annual report 2016 - marine produce australia report 2016.pdfcompanies for over 30 years. he is the...
TRANSCRIPT
annual report 2016

contents
chairman’s address 3
shareholder listing 4
annual financial report 5
corporate directory 55
chairman’s address Dear Shareholder,
It is with a great sense of accomplishment that we end FY16 and report on what has been another
productive and successful year. We posted a profit of $3.5m for the period – a 50% improvement on our
maiden profit in FY15; and finally, over 4.5 years on from the State Government announcement of the
development of aquaculture zones, we have now secured the majority share of the Kimberley zone and are
fully licenced to produce 15,000 tonnes finfish per annum at our Cone Bay farm.
In line with our projected expansion plans, much of the focus this year has been on increasing the fish
biomass at the farm – almost doubling the value of our stock over last year; and on expanding the farm
infrastructure capacity to support the increased biomass. We have built an additional 12 80m cages this
year, bringing our total to 34 cages - currently holding almost 2,000 tonnes of our iconic Cone Bay Barra.
We have also added a new 10-cage anchoring system at the farm to accommodate the increased cage
numbers, and now have 3 cage systems on our lease.
You will see that our harvest volume was kept relatively low for FY16, and that we only harvested a little
over 600 tonnes. This was a measured approach to ensuring that future increased harvest volumes did not
come at the expense of fish size, and that we can continue to harvest fish over 4kg. We now have a
significant harvestable biomass at the farm and expect to double our annual harvest tonnage this year.
We have invested significantly this year in improved feeding and cage cleaning equipment – and shortly will
be installing our first automated feed barge at the farm. This feed system has been purpose built and will be
used to feed 10-12 cages from a single anchored barge. We have made this investment in automated
equipment sooner than originally planned, and expect it will significantly improve the efficiency and
effectiveness of our feeding.
In November we will be welcoming two new senior members to our Perth team. Hank Poeschl joins us as
General Manager, and will oversee all farming operations and expansion plans. Hank comes with over 25
years of sea cage farming experience from countries across the world. We are also gaining a new Chief
Financial Officer, Helen Chow, who has near 20 years senior financial management experience. We are
greatly looking forward to having both Hank and Helen as integral members of our group.
I would like to make special mention of the continued hard work of all our staff; in particular our Managing
Director Dr Desiree Allen whose persistence, hard work and focus deserve our great thanks. She is joined
in her efforts by the dedicated MPA team both at Cone Bay and in the Perth office – and I extend our
gratitude to each and every one.
This is going to be another very busy but exciting year for MPA and we look forward to reporting sustained
improvements and ongoing expansion plans as the year continues.
Yours faithfully,
Miles Kennedy
3
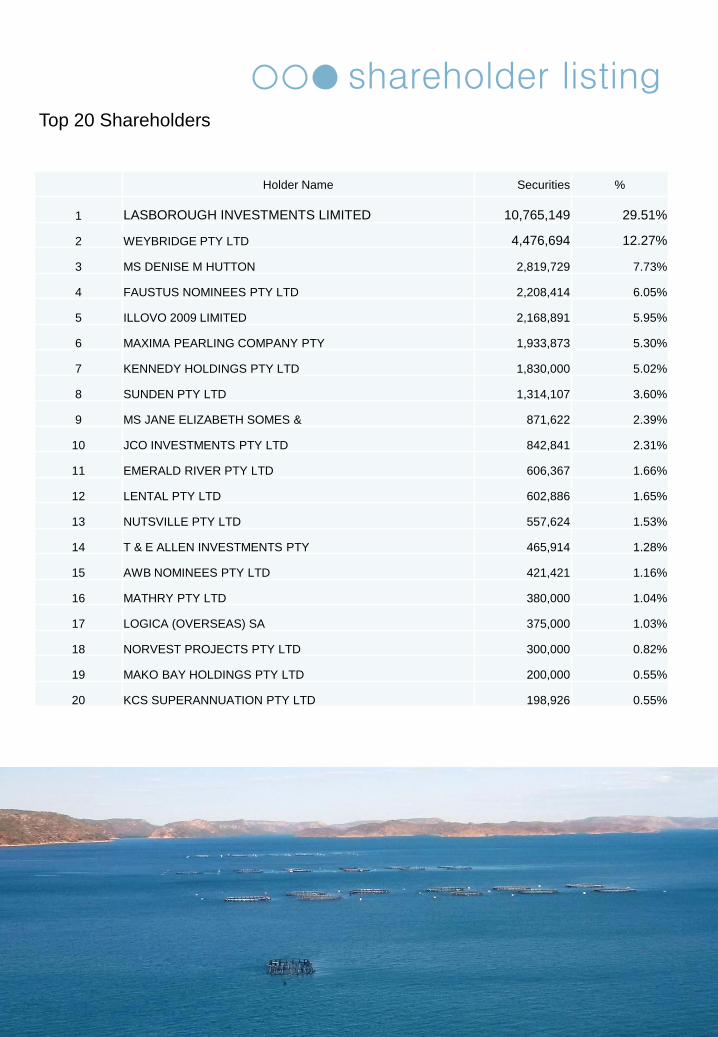
shareholder listing
6
Top 20 Shareholders
Holder Name Securities %
1 LASBOROUGH INVESTMENTS LIMITED 10,765,149 29.51%
2 WEYBRIDGE PTY LTD 4,476,694 12.27%
3 MS DENISE M HUTTON 2,819,729 7.73%
4 FAUSTUS NOMINEES PTY LTD 2,208,414 6.05%
5 ILLOVO 2009 LIMITED 2,168,891 5.95%
6 MAXIMA PEARLING COMPANY PTY 1,933,873 5.30%
7 KENNEDY HOLDINGS PTY LTD 1,830,000 5.02%
8 SUNDEN PTY LTD 1,314,107 3.60%
9 MS JANE ELIZABETH SOMES & 871,622 2.39%
10 JCO INVESTMENTS PTY LTD 842,841 2.31%
11 EMERALD RIVER PTY LTD 606,367 1.66%
12 LENTAL PTY LTD 602,886 1.65%
13 NUTSVILLE PTY LTD 557,624 1.53%
14 T & E ALLEN INVESTMENTS PTY 465,914 1.28%
15 AWB NOMINEES PTY LTD 421,421 1.16%
16 MATHRY PTY LTD 380,000 1.04%
17 LOGICA (OVERSEAS) SA 375,000 1.03%
18 NORVEST PROJECTS PTY LTD 300,000 0.82%
19 MAKO BAY HOLDINGS PTY LTD 200,000 0.55%
20 KCS SUPERANNUATION PTY LTD 198,926 0.55%
Annual Financial Report
Year Ended 30 June 2016
marine produce australia limited
34 Bagot Road Subiaco WA 6008
telephone +61 8 9381 4483 fax +61 8 9381 5817
email [email protected] web marineproduce.com
abn 70 091 805 480

DIRECTORS’ REPORT 1
LEAD AUDITOR’S INDEPENDENCE DECLARATION 10
CONSOLIDATED STATEMENT OF PROFIT OR LOSS AND OTHER COMPREHENSIVE INCOME
11
CONSOLIDATED STATEMENT OF FINANCIAL POSITION 12
CONSOLIDATED STATEMENT OF CHANGES IN EQUITY 13
CONSOLIDATED STATEMENT OF CASH FLOWS 14
NOTES TO THE FINANCIAL STATEMENTS 15
DIRECTORS’ DECLARATION 45
AUDITOR’S INDEPENDENT AUDIT REPORT 46
DIRECTORS’ REPORT FOR THE YEAR ENDED 30 JUNE 2016
1 | Page
The directors present their report together with the consolidated financial report of Marine Produce Australia Limited (the Company or MPA), and its subsidiaries (the Group), for the financial year ended 30 June 2016 and the auditor’s report thereon.
1 DIRECTORS
The directors of the Company at any time during or since the end of the financial year are:
Mr Miles Kennedy Chairman Appointed 11 June 2008
Mr Kennedy has held directorships of Australian listed resource companies for over 30 years. He is the non-executive Chairman of Lucapa Diamond Company Limited and was previously the executive Chairman of Sandfire Resources NL, Kimberley Diamond Company NL and RNI NL. Mr Kennedy practised as a Barrister and Solicitor of the Supreme Court of Western Australia and the High Court of Australia and as an Attorney of the Supreme Court of South Africa.
Dr Desiree Allen Managing Director Appointed 5 December 2012
Dr Allen joined MPA in 2011 with a strong background in both genetics (animal breeding) and environmental toxicology. She has a Bachelor of Science from Murdoch University (Australia), a Masters in Environmental Biology from the University of North Carolina (USA), and a PhD in Genetics from Indiana University (USA). Prior to joining MPA she was a Research Fellow at the University of Edinburgh (UK).
Mr Damien Kelly Non-Executive Director Appointed 18 August 2014
Mr Kelly is director of Western Tiger Corporate Advisers, a Perth-based corporate advisory and financial services firm. He has broad corporate and commercial experience spanning over 17 years, providing professional services to ASX and AIM listed companies predominately in the mining and energy sector. Mr Kelly has a MBA, Bachelor of Commerce, a Graduate Diploma in Applied Finance and Investment, full CPA qualifications and is a former officer in the Australian armed services, having graduated from the Royal Military College, Duntroon. He is also a fellow of the Financial Services Institute of Australia (FINSIA) and a member of CPA Australia.

DIRECTORS’ REPORT FOR THE YEAR ENDED 30 JUNE 2016
2 | Page
2 COMPANY SECRETARY
Mr Mark Clements Company Secretary Appointed 16 February 2015
Mr Clements gained a Bachelor of Commerce degree from the University of Western Australia. He is a Fellow of the Institute of Chartered Accountants and a member of both the Australian Institute of Company Directors and the Institute of Chartered Secretaries in Australia. Mr Clements currently holds the position of Company Secretary of a number of publicly listed companies and has experience in corporate finance, accounting and administration, capital raising and ASX Compliance and regulatory requirements.
3 DIRECTORS’ MEETINGS
The number of directors’ meetings and number of meetings attended by each of the directors of the Company during the financial year are:
Board Meetings Director Attended Held while a
director
Mr M Kennedy 5 5 Dr D Allen 5 5 Mr D Kelly 5 5
4 REMUNERATION REPORT
4.1 Principles of compensation
Remuneration is referred to as compensation throughout this report.
Key management personnel have authority and responsibility for planning, directing and controlling the activities of the Group, including directors of the Company and other executives. Key management personnel comprise the directors of the Company and senior executives for the Group.
Compensation levels for key management personnel and the Company Secretary are competitively set to attract and retain appropriately qualified and experienced directors and executives.
The compensation structures explained below are designed to attract suitably qualified candidates, reward the achievement of strategic objectives, and achieve the broader outcome of creation of value for shareholders. The compensation structures take into account:
the capability and experience of the key management personnel;
the key management personnel’s ability to influence and control performance of the business; and
the Group’s performance including the Group’s earnings, growth in share price and returns on shareholder wealth and amount of incentives within each key management person’s compensation.
Shares and options may only be issued to directors subject to approval by shareholders in general meeting. The Board has no established retirement or redundancy schemes.
Fixed compensation
Fixed compensation consists of base compensation as well as employer contributions to superannuation funds.
Non-executive directors
Total compensation for all non-executive directors is not to exceed $150,000 per annum and is set with reference to fees paid to other non-executive directors of comparable companies. Non-executive directors may receive performance related compensation for particular board approved objectives.
DIRECTORS’ REPORT FOR THE YEAR ENDED 30 JUNE 2016
3 | Page
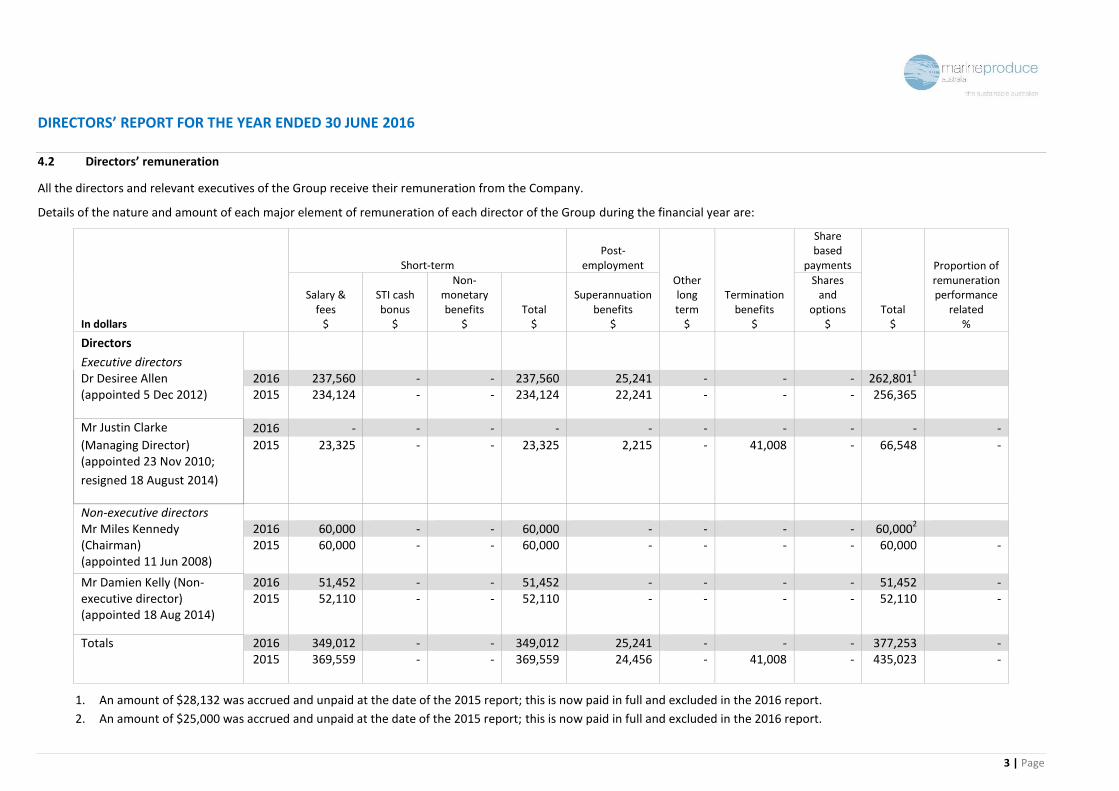
4.2 Directors’ remuneration
All the directors and relevant executives of the Group receive their remuneration from the Company.
Details of the nature and amount of each major element of remuneration of each director of the Group during the financial year are:
In dollars
Short-term Post-
employment
Other long term
$
Termination benefits
$
Share based
payments
Total $
Proportion of remuneration performance
related %
Salary & fees
$
STI cash bonus
$
Non-monetary benefits
$ Total
$
Superannuation benefits
$
Shares and
options $
Directors
Executive directors Dr Desiree Allen (appointed 5 Dec 2012)
2016 237,560 - - 237,560 25,241 - - - 262,8011
2015
234,124
-
-
234,124
22,241
-
-
-
256,365
Mr Justin Clarke 2016 - - - - - - - - - -
(Managing Director) 2015 23,325 - - 23,325 2,215 - 41,008 - 66,548 - (appointed 23 Nov 2010;
resigned 18 August 2014)
Non-executive directors Mr Miles Kennedy (Chairman)
2016 60,000 - - 60,000 - - - - 60,0002
2015 60,000 - - 60,000 - - - - 60,000 - (appointed 11 Jun 2008)
Mr Damien Kelly (Non-executive director)
2016 51,452 - - 51,452 - - - - 51,452 - 2015 52,110 - - 52,110 - - - - 52,110 -
(appointed 18 Aug 2014)
Totals 2016 349,012 - - 349,012 25,241 - - - 377,253 - 2015
369,559
-
-
369,559
24,456
-
41,008
-
435,023
-
1. An amount of $28,132 was accrued and unpaid at the date of the 2015 report; this is now paid in full and excluded in the 2016 report.
2. An amount of $25,000 was accrued and unpaid at the date of the 2015 report; this is now paid in full and excluded in the 2016 report.
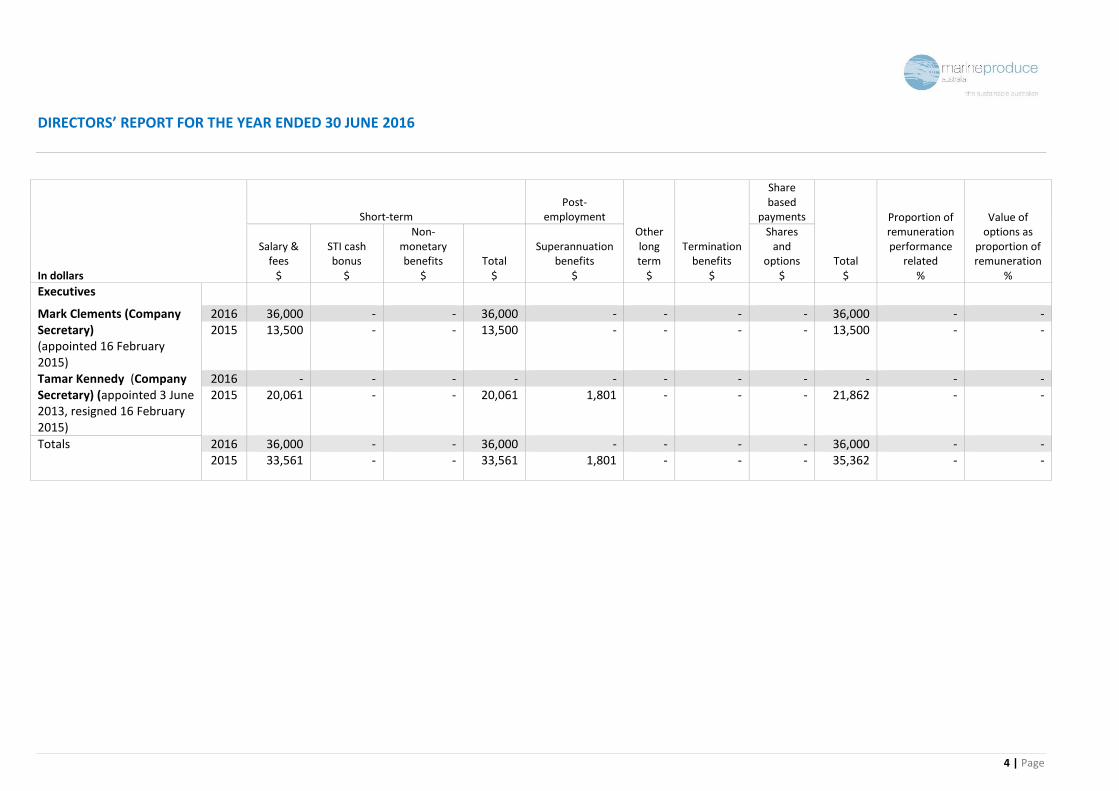
DIRECTORS’ REPORT FOR THE YEAR ENDED 30 JUNE 2016
4 | Page
In dollars
Short-term Post-
employment
Other long term
$
Termination benefits
$
Share based
payments
Total $
Proportion of remuneration performance
related %
Value of options as
proportion of remuneration
%
Salary & fees
$
STI cash bonus
$
Non-monetary benefits
$ Total
$
Superannuation benefits
$
Shares and
options $
Executives
Mark Clements (Company 2016 36,000 - - 36,000 - - - - 36,000 - - Secretary) 2015 13,500 - - 13,500 - - - - 13,500 - - (appointed 16 February 2015)
Tamar Kennedy (Company 2016 - - - - - - - - - - - Secretary) (appointed 3 June 2013, resigned 16 February 2015)
2015 20,061 - - 20,061 1,801 - - - 21,862 - -
Totals 2016 36,000 - - 36,000 - - - - 36,000 - - 2015 33,561 - - 33,561 1,801 - - - 35,362 - -

DIRECTORS’ REPORT FOR THE YEAR ENDED 30 JUNE 2016
5 | Page
4.3 Equity instruments
(i) Options and rights over equity instruments granted as compensation
On 23 November 2015, 2,200,000 unlisted $0.75 options expiring 30 November 2018 were issued to the Directors following shareholder approval at the Company’s Annual General meeting held 23 November 2015.
(ii) Exercise of options granted as compensation
No options were exercised during the reporting period or the prior period. No options lapsed in the current or prior period.
5 PRINCIPAL ACTIVITIES
This past year has been one of ongoing progress and development for MPA. We continue to focus on our production expansion plans, with improved equipment, greater fish inputs, key staff appointments, and continued development of workplace health and safety and staff training.
(i) OPERATING REVIEW
- Applied for, and were granted, a new Department of Fisheries Licence that allows the production of up to 15,000 tonnes finfish per annum. This approval includes additional 644 hectares of lease area adjacent to our existing 699 hectare water lease.
- Strengthened our farm management team with the promotion of Alasdair Connor to co-Manager of Marine Farming, and Nick Brearley to Innovator Skipper (Master IV).
- Expanded our farming capacity with the addition of new infrastructure, including:
o New 10-cage capacity anchoring system (now have 3 anchoring systems on our lease)
o 12 additional 80m cages (now have 34 cages in total).
- Improved our cage cleaning options with two new pressure washers and disk-drive cleaners
- Commissioned our first automated feed delivery system (feed barge), and updated our feed delivery equipment on existing boats
- Ongoing research into: feeding behaviour for optimal feed conversion and growth; cage materials for stock security; nursery conditions and fingerling genetics for improved production; and environmental conditions for optimising growth.
- Streamlined the cage building process in Derby with the continued assistance of the Derby Shire (with special thanks to all involved).
- Filed a trademark application for “Cone Bay” in relation to fish production – to ensure our iconic name, as we are known throughout Australia, is secured, and the value of that brand retained for our shareholders.

DIRECTORS’ REPORT FOR THE YEAR ENDED 30 JUNE 2016
6 | Page
(ii) REVIEW OF FINANCIAL RESULTS
Results from Operating Activities and Loss for the Period
The Group’s profit for the period was $3,530,000 (2015: $2,401,701). There was no impairment of property, plant and equipment or intangible assets in the year (2015: $516,787) and depreciation and amortisation was $398,106 (2015: $169,589).
Net cash provided by operating activities was ($2,659,141) (2015: $246,376).
The results from operating activities (excluding impairment and depreciation) included:
12 months
ended June 2016
12 months ended
June 2015 Profit / (loss) from farming operations (excluding impairment and depreciation) 1,368,297 (502,494) Administration and marketing expenses (1,857,847) (2,715,726) Other income 76,120 4,085 Other expense - -
Results from operating activities excluding impairment and depreciation (413,430) (3,214,135)
Impairment and depreciation (398,106) (686,376)
Loss before tax (811,536) (3,900,511)
Non IFRS unaudited
12 months
ended June 2016
12 months ended
June 2015 Farm cash operating costs (AUD) 13,154,499 10,719,168 Fish biomass growth before harvest (kg) 1,410,329 969,523
Farm cash operating cost per kg 9.33 11.06
Revenue
Revenue from sales
Revenue from the sale of fish was $7,253,391 for the period from the sale of 638,805kg. A total of 641,078kg of fish was harvested for the period. As part of the production planning, the harvest volume was intentionally kept low for part of the year so as to ensure we are able to attain the preferred size of our harvestable fish.
(iii) REVIEW OF FINANCIAL CONDITION
At 30 June 2016, the Group had a working capital surplus of $19,741,261 represented significantly by biological assets of $16,141,615 and cash and cash equivalents of $1,473,322.
The Group’s working capital will be utilised to fund operating and capital expenditure to continue to develop the Cone Bay farm site and increase profitability with scale.
The Group has the ability to slow its expansion strategy and/or harvest fish at less than the targeted harvest size to maintain sufficient cash reserves, with a resulting delay in the growth of the scale of the operations. The Group also has the ability, and is planning, to raise new equity or debt capital and to seek research and development tax refunds as it has in prior years.
The financial statements have been prepared on a going concern basis which the directors believe to be appropriate. The directors are confident that the Group will maintain sufficient levels of working capital to continue as a going concern and continue to pay its debts as and when they fall due.
If the Group is unable to continue as a going concern, it will be required to realise its assets and extinguish its liabilities other than in the ordinary course of business and at amounts that may be different to those stated in the financial statements.
DIRECTORS’ REPORT FOR THE YEAR ENDED 30 JUNE 2016
7 | Page
(iv) SIGNIFICANT CHANGES IN THE STATE OF AFFAIRS
In the interval between the end of the financial year and the date of this report, there has not been any item, transaction or effect of a material or unusual nature likely, in the opinion of the directors of the Company, to affect significantly the operations of the Group, the results of those operations, or the state of affairs of the Group, in future financial years.
6 DIVIDENDS
No dividends were paid or declared during the current or prior financial years.
7 DIRECTORS’ INTERESTS
The relevant interest of each Director in the shares, debentures, interests in registered schemes and rights or options over such instruments issued by the companies within the consolidated entity and other related bodies corporate at the date of this report is as follows.
Marine Produce Australia Limited
Ordinary shares Options over ordinary shares
Mr M Kennedy 1,830,000 1,056,484 Dr D Allen 136,726 1,000,000 Mr D Kelly 62,800 221,000
On 23 November 2015, 2,200,000 unlisted $0.75 options expiring 30 November 2018 were issued to the Directors
following shareholder approval at the Company’s Annual General meeting held 23 November 2015.
8 INDEMNIFICATION AND INSURANCE OF OFFICERS AND AUDITORS
Indemnification
The Group has agreed to indemnify the current and former Directors of the Company against all liabilities to another person (other than the Company or related body corporate) that may arise from their position as Directors of the Company and its controlled entities, except where the liability arises out of conduct involving a lack of good faith. The agreement stipulates that the Company will meet the full amount of any such liabilities, including costs and expenses.
The Group has also agreed to indemnify the current Directors of its controlled entities for all liabilities to another person (other than the Company or related body corporate) that may arise from their position, except where the liability arises out of conduct involving a lack of good faith. The agreement stipulates that the Company will meet the full amount of any such liabilities, including costs and expenses.
Insurance premiums
Since the end of the previous financial year the Group has paid insurance premiums in respect of Directors’ and officers’ liability and legal expenses insurance contracts, for current and former Directors and officers, including senior executives of the Company and Directors, senior executives of and secretaries of its controlled entities. The insurance premiums relate to:
costs and expenses incurred by the relevant officers in defending proceedings, whether civil or criminal and whatever their outcome; and
other liabilities that may arise from their position, with the exception of conduct involving a wilful breach of duty or improper use of information or position to gain personal advantage.
The value of the premium paid is not disclosed subject to an existing confidentiality agreement between the insurer and the Directors of the Group.
DIRECTORS’ REPORT FOR THE YEAR ENDED 30 JUNE 2016
8 | Page
9 DETAILS OF PROCEEDINGS UNDERTAKEN ON BEHALF OF THE COMPANY
At the date of this report, there are no proceedings brought on behalf of the Company under section 237 of the Corporations Act 2001.
10 ENVIRONMENTAL REGULATION
MPA’s operations are subject to the environmental quality monitoring and maintenance outlined in Ministerial
Statement 996 and the Department of Fisheries Kimberley Aquaculture Development Zone Environmental
Monitoring and Management Plan. MPA measures water and sediment quality during 8 months of the year, and
has these samples independently tested against the quality standards set by the Environmental Protection
Authority (EPA), outlined in the DoF 2014 EMMP. MPA is required to report any results that exceed the standards,
and if that were the case, implement further testing and subsequent remedial action. MPA submits a yearly
compliance report to the EPA with sample test results and details of any non-compliance.
11 LEAD AUDITOR’S INDEPENDENCE DECLARATION
The lead auditor’s independence declaration is set out on page 10 and forms part of the Directors’ Report for the financial year ended 30 June 2016.
12 SUBSEQUENT EVENTS
In the period subsequent to year end the Group has drawn down upon existing loans by an additional $1,756,603.
The Group also received the payment of the R&D tax refund of $4,412,782 on 9 September 2016.
No other matter or circumstance has arisen since 30 June 2016 that has significantly affected or may significantly
affect the Group’s operations, the results of those operations or the Group’s state of affairs in future years.
13 NON-AUDIT SERVICES
Details of the amounts paid to the auditor of the Company and their related practices for audit services provided during the year are set out below.
2016 2015
Audit services:
Audit and review of financial reports 58,823 50,899
58,823 50,899
The following non-audit services were provided by the Company’s auditor, Grant Thornton Australia. The Directors are satisfied that the provision of non-audit services is compatible with the general standard of independence for auditors imposed by the Corporations Act 2001. The nature and scope of each type of non-audit service provided means that auditor independence was not compromised.
Grant Thornton Australia received or is due to receive the following amounts for the provision of non-audit services:
2016 2015
Non-audit services:
Tax compliance services 25,848 14,450
25,848 14,450
DIRECTORS’ REPORT FOR THE YEAR ENDED 30 JUNE 2016
9 | Page
Signed in accordance with a resolution of the Directors.
DESIREE ALLEN MANAGING DIRECTOR Dated at Subiaco 29
th September 2016.
Level 1
10 Kings Park Road
West Perth WA 6005
Correspondence to:
PO Box 570
West Perth WA 6872
T +61 8 9480 2000
F +61 8 9322 7787
W www.grantthornton.com.au
Grant Thornton Audit Pty Ltd ACN 130 913 594 a subsidiary or related entity of Grant Thornton Australia Ltd ABN 41 127 556 389
‘Grant Thornton’ refers to the brand under which the Grant Thornton member firms provide assurance, tax and advisory services to their clients and/or refers to one or more member firms, as the
context requires. Grant Thornton Australia Ltd is a member firm of Grant Thornton International Ltd (GTIL). GTIL and the member firms are not a worldwide partnership. GTIL and each member firm
is a separate legal entity. Services are delivered by the member firms. GTIL does not provide services to clients. GTIL and its member firms are not agents of, and do not obligate one another and
are not liable for one another’s acts or omissions. In the Australian context only, the use of the term ‘Grant Thornton’ may refer to Grant Thornton Australia Limited ABN 41 127 556 389 and its
Australian subsidiaries and related entities. GTIL is not an Australian related entity to Grant Thornton Australia Limited.
Liability limited by a scheme approved under Professional Standards Legislation. Liability is limited in those States where a current scheme applies.
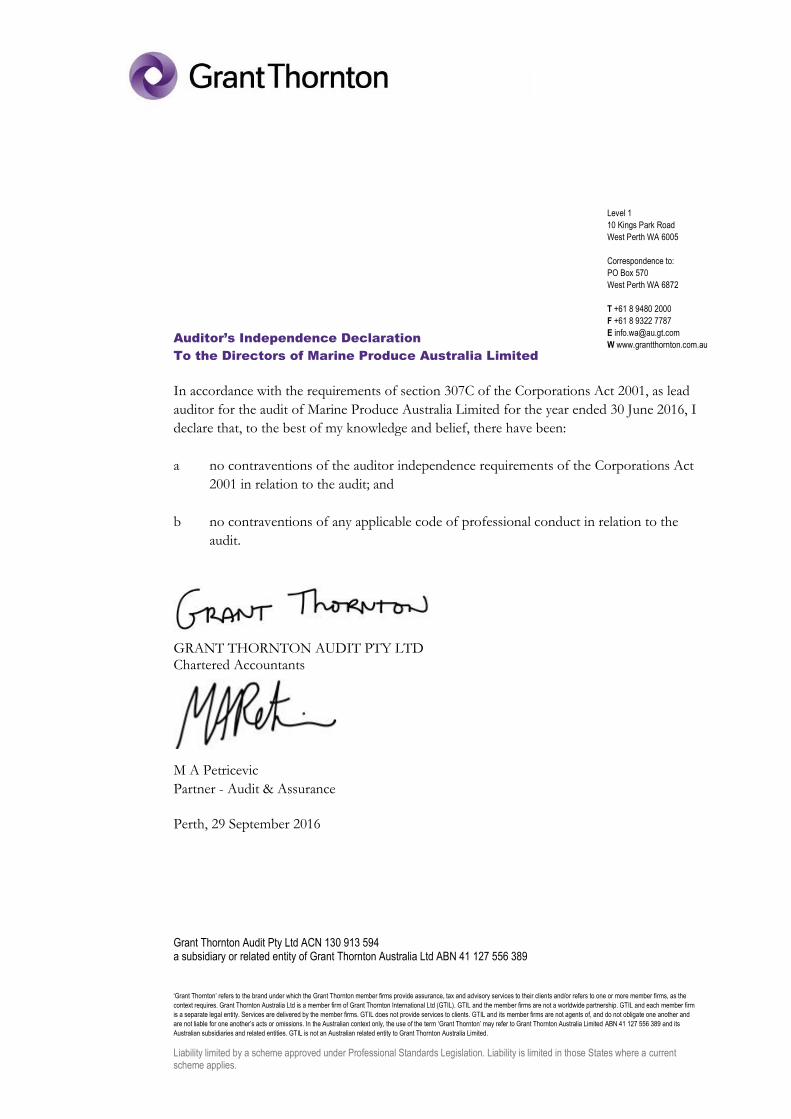
Auditor’s Independence Declaration
To the Directors of Marine Produce Australia Limited
In accordance with the requirements of section 307C of the Corporations Act 2001, as lead
auditor for the audit of Marine Produce Australia Limited for the year ended 30 June 2016, I
declare that, to the best of my knowledge and belief, there have been:
a no contraventions of the auditor independence requirements of the Corporations Act
2001 in relation to the audit; and
b no contraventions of any applicable code of professional conduct in relation to the
audit.
GRANT THORNTON AUDIT PTY LTD Chartered Accountants
M A Petricevic
Partner - Audit & Assurance
Perth, 29 September 2016
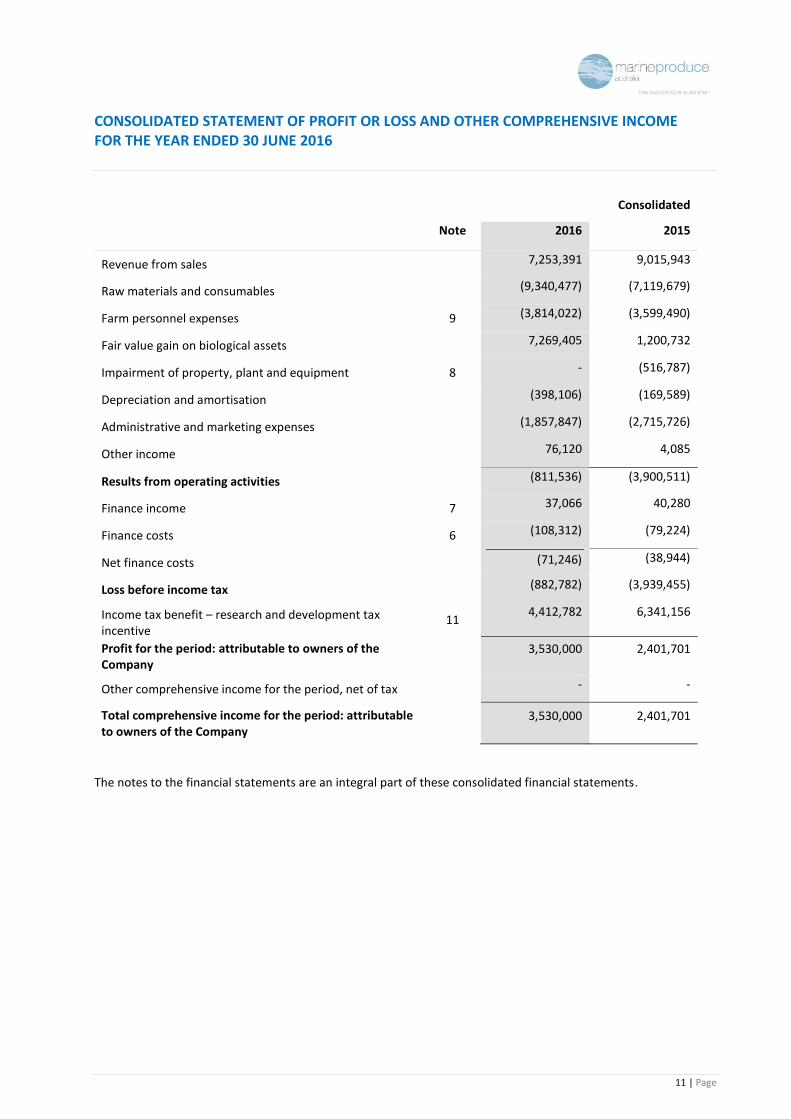
CONSOLIDATED STATEMENT OF PROFIT OR LOSS AND OTHER COMPREHENSIVE INCOME FOR THE YEAR ENDED 30 JUNE 2016
11 | Page
Consolidated
Note 2016 2015
Revenue from sales 7,253,391
9,015,943
Raw materials and consumables (9,340,477)
(7,119,679)
Farm personnel expenses 9 (3,814,022)
(3,599,490)
Fair value gain on biological assets 7,269,405
1,200,732
Impairment of property, plant and equipment 8 -
-
-
(516,787)
-
-
Depreciation and amortisation (398,106)
(169,589)
Administrative and marketing expenses (1,857,847)
(2,715,726)
Other income 76,120
4,085
Results from operating activities (811,536)
(3,900,511)
Finance income 7 37,066
40,280
Finance costs 6 (108,312)
(79,224)
Net finance costs (71,246)
-879,412
(38,944)
-879,412
Loss before income tax (882,782)
(3,939,455)
Income tax benefit – research and development tax incentive
11 4,412,782
3,533,370
6,341,156
3,533,370
Profit for the period: attributable to owners of the Company
3,530,000 2,401,701
Other comprehensive income for the period, net of tax -
-
Total comprehensive income for the period: attributable to owners of the Company
3,530,000 2,401,701
The notes to the financial statements are an integral part of these consolidated financial statements.

CONSOLIDATED STATEMENT OF FINANCIAL POSITION AS AT 30 JUNE 2016
12 | Page
Consolidated
Note 2016 2015
Assets
Cash and cash equivalents 12 1,473,322
2,063,069
Trade and other receivables 13 5,688,011
760,308
4,837,960
Inventories 14 760,308
441,489
Biological assets 15 16,141,615
8,658,598
Total current assets 24,063,256
16,001,116
Property, plant and equipment 8/17 4,949,139
2,914,323
Other assets 94,737 91,380
Biological assets 15 70,716
284,329
Total non-current assets 5,114,592
3,290,032
Total assets 29,177,848
19,291,148
Liabilities
Trade and other payables 20 3,509,439
471,702
2,066,503
471,702
Loans and borrowings 21 471,702
1,164,310
Employee benefits 22 340,854
226,331
Total current liabilities 4,321,995
3,457,144
Loans and borrowings 21 1,182,965
691,359
Provision for restoration 19 119,586
110,384
Employee benefits 22 60,230 -
Total non-current liabilities 1,362,781
801,743
Total liabilities 5,684,776
4,258,887
Net assets 23,493,072
15,032,261
Equity
Share capital 23 60,505,645
55,699,560
Reserves 124,726
-
Accumulated losses (37,137,299)
(40,667,299)
Total equity 23,493,072
15,032,261
The notes to the financial statements are an integral part of these consolidated financial statements.
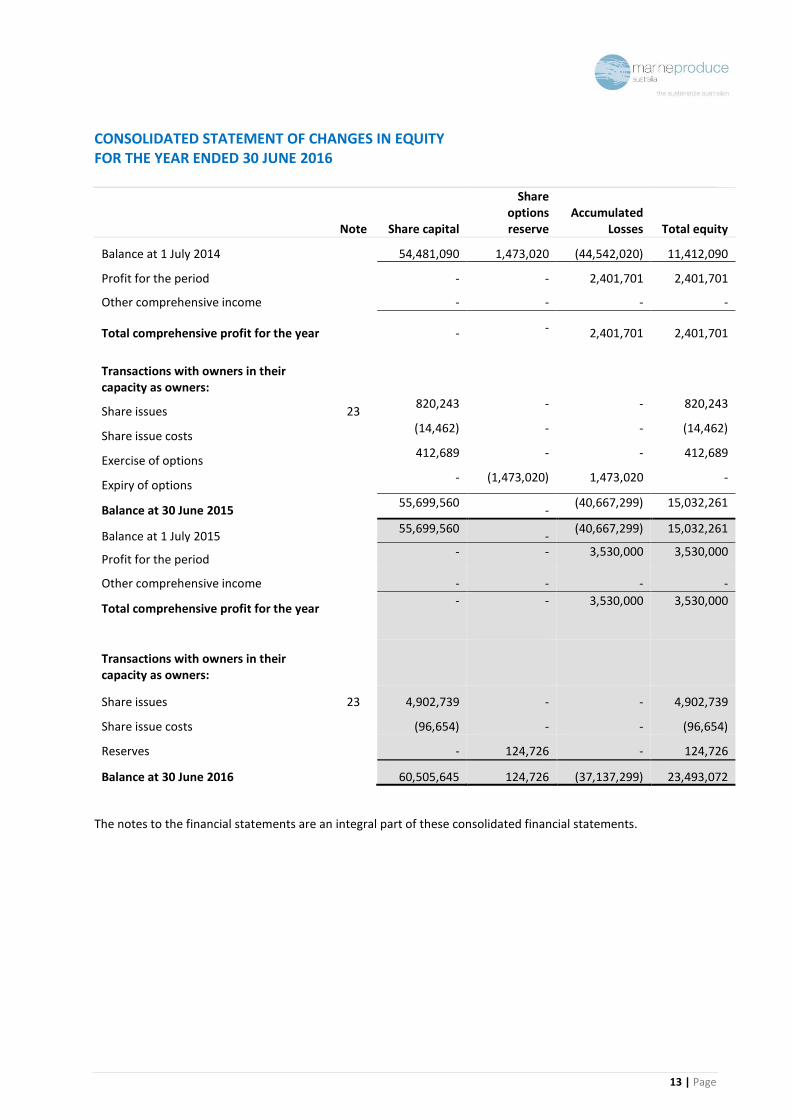
CONSOLIDATED STATEMENT OF CHANGES IN EQUITY FOR THE YEAR ENDED 30 JUNE 2016
13 | Page
Note Share capital
Share options reserve
Accumulated Losses Total equity
Balance at 1 July 2014 54,481,090 1,473,020 (44,542,020) 11,412,090
Profit for the period - - 2,401,701 2,401,701
Other comprehensive income - - - -
Total comprehensive profit for the year - - 2,401,701 2,401,701
Transactions with owners in their capacity as owners:
Share issues 23 820,243
- - 820,243
Share issue costs (14,462)
- - (14,462)
Exercise of options 412,689
- - 412,689
Expiry of options - (1,473,020)
1,473,020
-
Balance at 30 June 2015 55,699,560
- (40,667,299)
15,032,261
Balance at 1 July 2015 55,699,560
- (40,667,299)
15,032,261
Profit for the period - - 3,530,000
3,530,000
Other comprehensive income - - - -
Total comprehensive profit for the year - - 3,530,000
3,530,000
Transactions with owners in their capacity as owners:
Share issues 23 4,902,739 - - 4,902,739
Share issue costs (96,654) - - (96,654)
Reserves - 124,726 - 124,726
Balance at 30 June 2016 60,505,645 124,726 (37,137,299) 23,493,072
The notes to the financial statements are an integral part of these consolidated financial statements.
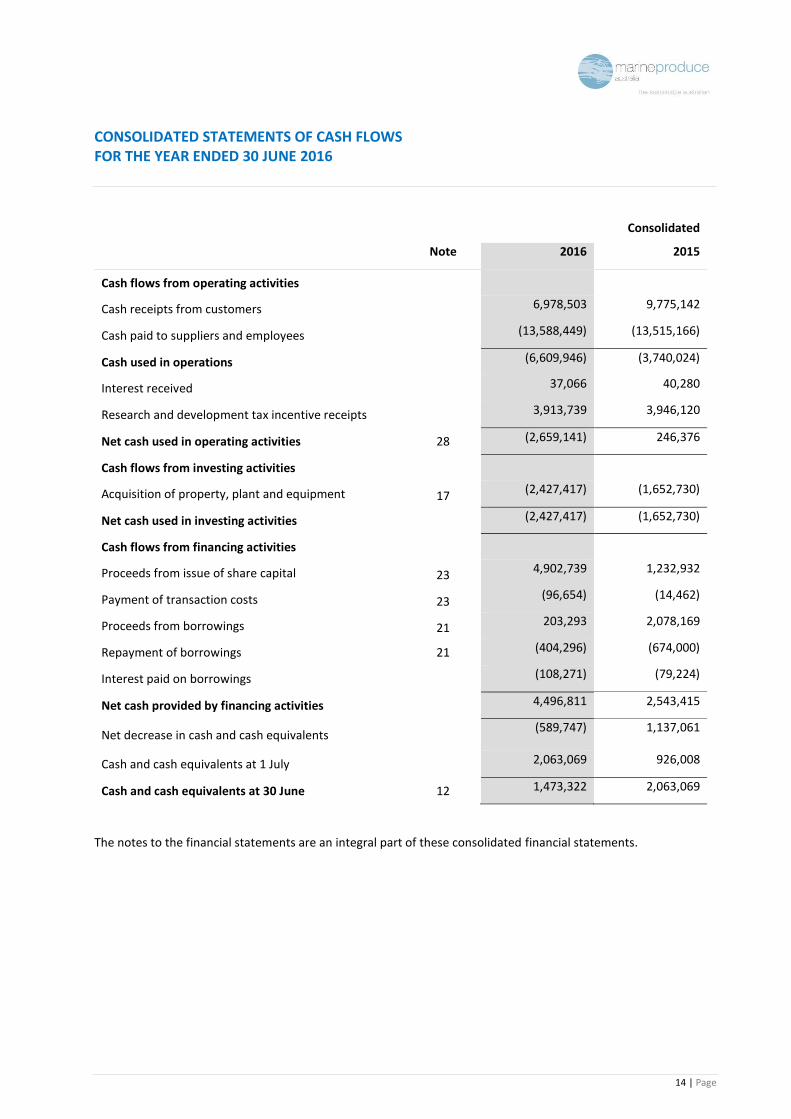
CONSOLIDATED STATEMENTS OF CASH FLOWS FOR THE YEAR ENDED 30 JUNE 2016
14 | Page
Consolidated
Note 2016 2015
Cash flows from operating activities
Cash receipts from customers 6,978,503
9,775,142
Cash paid to suppliers and employees (13,588,449)
(13,515,166)
Cash used in operations (6,609,946)
(3,740,024)
Interest received 37,066
40,280
Research and development tax incentive receipts 3,913,739
3,946,120
Net cash used in operating activities 28 (2,659,141)
246,376
Cash flows from investing activities
Acquisition of property, plant and equipment 17 (2,427,417)
(1,652,730)
Net cash used in investing activities (2,427,417)
(1,652,730)
Cash flows from financing activities
Proceeds from issue of share capital 23 4,902,739
-96,654
1,232,932
-96,654
Payment of transaction costs 23 (96,654)
(14,462)
Proceeds from borrowings 21 203,293
2,078,169
Repayment of borrowings 21 (404,296)
(674,000)
Interest paid on borrowings (108,271)
(79,224)
Net cash provided by financing activities 4,496,811
2,543,415
Net decrease in cash and cash equivalents (589,747) 1,137,061
Cash and cash equivalents at 1 July 2,063,069
926,008
Cash and cash equivalents at 30 June 12 1,473,322
2,063,069
The notes to the financial statements are an integral part of these consolidated financial statements.

NOTES TO THE FINANCIAL STATEMENTS FOR THE YEAR ENDED 30 JUNE 2016
15 | Page
1 Reporting entity
Marine Produce Australia Limited (the Company) is a company domiciled in Australia. The address of the Company’s registered office is 34 Bagot Road, Subiaco WA 6008. The consolidated financial statements of the Group as at and for the year ended 30 June 2016 comprise the Company and its subsidiaries (together referred to as the ‘Group’ and individually as ‘Group entities’).
The Group is a for-profit entity involved in the seafood and aquaculture industry, specifically including the farming of fin fish (Barramundi) in sea cages.
2 Basis of preparation
(a) Statement of compliance
The financial report is a general purpose financial report which has been prepared in accordance with Australian Accounting Standards (AASBs) (including Australian Interpretations) adopted by the Australian Accounting Standards Board (AASB) and the Corporations Act 2001 (Cth). The consolidated financial report of the Group complies with International Financial Reporting Standards (IFRSs) and interpretations adopted by the International Accounting Standards Board (IASB).
The consolidated financial statements were approved and authorised for issue by the Board of Directors on 29th September 2016.
(b) Basis of measurement
The consolidated financial statements have been prepared on the historical cost basis except for the following material items in the statement of financial position:
biological assets are measured at fair value less costs to sell;
property plant and equipment are measured at cost less accumulated depreciation and accumulated impairment losses; and
share based payments are measured at fair value of services provided.
The methods used to determine fair values are discussed further in Note 3 (m).
(c) Functional and presentation currency
These consolidated financial statements are presented in Australian Dollars, which is the Group’s functional currency.
(d) Use of estimates and judgements
The preparation of financial statements in conformity with IFRS requires management to make judgements, estimates and assumptions that affect the application of accounting policies and the reported amounts of assets, liabilities, income and expenses. Actual results may differ from those estimates.
Estimates and underlying assumptions are reviewed on an ongoing basis. Revisions to accounting estimates are recognised in the period in which the estimates are revised and in any future periods affected.
Information about critical judgements in applying accounting policies that have the most significant effect on the amounts recognised in the financial statements is included in the following notes:
Note 8 - Impairment of property, plant and equipment and intangible assets
Note 15 - Biological assets
Note 23 - Share Capital
Note 3(b) - Depreciation methods and rates
NOTES TO THE FINANCIAL STATEMENTS FOR THE YEAR ENDED 30 JUNE 2016
16 | Page
(e) Going concern
The financial statements have been prepared on a going concern basis which the Directors believe to be
appropriate. The Directors are confident that the Group will be able to maintain sufficient levels of working capital
to continue as a going concern and continue to pay its debts as and when they fall due.
For the period ended 30 June 2016, the Group made a profit of $3,530,000 (2015: $2,401,701). At 30 June 2016,
the Group had a working capital surplus of $19,741,261 represented significantly by biological assets of
$16,141,615 and cash and cash equivalents of $1,473,322.
The Directors are confident that the Group can continue as a going concern and as such are of the opinion that the
financial report has been appropriately prepared on a going concern basis.
The Group’s 2017 cash flow forecast assumes an increase in the working capital spending required to support its
ongoing expansion plans. These increased costs specifically include feeding and growing the fish biomass to sustain
increasing harvest volumes. This ongoing expansion is expected to be funded by sales of fish, further research and
development tax refunds, and some equity and/or debt investment. During 2016 the Group also secured an
additional rolling capital expenditure loan from National Australia Bank.
Key risks associated with Barramundi farming and the ability to successfully grow and harvest fish for sale are
discussed in Note 15.
The directors believe that it is appropriate to prepare the financial statements using the going concern basis as the
Group has the ability to slow its expansion strategy and/or harvest fish at less than the targeted harvest size to
maintain sufficient cash reserves, with a resulting delay in the growth of the scale of the operations. In any case,
the Group is planning to raise new equity or debt capital.
Should the Group be unable to undertake the initiatives disclosed above, there is uncertainty which may cast
doubt as to whether or not the Group will be able to continue as a going concern and whether it will realise its
assets and extinguish its liabilities in the normal course of business and at the amounts stated in the financial
statements.
The financial statements do not include any adjustments relating to the recoverability and classification of
recorded asset amounts nor to the amounts and classification of liabilities that might be necessary should the
Group not continue as a going concern.
3 Significant accounting policies
The accounting policies set out below have been applied consistently to all periods presented in these consolidated financial statements, and have been applied consistently by Group entities.
(a) Basis of consolidation
Subsidiaries
Subsidiaries are entities controlled by the Group. During the reporting period the Company had a 100% interest in the following subsidiaries:
MPA Fish Farms Pty Ltd; MPA Marketing Pty Ltd;
The financial statements of subsidiaries are included in the consolidated financial statements from the date that control commences until the date that control ceases. The accounting policies of subsidiaries have been changed when necessary to align them with the policies adopted by the Group.
In the Company’s financial statements, investments in subsidiaries are carried at cost.

NOTES TO THE FINANCIAL STATEMENTS FOR THE YEAR ENDED 30 JUNE 2016
17 | Page
Transactions eliminated on consolidation
Intra-group balances and transactions, and any unrealised income and expenses arising from intra-group transactions, are eliminated in preparing the consolidated financial statements.
(b) Property, plant and equipment
Recognition and measurement
Items of property, plant and equipment are measured at cost less accumulated depreciation and accumulated impairment losses.
Cost includes expenditure that is directly attributable to the acquisition of the asset. The cost of self-constructed assets includes the cost of materials; direct labour;; and, an appropriate proportion of production overheads.
When parts of an item of property, plant and equipment have different useful lives, they are accounted for as separate items (major components) of property, plant and equipment.
Gains and losses on disposal of an item of property, plant and equipment are determined by comparing the proceeds from disposal with the carrying amount of property, plant and equipment and are recognised net within other income in profit or loss.
Subsequent costs
Subsequent expenditure is capitalised only when it is probable that the future economic benefits associated with the expenditure will flow to the Group. Ongoing repairs and maintenance is expensed as incurred.
Depreciation
Depreciation is calculated over the depreciable amount, which is the cost of an asset, or other amount substituted for cost, less its residual value.
Depreciation is recognised in profit or loss on an adjusted reducing balance basis over the estimated useful lives of each part of an item of property, plant and equipment, since this most closely reflects the expected pattern of consumption of the future economic benefits embodied in the asset.
The estimated useful lives for the current and comparative periods are as follows:
Plant and equipment 5 – 15 years Fixtures and fittings 5 – 10 years Major components 3 – 5 years Boats 15 years Depreciation methods, useful lives and residual values are reviewed at each financial year end and adjusted if appropriate.
(c) Intangible assets
Research and development
Expenditure on research activities, undertaken with the prospect of gaining new scientific or technical knowledge and understanding, is recognised in the profit or loss as incurred.
Development activities involve a plan or design for the production of new or substantially improved products and processes. Development expenditure is capitalised only if development costs can be measured reliably, the product or process is technically and commercially feasible, future economic benefits are probable, and the Group intends to and has sufficient resources to complete development and to use or sell the asset. The expenditure capitalised includes the cost of materials, direct labour and overhead costs that are directly attributable to preparing the asset for its intended use. Other development expenditure is recognised in profit or loss as incurred. Capitalised development expenditure is stated at cost less accumulated amortisation and accumulated impairment losses.
NOTES TO THE FINANCIAL STATEMENTS FOR THE YEAR ENDED 30 JUNE 2016
18 | Page
Subsequent costs
Subsequent expenditure is capitalised only when it increases the future economic benefits embodied in the specific asset to which it relates. All other expenditure is recognised in profit or loss as incurred.
Amortisation
Amortisation is calculated over the costs of the asset, less its residual value.
Amortisation is recognised in profit or loss on a straight-line basis over the estimated useful lives of intangible assets from the date that they are available for use, since this most closely reflects the expected pattern of consumption of the future economic benefits embodied in the asset. The estimated useful lives for the current and comparative periods is 10 years.
Amortisation methods, useful lives and residual values are reviewed at each financial year end and adjusted if appropriate.
(d) Biological assets
Biological assets (fish 400 grams and larger) are measured at fair value less costs to sell, with any change therein recognised in profit or loss. Fair value is determined based on average market sales price. Costs to sell include all costs that are necessary to sell the assets, including costs necessary to get the assets to market.
As the fair value of the assets is based on its present location and condition, the Group applies direct costing to estimate fair value of fish in cages where they have not yet reached a saleable size:
Fish up to 400 grams are measured at cost plus direct feed cost and direct fish management costs.
(e) Inventories
Inventories are measured at the lower of cost and net realisable value. Net realisable value is the estimated selling price in the ordinary course of business, less the estimated costs of completion and costs to sell.
The cost attributed to harvested fish is equal to the fair value less estimated selling costs previously recorded in biological assets at the date of harvest, determined in accordance with the accounting policy for biological assets. Any change in value at the date of harvest is recognised in the income statement. Once harvested, fish inventories are accounted for as normal inventories.
The cost of other inventories is based on the first-in first-out principle and includes expenditure incurred in acquiring the inventories and bringing them to their existing location and condition. Cost includes an appropriate share of overheads based on normal operating capacity.
(f) Impairment
Non-derivative financial assets (including receivables)
The carrying amounts of the Group’s non-derivative financial assets, other than biological assets (see accounting policy (d)), inventories (see accounting policy (e)) and deferred tax assets (see accounting policy (k)) are reviewed at each balance sheet date to determine whether there is any indication of impairment. If any such indication exists, the asset’s recoverable amount is estimated.
For intangible assets that are not yet available for use, the recoverable amount is estimated at each balance sheet date.
An impairment loss is recognised whenever the carrying amount of an asset or its cash-generating unit exceeds its recoverable amount. Impairment losses are recognised in the income statement, unless an asset has previously been revalued, in which case the impairment loss is recognised as a reversal to the extent of that previous revaluation with any excess recognised through profit or loss.
Impairment losses recognised in respect of cash-generating units are allocated first to reduce the carrying amount of any goodwill allocated to cash-generating units (group of units) and then, to reduce the carrying amount of the other assets in the unit (group of units) on a pro rata basis (except for individual assets or groups of assets have been valued separately).
NOTES TO THE FINANCIAL STATEMENTS FOR THE YEAR ENDED 30 JUNE 2016
19 | Page
Calculation of recoverable amount
The recoverable amount of the Group’s investments and receivables carried at amortised cost is calculated as the present value of estimated future cash flows, discounted at the original effective interest rate (i.e. the effective interest rate computed at initial recognition of these financial assets). Receivables with a short duration are not discounted.
Impairment of receivables is not recognised until objective evidence is available that a loss event has occurred. Significant receivables are individually assessed for impairment. Impairment testing of receivables that are not impaired individually is performed by placing them into portfolios of receivables with similar risk profiles and undertaking a collective assessment of impairment. Non-significant receivables are not individually assessed. Instead, impairment testing is performed by placing non-significant receivables in portfolios of similar risk profiles based on objective evidence from historical experience adjusted to for any effects of conditions existing at each balance sheet date.
Non-financial assets
The carrying amounts of the Group’s non-financial assets, other than biological assets, investment property, inventories and deferred tax assets, are reviewed at each reporting date to determine whether there is any indication of impairment. If any such indication exists, then the asset’s recoverable amount is estimated. Goodwill and indefinite life intangible assets are tested annually for impairment. An impairment loss is recognised if the carrying amount of an asset or its related cash-generating unit (CGU) exceeds its recoverable amount.
The recoverable amount of an asset or CGU is the greater of its value in use and its fair value less costs to sell. In assessing value in use, the estimated future cash flows are discounted to their present value using a pre-tax discount rate that reflects current market assessments of the time value of money and the risks specific to the asset. For the purpose of impairment testing, assets that cannot be tested individually are grouped together into the smallest group of assets that generates cash inflows from continuing use that are largely independent of the cash inflows of other assets or CGUs. Subject to an operating segment ceiling test, CGUs to which goodwill has been allocated are aggregated so that the level at which impairment is tested reflects the lowest level at which goodwill is monitored for internal reporting purposes. Goodwill acquired in a business combination is allocated to groups of CGUs that are expected to benefit from the synergies of the combination.
Impairment losses are recognised in profit or loss. Impairment losses recognised in respect of CGUs are allocated first to reduce the carrying amount of any goodwill allocated to the CGU (or group of CGUs), and then to reduce the carrying amounts of the other assets in the CGU (or group of CGUs) on a pro rata basis (except for individual assets or groups of assets have been valued separately).
An impairment loss in respect of goodwill is not reversed. For other assets, an impairment loss is reversed only to the extent that the asset’s carrying amount does not exceed the carrying amount that would have been determined, net of depreciation or amortisation, if no impairment loss had been recognised.
(g) Employee benefits
Defined contribution plans
A defined contribution plan is a post-employment benefit plan under which an entity pays fixed contributions into a separate entity and will have no legal or constructive obligation to pay further amounts. Obligations for contributions to defined contribution superannuation funds are recognised as an employee benefit expense in profit or loss in the periods during which services are rendered by employees.
Short-term benefits
Liabilities for employee benefits for wages, salaries and annual leave that are expected to be settled within 12 months of the reporting date represent present obligations resulting from employees’ services provided to reporting date, are calculated at undiscounted amounts based on remuneration wage and salary rates that the Group expects to pay as at the reporting date including related on-costs, such as workers compensation, insurance and payroll tax. Non-monetary benefits, such as medical care, housing, cars and free or subsidised goods and services, are expensed based on the net marginal cost to the Group as the benefits are taken by the employees.

NOTES TO THE FINANCIAL STATEMENTS FOR THE YEAR ENDED 30 JUNE 2016
20 | Page
Termination benefits
Termination benefits are recognised as an expense when the Group is demonstrably committed, without realistic possibility of withdrawal, to a formal detailed plan to terminate employment before the normal retirement date. Termination benefits for voluntary redundancies are recognised if the Group has made an offer encouraging voluntary redundancy, it is probable that the offer will be accepted, and the number of acceptances can be estimated reliably.
(h) Provisions
A provision is recognised in the Statement of Financial Position when the Group has a present legal or constructive obligation as a result of a past event, and it is probable that an outflow of economic benefits will be required to settle the obligation. Provisions are determined by discounting the expected future cash flows at a pre-tax rate that reflects current market assessments of the time value of money and, where appropriate, the risks specific to the liability.
(i) Revenue
Sale of goods
Revenue from the sale of goods is recognised in profit or loss when persuasive evidence exists that the significant risks and rewards of ownership have been transferred to the buyer. No revenue is recognised if there are significant uncertainties regarding recovery of the consideration due, the costs incurred or to be incurred cannot be measured reliably, there is a risk of return of goods or there is continuing management involvement with the goods.
Transfers of risks and rewards vary depending on the individual terms of the contract of sale. For sales of Barramundi, transfer usually occurs when the product is received by the customer.
Gain from change in fair value of biological assets
Biological assets relating to aquaculture activities and products are stated at fair value less estimated point-of-sale costs, with any resultant gain or loss recognised in the income statement. Point-of-sale costs include all costs that would be necessary to sell the assets, including costs necessary to get the assets to market.
As the fair value of the assets is based on its present location and condition, the Company applies direct costing to estimate fair value of Barramundi in cages where they have not yet reached a saleable size of 400 grams.
(j) Expenses
Financing income and expenses
Financing costs comprise interest payable on borrowings (calculated using the effective interest method), facilities and interest receivable on funds invested that are recognised in the income statement. Borrowing costs are expensed as incurred and included in financing costs.
Interest income is recognised in the income statement as it accrues, using the effective interest method.
(k) Income tax
Income tax on profit or loss for the year comprises current and deferred tax. Income tax is recognised in the income statement except to the extent that it relates to items recognised directly in equity, in which case it is recognised in equity.
Current tax is the expected tax payable on the taxable income for the year, using tax rates enacted or substantively enacted at the balance sheet date, and any adjustment to tax payable in respect of previous years.
Research and development incentive is recognised as an income tax benefit in the year in which it is earned. The corresponding receivable is held within other receivables.
NOTES TO THE FINANCIAL STATEMENTS FOR THE YEAR ENDED 30 JUNE 2016
21 | Page
Deferred tax is provided using the balance sheet liability method, providing for temporary differences between the carrying amounts of assets and liabilities for financial reporting purposes and the amounts used for taxation purposes. The following temporary differences are not provided for: initial recognition of goodwill, the initial recognition of assets or liabilities that affect neither accounting nor taxable profit, and differences relating to investments in subsidiaries to the extent that they will probably not reverse in the foreseeable future. The amount of deferred tax provided is based on the expected manner of realisation or settlement of the carrying amount of assets and liabilities, using tax rates enacted or substantively enacted at the balance sheet date.
A deferred tax asset is recognised only to the extent that it is probable that the future taxable profits will be available against which the asset can be utilised. Deferred tax assets are reduced to the extent that it is no longer probable that the related tax benefit will be realised.
Tax consolidation
The Company and its wholly-owned Australian resident entities have formed a tax-consolidated group with effect from 1 July 2004 and are therefore taxed as a single entity from that date. The head entity within the tax-consolidated group is Marine Produce Australia Limited.
Current tax expense/income and deferred tax assets arising from unused tax losses of the subsidiaries is assumed by the head entity and are recognised in the separate financial statements of the members of the tax consolidated group using the “separate tax payer within group” approach by reference to the carrying amount of assets and liabilities in the separate financial statements of each entity and the tax values applying under tax consolidation.
Any current tax liabilities (or assets) and deferred tax assets arising from unused tax losses of the subsidiaries is assumed by the head entity in the tax consolidated group and are recognised as amounts payable (receivable) to (from) other entities in the tax-consolidated group in conjunction with any tax funding arrangement amounts (refer below). Any difference between these amounts is recognised by the Company as an equity contribution or distribution.
The Company recognises deferred tax assets arising from unused tax losses of the tax-consolidated group to the extent that it is probable that future taxable profits of the tax-consolidated group will be available against which the asset can be utilised.
Any subsequent period adjustments to deferred tax assets arising from unused tax losses as a result of revised assessments of the probability of recoverability is recognised by the head entity only.
Nature of tax funding arrangements and tax sharing arrangements
The head entity, in conjunction with other members of the tax-consolidated group, has not entered into a tax funding or sharing arrangement with members of the tax-consolidated group in respect of tax amounts.
(l) Goods and services tax
Revenue, expenses and assets are recognised net of the amount of goods and services tax (GST), except where the amount of GST incurred is not recoverable from the taxation authority. In these circumstances, the GST is recognised as part of the cost of acquisition of the asset or as part of the expense.
Receivables and payables are stated with the amount of GST included. The net amount of GST recoverable from, or payable to, the ATO is included as a current asset or liability in the balance sheet.
Cash flows are included in the statement of cash flows on a gross basis. The GST components of cash flows arising from investing and financing activities which are recoverable from, or payable to, the ATO are classified as operating cash flows.

NOTES TO THE FINANCIAL STATEMENTS FOR THE YEAR ENDED 30 JUNE 2016
22 | Page
(m) Determination of fair values
A number of the Group’s accounting policies and disclosures require the determination of fair value, for both financial and non-financial assets and liabilities. Fair values have been determined for measurement and/or disclosure purposes based on the following methods. When applicable, further information about the assumptions made in determining fair values of assets and liabilities are disclosed in the notes specific to that asset or liability.
Biological assets
The fair value of fish is set out in Note 3(d).
Trade and other receivables
The fair value of trade and other receivables is estimated as the present value of future cash flows, discounted at the market rate of interest at the reporting date.
(n) Financial instruments
Non-derivative financial assets
The Group initially recognises loans and receivables and deposits on the date that they are originated. All other financial assets (including assets designated at fair value through profit and loss) are recognised initially on the trade date at which the Group becomes a party to the contractual provisions of the instrument.
The Group derecognises a financial asset when the contractual rights to the cash flows from the asset expire, or it transfers the rights to receive the contractual cash flows on the financial asset in a transaction in which substantially all the risks and rewards of ownership of the financial asset are transferred. Any interest in transferred financial assets that is created or retained by the Group is recognised as a separate asset or liability.
The Group has the following non-derivative financial assets: trade and other receivables, and cash and cash equivalents.
Trade and other receivables are financial assets with fixed or determinable payments that are not quoted in an active market. Such assets are recognised initially at fair value plus any directly attributable transaction costs. Subsequent to initial recognition loans and receivables are measured at amortised cost using the effective interest method, less any impairment losses.
Cash and cash equivalents comprise cash balances and call deposits with original maturities of three months or less. Bank overdrafts that are repayable on demand and form an integral part of the Group’s cash management are included as a component of cash and cash equivalents for the purpose of the statement of cash flows.
Non-derivative financial liabilities
The Group initially recognises debt securities issued and subordinated liabilities on the date that they are originated. All other financial liabilities (including liabilities designated at fair value through profit or loss) are recognised initially on the trade date at which the Group becomes a party to the contractual provisions of the instrument. The Group derecognises a financial liability when its contractual obligations are discharged or cancelled or expire. Financial assets and liabilities are offset and the net amount presented in the Statement of Financial Position when, and only when, the Group has a legal right to offset the amounts and intends either to settle on a net basis or to realise the asset and settle the liability simultaneously.
The Group has the following non-derivative financial liabilities: loans and borrowings, and trade and other payables.
Such financial liabilities are recognised initially at fair value plus any directly attributable transaction costs. Subsequent to initial recognition these financial liabilities are measured at amortised cost using the effective interest rate method.
Financial assets and liabilities are offset and then net amount presented in the Statement of Financial Position when, and only when, the Group has a legal right to offset the amounts and intends either to settle on a net basis or to realise the asset and settle the liability simultaneously.

NOTES TO THE FINANCIAL STATEMENTS FOR THE YEAR ENDED 30 JUNE 2016
23 | Page
Share capital
Ordinary shares
Ordinary shares are classified as equity. Incremental costs directly attributable to the issue of ordinary shares and share options are recognised as a deduction from equity, net of any tax effects.
Dividends
Dividends are recognised as a liability in the period in which they are declared.
(o) Government grants
An unconditional government grant is recognised in profit or loss as other income when the grant becomes receivable.
Grants that compensate the Group for expenses incurred are recognised in profit or loss as other income on a systematic basis in the same period in which the expenses are recognised.
Research and development tax incentives are recognised in the statement of profit or loss when received or when the amount to be received can be reliably estimated.
4 New standards and interpretations not yet adopted
A number of new and revised standards are effective for the current reporting period, however there was no need
to change accounting policies or make retrospective adjustments as a result of adopting these standards.
Information on these new standards is presented below.
AASB 2015-1 Amendments to Australian Accounting Standards – Annual Improvements to Australian Accounting Standards 2012-2014 Cycle
These amendments arise from the issuance of Annual Improvements to IFRS 2012-2014 Cycle in September 2014
by the IASB.
Among other improvements, the amendments clarify that when an entity reclassifies an asset (or disposal group)
directly from being held for sale to being held for distribution (or vice-versa), the accounting guidance in
paragraphs 27-29 of AASB 5 Non-current Assets Held for Sale and Discontinued Operations does not apply. The
amendments also state that when an entity determines that the asset (or disposal group) is no longer available for
immediate distribution or that the distribution is no longer highly probable, it should cease held-for-distribution
accounting and apply the guidance in paragraphs 27-29 of AASB 5.
AASB 2014-3 Amendments to Australian Accounting Standards – Accounting for Acquisitions of Interests in Joint Operations
The amendments to AASB 11 Joint Arrangements state that an acquirer of an interest in a joint operation in which
the activity of the joint operation constitutes a ‘business’, as defined in AASB 3 Business Combinations, should;
apply all of the principles on business combinations accounting in AASB 3 and other Australian Accounting
Standards except principles that conflict with the guidance of AASB 11. This requirement also applies to the
acquisition of additional interests in an existing joint operation that results in the acquirer retaining joint
control of the joint operation (note that this requirement applies to the additional interest only, i.e., the
existing interest is not re-measured) and to the formation of a joint operation when an existing business is
contributed to the joint operation by one of the parties that participate in the joint operation; and
provide disclosures for business combinations as required by AASB 3 and other Australian Accounting
Standards.

NOTES TO THE FINANCIAL STATEMENTS FOR THE YEAR ENDED 30 JUNE 2016
24 | Page
AASB 2014-4 Amendments to Australian Accounting Standards – Clarification of Acceptable Methods of Depreciation and Amortisation
The amendments to AASB 116 prohibit the use of a revenue-based depreciation method for property, plant and
equipment. Additionally, the amendments provide guidance in the application of the diminishing balance method
for property, plant and equipment.
The amendments to AASB 138 present a rebuttable presumption that a revenue-based amortisation method for
intangible assets is inappropriate. This rebuttable presumption can be overcome (ie., a revenue-based
amortisation method might be appropriate) only in two (2) limited circumstances:
intangible asset is expressed as a measure of revenue, for example when the predominant limiting factor
inherent in an intangible asset is the achievement of a revenue threshold; or
when it can be demonstrated that revenue and the consumption of the economic benefits of the intangible
asset are highly correlated.
AASB 2014-9 Amendments to Australian Accounting Standards – Equity Method in Separate Financial Statements
The amendments introduce the equity method of accounting as one of the options to account for an entity’s
investments in subsidiaries, joint ventures and associates in the entity’s separate financial statements.
AASB 2015-2 Amendments to Australian Accounting Standards – Disclosure Initiative: Amendments to AASB 101
The Standard makes amendments to AASB 101 Presentation of Financial Statements arising from the IASB’s
Disclosure Initiative project. The amendments:
Clarify the materiality requirements in AASB 101, including an emphasis on the potentially detrimental effect
of obscuring useful information with immaterial information
Clarify that AASB 101’s specified line items in the statement(s) of profit or loss and other comprehensive
income and the statement of financial position can be disaggregated
Add requirements for how an entity should present subtotals in the statement(s) of profit and loss and other
comprehensive income and the statement of financial position
clarify that entities have flexibility as to the order in which they present the notes, but also emphasise that
understand-ability and comparability should be considered by an entity when deciding that order
remove potentially unhelpful guidance in AASB 101 for identifying a significant accounting policy
AASB 2015- 4 Amendments to Australian Accounting Standards – Financial Reporting Requirements for Australian Groups with a Foreign Parent
AASB 2015-4 amends AASB 128 Investments in Associates and Joint Ventures to ensure that its reporting
requirements on Australian groups with a foreign parent align with those currently available in AASB 10
Consolidated Financial Statements for such groups. AASB 128 will now only require the ultimate Australian entity
to apply the equity method in accounting for interests in associates and joint ventures, if either the entity or the
group is a reporting entity, or both the entity and group are reporting entities.
NOTES TO THE FINANCIAL STATEMENTS FOR THE YEAR ENDED 30 JUNE 2016
25 | Page
AASB 1057 Application of Australian Accounting Standards
In May 2015, the AASB decided to revise Australian Accounting Standards that incorporate IFRSs to minimise
Australian specific wording even further. The AASB noted that IFRSs do not contain application paragraphs that
identify the entities and financial reports to which the Standards (and Interpretations) apply. As a result, the AASB
decided to move the application paragraphs previously contained in each Australian Accounting Standard (or
Interpretation), unchanged, into a new Standard AASB 1057 Application of Australian Accounting Standards.
AASB 2015-9 Amendments to Australian Accounting Standards – Scope and Application Paragraphs removes the
application paragraphs from each Australian Accounting Standard.
Impact of standards issued but not yet applied
New and revised accounting standards and amendments that are currently issued for future reporting periods that
are relevant to the Company include:
AASB 9 Financial Instruments
AASB 9 introduces new requirements for the classification and measurement of financial assets and liabilities.
These requirements improve and simplify the approach for classification and measurement of financial assets
compared with the requirements of AASB 139.
The effective date is for annual reporting periods beginning on or after 1 January 2018.
The Company is yet to undertake a detailed assessment of the impact of AASB 9. However, based on the
Company’s preliminary assessment, the Standard is not expected to have a material impact on the transactions
and balances recognised in the financial statements when it is first adopted for the year ending 30 June 2019.
AASB 15 Revenue from Contracts with Customers
AASB 15 replaces AASB 118: Revenue, AASB 111 Construction Contracts and some revenue-related Interpretations. In summary, AASB 15:
establishes a new revenue recognition model;
changes the basis for deciding whether revenue is to be recognised over time at a point in time;
provides a new and more detailed guidance on specific topics (eg multiple element arrangements, variable
pricing, rights of return and warranties); and
expands and improves disclosures about revenue.
The Company is yet to undertake a detailed assessment of the impact of AASB 15. However, based on the Company’s preliminary assessment, the Standard is not expected to have a material impact on the transactions and balances recognised in the financial statements when it is first adopted for the year ending 30 June 2018.
AASB 16 Leases
AASB 16 replaces AASB 117 Leases and some lease-related Interpretations. In summary, AASB 16:
requires all leases to be accounted for ‘on-balance sheet’ by lessees, other than short-term and low value asset leases;
provides new guidance on the application of the definition of lease and on sale and lease back accounting;
largely retains the existing lessor accounting requirements in AASB 117; and
requires new and different disclosures about leases.
NOTES TO THE FINANCIAL STATEMENTS FOR THE YEAR ENDED 30 JUNE 2016
26 | Page
The Company is yet to undertake a detailed assessment of the impact of AASB 16. However, based on the
Company’s preliminary assessment, the Standard is not expected to have a material impact on the transactions
and balances recognised in the financial statements when it is first adopted for the year ending 30 June 2020.
AASB 2014-3 Amendments to Australian Accounting Standards – Accounting for Acquisitions of Interests in Joint
Operations
This amendment impacts on the use of AASB 11 when acquiring an interest in a joint operation.
The effective date is for annual reporting periods beginning on or after 1 January 2016. When these amendments
are first adopted for the year ending 30 June 2017, there will be no material impact on the transactions and
balances recognised in the financial statements.
AASB 2014-4 Amendments to Australian Accounting Standards – Clarification of Acceptable Methods of
Depreciation and Amortisation
The amendments to AASB 116 prohibit the use of a revenue-based depreciation method for property, plant and
equipment. Additionally, the amendments provide guidance in the application of the diminishing balance method
for property, plant and equipment.
The effective date is for annual reporting periods beginning on or after 1 January 2016. When these amendments
are first adopted for the year ending 30 June 2017, there will be no material impact on the transactions and
balances recognised in the financial statements.
AASB 2014-9 Amendments to Australian Accounting Standards – Equity Method in Separate Financial
Statements
The amendments introduce the equity method of accounting as one of the options to account for an entity’s
investments in subsidiaries, joint ventures and associates in the entity’s separate financial statements.
The effective date is for annual reporting periods beginning on or after 1 January 2016. When these amendments
are first adopted for the year ending 30 June 2017, there will be no material impact on the financial statements.
AASB 2014-10 Amendments to Australian Accounting Standards – Sale or Contribution of Assets between an
Investor and its Associate or Joint Venture
The amendments address a current inconsistency between AASB 10 Consolidated Financial Statements and AASB
128 Investments in Associates and Joint Ventures (2011). The amendments clarify that, on a sale or contribution of
assets to a joint venture or associate or on a loss of control when joint control or significant influence is retained in
a transaction involving an associate or a joint venture, any gain or loss recognised will depend on whether the
assets or subsidiary constitute a business, as defined in AASB 3 Business Combinations. Full gain or loss is
recognised when the assets or subsidiary constitute a business, whereas gain or loss attributable to other
investors’ interests is recognised when the assets or subsidiary do not constitute a business.
The effective date is for annual reporting periods beginning on or after 1 January 2016. When these amendments
are first adopted for the year ending 30 June 2017, there will be no material impact on the financial statements.
NOTES TO THE FINANCIAL STATEMENTS FOR THE YEAR ENDED 30 JUNE 2016
27 | Page
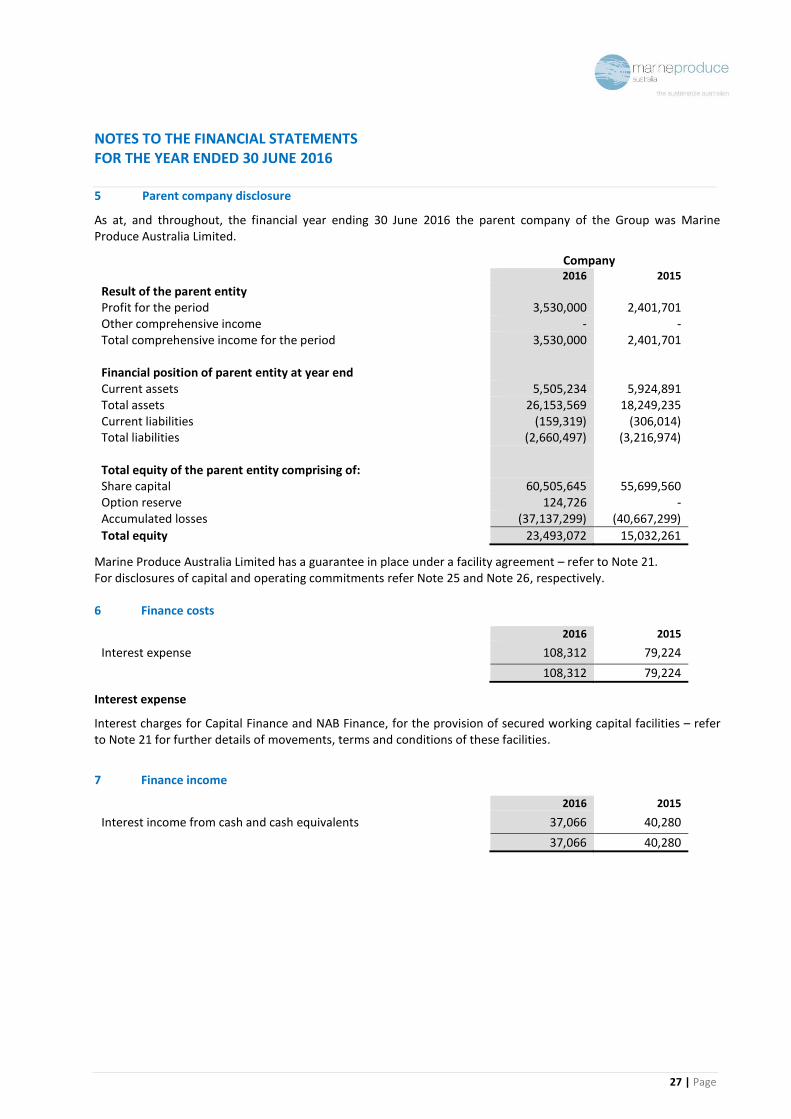
5 Parent company disclosure
As at, and throughout, the financial year ending 30 June 2016 the parent company of the Group was Marine Produce Australia Limited.
Company 2016 2015
Result of the parent entity Profit for the period 3,530,000 2,401,701 Other comprehensive income - - Total comprehensive income for the period 3,530,000 2,401,701 Financial position of parent entity at year end
Current assets 5,505,234 5,924,891 Total assets 26,153,569 18,249,235 Current liabilities (159,319) (306,014) Total liabilities (2,660,497) (3,216,974) Total equity of the parent entity comprising of:
Share capital 60,505,645 55,699,560 Option reserve 124,726 - Accumulated losses (37,137,299) (40,667,299)
Total equity 23,493,072 15,032,261
Marine Produce Australia Limited has a guarantee in place under a facility agreement – refer to Note 21. For disclosures of capital and operating commitments refer Note 25 and Note 26, respectively. 6 Finance costs
2016 2015
Interest expense 108,312 79,224
108,312 79,224
Interest expense
Interest charges for Capital Finance and NAB Finance, for the provision of secured working capital facilities – refer to Note 21 for further details of movements, terms and conditions of these facilities.
7 Finance income
2016 2015
Interest income from cash and cash equivalents 37,066 40,280
37,066 40,280
NOTES TO THE FINANCIAL STATEMENTS FOR THE YEAR ENDED 30 JUNE 2016
28 | Page
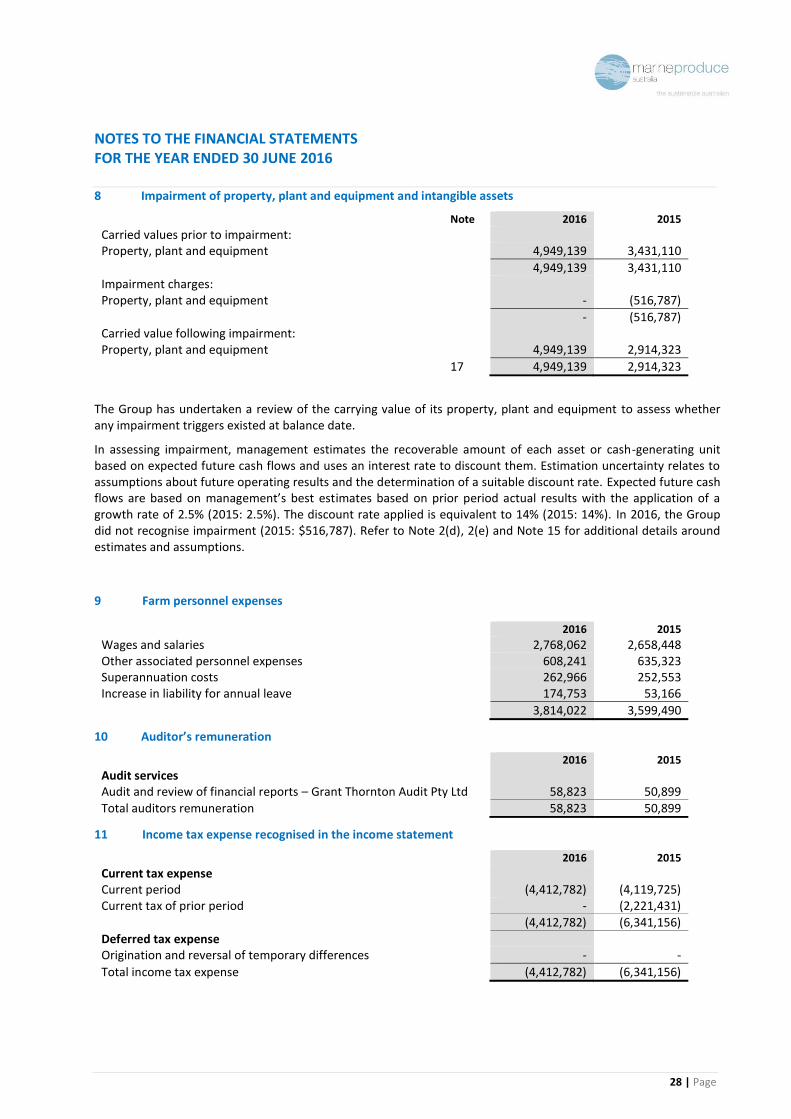
8 Impairment of property, plant and equipment and intangible assets
Note 2016 2015
Carried values prior to impairment: Property, plant and equipment 4,949,139 3,431,110
4,949,139 3,431,110 Impairment charges: Property, plant and equipment - (516,787)
- (516,787) Carried value following impairment: Property, plant and equipment 4,949,139 2,914,323
17 4,949,139 2,914,323
The Group has undertaken a review of the carrying value of its property, plant and equipment to assess whether any impairment triggers existed at balance date.
In assessing impairment, management estimates the recoverable amount of each asset or cash-generating unit based on expected future cash flows and uses an interest rate to discount them. Estimation uncertainty relates to assumptions about future operating results and the determination of a suitable discount rate. Expected future cash flows are based on management’s best estimates based on prior period actual results with the application of a growth rate of 2.5% (2015: 2.5%). The discount rate applied is equivalent to 14% (2015: 14%). In 2016, the Group did not recognise impairment (2015: $516,787). Refer to Note 2(d), 2(e) and Note 15 for additional details around estimates and assumptions.
9 Farm personnel expenses
2016 2015
Wages and salaries 2,768,062 2,658,448 Other associated personnel expenses 608,241 635,323 Superannuation costs 262,966 252,553 Increase in liability for annual leave 174,753 53,166
3,814,022 3,599,490
10 Auditor’s remuneration
2016 2015
Audit services Audit and review of financial reports – Grant Thornton Audit Pty Ltd 58,823
50,899
Total auditors remuneration 58,823 50,899
11 Income tax expense recognised in the income statement
2016 2015
Current tax expense Current period (4,412,782) (4,119,725) Current tax of prior period - (2,221,431)
(4,412,782) (6,341,156)
Deferred tax expense Origination and reversal of temporary differences - -
Total income tax expense (4,412,782) (6,341,156)

NOTES TO THE FINANCIAL STATEMENTS FOR THE YEAR ENDED 30 JUNE 2016
29 | Page
Numerical reconciliation between tax-expense and pre-tax net profit
2016 2015
Accounting loss before tax (881,480) (3,939,455)
Loss excluding income tax (881,480) (3,939,455)
Income tax (benefit) using the Company’s domestic tax rate of 30% (2015:30%)
(264,444) (1,181,837)
Non-deductible expenses 39,212 2,067 Recoupment of prior year tax losses not brought to account (373,235) (2,221,431) Research and development offset income tax rate variance (1,470,927) (1,373,242) Assessable research and development feedstock adjustment 48,821 467,451 Deferred tax asset not brought to account (2,392,209) 62,742 Deferred tax loss not brought to account 403,815 - Research and development tax refund – amendment prior year (2,096,906) Feedstock adjustment amendment of prior year (403,815) -
Income tax expense (benefit) (4,412,782) (6,341,156)
12 Cash and cash equivalents
2016 2015
Cash at bank 1,473,322 2,063,069
Cash in the statement of cash flows 1,473,322 2,063,069
The Group currently maintains a $400,000 overdraft facility with NAB. This amount of the facility used at 30 June 2016 was nil (2015: nil).
The Group’s exposure to interest rate risk and a sensitivity analysis for financial assets and liabilities are disclosed in Note 24.
13 Trade and other receivables
2016 2015
Trade receivables 1,058,837 818,448 Provision for doubtful debt - (19,440) Other receivables 16,600 3,411 Research and development tax refund
(1) 4,412,782 3,913,739
GST receivable 199,792 121,802
5,688,011 4,837,960
The research and development tax refund has been received subsequent to reporting date. Refer note 30.
The Group’s exposure to credit and currency risks and impairment losses related to trade and other receivables are disclosed in Note 24.
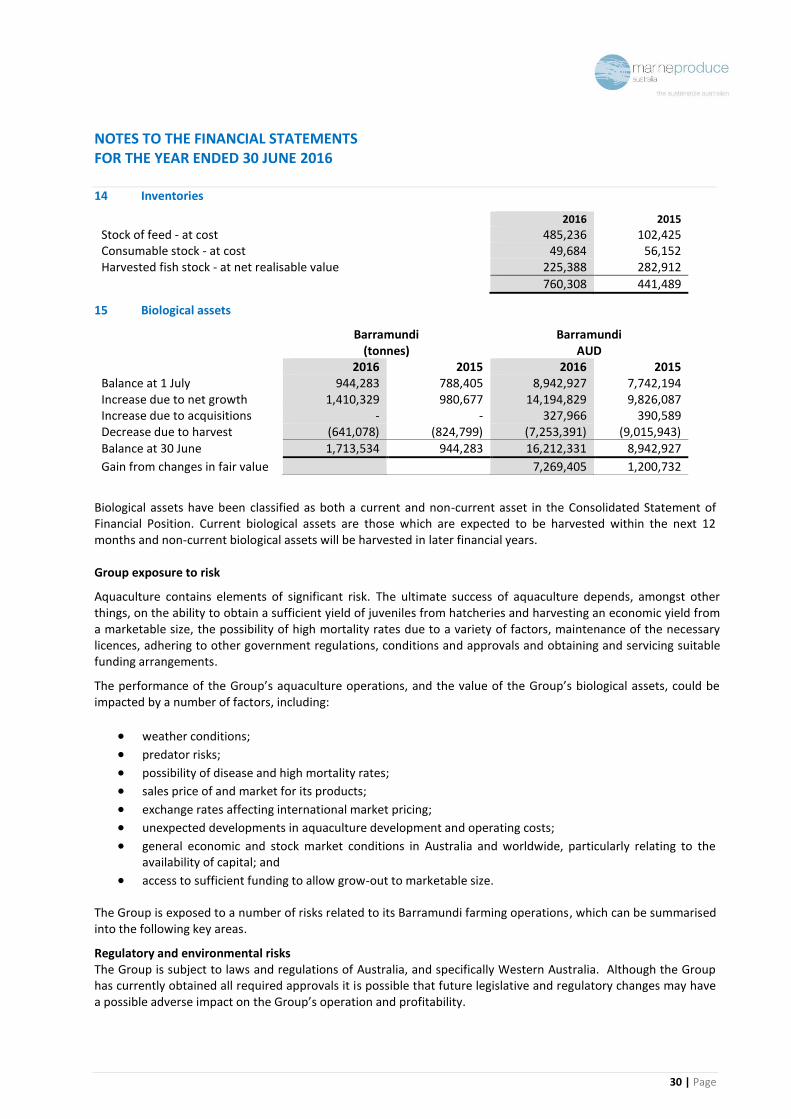
NOTES TO THE FINANCIAL STATEMENTS FOR THE YEAR ENDED 30 JUNE 2016
30 | Page
14 Inventories
2016 2015
Stock of feed - at cost 485,236 102,425 Consumable stock - at cost 49,684 56,152 Harvested fish stock - at net realisable value 225,388 282,912
760,308 441,489
15 Biological assets
Barramundi (tonnes)
Barramundi AUD
2016 2015 2016 2015 Balance at 1 July 944,283 788,405 8,942,927 7,742,194 Increase due to net growth 1,410,329 980,677 14,194,829 9,826,087 Increase due to acquisitions - - 327,966 390,589 Decrease due to harvest (641,078) (824,799) (7,253,391) (9,015,943)
Balance at 30 June 1,713,534 944,283 16,212,331 8,942,927
Gain from changes in fair value 7,269,405 1,200,732
Biological assets have been classified as both a current and non-current asset in the Consolidated Statement of Financial Position. Current biological assets are those which are expected to be harvested within the next 12 months and non-current biological assets will be harvested in later financial years. Group exposure to risk
Aquaculture contains elements of significant risk. The ultimate success of aquaculture depends, amongst other things, on the ability to obtain a sufficient yield of juveniles from hatcheries and harvesting an economic yield from a marketable size, the possibility of high mortality rates due to a variety of factors, maintenance of the necessary licences, adhering to other government regulations, conditions and approvals and obtaining and servicing suitable funding arrangements.
The performance of the Group’s aquaculture operations, and the value of the Group’s biological assets, could be impacted by a number of factors, including:
weather conditions;
predator risks;
possibility of disease and high mortality rates;
sales price of and market for its products;
exchange rates affecting international market pricing;
unexpected developments in aquaculture development and operating costs;
general economic and stock market conditions in Australia and worldwide, particularly relating to the availability of capital; and
access to sufficient funding to allow grow-out to marketable size.
The Group is exposed to a number of risks related to its Barramundi farming operations, which can be summarised into the following key areas.
Regulatory and environmental risks The Group is subject to laws and regulations of Australia, and specifically Western Australia. Although the Group has currently obtained all required approvals it is possible that future legislative and regulatory changes may have a possible adverse impact on the Group’s operation and profitability.

NOTES TO THE FINANCIAL STATEMENTS FOR THE YEAR ENDED 30 JUNE 2016
31 | Page
There are a number of environmental conditions which the Group must comply with and failure to meet such conditions could lead to forfeiture of key operating licences and leases and significant liability could be imposed on the Group for damages or penalties for non-compliance by the Group with environmental laws or regulations. The Group has established environmental policies and procedures aimed at compliance with local environmental and other laws. Management performs regular reviews to identify environmental risks and to ensure that the systems in place are adequate to manage those risks. Supply and demand risks The Group is exposed to risks arising from fluctuations in the price and sales volume of fish. MPA’s financial position and future development depends, to a considerable extent, on the price of Barramundi and demand for the fish is affected by a large number of different factors, over which the Group has little control. Where practicable, the Group manages this risk by aligning its harvest volume to market supply and demand. Management performs regular industry trend analysis to ensure that the Group’s pricing structure is in line with the market and to ensure that projected harvest volumes are consistent with the expected demand. Climate and other risks The Group’s fish farm is exposed to the risk of damage from climatic conditions as it is located in a tropical cyclone threat area. Although the main impacts of tropical lows and cyclones in the Derby region are heavy rainfall and associated flooding, there is still the risk that a severe cyclone may impact the Group’s operation. During the past twelve years of operating, the Group has had firsthand experience of cyclones and has subsequently developed and established procedures aimed at monitoring and mitigating those risks, including insuring itself against damage to its assets caused by natural disasters. Basis of estimation and valuation The measurement of the number, weight and value of fish stock involves:
sample counting of fish in cages during cage transfers and grading;
sample weighing of fish in cages and extrapolation of results to total holding in sampled cage; and
current market values and selling costs. In line with industry practice there is a degree of estimation in these processes which requires management and
staff to make judgments, estimates and assumptions that affect the reported quantities and value of the Group’s
biological assets. Fish numbers are estimated allowing for cannibalism, stock losses and under delivery of small fish
at time of purchase. Actual results, for example at later harvest, may differ positively or negatively from those
estimates. The estimates and assumptions applied are reviewed on an ongoing basis.
There is inherent uncertainty in the biomass estimate and resultant live fish valuation. This is common to all such
valuations and best practice methodology is used to facilitate reliable estimates. Biomass is estimated using a
model that simulates fish growth. Actual growth will invariably differ to some extent, which is monitored and stock
records adjusted via harvest counts and weights, periodic sample weight checks, physical counts on transfer to sea
cages and subsequent splitting of cages, mortality counts and reconciliation of the perpetual records after physical
counts and on cage closeout.
Competition Competition from domestic and foreign fish producers may pose a risk to the Group. The Group can provide no assurance that it will be able to compete effectively with existing or new competitors or that increased competition will not have a material adverse effect on the Group’s future operating and financial performance. Similarly, no assurances can be given regarding future Barramundi prices.
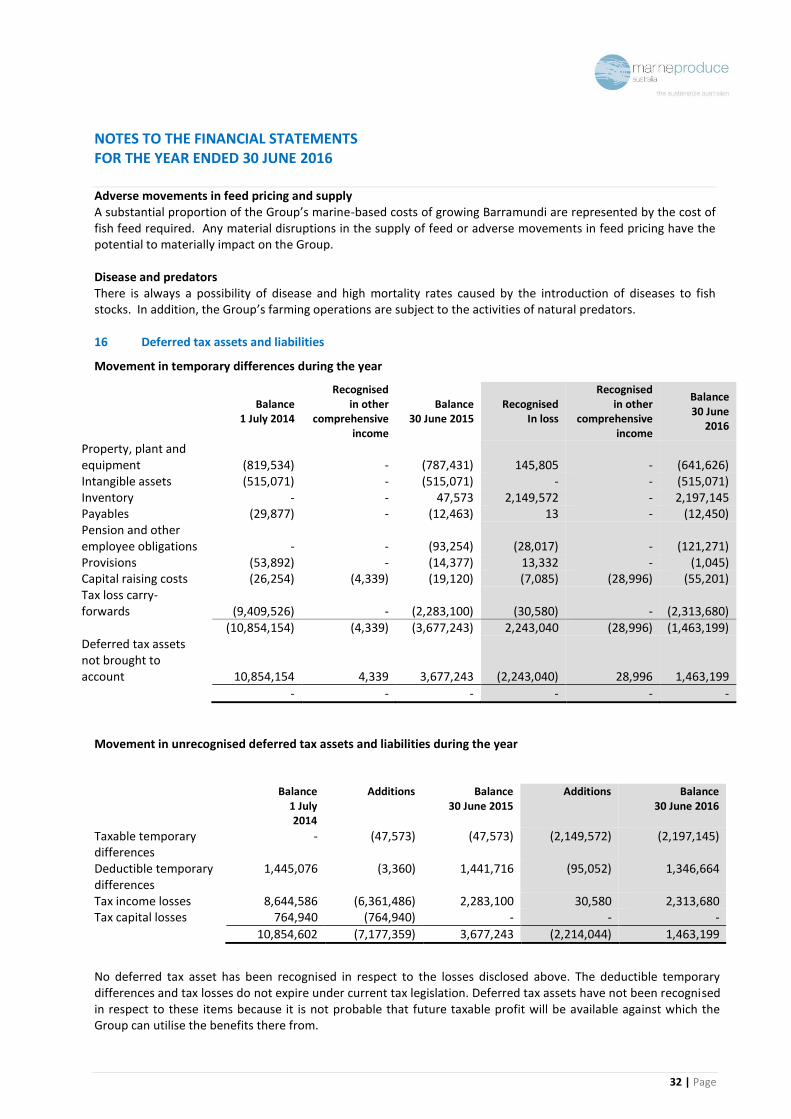
NOTES TO THE FINANCIAL STATEMENTS FOR THE YEAR ENDED 30 JUNE 2016
32 | Page
Adverse movements in feed pricing and supply A substantial proportion of the Group’s marine-based costs of growing Barramundi are represented by the cost of fish feed required. Any material disruptions in the supply of feed or adverse movements in feed pricing have the potential to materially impact on the Group. Disease and predators There is always a possibility of disease and high mortality rates caused by the introduction of diseases to fish stocks. In addition, the Group’s farming operations are subject to the activities of natural predators. 16 Deferred tax assets and liabilities
Movement in temporary differences during the year
Balance
1 July 2014
Recognised in other
comprehensive income
Balance 30 June 2015
Recognised In loss
Recognised in other
comprehensive income
Balance 30 June
2016
Property, plant and equipment (819,534) - (787,431) 145,805 - (641,626) Intangible assets (515,071) - (515,071) - - (515,071) Inventory - - 47,573 2,149,572 - 2,197,145 Payables (29,877) - (12,463) 13 - (12,450) Pension and other employee obligations - - (93,254) (28,017) - (121,271) Provisions (53,892) - (14,377) 13,332 - (1,045) Capital raising costs (26,254) (4,339) (19,120) (7,085) (28,996) (55,201) Tax loss carry-forwards (9,409,526) - (2,283,100) (30,580) - (2,313,680) (10,854,154) (4,339) (3,677,243) 2,243,040 (28,996) (1,463,199) Deferred tax assets not brought to account 10,854,154 4,339 3,677,243 (2,243,040) 28,996 1,463,199
- - - - - -
Movement in unrecognised deferred tax assets and liabilities during the year
Balance 1 July 2014
Additions Balance 30 June 2015
Additions Balance 30 June 2016
Taxable temporary differences
- (47,573) (47,573) (2,149,572) (2,197,145)
Deductible temporary differences
1,445,076 (3,360) 1,441,716 (95,052) 1,346,664
Tax income losses 8,644,586 (6,361,486) 2,283,100 30,580 2,313,680 Tax capital losses 764,940 (764,940) - - -
10,854,602 (7,177,359) 3,677,243 (2,214,044) 1,463,199
No deferred tax asset has been recognised in respect to the losses disclosed above. The deductible temporary differences and tax losses do not expire under current tax legislation. Deferred tax assets have not been recognised in respect to these items because it is not probable that future taxable profit will be available against which the Group can utilise the benefits there from.
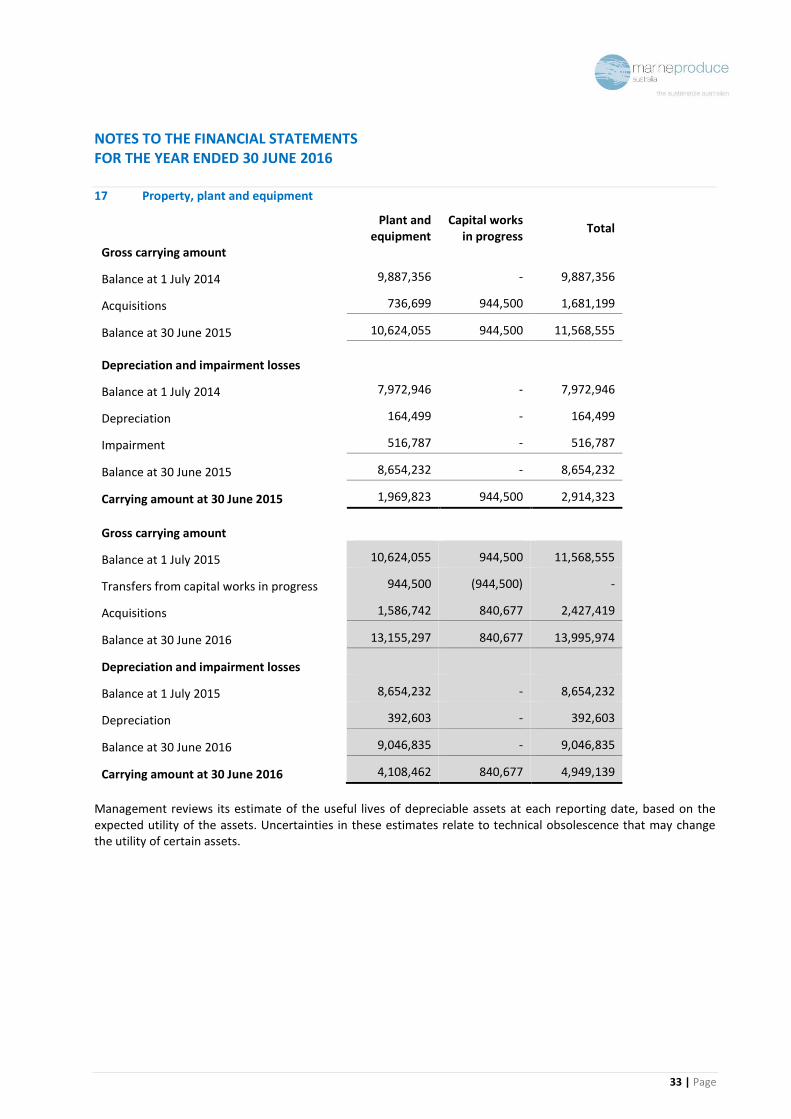
NOTES TO THE FINANCIAL STATEMENTS FOR THE YEAR ENDED 30 JUNE 2016
33 | Page
17 Property, plant and equipment
Plant and
equipment Capital works
in progress Total
Gross carrying amount
Balance at 1 July 2014 9,887,356 - 9,887,356
Acquisitions 736,699 944,500 1,681,199
Balance at 30 June 2015 10,624,055 944,500 11,568,555
Depreciation and impairment losses
Balance at 1 July 2014 7,972,946 - 7,972,946
Depreciation 164,499 - 164,499
Impairment 516,787 - 516,787
Balance at 30 June 2015 8,654,232 - 8,654,232
Carrying amount at 30 June 2015 1,969,823 944,500 2,914,323
Gross carrying amount
Balance at 1 July 2015 10,624,055 944,500 11,568,555
Transfers from capital works in progress 944,500 (944,500) -
Acquisitions 1,586,742 840,677 2,427,419
Balance at 30 June 2016 13,155,297 840,677 13,995,974
Depreciation and impairment losses
Balance at 1 July 2015 8,654,232 - 8,654,232
Depreciation 392,603 - 392,603
Balance at 30 June 2016 9,046,835 - 9,046,835
Carrying amount at 30 June 2016 4,108,462 840,677 4,949,139
Management reviews its estimate of the useful lives of depreciable assets at each reporting date, based on the expected utility of the assets. Uncertainties in these estimates relate to technical obsolescence that may change the utility of certain assets.
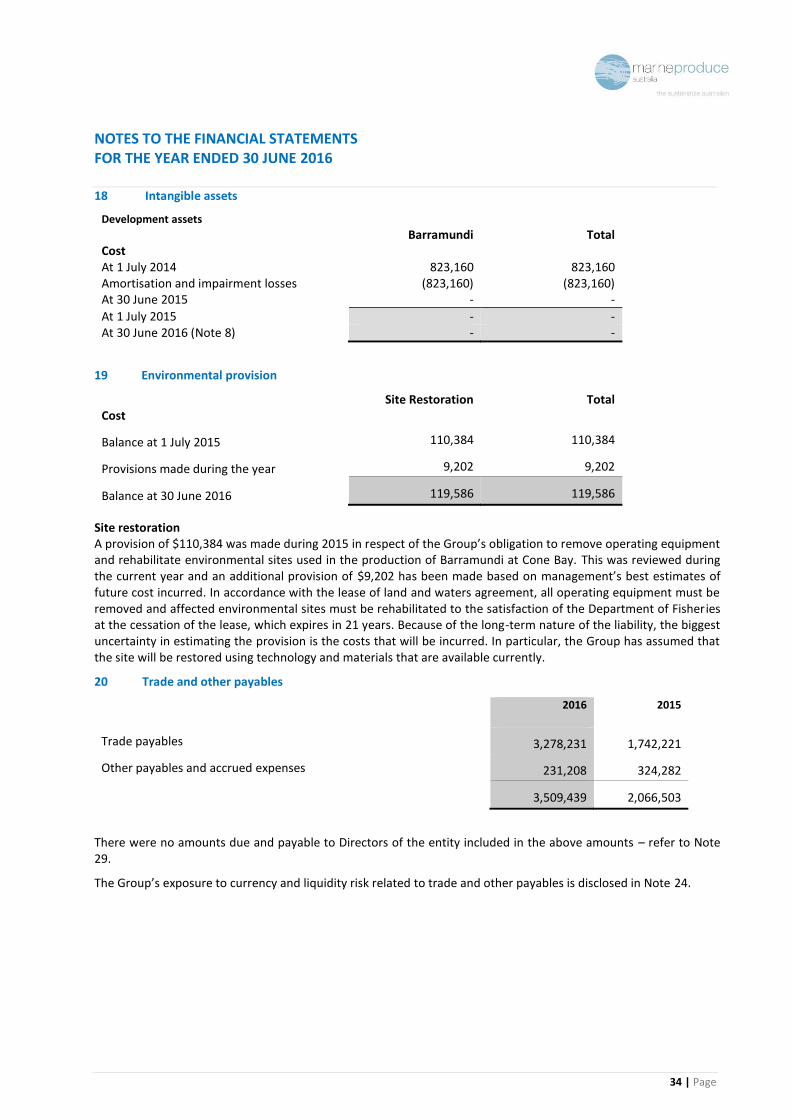
NOTES TO THE FINANCIAL STATEMENTS FOR THE YEAR ENDED 30 JUNE 2016
34 | Page
18 Intangible assets
Development assets
Barramundi Total Cost At 1 July 2014 823,160 823,160 Amortisation and impairment losses (823,160) (823,160) At 30 June 2015 - -
At 1 July 2015 - - At 30 June 2016 (Note 8) - -
19 Environmental provision
Site Restoration Total Cost
Balance at 1 July 2015 110,384 110,384
Provisions made during the year 9,202 9,202
Balance at 30 June 2016 119,586 119,586
Site restoration A provision of $110,384 was made during 2015 in respect of the Group’s obligation to remove operating equipment and rehabilitate environmental sites used in the production of Barramundi at Cone Bay. This was reviewed during the current year and an additional provision of $9,202 has been made based on management’s best estimates of future cost incurred. In accordance with the lease of land and waters agreement, all operating equipment must be removed and affected environmental sites must be rehabilitated to the satisfaction of the Department of Fisheries at the cessation of the lease, which expires in 21 years. Because of the long-term nature of the liability, the biggest uncertainty in estimating the provision is the costs that will be incurred. In particular, the Group has assumed that the site will be restored using technology and materials that are available currently.
20 Trade and other payables
2016 2015
Trade payables 3,278,231 1,742,221
Other payables and accrued expenses 231,208 324,282
3,509,439 2,066,503
There were no amounts due and payable to Directors of the entity included in the above amounts – refer to Note 29.
The Group’s exposure to currency and liquidity risk related to trade and other payables is disclosed in Note 24.

NOTES TO THE FINANCIAL STATEMENTS FOR THE YEAR ENDED 30 JUNE 2016
35 | Page
21 Loans and borrowings
2016 2015
Current interest-bearing loans 471,702 1,164,310
Non-current interest bearing loans 1,182,965 691,359
1,654,667 1,855,669
Movements in loans and borrowings during 2016
Facility Opening
Drawn in cash Repaid in
cash
Closing
1-Jul-15 30-Jun-16
NAB Finance - Innovator 977,500 - 285,490 692,010
NAB Finance – Work Vessels 878,169 113,180 116,066 875,283
Capital Finance - Crown Forklifts - 44,000 1,496 42,504
Capital Finance - Net & Pressure Cleaning - 46,113 1,243 44,870
Total 1,855,669 203,293 404,295 1,654,667
This note provides information about the contractual terms of the Group’s interest-bearing loans and borrowings, which are measured at amortised cost. For more information about the Group’s exposure to interest rate and liquidity risk, see Note 24.
NAB Finance
During the period the Group received further funds of $113,180 from National Australia Bank (NAB) which
completed previously secured payments for vessels, and $90,113 from Capital Finance. The Group has honoured
its covenant obligations with existing finance provider National Australia Bank (NAB), including maintaining capital
ratios and minimum equity levels since the agreements were entered into.
The loan agreements are with MPA Fish Farms Pty Ltd and the parent company, Marine Produce Australia Ltd,
acted as guarantor. The following is a list of security interests held by NAB in relation to the agreements:
- General security charge over all present and future rights, property and undertakings of MPA Fish Farms
Pty Ltd.
- General security charge over all present and future rights, property and undertakings of Marine Produce
Australia Ltd
- General security charge over all present and future rights, property and undertakings of MPA Marketing
Pty Ltd
- 1st
Registered Ships Mortgage given by MPA Fish Farms Pty Ltd over the Innovator vessel.
- Guarantee and Indemnity for $1,985,569 given by Marine Produce Australia Limited and MPA Marketing
Pty Ltd supported by:
Security interest and Charge over all present and future rights, property and
undertakings of MPA Marketing Pty Ltd
Security interest and Charge over all present and future rights, property and
undertakings of Marine Produce Australia Ltd

NOTES TO THE FINANCIAL STATEMENTS FOR THE YEAR ENDED 30 JUNE 2016
36 | Page
Subsequent to reporting date, MPA Fish Farms Pty Ltd entered equipment loans over each new vessel, superseding
the original loan. NAB has security of each vessel for each loan in addition to each loan being secured by the a
general security charge over all present and future rights, property and undertakings of MPA Fish Farms Pty Ltd,
Marine Produce Australia Pty Ltd and MPA Marketing Pty Ltd.
22 Employee benefits
Current
2016 2015
Provision for annual leave 288,407 226,330 Provision for long service leave 112,677 -
401,084 226,330
Defined superannuation contribution funds
The Group makes contributions to defined contribution superannuation funds. The amount recognised as an expense during the period was $335,160 (2015: $333,645).
23 Share capital
Ordinary Shares Options
No. shares $ No. options $
On issue at 1 July 2014 94,900,231 54,481,090 20,118,583 1,473,020
Consolidation 1:4 23,725,292 54,481,090 5,029,673 1,473,020
Issue of share capital 1,598,802 799,243 - -
Issue of share capital for no cash consideration
- - 799,428 -
Share application funds received - 21,000 - -
Transaction costs - (14,462) - -
Exercise of options 515,862 412,689 (515,862) -
Expiry of options - - (4,513,811) (1,473,020)
On issue at 30 June 2015 25,839,956 55,699,560 799,428 -
On issue at 1 July 2015 25,839,956 55,699,560 799,428 -
Rights issue 42,000 - 21,000 -
Issue of shares(i)
309,517 - - -
Issue of options to directors(ii)
- - 2,200,000 124,726
Issue of shares pursuant to rights
issue(iv)
9,805,477 4,902,739 - -
Transaction costs - (96,654) - -
On issue at 30 June 2016 35,996,950 60,505,645 3,020,428 124,726
Note
(i) On 7 August 2015 the Company issued 309,517 fully paid ordinary shares (Loyalty Shares), made on the basis of
3 Loyalty Shares for every 5 unlisted $0.80 options which option holders exercised prior to expiry on 31 October
2014;
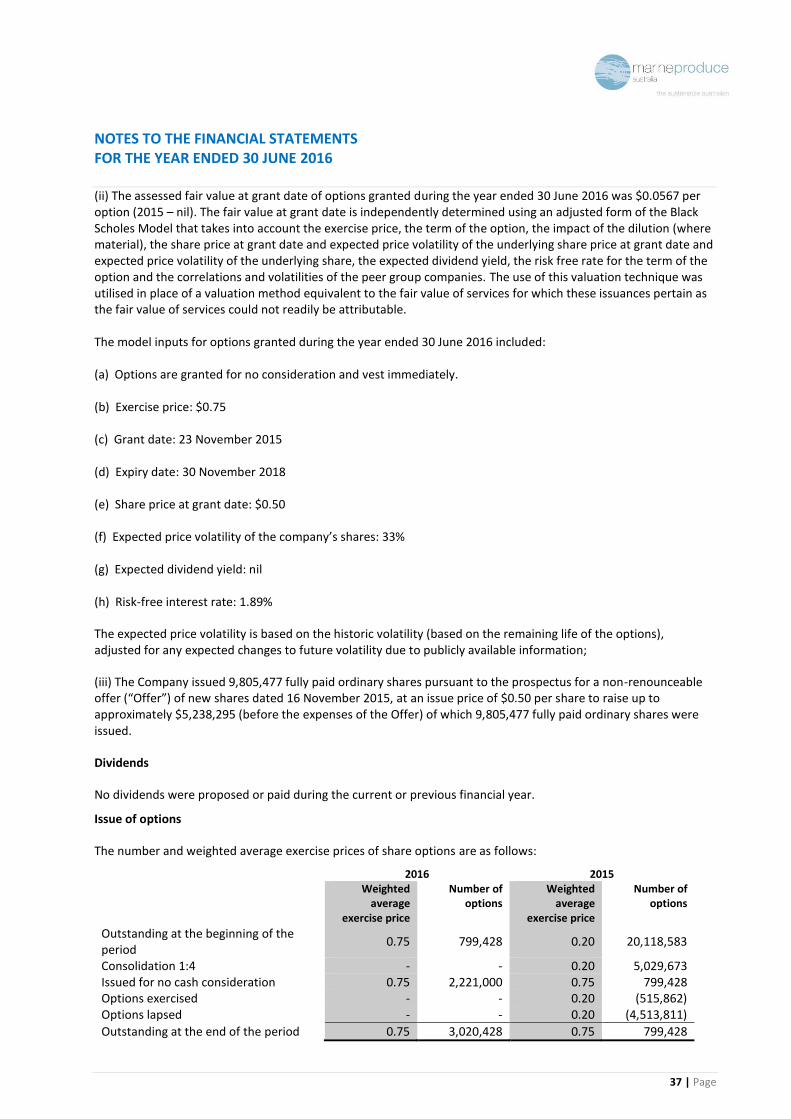
NOTES TO THE FINANCIAL STATEMENTS FOR THE YEAR ENDED 30 JUNE 2016
37 | Page
(ii) The assessed fair value at grant date of options granted during the year ended 30 June 2016 was $0.0567 per option (2015 – nil). The fair value at grant date is independently determined using an adjusted form of the Black Scholes Model that takes into account the exercise price, the term of the option, the impact of the dilution (where material), the share price at grant date and expected price volatility of the underlying share price at grant date and expected price volatility of the underlying share, the expected dividend yield, the risk free rate for the term of the option and the correlations and volatilities of the peer group companies. The use of this valuation technique was utilised in place of a valuation method equivalent to the fair value of services for which these issuances pertain as the fair value of services could not readily be attributable. The model inputs for options granted during the year ended 30 June 2016 included: (a) Options are granted for no consideration and vest immediately. (b) Exercise price: $0.75 (c) Grant date: 23 November 2015 (d) Expiry date: 30 November 2018 (e) Share price at grant date: $0.50 (f) Expected price volatility of the company’s shares: 33% (g) Expected dividend yield: nil (h) Risk-free interest rate: 1.89%
The expected price volatility is based on the historic volatility (based on the remaining life of the options), adjusted for any expected changes to future volatility due to publicly available information;
(iii) The Company issued 9,805,477 fully paid ordinary shares pursuant to the prospectus for a non-renounceable offer (“Offer”) of new shares dated 16 November 2015, at an issue price of $0.50 per share to raise up to approximately $5,238,295 (before the expenses of the Offer) of which 9,805,477 fully paid ordinary shares were issued.
Dividends
No dividends were proposed or paid during the current or previous financial year.
Issue of options
The number and weighted average exercise prices of share options are as follows:
2016 2015
Weighted average
exercise price
Number of options
Weighted average
exercise price
Number of options
Outstanding at the beginning of the period
0.75 799,428 0.20 20,118,583
Consolidation 1:4 - - 0.20 5,029,673 Issued for no cash consideration 0.75 2,221,000 0.75 799,428 Options exercised - - 0.20 (515,862) Options lapsed - - 0.20 (4,513,811)
Outstanding at the end of the period 0.75 3,020,428 0.75 799,428

NOTES TO THE FINANCIAL STATEMENTS FOR THE YEAR ENDED 30 JUNE 2016
38 | Page
24 Financial risk management
Exposure to credit and interest rate risks arises in the normal course of the Group’s businesses. The Group and Company are not exposed to foreign currency risk as sales, purchases and borrowings are made in the functional currency, being AUD.
The Company and Group have exposure to the following risks from their use of financial instruments:
Credit risk
Liquidity risk
Market risk
Interest rate risk
Operational risk
This note presents information about the Group’s exposure to each of the above risks, their objectives, policies and processes for measuring and managing risk, and the management of capital. Further quantitative disclosures are included throughout this financial report.
The Board of Directors has overall responsibility for the establishment and oversight of the risk management framework.
Risk management policies are established to identify and analyse the risks faced by the Group, to set appropriate risk limits and controls, and to monitor risks and adherence to limits. Risk management policies and systems are reviewed to reflect changes in market conditions and the Group’s activities. The Group, through its training and management standards and procedures, aim to develop a disciplined and constructive control environment in which all employees understand their roles and obligations.
(i) Credit risk
Credit risk is the risk of financial loss to the Group if a customer or counterparty to a financial instrument fails to meet its contractual obligations, and arises principally from the Group’s receivables from customers and investment securities.
Exposure to credit risk
The carrying amount of the Group’s financial assets represents the maximum credit exposure. The Group’s maximum exposure to credit risk at the reporting date was:
Carrying amount 2016 2015
Trade and other receivables 5,688,011 4,837,960 Cash and cash equivalents 1,473,322 2,063,069
7,161,333 6,901,029
Trade and other receivables
The Group’s exposure to credit risk is influenced mainly by the individual characteristics of each customer. The demographics of the Group’s customer base, including the default risk of the industry. The Group’s revenue is not significantly attributable to sales transactions with a single customer.
The Group does not require collateral in respect of trade and other receivables.
The Group’s maximum exposure to credit risk for trade receivables at the reporting date by geographic region, being within Australia, was $1,058,837 (2015: $818,448). All sales are made to wholesale customers.

NOTES TO THE FINANCIAL STATEMENTS FOR THE YEAR ENDED 30 JUNE 2016
39 | Page
Impairment losses
The Group’s trade receivables that are past due $334,636 (2015: $818,448). The ageing of the Group’s receivables at the reporting date was:
Gross Impairment Gross Impairment
2016 2016 2015 2015
Not past due 724,181 - - -
Past due 0-30 days 310,253 - 522,982 -
Past due 31-120 days 24,403 - 295,022 18,996
Past due 121 days - - 444 444
1,058,837 - 818,448 19,440
The Group has reviewed its receivables at period end for impairment. The Group believes that no impairment is necessary (2015: $19,440).
(ii) Liquidity risk
Liquidity risk is the risk that the Group will not be able to meet its financial obligations as they fall due. The Group’s approach to managing liquidity is to ensure, as far as possible, that it will always have sufficient liquidity to meet its liabilities when due, under both normal and stressed conditions, without incurring unacceptable losses or risking damage to the Group’s reputation.
The Group projects revenue and costs, which assists it in monitoring cash flow requirements and optimising its cash return on investments. Typically the Group seeks to ensure that it has sufficient cash on demand to meet expected operational expenses for a period of at least 30 days, including the servicing of financial obligations; this excludes the potential impact of extreme circumstances that cannot reasonably be predicted, such as natural disasters.
The following are the contractual maturities of financial liabilities, including estimated interest payments and excluding the impact of netting agreements:
2016
Carrying amount
Contractual cash flows
6 months or less
6-12 months
1-2 years
2-5 years More than
5 years
Non-derivative financial liabilities
Secured loans 1,654,667 1,654,667 469,282 501,776 683,619 - Trade and other payables
3,509,439 3,509,439 3,509,439 - - - -
5,164,106 5,164,106 3,509,439 469,282 501,776 683,619 -
2015
Carrying amount
Contractual cash flows
6 months or less
6-12 months
1-2 years 2-5 years More
than 5 years
Non-derivative financial liabilities
Secured loans 1,855,669 1,855,669 1,164,310 691,359 - -
Trade and other payables 2,066,503 2,066,503 2,066,503 - - - -
3,922,172 3,922,172 2,066,503 1,164,310 691,359 - -

NOTES TO THE FINANCIAL STATEMENTS FOR THE YEAR ENDED 30 JUNE 2016
40 | Page
(iii) Market risk
Market risk is the risk that changes in market prices, such as interest rates will affect the Group’s income or the value of its holdings of financial instruments. The objective of market risk management is to manage and control market risk exposures within acceptable parameters, while optimising the return.
(iv) Interest rate risk
At the reporting date the interest rate profile of Group’s interest-bearing financial instruments was:
Carrying amount 2016 2015
Fixed rate instruments Financial assets 1,473,322 2,063,069 Financial liabilities (1,654,667) (1,855,669)
(181,345) 207,400
Fair value sensitivity analysis for fixed rate instruments
The Group does not account for any fixed rate financial assets and liabilities at fair value through profit or loss. Therefore a change in interest rates at the reporting date would not affect profit or loss.
A change of 100 basis points in interest rates would have increased or decreased the Group’s equity by an immaterial amount in the current and prior period.
Fair values versus carrying amounts
The fair value of financial assets and liabilities, together with the carrying amounts shown in the balance sheet, are as follows.
Consolidated 2016 2015 Carrying amount Fair value Carrying amount Fair value
Trade and other receivables 5,688,011 5,688,011 4,837,960 4,837,960 Current tax assets - - Cash and cash equivalents 1,473,322 1,473,322 2,063,069 2,063,069 Secured loans (1,654,667) (1,654,667) (1,855,669) (1,855,669) Trade and other payables (3,509,439) (3,509,439) (2,066,503) (2,066,503)
1,997,227 1,997,227 2,978,857 2,978,857
Interest rates used for determining fair value
For all the financial assets and liabilities, that are expected to be settled within 12 months, estimated cash flows have not been discounted to determine fair value.
For all the financial assets and liabilities, that are expected to be settled after 12 months and later, estimated cash flows have been discounted applying their interest rate.
(v) Capital management
The Board’s policy is to maintain a working capital base so as to maintain investor, creditor and market confidence.
Practices have been established to ensure:
capital and operating expenditure and revenue commitments above a certain size obtain prior Board approval;
financial exposures are controlled;
business transactions are properly authorised and executed;
the quality and integrity of personnel; and
financial reporting accuracy and compliance with the financial reporting regulatory framework.

NOTES TO THE FINANCIAL STATEMENTS FOR THE YEAR ENDED 30 JUNE 2016
41 | Page
There were no changes in the Group’s approach to working capital management during the year. Neither the Company nor any of its subsidiaries are subject to externally imposed capital requirements. Refer Note 2(e) for the directors’ assessment of going concern.
25 Capital and other commitments
2016 2015
Capital expenditure commitments Plant and equipment
Contracted but not provided for and payable within one year - 47,500
26 Operating leases as lessee
The Group has operating leases in place for island access and infrastructure, office rent, use of the transit sheds at Derby Wharf, aquaculture lease for the operation in Cone Bay, work vehicles and miscellaneous office rentals. The future minimum lease payments are as follows;
Minimum lease payments due
Within 1 year
1 to 5 years After 5 years
Total
30 June 2016 263,747 344,433 771,867 1,380,047 30 June 2015 580,379 959,079 347,375 1,886,833
Lease expense during the period amounted to gross amounts of $580,379 (2015: $606,379) representing the minimum lease payments. In the current period, credit notes granted from lessors totalled $635,000 (2015: nil), which included credits for prior period charges. 27 Consolidated entities
Country of Incorporation
Ownership interest
2016 2015
Parent entity Marine Produce Australia Limited Subsidiaries MPA Fish Farms Pty Ltd Australia 100% 100% MPA Marketing Pty Ltd Australia 100% 100%

NOTES TO THE FINANCIAL STATEMENTS FOR THE YEAR ENDED 30 JUNE 2016
42 | Page
28 Reconciliation of cash flows from operating activities
2016 2015 Profit for the period 3,530,000 2,401,701 Adjustments for: Finance costs 108,312 79,224 Depreciation and amortisation 398,106 169,589 Impairment loss - 516,787
Operating profit before changes in working capital and provisions 4,036,418 3,167,301 Increase in biological assets (7,269,404) (1,200,732) Increase in trade and other receivables (850,051) (1,632,744) Increase in inventories (318,819) (263,128) Increase in other assets (3,356) (28,469) Increase in trade and other payables 1,442,936 150,981 Increase in provisions and employee benefits 303,135 53,167
Net cash used in/provided by operating activities (2,659,141) 246,376
29 Related parties
The following were key management personnel of the Group at any time during the reporting period and unless otherwise indicated in the directors’ report were key management personnel for the entire period:
Non-executive directors Executives
Mr M Kennedy (Chairman) Dr D Allen (Managing Director)
Mr D Kelly (Non-executive Director) Mr M Clements (Company Secretary)
Key management compensation disclosures
Information regarding individual Directors and executives compensation and some equity instruments disclosures is provided in the remuneration report section of the Directors’ Report.
Key management personnel and directors transactions
The terms and conditions of the transactions with key management personnel and their related parties were no more favourable than those available, or which might reasonably be expected to be available, on similar transactions to non-key management personnel related entities on an arm’s length basis. The aggregate amounts recognised during the year relating to key management personnel and their related parties were as follows:
Key management personnel and their related parties
Transaction
2016 2015
Mr M Kennedy The Bagot Road Property Partnership Rent and outgoings 74,567 47,766 The Bagot Road Group Payroll recovery &
management fee - 239,984
Kennedy Holdings Rent and outgoings 25,433 - Mr D Kelly Western Tiger Corporate Advisors Corporate advisory &
consulting services 50,349 20,000

NOTES TO THE FINANCIAL STATEMENTS FOR THE YEAR ENDED 30 JUNE 2016
43 | Page
An amount of $74,567 (30 June 2015: $47,766) was paid to The Bagot Road Property Partnership, associated with director Miles Kennedy, relating to office rent and associated costs during the period. No payments were made to The Bagot Road Group during the period. The contract arrangement with Bagot Road Group Pty Ltd, a company 50% owned by director Miles Kennedy until 31 May 2014 and thereafter wholly owned was terminated on 31 January 2015 and all staff were transferred to the Marine Produce Australia payroll. An amount of $25,433 was paid to Kennedy Holdings, a company owned by director Miles Kennedy, relating to office rent and associated costs during the period. An amount of $50,349 (30 June 2015: $20,000) was paid to Western Tiger Corporate Advisors, a company owned by director Damien Kelly, relating to corporate advisory and consulting services.
Amounts receivable from and payable to key management personnel and other related parties at reporting date arising from the transactions were as follows.
In AUD 2016 2015 Assets and liabilities arising from the above transaction
Other related parties Current receivables - - Key management personnel Current receivables - - Other related parties Current payables 1,688 76,910
Total payments/total liabilities 1,688 76,910
From time to time, key management personnel of the Company or its controlled entities, or their related entities, may purchase goods from the Group. These purchases are of the same terms and conditions as those entered into by other consolidated entity employees or customers and are trivial or domestic in nature.
Subsidiaries
Loans are made by the Company to wholly owned subsidiaries. Loans outstanding between the Company and its controlled entities are callable on demand, have no fixed date of repayment and are non-interest bearing. At 30 June 2016, such loans to subsidiaries totalled $50,097,945 (2015: $44,879,594). These loans have been recognised as a non-current receivable of $18,163,033 (2015: $9,413,383) after provision for non-recovery.
Interest-free loans made by the Company to its subsidiaries are repayable on demand. The Company has no intention to demand the loans within the next 12 months.
Shares and options over equity instruments
The movement during the reporting period in the number of shares in MPA held directly, indirectly or beneficially by each key management person, including their related parties is as follows.
Shares held at 1
July 2015 Purchases Share Purchase
Plan/Rights Issue Shares Held at
30 June 2016
Directors M Kennedy 694,357 520,156 515,405 1,729,918 D Allen 61,250 2,850 54,500 118,600 D Kelly - 42,000 20,800 62,800 Company Secretary
M Clements - - - -
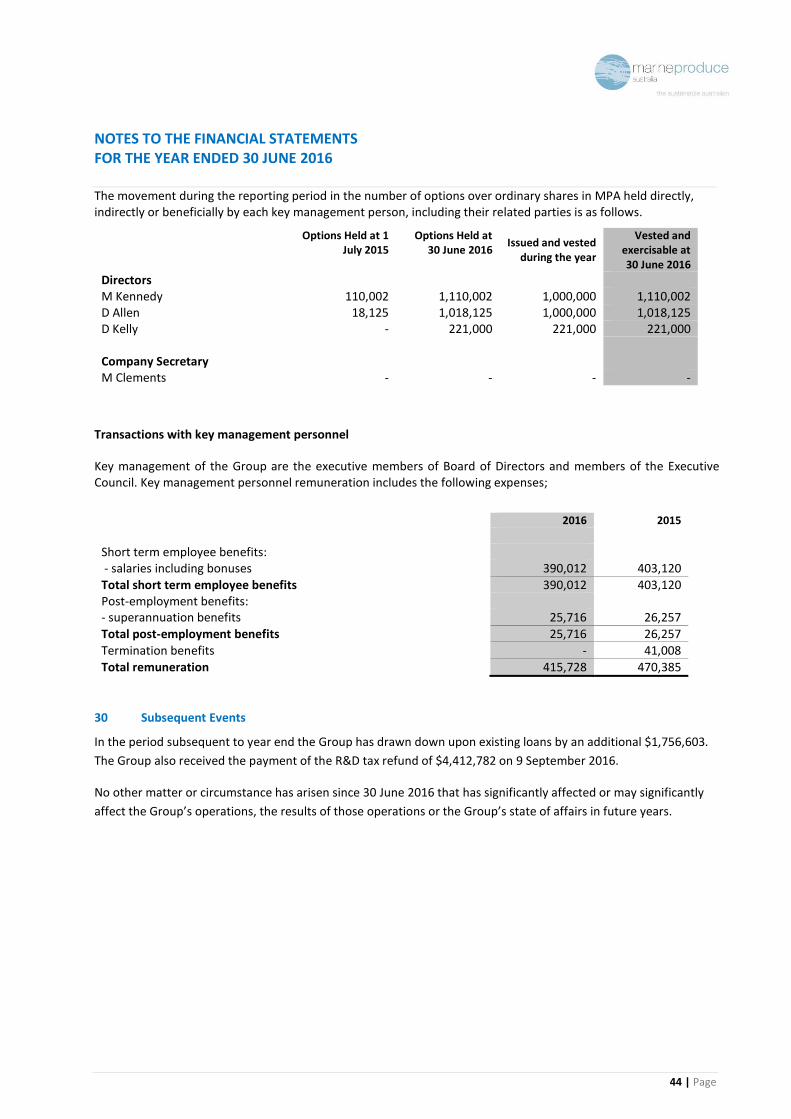
NOTES TO THE FINANCIAL STATEMENTS FOR THE YEAR ENDED 30 JUNE 2016
44 | Page
The movement during the reporting period in the number of options over ordinary shares in MPA held directly, indirectly or beneficially by each key management person, including their related parties is as follows.
Options Held at 1
July 2015 Options Held at
30 June 2016 Issued and vested
during the year
Vested and exercisable at 30 June 2016
Directors M Kennedy 110,002 1,110,002 1,000,000 1,110,002 D Allen 18,125 1,018,125 1,000,000 1,018,125 D Kelly - 221,000 221,000 221,000 Company Secretary
M Clements - - - -
Transactions with key management personnel
Key management of the Group are the executive members of Board of Directors and members of the Executive Council. Key management personnel remuneration includes the following expenses;
2016 2015
Short term employee benefits: - salaries including bonuses 390,012 403,120
Total short term employee benefits 390,012 403,120 Post-employment benefits: - superannuation benefits 25,716 26,257
Total post-employment benefits 25,716 26,257
Termination benefits - 41,008
Total remuneration 415,728 470,385
30 Subsequent Events
In the period subsequent to year end the Group has drawn down upon existing loans by an additional $1,756,603.
The Group also received the payment of the R&D tax refund of $4,412,782 on 9 September 2016.
No other matter or circumstance has arisen since 30 June 2016 that has significantly affected or may significantly
affect the Group’s operations, the results of those operations or the Group’s state of affairs in future years.

NOTES TO THE FINANCIAL STATEMENTS FOR THE YEAR ENDED 30 JUNE 2016
45 | Page
DIRECTORS’ DECLARATION
In accordance with a resolution of the Directors of Marine Produce Australia Limited, I state that:
1. In the opinion of the Directors:
(a) the financial statements and notes of Marine Produce Australia Limited for the financial year ended 30 June 2016 are in accordance with the Corporations Act 2001, including:
(i) giving a true and fair view of the Group’s financial position as at 30 June 2016 and of its performance; and
(ii) complying with Australian Accounting Standards (including the Australian Accounting Interpretations) and the Corporations Regulations 2001;
(b) the financial report also complies with International Financial Reporting Standards as disclosed in note 2(a);
(c) there are reasonable grounds to believe that the Group will be able to pay its debts as and when they become due and payable.
2. This declaration has been made after receiving the declarations required to be made to the directors in accordance with section 295A of the Corporations Act 2001 for the financial year ended 30 June 2016.
On behalf of the Board.
DESIREE ALLEN MANAGING DIRECTOR
Dated at Subiaco 29th September 2016.


australian business number
70 091 805 480
board of directors
miles kennedy – non-executive chairman
desiree allen – managing director
damien kelly – non-executive director
company secretary
mark clements
registered office and principle
place of business
34 bagot road
subiaco 6008
western australia
postal address
po box 1008
west perth 6872
western australia
communication details
telephone: (+61 8 ) 9381 4483
facsimile: (+61 8 ) 9381 5817
email: [email protected]
web: www.marineproduce.com
auditors
grant thornton australia
1/10 kings park road
west perth 6005
western australia
telephone: (+61 8 ) 9480 2000
facsimile: (+61 8 ) 9322 7787
lawyers
drummond law
48 matheson road
applecross 6153
western australia
telephone: (+61 8 ) 9364 9016
facsimile: (+61 8 ) 9364 7973
email: [email protected]
share registry
security transfer registrars pty ltd
770 canning highway
applecross 6153
western australia
telephone: (+61 8 ) 9315 2333
facsimile: (+61) 9315 2233
corporate directory