annual report 2017 - ajib.com annual report - english.pdf · dr. adnan steitieh member mr. khaled...
TRANSCRIPT

Annual Report2017

1
Annual Report 2017


4569
171827313789
Board of Directors Mission Statement Chairman’s Message Our Achievements During 2017 Business Objectives for 2018 Summary of Key Financial Indicators Independent Auditor’s ReportConsolidated Financial Statements Notes on the Consilidated Financial StatementsDomestic and International Branches, Offices, Subsidiaries and Affiliated Bank
Table of Content

4
Board of Directors
Mr. Hani Al-QadiChairman of the Board
Mr. Abdulkadir Al-QadiFounding ChairmanMember
Mr. Hussein H. DabbasVice Chairman
Mr. Ibrahim Al-MazyadRepresentative of the Arab InvestmentCompanyMember
Mr. Emhamed Mohammad FarajRepresentative of Libyan Foreign BankMember
His Excellency Mr. “Mohammad Shareef”Al ZoubiRepresentative of Petra Company forRestaurants Establishment & ManagementMember
Mr. Mohammad Al-OkerMember
Mr. Khalil Abul RubbMember
Dr. Adnan SteitiehMember
Mr. Khaled Zakaria Representative of Al Yakeen InvestmentCompanyMember
Mr. Sa’ed BudeiriMember since September 14, 2017
His Excellency Mr. “Mohammad Nasser”Abu Hamour Member until April 27, 2017

5
Mission Statement
To be recognized as the leading bank in Jordan and the region; in products, and in the use of technology, by being customer - focused, innovative and having customer - service excellence and highly skilled employees.

6
Chairman’s MessageDear Valued Shareholders,On behalf of the Board of Directors and myself, it is my pleasure to present to you the bank’s 39th annual report, which includes our achievements and consolidated financial statements, in addition to notes on the financial statements for the year ending on December 31, 2017.
Global economic growth maintained the marked slowdown observed in previous years despite intermittent growth spurts, particularly in Europe and Japan. According to the International Monetary Fund, the year 2016 saw global economic growth hitting its lowest mark since the global financial crisis, reaching as low as 3.2%. It recovered slightly in 2017 to reach 3.7% and is expected grow at a faster rate in 2018 and 2019 to reach up to 3.9%.
The state of the global economy remains unclear due to a variety of factors, including an increasingly ambiguous Brexit process, a consistently stronger Euro, and a U.S. monetary policy that is shifting toward tightening bias, reflected in a series of decisions by the U.S. Federal Reserve to raise interest rates by a total of 0.75% throughout the year. This shift came after years of expansionary policies implemented by the Federal Reserve Board following the global financial crisis of 2008 and the great recession that followed.
At the regional level, economies continued to face severe challenges in 2017, which limited growth rates to a mere 2.5% according to World Bank estimates, compared to 4.9% in 2016.
Economies in the Middle East have been continuously impacted by the geopolitical conflicts and tensions in Syria, Iraq, Yemen and Libya, which have been ongoing for years. The marked decrease in oil prices also had a notable impact on the dynamics within those markets, leading to high-level response measures to adjust budgets and decrease expenditures, which in turn restricted economic growth for oil exporting and importing countries alike. The crisis that ensued between Qatar and some of its neighboring countries in June 2017 also impacted financial markets and economic activities in the region.
Reports issued by international financial institutions attribute the projected increase in economic growth in 2018 to an expected upturn in the tourism industry as well as a projected rise in oil prices, which will allow oil exporting countries the opportunity to review their budgetary finances, with some taking measures to increase expenditures and boost internal revenues by imposing a VAT of 5% for the first time on a wide range of products and services.
Due to the aforementioned developments, many indicators of the Jordanian economy showed a marked decline in 2017, with GDP growing by only 2%, and the unemployment rate rising to 18.5% by year-end compared to 15.3% in 2016. These developments accompanied a rise in the inflation rate, which reached 3.3% in 2017 compared to a negative inflation of 0.8% in 2016. Moreover, foreign exports declined by 1.1% in 2017 to reach JOD 5.3 billion, while imports increased by 5.6% to reach JOD 14.5 billion. As a result, the trade balance registered a deficit of JOD 9.2 billion for 2017.
Furthermore, the national budget registered a total deficit of JOD 750 million in 2017 — down by 15% year-on-year due to a 5.1% increase in general revenues, which in turn totaled JOD 7.425 billion. General expenditures totaled JOD 8.175 billion, while the Kingdom’s national debt reached JOD 27.25 billion — equivalent to 95.3% of the GDP — compared to JOD 26.1 billion in 2016.
The General Budget Law for 2018 predicts a deficit of JOD 543.3 million with an expenditures ceiling ofJOD 9.039 billion, while targeted revenues including international assistance are expected to reach JOD 8.496 billion. In response to these economic and financial developments, and in light of the increase in general debt, budget deficits and governmental borrowing, Standard & Poor’s downgraded Jordan’s credit rating in 2017 from BB- to B+, with a stable outlook.

7
As for foreign exchange reserves, the Central Bank of Jordan recorded USD 12.253 billion by the end of December 2017, compared to USD 12.883 billion in 2016, enough to cover the Kingdom’s needs for imports for more than seven months.
The balance of credit facilities granted by licensed banks in Jordan reached JOD 24.75 billion by the end of 2017, compared to JOD 22.91 billion in 2016, while banks’ deposits totaled JOD 33.1 billion by year-end compared to JOD 32.9 billion in 2016.
In 2017, AJIB maintained its efforts to provide the most advanced of banking products and services, while simultaneously offering pioneering products and services to its customers, working toward expanding its customer base and increasing its contribution to the local economy. The strategy employed in 2017 maintained the bank’s commitment to following international best practices, leveraging on efficient banking procedures with a special focus on the diversification of revenue streams and the studying of all viable investment opportunities.
As for AJIB’s performance indicators, the bank was impacted by the numerous economic challenges and political developments faced by the regions in which it operates (Qatar and the United Kingdom), in addition to the large and rapid increases in the interest rates on the Jordanian Dinar that amounted to 1.5% in 2017. Profits before taxes totaled JOD 25.8 million compared to JOD 33.5 million in 2016. Net profits totaled JOD 17.2 million compared to JOD 22.6 million in 2016, bearing in mind that profits in 2016 included non-recurring revenue amounting to JOD 2.7 million. Meanwhile, the comprehensive income after taxes amounted to JOD 18.5 million at the end of 2017 compared to JOD 18.6 million at the end of 2016.
Customer deposits and cash margins totaled JOD 1,110.4 million, while net credit facilities reached JOD 755.2 million. The bank maintained the quality of its credit portfolio as well as its assets, as the ratio of non-performing loans (including suspended interest) to total facilities reached 2.1%, one of the lowest ratios among Jordanian banks. Capital adequacy ratio reached 15.95% as per Basel III regulations, which is much higher than international and local requirements (8% and 12% respectively), demonstrating the bank’s solid financial position.
In accordance with the bank’s achieved results, AJIB’s board of directors recommended to the General Assembly the distribution of dividends amounting to JOD 13.5 million, representing 9% of the bank's paid up capital.
Allow me to conclude by thanking AJIB’s Board of Directors for their active participation in formulating strategies and overseeing their implementation. I would also like to thank the bank’s management and its employees in all departments for their continued efforts, which have contributed significantly to maintaining the bank’s growth and preserving the highly regarded brand image we have cultivated over many years. Last but not least, I would like to extend my gratitude to all of our customers for their continued trust in the bank, and we are committed to continuously meeting all their expectations and delivering more cutting-edge services that suit their evolving needs.
Hani Al-QadiChairman of the Board of Directors

8

9
Our Achievements during 20171. Corporate Banking DepartmentAJIB has continued to provide advanced banking services to the corporate sector, assisting in economic development and working towards the realization of financial inclusion by relying on a team of highly qualified professionals in relationship management. The bank also provides an integrated array of diversified and developed banking services to satisfy the needs of its clients, offering practical solutions to the entire corporate sector that allow them to achieve their goals in an efficient manner.
Despite the ongoing political and economic difficulties, both globally and regionally, and their negative repercussions on a multitude of sectors, the bank was able to positively reinforce and cultivate its relationships with customers, responding to their needs and realizing them through prudent policies in business management. It has also succeeded in supporting business development by examining and evaluating financial and credit positions, and providing the most appropriate facilities, recommendations and guidance. Moreover, the bank has maintained the quality of its portfolio by upholding its rigorous credit policy, which assures the quality of facilities offered based on well-studied and accepted risk levels. The department expanded its customer base by targeting a wide spectrum of industries in accordance with the results of credit checks and in line with a strategy that is built upon the alignment of credit portfolio growth, maintaining the quality and level of acceptable risk and the well-planned diversification of the targeted economic sectors.
The bank focused on active economic sectors in the fields of general trade, manufacturing, services, energy and transportation, which contributed to their growth, ultimately having a positive impact on the country’s national economy.
The bank also worked on developing a digital banking strategy for corporations, enabling them to complete their banking transactions online or use the bank’s mobile app, an achievement that places the bank at the forefront of the sector.
In addition to providing distinguished and efficient services, on the first floor of the bank’s headquarters, we provide our VIP services to our corporate customers that allow them to deposit, issue checks, as well as a wide range of other services.
2. Retail Banking DepartmentThe bank continued to offer improved and innovative banking and investment products and services such as AJIB Prestige, AJIB Advantage and AJIB Value.
The bank also developed its cutting-edge e-services portals for all transactions in line with the latest developments in the field of banking operations technology, guaranteeing quick, safe and efficient transactions for its clients. Customers can also now benefit from the services of depositing cheques and paying bills through eFAWATEERcom, a domestic payment platform, both online and through our ATM network.
In order to satisfy the growing demand for innovative banking solutions, AJIB created the AJIB Rewards program exclusively for its VIP customers that hold Visa Infinite and Mastercard Prestige credit cards, offering valuable prizes when using their cards for purchases at any point of sale.
To streamline procedures for customers, and in line with the latest developments in banking services, AJIB launched Visa payWave, a new method of payment that enables customers to make purchases through a contactless terminal, simplifying and securing the payment process.

10
Additionally, and to accommodate the increasing demands of customers, the bank’s call center is now available 24 hours a day, seven days a week, guaranteeing a satisfying customer experience.
The bank has also enhanced its software system and communications portal by installing a Cisco system, allowing for smoother transactions and an enhanced communications infrastructure.
A number of automatic teller machines (ATMs) were distributed throughout the Kingdom, making them more accessible to all members of society, which is in line with the bank’s organizational identity that includes offering its services in a comfortable and developed environment.
3. Trade Finance DepartmentAJIB realizes the important role that the trade sector plays in the national economy, which has led to its focus on import and export services by offering specific banking products including letters of credit, financing imports and exports through LCs, letters of guarantee, post-dated bills, discounted notes and trade loans of all types, all of which serve a customer’s business needs.
AJIB distinguished itself by offering a diversified package of high-quality services to its customers, delivered by a highly experienced and qualified team of experts who have benefitted from specialized training courses that are accredited worldwide, a value added to the bank’s assets of diversified expertise that raises standards of efficient productivity.
AJIB also stays up to date with the latest developments in the global banking sector, implementing advanced software applications and programs that have enabled the bank to facilitate transactions with the ultimate transparency and under strict supervision. In this regard, electronic trade solutions and the electronic notifications system have allowed customers to receive instant private notifications by emails about their transactions, yet another service that satisfies actual customer needs.
This interactive combination of services was reinforced by both our team and the advanced strategy put in place by the bank. Our dedicated team of experts offers distinguished trade financing services to its customers, providing them with the most innovative banking solutions and procedures to help them propel their businesses forward.
4. Transfers DepartmentIn 2017, the Transfers Department witnessed a notable increase in the volume of transactions and demand on its online services at its various branches, which resulted in higher returns for the department and reinforced the bank’s positive position among the leading international and local banks.
These exceptional results were achieved through the implementation of the most stringent international anti-money laundry standards, in addition to the application of the most advanced programs in the transfer field such as Direct Transfers (STP), the Automated Clearing House (ACH), as well as the sending of money transfers through AJIB’s mobile phone application.
The department’s team of qualified professionals continued to serve customers at all the bank’s branches and offices located across the Kingdom, or through our correspondent bank network.
5. VIP Banking DepartmentThe bank continued offering its outstanding services to customers throughout 2017, applying the most exceptional procedures in the banking industry. In this regard, the VIP Banking Department maintained its solid relationship with customers, corporations and individuals, offering them the best services and products. The VIP account is ideal for customers looking for a unique, unmatched and special banking experience.

11
6. International Investments Department Through the exceptional achievements of the bank’s employees, in addition to the vast knowledge in financial and investment services provided at the local, regional and international levels, AJIB has become the ideal investment partner to manage customer investment portfolios.
In 2017, the bank offered a group of products and services specializing in investment services that were designed to provide the most suitable solutions to expand and manage private wealth, allowing this category of customers the opportunity to utilize their capital in the long, medium and short terms. This allows them to expand their investments with the help of the bank’s up-to-date knowledge of the latest developments witnessed by local and international markets.
The highly experienced team of professionals employed at AJIB, supplemented by innovative solutions, helped customers make investment decisions using the latest market updates, allowing them to align their private investment portfolios with their long-term objectives through a package of services that includes international stock investments, fixed income, joint investment funds, and precious metals and materials. Also in 2017, the bank presented an exclusive set of wealth management solutions that were specifically designed to fulfil customer needs, as asset diversification is considered one of the most important factors in the return of investments portfolios. To this end, the bank continued to work on analyzing global market trends and the latest economic updates, resulting in better performance and higher returns for the bank.
7. Prestige Service and Wealth ManagementThe AJIB Prestige Service is a private banking service that offers an exclusive set of products and services for Prestige customers, delivered by a team of experts recognized for its expertise experience and professionalism.
AJIB Prestige offers exceptionally competitive interest rates and diverse and exclusive advantages through a network of seven service centers at the headquarters building, and our branches at the Interior Ministry Circle, Abdoun, Bayader Wadi Al-Seer, Jubeiha, and Tla’a Al Ali.
AJIB Prestige includes advanced investment products and services provided by wealth management professionals tailored to individual customer requirements. The bank also offers a wide array of products and services of added value in global and local markets, including banking insurance services in cooperation with the American Life Insurance Company (MetLife) Jordan.
The Prestige Life program includes programs for life insurance, retirement insurance, study insurance and investment insurance, delivered by a licensed, qualified and highly experienced team of professionals. Also in 2017, relationship managers were required to update their certifications in order to continue offering private wealth customers the best services.
8. Treasury DepartmentInterest rates in 2017 played an influencing role in the local and global markets; however, the treasury department took precautionary measures to limit the negative impact of increasing interest rates on the bank’s returns. The Treasury Department continuously updated the bank’s customers on developments and changes in the economic arena, and provided assessments on their possible repercussions as well as advice on the tools and instruments needed to manage market risk and adopt suitable investment policies. The department also provided its clients the opportunity to conclude contracts in financial derivatives available in international markets.
AJIB also maintained a leading role in Jordan’s capital markets during 2017 by effectively investing in government bonds, Jordanian treasury bills and bonds issues by Jordanian companies, as well as productively participating in the interbank market.

12
In 2017, the Treasury Department offered its customers a wide range of investment tools, including spot foreign currency dealings, margin and forward contracts, swap currency contracts, and options contracts, all of which provide suitable solutions for mitigating exchange rate variations in the market. The department continues to develop its services and products to suit customer trends and requirements while enhancing its competitiveness and profitability.
9. Cards and ATM DepartmentThroughout the year, AJIB sought to diversify its portfolio of credit cards, continuing to issue Classic, Gold, and Platinum Visa and Mastercard cards, in addition to the Visa Infinite credit card and the Platinum Prestige Mastercard. This reinforced its local market share as per the volume of withdrawals on its branded credit cards.
Additionally, in 2017, the bank launched the new Visa payWave technology on all Visa credit and debit cards. Visa payWave is a new method of payment that is touch-free, requiring only the waving of the card in front of the accredited terminal from distance of no more than four centimeters to complete a purchase transaction.
The ATM network was also expanded to cover a wider geographical area, offering around-the-clock services to clients in both commercial and residential areas. AJIB ATMs are now available at all the country’s major malls and commercial centers, in addition to Queen Alia International Airport to serve arriving and departing passengers.
New services have been added to ATMs that include cheque depositing around the clock on select ATMs, allowing customers the ability to deposit up to 40 cheques in one transaction. These cheques can come from AJIB or other local banks, and the service is offered in addition to the current cash depositing service already available.
10. Retail Branches and Offices NetworkAJIB is present at various strategic locations throughout the Kingdom to serve its customers and ensure interaction with all segments of society in accordance with the most stringent standards for quality and excellence. The bank inaugurated a new branch in Abdali’s The Boulevard, a thriving area of Amman, and relocated its downtown branch to its new location in Wadi Saqra Street, equipping it with the latest banking technologies in order to provide advanced services, totaling AJIB’s branches & offices operating in Jordan to 33 by the end of 2017.
The bank also expanded its ATM network, to reach 60 machines after adding new machines in the King Hussein Business Park and at Abdulhadi Eye Hospital, providing customers the ability to complete their transactions swiftly.
AJIB has maintained its pioneering role at the Queen Alia International Airport, providing money exchange services through its offices throughout the airport to arriving, departing and transit passengers. Additionally, the bank has established two new offices in the departure and arrivals areas, and has concluded a renovation of its offices in the transit area. The bank’s commitment to airport employees remains unwavering, relocating one of its offices to the flight operations building.
11. Information Technology DepartmentAJIB maintained its edge in technological development through the launch of the AJIB application for Android and Apple phones in 2017. The app’s launch marketing campaign distributed iPhones as prizes to some of those who downloaded the app, which allows users to efficiently manage their financial affairs safely, around the clock and from any location.

13
Automated registration was added to the online banking service through AJIB Online and AJIB Mobile, in addition to a new feature that enables users to update their personal information without requiring them to visit any of the bank’s branches or offices.
eFAWATEERcom was launched on a select number of ATMs, allowing customers to use the portal’s services that include bill inquiries, bill payments in addition to other services by following easy and simple steps.
The bank also launched a safe and effective fingerprint verification service that eliminates the need for a username and password. Additionally, a new feature was added to the AJIB app, allowing customers to specify the method of issuing their money transfers (ACH or RTGS).
The bank was awarded the Payment Card Industry Data Security Standard (PCI) in recognition of its high security standards. This is in addition to the advanced control systems at the bank’s information centers, which provide a safe environment for customers and increases their confidence in the services offered.
In order to reinforce the bank’s technological infrastructure, AJIB continued to develop and upgrade its emergency center, its business continuity plans and its dedicated communications systems, to ensure the quality of operations and smooth workflow. The bank also continued to implement best banking procedures in order to advance in its operations and risk assessments.
This list offers important data used by the bank from a source deemed trustworthy by the largest financial institutions in the world. This contributes to maintaining the customer base and managing global compliance standards by relying on dependable sources that provide global comprehensive coverage in addition to local support.
12. Administrative Affairs, Human Resources, and Training ServicesThe year 2017 was one filled with challenges and opportunities. The department was able to achieve its goals and focus on its targets and strategic plans, which were designed in compliance with the bank’s vision of providing unique banking services, creating a compelling work environment and delivering a unified organizational culture that reinforces effectiveness, ease and comprehensiveness.
The Human Resources Department continued its work to overcome the challenges that accompanied the bank’s acquisition of HSBC’s operations in Jordan, launching an initiative to merge human resources and instill one institutional culture. It also launched new initiatives with respect to management instructions, updating human resources policies and procedures to support the organization in achieving its goals and advancing operational professionalism and sustainability.
This initiative required an examination of the distribution of the workforce, as well as enhancing occupational skills and capabilities throughout the bank’s departments and on every functional and managerial level by increasing its efforts in recruitment and human resources planning. The bank continued to develop policies related to recruitment with a special focus on fresh graduates with special capabilities from the best local and foreign universities, in addition to employing experienced and capable individuals from diverse fields, while relying on internal resources to fill vacancies in order to further career development and create a motivating work environment.

14
Organizational structures were reviewed, finalized and approved to accommodate changes resulting from the bank’s operational development, expansion and its banking services network. The new system was developed to evaluate performance and present job descriptions, and a new guide was designed that clarified the mechanism for setting job descriptions, reviewing them and approving them according to the approved organizational structures. This has allowed duties and responsibilities for each position to be outlined in a transparent and clear manner and in compliance with job requirements.
In an effort to create a motivating work environment, the incentive system was revised and enhanced to increase productivity and achieve targets included in the bank’s plans and strategies, ensuring increased returns. These efforts were expanded in the scope of developing the Performance Management system to include the development of evaluation mechanisms and the methods used to monitor performance in a subjective and unbiased manner, guaranteeing completely transparent accountability.
The Training Department presented numerous activities and programs aimed at building capacities and developing the skills of staff in various fields.
Two hundred and sixty-seven senior and managerial employees participated in 368 local and international various courses, seminars, workshops and conferences, including comprehensive courses for branch employees in customer service, selling skills and bank systems, as well as legal issues and anti-money laundering.
Three hundred and forty-five employees took part in three training workshops on new products and systems in the fourth quarter of 2017, while 13 employees received specialized certifications such as CAMS, CDCS, the Comprehensive Banking Diploma and the Comprehensive Credit Diploma.
Employment examinations were held for nearly 290 job applicants during 2017, and another round of tests was organized for 86 recently appointed staff members, with 46 promotion exams given.
New staff members were introduced to work procedures in different departments. Twenty trainees from different Jordanian universities were also trained as part of their educational requirements, in addition to one trainee from LOYAC and four fresh graduates from the Banking Union for Bankers and 11 trainees from Amman’s University College of UNRWA.
The department is eagerly looking forward to 2018, when it will continue its development and the expansion of its operations. Strategic plans are in place and include numerous initiatives and projects that will work on reinforcing the pivotal role of the Human Resources Department, aiding the advancement of operations and providing advanced systems and services.
13. New Head Office TowerThe new head offices were inaugurated in May 2017, in the presence of Governor of the Central Bank of Jordan His Excellency Ziad Fariz, Founding Chairman Abdulkadir Al-Qadi and the Chairman of the Board Hani Al-Qadi.
AJIB’s new headquarters are located on Zahran Street and has its main entrance on Ibn Al Rumi Street, near the Sixth Circle. The new building, which has an area of 30,000 square meters, towers above the city at 15 stories with six underground levels, and houses the bank’s management offices, its main branch, a VIP center, one floor each for Prestige, Corporate and Trade Finance customers, in addition to various departments.

15
The tower also includes training facilities and an auditorium. Two basement floors are dedicated for services and four for staff parking, all designed according to the highest architectural standards and fitted with cutting-edge audiovisual equipment. A large 75-car free customer parking facility is also available on an adjacent plot of land, in addition to the four underground levels dedicated for parking that can accommodate more than 260 other cars.
The tower is characterized by its design, external lighting and the advanced tech-screen, and is now considered one of Amman’s distinguished architectural landmarks.
14. Cyprus BranchCyprus was able to resume its course of economic growth and was graded by international institutions as one of the fastest growing countries in the European Union in 2017 with a growth rate of 3.8%.
The Cypriot economy exceeded international expectations after implementing positive reforms, and the island was able to maintain a stable trend in reinforcing efficiency and gaining the trust of investors through its growing business environment.
With that, the Cypriot economy has once again exceeded expectations, contrary to assessments, driven by strong private demand, while the global economic institutions predict that the financial position will remain stable as the Cypriot economy is considered rather small and more capable of quickly adapting to positive long-term expectations.
Cyprus is considered the gateway to active trade between Europe, the Middle East and Africa, utilizing its assets of qualified human resources. Additionally, as a member in the European Union and the Eurozone, its IT infrastructure is well developed and has an appropriate business environment that attracts international investments and corporations from different sectors.
AJIB’s branch in Cyprus has been serving the island for nearly 27 years and will continue offering its banking services at a high level of professionalism.
15. United Arab Jordan Company for Investment and Financial BrokerageThe United Arab Jordan Company for Investment and Financial Brokerage continued to offer its services in buying and selling local bonds in a comfortable and professional environment for customers.
The Amman Stock Exchange market witnessed a good volume of transactions in 2017 compared to 2016; however, the exchange share price index weighted by free shares decreased to reach 2122.5 points by the end of 2017, compared to 2170.3 points by the end of 2016, a decrease by 0.98%. Total trading volume at the Amman Stock Exchange increased in 2017 to reach JD2.8 billion, compared to JD2.3 billion last year.
The number of traded shares decreased in 2017 to reach 1.6 billion, executed through 675 thousand contracts compared to 1.8 billion shares that were traded in 2016 through 786 thousand contracts. The average stock turnover ratio also decreased to 24% compared to 27.2% in 2016.

16
16. Arab Jordan Investment Bank (Qatar) LLCThe Qatari economy remains one of the strongest in the MENA region despite the difficult conditions and untimely political regional events. It has continued to export oil and gas without interruption, and new trade channels were established as the government is keen on achieving a high level of internal sufficiency at the economic level.
The Qatari economy is expected to maintain a solid and flexible position in the mid-term and the domestic sectors will benefit by the state increasing its dependency on internal sources. The government’s plans include raising production of liquefied natural gas in addition to increasing tourism from different regions of the world to advance its economy in the future.
Qatar announced a new increase in the production of liquefied natural gas, increasing the total expected production by 30% in five to seven years, which forms a new phase and a distinct leap in the development of the country’s economy.
AJIB - Qatar was able to maintain its presence in the local and regional markets for the twelfth consecutive year as the first licensed bank in the Qatari Financial Center by continuing to offer its financing and investment services and solutions to the customers, thereby reinforcing its relations with local and international financial institutions.
The bank registered acceptable performance levels amidst difficult market conditions with a stable financial performance and high and stable liquidity ratios.
17. Jordan International Bank - JIB LondonJordan International Bank - JIB London is considered an affiliate company of AJIB. AJIB’s share in JIB London is 25% of its capital.
Despite the uncertainty prevalent in the British economy due to Britain’s upcoming exit from the European Union, JIB London has continued to advance on all fronts since its affiliation with AJIB in 2010.
JIB provides trade finance, private banking services, and treasury services to a select group of individuals and corporations as well as short-term loans to real-estate developers and investors in London and southeast England. The bank’s operating profits before taxes totaled £3.4 million in 2017, compared to £5.8 million in 2016. The bank’s balance sheet was relatively stable, recording £409 million by the end of 2017, compared to £411 million by the end of 2016.

17
Business Objectives for 2018• Further enhance the level of retail banking services and continue to provide a unique experience to
customers by launching innovative products and services that fulfil their needs, guarantee their loyalty and preserve their trust, which, in turn, reinforces the bank’s customer base and increases its market share in the retail sector.
• Focus on providing an outstanding banking experience to VIP and Prestige customers with a carefully selected and highly qualified team of relationship managers to provide guidance and assistance in growing customers’ wealth.
• Continue to excel and play the pivotal role in providing banking services to the corporate sector and provide an integrated group of banking products and services designed specifically to achieve the economic and financial objectives of leading companies and institutions in different sectors.
• Continue to develop our corporate customer base in various sectors including industry, trade, transportation, energy and others, in a manner that ensures consistency in the quality of services provided according the well-studied and acceptable risk levels.
• Continue to develop our electronic banking systems to facilitate transactions for customers in a
transparent and secure manner, while developing electronic financial services that efficiently cater to the evolving needs of customers in the local market with a vision to remain a leader in this field.
• Expand the customer base to include lower cost current accounts and deposits to enhance the bank’s liquidity and funding position.
• Continue the expansion of the Branches, offices and ATM’s network in several strategic areas in the Kingdom and developing the offered services through this network to fulfil customers’ needs at any time.
• Continue to develop the skills of the bank’s human resources in all departments and positions to reach the highest professional standards by providing training and workshops given by the most qualified experts and instructors to enrich the employee knowledge with banking products and equip them with the advanced selling skills and mechanisms.

18
SUMMARY OF KEY FINANCIAL INDICATORS FOR ARAB JORDAN INVESTMENT BANK GROUP

19
Summary of Key Financial Indicators for AJIB Group Amounts in JD Million
Statement/Year 2017 2016 2015 2014Total Assets 1838.0 1809.6 1793.2 1750.2Credit Facilities (Net) 755.2 753.2 736.6 698.1Financial Assets Held at Amortized Costs 597.6 594.0 588.6 578.5Customers’ Deposits and Cash Margins 1110.4 1140.0 1105.9 1050.1Total Equity 219.4 220.4 221.6 218.5Gross Income 59.9 67.6 69.5 61.0Net Profit Before Tax 25.8 33.5 33.5 33.6Market Value 262.5 255.0 286.5 307.5Share Price by End of Year (JD) 1.75 1.70 1.91 2.05Earning per share (JD) 0.107 0.140 0.142 0.172Proposed dividend distribution of shares (JD) 0.09 0.12 0.12 0.12
Solid Financial Position • Constant growth in volume of operations as total assets reached JD1.84 billion by the end of 2017, with
a growth rate of 1.6% compared to 2016, while maintaining acceptable risk ratios.• Despite the political and economic challenges and increasing competition in the banking sector, the
bank was able to maintain the quality of its credit portfolio.• Solid capital base that is capable of prudently addressing all risks associated with banks.
Amounts in JD Million2017 2016 Change (%)
Net Credit Portfolio 755.2 753.2 0.3%Securities Portfolio 612.6 609.3 0.5%Total Assets 1838.0 1809.6 1.6%Total Customer Deposits and Cash Margin 1110.4 1140.0 (2.6%)Total Bank and Financial Institution Deposits 487.3 420.5 15.9%Total Equity 219.4 220.4 0.5%
2017
Basel III2016
Basel III2015
Basel II2014
Basel IICapital Adequacy Ratio 15.95% 16.25% 15.94% 15.46%

20
Net Profit Before TaxThe bank generated profits before taxes in 2017 of JD25.8 million, keeping in mind the economic conditions witnessed in 2017 in the markets in which the bank is present. Most notable are the interest rate increases by the Central Bank of Jordan throughout the year, totaling 1.5%, in addition to the increase by the US Federal Reserve of 0.75%, which had a direct and rapid effect on the cost of customers and banks deposits.
Amounts in JD Million
33.5
25.8
33.533.6
2017201620152014Net Profit Before Tax
Total Operating CostsControlling the operating expenses, especially those that are controllable, noting that overall operating expenses increased marginally due to the start in depreciation of the new Head Office building, which became operational in early 2017.
Amounts in JD Million
31.130.5
25.0
31.5
2017201620152014Total Operational Costs

21
Steady and Balanced Growth in the Financial PositionTotal assets witnessed a growth of 1.6% in 2017, reaching JD1.84 billion, compared to JD1.81 billion in 2016, which was attained through the diversification of revenue streams and investments that generated adequate returns to our partners including shareholders, employees and customers, and within well-studied and acceptable risk levels in light of the tough economic and political challenges in the region.
Amounts in JD Million
1809.61793.21750.2 1838.0
2017201620152014Total Assets
Balanced Composition of Assets Indicates Strong Financial Position
20172016
Other Assets5.9% Cash and Balances
with Banks 18.6%
EquitySecurities
0.8%
Net CreditFacilities
41.1%
Investments inAssociated
Corporations 1.1%
FinancialAssets
at AmortizedCost 32.5%
Other Assets5.8% Cash and Balances
with Banks 18%
EquitySecurities
0.8%
Net CreditFacilities
41.6%
Investments inAssociated
Corporations 1%
FinancialAssets
at AmortizedCost 32.8%

22
Capital Adequacy Ratio The capital adequacy ratio has significantly surpassed the minimum 8% required by the Basel Committee as well as the minimum 12% required by the Central Bank of Jordan, reaching 15.95% in 2017, according to the Basel III requirements.
2017
16.25%15.94% 15.95%15.46%
201620152014Capital Adequacy Ratio
Growth of Customer Deposits and Cash MarginsThe bank sought not to increase the cost of deposits by not accepting costly deposits, noting that deposits did not increase in the Jordanian banking sector during 2017, maintaining the same level of JD33 billion as the previous year.
Amounts in JD Million
1140.0 1110.41105.91050.1
2017201620152014Growth of Customers' Deposits and Cash Margins

23
Total Credit Facilities PortfolioIn 2017, the bank continued exerting efforts to improve the quality of its credit portfolio by implementing two strategic pillars: pursuing a prudent and selective credit policy in granting facilities during these difficult economic conditions, and intensifying its efforts in recovering and processing non-performing loans in a manner that improves the quality of the credit portfolio. Thanks to these efforts, the total credit facilities portfolio rose to JD769 million, compared to JD765 million by the end of 2016. The percentage of non-performing loans in 2017 reached 1.8% of total direct facilities after deducting suspended interest, which is one of the best ratios in the Jordanian banking sector.
Amounts in JD Million
2017201620152014
765.5 769.1747.4713.7
Total Credit Facilities Portfolio
Composition of Customer Deposits and the Credit Facilities PortfolioRetail deposits are generally considered stable deposits in the banking sector, and retail deposits comprised 65.4% of total deposits by the end of 2017, whereas retail loans constituted 25.2% of the overall credit portfolio. Facilities granted to the public sector comprised 26.4% of total facilities, most of which are directly guaranteed by the Government.
26.4%
11.9%
48.4%22.7%
25.2%
65.4%
Customer DepositCredit Facilities
Government
Corporate
Retail
Customer Deposits and the Credit Facilities Portfolio

24
Total EquityThe bank realized continued stability in its capital base, placing it within the ranks of well-capitalized and stable financial institutions. Total equity was JD219 million by the end of 2017.
Amounts in JD Million
2017201620152014
220.4221.6218.5 219.4
Total Equity
Net Revenues and Operational ExpensesThe bank was able to maintain an acceptable level of operating efficiency despite the increase in this indicator due to the depreciation of the new building in 2017 compared to 2016.
Amount in JD MillionStatement/Year 2017 2016 2015 2014
Net Operational Revenues* 59.9 67.6 69.5 61.0Operational Expenses 31.5 31.1 30.5 25.0Efficiency Indicator 52.6% 46.0% 43.8% 41.0%Non interest revenue 14.9 17.3 17.5 15.3Net Interest Revenues 45.0 50.3 52.0 45.7
*Included non-recurring revenues amounting to JD 2.7 million in 2016.
Financial Highlights
2017 2016Return on Average Assets (ROaA) before Tax 1.4% 1.9%Return on Average Assets (ROaA) after Tax 0.9% 1.3%Return on Average Equity (ROaE) before Tax 11.7% 15.1%Return on Average Equity (ROaE) after Tax 7.8% 10.2%Non-performing Loans / Credit Facilities Portfolio 1.8% 1.7%Net Credit Facilities / Customers Deposits 71.9% 69.9%Net Credit Facilities / Total Assets 41.1% 41.6%Cash and Balances with Banks / Total Assets 18.6% 18.0%Total Equity / Total Assets 11.9% 12.2%

25
Share PricePrices in JD
Statement / Year 2017 2016 2015 2014Highest Price 1.75 1.76 1.91 2.15Lowest Price 1.73 1.69 1.78 2.02Closing Price* 1.75 1.70 1.91 2.05
*Prices are according to the last day of the year.
Number of Bank EmployeesAJIB employees numbered 761 by the end of 2017, compared to 733 employees by the end of 2016.
Bank Shares Ownership
66٫1%
33٫9%
Jordanian ShareholdersArab and Forign Shareholders
Bank Shares Ownership

26
ARAB JORDAN INVESTMENT BANK(A PUBLIC SHAREHOLDING LIMITED COMPANY)AMMAN - JORDAN
CONSOLIDATED FINANCIAL STATEMENTS FOR THE YEAR ENDED DECEMBER 31, 2017

27
INDEPENDENT AUDITORS’ REPORT To the Shareholders ofArab Jordan Investment BankAmman – Jordan
Report on the Audit of the Consolidated Financial Statements
Opinion We have audited the consolidated financial statements of Arab Jordan Investment Bank (a public shareholding company) and its subsidiaries “the Group”, which comprise the consolidated statement of financial position as at 31 December 2017, and the consolidated statement of comprehensive income, consolidated statement of changes in equity and consolidated statement of cash flows for the year then ended, and notes to the financial statements, including a summary of significant accounting policies.
In our opinion, the accompanying consolidated financial statements present fairly, in all material respects, the consolidated financial position of the Group as at 31 December 2017, and its consolidated financial performance and its consolidated cash flows for the year then ended in accordance with International Financial Reporting Standards (IFRSs).
Basis for OpinionWe conducted our audit in accordance with International Standards on Auditing (ISAs). Our responsibilities under those standards, are further described in the Auditor’s Responsibilities for the Audit of the Consolidated Financial Statements section of our report. We are independent of the Group in accordance with the International Ethics Standards Board for Accountants’ Code of Ethics for Professional Accountants (IESBA Code) together with the ethical requirements that are relevant to our audit of the consolidated financial statements in Jordan, and we have fulfilled our other ethical responsibilities in accordance with these requirements and the IESBA Code. We believe that the audit evidence we have obtained is sufficient and appropriate to provide a basis for our opinion.
Other MatterThe consolidated financial statements for the year ended 31 December 2016 were audited by Deloitte & Touche (Middle East) – Jordan as the sole auditor of the Group for the year 2016. Unqualified opinion was issued on the consolidated financial statements on 05 February 2017. Deloitte & Touche (Middle East) – Jordan and Ernst & Young – Jordan were appointed as joint auditors of the Group for the year 2017 in accordance with Central Bank of Jordan regulations for corporate governance.
Key Audit MattersKey audit matters are those matters that, in our professional judgment, were of most significance in our audit of the consolidated financial statements for the year ended 31 December 2017. These matters were addressed in the context of our audit of the consolidated financial statements as a whole, and in forming our opinion thereon, and we do not provide a separate opinion on these matters. For each matter below, our description of how our audit addressed the matter provided in that context. We have fulfilled the responsibilities described in the Auditor’s responsibilities for the audit of the consolidated financial statements section of our report, including in relation to these matters. Accordingly, our audit included the performance of procedures designed to respond to our assessment of the risks of material misstatement of the consolidated financial statements. The results of our audit procedures, including the procedures performed to address the matters below, provide the basis for our audit opinion on the accompanying consolidated financial statements.

28
1. Adequacy of Credit Facilities Impairment ProvisionRefer to the note 9 on the consolidated financial statements
Key Audit MatterThe provision for credit facilities impairment is significant to the Group’s financial statements. Moreover, its calculation requires making assumptions and management’s use of estimates for the drop in credit ratings and un-collectability due to some sectors’ deteriorating financial and economic conditions and inadequate guarantees, and the suspension of interest arising from default according to regulatory authorities’ instructions. Moreover, the net credit facilities granted by the Group to customers amounted to JD 755 million, representing 41% of total assets as of 31 December 2017.
How the Key Audit Matter was addressed in the AuditThe nature and characteristics of credit facilities granted to customers do vary from one sector to another, and from one country to another, due to the Group’s operation in several geographical locations. Consequently, the calculation method of the provision for credit facilities impairment varies due to diverse sectors and different risk assessments for those countries, as well as due to their legal and statutory requirements and the requirements of the Central Bank of Jordan.
The performed audit procedures included understanding the nature of credit facilities portfolios, examining the internal control system adopted in granting, booking and monitoring credit, and evaluating the reasonableness of management’s estimates of the provision for credit facilities impairment, collection procedures and follow- up, as well as suspension of interest. Furthermore, we reviewed and understood the Group’s policy for calculating the provisions. We also selected and reviewed a sample of performing, watch list, and non-performing credit facilities at the Group’s level as a whole. In addition, we evaluated the factors affecting the calculation of the provision for credit facilities impairment such as evaluating available guarantees and collaterals, customers’ financial solvency, management’s estimates of expected cash flows, and regulatory authorities’ statutory requirements. We also discussed these factors with executive management to verify the adequacy of recorded provisions. Moreover, we re-calculated the provisions to be taken for those accounts and verified suspension of interest on non-performing or defaulted accounts and the Group’s adherence to the regulatory authorities’ instructions and International Accounting Standard No. (39), and assumptions used for the calculation of the provision for credit facilities impairment.
Meanwhile, we also evaluated disclosure adequacy relating to credit facilities and provision for credit facilities impairment as set out in Note (9).
2. Financial Assets at Amortized CostRefer to the note 10 and 47 on the (consolidated) financial statements.
Key Audit MatterThe Group holds financial assets at amortized cost of JD597 million, representing 32% of total assets as of 31 December 2017. Moreover, the Group should measure the impairment in their value through comparing the recorded value to their fair value. Fair value determination of financial assets requires the Group’s management to make several judgments and assessments and to rely on non-listed prices input. Consequently, management’s fair value estimation of these assets was significant to our audit.
How the Key Audit Matter was addressed in the AuditAudit procedures included evaluating internal procedures relating to determination of the fair value of financial assets at amortized cost. Moreover, these estimates have been compared to the requirements of International Financial Reporting Standards and discussed in light of available information.

29
The audit procedures also included evaluating the adopted methodology, appropriateness of valuation models, and inputs used to determine the fair value of financial assets at amortized cost. They also included reviewing the reasonableness of the most significant inputs in the valuation process through reviewing investee companies’ financial statements or obtaining secondary market prices as well as other reviewed inputs. We also evaluated disclosure adequacy set out in Notes (10) and (47).
Other Information included in the Group’s 2017 Annual ReportOther information consists of the information included in The Group’s 2017 Annual Report other than the consolidated financial statements and our auditor’s report thereon. Management is responsible for the other information. The Group’s 2017 Annual Report is expected to be made available to us after the date of this auditor’s report. Our opinion on the consolidated financial statements does not cover the other information and we will not express any form of assurance conclusion thereon.
In connection with our audit of the consolidated financial statements, our responsibility is to read the other information identified above when it becomes available and, in doing so, consider whether the other information is materially inconsistent with the consolidated financial statements or our knowledge obtained in the audit or otherwise appears to be materially misstated.
Responsibilities of Management and Those Charged with Governance for the consolidated Financial StatementsManagement is responsible for the preparation and fair presentation of the consolidated financial statements in accordance with IFRSs, and for such internal control as management determines is necessary to enable the preparation of consolidated financial statements that are free from material misstatement, whether due to fraud or error.
In preparing the consolidated financial statements, management is responsible for assessing the Group’s ability to continue as a going concern, disclosing, as applicable, matters related to going concern and using the going concern basis of accounting unless management either intends to liquidate the Group or to cease operations, or has no realistic alternative but to do so.
Those charged with governance are responsible for overseeing the Group’s financial reporting process.
Auditor’s Responsibilities for the Audit of the consolidated Financial StatementsOur objectives are to obtain reasonable assurance about whether the consolidated financial statements as a whole are free from material misstatement, whether due to fraud or error, and to issue an auditor’s report that includes our opinion.
Reasonable assurance is a high level of assurance, but is not a guarantee that an audit conducted in accordance with ISAs will always detect a material misstatement when it exist. Misstatements can arise from fraud or error and are considered material if, individually or in the aggregate, they could reasonably be expected to influence the economic decisions of users taken on the basis of these consolidated financial statements.
As part of an audit in accordance with ISAs, we exercise professional judgment and maintain professional skepticism throughout the audit. We also:• Identify and assess the risks of material misstatement of the consolidated financial statements, whether
due to fraud or error, design and perform audit procedures responsive to those risks, and obtain audit evidence that is sufficient and appropriate to provide a basis for our opinion. The risk of not detecting a material misstatement resulting from fraud is higher than for one resulting from error, as fraud may involve collusion, forgery, intentional omissions, misrepresentations, or the override of internal control.

30
• Obtain an understanding of internal control relevant to the audit in order to design audit procedures that are appropriate in the circumstances, but not for the purpose of expressing an opinion on the effectiveness of the Group’s internal control.
• Evaluate the appropriateness of accounting policies used and the reasonableness of accounting estimates and related disclosures made by management
• Conclude on the appropriateness of management’s use of the going concern basis of accounting and, based on the audit evidence obtained, whether a material uncertainty exists related to events or conditions that may cast significant doubt on the Group’s ability to continue as a going concern. If we conclude that a material uncertainty exist, we are required to draw attention in our auditor’s report to the related disclosures in the consolidated financial statements or, if such disclosures are inadequate, to modify our opinion. Our conclusions are based on the audit evidence obtained up to the date of our auditor’s report. However future events or conditions may cause the Group to cease to continue as a going concern.
• Evaluate the overall presentation, structure and content of the consolidated financial statements, including the disclosures, and whether the consolidated financial statements represent the underlying transactions and events in a manner that achieves fair presentation.
• Obtain sufficient appropriate audit evidence regarding the financial information of the entities or business activities within the Group to express an opinion on the consolidated financial statements. We are responsible for the direction, supervision and performance of the group audit. We remain solely responsible for our audit opinion.
We communicate with those charged with governance regarding, among other matters, the planned scope and timing of the audit and significant audit findings, including any significant deficiencies in internal control that we identify during our audit.
We also provide those charged with governance with a statement that we have complied with relevant ethical requirements regarding independence, and to communicate with them all relationships and other matters that may reasonably be thought to bear on our independence, and where applicable, related safeguards.
From the matters communicated with those charged with governance, we determine those matters that were of most significance in the audit of the consolidated financial statements of the current period, and are therefore the key audit matters. We describe these matters in our auditor’s report, unless law or regulation precludes public disclosure about the matter or when, in extremely rare circumstances, we determine that a matter should not be communicated in our report because the adverse consequences of doing so would reasonable be expected to outweigh the public interest benefits of such communication.
Report on Other Legal and Regulatory Requirements The Group maintains proper books of accounts which are in agreement with the financial statements.
Amman- Hashemite Kingdom of Jordan31 January 2018
Ernst & Young – Jordan Deloitte & Touche (Middle East) - Jordan

31
ARAB JORDAN INVESTMENT BANK - (A PUBLIC SHAREHOLDING LIMITED COMPANY) AMMAN - JORDANCONSOLIDATED STATEMENT OF FINANCIAL POSITION
Assets NotesDecember 31,
2017 2016JD JD
Cash and balances at Central Bank of Jordan 4 70,179,969 73,679,105Balances at banks and financial institutions 5 254,895,109 224,106,568Deposits at banks and financial institutions 6 16,535,460 27,312,114Financial assets at fair value through profit or loss 7 169,390 223,760Financial assets at fair value through comprehensive income 8 14,817,140 15,066,496Direct credit facilities - net 9 755,162,896 753,206,802Financial assets at amortized cost - net 10 597,569,867 594,028,333Investment in associate company 11 19,947,778 17,376,287Property and equipment – net 12 68,754,517 65,692,484Intangible assets - net 13 930,783 1,688,482Deferred tax assets 20-D 932,646 936,420Other assets 14 38,130,272 36,267,905Total Assets 1,838,025,827 1,809,584,756Liabilities and EquityLiabilities: Banks and financial institutions’ deposits 15 487,339,879 420,474,428Customers’ deposits 16 1,050,715,661 1,077,556,467Borrowed money from the Central Bank of Jordan 17 161,422 -Cash margins 18 59,693,044 62,460,574Sundry provisions 19 1,923,950 1,984,077Income tax provision 20-A 7,785,786 9,975,825Other liabilities 21 11,047,721 16,719,105Total Liabilities 1,618,667,463 1,589,170,476EquityEquity attributable to Bank’s shareholders:Paid-up capital 22 150,000,000 150,000,000Share issuance premium 23 1,418,000 1,418,000Statutory reserve 24 29,279,131 26,957,710General banking risks reserve 24 5,888,551 5,788,551Foreign currency translation adjustments 25 (2,379,220) (4,178,654)Fair value reserve – net after tax 26 (1,673,812) (1,429,227)Retained earnings 27 16,168,304 20,603,714Total Equity attributable to the Bank’s shareholders 198,700,954 199,160,094Non – controlling interest 29 20,657,410 21,254,186Total Equity 219,358,364 220,414,280Total Liabilities and Shareholders’ Equity 1,838,025,827 1,809,584,756
The accompanying notes from (1) to (50) constitute an integral part of these statements and should be read with them.

32
ARAB JORDAN INVESTMENT BANK - (A PUBLIC SHAREHOLDING LIMITED COMPANY) AMMAN - JORDANCONSOLIDATED STATEMENT OF INCOME
NotesFor the Year Ended December 31,
2017 2016JD JD
Interest income 30 80,807,691 78,139,623Interest expense 31 (35,813,651) (27,835,611)Net Interest Income 44,994,040 50,304,012Commissions and fees income - Net 32 8,468,863 8,061,629Net Interest and Commissions Income 53,462,903 58,365,641Foreign currencies income 33 3,586,162 3,905,020(Loss) from financial assets at fair value through profit or Loss 34 (7,924) (145,095)Cash dividends from financial assets at fair value through comprehensive income 35 383,644 436,622Other income 36 1,717,082 4,518,123Total Income 59,141,867 67,080,311Employees expenses 37 16,740,195 17,138,820Depreciation and amortization 12, 13 3,068,516 2,607,462Other expenses 38 11,726,260 11,396,488Provision for impairment of direct credit facilities 9 1,771,667 2,068,886Sundry provisions 10, 14 & 19 833,029 956,526Total Expenses 34,139,667 34,168,182(Loss) from the sale of a subsidiary company 2 - (557,650)Bank’s Share in the income of associate company 11 772,057 1,119,586Profit before income tax 25,774,257 33,474,065Income tax expense 20-B (8,599,308) (10,835,765)Profit for the Year 17,174,949 22,638,300Attributable to: Bank’s Shareholders 15,984,051 21,006,184 Non – controlling Interest 1,190,898 1,632,116
17,174,949 22,638,300JD/Fils JD/Fils
Basic and diluted earnings per share 39 0,107 0,140
The accompanying notes from (1) to (50) constitute an integral part of these statements and should be read with them.

33
ARAB JORDAN INVESTMENT BANK - (A PUBLIC SHAREHOLDING LIMITED COMPANY) AMMAN - JORDANCONSOLIDATED STATEMENT OF COMPREHENSIVE INCOME
For the Year Ended December 31,2017 2016
JD JDProfit for the year 17,174,949 22,638,300Comprehensive Income Items:Foreign currency translation adjustments - associate company (convertible to income statement)
1,799,434 (3,423,912)
Cumulative change in fair value - net after tax (non-convertible to income statement) (439,271) (562,450)(Loss) gain from the sale of financial assets through comprehensive income (non-convertible to income statement)
4,222 (10,011)
Total other comprehensive income 1,364,385 (3,996,373)Total Comprehensive Income for the year 18,539,334 18,641,927Total Comprehensive Income Attributable to:Bank’s Shareholders 17,540,860 17,045,428Non - Controlling Interest 998,474 1,596,499
18,539,334 18,641,927
The accompanying notes from (1) to (50) constitute an integral part of these statements and should be read with them.

34
ARAB JORDAN INVESTMENT BANK - (A PUBLIC SHAREHOLDING LIM
ITED COMPANY) AM
MAN - JORDAN
CONSOLIDATED STATEMNET OF CHANGES IN SHAREHOLDERS’ EQUITY
For the year ended 31 December 2017
Paid-upcapital
Share issuance prem
ium
ReservesForeign
currency Translation
Adjustments
Fair value reserve - net after tax ****
Retained earnings***
Totalshareholders'
equity
Non - controlling
interest Total equity
Statutory reserve
General banking
risks reserve**
JDJD
JDJD
JDJD
JDJD
JDJD
Balance - beginning of the year150,000,000
1,418,00026,957,710
5,788,551(4,178,654)
(1,429,227)20,603,714
199,160,09421,254,186
220,414,280Profit of the year
--
--
--
15,984,05115,984,051
1,190,89817,174,949
Cumulative change in fair value - net after tax
--
--
-(246,847)
-(246,847)
(192,424)(439,271)
Gain from sale financial assets through com
prehensive income
--
--
-2,262
1,9604,222
-4,222
Foreign currency translation adjustments - associate com
pany-
--
-1,799,434
--
1,799,434-
1,799,434Total com
prehensive income
--
--
1,799,434(244,585)
15,986,01117,540,860
998,47418,539,334
Dividends distributed *-
--
--
-(18,000,000)
(18,000,000)-
(18,000,000)Transfer to statutory reserves
--
2,321,421100,000
--
(2,421,421)-
--
Change in non-controlling interest-
--
--
--
-(1,595,250)
(1,595,250)Balance - end of the year
150,000,0001,418,000
29,279,1315,888,551
(2,379,220)(1,673,812)
16,168,304198,700,954
20,657,410219,358,364
For the year ended 31 December 2016
Balance - beginning of the year 150,000,000
1,418,00023,917,637
5,788,551(754,742)
(1,017,821)20,747,416
200,099,04121,509,930
221,608,971Profit for the year
--
--
--
21,006,18421,006,184
1,632,11622,638,300
Cumulative change in fair value - net after tax
--
--
-(526,833)
-(526,833)
(35,617)(562,450)
Gain from sale financial assets through com
prehensive income
--
--
-115,427
(125,438)(10,011)
-(10,011)
Foreign currency translation adjustments - associate com
pany-
--
-(3,423,912)
--
(3,423,912)-
(3,423,912)Total Com
prehensive Income
--
--
(3,423,912)(411,406)
20,880,74617,045,428
1,596,49918,641,927
Dividends distributed-
--
--
-(18,000,000)
(18,000,000)-
(18,000,000)Transfer to statutory reserves
--
3,052,573-
--
(3,052,573)-
--
Effect of the sale of a subsidiary company
--
(12,500)-
--
28,12515,625
(28,125)(12,500)
Change in non-controlling interest-
--
--
--
-(1,824,118)
(1,824,118)Balance - end of the year
150,000,0001,418,000
26,957,710 5,788,551
(4,178,654)(1,429,227)
20,603,714 199,160,094
21,254,186 220,414,280
* According to the resolution of the Bank’s General Assem
bly meeting held on 27 April 2017 it w
as approved to distribute 12% of the Bank›s capital as cash dividends to the
shareholders which is equivalent to JD 18 m
illion. In accordance to the instructions of the regulatory authorities
** The general banking risk reserve cannot be utilized w
ithout the approval of the Central Bank of Jordan.***
Retained earnings include a restricted amount of JD 932,646 against deferred tax benefits as of 31 Decem
ber 2017. This restricted amount cannot be utilized through
capitalization or distribution unless actually realized in accordance to the Central Bank of Jordan regulations.****
The negative fair value reserve which am
ounts to JD (1,673,812) cannot be utilized through capitalization, distribution or any other way unless realized from
the actual sales transactions in accordance to the Central Bank of Jordan regulations.
The accompanying notes from
(1) to (50) constitute an integral part of these statements and should be read w
ith them.

35
ARAB JORDAN INVESTMENT BANK - (A PUBLIC SHAREHOLDING LIMITED COMPANY) AMMAN - JORDANCONSOLIDATED STATEMENT OF CASH FLOWS
NotesFor the year ended December 31,
2017 2016JD JD
Cash Flows From Operating Activities Profit before income tax 25,774,257 33,474,065Adjustments for non-cash items:Depreciation and amortization 12, 13 3,068,516 2,607,462Provision for impairment of direct credit facilities 9 1,771,667 2,068,886Unrealized loss on financial assets at fair value through profit or loss 34 19,242 41,036Provision for end-of-service indemnity 19 236,529 420,026Provision for assets seized by the Bank 14 500,000 500,000Provision for financial assets at amortized cost 10 36,500 36,500Sundry provisions 19 60,000 -(Gain) from the sale of property and equipment 36 (27,147) (628,402)(Gain) loss from the sale of assets seized by the Bank 36 (7,946) 3,856Loss from the sale of a subsidiary company 2 - 557,650Effect of exchange rate fluctuations on cash and cash equivalents (136,658) (171,599)Bank’s share from (gain) of investment in associate company 11 (772,057) (1,119,586)Cash Profit before Changes in Assets and Liabilities 30,522,903 37,789,894Changes in assets and liabilities:Deposits with banks and other financial institutions (maturing over 3 months) 10,776,654 (5,290,331)Financial assets at fair value through profit or loss 35,128 (199,149)Direct credit facilities (3,727,761) (18,703,218)Other assets (2,354,421) 3,427,186Banks and financial institutions deposits (maturing over 3 months) 80,000,000 (63,720,000)Customers' deposits (26,840,806) 37,456,522Cash margins (2,767,530) (3,303,472)Other liabilities (5,878,951) (1,114,957)Net Change in Assets and Liabilities 49,242,313 (51.447.419)Net Cash Flows from Operating Activities before Taxes and Provisions Paid 79,765,216 (13,657,525)Provisions paid 19 (356,656) (156,148)Income tax paid 20-A (10,785,573) (10,440,663)Net Cash Flows (used in) from Operating Activities 68,622,987 (24,254,336)Cash Flows From Investing Activities:Proceeds from the sale of a subsidiary company 2 - 106,200Financial assets at amortized cost - net (3,578,034) (5,501,746) Purchase sale of financial assets at fair value through other comprehensive income
(185,693) (1,095,579)
Purchase of property and equipment 12 (5,527,593) (6,181,321)Sale / disposals of property and equipment and intangible asset 384,576 1,116,655Purchase of intangible assets 13 (202,686) (474,677) Net Cash Flows (used in) Investing Activities (9,109,430) (12,030,468) Cash Flows From Financing Activities:Borrowed money from the Central Bank of Jordan 161,422 -Change in non–controlling interest (1,595,250) (1,852,243)Dividends paid to shareholders (17,792,433) (18,864,459)Net cash flows (used in) financing activities (19,226,261) (20,716,702)Net increase (decrease) in cash and cash equivalents 40,287,296 (57,001,506)Effect of exchange rate fluctuations on cash and cash equivalents 136,658 171,599Cash and cash equivalent - beginning of the year (122,688,755) (65,858,848)Cash and Cash Equivalent - end of the year 40 (82,264,801) (122,688,755)
The accompanying notes from (1) to (50) constitute an integral part of these statements and should be read with them.

36
ARAB JORDAN INVESTMENT BANK(A PUBLIC SHAREHOLDING LIMITED COMPANY)AMMAN - JORDAN
NOTES TO CONSOLIDATED FINANCIAL STATEMENTS

37
1. GENERALThe Arab Jordan Investment Bank is a public shareholding limited company with headquarters inAmman – Jordan, On January 1, 1978 it was registered according to the Companies Law and related subsequent amendments the last of which was amendment No, (22) for the year 1997. Moreover the Bank's authorized and paid-up capital was increased gradually the last of which was during the year 2014 to become JD 150 million at face value of JD 1 each.
The Bank is engaged in commercial banking activities through its (33) branches and offices in Jordan and (1) branch in Cyprus and its subsidiaries in Qatar and Jordan (Arab Jordan Investment Bank - (Qatar) LLC and the United Arab Jordan Company for Investment and Financial Brokerage).
The Bank's shares are listed and traded in the Amman Stock Exchange.
The consolidated financial statements have been approved by the Board of Directors in its meeting held on 31 January 2018 meeting number (267) and are subject to the approval of the Central Bank of Jordan and the General Assembly of Shareholders.
2. SIGNIFICANT ACCOUNTING POLICIES Basis of PreparationThe accompanying consolidated financial statements for the Bank and its subsidiaries have been prepared in accordance with the international financial reporting standards issued by the International Accounting Standards Board and the interpretations of the International Financial Reporting Interpretations Committee stemming from the International Accounting Standards Board and in conformity with the applicable laws and regulations of the Central Bank of Jordan.
The consolidated financial statements are prepared on the historical cost basis except for financial assets at fair value through profit and Loss and financial assets at fair value through Comprehensive Income and financial derivatives which have been measured at fair value at the date of the consolidated financial statements, Moreover hedged assets and liabilities are stated at fair value.
The consolidated financial statements are presented in Jordanian Dinar (JD) which is the base currency of the Bank.
Changes in Accounting PoliciesThe accounting policies used in the preparation of the financial statements are consistent with those used in the preparation of the annual financial statements for the year ended 31 December 2016 except for the followings as the Bank started applying the adjustments since 1 January 2017:
Amendments to IAS 7 Statement of Cash Flows: Disclosure InitiativeLimited amendments which require entities to provide disclosures about changes in their liabilities arising from financing activities, including both changes arising from cash flows and non-cash changes (such as foreign exchange gains or losses). However, the adoption of these amendments have no impact on the Bank’s consolidated financial statements.
Amendments to IAS 12 Income Taxes: Recognition of Deferred Tax Assets for Un-recognised LossesLimited amendments to clarify that an entity needs to consider whether tax law restricts the sources of taxable profits against which it may make deductions on the reversal of that deductible temporary difference and some other limited amendments, the adoption of these amendments have no impact on the Bank’s consolidated financial statements.

38
Basis of Consolidation The consolidated financial statements comprise the financial statements of the Bank and its subsidiaries were the Bank holds control over the subsidiaries. The control exists when the Bank controls the subsidiaries significant and relevant activities and is exposed, or has rights, to variable returns from its involvement with the subsidiaries and has the ability to affect those returns through its power over the subsidiaries. All transactions balances, income and expenses between the Bank and subsidiaries are eliminated. The following subsidiaries were consolidated in the Group’s account:
Company’sObjectives
Date ofIncorporated
Headquarter
Company’s Paid-up Capital
Equivalent OwnershipPercentage
Company’s Name
JD
FinancialBrokerage
February 5,2002
Amman-Jordan
2,500,000100% United Arab Jordan Company for Investment and FinancialBrokerage
Bank Activity December 5,
2005Doha - Qatar35,450,000
50% + two shares
Arab Jordan Invest Bank / Qatar
The following are the most significant financial information for the subsidiary companies:
Arab Jordan Invest Bank / QatarUnited Arab Jordan Company for Investment and Financial
Brokerage2016201720162017
JDJDJDJD232,208,146192,800,4082,344,1502,799,178Total assets189,699,769151,485,588121,774137,148Total liabilities
42,508,37741,314,8202,222,3762,662,030Equity
2016201720162017JDJDJDJD
8,162,0396,992,25075,57897,802Total revenue 4,897,8054,610,458745,898328,468Total expenses
The United Arab Jordan for Investment and Financial Brokerage Company (a subsidiary of the Bank) has sold in the year 2016 all its shares in Arab Advisors Company which represents 55% of the total shares for an amount of JD 106,200 which resulted in a loss from the sale amounted JD 557,650.
The financial statements of the subsidiaries are prepared for the same financial year of the Bank using the same accounting policies adopted by the Bank, If the accounting policies adopted by the Company are different from those used by the Bank the necessary adjustments to the financial statements of the subsidiaries are made to comply with the accounting policies used by the Bank.
The subsidiary companies results are consolidated in the consolidated income statement from the date of the acquisition, which is the date when the bank have the actual control over the subsidiary.
Non-controlling interest represents the portion that is not owned by the bank in the owner’s equity in the subsidiary companies.

39
Segmental Information Business sector represents a group of assets and operations that jointly provide products or services subject to risks and returns different from those of other business segments, which were measured according to the reports used by the General Manager and the Bank’s decision maker.
Geographical sector relates to providing products or services in an economic environment subject to specific risks and returns different from those operating in other sectors of other economic environments.
Direct Credit Facilities Direct credit facilities are financial assets with fixed or determinable payments which are provided basically by the Bank or have been acquired and has no market price in the active markets, which are measured at amortized cost.
A provision for the impairment in direct credit facilities is recognized when the bank can’t recover its overdue amounts and when there is an evidence that the future cash flows of the direct credit facilities have been negatively impacted by an event and the impairment loss can be estimated and recorded in the consolidated statement of income.
Interest and commission earned on non-performing granted credit facilities are suspended in accordance with the instructions of the Central Bank of Jordan and in accordance with the instructions of the regulatory authorities whichever is more conservative in countries where the bank has its branches or subsidiaries.
When direct credit facilities are uncollectible they are written off against the provision account, any surplus in the provision is reversed through the consolidated statement of income, and subsequent recoveries of amounts previously written off are credited to revenue.
Fair ValueFair value represents the closing market price (Assets Purchasing / Liabilities Selling) of financial assets and derivatives on the date of the consolidated financial statements. In case declared market prices do not exist active trading of some financial assets and derivatives is not available or the market is inactive fair value is estimated by one of several methods including the following:
• Comparison with the fair value of another financial asset with similar terms and conditions.
• Analysis of the present value of expected future cash flows for similar instruments.
• Adoption of the option pricing models.
• Evaluation of long-term assets and liabilities that bear no interest through discounting cash flows and amortizing premium / discount using the effective interest rate method within interest revenue / expense in the consolidated statement of income.
The valuation methods aims to provide a fair value reflecting the market’s expectations taking into consideration the market expected risks and expected benefits when the value of the financial assets. When the financial assets fair value can’t be reliably measured, they are stated at cost less any impairment.
Investment in AssociateAn associate company is the company whereby the bank exercises effective influence over their decisions related to financial and operational policies without control, with the bank owning from (20%) to (50%) of the voting rights, and is stated in accordance to the equity method.
Revenues and expenses resulting from transactions between the bank and the associate company are eliminated according to the bank's ownership percentage in these company.

40
Financial Assets at Amortized CostAre the assets that the bank’s management intends to hold for the purpose of collecting the contractual cash flows which represents the cash flows that are solely payments of principal and interest on the outstanding principal.
Financial assets are recorded at cost upon purchase plus acquisition expenses, Moreover the issue premium\discount is amortized using the effective interest associated with the decline in value of these investments leading to the in ability to recover the investment or parts thereof are deducted, Any impairment is registered in the consolidated statement of income and should be presented subsequently at amortized cost less any impairment losses.
The amount of impairment loss recognised at amortized cost is the difference between the asset’s carrying amount and the present value of estimated future cash flows discount at the original effective interest rate.
It is not allowed to reclassify any financial assets from/to this category except for certain cases that are specified by the International Financial Reporting Standards (And if in any cases these assets are sold before the maturity date the result of sale will be recorded in the consolidated statement of income in an separated disclosure and note about it according to the International Financial Reporting Standards in specific).
Financial Assets at Fair Value through Profit or LossIt is the financial assets purchased by the bank for the purpose of trading in the near future and achieving gains from the fluctuations in the short-term market prices or trading margins.
Financial assets at fair value through profit or loss are initially stated at fair value at acquisition date (purchase costs are recorded in the consolidated statement of income upon acquisition) and subsequently measured in fair value, Moreover changes in fair value are recorded in the consolidated statement of income including the change in fair value resulting from translation of non-monetary assets stated at foreign currency, Gains or losses resulting from the sale of these financial assets or part of them are taken to the consolidated statement of income.
Dividends and interests from these financial assets are recorded in the consolidated statement of income.
It is not allowed to reclassify any financial assets to / from this category except for the cases specified in International Financial Reporting Standard.
Financial Assets at Fair Value through Comprehensive IncomeThese financial assets represents the investments in equity instruments held for the long term.
These financial assets are recognized at fair value plus transaction costs at purchase date and are subsequently measured at fair value in the consolidated statement of comprehensive income and within owner’s equity including the changes in fair value resulting from translation of non-monetary assets stated in foreign currency. Gain or loss from the sale of these investments or part of them should be recognized in the consolidated statement of comprehensive income and within owner’s equity and the balance of the revaluation reserve for these assets should be transferred directly to the retained earnings not to the consolidated statement of income.
No impairment testing is required for these assets.
Dividends are recorded in the consolidated statement of income.

41
Impairment in Financial AssetsThe bank reviews the value of financial assets on the date of the consolidated statement of financial position in order to determine if there are any indications of impairment in their value individually or in the form of a portfolio, In case such indications exist the recoverable value is estimated so as to determine the impairment loss.
Impairment is determined as follows:• The impairment in the financial assets recorded at amortized cost is determined on the basis of the
present value of the expected cash flows discounted at the original interest rate.
• The impairment in the financial assets at cost is determined by the difference between book value and the present value of the expected future cash flows discounted in effective market price on any other similar financial assets.
• Impairment is recorded in the consolidated statement of income as does any surplus that occurs in subsequent years that is due to a previous impairment of the financial assets in the consolidated statement of income.
Property and Equipment Property and equipment are stated at cost net of accumulated depreciation and any impairment loss in its value, Moreover Property and Equipment (except for land) are depreciated according to the straight-line method over the estimated useful lives when ready for use of these assets using the following annual rates.
%Buildings 2Equipment furniture and fixtures 9-15Vehicles 20Computer 12-15Others 2-12
When the carrying amount of property and equipment exceeds their recoverable value, assets are written down and impairment loss is recorded in the consolidated statement of income.
The useful lives of property and equipment are reviewed at the end of each year, In case the expected useful life is different from what was determined before the change in estimate is recorded in the following years being a change in estimates.
Property and equipment are derecognized when disposed or when there is no expected future benefit from their use.

42
Intangible AssetsA. GoodwillGoodwill is recognized at cost and represents the excess of the acquisition costs or investment costs in an affiliate or a subsidiary over the net assets fair value of the affiliate or subsidiary as of the acquisition date. Goodwill arises from the investment in the subsidiary recognized as a separate item in intangible assets. Later on, goodwill will be reviewed and reduced by any impairment amount.
Goodwill is allocated to cash generating unit(s) to test impairments in its value.
Impairment testing is done on the date of the consolidated financial statements. Goodwill is reduced if the test indicates that there is impairment in its value, and that the estimated recoverable value of the cash generating unit(s) relating to goodwill is less than the book value of the cash generating unit(s). Impairment is recognized in the consolidated statement of income.
B. Other Intangible assetsIntangible assets purchased in an acquisition are stated at fair value at the date of acquisition. Other intangible assets purchased other than through acquisition are recorded at cost.
Intangible assets are to be classified on the basis of either definite or indefinite useful life. Intangible assets with definite useful economic lives are amortized over their useful lives and recorded as an expense in the consolidated statement of income. Intangible assets with indefinite lives are reviewed for impairment as of the consolidated financial statements date, and impairment loss is recorded in the consolidated statement of income.
No capitalization of intangible assets resulting from the banks' operations is made. They are rather recorded as an expense in the consolidated statement of income in the same year.
Any indications of impairment in the value of intangible assets as of the consolidated financial statements date are reviewed. Furthermore, the estimated useful lives of the impaired intangible assets are reassessed, and any adjustment is made in the subsequent periods.
The intangible assets with a specified useful life appears of cost after deducting the annual amortization. These assets were amortized by using the straight-line method on the useful life using a percentage of 25% annually.
ProvisionsProvisions are recognized when the bank has an obligation on the date of the consolidated financial statement arising from a past event and the costs to settle the obligation is probable and can be reliably measured.
Provision for employees’ end-of-service indemnityProvision for end of service indemnity is established by the Bank to fare any legal or contractual obligations at the end of employees’ services and is calculated based on the service terms as of the financial statements date.
Income TaxIncome tax expenses represent accrued taxes and deferred taxes.
Income tax expenses are accounted for on the basis of taxable income. Moreover taxable income differs from income declared in the consolidated financial statements because the latter includes non-taxable revenues or taxable expenses disallowed in the current year but deductible in subsequent years accumulated losses acceptable by the tax law and items not accepted for tax purposes or subject to tax.

43
Taxes are calculated on the basis of the tax rates according to the prevailing laws regulations and instructions of the countries where the bank operates.
Deferred taxes are taxes expected to be paid or recovered as a result of temporary timing differences between the value of the assets and liabilities in the consolidated financial statements and the value of the taxable amount. Deferred tax is calculated on the basis of the liability method in the consolidated statement of financial position according to the rates expected to be applied when the tax liability is settled or tax assets are recognized.
Deferred tax assets and liabilities are reviewed as of the date of the consolidated financial statements and reduced in case it is expected that no benefit will arise from payment or the elimination of the need for deferred tax liabilities partially or totally.
Capital Cost of Issuing or Buying the Bank's SharesCost arising from the issuance or purchase of the bank's shares are charged to retained earnings (net of the tax effect of these costs if any). If the shares issuance or purchase process is incomplete these costs are recorded as expenses in the consolidated statement of income.
Accounts Managed on Behalf of CustomersThese represent the accounts managed by the bank on behalf of its customers but do not represent part of the bank's assets. The fees and commissions on such accounts are shown in the consolidated statement of Income. A provision against the impairment in the capital-guaranteed portfolios managed on behalf of customers is taken.
OffsettingFinancial assets and financial liabilities are offset and the net amount reported in the consolidated statement of financial position when there is a legally enforceable right to offset the recognized amounts and the Bank intends to either settle them on a net basis or to realize the asset and settle the liability simultaneously.
Realization of Income and Recognition of Expenses Interest income is realized by using the effective interest method except for interest and commissions from non-performing credit facilities which are not recognized as income and are recorded in the interest and commissions in suspense account.
Expenses are recognised according to the accrual basis.
Commission is recorded as revenue when the related services are provided, Moreover dividends are recorded when realized (decided upon by the General Assembly of Shareholders).
Recognition of Financial Assets DatePurchases and sales of financial assets are recognized on the trading date (which is the date on which the bank commits itself to purchase or sell the asset).

44
Hedge Accounting and Financial Derivatives Financial Derivatives for Hedging:Fair Value Hedges:For the purpose of hedge accounting the financial derivatives appear at fair value.
A fair value hedge is a hedge against the exposure to changes in the fair value of the bank's recognised assets or liabilities.
When the conditions of an effective fair value hedge are met the resulting gains and losses from the valuation of the fair value hedge and the change in the fair value of the hedged assets or liabilities is recognised in the consolidated statement of income.
When the conditions of an effective portfolio hedge are met the gain or loss resulting from the revaluation of the hedging instrument at fair value as well as the change in the fair value of the assets or liabilities portfolio are recorded in the consolidated income statement for the same year.
Cash flow Hedges:Hedge for the change in the current and expected cash flows exposures of the Bank’s assets and liabilities.When the conditions of an effective cash flow hedge are met the gain or loss of the hedging instruments is recognized in the statement of comprehensive income and owner’s equity, such gain or loss is transferred to the consolidated statement of income in the period in which the hedge transaction impacts the consolidated statement of income.
When the condition of the effective hedge do not apply the gain or loss resulting from the change in the fair value of the hedging instrument is recorded in the consolidated statement of income the same year.
Derivative financial instruments held for trading Derivative financial instruments such as foreign currency forward and future deals, interest rate forward and future deals, swaps, foreign currency options and others, are recorded at fair value in the balance sheet. Fair value is determined by reference to current market prices. In case such prices were not available, the method of valuation is stated. Changes in fair value are transferred to the income statement.
Assets Seized by the Bank against Due DebtsAssets that have been the subject of foreclosure by the bank are shown under "other assets" at the acquisition value or fair value whichever is lower. As of the consolidated statement of financial position date these assets are revalued individually at fair value, any decline in their market value is taken to the consolidated statement of income as a loss whereas any such increase is not recognized. Subsequent increase is taken to the income statement to the extent it does not exceed the previously recorded impairment.
Repurchase and Resale AgreementsAssets sold with a simultaneous commitment to repurchase at a specified future date (repos) will continue to be recognised in the bank's consolidated financial statements due to the bank's continuing exposure to the risks and rewards of these assets using the same accounting policies, (The buyer has the right to control such assets (by sale or pledge as collateral) which are reclassified as financial assets pledged as collateral), The proceeds of the sale are recorded under loans and borrowings, The difference between the sale and repurchase price is recognised as an interest expense over the agreement term using the effective interest method.
Assets purchased with a corresponding commitment to resell at a specified future date (reverse repos) are not recognised in the bank's consolidated financial statements since the bank is not able to control these assets and since any risks and benefits do not accrue to the bank when they occur. The related payments are recognised as part of deposits at banks and financial institutions or direct credit facilities as applicable Moreover the difference between the purchase and resale price is recognised in the consolidated statement of income over the agreement term using the effective interest method.

45
Foreign CurrenciesTransactions in foreign currencies during the year are recorded at the exchange rates prevailing at the date of the transactions. Moreover financial assets and financial liabilities are translated to Jordanian Dinar based on the average exchange rates declared by the Central Bank of Jordan on the date of the consolidated financial statements.
Non-monetary assets and liabilities denominated in foreign currencies and recorded at fair value are translated on the date when their fair value is determined.
Gains or losses resulting from foreign currency translation are recorded in the consolidated statement of income.
Translation differences for non-monetary assets and liabilities denominated in foreign currencies (such as equity securities) are recorded as part of the change in fair value.
When consolidating the financial statements assets and liabilities of the branches and subsidiaries abroad are translated from the primary currency to the currency used in the financial statements using the average exchange rates prevailing on the consolidated statement of financial position date and declared by the Central Bank of Jordan, Revenue and expense items are translated using the average exchangerates during the year and exchange differences are shown in a separate item within the consolidated statement of other comprehensive income equity, In case of selling one of the subsidiaries or branches the related amount of exchange difference is booked in revenues/expenses in the consolidated statement of income.
Profit or loss resulting from the foreign exchange of interest-bearing debt instruments and within financial assets at fair value through other comprehensive income is included in the consolidated statement of income. Differences in the foreign currency translation of equity instruments are included in the cumulative change in fair value reserve within owner’s equity in the consolidated statement of financial position.
Cash and Cash EquivalentsCash and cash equivalents comprise cash balances with central banks and balances with banks and financial institutions maturing within three months less balances due to banks and financial institutions maturing within three months and restricted funds.

46
3. Use of Estimates The preparation of the financial statements requires management to make estimates and assumptions that affect the reported amounts of financial assets and liabilities and disclosure of contingent liabilities. These estimates and assumptions also affect the revenues and expenses and the resultant provisions as well as fair value changes reported in equity. In particular, considerable judgment by management is required in the estimation of the amount and timing of future cash flows. Such estimates are necessarily based on assumptions about several factors involving varying degrees of judgment and uncertainty and actual results may differ resulting in future changes in such provisions.
The management believes that their estimates are reasonable:
• A provision for credit facilities is taken on the bases and estimates approved by management in conformity with International Financial Reporting Standards (IFRSs), The outcome of these bases and estimates is compared against the adequacy of the provisions as per the instructions of the central banks where the bank branches operate, the strictest outcome that conforms with (IFRSs) is used for the purpose of determining the provision.
• Impairment for assets seized by the Bank is recorded depending on a new valuation approved by certified valuators for the purpose of calculating impairment and it is assessed on an ongoing basis. And starting from the year 2015 the Bank has started to book a provision for assets seized by the Bank from due debts and which has been seized for more than four years in accordance to the Central Bank of Jordan publication 10/1/6740 dated on March 27, 2014.
• Management periodically reassesses the economic useful lives of tangible and intangible assets for the purpose of calculating annual depreciation and amortization based on the general condition of these assets and the assessment of their useful economic lives expected in the future. Impairment loss (if any) is taken to the consolidated statement of income.
• A provision for income tax is recorded on the current year's profit and for accrued and assessed tax for the prior year in case of differences exceeding the provision due to not reaching a final settlement with the tax authorities for that year.
• A provision for lawsuits raised against the bank (if there is any need) is recorded based on a legal study prepared by the bank's legal advisor, moreover the study highlights any potential risks that the Bank may encounter in the future, such legal assessments are reviewed periodically.
• Provision for end of service indemnity, the obligations to the Bank’s employees are computed according to the labor law and the Bank’s regulations.

47
4. Cash and balances at the Central Bank of JordanThis item consists of the following:
December 31,2017 2016
JD JDCash in vaults 18,454,887 15,338,455Balances at Central Bank of Jordan:Statutory cash reserve 51,725,082 50,340,650Certificates of deposit * - 8,000,000Total 70,179,969 73,679,105
Except for the statutory cash reserve there are no restricted balances at the Central Bank of Jordan as of 31 December 2017 and 2016.* There are no certificated of deposit maturing within a period exceeding three months as of 31 December
2017 and 2016.
5. Balances at banks and financial institutionsThis item consists of the following:
Local Banks and Financial Institutions
Foreign Banks and Financial Institutions Total
December 31, December 31, December 31,2017 2016 2017 2016 2017 2016
JD JD JD JD JD JDCurrent and Call accounts 170,433 134,579 57,389,439 53,992,274 57,559,872 54,126,853Deposits maturing within 3 months or less 18,302,183 37,876,118 179,033,054 132,103,597 197,335,237 169,979,715
Total 18,472,616 38,010,697 236,422,493 186,095,871 254,895,109 224,106,568
The balances at banks and financial institutions that bears no interest amounted to JD 57,559,263 as of 31 December 2017 (JD 54,125,501 as of 31 December 2016).
There are no restricted balances at banks and financial institutions as of 31 December 2017 and 2016.
6. Deposits at banks and financial institutionsThis item consists of the following:
Local Banks and Financial Institutions
Foreign Banks and Financial Institutions
Total
December 31, December 31, December 31,2017 2016 2017 2016 2017 2016
JD JD JD JD JD JDDeposits maturing within 3 to 6 months - 8,508,000 5,511,348 6,558,873 5,511,348 15,066,873Deposits maturing from 6 to 9 months - - 5,511,348 8,772,561 5,511,348 8,772,561Deposits maturing from 9 months to one year - - 5,512,764 - 5,512,764 -Deposits maturing in more than one year - 3,472,680 - - - 3,472,680Total - 11,980,680 16,535,460 15,331,434 16,535,460 27,312,114
There are no restricted deposits at banks and financial institutions as of 31 December 2017 and 2016.

48
7. Financial assets at fair value through profit or lossThis item consists of the following:
December 31,2017 2016
JD JDListed stocks in active markets 169,390 223,760Total 169,390 223,760
8. Financial assets at fair value through comprehensive income This item consists of the following:
December 31,2017 2016
JD JDListed stocks in active markets 13,384,653 13,782,864Unlisted stocks in active markets 1,432,487 1,283,632Total 14,817,140 15,066,496
Cash dividends on the above investments amounted to JD 383,644 for the year ended 31 December 2017 (JD 436,622 for the year ended 31 December 2016).
9. Direct Credit Facilities – Net This item consists of the following:
December 31,2017 2016
JD JDIndividual (Retail):Loans 92,585,951 92,248,503Credit cards 9,448,232 11,273,210Real-estate loans 91,578,633 97,906,564Large companies Loans* 246,844,342 217,137,484Overdraft accounts 82,713,613 112,685,776Small and medium companies Loans* 34,862,172 32,065,663Overdraft accounts 8,209,895 12,399,580Government & public sector 202,870,110 189,737,076Total 769,112,948 765,453,856Less: provision for impairment of direct credit facilities (11,093,862) (10,236,282)Less: suspended interest (2,856,190) (2,010,772)Net credit facilities 755,162,896 753,206,802
* Net after deducting interests and commission received in advance.• Non-performing credit facilities amounted to JD 16,220,840 representing 2.11% of direct credit facilities
balance as of 31 December 2017 (JD 14,095,395 representing 1.84% of the granting balance for the previous year).
• Non-performing credit facilities net of interest in suspense amounted to JD 13,918,004 representing 1.82% of direct credit facilities balance net of interest in suspense (JD 12,667,048 representing 1.66% for the previous year).
• Credit facilities granted to and guaranteed by the Jordanian Government amounted to JD 179,452,826 representing 23.33% of total direct credit facilities (JD 163,263,623 representing 21.33% for the previous year).

49
Provision for impairment of direct credit facilities:The following is the movement on the provision for impairment of direct credit facilities:
For the Year Ended December 31, 2017
Individuals Real-estate
LoansLarge
Companies
Small and Medium
CompaniesTotal
JD JD JD JD JDBalance – Beginning of the year 2,270,177 2,058,376 1,064,000 4,843,729 10,236,282Provision for the year taken from revenues 783,777 - - 987,890 1,771,667Transferred to off-statement of financial position accounts *
(500,104) (298,511) - (115,472) (914,087)
Balance – End of the year 2,553,850 1,759,865 1,064,000 5,716,147 11,093,862Provision on a single client basis 2,232,403 1,686,606 1,064,000 3,630,865 8,613,874Provision for watch-list debts on a portfolio basis 321,447 73,259 - 2,085,282 2,479,988
2,553,850 1,759,865 1,064,000 5,716,147 11,093,862For the Year Ended December 31, 2016Balance – Beginning of the year 2,675,220 1,353,720 1,064,000 4,037,432 9,130,372Provision for the year taken from revenues 209,970 746,716 - 1,112,200 2,068,886Used during the year - (24,248) - - (24,248)Transfer to off-statement of financial position accounts* (615,013) (17,812) - (305,903) (938,728)Balance – End of the year 2,270,177 2,058,376 1,064,000 4,843,729 10,236,282Provision on a single client basis 1,991,695 1,987,424 1,064,000 3,262,264 8,305,383Provision for watch-list debts on a portfolio basis 278,482 70,952 - 1,581,465 1,930,899
2,270,177 2,058,376 1,064,000 4,843,729 10,236,282 * There are non-performing credit facilities with a balance of JD 64,763,502 and interest in
suspense of JD 18,447,115 with a provision of JD 46,034,627 and cash margins of JD 281,760 as of31 December 2017 (Non-performing credit facilities have a balance of JD 62,164,887 and it’s suspended interests JD 16,146,179 and a provision JD 45,133,534 and cash margins JD 885,174 as of 31 December 2016) that have been recorded within off – statement of financial position account as per the board of directors decision as these credit facilities are fully covered as of the date of the consolidated financial statements.
• The provisions no longer needed due to settlements or repayments and transferred against other debts
amounted to JD 3,215,082 for the year ended 31 December 2017 (JD 2,448,277 as of 31 December 2016).

50
Interest in suspense:The following is the movement on the interest in suspense:
Individual Real-estate
loans
Small and medium
companiesTotal
For the year ended 31 December 2017 JD JD JD JDBalance – Beginning of the year 253,496 749,639 1,007,637 2,010,772Add: Interest suspended during the year 272,656 455,817 689,179 1,417,652Less: Interest in suspense reversed to revenues (90,516) (234,261) (9,291) (334,068)Less: Interest in suspense transferred to off - statement of financial position accounts
(97,268) (55,925) (78,311) (231,504)
Less: Interest in suspense written off (1,882) (4,780) - (6,662)Balance - End of the year 336,486 910,490 1,609,214 2,856,190For the year ended 31 December 2016Balance – Beginning of the year 225,345 629,180 799,131 1,653,656Add: Interest suspended during the year 355,528 425,256 303,110 1,083,894Less: Interest in suspense reversed to revenues (51,555) (118,150) (9,087) (178,792)Less: Interest in suspense transferred to off - statement of financial position accounts
(275,822) (148,492) (85,517) (509,831)
Less: Interest in suspense written off - (38,155) - (38,155)Balance - End of the year 253,496 749,639 1,007,637 2,010,772
10. Financial Assets at Amortized Cost – NetThis item consists of the following:
2017 2016JD JD
Financial assets with market price:Governmental treasury bonds 561,521,617 555,171,529Bonds guaranteed by other government 6,026,881 4,286,146Companies bonds 30,094,369 34,607,158
597,642,867 594,064,833Less: Impairment (73,000) (36,500)Total financial assets with market price 597,569,867 594,028,333
Below is the movement of impairment on bonds:
2017 2016 JD JD
Balance at the beginning of the year 36,500 -Impairment during the year 36,500 36,500Balance at the end of the year 73,000 36,500

51
Bonds Analysis:2017 2016
JD JDFinancial assets at fixed rate of return 581,695,022 594,028,333Financial assets at variable rate of return 15,874,845 -Total 597,569,867 594,028,333
11. Investment in Associate CompanyThe following is the movement on the investment in the associate company:
For the Year ended December 31,2017 2016
JD JDBalance at the beginning of the year 17,376,287 19,680,613The Bank's share in the associate company's gain 772,057 1,119,586Foreign currency translation adjustment 1,799,434 (3,423,912)Balance at the end of the year 19,947,778 17,376,287
On September 22, 2010 it was agreed with the Central Bank of Jordan that the Arab Jordan Investment Bank would buy a portion of the shares of Jordanian banks investing in the Jordan International Bank / London, Moreover the Bank has bought additional shares during the year 2010 so as for its share to reach 22,86%, Moreover during April 2013 the bank has increased its share percentage by buying more shares reaching a 25% share percentage.
During April 2015 Jordan International Bank / London increased its capital by GBP 10,000,000 where the bank’s share amounted to GBP 2,500,000 (equivalent to JD 2,633,225 at that time).
The Bank's right to vote on the General Assembly's decisions regarding this investment is based on the ownership percentage in the investment.
The Bank's share in the associate company's assets, liabilities, and revenues is as follows:
December 31,2017 2016
JD JDTotal assets 384,193,346 362,225,170Total liabilities 304,402,236 292,720,023Net assets 79,791,110 69,505,147The Bank's share in net assets 19,947,778 17,376,287Net income for the year 3,088,228 4,478,344The Bank’s share in net income for the year 772,057 1,119,586
The Bank's share of 25% in the assets and liabilities and net profit of Jordan International Bank / London has been calculated for the year 2017 as shown above according to the latest financial statements available on 31 December 2017.

52
12. Property and Equipment - Net This item consists of the following :
For the year-endedDecember 31, 2016
Land Buildings
EquipmentFurniture
and Fixtures
Vehicles Computers Others
Payments toAcquire
Property and Equipment
Total
JD JD JD JD JD JD JD JDCost:Balance –Beginning of the year 17,911,860 36,469,078 14,068,335 1,429,170 2,920,048 7,069,960 881,720 80,750,171Additions 18,423 2,240,348 167,456 190,750 122,233 298,536 2,489,847 5,527,593Transfers - 227,091 26,096 - 1,373 50,717 (305,277) -Disposals - - (65,632) (228,022) (84,100) - - (377,754)Balance – End of the Year 17,930,283 38,936,517 14,196,255 1,391,898 2,959,554 7,419,213 3,066,290 85,900,010Accumulated depreciation:Balance – Beginning of the year - 1,481,057 7,098,063 1,034,247 1,981,279 3,463,041 - 15,057,687Depreciation for the year - 764,745 817,396 154,890 234,563 482,306 - 2,453,900Disposals - - (65,621) (216,583) (83,890) - - (366,094)Balance – End of the year - 2,245,802 7,849,838 972,554 2,131,952 3,945,347 - 17,145,493Net property and equipment at the end of the year
17,930,283 36,690,715 6,346,417 419,344 827,602 3,473,866 3,066,290 68,754,517
For the year-ended 31 December 2016Cost:Balance – Beginning of the year 17,898,351 5,150,446 9,992,807 1,432,093 2,845,032 5,245,221 33,582,454 76,146,404Additions 226,689 233,790 264,750 92,512 163,317 50,809 5,149,454 6,181,321Transfers* - 31,381,383 4,095,182 - 1,903 1,914,820 (37,850,188) (456,900)Disposals (213,180) (296,541) (284,404) (95,435) (90,204) (140,890) - (1,120,654)Balance – End of the year 17,911,860 36,469,078 14,068,335 1,429,170 2,920,048 7,069,960 881,720 80,750,171Accumulated depreciation:Balance – Beginning of the year - 1,119,880 6,711,753 927,664 1,824,123 3,161,468 - 13,744,888Depreciation for the year - 450,425 656,050 168,669 240,818 429,238 - 1,945,200Disposals - (89,248) (269,740) (62,086) (83,662) (127,665) - (632,401)Balance – End of the year - 1,481,057 7,098,063 1,034,247 1,981,279 3,463,041 - 15,057,687Net property and equipment at the ending of the year
17,911,860 34,988,021 6,970,272 394,923 938,769 3,606,919 881,720 65,692,484
• Property and equipment consists of assets that has been fully depreciated amounting to JD 10,073,367 as of 31 December 2017 (JD 8,745,113 as of 31 December 2016).
• During the year 2016 payments to acquire property and equipment amounting JD 456,900 were reclassified to Intangible assets - note (13).

53
13. Intangible Assets – NetThis item consists of the following:
For the year ended 31 December 2017 For the year ended 31 December 2016
Goodwill *Computer’s
SoftwareTotal Goodwill
Computer’s Software
Total
JD JD JD JD JD JDBalance-Beginning of the year - 1,688,482 1,688,482 608,666 1,419,167 2,027,833Additions - 202,686 202,686 - 474,677 474,677Transfers (Note 12) - - - - 456,900 456,900Disposals* - (345,769) (345,769) (608,666) - (608,666)Amortization for the year - (614,616) (614,616) - (662,262) (662,262)Balance-End of the Year - 930,783 930,783 - 1,688,482 1,688,482
* Amortized goodwill shown above is as a result of United Arab Jordan Company for Investment and Financial Brokerage (a subsidiary) selling the Arab Advisors Company (Private Shareholding Company) during year 2016, as mentioned in note (2) in the consolidated financial statements.
14. Other AssetsThis item consists of the following:
December 31,2017 2016
JD JDEarned interest income 15,924,542 15,091,675Rent and prepaid expenses 1,416,582 1,330,122Assets seized by the bank* 18,680,902 18,064,249Stationery and printing 254,573 242,227Refundable deposits 456,363 451,281Others 1,397,310 1,088,351Total 38,130,272 36,267,905
*The following is the movement on the assets seized by the Bank:December 31,
2017 2016JD JD
Balance-Beginning of the year 18,890,249 17,404,727Additions 1,158,257 1,985,578Disposals (41,604) (500,056)
20,006,902 18,890,249Provision for assets seized by the Bank ** (1,326,000) (826,000)Balance- End of the year 18,680,902 18,064,249
**According to Central Bank of Jordan’s Law, buildings and plots of land that were foreclosed by the Bank against debts due from clients should be sold within two years from the foreclosure date, however this period could be extended for two more years, In accordance with the central bank of Jordan’s circulating number 10/1/4076 dated on 27 March 2014. The bank has recorded a provision for assets seized against debts that have been sized for more than four years as of 31 December 2017.

54
Provision for assets seized by the BankFor the year ended 31 December
2017 2016JD JD
Balance-Beginning of the year 826,000 326,000Provision during the year 500,000 500,000Balance- End of the year 1,326,000 826,000
15. Banks and Financial Institutions’ DepositsThis item consists of the following:
December 31,2017 2016
Inside the Kingdom
Outside the Kingdom
TotalInside the Kingdom
Outside the Kingdom
Total
JD JD JD JD JD JDCurrent accounts and demand deposits 62,664 3,224,354 3,287,018 668,032 2,418,302 3,086,334Time deposits due within 3 months 176,630,620 227,422,241 404,052,861 224,209,956 193,178,138 417,388,094Time deposits over 1 year 80,000,000 - 80,000,000 - - -Total 256,693,284 230,646,595 487,339,879 224,877,988 195,596,440 420,474,428
16. Customers’ DepositsThis item consists of the following:
31 December 2017
IndividualLarge
companies
Small and medium
companies
Government and Public
SectorTotal
JD JD JD JD JDCurrent accounts and demand deposits 77,693,611 106,601,631 40,409,612 23,411,946 248,116,800Saving accounts 194,270,211 3,469,308 1,067,884 9,193 198,816,596Time and notice deposits 415,497,959 73,838,216 13,076,922 101,369,168 603,782,265Total 687,461,781 183,909,155 54,554,418 124,790,307 1,050,715,66131 December 2016Current accounts and demand deposits 96,070,847 143,295,906 40,066,259 27,299,519 306,732,531Saving accounts 182,063,088 3,431,765 1,784,270 4,359 187,283,482Time and notice deposits 396,418,888 71,828,270 13,283,950 102,009,346 583,540,454Total 674,552,823 218,555,941 55,134,479 129,313,224 1,077,556,467
Deposits of the government and the general public sector inside the kingdom of Jordan amounted to JD 89,340,307 and the government deposits outside the Kingdom of Jordan JD 35,450,000 equivalent to 11.88% from the total deposits as of 31 December 2017 (JD 129,313,224 equivalent to 12% as of 31 December 2016).
Non-interest bearing deposits amounted to JD 241,292,196 equivalent to 22.96% of total deposits as of 31 December 2017 (JD 293,599,483 equivalent to 27.25% as of 31 December 2016).
Restricted deposits amounted to JD 3,097,302 equivalent to 0.30% of total deposits as of 31 December 2017 of which JD 5,128 is at Cyprus branch and JD 3,092,174 at Jordan Branches (JD 3,443,164 equivalent to 0.32% as of 31 December 2016 of which JD 12,886 is at Cyprus branch and JD 3,430,278 at Jordan branches).
Dormant deposits amounted to JD 1,460,668 as of 31 December 2017 (JD 462,314 for the previous year).

55
17. Borrowed Money from the Central Bank of JordanThis item represents borrowed money from the Central Bank of Jordan which was reborrowed for customers to fund production projects with interest rate 1.75% and maturity date on 31 March 2018.
18. Cash MarginsThis item consists of the following:
December 31,2017 2016
JD JDCash margins against direct credit facilities 46,626,294 49,412,304Cash margins against indirect credit facilities 13,066,750 13,048,270Total 59,693,044 62,460,574
19. Sundry ProvisionsThis item consists of the following:
EndingBalance
Used Duringthe Year
ProvidedDuring the Year
BeginningBalance
2017 JDJDJDJD1,736,950(276,656)236,5291,777,077Provision for end of service indemnity
127,000--127,000 Lawsuits provision60,000(80,000)60,00080,000 Other provisions
1,923,950(356,656)296,5291,984,077Total2016
1,777,077(156,148)420,0261,513,199Provision for end-of-service indemnity127,000--127,000Lawsuits provision
80,000--80,000 Other provisions1,984,077(156,148)420,0261,720,199Total
20. Income TaxA- Income Tax ProvisionThe movement on the income tax provision is as follows:
For the Year Ended December 31,2017 2016
JD JDBalance – beginning of the year 9,975,825 9,509,374Income tax paid (10,785,573) (10,440,663)Accrued income tax expense 8,595,534 10,907,114Balance – end of the year 7,785,786 9,975,825

56
B- Income tax in the statement of income represents the following: 2017 2016
JD JDAccrued Income tax expense for the year 8,595,534 10,907,114Amortization of deferred tax assets 3,774 (71,349)Total 8,599,308 10,835,765
C- Tax Situation The Bank has reached a final settlement with the Income and Sales Tax Department for all previous years up to 2014 and paid the taxes declared up to the year 2016 and there are no accrued balances due to the Department as of 31 December 2017 relating to previous years.
United Arab Jordan Company for Investment and Financial Brokerage (a subsidiary) has reached a final settlement with the Income and Sales Tax Department in Jordan up to the year 2014, In addition the company has already submitted its tax returns for the year 2016 which hasn’t been audited by the Income Tax and Sales Department yet.
A final tax settlement has been reached for the bank in Qatar up to the year 2016.
A final tax settlement has been reached for Cyprus branch up to the year 2016.
The Bank has booked a provision against any expected tax liabilities for the declared years which includes the above-mentioned years, in the opinion of the bank’s management and its tax consultant the income tax provision booked in the consolidated financial statement is sufficient to cover any future tax liabilities that may arise.
D- Deferred Tax AssetsThe details of this item are as follows:
31 December 201731 December
2017 2016Balance
Beginning ofthe Year
Amount Released
AdditionalAmounts
Balance End of
the Year
DeferredTax
DeferredTax
JD JD JD JD JD JDAccounts IncludedProvision for impairment of direct credit facilities
1,202,335 - - 1,202,335 420,817 420,817
Provision for staff end-of-service Indemnity*
1,473,148 (190,783) 180,000 1,462,365 511,829 515,603
2,675,483 (190,783) 180,000 2,664,700 932,646 936,420
* Deferred tax assets has not been calculated on the total balance of the staff’s end-of-service indemnity provision as a part of this balance relates to Arab Jordan Investment Bank – Qatar.
• The movement on deferred tax assets is as follows:For the Year Ended December 31,
2017 2016JD JD
Balance-beginning of the year 936,420 865,071Additions 63,000 126,000Released (66,774) (54,651)Balance-end of the year 932,646 936,420
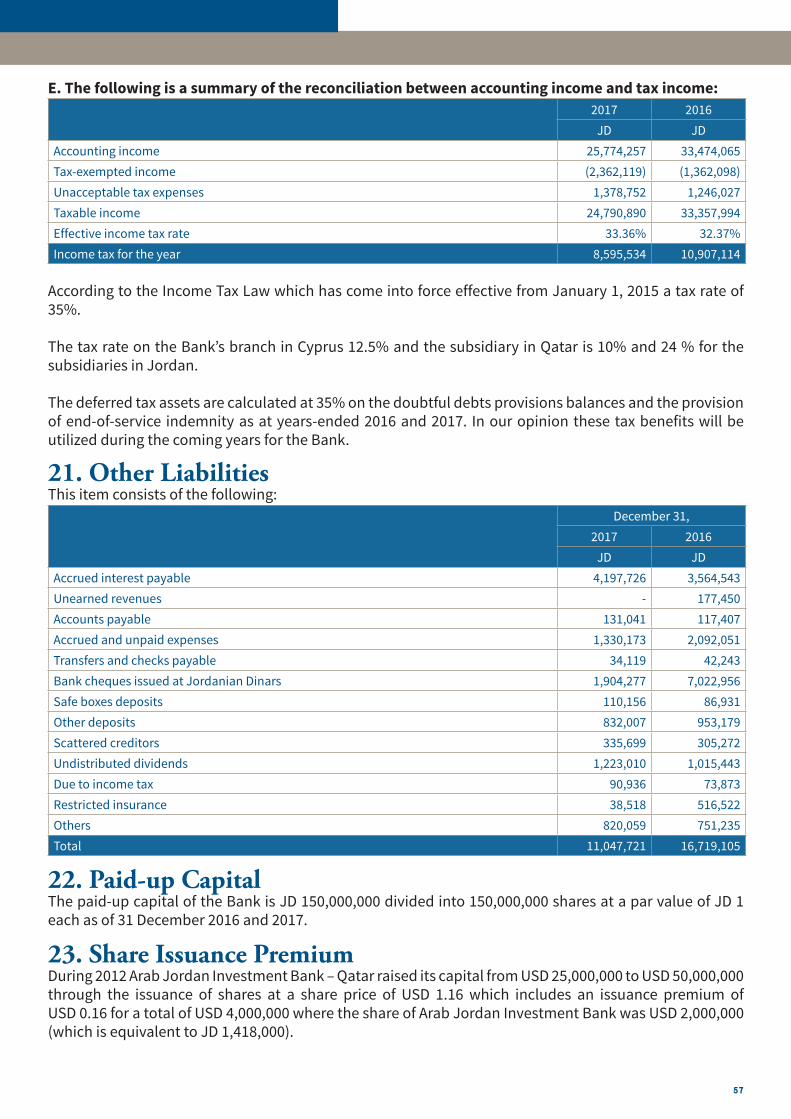
57
E. The following is a summary of the reconciliation between accounting income and tax income:2017 2016
JD JDAccounting income 25,774,257 33,474,065Tax-exempted income (2,362,119) (1,362,098)Unacceptable tax expenses 1,378,752 1,246,027Taxable income 24,790,890 33,357,994Effective income tax rate 33.36% 32.37%Income tax for the year 8,595,534 10,907,114
According to the Income Tax Law which has come into force effective from January 1, 2015 a tax rate of 35%.
The tax rate on the Bank’s branch in Cyprus 12.5% and the subsidiary in Qatar is 10% and 24 % for the subsidiaries in Jordan.
The deferred tax assets are calculated at 35% on the doubtful debts provisions balances and the provision of end-of-service indemnity as at years-ended 2016 and 2017. In our opinion these tax benefits will be utilized during the coming years for the Bank.
21. Other LiabilitiesThis item consists of the following:
December 31,2017 2016
JD JDAccrued interest payable 4,197,726 3,564,543Unearned revenues - 177,450Accounts payable 131,041 117,407Accrued and unpaid expenses 1,330,173 2,092,051Transfers and checks payable 34,119 42,243Bank cheques issued at Jordanian Dinars 1,904,277 7,022,956Safe boxes deposits 110,156 86,931Other deposits 832,007 953,179Scattered creditors 335,699 305,272Undistributed dividends 1,223,010 1,015,443Due to income tax 90,936 73,873Restricted insurance 38,518 516,522Others 820,059 751,235Total 11,047,721 16,719,105
22. Paid-up Capital The paid-up capital of the Bank is JD 150,000,000 divided into 150,000,000 shares at a par value of JD 1 each as of 31 December 2016 and 2017.
23. Share Issuance Premium During 2012 Arab Jordan Investment Bank – Qatar raised its capital from USD 25,000,000 to USD 50,000,000 through the issuance of shares at a share price of USD 1.16 which includes an issuance premium of USD 0.16 for a total of USD 4,000,000 where the share of Arab Jordan Investment Bank was USD 2,000,000 (which is equivalent to JD 1,418,000).

58
24. Reserves Statutory Reserve The amount accumulated in this account is transferred from the annual net income before tax at 10% during the year and previous years according to the Bank’s Law This reserve cannot be distributed to shareholders.
General banking risks reserve This item represents the general banking risks reserve according to the instructions of the Central Bank of Jordan.
The restricted reserves are as follows:
ReserveAmount
Nature of RestrictionJD
Statutory reserve 29,279,131 Banks and companies’ laws General banking risks reserve 5,888,551 Central Bank of Jordan’s Instructions
25. Foreign Currency Translation AdjustmentsThis represents differences resulting from the translation of the net investment in associates and foreign branches outside of Jordan upon consolidation of the financial statements of the Bank and the movement for this account is the following:
For the Year Ended December 31,2017 2016
JD JDBalance – beginning of the year (4,178,654) (754,742)Movement during the year 1,799,434 (3,423,912)Balance – End of the year (2,379,220) (4,178,654)
26. Fair Value Reserve - Net After TaxThe details of fair value reserve for financial assets at fair value through other comprehensive income are as follows:
For the Year Ended December 31,2017 2016
JD JDBalance - beginning of the year (1,429,227) (1,017,821)Unrealized losses (246,847) (526,833)Realized gains transferred to the retained earnings 2,262 115,427Balance – end of the year (1,673,812) (1,429,227)

59
27. Retained EarningsThe movement on retained earnings account as the following:
For the Year Ended December 31,2017 2016
JD JDBalance - beginning of the year 20,603,714 20,747,416Income for the year 15,984,051 21,006,184Gain from sale of financial assets through consolidated comprehensive income statement 1,960 (125,438)Transferred to reserves (2,421,421) (3,052,573)Effect of the sale of a subsidiary company - 28,125Distributed dividends (18,000,000) (18,000,000)Balance – end of the year 16,168,304 20,603,714
Retained earnings include an amount of JD 932,646 as of 31 December 2017 (JD 936,420 as of 31 December 2016) restricted against deferred tax assets.
28. Proposed Dividends to the General AssemblyThe Board of Directors recommended the distribution of 9% of capital as cash dividends to the shareholders equivalent to JD 13,500,000 subject to the approval of the General Assembly ofShareholders (during the year 2017 the Bank distributed 12% of capital as cash dividends toshareholders equivalent to JD 18,000,000 for the year 2016).
29. Non - Controlling InterestThis item represents other shareholders' interest of 50% (minus two shares) as of 31 December 2017 from the net shareholders' equity of Arab Jordan Investment Bank in Qatar (subsidiary company).
30. Interest IncomeThis item consists of the following:
20162017JDJD
Direct Credit Facilities: Individual (retail):
4,658,3574,955,098Loans 2,204,5651,546,168Credit cards 4,771,8065,742,428Real-estate loans
Large companies8,558,18512,139,263Loans 6,369,5575,727,255Overdraft Accounts
Small and medium companies3,853,5794,562,701Loans 3,815,6292,245,767Overdraft accounts9,423,5549,898,789Government and public sector
361,151104,315Balances at the Central Bank of Jordan 2,684,6893,020,250Balances and deposits at banks and financial institutions
31,438,55130,865,657Financial assets at amortized cost78,139,62380,807,691Total

60
31. Interest ExpenseThis item consists of the following:
2017 2016JD JD
Deposits from banks and financial institutions 11,397,743 6,008,986Customers’ deposits:Current accounts and demand deposits 2,157,282 1,422,404Saving accounts 1,337,707 1,145,442Time and notice deposits 18,342,256 16,596,511Cash margins 1,090,942 1,173,905Deposits insurance fees 1,487,721 1,488,363Total 35,813,651 27,835,611
32. Commissions Income – NetThis item consists of the following:
2017 2016JD JD
Commissions Income:Direct credit facilities 1,621,559 1,730,297Indirect credit facilities 8,100,149 7,620,970Less: Commission expense (1,252,845) (1,289,638)Net commissions income 8,468,863 8,061,629
33. Foreign Currencies IncomeThis item consists of the following:
20162017JDJD
3,733,4213,449,504 Resulting from trading171,599136,658 Resulting from revaluation
3,905,0203,586,162 Total
34. (Losses) from Financial Assets at Fair Value Through Profit or LossThe details of gains on financial assets of fair value through profit and loss in accordance with IFRS (9) are as follows:
For the Year Ended December 31, 2017
Realized Gains/
(Losses)
Unrealized (Losses)
Total
JD JD JDCompanies’ shares 11,318 (19,242) (7,924)Total 11,318 (19,242) (7,924)For the Year Ended December 31, 2016Companies’ shares (104,059) (41,036) (145,095)Total (104,059) (41,036) (145,095)

61
35. Cash Dividends on Financial Assets at Fair Value through Comprehensive Income This item consists of the following:
2017 2016JD JD
Local companies dividends 309,634 344,109Foreign companies dividends 74,010 92,513Total 383,644 436,622
36. Other Income This item consists of the following:
2017 2016JD JD
Income from sale of property and equipment 27,147 628,402Gains (losses) from sales of seized property 7,946 (3,856)Returns from managed portfolios 130,754 112,486Commission of salary transfer 53,404 55,671Returns from shares trading on behalf of customers 28,698 60,896Recorded revenues from pervious provisions 80,000 -Recovered revenues from bad debts 840,761 3,492,298Revenues from subsidiaries 13,178 6,518Revenues from credit cards sponsorship 447,516 52,724Other revenues 87,678 112,984Total 1,717,082 4,518,123
37. Employees ExpensesThis item consists of the following:
2017 2016JD JD
Salaries, bonuses and employees benefits 13,535,039 14,057,152Bank’s contribution in social security 1,432,462 1,401,194Bank’s contribution in provident fund 478,431 466,212Employees' life insurance 178,760 181,000Medical expenses 701,522 670,354Staff training 55,559 45,765Travel expenses 265,365 251,470Other 93,057 65,673Total 16,740,195 17,138,820

62
38. Other ExpensesThis item consists of the following:
2017 2016JD JD
Rent 2,168,715 2,470,560Stationery and printing 299,763 467,010Subscriptions 763,095 681,233Legal and audit fees 233,821 257,844Telephone, telex and postage 882,421 1,049,485Insurance expenses 167,556 191,145Maintenance and repair 657,982 587,514General services 1,815,660 1,564,135Swift services 145,379 144,393Security 295,437 298,716Donations 108,183 134,002Board of directors remunerations 55,000 55,000Board of directors expenses 743,874 235,709Foreign currency trading fees 188,549 149,298Registration and governmental fees 99,021 77,445Mortgage and insurance fees 334,844 447,498Consultations 266,395 264,667Automated clearing (offset) expenses 17,500 7,524Property tax fees 203,013 45,081Marketing and advertising expenses 259,741 258,438Computers and ATM expenses 971,699 766,358Other expenses 1,048,612 1,243,433Total 11,726,260 11,396,488
39. Earnings per Share (Bank’s Shareholders) This item consists of the following:
2017 2016JD JD
Income for the year 15,984,051 21,006,184Weighted average number of shares 150,000,000 150,000,000Earnings per share (Bank shareholders) basis and Diluted 0.107 0.140
40. Cash and Cash Equivalents This item consists of the following:
December 31,2017 2016
JD JDCash and balances at the Central Bank of Jordan Maturing within 3 months 70,179,969 73,679,105Add: Balances at banks and other financial Institutions maturing within 3 months 254,895,109 224,106,568Less: Deposits from banks and financial Institutions maturing within 3 months (407,339,879) (420,474,428)Total (82,264,801) (122,688,755)

63
41. Related Parties Transactions The Consolidated Financial Statements includes the financial statements of the Bank and its subsidiaries include the following:
Company’s NameOwnership Percentage
Company’s Capital2017 2016
JD JDUnited Arab Jordan Company for Investment and Financial Brokerage 100% 2,500,000 2,500,000Arab Jordan Investment Bank /Qatar LLC 50% + two shares 35,450,000 35,450,000
The Bank has entered into transactions with members of the Board of Directors and Executive Management within the normal course of its activities at the commercial interest rates and commissions.
The following is a summary of the transactions with related parties during the year:
Related party Total
SubsidiaryCompany
Board of Directors
Members and Management
Executives
AssociateBank
Other*
December 31,
2017 2016
JD JD JD JD JD JDStatement of Financial Position Items:Total Deposits for related parties 26,666,873 106,479,621 17,962,038 6,811,177 157,919,709 125,939,810Total Bank Deposits with related parties
15,634,615 - 23,797,848 - 39,432,463 63,687,447
Loans and credit facilities granted to related parties
- 331,675 - 2,363,300 2,694,975 2,507,859
Off-Statement of Financial Position Items:Letter of Credit and Guarantee 17,098,081 - - - 17,098,081 160,000Managed Accounts 9,237,422 - - - 9,237,422 12,111,266Statement of Income Items:Credit interest and commission 119,952 19,693 150,671 158,360 448,676 346,217Debit interest and commission 1,302,219 2,665,352 335,229 405,390 4,708,190 4,602,725
* This item represents employees' deposits and facilities for other than Board of Directors and the executive management.• Balances transactions revenues and expenses between the Bank and the subsidiaries are eliminated.• The interest rate received on amounts granted as facilities to related parties reached 4% annually which
the interest rate paid reached 7.25% annually.• All credit facilities granted to related parties are performing and consequently no related provisions
have been booked.The following is a summary of the benefits (salaries and remunerations plus other benefits) of the executive management of the Bank:
For the Year Ended December 31,2017 2016
JD JDSalaries, remunerations and other benefits 1,875,572 2,030,263Travel and transportation 31,837 21,150Total 1,907,409 2,051,413

64
42. Risk Management First: Qualitative Disclosures:Risk is an integral part of the Bank's operations, The general framework of the Risk Management Department in the bank is to identify understand and evaluate risks associated with the Bank's operations, The Department also ensures that risk is maintained within approved and accepted limits and that the necessary measures are taken to reduce risk and attain a balance between risks and rewards.
The Risk Department's policies are developed in order to identify analyze control and place caps on risk, Moreover risk is also monitored through the Bank's risk database system.
The Bank periodically reviews the policies and procedures associated with the Risk Department in order to incorporate new market developments and practices best suited to the Bank's operations.
The Risk Management Department in the Bank is responsible for managing risk through close alignment of the policies and procedures authorized by the Bank's Board of Directors, Furthermore the Risk Committee which is emerged from the Board of Directors reviews the said department's activities and continually issues reports to the Board of Directors disclosing whether the risk is maintained according to the Bank's policies and approved and accepted risk levels.
The Assets and Liabilities Management Committee and Investment Committee also partake in risk management within the Bank. In addition all of the Bank's work centers are responsible for identifying the risks associated with their activities, They also set the necessary and appropriate risk controls; the most important risks are credit risk liquidity risk operation risk and market risk which also includes interest rate risk and currency risk.
Credit RiskCredit risk arises from the probable default or inability of the borrower or third party to fulfil its obligations to the Bank Moreover, this risk is one of the most important risks the Bank faces during the conduct of its activities, Therefore the Bank manages credit risk continuously this risk relates to items such as loans bonds and activity investments in debt instruments in addition to credit risk related to off- statement of financial position items such as unutilized loans guarantees and documentary credits.
Measurement of Credit Risk:1. Debt InstrumentsThe external rating issued by the International Rating Institutions such as (Standard and Poor) and (Moody’s) or the like is used in managing exposure to credit risk relating to debt instruments, This rating is within specific categories and as instructed by the regulatory authorities in the countries where the bank has its branches or subsidiaries.
2. Control on Risk Ceilings and Credit Risk Mitigation PoliciesThe Bank manages credit ceilings and controls the credit concentrations risks on the customers’ levels (individual or corporate) in addition to managing and controlling the exposure to credit risk for each sector or geographical area.
The Bank determines the accepted credit risk levels through installing ceilings for the acceptable risks relating to one borrower or a group of borrowers and for each sector or geographical area.
These risks are continuously controlled and are subject to annual / periodic reviews in addition to controlling the actual exposure against the risk ceilings daily.

65
Credit Risk Mitigation MethodsThe Bank adopts several methods and practices to mitigate credit risk such as obtaining guarantees according to acceptable standards.
The most prevalent guarantees against loans and credit facilities are the following: • Real estate mortgages• Mortgages of financial instruments such as shares• Bank guarantees• Cash Collaterals• Government guarantees.
Moreover the Bank adopts the following methods to improve the quality of credit and mitigate risks:
• A system of three approvals for granting a credit• Credit approval authority that varies from one management level to another depending on the volume
of the customer's portfolio extent of exposure maturity and customer's risk degree.• Complete segregation between credit management departments (business) credit control and analysis
departments.
Second: Quantitative Disclosures: (42/A) Credit Risk1. Exposure to credit risk (after impairment provisions and suspended interest and before collateral held or other mitigation factors):
December 31,20162017
JDJDOn- Statement of Financial Position
58,340,65051,725,082Cash and balances at Central Bank of Jordan224,106,568254,895,109Balances at banks and financial institutions
27,312,11416,535,460Deposits at banks and financial InstitutionsCredit Facilities:
100,998,04099,143,847Individual 95,098,54988,908,278Real-estate loans
328,759,260328,493,955Large companies38,613,87735,746,706Small and medium companies
189,737,076202,870,110Government & public sectorBonds and Treasury Bills:
594,028,333597,569,867Within financial assets at amortized Cost15,091,67515,924,542Other assets
1,672,086,1421,691,812,956 Total Off- Statement of Financial Position Items
86,865,73376,650,460Letters of guarantee27,463,11532,893,879Letters of credit 27,466,18855,273,927Acceptances 35,056,51948,350,039Un-utilized facilities
176,851,555213,168,3051,848,937,6971,904,981,261 Total

66
The Bank obtains cash and in-kind collaterals representing real estates and shares to mitigate credit risks to which the Bank might be exposed.
The above schedule represents the Bank's maximum exposure to credit risk as of 31 December 2017 and 2016 without taking into consideration guarantees and other credit risk mitigation factors.
As for on-consolidated statement of financial position assets the above exposure is based on the balance shown in the consolidated statement of financial position.
2. Credit exposure is distributed according to the degree of risk as follows:
Total
Banks and Other Financial
Institutions
Government and Public
Sector
Small and Medium
Companies
Large Companies
Real-Estate Loans
Individual
December 31, 2017 JDJDJDJDJDJDJD824,905,103-799,273,268717,54613,572,2312,987,7548,354,304Low grade 844,146,586281,713,97332,118,84420,852,296331,989,23285,855,42391,616,818Standard grade
From which past due:42,130----16,31725,813Up to 30 days 12,841--12,841---From 31 to 60 days
20,490,479--13,462,547-4,883,9572,143,975Watch list Non performing:
1,662,875----1,046,598616,277Substandard4,228,324--2,213,478-853,1721,161,674Doubtful
10,329,641--5,826,200-3,139,7221,363,719written - off 1,705,763,008281,713,973831,392,11243,072,067345,561,46398,766,626105,256,767Total
2,856,190--1,609,214-910,490336,486Deduct: interest in suspense 11,093,862--5,716,1471,064,0001,759,8652,553,850Allowance for Impairment losses
1,691,812,956281,713,973831,392,11235,746,706344,497,46396,096,271102,366,431Net
Total
Banks and Other Financial
Institutions
Government and Public
Sector
Small and Medium
Companies
LargeCompanies
Real-EstateLoans
Individual
December 31, 2016 JDJDJDJDJDJDJD814,472,881-782,007,065443,4814,959,1483,317,46523,745,722Low grade 838,432,029263,033,81333,629,84427,475,897339,082,60896,427,70978,782,158Standard grade
-------From which past due:125,130----33,61791,513Up to 30 days
19,857--12,694--7,163From 31 to 60 days17,332,891--10,743,748-4,730,1381,859,005Watch list
Non performing: 874,436--1,396-281,039592,001Substandard
1,707,781--143,331-604,527959,923Doubtful11,513,178--5,657,390-4,731,6501,124,138written - off
1,684,333,196263,033,813815,636,90944,465,243344,041,756110,092,528107,062,947Total 2,010,772--1,007,637-749,639253,496Deduct: interest in suspense
10,236,282--4,843,7291,064,0002,058,3762,270,177Allowance for Impairment losses1,672,086,142263,033,813815,636,90938,613,877342,977,756107,284,513104,539,274Net

67
* Exposures include credit facilities balances and deposits with banks and Treasury bonds and any assets of its credit exposures.
* The full balance of the debt owed in the event of a single maturity premiums or benefits and the overdraft is considered payable if it exceeds the ceiling.
3. The following table breaks down the fair value of the collaterals held as security for credit facilities:
Total
Government and Public
Sector
Small and Medium
Companies
LargeCompanies
Real-estateLoans
Individual
December 31, 2017 JDJDJDJDJDJD202,561,148176,929,313717,54613,572,2312,987,7548,354,304Low grade418,357,14325,940,79717,647,354243,362,45560,802,85070,603,687Standard grade
12,079,283-7,207,224-4,836,25135,808Watch list Non- performing:
1,038,244---1,038,244-Substandard grade 2,700,359-1,867,640-832,719-Doubtful 9,185,812-5,159,352-2,862,0451,164,415Written - off
645,921,989202,870,11032,599,116256,934,68673,359,86380,158,214Total As:
23,108,322-717,54613,572,231464,2418,354,304Cash margins 205,393,623202,870,110--2,523,513-Governmental guarantees388,694,552-31,881,570220,400,55670,372,10966,040,317Real estate
27,334,112--22,961,899-4,372,213Listed shares1,391,380----1,391,380Vehicles and Equipment
December 31, 2016192,918,987160,453,171443,4814,959,1483,317,46523,745,722Low grade428,918,28129,283,90522,719,201251,054,86166,044,84859,815,466Standard grade
10,009,376-5,184,914-4,716,102108,360Watch list Non- performing:
214,207---214,207-Substandard grade 718,565-112,513-604,5271,525Doubtful
8,513,431-4,293,919-4,211,9227,590Written - off 641,292,847189,737,07632,754,028256,014,00979,109,07183,678,663Total
As: 28,591,864 - 443,4814,959,148507,01322,682,222Cash margins
192,547,528189,737,076--2,810,452-Governmental guarantees1,063,500 - ---1,063,500Accepted bank guarantees
418,543,030 - 32,310,547251,054,86175,791,60659,386,016Real estate496,157 - ---496,157Listed shares
50,768 - ---50,768Vehicles and Equipment

68
Rescheduled loans These represent loans classified previously as non-performing and reclassified as performing but taken out therefrom according to proper scheduling and classified as watch list loans they amounted to JD 3,257,131 for the current year (JD 3,951,712 for the previous year).
The balance of the rescheduled loans represents the loans which were rescheduled either still classified as watch list or transferred to performing.
Restructured loansRestructuring means to rearrange facilities instalments or by increasing their duration postpone some instalments or increase the grace period…etc. They are classified as a watch-list debt and it amounted to JD 5,233,770 for the current year (JD 39,282,482 for the previous year-end).
4. Bills bonds and debenturesThe table below shows the classification of bills bonds and debentures according to external rating agencies:
Included in Assets at Amortized CostRating AgencyRisk Rating Class 550,387,267Moody’sGovernment guaranteed bonds
11,134,350Moody’sGovernment guaranteed bonds B12,156,310Moody’sForeign governmental bonds Aa3
690,550Moody’sForeign governmental bonds BBB -1,755,375Moody’sForeign governmental bonds B1
714,445Moody’sForeign governmental bonds Ba1710,201Moody’sForeign governmental bonds Baa3714,356Moody’sCompanies Bond A711,619Moody’sCompanies Bond A1713,137Moody’sCompanies Bond A2
1,439,996Moody’sCompanies Bond A35,701,226Moody’sCompanies Bond Ba1
715,016Moody’sCompanies Bond Ba2716,922Moody’sCompanies Bond Ba3874,845Moody’sCompanies Bond Baa1
6,066,143Moody’sCompanies Bond Baa31,418,000Moody’sCompanies Bond Caa1
10,950,109Moody’sCompanies Bond without classification597,569,867Total

69
5. The schedule below show
s the geographical distribution of the credit risk exposure:
Total Other
CountriesAm
erica Africa *
Asia *Europe
Other Middle
East Countries Inside the Kingdom
JDJD
JDJD
JDJD
JDJD
51,725,082-
--
--
-51,725,082
Balance at Central Bank of Jordan254,895,109
427,47133,749,162
488,313658,283
23,794,571169,950,508
25,826,801Balances at banks and financial institutions
16,535,460-
--
-16,535,460
--
Deposits at banks and financial institutionsCredit facilities-net:
99,143,847-
--
-3,322,077
12,083,72383,738,047
Individual 88,908,278
--
--
-7,195,574
81,712,704Property loans
328,493,955-
--
--
26,656,432301,837,523
Large companies
35,746,706-
--
-487,424
-35,259,282
Small and m
edium com
panies (SMEs)
202,870,110-
--
--
-202,870,110
Government and public sector
Bonds debentures and bills: 597,569,867
-7,467,060
2,445,9251,421,820
7,314,4707,177,198
571,743,394Financial assets at am
ortized cost 15,924,542
-139,113
86,11713,662
289,938535,119
14,860,593Other assets
1,691,812,956427,471
41,355,3353,020,355
2,093,76551,743,940
223,598,5541,369,573,536
Total / Current year1,672,086,142
255,14322,774,259
943,0491,526,927
64,309,084191,609,602
1,390,668,078Total / Com
parative figures
* Excluding Middle East countries.
6. The schedule below show
s the credit risk exposure according to economic activities:
TotalGovernm
ent and public
sectorIndividual
(retail)Shares
AgricultureReal-estate
TradeIndustrial
Finance
Economic Sector
JDJD
JDJD
JDJD
JDJD
JD51,725,082
51,725,082-
--
--
--
Balances at Central Bank of Jordan254,895,109
--
--
--
-254,895,109
Balances at banks and financial institutions16,535,460
--
--
--
-16,535,460
Deposits at banks and financial institutions755,162,896
202,870,11099,143,847
789,248-
88,908,278198,433,580
149,532,95415,484,879
Credit facilitiesBonds debentures and bills:
597,569,867567,548,498
--
-7,000,000
2,869,07310,677,314
9,474,982Financial assets at am
ortized cost 15,924,542
9,248,4223,222,584
1,265-
187,9931,444,300
900,756919,222
Other assets 1,691,812,956
831,392,112102,366,431
790,513-
96,096,271202,746,953
161,111,024297,309,652
Total / Current year1,672,086,142
815,636,909104,539,274
3,393,0743,859,428
107,284,513208,173,379
156,976,272272,223,293
Total / Comparative figures

70
42/B Market Risks: Market risk is the risk of the fluctuation in the fair value or cash flows of financial instruments due to changes in market prices such as interest rates currency rates and stock prices The risks subject to this requirement are foreign currency risk price risk and commodity risk Market risks arise due to open positions for interest rate foreign currency exchange rate investment rate and share prices These risks are controlled according to predetermined policies and procedures and through specialized committees and work centers. Sensitivity analysis is based on estimating the loss risk in fair value due to changes in interest rate and exchange rate Moreover fair value is calculated according to the current value of future cash flows that will be affected by price changes.
Interest Rate Risks:Interest rate risk arises from the probable impact of changes in interest rates on the value of other financial assets The Bank is exposed to the risk of interest rates due to a mismatch or a gap in the amounts of assets and liabilities according to the various time limits or review of interest rates in a certain period Moreover the Bank manages these risks through reviewing the interest rates on assets and liabilities based on the risk management strategy The Bank will study all the factors that have an effect on the interest rates whether they are local regional or global in addition to studying the interest rate gap and their future expectations to determine the degree of risk in the short and long term so as to be able to put a suitable future plan and make the right decisions such as amending the maturity date and repricing the deposits and loans and the purchase and sale of the financial investments
1. Interest Rate RiskSensitivity Analysis 2017
Sensitivity of shareholders'equity
Sensitivity of interest revenue profit and (loss)Change (increase) in interest
rate (%) Currency
JDJD-676,9631 US Dollar-225,7161Euro-(40,756)1British Pound-(3)1Japanese Yen-144,7201Others
Sensitivity of Shareholders’Equity
Sensitivity of Interest Revenue profit and (loss)Change (decrease) in Interest
Rate%Currency
JDJD-(676,963)1 US Dollar-(225,716)1Euro-40,7561British Pound-31Japanese Yen-(144,720)1Others

71
Sensitivity Analysis 2016 Sensitivity of Shareholders’
EquitySensitivity of Interest
Revenue profit and (loss)Change (increase) in Interest Rate%
CurrencyJDJD-692,2981 US Dollar-(101,691)1Euro-(63,351)1British Pound-(666)1Japanese Yen-97,2131Others
Sensitivity of Shareholders’Equity
Sensitivity of Interest Revenue profit and (loss)Change (increase) in Interest
Rate%Currency
JDJD-(692,298)1 US Dollar-101,6911Euro-63,3511British Pound-6661Japanese Yen-(97,213)1Others
2. Foreign Currencies RiskThis is the risk that results from the changes in foreign exchange rates with potential impact on the Bank's assets and liabilities in foreign currencies The Bank prepares a sensitivity analysis to monitor the changes in exchange rates at (± 5%) of net profits and losses.
Sensitivity Analysis 2017
Currency Change in Currency Exchange Rate (%)
Effect on Profits and LossesSensitivity of Shareholders’
EquityJD JD
Euro 5 814 -British Pound 5 38,603 958,786Japanese Yen 5 142 -Other currencies 5 171,990 -
Sensitivity Analysis 2016
Currency Change in Currency Exchange rate (%)
Effect on Profits and LossesSensitivity of Shareholders’
EquityJD JD
Euro 5 (7,482) -British Pound 5 55,979 812,835Japanese Yen 5 (134) -Other currencies 5 54,407 -
• In case the decrease in the currency exchange rate amounts to 5% the same financial effect will result with an opposite sign.

72
3. Shares Prices RisksIs the risk arising from changes in the prices of stocks within the portfolio of financial assets at fair value through the statement of income and comprehensive income The Bank manages the risks of stock prices by analyzing value at losses.
Sensitivity Analysis 2017
IndicatorChange in
Equity Prices (%)Effect on Profit and Losses Effect on Shareholders
JD JDAmman Stock Exchange 5 8,470 637,362Qatar Stock Exchange 5 - 31,870
Sensitivity Analysis 2016
IndicatorChange in
Equity Prices (%)Effect on Profit and Losses Effect on Shareholders
JD JDAmman Stock Exchange 5 11,188 638,030Qatar Stock Exchange 5 - 51,113
• If the stock exchanges indicator decreases by the same percentage the same financial effect will arise but with an opposite sign.

73
4. Interest rate sensitivity gapClassification is done according to interest re-pricing or m
aturity whichever is closer
December 31, 2017
Less than 1 Month
From
1 to 3 MonthsFrom
3 to 6 Months
From
6 Months to 1 Year
From
1 to 3 YearsOver 3 Years
Non - interest Bearing Item
sTotal
JDJD
JDJD
JDJD
JDJD
AssetsCash and balances at central Banks of Jordan
70,179,969-
--
--
-70,179,969
Balances at banks and financial institutions-
197,335,846-
--
-57,559,263
254,895,109Deposits at banks and financial institutions
--
5,511,34811,024,112
--
-16,535,460
Financial assets at amortized costs
-5,000,000
23,715,15023,003,900
262,780,379283,070,438
-597,569,867
Financial assets at fair value through profit or loss -
--
--
-169,390
169,390Direct credit facilities – Net
132,751,83061,667,726
78,564,31755,758,686
194,963,001231,457,336
-755,162,896
Financial assets at fair value through other comprehensive incom
e-
--
--
-14,817,140
14,817,140Investm
ents in associate company
--
--
--
19,947,77819,947,778
Property and equipment – Net
--
--
--
68,754,51768,754,517
Intangible assets – Net-
--
--
930,783930,783
Deferred tax assets-
--
--
-932,646
932,646Other assets
--
--
--
38,130,27238,130,272
Total assets202,931,799
264,003,572107,790,815
89,786,698457,743,380
514,527,774201,241,789
1,838,025,827LiabilitiesBanks and financial institution deposits
3,287,018404,052,861
--
80,000,000-
-487,339,879
Customers' deposits
481,737,157197,774,633
63,354,67264,189,963
2,325,60341,437
241,292,1961,050,715,661
Borrowed funds from the central bank of Jordan
-161,422
--
--
-161,422
Cash collaterals25,768,100
9,659,6964,946,611
8,923,183101,629
53,31810,240,507
59,693,044Sundry provisions
--
--
--
1,923,9501,923,950
Income tax provisions
--
--
--
7,785,7867,785,786
Other liabilities -
--
--
-11,047,721
11,047,721 Total Liabilities
510,792,275611,648,612
68,301,28373,113,146
82,427,23294,755
272,290,1601,618,667,463
Interest Rate Sensitivity Gap(307,860,476)
(347,645,040)39,489,532
16,673,552375,316,148
514,433,019(71,048,371)
219,358,364Decem
ber 31, 2016Total Assets
165,981,411235,997,779
121,106,425117,470,857
428,844,512483,127,332
257,056,4401,809,584,756
Total Liabilities385,472,717
672,778,520126,698,255
79,194,9461,194,537
30,205323,801,296
1,589,170,476Interest Rate Sensitivity Gap
(219,491,306)(436,780,741)
(5,591,830)38,275,911
427,649,975483,097,127
(66,744,856)220,414,280

74
5. Foreign Currency Sensitivity Gap:
December 31, 2017
USD EuroSterlingPounds
JapaneseYen
Others Total
JD JD JD JD JD JDAssets Cash and balances at Central Banks of Jordan
27,545,683 1,193,859 841,758 5,744 540,549 30,127,593
Balances and deposits at banks and financial institutions
177,636,282 56,020,997 22,766,503 23,666 14,838,557 271,286,005
Direct credit facilities 191,146,915 4,936,317 12 - 50,323,622 246,406,866Financial securities at amortized cost 134,425,710 7,995,266 - - - 142,420,976Assets through Comprehensive Income
35,672 - - - 637,408 673,080
Investments in associate company - - 19,947,778 - - 19,947,778Property and equipment - net 1,834,106 - - - - 1,834,106Other assets 35,318,032 638,566 52,839 - (8,248,186) 27,761,251Total Assets 567,942,400 70,785,005 43,608,890 29,410 58,091,950 740,457,655LiabilitiesBanks and financial institutions deposits
199,459,787 31,097,610 403,523 - 4,989,976 235,950,896
Customers' deposits 350,008,180 39,076,431 22,995,641 26,486 41,391,011 453,497,749Cash margins 6,836,836 422,846 205,626 - 8,040,347 15,505,655Sundry provisions 274,585 - - - - 274,585Deferred tax liabilities 241,013 - - - - 241,013Other liabilities 2,027,198 171,845 26,095 79 342,550 2,567,767Retained earnings 19,955 - - - - 19,955Banking risks reserves 495,531 - - - - 495,531Cumulative change in fair value - - - - (111,724) (111,724)Share Issuance Premium 1,418,000 - - - - 1,418,000Non - Controlling Interest 20,657,410 - - - - 20,657,410Total Liabilities 581,438,495 70,768,732 23,630,885 26,565 54,652,160 730,516,837Net concentration on - balance sheet for the current year
(13,496,095) 16,273 19,978,005 2,845 3,439,790 9,940,818
Contingent liabilities off - balance sheet for the current year
134,343,314 19,512,416 197,903 1,785,980 21,384,668 177,224,281
December 31, 2016Total Assets 523,255,107 56,829,148 40,962,859 91,543 68,777,335 689,915,992Total Liabilities 536,171,806 56,978,795 23,556,313 94,230 67,689,190 684,490,334Net concentration on - balance sheet for the current year
(12,916,699) (149,647) 17,406,546 (2,687) 1,088,145 5,425,658
Contingent liabilities off - balance sheet for the current year
83,620,930 11,923,178 833,630 - 16,061,979 112,439,717

75
(42/C) Liquidity RiskLiquidity risk is defined as the Bank’s inability to provide the necessary funding to cover its obligations at the due date, Liquidity risk is managed through the following:
• Funding requirements are managed through daily oversight of future cash flows to ensure the possibility of meeting them and the Bank maintains a presence in the market of cash that allows the bank to achieve it.
• Holding highly marketable assets that can be easily liquidated to meet any unexpected liquidity requirements.
• Monitoring the liquidity ratios according to the internal requirements and the requirements of the regulatory authorities.
• Managing concentrations in assets / liabilities and their maturities.
• Maintaining a portion of customers’ deposits as a cash reserve at the Central Bank of Jordan; this reserve cannot be disposed of except for certain conditions as specified by the Central Bank of Jordan.
Liquidity is measured on the basis of normal and emergency conditions, this includes analyzing the remaining period of the contractual maturity and financial assets on the basis of the expected recoverability.
The treasurer is in charge of controlling the liquidity of the Bank taking into consideration loans and any related commitments letters of credit and guarantees.
Sources of FundsThe Bank diversifies its funding sources according to geographical areas currencies customers and products in order to achieve financial flexibility and reduce funding costs, It also endeavors to maintain stable and reliable funding sources, Moreover the Bank has a large customer base including individual customers companies and corporations.

76
1. The table below sum
marizes the distribution of liabilities (not discounted) on the basis of the rem
ainder of the contractual maturity at the date of
the financial statements:
TotalW
ithout M
aturityOver 3 Years
From
1 To 3Years
From6 m
onths to 1 Year
From 3 to 6
Months
1 to 3 M
onthsLess than 1
Month
December 31, 2017
JDJD
JDJD
JDJD
JDJD
Liabilities493,999,635
--
86,481,630-
-404,128,259
3,389,746Banks’ and financial institution’s Deposits
1,054,392,791241,292,196
41,4372,330,887
65,760,98364,131,948
198,754,972482,080,368
Customers’ Deposits
163,834-
--
--
163,834-
Borrowed funds from
the central bank of Jordan59,915,438
10,240,50753,318
109,1999,080,144
4,963,7429,670,327
25,798,201Cash m
argins1,923,950
1,923,950-
--
--
-M
iscellaneous provisions7,785,786
7,785,786-
--
--
-Incom
e tax provision11,047,721
11,047,721-
--
--
-Other liabilities
1,629,229,155272,290,160
94,75588,921,716
74,841,12769,095,690
612,717,392511,268,315
Total 1,838,025,827
201,241,789245,014,327
211,744,39166,782,798
84,785,536264,003,572
764,453,414Total Assets (according to expected m
aturities)
TotalW
ithout M
aturityOver 3 Years
From1 To 3Years
From6 m
onths to 1 Year
From 3 to 6
Months
1 to 3 M
onthsLess than 1
Month
December 31, 2016
JDJD
JDJD
JDJD
JDJD
Liabilities420,581,526
--
--
-417,491,651
3,089,875Banks’ and financial institution’s deposits
1,079,884,987293,599,483
11,6921,158,966
68,218,306114,245,989
247,954,038354,696,513
Customers’ deposits
62,661,20510,385,469
23,289155,127
11,668,4496,652,935
7,997,19725,778,739
Cash margins
1,984,0771,984,077
--
--
--
Miscellaneous provisions
9,975,8251,113,162
--
-6,587,278
-2,275,385
Income tax provision
16,719,10516,719,105
--
--
--
Other liabilities1,591,806,725
323,801,29634,981
1,314,09379,886,755
127,486,202673,442,886
385,840,512Total
1,809,584,756257,056,440
219,245,813187,067,631
87,126,067101,938,086
235,997,779721,152,940
Total Assets (according to expected maturities)

77
2. The following table summarizes forward currency contracts based on the remaining period to the contractual maturity date on the date of the financial statements:
TotalOver 3 Years1 to 3Years
6 Months to 1 Year
3 to 6 Months
1 to 3 Months
Up to 1 Month
December 31, 2017 JDJDJDJDJDJDJD Forward currencycontracts
-------Outflows-------Inflows
December 31, 2016 Forward currencycontracts
10,614,113---1,397,113-9,217,000Outflows10,614,113---1,397,113-9,217,000Inflows
3. Off- the statement of financial position items:
TotalOver 5 YearsMore than 1 to
5 YearsUp to 1 Year
JDJDJDJD2017
87,476,221--87,476,221 Letters of credit and acceptances / issued48,350,039--48,350,039 Un-utilized facilities76,650,46023,00019,148,99957,478,461Letters of guarantee
212,476,72023,00019,148,999193,304,721Total2016
54,173,064--54,173,064 Letters of credit and acceptances / issued35,056,519--35,056,519 Un-utilized facilities86,865,73376,74527,901,83258,887,156Letters of guarantee
176,095,31676,74527,901,832148,116,739Total
43. Segment AnalysisA. Information about the Bank's Business SegmentsThe Bank is organized for administrative purposes so that the segments are measured according to the reports that are used by the Executive Director and the main decision-maker at the bank through the following main business segments:
Individual accounts: include following up on individual customers accounts real estate loans overdrafts credit cards facilities and transfer facilities.
Corporate accounts: include corporate transactions on loans credit facilities and deposits.
Treasury: principally providing money market trading and treasury services as well as management of the Bank's funding operations through treasury bills Government securities placements and acceptances with other banks and that is through treasury and banking services.

78
1-The Following represents information about the bank’s sector activities:
Individual Corporate Treasury Others
TotalFor the Year Ended
December 312017 2016
JDIn Thousands
JDIn Thousands
JDIn Thousands
JDIn Thousands
JDIn Thousands
JDIn Thousands
Gross income 7,931 40,320 38,878 7,827 94,956 94,916Provision for impairment of direct credit facilities
(784) (988) - - (1,772) (2,069)
Loss of disposal of subsidiary - - - - - (558)Bank’s share of income from associate Company
- - 772 - 772 1,120
Segment results 7,147 39,332 39,650 7,827 93,956 93,409Undistributed segment expenses (68,182) (59,935)Income before tax 25,774 33,474Income tax (8,599) (10,836)Income for the Year 17,175 22,638Segment’s assets 181,861 573,302 954,167 - 1,709,330 1,687,621Investments in associate Company
- - 19,948 - 19,948 17,377
Undistributed assets - - - 108,748 108,748 104,587Total Segment’s Assets 181,861 573,302 974,115 108,748 1,838,026 1,809,585Segment’s liabilities 726,262 384,146 487,501 - 1,597,909 1,560,489Undistributed liabilities - - - 20,758 20,758 28,681Total Liabilities 726,262 384,146 487,501 20,758 1,618,667 1,589,170Capital expenses - - - - 5,730 6,656Depreciation - - - - 3,069 2,607
B. Information about Geographical DistributionThis item represents the geographical distribution of the Bank's activities Moreover the Bank conducts its activities mainly in Jordan representing local activities Additionally the Bank performs international activities through its branches in the Middle East and the Near East.
The following is the geographical distribution of the Bank's revenues assets and capital expenses: Inside the Kingdom Outside the Kingdom Total
2017 2016 2017 2016 2017 2016JD JD JD JD JD JD
Total Revenues 85,971,816 87,415,402 9,755,759 8,062,456 95,727,575 95,477,858Total Assets 1,470,116,827 1,488,801,130 367,909,000 320,783,626 1,838,025,827 1,809,584,756Capital Expenses 5,691,658 6,474,561 38,621 181,437 5,730,279 6,655,998
44. Capital Management: The Bank seeks to achieve the following goals:
• Compliance with the Central Bank of Jordan requirements relating to share capital.• Maintaining the ability to continue as a going concern.• Maintaining a strong capital base for supporting the expansion and development of the Bank's activities.

79
Capital adequacy is monitored and reviewed by the Bank's management moreover the Bank provides the Central Bank of Jordan with quarterly reports on the adequacy of its capital. According to the Central Bank of Jordan instructions the minimum requirements for the capital adequacy ratio is 12% Moreover banks are classified into five categories the best one having an average capital adequacy ratio equal to or more than 14% Additionally the Bank's capital adequacy ratio is 15.95% as of 31 December 2017 (16.25% as of 31 December 2016 in ). The schedule below shows capital components total risk weighted assets and capital adequacy ratio according to the Central Bank of Jordan instructions in accordance with Basel II 2017 Committee regulations:
Primary capital
2017 2016JD
In ThousandsJD
In ThousandsPaid-up capital 150,000 150,000Retained Earnings 2,668 2,604Other Comprehensive income items:Change in fair value (1,674) (1,429)Foreign currency translation adjustments (2,379) (4,179)Share Issuance Premium 1,418 1,418Statutory Reserve 29,279 26,958Non–controlling interest 5,654 6,797Total Ordinary Share Capital 184,966 182,169Total Regulatory AdjustmentsGoodwill and Intangible assets (931) (1,688)Deferred tax assets resulting from provisions of credit facilities (933) (936)Investment in Bank’s Capital and financial institutions and insurance companies Outside the scope of regulatory consolidation and where the bank owns more than 10%
(1,637) -
Net Ordinary Shareholders 181,465 179,545Additional Capital: Total primary Capital 181,465 179,545Secondary Capital:General banking risk reserve 5,889 5,789Total Stable Capital 5,889 5,789Net stable capital 5,899 5,789Total regulatory capital 187,354 185,334Total risk weighted assets 1,174,614 1,140,817Capital adequacy ratio (%) 15.95% 16.25%Primary capital ratio (%) 15.45% 15.74%
45. Accounts Managed on Behalf of Customers This item represents the accounts managed by the bank on behalf of its customers but are not considered part of the bank's assets and its balances as of 31 December 2017 was JD 32,886,344 (JD 31,881,896 as of 31 December 2016), The fees and commissions on such accounts are stated in the consolidated statement of Income.

80
46. Assets and Liabilities Maturity AnalysisThe following table analyzes assets and liabilities according to the expected period of their recoverability or settlement:
TotalOver 1 year Up to 1 yearDecember 31, 2017 JDJDJDAssets
70,179,969-70,179,969Cash and balances at Central Bank of Jordan254,895,109-254,895,109Balances at banks and financial institutions
16,535,460-16,535,460Deposits at banks and financial institutions14,817,140-14,817,140 Financial assets at fair value through Comprehensive Income
169,390-169,390Financial assets at fair value through Profit or Loss755,162,896508,641,445246,521,451Direct Credit facilities - net597,569,86730,338,381567,231,486Financial assets at amortized cost
19,947,77819,947,778-Investments in associate company68,754,51768,754,517-Property and equipment-Net
930,783930,783-Intangible assets-Net932,646932,646-Deferred tax assets
38,130,27238,130,272-Other assets1,838,025,827667,675,8221,170,350,005Total Assets
Liabilities487,339,87980,000,000407,339,879Banks and financial institutions’ deposits
1,050,715,661345,561,537705,154,124Customers’ deposits161,422-161,422Borrowed funds from the Central Bank of Jordan
59,693,04410,395,45449,297,590 Cash margins1,923,9501,923,950-Sundry provisions7,785,7867,785,786-Income tax provision
11,047,72111,047,721-Other liabilities1,618,667,463456,714,4481,161,953,015Total Liabilities
219,358,364210,961,3748,396,990Net

81
TotalOver 1 Year Up to 1 YearDecember 31, 2016 JDJDJDAssets
73,679,105-73,679,105Cash and balances at Central Bank of Jordan224,106,568-224,106,568Balances at banks and financial institutions
27,312,1143,472,68023,839,434Deposits at banks and financial institutions15,066,496-15,066,496Financial assets at fair value through Compressive Income
223,760-223,760Financial assets at fair value through Profit or Loss753,206,802373,968,339379,238,463Direct Credit Facilities - net594,028,33328,872,425565,155,908Financial assets at amortized cost
17,376,28717,376,287-Investments in associate company65,707,09165,707,091-Property and equipment-Net
1,673,8751,673,875-Intangible assets-Net936,420936,420-Deferred tax assets
36,267,90536,267,905-Other assets1,809,584,756528,275,0221,281,309,734Total Assets
Liabilities420,474,428-420,474,428Banks and financial institutions’ deposits
1,077,556,467294,653,847782,902,620Customers’ deposits62,460,57410,555,84751,904,727 Cash margins
1,984,0771,984,077-Sundry provisions9,975,8251,113,1628,862,663Income tax provision
16,719,10516,719,105-Other liabilities1,589,170,476325,026,0381,264,144,438Total Liabilities
220,414,280203,248,98417,165,296Net

82
47. Fair Value HierarchyA. Fair value of financial assets and financial liabilities that are measured at fair value on a recurring basis:Some of the financial assets and financial liabilities are measured at fair value at the end of each reporting period, The following table gives information about How the fair value of these financial assets and financial liabilities are determined (valuation techniques and key inputs).
Financial Assets/Financial Liabilities
Fair Value as at
Fair Value Hierarchy
Valuation Techniques and Key Inputs
Significant Unobservable
Relationship of
Unobservable Inputs to Fair
Value
31, December2017 2016
JD JD
Financial assets at fair value:Financial assets at fair value through profit or loss
Companies shares 169,390 223,760 Level 1Quoted rates in financial
marketsNot
ApplicableNot
ApplicableTotal 169,390 223,760Financial assets at fair value through comprehensive incomeShares available at market price
13,384,653 13,782,864 Level 1 Quoted rates in financial
marketsNot
ApplicableNot
ApplicableShares not available at market price
1,432,487 1,283,632 Level 2Compare to similar
financial instrumentsNot
ApplicableNot
ApplicableTotal 14,817,140 15,066,496
There were no transfers between level 1 and 2 during 2017 and 2016.

83
B. Fair value of financial assets and financial liabilities that are not measured at fair value on a recurring basis,Except what is detailed in following table we believe that the carrying amounts of financial assets recognized in the Company's financial statements approximate their fair values, due to that the bank's management believes that the item's book value are equals to the fair value which is due to its Short term maturity or to the interest rates being revaluated during the year.
December 31, 2017 December 31, 2016Hierarchy
Book value Fair value Bookvalue Fair valueJD JD JD JD
Financial assets not calculated at fair valueBalances at central banks 51,725,082 51,725,082 58,340,650 58,446,951 level 2Balances at banks and financial institutions
254,895,109 255,101,343 224,106,568 224,202,941 level 2
Deposits at banks and financial institutions
16,535,460 16,571,563 27,312,114 27,415,167 level 2
Loans and other bills 755,162,896 760,572,218 753,206,802 758,605,521 level 2Financial assets at amortized costs 597,569,867 607,355,672 594,028,333 603,311,893 level 1&2Total Financial assets not calculated at fair value
1,675,888,414 1,691,325,878 1,656,994,467 1.671,982,473
Liabilities not calculated at fair valueBanks and financial institution deposits
487,339,879 488,053,997 420,474,428 420,783,974 level 2
Customer Deposits 1,050,715,661 1,053,821,803 1,077,556,467 1,080,458,509 level 2Borrowed funds from the Central Bank of Jordan
161,422 161,958 - - level 2
Cash margins 59,693,044 59,769,606 62,460,574 62,490,341 level 2Total Liabilities not Calculated at Fair Value
1,597,910,006 1,601,807,364 1,560,491,469 1,563,732,824
• The fair values of the financial assets included in level 2 and 3 categories above have been determined in accordance with the generally accepted pricing.

84
48. Commitments and Contingent Liabilities (Off-Statement of Financial Position)A. Contingent Liabilities:
December 31,2017 2016
JD JDLetters of creditExport 32,202,294 26,706,876Import (backed) 691,585 756,239Import (not backed) 70,358,389 18,256,659AcceptanceExport / letter of credit 45,703,226 19,206,824Export / Bill of Collection 9,570,701 8,259,364Import (not backed) 6,143,745 8,316,672Letters of guaranteePayments 23,233,230 29,155,264Performance 30,372,402 33,249,426Other 23,044,828 24,461,043Forward contracts - 10,614,113Un-utilized facilities 48,350,039 35,056,519 Total 289,670,439 214,038,999
B. There are contractual commitments to purchase fixed assets or constructional contracts that has an estimate value of JD 2,000,000.
C. There are no guarantees provided against contractual obligations.
D. Operating and finance lease contracts.
The minimum capital lease payment is as follows The minimum capital lease payment is as follows:2017 2016
JD JDWithin one year 181,161 573,676Total 181,161 573,676
49. Lawsuits against the BankThe lawsuits against the bank amounted to JD 10,234,144 as of 31 December 2017 (8,299,988 as of 31 December 2016) which represents mostly lawsuits that clients have raised to respond to lawsuits that the bank has raised against them In the opinion of the Bank's lawyer the Bank will not incur any significant amounts against these lawsuits except for the booked provision which amounted to JD 127,000 as of 31 December 2017. Moreover, the amounts paid by the Bank against concluded or settled lawsuits are taken to the consolidated statement of income upon payment.

85
50. New International Financial Reporting Standards and its explanations and issued amendments and not implemented yetThe standards and interpretations that are issued but not yet effective, up to the date of issuance of the Bank’s financial statements are disclosed below. The Bank intends to adopt these standards, if applicable, when they become effective.
IFRS 9 Financial InstrumentsIn July 2014, the IASB issued the final version of IFRS 9 Financial Instruments that replaces IAS 39 Financial Instruments: Recognition and Measurement and all previous versions of IFRS 9. IFRS 9 brings together all three aspects of the accounting for financial instruments project: classification and measurement, impairment and hedge accounting. The Group has implemented the first phase of IFRS 9 as issued during 2009. The date of initial implementation of the first phase of IFRS 9 was 1 January 2011.
The new version of IFRS 9 is effective for annual periods beginning on or after 1 January 2018, with early application permitted. Except for hedge accounting, retrospective application is required; however, the entities are exempted from restating their comparative information.
The Group plans to adopt the new standard on the required effective date and will not restate comparative information. During 2017, the Group has performed an impact assessment of IFRS 9. This assessment is based on currently available information and may be subject to changes arising from further reasonable and supportable information being made available to the Group in 2018 when the Group adopts IFRS 9. The Group calculated preliminary ECL allowance for stage 3 accounts which amounted to JD 2.9 M compared to an outstanding balance of JD 11M allowance for non-performing loans and watch-list loans as detailed in note 9 to the Consolidated financial statements. In addition, the Group expects based on preliminary figures the following ECL allowances for stage 1 and stage 2 debt instruments:
Expected credit loss: JDDebt instruments- stage 1 894,832Debt instruments- stage 2 678,447
The Central Bank of Jordan issued a circular on 25 January 2018 allowing Banks to use the balance of the general banking reserves against the additional provisions resulted from the preliminary implementation of IFRS 9 during the year 2018.
A. Classification and MeasurementThe Group does not expect a significant impact on its balance sheet or equity on applying the new classification and measurement category of IFRS 9. It expects to continue being measured at amortized cost and to use the new category starting from 1 January 2018 for classifying part of the debt securities portfolio to be measured at fair value through OCI.
Credit facilities are held to collect contractual cash flows and are expected to give rise to cash flows representing solely payments of principal and interest. The Group analyzed the contractual cash flow characteristics of those instruments and concluded that they meet the criteria for amortized cost measurement under IFRS 9. Therefore, reclassification for these instruments is not required.
B. ImpairmentThe new impairment guidance sets out an expected credit loss (ECL) model applicable to all debt instrument financial assets classified as amortized cost or FVTOCI. In addition, the ECL model applies to loan commitments and financial guarantees that are not measured at FVTPL.

86
Incurred Loss versus Expected Loss MethodologyThe application of ECL will significantly change the credit loss methodology and models. ECL allowances represent credit losses that should reflect an unbiased and probability-weighted amount which is determined by evaluating a range of possible outcomes, the time value of money and reasonable and supportable information about past events, current conditions and forecasts of future economic conditions. This compares to the present incurred loss model under IAS 39 that incorporates a single best estimate, the time value of money and information about past events and current conditions. The objective of the new impairment standard is to record lifetime losses on all financial instruments which have experienced a significant increase in credit risk (SICR) since their initial recognition. As a result, ECL allowances will be measured at amounts equal to either (i) 12-month ECL or (ii) lifetime ECL for those financial instruments which have experienced a SICR since initial recognition. This compares to the present incurred loss model which recognizes lifetime credit losses when there is objective evidence of impairment and also allowances for incurred but not identified credit losses. Because of the inclusion of relative credit deterioration criteria and consideration of forward looking information, the ECL model eliminates the threshold or trigger event required under the incurred loss model, and lifetime ECL are recognized earlier under IFRS 9.
Stage Migration and Significant Increase in Credit Risk• For non-Impaired Financial InstrumentsStage 1 is comprised of all non-impaired financial instruments which have not experienced a SICR since initial recognition. Entities are required to recognize 12 months of ECL for stage 1 financial instruments. In assessing whether credit risk has increased significantly, entities are required to compare the risk of a default occurring on the financial instrument as at the reporting date, with the risk of a default occurring on the financial instrument as at the date of initial recognition.Stage 2 is comprised of all non-impaired financial instruments which have experienced a SICR since initial recognition. Entities are required to recognize lifetime ECL for stage 2 financial instruments. In subsequent reporting periods, if the credit risk of the financial instrument improves such that there is no longer a SICR since initial recognition, then entities shall revert to recognizing 12 months of ECL.
• For Impaired Financial InstrumentsFinancial instruments are classified as stage 3 when there is objective evidence of impairment as a result of one or more loss events that have occurred after initial recognition with a negative impact on the estimated future cash flows of a loan or a portfolio of loans. The ECL model requires that lifetime ECL be recognized for impaired financial instruments, which is similar to the current requirements under IAS 39 for impaired financial instruments.For the business and government portfolios, the individually assessed allowances for impaired instruments recognized under IAS 39 will generally be replaced by stage 3 allowances under IFRS 9, while the collective allowances for non-impaired financial instruments will generally be replaced by either stage 1 or stage 2 allowances under IFRS 9. For the retail portfolios, the portion of the collective allowances that relate to impaired financial instruments under IAS 39 will generally be replaced by stage 3 allowances, while the non-impaired portion of the collective allowances will generally be replaced by either stage 1 or stage 2 allowances under IFRS 9.
Key Drivers of Expected Credit LossThe following concepts are subject to a high level of judgment, will have a significant impact on the level of ECL allowances and will be the cause of increased volatility of allowances:1- Determining when a SICR of a financial asset has occurred.2- Measuring both 12-month and lifetime credit losses. 3- Incorporating forward-looking information using multiple probability-weighted scenarios, and4- Collateral and quality.

87
Further, the preliminary expected impact disclosed above may change as a result of the following factors:• The systems and associated controls in place have not been operational for an extended period.• The Group has not finalized the testing and assessment of controls over its IT systems and changes to
its governance framework.• The new accounting policies, assumptions, judgements and estimation techniques employed are
subject to re-assessment and changes upon instructions of the regulatory authority.
Bank IFRS 15 Revenue from Contracts with CustomersIFRS 15 specifies the accounting treatment for all revenue arising from contracts with customers. It applies to all entities that enter into contracts to provide goods or services to their customers, unless the contracts are in the scope of other IFRSs, such as IAS 17 Leases. IFRS 15 supersedes IAS 11 Construction Contracts, IAS 18 Revenue, IFRIC 13 Customer Loyalty Programmes, IFRIC 15 Agreements for the Construction of Real Estate, IFRIC 18 Transfers of Assets from Customers; and SIC-31 Revenue—Barter Transactions Involving Advertising Services. The standard is effective for annual periods beginning on or after 1 January 2018, and early adoption is permitted.
Amendments to IFRS 10 and IAS 28: Sale or Contribution of Assets between an Investor and Its Associate or Joint VentureThe amendments address the conflict between IFRS 10 and IAS 28 in dealing with the loss of control of a subsidiary that is sold or contributed to an associate or joint venture. The amendments clarify that the gain or loss resulting from the sale or contribution of assets that constitute a business, as defined in IFRS 3, between an investor and its associate or joint venture, is recognised in full. Any gain or loss resulting from the sale or contribution of assets that do not constitute a business, however, is recognised only to the extent of unrelated investors' interests in the associate or joint venture.
IFRS 2 Classification and Measurement of Share-based Payment Transactions - Amendments to IFRS 2The IASB issued amendments to IFRS 2 Share-based Payment that address three main areas: the effects of vesting conditions on the measurement of a cash-settled share-based payment transaction; the classification of a share-based payment transaction with net settlement features for withholding tax obligations; and accounting where a modification to the terms and conditions of a share-based payment transaction changes its classification from cash settled to equity settled.Entities may apply the amendments prospectively and are effective for annual periods beginning on or after 1 January 2018, with early application permitted.
IFRS 16 LeasesDuring January 2016, the IASB issued IFRS 16 “Leases” which sets out the principles for the recognition, measurement, presentation and disclosure of leases.IFRS 16 substantially carries forward the lessor accounting requirements in IAS 17. Accordingly, a lessor continues to classify its leases as operating leases or finance leases, and to account for those two types of leases differently.IFRS 16 introduced a single lessee accounting model and requires a lessee to recognize assets and liabilities for all leases with a term of more than 12 months, unless the underlying asset is of low value. A lessee is required to recognize a right-of-use asset representing its right to use the underlying leased asset and a lease liability representing its obligation to make lease payments. The new standard will be effective for annual periods beginning on or after 1 January 2019.Early application is permitted.

88
IFRS 17 Insurance ContractsIFRS 17 provides a comprehensive model for insurance contracts covering the recognition and measurement and presentation and disclosure of insurance contracts and replaces IFRS 4 -Insurance Contracts. The standard applies to all types of insurance contracts (i.e. life, non-life, direct insurance and re-insurance), regardless of the type of entities that issue them, as well as to certain guarantees and financial instruments with discretionary participation features. The standard general model is supplemented by the variable fee approach and the premium allocation approach.The new standard will be effective for annual periods beginning on or after 1 January 2021. Early application is permitted. Transfers of Investment Property (Amendments to IAS 40)The amendments clarify when an entity should transfer property, including property under construction or development into, or out of investment property. The amendments state that a change in use occurs when the property meets, or ceases to meet, the definition of investment property and there is evidence of the change in use. A mere change in management’s intentions for the use of a property does not provide evidence of a change in use. Entities should apply the amendments prospectively and effective for annual periods beginning on or after 1 January 2018. Early application of the amendments is permitted and must be disclosed.
Amendments to IFRS 4 Applying IFRS 9 Financial Instruments with IFRS 4 Insurance ContractsIn September 2016, the IASB issued amendments to IFRS 4 to address issues arising from the different effective dates of IFRS 9 and the upcoming new insurance contracts standard (IFRS 17). The amendments introduce two alternative options for entities issuing contracts within the scope of IFRS 4, a temporary exemption from implementing IFRS 9 to annual periods beginning before 1 January 2021 at latest and an overlay approach that allows an entity applying IFRS 9 to reclassify between profit or loss and other comprehensive income an amount that results in the profit or loss at the end of the reporting period for the designated financial assets being the same as if an entity had applied IAS 39 to these designated financial assets.
IFRIC Interpretation 22 Foreign Currency Transactions and Advance ConsiderationThe interpretation clarifies that in determining the spot exchange rate to use on initial recognition of the related asset, expense or income (or part of it) on the derecognition of a non-monetary asset or non-monetary liability relating to advance consideration, the date of the transaction is the date on which an entity initially recognises the nonmonetary asset or non-monetary liability arising from the advance consideration. Entities may apply the amendments on a fully retrospective or prospective basis. The new interpretation will be effective for annual periods beginning on or after 1 January 2018. Early application of interpretation is permitted and must be disclosed.
IFRIC Interpretation 23 Uncertainty over Income Tax TreatmentThe Interpretation addresses the accounting for income taxes when tax treatments involve uncertainty that affects the application of IAS 12 and does not apply to taxes or levies outside the scope of IAS 12, nor does it specifically include requirements relating to interest and penalties associated with uncertain tax treatments. An entity must determine whether to consider each uncertain tax treatment separately or together with one or more other uncertain tax treatments. The interpretation is effective for annual reporting periods beginning on or after 1 January 2019, but certain transition reliefs are available.

89
DOMESTIC AND INTERNATIONAL BRANCHES, OFFICES, SUBSIDIARIES, AND AFFILIATED BANK

90
GENERAL MANAGEMENT:AJIB Tower200 Zahran Street P.O. Box 8797 Amman 11121 JordanTel: +962(6)5607138 Fax: +962(6)5681482Reuters Dealing Code: AJIB SWIFT: AJIBJOAX Website: www.ajib.com E-mail: [email protected]
BRANCHES: Main Branch – AJIB Tower200 Zahran Street P.O. Box 8797 Amman 11121 JordanTel: +962(6)5607138 Fax: +962(6)5681482
Corporate Banking – AJIB Tower200 Zahran Street P.O. Box 8797 Amman 11121 JordanTel: +962(6)5607138 Fax: +962(6)5681482 Dakhiliyeh Circle BranchKhaled Bin Al-Walid Street, Building No. 224P.O. Box 925286 Amman 11190, JordanTel: +962(6)5607471Fax: +962(6)5682047
Abdoun BranchAbdoun CircleP.O. Box 925286 Amman 11190, JordanTel: +962(6)5901100 Fax: +962(6)5920452
Bayader Wadi Al-Seer Branch Al-Bayader - Main Street, Building No.14 P.O. Box 140375, Al-Bayader 11814 JordanTel: +962(6)5815831Fax: +962(6)5814516
Al-Wehdat Branch Madaba Street, Building No. 288P.O. Box 620905, Amman 11162 JordanTel: +962(6)4751641Fax: +962 (6) 4787996
Wadi Saqra BranchArar Street, Building No. 234P.O. Box 6041, Amman 11118 JordanTel: +962(6)4621942Fax: +962(6)4657571
Tla’a Al-Ali BranchAl-Madinah Al-Munawarah Street,Building No. 204P.O Box 3541, Tla’a Al-Ali 11953 JordanTel: +962(6)5517546 Fax: +962(6)5516892
Al-Jubeiha Branch Yajouz Street, Manhal Center, Manhal Traffic LightP.O. Box 8797, Amman 11121 JordanTel: +962(6)5344743 Fax: +962(6)5342644
Al-Yasmeen BranchJabal Arafat Street, Building No. 15P.O. Box 713100, Amman 11171 JordanTel: +962(6)4209221 Fax: +962(6)4206752
Tabarbour BranchTariq StreetP.O. Box 279, Amman 11947 JordanTel: +962(6)5058341 Fax: +962(6)5058356
Queen Alia International Airport BranchArrivals BuildingP.O. Box 8797, Amman 11121 JordanTel: +962(6)5200703 Fax: +962(6)5200702
Mecca Mall Branch Ground Floor P.O. Box 8797, Amman 11121 Jordan Tel: +962(6)5866139 Fax: +962(6)5821943
Marj Al-Hamam BranchAirport Road – Manaseer Gas StationTel: +962(6)5200720 Fax: +962(6)5200725
Abdali BranchAbdali Boulevard – Abdali MallTel: +962(6)5696691Fax: +962(6)5696693

91
Zarka Branch King Hussein Street, Building No. 22P.O. Box: 2186, Zarka 13110 Jordan Tel: +962(5)3931351 Fax: +962(5)3931354
Zarka Al-Jadedah Branch Mecca Street 36, Al-Barakah Complex P.O. Box: 2186, Zarka 13110 Jordan Tel: +962(5)3869097 Fax: +962(5)3853240
Irbid Branch Wasfi Al-Tal Street P.O. Box: 970, Irbid 21110 Jordan Tel: +962(2)7279661 Fax: +962(2)7279670
Aqaba Branch Al Kurneesh Street - Next to Aqaba Castle P.O. Box 1598, Aqaba 77110 Jordan Tel: +962(3)2022830 Fax: +962(3)2022834
Cyprus Branch Limassol - 23 Olympion Street P.O. Box 54384, Limassol - Cyprus Tel: (25 -357) 351351Fax: (25 - 357) 360151 Telex: 3809 - 4029 AJIBCY SWIFT: AJIBCY2I
OFFICES: City Mall Office Tel: +962(6)5822489 Fax: +962(6)5824305
TAJ Mall Office Tel: +962 (6) 5929956 Fax: +962 (6) 5932083
Four Seasons Hotel Office Tel: +962 (6) 5540080Fax: +962 (6) 5540884
Queen Alia International Airport OfficesDeparturePassports (1)Passports (2)Transit Gates (1)Gates (2)Crew Center Tel: +962(6)5200703 Fax: +962(6)5200702
Marka Airport Office Tel: +962(6)4883556 Fax: +962(6)4883557
King Hussein Airport – AqabaTel: +962(3)2022877 Fax: +962(3)2022878
Tala Bay Office – AqabaTel: +962(3)2022877 Fax: +962(3)2022878
Al-Huson Street Office – Irbid Tel: +962(2)7245656 Fax: +962(2)7245663 Irbid National University Office Tel: +962(2)7057392 Fax: +962(2)7057392
Al-Omari Exchange Office Al-Omari Border Point Telefax: +962(5)3838024
Tripoli Representative Office Tripoli - Libya Tripoli Tower No.1 - Fourth Floor - Office No.45 P.O. Box 93598 Tel: (21821)3351746 Fax: (21821)3351747

92
SUBSIDIARIES AND AFFILIATED BANK
SUBSIDIARIES:Arab Jordan Investment Bank (Qatar) L.L.C. Qatar Financial Center Tower No.1, 17th Floor P.O. Box 37563 Doha, Qatar Tel: (+974)44967338 Fax: (+974)44967348 Website: www.ajib.com E-mail: [email protected]
The United Arab Jordan Company for Investment & Financial Brokerage Housing Bank Complex - Fifth floor P.O. Box 8797 Amman 11121 Jordan Tel: +962(6)5652441 / +962(6)5671578Fax: +962(6)5696156 Website: www.uajci.com
AFFILIATED BANK: Jordan International Bank Moreau House 116 Brompton Road Knightsbridge London SW3 1JJ, U.K. Tel: +44(0)2031440200 Website: www.jordanbank.co.uk