annual report 2017 - freightways · shred-x pty limited the information management group pty...
TRANSCRIPT

ANNUAL REPORT 2017
DX Mail www.dxmail.co.nz
Dataprint www.dataprint.co.nz
Security Express www.securityexpress.co.nz
Pass The Parcel www.passtheparcel.co.nz
Stuck www.stuck.co.nz
Post Haste Couriers www.posthaste.co.nz
New Zealand Couriers www.nzcouriers.co.nz
Air Freight NZ Freightways Information ServicesFieldair Engineering www.fieldair.co.nz
Parceline Express
Databank www.timg.com
Shred-X www.shred-x.com.au
Filesaver www.filesaver.com.au
LitSupport www.litsupport.com.au
SUB60 www.sub60.co.nz
Kiwi Express Couriers www.kiwiexpress.co.nz
Security Express www.securityexpress.co.nz
Data Security Services www.timg.co.nz
The Information Management Group www.timg.co.nz
Document Destruction Service www.timg.co.nz
Archive Security www.timg.co.nz
Castle Parcels www.castleparcels.co.nz
Now Couriers www.nowcouriers.co.nz
D I R E C TO RY
For inquiries in relation to Freightways’ services and products contact the offices listed below or refer to Freightways’ website at www.freightways.co.nz.
Messenger Services Limited New Zealand Document Exchange Limited32 Botha Road 20 Fairfax AvenuePenrose PenroseDX EX10911 DX CR59901AUCKLAND AUCKLAND Telephone: 09 526 3680 Telephone: 09 526 3150www.sub60.co.nz www.dxmail.co.nzwww.kiwiexpress.co.nz www.dataprint.co.nzwww.stuck.co.nzwww.securityexpress.co.nz
New Zealand Couriers Limited The Information Management Group (NZ) Limited32 Botha Road 33 Botha RoadPenrose PenroseDX CX10119 DX EX10975AUCKLAND AUCKLANDTelephone: 09 571 9600 Telephone: 09 580 4360www.nzcouriers.co.nz www.timg.co.nz
Post Haste Limited Fieldair Holdings Limited32 Botha Road Palmerston North International AirportPenrose Palmerston NorthDX EX10978 DX PX10029AUCKLAND PALMERSTON NORTHTelephone: 09 579 5650 Telephone: 06 357 1149www.posthaste.co.nz www.fieldair.co.nzwww.passtheparcel.co.nz
Castle Parcels Limited NOW Couriers Limited163 Station Road 161 Station Road Penrose PenroseDX CX10245 AUCKLANDAUCKLAND Telephone: 09 526 9170Telephone: 09 525 5999 www.nowcouriers.co.nz www.castleparcels.co.nz
Shred-X Pty Limited The Information Management Group Pty LimitedPO Box 1184 PO Box 21 Oxenford EnfieldQueensland 4210 New South Wales 2136AUSTRALIA AUSTRALIA Telephone: +61 1 300 747 339 Telephone: +61 2 9882 0600www.shred-x.com.au www.timg.com
www.filesaver.com.auwww.litsupport.com.au

Fre ightways L imi ted
and i ts subsid iar ies
1
Fre ightways L imi ted
and i ts subsid iar ies
1
BOARD OF DIRECTORS
Sue Sheldon (Chairman)Dean Bracewell (Managing Director)Kim EllisPeter KeanMark RushworthMark Verbiest
REGISTERED OFFICE
32 Botha RoadPenrose DX CX10120Telephone: (09) 571 9670Facsimile: (09) 571 9671www.freightways.co.nz
AUDITORS
PricewaterhouseCoopers188 Quay StreetAuckland
SHARE REGISTRAR
Computershare Investor Services Limited159 Hurstmere RoadTakapunaAuckland 0622DX CX10247
STOCK EXCHANGE
The fully paid ordinary shares of Freightways Limited are listed on the NZX (the New Zealand Stock Exchange).
C O M PA N Y PA RT I C U L A R S

2
Fre ightways L imi ted
and i ts subsid iar ies
Company Particulars 1
Group Profile 3
Financial Summary 4
Report from the Chairman and Managing Director 6
Directors’ Report 10
Independent Auditor’s Report 15
FINANCIAL STATEMENTS
Income Statement 19
Statement of Comprehensive Income 20
Statement of Changes in Equity 21
Balance Sheet 22
Statement of Cash Flows 23
Notes to the Financial Statements 24
Shareholder Information 64
Corporate Governance Statement 66
Directory 69
TA B L E O F C O N T E N T S
Fre ightways L imi ted
and i ts subsid iar ies
33
FREIGHTWAYS' STRATEGYFreightways’ business strategy is to develop organic growth opportunities that exist in the express package, business mail and information management industries, diversify its operations further into the information management industry, including geographically, and execute acquisition and alliance opportunities in areas that complement its existing capabilities.
Express package & business mail
Freightways delivers over 200,000 items each business day and over 50 million items each year. In addition to its extensive nationwide network, Freightways offers a worldwide delivery service through alliances with international express package operators.
Freightways employs a multi-brand strategy within the network courier segment of the Express Package market via New Zealand Couriers, Post Haste Couriers, Castle Parcels and NOW Couriers. This strategy allows Freightways to successfully segment the market by meeting varying customer service and price requirements.
Freightways services the point-to-point segment through its SUB60, Kiwi Express, Pass The Parcel and STUCK brands, and provides a secure service for valuables through Security Express.
DX Mail operates in the New Zealand postal services market. It provides a full range of domestic and international mail solutions to business customers. DX Mail is represented in all towns and cities throughout New Zealand. Its services include the processing of letters and parcels for box-to-box and street delivery. It also offers a full suite of mailhouse services for both physical and electronic transactional mail through its Dataprint business.
Information management
Freightways’ information management division offers a complete range of physical and digital information management services throughout New Zealand and Australia. Physical services include archive management services for documents, storage and retrieval of computer media, print & copy and document destruction. Complementary digital services include data conversion, online back-up, digitisation, workflow and electronic discovery services.
In New Zealand, The Information Management Group (TIMG) provides a nationwide service from its locations in Auckland, Hamilton, New Plymouth, Palmerston North, Wellington, Christchurch and Dunedin. It operates the brands of Archive Security, Document Destruction Services and Data Security Services.
In Australia, TIMG operates in all states and territories, through the brands of Archive Security, Filesaver, DataBank and LitSupport. Shred-X operates as the document destruction brand in Australia.
Internal service providers
Freightways manages its road and air linehaul requirements through the Parceline Express and Fieldair businesses, and its Parcelair joint venture. Fieldair also provides a wide range of avionics and engineering services to the NZ aviation industry. Information technology systems are provided to Freightways’ various businesses via Freightways Information Services.
G R O U P P R O F I L E
4
Fre ightways L imi ted
and i ts subsid iar ies
F I N A N C I A L S U M M A RYFOR THE YEAR ENDED 30 JUNE 2017
2017 2016 NOTE $000 $000 INCREASE
Operating revenue 545,262 505,360 7.9%EBITA (i) 93,031 81,361 14.3%NPAT (ii) 60,856 49,774 22.3%EBITA, excluding non-recurring items 89,345 87,698 1.9%NPAT, excluding non-recurring items, net of tax 56,587 54,337 4.1%Non-recurring items: - reversal of accrued earn-out payables 5,630 - - relocation costs of TIMG in Sydney (1,944) - - write-down of aircraft - (4,944) - write-down of aircraft-related inventory - (1,393) Total 3,686 (6,337) Tax benefit applicable to non-recurring items 583 1,774 Non-recurring items, net of tax 4,269 (4,563)
Note:(i) Operating profit before interest, income tax and amortisation of intangibles.(ii) Profit for the year attributable to the shareholders.
The Directors believe that the non-recurring items detailed above should not be included when assessing the underlying trading performance of the Group.

Fre ightways L imi ted
and i ts subsid iar ies
5
F I N A N C I A L S U M M A RYFOR THE YEAR ENDED 30 JUNE 2017
1st half 2nd half
* This EBITA graph represents the operating results of the company, exclusive of any non-recurring items.
Year ended 30 June
F R E I G H T WAYS O P E R AT I N G R E V E N U E
Year ended 30 June
2004 2005 2006 2007 2008 2009 2010 2011 2012 2013 2014 2015 2016 2017
2004 2005 2006 2007 2008 2009 2010 2011 2012 2013 2014 2015 2016 2017
600
500
400
300
200
100
-
$M
100
90
80
70
60
50
40
30
20
10
-
$M
F R E I G H T WAYS E B I TA *

6
Fre ightways L imi ted
and i ts subsid iar ies
R E P O RT F R O M T H E C H A I R M A N A N D M A N A G I N G D I R E C TO R
The Directors are pleased to present the consolidated financial result of Freightways Limited (Freightways) for the year ended 30 June 2017. This report discusses the result, reviews the operations of each division and provides an outlook for the financial year ahead.
Highlights of the result include the strength of the underlying volume growth and margin in the express package & business mail division, the completion of a number of significant projects that ensure important future capacity for both divisions of the Group, the execution of robust contingency plans that minimised service disruption following the significant impact of the North Canterbury earthquake and the performance of the information management businesses, other than TIMG Australia, which demonstrated improved results in the second half of the financial year.
Operating performance
The below table presents the reported 2017 result compared to the prior comparative period (pcp), both before and after the inclusion of non-recurring items: 2017 2016 Increase NOTE $M $M %
Revenue 545.3 505.4 7.9%
EBITA, before non-recurring items (i) 89.3 87.7 1.9%Non-recurring items 3.7 (6.3) EBITA (ii) 93.0 81.4 14.3%
NPAT, before non-recurring items (iii) 56.6 54.4 4.1%Non-recurring items after tax 4.3 (4.6)NPAT (iv) 60.9 49.8 22.3% Basic EPS (cents), before non-recurring items 36.5 35.1
Notes:
(i) Operating profit before interest, tax and amortisation, before non-recurring items.(ii) Operating profit before interest, tax and amortisation.(iii) Net profit after tax (NPAT), before non-recurring items.(iv) Profit for the year attributable to shareholders.
The results discussed throughout this commentary exclude the impact of the following non-recurring items that the Directors believe should not be included when assessing underlying trading results:
• 2017: A non-recurring benefit before tax of $5.6 million (no tax applicable) relating to previously accrued final acquisition payables that are no longer expected to be required. A non-recurring cost before tax of $1.9 million ($1.3 million after tax) relating to the relocation of the TIMG business in Sydney.
• 2016: A total non-recurring charge of $6.3 million ($4.6 million after tax) that comprised a one-off expense relating to the write-down of the carrying value of the Convair fleet of aircraft that were retired during 2016, and related spare parts.

Fre ightways L imi ted
and i ts subsid iar ies
7
R E P O RT F R O M T H E C H A I R M A N A N D M A N A G I N G D I R E C TO R
Dividend
The Directors have declared a final dividend of 14.75 cents per share, fully imputed at a tax rate of 28%, being a 2% increase above the pcp final dividend of 14.5 cents per share. This represents a payout of approximately $22.9 million compared with $22.5 million for the pcp. The dividend will be paid on 2 October 2017. The record date for determination of entitlements to the dividend is 15 September 2017.
The Dividend Reinvestment Plan (DRP) will not be offered in relation to this dividend. As a capital management tool, the application of the DRP will be reviewed for each future dividend.
REVIEW OF OPERATIONS
Divisional results for the year ended 30 June 2017 are provided below for the express package & business mail division and the information management division.
Express package & business mail
Operating revenue of $402.6 million was 8.7% higher than the pcp. EBITA of $65.3 million was 5.1% higher than the pcp.
The express package & business mail division operates a multi-brand strategy in the domestic market through New Zealand Couriers, Post Haste, Castle Parcels, NOW Couriers, SUB60, Security Express, Kiwi Express, Stuck, Pass The Parcel, DX Mail and Dataprint.
Volume growth throughout the year was consistently strong, particularly so in the peak month of December. This growth, from both existing and new customers, created pressure on the service capability of this division at a time when it was transitioning to a new model of freighter aircraft, relocating its primary South Island freight hub and implementing wide-reaching operational contingencies in the aftermath of the North Canterbury earthquake. Modest price increases were implemented to offset rising costs and disruption surcharges were introduced to offset earthquake-related contingency costs. Overall, costs were well contained. Key matters:
• The transition to Boeing 737-400 aircraft is in most respects materially complete. The four superseded Convair aircraft and related parts were all sold during the year for a combined book loss of $0.5 million ($0.3 million after tax).
• A decision in February to introduce additional airfreight capacity through regularly operating an extra inter-island return flight of a 737-400 aircraft and/or the chartering back of a Convair aircraft was made to provide essential capacity, as referred to above, for the greater than anticipated airfreight volume growth and for service reasons. While this additional capacity comes at a cost, due to it not being fully utilised, it is required to ensure a sustainable premium service offer.
• Due diligence is under way on permanently introducing a fourth Boeing 737-400 aircraft that will effectively replace this additional return flight/charter for a similar cost and provide continuity in case of maintenance or related issues to the existing aircraft fleet.
• The Christchurch businesses relocated from four independent sites to one purpose-built air-side facility at Christchurch Airport. This project was completed on time and within budget. The benefits from being in the one modern and automated facility will be seen throughout the 2018 year and beyond.
• Increased resourcing of the IT team enabled the progression of a number of key projects in support of Freightways’ strategic intent to be a technology leader in the markets it operates in.
• Auckland’s growth north and west of the city has led to a decision to run a twin-city operation within the greater metropolitan area, commencing during 2018. As such, new premises have been leased in Albany on Auckland’s North Shore to accommodate the current and expected growth in volume from these areas for many years to come. These new premises will complement, and effectively extend, the life of the existing site south of the city in Penrose.
8
Fre ightways L imi ted
and i ts subsid iar ies
R E P O RT F R O M T H E C H A I R M A N A N D M A N A G I N G D I R E C TO R
• Overall volume mix within the customer base is gradually changing as consumers increasingly shop online, resulting in Business to Consumer (B2C) deliveries growing faster than Business to Business (B2B) deliveries. A wide range of initiatives are being implemented to ensure these B2C deliveries are completed as efficiently as possible and to the satisfaction of customers.
Freightways’ business mail operator, DX Mail, again expanded its postal delivery network in several locations throughout New Zealand to satisfy increasing demand for its overnight and 5-day per week delivery of standard-priced letters. Despite the decline of the overall letter market, DX Mail’s postal delivery volumes and physical and digital transactional mailhouse services continue to grow profitably.
Information management
Operating revenue of $144.2 million was 5.4% higher than the pcp. EBITA of $27.7 million was 2.7% lower than the pcp.
This division operates under the brands of The Information Management Group (TIMG) and Shred-X.
Good results from Shred-X and TIMG New Zealand were in contrast to the performance from TIMG Australia, which was not to expectation. Key matters:
• Within TIMG Australia, its LitSupport business performed at the bottom end of the range of expectations set at the time of acquiring the business (and below the pcp). This outcome was anticipated as a possibility at that time and hence the payment for this business was structured to reduce Freightways’ financial risk should this occur, as was explained in the Freightways Half Year result commentary. Restructuring that occurred in November/December and the winning of a number of new contracts has, as expected, improved LitSupport’s performance in the second half of the financial year, but not to the extent that any earn-out is expected to be paid to the previous owners.
• The relocation of three Sydney-based information management facilities into a single, purpose-built facility was completed in the second half of the year, on time and within budget. This new facility provides much needed capacity for the growing Sydney operations and delivers operating efficiencies that will contribute to a positive return on this investment.
• Demand for the broad suite of digital services offered by TIMG in New Zealand and Australia, and the e-destruction services offered by Shred-X, continues to gain momentum. It is expected that these new revenue streams will become an increasingly important part of the overall information management division’s revenue and earnings in the near to medium term.
• The severity of the North Canterbury earthquake had repercussions for the division’s document storage facilities in Wellington. While the racking did its job and withstood the impact of the earthquake, its structural integrity was compromised, particularly in the major site located in Porirua. This is likely to result in the need to replace all of the Porirua racking and would involve repositioning boxes to enable service continuity while replacement racking is installed. Freightways carries comprehensive insurance for events such as this. The related deductible was expensed as a corporate cost.

Fre ightways L imi ted
and i ts subsid iar ies
9
Internal service providers
Fieldair Holdings, through its subsidiary of Air Freight NZ, operates a joint venture company that leases and operates the Boeing 737-400 aircraft fleet that provides Freightways’ overnight airfreight linehaul service. Fieldair also provides specialist engineering and contracting services to the general aviation market. Parceline Express provides Freightways’ road linehaul service. Contingencies implemented by these linehaul businesses following the North Canterbury earthquake, which will continue in place until the reinstatement of State Highway 1, are minimising the disruption to the ultimate service provided to customers.
Freightways Information Services provides IT development and support to both operating divisions. This team is responsible for providing the front-line businesses with robust and secure information management systems and supporting their technology-related strategic objectives.
Corporate
Corporate costs increased compared to the pcp, primarily due to expensing the insurance deductibles related to earthquake insurance claims.
Net debt of $158 million is $6 million higher than the pcp, in a year when Freightways has invested $24 million of capital expenditure in its new Christchurch and Sydney premises, IT infrastructure and in the provision of capacity for growth for both divisions.
OUTLOOK
The markets in which Freightways operates in both New Zealand and Australia remain positive. Volumes and activity levels experienced throughout 2017 are expected to increase during 2018, from both existing and new customers. Accordingly, Freightways is again targeting year-on-year earnings growth.
Within the express package & business mail division, investment will be made during 2018 in capacity, both in regards to airfreight and premises (notably Auckland), to accommodate current volumes and projected growth. Within the information management division, better results are expected following the completion of the Sydney relocation and through maintaining the recent improvement in performance achieved at TIMG Australia.
Overall capital expenditure for the 2018 financial year is expected to be approximately $17 million. Operating cash flows are expected to remain strong throughout the 2018 financial year.
Strategic growth opportunities, including acquisitions and alliances that complement existing capabilities, will be executed where they make commercial sense.
CONCLUSION
The strength of Freightways’ business models, the expertise of its people and the positive features of the markets it operates in are once again evident in this full year result. This result has been achieved in a year that has included the challenges of a significant natural disaster, the completion of a number of major capacity-related projects and at a time of strong growth in volumes and related activity.
The Directors acknowledge the outstanding work and ongoing dedication of the Freightways team of people throughout New Zealand and Australia.
Susan Sheldon Dean Bracewell Chairman Managing Director 14 August 2017
R E P O RT F R O M T H E C H A I R M A N A N D M A N A G I N G D I R E C TO R

10
Fre ightways L imi ted
and i ts subsid iar ies
D I R E C TO R S ’ R E P O RT
The Directors of Freightways Limited (Freightways) resolved to submit the following report with respect to the financial position of the Group as at 30 June 2017 and its financial performance and cash flows for the year ended on that date.
DIRECTORS
The names of the Directors of the Company in office at the date of this report are:
Sue Sheldon CNZM (b.com, fca, m inst d)
Sue was appointed a Director of Freightways in July 2003 and appointed Chairman in October 2010. She is a Chartered Accountant and full-time professional director, and is currently a Director of Contact Energy Limited and Real Journeys Limited. Sue is Independent Chair of the Audit & Risk Management Committee of Christchurch City Council, Independent Chair of the Audit & Risk Management Committee of Auckland City Council and a former President of the New Zealand Institute of Chartered Accountants.
Dean Bracewell (managing director)
Dean has been Managing Director of the Freightways Group since 1999. He joined the Group in 1979 and other than a 5-year period, including time overseas, he has spent his entire career with the Freightways Group. Dean held a range of senior executive and general management roles in a number of the Freightways businesses prior to his appointment as Managing Director.
Kim Ellis
Kim was appointed a Director in August 2009. He spent 28 years in chief executive roles in a number of sectors, including 13 years as Managing Director of Waste Management NZ Ltd until its sale in 2006 to Transpacific Industries Pty Limited, and has developed businesses in both New Zealand and Australia. Kim is now a professional director working with both private and listed companies. His current Board appointments include Port of Tauranga Limited, FSF Management Company Limited, Ballance Agri-Nutrients Limited, NZ Social Infrastructure Fund Limited and Metlifecare Limited.
Peter Kean
Peter was appointed a Director in July 2016. He brings to Freightways many years of senior executive experience with the Lion group of companies in both New Zealand and Australia. Peter's last executive roles were as Managing Director of Lion Nathan New Zealand and Managing Director of Lion Dairy and Drinks, based in Melbourne. He retired from Lion in 2014 and has since developed his career in governance. Peter is also a Director of Sanford Limited, the New Zealand Rugby Union and a number of private companies.
Mark Rushworth (be(hons),mem)
Mark was appointed a Director of Freightways in September 2015. He has extensive experience in the technology sector, with a decade’s governance experience, predominantly in the high tech and innovation space. An electrical engineer by training, with widespread operations and marketing experience, he spent four years on the senior executive team of Vodafone NZ through until 2010, where among other things he had executive accountability for the fixed line business and as executive director of marketing. Mark previously served as chief executive of Pacific Fibre, Paymark Limited and internet provider ihug.

Fre ightways L imi ted
and i ts subsid iar ies
11
D I R E C TO R S ’ R E P O RT
Mark Verbiest (llb, cf inst d)
Mark was appointed a Director in February 2010. He is a professional director who has a strong working knowledge of technology and technology-related businesses, as well as having extensive capital markets experience. A lawyer by training, with widespread corporate legal experience in private practice, he spent 7.5 years on the senior executive team of Telecom NZ through until mid-2008, where among other things he had executive accountability for two business units. Mark is Chairman of Spark New Zealand Limited and Willis Bond Capital Partners Limited. He is also a director of ANZ Bank New Zealand Limited, Meridian Energy Limited and MyCare Limited, a consultant to law firm Simpson Grierson and a member of both the Advisory Board of The Treasury and the Commercial Operations Advisory Board of The Treasury.
The Board has determined for the purposes of the NZSX Listing Rules that, as at 30 June 2017, Sue Sheldon, Kim Ellis, Peter Kean, Mark Rushworth and Mark Verbiest are independent Directors and Dean Bracewell as Managing Director is not an independent Director.
PRINCIPAL ACTIVITIES
The principal activities of the Group during the year ended 30 June 2017 were the operation of express package & business mail services and information management services.
CONSOLIDATED RESULT FOR THE YEAR 2017 2016 $000 $000
Operating revenue 545,262 505,360
Operating profit before interest, income tax andamortisation of intangibles 93,031 81,361Amortisation of intangibles (1,679) (1,685)Profit before interest and income tax 91,352 79,676Net interest and finance costs (9,570) (11,055)Profit before income tax 81,782 68,621Income tax (20,926) (18,847)Profit for the year attributable to the shareholders 60,856 49,774
DIRECTORS HOLDING OFFICE DURING THE YEAR WERE:
Parent: Subsidiaries:
Sue Sheldon (Chairman) Dean Bracewell
Dean Bracewell (Managing Director) Mark Royle
Roger Corcoran (resigned 27 October 2016)
Kim Ellis
Peter Kean (appointed 1 July 2016)
Mark Rushworth
Mark Verbiest

12
Fre ightways L imi ted
and i ts subsid iar ies
D I R E C TO R S ’ R E P O RT
REMUNERATION OF DIRECTORS GROUP 2017 2016 $ $
Sue Sheldon 150,767 148,300Dean Bracewell 1,370,140 1,376,475Roger Corcoran (resigned 27 October 2016) 25,676 80,532Kim Ellis 81,417 75,000Peter Kean (appointed 1 July 2016) 79,333 -Mark Rushworth 79,333 57,750Mark Verbiest 89,767 85,300Mark Royle 679,007 680,868 2,555,440 2,177,866
Remuneration of executive Directors includes the incentive payments made during the year ended 30 June 2017 in respect of the two previous six-month performance periods (1 January to 30 June 2016 and 1 July to 31 December 2016). No amount is included above in respect of incentive payments for the period 1 January to 30 June 2017, as these were paid in August 2017. Remuneration of the Managing Director comprises a fixed remuneration package representing 70% of his total remuneration and an ‘at risk’ portion representing 30%, payable on achievement of short-term financial objectives. He also participates in the Freightways Senior Executive Performance Share Plan described in Note 21 of the Financial Statements by way of an annual allocation of partly-paid shares equivalent to 55% of his fixed remuneration, but otherwise on the same terms and conditions as other Freightways executives. The partly-paid shares have a 3-year vesting period and are subject to the achievement of financial hurdles, as described in Note 21.
Fre ightways L imi ted
and i ts subsid iar ies
13
D I R E C TO R S ’ R E P O RT
ENTRIES IN THE REGISTER OF DIRECTORS’ INTERESTSThe Register of Directors’ Interests records that the following directors of Freightways Limited and its subsidiaries have an equity interest in the Company. These Directors therefore have an interest in any transactions between Freightways Limited and any of its subsidiaries:
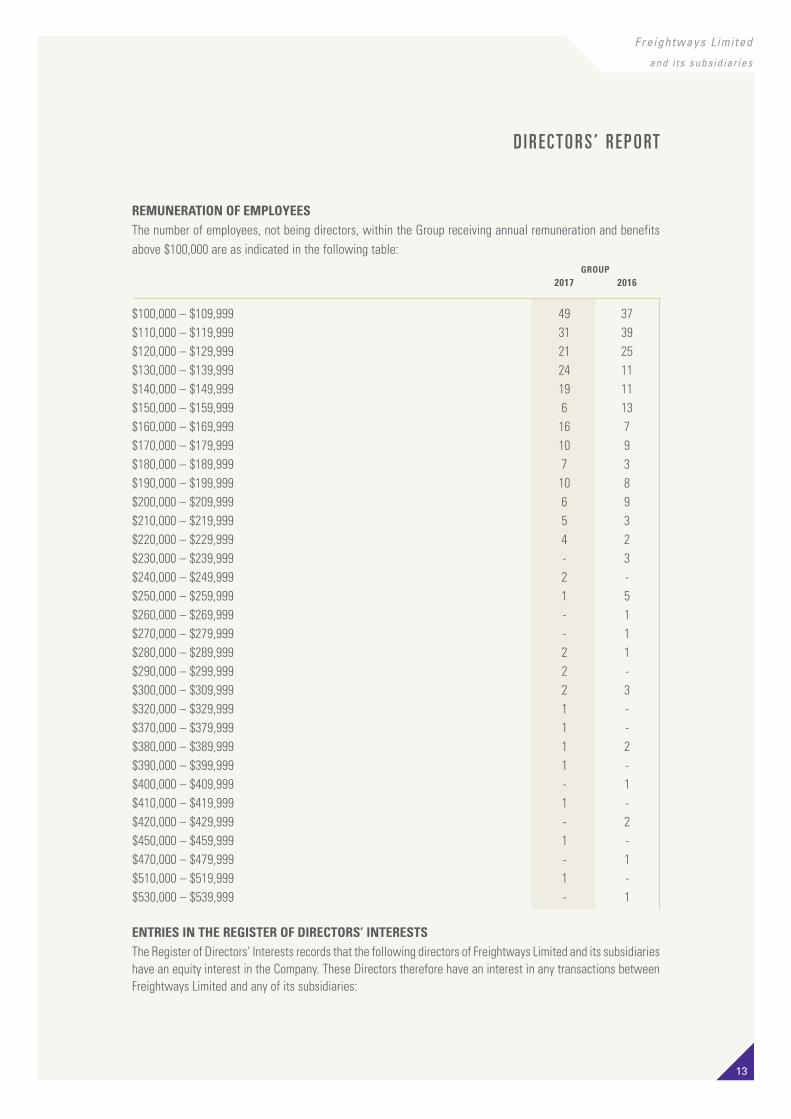
REMUNERATION OF EMPLOYEESThe number of employees, not being directors, within the Group receiving annual remuneration and benefits above $100,000 are as indicated in the following table: GROUP 2017 2016
$100,000 – $109,999 49 37$110,000 – $119,999 31 39$120,000 – $129,999 21 25$130,000 – $139,999 24 11$140,000 – $149,999 19 11$150,000 – $159,999 6 13$160,000 – $169,999 16 7$170,000 – $179,999 10 9$180,000 – $189,999 7 3$190,000 – $199,999 10 8$200,000 – $209,999 6 9$210,000 – $219,999 5 3$220,000 – $229,999 4 2$230,000 – $239,999 - 3$240,000 – $249,999 2 -$250,000 – $259,999 1 5$260,000 – $269,999 - 1$270,000 – $279,999 - 1$280,000 – $289,999 2 1$290,000 – $299,999 2 -$300,000 – $309,999 2 3$320,000 – $329,999 1 -$370,000 – $379,999 1 -$380,000 – $389,999 1 2$390,000 – $399,999 1 -$400,000 – $409,999 - 1$410,000 – $419,999 1 -$420,000 – $429,999 - 2$450,000 – $459,999 1 -$470,000 – $479,999 - 1$510,000 – $519,999 1 -$530,000 – $539,999 - 1
14
Fre ightways L imi ted
and i ts subsid iar ies
D I R E C TO R S ’ R E P O RT
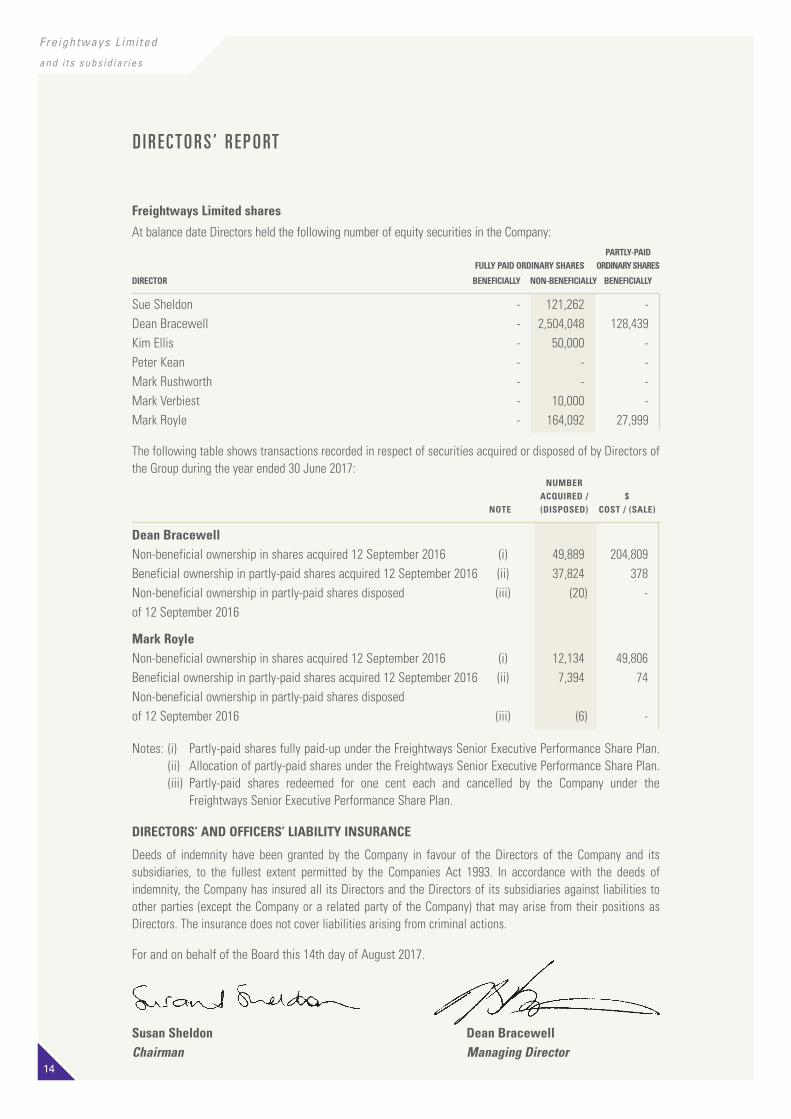
The following table shows transactions recorded in respect of securities acquired or disposed of by Directors of the Group during the year ended 30 June 2017: NUMBER ACQUIRED / $ NOTE (DISPOSED) COST / (SALE)
Dean BracewellNon-beneficial ownership in shares acquired 12 September 2016 (i) 49,889 204,809Beneficial ownership in partly-paid shares acquired 12 September 2016 (ii) 37,824 378Non-beneficial ownership in partly-paid shares disposed (iii) (20) -of 12 September 2016
Mark RoyleNon-beneficial ownership in shares acquired 12 September 2016 (i) 12,134 49,806Beneficial ownership in partly-paid shares acquired 12 September 2016 (ii) 7,394 74Non-beneficial ownership in partly-paid shares disposed of 12 September 2016 (iii) (6) -
Notes: (i) Partly-paid shares fully paid-up under the Freightways Senior Executive Performance Share Plan.(ii) Allocation of partly-paid shares under the Freightways Senior Executive Performance Share Plan. (iii) Partly-paid shares redeemed for one cent each and cancelled by the Company under the
Freightways Senior Executive Performance Share Plan.
DIRECTORS’ AND OFFICERS’ LIABILITY INSURANCE
Deeds of indemnity have been granted by the Company in favour of the Directors of the Company and its subsidiaries, to the fullest extent permitted by the Companies Act 1993. In accordance with the deeds of indemnity, the Company has insured all its Directors and the Directors of its subsidiaries against liabilities to other parties (except the Company or a related party of the Company) that may arise from their positions as Directors. The insurance does not cover liabilities arising from criminal actions.
For and on behalf of the Board this 14th day of August 2017.
Susan Sheldon Dean Bracewell Chairman Managing Director
Freightways Limited shares
At balance date Directors held the following number of equity securities in the Company: PARTLY-PAID FULLY PAID ORDINARY SHARES ORDINARY SHARES
DIRECTOR BENEFICIALLY NON-BENEFICIALLY BENEFICIALLY
Sue Sheldon - 121,262 -Dean Bracewell - 2,504,048 128,439Kim Ellis - 50,000 -Peter Kean - - -Mark Rushworth - - -Mark Verbiest - 10,000 -Mark Royle - 164,092 27,999
Fre ightways L imi ted
and i ts subsid iar ies
15
The financial statements comprise:
• the balance sheet as at 30 June 2017;
• the income statement for the year then ended;
• the statement of comprehensive income for the year then ended;
• the statement of changes in equity for the year then ended;
• the statement of cash flows for the year then ended; and
• the notes to the financial statements, which include a summary of significant accounting policies.
Our opinionIn our opinion, the financial statements of Freightways Limited (the Company), including its subsidiaries (the Group), present fairly, in all material respects, the financial position of the Group as at 30 June 2017, its financial performance and its cash flows for the year then ended in accordance with New Zealand Equivalents to International Financial Reporting Standards (NZ IFRS) and International Financial Reporting Standards (IFRS).
Basis for opinionWe conducted our audit in accordance with International Standards on Auditing (New Zealand) (ISAs NZ) and International Standards on Auditing (ISAs). Our responsibilities under those standards are further described in the Auditor’s responsibilities for the audit of the financial statements section of our report.
We believe that the audit evidence we have obtained is sufficient and appropriate to provide a basis for our opinion.
We are independent of the Group in accordance with Professional and Ethical Standard 1 (Revised) Code of Ethics for Assurance Practitioners (PES 1) issued by the New Zealand Auditing and Assurance Standards Board and the International Ethics Standards Board for Accountants’ Code of Ethics for Professional Accountants (IESBA Code), and we have fulfilled our other ethical responsibilities in accordance with these requirements.
Our firm carries out other services for the Group in the areas of Executive Remuneration Benchmarking and other related assurance services. The provision of these other services has not impaired our independence as auditor of the Group.
OUR AUDIT APPROACH
OverviewAn audit is designed to obtain reasonable assurance whether the financial statements are free from material misstatement.
Overall Group materiality: $4 million, which represents 5% of profit before tax.
We chose profit before tax as the benchmark because, in our view, it is the benchmark against which the performance of the Group is most commonly measured by users, and is a generally accepted benchmark.
We have the following key audit matters:• Impairment assessment of goodwill and brands• Prepaid Ticket Liability.
MaterialityThe scope of our audit was influenced by our application of materiality.
Based on our professional judgement, we determined certain quantitative thresholds for materiality, including the overall Group materiality for the financial statements as a whole as set out above. These, together with qualitative considerations, helped us to determine the scope of our audit, the nature, timing and extent of our audit procedures and to evaluate the effect of misstatements, both individually and in aggregate on the financial statements as a whole.
Audit scopeWe designed our audit by assessing the risks of material misstatement in the financial statements and our application of materiality. As in all of our audits, we also addressed the risk of management override of internal controls including, among other matters, consideration of whether there was evidence of bias that represented a risk of material misstatement due to fraud.
I N D E P E N D E N T AU D I TO R ’ S R E P O RTTO THE SHAREHOLDERS OF FREIGHTWAYS LIMITED
16
Fre ightways L imi ted
and i ts subsid iar ies
We tailored the scope of our audit in order to perform sufficient work to enable us to provide an opinion on the financial statements as a whole, taking into account the structure of the Group, the accounting processes and controls, and the industries in which the Group operates.
We conducted full scope audit work at four divisions which make up 71% of external revenue and 81% of profit before tax in New Zealand and Australia. The remaining divisions in the Group were not considered individually significant and depending on our risk assessment were subject to other audit procedures such as analytical review, enquiry, testing key balances or reconciliations.
Key audit mattersKey audit matters are those matters that, in our professional judgement, were of most significance in our audit of the financial statements of the current year. These matters were addressed in the context of our audit of the financial statements as a whole, and in forming our opinion thereon, and we do not provide a separate opinion on these matters.
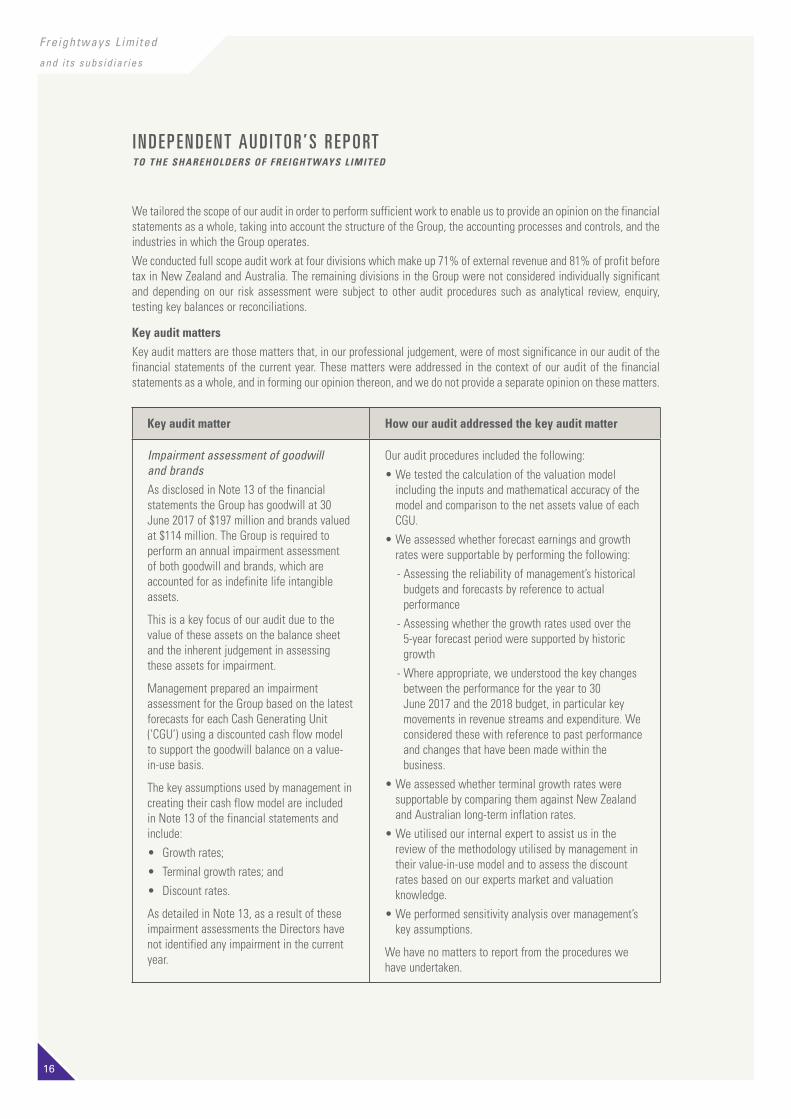
Key audit matter How our audit addressed the key audit matter
Impairment assessment of goodwill and brandsAs disclosed in Note 13 of the financial statements the Group has goodwill at 30 June 2017 of $197 million and brands valued at $114 million. The Group is required to perform an annual impairment assessment of both goodwill and brands, which are accounted for as indefinite life intangible assets.
This is a key focus of our audit due to the value of these assets on the balance sheet and the inherent judgement in assessing these assets for impairment.
Management prepared an impairment assessment for the Group based on the latest forecasts for each Cash Generating Unit (‘CGU’) using a discounted cash flow model to support the goodwill balance on a value-in-use basis.
The key assumptions used by management in creating their cash flow model are included in Note 13 of the financial statements and include:
• Growth rates;
• Terminal growth rates; and
• Discount rates.
As detailed in Note 13, as a result of these impairment assessments the Directors have not identified any impairment in the current year.
Our audit procedures included the following:
• We tested the calculation of the valuation model including the inputs and mathematical accuracy of the model and comparison to the net assets value of each CGU.
• We assessed whether forecast earnings and growth rates were supportable by performing the following:
- Assessing the reliability of management’s historical budgets and forecasts by reference to actual performance
- Assessing whether the growth rates used over the 5-year forecast period were supported by historic growth
- Where appropriate, we understood the key changes between the performance for the year to 30 June 2017 and the 2018 budget, in particular key movements in revenue streams and expenditure. We considered these with reference to past performance and changes that have been made within the business.
• We assessed whether terminal growth rates were supportable by comparing them against New Zealand and Australian long-term inflation rates.
• We utilised our internal expert to assist us in the review of the methodology utilised by management in their value-in-use model and to assess the discount rates based on our experts market and valuation knowledge.
• We performed sensitivity analysis over management’s key assumptions.
We have no matters to report from the procedures we have undertaken.
I N D E P E N D E N T AU D I TO R ’ S R E P O RTTO THE SHAREHOLDERS OF FREIGHTWAYS LIMITED

Fre ightways L imi ted
and i ts subsid iar ies
17
I N D E P E N D E N T AU D I TO R ’ S R E P O RTTO THE SHAREHOLDERS OF FREIGHTWAYS LIMITED
Key audit matter How our audit addressed the key audit matter
Prepaid Ticket Liability (‘PTL’)The prepaid ticket liability is disclosed as ‘unearned income’ on the balance sheet which represents the deferral of revenue in relation to courier sales in advance of the service having been provided. The PTL at 30 June 2017 was $15.4 million.
The PTL is an area of focus due to the extent of audit effort that is required to test the liability.
At each balance sheet date, the calculation of the PTL is based on the likely utilisation of the prepaid ticketsoutstanding at year end. This is based on historical prepaid ticket utilisation. The percentage of tickets not expected to be used is released from the PTL to the income statement as revenue.
Our audit procedures included the following:
We confirmed that the methodology applied for the year ended 30 June 2017 was consistent with previous periods.
• We substantively tested the historical sales and use of prepaid tickets to assess the usage assumptions for the calculation of the liability in the current year.
• We tested the system reports from which the data used in the PTL calculation and revenue recorded as follows:
a) the sales of prepaid tickets during the year, which increase the liability, were sample tested to invoices issued and cash received.
b) for completeness of sales of prepaid tickets we have agreed a sample of cash receipts from bank statements to ensure the sale of the prepaid ticket was recorded as an increase in the liability.
c) to obtain comfort over the revenue recognised from prepaid tickets being used, for a sample of deliveries, we agreed the usage date to the date that the package was scanned as delivered per the parcel tracking website, and checked that the driver was subsequently paid for delivery.
• We challenged management’s underlying assumptions of usage rates and the methodology used in the PTL calculations by re-computing the usage profile calculation based on the above tested inputs, as well as assessing whether the revenue recognition policies adopted comply with the accounting standards.
• We re-performed the calculation of the PTL to test the mathematical accuracy of the model.
From the evidence obtained and procedures performed, the outcome of our testing was consistent with management's estimate.
Information other than the financial statements and auditor’s reportThe Directors are responsible for the annual report. Our opinion on the financial statements does not cover the other information included in the annual report and we do not express any form of assurance conclusion on the other information.
In connection with our audit of the financial statements, our responsibility is to read the other information and, in doing so, consider whether the other information is materially inconsistent with the financial statements or our knowledge obtained in the audit, or otherwise appears to be materially misstated. If, based on the work we have performed on the other information that we obtained prior to the date of this auditor’s report, we conclude that there is a material misstatement of this other information, we are required to report that fact. We have nothing to report in this regard.

18
Fre ightways L imi ted
and i ts subsid iar ies
Chartered Accountants, Auckland14 August 2017
Responsibilities of the Directors for the consolidated financial statementsThe Directors are responsible, on behalf of the Company, for the preparation and fair presentation of the financial statements in accordance with NZ IFRS and IFRS, and for such internal control as the Directors determine is necessary to enable the preparation of financial statements that are free from material misstatement, whether due to fraud or error.
In preparing the financial statements, the Directors are responsible for assessing the Group’s ability to continue as a going concern, disclosing, as applicable, matters related to going concern and using the going concern basis of accounting unless the Directors either intend to liquidate the Group or to cease operations, or have no realistic alternative but to do so.
Auditor’s responsibilities for the audit of the financial statementsOur objectives are to obtain reasonable assurance about whether the financial statements, as a whole, are free from material misstatement, whether due to fraud or error, and to issue an auditor’s report that includes our opinion. Reasonable assurance is a high level of assurance, but is not a guarantee that an audit conducted in accordance with ISAs NZ and ISAs will always detect a material misstatement when it exists. Misstatements can arise from fraud or error and are considered material if, individually or in the aggregate, they could reasonably be expected to influence the economic decisions of users taken on the basis of these financial statements.
A further description of our responsibilities for the audit of the financial statements is located at the External Reporting Board’s website at: https://www.xrb.govt.nz/standards-for-assurance-practitioners/auditors-responsibiiities/audit-rep01t-1/This description forms part of our auditor’s report.
Who we report toThis report is made solely to the Company’s shareholders, as a body. Our audit work has been undertaken so that we might state those matters which we are required to state to them in an auditor’s report and for no other purpose. To the fullest extent permitted by law, we do not accept or assume responsibility to anyone other than the Company and the Company’s shareholders, as a body, for our audit work, for this report or for the opinions we have formed.
The engagement partner on the audit resulting in this independent auditor’s report is Leopino (Leo) Foliaki.
For and on behalf of:
I N D E P E N D E N T AU D I TO R ’ S R E P O RTTO THE SHAREHOLDERS OF FREIGHTWAYS LIMITED

Fre ightways L imi ted
and i ts subsid iar ies
19
I N C O M E S TAT E M E N TFOR THE YEAR ENDED 30 JUNE 2017
GROUP 2017 2016 NOTE $000 $000
Operating revenue 2 545,262 505,360Transport and logistics expenses (215,883) (195,060)Employee benefits expenses (149,896) (138,868)Occupancy expenses (24,768) (23,360)General and administration expenses (53,718) (49,613)Non-recurring items 3 3,686 (6,337)Operating profit before interest, income tax, depreciation and software amortisation, and amortisation of intangibles 104,683 92,122
Depreciation and software amortisation 3 (11,652) (10,761)
Operating profit before interest, income tax and amortisation of intangibles 93,031 81,361Amortisation of intangibles 3 (1,679) (1,685)
Profit before interest and income tax 91,352 79,676Net interest and finance costs 3 (9,570) (11,055)Profit before income tax 81,782 68,621Income tax 4 (20,926) (18,847)
Profit for the year attributable to the shareholders 60,856 49,774
Earnings per share 24Basic earnings per share (cents) 39.3 32.2
Diluted earnings per share (cents) 39.2 32.1
NB: All revenue and earnings are from continuing operations.The above Income Statement should be read in conjunction with the accompanying notes.

20
Fre ightways L imi ted
and i ts subsid iar ies
GROUP 2017 2016 NOTE $000 $000
Profit for the year (NPAT) 60,856 49,774
Other comprehensive incomeItems that may be reclassified subsequently to profit or loss:Exchange differences on translation of foreign operations 20 (41) (2,585)Cash flow hedges taken directly to equity, net of tax 20 2,927 (2,636)
Total other comprehensive income after income tax 2,886 (5,221)
Total comprehensive income for the year attributable to the shareholders 63,742 44,553
The above Statement of Comprehensive Income should be read in conjunction with the accompanying notes.
S TAT E M E N T O F C O M P R E H E N S I V E I N C O M EFOR THE YEAR ENDED 30 JUNE 2017

Fre ightways L imi ted
and i ts subsid iar ies
21
S TAT E M E N T O F C H A N G E S I N E Q U I T YFOR THE YEAR ENDED 30 JUNE 2017
CONTRIBUTED RETAINED CASH FLOW FOREIGN TOTAL GROUP EQUITY EARNINGS HEDGE CURRENCY EQUITY RESERVE TRANSLATION RESERVE
Balance at 1 July 2016 123,852 105,824 (9,417) (5,403) 214,856Profit for the year - 60,856 - - 60,856Exchange differences on translation of foreign operations - - - (41) (41)Cash flow hedges taken directly toequity, net of tax - - 2,927 - 2,927Total comprehensive income - 60,856 2,927 (41) 63,742Dividend payments - (42,608) - - (42,608)Shares issued 578 - - - 578Balance at 30 June 2017 124,430 124,072 (6,490) (5,444) 236,568
$000 $000 $000 $000 $000
CONTRIBUTED RETAINED CASH FLOW FOREIGN TOTAL GROUP EQUITY EARNINGS HEDGE CURRENCY EQUITY RESERVE TRANSLATION RESERVE
Balance at 1 July 2015 122,858 95,128 (6,781) (2,818) 208,387Profit for the year - 49,774 - - 49,774Exchange differences on translation of foreign operations - - - (2,585) (2,585) Cash flow hedges taken directly to equity, net of tax - - (2,636) - (2,636)Total comprehensive income - 49,774 (2,636) (2,585) 44,553Dividend payments - (39,078) - - (39,078)Shares issued 994 - - - 994 Balance at 30 June 2016 123,852 105,824 (9,417) (5,403) 214,856
$000 $000 $000 $000 $000
The above Statements of Changes in Equity should be read in conjunction with the accompanying notes.
The Board of Directors of Freightways Limited authorised these financial statements for issue on the date below.
For and on behalf of the Board this 14th day of August 2017.
Susan Sheldon Dean Bracewell Chairman Managing Director

22
Fre ightways L imi ted
and i ts subsid iar ies
GROUP 2017 2016 NOTE $000 $000 (Restated)
Current assetsCash and cash equivalents 6 8,423 7,065Trade and other receivables 7 77,184 68,865Inventories 8 5,190 5,248 Income tax receivable 705 - 91,502 81,178Assets held for sale 9 - 1,000Total current assets 91,502 82,178
Non-current assets
Trade receivables and other non-current assets 7 2,914 190Property, plant and equipment 12 101,934 88,621Intangible assets 13 343,543 337,904Total non-current assets 448,391 426,715Total assets 539,893 508,893
Current liabilitiesTrade and other payables 15 65,722 54,679Finance lease liabilities 147 79Income tax payable 3,350 6,145Provisions 17 1,008 1,115Derivative financial instruments 10 2,054 779Unearned income 18 15,446 16,391
Total current liabilities 87,727 79,188
Non-current liabilitiesTrade and other payables 15 2,867 6,368Borrowings (secured) 19 166,241 158,801Deferred tax liability 14 35,606 34,491Provisions 17 3,691 3,035Finance lease liabilities 204 32Derivative financial instruments 10 6,989 12,122
Total non-current liabilities 215,598 214,849
Total liabilities 303,325 294,037
Net assets 236,568 214,856
EquityContributed equity 124,430 123,852Retained earnings 124,072 105,824Cash flow hedge reserve (6,490) (9,417)Foreign currency translation reserve (5,444) (5,403)Total equity 20 236,568 214,856
The above Balance Sheet should be read in conjunction with the accompanying notes.
B A L A N C E S H E E TAS AT 30 JUNE 2017
Fre ightways L imi ted
and i ts subsid iar ies
23
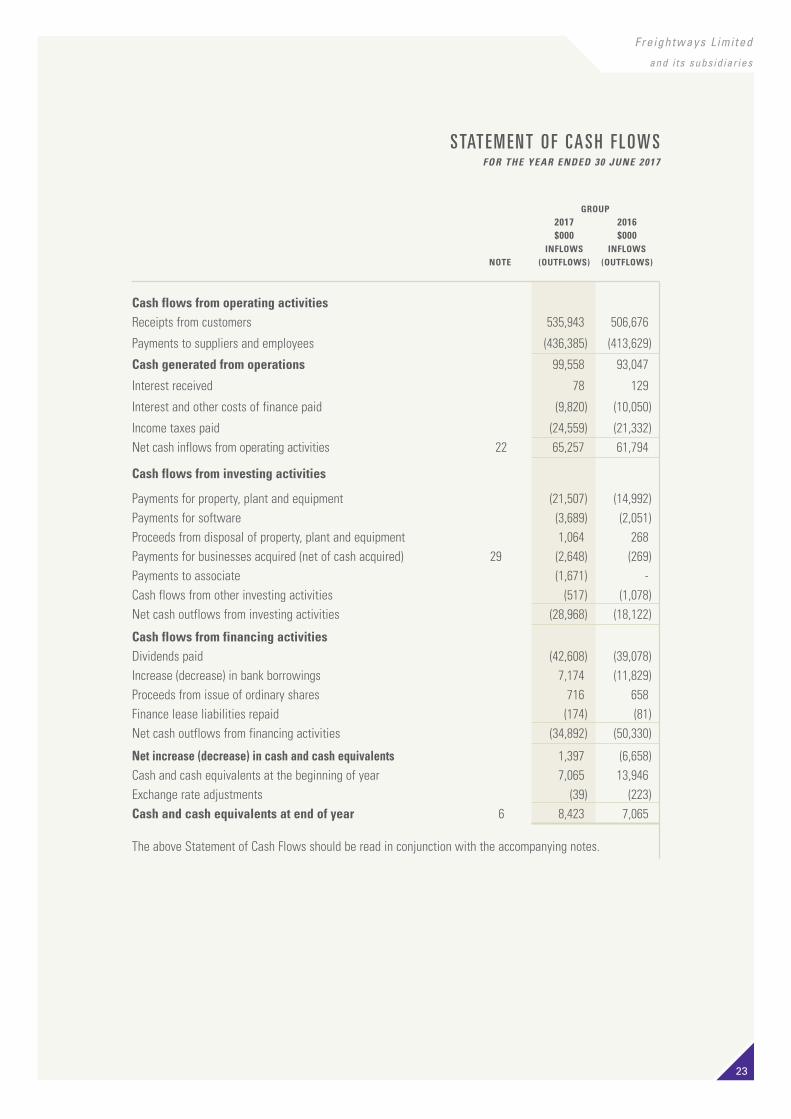
S TAT E M E N T O F CA S H F L OW SFOR THE YEAR ENDED 30 JUNE 2017
GROUP 2017 2016 $000 $000 INFLOWS INFLOWS NOTE (OUTFLOWS) (OUTFLOWS)
Cash flows from operating activities Receipts from customers 535,943 506,676
Payments to suppliers and employees (436,385) (413,629)
Cash generated from operations 99,558 93,047
Interest received 78 129
Interest and other costs of finance paid (9,820) (10,050)
Income taxes paid (24,559) (21,332)Net cash inflows from operating activities 22 65,257 61,794
Cash flows from investing activities
Payments for property, plant and equipment (21,507) (14,992) Payments for software (3,689) (2,051) Proceeds from disposal of property, plant and equipment 1,064 268 Payments for businesses acquired (net of cash acquired) 29 (2,648) (269)Payments to associate (1,671) - Cash flows from other investing activities (517) (1,078)Net cash outflows from investing activities (28,968) (18,122)
Cash flows from financing activitiesDividends paid (42,608) (39,078) Increase (decrease) in bank borrowings 7,174 (11,829) Proceeds from issue of ordinary shares 716 658Finance lease liabilities repaid (174) (81)Net cash outflows from financing activities (34,892) (50,330)
Net increase (decrease) in cash and cash equivalents 1,397 (6,658)Cash and cash equivalents at the beginning of year 7,065 13,946Exchange rate adjustments (39) (223)Cash and cash equivalents at end of year 6 8,423 7,065
The above Statement of Cash Flows should be read in conjunction with the accompanying notes.

24
Fre ightways L imi ted
and i ts subsid iar ies
N OT E S TO T H E F I N A N C I A L S TAT E M E N T SFOR THE YEAR ENDED 30 JUNE 2017
NOTE 1. SUMMARY OF SIGNIFICANT ACCOUNTING POLICIES
(a) Reporting entity and statutory base
Freightways Limited is a company registered under the Companies Act 1993 and is an FMC reporting entity under Part 7 of the Financial Markets Conduct Act 2013. The financial statements of the Group have been prepared in accordance with the requirements of Part 7 of the Financial Markets Conduct Act 2013 and the NZX Main Board Listing Rules. In accordance with the Financial Markets Conduct Act 2013, group financial statements are prepared and presented for Freightways Limited and its subsidiaries. Accordingly, separate financial statements for Freightways Limited are no longer required to be prepared and presented.
The financial statements are stated in New Zealand dollars rounded to the nearest thousand, unless otherwise indicated.
Basis of preparation
The consolidated financial statements of the Group have been prepared in accordance with Generally Accepted Accounting Practice in New Zealand (NZ GAAP).
The Group is a for-profit entity for the purposes of complying with NZ GAAP. The consolidated financial statements comply with New Zealand equivalents to International Financial Reporting Standards (NZ IFRS), other New Zealand accounting standards and authoritative notices that are applicable to entities that apply NZ IFRS. The consolidated financial statements also comply with International Financial Reporting Standards (IFRS).
Certain comparatives have been restated to align with current year presentation.
The consolidated financial statements have been prepared on a historical cost basis, except for derivative financial instruments, which have been measured at fair value and assets held for sale which are stated at fair value less estimated costs to sell.
Critical accounting estimates and judgements
The preparation of financial statements in conformity with NZ IFRS requires the use of certain critical accounting estimates, where necessary, and may require management to exercise judgement in the process of applying the Group’s accounting policies. There are no judgements made that are considered to have a significant risk of causing a material adjustment to the carrying value of assets or liabilities. Specific areas of critical accounting estimates and assumptions used are as follows:
(i) Carrying value of indefinite life intangible assets Impairment reviews are performed by management, at least annually, to assess the carrying value of
indefinite life intangible assets, including goodwill and brand names. The recoverable amounts of cash-generating units have been determined based on value-in-use calculations. These calculations require the use of estimates. Refer to Note 13.
(ii) Accounting for unearned income An unearned income liability is recorded in the balance sheet reflecting the future service obligation for
products that have been sold in advance of their use. The balance is supported by reference to historical customer prepaid product usage patterns. Accordingly, the balance is sensitive to movements in the future level of customer purchases and use of prepaid products, which involves estimates. Management regularly review the historical usage patterns to ensure adequate unearned income is recognised.
(iii) Fair value of derivatives The fair value of financial instruments that are not traded in an active market is determined by using
valuation techniques. The Group uses its judgement to select a variety of valuation methods and makes assumptions that are mainly based on market conditions existing at the end of each reporting period.
(iv) Customer relationships The estimation of the useful lives of customer relationships has been based on historical experience. The
useful lives are reviewed at least once per year and adjustments to useful lives are made when considered necessary.

Fre ightways L imi ted
and i ts subsid iar ies
25
N OT E S TO T H E F I N A N C I A L S TAT E M E N T SFOR THE YEAR ENDED 30 JUNE 2017
(v) Acquisition earn-out amounts payable The valuations of the Group’s acquisition earn-out amounts payable are based on the post-acquisition
performance of the acquired businesses. These fair value measurements require, among other things, significant estimation of post-acquisition performance of the acquired business and judgement on time value of money. Acquisition earn-out amounts payable shall be remeasured at their fair value resulting from events or factors that emerge after the acquisition date, with any resulting gain or loss recognised in the income statement. Judgement is applied to determine key assumptions (such as growth in sales and margins) adopted in the estimate of post-acquisition performance of the acquired business. Judgement is also applied to determine the appropriate discount rate applied to calculate the present value of the amount payable. Changes to key assumptions may impact the future payable amount. Refer also to Note 29.
(vi) Carrying value of aircraft and related inventory In June 2015, the Group announced that it would, through a joint venture with Airwork Limited, be
transitioning from its fleet of Convair aircraft to a fleet of Boeing 737-400 freighter aircraft during the year ended 30 June 2016 and wrote down the owned Convair aircraft and related inventory to their fair value less costs to sell. The transition was completed during the year ended 30 June 2017 and the owned Convair aircraft and related inventory were sold prior to 30 June 2017. Determining the amount of the write-down as at 30 June 2016 required significant judgement. In making this judgement, management of the Group evaluated, among other factors, market demand and pricing of similar aircraft. Refer to Notes 8 and 9.
(b) Basis of consolidation
(i) Subsidiaries Subsidiaries are entities that are controlled either directly by the Company or where the substance of
the relationship between the Company and the entity indicates the Company controls it. The results of businesses acquired or disposed of during the year are included in the consolidated income statement from the date of acquisition or up to the date of disposal.
The consolidated financial statements include the Company and its subsidiaries accounted for using the acquisition method. The cost of an acquisition is measured as the fair value of the assets acquired, equity instruments issued and liabilities incurred or assumed at the date of acquisition. Costs directly attributable to the acquisition are expensed to the income statement. Identifiable assets acquired, liabilities and contingent liabilities assumed in a business combination are measured initially at their fair values at acquisition date. The excess of the consideration transferred over the fair value of the Group’s share of the identifiable net assets acquired is recorded as goodwill.
All material transactions between subsidiaries or between the Company and subsidiaries are eliminated on consolidation. Accounting policies of subsidiaries are consistent with those adopted by the Group.
Any contingent consideration to be transferred by the Group is recognised at fair value at the acquisition date. Subsequent changes to the fair value of the contingent consideration that is deemed to be an asset or liability is recognised in accordance with NZ IAS 39 either in the income statement or as a change to other comprehensive income. Contingent consideration that is classified as equity is not remeasured, and its subsequent settlement is accounted for within equity.
(ii) Joint arrangements and joint ventures The Group applies NZ IFRS 11 to all joint arrangements. Under NZ IFRS 11 investments in joint
arrangements are classified as either joint operations or joint ventures depending on the contractual rights and obligations of each investor. The Group has assessed the nature of its joint arrangements and determined them to be joint ventures. Joint ventures are accounted for using the equity method.
Under the equity method of accounting, interests in joint ventures are initially recognised at cost and adjusted thereafter to recognise the Group’s share of the post-acquisition profits or losses and
26
Fre ightways L imi ted
and i ts subsid iar ies
N OT E S TO T H E F I N A N C I A L S TAT E M E N T SFOR THE YEAR ENDED 30 JUNE 2017
movements in other comprehensive income. When the Group’s share of losses in a joint venture equals or exceeds its interests in the joint venture (which includes any long-term interests that, in substance, form part of the Group’s net investment in the joint venture), the Group does not recognise further losses, unless it has incurred obligations or made payments on behalf of the joint venture.
Unrealised gains on transactions between the Group and its joint ventures are eliminated to the extent of the Group’s interest in the joint ventures. Unrealised losses are also eliminated unless the transaction provides evidence of an impairment of the asset transferred. Accounting policies of joint ventures are changed where necessary to ensure consistency with the policies adopted by the Group.
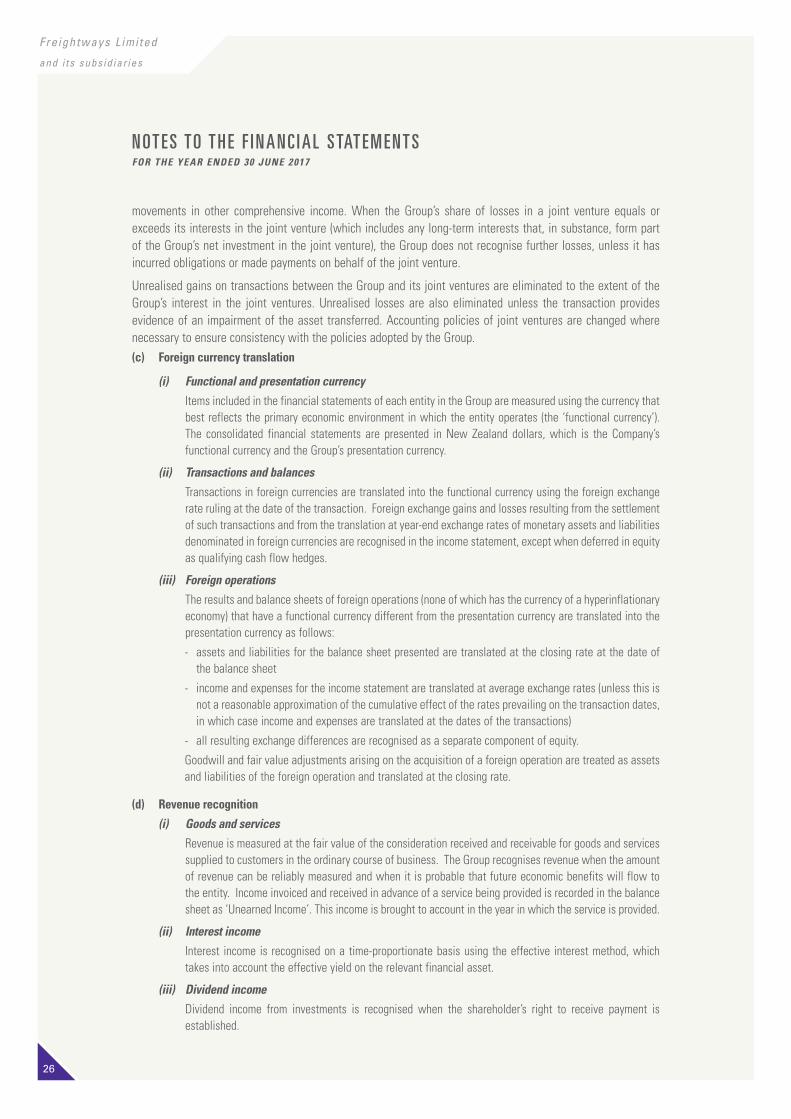
(c) Foreign currency translation
(i) Functional and presentation currency Items included in the financial statements of each entity in the Group are measured using the currency that
best reflects the primary economic environment in which the entity operates (the ‘functional currency’). The consolidated financial statements are presented in New Zealand dollars, which is the Company’s functional currency and the Group’s presentation currency.
(ii) Transactions and balances Transactions in foreign currencies are translated into the functional currency using the foreign exchange
rate ruling at the date of the transaction. Foreign exchange gains and losses resulting from the settlement of such transactions and from the translation at year-end exchange rates of monetary assets and liabilities denominated in foreign currencies are recognised in the income statement, except when deferred in equity as qualifying cash flow hedges.
(iii) Foreign operations The results and balance sheets of foreign operations (none of which has the currency of a hyperinflationary
economy) that have a functional currency different from the presentation currency are translated into the presentation currency as follows:
- assets and liabilities for the balance sheet presented are translated at the closing rate at the date of the balance sheet
- income and expenses for the income statement are translated at average exchange rates (unless this is not a reasonable approximation of the cumulative effect of the rates prevailing on the transaction dates, in which case income and expenses are translated at the dates of the transactions)
- all resulting exchange differences are recognised as a separate component of equity.
Goodwill and fair value adjustments arising on the acquisition of a foreign operation are treated as assets and liabilities of the foreign operation and translated at the closing rate.
(d) Revenue recognition
(i) Goods and services Revenue is measured at the fair value of the consideration received and receivable for goods and services
supplied to customers in the ordinary course of business. The Group recognises revenue when the amount of revenue can be reliably measured and when it is probable that future economic benefits will flow to the entity. Income invoiced and received in advance of a service being provided is recorded in the balance sheet as ‘Unearned Income’. This income is brought to account in the year in which the service is provided.
(ii) Interest income Interest income is recognised on a time-proportionate basis using the effective interest method, which
takes into account the effective yield on the relevant financial asset.
(iii) Dividend income Dividend income from investments is recognised when the shareholder’s right to receive payment is
established.

Fre ightways L imi ted
and i ts subsid iar ies
27
N OT E S TO T H E F I N A N C I A L S TAT E M E N T SFOR THE YEAR ENDED 30 JUNE 2017
(e) Impairment of non-financial assets
Assets that have an indefinite life are not subject to amortisation and are tested annually for impairment. Assets that are subject to amortisation or depreciation are reviewed for impairment whenever events or changes in circumstances indicate that the carrying amount may not be recoverable. An impairment loss is recognised for the amount by which the asset’s carrying amount exceeds its recoverable amount. The recoverable amount is the higher of an asset’s fair value, less costs to sell, and value-in-use. For the purposes of assessing impairment, assets are grouped at the lowest levels for which there are separately identifiable cash flows (cash-generating units).
(f) Financial assets
Regular purchases and sales of financial assets are recognised on the trade date, i.e. the date on which the Group commits to purchase or sell the asset. Financial assets are derecognised when the rights to receive cash flows from the investments have expired or the Group has transferred substantially all the risks and rewards of ownership.
Financial assets are classified into the following specified categories: financial assets ‘at fair value through profit or loss’ and ‘loans and receivables’. The classification depends on the nature and purpose of the financial assets and is determined at the time of initial recognition.
(i) Financial assets at fair value through profit or loss This category has two sub-categories: financial assets held for trading and those designated at fair value
through profit or loss at inception. A financial asset is classified in this category if acquired principally for the purpose of selling in the short term or if so designated by management. Derivatives are also categorised as held for trading unless they are designated as hedges. Assets in this category are classified as current assets if they are either held for trading or are expected to be realised within 12 months of the balance date.
(ii) Loans and receivables Loans and receivables are non-derivative instruments with fixed or determinable payments that are not
quoted in an active market. They are included in current assets, except for maturities greater than 12 months after the balance date, which are classified as non-current assets. Loans and receivables are reported separately in Trade and other receivables and Cash and cash equivalents on the balance sheet.
(g) Derivative financial instruments
Derivative financial instruments, such as interest rate caps and collar contracts and fixed rate agreements are entered into from time to time to manage interest rate exposure on borrowings. Forward exchange contracts are also entered into from time to time to manage foreign exchange exposures. Derivative financial instruments are initially recognised at fair value on the date a derivative contract is entered into and are subsequently remeasured and restated to their fair value at the reporting date. The method of recognising the resultant gain or loss depends on whether the derivative financial instrument is designated as a hedging instrument and, if so, the nature of the item being hedged. The Group designates derivative financial instruments as either fair value hedges (hedges of the fair value of recognised assets or liabilities or a firm commitment) or cash flow hedges (hedges of highly probable forecast transactions).
At the inception of the transaction, the Group documents the relationship between the hedging instrument and the hedged item, as well as its risk management objective and strategy for undertaking the hedge transaction. The Group also documents its assessment, both at hedge inception and on an ongoing basis, of whether the derivative financial instruments that are used in hedging transactions have been and will continue to be highly effective in offsetting changes in fair values or cash flows of hedged items.
(i) Fair value hedges Changes in the fair value of derivative financial instruments that are designated and qualify as fair value
hedges are recorded in the income statement, together with any changes in the fair value of the hedged asset or liability that are attributable to the hedged risk.

28
Fre ightways L imi ted
and i ts subsid iar ies
N OT E S TO T H E F I N A N C I A L S TAT E M E N T SFOR THE YEAR ENDED 30 JUNE 2017
(ii) Cash flow hedges The effective portion of changes in the fair value of derivative financial instruments that are designated
and qualify as cash flow hedges is recognised in equity in the cash flow hedge reserve. The gain or loss relating to any ineffective portion is recognised immediately in the income statement.
Amounts taken to equity are transferred to the income statement when the hedged transaction affects profit or loss, such as when hedged income or expenses are recognised or when a forecast sale or purchase occurs. When the hedged item is the cost of a non-financial asset or liability, the amounts taken to equity are transferred to the initial carrying amount of the non-financial asset or liability.
If the forecast transaction is no longer expected to occur, amounts previously recognised in equity are immediately transferred to the income statement. If the hedging instrument expires or is sold, terminated or exercised without replacement or rollover, or if its designation as a hedge is revoked, amounts previously recognised in equity remain in equity until the forecast transaction occurs. If the related transaction is not expected to occur, the amount is taken immediately to the income statement.
(iii) Derivatives that do not qualify for hedge accounting Certain derivative financial instruments do not qualify for hedge accounting or hedge accounting has
not been adopted. Changes in the fair value of these derivative financial instruments are recognised immediately in the income statement.
(h) Fair value estimation
The fair value of financial assets and financial liabilities is estimated for recognition and measurement or for disclosure purposes. The fair value of financial instruments that are not traded in an active market (for example, over-the-counter derivatives) is determined using accepted treasury valuation techniques, such as estimated discounted cash flows, by an external treasury management system provider. The carrying value of trade receivables (less provision for doubtful receivables) and payables approximates their fair values.
(i) Employee entitlements
(i) Wages, salaries and annual leave Liabilities for wages and salaries, including non-monetary benefits, and annual leave expected to be
settled within 12 months of the reporting date are recognised in respect of employees' services rendered up to the reporting date. They are measured for recognition by assessing the amounts expected to be paid when the liabilities are settled.
(ii) Long service leave Liability for long service leave is recognised and measured as the present value of expected future
payments to be made in respect of services provided by the employee. Consideration is given to expected future wage and salary levels, experience of employee departures and periods of service.
(iii) Share-based compensation The Group operates an equity-settled, share-based compensation plan for senior executives, under
which the Group receives services from employees as consideration for partly-paid ordinary shares in the Company. The fair value of the employee services received in exchange for the partly-paid ordinary shares is recognised as an expense. The total amount to be expensed is determined by reference to the fair value of the partly-paid ordinary shares allotted, taking into account market vesting conditions (for example, total shareholder return measures such as outperforming the median of the NZX50 Index), but excluding the impact of any non-market service and performance vesting conditions (for example, compound growth rates for earnings per share and remaining an employee of the Group over a specified time period). Non-market vesting conditions are included in assumptions about the number of partly-paid ordinary shares that are expected to vest. The total amount expensed is recognised over the relevant vesting period, which is the period over which all of the specified vesting conditions are to be satisfied. At each balance sheet date, the Group revises its estimates of the number of partly-paid ordinary shares that are expected to vest based on the non-market vesting conditions. It recognises the impact of the revision to original estimates, if any, in the income statement.
Fre ightways L imi ted
and i ts subsid iar ies
29
N OT E S TO T H E F I N A N C I A L S TAT E M E N T SFOR THE YEAR ENDED 30 JUNE 2017
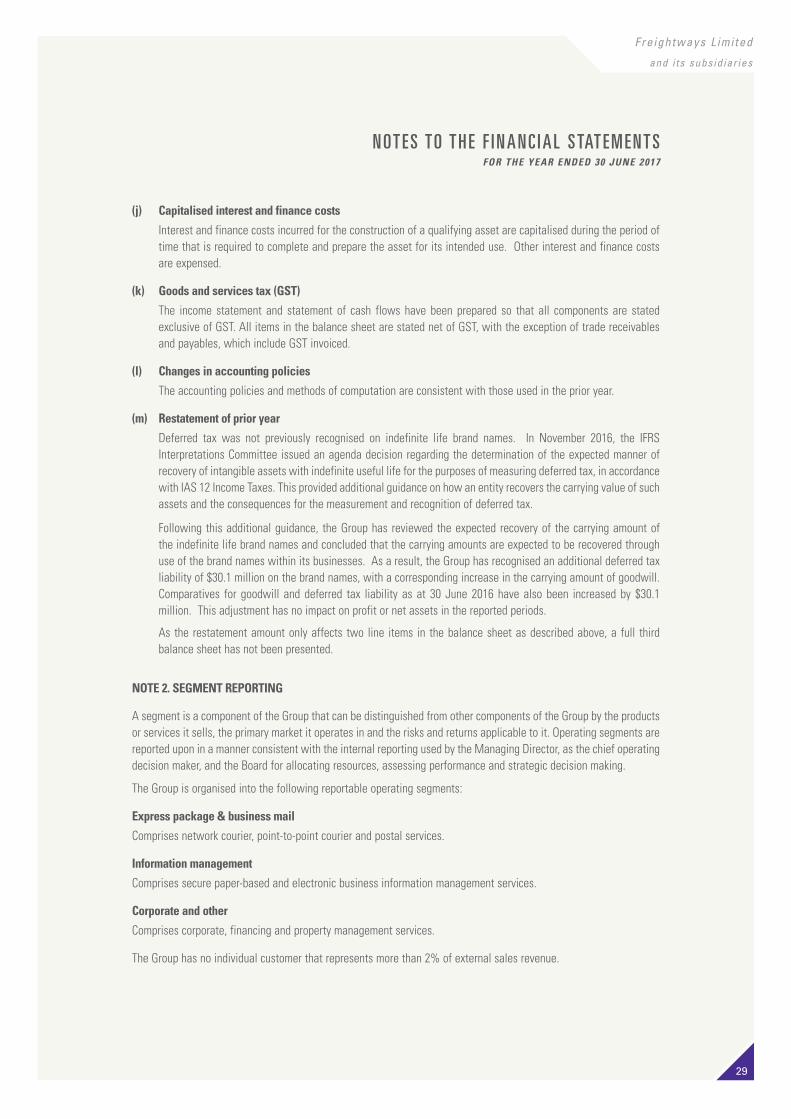
(j) Capitalised interest and finance costs
Interest and finance costs incurred for the construction of a qualifying asset are capitalised during the period of time that is required to complete and prepare the asset for its intended use. Other interest and finance costs are expensed.
(k) Goods and services tax (GST)
The income statement and statement of cash flows have been prepared so that all components are stated exclusive of GST. All items in the balance sheet are stated net of GST, with the exception of trade receivables and payables, which include GST invoiced.
(l) Changes in accounting policies
The accounting policies and methods of computation are consistent with those used in the prior year.
(m) Restatement of prior year
Deferred tax was not previously recognised on indefinite life brand names. In November 2016, the IFRS Interpretations Committee issued an agenda decision regarding the determination of the expected manner of recovery of intangible assets with indefinite useful life for the purposes of measuring deferred tax, in accordance with IAS 12 Income Taxes. This provided additional guidance on how an entity recovers the carrying value of such assets and the consequences for the measurement and recognition of deferred tax.
Following this additional guidance, the Group has reviewed the expected recovery of the carrying amount of the indefinite life brand names and concluded that the carrying amounts are expected to be recovered through use of the brand names within its businesses. As a result, the Group has recognised an additional deferred tax liability of $30.1 million on the brand names, with a corresponding increase in the carrying amount of goodwill. Comparatives for goodwill and deferred tax liability as at 30 June 2016 have also been increased by $30.1 million. This adjustment has no impact on profit or net assets in the reported periods.
As the restatement amount only affects two line items in the balance sheet as described above, a full third balance sheet has not been presented.
NOTE 2. SEGMENT REPORTING
A segment is a component of the Group that can be distinguished from other components of the Group by the products or services it sells, the primary market it operates in and the risks and returns applicable to it. Operating segments are reported upon in a manner consistent with the internal reporting used by the Managing Director, as the chief operating decision maker, and the Board for allocating resources, assessing performance and strategic decision making.
The Group is organised into the following reportable operating segments:
Express package & business mail
Comprises network courier, point-to-point courier and postal services.
Information management
Comprises secure paper-based and electronic business information management services.
Corporate and other
Comprises corporate, financing and property management services.
The Group has no individual customer that represents more than 2% of external sales revenue.

30
Fre ightways L imi ted
and i ts subsid iar ies
N OT E S TO T H E F I N A N C I A L S TAT E M E N T SFOR THE YEAR ENDED 30 JUNE 2017
Income statement
Sales to external customers 401,071 144,190 1 - 545,262
Inter-segment sales 1,522 47 4,510 (6,079) -
Total revenue 402,593 144,237 4,511 (6,079) 545,262
Operating profit before non-recurring items, interest, income tax, depreciation and software amortisation, and amortisation of intangibles 70,353 32,727 (2,083) - 100,997
Non-recurring items - 3,686 - - 3,686
Operating profit before interest, income tax, depreciation and software amortisation, and amortisation of intangibles 70,353 36,413 (2,083) - 104,683
Depreciation and software amortisation (5,083) (5,050) (1,519) - (11,652)
Operating profit before interest, income tax and amortisation of intangibles 65,270 31,363 (3,602) - 93,031
Amortisation of intangibles (50) (1,629) - - (1,679)
Profit before interest and income tax 65,220 29,734 (3,602) - 91,352
Net interest and finance costs (30) (320) (9,220) - (9,570)
Profit before income tax 65,190 29,414 (12,822) - 81,782
Income tax (18,050) (6,883) 4,007 - (20,926)
Profit for the year attributable to the shareholders 47,140 22,531 (8,815) - 60,856
Balance sheet
Segment assets 292,718 206,126 41,049 - 539,893
Segment liabilities 83,065 32,940 187,320 - 303,325
Additions to non-current assets, excluding deferred tax asset 19,456 12,567 96 - 32,119
EXPRESS INFORMATION CORPORATE INTER-SEGMENT CONSOLIDATED PACKAGE & MANAGEMENT ELIMINATION OPERATIONS BUSINESS MAIL $000 $000 $000 $000 $000
As at and for the year ended 30 June 2017:
Fre ightways L imi ted
and i ts subsid iar ies
31
N OT E S TO T H E F I N A N C I A L S TAT E M E N T SFOR THE YEAR ENDED 30 JUNE 2017
As at and for the year ended 30 June 2016:
EXPRESS INFORMATION CORPORATE INTER-SEGMENT CONSOLIDATED PACKAGE & MANAGEMENT ELIMINATION OPERATIONS BUSINESS MAIL $000 $000 $000 $000 $000
Income statement
Sales to external customers 368,536 136,821 3 - 505,360
Inter-segment sales 1,805 12 4,501 (6,318) -
Total revenue 370,341 136,833 4,504 (6,318) 505,360
Operating profit before non-recurring items, interest, income tax, depreciation and software amortisation, and amortisation of intangibles 66,515 33,238 (1,294) - 98,459
Non-recurring items (6,337) - - - (6,337)
Operating profit before interest, income tax, depreciation and software amortisation, and amortisation of intangibles 60,178 33,238 (1,294) - 92,122
Depreciation and software amortisation (4,440) (4,799) (1,522) - (10,761)
Operating profit before interest, income tax and amortisation of intangibles 55,738 28,439 (2,816) - 81,361
Amortisation of intangibles (50) (1,635) - - (1,685)
Profit before interest and income tax 55,688 26,804 (2,816) - 79,676
Net interest and finance costs (2) (928) (10,125) - (11,055)
Profit before income tax 55,686 25,876 (12,941) - 68,621
Income tax (15,790) (7,885) 4,828 - (18,847)
Profit for the year attributable to the shareholders 39,896 17,991 (8,113) - 49,774
Balance sheet
Segment assets (restated) 271,658 194,898 42,337 - 508,893
Segment liabilities (restated) 78,232 33,276 182,529 - 294,037
Additions to non-current assets, excluding deferred tax asset 11,022 11,637 10 - 22,669
Segment assets and liabilities are disclosed net of inter-company balances.
For the year ended 30 June 2017, external revenue from customers in the Group's New Zealand and Australian operations was $444.1 million and $101.2 million, respectively (2016: $410.4 million and $95.0 million, respectively). As at 30 June 2017, non-current assets in respect of the New Zealand and Australian operations (excluding deferred tax assets) were $308.2 million and $140.2 million, respectively (2016: $293.4 million and $133.3 million, respectively).
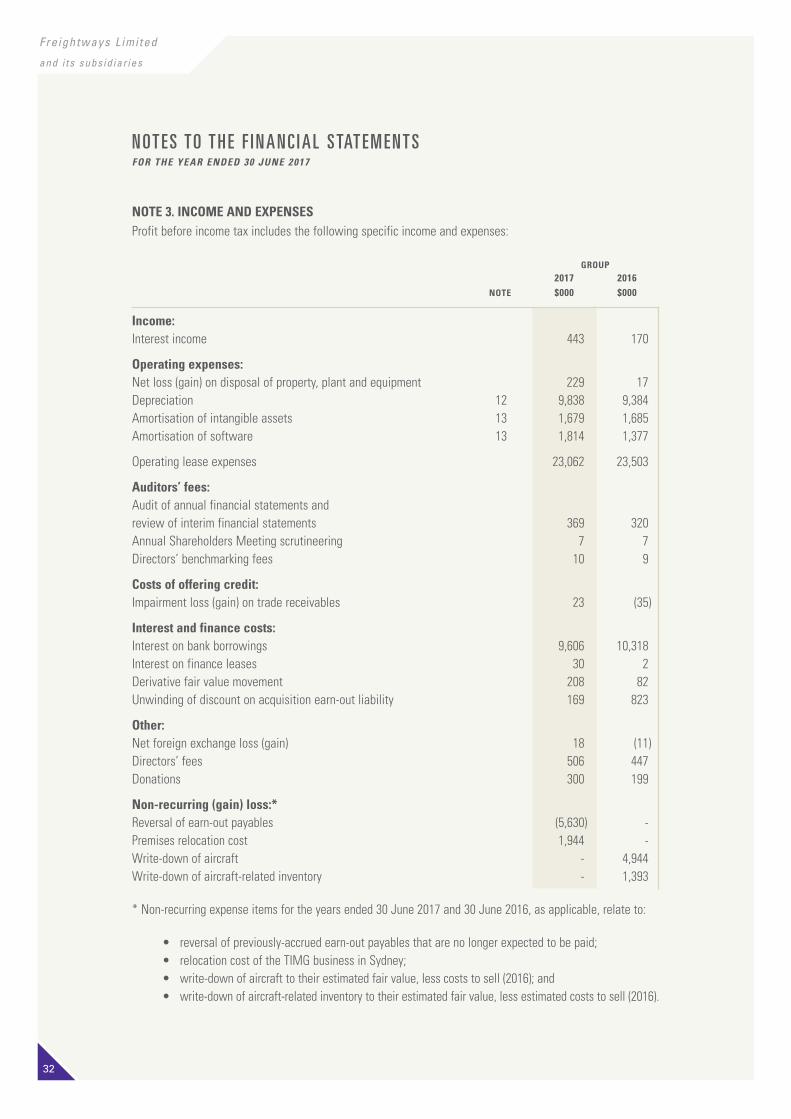
32
Fre ightways L imi ted
and i ts subsid iar ies
N OT E S TO T H E F I N A N C I A L S TAT E M E N T SFOR THE YEAR ENDED 30 JUNE 2017
NOTE 3. INCOME AND EXPENSESProfit before income tax includes the following specific income and expenses:
GROUP 2017 2016 NOTE $000 $000
Income: Interest income 443 170
Operating expenses: Net loss (gain) on disposal of property, plant and equipment 229 17Depreciation 12 9,838 9,384Amortisation of intangible assets 13 1,679 1,685Amortisation of software 13 1,814 1,377
Operating lease expenses 23,062 23,503
Auditors’ fees: Audit of annual financial statements andreview of interim financial statements 369 320Annual Shareholders Meeting scrutineering 7 7Directors’ benchmarking fees 10 9
Costs of offering credit: Impairment loss (gain) on trade receivables 23 (35)
Interest and finance costs: Interest on bank borrowings 9,606 10,318Interest on finance leases 30 2Derivative fair value movement 208 82 Unwinding of discount on acquisition earn-out liability 169 823
Other: Net foreign exchange loss (gain) 18 (11)Directors’ fees 506 447Donations 300 199
Non-recurring (gain) loss:* Reversal of earn-out payables (5,630) - Premises relocation cost 1,944 - Write-down of aircraft - 4,944 Write-down of aircraft-related inventory - 1,393
* Non-recurring expense items for the years ended 30 June 2017 and 30 June 2016, as applicable, relate to:
• reversal of previously-accrued earn-out payables that are no longer expected to be paid;• relocation cost of the TIMG business in Sydney;• write-down of aircraft to their estimated fair value, less costs to sell (2016); and• write-down of aircraft-related inventory to their estimated fair value, less estimated costs to sell (2016).
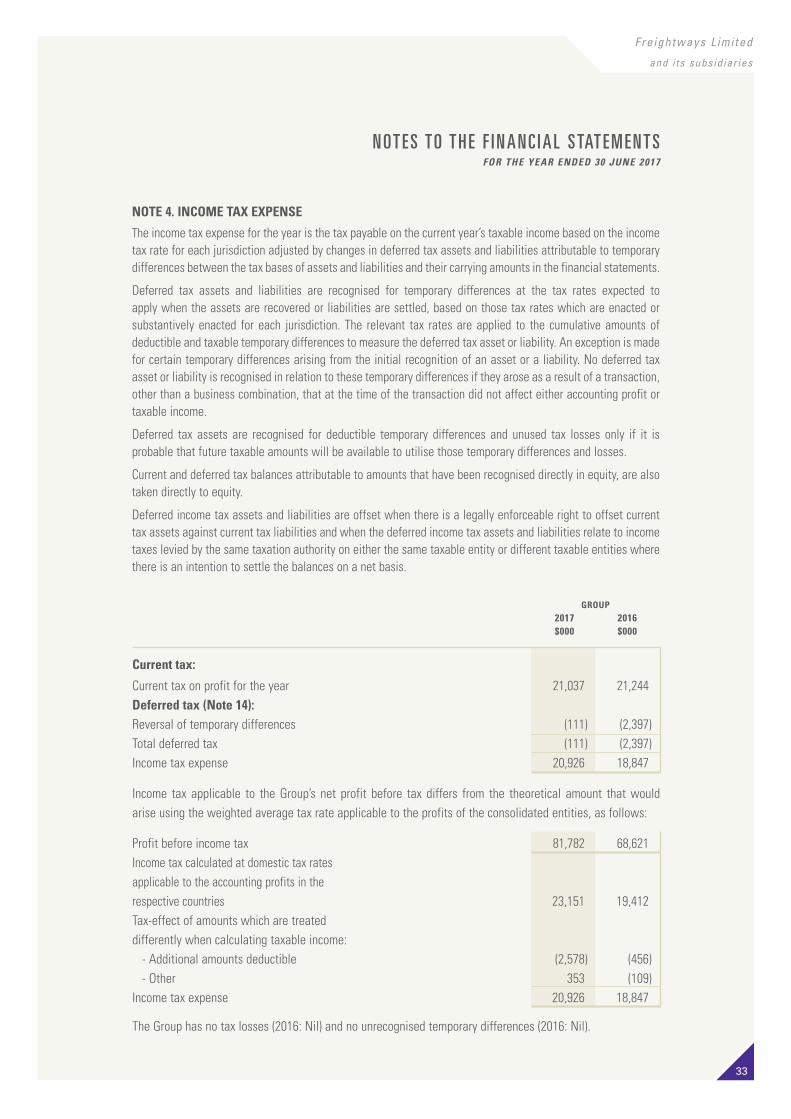
Fre ightways L imi ted
and i ts subsid iar ies
33
N OT E S TO T H E F I N A N C I A L S TAT E M E N T SFOR THE YEAR ENDED 30 JUNE 2017
GROUP 2017 2016 $000 $000
Current tax:
Current tax on profit for the year 21,037 21,244 Deferred tax (Note 14):Reversal of temporary differences (111) (2,397)Total deferred tax (111) (2,397)Income tax expense 20,926 18,847
Income tax applicable to the Group’s net profit before tax differs from the theoretical amount that would arise using the weighted average tax rate applicable to the profits of the consolidated entities, as follows:
Profit before income tax 81,782 68,621Income tax calculated at domestic tax rates applicable to the accounting profits in therespective countries 23,151 19,412Tax-effect of amounts which are treateddifferently when calculating taxable income: - Additional amounts deductible (2,578) (456) - Other 353 (109)Income tax expense 20,926 18,847
The Group has no tax losses (2016: Nil) and no unrecognised temporary differences (2016: Nil).
NOTE 4. INCOME TAX EXPENSE
The income tax expense for the year is the tax payable on the current year’s taxable income based on the income tax rate for each jurisdiction adjusted by changes in deferred tax assets and liabilities attributable to temporary differences between the tax bases of assets and liabilities and their carrying amounts in the financial statements.
Deferred tax assets and liabilities are recognised for temporary differences at the tax rates expected to apply when the assets are recovered or liabilities are settled, based on those tax rates which are enacted or substantively enacted for each jurisdiction. The relevant tax rates are applied to the cumulative amounts of deductible and taxable temporary differences to measure the deferred tax asset or liability. An exception is made for certain temporary differences arising from the initial recognition of an asset or a liability. No deferred tax asset or liability is recognised in relation to these temporary differences if they arose as a result of a transaction, other than a business combination, that at the time of the transaction did not affect either accounting profit or taxable income.
Deferred tax assets are recognised for deductible temporary differences and unused tax losses only if it is probable that future taxable amounts will be available to utilise those temporary differences and losses.
Current and deferred tax balances attributable to amounts that have been recognised directly in equity, are also taken directly to equity.
Deferred income tax assets and liabilities are offset when there is a legally enforceable right to offset current tax assets against current tax liabilities and when the deferred income tax assets and liabilities relate to income taxes levied by the same taxation authority on either the same taxable entity or different taxable entities where there is an intention to settle the balances on a net basis.
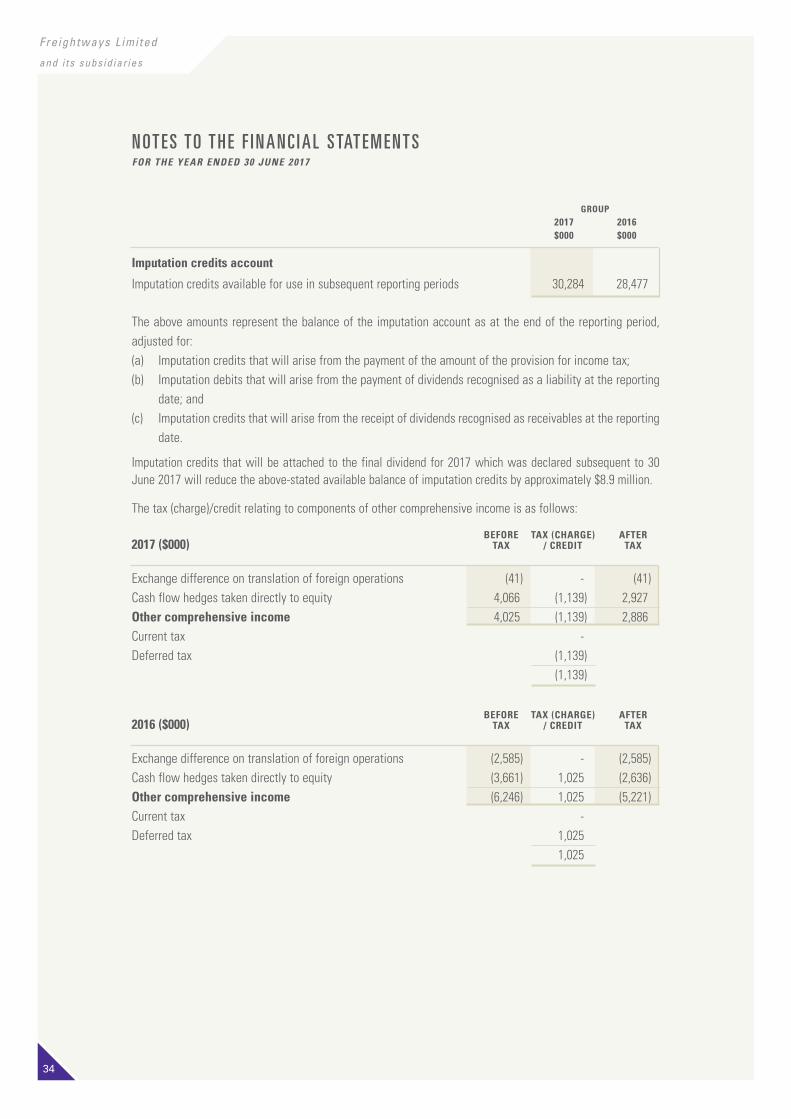
34
Fre ightways L imi ted
and i ts subsid iar ies
N OT E S TO T H E F I N A N C I A L S TAT E M E N T SFOR THE YEAR ENDED 30 JUNE 2017
GROUP 2017 2016 $000 $000
Imputation credits account
Imputation credits available for use in subsequent reporting periods 30,284 28,477
The above amounts represent the balance of the imputation account as at the end of the reporting period, adjusted for:(a) Imputation credits that will arise from the payment of the amount of the provision for income tax;(b) Imputation debits that will arise from the payment of dividends recognised as a liability at the reporting
date; and(c) Imputation credits that will arise from the receipt of dividends recognised as receivables at the reporting
date.
Imputation credits that will be attached to the final dividend for 2017 which was declared subsequent to 30 June 2017 will reduce the above-stated available balance of imputation credits by approximately $8.9 million.
The tax (charge)/credit relating to components of other comprehensive income is as follows:
BEFORE TAX (CHARGE) AFTER2017 ($000) TAX / CREDIT TAX
Exchange difference on translation of foreign operations (41) - (41)Cash flow hedges taken directly to equity 4,066 (1,139) 2,927Other comprehensive income 4,025 (1,139) 2,886Current tax - Deferred tax (1,139) (1,139)
BEFORE TAX (CHARGE) AFTER2016 ($000) TAX / CREDIT TAX
Exchange difference on translation of foreign operations (2,585) - (2,585)Cash flow hedges taken directly to equity (3,661) 1,025 (2,636)Other comprehensive income (6,246) 1,025 (5,221)Current tax - Deferred tax 1,025 1,025

Fre ightways L imi ted
and i ts subsid iar ies
35
N OT E S TO T H E F I N A N C I A L S TAT E M E N T SFOR THE YEAR ENDED 30 JUNE 2017
NOTE 5. DIVIDENDS
GROUP 2017 2016 $000 $000
Recognised amountsFully imputed dividends declared and paid during the year:
Final dividend for 2016 at 14.5 cents per share (2015: 12.5 cents) 22,466 19,345Interim dividend for 2017 at 13.0 cents per share (2016: 12.75 cents) 20,142 19,733 42,608 39,078
Unrecognised amountsFinal dividend for 2017 at 14.75 cents per share (2016: 14.5 cents) 22,884 22,473
Subsequent to balance date the above unrecognised dividend was approved by a directors’ resolution dated 14 August 2017. This amount has not been recognised as a liability at the reporting date, but will be brought to account when paid.
NOTE 6. CASH AND CASH EQUIVALENTS
Cash and cash equivalents comprise cash balances and overnight deposits. Bank overdrafts that are repayable on demand and form an integral part of the Group’s cash management are included as a component of cash and cash equivalents for the purpose of the statement of cash flows. Bank overdrafts are shown within borrowings in the current liabilities on the balance sheet to the extent they exceed the legal right of off-set against cash included in current assets.
GROUP 2017 2016 $000 $000
Comprises: - Cash at bank 8,318 6,960- Overnight deposits 105 105Cash and cash equivalents in statement of cash flows 8,423 7,065

36
Fre ightways L imi ted
and i ts subsid iar ies
N OT E S TO T H E F I N A N C I A L S TAT E M E N T SFOR THE YEAR ENDED 30 JUNE 2017
NOTE 7. TRADE RECEIVABLES AND OTHER NON-CURRENT ASSETS
Trade and other receivables are recognised at their fair value and subsequently measured at amortised cost using the effective interest rate, less provision for impairment.
GROUP 2017 2016 $000 $000
Current:
Trade receivables 67,249 60,965Provision for doubtful receivables (1,655) (1,649) 65,594 59,316Other debtors and prepayments 11,321 9,174Share plan loans receivable from employees 269 375 77,184 68,865Non-current: Share plan loans receivable from employees 140 172Other non-current assets 2,774 18 2,914 190
Trade receivables are non-interest bearing and are generally on 7-30 day terms.
Recoverability of trade and other receivables is reviewed on an ongoing basis. Amounts that are known to be uncollectible are written-off when identified. An allowance for doubtful receivables is raised when there is objective evidence that the Group will not be able to collect all amounts due according to the original terms of the receivable.
The movements in the provision for doubtful receivables for the Group were as follows:
GROUP 2017 2016 $000 $000
Opening balance 1,649 1,742Provision for doubtful receivables 192 108Receivables written off during the year as uncollectible (188) (164)Exchange rate movement 2 (37)Closing balance (Note 27.1(b)) 1,655 1,649

Fre ightways L imi ted
and i ts subsid iar ies
37
N OT E S TO T H E F I N A N C I A L S TAT E M E N T SFOR THE YEAR ENDED 30 JUNE 2017
NOTE 8. INVENTORIES
Inventories are stated at the lower of cost, determined on a first-in-first-out basis, and net realisable value. Full provision is made for obsolescence, where applicable. Net realisable value is the estimated selling price in the ordinary course of business, less the estimated costs of completion and the estimated costs necessary to make the sale. The cost of inventories recognised as an expense and included in ‘general and administration expenses’ amounted to $12.3 million (2016: $13.6 million).
GROUP 2017 2016 $000 $000
Finished goods 1,682 1,727Convair parts (refer Note 9 below) - 500Ticket stocks, uniforms and consumables 3,508 3,021 5,190 5,248
NOTE 9. ASSETS HELD FOR SALE
Assets are classified as assets held for sale when their carrying amount is to be recovered principally through a sale transaction. They are stated at the lower of carrying amount and fair value less estimated costs to sell and the Group intends to sell these assets within a year.
GROUP 2017 2016 $000 $000
Aircraft held for sale - 1,000
In June 2015, the Group announced that it would, through a joint venture with Airwork Limited, be transitioning from its fleet of Convair aircraft to a fleet of Boeing 737-400 freighter aircraft during the year ended 30 June 2016. In accordance with IFRS 5, the Group wrote down the owned Convair aircraft and related inventory to their fair value less costs to sell. The write-down was a non-recurring fair value adjustment which had been measured using observable inputs, including among other factors, market demand and pricing of similar aircraft and was therefore within Level 2 of the fair value hierarchy, as defined in Note 27.1(d). The aircraft and related parts (refer Note 8 above) were sold during the year ended 30 June 2017.
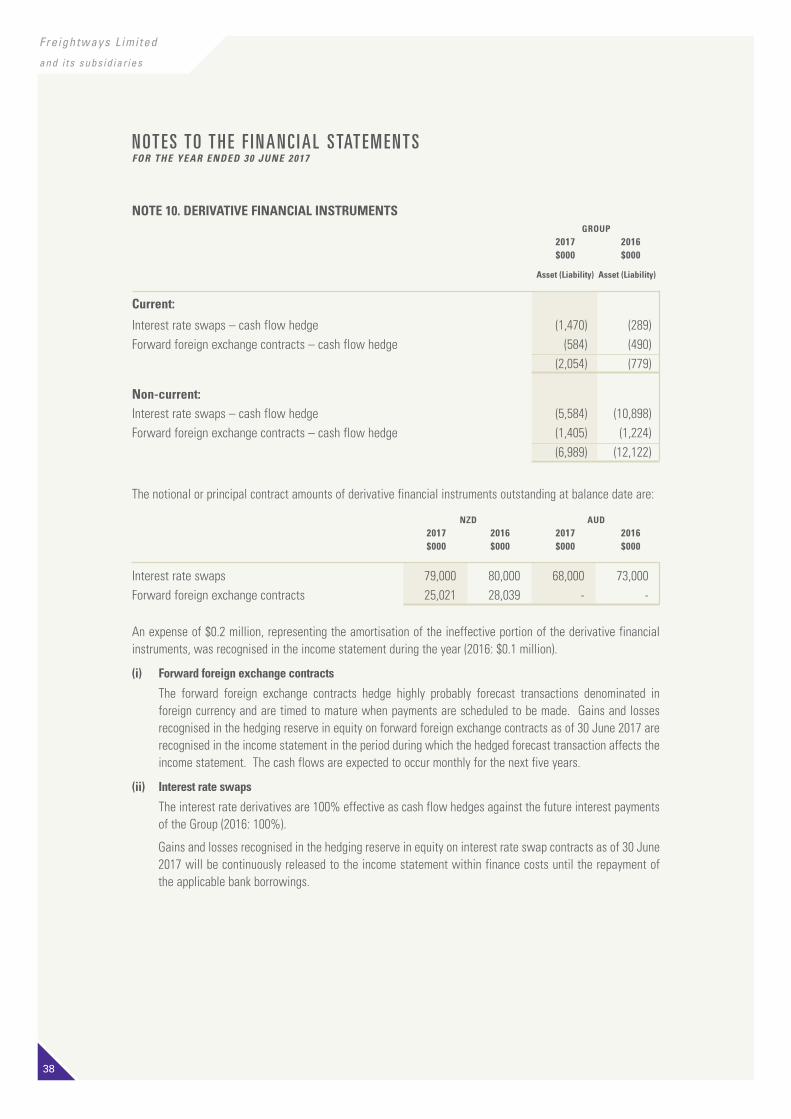
38
Fre ightways L imi ted
and i ts subsid iar ies
N OT E S TO T H E F I N A N C I A L S TAT E M E N T SFOR THE YEAR ENDED 30 JUNE 2017
NOTE 10. DERIVATIVE FINANCIAL INSTRUMENTS GROUP 2017 2016 $000 $000
Asset (Liability) Asset (Liability)
Current:
Interest rate swaps – cash flow hedge (1,470) (289)Forward foreign exchange contracts – cash flow hedge (584) (490) (2,054) (779)
Non-current:Interest rate swaps – cash flow hedge (5,584) (10,898)Forward foreign exchange contracts – cash flow hedge (1,405) (1,224) (6,989) (12,122)
The notional or principal contract amounts of derivative financial instruments outstanding at balance date are:
NZD AUD 2017 2016 2017 2016 $000 $000 $000 $000
Interest rate swaps 79,000 80,000 68,000 73,000Forward foreign exchange contracts 25,021 28,039 - -
An expense of $0.2 million, representing the amortisation of the ineffective portion of the derivative financial instruments, was recognised in the income statement during the year (2016: $0.1 million).
(i) Forward foreign exchange contracts
The forward foreign exchange contracts hedge highly probably forecast transactions denominated in foreign currency and are timed to mature when payments are scheduled to be made. Gains and losses recognised in the hedging reserve in equity on forward foreign exchange contracts as of 30 June 2017 are recognised in the income statement in the period during which the hedged forecast transaction affects the income statement. The cash flows are expected to occur monthly for the next five years.
(ii) Interest rate swaps
The interest rate derivatives are 100% effective as cash flow hedges against the future interest payments of the Group (2016: 100%).
Gains and losses recognised in the hedging reserve in equity on interest rate swap contracts as of 30 June 2017 will be continuously released to the income statement within finance costs until the repayment of the applicable bank borrowings.
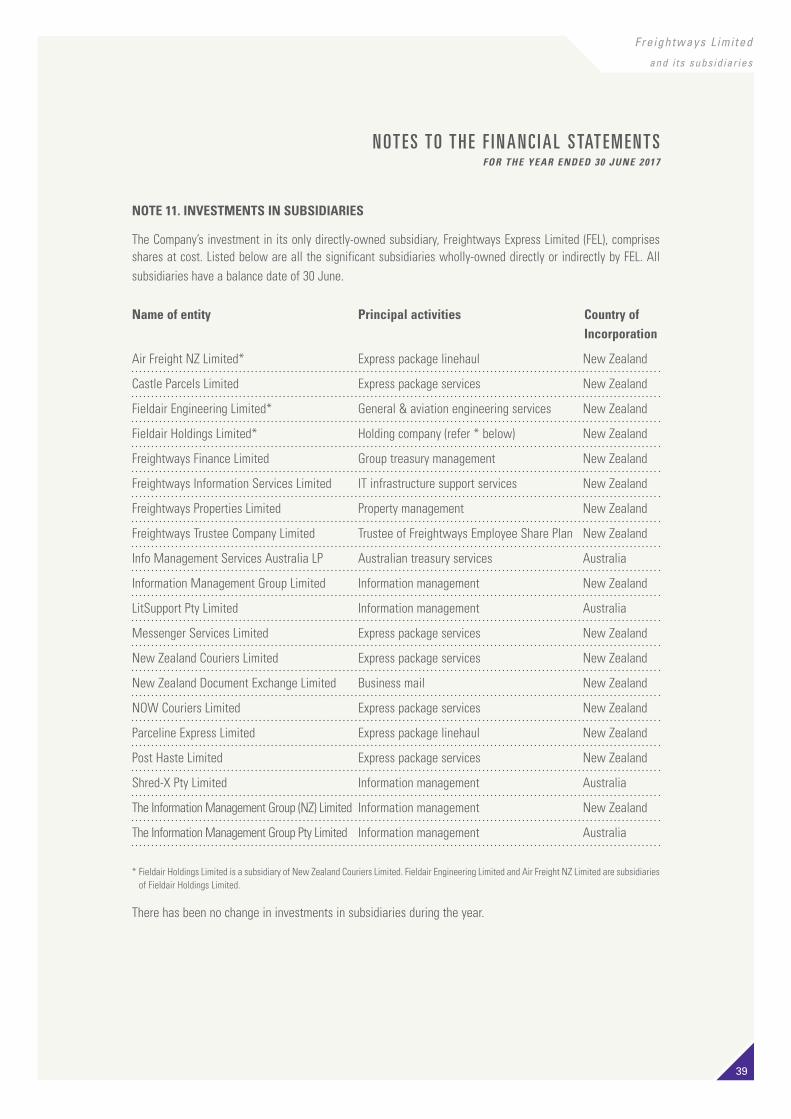
Fre ightways L imi ted
and i ts subsid iar ies
39
N OT E S TO T H E F I N A N C I A L S TAT E M E N T SFOR THE YEAR ENDED 30 JUNE 2017
NOTE 11. INVESTMENTS IN SUBSIDIARIES
The Company’s investment in its only directly-owned subsidiary, Freightways Express Limited (FEL), comprises shares at cost. Listed below are all the significant subsidiaries wholly-owned directly or indirectly by FEL. All subsidiaries have a balance date of 30 June.
Name of entity Principal activities Country of Incorporation
Air Freight NZ Limited* Express package linehaul New Zealand
Castle Parcels Limited Express package services New Zealand
Fieldair Engineering Limited* General & aviation engineering services New Zealand
Fieldair Holdings Limited* Holding company (refer * below) New Zealand
Freightways Finance Limited Group treasury management New Zealand
Freightways Information Services Limited IT infrastructure support services New Zealand
Freightways Properties Limited Property management New Zealand
Freightways Trustee Company Limited Trustee of Freightways Employee Share Plan New Zealand
Info Management Services Australia LP Australian treasury services Australia
Information Management Group Limited Information management New Zealand
LitSupport Pty Limited Information management Australia
Messenger Services Limited Express package services New Zealand
New Zealand Couriers Limited Express package services New Zealand
New Zealand Document Exchange Limited Business mail New Zealand
NOW Couriers Limited Express package services New Zealand
Parceline Express Limited Express package linehaul New Zealand
Post Haste Limited Express package services New Zealand
Shred-X Pty Limited Information management Australia
The Information Management Group (NZ) Limited Information management New Zealand
The Information Management Group Pty Limited Information management Australia
* Fieldair Holdings Limited is a subsidiary of New Zealand Couriers Limited. Fieldair Engineering Limited and Air Freight NZ Limited are subsidiaries of Fieldair Holdings Limited.
There has been no change in investments in subsidiaries during the year.
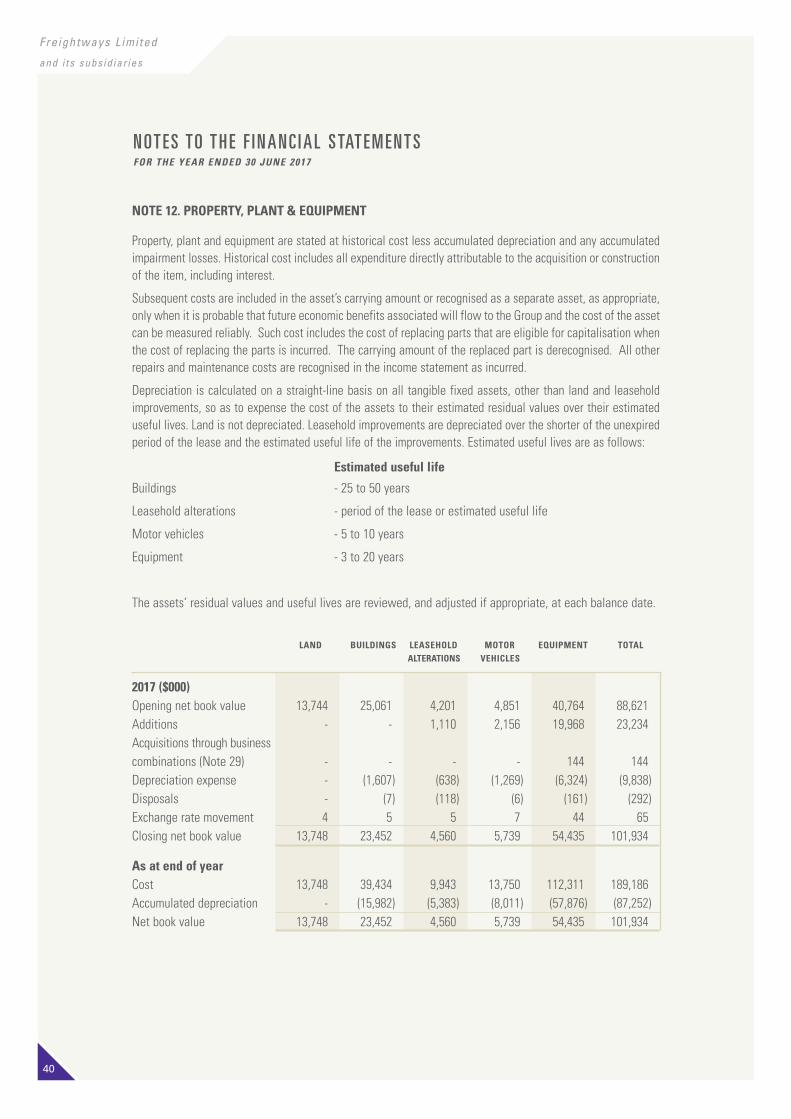
40
Fre ightways L imi ted
and i ts subsid iar ies
N OT E S TO T H E F I N A N C I A L S TAT E M E N T SFOR THE YEAR ENDED 30 JUNE 2017
LAND BUILDINGS LEASEHOLD MOTOR EQUIPMENT TOTAL ALTERATIONS VEHICLES
2017 ($000)Opening net book value 13,744 25,061 4,201 4,851 40,764 88,621Additions - - 1,110 2,156 19,968 23,234Acquisitions through business combinations (Note 29) - - - - 144 144Depreciation expense - (1,607) (638) (1,269) (6,324) (9,838) Disposals - (7) (118) (6) (161) (292)Exchange rate movement 4 5 5 7 44 65Closing net book value 13,748 23,452 4,560 5,739 54,435 101,934
As at end of yearCost 13,748 39,434 9,943 13,750 112,311 189,186Accumulated depreciation - (15,982) (5,383) (8,011) (57,876) (87,252)Net book value 13,748 23,452 4,560 5,739 54,435 101,934
NOTE 12. PROPERTY, PLANT & EQUIPMENT
Property, plant and equipment are stated at historical cost less accumulated depreciation and any accumulated impairment losses. Historical cost includes all expenditure directly attributable to the acquisition or construction of the item, including interest.
Subsequent costs are included in the asset’s carrying amount or recognised as a separate asset, as appropriate, only when it is probable that future economic benefits associated will flow to the Group and the cost of the asset can be measured reliably. Such cost includes the cost of replacing parts that are eligible for capitalisation when the cost of replacing the parts is incurred. The carrying amount of the replaced part is derecognised. All other repairs and maintenance costs are recognised in the income statement as incurred.
Depreciation is calculated on a straight-line basis on all tangible fixed assets, other than land and leasehold improvements, so as to expense the cost of the assets to their estimated residual values over their estimated useful lives. Land is not depreciated. Leasehold improvements are depreciated over the shorter of the unexpired period of the lease and the estimated useful life of the improvements. Estimated useful lives are as follows:
Estimated useful life
Buildings - 25 to 50 years
Leasehold alterations - period of the lease or estimated useful life
Motor vehicles - 5 to 10 years
Equipment - 3 to 20 years
The assets’ residual values and useful lives are reviewed, and adjusted if appropriate, at each balance date.
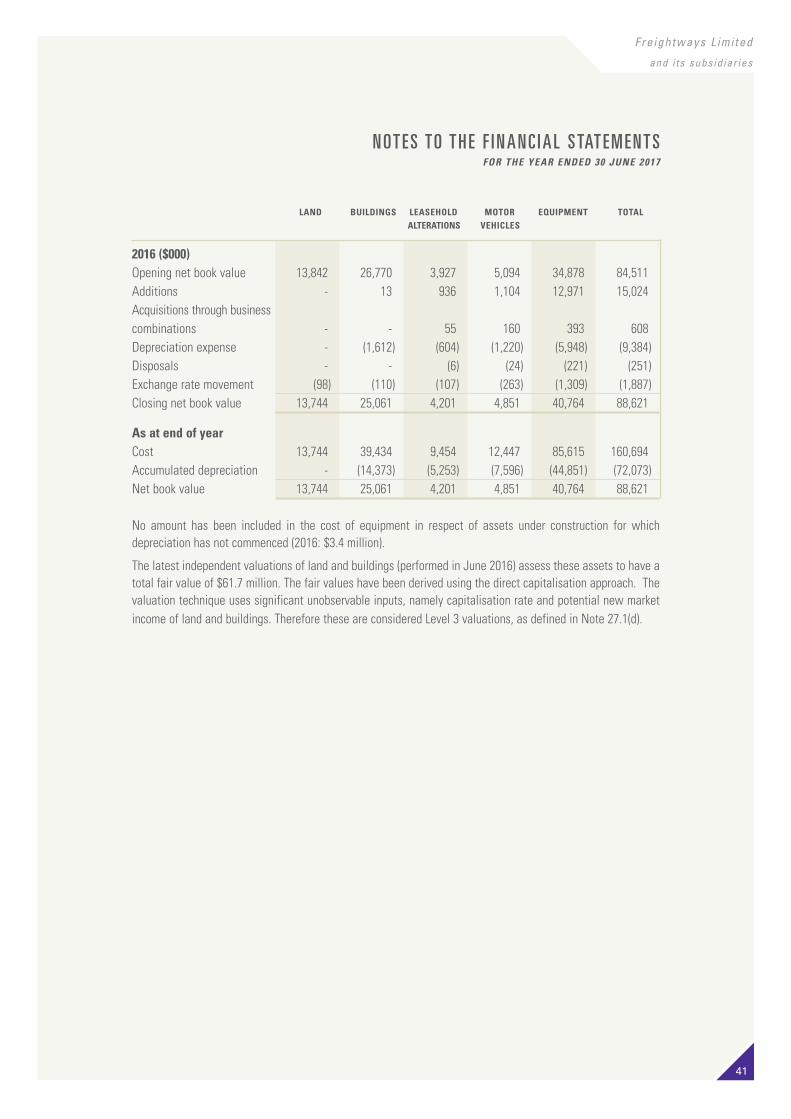
Fre ightways L imi ted
and i ts subsid iar ies
41
N OT E S TO T H E F I N A N C I A L S TAT E M E N T SFOR THE YEAR ENDED 30 JUNE 2017
LAND BUILDINGS LEASEHOLD MOTOR EQUIPMENT TOTAL ALTERATIONS VEHICLES
2016 ($000)Opening net book value 13,842 26,770 3,927 5,094 34,878 84,511Additions - 13 936 1,104 12,971 15,024Acquisitions through businesscombinations - - 55 160 393 608Depreciation expense - (1,612) (604) (1,220) (5,948) (9,384)Disposals - - (6) (24) (221) (251)Exchange rate movement (98) (110) (107) (263) (1,309) (1,887)Closing net book value 13,744 25,061 4,201 4,851 40,764 88,621
As at end of yearCost 13,744 39,434 9,454 12,447 85,615 160,694Accumulated depreciation - (14,373) (5,253) (7,596) (44,851) (72,073)Net book value 13,744 25,061 4,201 4,851 40,764 88,621
No amount has been included in the cost of equipment in respect of assets under construction for which depreciation has not commenced (2016: $3.4 million).
The latest independent valuations of land and buildings (performed in June 2016) assess these assets to have a total fair value of $61.7 million. The fair values have been derived using the direct capitalisation approach. The valuation technique uses significant unobservable inputs, namely capitalisation rate and potential new market income of land and buildings. Therefore these are considered Level 3 valuations, as defined in Note 27.1(d).
42
Fre ightways L imi ted
and i ts subsid iar ies
N OT E S TO T H E F I N A N C I A L S TAT E M E N T SFOR THE YEAR ENDED 30 JUNE 2017
NOTE 13. INTANGIBLE ASSETS
(i) Goodwill
Goodwill represents the excess of the consideration transferred in an acquisition over the fair value of the Group’s share of the net identifiable assets of the acquired business at the date of acquisition. Goodwill is not amortised, but is tested for impairment annually or whenever events or changes in circumstances indicate that it might be impaired, and is carried at cost less accumulated impairment losses. Goodwill is allocated to cash-generating units for the purpose of impairment testing.
(ii) Brand names
Acquired brand names are recognised at cost, being their fair value at the date of acquisition if acquired in a business combination. Brand names with indefinite useful lives are not subject to amortisation, but are tested for impairment annually or whenever events or changes in circumstances indicate that they might be impaired, and are carried at cost less amortisation and impairment losses. The useful lives and amortisation methods are reviewed and adjusted, if appropriate, at each balance sheet date.
Brand names are allocated to cash-generating units for the purpose of impairment testing. The allocation is made to those cash-generating units or groups of cash-generating units that are expected to benefit from the brand names.
An independent valuation of the brand names was conducted by Deloitte in August 2017. This independent report assessed the fair market value of the brand names as at 30 June 2017 to be between $251 million and $387 million, using the value-in-use approach. The valuation technique uses significant unobservable inputs, namely discount rate, growth rate and cash flow. Therefore these are considered Level 3 valuations, as defined in Note 27.1(d).
(iii) Computer software
External software costs, together with payroll and related costs for employees directly associated with the development of software, are capitalised. Costs associated with upgrades and enhancements are capitalised to the extent they result in additional functionality. Amortisation is charged on a straight-line basis over the estimated useful life of the software which ranges between 3 and 10 years. Included in the cost of software is work in progress of $2.9 million (2016: $1.6 million) for which amortisation has not commenced.
(iv) Customer relationships
• Contractual
An intangible asset is recorded at fair value in respect of the amount of any contractual termination fees payable by customers of businesses acquired in respect of their document holdings. As it is not known when permanent retrieval fees may arise, this asset is only amortised upon the actual retrieval fee being charged to the respective customer.
• Other
Non-contractual customer relationships acquired in a business combination are recognised at fair value at the acquisition date. These customer relationships have an estimated finite useful life and are carried at cost less accumulated amortisation. Amortisation is calculated using the straight-line method over the expected useful life of the customer relationship which ranges between 10 and 20 years.
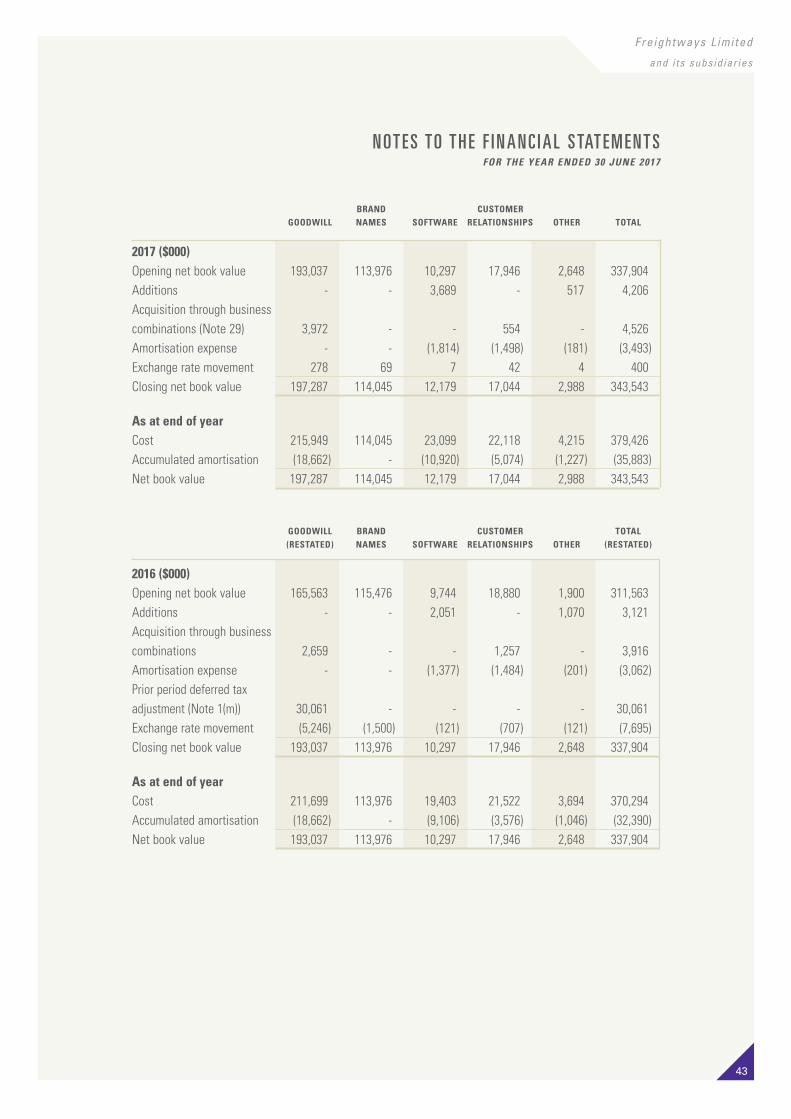
Fre ightways L imi ted
and i ts subsid iar ies
43
N OT E S TO T H E F I N A N C I A L S TAT E M E N T SFOR THE YEAR ENDED 30 JUNE 2017
BRAND CUSTOMER GOODWILL NAMES SOFTWARE RELATIONSHIPS OTHER TOTAL
2017 ($000)Opening net book value 193,037 113,976 10,297 17,946 2,648 337,904Additions - - 3,689 - 517 4,206Acquisition through businesscombinations (Note 29) 3,972 - - 554 - 4,526Amortisation expense - - (1,814) (1,498) (181) (3,493)Exchange rate movement 278 69 7 42 4 400Closing net book value 197,287 114,045 12,179 17,044 2,988 343,543
As at end of year Cost 215,949 114,045 23,099 22,118 4,215 379,426 Accumulated amortisation (18,662) - (10,920) (5,074) (1,227) (35,883)Net book value 197,287 114,045 12,179 17,044 2,988 343,543
GOODWILL BRAND CUSTOMER TOTAL (RESTATED) NAMES SOFTWARE RELATIONSHIPS OTHER (RESTATED)
2016 ($000)Opening net book value 165,563 115,476 9,744 18,880 1,900 311,563Additions - - 2,051 - 1,070 3,121Acquisition through businesscombinations 2,659 - - 1,257 - 3,916Amortisation expense - - (1,377) (1,484) (201) (3,062) Prior period deferred tax adjustment (Note 1(m)) 30,061 - - - - 30,061 Exchange rate movement (5,246) (1,500) (121) (707) (121) (7,695)Closing net book value 193,037 113,976 10,297 17,946 2,648 337,904
As at end of year Cost 211,699 113,976 19,403 21,522 3,694 370,294 Accumulated amortisation (18,662) - (9,106) (3,576) (1,046) (32,390)Net book value 193,037 113,976 10,297 17,946 2,648 337,904

44
Fre ightways L imi ted
and i ts subsid iar ies
N OT E S TO T H E F I N A N C I A L S TAT E M E N T SFOR THE YEAR ENDED 30 JUNE 2017
Impairment tests for indefinite life intangible assetsGoodwill and brand names are allocated to those cash-generating units (CGU's) or groups of CGU's that are expected to benefit from them. The carrying amount of intangible assets allocated by CGU or group of CGU's is outlined below: GOODWILL BRAND NAMES 2017 2016 2017 2016 $000 $000 $000 $000 (Restated)
Messenger Services 8,766 8,766 5,100 5,100New Zealand Couriers 47,752 47,752 58,500 58,500New Zealand Document Exchange 10,967 10,967 5,900 5,900Dataprint 4,125 4,125 1,310 1,310Post Haste, Castle Parcels and NOW Couriers 27,159 27,159 18,395 18,395Total Express Package & Business Mail 98,769 98,769 89,205 89,205The Information Management Group (New Zealand) 17,577 17,577 4,400 4,400The Information Management Group (Australia) 53,489 49,327 17,191 17,133Shred-X 27,453 27,364 3,249 3,238Total Information Management 98,519 94,268 24,840 24,771Total 197,288 193,037 114,045 113,976
The Information Management Group (Australia), Filesaver and LitSupport were previously disclosed as separate CGU's. Filesaver and LitSupport were acquired by The Information Management Group (Australia) in previous years and had been disclosed as separate CGU's while there was a need to measure performance as if they were standalone operations for the purposes of calculating related earn-outs. The Group derives benefit from the synergies of integrating or combining acquired businesses and the cash inflows of these businesses are not considered independent of each other. The combined businesses represent the lowest level within the Group at which the intangible assets are monitored for internal management purposes. Therefore The Information Management Group (Australia), Filesaver and LitSupport have been combined as at 30 June 2017 as a single CGU in the disclosure above.
(i) Key assumptions used for value-in-use calculations
On an annual basis, the recoverable amount of goodwill and brand names is determined based on value-in-use calculations specific to the CGU associated with both goodwill and brand names.
These calculations use pre-tax cash flow projections based on financial budgets prepared by management and approved by the Board for the year ended 30 June 2018. Cash flows beyond June 2018 have been extrapolated using growth rates which do not exceed the historical compound annual earnings growth rates for each respective CGU, taking into consideration current and forecast economic conditions. The compound annual earnings growth rate for the Express Package & Business Mail segment over the past 10 years has been approximately 3% (2016: 3%). A 1% (2016: 1%) growth rate and 1% (2016: 1%) terminal growth rate have been applied to the express package & business mail businesses in the value-in-use calculation. For the Information Management segment, the compound annual earnings growth rate for the last 5 years of approximately 10% (2016: 14%) is considered indicative of the growth in this segment since the Company’s expansion into Australia. A 3% (2016: 3%) growth rate and 2.5% (2016: 3%) terminal growth rate have been applied to the Information Management businesses in the value-in-use calculation.
A pre-tax discount rate of 11% (2016: 11%) has been applied to all CGU's.
The value-in-use calculations indicate that the recoverable amounts of goodwill and brand names exceed their carrying values and therefore there is no impairment in the value of goodwill and brand names.

Fre ightways L imi ted
and i ts subsid iar ies
45
N OT E S TO T H E F I N A N C I A L S TAT E M E N T SFOR THE YEAR ENDED 30 JUNE 2017
(ii) Sensitivity to changes in assumptions
With regard to the value-in-use assessment for all CGU's, management believes that no reasonably possible change in any of the above assumptions would cause the carrying values of goodwill and brand names to materially exceed their respective recoverable amounts.
NOTE 14. DEFERRED LIABILITY 2017 2016 $000 $000 (Restated)
Deferred tax liabilitiesDeferred tax liabilities to be recovered within 12 months 491 325Deferred tax liabilities to be recovered after more than 12 months 35,115 34,166Balance at end of year 35,606 34,491
The movement in deferred tax assets and liabilities during the year, without taking into consideration the offsetting of balances within the same jurisdiction, is as follows:
PROPERTY, EMPLOYEE ACCRUALS DERIVATIVE INTANGIBLE TOTAL PLANT AND ENTITLEMENTS AND FINANCIAL ASSETS EQUIPMENT PROVISIONS INSTRUMENTS
2017 ($000)Balance at beginning of year (4,833) 3,494 2,946 3,611 (39,709) (34,491)Prior period adjustment (119) (41) 19 - 66 (75)Transfer to income statement 177 243 (686) 58 394 186Amounts relating to businesscombinations (Note 29) - 85 5 - (166) (76)Adjustment for cash flowhedge reserve - - - (1,139) - (1,139)Exchange rate movement - 5 3 1 (20) (11)Balance at end of year (4,775) 3,786 2,287 2,531 (39,435) (35,606)
PROPERTY, EMPLOYEE ACCRUALS DERIVATIVE INTANGIBLE TOTAL PLANT AND ENTITLEMENTS AND FINANCIAL ASSETS (Restated) EQUIPMENT PROVISIONS INSTRUMENTS (Restated)
2016 ($000)Balance at beginning of year (6,793) 3,498 2,782 2,566 (9,776) (7,723)Prior period adjustment 182 (145) 103 - (19) 121Transfer to income statement 1,783 232 118 20 123 2,276Amounts relating to businesscombinations - 29 (3) - (364) (338)Adjustment for cash flow hedge reserve - - - 1,025 - 1,025Prior period goodwill adjustment (Note 1(m)) - - - - (30,061) (30,061)Exchange rate movement (5) (120) (54) - 388 209Balance at end of year (4,833) 3,494 2,946 3,611 (39,709) (34,491)

46
Fre ightways L imi ted
and i ts subsid iar ies
N OT E S TO T H E F I N A N C I A L S TAT E M E N T SFOR THE YEAR ENDED 30 JUNE 2017
NOTE 15. TRADE AND OTHER PAYABLES
Trade and other payables are recognised when the Group becomes obligated to make future payments resulting from the purchase of goods or services. They are initially recognised at fair value and subsequently measured at amortised cost using the effective interest rate method. The amounts are unsecured.
GROUP 2017 2016 $000 $000
Current:
Trade creditors 37,050 29,363Employee entitlements 16,210 13,996Other creditors and accruals 12,462 11,320 65,722 54,679Non-current:
Acquisition earn-out payables 1,786 5,620Other non-current payables 1,081 748 2,867 6,368
NOTE 16. LEASES
Operating lease commitments (non-cancellable)
Leases in which a significant portion of the risks and rewards of ownership is retained by the lessor are classified as operating leases. Payments made under operating leases (net of any incentives received from the lessor) are charged to the income statement on a straight-line basis over the period of the lease.
The Group leases certain premises, motor vehicles, and plant and equipment, and as a result has the following operating lease commitments: 2017 2016 $000 $000
Within one year 24,935 22,424After one year but not more than five years 63,520 52,208After five years 28,667 22,413 117,122 97,045
The leases have varying terms, escalation clauses and renewal rights. On renewal, the terms of the leases are renegotiated.

Fre ightways L imi ted
and i ts subsid iar ies
47
N OT E S TO T H E F I N A N C I A L S TAT E M E N T SFOR THE YEAR ENDED 30 JUNE 2017
NOTE 17. PROVISIONS
A provision is recognised when the Group has a present legal or constructive obligation as a result of a past event, and it is probable that an outflow of economic benefits will be required to settle the obligation and a reliable estimate of the obligation can be made. If the effect is material, provisions are determined by discounting the expected future cash flows at a pre-tax rate that reflects current market assessments of the time value of money and, where appropriate, the risks specific to the liability. The increase in the provision due only to the passage of time is recognised as an interest expense.
Explanation of provisions
Provision for customer claims relates to actual claims received from customers that are being considered for payment as at reporting date and are expected to be resolved within the next two months.
Provision for long service leave relates to the potential leave obligation for employees who reach continuous employment milestones required under Australian regulations. Consideration is given to expected future wage and salary levels, experience of employee departures and periods of service.
Provision for lease obligations relates to estimated payments to reinstate leased buildings and equipment used to an appropriate condition upon the expiry of the respective lease terms.
CUSTOMER LONG SERVICE LEASE TOTAL CLAIMS LEAVE OBLIGATIONS $000 $000 $000 $000
2017Balance at beginning of year 613 2,089 1,448 4,150Current year provision (83) 512 660 1,089Amounts relating to business combinations - 116 16 132Expenses incurred (25) (235) (384) (644)Movement in exchange rate - (27) (1) (28)Balance at end of year 505 2,455 1,739 4,699
2016Balance at beginning of year 516 1,833 1,996 4,345Current year provision 97 412 199 708Amounts relating to business combinations - 45 60 105Expenses incurred - (59) (765) (824)Movement in exchange rate - (142) (42) (184)Balance at end of year 613 2,089 1,448 4,150
Analysis of total provisions: 2017 2016 $000 $000
Current 1,008 1,115Non-current 3,691 3,035Total 4,699 4,150

48
Fre ightways L imi ted
and i ts subsid iar ies
N OT E S TO T H E F I N A N C I A L S TAT E M E N T SFOR THE YEAR ENDED 30 JUNE 2017
NOTE 18. UNEARNED INCOME
An unearned income liability is recorded in the balance sheet reflecting the future service obligation for products that have been sold in advance of their use.
NOTE 19. BORROWINGS
Interest-bearing bank loans and overdrafts are initially recognised at fair value and subsequently measured at amortised cost using the effective interest rate method. Costs incurred in establishing finance facilities are amortised to the income statement over the term of the respective facilities.
GROUP 2017 2016 $000 $000
Non-current:Bank borrowings 166,241 158,801
(a) Security for borrowings
The bank borrowings are secured by a charge over the assets of the majority of the Company’s New Zealand subsidiaries in favour of its primary lenders and guarantees from the Company’s primary Australian subsidiaries. As at 30 June 2017, the carrying amount of the assets pledged as security is $198 million (2016: $174 million).
(b) Finance facilities
The following finance facilities existed at the reporting date:
FACILITIES DENOMINATED IN FACILITIES DENOMINATED IN NEW ZEALAND DOLLARS AUSTRALIAN DOLLARS 2017 2016 2017 2016 $000 $000 $000 $000
Bank overdraft- total bank overdraft facility available 8,000 8,000 - 20- amount of overdraft facility unused 8,000 8,000 - 20
Loan facilities- total loan facilities available 110,000 110,000 97,000 97,000- maturing 1 September 2018 37,000 37,000 27,500 27,500- maturing 1 September 2019 37,000 37,000 35,000 35,000- maturing 1 September 2020 26,000 36,000 24,500 34,500- maturing 15 December 2026 10,000 - 10,000 -- amount of loan facilities used 78,000 74,000 83,900 80,900- amount of loan facilities unused 32,000 36,000 13,100 16,100
Effective interest rate at 30 June as amended for interest rate hedges 6.15% 6.60% 5.12% 5.31%
The fair values of borrowings are not materially different to their carrying amount, since the interest payable on those borrowings is either close to market rate or the borrowings are of a short-term nature.
In December 2016, a US$125 million uncommitted finance facility was established with a US-based lender on the same terms as those that are in place with the existing banking syndicate. Of this facility, the US dollar equivalent of NZ$10 million and A$10 million has been drawn as at 30 June 2017.
The Group was in compliance with all of its banking covenants throughout the year ended 30 June 2017.

Fre ightways L imi ted
and i ts subsid iar ies
49
NOTE 20. EQUITY
Ordinary shares are classified as equity. Incremental costs directly attributable to the issue of new shares are shown in equity as a reduction in the amount of proceeds arising from the issue of shares.
Contributed Equity
(i) Fully paid ordinary shares
As at 30 June 2017 there were 154,938,225 shares issued and fully paid (2016: 154,760,691). All fully paid ordinary shares have equal voting rights and share equally in dividends and surplus on winding up.
(ii) Partly-paid ordinary shares
On 12 September 2016, 103,682 partly-paid shares were issued to certain senior executives under the rules of the Freightways Senior Executive Performance Share Plan (2016: 121,691). The issue price per share was $6.82 (2016: $5.39) and the shares have been paid up by the relevant participants to one cent per share. The balance of the issue price per share may only be paid up upon the participants meeting agreed performance hurdles and upon the expiry of the applicable three-year escrow period in accordance with the Plan rules (refer Note 21). During the year, 17,863 partly-paid shares were redeemed and cancelled (2016: 63). As at 30 June 2017 there were 342,006 partly-paid shares on issue, paid up to one cent per share (2016: 383,721). Partly-paid shares have no voting rights and no rights to dividends and surplus on winding up.
(iii) Partly-paid shares, fully paid up to ordinary shares
On 12 September 2016, 127,534 (2016: 147,769) partly-paid shares were fully paid-up by certain Freightways senior executives upon the achievement of agreed performance targets in accordance with the terms of the original issue of the relevant partly-paid shares under the Freightways Senior Executive Performance Share Plan. The average issue price per share was $4.17 (2016: $3.92).
(iv) Employee Share Plan
On 13 September 2016, the Company issued 50,000 fully paid ordinary shares at $6.13 each to Freightways Trustee Company Limited, as Trustee for the Freightways Employee Share Plan (September 2015: 90,000 fully paid ordinary shares at $4.86 each). In total, participating employees were provided with interest-free loans of $0.3 million to fund their purchase of the shares in the Share Plan (September 2015: $0.4 million). The loans are repayable over three years and repayment commenced in October 2016.
As at 30 June 2017 the Trustee held 496,143 (2016: 539,766) fully paid ordinary shares (representing 0.3% (2016: 0.3%) of all issued ordinary shares) of which 4,547 (2016: 3,102) were unallocated. These shares are held for allocation in the future.
The Employee Share Plan operates in accordance with section DC13 of the New Zealand Income Tax Act 2007 and the Trustees are appointed by the Freightways Limited Board of Directors.
Balance at beginning of year 154,757,589 154,519,061 123,852 122,858Partly-paid ordinary shares issued - - 1 1Partly-paid shares, fully paid up to ordinary shares 127,534 147,769 532 579Employee share-based payment - - (271) (19)Shares issued for employee share plan 50,000 90,000 307 437(Increase) decrease in employee share plan unallocated shares (1,445) 759 9 (4)Balance at end of year 154,933,678 154,757,589 124,430 123,852
N OT E S TO T H E F I N A N C I A L S TAT E M E N T SFOR THE YEAR ENDED 30 JUNE 2017
2017ORDINARY
SHARES
2016ORDINARY
SHARES
2017$000
2016$000
GROUP
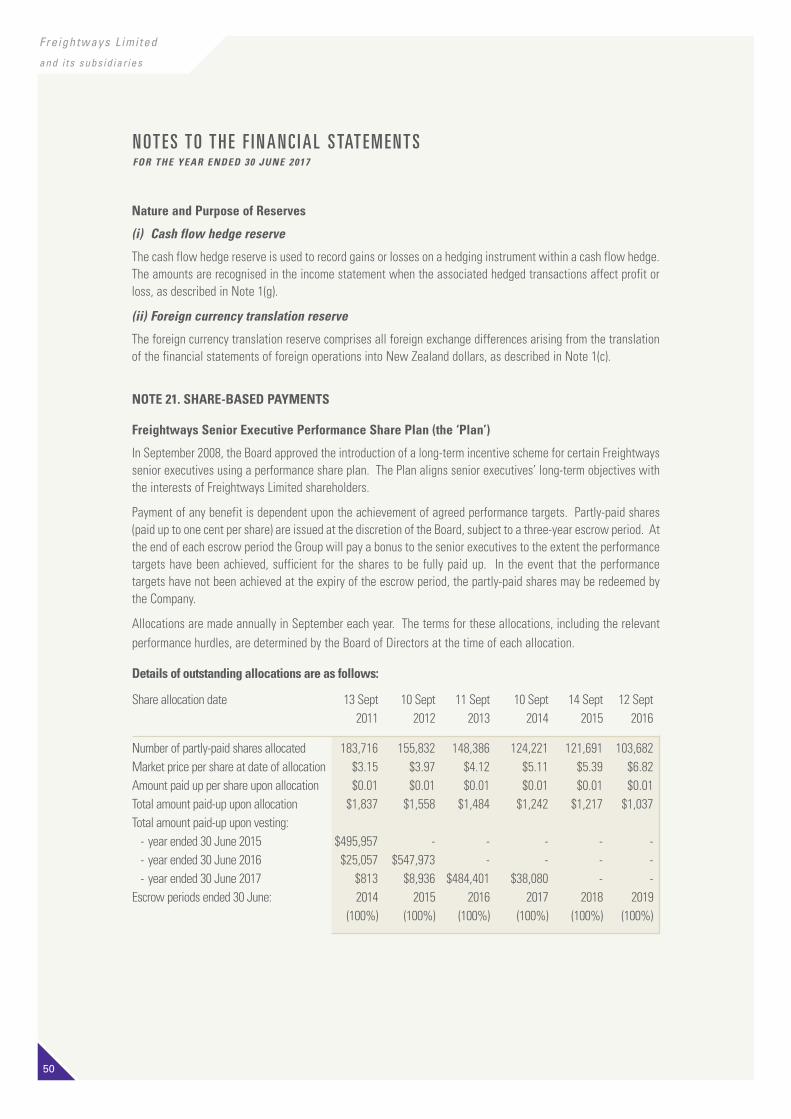
50
Fre ightways L imi ted
and i ts subsid iar ies
N OT E S TO T H E F I N A N C I A L S TAT E M E N T SFOR THE YEAR ENDED 30 JUNE 2017
NOTE 21. SHARE-BASED PAYMENTS
Freightways Senior Executive Performance Share Plan (the ‘Plan’)
In September 2008, the Board approved the introduction of a long-term incentive scheme for certain Freightways senior executives using a performance share plan. The Plan aligns senior executives’ long-term objectives with the interests of Freightways Limited shareholders.
Payment of any benefit is dependent upon the achievement of agreed performance targets. Partly-paid shares (paid up to one cent per share) are issued at the discretion of the Board, subject to a three-year escrow period. At the end of each escrow period the Group will pay a bonus to the senior executives to the extent the performance targets have been achieved, sufficient for the shares to be fully paid up. In the event that the performance targets have not been achieved at the expiry of the escrow period, the partly-paid shares may be redeemed by the Company.
Allocations are made annually in September each year. The terms for these allocations, including the relevant performance hurdles, are determined by the Board of Directors at the time of each allocation.
Details of outstanding allocations are as follows:
Share allocation date 13 Sept 10 Sept 11 Sept 10 Sept 14 Sept 12 Sept 2011 2012 2013 2014 2015 2016
Number of partly-paid shares allocated 183,716 155,832 148,386 124,221 121,691 103,682Market price per share at date of allocation $3.15 $3.97 $4.12 $5.11 $5.39 $6.82Amount paid up per share upon allocation $0.01 $0.01 $0.01 $0.01 $0.01 $0.01Total amount paid-up upon allocation $1,837 $1,558 $1,484 $1,242 $1,217 $1,037Total amount paid-up upon vesting: - year ended 30 June 2015 $495,957 - - - - - - year ended 30 June 2016 $25,057 $547,973 - - - - - year ended 30 June 2017 $813 $8,936 $484,401 $38,080 - - Escrow periods ended 30 June: 2014 2015 2016 2017 2018 2019 (100%) (100%) (100%) (100%) (100%) (100%)
Nature and Purpose of Reserves
(i) Cash flow hedge reserve
The cash flow hedge reserve is used to record gains or losses on a hedging instrument within a cash flow hedge. The amounts are recognised in the income statement when the associated hedged transactions affect profit or loss, as described in Note 1(g).
(ii) Foreign currency translation reserve
The foreign currency translation reserve comprises all foreign exchange differences arising from the translation of the financial statements of foreign operations into New Zealand dollars, as described in Note 1(c).
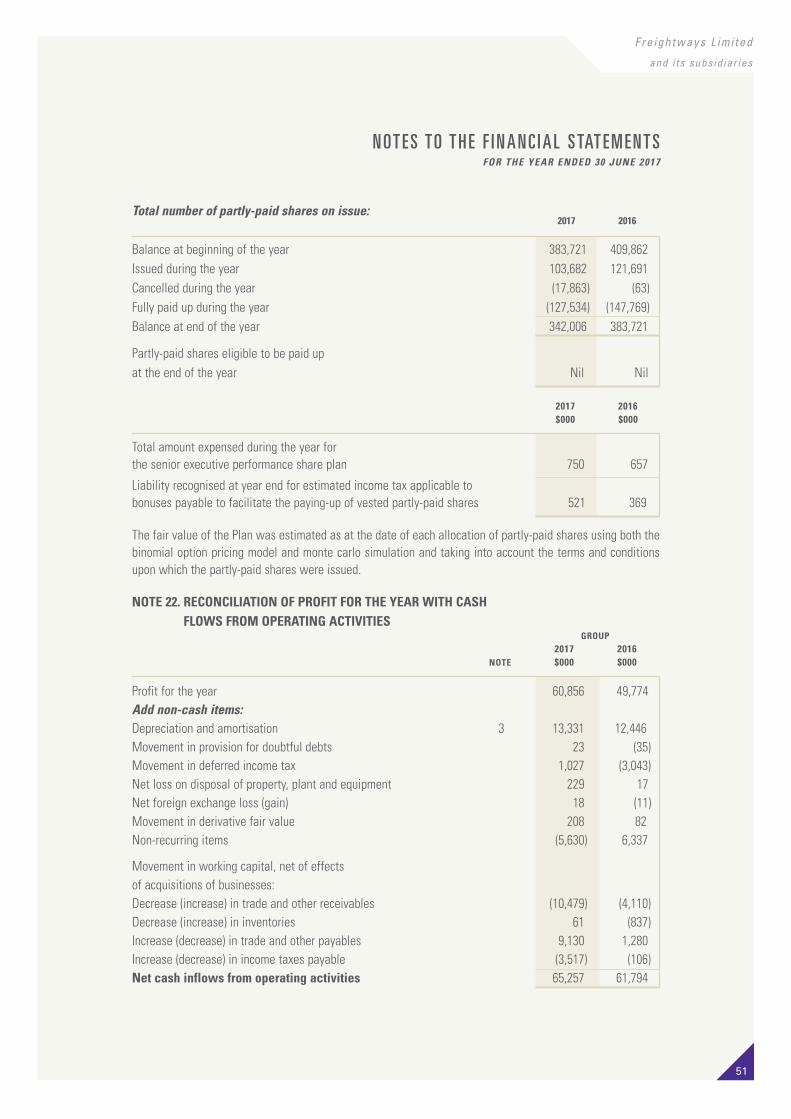
Fre ightways L imi ted
and i ts subsid iar ies
51
N OT E S TO T H E F I N A N C I A L S TAT E M E N T SFOR THE YEAR ENDED 30 JUNE 2017
Total number of partly-paid shares on issue:
Balance at beginning of the year 383,721 409,862Issued during the year 103,682 121,691Cancelled during the year (17,863) (63)Fully paid up during the year (127,534) (147,769)Balance at end of the year 342,006 383,721
Partly-paid shares eligible to be paid upat the end of the year Nil Nil
2017 2016
2017 2016 $000 $000
Total amount expensed during the year forthe senior executive performance share plan 750 657
Liability recognised at year end for estimated income tax applicable to bonuses payable to facilitate the paying-up of vested partly-paid shares 521 369
The fair value of the Plan was estimated as at the date of each allocation of partly-paid shares using both the binomial option pricing model and monte carlo simulation and taking into account the terms and conditions upon which the partly-paid shares were issued.
NOTE 22. RECONCILIATION OF PROFIT FOR THE YEAR WITH CASH FLOWS FROM OPERATING ACTIVITIES
GROUP 2017 2016 NOTE $000 $000
Profit for the year 60,856 49,774 Add non-cash items:Depreciation and amortisation 3 13,331 12,446Movement in provision for doubtful debts 23 (35) Movement in deferred income tax 1,027 (3,043)Net loss on disposal of property, plant and equipment 229 17Net foreign exchange loss (gain) 18 (11)Movement in derivative fair value 208 82Non-recurring items (5,630) 6,337
Movement in working capital, net of effects of acquisitions of businesses: Decrease (increase) in trade and other receivables (10,479) (4,110)Decrease (increase) in inventories 61 (837)Increase (decrease) in trade and other payables 9,130 1,280Increase (decrease) in income taxes payable (3,517) (106)Net cash inflows from operating activities 65,257 61,794

52
Fre ightways L imi ted
and i ts subsid iar ies
N OT E S TO T H E F I N A N C I A L S TAT E M E N T SFOR THE YEAR ENDED 30 JUNE 2017
NOTE 23. CAPITAL COMMITMENTS AND CONTINGENT LIABILITIES
The Group had made capital commitments to purchase or construct buildings and equipment for $2.7 million at 30 June 2017 (2016: $9.9 million), principally relating to the completion of operating facilities throughout the Group.
As at 30 June 2017, the Group had outstanding letters of credit and bank guarantees issued by its lenders totalling approximately $5.9 million (2016: $4.8 million). The letters of credit relate predominantly to support for regular payroll payments. The bank guarantees relate to security given to various landlords in respect of leased operating facilities.
NOTE 24. EARNINGS PER SHARE*Basic earnings per share Basic earnings per share is calculated by dividing the profit for the year attributable to shareholders by the weighted average number of ordinary shares outstanding during the year:
GROUP 2017 2016
Profit for the year attributable to shareholders ($000) 60,856 49,774Weighted average number of ordinary shares (‘000): 154,903 154,712Basic earnings per share (cents) 39.3 32.2
Diluted earnings per shareDiluted earnings per share is calculated by dividing the profit for the year attributable to shareholders by the weighted average number of ordinary shares outstanding during the year, adjusted to include all dilutive potential ordinary shares (for example, partly-paid shares on issue) as if they had been converted to ordinary shares at the beginning of the year:
GROUP 2017 2016
Profit for the year attributable to shareholders ($000) 60,856 49,774Weighted average number of ordinary shares (‘000): 154,903 154,712Effect of dilution 342 383Diluted weighted average number of ordinary shares (‘000): 155,245 155,095Diluted earnings per share (cents) 39.2 32.1
* Basic and diluted earnings per share calculated on the profit for the year attributable to shareholders, excluding non-recurring items, net of tax (refer Note 3), are both 36.5 cents (2016: 35.1 cents and 35.0 cents, respectively).
NOTE 25. NET TANGIBLE ASSETS PER SECURITY
Net tangible assets (liabilities) per security at 30 June 2017 was ($0.42) (2016: ($0.53)).
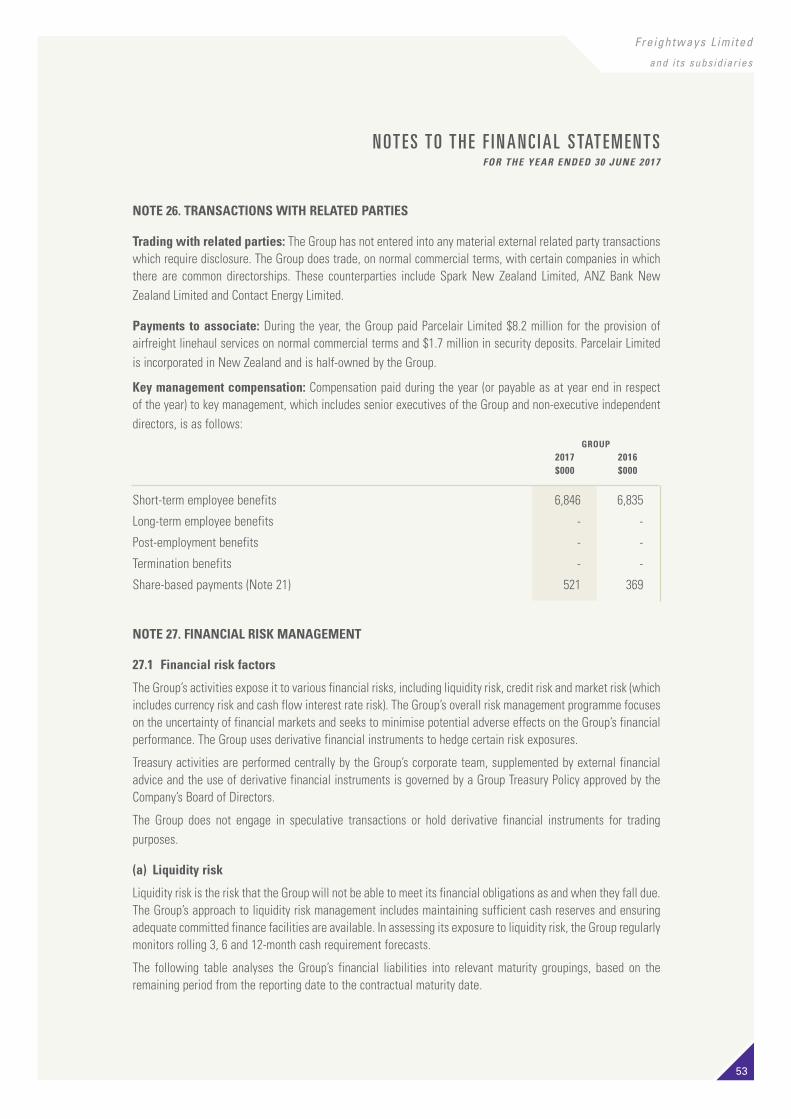
Fre ightways L imi ted
and i ts subsid iar ies
53
N OT E S TO T H E F I N A N C I A L S TAT E M E N T SFOR THE YEAR ENDED 30 JUNE 2017
NOTE 26. TRANSACTIONS WITH RELATED PARTIES
Trading with related parties: The Group has not entered into any material external related party transactions which require disclosure. The Group does trade, on normal commercial terms, with certain companies in which there are common directorships. These counterparties include Spark New Zealand Limited, ANZ Bank New Zealand Limited and Contact Energy Limited.
Payments to associate: During the year, the Group paid Parcelair Limited $8.2 million for the provision of airfreight linehaul services on normal commercial terms and $1.7 million in security deposits. Parcelair Limited is incorporated in New Zealand and is half-owned by the Group.
Key management compensation: Compensation paid during the year (or payable as at year end in respect of the year) to key management, which includes senior executives of the Group and non-executive independent directors, is as follows: GROUP 2017 2016 $000 $000
Short-term employee benefits 6,846 6,835
Long-term employee benefits - -
Post-employment benefits - -
Termination benefits - -
Share-based payments (Note 21) 521 369
NOTE 27. FINANCIAL RISK MANAGEMENT
27.1 Financial risk factors
The Group’s activities expose it to various financial risks, including liquidity risk, credit risk and market risk (which includes currency risk and cash flow interest rate risk). The Group’s overall risk management programme focuses on the uncertainty of financial markets and seeks to minimise potential adverse effects on the Group’s financial performance. The Group uses derivative financial instruments to hedge certain risk exposures.
Treasury activities are performed centrally by the Group’s corporate team, supplemented by external financial advice and the use of derivative financial instruments is governed by a Group Treasury Policy approved by the Company’s Board of Directors.
The Group does not engage in speculative transactions or hold derivative financial instruments for trading purposes.
(a) Liquidity risk
Liquidity risk is the risk that the Group will not be able to meet its financial obligations as and when they fall due. The Group’s approach to liquidity risk management includes maintaining sufficient cash reserves and ensuring adequate committed finance facilities are available. In assessing its exposure to liquidity risk, the Group regularly monitors rolling 3, 6 and 12-month cash requirement forecasts.
The following table analyses the Group’s financial liabilities into relevant maturity groupings, based on the remaining period from the reporting date to the contractual maturity date.

54
Fre ightways L imi ted
and i ts subsid iar ies
N OT E S TO T H E F I N A N C I A L S TAT E M E N T SFOR THE YEAR ENDED 30 JUNE 2017
The amounts disclosed below are contractual, undiscounted cash flows, except for interest rate swaps.
GROUP LESS THAN 6-12 1-2 2-5 MORE THAN TOTAL 6 MONTHS MONTHS YEARS YEARS 5 YEARS
2017 ($000)Bank borrowings 3,043 3,192 72,496 100,369 25,428 204,528Trade and other payables 54,262 8,154 - 1,786 - 64,202Finance lease liabilities 75 75 108 93 - 351Derivative financialinstruments – interestrate swaps* 1,675 1,526 2,232 2,290 2 7,725
2016 ($000)Bank borrowings 2,874 2,802 5,741 175,453 - 186,870 Trade and other payables 44,462 13,215 6,367 - - 64,044Finance lease liabilities 40 36 35 - - 111 Derivative financialinstruments – interestrate swaps* 1,581 1,653 3,168 5,321 528 12,251
* The amounts expected to be payable in relation to the interest rate swaps have been estimated using forward interest rates applicable at the reporting date.
(b) Credit risk
Credit risk refers to the risk of a counterparty failing to discharge its obligation. Financial instruments which potentially subject the Group to credit risk principally consist of bank balances, accounts receivable and derivative financial instruments.
The Group has credit policies that are used to manage the exposure to credit risk. As part of these policies, exposures with counterparties are monitored on a regular basis. The Group performs credit evaluations on all customers requiring credit and generally does not require collateral.
The Group’s Treasury Policy ensures due consideration is given to the financial standing of the counterparty banks with which the Group holds cash reserves and transacts derivative financial instruments. A minimum Standard & Poor’s long-term credit rating of A+ is required to qualify as an approved counterparty. The quantum of transactions entered into with the Group’s various financial lenders is also balanced to mitigate exposure to concentrated counterparty credit risk with any one financial provider.
The Group does not have any significant concentrations of credit risk.
For counterparties to trade receivables that are neither past due nor impaired, payments have historically been received regularly and on time.
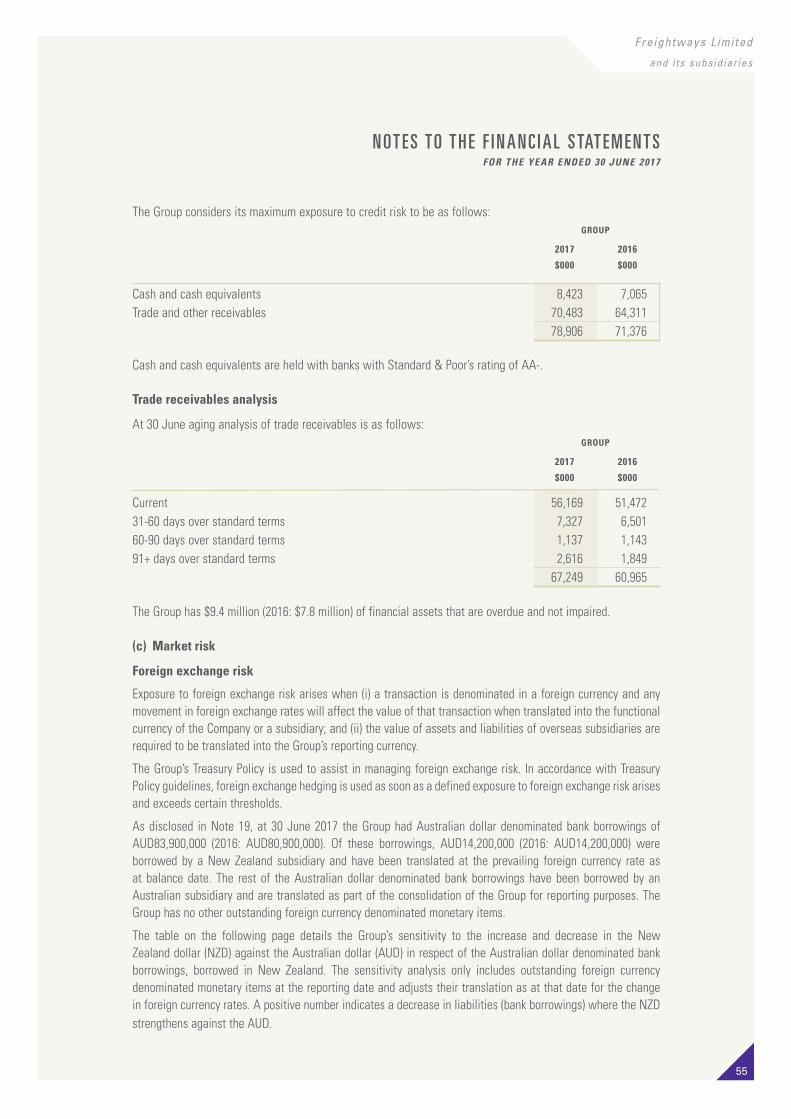
Fre ightways L imi ted
and i ts subsid iar ies
55
The Group considers its maximum exposure to credit risk to be as follows: GROUP
2017 2016
$000 $000
Cash and cash equivalents 8,423 7,065 Trade and other receivables 70,483 64,311 78,906 71,376
Cash and cash equivalents are held with banks with Standard & Poor’s rating of AA-.
Trade receivables analysis
At 30 June aging analysis of trade receivables is as follows: GROUP
2017 2016
$000 $000
Current 56,169 51,47231-60 days over standard terms 7,327 6,50160-90 days over standard terms 1,137 1,14391+ days over standard terms 2,616 1,849 67,249 60,965
The Group has $9.4 million (2016: $7.8 million) of financial assets that are overdue and not impaired.
(c) Market risk
Foreign exchange risk
Exposure to foreign exchange risk arises when (i) a transaction is denominated in a foreign currency and any movement in foreign exchange rates will affect the value of that transaction when translated into the functional currency of the Company or a subsidiary; and (ii) the value of assets and liabilities of overseas subsidiaries are required to be translated into the Group’s reporting currency.
The Group’s Treasury Policy is used to assist in managing foreign exchange risk. In accordance with Treasury Policy guidelines, foreign exchange hedging is used as soon as a defined exposure to foreign exchange risk arises and exceeds certain thresholds.
As disclosed in Note 19, at 30 June 2017 the Group had Australian dollar denominated bank borrowings of AUD83,900,000 (2016: AUD80,900,000). Of these borrowings, AUD14,200,000 (2016: AUD14,200,000) were borrowed by a New Zealand subsidiary and have been translated at the prevailing foreign currency rate as at balance date. The rest of the Australian dollar denominated bank borrowings have been borrowed by an Australian subsidiary and are translated as part of the consolidation of the Group for reporting purposes. The Group has no other outstanding foreign currency denominated monetary items.
The table on the following page details the Group’s sensitivity to the increase and decrease in the New Zealand dollar (NZD) against the Australian dollar (AUD) in respect of the Australian dollar denominated bank borrowings, borrowed in New Zealand. The sensitivity analysis only includes outstanding foreign currency denominated monetary items at the reporting date and adjusts their translation as at that date for the change in foreign currency rates. A positive number indicates a decrease in liabilities (bank borrowings) where the NZD strengthens against the AUD.
N OT E S TO T H E F I N A N C I A L S TAT E M E N T SFOR THE YEAR ENDED 30 JUNE 2017
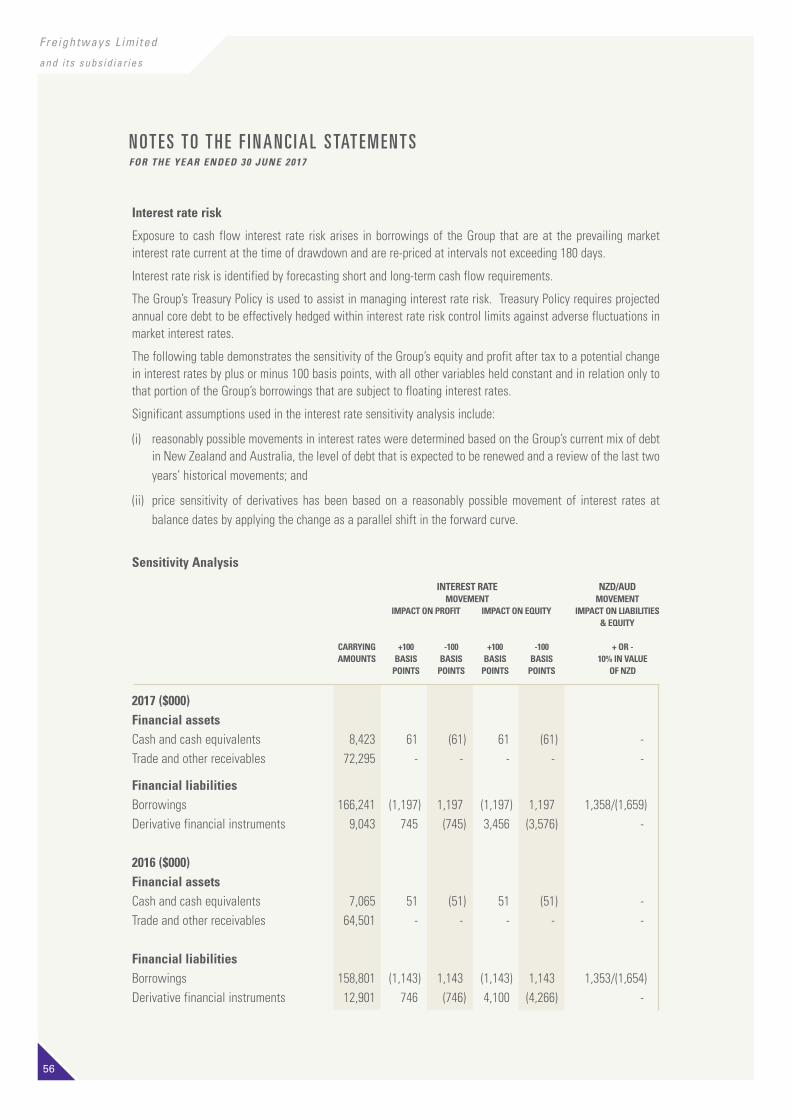
56
Fre ightways L imi ted
and i ts subsid iar ies
N OT E S TO T H E F I N A N C I A L S TAT E M E N T SFOR THE YEAR ENDED 30 JUNE 2017
Interest rate risk
Exposure to cash flow interest rate risk arises in borrowings of the Group that are at the prevailing market interest rate current at the time of drawdown and are re-priced at intervals not exceeding 180 days.
Interest rate risk is identified by forecasting short and long-term cash flow requirements.
The Group’s Treasury Policy is used to assist in managing interest rate risk. Treasury Policy requires projected annual core debt to be effectively hedged within interest rate risk control limits against adverse fluctuations in market interest rates.
The following table demonstrates the sensitivity of the Group’s equity and profit after tax to a potential change in interest rates by plus or minus 100 basis points, with all other variables held constant and in relation only to that portion of the Group’s borrowings that are subject to floating interest rates.
Significant assumptions used in the interest rate sensitivity analysis include:
(i) reasonably possible movements in interest rates were determined based on the Group’s current mix of debt in New Zealand and Australia, the level of debt that is expected to be renewed and a review of the last two years’ historical movements; and
(ii) price sensitivity of derivatives has been based on a reasonably possible movement of interest rates at balance dates by applying the change as a parallel shift in the forward curve.
Sensitivity Analysis
INTEREST RATE NZD/AUD MOVEMENT MOVEMENT IMPACT ON PROFIT IMPACT ON EQUITY IMPACT ON LIABILITIES & EQUITY
CARRYING +100 -100 +100 -100 + OR - AMOUNTS BASIS BASIS BASIS BASIS 10% IN VALUE POINTS POINTS POINTS POINTS OF NZD
2017 ($000)Financial assetsCash and cash equivalents 8,423 61 (61) 61 (61) -Trade and other receivables 72,295 - - - - -
Financial liabilities Borrowings 166,241 (1,197) 1,197 (1,197) 1,197 1,358/(1,659)Derivative financial instruments 9,043 745 (745) 3,456 (3,576) -
2016 ($000)Financial assets Cash and cash equivalents 7,065 51 (51) 51 (51) -Trade and other receivables 64,501 - - - - -
Financial liabilities Borrowings 158,801 (1,143) 1,143 (1,143) 1,143 1,353/(1,654)Derivative financial instruments 12,901 746 (746) 4,100 (4,266) -

Fre ightways L imi ted
and i ts subsid iar ies
57
N OT E S TO T H E F I N A N C I A L S TAT E M E N T SFOR THE YEAR ENDED 30 JUNE 2017
(d) Fair value estimation
The carrying value less impairment provision of trade receivables and payables is a reasonable approximation of their fair values due to the short-term nature of trade receivables and payables. The fair value of financial liabilities for disclosure purposes is estimated by discounting the future contractual cash flows at the current market interest rate that is available to the Group for similar financial instruments.
The fair values of financial instruments are estimated using discounted cash flows. The fair value of interest rate swaps is calculated as the present value of the estimated future cash flows.
Unless otherwise stated, all other carrying amounts are assumed to equal or approximate fair value.
The Group uses various methods in estimating the fair value of a financial instrument. The methods comprise:
Level 1 – Quoted prices (adjusted) in active markets for identical assets or liabilities at the reporting date. A market is regarded as active if quoted prices are readily and regularly available from an exchange, dealer, broker, industry group, pricing service, or regulatory agency, and those prices represent actual and regularly occurring market transactions on an arm’s length basis.
Level 2 – Inputs that are observable for the asset or liability, either directly (i.e., as prices; other than quoted prices referred to in Level 1 above) or indirectly (i.e., derived from prices). The fair value of financial instruments that are not traded in an active market (for example, over-the-counter derivatives) is determined by using valuation techniques. These valuation techniques maximise the use of observable market data where it is available and rely as little as possible on entity-specific estimates. If all significant inputs required to fair value an instrument are observable, the fair value of an instrument is included in Level 2.
Level 3 – Inputs for the asset or liability that are not based on observable market data (i.e., unobservable inputs). In these cases, the fair value of an instrument would be included in Level 3.
Specific valuation techniques used to value financial instruments include:
• In respect of interest rate swaps, the fair value is calculated as the present value of the estimated future cash flows based on observable yield curves;
• In respect of forward foreign exchange contracts, the fair value is calculated using forward exchange rates at the balance sheet date, with the resulting value discounted back to present value; and
• discounted cash flow analysis for other financial instruments.
Specific valuation techniques used to value contingent consideration in a business combination and estimated purchase price adjustments include:
• fair value is calculated as the present value of the estimated future cash flows based on management’s assessment of future performance; and
• management’s knowledge of the business and the industry it operates in.
Specific valuation techniques used to value aircraft held for sale include, among other factors, market demand and pricing of similar aircraft.

58
Fre ightways L imi ted
and i ts subsid iar ies
N OT E S TO T H E F I N A N C I A L S TAT E M E N T SFOR THE YEAR ENDED 30 JUNE 2017
The amounts below are for aircraft held for sale. There were no transfers between levels during the year.
LEVEL 1 LEVEL 2 LEVEL 3 TOTAL $000 $000 $000 $000
2017
Assets
Aircraft held for sale - - - -
Total assets - - - -
2016
Assets
Aircraft held for sale - 1,000 - 1,000
Total assets - 1,000 - 1,000
The amounts below are for the derivative financial instruments and contingent consideration in a business combination. There were no transfers between levels during the year.
LEVEL 1 LEVEL 2 LEVEL 3 TOTAL $000 $000 $000 $000
2017
Liabilities
Derivative financial instruments - 9,043 - 9,043
Contingent consideration in a business combination - - 1,786 1,786
Total liabilities - 9,043 1,786 10,829
2016
Liabilities
Derivative financial instruments - 12,901 - 12,901
Contingent consideration in a business combination - - 5,620 5,620
Total liabilities - 12,901 5,620 18,521
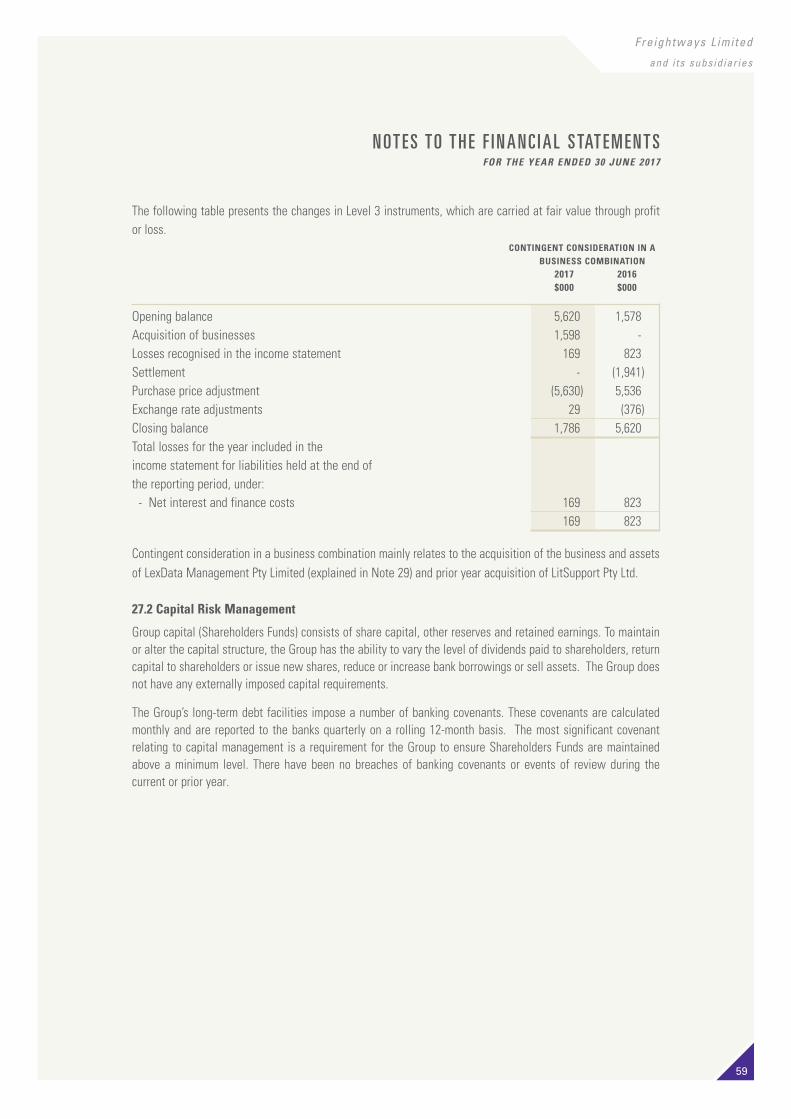
Fre ightways L imi ted
and i ts subsid iar ies
59
N OT E S TO T H E F I N A N C I A L S TAT E M E N T SFOR THE YEAR ENDED 30 JUNE 2017
The following table presents the changes in Level 3 instruments, which are carried at fair value through profit or loss. CONTINGENT CONSIDERATION IN A BUSINESS COMBINATION 2017 2016 $000 $000
Opening balance 5,620 1,578Acquisition of businesses 1,598 -Losses recognised in the income statement 169 823Settlement - (1,941)Purchase price adjustment (5,630) 5,536Exchange rate adjustments 29 (376)Closing balance 1,786 5,620Total losses for the year included in the income statement for liabilities held at the end of the reporting period, under: - Net interest and finance costs 169 823 169 823
Contingent consideration in a business combination mainly relates to the acquisition of the business and assets of LexData Management Pty Limited (explained in Note 29) and prior year acquisition of LitSupport Pty Ltd.
27.2 Capital Risk Management
Group capital (Shareholders Funds) consists of share capital, other reserves and retained earnings. To maintain or alter the capital structure, the Group has the ability to vary the level of dividends paid to shareholders, return capital to shareholders or issue new shares, reduce or increase bank borrowings or sell assets. The Group does not have any externally imposed capital requirements.
The Group’s long-term debt facilities impose a number of banking covenants. These covenants are calculated monthly and are reported to the banks quarterly on a rolling 12-month basis. The most significant covenant relating to capital management is a requirement for the Group to ensure Shareholders Funds are maintained above a minimum level. There have been no breaches of banking covenants or events of review during the current or prior year.
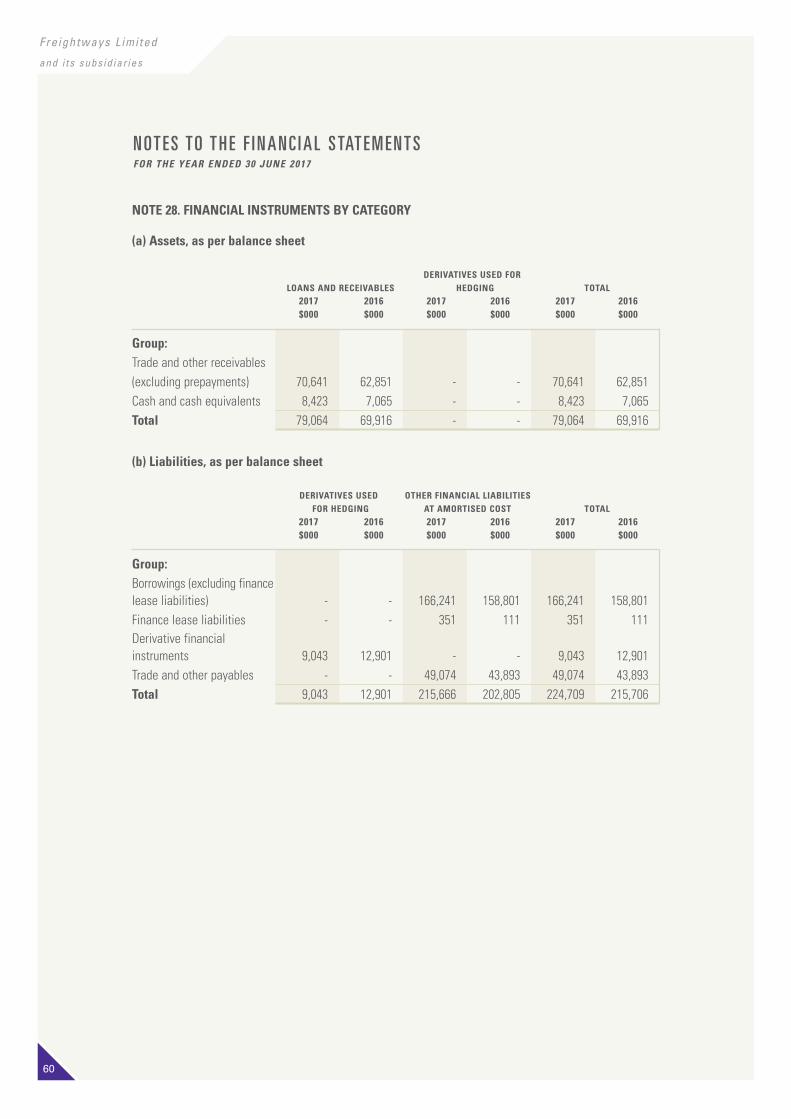
60
Fre ightways L imi ted
and i ts subsid iar ies
N OT E S TO T H E F I N A N C I A L S TAT E M E N T SFOR THE YEAR ENDED 30 JUNE 2017
NOTE 28. FINANCIAL INSTRUMENTS BY CATEGORY
(a) Assets, as per balance sheet DERIVATIVES USED FOR LOANS AND RECEIVABLES HEDGING TOTAL 2017 2016 2017 2016 2017 2016 $000 $000 $000 $000 $000 $000
Group: Trade and other receivables (excluding prepayments) 70,641 62,851 - - 70,641 62,851Cash and cash equivalents 8,423 7,065 - - 8,423 7,065Total 79,064 69,916 - - 79,064 69,916
(b) Liabilities, as per balance sheet
DERIVATIVES USED OTHER FINANCIAL LIABILITIES FOR HEDGING AT AMORTISED COST TOTAL 2017 2016 2017 2016 2017 2016 $000 $000 $000 $000 $000 $000
Group: Borrowings (excluding finance lease liabilities) - - 166,241 158,801 166,241 158,801Finance lease liabilities - - 351 111 351 111Derivative financialinstruments 9,043 12,901 - - 9,043 12,901 Trade and other payables - - 49,074 43,893 49,074 43,893 Total 9,043 12,901 215,666 202,805 224,709 215,706
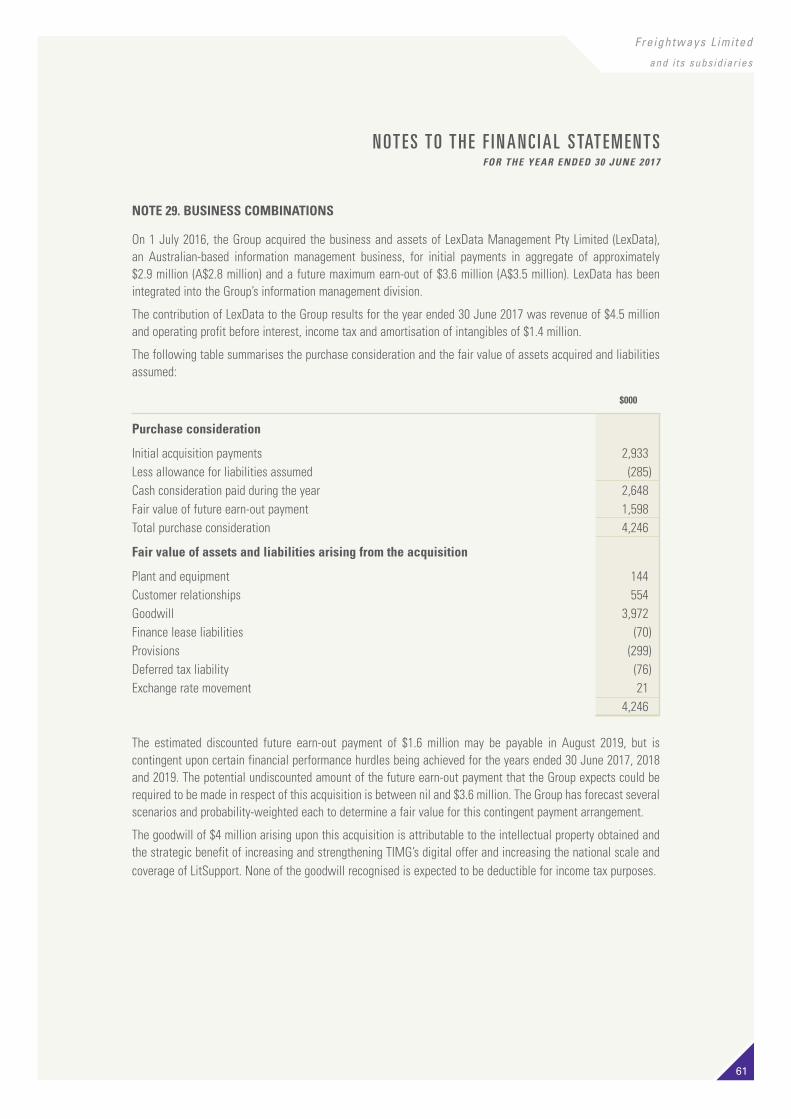
Fre ightways L imi ted
and i ts subsid iar ies
61
N OT E S TO T H E F I N A N C I A L S TAT E M E N T SFOR THE YEAR ENDED 30 JUNE 2017
NOTE 29. BUSINESS COMBINATIONS
On 1 July 2016, the Group acquired the business and assets of LexData Management Pty Limited (LexData), an Australian-based information management business, for initial payments in aggregate of approximately $2.9 million (A$2.8 million) and a future maximum earn-out of $3.6 million (A$3.5 million). LexData has been integrated into the Group’s information management division.
The contribution of LexData to the Group results for the year ended 30 June 2017 was revenue of $4.5 million and operating profit before interest, income tax and amortisation of intangibles of $1.4 million.
The following table summarises the purchase consideration and the fair value of assets acquired and liabilities assumed:
$000
Purchase consideration
Initial acquisition payments 2,933Less allowance for liabilities assumed (285)Cash consideration paid during the year 2,648Fair value of future earn-out payment 1,598Total purchase consideration 4,246
Fair value of assets and liabilities arising from the acquisition
Plant and equipment 144Customer relationships 554Goodwill 3,972Finance lease liabilities (70)Provisions (299)Deferred tax liability (76)Exchange rate movement 21 4,246
The estimated discounted future earn-out payment of $1.6 million may be payable in August 2019, but is contingent upon certain financial performance hurdles being achieved for the years ended 30 June 2017, 2018 and 2019. The potential undiscounted amount of the future earn-out payment that the Group expects could be required to be made in respect of this acquisition is between nil and $3.6 million. The Group has forecast several scenarios and probability-weighted each to determine a fair value for this contingent payment arrangement.
The goodwill of $4 million arising upon this acquisition is attributable to the intellectual property obtained and the strategic benefit of increasing and strengthening TIMG’s digital offer and increasing the national scale and coverage of LitSupport. None of the goodwill recognised is expected to be deductible for income tax purposes.

62
Fre ightways L imi ted
and i ts subsid iar ies
N OT E S TO T H E F I N A N C I A L S TAT E M E N T SFOR THE YEAR ENDED 30 JUNE 2017
NOTE 30. SIGNIFICANT EVENTS AFTER BALANCE DATE
Dividend declared
On 14 August 2017, the Directors declared a fully imputed final dividend of 14.75 cents per share (approximately $22.9 million) in respect of the year ended 30 June 2017. The dividend will be paid on 2 October 2017. The record date for determination of entitlements to the dividend is 15 September 2017.
Renewal of bank facilities
The Group has negotiated a three-year extension to the existing debt facilities of NZ$37 million and A$27.5 million that have a maturity date of 1 September 2018. The extension is effective from 14 July 2017 and is at higher pricing compared to existing facilities. In addition, the New Zealand dollars facility has been reduced by $6.5 million.
At the date of this report, there have been no other significant events subsequent to the reporting date.
NOTE 31. STANDARDS, AMENDMENTS AND INTERPRETATIONS TO EXISTING STANDARDS THAT ARE NOT YET EFFECTIVE
New standards, amendments and interpretations to existing standards have been published by the International Accounting Standards Board (IASB) and the External Reporting Board (XRB) that are mandatory for future periods and which the Group will adopt when they become mandatory. These new standards, amendments and interpretations include:
• NZ IFRS 9 Financial Instruments (mandatory for annual periods beginning on or after 1 January 2018).
- NZ IFRS 9 addresses the classification, measurement and recognition of financial assets and financial liabilities. The complete version of NZ IFRS 9 was issued in September 2014. It replaces the guidance in NZ IAS 39 that relates to the classification and measurement of financial instruments. NZ IFRS 9 retains but simplifies the mixed measurement model and establishes three primary measurement categories for financial assets: amortised cost, fair value through other comprehensive income and fair value through profit or loss. The basis of classification depends on the entity's business model and the contractual cash flow characteristics of the financial asset. Investments in equity instruments are required to be measured at fair value through profit or loss with the irrevocable option at inception to present changes in fair value in other comprehensive income not recycling. There is now a new expected credit losses model that replaces the incurred loss impairment model used in NZ IAS 39. For financial liabilities there were no changes to classification and measurement except for the recognition of changes in own credit risk in other comprehensive income, for liabilities designated at fair value through profit or loss. NZ IFRS 9 relaxes the requirements for hedge effectiveness by replacing the bright line hedge effectiveness tests. It requires an economic relationship between the hedged item and hedging instrument and for the ‘hedged ratio’ to be the same as the one management actually uses for risk management purposes. Contemporaneous documentation is still required but is different to that currently prepared under NZ IAS 39.
- The standard is effective for accounting periods beginning on or after 1 January 2018. Early adoption is permitted. The Group intends to adopt NZ IFRS 9 on its effective date and is planning to commence assessment of the impact of NZ IFRS 9 during the 2018 financial year.
Fre ightways L imi ted
and i ts subsid iar ies
63
N OT E S TO T H E F I N A N C I A L S TAT E M E N T SFOR THE YEAR ENDED 30 JUNE 2017
• NZ IFRS 15 Revenue from Contracts with Customers (effective for annual periods beginning on or after 1 January 2018).
- NZ IFRS 15 deals with revenue recognition and establishes principles for reporting useful information to users of financial statements about the nature, amount, timing and uncertainty of revenue and cash flows arising from an entity’s contracts with customers. Revenue is recognised when a customer obtains control of a good or service and therefore has the ability to direct the use and obtain the benefits from the good or service. The standard replaces NZ IAS 18 'Revenue' and NZ IAS 11 'Construction contracts' and related interpretations.
- The standard is effective for annual periods beginning on or after 1 January 2018 and earlier application is permitted. The Group intends to adopt NZ IFRS 15 on its effective date and is planning to commence assessment of the impact of NZ IFRS 15 during the 2018 financial year. This standard is not expected to significantly impact the Group.
• NZ IFRS 16 Leases (effective for annual periods beginning on or after 1 January 2019).
- NZ IFRS 16 replaces the current guidance in NZ IAS 17. Under NZ IFRS 16, a contract is, or contains, a lease if the contract conveys the right to control the use of an identified asset for a period of time in exchange for consideration. Under NZ IAS 17, a lessee was required to make a distinction between a finance lease (on balance sheet) and an operating lease (off balance sheet). NZ IFRS 16 now requires a lessee to recognise a lease liability reflecting future lease payments and a ‘right-of-use asset’ for virtually all lease contracts. Included is an optional exemption for certain short-term leases and leases of low-value assets; however, this exemption can only be applied by lessees.
- The standard is effective for accounting periods beginning on or after 1 January 2019. Early adoption is permitted but only in conjunction with NZ IFRS 15, ‘Revenue from Contracts with Customers’. The Group intends to adopt NZ IFRS 16 on its effective date and is planning to commence assessment of the impact of NZ IFRS 16 during the 2018 financial year.
There are no other IFRSs or IFRIC interpretations that are not yet effective that would be expected to have a material impact on the Group.
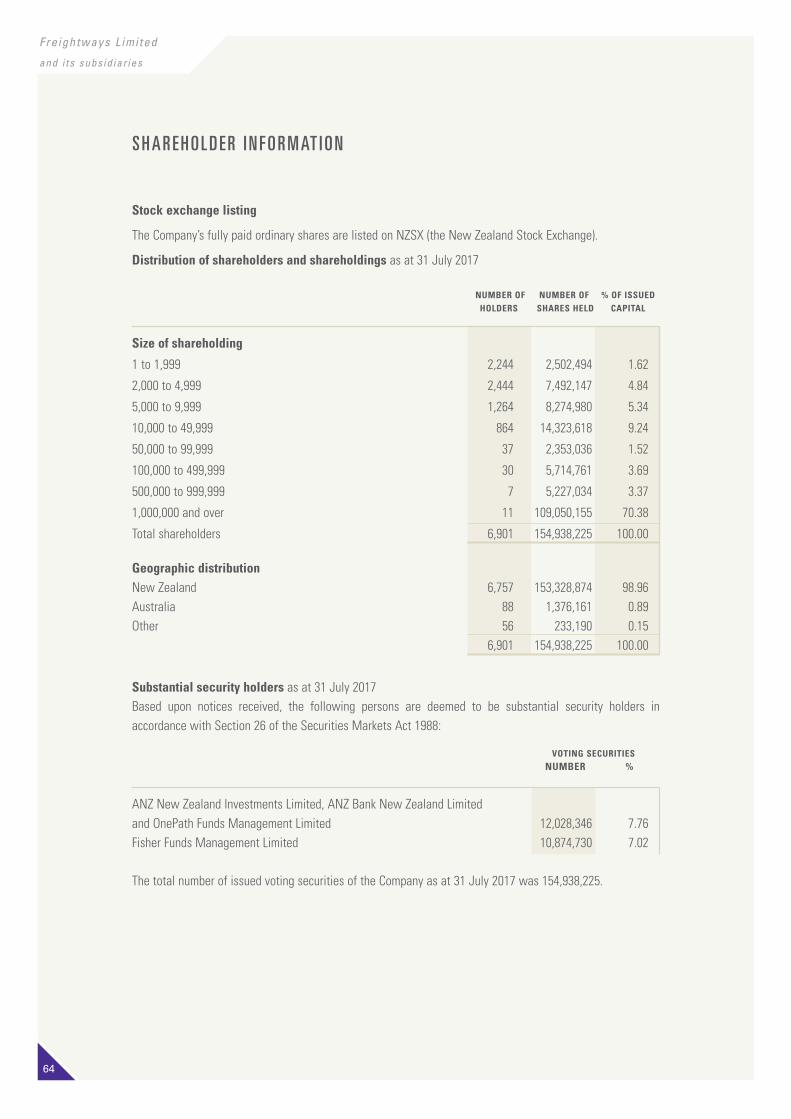
64
Fre ightways L imi ted
and i ts subsid iar ies
S H A R E H O L D E R I N F O R M AT I O N
Stock exchange listing
The Company’s fully paid ordinary shares are listed on NZSX (the New Zealand Stock Exchange).
Distribution of shareholders and shareholdings as at 31 July 2017
NUMBER OF NUMBER OF % OF ISSUED HOLDERS SHARES HELD CAPITAL
Size of shareholding
1 to 1,999 2,244 2,502,494 1.62
2,000 to 4,999 2,444 7,492,147 4.84
5,000 to 9,999 1,264 8,274,980 5.34
10,000 to 49,999 864 14,323,618 9.24
50,000 to 99,999 37 2,353,036 1.52
100,000 to 499,999 30 5,714,761 3.69
500,000 to 999,999 7 5,227,034 3.37
1,000,000 and over 11 109,050,155 70.38
Total shareholders 6,901 154,938,225 100.00
Geographic distributionNew Zealand 6,757 153,328,874 98.96Australia 88 1,376,161 0.89Other 56 233,190 0.15 6,901 154,938,225 100.00
Substantial security holders as at 31 July 2017Based upon notices received, the following persons are deemed to be substantial security holders in accordance with Section 26 of the Securities Markets Act 1988: VOTING SECURITIES NUMBER %
ANZ New Zealand Investments Limited, ANZ Bank New Zealand Limited and OnePath Funds Management Limited 12,028,346 7.76Fisher Funds Management Limited 10,874,730 7.02
The total number of issued voting securities of the Company as at 31 July 2017 was 154,938,225.

Fre ightways L imi ted
and i ts subsid iar ies
65
Top twenty registered shareholders of listed shares as at 31 July 2017
NUMBER OF % OF ISSUED SHARES HELD CAPITAL
HSBC Nominees (New Zealand) Limited <HKBN45>* 16,994,175 10.97TEA Custodians Limited <TEAC40>* 11,365,313 7.34Citibank Nominees (New Zealand) Limited <CNOM90>* 9,119,528 5.89HSBC Nominees (New Zealand) Limited <HKBN90>* 8,576,071 5.54ANZ Custodial Services New Zealand Limited <PBNK90>* 6,722,712 4.34FNZ Custodians Limited 5,433,199 3.51Accident Compensation Corporation <ACCI40>* 4,968,711 3.21JPMorgan Chase Bank <CHAM24>* 4,324,150 2.79Forsyth Barr Custodians Limited <1-Custody> 4,021,136 2.60Custodial Services Limited <A/C 3> 3,507,468 2.26ANZ Wholesale Australasian Share Fund <PNAS90>* 3,414,954 2.20National Nominees New Zealand Limited <NNLZ90>* 3,349,752 2.16JBWere (NZ) Nominees Limited <NZ Resident A/C> 3,273,252 2.11Port Devon Limited 3,153,469 2.04BNP Paribas Nominees (NZ) Limited* 3,150,704 2.03Investment Custodial Services Limited <A/C C> 2,678,361 1.73BNP Paribas Nominees (NZ) Limited <BPSS40>* 2,325,148 1.50BNP Paribas Nominees (NZ) Limited <COGN40>* 2,068,089 1.33HSBC Nominees A/C NZ Superannuation Fund Nominees Limited <SUPR40>* 1,769,650 1.14Custodial Services Limited <A/C 4> 1,570,018 1.01 101,785,860 65.70
* held through NZ Central Securities Depository Limited
S H A R E H O L D E R I N F O R M AT I O N
66
Fre ightways L imi ted
and i ts subsid iar ies
C O R P O R AT E G OV E R N A N C E S TAT E M E N T
This statement is an overview of the Group’s main corporate governance policies, practices and processes adopted or followed by the Board of Directors. The Group’s corporate governance processes do not materially differ from the principles set out in the NZX Corporate Governance Best Practice Code.
THE ROLE OF THE BOARD OF DIRECTORS
The Board of Directors of Freightways Limited (the Board) is committed to the highest standards of corporate governance and ethical behaviour, both in form and substance, amongst its Directors and the people of the Company and its subsidiaries (Freightways).
BOARD RESPONSIBILITIES
The Board’s corporate governance responsibilities include overseeing the management of Freightways to ensure proper direction and control of Freightways’ activities.
In particular, the Board will establish corporate objectives and monitor management’s implementation of strategies to achieve those objectives. It will approve budgets and monitor performance against budget. The Board will ensure adequate risk management strategies are in place and monitor the integrity of management information and the timeliness of reporting to shareholders and other stakeholder groups.
The Board will follow the corporate governance rules established by the New Zealand Stock Exchange and Directors will act in accordance with their fiduciary duties in the best interests of the Company.
A formal charter has been adopted by the Board that elaborates on Directors’ responsibilities. The Board will internally evaluate its performance annually. Any recommendations flowing from this review will be implemented promptly. The Board will review its Corporate Governance practice against current best practice and continue to develop company policies and procedures, as deemed necessary.
BOARD COMPOSITION
In accordance with the Company’s constitution the Board will comprise not less than three directors. The Board will be comprised of a mix of persons with complementary skills appropriate to the Company’s objectives and strategies. The Board must include not less than two persons (or if there are eight or more directors, three persons or one third rounded down to the nearest whole number of directors) who are deemed to be independent.
Freightways’ Board currently comprises six Directors: the non-executive Chairman, the Managing Director and four non-executive Directors. Freightways’ Board includes five independent Directors. Key executives attend board meetings by invitation.
DIVERSITYThe Company does not have a formal diversity policy. The Company is, however, committed to encouraging diversity throughout all levels of its operations and by ensuring all employees have an equal opportunity to realise their career ambitions within Freightways. As required to be reported by the NZX Listing Rules, the Company advises that from a gender diversity perspective, as at 30 June 2017, the Board was comprised of 5 male Directors and 1 female non-executive Chairman (2016: 5 male Directors and 1 female non-executive Chairman), and all 5 officers of the Company, who are not Directors, were male (2016: all 5 officers of the Company, who are not Directors, were male).
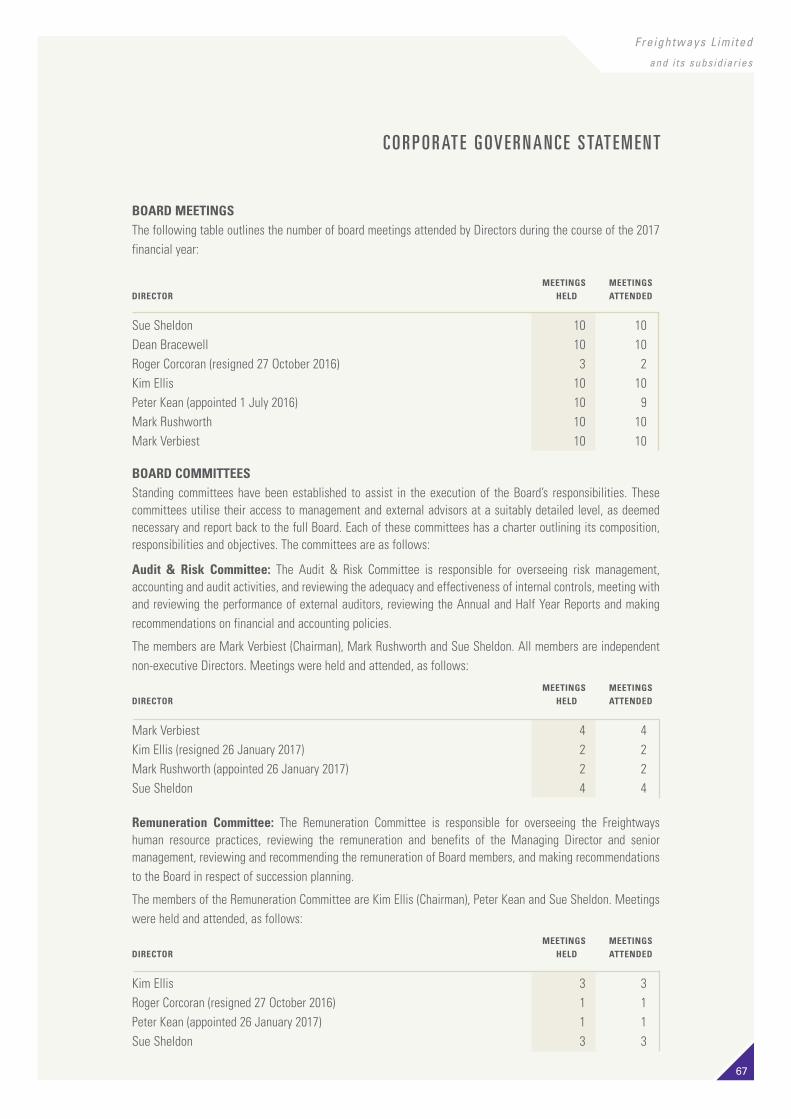
Fre ightways L imi ted
and i ts subsid iar ies
67
BOARD MEETINGSThe following table outlines the number of board meetings attended by Directors during the course of the 2017 financial year:
MEETINGS MEETINGSDIRECTOR HELD ATTENDED
Sue Sheldon 10 10Dean Bracewell 10 10Roger Corcoran (resigned 27 October 2016) 3 2Kim Ellis 10 10Peter Kean (appointed 1 July 2016) 10 9Mark Rushworth 10 10Mark Verbiest 10 10
BOARD COMMITTEESStanding committees have been established to assist in the execution of the Board’s responsibilities. These committees utilise their access to management and external advisors at a suitably detailed level, as deemed necessary and report back to the full Board. Each of these committees has a charter outlining its composition, responsibilities and objectives. The committees are as follows:
Audit & Risk Committee: The Audit & Risk Committee is responsible for overseeing risk management, accounting and audit activities, and reviewing the adequacy and effectiveness of internal controls, meeting with and reviewing the performance of external auditors, reviewing the Annual and Half Year Reports and making recommendations on financial and accounting policies.
The members are Mark Verbiest (Chairman), Mark Rushworth and Sue Sheldon. All members are independent non-executive Directors. Meetings were held and attended, as follows:
MEETINGS MEETINGSDIRECTOR HELD ATTENDED
Mark Verbiest 4 4Kim Ellis (resigned 26 January 2017) 2 2Mark Rushworth (appointed 26 January 2017) 2 2Sue Sheldon 4 4
Remuneration Committee: The Remuneration Committee is responsible for overseeing the Freightways human resource practices, reviewing the remuneration and benefits of the Managing Director and senior management, reviewing and recommending the remuneration of Board members, and making recommendations to the Board in respect of succession planning.
The members of the Remuneration Committee are Kim Ellis (Chairman), Peter Kean and Sue Sheldon. Meetings were held and attended, as follows:
MEETINGS MEETINGSDIRECTOR HELD ATTENDED
Kim Ellis 3 3Roger Corcoran (resigned 27 October 2016) 1 1Peter Kean (appointed 26 January 2017) 1 1Sue Sheldon 3 3
C O R P O R AT E G OV E R N A N C E S TAT E M E N T
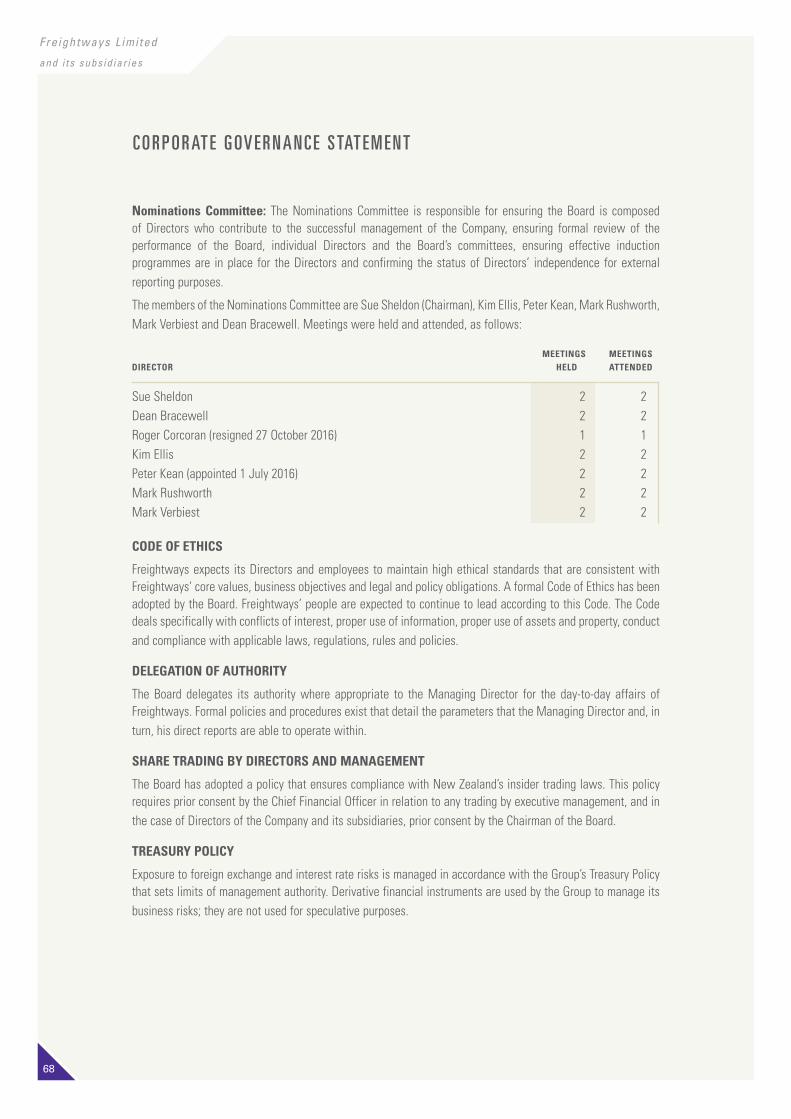
68
Fre ightways L imi ted
and i ts subsid iar ies
C O R P O R AT E G OV E R N A N C E S TAT E M E N T
CODE OF ETHICS
Freightways expects its Directors and employees to maintain high ethical standards that are consistent with Freightways’ core values, business objectives and legal and policy obligations. A formal Code of Ethics has been adopted by the Board. Freightways’ people are expected to continue to lead according to this Code. The Code deals specifically with conflicts of interest, proper use of information, proper use of assets and property, conduct and compliance with applicable laws, regulations, rules and policies.
DELEGATION OF AUTHORITY
The Board delegates its authority where appropriate to the Managing Director for the day-to-day affairs of Freightways. Formal policies and procedures exist that detail the parameters that the Managing Director and, in turn, his direct reports are able to operate within.
SHARE TRADING BY DIRECTORS AND MANAGEMENT
The Board has adopted a policy that ensures compliance with New Zealand’s insider trading laws. This policy requires prior consent by the Chief Financial Officer in relation to any trading by executive management, and in the case of Directors of the Company and its subsidiaries, prior consent by the Chairman of the Board.
TREASURY POLICY
Exposure to foreign exchange and interest rate risks is managed in accordance with the Group’s Treasury Policy that sets limits of management authority. Derivative financial instruments are used by the Group to manage its business risks; they are not used for speculative purposes.
Nominations Committee: The Nominations Committee is responsible for ensuring the Board is composed of Directors who contribute to the successful management of the Company, ensuring formal review of the performance of the Board, individual Directors and the Board’s committees, ensuring effective induction programmes are in place for the Directors and confirming the status of Directors’ independence for external reporting purposes.
The members of the Nominations Committee are Sue Sheldon (Chairman), Kim Ellis, Peter Kean, Mark Rushworth, Mark Verbiest and Dean Bracewell. Meetings were held and attended, as follows:
MEETINGS MEETINGSDIRECTOR HELD ATTENDED
Sue Sheldon 2 2Dean Bracewell 2 2Roger Corcoran (resigned 27 October 2016) 1 1Kim Ellis 2 2Peter Kean (appointed 1 July 2016) 2 2Mark Rushworth 2 2Mark Verbiest 2 2
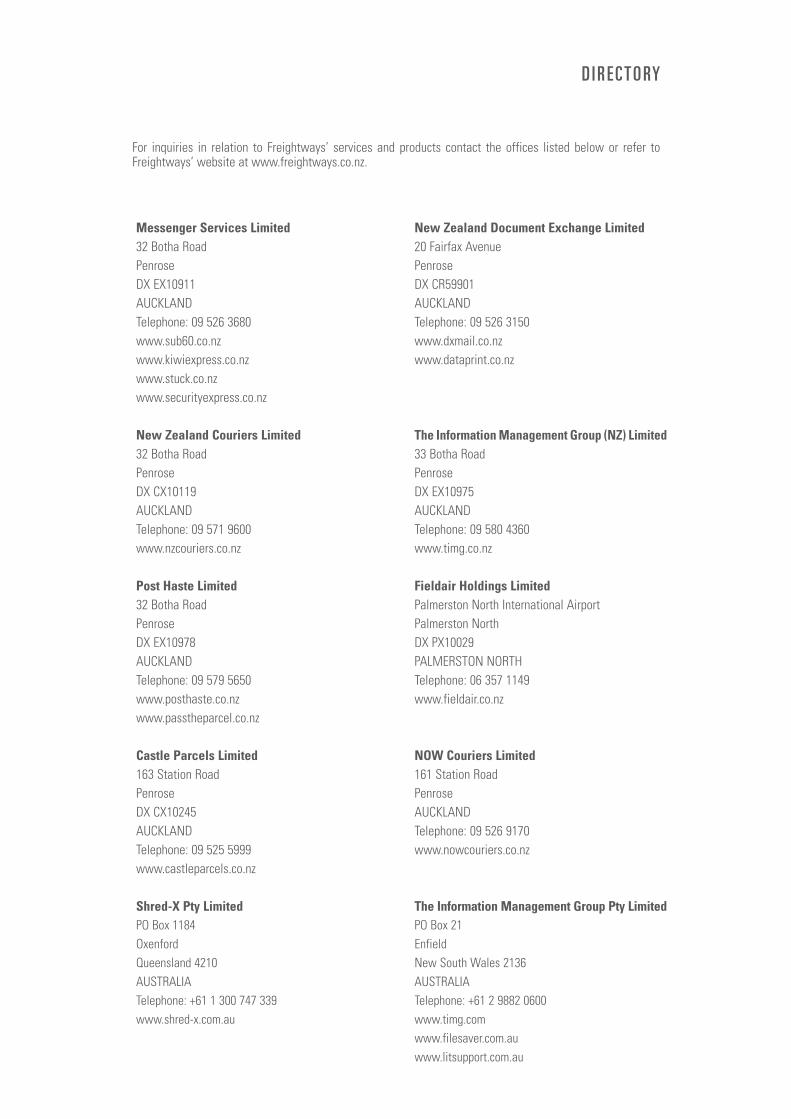
DX Mail www.dxmail.co.nz
Dataprint www.dataprint.co.nz
Security Express www.securityexpress.co.nz
Pass The Parcel www.passtheparcel.co.nz
Stuck www.stuck.co.nz
Post Haste Couriers www.posthaste.co.nz
New Zealand Couriers www.nzcouriers.co.nz
Air Freight NZ Freightways Information ServicesFieldair Engineering www.fieldair.co.nz
Parceline Express
Databank www.timg.com
Shred-X www.shred-x.com.au
Filesaver www.filesaver.com.au
LitSupport www.litsupport.com.au
SUB60 www.sub60.co.nz
Kiwi Express Couriers www.kiwiexpress.co.nz
Security Express www.securityexpress.co.nz
Data Security Services www.timg.co.nz
The Information Management Group www.timg.co.nz
Document Destruction Service www.timg.co.nz
Archive Security www.timg.co.nz
Castle Parcels www.castleparcels.co.nz
Now Couriers www.nowcouriers.co.nz
D I R E C TO RY
For inquiries in relation to Freightways’ services and products contact the offices listed below or refer to Freightways’ website at www.freightways.co.nz.
Messenger Services Limited New Zealand Document Exchange Limited32 Botha Road 20 Fairfax AvenuePenrose PenroseDX EX10911 DX CR59901AUCKLAND AUCKLAND Telephone: 09 526 3680 Telephone: 09 526 3150www.sub60.co.nz www.dxmail.co.nzwww.kiwiexpress.co.nz www.dataprint.co.nzwww.stuck.co.nzwww.securityexpress.co.nz
New Zealand Couriers Limited The Information Management Group (NZ) Limited32 Botha Road 33 Botha RoadPenrose PenroseDX CX10119 DX EX10975AUCKLAND AUCKLANDTelephone: 09 571 9600 Telephone: 09 580 4360www.nzcouriers.co.nz www.timg.co.nz
Post Haste Limited Fieldair Holdings Limited32 Botha Road Palmerston North International AirportPenrose Palmerston NorthDX EX10978 DX PX10029AUCKLAND PALMERSTON NORTHTelephone: 09 579 5650 Telephone: 06 357 1149www.posthaste.co.nz www.fieldair.co.nzwww.passtheparcel.co.nz
Castle Parcels Limited NOW Couriers Limited163 Station Road 161 Station Road Penrose PenroseDX CX10245 AUCKLANDAUCKLAND Telephone: 09 526 9170Telephone: 09 525 5999 www.nowcouriers.co.nz www.castleparcels.co.nz
Shred-X Pty Limited The Information Management Group Pty LimitedPO Box 1184 PO Box 21 Oxenford EnfieldQueensland 4210 New South Wales 2136AUSTRALIA AUSTRALIA Telephone: +61 1 300 747 339 Telephone: +61 2 9882 0600www.shred-x.com.au www.timg.com
www.filesaver.com.auwww.litsupport.com.au

ANNUAL REPORT 2017