annual report 2018 sharing risk to create -...
TRANSCRIPT

Annual Report 2018Sharing risk to create a braver world

Lloyd’s is the world’s leading insurance and reinsurance marketplace. Through the collective intelligence and risk-sharing expertise of the market’s underwriters and brokers, Lloyd’s helps to create a braver world.
The Lloyd’s market provides the leadership and insight to anticipate and understand risk, and the knowledge to develop relevant, new and innovative forms of insurance for customers globally.
It offers the efficiencies of shared resources and services in a marketplace that covers and shares risks from more than 200 territories, in any industry, at any scale.
And it promises a trusted, enduring partnership built on the confidence that Lloyd’s protects what matters most: helping people, businesses and communities to recover in times of need.
Lloyd’s began with a few courageous entrepreneurs in a coffee shop. Three centuries later, the Lloyd’s market continues that proud tradition, sharing risk in order to protect, build resilience and inspire courage everywhere.

Contents
Overview02 At a Glance04 Chairman’s Statement06 Chief Executive’s Statement
Strategic Report10 Lloyd’s Purpose and Business12 External Environment14 Lloyd’s Key Risks and Risk Appetite16 Areas of Focus in 201819 Responsible Business21 Future Direction
Market Results24 2018 Highlights36 Statement of Council’s Responsibilities 37 Report of PricewaterhouseCoopers LLP to the
Council on the 2018 Pro Forma Financial Statements38 Pro Forma Profit and Loss Account39 Pro Forma Statement of Comprehensive Income40 Pro Forma Balance Sheet41 Pro Forma Statement of Cash Flows42 Notes to the Pro Forma Financial Statements67 Managing Agents and Syndicates
Society Report72 Financial Highlights73 Corporate Governance82 The Council87 The Board90 Internal Control Statement92 Report of the Remuneration Committee105 Report of the Audit Committee108 Report of the Lloyd’s Members’ Ombudsman109 Financial Review116 Statement of the Council’s Responsibilities
for the Financial Statements117 Independent Auditor’s Report to the Members
of the Society of Lloyd’s122 Group Income Statement123 Group Statement of Comprehensive Income124 Group Statement of Financial Position125 Group Statement of Changes in Equity126 Group Statement of Cash Flows127 Notes to the Financial Statements181 Five Year Summary
Other Information184 Alternative Performance Measures185 Glossary of Terms and Useful Links
Lloyd’s Annual Report 2018 01
Market Results Society Report Other InformationStrategic Report

Loss before tax
(£1,001m)(2017: loss of £2,001m)
Gross written premium
£35,527m(2017: £33,591m)
Combined ratio*
104.5%(2017: 114.0%)
Investment return*
£504m(2017: £1,800m)
Pre-tax return on capital *
(3.7%)(2017: (7.3%))
Net resources
£28,222m(2017: £27,560m)
Operating highlights
— The Lloyd’s market paid out £19.7bn of gross claims in 2018 and has been able to
meet these substantial commitments without impacting on our total resources, which
remain strong at £28.2bn.
— Lloyd’s Insurance Company, in Brussels, commenced trading to allow the market to
continue to support customers on the continent of Europe in a post-Brexit world.
Underwriting result by line of business* Combined ratio by line of business*
Reinsurance (£456m) Reinsurance 106.0%
Property (£700m) Property 110.4%
Casualty (£183m) Casualty 102.9%
Marine (£343m) Marine 116.0%
Energy £113m Energy 87.4%
Motor £12m Motor 98.7%
Aviation (£49m) Aviation 112.0%
Life £16m Life 77.8%
At a GlanceOur excellent capital strength reaffirms that Lloyd’s remains in robust financial shape. Lloyd’s entered 2019 in a secure position following 2018’s result, which reflects ongoing challenging underwriting and investment market conditions.
02 Lloyd’s Annual Report 2018

Lloyd’s lines of business breakdown by region
Rest of Europe
13%30% Reinsurance19% Property 26% Casualty16% Marine4% Energy2% Motor 3% Aviation
Central Asia & Asia Pacific
11%43% Reinsurance19% Property 28% Casualty6% Marine2% Energy1% Motor 1% Aviation
Rest of the World
4%63% Reinsurance9% Property 11% Casualty6% Marine4% Energy3% Motor 4% Aviation
Global total: 31% Reinsurance
27% Property
26% Casualty
7% Marine4% Energy3% Motor
2% Aviation
US and Canada
51%22% Reinsurance36% Property 28% Casualty6% Marine5% Energy2% Motor 1% Aviation
Other Americas
7%67% Reinsurance9% Property 14% Casualty7% Marine1% Energy1% Motor 1% Aviation
UK
14%31% Reinsurance26% Property 25% Casualty6% Marine2% Energy9% Motor 1% Aviation
The combined ratio for the market and by line of business is the ratio of net incurred claims and net operating expenses to net earned premiums. The prior year movement represents the ratio of the surplus/deficit arising on reserves set at December 2017 to overall net earned premiums in calendar year 2018. The overall combined ratio includes central adjustments in the technical account in respect of transactions between syndicates and the Society as described in notes 2 and 8 to the PFFS (pages 42, 43 and 59). The combined ratios and results for individual lines of business do not include these adjustments as the market commentary for each line of business reflects trading conditions at syndicate level as reported in syndicate annual accounts. The underwriting result and combined ratio tables include the results of all life and non-life syndicates transacting business during 2018. The results and net assets for life syndicates are not material and have not been separately disclosed in the profit and loss account and balance sheet. The results for life business have been reported in the segmental analysis, note 9 on page 60.
* The combined ratio, the return on capital, the investment return, the underwriting result and the accident year ratio are metrics that are consistently used to analyse financial performance in the Lloyd’s Market Results and/or in the Society Report. These metrics (wherever used in this Annual Report) are Alternative Performance Measures (APMs), with further information available on page 184.
Lloyd’s capital providers by source and location (%)
20.1
13.4
12.7
10.8
10.7
10.2
9.5
7.1
5.5
US insurance industry
Bermudian insurance industry
Japan insurance industry
UK insurance industry
European insurance industry
Private capital – limited & unlimited
Rest of the World insurance industry
Worldwide non-insurance
Middle/Far East insurance industry
Lloyd’s Annual Report 2018 03
Strategic Report Society Report Other InformationMarket Results

Against a backdrop of global macro-economic instability, performance in the insurance sector continued to be affected by the tough underwriting and investment market conditions.Bruce Carnegie-BrownChairman
I am delighted that in 2018 Lloyd’s donated £1.4m to nearly 200 charitable organisations and activities, supporting more than 13,000 people. We also celebrated almost 3,000 volunteers from across the Lloyd’s market giving 22,000 hours of their time to charitable causes.
Much of the work we did last year was set in motion by our former CEO Dame Inga Beale who stepped down from her role after five years at Lloyd’s. During her tenure, Inga drove a series of changes aimed at modernising the market, and making it more efficient and inclusive. The market owes her a debt of gratitude for her courage and persistence and we are committed to continuing her work on inclusion in the market.
As we said goodbye to Inga, so we welcomed John Neal as our new CEO. John, who took up the post in October, brings great energy, enthusiasm and passion to the role, and I am sure Lloyd’s will thrive under his leadership.
At the Board, we welcomed Mike Bracken, Nigel Hinshelwood and Fiona Luck, who were all appointed in March 2018. In February 2019, Neil Maidment was appointed to the Board, having left Council in January. At Council, we said goodbye to Matthew Fosh, Julian James and Philip Swatman who all stepped down after completing their terms of office. All of them have provided great service
Chairman’s Statement
These were reflected in the Lloyd’s market’s 2018 results, which were impacted by above-average major claims activity, and the low return and volatile investment environment. However, the result was underpinned by continued strengthening of the Lloyd’s market’s capital position and signs of improvement in underwriting performance.
During the year, Lloyd’s put in place a series of measures to improve the market’s competitiveness and relevance in the short, medium and long term.
Most importantly, this took the form of a rigorous performance management process to make sure business written in the Lloyd’s market is profitable and sustainable. We continued to invest in our digital future, mandating electronic placement and piloting new ways of connecting with our clients, coverholders and brokers around the world to make Lloyd’s easier to do business with. We enhanced our reputation for innovation by launching the Lloyd’s Lab, which connects new products and services with capital providers. We also made Lloyd’s Brexit-ready by opening our new subsidiary, Lloyd’s Brussels.
04 Lloyd’s Annual Report 2018

to Council. They have been succeeded by Christian Noyer, who joined Council in November 2018, and Albert Benchimol, Victoria Carter and John Sununu who joined in February 2019. All our new appointments bring a wealth of expertise and experience from different sectors that will help guide Lloyd’s as it evolves over the next few years.
On 18 February 2019, Lloyd’s learned of the death of Sir David Rowland, former Chairman of Lloyd’s, who in a time of crisis in the 1990s introduced a series of reforms to the market which restored the financial strength and reputation of Lloyd’s. Sir David was awarded a Gold Medal for Services to Lloyd’s in recognition of his critical contribution, and will be remembered as a wonderful man and a great leader of the Lloyd’s market.
While 2018 was a challenging year, it was also one in which the insurance sector once again demonstrated its value to society, paying billions of pounds in claims globally to help nations, businesses and communities recover post disaster.
The continuing challenge for all insurers is to create new products and services to help our customers manage and mitigate the rapidly evolving risks they face, to reduce our costs to remain competitive, and to adopt new ways of working to meet our clients’ changing needs and expectations. It is incumbent upon Lloyd’s, as the world’s leading specialist, commercial and corporate insurance and reinsurance market, to play our part in this transformation of our industry.
Lloyd’s succeeds when the market works together towards a common purpose and I am very grateful to all market participants for their support of Lloyd’s in 2018 and I look forward to earning their support again in 2019.
I am confident the work we began in 2018, and are continuing into 2019, positions Lloyd’s for success in the years ahead.
Bruce Carnegie-BrownChairman, Lloyd’s
Lloyd’s Annual Report 2018 05
Strategic Report Society Report Other InformationMarket Results

During 2018, the Lloyd’s market and Corporation worked together to address performance challenges with positive and thoughtful action, following a difficult 2017 result.John NealChief Executive Officer
Lloyd’s financial credentials and quality of our balance sheet go from strength to strength. Total assets grew by 9% to £118.0bn, with net resources up by 2% to £28.2bn. Central assets, the final link in Lloyd’s chain of security, also increased by 8% to £3.2bn. Nevertheless, the market’s aggregated 2018 results report a combined ratio of 104.5%, and a £1.0bn loss. This performance is not of the standard that we would expect of a market that has both the heritage and quality of Lloyd’s and we are taking further actions. In particular, we have implemented stronger performance management measures which will remain an enduring feature of how we go about our business.
2019 business plans have been constructed on a more rigorous basis, with almost £3bn of poorly performing business removed from the market. The 2018 performance review process has now been integrated into the regular planning process, allowing continuous oversight of inadequately performing syndicates and classes of business. We expect these actions to deliver progressive performance improvement across the market in 2019 and 2020.
We have a series of activities underway aimed at improving the Corporation’s systems, processes and technology, and the way we go about our day jobs, to ensure we are supporting the market in an effective and efficient way. In that regard I want to thank all of our employees for their commitment and hard work as we invest in setting ourselves up for success. In parallel, I am completing the reset of our Executive Team with the key appointments
The Corporation undertook a thorough and robust evaluation of future plans to support the market in delivering sustainable, profitable growth in the years to come.
With continuing uncertainty around the UK’s exit from the European Union, we tackled the challenges of a post-Brexit world by setting up Lloyd’s Insurance Company in Brussels, which will allow the market to continue to support customers in the continent of Europe.
We also made significant progress in our efforts to modernise the market, collaborating with managing agents, coverholders and brokers, as well as the company market. 2018 focused on adoption for electronic risk placement, and by the end of the year almost 40% of in scope contracts were placed electronically.
During 2018 the Lloyd’s market paid £19.7bn in claims, in response to a number of severe natural catastrophes that struck around the world, including Hurricanes Florence and Michael, Typhoon Jebi in Japan, as well as the Californian wildfires.
On the back of a second higher than average catastrophe claims year, Lloyd’s 2018 aggregated results have shown green shoots of improvement. The pricing environment saw strengthening by 3.2% on renewal business and the beginnings of improvement in the attritional loss ratio is evident with a reduction of 1.3% on the previous year.
Chief Executive’s Statement
06 Lloyd’s Annual Report 2018

of Burkhard Keese as Chief Financial Officer, and Dave Duclos, Non-Executive Chairman of Lloyd’s Global Networks, with further announcements on the important roles of Chief Risk Officer and Chief Operations Officer to follow. I would like to take the opportunity to thank John Parry, Shirine Khoury-Haq, and Hilary Weaver for their time and contributions to Lloyd’s.
As I reflect on the Corporation’s gender pay gap of 19.9% (mean), I am acutely conscious that there is much more work to be done to achieve the broadest opportunities that a diverse and inclusive workplace brings. I am committed to taking decisive and thoughtful action now, and in the months ahead, to ensure that lasting, meaningful change is achieved.
Since I joined the Corporation in October last year, I have focused on what the market must do to ensure we can thrive today, tomorrow and in the insurance ecosystem of the future. Over the past five months my team and I have been listening to the views and insights from our diverse range of stakeholders to better understand what we are doing well, and where we can improve.
The top line is that everyone we have spoken to sees immense value in Lloyd’s and its key role at the heart of global insurance and reinsurance for commercial, corporate and specialty business. With that support came honest feedback on where we need to focus – on performance, on people, and on the market’s long-term future and the opportunities ahead of it.
To cement our future success, and to remain the top choice for commercial and specialty insurance, Lloyd’s strategy and direction will be underpinned by a refreshed purpose of “sharing risk to create a braver world”.
This purpose speaks to the impact and aspiration of the market and is as true today as it was in Edward Lloyd’s coffee shop in 1688. Lloyd’s collective expertise and insight continues to provide unparalleled choice, giving customers confidence in an uncertain world by protecting what matters most to them – helping create a braver world.
The global insurance industry faces real challenges in supporting the changing world, and this can herald a new chapter in Lloyd’s history. Our market has huge untapped potential and with its leadership, innovation, and deep expertise, policyholders and clients can face the future with renewed optimism and confidence.
In 2019 and beyond, the market and Corporation will work together to understand, design and build our collective vision for the future and I am honoured and excited to be part of it.
John NealChief Executive Officer
Lloyd’s Annual Report 2018 07
Strategic Report Society Report Other InformationMarket Results

08 Lloyd’s Annual Report 2018

Contents10 Lloyd’s Purpose and Business 12 External Environment14 Lloyd’s Key Risks and Risk
Appetite16 Areas of Focus in 2018 Managing Market Performance Market Modernisation Lloyd’s Innovation Lab Delegated Authority Business Brexit19 Responsible Business21 Future Direction
Strategic ReportIn 2018 we made good progress on our priority areas: focusing our oversight to improve performance; implementing our Brexit solution; ramping up adoption of the London Market Target Operating Model; and embracing technology to pilot new initiatives.
For 2019 we are focused on cementing our future success to ensure Lloyd’s remains the top choice for commercial and specialty insurance. To do that we will be working to understand and design Lloyd’s collective vision for the future, underpinned by our refreshed purpose of “sharing risk to create a braver world”.
Strategic Report Society Report Other InformationMarket Results
Lloyd’s Annual Report 2018 09

Lloyd’s Purpose and Business
Lloyd’s purposeTo cement our future success, and to remain the top choice for commercial and specialty insurance, Lloyd’s strategy and direction will be underpinned by a refreshed purpose of “sharing risk to create a braver world”. The purpose speaks to the impact and aspiration of the market and is as true as it was in Edward Lloyd’s coffee shop in 1688.
How Lloyd’s delivers on its purposeLloyd’s is the world’s leading insurance and reinsurance marketplace. Through the collective intelligence and risk-sharing expertise of the market’s underwriters and brokers, Lloyd’s helps to create a braver world.
The Lloyd’s market provides the leadership and insight to anticipate and understand risk, and the knowledge to develop relevant, new and innovative forms of insurance for customers globally.
It offers the efficiencies of shared resources and services in a marketplace that covers and shares risks from more than 200 territories, in any industry, at any scale.
And it promises a trusted, enduring partnership built on the confidence that Lloyd’s protects what matters most: helping people, businesses and communities to recover in times of need.
Lloyd’s began with a few courageous entrepreneurs in a coffee shop. Three centuries later, the Lloyd’s market continues that proud tradition, sharing risk in order to protect, build resilience and inspire courage everywhere.
Lloyd’s business modelWith our trading rights and distribution network of international hubs, brokers, coverholders and service companies, the market is able to underwrite risks from around the world through Lloyd’s syndicates. Members (the capital providers) put up their capital and share in the risks and rewards of the syndicates they support. All insurance policies are underpinned by Lloyd’s central assets of over £3bn, including the Central Fund, which is designed to ensure that the market remains well capitalised even under extreme events and helps Lloyd’s to maintain its reputation for paying all valid claims.
A Lloyd’s syndicate is formed by one or more members joining together to provide capital and accept insurance risks. Most syndicates write a range of business lines across multiple areas of expertise. Each syndicate sets its own appetite for risk, develops a business plan, arranges its reinsurance protection and manages its exposures and claims.
A managing agent is a company set up to run one or more syndicates on behalf of the members. They have responsibility for employing underwriters, overseeing their underwriting and managing the infrastructure and day to day operations.
Lloyd’s is a broker market in which strong business relationships, backed by deep expertise, play a crucial part. Brokers facilitate the risk transfer process between customers and underwriters. Much of this business involves face to face negotiation, supported by electronic placement.
Business flow The market Capital flow
Customers – transferring risk
— Global commercial organisations, such as FTSE 250 and Fortune 500 companies
— Small and medium-sized enterprises
— Individuals
— Other insurance groups
Distribution channels
— 303 brokers: distributing business
— 378 service company locations
— 3,936 coverholder locations: offering local access to Lloyd’s
55 managing agents – managing syndicates
84 syndicates – writing insurance and reinsurance directly
15 special purpose arrangements set up solely to write a quota share of another syndicate
Members(the capital providers)
— Trade capital: insurance companies from around the world
— Institutional capital: such as pension funds and private equity
— Private capital (via members’ agents): such as small companies and individuals
Gross written premiums:2018 £35.5bn2017 £33.6bn2016 £29.9bn
Capital and reserves:2018 £28.2bn2017 £27.6bn2016 £28.6bn
The Corporation – supporting the market
For further information on the Lloyd’s market visit: lloyds.com/thelloydsmarket
Note: All figures are as at 31 December 2018. Capital and reserves of £28.2bn was split among members’ assets held severally of £25.0bn, mutual assets of £2.4bn and subordinated debt of £0.8bn.
10 Lloyd’s Annual Report 2018

Syndicates can also authorise third parties, known as coverholders to underwrite business on their behalf locally around the world. Service companies are wholly owned by a managing agent or a related group company and are authorised to enter into contracts of insurance for members of the associated syndicate.
Value generationLloyd’s strategy is to maintain and enhance the value it offers to its many stakeholders:
— Customers, ensuring that their needs are met;
— Distributors that bring business to the Lloyd’s market;
— Managing agents, carrying out the underwriting and paying claims; and
— Capital providers backing the risks written at Lloyd’s.
Lloyd’s generates value by creating for its stakeholders:
— Choice: Lloyd’s is the world’s largest insurance marketplace and global distribution network, competing and collaborating to share risks no matter what the size, location, industry or complexity;
— Confidence: we take pride in doing what’s right, paying all valid claims. For over three centuries the security of Lloyd’s has protected what matters most to people, businesses and communities and helped them recover in times of need;
— Partnership: the trusted relationships which underpin our marketplace are one of our greatest strengths. Our community of experts bring a collaborative culture of mutual respect to best serve our customers, enabling us to share risk;
— Expertise: with an unrivalled depth and breadth of insurance expertise, new ground is familiar territory to Lloyd’s. We bring together the best minds in the industry, and together our underwriters and brokers create innovative, responsive solutions;
— Insight: Lloyd’s has always been an intelligence network and continues to lead the industry. Our insight, experience and judgement inform decision-making, enable innovation and ensure our customers stay resilient and ahead; and
— Ecosystem: as a marketplace, Lloyd’s provides access to economies of scale through consistent standards and shared business services. Our competitive environment and capital efficiencies improve performance and unlock new opportunities.
Lloyd’s has a globally recognisable brand and is proud of its reputation for paying all valid claims in a timely and efficient manner. Lloyd’s is committed to being an inclusive global market that treats its people and customers with dignity and respect. The Corporation seeks to improve performance in the market and to help maintain Lloyd’s reputation, for the benefit of all stakeholders. The Corporation carries out this responsibility through a proportionate and robust market oversight regime consistent with an entrepreneurial and innovative culture.
Benefits to societyLloyd’s is part of the broader London insurance market, writing more than half of its total premium. The London insurance market employs over 50,000 people and represents more than a quarter of the City of London’s gross domestic product.
Lloyd’s also plays its part globally in supporting the communities in which it operates and in taking a lead on wider social and environmental issues. Lloyd’s was a founding member of the ClimateWise initiative, a collaborative endeavour by insurers to drive action on climate change.
Areas of focus in 2018Lloyd’s strategy has concentrated on meeting the most pressing challenges facing the market to ensure the long term profitability of the Lloyd’s market. These were:
— To return Lloyd’s to sustainable profitable performance through risk-based market oversight and a rigorous performance review process;
— Finishing delivery of phase 1 of the London Market Target Operating Model and encouraging adoption of services by the market that yield business process efficiencies;
— Making the new Lloyd’s Brussels subsidiary operational by the end of 2018 and to grow our business in Europe; and
— Launching pilot initiatives to make it cheaper and easier for customers to reach Lloyd’s, and developing ways to encourage innovation across the Lloyd’s market.
Future directionThe focus in 2019 is on finishing what we have started; getting the Corporation ready to deliver future changes; developing a shared market vision; and delivering a blueprint for Lloyd’s future development that will sustain the market over the longer term.
Non-financial information statementThe Corporation aims to comply with the requirements contained in sections 414CA and 414CB of the Companies Act 2006 and related guidance on the Strategic Report issued by The Financial Reporting Council Limited.
Reporting requirement Page reference to our approach
Business model 10
Key risks 14
Non-financial KPIs 16-18
Environmental and social matters
19
Anti-corruption and anti-bribery matters
19
Human rights 19
Employees 20
Lloyd’s Annual Report 2018 11
Strategic Report Society Report Other InformationMarket Results

The world economy 2018 GDP growth of 3.7% suggests that while the world continues to recover from the 2008 global financial crisis, we are still living with the consequences. Growth has still not reached pre-2008 levels and it is forecast to slow down. US GDP growth improved to 2.9% while the EU28 area showed a reduction to 1.9%.
The slow recovery has had a number of implications for the wider economy and the insurance industry in particular. As a marketplace of competing and collaborating businesses, the Lloyd’s market has different opportunities to respond collectively.
Geopolitical trendsSlower global growth can often result in trends of nationalism and protectionism. Across the globe, geopolitical tensions have been increasing. Trade tensions between the US and China may increase trade tariffs in 2019 with the danger that in an extreme scenario it could have a dampening effect on world GDP and on global insurance premiums.
Politics among western democracies is becoming more polarised on the back of the growth in populism. From the impending exit of the United Kingdom from the EU, unilateral actions taken by the US, to instability in the Middle East – the impacts of this instability are affecting people and businesses around the world.
SustainabilityAt the same time there is growing recognition that businesses must do more to promote a sustainable future. The threats posed by climate change, unclean air, water scarcity and related food insecurity are already well documented. For example, disruptions to the production and delivery of goods and services due to environmental disasters are up by 29% since 2012.
Business leaders have a responsibility to align their commercial interests with these challenges. Evidence suggests that more than two-thirds of economic losses from natural disasters remain uninsured. More needs to be done to close this protection gap and mitigate the wider damage caused by climate-related disasters.
The Corporation is proud to take a lead role in addressing wider social and environmental issues, and has signed up to the United Nations Global Compact. In so doing, the Corporation agrees to align strategy, culture and day to day operations with universal principles on human rights, labour, the environment and anti-corruption, and to take actions that advance societal goals.
Insurance industry Responses to the global financial crisis have led to a period of quantitative easing and low interest rates, with only moderate inflationary pressure so far. This pressure is expected to increase as some economies show signs of overheating. The US Federal Reserve increased interest rates on four occasions in 2018, although the prospect of further rises is uncertain.
This has led to a search for returns from the capital markets, including from insurance risk which has enjoyed historically attractive returns to capital. This in turn has driven down the price of risk transfer with what seems to be a less volatile supply of insurance capital. While this has resulted in good outcomes for customers in terms of the price and capacity of insurance coverage, it has challenged insurers’ and reinsurers’ profitability.
The relatively benign claims environment before 2017 masked some of these issues, but they have increasingly come to the fore as the incidence of major claims in the last two years has increased. Despite the increased claims, price increases have been modest, and it remains uncertain whether this trend will be sustained.
Many insurers and reinsurers have responded in a similar fashion by getting closer to the customer, making better use of data and analytics to ensure the price more closely reflects the risk and seeking operating and cost efficiencies – including through acquisition.
We have seen similar developments within the London and Specialty markets – notable transactions in 2018 included AXA’s takeover of XL Group, Marsh’s purchase of JLT, Markel’s acquisition of Nephila – the industry’s largest ILS fund manager – and Hanover Insurance Group’s sale of the Chaucer Group to China Re.
While these activities are affecting individual market participants, what sets the Lloyd’s market apart is its ability to act collectively as a marketplace. This has been most notable recently in the market’s growing adoption of the London Market Target Operating Model initiatives that will deliver efficiencies. These continue to be a focus for the market in 2019 and, through its oversight role, the Corporation has a heightened focus on expense management in the market.
External Environment
12 Lloyd’s Annual Report 2018

Technology and innovationAs the pace of technological change has increased in past decades, it has changed the way we live and the risks to which we are exposed. The development of new insurance solutions has often lagged behind the emergence of risks, even more so as the pace of change has increased. Lloyd’s was a pioneer of cyber insurance which started to appear in the late 1990s. Lloyd’s continues to foster product development to address the unique dynamic exposures, currently writing approximately a quarter of global cyber premiums. Nevertheless, most cyber risks are still uninsured – and more are emerging all the time. It will likely remain a growth area for years to come.
The Corporation carried out a thematic review of cyber security in 2018 with a report provided to the market highlighting good practice. Further guidance will be provided in 2019.
The advent of the Internet of Things has the potential to increase complexity and amplify risk, but it could also enable more innovation throughout the insurance industry, including the way claims are settled in future. It has been estimated that by 2020, some 25 billion devices will be connected to the internet.
Interconnectivity will create new business models where more is known about insureds, policies are generated in real time and are bespoke, and fraudulent claims are recognised quicker. The ability to create personalised policies will also enable insurers to more accurately predict and mitigate risks.
New types of threats will emerge, which will increase the need for insurers to develop new products and services that better serve their customers’ risk profile. The scale and variability of the type of disruption that could occur will affect multiple sectors and lines of business. Businesses are moving away from concentration in tangible assets towards intangible assets such as networks, data and client relationships and intellectual property. These assets lead to new types of exposures like earnings and cash flow losses, business interruption absent property damage, cyber and product recall risks. Successful insurers will be alive to the challenge and embrace these new risks with innovative products.
As the world changes, Lloyd’s reputation for being at the forefront of insuring progress remains firm. But we are not complacent, and we will build on our reputation to ensure that the Lloyd’s market continues to be the place to take on new risks.
Regulatory environmentThe insurance industry is operating in an increasingly complex global regulatory environment. As well as the ongoing cost of complying with regulation there remains uncertainty in some emerging areas, with significant implications for insurers.
The withdrawal of the US from the nuclear agreement with Iran in May 2018 has caused a divergence in foreign policy in relation to Iran, between the EU and the US. Insurers are now caught between directly conflicting regulations and lawful business from the EU will now be potentially exposed to US secondary sanctions.
The Insurance Distribution Directive became mandatory in October 2018. It is an EU-wide directive aimed at ensuring minimum harmonisation of insurance distribution regulation across the EU, creating a “level playing field” for insurance intermediaries and insurance distribution, regardless of the channel customers use to purchase their products. The aim is to ensure consistent prudential standards for intermediaries as well as significantly raising conduct standards, improving consumer protection and effective competition. The Corporation will continue to assess its impact and identify best practice to ensure managing agents are meeting the new requirements.
The tax environment is becoming increasingly difficult. The US has introduced an anti-abuse rule that significantly limits non-US insurance groups’ ability to efficiently consolidate and manage their group risk in a single location. The OECD, European Commission, UK and others are actively looking at the challenges of appropriately taxing the digital economy which, while not specifically aimed at the insurance industry, is a concern as the line between digital businesses and business that operates on a digital platform is not an easy one to draw.
The first review of the Solvency II framework took place and focused on the standard formula used to calculate the Solvency Capital Requirement. A second review is scheduled for 2020 and is expected to allow for more fundamental change.
The impact of European regulatory developments on the UK will be affected by any form of withdrawal from the EU. Following a UK departure from the EU, UK insurers’ and reinsurers’ continued access to the EU single market will depend on the extent to which the UK maintains regulatory alignment. The establishment of an insurance subsidiary in Brussels ensures that Lloyd’s will continue to have access to European markets.
In the UK, the Senior Managers and Certification Regime came into effect for insurers in December. This aims to strengthen the regulatory regime to ensure that there is an effective governance system with a clear allocation of responsibilities within firms and to raise standards of conduct.
Outlook The prevailing conditions give rise to risks and challenges that shape our strategy. The most critical risks are highlighted for focus through Lloyd’s risk framework. A summary of these risks is provided with an overview of the mitigating actions currently in place.
Lloyd’s Annual Report 2018 13
Strategic Report Society Report Other InformationMarket Results

Lloyd’s Key Risks and Risk Appetite
Each year the Corporation identifies the key risks which could have a significant impact on Lloyd’s business, and the mitigating actions required to reduce or eliminate the risk.
Key risk and impact on Lloyd’s Mitigation
Market performanceLloyd’s businesses suffer losses or erode their capital base due to a failure to respond to changing market conditions.
— Increased oversight of Lloyd’s poorly performing classes. — Monitoring syndicate remediation/performance improvement plans. — Close monitoring of syndicates’ performance against 2019 approved business plans to ensure
they do not materially deviate from them, or where they do, that the changes are acceptable. — Continue to closely monitor and respond to the market risk appetite measures.
Attractiveness of Lloyd’s marketLloyd’s sees its long term attractiveness suffer by failing to respond to emerging issues such as the rising cost of distribution and rapidly evolving technologies such as AI and robotics.
— Continue to review and adapt Lloyd’s strategy in response to new and evolving business model threats.
— Establishing the capabilities to ensure we can deliver valued services for our different stakeholders.
— Enhancing and building on the services provided through the London Market Target Operating Model programme to yield further business processing efficiencies.
— Increased investment in innovation and technology. — Launching pilot initiatives to make it cheaper and easier for customers to reach Lloyd’s.
BrexitA loss of passporting rights to the European Single Market could lead to a reduction in business written, or business written at Lloyd’s from the single market will be more expensive.
— Lloyd’s new European insurance company, located in Brussels, has gone live and is writing risks. This ensures customers based in the EEA are able to access the Lloyd’s market after the UK has left the EU.
— Preparations to minimise disruption from a potential no-deal Brexit are underway.
Operational resilienceFailure to deliver the desired process, technology and organisational change or maintain operational resilience could mean that operating in the Lloyd’s market is inefficient, costly and no longer attractive.
— As Lloyd’s invests in new technologies, we will assess the approach taken to ensure adequate operational resilience, its effectiveness and any gaps in the technology being implemented.
— Strong central governance to manage delivery risks associated with change programmes at Lloyd’s, including detailed project risk assessments.
— Contingency plans for the failure of key services, processes or outsource providers to ensure recovery of services or workaround processes at Lloyd’s.
Cyber riskLloyd’s suffers a loss as a result of a direct malicious electronic attack or through exposure to aggregations of risk via the policies written by its businesses.
— Refreshing the Data Management Minimum Standard and development of Cyber Security guidance for the market.
— Ongoing participation with industry bodies to maintain awareness of changing cyber risks and thought leadership reports on cyber scenarios.
— Monitoring of risks against Lloyd’s cyber risk appetite. — Market oversight framework detailing annual review activity to include exposure/
aggregation monitoring.
Significant regulatory and tax changes Lloyd’s sees its competitive position weaken, suffers regulatory penalties or disadvantageous capital position in an era of heightened geopolitical risk and uncertainty.
— Continue to lobby to influence the evolution of UK, European and global regulatory and tax frameworks to maintain the competitive position of the market.
— Monitoring Solvency II compliance at Lloyd’s. — Responding to regulatory consultations/regulatory liaison on topics such as climate change.
Financial crime Lloyd’s fails to align with current and emerging global regulation around financial crime and sanctions.
— Further development of the financial crime risk management framework to better reflect the relevant risks faced by Lloyd’s.
— Ongoing monitoring of sanctions and issuing guidance to the market. — Increased resource dedicated to financial crime risk oversight.
14 Lloyd’s Annual Report 2018

Risk appetiteAt Lloyd’s, the Board manages exposure to risk by setting and monitoring a risk appetite framework. The framework starts with Lloyd’s purpose – sharing risk to create a braver world.
To deliver on this purpose, Lloyd’s sets three risk objectives to be continuously met:
— Sustainability – Lloyd’s strategy must deliver a sustainable business model over the medium term;
— Solvency – Management of financial risks ensures that Lloyd’s is able to withstand an extreme event and trade forward; and
— Operational – The risk of operational and other events is managed to ensure Lloyd’s maintains its strong reputation.
These risk objectives reflect the Board’s view of the acceptable risk faced by Lloyd’s and provide the three pillars of the risk appetite framework. Within each pillar, a number of metrics define the amount of risk that Lloyd’s is willing to take. These metrics represent the key elements that could result in the risk objectives not being achieved for that pillar. The metrics are monitored on an ongoing basis and reported to the Board each quarter alongside any “get to green” actions if a threshold has been breached.
Lloyd’s purpose:
Lloyd’s purpose is sharing risk to create a braver world. The Corporation acts to create and maintain a competitive, innovative and secure market.
Pillar: Sustainability Strategic, Group, Insurance, Credit
Pillar: Solvency Market, Liquidity
Pillar: Operational Reputation, Legal, Regulatory, Conduct
Risk appetite statements:
Risk objective: Lloyd’s strategy must deliver a sustainable business model over the medium term
Statement: The rolling average five year combined ratio should be less than the five year target
Risk objective: Management of financial risks ensures that Lloyd’s is not exposed to undue concentration and is able to withstand an extreme event and trade forward
Statement: Losses under a 1-in-200 event should not erode the Central Fund to below the Solvency Capital Requirement
Risk objective: Risk of operational and other events is managed to ensure Lloyd’s maintains its strong reputation
Statement: Activities in the market and the Corporation should be managed to avoid significant reputational damage
Lloyd’s Annual Report 2018 15
Strategic Report Society Report Other InformationMarket Results

While strong action was taken to address unprofitable areas, no class of business was closed at Lloyd’s and capacity is still deployed in all classes previously written. Around £7bn of new business is contained within the plans approved for 2019, with many syndicates planning to grow through strong value propositions and innovative growth such as cyber and the sharing economy.
Several initiatives were introduced in 2018 to develop and improve the way the Corporation works with the market. One example is the oversight managers, who are integral to the oversight approach. Oversight managers have responsibility for ensuring the Corporation is fully conversant with the operations and ambitions of the managing agents and their stakeholders. They ensure the level of oversight applied to each managing agent is reflective of the risk posed and provide structured communications and commercially-driven outcomes for managing agents.
Market oversight remains a key priority for the Corporation in 2019, with a strong focus on active portfolio management, through an approach of continuous improvement and risk-based oversight. This means focusing more on poorly performing syndicates and less on the good performers. The Corporation will maintain the decile approach, continuously monitoring the worst performing “Decile 10”, while also analysing the best performing portfolios (Deciles 1 and 2) to identify areas of future strong growth.
The robust action taken in 2018 and strong business plans in place for 2019 provide the Corporation with confidence that the Lloyd’s market will be set up for a sustainable, profitable and successful future.
Key performance indicators
KPI OutcomeNo new Central Fund dependent members other than as a result of a significant event.
Achieved
No managing agent issues resulted in a financial or reputational loss that should have been prevented or mitigated through the market oversight framework.
Achieved
Lloyd’s Solvency II internal model “major model change” application approved by the PRA.
Achieved
Reduce the amount of Tier 2 assets that are ineligible for meeting our solvency capital requirement.
Achieved
For first party claimants on open market business, reduced average time taken between first notification of loss and settlement by 5%.
Achieved
The percentage of decisions on policyholder complaints upheld by the Financial Ombudsman Service over 2018 was at least 0.5ppts lower than the industry average.
Not achieved. Percentage impacted by complaints from two coverholder schemes that have now exited Lloyd’s. Changes implemented in 2018 should improve performance
Managing market performance Rationale and approachThe purpose of the Corporation is to create and maintain a competitive, innovative and secure marketplace, where insurance and reinsurance business can be transacted. Through this, Lloyd’s protects and promotes the interests of the market and its customers, with oversight of both prudential and conduct risks across the market. To do this effectively, the Corporation must challenge syndicates and managing agents when business and operational performance does not meet the required standards. It is important that the Corporation’s market oversight is valued by all stakeholders and is supportive of sustainable, profitable growth while safeguarding customer interests and Lloyd’s financial strength ratings.
Lloyd’s has a risk-based approach to oversight. This means that our approach to each syndicate and managing agent is appropriate, and oversight teams spend their time appropriately; with more effort focused on the most material risks. There are a number of principles that underpin the Lloyd’s approach:
— It is built on minimum standards, to which managing agents must adhere;
— It must be clear and transparent to ensure managing agents understand what the Corporation does, and the reasons behind decisions taken; and
— It must not be unduly burdensome on managing agents.
The Corporation is mindful that supervisory activities are undertaken by other parties: the managing agents themselves, their parent companies (in many cases), and by the Prudential Regulation Authority (PRA) and the Financial Conduct Authority (FCA), as well as regulators in many overseas jurisdictions. Lloyd’s aims to minimise any duplication of work undertaken by these parties.
Developments in 2018Both 2017 and 2018 were challenging years for the Lloyd’s market, and for the broader industry in general. While heavy catastrophe losses have impacted results, the market has faced a number of other, historical challenges.
Since 2012, a bounty of capital and fierce competition have helped keep prices low. In these conditions, some carriers have continued to reduce prices to retain business or have continued underwriting risks which were unlikely to deliver sustainable, profitable performance. This is not sustainable in the long term, so the Corporation had to take decisive action to help the market improve performance.
Alongside the annual business planning process, the Corporation introduced performance reviews to look at perennially unprofitable syndicates and classes of business, and asked syndicates to identify their poorest performing business, known as “Decile 10”. The reviews required syndicates to produce plans that demonstrated a realistic route to sustainable, profitable performance, and improve or withdraw from poorly performing business.
The outcome of this process saw around £3bn of the poorest performing business exited by the market. More importantly, syndicates experiencing poor performance agreed business plans that showed a clear route back to sustainable profitability.
Areas of Focus in 2018
16 Lloyd’s Annual Report 2018

Market modernisation Rationale and approachThe London Market Target Operating Model programme is designed and delivered by our market for our market. This involves working collaboratively with managing agents, brokers, company market carriers and the Corporation to deliver industry-wide infrastructure and an enhanced service proposition covering London, Lloyd’s international operations and delegated authority business.
This is critical to ensuring the continued success for the market within which participants can not only compete for business, but also compete collectively as the world’s leading (re)insurance market to provide the best services and solutions to our customers.
Developments in 20182018 has been focused on adoption. In March, Lloyd’s published new mandatory targets for the placing of contracts into the market through a recognised electronic system. For Q4 2018, the target was set at 30% of in scope contracts and the market achieved 39.17%. New targets for both quotes and placements have been set for 2019 and, in addition, Lloyd’s brokers will be required to connect to a recognised electronic placement platform by 1 June 2019. By the end of 2019 we expect the market will be placing at least 70% of its contracts electronically.
A key part of making Lloyd’s more attractive to coverholders was the delivery in September 2018 of the delegated authority submission, access and transformation service (DA SATS). DA SATS combines a single set of market-approved reporting standards with a central repository to facilitate the collection of data in line with the standards. It is supported by a centrally manned service for automated submission, collection, validation, processing and distribution of delegated authority data. All managing agents with delegated authority business have signed up to the service and over 1,250 people have been trained in the London market.
The services to co-ordinate coverholder audit and compliance checks are now 100% adopted. In addition, we have begun to make improvements to the coverholder approval process.
The Central Services Refresh Programme has developed a post bind submission channel that enables brokers to submit accounting and claims movement data in a consistent format in line with global insurance messaging standards. We are working to improve take up and onboard brokers that have expressed an interest in adoption.
The market objective to drive “straight through processing” efficiencies was furthered by the deliveries of Structured Data Capture and Common Services. The former is a simple online service that converts the content of various market documents into consistent, electronic data during the risk placement process; while Common Services is a live system that makes it easier to access, integrate and share data across the London market.
Structured Data Capture delivers enhanced functionality for carriers to send digitised documents to DA SATS and provides the solution to support Lloyd’s insurance subsidiary in Brussels.
The 2019 focus is to continue progress on adoption with emphasis on integration and business benefits.
Key performance indicators
KPI OutcomeLondon Market Target Operating Model adoption targets in Q4 2018 achieved:
— 30% of open market risks per managing agent bound through PPL;
Achieved
— 12 market firms on-boarded to the CSRP service;
Not achieved. We are working to improve take up
— 20% of binders processed through Delegated Authority Data Submission, Access and Transformation Service;
Achieved
— 97% of coverholder audits coordinated through the audit system;
Achieved
— All coverholders subject to the compliance oversight service; and
Achieved
— 15% of Market Reform Contracts and additional documents processed through the Structured Data Capture service.
Achieved
Lloyd’s innovation lab
In September 2018, Lloyd’s launched its innovation lab. Lloyd’s Lab, located in the Lloyd’s Building, is a space where new concepts, ideas and products can be developed with the support and active involvement of the market. It will focus predominantly on designing new technology-driven solutions for Lloyd’s and should also help to promote new more agile ways of working and a more innovative culture.
The first cohort of 10 teams started in Lloyd’s Lab in October and presented their outputs at demonstration day in December – a number have ongoing discussions with the market and possible next steps are being considered by Lloyd’s. A second cohort is due to start in April 2019.
Key performance indicator
KPI OutcomeThree ideas developed through the Lloyd’s Lab, one of which is suitable to be taken forward for implementation for the benefit of the Lloyd’s market.
Achieved
Lloyd’s Annual Report 2018 17
Strategic Report Society Report Other InformationMarket Results

BrexitLloyd’s starts a new chapter in Europe Although uncertainty remains around the United Kingdom’s exit from the European Union, Lloyd’s will continue to pay all valid claims regardless. We will be moving all legacy EEA business to Lloyd’s Brussels before the end of 2020, through an insurance business transfer under Part VII of the Financial Services and Markets Act 2000.
In order to guarantee our ability to accept business from customers within the European Economic Area, Lloyd’s has established a separate insurance subsidiary in Brussels. In June we obtained licence approval from the National Bank of Belgium for the Lloyd’s subsidiary and it began processing business in November.
As well as its headquarters in Brussels, the new insurer has 19 European branches and is working with over 400 coverholders and 40 Lloyd’s brokers spread across Europe.
In December, we appointed Sonja Rottiers as our new Lloyd’s Brussels Chief Executive Officer. She has over 30 years’ experience in the Belgian financial services industry. Sonja took up her position in February 2019.
Now that Lloyd’s Brussels is operational, we are looking forward to the new opportunities that we will have to grow our business with European customers through a locally employed, locally regulated and locally capitalised insurer. By using electronic placement and digital data capture, Lloyd’s Brussels offers its partners in Europe the very best that Lloyd’s has to offer in an easily accessible and cost-effective way.
Key performance indicator
KPI OutcomeLloyd’s Brussels is ready to write business from 1 January 2019.
Achieved
Delegated authority businessLloyd’s is working toward providing user friendly and integrated systems to support delegated authority business, harnessing new technologies and modernising our processes.
Lloyd’s WorkbenchLloyd’s Workbench is a digital platform that will support the full coverholder placement life cycle – including submission, policy management and cash handling – while also supporting claims recording and payments. It is being developed for coverholders placing business on behalf of Lloyd’s syndicates, and is aimed at making Lloyd’s an easier and more attractive market for delegated authority business.
Workbench is expected to be of particular benefit to new coverholders and small to medium sized existing coverholders who may not be able to source their own systems cost-effectively, or who need to replace their legacy systems.
The Workbench pilot began in September in the UK and Australia with a small number of coverholders and it is being rolled out further during 2019.
Lloyd’s BridgeIn July, Lloyd’s commenced a pilot online digital platform seeking to introduce new binding authority propositions for the market.
New business partners and existing coverholders are able to upload new business opportunities onto the platform that are then matched against “live” business appetites and expertise of participating carriers and brokers. The pilot is currently being trialled in the UK, Australia and New Zealand.
Key performance indicators
KPI OutcomeCoverholder underwriting portal (Lloyd’s Workbench) pilot completed.
Achieved
Managing general agent matching portal (Lloyd’s Bridge) pilot developed and launched with three new coverholders introduced via the portal.
Not achieved. Although only one new binding authority was completed by the year end, further opportunities are being progressed
Areas of Focus in 2018 continued
18 Lloyd’s Annual Report 2018

EnvironmentLloyd’s continues to be an active member of the ClimateWise initiative, a collaborative endeavour by insurers to drive action on climate change. The total reported greenhouse gas emissions from the Corporation’s business activities in 2018 were 9,732 tonnes of CO2e, a decrease of 11% since 2017 and our fourth consecutive year of emission reductions.
CommunityLloyd’s plays its part globally in supporting the communities in which it operates and in taking a lead on wider social and environmental issues. We want to be known as a responsible business leader, operating in a way that makes those who work for us feel proud of their contribution to what we do and how we do it.
Our responsible business approach underpins the Lloyd’s market in supporting global economic growth, and helping people, businesses and communities recover after disasters. To this end, in 2018 Lloyd’s signed up to the United Nations Global Compact, the world’s largest corporate sustainability initiative.
The Corporation not only has its own responsible business initiatives but also manages three independent charities and a community volunteer programme supported by the Lloyd’s market in London. All three charities have their own trustees made up from professionals across the Lloyd’s market and academia: Lloyd’s Charities Trust, Lloyd’s Patriotic Fund and Lloyd’s Tercentenary Research Foundation. In 2018 the Corporation donated £1.4m and supported nearly 3,000 volunteers from across the market to help people in our local communities through Lloyd’s Community Programme.
Responsible Business
Lloyd’s greenhouse gas (GHG) emissions 2018
Scope 1(tonnes CO₂e)
Scope 2 (tonnes CO₂e)
Scope 3 (tonnes CO₂e)
Lloyd’s total 2018 GHG emissions
(tonnes CO₂e)
Lloyd’s total 2017 GHG emissions
(tonnes CO₂e)*
UK 1,702 5,253 1,886 8,841 10,170
International offices 17 768 106 891 825
Lloyd’s 2018 total GHG reported emissions 9,732 10,995
Lloyd’s UK operations, which accounts for 91% of our overall electricity consumption, benefitted from a 19% reduction in the average carbon intensity of purchased electricity. This trend continues to be driven by the decarbonisation of the UK’s electricity grid. Despite increased demand for heating in 2018, consumption of natural gas and gas oil across our UK offices reduced by 2% and 26% respectively. Further emission reductions have been offset by a 24% increase in emissions associated with business travel, however travel emissions have reduced by 42% since 2016, and we continue to offset our air travel emissions by buying carbon credits for renewable energy projects. Whilst emissions from our international offices have risen by 8% since 2017, this is in the context of a 12% increase in headcount across our global offices, contributing to Lloyd’s overall 10% reduction in emissions intensity (tonnes of CO2e per employee) in 2018.
* 2017 emissions have been restated from the originally reported figure of 11,007 tonnes CO2e to account for the discovery of non-material errors within Lloyd’s 2017 emission figures associated with paper consumption and taxi hires.
A more detailed statement on Lloyd’s GHG emissions is available at: lloyds.com/ghgemissions
Anti-bribery and corruptionThe Corporation is committed to ensuring it, any associated parties, and the market it oversees has robust systems, policies and controls in place to minimise the risk of any acts of bribery and corruption. The Corporation has its own policies and procedures covering anti-bribery and corruption (including gifts, entertainment and whistleblowing policies).
Through its oversight of the market, the Corporation also lays down financial crime-related minimum standards, which it expects the market to implement accordingly.
Responsible investment strategyThe Corporation’s investment philosophy focuses on generating long term, sustainable capital growth for Central Fund assets. The approach to responsible investment is built upon three core pillars;
— Protecting the Central Fund assets by considering environmental, social and governance risks;
— Promoting responsible business practices in companies through activities such as corporate engagement and shareholder action; and
— Providing capital to support a sustainable future, through investments in green and social impact bonds and by excluding investments in coal focused companies.
Human rights and modern slaveryWe fully support the principles set out in the United Nations Universal Declaration of Human Rights and the International Labour Organisation core labour standards. We respect the dignity and rights of each individual who works for us and with us.
Lloyd’s Annual Report 2018 19
Strategic Report Society Report Other InformationMarket Results

As a global business, we recognise that respect for human rights is fundamental. We are committed to ensuring that there is no modern slavery or human trafficking taking place in our supply chains or in any part of our business. We continue to implement appropriate policies to support our commitment to act ethically and with integrity in all our business relationships.
Employee policiesThe Corporation has a number of policies, standards and practices to ensure we treat all colleagues with fairness, respect and consistency, and provide them with the necessary support to be the best they can be at work. Our Diversity and Inclusion policy is designed to ensure that all employees understand the importance of equality and diversity. A Reasonable Adjustment policy sets out the general principles and procedures for all employees to follow and discuss reasonable adjustments, so that employees with disabilities are not disadvantaged compared with people who are not disabled.
Living Wage employerAs part of our commitment to being a responsible business, Lloyd’s is part of the Living Wage campaign. Our commitment to the initiative means that all Corporation employees, including those working for our sub-contractors, are guaranteed a fair wage that accurately reflects the cost of living.
Diversity and inclusionTo embrace diversity in gender, gender identity, race, sexual orientation, age, ability or disability, background and religion, the Corporation and the market work in partnership through Inclusion@Lloyd’s, which is comprised of a group of senior executives representing the companies and membership organisations within Lloyd’s and the wider insurance market. A significant and growing number of market firms have signed up to Inclusion@Lloyd’s Diversity and Inclusion Charter, and there is a range of resources to help everyone involved achieve its aims.
2018 was our fourth year of sponsoring the Dive In Festival for diversity and inclusion in insurance. Spread across three days, events took place in 27 countries and more than 50 cities. This year’s theme was #time4inclusion, in response to last year’s finding that CEOs see time as the biggest barrier to achieving inclusive cultures in their organisations.
Stonewall equality indexEach year organisations take part in the Stonewall Workplace Equality Index, looking to assess their achievements and progress on LGBT inclusion in the workplace. For the first time, the Corporation has been placed in the Top 100 of the Index. We were ranked 95th compared with 199th in 2017. This result highlights our work and strategy in the diversity and inclusion space for our employees.
Gender pay gapThe Corporation reported a gender pay gap of 19.9% (mean) in its 2018 Gender Pay Gap Report, a reduction from the 2017 figure of 27.7%. This gap represents the difference between the average pay for a man in the Corporation, compared with the average pay for a woman. The gender pay gap is different to equal pay which is men and women being paid the same for the same work or work of equal value. The Corporation does not believe it has an equal pay issue. However, we review this on an annual basis as part of our compensation review process.
Like many financial services firms, we employ fairly equal numbers of men and women at the entry levels, but this representation does not extend to senior levels. To help redress the balance, we launched a new pilot programme, Lloyd’s Advance, aimed at developing future female leaders within the Corporation and the Lloyd’s market.
2018 Corporation employee segmentation figures
UK 819
Non-UK 225
Executive Team
Head of Function Manager
Professional/ Technician Administrative Total
Female 3 14 153 170 216 556
Male 4 37 198 160 89 488
Total 7 51 351 330 305 1,044
Responsible Business continued
20 Lloyd’s Annual Report 2018

The futureToday, Lloyd’s approaches a critical juncture that requires both a bold vision and the collective will of the marketplace to ensure it continues to thrive for years to come. Over three centuries of change Lloyd’s has evolved as a market to develop new ways of sharing risk to better protect its customers and we need to do so again.
While Lloyd’s remains the world’s insurance and reinsurance market for commercial and specialty risk, to grow profitably in the future we must become the world’s most technologically advanced marketplace that delivers outstanding value and products for our customers. Enhancing the value Lloyd’s provides to its customers must be the compass that guides our future development.
A blueprint for changeTo start this process, and to seize the enormous opportunity before us, we have renewed Lloyd’s purpose: to create a braver world by sharing the risks of people, businesses and communities, and by helping them recover in times of need.
We are also articulating what makes the Lloyd’s market unique and valued by each of our stakeholders. To do this we are asking the opinion of a wide cross section of stakeholders globally, including brokers, carriers, capital providers, coverholders, managing agents and, importantly, our customers.
Their feedback is informing our work to develop a strategy for building the Lloyd’s of the future. We are publishing a full prospectus in May 2019 which outlines the vision of what this might look like and what steps we might need to take to get there. All stakeholders will be invited for their feedback, and this will be used to create a blueprint for change that will deliver Lloyd’s vision.
In parallel Lloyd’s, through the London Market Target Operating Model, is continuing to invest in the market to ensure it has the platforms in place to support future change. It is also making sure the Corporation has the right capabilities to support the market in delivering its value proposition.
The work we are carrying out this year and beyond is essential for securing Lloyd’s future – and that of our customers.
Future Direction
Lloyd’s Annual Report 2018 21
Strategic Report Society Report Other InformationMarket Results

22 Lloyd’s Annual Report 2018

f
Market ResultsChallenging underwriting and investment market conditions and significant losses from natural catastrophes have impacted the Lloyd’s market result. It is in these moments that Lloyd’s proves its value and strength, being able to more than meet its substantial commitments without any significant impact on its total resources.
Lloyd’s has lived up to its centuries old promise and purpose – to be there when it matters most, providing the financial support to enable businesses, governments and most importantly people, to recover and rebuild their lives as quickly as possible.
Contents24 2018 Highlights 36 Statement of Council’s
Responsibilities 37 Report of
PricewaterhouseCoopers LLP to the Council on the 2018 Pro Forma Financial Statements
38 Pro Forma Profit and Loss Account
39 Pro Forma Statement of Comprehensive Income
40 Pro Forma Balance Sheet 41 Pro Forma Statement of
Cash Flows 42 Notes to the Pro Forma
Financial Statements67 Managing Agents and Syndicates
Market Results Society ReportStrategic Report Other Information
Lloyd’s Annual Report 2018 23

2018 Highlights
Gross written premium (£m)2014 25,259
2015 26,690
2016 29,862
2017 33,591
2018 35,527
Capital, reserves and subordinated debt and securities (£m)
2014 23,413
2015 25,098
2016 28,597
2017 27,560
2018 28,222
Return on capital* (%)2014 14.1
2015 9.1
2016 8.1
2017 (7.3)
2018 (3.7)
Result before tax (£m)2014 3,016
2015 2,122
2016 2,107
2017 (2,001)
2018 (1,001)
Central assets (£m)
2014 2,578
2015 2,645
2016 2,879
2017 2,981
2018 3,211
Combined ratio* (%)
2014 88.4
2015 90.0
2016 97.9
2017 114.0
2018 104.5
Financial highlights
— Lloyd’s reported a loss of £1,001m (2017: a loss of £2,001m)
— Combined ratio of 104.5% (2017: 114.0%)
— Gross written premium of £35,527m (2017: £33,591m)
— Capital, reserves and subordinated loan notes stand at £28,222m (2017: £27,560m)
The Pro Forma Financial Statements (PFFS) are prepared so that the financial results of Lloyd’s and its members taken together and their net assets can be compared as closely as possible with general insurance companies. The PFFS include the aggregate of syndicate annual accounts (Aggregate Accounts), members’ funds at Lloyd’s (FAL) and the Society of Lloyd’s financial statements. Further information concerning the basis of preparation of the PFFS is set out on pages 42-43.
* The return on capital and the combined ratio are metrics that are consistently used to analyse financial performance in the Lloyd’s market results and/or in the Society Report. These metrics (wherever used in this Annual Report) are Alternative Performance Measures (APMs), with further information available on page 184.
24 Lloyd’s Annual Report 2018

2017 result
Underwriting results
Accident year – attritional result
Accident year –major claims
Prior year releases
Investment return
Foreign exchange
Other expenses
2018: Split of underwriting result and other result
2017: Split of underwriting result and other result
Other – investment return, foreign exchange and the other net expenses
-3,000
-2,000
-1,000
1,000
2,000
3,000
0
-4,000
2018 result
The Lloyd’s market reported a pre-tax loss of £1,001m in 2018 (2017: a loss of £2,001m) and a combined ratio of 104.5% (2017: 114.0%). This result is driven by the losses arising from a number of catastrophic events which impacted the insurance industry in the second half of 2018, notably Hurricanes Florence and Michael and the wildfires in California. 2018 was the second successive year of significant catastrophic losses for the insurance industry and so too for the Lloyd’s market. Insured losses arising from catastrophic events cost the Lloyd’s market £2.9bn, net of reinsurance, in 2018 (2017: £4.6bn) and added 11.6% to the combined ratio (2017: 18.5%). The impact of these major events on the Lloyd’s market result was offset to some extent by prior year releases of £976m (2017: £706m), representing a 3.9% (2017: 2.9%) improvement to the combined ratio.
During 2018 stable or increased pricing levels became more widespread as the year progressed after many years of decline; favourable price movements were seen across all lines of business and more notably in those which had the greatest exposures to the major catastrophic events in 2017. The Lloyd’s market experienced a weighted average increase in prices on renewal business slightly over 3% in 2018. In addition, several syndicates exited or severely curbed their risk appetites in poor-performing lines, as Lloyd’s began to ramp up its activity to support the market in closing the performance gap.
There has been a small reduction in the operating expense ratio in 2018 reflecting the initial effects of actions being taken by Lloyd’s and the market to reduce the cost of doing business; the operating expense ratio is 39.2%, down from 39.5% in 2017. Reducing the Lloyd’s market expenses will continue to be an area of focus in 2019.
Investment return was £504m (2017: £1,800m), a return of 0.7% (2017: 2.7%), reflecting the challenging year in the financial markets, with most risk assets generating negative returns as equity markets in particular suffered in the fourth quarter.
Foreign exchange had a negligible impact on the result with a small loss reported in 2018. This reflected the impact of most major currencies strengthening against sterling in 2018. The increase in other expenses is primarily driven by the costs associated with establishing the Lloyd’s Brussels subsidiary.
The Pro Forma Financial Statements (PFFS) aggregates the results of the syndicate annual accounts, notional investment return on members’ funds at Lloyd’s and the Society’s financial statements. The basis of preparation of the PFFS is set out in note 2 on pages 42 to 43.
Looking aheadThe 2019 planning cycle was the most challenging, so far, for the Lloyd’s market with the significant level of effort placed on remediation activities against poor-performing lines of business and syndicates as part of the drive to close the performance gap. There are already some encouraging signs in 2019 that the remedial action being taken is gaining traction; there is a greater level of focus on underwriting controls, the correct pricing of attritional, large and catastrophe exposures and acquisition and administrative expenses.
While industry capital remains stable at an all-time high, with plenty more still potentially available, this is likely to continue acting as a constraint to the scale of improvement that is necessary. Notwithstanding another costly year in terms of natural catastrophes (with latest industry insured loss estimates as high as US$79bn), market conditions look set to remain broadly stable. Increased prices are likely to be confined to specific risks and regions impacted by losses from these events.
Drivers of market result – change from 2017 to 2018 (£m)
2017: £2,001m loss – a £3,421m underwriting loss offset by £1,420m non-technical profit
2018: £1,001m loss – a £1,130m underwriting loss offset by £129m non-technical profit
(2,001)
388
(3,421)
1,4201,633
270
(49)
54(1,130)
129(1,001)
(1,296)
Lloyd’s Annual Report 2018 25
Market Results Society ReportStrategic Report Other Information

2018 Highlights continued
The macroeconomic environment remains challenging with the parlous state of world politics and fragile global economic climate requiring careful monitoring and a nimble, and pro-active, underwriting response. Aside from the conundrum posed by Brexit, increasing global protectionism and continued violent extremism remain key topics to watch.
2018 performanceGross written premium for the year increased to £35,527m compared with £33,591m in 2017. US dollar denominated business continues to account for the largest share of business at Lloyd’s. The average exchange rate in 2018 was US$1.34: £1 compared with US$1.29: £1 in 2017. The US dollar and other currency movements have decreased premiums as reported in converted sterling by 4%. Adjusting for the impact of exchange rate movements, the increase in gross written premium was 10%.
The overall price change (taking into account terms and conditions) on renewal business was an increase of approximately 3%, which was slightly above planning assumptions for the year. This increase was largely driven by catastrophe impacted lines. During the year, there continued to be growth in most lines, although the rate of growth slowed throughout the year. The main exception was aviation where further contraction was evident.
The underlying accident year ratio, excluding major claims, was 96.8% (2017: 98.4%) which reflects the small improvement in risk adjusted pricing since 2017. However, underlying claims inflation, deductible erosion, current pricing and terms and conditions continue to contribute to high attritional loss levels, albeit the attritional ratio has improved by 1.3% in 2018.
Major claimsMajor claims for the market were £2,906m in 2018 (2017: £4,539m), net of reinsurance and including reinstatements payable and receivable. Total industry insured losses for the catastrophe events of 2018 are estimated to be US$79bn.
After a long period of relatively benign major loss activity pre-2017, the cost of major claims to the Lloyd’s market in 2018 is the fourth highest since 2003, in today’s terms. This continued period of high losses follows on from 2017, which was the third highest year for losses over that period.
The largest insured natural catastrophe event was Hurricane Michael. This event, which devastated large parts of Florida, was the second of two large hurricanes to hit the US in the second half of 2018. The other large hurricane was Hurricane Florence, which caused significant wind and flood damage in North and South Carolina.
The market once again incurred significant claims from wildfires in California in November. Other notable events included a volcanic eruption in Hawaii in May, Typhoons Jebi and Mangkhut striking Asia in August and September, and losses resulting from a fire at the Lürssen shipyard in Germany in September.
1. Weighted by net earned premium.
Major claims
% of net earned
premiumAccident year ratio excl. major claims %
2014 3.4 2014 93.1
2015 3.5 2015 94.4
2016 9.1 2016 93.9
2017 18.5 2017 98.4
2018 11.6 2018 96.8
Five year average1 8.2 Five year average1 95.5
Ten year average1 10.2 Ten year average1 92.4
Contributors to combined ratio2018 Combined ratio %
96.8% (3.9%)11.6%
11.9%104.5%
27.3%
57.6%
AY excl.Major claims
Majorclaims
Prior yearmovements
Calendaryear
Attritional loss ratio Acquisition expense ratio Admin expense ratio
2017 Combined ratio %
98.4% (2.9%)18.5%
12.5%
114.0%
27.0%
58.9%
AY excl.Major claims
Majorclaims
Prior yearmovements
Calendaryear
Attritional loss ratio Acquisition expense ratio Admin expense ratio
26 Lloyd’s Annual Report 2018

Prior year movementThe combined ratio has been improved by 3.9% (2017: 2.9%) through prior year releases. The release represents 2.5% (2017: 1.9%) of net claims reserves brought forward at 1 January.
This was the 14th successive year of prior year releases. In each of these years, the level of release has been significantly influenced by actual experience. In 2018, aggregate attritional claims emergence was broadly in line with projected levels at a strict best estimate with releases from initial prudent claims estimates. The level of release is influenced by both claims experience and the reserving approach of the market.
With regard to the reserving approach, a number of managing agents adopt prudent initial held reserves. In the absence of poor claims experience these would be expected to result in future releases.
Estimates for major catastrophe events from recent years have also proved to be adequate, with only small movements in estimates seen during 2018.
In 2019, Lloyd’s will continue to monitor reserves closely and act to ensure that adequate market discipline is being maintained in current challenging market conditions, particularly on the longer-tailed lines, such as casualty where there has been continued focus in recent years.
The actual level of claims payments ultimately made compared with the provisions held is an area of inherent uncertainty. Oversight of this area is a key focus for Lloyd’s to ensure that the processes underlying these estimates are robust, provisions are adequate, and any release of provision is appropriate.
Reinsurance protectionThe credit quality of the Lloyd’s market’s reinsurance protections remains extremely high, with 98% of all recoveries and reinsurance premium ceded being with reinsurers rated “A-” and above or supported by high quality collateral assets.
Reinsurers’ share of claims outstanding remains a material consideration for Lloyd’s (equivalent to 55% of gross written premium/78% of members’ assets). There has been an increase in the overall reinsurance recoverables due to the catastrophe losses experienced in the second half of 2018. This increase reflects the reinsurance risk transfer strategy of the Lloyd’s market and the nature of loss events experienced during 2017 and 2018. No negative settlement trends have been witnessed to date. Lloyd’s will be monitoring this closely in 2019 as part of our normal market oversight procedures.
Lloyd’s outward reinsurance premium spend for 2018 was 28% (2017: 26%) of gross written premium, which reflects a small increase in the scale of reinsurance purchased. This level of reinsurance transfer remains within risk appetite.
Lloyd’s major losses: net ultimate claims (£m)
1,772
4,6
64 64
60
7
2,0
48
406
2,50
5
5,14
4
1,98
6
941 71
1
767
2,14
7
4,6
50
2,9
06
200
4
200
5
200
6
200
7
200
8
200
9
2010
2011
2012
2013
2014
2015
2016
2017
2018
Five year average: £1,843m; 15 year average: £1,907m. Indexed for inflation to 2018. Claims in foreign currency translated at the exchange rates prevailing at the date of loss.
Prior year reserve movement
% of net earned
premiumYears of account in run-off
Number ofyears
2014 (8.1) 2014 4
2015 (7.9) 2015 4
2016 (5.1) 2016 6
2017 (2.9) 2017 5
2018 (3.9) 2018 0
Result for the closed year and run-off years of accountUnder Lloyd’s three-year accounting policy for final distribution of each underwriting year of account, the 2016 account reached closure at 31 December 2018. 2016 witnessed some above average risk losses, notably in the property sector. Hurricane Matthew was the first category five hurricane since 2007 and impacted the Caribbean and the US. The Fort McMurray wildfire also devastated parts of Alberta, Canada. As a result, the 2016 pure year of account reported an underwriting loss. The 2016 pure year loss was offset partially by the addition of releases from prior years totalling £896m on the 2015 and prior reinsurance to close (RITC) (2014 and prior: £919m), which meant the year closed with an overall loss of £855m (2015 pure year profit: £1,620m).
Five years of account were in run-off at the beginning of 2018. All of these run-off years have now closed at the end of 2018, which represents a first for Lloyd’s in recent years to have no open run-off years in existence.
In aggregate, run-off years reported a surplus of £7m including investment return (2017: surplus of £8m).
The results of the major lines of business are discussed in detail on pages 28-35.
Lloyd’s Annual Report 2018 27
Market Results Society ReportStrategic Report Other Information

Investment reviewEquity and other risk assets endured a difficult year after a strong investment return in 2017. In 2018, financial markets suffered a volatile risk-off move in the last quarter of the year brought on by trade disputes, fears of a global slowdown, geopolitical risks and less accommodative financial conditions.
Developed market monetary policy continued to be tightened with central banks in the US, Canada and UK raising interest rates. However, core government bonds outperformed over the risk-off move in the fourth quarter. Credit spreads on corporate bond investments widened in line with the general risk-off sentiment.
The market’s investments generated a return of £504m (2017: £1,800m), or 0.7% (2017: 2.7%), a significant reduction on the previous year and also well below the five-year average. In terms of key drivers, an allocation, albeit conservative, to equity and risk assets generated losses for the year, but this was offset by positive returns in cash, government and investment grade corporate bonds.
Syndicate premium trust fund assets form the largest element of investment assets at Lloyd’s. Managing agents have responsibility for the investment of these assets, which are used to meet insurance claims as they become payable. The aggregate asset disposition reflects the balanced but conservative investment policy pursued by agents. Cash and high quality, shorter duration, fixed interest investments constitute a majority core share while return seeking equity and growth assets account for a moderate allocation at less than 10%.
Overall, syndicate investments returned £333m, or 0.8% in 2018 (2017: £907m, 2.2%). Investment return was materially lower this year driven by disappointing corporate bond returns as well as negative performance in equity and growth assets. Investments are valued at mark to market prices and unrealised gains and losses are included within reported investment returns.
Members’ capital is generally held centrally at Lloyd’s. A proportion of this capital is maintained in investment assets and managed at members’ discretion. A notional investment return on members’ capital of £178m, or 0.7% (2017: £722m, 3.1%) has been included in the Pro Forma Financial Statements (PFFS). This is based on the investment disposition of the relevant assets and market index returns. Return on this pool of assets was low by comparison with previous years with its allocation to equity and growth assets driving investment losses.
The investment return on Lloyd’s central assets is also included in the PFFS. This was a loss of £7m or -0.2% in 2018 (2017: gain of £171m, 5.0%). The investment performance of central assets is discussed on pages 109-110.
Line of business: Reinsurance – PropertyProperty catastrophe excess of loss represents the largest sector in this line. Other key sectors are property facultative, property risk excess, property pro rata and agriculture and hail.
2018 performanceLloyd’s gross written premium for 2018 was £6,440m (2017: £5,991m), an increase of 7.5%. Growth was driven by improved pricing adequacy on property treaty and facultative contracts, albeit moderated by whether they were significantly loss impacted or not from 2017 events. The Lloyd’s reinsurance property line reported an accident year ratio of 121.1% (2017: 134.3%).
2018 was another year in which globally, natural disasters at times dominated the headlines. Many of these events resulted in meaningful losses to the insurance market and while in aggregate not to the same scale of 2017, they remain above the long-term averages.
Prior year movementThe prior year movement was a release of 4.9% (2017: 4.0%). This line of business has seen releases across several prior years during 2018. In particular, there has been a large release on the 2016 year of account driven by reductions on the US property catastrophe losses compared to the estimates at the end of 2017, mainly due to the 2016 and 2017 US windstorm events. Movements are expected for historical catastrophe events, as there is greater certainty as claims are paid out.
Looking aheadDespite a second year globally of above average natural catastrophe losses in 2018, there remains a surplus of capacity in the market. Anecdotal evidence suggests that pricing levels at January 2019 were generally below those expected by the market, but again this was dependent on region and whether or not the business was loss affected. Pricing adequacy may improve as 2019 progresses, with more loss impacted business renewing.
2018 Highlights continued
28 Lloyd’s Annual Report 2018

Reinsurance – CasualtyThe largest sectors of the casualty treaty market at Lloyd’s are non-marine liability excess of loss and US workers’ compensation.
2018 performanceLloyd’s gross written premium for 2018 was £2,541m (2017: £2,223m), an increase of 14.3%. The Lloyd’s reinsurance casualty line reported an accident year ratio of 99.7% (2017: 103.9%).
While the wider casualty treaty market has remained competitive, with an abundance of capacity, the underlying motor portfolios have seen sizeable rate strengthening in response to the change in Ogden discount rate in February 2017. As most treaty business renews at the start of the calendar year, syndicates were not able to react until 2018 renewals. In addition, prior to the Motor Insurers’ Bureau announcing changes to how terrorism would be dealt with within motor policies, there has been considerable uncertainty within the UK motor treaty market with participants cutting back and restructuring of attachments and limits.
Prior year movementThe prior year movement was a release of 3.6% (2017: 1.8%). 2018 has been a year of relatively benign prior year claims experience for this line, leading to an overall reserve release. There has been overall deterioration seen for US casualty treaty business, however overall experience for the class has been favourable. Lloyd’s continues to monitor these lines, as per the casualty class of business, to ensure adequate provisions remain over all prior years.
Looking aheadFollowing the increasing severity of claim awards in the US, Canada and Australia in particular, there are signs that the market is starting to tighten capacity and there is likely to be further rate strengthening across all lines. Currently, these increases are unlikely to be sufficient to keep up with claims inflation, but it appears that greater scrutiny is being undertaken during renewal negotiations.
2018 combined ratio by line of business
Accidentyear
Prior yearreserve
movementCalendar
year
Reinsurance 111.8% (5.8%) 106.0%
Property 114.0% (3.6%) 110.4%
Casualty 103.9% (1.0%) 102.9%
Marine 115.6% 0.4% 116.0%
Energy 105.6% (18.2%) 87.4%
Motor 101.8% (3.1%) 98.7%
Aviation 119.8% (7.8%) 112.0%
Life 98.6% (20.8%) 77.8%
Reinsurance – SpecialtyMarine reinsurance is the largest sector of the Lloyd’s specialty reinsurance business, followed by energy and aviation.
2018 performanceGross written premium overall was £2,089m (2017: £2,346m), a reduction of 11.0%. Gross written premium by sector within this specialty business was: Marine £1,090m (2017: £1,166m), Energy £624m (2017: £749m), Aviation £361m (2017: £415m) and Life £14m (2017: £16m). The Lloyd’s reinsurance specialty line reported an accident year ratio of 101.9% (2017: 110.3%).
Marine excess of loss reinsurers were enjoying a relatively benign year with Hurricane Michael and Typhoon Jebi being less impactful than may have been expected. This changed following the Lürssen shipyard loss, which had substantial reinsurance coverage, having significant impact on the line.
While the year started off with positive pricing movements, this tailed off somewhat towards the end of the year, reflective of the high level of capacity available in the market.
Prior year movementThe prior year movement was a release of 11.0% (2017: 8.5%). The claims experience for this line has been favourable compared to expectations over the 2018 year. This line is predominantly marine, aviation and motor business, written on an excess of loss basis. Given that claims experience is largely driven by isolated claim events, prudent reserves tend to be held and released in years with less claims activity. In addition to the general release of prudence over time, the marine line is also impacted by the 2016 and 2017 US windstorm events, which have seen a reduction in the anticipated losses when compared to the estimates set at the end of 2017.
Looking aheadThere is some anecdotal evidence of price strengthening in the sector in 2019 following the effects of late 2018, which further compounded the hurricane-affected 2017 result. There may also be additional impetus following Lloyd’s performance improvement planning – the effects of which may be felt beyond the classes immediately included in that review.
PropertyThe property line consists of a broad range of risks written worldwide. It is made up of predominantly excess and surplus lines business with a weighting in favour of the industrial and commercial sectors, binding authority business comprising mainly non-standard commercial and residential risks and specialist sectors, including terrorism, power (electricity) generation, engineering and nuclear risks.
Business is written through the broker network with a significant proportion using the framework of coverholders (or managing general agencies) and other similar delegated authority arrangements.
Lloyd’s Annual Report 2018 29
Market Results Society ReportStrategic Report Other Information

2018 performanceLloyd’s gross written premium for 2018 was £9,687m (2017: £8,965m), an increase of 8.1%. The Lloyd’s property line reported an accident year ratio of 114.0% (2017: 131.5%).
Despite significant 2017 losses and further losses in 2018, there has remained an abundance of global capacity available. This has continued to constrain the extent of increases to pricing levels needed to reflect the inherent underlying levels of risk being underwritten. Overall pricing has increased, although there are wide variations across the book.
2018 income growth was again primarily driven by US binding authority business and to a lesser extent US and non-US open market business. Non-US binding authority business showed a slight contraction as did engineering, reflecting reduced appetite in the lines by some syndicates due to deteriorating loss experience. Terrorism also continued to see downward pricing pressure.
Prior year movementThe prior year movement was a release of 3.6% (2017: 3.9%). Recent years of account have seen elevated levels of catastrophe losses, particularly losses arising within the US windstorm season. These losses mainly impacted the direct and facultative property insurance lines on the 2016 and 2017 years of account. At the end of 2017 a number of these losses had only just occurred, making it more difficult to determine the level of reserves required. The 2018 calendar year has seen a release of prior year reserves for these 2017 windstorm losses and other prior year major losses.
Looking ahead2018 saw considerable change within the market place against a backdrop of challenging conditions. This has been driven in part by another year of above average natural catastrophe losses and excess global capacity. Significant remedial action is being taken and the successful execution and delivery of plans will be critical for 2019. Difficult decisions regarding existing accounts, or indeed the appropriateness of new accounts, will continue to have to be made during 2019.
CasualtyThe casualty market at Lloyd’s comprises a broad range of sectors. The most significant are general liability and professional liability. Although shorter-tail in nature than most casualty lines, accident and health business is also included within this sector. The US market is the largest single market for Lloyd’s casualty followed by the UK, Canada and Australia.
2018 performanceLloyd’s gross written premium for 2018 was £9,094m (2017: £8,464m), an increase of 7.4%. This increase was largely driven by further growth in cyber, warranty and indemnity business, and US general liability business. The Lloyd’s casualty line reported an accident year ratio of 103.9% (2017: 103.7%).
The wider casualty market in 2018 remained replete with capacity. This suppressed price increases, often keeping them below widely agreed-upon claims inflation assumptions.
The growth in cyber insurance products is a continuing trend, illustrating how the market is responding to rapidly evolving exposures, with many customers being first-time buyers. This growth is expected to continue. There was some organic premium growth in other traditional lines driven by insureds experiencing higher turnover, wage rolls and fee income, reflecting a slowly improving economic environment. In other lines, some market participants have recently cut back or exited, causing some price strengthening and the overall growth in casualty business to slow. Niche and heavy industry areas, in particular, have seen greater focus on underwriting, not just in terms of pricing but also in relation to reviews of programme structure and policy terms.
Prior year movementThe prior year movement was a release of 1.0% (2017: 0.6%).
Casualty lines have been subject to increased market oversight throughout 2018 given their uncertain, long-term nature. As a result of this additional oversight, a number of casualty classes have seen increases in their reserves in 2018. Given the fairly stable experience for this line of business in 2018, this strengthening of reserves has acted to reduce the reserve releases across the market compared to previous years. The continued release of reserves on prior years of account is, however, still in line with our expectations. Reserve releases would generally still be expected for this line given the tendency for some managing agents to hold high initial reserves for a number of years, where claims are expected to emerge over a long period of time. This longer emergence period leads to greater uncertainty for these lines when compared to property lines, which have shorter periods of exposure.
Going forward into 2019, the Corporation will continue to monitor the adequacy of market-wide casualty reserves, ensuring that we engage with managing agents writing material casualty business. This increased level of oversight is warranted given the current tough market conditions and the fact that it will take many years to confirm whether any adjustments to these reserves are sufficient.
Looking aheadThe casualty market’s performance is highly correlated with both economic and legal conditions. Despite the global economic climate having improved since the late 2000s there remain certain sectors, particularly within financial and professional lines, that are more exposed to the prevailing fragile economic environment, with the potential to cause volatility in results.
While the legal and regulatory environment varies across territories and jurisdictions, there is a general trend of increasing regulation and litigiousness in many regions of the world and in some territories fuelled by third party litigation funding, which may lead to an increase in the frequency and severity of claims. Additionally, increases in inflation will put more pressure on attritional loss ratios for open claims as well as future years of account.
2018 Highlights continued
30 Lloyd’s Annual Report 2018

The global cyber insurance market continues to expand, with high profile breaches and evolving legislation driving increased product demand. A significant proportion of the business written is US-domiciled, however growth in other territories has been witnessed, particularly in Europe where the introduction of the General Data Protection Regulations in May 2018 encouraged new buyers to the market. Lloyd’s writes approximately a quarter of the global market share and pioneered many of the original products in this line and remains at the leading edge of product development by providing innovative, bespoke and risk transfer solutions in both standalone products or with coverage embedded or blended with traditional product lines. Risk aggregation and monitoring tools, introduced to understand and manage the exposures to cyber risk across the Lloyd’s market, remain under scrutiny and will continue to be enhanced further in 2019.
Generally, the market in all casualty lines remains historically competitive, with many participants having grown in recent years, often through delegated underwriting arrangements. However, there now appears to be some signs of stabilisation and additionally certain casualty lines of business, typically ones which have experienced deterioration in recent back years, have begun to come under some increased pressure on terms, conditions and pricing in an attempt to return them to profitability.
MarineA diverse mix of marine business is placed at Lloyd’s who are regarded as industry leaders in the line. Principal lines of business include cargo, hull, marine liability, specie and fine art.
2018 performanceLloyd’s gross written premium for 2018 was £2,603m (2017: £2,506m), an increase of 3.9%. The Lloyd’s marine line reported an accident year ratio of 115.6% (2017: 121.8%).
While a competitive environment persisted across the marine lines, reflective of available capacity, the pricing environment was generally positive reversing the trend of prior years. This was particularly apparent across the three main lines of cargo, hull and yacht in the final quarter of the year.
Political and credit risks, which continue to perform well, experienced some growth. Overall performance, however, remained marginal as a series of large losses affected the cargo and hull classes, most notably the major Lürssen shipyard loss in September.
Prior year movementThe prior year movement was a strengthening of 0.4% (2017: 0.6%).
The marine line has performed broadly in line with expectations across a number of years of account during 2018. There has been some favourable movement in large isolated events, such as the Tianjin port explosion that impacted the 2015 year of account. Despite this favourable experience, there is a tendency on this line for the view of claims to be held for a number of years to allow for any uncertainty. In addition, there have been late notifications of claims and some syndicates have reviewed their methodology to derive the reserves, which in aggregate has led to an overall slight strengthening of prior year reserves in 2018.
Looking aheadIt was hoped that the effects of the hurricane-led losses in 2017 would act as a catalyst for price improvement in 2018 but the early positive movement seen in the final quarter of 2017 lost momentum in the first half of 2018.
Following a difficult 2019 planning season for marine business, which resulted in restriction in capacity for some of the major lines, conditions may now exist for further market stabilisation as syndicates continue to seek a return to profit.
EnergyThe Lloyd’s energy line includes a variety of onshore and offshore property and liability sectors, ranging from construction to exploration, production, refining and distribution.
2018 performanceGross written premium for the Lloyd’s energy line in 2018 was £1,404m (2017: £1,253m), an increase of 12.1%. The Lloyd’s energy line reported an accident year ratio of 105.6% (2017: 107.7%).
The positive pricing environment across all sub-lines contributed to the overall growth in premium. Pricing increases were particularly evident in the offshore and onshore property lines, materially reversing the prior year trend.
The accident year performance in energy was impacted by several substantial current year onshore property losses, balanced somewhat by benign loss activity for offshore property.
Prior year movementThe prior year movement was a release of 18.2% (2017: 21.1%). The energy line of business has seen continued prior year reserve releases over 2018. This line contains a mix of contracts that give rise to claims that are settled on both a short-term and long-term time horizon. Of the short-term contracts, energy offshore property has performed most favourably against expectations. Likewise, the offshore liability line has performed well over 2018, with prior year releases being made across a number of older years of account. Given that the energy line is exposed to isolated large losses, a reduction in the view of claims for these large losses also drives reserve releases.
Looking aheadIn previous years, a downswing in the oil price heralded a negative pricing environment for offshore property and it will be interesting to see whether the current discipline in the line is maintained by the upstream market, should the current oil price trend continue for any length of time.
For onshore property, there is anecdotal evidence to suggest market resolve exists to improve terms and conditions in light of another year of substantial loss activity.
Lloyd’s Annual Report 2018 31
Market Results Society ReportStrategic Report Other Information

MotorLloyd’s motor market primarily covers UK private car, commercial and fleet business. Private car represents around 35% of Lloyd’s UK motor premium and includes niche motor risks. Lloyd’s commercial and fleet business is very diverse, ranging from light commercial vehicles and taxis to buses and heavy haulage.
International motor is also written; a large proportion emanates from North America, including private auto and static risks such as dealers open lot.
2018 performanceGross written premium in 2018 was £1,037m (2017: £1,057m), a decrease of 1.9%. The Lloyd’s motor line reported an accident year ratio of 101.8% (2017: 114.4%).
Underwriting conditions in the UK motor market continue to be challenging. However, the market saw far more robust price strengthening during 2018 following the Ogden discount rate change in February 2017.
International motor continues to perform poorly. While the beginning of the year saw very little in terms of rate strengthening, it appears that there have been some positive signs towards the end of the year and going into 2019 as some market participants reviewed their appetite and capacity in this line.
Prior year movementThe prior year movement was a release of 3.1% of net earned premium (2017: strengthening of 7.9%). This is driven by favourable claims experience for both UK and overseas motor.
Looking aheadAt the end of 2018, the Civil Liability Bill received royal assent. While this Bill specifically deals with the Ogden discount rate, the proposed amendment to the current rate will not be known until the middle of 2019. This Bill also introduces reforms which are aimed at reducing fraudulent whiplash claims. These reforms will not be introduced until 2020 so it unlikely to have any material impact on loss ratios for some time.
Starting in 2019, the Motor Insurers’ Bureau has also agreed to mutualise risks for terrorism claims. This will be good news to UK motor insurers. It is unclear what impact these changes will have on premiums, but it should create more certainty for motor reinsurers.
2019 is likely to see further restrictions on capacity for international motor, although other market participants may see this as an opportunity to write new business at higher rates.
AviationLloyd’s writes across all main business sectors including airline, aerospace, general aviation, space and war. Airline (hull and liability) is the largest sector but Lloyd’s is also actively involved in the underwriting of general aviation (eg privately owned light aircraft, helicopters and large private corporate jets), airport liability, aviation product manufacturers’ liability, aviation, war/terrorism and satellite launch and in-orbit risks.
2018 performanceGross written premium was £549m (2017: £687m), a decrease of 20.1%. The Lloyd’s aviation line reported an accident year ratio of 119.8% (2017: 100.6%).
There were a few large losses in 2018 but overall major loss activity remained relatively benign. Following the trend of recent years, results have continued to be impacted by the frequency and cost of attritional claims eroding premium and deductible levels. Airline and general aviation continued to be the main lines contributing to the negative result, alongside space which experienced some large loss estimates. Consolidation and market withdrawals, driven by sustained poor performance, have led to a gradual decline in industry capacity levels. This has stimulated the extent of price increases as the year progressed.
Prior year movementThe prior year movement was a release of 7.8% (2017: strengthening of 1.6%). The aviation line of business has seen prior year reserve releases over 2018. Reserving prudence for this class is generally held for large isolated losses, for which the losses estimates during 2018 have remained stable. Despite seeing above average attritional claims experience, release of reserves held for large losses has offset this adverse experience. The adverse attritional experience is mostly driven by space losses on the 2016 and 2017 years of account.
Looking aheadThe steady growth in industry exposures shows no sign of abating over the next few years. While safety is likely to continue to improve, higher aircraft repair costs and the increasing values of engines and airframes will continue to drive higher levels of attrition, absent a commensurate increase in deductibles.
Notwithstanding the rise in general pricing levels in 2018, industry claims are still likely to materially exceed premiums in a normal loss year. Strict adherence to underwriting discipline regarding risk selection, exposure management controls (eg cyber, war accumulations) and rigorous portfolio management remain essential in order to generate positive returns.
2018 Highlights continued
32 Lloyd’s Annual Report 2018

Reinsurance
Property Gross written premium £m Combined ratio % Underwriting result £m
2014 4,472 2014 77.0 2014 801
2015 4,627 2015 76.3 2015 794
2016 5,022 2016 91.8 2016 299
2017 5,991 2017 130.3 2017 (1,260)
2018 6,440 2018 116.2 2018 (672)
Casualty Gross written premium £m Combined ratio % Underwriting result £m
2014 1,779 2014 87.6 2014 187
2015 1,797 2015 100.0 2015 0
2016 2,096 2016 98.1 2016 33
2017 2,223 2017 102.1 2017 (39)
2018 2,541 2018 96.1 2018 78
Specialty Gross written premium £m Combined ratio % Underwriting result £m
2014 2,237 2014 86.5 2014 225
2015 2,169 2015 93.3 2015 110
2016 2,290 2016 87.7 2016 216
2017 2,346 2017 101.8 2017 (31)
2018 2,089 2018 90.9 2018 138
Lloyd’s Annual Report 2018 33
Market Results Society ReportStrategic Report Other Information

Insurance
Property Gross written premium £m Combined ratio % Underwriting result £m
2014 6,274 2014 87.7 2014 558
2015 6,893 2015 90.1 2015 501
2016 7,988 2016 103.4 2016 (202)
2017 8,965 2017 127.6 2017 (1,757)
2018 9,687 2018 110.4 2018 (700)
Casualty Gross written premium £m Combined ratio % Underwriting result £m
2014 4,959 2014 98.1 2014 74
2015 5,764 2015 100.1 2015 (5)
2016 7,131 2016 102.7 2016 (146)
2017 8,464 2017 103.1 2017 (189)
2018 9,094 2018 102.9 2018 (183)
Marine Gross written premium £m Combined ratio % Underwriting result £m
2014 2,140 2014 95.2 2014 84
2015 2,245 2015 94.2 2015 108
2016 2,470 2016 106.2 2016 (129)
2017 2,506 2017 122.4 2017 (469)
2018 2,603 2018 116.0 2018 (343)
2018 Highlights continued
34 Lloyd’s Annual Report 2018

Energy Gross written premium £m Combined ratio % Underwriting result £m
2014 1,532 2014 83.4 2014 181
2015 1,414 2015 76.0 2015 247
2016 1,110 2016 92.6 2016 59
2017 1,253 2017 86.6 2017 105
2018 1,404 2018 87.4 2018 113
Motor Gross written premium £m Combined ratio % Underwriting result £m
2014 1,213 2014 106.6 2014 (71)
2015 1,120 2015 102.0 2015 (17)
2016 1,047 2016 111.5 2016 (103)
2017 1,057 2017 122.3 2017 (188)
2018 1,037 2018 98.7 2018 12
Aviation Gross written premium £m Combined ratio % Underwriting result £m
2014 581 2014 102.7 2014 (10)
2015 587 2015 95.7 2015 19
2016 627 2016 84.7 2016 71
2017 687 2017 102.2 2017 (11)
2018 549 2018 112.0 2018 (49)
Lloyd’s Annual Report 2018 35
Market Results Society ReportStrategic Report Other Information

Statement of Council’s Responsibilities
Statement of Council’s ResponsibilitiesThe Pro Forma Financial Statements (PFFS) are prepared so that the financial results of Lloyd’s and its members taken together and their net assets can be compared as closely as possible with general insurance companies.
The Council is responsible for the preparation and approval of the PFFS.
The maintenance and integrity of the Lloyd’s website is the responsibility of the Council; the work carried out by the auditors does not involve consideration of these matters and, accordingly, the auditors accept no responsibility for any changes that may have occurred to the financial statements since they were initially presented on the website.
Legislation in the United Kingdom governing the preparation and dissemination of financial statements may differ from legislation in other jurisdictions.
36 Lloyd’s Annual Report 2018

Independent Reasonable Assurance Report of PricewaterhouseCoopers LLP to the Council of Lloyd’s on the preparation of the 2018 Lloyd’s Pro Forma Financial StatementsConclusionIn our opinion the Council of Lloyd’s has prepared the Lloyd’s Pro Forma Financial Statements (the “PFFS”) for the financial year ended 31 December 2018, defined below, in all material respects in accordance with the basis of preparation set out in note 2.
This opinion is to be read in the context of what we say in the remainder of this report.
What we have assuredThe PFFS, which are prepared by the Council of Lloyd’s, comprise: a pro forma profit and loss account, a pro forma statement of other comprehensive income, a pro forma balance sheet, a pro forma statement of cash flows, and notes 1-24.
The financial reporting framework that has been applied in their preparation is the basis of preparation set out in note 2.
Our assurance does not extend to information in respect of earlier periods or to any other information included in the Lloyd’s Annual Report within which the PFFS for the year ended 31 December 2018 are included.
What a reasonable assurance engagement involvesWe performed a reasonable assurance engagement in accordance with International Standard on Assurance Engagements 3000 (Revised) – ‘Assurance Engagements other than Audits and Reviews of Historical Financial Information’, issued by the International Auditing and Assurance Standards Board.
We complied with the Institute of Chartered Accountants in England and Wales (ICAEW) Code of Ethics, which includes independence and other requirements founded on fundamental principles of integrity, objectivity, professional competence and due care, confidentiality and professional behaviour. We apply International Standard on Quality Control (UK) 1 and accordingly maintain a comprehensive system of quality control including documented policies and procedures regarding compliance with ethical requirements, professional standards and applicable legal and regulatory requirements.
The PFFS have been compiled in part from an aggregation of financial information extracted from the balance sheet and profit and loss account included in syndicate annual accounts by the managing agent of each syndicate, which has been submitted to the Council of Lloyd’s and on which the auditors of each syndicate have reported. Our work did not involve assessing the quality of those audits or performing any audit procedures over the financial information of the syndicates.
Report of PricewaterhouseCoopers LLP to the Council on the 2018 Pro Forma Financial Statements
Our examination of the preparation of the PFFS consisted principally of:
— obtaining an understanding of how the Council of Lloyd’s has compiled the PFFS from the audited syndicate annual returns and accounts, the audited Society of Lloyd’s Group Financial Statements and members’ funds at Lloyd’s;
— checking (on a sample basis) that the financial information included in the PFFS was correctly extracted from the syndicate annual accounts and the Society of Lloyd’s Financial Statements;
— evaluating evidence to support the existence and valuation of members’ funds at Lloyd’s; and
— evaluating the evidence supporting the adjustments made in the preparation of the PFFS and obtaining evidence that the PFFS have been prepared in accordance with the basis of preparation set out in the PFFS notes.
The engagement also involves evaluating the overall presentation of the PFFS. We do not consider the appropriateness of the basis of preparation of the PFFS.
The responsibilities of the Council of Lloyd’s and our responsibilitiesThe Council of Lloyd’s is responsible for the preparation and approval of the PFFS in accordance with the basis of preparation set out in note 2. The purpose of the PFFS is to allow the financial results of Lloyd’s and its members and their net assets taken together to be compared as closely as possible with the financial reports of general insurance companies.
Our responsibility is to express an opinion about whether the preparation of the PFFS has been performed by the Council of Lloyd’s on the basis set out in note 2.
This report including our conclusions has been prepared solely to the Council of Lloyd’s in accordance with our engagement letter dated 6 December 2018 (the “instructions”). Our examination has been undertaken so that we might state to the Council of Lloyd’s those matters which we are required to state in this report in accordance with the instructions and for no other purpose. To the fullest extent permitted by law, we do not accept or assume any responsibility for any other purpose or to any other person to whom this report is shown or into whose hands it may come save where expressly agreed by our prior consent in writing.
PricewaterhouseCoopers LLPLondon 26 March 2019
Lloyd’s Annual Report 2018 37
Market Results Society ReportStrategic Report Other Information

Pro Forma Profit and Loss Account (For the year ended 31 December 2018)
Technical account Note £m2018
£m £m2017
£m
Gross written premiums 9 35,527 33,591
Outward reinsurance premiums (9,846) (8,722)
Premiums written, net of reinsurance 25,681 24,869
Change in the gross provision for unearned premiums (789) (847)
Change in the provision for unearned premiums, reinsurers’ share 286 476
(503) (371)
Earned premiums, net of reinsurance 25,178 24,498
Allocated investment return transferred from the non-technical account 367 732
25,545 25,230
Claims paid
Gross amount 19,666 18,292
Reinsurers’ share (5,682) (3,634)
13,984 14,658
Change in provision for claims
Gross amount 4,895 9,768
Reinsurers’ share (2,441) (6,176)
2,454 3,592
Claims incurred, net of reinsurance 16,438 18,250
Net operating expenses 11 9,870 9,669
Balance on the technical account for general business (763) (2,689)
Non-technical account
Balance on the technical account for general business (763) (2,689)
Investment return on syndicate assets 333 907
Notional investment return on members’ funds at Lloyd’s 6 178 722
Investment return on Society assets (7) 171
12 504 1,800
Allocated investment return transferred to the technical account (367) (732)
137 1,068
(Loss)/profit on exchange (8) (62)
Other income 34 42
Other expenses (401) (360)
Result for the financial year before tax 8 (1,001) (2,001)
All operations relate to continuing activities.
38 Lloyd’s Annual Report 2018

Pro Forma Statement of Comprehensive Income (For the year ended 31 December 2018)
Statement of other comprehensive income2018
£m2017
£m
Result for the year (1,001) (2,001)
Currency translation differences (65) (69)
Other comprehensive losses in the syndicate annual accounts (3) (2)
Remeasurement gains/(losses) on pension assets/liabilities in the Society accounts 61 41
Total comprehensive (loss)/income for the year (1,008) (2,031)
Lloyd’s Annual Report 2018 39
Market Results Society ReportStrategic Report Other Information

Pro Forma Balance Sheet(As at 31 December 2018)
Investments Note £m2018
£m £m2017
£m
Financial investments 13 60,363 55,765
Deposits with ceding undertakings 35 18
Reinsurers’ share of technical provisions
Provision for unearned premiums 18 3,853 3,372
Claims outstanding 18 19,541 16,811
23,394 20,183
Debtors
Debtors arising out of direct insurance operations 14 9,673 8,882
Debtors arising out of reinsurance operations 15 7,478 5,921
Other debtors 1,016 734
18,167 15,537
Other assets
Tangible assets 27 31
Cash at bank and in hand 16, 22 10,877 12,137
Other 125 72
11,029 12,240
Prepayments and accrued income
Accrued interest and rent 123 104
Deferred acquisition costs 18 4,680 4,304
Other prepayments and accrued income 217 245
5,020 4,653
Total assets 118,008 108,396
Capital, reserves and subordinated debt
Members’ funds at Lloyd’s 6 26,483 24,579
Members’ balances 17 (1,472) –
Members’ assets (held severally) 25,011 24,579
Central reserves (mutual assets) 2,417 2,188
8 27,428 26,767
Subordinated debt 2 794 793
Total capital, reserves and subordinated debt 28,222 27,560
Technical provisions
Provision for unearned premiums 18 17,868 16,377
Claims outstanding 18 60,450 54,893
78,318 71,270
Deposits received from reinsurers 169 111
Creditors
Creditors arising out of direct insurance operations 20 1,325 955
Creditors arising out of reinsurance operations 21 6,552 5,929
Other creditors including taxation 2,484 1,781
10,361 8,665
Accruals and deferred income 938 790
Total liabilities 118,008 108,396
Approved by the Council on 26 March 2019 and signed on its behalf by
Bruce Carnegie-BrownChairman
John Neal Chief Executive Officer
40 Lloyd’s Annual Report 2018

Pro Forma Statement of Cash Flows (For the year ended 31 December 2018)
Note2018
£m2017
£m
Result for the financial year before tax (1,001) (2,001)
Increase/(decrease) in gross technical provisions 6,113 7,714
(Increase)/decrease in reinsurers’ share of gross technical provisions (2,918) (5,930)
(Increase)/decrease in debtors (2,120) (1,942)
Increase/(decrease) in creditors 943 1,596
Movement in other assets/liabilities (424) 66
Investment return (504) (1,800)
Depreciation 9 8
Tax paid (34) (51)
Foreign exchange (809) 1,057
Other (113) (6)
Net cash flows from operating activities (858) (1,289)
Investing activities
Purchase of equity and debt instruments (40,927) (38,462)
Proceeds from sale of equity and debt instruments 41,316 39,631
Purchase of derivatives (3,078) (69)
Proceeds from sale of derivatives 3,070 28
Investment income received 653 801
Other (538) 171
Net cash flows from investing activities 496 2,100
Financing activities
Net profits paid to members (851) (1,689)
Net capital transferred into/(out of) syndicate premium trust funds 825 774
Proceeds from sale of debt securities – 298
Redemption of subordinated notes – (392)
Interest paid on subordinated notes (38) (53)
Net movement in members’ funds at Lloyd’s (1,451) (123)
Other 104 21
Net cash flows from financing activities (1,411) (1,164)
Net (decrease)/increase in cash and cash equivalents (1,773) (353)
Cash and cash equivalents at 1 January 14,113 14,631
Exchange differences on cash and cash equivalents 55 (165)
Cash and cash equivalents at 31 December 22 12,395 14,113
Lloyd’s Annual Report 2018 41
Market Results Society ReportStrategic Report Other Information

Notes to the Pro Forma Financial Statements(For the year ended 31 December 2018)
1. The Pro Forma Financial StatementsThe Pro Forma Financial Statements (PFFS) are prepared so that the financial results of Lloyd’s and its members taken together and their net assets can be compared as closely as possible with general insurance companies.
2. Basis of preparationGeneralThe PFFS have been prepared by aggregating audited financial information reported in syndicate returns and annual accounts (Aggregate Accounts), members’ funds at Lloyd’s (FAL) and the financial statements of the Society of Lloyd’s (the Society) on pages 122-180. Having assessed the principal risks, the Council considered it appropriate to adopt the going concern basis of accounting in preparing the PFFS; the going concern and viability statement of the Society is included within the Society Report on pages 114-115.
The Aggregate Accounts report the audited results for calendar year 2018 and the financial position at 31 December 2018 for all life and non-life syndicates that transacted business during the year. The results and net assets for life syndicates are not material and have not been separately disclosed in the profit and loss account and balance sheet. The results for life business are reported in the segmental analysis (note 9). The Aggregate Accounts are reported as a separate document and can be viewed at lloyds.com/annualreport2018. In order to provide more meaningful information in the Aggregate Accounts and PFFS, the Society has required syndicates to report certain disclosures presented on a consistent basis, which may vary from presentation included in the individual syndicates’ annual accounts.
The profit and loss account in the PFFS aggregates the syndicate results, the notional investment return on members’ capital and the results of the Society. The balance sheet in the PFFS aggregates the assets and liabilities held at syndicate level, members’ assets held as FAL and the central resources of the Society.
The PFFS have, where practicable, been prepared in accordance with United Kingdom Accounting Standards (UK Generally Accepted Accounting Practice (UK GAAP)), including Financial Reporting Standard 102 (FRS 102) and the applicable Accounting Standard on insurance contracts Financial Reporting Standard 103 (FRS 103). In preparing the PFFS, note disclosures have been included for those areas the Council consider material to enable the PFFS to depict a comprehensive view of the financial results and position of the Lloyd’s market and to enable comparison with general insurance companies, with the exception of the following items:
— Use of the aggregation basis to prepare the PFFS;
— Notional investment return on members’ funds at Lloyd’s;
— The statement of changes in equity;
— Taxation; and
— Related party transactions.
(a) AggregationThe PFFS have not been prepared in accordance with full consolidation principles and do not present a consolidated view of the results of the Lloyd’s business taken as a single entity for the reasons detailed further below. However, the PFFS may be used as a reasonable presentation of the results and state of affairs of the Lloyd’s market on a basis that is broadly comparable with general insurance companies.
The syndicates’ financial information included in the PFFS has been prepared in accordance with the recognition and measurement requirements of UK GAAP by reference to the accounting policies that are deemed most appropriate by the managing agents. Where different accounting policies have been selected by managing agents in preparing syndicate annual accounts, no adjustments are made to align the bases of recognition and measurement in the PFFS. In addition, no adjustments are made to eliminate inter-syndicate transactions and balances except for those relating to inter-syndicate loans and Special Purpose Arrangements (SPA). Transactions between syndicates and the Society are eliminated in the PFFS. These adjustments are described below:
Inter-syndicate loansThe syndicate annual accounts report debtor and creditor balances for inter-syndicate loans totalling £125m (2017: £122m). These amounts have been eliminated from the amounts reported in the balance sheet to provide a more meaningful presentation of the balance sheet for users of the PFFS (note 8).
Special Purpose Arrangements (SPA)The Aggregate Accounts include the results and assets of the SPA (see Glossary on page 185). Due to the nature of the SPA, the quota share of the host syndicate’s business is reported as gross written premiums in both the host syndicate and the SPA annual accounts. This leads to an overstatement of the original premiums written by the whole Lloyd’s market. To provide users of the PFFS with a more meaningful presentation of the market’s figures, all the transactions arising from the insurance contracts between the SPA and host syndicates have been eliminated. The key impact of this elimination is that gross written premium is reduced by £643m (2017: £589m). The elimination does not affect the PFFS result or the balance due to members. All other inter-syndicate reinsurance arrangements are included in full.
Transactions between syndicates and the Society — Central Fund contributions, members’ subscriptions and other market charges levied by the Society are reported as net operating expenses in the syndicate annual accounts and as income in the Society financial statements.
42 Lloyd’s Annual Report 2018

— Central Fund claims and provisions to discharge the liability of members where they have unpaid cash calls, and do not have the resources to meet those cash calls, are reported as a profit and loss charge and balance sheet liability in the Society financial statements. The Central Fund’s other income includes recoveries from insolvent members. The syndicate annual accounts for calendar year 2018 and earlier years include those members’ results and at the balance sheet date will report the outstanding liability within members’ balances.
— Loans funding statutory overseas deposits are reported as assets within the syndicate annual accounts and as liabilities in the Society financial statements.
(b) Notional investment return on members’ funds at Lloyd’s (FAL)A notional investment return on FAL has been estimated, which is the equivalent of insurance companies generating investment return on the capital that they hold to support their underwriting. Where Lloyd’s is the investment manager for FAL, the actual return achieved has been included. For other assets the notional investment return, net of management fees, is estimated on the average value of FAL during the year, based on yields from indices for each type of asset held. The typical investment return on bank deposits has been applied to FAL, provided as letters of credit or bank guarantees. The actual return achieved on FAL investments will differ from the notional return due to individual stocks held, daily cash flows and transactional charges. Notional investment return on FAL is reported in the non-technical account.
Due to the estimation of the notional investment return, movements in FAL recorded within the financing section of the statement of cash flows is comprised of both cash and non-cash activity.
(c) Statement of changes in equityWhere Lloyd’s is not the investment manager for FAL, actual changes are not available and therefore a statement of changes in equity has not been included. However, a statement of changes in members’ balances has been included in note 17, which, along with the Society’s group statement of changes in equity (on page 125), represents the changes in equity of the other components of the PFFS.
(d) TaxationThe PFFS report the market’s result before tax. Members are responsible for tax payable on their syndicate results and investment income on FAL. For consistency, the results of the Society are also included pre-tax in the profit and loss account. The balance sheet in the Society financial statements includes the Society’s own tax provision balances.
(e) Related party transactionsIndividual syndicates or their members do not disclose details of insurance and/or reinsurance transactions with other (non-related) syndicates or members within the market. Therefore analysis and/or disclosure of these transactions within the Lloyd’s market in the PFFS is not possible. Other than the disclosures made in note 24, a more detailed related party transaction note is therefore not included within the PFFS. The annual accounts of each syndicate or member provide, where appropriate, the required disclosures on related parties. The related party transactions of the Society are disclosed in note 27 on page 180 of the Society financial statements.
Members’ funds at Lloyd’s (FAL)FAL comprise the capital provided by members, which is generally held centrally, to support their underwriting, and are the equivalent of capital shown in insurance companies’ accounts. The valuation of FAL has, therefore, been included in the pro forma balance sheet. FAL is available to meet cash calls made on the member in respect of a syndicate liability. The assets in FAL must be readily realisable and may include letters of credit and bank and other guarantees.
The total resources, including FAL, for members writing ongoing insurance must be at least equivalent to the aggregate of the member’s Economic Capital Assessment (ECA) requirement and certain liabilities in respect of its underwriting business. Each member’s ECA to support its underwriting at Lloyd’s is determined using Lloyd’s Solvency Capital Requirement to ultimate capital setting methodology.
Subordinated debtIn accordance with the terms of the Society’s subordinated debt, the capital raised is available for payment to policyholders in advance of repayment to the note holders and is included in “capital, reserves and subordinated debt” in the pro forma balance sheet. Note 22 to the Society financial statements on page 176 provides additional information.
Society financial statementsThe PFFS include the results and net assets reported in the consolidated financial statements of the Society prepared in accordance with UK GAAP, comprising the financial statements of the Society and all its subsidiary undertakings, the Lloyd’s Central Fund and the Society’s interest in associates.
Lloyd’s Annual Report 2018 43
Market Results Society ReportStrategic Report Other Information

Notes to the Pro Forma Financial Statements continued(For the year ended 31 December 2018)
3. Accounting policies notesSources of significant accounting judgements and estimation uncertaintyThe PFFS aggregates judgements, estimates and assumptions made by managing agents in respect of syndicate balances, and the Council, in respect of the Society and FAL balances. These judgements, estimates and assumptions affect the application of accounting policies and reported amounts of assets, liabilities, income and expenses. Actual results may differ from these estimates.
Estimates and underlying assumptions are reviewed on an ongoing basis. Revisions to accounting estimates are recognised in the period in which the estimate is revised and in any future periods affected. In particular, information about significant areas of estimation uncertainty and critical judgements in applying accounting policies that have the most significant effect on the amounts recognised in the PFFS are described in the following accounting policies:
— Claims provisions and related recoveries (including provision for outstanding claims) (see note 3(a) and note 18);
— Premiums written (estimates for premiums written under delegated authority agreements) (see note 3(a) and note 9);
— Investments (valuations based on models and unobservable inputs) (see note 3(a) and note 13); and
— Notional investment return on FAL (estimate based on yields from indices for each type of asset held) (see note 2(b), note 3(b) and note 6).
The most critical accounting estimate included within the balance sheet is the estimate for outstanding claims. The total estimate, net of reinsurers’ share, as at 31 December 2018 is £40,909m (2017: £38,082m) and is included within the pro forma balance sheet.
(a) Aggregate accountsGeneralUnder the Insurance Accounts Directive (Lloyd’s Syndicate and Aggregate Accounts) Regulations 2008, as amended by The Statutory Auditors and Third Country Auditors Regulations 2017, managing agents must prepare syndicate annual accounts under UK GAAP. However, where UK GAAP permits different accounting treatments, each managing agent is able to adopt the accounting policies it considers most appropriate to its syndicate. The following accounting policies are, therefore, an overview of the policies generally adopted by syndicates.
Premiums writtenPremiums written represent premiums on business incepting during the year, together with adjustments for premiums written in previous accounting periods. Premiums written are stated before deduction of commissions but net of taxes, duties levied on premiums and other deductions.
Unearned premiumsWritten premiums are recognised as earned according to the risk profile of the policy. Unearned premiums represent the proportion of premiums written in the year that relate to unexpired terms of policies in force at the balance sheet date, calculated on the basis of established earnings patterns or time apportioned as appropriate.
Outward reinsurance premiumsOutward reinsurance premiums comprise the cost of reinsurance arrangements placed and are accounted for in the same accounting period as the related insurance contracts. The provision for reinsurers’ share of unearned premiums represents that part of reinsurance premium ceded that is estimated to be earned in following financial years.
Claims provisions and related recoveriesGross claims incurred comprise the estimated cost of all claims occurring during the year, whether reported or not, including related direct and indirect claims handling costs and adjustments to claims outstanding from previous years.
The provision for claims outstanding is assessed on an individual case basis and is based on the estimated ultimate cost of all claims notified but not settled by the balance sheet date, together with the provision for related claims handling costs. The provision also includes the estimated cost of claims incurred but not reported (IBNR) at the balance sheet date based on statistical methods.
These methods generally involve projecting from past experience of the development of claims over time to form a view of the likely ultimate claims to be experienced for more recent underwriting, having regard to variations in the business accepted and the underlying terms and conditions. For the most recent years, where a high degree of volatility arises from projections, estimates may be based in part on output from rating and other models of the business accepted and assessments of underwriting conditions. The amount of salvage and subrogation recoveries is separately identified and, where material, reported as an asset.
The reinsurers’ share of provisions for claims is based on the amounts of outstanding claims and projections for IBNR, net of estimated irrecoverable amounts, having regard to the reinsurance programme in place for the line of business, the claims experience for the year and the current security rating of the reinsurers involved. Statistical techniques are used to assist in making these estimates. The two most critical assumptions as regards claims provisions are that the past is a reasonable predictor of the likely level of future claims development and that the rating and other models used for current business are fair reflections of the likely level of ultimate claims to be incurred. The directors of each syndicate’s managing agent consider that the provisions for gross claims and related reinsurance recoveries are fairly stated on the basis of the information currently available to them.
44 Lloyd’s Annual Report 2018

However, the ultimate liability will vary as a result of subsequent information and events, which may result in significant adjustments to the amounts provided. Adjustments to the amounts of claims provisions established in prior years are reflected in the financial statements for the period in which the adjustments are made. The methods used, and the estimates made, are reviewed regularly.
Additional information on insurance risk is disclosed in note 4.
Discounted claims provisionsDue to the long delay between the date of an incurred claim and the final settlement of the claim, the outstanding claims provisions are discounted to take account of the expected investment income receivable between claim event and settlement dates on the assets held to cover the provisions. This is only applicable to the syndicates that discount their claims provisions.
Unexpired risks provisionA provision for unexpired risks is made where claims and related expenses arising after the end of the financial period in respect of contracts concluded before that date are expected to exceed the unearned premiums under these contracts, after the deduction of any acquisition costs deferred.
The provision for unexpired risks is calculated at syndicate level by reference to lines of business that are managed together, and may take into account relevant investment return.
Acquisition costsAcquisition costs, comprising commission and other costs related to the acquisition of new insurance contracts are deferred to the extent that they are attributable to premiums unearned at the balance sheet date.
Foreign currenciesThe Council considers that the functional currency and the presentational currency of the PFFS and Aggregate Accounts is sterling. In the context of the PFFS and Aggregate Accounts the Council views this to be the equivalent of a group which has different operating units with a mix of functional currencies.
Foreign currency transactions are translated into the functional currency using the exchange rates prevailing at the dates of the transactions, or the average rate may be used when this is a reasonable approximation.
At each period end foreign currency monetary items are translated using the closing rate. For this purpose, all assets and liabilities arising from insurance contracts (including unearned premiums, deferred acquisition costs and unexpired risks provisions) are monetary items.
Foreign exchange gains and losses resulting from the settlement of transactions and from the translation at period end exchange rates of monetary assets and liabilities denominated in foreign currencies are recognised in the non-technical account.
Foreign exchange gains and losses resulting from the settlement of transactions and from the translation at period end exchange rates of non-monetary assets and liabilities denominated in foreign currencies are recognised in other comprehensive income for those items where the gain or loss is required to be recognised within other comprehensive income, and in the non-technical account where the gain or loss is required to be recognised within profit or loss.
InvestmentsInvestments are stated at fair value at the balance sheet date. For this purpose, listed investments are stated at their bid price market value, and deposits with credit institutions and international deposits are stated at cost, less any provision for impairment.
Unlisted investments for which a market exists are stated at the average price at which they are traded on the balance sheet date or the last trading day before that date.
Syndicate investment returnSyndicate investment return comprises all investment income, realised investment gains and losses and movements in unrealised gains and losses, net of investment expenses, charges and interest.
Realised gains and losses on investments carried at market value are calculated as the difference between sale proceeds and purchase price.
Unrealised gains and losses on investments represent the difference between the valuation at the balance sheet date and the valuation at the previous balance sheet date, or purchase price, if acquired during the year, together with the reversal of unrealised gains and losses recognised in earlier accounting periods in respect of investment disposals in the current period.
Syndicate investment return is initially recorded in the non-technical account. A transfer is made from the non-technical account to the general business technical account where the investments generating the return relate to insurance business.
TaxationThe PFFS report the market’s result before tax because it is the members rather than the syndicates that are responsible for tax payable on their syndicate results and investment income on FAL. No provision has therefore been made in the PFFS for income tax payable by members. Any payments on account of members’ tax liabilities made on their behalf by a syndicate during the year are included in the balance sheet within other debtors or other creditors including taxation.
Operating expensesOperating expenses have been charged to the syndicates in accordance with the policies adopted by the managing agents.
Lloyd’s Annual Report 2018 45
Market Results Society ReportStrategic Report Other Information

3. Accounting policies notes continuedProfit commissionWhere profit commission is charged by the managing agent it will normally be fully paid once the appropriate year of account closes, normally at 36 months. The profit commission is accrued in the profit and loss account in accordance with the earned profit.
Managing agents may make payments on account of their anticipated profit commission from the syndicate premiums trust funds prior to the closure of a year of account where they have transferred open year surpluses (interim profits) from the syndicate level premiums trust funds to the members’ personal reserve fund. Any payments on account of such commission are restricted to the profit commission expensed in the profit and loss account in striking the level of interim profits declared and subsequently released.
Cash at bank and in handCash at bank and in hand includes cash in hand, deposits held at call with banks, other short term highly liquid investments with original maturities of three months or less and bank overdrafts. Bank overdrafts, when applicable, are shown within borrowings in current liabilities.
Comparative disclosuresCertain comparative balances have been reclassified to be consistent with current year presentation.
(b) Member’s funds at Lloyd’s (FAL)FAL is valued in accordance with their market value at the year end, and using year end exchange rates. Investments are stated at fair value at the balance sheet date. For this purpose, listed investments are stated at their bid price market value, and deposits with credit institutions and international deposits are stated at cost. Unlisted investments for which a market exists are stated at the average price at which they are traded on the balance sheet date or the last trading day before that date. Letters of credit are stated at the amount guaranteed by the issuing credit institution.
As disclosed in the basis of preparation a notional investment return on FAL is estimated, which is recognised in the non-technical account.
Members that only participate on one syndicate may hold the capital supporting their underwriting in their syndicate’s premium trust funds. Where a member takes advantage of this facility, the capital held in the premium trust fund is reported within members’ balances and the investment return retained within the non- technical account.
(c) Society of Lloyd’s (the Society)The accounting policies adopted in the Society financial statements are set out on pages 127 to 137. No adjustments have been made to the information incorporated into the PFFS as the Council do not consider there to be any material accounting policy differences between the existing IFRS accounting policies and the recognition and measurement requirements of UK GAAP.
4. Risk managementGovernance frameworkThe following governance structure relates to the Society as a whole, as the preparer of the PFFS. Individual syndicates will report, in their syndicate annual accounts, the governance structure applied to them by their managing agents.
An Act of Parliament, the Lloyd’s Act 1982, defines the governance structure and rules under which Lloyd’s operates. Under the Act, the Council is responsible for the management and supervision of the market. Lloyd’s is regulated by the Prudential Regulation Authority (PRA) and Financial Conduct Authority (FCA) under the Financial Services and Markets Act 2000.
The Council normally has six working, six external and six nominated members. The working and external members are elected by Lloyd’s members. The Chairman and Deputy Chairmen are elected annually by the Council from among its members. All members are approved by the PRA.
The Council can discharge some of its functions directly by making decisions and issuing resolutions, requirements, rules and byelaws. Other decisions are delegated to the Board and associated committees.
The Board is responsible for the day to day management of the Lloyd’s market. It lays down guidelines for all syndicates and operates a business planning and monitoring process to safeguard high standards of underwriting and risk management, thereby improving sustainable profitability and enhancing the financial strength of the market.
The principal committees of the Council are the Nominations and Governance Committee and the Remuneration Committee.
The principal committees of the Board are the Audit Committee, the Risk Committee, the Market Supervision and Review Committee, the Capacity Transfer Panel and the Investment Committee.
Capital management objectives, policies and approachCapital framework at Lloyd’sThe Society is a regulated undertaking and subject to the supervision of the Prudential Regulation Authority (PRA) under the Financial Services and Markets Act 2000. Within this supervisory framework, the Corporation applies capital requirements at member level and centrally to ensure that Lloyd’s complies with Solvency II, and beyond that to meet its own financial strength, licence and ratings objectives.
Although, as described below, Lloyd’s capital setting processes use a capital requirement set at syndicate level as a starting point, the requirement to meet Solvency II and Lloyd’s capital requirements apply at an overall and member level only, not at a syndicate level. Accordingly, the capital requirements in respect of individual syndicates are not disclosed in these financial statements.
Notes to the Pro Forma Financial Statements continued(For the year ended 31 December 2018)
46 Lloyd’s Annual Report 2018

Lloyd’s capital setting processIn order to meet Lloyd’s requirements, each syndicate is required to calculate its Solvency Capital Requirement (SCR) for the prospective underwriting year. This amount must be sufficient to cover a 1 in 200 year loss, reflecting uncertainty in the ultimate run-off of underwriting liabilities (SCR “to ultimate”). The SCRs of each syndicate are subject to review by the Corporation and approval by the Lloyd’s Capital and Planning Group.
A syndicate may be comprised of one or more underwriting member of Lloyd’s. Each member is liable for its own share of underwriting liabilities on the syndicate(s) on which it is participating but not other members’ shares. Accordingly, the capital requirement that Lloyd’s sets for each member operates on a several basis. Each member’s SCR shall thus be determined by the sum of the member’s share of the syndicate SCR “to ultimate”. Where a member participates on more than one syndicate, a credit for diversification is provided to reflect the spread of risk, but consistent with determining an SCR that reflects the capital requirement to cover a 1 in 200 year loss “to ultimate” for that member. Over and above this, the Corporation applies a capital uplift to the member’s capital requirement to determine the Economic Capital Assessment (ECA). The purpose of this uplift, which is a Lloyd’s not a Solvency II requirement, is to meet Lloyd’s financial strength, licence and ratings objectives. The capital uplift applied for 2018 was 35% of the member’s SCR “to ultimate”.
Solvency Capital Requirement (Solvency II basis)The SCR represents the amount of capital required to withstand a 1 in 200 year loss event over a one year horizon. Given Lloyd’s unique structure there are two SCRs that are monitored under the Solvency II regime:
The Lloyd’s market wide SCR (MWSCR) is calculated to cover all of the risks of “the association of underwriters known as Lloyd’s”, ie those arising on syndicate activity, members’ capital provided at Lloyd’s and the Society taken together, at a 99.5% confidence level over a one year time horizon as provided for in Solvency II legislation. All of the capital of the component parts of the market taken together are available to meet the MWSCR.
The Lloyd’s central SCR (CSCR) is calculated in respect of only the risks facing the Society, including the Central Fund at the same confidence level and time horizon used to calculate the MWSCR.
The material risk is that members do not have sufficient funds to meet their underwriting losses even having complied with the Corporation’s rigorous capital setting rules.
Individual syndicates are also required to calculate a SCR, at a 99.5% confidence level over a one year horizon, for each underwriting year; this drives the determination of member level SCRs. Each member’s SCR is derived as the sum of the member’s share of the syndicate’s one year SCR. Where a member participates on more than one syndicate, a credit for diversification is provided to reflect the spread of risk.
The MWSCR and CSCR are derived from the Lloyd’s Internal Model (LIM), which has been approved by the PRA. Individual syndicates also derive SCRs from their own internal models that are subject to approval by the Corporation’s Capital and Planning Group. The appropriateness of each syndicate’s internal model, including changes thereto and the reasonableness of the key assumptions are assessed as part of the Corporation’s oversight of the Lloyd’s market.
The Lloyd’s Internal ModelThe LIM is a purpose-built model designed to calculate the MWSCR and CSCR as required under Solvency II. It covers all risk types and all material risks for the aggregation of syndicates as well as for the Society, allowing for the unique capital structure of Lloyd’s. The LIM consists of three main components: the Lloyd’s Investment Risk Model (LIRM), which simulates economic variables and total assets returns; the Lloyd’s Catastrophe Model (LCM), which models catastrophe risk using syndicates’ views of risk; and the Capital Calculation Kernel (CCK), which is the main element of the LIM where all other risks are simulated and all risks are combined.
Syndicates calculate their own SCR. However, the market wide and central capital requirements are derived from the Corporation’s parameterisation at a whole market level to build a view of total market capital requirements from the ground up using market level assumptions. The LIM uses a methodology whereby losses from insurance and other risks are simulated by line of business, allocated to syndicates and through to members to assess the level of capital required by the market and centrally to meet 1 in 200 year losses over the one year time horizon.
Syndicates are the source of the majority of risks. They source all of the insurance business; manage the bulk of the asset portfolios; hold the majority of the counterparty exposures; and conduct most of the day to day operational activity. The syndicate risks include: insurance risk (underwriting, reserving and catastrophe risk); market risk on central assets; market risk on syndicate assets (including credit risk on Premiums Trust Funds (PTF)); reinsurance and other credit risk; and syndicate operational risk. At the central level, additional risks arise from central operational risk and pension fund risk.
Lloyd’s Annual Report 2018 47
Market Results Society ReportStrategic Report Other Information

4. Risk management continuedDetails of the major risk components are set out below.
Insurance riskThe dominant category of risk faced by Lloyd’s syndicates is insurance risk. This is the risk arising from the inherent uncertainties as to the occurrence, amount and timing of insurance liabilities. In practice, insurance risk can be subdivided into:
(i) underwriting risk; (ii) reserving risk; (iii credit risk; and (iv) catastrophe risk.
Underwriting riskThis includes the risk that a policy will be written for too low a premium, provide inappropriate cover, or that the frequency or severity of insured events will be higher than expected.
Underwriting strategy is agreed by the Board of each managing agent and set out in the syndicate business plan that is submitted to the Corporation for approval each year. Approval of business plans – and setting the capital requirements needed to support these plans – is the key control the Corporation uses to manage underwriting risk.
The Corporation reviews each syndicate business plan to ensure it meets Lloyd’s standards and is consistent with the capabilities of the managing agent. Once a plan is agreed, the Corporation uses performance management data to identify whether each syndicate’s business performance is progressing in line with the business plan or that variations are understood and accepted.
The managing agents’ underwriting controls should ensure that underwriting is aligned with their strategy, agreed business plan and underwriting policy.
Managing agents are expected to have controls in place to ensure that regulatory requirements and the scope of Lloyd’s market licences are clearly understood and that risks are written within those requirements.
Managing agents need to have clear processes for pricing business and an audit trail to show how pricing will deliver the projected results within the approved business plan and how pricing will be managed over the relevant underwriting cycle.
Reserving riskReserving risk arises where the reserves established in the balance sheet are not adequate to meet eventual claims arising. The level of uncertainty varies significantly across lines of business but can arise from inadequate reserves for known or Incurred But Not Reported (IBNR) claims. These shortfalls can arise from inadequate reserving processes or from the naturally uncertain progress of insurance events.
Lloyd’s current level of aggregate market reserves remains robust and the continued level of overall reserve releases are supported by underlying claims experience being more favourable than expected. This will not necessarily translate to all syndicates. There are currently few specific reserving issues and the main perceived risks relate to macro influences such as inflation or changes in legislation, or prescribed levels of payout. The Corporation analyses reserve developments at line of business and syndicate levels quarterly; and briefs the market on issues it considers need to be taken into account.
Case-specific claim reserves should make financial provision at reported loss levels, without prejudice to coverage.
Legal advisers’, underwriters’ and loss adjusters’ judgement are used to set the estimated case reserves.
Reserving processes use a variety of statistical analyses such as projections of historical loss development patterns, with results adjusted for expert judgement. Lloyd’s syndicates have significant exposure to volatile lines of business that carry material inherent risk that the ultimate claims settlement will vary from previous assessments of reserves.
Syndicates’ reserves are annually subject to a formal independent actuarial opinion and are monitored by the Corporation. The actuarial opinions are covered by a combination of formal Actuarial Professional Standards and specific Lloyd’s guidance and rules.
Credit riskThe market’s principal credit risk is that the reinsurance purchased to protect the syndicate’s gross losses does not respond as expected. This can occur because the reinsurer is unable to settle its liabilities. Managing agents are expected to have a clear and comprehensive plan for the reinsurance of each syndicate. This takes into account risk appetite for retained insurance risk and the potential for the accumulation of risk.
The managing agent should monitor and assess the security of, and exposure to, each reinsurer and intermediary. Reinsurance credit risk is subject to quarterly review by Lloyd’s.
Catastrophe riskCatastrophe risk is the risk of loss occurring across all lines of business from worldwide natural catastrophe events. Managing agents may use catastrophe modelling software, where appropriate, to monitor aggregate exposure to catastrophe losses. The Corporation has developed a suite of Realistic Disaster Scenarios to measure syndicate level and aggregate market exposure to both natural catastrophes and man-made losses. These are monitored frequently and syndicates supply projected probabilistic exceedance forecasts for Lloyd’s key exposures with their capital and business plans. Further enhancements to the monitoring and oversight of aggregate market catastrophe risk exposure have been implemented within the approved internal model under Solvency II.
Notes to the Pro Forma Financial Statements continued(For the year ended 31 December 2018)
48 Lloyd’s Annual Report 2018

Lloyd’s MWSCRThe MWSCR is broken down into the various risk components as shown below.
31 December 2018*SCR
£m
31 December 2017SCR
£m
Reserving risk 6,705 6,183
All other (attritional) underwriting risk 5,865 5,733
Catastrophe risk 2,972 3,923
Market risk 501 181
Reinsurance credit risk 597 523
Operational risk 739 728
Pension risk 22 14
MWSCR before adjustments 17,401 17,285
Foreign exchange adjustment for movement in H2 2018 (H2 2017) 349 (335)
MWSCR 17,750 16,950
Solvency Capital Requirement coverageCoverage of the MWSCR and CSCR is an ongoing and continuous requirement and the Corporation reports the results of its solvency test – ie the amount of the MWSCR, eligible assets to cover it and the solvency ratio – on a quarterly basis to the PRA. Lloyd’s solvency coverage for both MWSCR and CSCR are set out below.
Lloyd’s MWSCR
31 December 2018*
31 December 2017
SCR
149%
£17,750m
£16,950m
£8,640m
£7,431m £1,910m
£26,390m
£26,291m
144%0
Eligible assets in excess of the SCRSolvency cover ratio % (risk appetite: 125%) Ineligible assets
50 100 150 200 250
Lloyd’s CSCR
31 December 2018*
31 December 2017
£1,400m
£1,600m
£2,094m
£1,845m £133m
£153m £3,647m
£3,578m
0 50 100 150 250200 300 350
250%
215%
SCR Eligible assets in excess of the SCR Ineligible assets Solvency cover ratio % (risk appetite: 200%)
* Represents the position based on the unaudited solvency returns, which may differ from the final audited 2018 submissions.
In addition to the quarterly reporting to the PRA, internal risk appetites have been set to monitor the coverage of the MWSCR and CSCR as part of the risk management framework in place at Lloyd’s. During 2018, the solvency coverage ratios for both the MWSCR and the CSCR were in excess of internal risk appetites and regulatory requirements.
— MWSCR: The Society aims to hold market capital sufficient to provide financial security to policyholders and capital efficiency to investors (or “members”). Members are required to put up funds to meet their ECA, which is set as their SCR (on an ultimate view of risk) plus an uplift of 35%. The Corporation does not require excess capital to be held above this level and considers that the risk appetite of 125% of SCR gives an appropriate buffer following diversification benefits. In the event that the capital put up by a member falls below their ECA through losses incurred or an increase in their risk profile, additional funds must be deposited. If members do not recapitalise, their authority to continue to trade is restricted to the level of their available capital or ultimately fully withdrawn and they cease trading. Such action would then reduce their risk and the aggregate MWSCR.
— CSCR: All policies written at Lloyd’s are supported by central assets managed by the Society, which underpin the financial strength ratings of the Lloyd’s market and its international licence network. Accordingly, the risk appetite for 200% CSCR coverage reflects the prudent approach to maintaining adequate central assets to meet a 1 in 200 year event and be in position to continue to write new business.
Lloyd’s Annual Report 2018 49
Market Results Society ReportStrategic Report Other Information

4. Risk management continued
Solvency cover ratiosMWSCR
coverageCSCR
coverage
31 December 2018* 149% 250%
31 December 2017 144% 215%
Risk appetite for solvency cover ratio 125% 200%
* Based on the unaudited solvency returns.
Assets eligible for solvencyThe assets of the syndicates, members’ FAL and the Society all contribute towards coverage of the MWSCR, after adjustments to value items in accordance with Solvency II valuation principles. The Society assets and callable layer, in the chain of security, are available to cover the CSCR.
The eligibility of assets to cover the SCR under Solvency II is determined by a tiering test. Tier 1 assets are fully available to cover the SCR while Tier 2 and Tier 3 assets in aggregate can cover up to 50% of the SCR. The majority of the assets available to cover the MWSCR are Tier 1. However, a proportion of members’ FAL is provided in the form of letters of credit which are classed as Tier 2 assets, restricting their ability to cover the MWSCR and resulting in a lower solvency cover ratio. These letters of credit are callable on demand and when called, the proceeds, namely cash, would qualify as Tier 1 assets. Under these circumstances, the amounts previously restricted would become fully eligible.
Lloyd’s MWSCR (£m)
0
5000
10000
15000
20000
25000
30000 794*
(1,444) (388)
31
26,39028,222
17,881
8,478
18,157
2,417
25,011
Solvency valuation adjustments
Net profits to be distributed
Subordinated debt Central assets
Members’ assets
Tier 3 Tier 2
Tier 1
8,478
Lloyd’s CSCR (£m)
0
500
1000
1500
2000
2500
3000
3500
4000
794*
822436
2,794 2,794
700
31
(122)
(31)3,6473,211 3,494
2,417
Solvency valuation adjustments
Deduction for ineligible Tier 2 and 3
Assets eligible for solvency
Subordinated debt Central assets
Members’ assets
Tier 3 Tier 2
Tier 1
* Per 31 December 2018 balance sheet. Other amounts represent the position based on the unaudited solvency returns, which may differ from the final audited 2018 submissions.
Notes to the Pro Forma Financial Statements continued(For the year ended 31 December 2018)
50 Lloyd’s Annual Report 2018

Claims development tableThe tables below illustrate the development of the estimates of earned ultimate cumulative claims for syndicates in aggregate after the end of the underwriting year, illustrating how amounts estimated have changed from the first estimates made. Non-sterling balances have been converted using 2018 year end exchange rates to aid comparability. As these tables are on an underwriting year basis there is an apparent jump from figures for the end of the underwriting year to one year later as a large proportion of premiums are earned in the year of account’s second year of development.
Advantage has been taken of the transitional rules of FRS 103 that permit the stepped increase in disclosure of claims development information. The claims development information disclosed will be increased from eight years to ten years over the period 2019-2020.
Gross
Underwriting year
2010 and prior years
£m2011
£m2012
£m2013
£m2014
£m2015
£m2016
£m2017
£m2018
£mTotal
£m
At end of underwriting year 9,622 8,887 7,523 7,723 7,464 9,358 17,299 14,092
One year later 16,032 14,327 14,251 14,718 15,427 20,345 27,973
Two years later 16,144 14,666 14,458 15,621 16,370 21,958
Three years later 16,222 14,440 14,110 15,512 17,166
Four years later 16,190 14,406 13,903 16,451
Five years later 16,020 14,248 14,241
Six years later 15,899 14,670
Seven years later 16,438
Cumulative payments (14,958) (12,575) (11,598) (11,995) (11,161) (12,258) (11,652) (2,176)
Estimated balance to pay 5,834 1,480 2,095 2,643 4,456 6,005 9,700 16,321 11,916 60,450
Net
Underwriting year
2010 and prior years
£m2011
£m2012
£m2013
£m2014
£m2015
£m2016
£m2017
£m2018
£mTotal
£m
At end of underwriting year 7,754 6,786 6,222 6,292 5,950 7,473 10,139 9,438
One year later 12,726 11,445 11,735 11,893 12,373 15,680 17,868
Two years later 12,746 11,668 11,811 12,476 12,987 16,610
Three years later 12,724 11,512 11,512 12,424 13,646
Four years later 12,736 11,319 11,363 12,991
Five years later 12,308 11,248 11,630
Six years later 12,215 11,558
Seven years later 12,648
Cumulative payments (11,531) (9,919) (9,568) (9,738) (9,136) (9,869) (7,962) (1,856)
Estimated balance to pay 4,099 1,117 1,639 2,062 3,253 4,510 6,741 9,906 7,582 40,909
Lloyd’s Annual Report 2018 51
Market Results Society ReportStrategic Report Other Information

4. Risk management continuedFinancial riskCredit riskCredit risk is the exposure to loss if a counterparty fails to perform its contractual obligations.
As discussed on page 48, the market’s principal credit risk is that the reinsurance purchased to protect the syndicate’s gross losses does not respond as expected. Syndicates are also exposed to credit risk in their premium debtors. Credit risk in respect of premium debt is controlled through broker approval and regular monitoring of premium settlement performance. Syndicates and members are exposed to credit risks in their investment portfolios. PRA and Lloyd’s investment guidelines are designed to mitigate credit risk by ensuring diversification of holdings.
The carrying amount of financial assets and reinsurance assets represents the maximum credit risk exposure.
The tables below show the maximum exposure to credit risk for the components of the balance sheet. The maximum exposure is shown gross, before the effect of mitigation through collateral agreements and the use of credit derivatives.
2018
Neither pastdue nor
impaired£m
Past due£m
Impaired£m
Total£m
Debt securities 41,679 – – 41,679
Participation in investment pools 2,254 – – 2,254Loans with credit institutions 3,994 – – 3,994Deposits with credit institutions 3,806 – – 3,806Derivative assets 37 – – 37Other investments 43 – – 43Reinsurers’ share of claims outstanding 19,549 – (8) 19,541
Cash at bank and in hand, including letters of credit and bank guarantees 10,877 – – 10,877
Total 82,239 – (8) 82,231
2017
Neither pastdue nor
impaired£m
Past due£m
Impaired£m
Total£m
Debt securities 37,193 – 4 37,197
Participation in investment pools 2,118 – – 2,118Loans with credit institutions 1,050 – – 1,050Deposits with credit institutions 5,791 – – 5,791Derivative assets 75 – – 75Other investments 60 – – 60Reinsurers’ share of claims outstanding 16,811 – – 16,811
Cash at bank and in hand, including letters of credit and bank guarantees 12,137 – – 12,137
Total 75,235 – 4 75,239
In aggregate there are no financial assets that would be past due, or impaired whose terms have been renegotiated, held by syndicates, the Society or within FAL.
In aggregate there were no material debt and fixed income assets held that were past due or impaired beyond their reported fair values, either for the current period under review or on a cumulative basis. For the current period and prior period, in aggregate there were no material defaults on debt securities.
Assets held as collateral comprise cash and debt securities received as collateral against reinsurance assets transferred from syndicates’ reinsurers.
Notes to the Pro Forma Financial Statements continued(For the year ended 31 December 2018)
52 Lloyd’s Annual Report 2018

The table below provides information regarding the credit risk exposure at 31 December 2018 by classifying assets according to the credit ratings of the counterparties. AAA is the highest possible rating. Assets that fall outside the range of AAA to BBB are classified as other. Debtors, other than amounts due from reinsurers, have been excluded from the table as these are not rated. This table is the sum of assets neither past due nor impaired.
2018
Rated AAA
£m
Rated AA£m
RatedA
£m
Rated BBB
£mOther
£mTotal
£m
Debt securities 11,900 9,988 10,543 5,421 3,827 41,679
Participation in investment pools 128 131 36 7 1,952 2,254Loans with credit institutions 613 88 171 151 2,971 3,994Deposits with credit institutions 1,740 570 502 248 746 3,806Derivative assets – – 8 – 29 37
Other investments 9 1 – – 33 43
Reinsurers’ share of claims outstanding 616 3,791 12,752 107 2,283 19,549
Cash at bank and in hand 250 1,751 7,973 383 520 10,877
Total credit risk 15,256 16,320 31,985 6,317 12,361 82,239
2017
Rated AAA
£m
Rated AA£m
RatedA
£m
Rated BBB
£mOther
£mTotal
£m
Debt securities 9,379 10,143 9,514 4,827 3,330 37,193
Participation in investment pools 187 66 130 8 1,727 2,118Loans with credit institutions 473 76 126 54 321 1,050Deposits with credit institutions 1,592 554 508 257 2,880 5,791Derivative assets – 1 5 5 64 75Other investments 33 5 – – 22 60Reinsurers’ share of claims outstanding 278 3,868 10,781 40 1,844 16,811
Cash at bank and in hand 176 2,207 8,811 478 465 12,137
Total credit risk 12,118 16,920 29,875 5,669 10,653 75,235
Liquidity riskLiquidity risk arises where there are insufficient funds to meet liabilities, particularly claims. Managing agents are expected to manage the cash needs of their syndicates on an ongoing basis and to avoid becoming forced sellers of assets. They are required to match the duration of their syndicates’ investments with the liabilities to policyholders. Generally, syndicates have a high concentration of liquid assets, namely cash and government securities.
The Corporation centrally monitors syndicate liquidity, both in terms of asset mix and future funding needs, and conducts stress tests to monitor the impact on liquidity of significant claims events.
Lloyd’s Annual Report 2018 53
Market Results Society ReportStrategic Report Other Information

4. Risk management continuedThe table below summarises the maturity profile of financial liabilities for the market.
2018
No stated maturity
£m0-1 yrs
£m1-3yrs
£m3-5yrs
£m>5 yrs
£mTotal
£m
Claims outstanding 2 19,619 22,149 9,428 9,252 60,450
Derivatives – 31 – – – 31Deposits received from reinsurers 26 104 30 7 2 169Creditors 788 8,317 963 145 117 10,330Other liabilities 1 36 3 1 – 41Subordinated debt – – – – 794 794
Total 817 28,107 23,145 9,581 10,165 71,815
2017
No stated maturity
£m0-1 yrs
£m1-3yrs
£m3-5yrs
£m>5 yrs
£mTotal
£m
Claims outstanding 1 18,410 19,890 8,328 8,264 54,893
Derivatives – 20 – – – 20Deposits received from reinsurers 31 61 12 7 – 111Creditors 758 6,805 792 153 137 8,645Other liabilities 6 33 – – – 39Subordinated debt – – – – 793 793
Total 796 25,329 20,694 8,488 9,194 64,501
Market risk – overviewMarket risk is the risk that the value of financial instruments will fluctuate because of movements in foreign currency, interest rates or asset values. Syndicate assets are held in premium trust funds and are subject to the asset rules contained in the PRA’s handbook. Managing agents manage asset risk through their investment strategy.
There is greater oversight of market risk in light of the volatile economic climate, which includes the monitoring of Investment Management Minimum Standards. Lloyd’s Financial Risk Committee monitors assets across the full chain of security to ensure the asset disposition of the market and Society remains appropriate, closely monitoring global economic and market trends.
The potential financial impact of changes in market value is additionally monitored through the capital setting process, and asset mix must be reported to the Corporation on a quarterly basis, including credit rating analysis of fixed income portfolios.
Market risk comprises three types of risk:
(a) currency risk; (b) interest rate risk; and (c) equity price risk.
Notes to the Pro Forma Financial Statements continued(For the year ended 31 December 2018)
54 Lloyd’s Annual Report 2018

Currency riskManaging agents must identify the main currencies in which each syndicate transacts its business. For the market overall, the US dollar is the largest currency exposure. Assets are then held in each of those currencies to match the relevant liabilities. Managing agents must ensure that assets match liabilities and take corrective action where a mismatch arises. The Corporation also reviews the matching of assets to liabilities at the syndicate level as well as at the market level. In addition, many members seek to match their capital disposition by currency against their peak exposures.
The profile of the aggregate of the Lloyd’s market assets and liabilities, categorised by currency at their translated carrying amounts was as follows:
2018Sterling
£mUS dollar
£mEuro
£mCanadian $
£mAustralian $
£mOther
£mTotal
£m
Financial investments 9,743 40,258 2,640 5,061 1,758 903 60,363Reinsurers’ share of technical provisions 3,903 17,055 1,354 688 236 158 23,394Insurance and reinsurance receivables 2,869 12,399 935 425 269 254 17,151Cash at bank and in hand 3,360 6,072 724 323 134 264 10,877Other assets 1,416 3,770 615 257 100 65 6,223Total assets 21,291 79,554 6,268 6,754 2,497 1,644 118,008Technical provisions 15,169 50,449 6,280 3,829 1,590 1,001 78,318
Insurance and reinsurance payables 1,311 5,532 573 286 103 72 7,877
Other liabilities 2,834 1,872 (139) 156 40 (378) 4,385
Total liabilities 19,314 57,853 6,714 4,271 1,733 695 90,580
Total capital and reserves 1,977 21,701 (446) 2,483 764 949 27,428
2017Sterling
£mUS dollar
£mEuro
£mCanadian $
£mAustralian $
£mOther
£mTotal
£m
Financial investments 10,257 35,675 2,890 4,804 1,595 544 55,765
Reinsurers’ share of technical provisions 3,443 14,977 876 611 225 51 20,183Insurance and reinsurance receivables 2,547 10,598 774 453 228 203 14,803Cash at bank and in hand 4,511 6,107 765 237 221 296 12,137Other assets 1,238 3,704 472 258 84 (248) 5,508Total assets 21,996 71,061 5,777 6,363 2,353 846 108,396Technical provisions 13,942 46,286 5,089 3,785 1,506 662 71,270
Insurance and reinsurance payables 1,011 5,078 363 302 68 62 6,884
Other liabilities 1,770 1,846 (1) 21 10 (171) 3,475
Total liabilities 16,723 53,210 5,451 4,108 1,584 553 81,629
Total capital and reserves 5,273 17,851 326 2,255 769 293 26,767
Lloyd’s Annual Report 2018 55
Market Results Society ReportStrategic Report Other Information

4. Risk management continuedSensitivity analysisA 10% strengthening or weakening of the pound sterling against the following currencies at 31 December would have increased/(decreased) the result before tax and members’ balances for the financial year by the amounts shown below. This analysis assumes that all other variables, in particular interest rates, remain constant.
2018
Impact onresult
before tax£m
Impact on members’
balances£m
Strengthening of US dollar 421 2,586
Weakening of US dollar (345) (2,116)
Strengthening of euro (85) (44)
Weakening of euro 70 36
2017
Impact onresult
before tax£m
Impact on members’
balances£m
Strengthening of US dollar 257 2,061
Weakening of US dollar (211) (1,686)
Strengthening of euro (18) 40
Weakening of euro 15 (33)
The impact on the result before tax is different to the impact on members’ balance as the calculation of the notional return on members’ funds at Lloyd’s is not affected by currency movements.
Interest rate riskInterest rate risk is the risk that the value and future cash flows of a financial instrument will fluctuate because of changes in interest rates. Lloyd’s operates a generally conservative investment strategy with material cash and short-dated bonds portfolios, which reduces the interest rate risk exposure.
The analysis below is performed for reasonably possible movements in interest rates with all other variables held constant, showing the impact on the result before tax and equity of the effects of changes in interest rates.
2018
Impact onresult
before tax£m
Impact on members’
balances£m
+ 50 basis points (344) (484)
- 50 basis points 339 479
2017
Impact onresult
before tax£m
Impact on members’
balances£m
+ 50 basis points (351) (445)
- 50 basis points 347 440
Notes to the Pro Forma Financial Statements continued(For the year ended 31 December 2018)
56 Lloyd’s Annual Report 2018

Equity price riskEquity price risk is the risk that the fair value or future cash flows of a financial instrument will fluctuate because of changes in market prices (other than those arising from interest rate risk or currency risk), whether those changes are caused by factors specific to the individual financial instrument or its issuer, or factors affecting all similar financial instruments traded in the market.
Equity price risk exposure relates to financial assets and financial liabilities whose values will fluctuate as a result of changes in market prices, principally investment securities.
Such risks are managed by setting and monitoring objectives and constraints on investments, diversification plans and limits on investments in each sector and market.
In aggregate there is no significant concentration of equity price risk.
The analysis below is performed for reasonably possible movements in market indices on financial instruments with all other variables held constant, showing the impact on the result before tax due to changes in fair value of financial assets and liabilities (whose fair values are recorded in the profit and loss account) and members’ balances (that reflects adjustments to the result before tax and changes in fair value of available for sale financial assets that are equity instruments).
2018
Impact onresult
before tax£m
Impact on members’
balances£m
5% increase in equity markets 106 281
5% decrease in equity markets (106) (281)
2017
Impact onresult
before tax£m
Impact on members’
balances£m
5% increase in equity markets 107 280
5% decrease in equity markets (107) (280)
Concentration riskThe Corporation closely monitors concentrations of risk across the market and tests risk exposure against clearly defined risk appetites as established by the Board. Specialist supervisory teams across the Corporation monitor concentrations across the following areas: region perils, line of business, geographical location, method of distribution in insurance and investment counterparties, among others.
While syndicates define the type of business that they write, at the market level the Corporation seeks to avoid an inappropriate concentration of premium sources, monitoring concentration of business in poorly performing lines, material sources of premium by method of placement as well as coverholder concentration, which feature in metrics reported quarterly to the Board. Managing agents controlling more than 10% of overall market gross written premium are also subject to Board review. Any reported metrics outside of appetite are reported to and discussed by the Risk Committee and the Board. Specific and targeted actions can then be agreed, which will be discussed with specific managing agents or the market as a whole, as appropriate. These actions can vary considerably depending on the nature of the risk or the line of business impacted, with different levels of the requirements placed on syndicates, which forms part of the Corporation’s oversight role of the market.
Further analysis of premiums, claims, expenses and underwriting result by line of business is included within note 9 of the PFFS, with commentary on the performance of each line of business included on pages 28-35. Analysis of premium by geographical region is included both within note 9 of the PFFS (which details where contracts were concluded) as well as within the Lloyd’s line of business breakdown by region analysis in the “2018 At a Glance” section at the beginning of the Annual Report. Analysis of capital providers by source and location is also included in the “2018 At a Glance” section of the Annual Report. Analysis of investments held within the market is disclosed in note 13 of the PFFS.
Lloyd’s Annual Report 2018 57
Market Results Society ReportStrategic Report Other Information

4. Risk management continuedRegulatory riskRegulatory risk is the risk of loss owing to a breach of regulatory requirements or failure to respond to regulatory change. Managing agents monitor regulatory development to ensure ongoing compliance and any impact on claims reserves. Additionally, given current developments in the global regulatory landscape, the Corporation closely monitors changes that may adversely impact the global licence network. The Corporation is actively working with the market to assist and adapt to the changes in the UK regulatory architecture, in particular the increased focus on conduct risk by the Financial Conduct Authority; managing agents are now expected to comply with the Lloyd’s Conduct Minimum Standards. Similarly, the Corporation monitors global political trends and is taking action at both a market and Society level in response to a growing geopolitical risk facing companies operating around the world.
Operational riskOperational risk is the risk of loss resulting from inadequate or failed internal processes, people and systems, or from external events. Managing agents manage these risks through internal compliance monitoring and the use of detailed procedure manuals. The Corporation sets minimum standards to be applied by agents and monitors to ensure these are met.
Group riskGroup risk is the risk of loss resulting from risk events arising within a related entity. While Lloyd’s is not a group, the Corporation monitors potential risks that could impact Lloyd’s, for example arising from the activities of a parent company of a syndicate or managing agent. While, by its nature, group risk is difficult to control, the Corporation mitigates the potential impact of group risk through the implementation of controls, including Lloyd’s minimum standards, mitigating any material impairment to Lloyd’s brand, reputation or strategic priorities.
5. VariabilityCalendar year movements in reserves are based upon best estimates as at 31 December 2018, taking into account all available information as at the balance sheet date. These estimates are subject to variability until the date at which the underlying claims are settled. Such changes in best estimate are reflected in the technical account of the year in which they occur. The aggregate of the prior year surpluses/deficiencies is a surplus of £976m (2017: £706m). The surplus arises across all lines of business, except for the marine line of business, reflecting favourable claims development compared with projections in these classes.
6. Members’ funds at Lloyd’s (FAL)The valuation of members’ FAL in the balance sheet totals £26,483m (2017: £24,579m). The notional investment return on FAL included in the non-technical profit and loss account totals £178m (2017: £722m).
The notional investment return on FAL has been calculated by applying quarterly yields from indices, net of management fees, to the value of FAL at the beginning of each quarter except, where the Society is the investment manager for FAL, in which case the actual return achieved has been included. A significant proportion of FAL investments are US dollar denominated and, for these assets, US dollar yields from indices are applied.
The following table shows the indices used and the return applied for the full year.
Proportionof FAL
Investmentreturn
Investment type Index
December2018
%
December2017
%2018
%2017
%
UK equities FTSE All share 4.1 4.9 (9.9) 12.0
UK government bonds UK Gilts 1-3 years 2.1 2.1 0.1 (0.6)
UK corporate bonds UK Corporate 1-3 years 4.4 5.0 0.2 (0.4)
UK deposits managed by Lloyd’s Return achieved 4.6 3.8 1.8 0.5
UK deposits managed externally including letters of credit GBP LIBID 1 month 12.1 18.5 0.3 0.0
US equities S&P 500 Index 8.1 9.9 (2.7) 19.7
US government bonds US Treasuries 1-5 years 15.5 12.8 1.5 0.5
US corporate bonds US Corporate 1-5 years 25.5 17.8 1.2 1.9
US deposits managed by Lloyd’s Return achieved 5.8 5.1 7.7 3.7
US deposits managed externally including letters of credit USD LIBID 1 month 17.8 20.1 1.7 0.8
Notes to the Pro Forma Financial Statements continued(For the year ended 31 December 2018)
58 Lloyd’s Annual Report 2018

7. Society of Lloyd’s (the Society)The results of the Group financial statements of the Society included in the profit and loss account are a profit of £460m (2017: £442m) in the technical account and a loss of £266m (2017: a loss of £257m) in the non-technical account.
8. Aggregation of results and net assetsA reconciliation between the results, statement of other comprehensive income and net assets reported in the syndicate annual accounts, members’ FAL and by the Society is set out below:
Profit and loss account2018
£m2017
£m
Result per syndicate annual accounts (1,373) (2,908)
Result of the Society 163 156
Central Fund claims and provisions incurred in Society financial statements – –
Taxation charge in the Society financial statements 39 31
Notional investment return on members’ funds at Lloyd’s 178 722
Movement in Society income not accrued in syndicate annual accounts (8) (2)
Result for the financial year before tax (1,001) (2,001)
Capital and reserves2018
£m2017
£m
Net assets per syndicate annual accounts (1,475) (1)
Net assets of the Society 2,417 2,188
Central Fund claims and provisions – –
Members’ funds at Lloyd’s 26,483 24,579
Unpaid cash calls reanalysed from debtors to members’ balances 40 30
Society income receivable not accrued in syndicate annual accounts (37) (29)
Total capital and reserves 27,428 26,767
Transactions between syndicates and the Society (which have been reported within both the syndicate annual accounts and the Society financial statements) have been eliminated in the PFFS as set out in note 2.
Lloyd’s Annual Report 2018 59
Market Results Society ReportStrategic Report Other Information

9. Segmental analysisThe syndicate returns to the Corporation provided additional information to derive the following table in respect of the lines of business reviewed in the market commentary.
2018
Gross written
premiums£m
Net earned
premium£m
Net incurred
claims£m
Net operatingexpenses
£m
Under- writing
result£m
Reinsurance 11,070 7,650 (5,524) (2,582) (456)Property 9,687 6,692 (4,319) (3,073) (700)
Casualty 9,094 6,363 (3,696) (2,850) (183)
Marine 2,603 2,154 (1,580) (917) (343)Energy 1,404 897 (392) (392) 113Motor 1,037 940 (607) (321) 12Aviation 549 410 (292) (167) (49)Life 83 72 (28) (28) 16
Total from syndicate operations 35,527 25,178 (16,438) (10,330) (1,590)
Transactions between syndicates and the Society (notes 2 and 7) and insurance operations of the Society
460 460
PFFS premiums and underwriting result 35,527 25,178 (16,438) (9,870) (1,130)Allocated investment return transferred from the non-technical account 367
Balance on the technical account for general business (763)
2017
Gross written
premiums£m
Net earned
premium£m
Net incurred
claims£m
Net operatingexpenses
£m
Under- writing
result£m
Reinsurance 10,560 7,751 (6,498) (2,583) (1,330)
Property 8,965 6,367 (5,137) (2,987) (1,757)Casualty 8,464 6,082 (3,558) (2,713) (189)Marine 2,506 2,092 (1,674) (887) (469)Energy 1,253 783 (277) (401) 105Motor 1,057 843 (723) (308) (188)Aviation 687 509 (320) (200) (11)Life 99 71 (63) (32) (24)Total from syndicate operations 33,591 24,498 (18,250) (10,111) (3,863)Transactions between syndicates and the Society (notes 2 and 7) and insurance operations of the Society
442 442
PFFS premiums and underwriting result 33,591 24,498 (18,250) (9,669) (3,421)Allocated investment return transferred from the non-technical account 732Balance on the technical account for general business (2,689)
The geographical analysis of direct insurance premiums by location where contracts were concluded is as follows:
2018£m
2017£m
United Kingdom 24,063 22,651
Other EU member states 38 29
Rest of the World 356 351
24,457 23,031
Notes to the Pro Forma Financial Statements continued(For the year ended 31 December 2018)
60 Lloyd’s Annual Report 2018

10. Life businessThe PFFS include the results of all life and non-life syndicates transacting business during 2018. The results and net assets for life syndicates are not material and have not been separately disclosed in the profit and loss account and balance sheet. The results for life business are reported in the segmental analysis (note 9).
11. Net operating expenses
2018£m
2017£m
Acquisition costs 9,033 8,645
Change in deferred acquisition costs (171) (239)
Administrative expenses 2,270 2,307
Reinsurance commissions and profit participation (1,262) (1,044)
9,870 9,669
Total commissions on direct insurance business accounted for in the year amounted to £6,100m (2017: £5,773m).
12. Investment return
Interest and similar income2018
£m2017
£m
From financial instruments designated as at fair value through profit or loss 836 1,356
From available for sale investments 39 35
From financial instruments designated as held to maturity – 1
Dividend income 48 37
Interest on cash at bank 50 23
Other interest and similar income 30 35
Investment expenses (45) (72)
Total 958 1,415
Other income from investments designated as at fair value through profit or loss2018
£m2017
£m
Realised gains/(losses) (17) 261
Unrealised gains/(losses) (464) 89
Other relevant income/(losses) 27 35
Total (454) 385
Total investment return 504 1,800
Lloyd’s Annual Report 2018 61
Market Results Society ReportStrategic Report Other Information

13. Financial investments
2018£m
2017£m
Shares and other variable yield securities 8,550 9,474
Debt securities and other fixed income securities 41,679 37,197
Participation in investment pools 2,254 2,118
Loans and deposits with credit institutions 7,800 6,841
Other investments 80 135
60,363 55,765
Disclosures of fair values in accordance with the fair value hierarchyFair value measurements have been classified using a fair value hierarchy that reflects the significance of the inputs used in making the measurements.
The fair value hierarchy includes the following classifications:
— Level 1 – Quoted prices (unadjusted) in active markets for identical assets. An active market is one in which transactions for the asset occur with sufficient frequency and volume to provide readily and regularly available quoted prices;
— Level 2 – Inputs to a valuation model other than quoted prices included within Level 1 that are observable for the asset, either directly (ie as prices) or indirectly (derived from prices); and
— Level 3 – Inputs to a valuation model for the asset that are not based on observable market data (unobservable inputs) and are significant to the overall fair value measurement. Unobservable inputs may have been used to measure fair value to the extent that observable inputs are not available, thereby allowing for situations in which there is little, if any, market activity for the asset at the measurement date (or market information for the inputs to any valuation models). As such, unobservable inputs reflect the assumptions it is considered that market participants would use in pricing the asset.
The level in the fair value hierarchy within which the fair value measurement is categorised in its entirety is determined on the basis of the lowest level input that is significant to the fair value measurement. The significance of an input is assessed against the fair value measurement in its entirety. If a fair value measurement uses observable inputs that require significant adjustment based on unobservable inputs, that measurement is a Level 3 measurement. Assessing the significance of a particular input to the fair value measurement in its entirety requires judgement, considering factors specific to the asset.
2018Level 1
£mLevel 2
£mLevel 3
£m
Sub-total fair value
£m
Assets held at amortised
cost£m
Total£m
Shares and other variable yield securities 3,546 4,229 774 8,549 1 8,550
Debt and other fixed income securities 14,087 27,572 20 41,679 – 41,679
Participation in investment pools 2,013 222 19 2,254 – 2,254
Loans and deposits with credit institutions 4,232 3,400 168 7,800 – 7,800
Other investments 9 46 25 80 – 80
Total investments 23,887 35,469 1,006 60,362 1 60,363Loans recoverable – – 36 36 – 36
Total assets 23,887 35,469 1,042 60,398 1 60,399
Borrowings (4) – (14) (18) – (18)
Derivative liabilities (10) (20) (1) (31) – (31)
Total liabilities (14) (20) (15) (49) – (49)
Loans recoverable represent loans made to hardship members by the Central Fund, with further details disclosed in the Society Report (note 2 and note 16).
Notes to the Pro Forma Financial Statements continued(For the year ended 31 December 2018)
62 Lloyd’s Annual Report 2018

2017Level 1
£mLevel 2
£mLevel 3
£m
Sub-total fair value
£m
Assets held at amortised
cost£m
Total£m
Shares and other variable yield securities 3,797 4,865 811 9,473 1 9,474
Debt and other fixed income securities 12,094 25,022 81 37,197 – 37,197
Participation in investment pools 1,875 211 32 2,118 – 2,118
Loans and deposits with credit institutions 3,325 3,333 181 6,839 2 6,841
Other investments 6 100 29 135 – 135
Total investments 21,097 33,531 1,134 55,762 3 55,765Loans recoverable – – 43 43 – 43
Total assets 21,097 33,531 1,177 55,805 3 55,808
Borrowings (11) – – (11) –– (11)
Derivative liabilities (1) (19) – (20) – (20)
Total liabilities (12) (19) – (31) – (31)
14. Debtors arising out of direct operations
2018£m
2017£m
Due within one year
— Policyholders 1 1
— Intermediaries 9,569 8,781
Due after one year
— Policyholders – –
— Intermediaries 103 100
Total 9,673 8,882
15. Debtors arising out of reinsurance operations
2018£m
2017£m
Due within one year 6,659 5,245
Due after one year 819 676
Total 7,478 5,921
16. Cash at bank and in handCash at bank and in hand includes letters of credit and bank guarantees held in trust within members’ FAL to meet policyholder claims as required, totalling £8,012m (2017: £9,463m).
Lloyd’s Annual Report 2018 63
Market Results Society ReportStrategic Report Other Information

17. Members’ balances
2018£m
2017£m
Balance at 1 January – 4,015
Result for the year per syndicate annual accounts (1,373) (2,908)
Distribution on closure of the 2015 (2014) year of account (1,656) (2,670)
Advance distributions from open years of account (29) (60)
Movement in cash calls 834 1,041
Net movement on funds in syndicate (see note below) 825 774
Exchange (losses)/gains (50) (116)
Other (23) (76)
Balance at 31 December (1,472) –
Members participate on syndicates by reference to years of account. Members’ ultimate results, assets and liabilities are assessed by year of account with reference to policies incepting in that year of account. Members’ balances represent the net profit/(loss) to be distributed/(collected) by syndicates to/(from) the members. Where there are profits and funds at Lloyd’s held in excess of members’ capital requirements, they will be distributed in the second quarter of 2019.
Members that only participate on one syndicate may hold the capital supporting their underwriting in their syndicate’s premium trust funds. These funds are known as funds in syndicate (FIS). At 31 December 2018 there was £5,053m (2017: £4,076m) of FIS within members’ balances. Where a member takes advantage of this facility in the year, the movement is reflected in the above table as “net movement on funds in syndicate”.
18. Technical provisions(a) Provisions for unearned premiums
2018Gross
£m
Reinsurers’share
£mNet£m
At 1 January 16,377 3,372 13,005
Premiums written in the year 35,527 9,846 25,681
Premiums earned in the year (34,738) (9,560) (25,178)
Exchange movements 702 195 507
At 31 December 17,868 3,853 14,015
2017Gross
£m
Reinsurers’share
£mNet£m
At 1 January 16,548 3,110 1 3,438
Premiums written in the year 33,591 8,722 24,869
Premiums earned in the year (32,744) (8,246) (24,498)
Exchange movements (1,018) (214) (804)
At 31 December 16,377 3,372 13,005
(b) Deferred acquisition costs
2018£m
2017£m
At 1 January 4,304 4,278
Change in deferred acquisition costs 171 239
Exchange movements 173 (232)
Other 32 19
At 31 December 4,680 4,304
Notes to the Pro Forma Financial Statements continued(For the year ended 31 December 2018)
64 Lloyd’s Annual Report 2018

(c) Claims outstanding
2018Gross
£m
Reinsurers’share
£mNet£m
At 1 January 54,893 16,811 38,082
Claims paid during the year (19,666) (5,682) (13,984)
Claims incurred during the year 24,561 8,123 16,438
Exchange/other movements 662 289 373
At 31 December 60,450 19,541 40,909
2017Gross
£m
Reinsurers’share
£mNet£m
At 1 January 47,747 11,310 36,437
Claims paid during the year (18,292) (3,634) (14,658)
Claims incurred during the year 28,060 9,810 18,250
Exchange/other movements (2,622) (675) (1,947)
At 31 December 54,893 16,811 38,082
19. Discounted claimsDiscounting may be applied to claims provisions where there are individual claims with structured settlements that have annuity-like characteristics or for books of business with mean term payment greater than four years. Certain syndicates have elected to discount their claims provisions.
The claims have been discounted as follows:
Average discounted ratesAverage mean term
of liabilities
Line of business2018
%2017
%2018
years2017
years
Motor (third party liability) 2.41 2.46 26.12 24.55
Motor (other classes) 2.98 3.00 2.29 2.60
Third party liability 2.57 2.32 22.45 22.96
The period that will elapse before claims are settled is determined using impaired mortality rates.
The claims provisions before discounting are as follows:
Before discounting Effect of discounting Discounted provision
2018£m
2017£m
2018£m
2017£m
2018£m
2017£m
Total claims provisions 1,429 1,649 (333) (430) 1,096 1,219
Reinsurers’ share of total claims 398 549 (63) (78) 335 471
Lloyd’s Annual Report 2018 65
Market Results Society ReportStrategic Report Other Information

20. Creditors arising out of direct insurance operations
2018£m
2017£m
Due within one year 1,322 953
Due after one year 3 2
1,325 955
21. Creditors arising out of reinsurance operations
2018£m
2017£m
Due within one year 5,884 5,332
Due after one year 668 597
6,552 5,929
22. Note to the statement of cash flowsCash and cash equivalents comprise the following:
2018£m
2017£m
Cash at bank and in hand 10,877 12,137
Short term deposits with credit institutions 1,731 2,146
Overdrafts (213) (170)
12,395 14,113
Of the cash and cash equivalents, £326m (2017: £548m) is held in regulated bank accounts in overseas jurisdictions.
23. Five year summary
Results2018
£m2017
£m2016
£m2015
£m2014
£m
Gross written premiums 35,527 33,591 29,862 26,690 25,259
Net written premiums 25,681 24,869 23,066 21,023 20,006
Net earned premiums 25,178 24,498 22,660 20,565 19,499
Result attributable to underwriting (1,130) (3,421) 468 2,047 2,253
Result for the year before tax (1,001) (2,001) 2,107 2,122 3,016
Assets employedCash and investments 71,240 67,902 67,646 56,900 54,889
Net technical provisions 54,924 51,087 49,875 41,578 40,025
Other net assets 11,112 9,952 9,943 8,894 7,664
Capital and reserves 27,428 26,767 27,714 24,216 22,528StatisticsCombined ratio (%) 104.5 114.0 97.9 90.0 88.4
Return on capital (%) (3.7) (7.3) 8.1 9.1 14.1
24. Related party transactionsThe annual accounts of each syndicate provide, where appropriate, the required disclosures on related parties. Syndicate level disclosures are specific to that syndicate and its managing agent. For 2018, there were no material related party transactions conducted outside normal market conditions reported in the syndicate annual accounts requiring disclosure. The related party transactions of the Society are disclosed in note 27 on page 180.
Notes to the Pro Forma Financial Statements continued(For the year ended 31 December 2018)
66 Lloyd’s Annual Report 2018

Managing Agents and Syndicates
Managing AgentManaged
Syndicate(s)
2018GWP*
£m
2018Result
£m
2018Combined Ratio*
%
Advent Underwriting Limited 780 185 (16) 123%
AEGIS Managing Agency Limited 1225 555 28 97%
Allied World Managing Agency Limited 2232 225 3 101%
AmTrust Syndicates Limited 44 18 (1) 107%
779 6 (1) 127%
1206 53 (15) 113%
1861 616 2 101%
2526 – 5 739%
5820 69 3 99%
Antares Managing Agency Limited 1274 438 (32) 108%
Apollo Syndicate Management Limited 1969 313 (45) 126%
6133 44 (21) 192%
Arch Underwriting at Lloyd’s Ltd 2012 232 (1) 98%
Argenta Syndicate Management Limited 2121 398 (38) 114%
6134 31 (3) 120%
Argo Managing Agency Limited 1200 589 (36) 108%
1910 364 8 95%
6117 83 3 96%
Ark Syndicate Management Limited 3902 97 – 101%
4020 269 (13) 105%
Ascot Underwriting Limited 1414 680 44 91%
Aspen Managing Agency Limited 4711 388 (25) 111%
Asta Managing Agency Limited 1729 128 (3) 104%
1897 68 (15) 121%
1980 188 (30) 176%
2357 443 (125) 161%
2525 70 9 83%
2689 102 (13) 116%
2786 116 (12) 108%
3268 89 (19) 151%
4242 160 (55) 168%
5886 148 (17) 118%
6123 19 (11) 235%
6126 3 (8) 148%
6131 3 (1) 193%
Atrium Underwriters Limited 609 503 33 93%
AXIS Managing Agency Limited 1686 313 (32) 118%
2007 946 (87) 116%
6129 72 (52) 224%
Barbican Managing Agency Limited 1856 144 (7) 106%
1955 434 (10) 110%
6118 143 (7) 109%
6132 40 (3) 121%
Beaufort Underwriting Agency Limited 318 177 (56) 136%
Beazley Furlonge Limited 623 357 6 97%
2623 1,625 69 96%
3622 18 2 89%
3623 (25) (8) 118%
5623 6 – 106%
Lloyd’s Annual Report 2018 67
Market Results Society ReportStrategic Report Other Information

Managing AgentManaged
Syndicate(s)
2018GWP*
£m
2018Result
£m
2018Combined Ratio*
%
Beazley Furlonge Limited (continued) 6050 – 2 70%
6107 51 (2) 109%
Brit Syndicates Limited 2987 1,655 (48) 105%
2988 107 (22) 128%
Canopius Managing Agents Limited 4444 1,249 (74) 108%
Capita Managing Agency Limited 1492 130 2 98%
Cathedral Underwriting Limited 2010 217 (24) 119%
3010 64 1 99%
Catlin Underwriting Agencies Limited 2003 2,261 (250) 116%
2088 189 (26) 119%
3002 43 2 93%
6111 34 (9) 126%
6112 1 (1) 126%
6119 – – 133%
6121 2 – 118%
Charles Taylor Managing Agency Limited 1884 104 (57) 160%
Chaucer Syndicates Limited 1084 962 (18) 103%
1176 29 22 31%
6130 21 1 89%
Chubb Underwriting Agencies Limited 1882 (2) 9 217%
2488 440 34 90%
Coverys Managing Agency Limited 1110 12 7 79%
1975 36 (3) 114%
1991 149 (15) 111%
3330 – (3) 703%
Endurance at Lloyd’s Limited 5151 358 (9) 107%
ERS Syndicate Management Limited 218 329 11 96%
Faraday Underwriting Limited 435 470 25 98%
Hamilton Underwriting Limited 3334 135 (23) 133%
Hardy (Underwriting Agencies) Limited 382 373 (15) 105%
HCC Underwriting Agency Ltd 4141 161 17 85%
Hiscox Syndicates Limited 33 1,385 99 88%
3624 338 10 99%
6104 36 (11) 131%
Liberty Managing Agency Limited 4472 1,386 (7) 99%
Managing Agency Partners Limited 2791 179 9 94%
6103 17 (1) 109%
Markel Syndicate Management Limited 3000 515 (15) 106%
MS Amlin Underwriting Limited 2001 2,372 (114) 111%
3210 24 (30) 188%
Munich Re Syndicate Limited 457 523 35 92%
Navigators Underwriting Agency Limited 1221 332 (4) 105%
Neon Underwriting Limited 2468 405 (48) 120%
Newline Underwriting Management Limited 1218 152 (16) 91%
Pembroke Managing Agency Limited 1947 24 (12) 218%
Managing Agents and Syndicates continued
68 Lloyd’s Annual Report 2018

Managing AgentManaged
Syndicate(s)
2018GWP*
£m
2018Result
£m
2018Combined Ratio*
%
Pembroke Managing Agency Limited (continued) 2014 200 (17) 112%
4000 423 24 95%
6125 21 (7) 144%
QBE Underwriting Limited 386 351 31 92%
2999 1,192 26 98%
RenaissanceRe Syndicate Management Limited 1458 564 (6) 103%
RiverStone Managing Agency Ltd 3500 207 6 94%
S.A. Meacock & Company Limited 727 73 11 90%
Sirius International Managing Agency Limited 1945 100 (11) 110%
Starr Managing Agents Limited 1919 297 (4) 110%
StarStone Underwriting Limited 1301 249 (89) 177%
2008 971 4 99%
Talbot Underwriting Ltd 1183 713 (48) 111%
The Channel Managing Agency Limited 2015 313 (54) 126%
Tokio Marine Kiln Syndicates Limited 308 12 3 87%
510 1,377 (23) 103%
557 16 6 59%
1880 271 1 100%
Travelers Syndicate Management Limited 5000 354 (30) 110%
Vibe Syndicate Management Limited 5678 121 (12) 110%
W R Berkley Syndicate Management Limited 1967 190 (10) 110%
Market level SPA, RITC and aggregation adjustments (note 2, note 8) (1,699) 372
Total 35,527 (1,001) 104.5%
* Refer to glossary on page 185 for further information.
The following syndicates ceased trading at 31 December 2018:
AmTrust Syndicates Limited 44 Advent Underwriting Limited 780 Charles Taylor Managing Agency Limited 1884 Axis Managing Agency Limited 2007 Catlin Underwriting Agencies Limited 6111 Barbican Managing Agency Limited 6118 Axis Managing Agency Limited 6129 Chaucer Syndicates Limited 6130
As at 26 March 2019 the following syndicates commenced trading for the 2019 year of account:
Apollo Syndicate Management Limited 1971
Lloyd’s Annual Report 2018 69
Market Results Society ReportStrategic Report Other Information

70 Lloyd’s Annual Report 2018

Society ReportLloyd’s excellent financial strength gives our customers confidence in our ability to provide support when it is needed most.
Contents72 Financial Highlights73 Corporate Governance82 The Council87 The Board90 Internal Control Statement92 Report of the Remuneration
Committee105 Report of the Audit Committee108 Report of the Lloyd’s Members’
Ombudsman109 Financial Review116 Statement of the Council’s
Responsibilities for the Financial Statements
117 Independent Auditor’s Report to the Members of the Society of Lloyd’s
122 Group Income Statement123 Group Statement of
Comprehensive Income124 Group Statement of Financial
Position125 Group Statement of Changes
in Equity126 Group Statement of Cash Flows127 Notes to the Financial Statements181 Five Year Summary
Market ResultsStrategic Report Society Report Other Information
Lloyd’s Annual Report 2018 71

Financial Highlights
2018£m
2017£m
2016£m
2015£m
2014£m
Operating result
Corporation operating income 352 351 332 239 220
Central Fund income 149 125 120 111 115
Total income 501 476 452 350 335
Central Fund claims and provisions incurred – – (8) – (1)
Central Fund repayment to members – – – – (49)
Net insurance claims and provisions – – – – 1
Other Group operating expenses (362) (306) (307) (259) (227)
Operating surplus1 139 170 137 91 59
Finance costs
Deficit on subordinated debt repurchase – – – – (9)
Interest payable on financial liabilities and other (39) (55) (54) (54) (49)
Finance income2 93 62 314 43 93
Realised/unrealised exchange gains on borrowings – – – – 7
Share of profits of associates 9 10 8 7 8
Surplus before tax 202 187 405 87 109
Tax charge (39) (31) (75) (13) (18)
Surplus for the year 163 156 330 74 91
Balance sheet
Net assets 2,417 2,188 1,996 1,763 1,693
Movement in net assets % 10.5% 9.6% 13.2% 4.1% 3.6%
Solvency
Eligible central own funds to meet Central SCR 3,494 3,445 3,433 3,162 –
Central SCR (1,400) (1,600) (1,600) (1,450) –
Excess of eligible central own funds over the Central SCR 2,094 1,845 1,833 1,712 –
Solvency ratio % 250% 215% 215% 218% –
The solvency ratio is reported under the Solvency II legislative requirements which came into force on 1 January 2016. The 2018 position is an estimate of the amount which will be finalised in April 2019 for submission to the PRA. The solvency figures in the table above are unaudited.
1. The operating surplus is a metric which is consistently used to analyse financial performance in the Society Report. This metric (wherever used in the Annual Report) is an Alternative Performance Measure (APM), with further information available on page 184.
2. The Society’s investments, mostly held within the Central Fund, returned £93m or 2.4% during the year (2017: £62m, 1.7%). Excluding the impact of a £100m foreign exchange gain in 2018 (2017: foreign exchange loss of £108m), arising from currency matching assets to the US dollar component of the Central Solvency Capital Requirement, underlying investment returns were lower, returning a loss of £7m or -0.2% in 2018 (2017: £170m gain or 4.6%).
72 Lloyd’s Annual Report 2018

Corporate Governance
Lloyd’s governance structure provides challenge, clarity and accountabilityPrincipal Committees structure
The Council and BoardThe Council is the governing body of the Society of Lloyd’s (Society) and has ultimate responsibility for overall management of the market. The Council delegates many of its functions to the Board, whose members are appointed by the Council and come from both inside and outside the Lloyd’s market.
The day to day powers and functions of the Council and Board are carried out by the Corporation’s Executive Committee – the Chief Executive Officer, Chief Financial Officer, Chief Operating Officer, Chief Risk Officer, Chief People Officer, General Counsel and Company Secretary, Performance Management Director and Market Development Director (who is in the process of being recruited).
Lloyd’s is regulated by the PRA and FCA, which have direct supervision of managing agents and monitor capital, solvency and conduct. The Corporation is active in managing risk within the market to ensure that Lloyd’s central assets, brand, licences and reputation remain protected.
The Council is committed to the principle of good corporate governance and supports the application of the principles of the UK Corporate Governance Code, as far as they can be applied to the governance of a Society of members and a market of separate entities.
The Councilof Lloyd’s
The Board
RemunerationCommittee
Nominations & GovernanceCommittee
InnovationInvestment Committee
InvestmentCommittee
CapacityTransfer Panel
AuditCommittee
Market Supervision and Review Committee
RiskCommittee
The members of the Council and Board are listed on pages 82 to 89Details of the Executive Committee can be found at: https://www.lloyds.com/about-lloyds/governance-and-management/executive-team
Lloyd’s Annual Report 2018 73
Market ResultsStrategic Report Society Report Other Information

Chairman and Deputy ChairmenIn accordance with Lloyd’s Act 1982, the Chairman and Deputy Chairmen of Lloyd’s are elected annually by special resolution of the Council from among its members. One of the Chairman and Deputy Chairmen must be a working member of the Council. This position is currently filled by Simon Beale.
The Chairman of Lloyd’s is contracted to work three days a week but commits as much time as is necessary to undertake the role. The Council acknowledges that the Chairman has other commitments outside Lloyd’s (see page 82) and is satisfied that these can be accommodated with the Chairmanship of Lloyd’s.
Andy Haste (a nominated member) was appointed Senior Independent Deputy Chairman (Lloyd’s equivalent of the Senior Independent Director) with effect from 1 November 2012.
MeetingsThe Council met on seven occasions in 2018. These meetings are structured to allow open discussion. At each meeting the Council receives certain regular reports – for example, a written report from the Chief Executive Officer and oral updates from its principal committees.
A table showing Council members’ attendance at Council and Committee meetings which they were eligible to attend is set out on pages 80 to 81.
The detailed arrangements for Lloyd’s governance processes are set out in the Council’s Governance Policies and the Constitutional Requirements as set out in the Constitutional Arrangements Byelaw (No.2 of 2010).
Governance Policies and the Constitutional RequirementsThe Governance PoliciesAmong other matters, the Governance Policies are intended to improve the clarity around the role of the Council and to establish a more structured relationship with the Board.
Under the Governance Policies, the Council is responsible for assessing the long-term strategic development of Lloyd’s by reference to both the interests of capital providers and other stakeholders and through an evaluation of economic, political and social issues impacting the international insurance and reinsurance markets.
Governing body: The CouncilUnder Lloyd’s Act 1982, the Council undertakes the management and superintendence of the affairs of the Society and has the power to regulate and direct the business of insurance at Lloyd’s. Certain functions are reserved to the Council including:
— the making, amendment or revocation of byelaws (which are available at www.lloyds.com/byelaws);
— the setting of Central Fund contribution rates; and
— appointing the Chairman and Deputy Chairmen of Council.
Beyond the reserved functions, the Council can delegate its powers or functions to any person, committee or employee of the Society.
The Council has delegated authority for the day to day management of the market to the Board. The Board is able, in turn, to sub-delegate authority to the Chief Executive Officer and through him to the Lloyd’s Executive. In addition, the Council has delegated authority to carry out specified functions to committees including the Remuneration and Nominations & Governance Committees, as summarised below.
The relationship between the Council and the Board is defined in the Council’s Governance Policies which clarify the role of the Council and establish a more structured relationship with the Board. Further details on the role and functions of the Board and the Governance Policies are set out below.
MembershipThe Council comprises a maximum of 18 members, split between six working, six external and six nominated members. The biographical details of the current members of the Council (as at 26 March 2019) are listed on pages 82 to 86.
Nominated members are usually appointed for three-year terms which can be renewed. They may be regarded, for the purposes of the Code, as independent members of the Council with the exception of the Chairman and Chief Executive Officer who are included within their number.
Working and external members are generally elected for terms of three years by the working and external members of the Society respectively. In the elections for working members, voting operates on a one member, one vote basis. In the elections for external members, the voting entitlement of an external member of the Society is based on the member’s allocated underwriting capacity as determined under the Constitutional Arrangements Byelaw (No.2 of 2010).
The presence of working and external members of the Council enables the nominated members to gain an understanding of the views of key stakeholders in the Lloyd’s market.
Other than the Chief Executive Officer, no member of Council may serve more than nine years in aggregate on the Council or Board.
Corporate Governance continued
74 Lloyd’s Annual Report 2018

The Board has reserved to itself a list of specific functions and powers that only it may deal with. The Board may sub-delegate authority to the Chief Executive Officer, executive and employees of the Corporation save in respect of those functions and powers reserved to it, the Council and their committees.
The Board’s committees, the Chief Executive Officer, the executive and employees must act in accordance with the Board Limitations (including the Principles) and in accordance with the strategy, policy and principles set by the Board.
Matters reserved to the Board include:
— setting the policy and principles relating to the supervision, regulation and direction of the business of insurance at Lloyd’s (the Market Supervision Framework), in compliance with PRA and FCA requirements;
— considering and approving Lloyd’s risk appetite (both at Corporation and market level); setting policy for the admission and removal of participants in the Lloyd’s market;
— admitting and removing managing agents;
— determining the Standards for managing agents and approving the Three-Year and Annual Plan and Budget of the Corporation; and
— approving the Lloyd’s Society level capital requirements.
Membership and meetingsBiographical details of the members of the Board as at 26 March 2019 are listed on pages 87 to 89. At the end of 2018, the Board comprised:
— the Chairman of Lloyd’s (who was also its Chairman);
— the Chief Executive Officer, the Performance Management Director and the Chief Financial Officer;
— Three non-executives connected with the Lloyd’s market; and
— Six independent non-executives.
The presence of market connected Non-Executive Directors enables the independent non-executives to gain an understanding of market practitioner views and perspectives.
Other than the Lloyd’s Executives no member of the Board may serve more than nine years in aggregate on the Board or the Council.
The Board held ten scheduled meetings in 2018. It also held a full day offsite focusing on the major strategic challenges facing Lloyd’s and their impact on Lloyd’s current strategy. Two workshops were also held together with some further meetings.
Board meetings are structured to allow open discussion. At each scheduled meeting, the Board receives certain regular reports – for example, a written report from the Chief Executive Officer. It also reviews the quarterly Management Information Pack. The Board papers and minutes are made available to members of the Council.
A table showing Board members’ attendance at Board and Committee meetings which they were eligible to attend is set out on pages 80 to 81.
As the Council has delegated authority for the majority of its functions (other than its reserved matters) to the Board, the Governance Policies also define the accountability linkage between the Board and the Council. This includes determining the boundaries within which the Board will operate (the Board Limitations) and establishing a Monitoring and Assurance regime which, among other matters, requires the Chairman of the Board to report to the Council on all material issues impacting the world insurance market and Lloyd’s as well as providing a summary of key performance indicators.
The Constitutional RequirementsThe Constitutional Requirements align, so far as appropriate, Lloyd’s governance arrangements with the Companies Act 2006. They include provisions concerning the duties and responsibilities of Council members. These same duties also apply to members of the Board and the other Lloyd’s committees.
In summary, members of the Council, Board and their committees are required to act in a way which “would be most likely to promote the success of the Society for the benefit of the members as a whole” and must have regard to:
— The likely consequences of any decision in the long term.
— The needs of the Society:
— to foster business relations with those who do business at Lloyd’s;
— to have regard to the interests of its employees;
— to consider the impact of its operations on the community and the environment; and
— to maintain a reputation for high standards of business conduct.
The Constitutional Requirements also deal with conflicts of interest and collective responsibility.
BoardThe Council established the Board as from 1 January 2003.
Specific functions delegated to the Board include:
— determining the major risks to the Lloyd’s market and determining appropriate action to address or mitigate those risks;
— determining the key factors, levers and drivers which may affect the profitability of the Lloyd’s market;
— developing and implementing a strategy to achieve the Corporation goals; and
— supervising, regulating and directing the business of insurance at Lloyd’s.
Lloyd’s Annual Report 2018 75
Market ResultsStrategic Report Society Report Other Information

— To appoint Christian Noyer as a Nominated member of Council for an initial term of three years with effect from 2 November 2018. Following a review of the skills and composition of the Council, this appointment satisfied the requirement for the Council to obtain representation with experience of operating in Continental Europe;
— To appoint Neil Maidment as an independent Non-Executive Director of the Board following his retirement from Beazley Plc and therefore, as a working member of the Council with effect from 31 January 2019. Neil Maidment’s independence is retained subject to him being recused from matters relating to Beazley Plc. Neil Maidment’s appointment to the Board provided succession to the vacancy created by Sir Andrew Cahn’s departure; and
— After an extensive search of candidates, to appoint Burkhard Keese as the Chief Financial Officer with effect from 1 April 2019;
The Committee’s recommendations were supported and approved by the Council.
With regards to the first quarter of 2019, the Committee made the recommendation to appoint John Sununu as a Nominated member of Council to satisfy the need for an individual with experience operating within the US and within the financial and regulatory environment. The position became available following the departure of Gregory Fleming.
The Committee was assisted by external search consultants for the previously mentioned Board, Council and C-Suite appointments throughout the year, with the exclusion of the appointment of Neil Maidment to the Board. In all instances, the external search agents had no connection to the Society.
To assist with succession planning, the Committee also considered the future skills, knowledge and experience likely to be needed by the Board and the Council.
Diversity – The Committee is very focused on the need for recent and relevant experience in the appointments it recommends and is equally focused on increasing the diversity of its membership especially with respect to the appointment of female Board members. It is difficult to establish diversity targets for the Council, given that it is two-thirds elected, but diversity of candidates offering themselves for election is encouraged. Candidates for appointed positions are selected on merit and with due regard to the benefits of diversity in its broadest sense. In addition, the Board, with the support of the Committee, established a target of 30% of the Board being female by 2020 in line with current market practice. Two of the 13 Board members (15%) as at the date of this report are female.
The Principal Committees of the CouncilNominations & Governance CommitteeThe Nominations & Governance Committee (the Committee) is responsible for making recommendations to the Council on the appointment of the Chairman, Chief Executive Officer, new nominated Council members, Board members (including the executive directors on the Board), members of a number of the Council and Board committees and the Secretary to the Council. The Committee is also responsible for succession planning arrangements for these positions.
The Committee meets at least twice annually and otherwise at the discretion of its Chairman or as directed by the Council. The Committee reports to the Council and Board on its proceedings after each meeting on all matters relating to its duties and powers. A written report is submitted to the Council annually.
In addition to the annual exercise of making recommendations with respect to the composition of Council and Board committees (together with any other necessary changes in composition during the year), the Committee made the following major recommendations to the Council during 2018:
— To appoint John Neal as Chief Executive Officer and, pursuant to this position, as a Nominated member of the Council and a member of the Board with effect from 15 October 2018. In this regard, the Committee was augmented by the addition of Neil Maidment;
— To re-elect Andy Haste as the Senior Independent Deputy Chairman and Simon Beale and Robert Childs, nominated representative of Hiscox Dedicated Member Limited, as Deputy Chairmen;
— To re-elect Andy Haste as a Nominated member of Council for a further three-year term with effect from 1 November 2018;
— To re-appoint Charles Franks and Mark Cloutier as market-connected Non-Executive Directors of the Board for further terms of three years with effect from 1 January 2018 and 1 April 2018 respectively;
— To appoint Mike Bracken, Nigel Hinshelwood and Fiona Luck as independent Non-Executive Directors of the Board, each for a term of three years, with effect from 1 March 2018. The appointments of Mike Bracken and Nigel Hinshelwood provided the Board with data and technological experience following the departure of Joy Griffiths and Dr Martin Read. The appointment of Fiona Luck satisfied the requirement to obtain non-Lloyd’s insurance representation on the Board. In order to accommodate these appointments, the maximum composition of the Board was increased by one member;
Corporate Governance continued
76 Lloyd’s Annual Report 2018

The Principal Committees of the Board Audit CommitteeThe Audit Committee’s role is to ensure that the financial activities of Lloyd’s are subject to independent review and audit. The Audit Committee’s functions in 2018 included reviewing Lloyd’s annual and interim financial statements, the aggregate syndicate results and the Lloyd’s Return to the PRA; and the Solvency II Pillar 3 return to the PRA.
The Chief Executive Officer, Chief Risk Officer, Chief Financial Officer, senior managers and the external and internal auditors attend meetings as appropriate. The Chairman also attends some Audit Committee meetings by invitation.
Reports from the internal and external auditors on aspects of internal control are reviewed by the Audit Committee and appropriate action taken in response.
The Audit Committee submits an Annual Report to the Board.
It also reports to the Council and the Board on its proceedings after each meeting. Additional reports are submitted to the Council and/ or the Board on matters of material interest as and when necessary. The minutes of Audit Committee meetings are submitted to the Board and the Council.
The Audit Committee is chaired by Richard Keers, an independent non executive director on the Board. Its remaining members are drawn from both the Council and the Board. A table showing Audit Committee members’ attendance at Audit Committee meetings is set out on pages 80 to 81.
The Audit Committee met on four occasions in 2018. The Audit Committee’s full report is on pages 105 to 107.
The Committee is chaired by the Chairman of Lloyd’s and its remaining members are drawn from both the Council and the Board.
A table showing the names of Committee members and their attendance at scheduled Committee meetings is set out on pages 80 to 81. The Committee held six scheduled meetings in 2018.
Remuneration CommitteeThe Remuneration Committee is responsible for setting remuneration arrangements for the Chairman, Chief Executive Officer, the Executive Directors and any other direct reports of the Chief Executive Officer and any such other members of the executive management or other persons as it is designated to consider.
Non executive remuneration is decided by the Council, on recommendation from the Chairman and Chief Executive Officer who may consult the Remuneration Committee as part of that process.
The Remuneration Committee meets at least twice a year and otherwise at the discretion of its Chairman or as directed by the Council. The Remuneration Committee reports to the Council and Board on its proceedings after each meeting on all matters relating to its duties and powers and makes recommendations to the Council or Board on any area within its remit where action or improvement is needed.
The Remuneration Committee submits a written report to the Council annually.
The Remuneration Committee is chaired by the Senior Independent Deputy Chairman. The Chairman is a member of the Committee and its remaining members are drawn from both the Council and the Board. A table showing Remuneration Committee members’ attendance at Remuneration Committee meetings is set out on pages 80 to 81. The Remuneration Committee met on eight occasions in 2018. The Remuneration Committee’s full report is on pages 92 to 104.
Lloyd’s Annual Report 2018 77
Market ResultsStrategic Report Society Report Other Information

Investment CommitteeThe Investment Committee, chaired by Andy Haste, monitors the investment objectives and parameters of centrally managed assets and is responsible for reviewing the performance of these funds. In addition, it monitors the investment operations of the Treasury and Investment Management department in respect of all funds under its management and approves all investment counterparties. It may also make more general recommendations concerning investment activity at Lloyd’s.
The Investment Committee meets at the discretion of its Chairman. The Investment Committee submits a written report to the Board annually and may submit additional reports on matters of material concern as and when necessary. The Investment Committee is required to obtain the approval of the Board before making any decisions which may materially affect the financial risks applying to the Society or Lloyd’s market entities.
A table showing Investment Committee members’ attendance at Investment Committee meetings is set out on pages 80 to 81.
The Committee will ordinarily meet quarterly each year.
Innovation Investment CommitteeThe Innovation Investment Committee was incorporated during 2018 and first met in June. The Committee is responsible for the development and implementation of investment strategies identified by the Lloyd’s Lab. In doing so, the Committee aims to promote an innovative culture within the market and increase the rate of adoption of new technologies and initiatives.
A table showing the Innovation Investment Committee members’ attendance at Innovation Investment Committee meetings for 2018 is set out on pages 80 to 81.
The Committee will ordinarily meet quarterly each year.
Terms of reference and appointment terms There are terms of reference for the Council, Board and their committees (including the Audit, Remuneration, Nominations & Governance Committees.) There are also terms of reference for the Chairman, Deputy Chairmen (including the Senior Independent Deputy Chairman) and the Chief Executive Officer. All of the aforementioned terms of reference are available to view on Lloyd’s.com.
The terms and conditions of appointment of non executive members of the Board and the Council are available on request from the Secretary to the Council.
Risk CommitteeDuring 2018, the Risk Committee was chaired by Patricia Jackson, an independent non executive member of the Board, and its other members are drawn from both the Council and the Board. Other individuals including the Chief Executive Officer, Chief Risk Officer, Chief Financial Officer and Performance Management Director are regular attendees with others invited to attend all or part of any meeting as and when deemed appropriate by the Risk Committee or its Chair. The Committee submits an Annual Report to the Board. It also reports to the Council and the Board on its proceedings after each meeting. The minutes of the Risk Committee meetings are submitted to the Board and the Council.
A table showing the Risk Committee members’ attendance at meetings is set out on pages 80 to 81. It met on nine occasions in 2018.
Market Supervision and Review Committee (MSARC)The MSARC takes decisions regarding the exercise of Lloyd’s enforcement powers. It also acts as a review body capable, where appropriate, of amending, modifying or withdrawing certain decisions taken by the Executives affecting managing agents. It also acts as the body that determines whether certain decisions can be referred to the Lloyd’s Appeal Tribunal and can also make certain business decisions.
MSARC meets at the discretion of its Chairman. MSARC submits a written report to the Board annually and may submit additional reports to inform the Board of any matters of material concern as and when required.
A table showing MSARC members’ attendance at MSARC meetings is set out on pages 80 to 81. The MSARC met on four occasions in 2018.
Capacity Transfer PanelThe Capacity Transfer Panel was established principally to exercise the Council’s powers in relation to minority buyouts and mergers. The Panel meets at the discretion of its Chairman.
The Panel submits a written report to the Board annually and may submit additional reports on matters of material concern as and when necessary.
The Panel did not meet in 2018.
Corporate Governance continued
78 Lloyd’s Annual Report 2018

Annual General MeetingThe Council reports to the members at the Annual General Meeting (AGM). A summary business presentation is given at the AGM by the Chief Executive Officer and Chief Financial Officer, before the Chairman deals with the business of the meeting.
Voting entitlement at general meetings is generally capacity-based for both external and working members, except at general meetings called on the requisition of members under section 6(4) of the Lloyd’s Act 1982 for the purpose of revoking or annulling byelaws, at which each member has one vote. The resolutions to be considered at general meetings are published on lloyds.com.
IndemnitiesThe Society has given indemnities to a number of its subsidiary undertakings, and the directors thereof, in respect of any claims or actions which may be brought against them or any future operating losses incurred by them in connection with the companies’ activities. The Society has also given indemnities to and has agreed to cover certain specific costs that may be incurred by members of the Council, the Board, Lloyd’s Insurance Company SA and of their respective sub-committees, the Society employees and also certain individuals and organisations who have been asked to carry out or provide services to the Society or on behalf of, or for the benefit of, its members.
Council, Board and committee assessmentsIn accordance with the UK Corporate Governance Code, an external and independent evaluation of the performance of the Council, Board, Audit, Remuneration and Nominations & Governance Committees is undertaken every three years. The external evaluation was undertaken by YSC Consulting and took place at the end of 2018.
The principal conclusion of the assessment was that the current governance arrangements were working adequately, identifying areas for discussion including increasing efficiencies between the two governing bodies and the Executive.
Individual assessmentThe Chairman meets each Non-Executive Director on the Board and each member of the Council once a year to appraise their performance. The Senior Independent Deputy Chairman also seeks the views of the Board and the Council on the performance of the Chairman. These views are conveyed to the Chairman by the Senior Independent Deputy Chairman.
Training and inductionAll new appointments to the Council and Board receive an induction pack.
In addition, new members of the Council and Board are provided with an induction programme which includes briefings with senior executive management and others on Lloyd’s, its operations and key issues of the day.
Independent professional adviceMembers of the Council and Board have access to independent professional advice, if required.
Conflicts of interestA register of interests is maintained by the Secretary to the Council for members of the Council, Board and their committees and is available for inspection by members.
Lloyd’s Annual Report 2018 79
Market ResultsStrategic Report Society Report Other Information
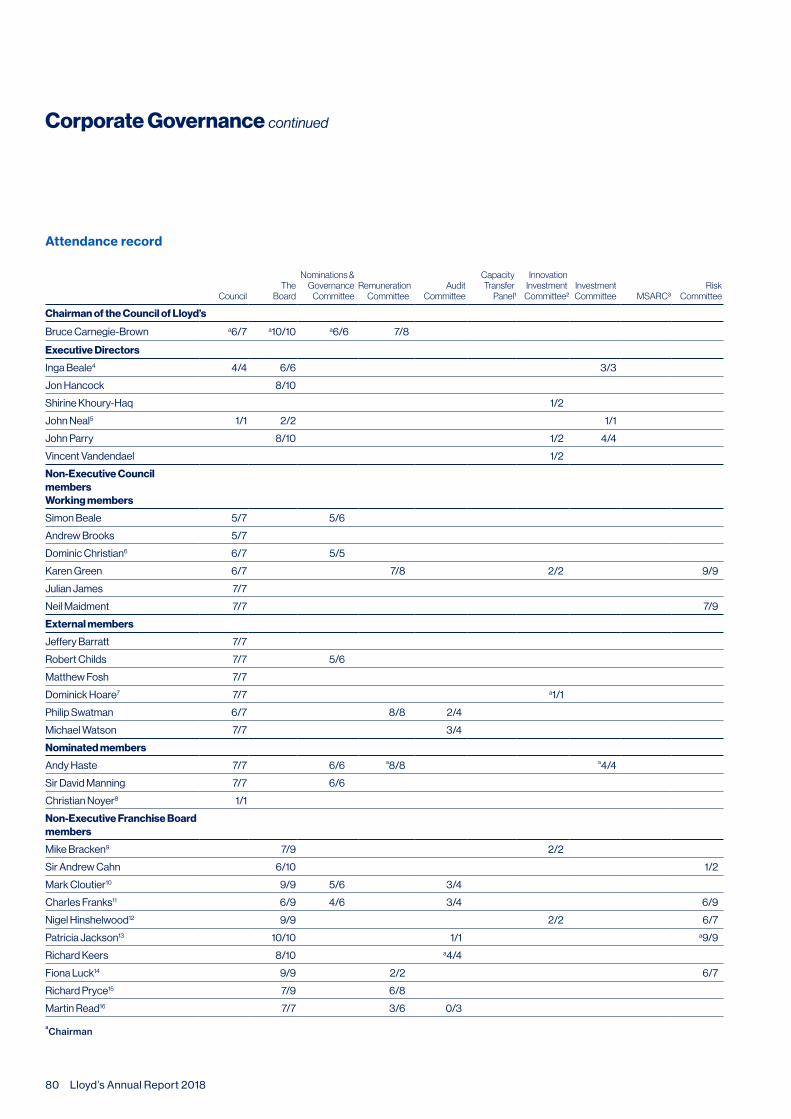
Attendance record
CouncilThe
Board
Nominations & Governance
Committee Remuneration
CommitteeAudit
Committee
Capacity Transfer
Panel1
Innovation Investment
Committee2Investment Committee MSARC3
RiskCommittee
Chairman of the Council of Lloyd’s
Bruce Carnegie-Brown a6/7 a10/10 a6/6 7/8
Executive Directors
Inga Beale4 4/4 6/6 3/3
Jon Hancock 8/10
Shirine Khoury-Haq 1/2
John Neal5 1/1 2/2 1/1
John Parry 8/10 1/2 4/4
Vincent Vandendael 1/2
Non-Executive Council membersWorking members
Simon Beale 5/7 5/6
Andrew Brooks 5/7
Dominic Christian6 6/7 5/5
Karen Green 6/7 7/8 2/2 9/9
Julian James 7/7
Neil Maidment 7/7 7/9
External members
Jeffery Barratt 7/7
Robert Childs 7/7 5/6
Matthew Fosh 7/7
Dominick Hoare7 7/7 a1/1
Philip Swatman 6/7 8/8 2/4
Michael Watson 7/7 3/4
Nominated members
Andy Haste 7/7 6/6 ª8/8 ª4/4
Sir David Manning 7/7 6/6
Christian Noyer8 1/1
Non-Executive Franchise Board members
Mike Bracken9 7/9 2/2
Sir Andrew Cahn 6/10 1/2
Mark Cloutier10 9/9 5/6 3/4
Charles Franks11 6/9 4/6 3/4 6/9
Nigel Hinshelwood12 9/9 2/2 6/7
Patricia Jackson13 10/10 1/1 a9/9
Richard Keers 8/10 a4/4
Fiona Luck14 9/9 2/2 6/7
Richard Pryce15 7/9 6/8
Martin Read16 7/7 3/6 0/3
aChairman
Corporate Governance continued
80 Lloyd’s Annual Report 2018

CouncilThe
Board
Nominations & Governance
Committee Remuneration
CommitteeAudit
Committee
Capacity
Transfer Panel1
Innovation Investment
Committee2Investment Committee MSARC3
RiskCommittee
Other Committee members
Richard Boys-Stones1
Martin Bride 3/4
Margaret Chamberlain1
Edward Creasy17 2/2
Lady Delves Broughton1
David Gittings1
Reg Hinkley 4/4
Alan Lovell1
Nick Marsh 4/4
Philip Matthews 3/4
Jo Rickard 4/4
Sacha Sadan 4/4
Jane Styles 3/4
Paul Swain1
Notes1. The Capacity Transfer Panel did not meet during 2018.2. The Innovation Investment Committee was established during 2018 and first met on 11 June 2018.3. Market Supervision and Review Committee.4. Inga Beale ceased as the Chief Executive Officer and as a member of the Council, Board and Investment Committee with effect from 13 October 2018. 5. John Neal was appointed as the Chief Executive Officer and a member of the Council and Board with effect from 15 October 2018 and as a member of
the Investment Committee with effect from 28 November 2018.6. Dominic Christian was appointed to the Nominations & Governance Committee with effect from 22 January 2018.7. Dominick Hoare was appointed as the Chair of the Innovation Investment Committee with effect from 26 July 2018. 8. Christian Noyer was appointed as a nominated member of the Council with effect from 2 November 2018.9. Mike Bracken was appointed as an independent non executive director of the Board with effect from 1 March 2018.10. Mark Cloutier was recused from the 12 October 2018 Board meeting due to a conflict of interest.11. Charles Franks was recused from the 12 October 2018 Board meeting due to a conflict of interest.12. Nigel Hinshelwood was appointed as an independent non executive director of the Board with effect from 1 March 2018.13. Patricia Jackson was appointed as a member of the Audit Committee with effect from 24 October 2018.14. Fiona Luck was appointed as an independent non executive director of the Board with effect from 1 March 2018 and to the Remuneration Committee
with effect from 20 September 2018.15. Richard Pryce was recused from the 12 October 2018 Board meeting due to a conflict of interest.16. Martin Read ceased as an independent non executive director of the Board and as a member of the Remuneration Committee with effect from
13 September 2018.17. Edward Creasy was recused from the 8 March and 26 March MSARC meetings due to a conflict of interest.
Lloyd’s Annual Report 2018 81
Market ResultsStrategic Report Society Report Other Information

The Council
1. Bruce Carnegie-BrownNominated memberAppointed 15 June 2017 Chairman of Lloyd’s Chairman of the Nominations & Governance CommitteeMember of the Remuneration Committee
Bruce Carnegie-Brown was appointed Chairman in June 2017. He is currently also Chairman of Moneysupermarket Group and a Vice-Chairman of Banco Santander. He was a Non-Executive Director of JLT Group plc from 2016 to 2017, prior to which he was Non-Executive Chairman of Aon UK Ltd from 2012 to 2015, Senior Independent Director of Catlin Group Ltd from 2010 to 2014 and Chief Executive for Marsh UK and Europe from 2003 to 2006. He was also a Senior Independent Director of Close Brothers Group plc from 2006 to 2014. He previously worked at JP Morgan for 18 years in a number of senior roles and was Managing Partner of 3i Group plc’s Quoted Private Equity Division from 2007 to 2009. He is President of the Chartered Management Institute.
2. John NealNominated memberAppointed 15 October 2018Chief Executive Officer
John Neal was appointed Chief Executive Officer in October 2018. He was previously Group Chief Executive Officer of QBE, a global insurance and reinsurance business with a significant Lloyd’s footprint. In this role, he was responsible for running a A$14bn gross written premium (GWP) business with over 14,000 employees in 37 countries. John refocused QBE’s business around commercial and specialty lines, disposing of non-core portfolios and reducing costs by over A$350m. Before becoming Chief Executive Officer, he held a number of roles at QBE including Chief Underwriting Officer and Chief Operations Officer of the firm’s European operations.
Prior to this, he led a management buyout of Ensign to establish a dedicated Lloyd’s Managing Agency. As Chief Executive Officer of Ensign, he grew GWP to £150m to create the leading specialist commercial motor underwriter in the UK. He also worked at Bankside Managing Agency, where he was the youngest active underwriter at Lloyd’s. He started his career at the Crowe Underwriting Agency, where over the course of a decade he grew UK GWP from £3m to £100m.
3. Albert Benchimol(Representative of Axis Corporate Capital UK Ltd) External memberElected 1 February 2019
Albert Benchimol is currently President and Chief Executive Officer of AXIS Capital Holdings Limited, a position he has held since 2012. He joined the company in 2011 as Chief Financial Officer. He formerly served as Executive Vice President and Chief Financial Officer of Partner Re Ltd. for a 10-year period, and was also Chief Executive Officer of Partner Re Ltd.’s Capital Markets Group business unit from 2007 to 2010. Albert spent several years working for Reliance Group Holdings and for the Bank of Montreal in Montreal, Toronto and New York. He received a Bachelor of Science degree in Physiology and Immunology from McGill University in Montreal, and earned a Master’s in Business Administration at the same university. Albert is Chairman of the Association of Bermuda Insurers and Reinsurers and is also on the Board of Overseers of the School of Risk Management, Insurance and Actuarial Science at St John’s University in addition to being a member of the Insurance Development Fund Steering Committee. He speaks French and Spanish.
82 Lloyd’s Annual Report 2018

* Considered to be an independent Non-Executive Director.
4. Andrew BrooksWorking member Elected 1 February 2017
Andrew Brooks has been Chief Executive Officer of Ascot Underwriting Ltd since 2008 and a member of the Board since 2004. He joined Ascot at its inception in 2001 and was promoted to Chief Underwriting Officer in 2005. He has worked in the Lloyd’s market since 1983 and is currently Chairman of the Lloyd’s Market Association and London Market Group Board. He also served on the Lloyd’s Claims Implementation Board.
5. Andy Haste*Nominated memberAppointed 1 November 2012Senior Independent Deputy Chairman of LloydsChairman of the Remuneration CommitteeChairman of the Investment CommitteeMember of the Nominations & Governance Committee
Andy Haste is a Visiting Fellow at the Oxford University Centre for Corporate Reputation (the Centre) and is one of the leading practitioners from business, the media and other organisations who assist with research, programmes and events at the Centre.
From July 2014 to August 2018 he was Chairman of Wonga Group. Since 2012 he has also been Senior Independent Deputy Chairman of Lloyd’s. His previous roles include Senior Independent Director of ITV, a Member of both its Audit and Nomination Committees and Chair of its Remuneration Committee, Group Chief Executive of RSA Insurance Group plc, Chief Executive of AXA Sun Life plc, Director of AXA UK plc (life and pensions), President and Chief Executive Officer of GE Capital Global Consumer Finance, Western Europe and Eastern Europe and President and Chief Executive Officer of National Westminster Bank’s US Consumer Credit Business (retail banking). He was also a Member of the Board of the Association of British Insurers from 2003 to 2011.
6. Christian Noyer*Nominated member Elected 2 November 2018
Christian has been Honorary Governor of the Bank of France since 2015 following a ten-year period as a governor. He’s also a member of the French Fiscal Council, and advisor to the French Government on issues related to Brexit. During his forty-year career within international public finance, Christian held several high-profile positions including Vice-President of the European Central Bank, from when the institution was set up in 1998 to 2002, and President of the Bank for International Settlements between 2010 and 2015. He worked for the French Treasury for over 20 years and was appointed Director of the Treasury in 1993. Christian studied law at the University of Rennes and subsequently graduated from the Institut d’études politiques de Paris and the École nationale d’administration. He has been awarded the honours of Commandeur de la Légion d’Honneur and Commandeur des Arts et des Lettres in France. Christian also holds numerous prestigious international decorations including Commander of the National Order of the Lion of Senegal; the Spanish Great Cross of the Orden del Mérito Civil; Officier de l’Ordre National de la Valeur of Cameroun; and the Japanese Order of the Rising Sun gold and silver star.
Lloyd’s Annual Report 2018 83
Market ResultsStrategic Report Society Report Other Information

The Council continued
7. Dominic ChristianWorking member Elected 1 February 2014Member of the Nominations & Governance Committee
Dominic Christian is Executive Chairman of Aon Benfield International. He is also Chief Executive Officer of Aon UK Ltd. He sits on Aon Group’s Executive Committee. Previously he served as co-Chief Executive Officer of Aon Benfield and prior to this as a Group Board Director of Benfield Group plc. He has nearly 32 years’ of experience as a Lloyd’s broker. He is also Chairman of the Lloyd’s Tercentenary Research Foundation and a Director of The Bermuda Society and the Juvenile Diabetes Research Foundation. He chairs the University of East Anglia’s Campaign Advisory Board. He was the President of the Insurance Institute of London in 2015 to 2016 and recently elected as Chairman of ClimateWise. He is Chairman of the Sainsbury Centre for Visual Arts.
9. Jeffery Barratt(Representative of Nameco (No 1249) Ltd)External memberElected 1 February 2017
Jeffery Barratt is a lawyer and has been a member of Lloyd’s since 1987. He is a Director of the Association of Lloyd’s Members. He was a Partner at Norton Rose Fulbright for many years, specialising in project finance and financial law and held a number of management positions within the firm. He has been actively involved in promoting the City’s interests for a number of years and chaired TCUK Infrastructure and Energy Executive Board from 2013 to 2017. He was a Non-Executive Director of the International Project Finance Association from 2011 and sat on the London Council from 2011 to 2018 and currently sits on the International Advisory Group of the CBI. He was Chairman of the Cook Society in 2015 and 2016 and is now Deputy Chairman. He actively supports a number of children’s charities including the Dyspraxia Foundation, Snow-Camp, Beanstalk, Wooden Spoon and the Change Foundation.
8. Dominick Hoare(Representative of Munich Re Capital Ltd) External memberElected 19 April 2017
Dominick Hoare is Group Chief Underwriting Officer of Munich Re Syndicate Ltd and is also an Executive Director of both MunichRe Speciality Group Ltd and Munich Re Capital Ltd. He also holds various Non-Executive Directorships of subsidiary companies of Munich Re Speciality Group Ltd. He has worked in the Lloyd’s Market since 1985 and has served on various Lloyd’s Underwriting Committees including the Lloyd’s Market Association Board
84 Lloyd’s Annual Report 2018

* Considered to be an independent Non-Executive Director.
10. John E Sununu*Nominated memberAppointed 6 February 2019
John E Sununu represented New Hampshire in the United States Senate from 2003-2009. Previously, he served in the US House of representatives (1997-2003) and as Chief Financial Officer for privately held manufacturer Teletrol Systems. During his term in office, Sununu was a member of the Senate Banking Committee, Senate Finance Committee, and Subcommittee on Science Technology and Innovation. Since 2011 he has worked for international law firm Akin Gump Strauss & Hauer, where he provides strategic advice to energy, technology, telecommunications and financial services clients. He is a Non-Executive Director for Boston Scientific, a publicly traded manufacturer of medical devices where he chairs the Nominations and Governance Committee and is a member of the Audit Committee. He also serves on the Boards of Sorenson Communications and Afiniti, both privately held technology firms. Sununu holds bachelor’s and master’s degrees in Mechanical Engineering from the Massachusetts Institute of Technology, and earned a Master of Business Administration from Harvard University.
11. Karen GreenWorking memberElected 1 February 2015Member of the Remuneration CommitteeMember of the Risk CommitteeMember of the Innovations Investment Committee
Karen Green is Deputy Chair and Acting Chair of Aspen Managing Agency Ltd (“AMAL”) and former Chief Executive Officer of Aspen UK, which includes AMAL. She is a Non-Executive Director of Phoenix Group Holdings and the Admiral Insurance Group. She had previously worked as a Principal with the global private equity firm MMC Capital Inc (now Stone Point Capital). Before this, she was a Director at GE Capital in London, co-running the business development team responsible for mergers and acquisitions in Europe. She started her career as an Investment Banker with Baring Brothers and then Schroders. She is a Member (and former Chair) of the Development Council for the Almeida Theatre Company. She is also a Vice President of the Insurance Institute of London.
12. Robert Childs(Representative of Hiscox Dedicated Corporate Member Ltd)External member: Elected 1 February 2012Deputy Chairman of Lloyd’sMember of the Nominations & Governance Committee
Robert Childs is Non-Executive Chairman of Hiscox. He was Chairman of the Lloyd’s Market Association from January 2003 to May 2005 and is currently Deputy Chairman of Lloyd’s.
Lloyd’s Annual Report 2018 85
Market ResultsStrategic Report Society Report Other Information

The Council continued
* Considered to be an independent Non-Executive Director.
13. Simon BealeWorking memberElected 8 February 2012Deputy Chairman of Lloyd’sMember of the Nominations & Governance Committee
Simon Beale is Chief Executive Officer of MS Amlin. He is an Executive Director of the MS Amlin plc Board and Non-Executive Director of MS Amlin Underwriting Ltd, the managing agency for Syndicate 2001 of which he was joint Active Underwriter until 2012. He is also an Executive Officer of Mitsui Sumitomo Insurance Co Ltd. He has been with MS Amlin since 1994 and has most recently held the position of Chief Underwriting Officer since 2012. He has worked in the Lloyd’s Market since 1984 and has served on various Lloyd’s Underwriting Committees including the Lloyd’s Market Association Board.
14. Sir David Manning GCMG KCVO* Nominated memberAppointed 1 September 2010Member of the Nominations & Governance Committee
Sir David Manning retired from the Diplomatic Service in 2007 after four years as Ambassador to the United States of America. He is a Director of Gatehouse Advisory Partners. He is Chair of the Advisory Board of IDEAS at the London School of Economics and of Macquarie’s Infrastructure and Real Estate Advisory Board. He is on the Panel of Senior Advisers at the Royal Institute of International Affairs, Chatham House and a Member of the Advisory Board of British American Business. He is President of Step Together.
15. Michael Watson(Representative of Flectat Ltd) External memberElected 1 February 2013 Member of the Audit Committee
Michael Watson is Executive Chairman of Canopius AG, a private equity backed global specialty re(insurance) business with its principal operations at Lloyd’s. He led the original management buyout of Canopius in 2003 and again in 2018. He has over 40 years’ experience in commercial and investment banking, trade finance, stock broking, life and non-life insurance, gained in London, Bermuda and New York. He is a Chartered Accountant and serves on the Board of the Lloyd’s Market Association and Weston Insurance Holdings Corporation.
16. Victoria Carter Working member Elected 1 February 2019
Victoria Carter has worked in the Lloyd’s Market for 38 years, starting her career in medicine then moving to Reinsurance Broking in 1980. She joined Guy Carpenter in 2010 as Vice Chairman of International Operations and in 2016 became Vice Chairman of Global Strategic Advisory. She also holds positions on the company’s executive committee and board. Prior to that, she was Chairman of UK and Europe at Towers Watson. In 1992, she founded Dunn & Carter Ltd, becoming the first female founder of a Lloyd’s broking house. She is also the founder and driver of the Marsh & McLennan Young Professionals Initiative, which initiated a market-wide networking and educational platform. Victoria is a Trustee of the Lloyd’s Charities Trust and a Board member of the Lloyd’s Community Programme. She is also on the Court of the Worshipful Company of Insurers.
86 Lloyd’s Annual Report 2018

The Board
* Considered to be an independent Non-Executive Director.
1. Bruce Carnegie-BrownChairman of the BoardAppointed 15 June 2017Chairman of Lloyd’sChairman of the Nominations & Governance CommitteeMember of the Remuneration Committee
Biography on page 82.
2. John NealNominated memberAppointed 15 October 2018Chief Executive Officer
Biography on page 82.
3. Charles FranksMarket connected Non-Executive DirectorAppointed 1 January 2012Member of the Nominations & Governance CommitteeMember of the Risk Committee
Charles Franks is Group Chief Executive Officer of Tokio Marine Kiln Group and of its Lloyd’s managing agency, Tokio Marine Kiln Syndicates Ltd and insurance company Tokio Marine Kiln Insurance Ltd. Having joined Kiln in 1993, he became a Director of R J Kiln in 1995 and was appointed Active Underwriter of the Marine division in 2001. He became Chief Executive of R J Kiln in 2007. He is an Executive Officer of Tokio Marine Holdings.
4. Fiona Luck*Independent Non-Executive DirectorAppointed 1 March 2018Member of the Risk CommitteeMember of the Remuneration Committee
Fiona Luck has more than 25 years’ experience in insurance and reinsurance. She was a Non-Executive Director of the Bermuda Monetary Authority from 2013 to 2018. Previously, she was Non-Executive Director at Catlin Holdings Ltd and Allied World Holdings Ltd and, prior to that, spent a decade at XL Capital Ltd, in a variety of senior roles including Chief of Staff to the Chief Executive Officer and Executive Vice-President responsible for Strategy, Global HR, IT and Corporate Social Responsibility. She has also worked for the ACE Group from 1996 to 1999 and was President and Chief Executive Officer of Marsh and McLennan’s Bermuda operation from 1992 to 1996. She is a chartered accountant.
5. John ParryExecutive DirectorAppointed 11 December 2014Chief Financial Officer
John Parry was appointed Chief Financial Officer in December 2014 and is responsible for the financial reporting for the Society and the Lloyd’s market, capital setting and capital adequacy. Finance also covers treasury and investment management and the tax affairs of the Corporation and market in the UK and overseas. He is a chartered accountant and joined Lloyd’s in August 2001 and was previously Finance Director of various Lloyd’s managing agents.
Lloyd’s Annual Report 2018 87
Market ResultsStrategic Report Society Report Other Information

The Board continued
* Considered to be an independent Non-Executive Director.
7. Mark CloutierMarket connected Non-Executive DirectorAppointed 1 April 2015Member of the Audit CommitteeMember of the Nominations & Governance Committee
Mark Cloutier was appointed Executive Chairman and Group Chief Executive Officer of Aspen with effect from 15 February 2019. Between January 2017 and December 2018 he was Executive Chairman of Brit Group having previously been Chief Executive Officer of the Brit Group. He is also Chairman of Bryte Group and a Director of Comarque Ltd, South Africa. With over 35 years’ experience working in the international insurance and reinsurance sector he holds a number of Non-Executive positions and has held a number of Chief Executive Officer and senior executive positions, including Chief Executive Officer of the Alea Group, Chief Executive Officer of Overseas Partners Re and President of E.W. Blanch Insurance Services Inc. He has worked in partnership with a number of leading private equity and institutional investors including Kohlberg Kravis Roberts (KKR), Fortress Investment Group, Apollo LP, CVC Capital Partners and Ontario Municipal Employees
8. Mike Bracken*Independent Non-Executive DirectorAppointed 1 March 2018Member of the Innovations Investment Committee
Mike Bracken was formerly Chief Digital Officer at the Co-Op Group and prior to that he spent four years as the UK Government’s Executive Director, Digital and also as Chief Data Officer. In this role he created the Government Digital Service, the organisation behind GOV.UK and the transformation of mainstream Government transactions.
9. Neil Maidment* Independent Non-Executive Director Appointed 1 February 2019Member of the Risk Committee
Neil Maidment has worked in the Lloyd’s market for 34 years. He was previously a Director of Beazley plc and was Chief Underwriting Officer of the company and Active Underwriter for its Lloyd’s syndicates from 2008 to 2018. He was Chairman of the Lloyd’s Market Association from 2016 to 2018 and served as an elected working member of the Council of Lloyd’s during the same period.
6. Jon HancockExecutive DirectorAppointed 1 December 2016Director, Performance Management
Jon Hancock was appointed Director of Performance Management in December 2016 and is responsible for performance management, capital setting and risk management in the market. He joined Lloyd’s from RSA where he had enjoyed a career of more than 25 years with the insurance company, starting as a Marine Underwriter in their Liverpool office. Working across UK regions, the London market as well as many years overseas, he has held a variety of chief underwriter and risk roles in both developed and emerging markets prior to becoming Chief Executive Officer for their Asia & Middle East businesses. Prior to leaving RSA he was Managing Director of the UK Commercial and European Specialty Lines businesses and Global Relationship Director for the RSA Group.
88 Lloyd’s Annual Report 2018

* Considered to be an independent Non-Executive Director.
10. Nigel Hinshelwood*Independent Non-Executive DirectorAppointed 1 March 2018Member of the Risk CommitteeMember of the Innovations Investment Committee
Nigel Hinshelwood has over 27 years’ experience in the financial services sector working across the UK and Europe, North and South America, the Middle East and Asia Pacific. He was most recently Head of HSBC UK and Deputy Chief Executive Officer of HSBC Bank plc. He had a 12 year career at HSBC, where he was a Group General Manager, in a variety of senior global roles including Global Head of Operations, Chief Operating Officer for Europe, Middle East and Africa, Head of HSBC Insurance Holdings and Head of Business Transformation. Prior to joining HSBC, he was a Partner at Ernst & Young (subsequently Cap Gemini Ernst & Young) where he held numerous positions including Head of Financial Services and Chief Executive Officer of Southeast Asia. He was also a Group General Manager with Unisys where he was responsible for the Financial Services practice in Asia Pacific. He is Senior Independent Director of Lloyds Bank plc and Bank of Scotland plc. He is also an Independent Non-Executive Director and Chairman of the Risk Committee of Nordea Bank Group.
11. Patricia Jackson*Independent Non-Executive DirectorAppointed 30 March 2017Chairman of the Risk CommitteeMember of the Audit Committee
Patricia Jackson is a Non-Executive Director and Chair of the Risk Committee of the digital challenger bank Atom, SMBC Nikko Capital Markets Ltd and BGL, which owns Compare The Market. She is a Council Member of the European Money and Finance Forum SUERF and an Adjunct Professor at the Imperial College Business School. From 2004 to 2013 she was a Partner at EY and led the risk governance and financial regulation practice across EMEIA. Up until 2004 she was a Senior Official at the Bank of England and Head of the Financial Industry and Regulation Division. She represented the UK on the Basel Committee for Banking Supervision for seven years.
12. Richard Keers*Independent Non-Executive DirectorAppointed 1 June 2016 Chairman of the Audit Committee
Richard Keers was appointed a Director and Chief Financial Officer of Schroders plc in May 2013. He is a chartered accountant and was a Senior Audit Partner of PricewaterhouseCoopers LLP (PwC) until May 2013. He became a Partner of PwC in 1997 and has 25 years’ experience in the audits of global financial services groups. His experience includes time spent in PwC’s New York, Sydney, Edinburgh and London offices.
13. Richard PryceMarket connected Non-Executive DirectorAppointed 1 January 2017 Member of the Remuneration Committee
Richard Pryce joined QBE European Operations as Deputy Chief Executive Officer in 2012 and became Chief Executive Officer the following year. He is also the Chief Executive Officer of QBE Underwriting Ltd and is a member of QBE’s Group Executive Committee. He has worked in the London insurance market for more than 30 years, including holding several roles at ACE, where he became President of ACE Global Markets in 2003, assuming the additional responsibility for the UK business in 2007 and was the Active Underwriter of syndicate 2488.
Lloyd’s Annual Report 2018 89
Market ResultsStrategic Report Society Report Other Information

Internal Control Statement
Lloyd’s maintains an independent and objective internal audit function that reports functionally to the Chairman of the Audit Committee and administratively to the Chief Executive Officer. The Head of Internal Audit is supported by Deloitte LLP which provides the skills and resources required to complete the annual Internal Audit Plan.
Identification and evaluation of business risksThe Risk Management Framework (the Framework) ensures that the identification, assessment, monitoring and management of all material risks affecting the Society takes place on an ongoing basis.
The Framework includes a number of risk assessment techniques, which are tailored to specific risk areas.
One such technique is the comprehensive risk and control assessment process, which is conducted on a regular basis. This review reassesses the existing risks and identifies any new or emerging risks. It evaluates the performance of key controls and also seeks to monitor the action plans in place to help manage risks. The Framework also enables Lloyd’s to undertake a more forward looking assessment of risk, building capital consideration into the decision making processes. An Own Risk and Solvency Assessment (ORSA) is performed every year, bringing together key risk, capital and solvency management information on a more formal basis for the Board on a current and future basis. While an annual process, the ORSA is reviewed on a quarterly basis to ensure it remains relevant.
The risk governance structure, which includes the Board Risk Committee provides clear independent challenge to the risk takers at Lloyd’s and enables tailored risk management operating models, rather than a one-size-fits-all platform.
The Board Risk Committee oversees, challenges and where appropriate escalates issues using appropriate management information sourced from the Risk Management and Internal Control Frameworks, such as the various risk and control assessments, details of the operating and regulatory environment and capital management reports. The risk governance structure is reviewed on a regular basis to ensure it remains fit for purpose.
A key objective of the Lloyd’s risk governance structure is to provide assurance to the Board that risks facing the Society are identified and managed in accordance with approved policy and risk appetite. The Risk Appetite Framework articulates the level of risk believed to be acceptable and desirable for Lloyd’s through a series of risk appetite metrics. These are monitored on an ongoing basis by both the business areas responsible for each risk area and the Board Risk Committee.
The Board, on behalf of the Council, has responsibility for the Society’s system of internal control and for reviewing its effectiveness. The Audit Committee monitors and reviews the effectiveness of the system of internal control, providing biannual reports to the Board. The Executive Committee is responsible for the implementation and maintenance of the internal control system and for instilling a strong internal control environment across the Corporation and market.
The internal control system provides the foundation for the safe and sound operation of the business, ensuring compliance with relevant laws and regulations and the safeguarding of assets. The system is designed to reduce, rather than eliminate, the risk of failure to achieve business objectives and can only provide reasonable but not absolute assurance against material misstatement or loss.
In accordance with the guidance of the UK Corporate Governance Code on internal control, and Solvency II requirements, there is an established, ongoing process for identifying, evaluating and managing significant business, operational, financial, compliance and other risks. Other procedures such as our Speaking-up Policy whereby any employee may take matters that concern them to the Chief People Officer, the Legal and Compliance departments or, where appropriate, to the Chairman of the Audit Committee or the FCA or the PRA, are clearly set out. Associate companies, Ins-sure Holdings Limited and Xchanging Claims Services Limited, are not dealt with as part of the Group for the purposes of applying the UK Corporate Governance Code.
The Group’s key risk management processes and the system of internal control procedures include the following:
Management structure‘Lloyd’s Governance Arrangements: A Guide for Members of Lloyd’s Committees’, reviewed and updated in February 2018, outlines the governance structure and committee members’ duties and responsibilities, including confidentiality and conflicts and declarations of interest.
There is a clearly defined organisation structure with terms of reference agreed for the Chief Executive Officer and all directors which sets out, inter alia, their functions and powers, authority to act and limitations on authority. Role profiles are required to ensure that employees are aware of their role and responsibilities and sets out the equivalent information, as agreed with their line manager.
The Society is committed to the highest standards of business conduct. Corporate policies and procedures are available to all employees and include the Code of Conduct, Compliance Manual, Employee Handbook, Health & Safety Policy, Information Security and Computer Usage Policy, Procurement Policy, Risk Policies, Financial Policies and authorisation limits.
90 Lloyd’s Annual Report 2018

A framework of regular self certification, with targeted independent challenge, is in place and where control failures have been reported, details of the circumstances are required together with appropriate corrective actions. A summary of these reports is reviewed by the Executive Risk Committee, Board Risk Committee, Board and the Audit Committee on a regular basis.
The Internal audit function also performs independent reviews of control activities as part of their annual risk based programme as approved by the Audit Committee. The Head of Internal Audit reports to the Audit Committee on a regular basis and as part of every audit discusses the key findings with the executive responsible.
A compliance plan is in place to manage the risk associated with non-compliance with FCA/PRA regulatory processes. The Head of Compliance provides progress reports to the Board Risk Committee.
International regulatory compliance risk is overseen through the Overseas Risk Assessments completed by global offices.
Information and financial reporting systemsAn annual budget for the Society is reviewed in detail by the Executive Committee and is considered and approved by the Board and Council. Monthly financial reports compare actual performance with the annual budget and management action is taken, where appropriate, when variances arise. Revised forecasts are prepared regularly.
Lloyd’s Annual Report 2018 91
Market ResultsStrategic Report Society Report Other Information

The overall principles that underpin the remuneration policy remain unchanged and are as follows:
— Nature of the Corporation – The organisation has a unique role both as an oversight body and a promoter of the Lloyd’s market. Remuneration packages for executives with Board member roles will be re-balanced, with reduced emphasis on fixed pay (salary, pension and benefits), and a greater weighting on variable pay elements linked to measurable strategic KPIs.Under the re-balanced approach, incentives will continue to be set below market levels, reflecting the oversight role of the Corporation.
— Alignment to Corporation strategy – Individual performance awards will continue to be linked to Corporation and individual KPIs. Performance will be assessed against a rigorous balanced scorecard of quantifiable metrics, and will continue to be subject to risk adjustment.
— Alignment to the Lloyd’s market – A significant element of remuneration will be based on the performance and profitability of the Lloyd’s market. This encourages an attitude of commercial partnership with the market and aligns the interests of participants with capital providers. This alignment means that the payment under the market element has been nil for both 2017 and 2018. Market and Corporation risk adjustment metrics also apply to this element.
— Solvency II – We will continue to operate appropriate features such as long term deferral for Solvency II staff and risk adjustment underpin.
An updated remuneration policy is set out on pages 102 to 103.
Key management changes – new Chief Executive Officer and Chief Financial OfficerJohn Neal was appointed as Chief Executive Officer on 15 October 2018.
He was appointed on a salary of £650,000, with a cash benefits allowance of 3% of salary and a pension supplement of 15% of salary, in line with the maximum pension contribution available to wider Corporation employees. Total fixed pay was set at a level lower than his predecessor. In line with the revised remuneration principles described above, the Chief Executive Officer will receive a maximum individual performance award of 100% of salary, and a maximum market award of 50% of salary. No buy-out awards were made on appointment.
The Committee is supportive of John Neal building a strong leadership team, with the capability to deliver transformation and drive long-term market success. The Committee therefore considered carefully the recruitment market for potential candidates and the compensation package which might be offered.
This report is based upon the principles of the Directors’ remuneration reporting regulations for UK listed companies, and the UK Corporate Governance Code. The code and regulations are directed at companies listed on the London Stock Exchange, whereas Lloyd’s is a market of many separate and competing trading entities. Nonetheless, the Council supports their principles insofar as they can be applied to the governance of the Society and has chosen to broadly follow the disclosure principles in this report.
Statement by Chair of the Remuneration CommitteeI am pleased to present the Remuneration Committee’s report for 2018 in the following pages.
2018 was an important year for the Corporation, with the appointment of a new Chief Executive Officer. Under John Neal’s leadership, the Corporation will continue its focus on delivering long-term market success through transformation in a number of critical areas. These include improved underwriting discipline, accelerated efforts to modernise the way in which we do business, reducing costs and the launch of a Lloyd’s Brussels subsidiary.
Remuneration policy reviewPrior to the appointment of a new Chief Executive Officer, the Committee reviewed the overall shape of remuneration packages for executive directors to ensure that the policy remains relevant for the Corporation going forward.
A key conclusion of the Committee’s review was that the balance of fixed and variable pay should be adjusted for those executives with Board member roles, with a reduction in fixed pay and an increase in variable performance-related pay. The increase in variable pay will be accompanied by a rigorous framework against which performance is assessed.
The Committee’s review also concluded that:
— Pension arrangements for new executive directors would be simplified and reduced to be in line with the maximum contribution available to wider Corporation employees.
— The deferral of variable pay under the Lloyd’s Incentive Plan would be simplified, and be structured as 40% deferral of both the Individual and Market elements of the Lloyd’s Incentive Plan.
— In order to provide a more balanced approach to performance measurement and better reflect the focus of the Corporation and its drive for improved efficiencies and transformation in the Lloyd’s market, Profit Before Tax (PBT) and Combined Operating Ratio (COR) will be the key metrics to measure market performance from 2019.
Report of the Remuneration Committee
92 Lloyd’s Annual Report 2018

UK Corporate Governance developments During the year the Committee considered the new UK Corporate Governance Code and other regulatory changes which will take effect from 1 January 2019. While some aspects are not applicable to the Corporation, the Committee considered how these principles may be applied to the Corporation in the areas of workforce remuneration, pensions and discretion.
Wider Corporation employeesAll employees in the Corporation are eligible to participate in Lloyd’s incentive arrangements, and the framework is consistent across all employees in the Corporation.
From October 2018, new executive and senior management hires will be appointed on a reduced pension supplement, in line with the maximum contribution available to wider Corporation employees.
Andy HasteChairman, Remuneration Committee 26 March 2019
Burkhard Keese was appointed as Chief Financial Officer effective 1 April 2019 on a salary of £450,000. His cash benefits allowance, pension and incentive arrangements are in line with those described above for the new Chief Executive Officer.
No buy out awards were made on his appointment. However, in order to attract the candidate and to transition him from his previous higher package, the Committee determined that a recruitment award would be made, subject to the achievement of specific KPIs.
Further details of the remuneration arrangements for the Chief Executive Officer and Chief Financial Officer are set out on pages 99 to 100.
Key management changes – departing DirectorsInga Beale stepped down with effect from 13 October 2018. Further details of her leaving arrangements are set out on page 100.
John Parry announced his intention to step down on 23 April 2018. In addition to his six month notice period, John agreed to work a further six month period during the search for his successor and to support a smooth transition. Further details of his leaving arrangements are set out on page 100.
Other key remuneration decisions and incentive outturnsNo salary increases were awarded for Executive Directors for 2019.
As part of the review of the Chief Executive Officer’s new leadership team, the remuneration package of the Performance Management Director was also considered, given the importance of his role in delivering market transformation and driving long-term success. In line with the rebalanced packages for the new Chief Executive Officer and Chief Financial Officer, from 2019 Jon Hancock will receive an increase in annual performance bonus opportunity to 100% of salary. The maximum market award remains at 50% of salary. As part of the alignment in packages, his pension contribution will be decreased to 15% of salary in line with the maximum contribution available to wider Corporation employees, and his benefit allowance will be 3% of salary.
Lloyd’s made good progress against strategic priorities in 2018, which is reflected in the individual performance awards (see pages 95 to 96).
The individual performance awards are based on an assessment of each Director’s performance against key performance indicators. The Committee aims to ensure that KPIs are stretching and aimed at delivering strategic priorities while remaining in accordance with Lloyd’s risk policies and risk appetite.
For 2018, no market awards have been made.
Lloyd’s Annual Report 2018 93
Market ResultsStrategic Report Society Report Other Information

Compliance statementThe Corporation is not required to report under the Directors’ remuneration reporting regulations, as these only apply to UK listed companies. The Committee has chosen to broadly follow the disclosure principles in those regulations insofar as they can be applied to the governance of the Society.
For the purposes of this report, Executive Directors refers to John Neal (Chief Executive Officer), Jon Hancock (Performance Management Director) and John Parry (Chief Financial Officer) – i.e. Directors who are current members of the Board. “Former Chief Executive Officer” refers to Inga Beale, who stepped down as Chief Executive Officer on 13 October 2018.
Summary of remuneration policy and outturns for 2018The following table provides a summary of how our remuneration policy was implemented in 2018. The remuneration policy for 2019 is provided on page 102 to 103.
Salary Salaries are set to appropriately recognise responsibilities and be broadly market competitive.
For 2018, annual salaries were as follows:
— Chief Executive Officer (appointed on 15 October 2018): £650,000
— Former Chief Executive Officer: £715,000 (stepped down on 13 October 2018)
— Chief Financial Officer: £433,500 (to step down on 23 April 2019)
— Performance Management Director: £510,000
Lloyd’s Incentive Plan (Individual Performance Award)
The individual performance award links reward to corporate and individual Key Performance Indicators (KPIs) aligned with our strategy.
Role Maximum 2018 outturn
Chief Executive Officer 100% of salary Not applicable (due to time in role)
Former Chief Executive Officer 75% of salary 57% of salary
Chief Financial Officer 50% of salary 36% of salary
Performance Management Director 50% of salary 49% of salary
In 2018, annual bonus awards were also subject to a “risk underpin”. The Committee assessed performance against a range of Corporation risk and compliance metrics and decided to apply a downward adjustment to a number of individual bonus awards across the Corporation.
A portion of the annual bonus will be deferred for three years, so that total incentives meet the PRA guidance to defer at least 40% of the total variable pay. 40% of the 2018 bonus award will be deferred for three full years.
Lloyd’s Incentive Plan (Market Award)
The market award (previously LPP) offers an incentive which is directly linked to the profitability of the Lloyd’s market. Annual market awards are calculated by reference to profit levels in the year. Market awards are only triggered for profit in excess of £100m. For 2018, no award is payable.
For the Executive Directors, the whole of any market award is deferred for three years to be paid in the fourth financial year following the end of the performance period (April).
For the Executive Directors, a maximum cap of 50% of salary applies.
Executive Directors will receive any market awards deferred from prior years, payable in accordance with the deferral requirements.
Market awards are subject to a “risk underpin”.
Pension The Chief Executive Officer receives a pension supplement of 15% of salary.
The Former Chief Executive Officer was a member of the Group Pension Plan, which is a defined contribution plan, and she received an annual contribution of £40,000 into the Group Pension Plan. This was structured as a £10,000 contribution, with a cash allowance of £26,362 (balance of a £40,000 contribution less employer’s NI). She also received an additional cash allowance of 20% of base salary.
The Chief Financial Officer (John Parry) participates in the Lloyd’s Pension Scheme, a defined benefit scheme which closed to future accrual on 30 June 2018. From 1 July 2018, John Parry joined the Group Pension Plan with an annual contribution of £10,000. He also received an additional cash allowance of 20% of base salary.
The Performance Management Director is a member of the Group Pension Plan, which is a defined contribution plan, and he received an annual contribution of £10,000. He also received an additional cash allowance of 20% of base salary. From 2019 his pension contribution will decrease to 15% of salary.
Report of the Remuneration Committee continued
94 Lloyd’s Annual Report 2018

Annual remuneration reportThis part of the report sets out the annual remuneration for 2018 and a summary of how the policy will apply for 2019.
Single total figure of remuneration The total remuneration receivable in respect of qualifying services for each person who served as a Board Director or member of Council during the year is shown below. Further detail on annual bonus and market awards (previously “LPP Awards”) is shown on pages 97 to 98.
Salary/fees Other benefits1 Annual bonus Market Award Pension benefit2 Total
2018 £000
2017 £000
2018 £000
2017 £000
2018 £000
2017 £000
2018 £000
2017 £000
2018 £000
2017 £000
2018 £000
2017 £000
Chairman of the CouncilBruce Carnegie-Brown3,4,6,8 600 327 – – – – – – – – 600 327
Executive DirectorsInga Beale4,9 715 715 5 5 405 405 – – 179 179 1,304 1,304Jon Hancock3,5 510 500 15 15 250 204 – – 112 118 887 837
John Neal3,4,9 139 – 5 – – – – – 23 – 167 –
John Parry3,5 434 425 17 17 156 157 – – 124 150 731 749
Non-Executive Council membersWorking membersSimon Beale6 58 57 – – – – – – – – 58 57
Andrew Brooks 39 35 – – – – – – – – 39 35
Dominic Christian6,14 46 39 – – – – – – – – 46 39
Karen Green6,14 65 54 – – – – – – – – 65 54
Julian James 39 39 – – – – – – – – 39 39
Neil Maidment 53 48 – – – – – – – – 53 48
External members
Jeffery Barratt7 39 35 2 – – – – – – – 41 35
Robert Childs6,7 58 46 – – – – – – – – 58 46
Matthew Fosh7 39 39 – – – – – – – – 39 39
Dominick Hoare,7,14 47 27 – – – – – – – – 47 27
Philip Swatman6,7 55 55 – – – – – – – – 55 55
Michael Watson7 48 47 – – – – – – – – 48 47
Nominated membersAndy Haste6 89 88 – – – – – – – – 89 88
Sir David Manning6 46 46 – – – – – – – – 46 46
Christian Noyer10 13 – – – – – – – – – 13 –Non-Executive Board membersMike Bracken11 58 – – – – – – – – – 58 –
Sir Andrew Cahn15 66 72 – – – – – – – – 66 72
Mark Cloutier6 79 78 – – – – – – – – 79 78
Charles Franks6,15 93 88 – – – – – – – – 93 88
Nigel Hinshelwood13 69 – – – – – – – – – 69 –
Patricia Jackson14 85 57 – – – – – – – – 85 57
Fiona Luck6,12 64 – – – – – – – – – 64 –
Martin Read6,15 59 78 1 1 – – – – – – 60 79
Richard Keers 78 78 – – – – – – – – 78 78
Richard Pryce6 70 69 – – – – – – – – 70 69
Lloyd’s Annual Report 2018 95
Market ResultsStrategic Report Society Report Other Information

Salary/fees Other benefits1 Annual bonus Market Award Pension benefit2 Total
2018 £000
2017 £000
2018 £000
2017 £000
2018 £000
2017 £000
2018 £000
2017 £000
2018 £000
2017 £000
2018 £000
2017 £000
Former members of Council and BoardMichael Deeny – – – 1 – – – – – – – 1
Nick Furlonge – 1 – 1 – – – – – – – 2
Joy Griffiths – 39 – – – – – – – – – 39
Lawrence Holder – 3 – – – – – – – – – 3
Fred Hu – 14 – – – – – – – – – 14
Paul Jardine – 5 – – – – – – – – – 5
John Nelson8 – 239 – 32 – – – – – – – 271
The information in the above table has been audited by the independent auditors, PricewaterhouseCoopers LLP.
Table notes1. Other benefits include items such as benefit allowances, medical and life insurance.2. Pension benefit is calculated as 20 times the increase in pension in the year (net of inflation) less the salary sacrificed and includes any pension
cash allowances.3. Current employee of the Corporation.4. Member of both Council and the Board for 2018.5. Member of the Board only.6. Member of the Remuneration Committee during 2018. 7. The following members of Council act as representatives of limited liability underwriting vehicles – Jeffery Barratt (Nameco (No 1249) Ltd), Robert
Childs (Hiscox Dedicated Corporate Member Ltd), Matthew Fosh (Novae Corporate Underwriting Ltd), Dominick Hoare (Munich Re Capital Ltd), Philip Swatman (Nomina No 115 LLP) and Michael Watson (Flectat Ltd).
8. John Nelson retired as Chairman of Lloyd’s on 31 May 2017 and Bruce Carnegie-Brown’s term as Chairman of Lloyd’s started on 15 June 2017.9. Inga Beale ceased as Chief Executive Officer on 13 October 2018 and John Neal started as Chief Executive Officer on 15 October 2018.10. Christian Noyer joined Council on 2 November 2018 and was appointed member of Lloyd’s Brussels Board on the same day.11. Michael Bracken joined the Board on 1 March 2018 and was appointed to the Innovation Investment Committee on 26 July 2018.12. Fiona Luck joined the Board on 1 March 2018 and was appointed to the Risk Committee on 3 April 2018 and the Remuneration Committee on
20 September 2018.13. Nigel Hinshelwood joined the Board on 1 March 2018 and was appointed to the Risk Committee on 21 March 2018 and the Innovation Investment
Committee on 26 July 2018.14. New appointments during the year included Dominic Christian (Nominations and Governance on 23 January 2018); Karen Green (Innovation
Investment Committee on 26 July 2018); Dominick Hoare (Chair of the Innovation Investment Committee on 26 July 2018) and Patricia Jackson (Audit Committee on 24 October 2018).
15. Appointments which ceased during the year included Sir Andrew Cahn (Board on 31 December 2018, Risk Committee on 21 March 2018); Charles Franks (Audit Committee on 3 December 2018) and Martin Read (Board on 19 September 2018, Audit Committee on 19 September 2018 and Remuneration Committee on 13 September 2018).
SalaryThe annual salaries of the Executive Directors take into account a range of factors, including increases for all employees across the Corporation, and are reviewed by the Remuneration Committee annually. 2019 salaries are as follows:
2019 Base salaries
£000Increase on 2018
Chief Executive Officer 650 NA
Performance Management Director 510 0%
Chief Financial Officer (to step down on 23 April 2019) 434 0%
Chief Financial Officer (appointed on 1 April 2019) 450 NA
The average increase awarded to all employees was 2.7%.
Report of the Remuneration Committee continued
96 Lloyd’s Annual Report 2018

Annual bonusExecutive Directors are eligible for a discretionary individual performance award. Payouts are based on the Remuneration Committee’s judgement of performance against corporate and individual Key Performance Indicators (KPIs) for the year. The Committee reviews strategic and operational objectives and KPIs at the start of the financial year, to ensure that they are stretching and aligned to the Corporation’s strategic objectives.
In 2018, annual bonus awards were subject to a “risk underpin”. The Committee assessed performance against a range of Corporation risk and compliance metrics and decided to apply a downward adjustment to a number of individual bonus awards across the Corporation.
Bonus outturns for 2018The following table sets out the strategic targets and performance against each of the annual KPIs linked to our strategy, which resulted in the bonus outcomes for 2018.
Annual KPI (strategic priority) Performance
Market oversight — Continued focus on addressing poor performance in the Lloyd’s market through a targeted remediation programme.
— Syndicate business plans were approved within risk appetites. Key risks were successfully identified and managed through the business planning process, with appropriate level of oversight applied.
— No material concerns were identified from a reinsurance, catastrophe exposure or reserving perspective.
Customers & Distribution — Lloyd’s Brussels successfully commenced live processing of EEA business from November 2018 as planned.
Operations & Services — Achievement of targeted market risks bound electronically ahead of 2018 budget. — Successful launch of Lloyd’s Bridge pilot in July 2018 in the UK, Australia and New Zealand, and Lloyd’s
Workbench pilot was launched in September 2018. — Innovation Lab was delivered on time and on budget with a strong pipeline of managing agents. — Full year run costs below budget offset by higher project costs related to the Brexit project.
Capital — Submission for major change to Lloyd’s internal model was made by the end of September 2018, with written confirmation from the PRA that the change has been approved.
Talent — During 2018, Lloyd’s University expanded to a further ten market companies. — Attraction of diverse employees can be evidenced across hiring activity in 2018.
Brand — 2018 saw significant coverage for Lloyd’s around senior employee changes, Brexit and the remediation process in the UK.
— New Chief Executive Officer carried out a stakeholder engagement exercise, meeting with over 300 market participants and customers.
— During Q4, visits to Lloyds.com increased by 6.7% to 1.16m.
Risk — Management actions were put in place to deal with our risk appetites that were flagged red during the year.
Taking into account an overall assessment of individual performance and contribution, and Corporation risk, the Committee determined the following annual bonus payments:
Role Maximum Outturn
Chief Executive Officer 100% of salary Not applicable (due to time in role)
Former Chief Executive Officer 75% of salary 57% of salary
Chief Financial Officer 50% of salary 36% of salary
Performance Management Director 50% of salary 49% of salary
40% of the 2018 annual bonus will be deferred for payment in April 2022, to comply with Solvency II remuneration requirements on minimum levels of variable remuneration subject to deferral.
Lloyd’s Annual Report 2018 97
Market ResultsStrategic Report Society Report Other Information

Market award (previously Lloyd’s Performance Plan or “LPP”)The Market award has been designed to meet Lloyd’s strategic objectives by enabling the Corporation to offer an incentive which:
— is directly linked to the profitability of the Lloyd’s market and will therefore encourage an attitude of commercial partnership with the market and align the interests of participants with capital providers;
— will provide a competitive reward and therefore assist the Corporation in attracting and retaining the talented individuals required to develop and support future strategy; and
— from 2018 is subject to personal performance.
The plan is operated at the discretion of the Remuneration Committee and can be amended or terminated at any time.
All employees of the Corporation and international offices were eligible to participate in the market award for 2018 on the basis set out below.
Overview of Market awards — Market awards are calculated by reference to PBT, as reported in the Pro Forma financial statements in the Lloyd’s Annual Report for each financial year.
— Awards will only be triggered for PBT in excess of £100m.
— Awards for each financial year will be calculated as a percentage of the participants’ salaries at 31 December in that year, for each £1bn of PBT.
— Market awards are subject to a “risk underpin”. The Committee assesses performance against market-based risk and compliance metrics and may apply a downward adjustment where appropriate.
— In respect of the Chief Executive Officer and all Directors and other designated Solvency II staff, any market awards are deferred (subject to a proportionality threshold as described below).
— For senior management employees whose remuneration is below the proportionality threshold set in line with Solvency II remuneration requirements, the market award will be paid on an ongoing fund basis. Under this approach, one half of an award will be paid in April following the relevant financial year, with the remaining 50% paid one year later.
— For other employees, the market award is paid in full in April following the relevant financial year.
From 2019, PBT and COR will be the metrics to measure market performance, in order to provide a more balanced approach to performance measurement and to better reflect the focus of the Corporation and its drive for improved efficiencies and transformation in the Lloyd’s market. The deferral of variable pay under the Lloyd’s Incentive Plan will also be simplified, such that 40% of the total individual and market awards will be deferred for three years. This will apply to relevant Solvency II staff above the proportionality threshold.
The framework for determining market awards for 2018 was as follows:
Job level Amount of market award Limits on market awards (cap as a % of salary)
Executive Directors and other Directors* 15% of salary per £1bn of PBT 50%
Senior managers (grade 16 and above) 10% of salary per £1bn of PBT 30%
Other employees (grade 15 and below) 5%-3% of salary per £1bn of PBT (depending on level) 15%-9% (depending on grade)
* The former Chief Executive Officer, who left Lloyd’s employment on 7 December 2018, was on a legacy arrangement of 20% of salary per £1bn PBT, capped at 100% of salary.
2018 market awards (outturns)For 2018, no market awards are payable. (2017: no award payable). Market awards, or LPP for Executive Directors were previously structured as an ongoing fund. A summary of fund movements in the year is provided below:
Total fund outstanding as at 31 December 2017
or date of appointment £000
Amount paid during the year ended
31 December 2018 £000
Market award in respect of 2018
£000
Total fund outstanding as at 31 December 2018
£000
Inga Beale (former Chief Executive Officer) 448* (223) – 225
Jon Hancock – – – –
John Parry 245* (135) – 110
* See further information on departing Directors and Executives on page 100.
The information in this table has been audited by the independent auditors, PricewaterhouseCoopers LLP.
Report of the Remuneration Committee continued
98 Lloyd’s Annual Report 2018

PensionsInga Beale received an annual contribution of £40,000 into the Group Pension Plan, the Corporation’s pension scheme. From April 2016, due to changes in the annual allowance, this has been structured as a £10,000 contribution, with a cash allowance of £26,362 (which is the balance of a £40,000 contribution less employer’s NI). The former Chief Executive Officer also received a cash allowance of 20% of salary.
Jon Hancock receives an annual contribution of £10,000 into the Group Pension Plan. He also receives an annual cash allowance of 20% of base salary. From 2019 his pension contribution will decrease to 15% of salary.
John Parry is a member of the Lloyd’s Pension Scheme, which closed to future accruals on 30 June 2018. The terms of the Scheme and details of accruals and contributions in the year are as follows:
Details of pension arrangements
Pension arrangements provide for a pension at normal retirement of two thirds base annual salary after 20 years’ eligible service less any entitlement from previous pension arrangements and subject to a Scheme earnings cap of £160,800 from 6 April 2018.
Contributions and accruals in 2018
Salary sacrifice of 10% of the earnings cap in exchange for additional employer pension contributions of the same amount.
Details of his rights under the Lloyd’s Pension Scheme and the transfer value of accrued pension benefits are set out below.
Scheme rights Transfer value
Salary sacrifice in year to
31 December 2018
£000
Age at 31 December
2018
Increase in pension
in year to 31 December 2018 – actual
£000
Increase in pension
in year to 31 December 2018 – net of
price inflation £000
Total accrued annual pension
in year to 31 December
2018£000 pa
Normal retirement
age
Transfer value of accrued
pension as at 31 December
2017 £000
Transfer value of accrued
pension as at 31 December
2018£000
Movement in transfer value over
the year less amounts salary
sacrificed £000
16 55 5 4 75 60 1,535 1,613 78
The transfer value represents a liability of the Lloyd’s Pension Scheme, not a sum paid or due to the individual. The transfer value has increased over the year in line with the increase in accrued pensions and due to changes in market conditions.
From 1 July 2018, John Parry joined the Group Pension Plan on the same terms as other Executive Directors (i.e. capped annual contribution of £10,000). He continues to receive a cash allowance of 20% of base salary.
No other payments to the Executive Directors are pensionable. Their dependants are eligible for the payment of a lump sum in the event of death in service and, for John Parry, dependants’ pensions.
Newly appointed Chief Executive Officer and Chief Financial Officer Chief Executive Officer (John Neal)John Neal was appointed as Chief Executive Officer on 15 October 2018. His remuneration package is as follows:
— Salary – £650,000.
— Pension cash supplement – 15% of salary, in line with the maximum contribution available to wider Corporation employees.
— Benefits allowance – 3% of salary.
— Maximum individual performance award – 100% of salary. Performance will be assessed against a balanced scorecard framework.
— Maximum market award – 50% of salary.
— No buyout awards were made on appointment.
Lloyd’s Annual Report 2018 99
Market ResultsStrategic Report Society Report Other Information
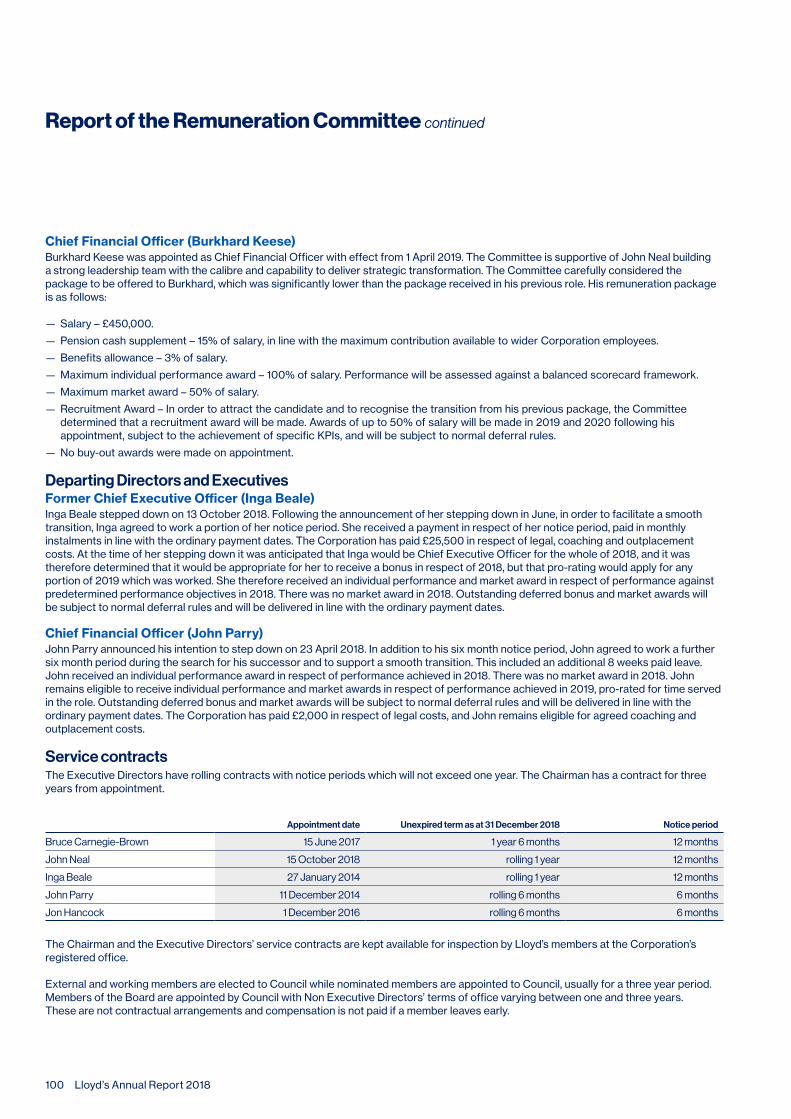
Chief Financial Officer (Burkhard Keese)Burkhard Keese was appointed as Chief Financial Officer with effect from 1 April 2019. The Committee is supportive of John Neal building a strong leadership team with the calibre and capability to deliver strategic transformation. The Committee carefully considered the package to be offered to Burkhard, which was significantly lower than the package received in his previous role. His remuneration package is as follows:
— Salary – £450,000.
— Pension cash supplement – 15% of salary, in line with the maximum contribution available to wider Corporation employees.
— Benefits allowance – 3% of salary.
— Maximum individual performance award – 100% of salary. Performance will be assessed against a balanced scorecard framework.
— Maximum market award – 50% of salary.
— Recruitment Award – In order to attract the candidate and to recognise the transition from his previous package, the Committee determined that a recruitment award will be made. Awards of up to 50% of salary will be made in 2019 and 2020 following his appointment, subject to the achievement of specific KPIs, and will be subject to normal deferral rules.
— No buy-out awards were made on appointment.
Departing Directors and ExecutivesFormer Chief Executive Officer (Inga Beale)Inga Beale stepped down on 13 October 2018. Following the announcement of her stepping down in June, in order to facilitate a smooth transition, Inga agreed to work a portion of her notice period. She received a payment in respect of her notice period, paid in monthly instalments in line with the ordinary payment dates. The Corporation has paid £25,500 in respect of legal, coaching and outplacement costs. At the time of her stepping down it was anticipated that Inga would be Chief Executive Officer for the whole of 2018, and it was therefore determined that it would be appropriate for her to receive a bonus in respect of 2018, but that pro-rating would apply for any portion of 2019 which was worked. She therefore received an individual performance and market award in respect of performance against predetermined performance objectives in 2018. There was no market award in 2018. Outstanding deferred bonus and market awards will be subject to normal deferral rules and will be delivered in line with the ordinary payment dates.
Chief Financial Officer (John Parry)John Parry announced his intention to step down on 23 April 2018. In addition to his six month notice period, John agreed to work a further six month period during the search for his successor and to support a smooth transition. This included an additional 8 weeks paid leave. John received an individual performance award in respect of performance achieved in 2018. There was no market award in 2018. John remains eligible to receive individual performance and market awards in respect of performance achieved in 2019, pro-rated for time served in the role. Outstanding deferred bonus and market awards will be subject to normal deferral rules and will be delivered in line with the ordinary payment dates. The Corporation has paid £2,000 in respect of legal costs, and John remains eligible for agreed coaching and outplacement costs.
Service contracts The Executive Directors have rolling contracts with notice periods which will not exceed one year. The Chairman has a contract for three years from appointment.
Appointment date Unexpired term as at 31 December 2018 Notice period
Bruce Carnegie-Brown 15 June 2017 1 year 6 months 12 months
John Neal 15 October 2018 rolling 1 year 12 months
Inga Beale 27 January 2014 rolling 1 year 12 months
John Parry 11 December 2014 rolling 6 months 6 months
Jon Hancock 1 December 2016 rolling 6 months 6 months
The Chairman and the Executive Directors’ service contracts are kept available for inspection by Lloyd’s members at the Corporation’s registered office.
External and working members are elected to Council while nominated members are appointed to Council, usually for a three year period. Members of the Board are appointed by Council with Non Executive Directors’ terms of office varying between one and three years. These are not contractual arrangements and compensation is not paid if a member leaves early.
Report of the Remuneration Committee continued
100 Lloyd’s Annual Report 2018

Additional disclosuresTen year Chief Executive Officer remuneration
CEO single figure of total remuneration
£000
Annual bonus
award as a percentage
of maximum opportunity
Market award /LPP
award as a percentage
of maximum opportunity
2018* 1,304 76% 0%
2017 1,304 76% 0%
2016 1,525 75% 63%
2015 1,531 81% 63%
2014 1,494 74% 95%
2013 1,795 75% 65%
2012 1,759 75% 55%
2011 1,499 90% 0%
2010 1,750 90% 44%
2009 1,771 83% 77%
* Relates to former Chief Executive Officer.
Chief Executive Officer pay increase in relation to all employeesThe table below sets out details of the change in remuneration for the Chief Executive Officer and all Corporation employees.
CEO %
All employees
%
Salary – 3
Other benefits (2) 3
Annual bonus – 3
Relative importance of spend on pay
2018 £m
2017 £m
Corporation operating income 352 351
Total remuneration – all employees 139 120
Corporation operating income excludes income relating to the Central Fund. Total remuneration excludes items such as employer’s social security costs, net interest on defined benefit liability, non-executive remuneration, and recruitment fees.
Remuneration for the Chairman and members of the Council and Board who are not employees of the CorporationThe Chairman’s remuneration will not be increased in 2019 and will remain unchanged at £600,000 per annum.
Fees for 2018 for Council and Board members were £38,500 and £62,000 per annum respectively. Fees will not be increased for Board members for 2019. Fees are also payable in respect of membership of a number of Council and Board committees, including ad hoc committees established to consider specific issues requiring a significant time commitment. Fees payable for members of the Risk Committee were increased for 2018. The additional fee payable to the Deputy Chairmen, over and above the standard Council member’s fee, was increased to £12,000 for 2018.
Lloyd’s Annual Report 2018 101
Market ResultsStrategic Report Society Report Other Information

Details of the Remuneration Committee, advisers to the Committee and their feesWithin the policy for remuneration approved by the Council, the Remuneration Committee is responsible for setting the total individual remuneration package for the Chairman of Lloyd’s, the Chief Executive Officer, each Executive Director, any other senior direct reports of the Chief Executive Officer and such other members of the executive management (including those designated as Solvency II staff for remuneration purposes, an individual consultants) as it is designated to consider.
The Remuneration Committee currently comprises six members – three members of Council, two members of the Board and the Chairman of Lloyd’s. It has been chaired by Andy Haste (a Nominated member of Council and Senior Independent Deputy Chairman) since November 2012.
The Remuneration Committee met eight times in 2018. The attendance record is set out in the Corporate Governance report on pages 80 to 81. The Committee’s terms of reference are available on lloyds.com and on request from the Secretary to the Council.
The Remuneration Committee was assisted by its remuneration consultants, Deloitte LLP, who adhere to the Code of Conduct for executive remuneration consultants. Deloitte LLP was appointed by the Remuneration Committee. Deloitte LLP adheres to working practices which have been agreed with the Remuneration Committee Chairman, for the purpose of maintaining independence.
The Committee is satisfied that the advice received from Deloitte LLP was objective and independent. Total fees paid in respect of advice and services to assist the Remuneration Committee amounted to £93,050 for the year. Deloitte LLP also provided other services to the Corporation during the year, including the co-sourced Internal Audit resource, risk and project management advice, other ad hoc assurance services and tax advice.
At the request of the Remuneration Committee, the Chief Executive Officer and Chief People Officer regularly attend Remuneration Committee meetings. Other senior executives, for example the Chief Risk Officer are invited to attend for specific agenda items from time to time.
Neither the Chairman, nor the Executive Directors or any other Director, play a part in any discussion about his or her own remuneration.
Report of the Remuneration Committee continued
Remuneration policy The Corporation is not required to comply with the Directors’ remuneration reporting regulations, including the requirement for a binding remuneration policy for executive directors, as these only apply to UK listed companies. Nonetheless, in line with good practice, this part of the report sets out the key features of the Corporation’s remuneration policy. Note that this is in a shortened format compared to the regulatory requirements. The policy is not legally binding, and the Committee reserves the right to amend the policy at any time.
Key changes to the remuneration policy for 2019 are set out below:
— Remuneration packages for executives with Board member roles will be rebalanced, with reduced emphasis on fixed pay, and a greater weighting of variable pay elements linked to measurable strategic KPIs.
— Simplification and reduction of pension arrangements. Pension cash supplements for new executive directors and for the Performance Management Director are reduced to 15% of salary, which is in line with the maximum available to wider Corporation employees.
— The annual bonus opportunity is increased to 100% of salary for the Chief Executive Officer, Chief Financial Officer and Performance Management Director (from 75% of salary and 50% of salary respectively). Notwithstanding this, under the rebalanced approach, the proportion of pay relating to incentives continues to be below market levels, reflecting the oversight role of the Corporation.
— Deferral will be simplified. From 2019 awards onwards, 40% of the total Lloyd’s Incentive Plan award will be deferred for three years and paid in April of the fourth financial year following the end of the performance period. This approach will apply consistently to all relevant Solvency II employees above the proportionality threshold.
— From 2019, PBT and COR will be the key metrics of market performance in order to better reflect the focus of the Corporation.
— The annual bonus will be assessed against a balanced scorecard framework incorporating strategic initiatives, business priorities, culture and risk & compliance metrics.
102 Lloyd’s Annual Report 2018

Remuneration policy
Base salary
— Salaries set to appropriately recognise responsibilities and be broadly market competitive. — Generally reviewed annually by the Remuneration Committee. — No maximum salary increase; however, any increases will generally reflect our approach to all employee salary
increases. Exceptions, in certain circumstances, may be made, for example to reflect a new appointment, change in role or adoption of additional responsibilities, changes to market practice or the development of the individual in the role.
Lloyd’s Incentive Plan
Individual performance award
Performance measures — Individual performance awards paid by reference to performance against a balanced scorecard of strategic
objectives and KPIs during the year. — Individual awards are subject to a “risk underpin”. The Committee will assess performance against Corporation
risk and compliance metrics, and may apply a downward adjustment where appropriate.
Maximum — Current individual maximums are 100% of salary for Executive Directors.
Operation — From 2019 awards onwards, 40% of the total Lloyd’s Incentive Plan award will be deferred for three years and paid
in April of the fourth financial year following the end of the performance period. This will apply to relevant Solvency II staff above the proportionality threshold.
— The Committee may apply malus and clawback to individual awards (see overleaf).
Market award (formerly LPP)
Performance measures — Market awards directly linked to Lloyd’s market profitability in the year, subject to a minimum threshold of £100m.
From 2019, market awards will be subject to the achievement of PBT and COR metrics. — Market awards are subject to a “risk underpin”. The Committee will assess performance against market based risk
and compliance metrics, and may apply a downward adjustment where appropriate. — The Market element is also subject to individual performance.
Maximum — Current individual maximums are 50% of salary for Executive Directors.
Operation — From 2019 onwards, 40% of the total Lloyd’s Incentive Plan award will be deferred for three years and paid in April
of the fourth financial year following the end of the performance period. This will apply to relevant Solvency II staff above the proportionality threshold.
— The Committee may apply malus and clawback to market awards (see overleaf).
Pension — Executive Directors will receive a pension contribution of 15% of salary.
Benefits
— Benefits may include a benefits cash allowance, private medical insurance, life insurance and a season ticket loan facility.
— Relocation benefits may be offered in certain circumstances. — Executive Directors will receive a benefits cash allowance of 3% of salary.
Lloyd’s Annual Report 2018 103
Market ResultsStrategic Report Society Report Other Information

Malus and ClawbackFor incentive awards in respect of 2014 and subsequent years, malus and clawback provisions apply.
Malus may be applied prior to payment including any deferral period. For senior employees (excluding the Chief Executive Officer) the circumstances in which malus may be applied are employee misconduct, material financial misstatement for which the employee was responsible, or deliberate or negligent failure in risk management for which the employee was responsible. In addition, the Committee retains the discretion to clawback awards for a period of six years from the date of award. The circumstances in which clawback may be applied are serious employee misconduct, material financial misstatement for which the employee was responsible, or deliberate failure in risk management for which the employee was responsible.
For the Chief Executive Officer, the circumstances in which malus and clawback may be applied are broader and include, but are not limited to, employee misconduct or the performance indicators relied on by the Committee being found to be materially different to those previously considered by the Committee (whether or not involving any culpability on the part of the individual), or deliberate or negligent failure in risk management for which the Chief Executive Officer was solely or in part responsible. The clawback period is indefinite for the Chief Executive Officer.
Approach to remuneration in respect of recruitment The following broad principles would apply when agreeing the components of a remuneration package upon the recruitment of a new executive director:
— Any package will be sufficient to attract executive directors of the calibre required to deliver the Corporation’s strategic priorities.
— Typically, the individual will be transitioned onto an ongoing remuneration package that is in line with the remuneration policy above.
— The Committee may, on appointing an executive director, need to “buy out” terms or remuneration arrangements forfeited on leaving a previous employer. The terms of any buy out would be determined taking into account the terms of the forfeited awards and the overriding principle will be that any replacement buy out awards should be of comparable commercial value to the awards that have been forfeited with comparable time horizons.
Report of the Remuneration Committee continued
— The Committee retains the flexibility to make additional awards for the purpose of recruitment where there is a strong rationale to do so.
— Where an executive director is appointed from within the organisation, the normal policy is that any legacy arrangements would be honoured in line with the original terms and conditions.
Compensation for termination of employment The following broad principles would apply when determining the termination arrangements for an executive director:
— If an executive director works out his or her notice period, he or she will be entitled to payment as normal during the period of notice. Alternatively, the Corporation reserves the right to terminate the employment by making a payment in lieu of notice.
— In these circumstances, the Corporation’s policy is that the outgoing employee would be entitled to receive an amount equal to base salary only in respect of his or her notice period. The sum may be paid in monthly instalments at the Corporation’s discretion and may be reduced to reflect alternative income.
— If an executive director leaves the Corporation’s employment on or before the date on which an annual bonus award would otherwise have been paid, they will not be entitled to that annual bonus award. However, the Remuneration Committee may determine that the executive director may receive a bonus in respect of the financial year of cessation based on performance in the year.
— If an executive director leaves the Corporation’s employment on or before the date on which a market award would otherwise have been paid, they will not be entitled to that market award. However, the Remuneration Committee may determine that the executive director may receive a market award in respect of the financial year of cessation based on performance in the year.
Andy HasteChairman, Remuneration Committee 26 March 2019
104 Lloyd’s Annual Report 2018

Statement by Chair of Audit CommitteeI am pleased to present the Report of the Audit Committee for the year ended 31 December 2018. The report explains the work of the Committee during the year and the key role it plays in overseeing the integrity of the Society’s financial reporting and internal control environment. The report comprises the following sections:
— Composition of the Audit Committee;
— Financial Reporting;
— Internal Control; and
— Auditors.
Our principal aim is to assist the Council and Board in discharging their responsibilities for monitoring the integrity of the Society’s financial reporting, assessing the effectiveness of the systems of internal control of the Society and monitoring the effectiveness, independence and objectivity of the internal and external auditors.
The terms of reference of the Audit Committee can be found on lloyds.com.
Richard KeersChairman, Audit Committee 26 March 2019
Composition of the Audit CommitteeAt the end of 2018 the Audit Committee comprised two external members of the Council and four Non-Executive members of the Board. The Committee met four times during the year.
The Council and Board requires the Committee to operate effectively and efficiently and its members to have a balance of skills and experience to enable it to fulfil its responsibilities in a robust and independent manner. Members of the Committee have varied and extensive commercial experience, including as executives in the international insurance and reinsurance sectors, brokerage, commercial and investment banking and asset management, as well as audit, risk and prudential regulation.
The Council and Board has determined that, by virtue of their previous experience gained in other organisations, members collectively have the competence and skills required to discharge the terms of reference and responsibilities of the Committee. In addition, the Council and Board consider that Richard Keers, a chartered accountant, has the recent and relevant financial experience required to chair the Committee.
Biographical details and experience of the members of the Committee in 2018 and their attendance at meetings are shown in the Corporate Governance report on pages 73 to 89.
The Chief Executive Officer, Chief Financial Officer, Chief Risk Officer and other senior management regularly attend meetings at the invitation of the Chairman, together with the Head of Internal Audit and the external auditor, PricewaterhouseCoopers LLP. The Committee as a whole meets privately with each of the Head of Internal Audit and external auditor on a regular basis.
In addition, throughout the year, the Chairman of the Committee meets informally and has open lines of communication with the Executive Committee, Head of Internal Audit, external auditors and senior management to discuss topical issues and operations of the Society. These meetings provide an opportunity for any matters to be raised confidentially.
The Committee received regular technical updates from senior management and the external auditor on developments in financial reporting, accounting policy and regulatory developments throughout the year.
Financial reportingDuring 2018 the Committee reviewed the Lloyd’s published Annual and Interim Reports, including the Pro Forma Financial Statements and the Society Report. The Committee also reviewed the Lloyd’s Solvency and Financial Condition Report. The Committee, with the support of the external auditor, assessed whether suitable accounting policies had been adopted and whether management had made appropriate estimates and judgements in preparing these financial statements.
The Committee also reviewed the statements and disclosures in relation to internal control, risk management, viability and going concern.
The principal issues reviewed were:
— The key themes and structure of the 2018 Annual Report, including changes in content, structure and disclosure arising from guidance issued by the Financial Reporting Council;
— The presentation of the Pro Forma Financial Statements and related disclosures on the basis of preparation as an aggregation of the Lloyd’s market results;
— The market notional investment return on Funds at Lloyd’s and the methodology for their calculation;
— The valuation of investments held by both the Society and within Funds at Lloyd’s, on an exceptional basis;
— A review of significant estimates and judgements, including the review of key assumptions and valuation of the Lloyd’s pension scheme and the Society lease provision.
— Assessment of the viability statement within the Society Report over a three-year period, including assessment of the impact of the strategic plan, Own Risk & Solvency Assessment and solvency projections for the Society;
— The continuing status of the Society as a going concern as part of the Annual and Interim reporting processes; and
— Reporting requirements and governance arrangements for Solvency II Pillar 3 reporting for both the market and the Society.
Report of the Audit Committee
Lloyd’s Annual Report 2018 105
Market ResultsStrategic Report Society Report Other Information

A key focus of the Committee is its work in assisting the Council and Board in ensuring that the Annual Report, when taken as a whole, is fair, balanced and understandable. The Committee considered the key messages being communicated in the Annual Report, as well as the information provided to the Committee throughout the year and their discussion on these. The Committee, having completed its review, recommended to the Board and Council that, when taken as a whole, the 2018 Annual Report is fair, balanced and understandable and provides the information necessary to assess the Society’s position and performance, business model and strategy.
During the year, the Committee has continued to keep abreast of significant and emerging accounting developments, in particular, changes to IFRS relating to lease accounting in 2019 and insurance accounting and the Society’s preparations for the adoption of IFRS 17 in 2022.
Internal controlThe Board, on behalf of the Council, has responsibility for the Society’s system of internal control and for reviewing its effectiveness. The Board has delegated to the Audit Committee responsibility for reviewing its effectiveness and monitoring of the risk and internal controls framework for the Society. The Audit Committee provides biannual reports to the Board in its review.
On behalf of the Board, the Committee carried out the biannual assessment of the effectiveness of internal controls during 2018, including those related to the financial reporting process. The Committee also considered the adequacy of the Group’s risk management arrangements in the context of the Society’s business and strategy.
In carrying out its assessment, the Committee considered reports from the Chief Financial Officer, Chief Risk Officer, Head of Group Finance, Head of Internal Audit, other senior management, and also from the external auditor. Regular reports and updates on specific control issues were received throughout the year. Specific issues considered were:
— The Committee reviewed reports from the Risk Committee on developments to the Lloyd’s Risk Framework. The Committee also considered the quarterly Own Risk & Solvency Assessment reports. Throughout the year, the Committee was updated on the key risks which are set out on pages 14 to 15;
— The Committee reviewed internal audit reports, the actions taken to implement the recommendations made in the reports and the status of progress against previously agreed actions;
— The Committee reviewed the external auditor’s controls observation report and management’s assessment of the internal control environment, including reports on control failures during the period and status of progress against previously agreed actions;
— The Committee also reviewed specific updates on the Lloyd’s Speaking Up Survey, Lloyd’s America, Financial crime governance and oversight, and the status of the Society’s preparations in respect of Brexit.
AuditorsInternal auditThe Internal Audit function provides the Committee and Executive Committee with independent and objective assurance on the effectiveness of internal control and risk management across the Society and its subsidiaries. The Head of Internal Audit has a direct reporting line to the Chairman of the Committee with an administrative reporting line to the Lloyd’s Chief Executive Officer.
The use of Internal Audit is governed by a Charter and Operating Standards which sets out the authority scope and remit of the Internal Audit function. Internal Audit sets an annual plan of work which considers an independent view of the risks facing the Society, as well as other factors such as strategic initiatives, emerging risks and change. The annual plan is approved and regularly reviewed by the Committee and is updated as necessary to ensure appropriate focus on the key risks. The Committee is responsible for ensuring that Internal Audit has the appropriate resources and budget. For 2018 the Committee was satisfied that the appropriate resources were in place.
The Committee satisfies itself as to the quality, experience and expertise of the Internal Audit function through regular interaction with the Head of Internal Audit. The performance of Internal Audit is subject to ongoing assessment and to an annual formal evaluation that is achieved through assessment of the results of feedback and questionnaires completed by the Executive Committee and departments that have been subject to an internal audit, in addition to the Committee members’ own views.
Deloitte LLP provides co-sourced Internal Audit resource and report directly to the Head of Internal Audit. The Committee keeps under review the relationship with Deloitte LLP and the procedures to ensure appropriate independence of the Internal Audit function is maintained.
External auditorThe Committee has the primary responsibility for the appointment and reappointment of the external auditor and overseeing the effectiveness of the ongoing audit relationship. The Committee places great importance on the quality, effectiveness and independence of the external audit process and monitors and reviews the objectivity and independence of the external auditor.
The Committee assesses the effectiveness of the external auditor against some of the following criteria:
— Provision of timely and accurate industry specific technical knowledge;
— The level of professionalism and open dialogue with the Chair of the Committee and its members at all times;
— Delivery of an efficient and effective audit and the ability to meet objectives within agreed timescales; and
— The quality of the external auditor’s findings, management’s responses and stakeholder feedback.
Report of the Audit Committee continued
106 Lloyd’s Annual Report 2018

In addition, the Committee performs a specific evaluation of the performance of the external auditor annually, through assessment of the results of feedback and questionnaires completed by members of the Executive Committee and senior management, together with Committee members’ own views.
The Committee is satisfied with the performance of the Society’s external auditor, PricewaterhouseCoopers LLP. The Committee concluded that there has been appropriate focus and challenge by the external auditor on the primary areas of the audit and they have provided robust challenge throughout the audit process.
In discharging its responsibilities for approving the terms of engagement of the external auditor and monitoring its independence, the Committee oversees the engagement of the external auditors for non-audit services.
This includes having in place a policy to govern the non-audit services that may be provided to the Society by the external auditor, setting out the circumstances in which the external auditor may be permitted to undertake non-audit services. All non-audit services require approval from the Committee and must be justified and, if appropriate, tendered before approval.
A breakdown of the fees paid to the external auditor for non-audit work may be found in note 7. Significant engagements undertaken in 2018 include services pursuant to legislation (work undertaken on the Aggregate Accounts and regulatory returns) and the Pro Forma Financial Statements.
The Committee receives a regular report on engagements undertaken by the external auditor in order to monitor the types of services provided and the fees incurred and to ensure they do not impair the ongoing independence and objectivity of the external audit. The external auditor also confirmed to the Committee that they believe they remain independent within the meaning of the regulations on this matter and their professional standards.
Lloyd’s Annual Report 2018 107
Market ResultsStrategic Report Society Report Other Information

Report of the Lloyd’s Members’ Ombudsman
Report by Mark Humphries, Lloyd’s Members’ OmbudsmanI am pleased to present the Annual Report of the Lloyd’s Members’ Ombudsman to the Council for the year ended 31 December 2018.
The role of the Lloyd’s Members’ Ombudsman is to investigate complaints by members and former members who were members at any time after 30 November 2001 and who believe that they have suffered injustice in consequence of maladministration in relation to any action taken by or on behalf of the Society.
Complaints receivedDuring the course of the year no complaints were received by my office.
CostsThe expenses incurred by my office amounted to £15,000.
108 Lloyd’s Annual Report 2018

Financial Review
This review should be read in conjunction with the financial statements of the Society on pages 122 to 180 and the Strategic Report on pages 10 to 21. These sections set out the strategic priorities for both the Society and the Lloyd’s market as a whole.
Operating surplusThe Society of Lloyd’s achieved an operating surplus for the year of £139m (2017: surplus of £170m). The operating surplus by business segment is set out below:
Corporation of Lloyd’s
£m
Lloyd’s Central Fund
£m
2018Total
£m
2017Total
£m
Total income 352 149 501 476
Central Fund claims and provisions incurred – – – –
Other Group operating expenses (350) (12) (362) (306)
Operating surplus 2 137 139 170
Corporation of Lloyd’sTotal income for the Corporation increased by £1m to £352m (2017: £351m); within this, subscription income was broadly flat. The subscription rate changed on 1 January 2018 from 0.40% of gross written premiums to 0.36% of gross written premiums (further details are given in note 3), which was partially offset by the higher level of premiums written after a small adverse movement in exchange rates.
In aggregate, other income streams also increased compared with the prior period, reflecting an increase in the overseas levy which covers the cost of our global network. Within income, premiums written through Lloyd’s Insurance Company (China) Limited decreased to £176m (2017: £253m) reflecting a reduction across a number of lines of business. All business underwritten through the company is reinsured to Lloyd’s syndicates.
Other Group operating expenses increased to £350m (2017: £294m), primarily as a result of continued investment in strategic priorities, including Brexit and market modernisation.
Central FundTotal income for the Central Fund increased by £24m to £149m (2017: £125m). Contribution income increased as a result of the higher level of written premiums, partially offset by a small adverse movement in exchange rates, together with recoveries in respect of Undertakings previously given by the Central Fund. The rate of contribution remained constant at 0.35% of gross written premiums (further details are given in note 3).
Central Fund claims and provisions were nil for the year (2017: nil). Undertakings to meet the liabilities of insolvent members to policyholders are approved at the discretion of the Council and are normally based on anticipated cash flow requirements of insolvent members in the following 12 months. No payments were made in respect of insolvent corporate members (2017: nil).
Other Group operating expenses were flat at £12m (2017: £12m).
Investment performance
2018£m
2017£m
Finance income 93 62
Finance costs (39) (55)
54 7
The Society’s investments, mostly held within the Central Fund, returned £93m or 2.4% during the year (2017: £62m, 1.7%). Excluding exchange rate movements, investments generated a loss of £7m or -0.2% during the year (2017: return of £170m or 4.6%).
2018 saw a resurgence of volatility for risk assets as investor concern over rising interest rates and the threat of global trade wars weighed on sentiment. Brexit uncertainty was an added headwind for the UK and wider European region. The resilience of markets was finally tested in October culminating in an acute downturn. The fourth quarter was particularly turbulent marked by a sharp fall in equity prices, a widening of corporate bond spreads and government bonds becoming a safe haven asset. Over the year as a whole, risk assets generated losses, credit spread widening on corporate bonds weakened fixed interest asset performance and government bonds produced positive returns.
Lloyd’s Annual Report 2018 109
Market ResultsStrategic Report Society Report Other Information

Financial Review continued
Investment performance continuedA significant weighting in money market and fixed interest investments in the Central Fund investment portfolio helped to dampen the effect of risk asset adverse performance and a small investment loss was generated overall, excluding foreign exchange impact. The Society’s currency policy, which aims to preserve the solvency strength of the Central Fund by holding US dollars, delivered its objective and results also benefitted with mark to market gains from US dollar strengthening.
TaxationA tax charge of £39m (2017: £31m) on the surplus before tax of £202m (2017: £187m) has been recognised for the year ended 31 December 2018. Further details are set out in note 12.
Movement in net assets (£m)Net assets at 1 January 2018*
Surplus for the year
Actuarial gain on pension schemes
Currency translation di�erences
Tax charge on other comprehensive income
Unrealised gain on revaluation of Lloyd’s collection
Net assets at 31 December 2018*
Additions to net assets
2,188
163
72
4
2
(12)
2,417
Deductions to net assets Net assets
* Net assets data not to scale.
The net assets of the Central Fund are included within the above amounts and at 31 December 2018 were £2,184m (2017: £2,043m).
110 Lloyd’s Annual Report 2018

Pension schemesLloyd’s pension schemeOn an IFRS basis, the Lloyd’s pension scheme valuation at 31 December 2018 was a deficit of £87m (31 December 2017: deficit of £161m) before allowance for a deferred tax asset of £15m (2017: £27m).
The movement in the pension deficit during the year is summarised below:
2018£m
2017£m
Pension deficit as at 1 January (161) (228)
Pension (expense)/gain recognised in the Group income statement (12) 2
Employer contributions 15 17
Remeasurement effects recognised in the Group statement of comprehensive income 71 48
Pension deficit as at 31 December (87) (161)
The reduction in the pension deficit was mainly due to a rise in corporate bond yields and a change in demographic and financial assumptions, partly offset by lower than expected asset returns during the year. Further details are provided in note 13 which includes the sensitivity of the valuation to changes in these assumptions.
The triennial funding valuation as at 30 June 2016 was undertaken by Willis Towers Watson. The total market value of the Scheme’s assets at the date of the valuation was £667m and the total value of accrued liabilities was £730m showing a funding deficit of £63m. These figures exclude both liabilities and the related assets in respect of money purchase Additional Voluntary Contributions (AVCs). A recovery plan is in place and has been agreed with the Trustees. This will be kept under review as circumstances develop.
The Lloyd’s Pension Scheme closed to new members in 2013 and closed to future accrual for existing members on 30 June 2018. Existing members of the Scheme at that time were enrolled into the Group Personal Pension Plan for future pension benefits. The contribution rates for this plan were externally benchmarked and revised at this time, with increased rates approved from 2018 for all employees.
Overseas pension schemesThe actuarial valuations of the overseas pension schemes at 31 December 2018 resulted in a deficit of £3m (2017: deficit of £3m). Further details are provided in note 13.
Lloyd’s Annual Report 2018 111
Market ResultsStrategic Report Society Report Other Information

SolvencyTotal assets for solvency purposes are set out below. The 2018 position is an estimate of the amount which will be finalised in April 2019 for submission to the PRA. The figures are calculated on a Solvency II basis. The solvency figures in the table below are unaudited:
2018£m
2017£m
Central assets at 31 December 2,417 2,188
Subordinated debt 794 793
Total 3,211 2,981
Solvency valuation adjustments 436 597
Available central own funds to meet the Central Solvency Capital Requirement (SCR) 3,647 3,578
Excess central own funds not eligible to meet the Central SCR (153) (133)
Eligible central own funds available to meet the Central SCR 3,494 3,445
Central SCR 1,400 1,600
Central solvency ratio 250% 215%
The central SCR covers central risks of the Society. This includes the risk that members may have insufficient capital to meet their losses. The central SCR may be covered only by central eligible own funds of the Society.
The solvency valuation adjustments above include items such as valuation differences arising and assets being disallowed due to the valuation principles used in Solvency II. It also includes recognition of the callable layer, which may be taken from member level capital to strengthen central resources.
The eligibility of assets to count towards the solvency coverage is also subject to tiering restrictions. All Tier 1 assets count fully towards the solvency coverage assessment. However, Tier 2 and Tier 3 assets may only count up to a maximum of 50% of the SCR. The inclusion of the Tier 2 subordinated debt issued in early 2017 means that Lloyd’s Tier 2 and 3 central capital exceeded 50% of the central SCR by £153m as at 31 December 2018. (2017: £133m).
Based on central own funds eligible to meet the central SCR of £3.5bn (2017: £3.4bn), the estimated solvency ratio is 250% (2017: 215%). In setting contribution levels, account is taken of the central SCR to ensure that Lloyd’s is prudently but competitively capitalised.
BrexitIn 2018 the Society continued working to ensure the Lloyd’s Market would continue to access the European Economic Area (EEA) after the UK leaves the European Union. Lloyd’s Insurance Company S.A. (Lloyd’s Brussels) was authorised by the National Bank of Belgium (NBB) in May 2018 to write non-life risks across all markets within the EEA. This is a fully capitalised, Solvency II compliant insurance company which reinsures business written back to Lloyd’s syndicates. Based in Brussels, with its own Board and Executive Committee, it has started writing new business with policies incepting as from 1 January 2019.
All Lloyd’s Brussels policies are 100% reinsured back to Lloyd’s syndicates. They are therefore backed by Lloyd’s unique Chain of Security capital structure, providing excellent financial security to policyholders. As the company benefits from the market’s financial strength through the Central Fund, it has the same financial ratings as Lloyd’s: AM Best (A “excellent”), Standard & Poor’s (A+ “strong”) and Fitch (AA- “very strong”).
Lloyd’s is continuing with its plans to ensure that existing non-life EEA insurance and reinsurance policies can be serviced by the Lloyd’s Market beyond the date of the UK’s withdrawal from the EU, including the payment of valid insurance claims. To achieve this, Lloyd’s is proposing to transfer all relevant non-life EEA business that has been written by the Lloyd’s Market between 1993 and 2018 to Lloyd’s Brussels before the end of 2020. This will be undertaken via an insurance business transfer under Part VII of the UK’s Financial Services and Markets Act 2000.
In October 2018, the Society publicly stated that in the event that the UK leaves the European Union with a “no deal” Brexit, Lloyd’s underwriters will continue to honour their contractual commitments including the payment of valid claims. The Society has continued to make the case for a public solution at the European level to enable UK firms to pay claims to EEA policyholders. On 19 February 2019, EIOPA published a set of recommendations for the insurance sector which includes a recommendation that competent authorities in the EU should apply a legal framework or mechanism to facilitate the orderly run-off of European business. While these are only recommendations, a number of member states have already passed, or are in the process of passing, national legislation in this regard. In that context, the Society expects its approach will be respected by European regulators pending the completion of the Part VII transfer.
Financial Review continued
112 Lloyd’s Annual Report 2018

The Executive Committee and senior management continue to work to assess Brexit risks and minimise their impact on the Society, the Lloyd’s market and its policyholders. There remain significant uncertainties and outcomes surrounding Brexit transition, with potentially unknown economic and political implications for the UK. The Society is monitoring developments closely and continually developing its plans to ensure delivery of the Lloyd’s business model and strategy.
Cash flows and liquidityCash and cash equivalents increased during the year ended 31 December 2018 by £104m to £601m (2017: £497m). Cash balances are maintained at appropriate levels to meet the short term operating expenses of the Society. Any surplus cash balances are invested and are included as financial investments within the Group statement of financial position.
The Corporation’s free cash balances* are regularly monitored. Free cash represents the amounts, both at bank and on deposit, held in the UK and available to the Corporation to meet operating expenses, including those of overseas operations, excluding any balances held in respect of insurance and arbitration activities. Free cash balances at 31 December 2018 were £279m (2017: £208m).
The liquidity of the Central Fund is monitored separately. Cash balances are managed to meet short term operational commitments including the payment of drawdowns. Any surplus cash balances are invested in compliance with defined investment parameters approved by the Investment Committee.
Central Fund investment strategyCentral Fund investment strategy is considered in three parts. A proportion of assets is assigned to meet liquidity needs, based on a prudent estimate of net cash flows. These assets are commingled with other liquid assets of Society companies and invested in bank deposits and other short-term securities, with maturities of up to 12 months. The objective is to optimise income, for a low level of risk, while ensuring that all cash flow requirements are met as they fall due.
A majority of assets are invested in fixed interest securities of a high credit quality and typically medium-term maturities. The financial risk exposures represented by subordinated debt securities issued by the Society are considered when determining the disposition of fixed interest investments. The return objective is to optimise investment return in the longer term while maintaining overall financial risk within defined limits.
A significant proportion of assets are invested in equities and other return seeking asset classes, also with an aim to optimise investment return in the longer term without exceeding defined risk tolerances. These investments are diversified among different asset classes to help manage risk, and third party investment managers are retained to manage these investments within clearly defined investment parameters specified by the Society. Equity investments currently include global developed and emerging market equities. Investments in other growth assets include multi-asset credit and hedge funds.
Financial risk management and treasury policiesOverviewThe Society’s principal financial instruments comprise cash and cash equivalents, investments, borrowings and items that arise directly from operations such as trade receivables and payables. These include assets and liabilities of the Central Fund.
The Society’s treasury operations and investments are managed by reference to established policies which are reviewed regularly by the Investment Committee. Overall risk is managed within defined limits, specified by the Board. Policies for managing these risks, in particular credit risk, liquidity risk and market risk, are summarised below. The following financial risk management objectives and policies disclosures within note 19 are audited.
Credit riskCredit risk represents the risk of financial loss to the Society if a counterparty, or the issuer of a security, fails to meet its contractual obligations.
Trade and other receivablesThe Society has established procedures to minimise the risk of default by trade and other receivables, which are mainly in respect of the Lloyd’s market, the main source of income. These procedures include minimum standard checks for new market entrants.
Financial investmentsA list of permissible bank counterparties, for the purposes of money-market investment, is maintained and restricted to banks having strong balance sheets and credit ratings. Investment parameters exist for all investment assets, controlling overall credit quality and ensuring appropriate risk diversification. Permitted counterparties to capital market transactions are also carefully controlled. All applicable parameters are reviewed regularly by the Investment Committee in accordance with the risk appetite set by the Board.
GuaranteesThe Society provides certain financial guarantees as security for the underwriting activities of the members of Lloyd’s.
* Free cash balances are a metric which is consistently used to analyse financial performance in the Society Report. This metric (wherever used in the Annual Report) is an Alternative Performance Measure (APM), with further information available on page 184.
Lloyd’s Annual Report 2018 113
Market ResultsStrategic Report Society Report Other Information

Financial risk management and treasury policies continuedLiquidity riskThe value and term of short-term assets are carefully monitored against those of the Society’s liabilities. The Society maintains sufficient liquid assets to meet liabilities as they fall due.
The liquidity of the Central Fund is monitored separately. Cash balances are managed to meet short-term operational commitments including the payment of drawdown. Any surplus cash balances are invested in compliance with defined investment parameters approved by the Investment Committee in accordance with the risk appetite set by the Board.
The Society had no committed borrowing facilities as at 31 December 2018 (2017: nil).
Market riskMarket risk represents the risk that movements in financial markets will affect the financial position of the Society. Market risks arising from the disposition of the Society’s investments are monitored against defined parameters using Value at Risk methodology. The position is reviewed regularly by the Investment Committee. Investments are actively monitored on a fair value basis and all investments are designated as fair value through profit or loss.
Foreign currency riskThe Society enters into a variety of foreign exchange transactions in response to the foreign currency requirements of Society Group companies. In managing the exposures arising from such foreign exchange activity, which may involve transactions for forward settlement, the net risk arising from all such exposures is considered and the level of this risk is managed within defined parameters. Consequently, while some net foreign exchange exposures may accrue to the Society from time to time as a result of this activity, the level of such exposures is carefully monitored and is not significant in the context of its activities.
Foreign currency exposures arising from overseas investments are considered together with any foreign currency liabilities of the Society, as well as the underlying currency mix of the Central Solvency Capital Requirement, of which a high proportion is US dollar based. Net foreign currency exposures arising are managed through the use of forward foreign exchange contracts.
Separately, the Society provides a Currency Conversion Service (CCS) to participating Lloyd’s syndicates, converting insurance premiums and claims between sterling and other Society settlement currencies as required. Foreign exchange exposures arising from the provision of the CCS are again managed on a net basis, within defined parameters. The CCS is operated separately from other foreign exchange activity of the Society because, under the terms of the service, any profit (or loss) arising from CCS exposures is distributed to (or collected from) syndicates participating in the CCS. Currency exposures arising from CCS activity consequently do not, ultimately, represent significant risks to the Society.
Interest rate riskBorrowings from the Lloyd’s market for the purpose of funding statutory insurance deposits do not bear a fixed rate of interest. Instead, investment returns earned on the borrowed assets are passed on to lenders. Consequently, no interest rate risk arises on such borrowings.
Short term assets held by the Society may be significant at certain times but such balances cannot be precisely predicted. These are invested in money market instruments of up to 12 months’ duration with the objective of maximising current income while meeting liquidity requirements.
Interest rate risk arising from the requirement to make fixed rate coupon payments in respect of the Society subordinated loan notes is considered in conjunction with the market risk arising on the Society’s investments.
As part of the strategy to mitigate these risks, the Society has entered into a number of interest rate swap contracts.
Capital managementThe Society monitors its capital to ensure that it maintains sufficient assets for both operational and solvency purposes. Further disclosures regarding financial instruments are provided in note 19. Further details regarding solvency are given on page 112.
Related party transactionsExcept for disclosures made in note 27, no related party had material transactions with the Society in 2018.
Going concern and viability statement Assessment of prospectsThe Lloyd’s business model and strategy are central to an understanding of its prospects and details can be found on pages 10 to 21. The strategy is subject to ongoing monitoring and development.
The prospects of the Lloyd’s market, including the Society, are primarily assessed through the annual strategic review and planning process. The output of the review is a strategic plan to deliver any recommendations. The review is led by the Chief Executive Officer through the Executive Committee and all relevant departments are involved. The Board and the Council participate fully in the process and part of their role is to consider whether the strategic plan continues to take appropriate account of the external environment and meets the needs of the market.
The review determines a set of medium term targets, key performance indicators for the current year and activities to deliver on those metrics. The latest three year strategic plan (Lloyd’s Strategy 2019 to 2021) was approved in December following completion of the latest review cycle. As part of the planning process, detailed financial budgets were prepared for the Society for the three year period to 31 December 2021.
Financial Review continued
114 Lloyd’s Annual Report 2018

Assessment of viabilityThe Board and Council receive quarterly reports from the Risk Committee on the key risks and risk appetites, including the Society’s own risk and solvency assessment as well as stress testing resilience to severe yet plausible scenarios. The principal risks and material uncertainties that would threaten the business model, future performance, liquidity or solvency of the Lloyd’s market as a whole are set out on pages 10 to 21. In addition, the financial statements include notes on investment strategy, financial risk management, treasury policies and sensitivity analysis.
The Lloyd’s capital structure is set out in the link provided in page 186 and Lloyd’s is required to maintain solvency on a continuous basis. The solvency position of each member, and thus of Lloyd’s as a whole, is monitored on a regular basis. The Audit Committee considers biannually management’s assessment of the current solvency position and the forecast position over a three year period, including resilience of central assets to meet the Central SCR.
Viability statementWhile the members of the Council have no reason to believe that the Society will not be viable over a longer period, the period over which the assessment is based is the three year period to 31 December 2021, being the period considered under the strategic plan, including the detailed budgets prepared, and the solvency projections of the Society.
The members of the Council believe that the Society is well placed to manage its business risks successfully, having taken into account the current economic outlook, and confirm that they have a reasonable expectation that the Society will be able to continue in operation and meet its liabilities as they fall due over the three year period ending 31 December 2021.
Going concernAfter making enquiries, the members of the Council also consider it appropriate to adopt the going concern basis in preparing the Society’s financial statements.
Statement as to disclosure of information to auditorsHaving made enquiries, the Council confirms that:
— to the best of each Council member’s knowledge and belief there is no information relevant to the preparation of the Society Report of which the Society’s auditors are unaware; and
— each Council member has taken all the steps a Council member might reasonably be expected to have taken to be aware of relevant audit information and to establish that the Society’s auditors are aware of that information.
OutlookCentral assets, which exclude subordinated liabilities, are expected to remain stable over £3bn in 2019. Following its meeting on 26 March 2019, the Council gave no further Undertakings to corporate members to use the New Central Fund to discharge the liability of members with unpaid cash calls who do not have the resources to meet those calls. After taking account of the expiry of unutilised Undertakings, the net movement in Undertakings is nil (see note 5). The operating expenses for the Corporation (excluding organisational transformation costs) and its subsidiaries are budgeted to be £350m in 2019*. The Council is responsible for preparing the Group financial statements in accordance with byelaws made under Lloyd’s Act 1982 and International Financial Reporting Standards (IFRS) as adopted by the European Union.
The Council is required to prepare Group financial statements for each financial year which present fairly the financial position of the Society and the financial performance and cash flows of the Society for that period. In preparing these Group financial statements, the Council is required to:
— Select suitable accounting policies and then apply them consistently;
— Present information, including accounting policies, in a manner that provides relevant, reliable, comparable and understandable information;
— Provide additional disclosures when compliance with the specific requirements in IFRS is insufficient to enable users to understand the impact of particular transactions, other events and conditions on the Society’s financial position and financial performance; and
— State that the Society has complied with IFRS, subject to any material departures disclosed and explained in the Group financial statements.
* Budgeted operating expenses is a metric which is consistently used to analyse financial performance in the Society Report. This metric (wherever used in the Annual Report) is an Alternative Performance Measure (APM), with further information available on page 184.
Lloyd’s Annual Report 2018 115
Market ResultsStrategic Report Society Report Other Information

Statement of the Council’s responsibilities for the Financial Statements
The Council is responsible for keeping proper accounting records which disclose with reasonable accuracy at any time the financial position of the Society and enable it to ensure that the Group financial statements comply with Article 4 of the IAS Regulation. As the Society’s subordinated debt is admitted to trading in a regulated market in the European Union, Council has elected to comply with Article 4, which requires Group financial statements to be prepared in conformity with IFRS as adopted by the European Union. The Council is also responsible for safeguarding the assets of the Society and hence for taking reasonable steps for the prevention and detection of fraud and other irregularities.
The Council is responsible for the maintenance and integrity of the corporate and financial information included on the Society’s website (lloyds.com). Legislation in the United Kingdom governing the preparation and dissemination of financial statements may differ from legislation in other jurisdictions.
The Council considers that the Annual Report, taken as a whole, is fair, balanced and understandable and provides the information necessary for stakeholders to assess the Society’s performance, business model and strategy.
116 Lloyd’s Annual Report 2018

Independent Auditors’ Report to the Members of the Society of Lloyd’s
Report on the audit of the financial statementsOpinionIn our opinion, the Society of Lloyd’s group financial statements (the “financial statements”):
— give a true and fair view of the state of the group’s affairs as at 31 December 2018 and of its surplus and cash flows for the year then ended;
— have been properly prepared in accordance with International Financial Reporting Standards (IFRSs) as adopted by the European Union; and
— have been prepared in accordance with the requirements of the Council byelaws made under Lloyd’s Act 1982.
We have audited the financial statements, included within the Annual Report, which comprise: the Group Statement of Financial Position as at 31 December 2018, the Group Income Statement and the Group Statement of Comprehensive Income, the Group Statement of Cash Flows, and the Group Statement of Changes in Equity for the year then ended, and the notes to the financial statements, which include a description of the significant accounting policies.
Our opinion is consistent with our reporting to the Audit Committee.
Basis for opinionWe conducted our audit in accordance with International Standards on Auditing (UK) (ISAs (UK)) and applicable law. Our responsibilities under ISAs (UK) are further described in the Auditors’ responsibilities for the audit of the financial statements section of our report. We believe that the audit evidence we have obtained is sufficient and appropriate to provide a basis for our opinion.
IndependenceWe remained independent of the group in accordance with the ethical requirements that are relevant to our audit of the financial statements in the UK, which includes the FRC’s Ethical Standard, as applicable to listed public interest entities, and we have fulfilled our other ethical responsibilities in accordance with these requirements.
To the best of our knowledge and belief, we declare that non-audit services prohibited by the FRC’s Ethical Standard were not provided to the group.
Other than those disclosed in note 7 to the financial statements, we have provided no non audit services to the group in the period from 1 January 2018 to 31 December 2018.
Our audit approachOverviewMateriality
— Overall group materiality: £24.4m (2017: £22.7m), based on 0.5% of total assets.
Audit scope — The three key components of The Society of Lloyd’s are considered to be the Central Fund, the Corporation of Lloyd’s and Lloyd’s Insurance Company (China) Limited. These were fully scoped in for the purposes of the audit. For the remaining components, a group scoping exercise was undertaken to identify significant balances.
Key audit matters — Valuation of Lloyd’s Pension Scheme;
— Risk of fraud in revenue recognition; and
— Valuation of financial investments.
The scope of our audit As part of designing our audit, we determined materiality and assessed the risks of material misstatement in the financial statements.
Capability of the audit in detecting irregularities, including fraudBased on our understanding of the group and industry, we identified that the principal risks of non-compliance with laws and regulations related to breaches of UK, European, US and China regulatory principles, such as those governed by the Prudential Regulation Authority (PRA) and the Financial Conduct Authority (FCA), and we considered the extent to which non-compliance might have a material effect on the financial statements. We also considered those laws and regulations that have a direct impact on the preparation of the financial statements such as the Lloyd’s Act 1982, regulations of the FCA and PRA. We evaluated management’s incentives and opportunities for fraudulent manipulation of the financial statements (including the risk of override of controls), and determined that the principal risks were related to posting inappropriate journal entries to increase the revenue of the group, and management bias in accounting estimates such as the assumptions used in the estimate of revenue, the valuation of the pension scheme liability and investment valuation. The group engagement team shared this risk assessment with the component auditors so that they could include appropriate audit procedures in response to such risks in their work. Audit procedures performed by the group engagement team and/or component auditors included:
— Discussions with management, the Audit Committee, internal audit, senior management involved in the Risk and Compliance function and the group’s legal function, including consideration of known or suspected instances of non-compliance with laws and regulation and fraud;
— Evaluation of management’s internal controls designed to prevent and detect irregularities, in particular their controls around disclosure of related parties and associated transactions;
Lloyd’s Annual Report 2018 117
Market ResultsStrategic Report Society Report Other Information

Independent Auditors’ Report to the Members of the Society of Lloyd’s continued
Our audit approach continued — Reading key correspondence with, reports to and meeting with the Prudential Regulation Authority and the Financial Conduct Authority in relation to compliance with laws and regulations;
— Reviewing internal audit reports so far as they related to non-compliance with laws and regulations and fraud;
— Identifying and testing journal entries, in particular any journal entries posted with unusual account combinations including those with revenue journals, backdated and post close entries, or journals posted by senior management;
— Designing audit procedures to incorporate unpredictability around the nature, timing or extent of our testing of directors’ personal expenses and selected immaterial balances.
There are inherent limitations in the audit procedures described above and the further removed non-compliance with laws and regulations is from the events and transactions reflected in the financial statements, the less likely we would become aware of it. Also, the risk of not detecting a material misstatement due to fraud is higher than the risk of not detecting one resulting from error, as fraud may involve deliberate concealment by, for example, forgery or intentional misrepresentations, or through collusion.
Key audit mattersKey audit matters are those matters that, in the auditors’ professional judgement, were of most significance in the audit of the financial statements of the current period and include the most significant assessed risks of material misstatement (whether or not due to fraud) identified by the auditors, including those which had the greatest effect on: the overall audit strategy; the allocation of resources in the audit; and directing the efforts of the engagement team. These matters, and any comments we make on the results of our procedures thereon, were addressed in the context of our audit of the financial statements as a whole, and in forming our opinion thereon, and we do not provide a separate opinion on these matters. This is not a complete list of all risks identified by our audit.
Key audit matter How our audit addressed the key audit matter
Valuation of Lloyd’s Pension Scheme
The Society of Lloyd’s operates a number of defined benefit and defined contribution pension schemes. The principal scheme is the Lloyd’s Pension Scheme whose net liabilities total £87m at 31 December 2018. Certain key assumptions have a material impact in determining the pension scheme liabilities and therefore were subject to more audit attention from us. We focused on key assumptions such as discount rate; inflation; and post-retirement life expectancy.
Following the High Court’s ruling, in October 2017, on Guaranteed Minimum Pensions (GMP), Lloyd’s have made an allowance for GMP equalisation for their Scheme of £3.3m. Due to this change and the risk of underestimation we have focused on the assumptions within Lloyd’s model and comparisons with other schemes.
(Refer also to note 13 to the financial statements)
We used our actuarial experts to evaluate the key assumptions used to value the Lloyd’s Pension Scheme. This included comparison of Lloyd’s assumptions to our own independent expectations based on our knowledge of the Lloyd’s Pension Scheme and current financial market conditions.
We found the following: — the discount rate used in the valuation of the pension liability was
consistent with our expectations, taking into account the duration of the pension liability and investment market conditions at 31 December 2018;
— the retail and consumer price inflation rates used in the valuation of the pension liability were consistent with our expectations, taking into account the duration of the pension liability and market expectations at 31 December 2018; and
— the post-retirement life expectancy assumptions were in line with the recent mortality experience of the Lloyd’s Pension Scheme and with assumptions made by other UK companies, and contain an appropriate allowance for how rates of mortality may change in the future.
We found the assumptions to be reasonable.
We have assessed the appropriateness of the accounting treatment adopted by Lloyd’s for the GMP and consider it to be reasonable. We have also used our pension actuarial experts to evaluate the key assumptions used to estimate the provision recognised and consider them to be acceptable.
118 Lloyd’s Annual Report 2018

Key audit matter How our audit addressed the key audit matter
Risk of fraud in Revenue Recognition
The Central Fund contributions (recognised as revenue in the Central Fund reporting unit) and members’ subscription fees (recognised as revenue within the Corporation of Lloyd’s reporting unit) represent a significant portion of the revenue of the Society.
We focused on these components of revenue because they are recognised based in part on management’s estimate of the future premium of each syndicate underwriting year. Although not complex, this estimate involves subjectivity with regards to assumptions on the estimation of future premium.
The future premium is estimated based on historical development trends. From this analysis, management selects an extrapolation factor, which is then applied to the current year.
(Refer also to note 2 to the financial statements)
We evaluated the reasonableness of the assumptions applied in the estimation of the future premium. As future premium is estimated based on the development trend of historical premium (the extrapolation factor), we traced a sample of the historical premium data to the system which aggregates market results.
We tested Information Technology General Controls over the system, where no exceptions were noted. Based on our work on the assumptions, we found that management’s analysis supported the extrapolation factor that was selected.
We tested the application of the extrapolation factor to the underlying data and recomputed the total Central Fund contributions and members’ subscription fees.
We found management’s assumptions to be reasonable. No significant exceptions were noted in our testing of underlying data or our recalculation of revenue.
Valuation of financial investments
We focused on this area because it represents 73% of the total assets of the Society, so the valuation of financial investments has a significant impact on the financial statements. This includes investments in the Society’s portfolio held as statutory insurance deposits by Additional Securities Limited (ASL). The risk of the assets not existing or not being realisable at their book values is therefore relevant to users of the financial information.
Our procedures to address this risk included:
— Independently re-priced a sample of the investments to validate the valuations within the in-scope components;
— Confirmed existence of the assets through third party confirmations; and — Evaluated the design and tested the operating effectiveness of controls
relating to the valuation of investments.
Based on the above procedures, no material exception were found.
How we tailored the audit scopeWe tailored the scope of our audit to ensure that we performed enough work to be able to give an opinion on the financial statements as a whole, taking into account the structure of the group, the accounting processes and controls, and the industry in which it operates.
The Society of Lloyd’s financial statements are a consolidation of 35 reporting units. In establishing the overall approach to the group audit, we determined the type of work that needed to be performed at the reporting units by us, as the group engagement team, or component auditors within PwC UK and from other PwC network firms operating under our instruction. For the audit of the Society of Lloyd’s financial statements, all audit procedures were performed centrally by the group engagement team with the exception of the audit of the financial information of Lloyd’s Insurance Company (China) Limited. Where the work was performed by a component auditor, we determined the level of involvement we needed to have in the audit work at that reporting unit to be able to conclude whether sufficient appropriate audit evidence had been obtained as a basis for our opinion on the financial statements as a whole. In our role as Group auditors, we exercised oversight of work performed by auditors of the component including performing the following procedures; maintained an active dialogue with reporting component audit teams throughout the year, including involvement in the risk assessment process during the planning phase of the audit; visited all in-scope components and undertook a detailed review of audit working papers; and attended meetings with local management.
For each reporting unit we determined whether we required an audit of their complete financial information or whether specified procedures for particular balances would be sufficient. Audit procedures were performed over the complete financial information for the Corporation of Lloyd’s, Central Fund and Lloyd’s Insurance Company (China) Limited reporting units to address the key audit matters identified above. Additionally, we identified Additional Securities Limited, where certain account balances were considered to be significant in size in relation to the Society, and scoped our audit to include detailed testing of those account balances.
Together, the reporting units where we performed our audit work accounted for 95% of the Society’s total assets and 89% of the Society’s surplus before tax.
Lloyd’s Annual Report 2018 119
Market ResultsStrategic Report Society Report Other Information

MaterialityThe scope of our audit was influenced by our application of materiality. We set certain quantitative thresholds for materiality. These, together with qualitative considerations, helped us to determine the scope of our audit and the nature, timing and extent of our audit procedures on the individual financial statement line items and disclosures and in evaluating the effect of misstatements, both individually and in aggregate on the financial statements as a whole.
Based on our professional judgement, we determined materiality for the financial statements as a whole as follows:
Overall group materiality
£24.4m (2017: £22.7m)
How we determined it
0.5% of total assets
Rationale for benchmark applied
We have identified the key financial statement users as rating agencies, syndicate members and policyholders who will be primarily concerned with the overall asset position of Lloyd’s, as those assets act as a backstop for the market. This will include the quality of assets held by Lloyd’s as well as its solvency. Therefore, we have assessed that it is appropriate to use an asset based benchmark for the materiality determination for the 31 December 2018 year end.
For each component in the scope of our group audit, we allocated a materiality that is less than our overall group materiality. The range of materiality allocated across components was between £12.6m and £22m. Certain components were audited to a local statutory audit materiality that was also less than our overall group materiality.
We agreed with the Audit Committee that we would report to them misstatements identified during our audit above £1.2m (2017: £1.1m) as well as misstatements below that amount that, in our view, warranted reporting for qualitative reasons.
Going concernIn accordance with ISAs (UK) we report as follows:
Reporting obligationThe Council has voluntarily included a statement in relation to going concern in accordance with provision C1.3 of the UK Corporate Governance Code (the “Code”) in the Financial Review section of the Society report. We agreed with the Council to report if we have anything material to add or draw attention to in respect of the Council’s statement about whether it is appropriate to adopt the going concern basis of accounting in preparing the financial statements and the Council’s identification of any material uncertainties to the group’s ability to continue as a going concern over a period of at least twelve months from the date of approval of the financial statements.
OutcomeWe have nothing material to add or to draw attention to.
However, because not all future events or conditions can be predicted, this statement is not a guarantee as to the group’s ability to continue as a going concern. For example, the terms on which the United Kingdom may withdraw from the European Union, are not clear, and, in common with other companies, it is difficult to evaluate all of the potential implications on the company’s trade, customers, suppliers and the wider economy.
Reporting on other information The other information comprises all of the information in the Annual Report other than the financial statements and our auditors’ report thereon. The Council is responsible for the other information. Our opinion on the financial statements does not cover the other information and, accordingly, we do not express an audit opinion or, except to the extent otherwise explicitly stated in this report, any form of assurance thereon.
In connection with our audit of the financial statements, our responsibility is to read the other information and, in doing so, consider whether the other information is materially inconsistent with the financial statements or our knowledge obtained in the audit, or otherwise appears to be materially misstated. If we identify an apparent material inconsistency or material misstatement, we are required to perform procedures to conclude whether there is a material misstatement of the financial statements or a material misstatement of the other information. If, based on the work we have performed, we conclude that there is a material misstatement of this other information, we are required to report that fact. We have nothing to report based on these responsibilities.
The Council’s assessment of the prospects of the Society and of the principal risks that would threaten the solvency or liquidity of the SocietyUnder the terms of our engagement, we agreed to report to you if we have anything material to add or to draw attention to in relation to:
— the Council’s confirmation on page 115 of the Annual Report, in accordance with provision C2.1 of the Code, that they have carried out a robust assessment of the principal risks facing the Society, including those that would threaten its business model, future performance, solvency or liquidity;
— the disclosures in the Annual Report that describe those risks and explain how they are being managed or mitigated;
— the Council’s explanation on page 115 of the Society’s Report, in accordance with provision C2.2 of the Code, as to how it has assessed the prospects of the Society, over what period they have done so and why they consider that period to be appropriate, and their statement as to whether they have a reasonable expectation that the Society will be able to continue in operation and meet its liabilities as they fall due over the period of their assessment, including any related disclosures drawing attention to any necessary qualifications or assumptions.
We have nothing material to add or to draw attention to regarding the above responsibilities.
Independent Auditors’ Report to the Members of the Society of Lloyd’s continued
120 Lloyd’s Annual Report 2018

Other Code ProvisionsUnder the terms of our engagement, we agreed to report to you if we have anything material to add or to draw attention to in relation to:
— The statement given by the Council, on page 116, in accordance with provision C1.1 of the Code, that they consider the Annual Report taken as a whole to be fair, balanced and understandable, and provides the information necessary for the members to assess the group’s position and performance, business model and strategy is materially inconsistent with our knowledge of the group obtained in the course of performing our audit.
— The section of the Annual Report on page 105 to 107, as required by provision C3.8 of the Code, describing the work of the Audit Committee does not appropriately address matters communicated by us to the Audit Committee.
We have nothing to report in respect of this responsibility.
Report of the Remuneration CommitteeThe Council is responsible for preparing the part of the report of the Remuneration Committee that has been described as audited in accordance with Schedule 8 Part 3 of the Large and Medium-sized Companies and Groups (Accounts and Reports) Regulations 2008 (the “basis of preparation”).
Under the terms of our engagement, we agreed to report to you whether, in our opinion, the part of the report of the Remuneration Committee that is described as audited has been properly prepared in accordance with the basis of preparation as described therein. In our opinion, the part of the report of the Remuneration Committee that is described as audited has been properly prepared in accordance with the basis of preparation as described therein.
Responsibilities for the financial statements and the auditResponsibilities of the Council for the financial statementsAs explained more fully in the Statement of the Council Responsibilities for the financial statements set out on page 116, the Council are responsible for the preparation of the financial statements in accordance with the applicable framework and for being satisfied that they give a true and fair view. The Council is also responsible for such internal control as they determine is necessary to enable the preparation of financial statements that are free from material misstatement, whether due to fraud or error.
In preparing the financial statements, the Council is responsible for assessing the group’s ability to continue as a going concern, disclosing as applicable, matters related to going concern and using the going concern basis of accounting unless the Council either intend to liquidate the group or to cease operations, or have no realistic alternative but to do so.
Auditors’ responsibilities for the audit of the financial statementsOur objectives are to obtain reasonable assurance about whether the financial statements as a whole are free from material misstatement, whether due to fraud or error, and to issue an auditors’ report that includes our opinion. Reasonable assurance is a high level of assurance, but is not a guarantee that an audit conducted in accordance with ISAs (UK) will always detect a material misstatement when it exists. Misstatements can arise from fraud or error and are considered material if, individually or in the aggregate, they could reasonably be expected to influence the economic decisions of users taken on the basis of these financial statements.
A further description of our responsibilities for the audit of the financial statements is located on the FRC’s website at: www.frc.org.uk/auditorsresponsibilities. This description forms part of our auditors’ report.
Use of this reportThis report, including the opinions, has been prepared for and only for the Society’s members as a body in accordance with the Lloyd’s Act 1982 and for no other purpose. We do not, in giving these opinions, accept or assume responsibility for any other purpose or to any other person to whom this report is shown or into whose hands it may come save where expressly agreed by our prior consent in writing.
Other required reportingUnder the terms of our engagement, we have agreed to report to you if, in our opinion:
— we have not received all the information and explanations we require for our audit;
— proper accounting records have not been maintained by the Society.
We have no exceptions to report arising from this responsibility.
AppointmentFollowing the recommendation of the Audit Committee, we were appointed by the members in July 2013 to audit the financial statements for the year ended 31 December 2013 and subsequent financial periods. The period of total uninterrupted engagement is 6 years, covering the years ended 31 December 2013 to 31 December 2018.
Mark Bolton (Senior Statutory Auditor) for and on behalf of PricewaterhouseCoopers LLPChartered Accountants and Statutory Auditors London 26 March 2019
Lloyd’s Annual Report 2018 121
Market ResultsStrategic Report Society Report Other Information

122 Lloyd’s Annual Report 2018
Group Income Statement (For the year ended 31 December 2018)
Note2018
£m2017
£m
Corporation operating income 352 351
Central Fund income 149 125
Gross written premiums 176 253
Outward reinsurance premiums (176) (253)
Total income 3/4 501 476
Gross insurance claims and insurance expenses incurred 6 (189) (212)
Insurance claims and expenses recoverable from reinsurers 6 189 212
Other Group operating expenses 3/7 (362) (306)
Operating surplus 139 170
Finance costs 9 (39) (55)
Finance income 9 93 62
Share of profits of associates 11 9 10
Surplus before tax 202 187
Tax charge 12 (39) (31)
Surplus for the year 163 156

Lloyd’s Annual Report 2018 123
Market ResultsStrategic Report Society Report Other Information
Group Statement of Comprehensive Income(For the year ended 31 December 2018)
Note2018
£m2017
£m
Surplus for the year 163 156
Other comprehensive income
Items that will not be reclassified to profit or loss
Remeasurement gains on pension asset/liabilities
UK 13 71 48
Overseas 13 – –
Associates 11 1 2
Tax charge relating to items that will not be reclassified 12 (12) (9)
Items that may be reclassified subsequently to profit or loss
Unrealised gains on revaluation of Lloyd’s Collection 15 2 –
Currency translation differences 4 (5)
Net other comprehensive surplus for the year 66 36
Total comprehensive income for the year 229 192

124 Lloyd’s Annual Report 2018
Group Statement of Financial Position (As at 31 December 2018)
Note2018
£m2017
£m
Assets
Intangible assets 14 6 –
Lloyd’s Collection 15 15 13
Plant and equipment 15 12 18
Deferred tax asset 12 31 25
Investment in associates and joint ventures 11 19 18
Insurance contract assets 6 347 342
Loans recoverable 16 36 40
Financial investments 17 – 3,293
Financial investments at fair value through profit and loss 17 2,486 –
Financial investments at amortised cost 17 1,097 –
Trade and other receivables due within one year 18 214 265
Prepayments and accrued income 36 23
Derivative financial instruments 19 11 16
Cash and cash equivalents 20 601 497
Total assets 4,911 4,550
Equity and liabilities
Equity
Accumulated reserve 21 2,378 2,155
Revaluation reserve 21 14 13
Translation reserve 21 25 20
Total equity 2,417 2,188
Liabilities
Subordinated notes 22 794 793
Insurance contract liabilities 6 347 342
Pension liabilities 13 90 164
Provisions 23 20 15
Loans funding statutory insurance deposits 625 483
Trade and other payables 24 507 481
Accruals and deferred income 70 67
Tax payable 31 7
Derivative financial instruments 19 10 10
Total liabilities 2,494 2,362
Total equity and liabilities 4,911 4,550
Approved and authorised by the Council on 26 March 2019 and signed on its behalf by
Bruce Carnegie-BrownChairman
John Neal Chief Executive Officer

Lloyd’s Annual Report 2018 125
Market ResultsStrategic Report Society Report Other Information
Group Statement of Changes in Equity (For the year ended 31 December 2018)
Note
Accumulatedreserve
£m
Revaluationreserve
£m
Translationreserve
£m
Totalequity
£m
At 1 January 2017 1,958 13 25 1,996
Surplus for the year 156 – – 156
Net other comprehensive surplus/(deficit) for the year 41 – (5) 36
At 31 December 2017 21 2,155 13 20 2,188
Surplus for the year 163 – – 163
Net other comprehensive surplus for the year 60 2 4 66
At 31 December 2018 21 2,378 15 24 2,417

126 Lloyd’s Annual Report 2018
Group Statement of Cash Flows(For the year ended 31 December 2018)
Note2018
£m2017
£m
Cash generated from operations 25 221 219
Tax paid (34) (51)
Net cash generated from operating activities 187 168
Cash flows from investing activities
Purchase of plant, equipment and intangible assets 14/15 (9) (8)
Purchase of financial investments 17 (2,265) (1,701)
Receipts from the sale of financial investments 17 2,234 1,752
Increase in short-term deposits 17 (196) (7)
Dividends received from associates 11 9 –
Interest received 46 45
Dividends received 9 5 7
Realised gains/(losses) on settlement of forward currency contracts 15 (3)
Net cash (used in)/generated from investing activities (161) 85
Cash flow from financing activities
Sale of debt securities – 298
Redemption of subordinated notes – (392)
Interest paid on subordinated notes (38) (53)
Issue costs in relation to subordinated notes (1) –
Increase in borrowings for statutory insurance deposits 113 18
Net cash generated from/(used in) financing activities 74 (129)
Net increase in cash and cash equivalents 100 124
Effect of exchange rates on cash and cash equivalents 4 (18)
Cash and cash equivalents at 1 January 497 391
Cash and cash equivalents at 31 December 20 601 497

Lloyd’s Annual Report 2018 127
Market ResultsStrategic Report Society Report Other Information
1. Basis of preparation and consolidationIn 1871, by Lloyd’s Act 1871, the then existing association of underwriters was incorporated in the United Kingdom as the Society and Corporation of Lloyd’s (the Society). Its activities are accordingly governed by statute and, since 1982, have been managed by the Council of Lloyd’s (the Council) pursuant to Lloyd’s Act 1982. Its principal place of business is at One Lime Street, London EC3M 7HA.
The Society’s main corporate purposes are to facilitate the carrying on of insurance business by members of Lloyd’s and the advancement and protection of their interests in this context. The Group financial statements of the Society of Lloyd’s comprise the financial statements of the Society of Lloyd’s and all its subsidiary undertakings, the Lloyd’s Central Fund and the Group’s interest in associates as at each reporting date. Subsidiary undertakings are consolidated from the date of their acquisition, being the date on which the Society obtains control, and continue to be consolidated until the date that such control ceases. The Group financial statements are prepared using consistent accounting policies. All intra Group balances and transactions are eliminated in full.
The Group financial statements have been prepared in accordance with International Financial Reporting Standards (as adopted by the European Union) and on a historic cost basis, except for financial assets and liabilities at fair value through profit or loss and the Lloyd’s Collection, which are measured at fair value.
Other financial liabilities, which include the subordinated notes, are carried at amortised cost. The Group financial statements are presented in pounds sterling and all values are rounded to the nearest million (£m).
The Society is regulated by the PRA and the FCA.
2. Principal accounting policiesSummary of significant accounting policiesThis section provides a list of the significant accounting policies adopted in the preparation of these consolidated financial statements to the extent that they have not been superseded by accounting policies adopted due to new standards that became effective from 1 January 2018. (see note 2(q)). The policies, except for those which have been superseded in 1 January 2018 (see note 2(p)), have been consistently applied to all the years presented, unless otherwise stated.
(a) Critical accounting estimates and assumptionsIn preparing the financial statements, significant estimates and judgements are made in respect of some of the items reported. The main accounting policies identified involving such assessments are:
— Central Fund claims and provisions – Undertakings (see note 2(m) and note 5);
— Employee benefits – defined benefit pension scheme (see note 2(i) and note 13);
— Insurance contracts – liabilities and reinsurance assets (see note 2(g) and note 6);
— Loans recoverable – hardship loans (see note 2(p) and note 16); and
— Provisions – (see note 2(o) and note 23).
Notes to the Financial Statements(For the year ended 31 December 2018)
(b) Plant and equipmentPlant and equipment are held at cost less accumulated depreciation and any impairment in value.
Depreciation is charged on a straight line basis on the following principal categories:
— Furniture and fittings are depreciated over seven to 25 years according to the estimated useful life of the asset;
— Computer and specialised equipment are depreciated over three to 15 years according to the estimated useful life of the asset; and
— Equipment on hire or lease is depreciated over the period of the lease.
(c) Software developmentCosts incurred in acquiring and developing computer software are capitalised as intangible assets where the software supports a significant business system and the expenditure leads to the creation of an identifiable asset of value. Software development is held at cost less accumulated depreciation and any impairment in value. Capitalised software is amortised over five years.
(d) Lloyd’s CollectionThe Lloyd’s Collection represents various paintings, antiques and artefacts which are included at fair value. Any revaluation surplus or deficit is recognised in the Group statement of comprehensive income and is reflected in the revaluation reserve within the Group statement of changes in equity.
(e) Investment in associates and joint venturesAn associate is an entity in which the Society has significant influence and which is not a subsidiary undertaking or joint venture. A joint venture is a joint arrangement whereby the parties that have joint control of the arrangement have rights to the net assets of the arrangement. The Society’s investments in associates and joint ventures are accounted for under the equity method of accounting.
Under the equity method, the investments in associates and joint ventures are carried in the Group statement of financial position at cost plus post-acquisition changes in the Society’s share of net assets of the associates and joint ventures. Goodwill relating to an associate is included in the carrying amount of the investment and is not amortised. After application of the equity method, the Society determines whether it is necessary to recognise any additional impairment loss with respect to the Society’s net investment in an associate or joint venture. The Group income statement reflects its share of the results of operations of associates and joint ventures. The Society’s share of associates’ other comprehensive income is recognised in the Group statement of comprehensive income.

128 Lloyd’s Annual Report 2018
Notes to the Financial Statements continued(For the year ended 31 December 2018)
(f) Impairment of non-financial assetsThe Society performs annual impairment testing to assess whether there is an indication that an asset may be impaired. If any such indication exists an impairment loss is recognised for the amount by which the asset’s carrying value exceeds its recoverable amount. The recoverable amount is the higher of an asset’s fair value less costs of disposal and value in use.
Prior impairments of non-financial assets are reviewed for possible reversal at each reporting date.
(g) Insurance contracts (liabilities and reinsurance assets)In accordance with IFRS 4 Insurance Contracts, the Society applies established UK accounting practices for insurance contracts, modified as appropriate to comply with the IFRS framework and applicable standards.
Insurance contracts are defined as those containing significant insurance risk which arises if, and only if, an insured event could cause an insurer to pay significant additional benefits in any scenario, excluding scenarios that lack commercial substance, at the inception of the contract. Such contracts remain insurance contracts until all rights and obligations are extinguished or expired.
An impairment review is performed on all reinsurance assets when an indication of impairment occurs. Reinsurance assets are impaired only if there is objective evidence that the Society may not receive all amounts due to it under the terms of the contract and this can be measured reliably.
The Society’s policy for measuring balances for insurance contracts issued by overseas subsidiaries is to apply the valuation technique used in the issuing entity’s local statutory or regulatory reporting. Therefore, for insurance contracts issued by Lloyd’s Insurance Company (China) Limited (LICCL), balances are calculated in accordance with the People’s Republic of China Generally Accepted Accounting Principles (PRC GAAP).
In particular, unearned premium reserves are calculated after deducting acquisition costs such as commissions, handling fees, business taxes, surcharges and regulatory charges, whilst outstanding claims reserves include a risk margin.
(h) InventoriesInventories are stated at the lower of cost and net realisable value on a first in, first out (FIFO) basis. Net realisable value is the estimated selling price in the ordinary course of business less estimated costs necessary to make the sale.
(i) Employee benefitsThe Society accounts for pensions and similar benefits (principally income protection due to ill health) under IAS 19 Employee Benefits. The Society operates a number of defined benefit pension schemes in which obligations are measured at discounted present value using the projected unit credit method, while plan assets are recorded at fair value. The operating and financing income and costs of the scheme are recognised in the Group income statement. Service costs, financing income (expected return on plan assets) and costs are recognised in the periods in which they arise. Actuarial gains and losses are recognised in full in the Group statement of comprehensive income in the period in which they occur.
Costs of discretionary awards in respect of past service are recognised in the Group income statement when amounts are committed to be paid or there is a constructive liability to make awards to pensioners.
Payments to separately administered defined contribution schemes are charged to the Group income statement as they fall due.
Short term bonuses are accrued in the period to which they relate, long term bonuses are recognised over their vesting period.
(j) TaxationCorporation tax on the surplus or deficit for the periods presented comprise current and deferred tax. Corporation and income tax are recognised in the Group income statement except to the extent that it relates to items recognised directly in the Group statement of comprehensive income.
Current tax is the expected tax payable on the taxable income for the year, using tax rates enacted or substantively enacted at the reporting date, and any adjustment to tax payable in respect of previous years.
Deferred tax liabilities are recognised for all taxable temporary differences and deferred tax assets are recognised for all deductible temporary differences and unutilised tax losses to the extent that it is probable that taxable profits will be available against which the deductible temporary differences or tax losses can be utilised.
Deferred tax is measured on an undiscounted basis at the rates that are expected to apply in the periods in which timing differences reverse, based on tax rates and laws enacted or substantively enacted at the reporting date.
(k) Insurance premiumsInsurance premiums represent premiums on business incepting during the year, together with adjustments for premiums written in previous accounting periods. Premium income is recognised over the period of cover, taking the underlying risk exposure into account. Premiums written are stated before deduction of commissions but net of taxes, duties levied on premiums and other similar deductions.
(l) Insurance claimsClaims incurred in insurance related activities consist of claims and claims handling expenses paid during the year together with the movement in outstanding claims. Outstanding claims are the estimated final cost of all claims incurred but not settled at the reporting date, including claims incurred but not reported (IBNR). Outstanding claims are discounted. Subsequent information and events may result in the ultimate liability being less than, or greater than, the amount provided. Any differences between the provision and subsequent settlements are reflected within the Group financial statements of later years when differences between provision and subsequent settlement become apparent.
(m) Central Fund claims and provisionsCentral Fund claims and provisions (Undertakings) are accounted for when they are approved by the Council and become contractual commitments. These Undertakings are granted wholly at the discretion of the Council for a fixed period, normally one year, and therefore are not deemed to be constructive obligations, except for renewals of those commitments previously granted. For those

Lloyd’s Annual Report 2018 129
Market ResultsStrategic Report Society Report Other Information
corporate members in provisional liquidation, the Council provides a supporting commitment, which will ensure that in no circumstance will an insurance creditor receive less than the amount it would have received in a winding up commencing on the date of the provisional liquidation. As the supporting Undertakings are legally enforceable commitments, an estimate of their value is included within provisions in the Group financial statements and changes during the period are reflected in the Group income statement.
Recoveries in respect of Undertakings previously given are credited to the Group income statement when contractually committed to be received.
(n) Foreign currency and derivative instruments foreign currency translationFunctional and presentation currencyThe Group financial statements are presented in pounds sterling, which is the Society’s functional and presentation currency. Items included in the financial statements of each of the Society’s entities are measured using the currency of the primary economic environment in which the entity operates (the functional currency).
Transactions and balancesTransactions in foreign currencies are recorded at the exchange rate prevailing on the date of the transaction. At each reporting date, monetary assets and liabilities denominated in foreign currencies are retranslated at the exchange rate prevailing at the reporting date. Translation differences on monetary items are taken to the Group income statement.
Translation differences on non-monetary items measured at fair value are reported as part of the fair value gain or loss and included in the Group statement of comprehensive income.
The principal exchange rates were:
2018Average
2017 Average
2018Closing
2017Closing
US$ 1.33 1.29 1.27 1.35
CAN$ 1.73 1.67 1.74 1.70
RMB 8.82 8.73 8.71 8.75
EUR 1.13 1.14 1.11 1.13
The results and financial position of overseas Society operations are translated into pounds sterling as follows:
(i) Assets and liabilities are translated at the closing rate at the date of that statement of financial position;
(ii) Income and expenses are translated at the average exchange rate for the year; and
(iii) Any resulting exchange differences are recognised in the Group statement of comprehensive income.
The Society enters into forward currency contracts to manage exposures to fluctuation in foreign exchange rates, and to provide a service to the Lloyd’s market. Where gains and losses are not expected to be refunded or recovered from the Lloyd’s market, these amounts are taken to the Group income statement.
(o) LeasesPayments made under operating leases are charged to the Group income statement on a straight line basis over the period of the lease. Contractual capital expenditure is provided for over the term of the underlying lease agreement. The lease cost provision (see note 23) is an accounting estimate which arises due to the fact the Society has entered into a number of fully repairing leases.
(p) Accounting policies superseded on 1 January 2018Financial instrumentsThe following accounting policies were applied until these were superseded by IFRS 9 which was effective on 1 January 2018. The new accounting policies adopted by the Society are set out in note 2(q).
Financial assets Initial recognitionFinancial assets within the scope of IAS 39 are classified as financial assets at fair value through profit or loss or loans and receivables. The Society determines the classification of its financial assets at initial recognition.
Financial assets are recognised initially at fair value plus, in the case of loans and receivables, directly attributable transaction costs. A financial asset is classified in this category if acquired principally for the purpose of selling in the short term.
Purchases or sales of financial assets that require delivery of assets within a timeframe established by regulation or convention in the market place (regular way purchases) are recognised on the settlement date.
The Society’s financial assets include loans recoverable, statutory insurance deposits and other investments designated at fair value through profit or loss, trade and other receivables, accrued income, cash and cash equivalents and derivative assets.
Subsequent measurementThe subsequent measurement of financial assets depends on their classification as follows:
(i) Financial assets at fair value through profit or loss include derivative financial assets which are classified as held for trading, and financial assets designated upon initial recognition at fair value through profit or loss. They are carried in the Group statement of financial position at fair value. Gains and losses arising from changes in their fair value are included in the Group income statement in the period in which they arise. When financial assets are interest bearing, interest calculated using the effective interest method is recognised in the Group income statement; and
(ii) Loans and receivables are non derivative financial assets with fixed or determinable payment that are not quoted in an active market. They arise when the Society provides money, goods or services directly to a debtor with no intention of trading the receivable. These financial assets are carried at amortised cost using the effective interest method. Gains and losses are recognised in the Group income statement when the loans and receivables are derecognised or impaired, as well as through the amortisation process.

130 Lloyd’s Annual Report 2018
Financial liabilities Initial recognitionFinancial liabilities within the scope of IAS 39 are classified as financial liabilities at fair value through profit and loss or other financial liabilities. The Society determines the classification of its financial liabilities at initial recognition.
Financial liabilities are recognised initially at fair value and in the case of other financial liabilities, directly attributable transaction costs. The Society’s financial liabilities include trade and other payables, accruals, subordinated notes and derivative liabilities.
Subsequent measurementThe subsequent measurement of financial liabilities depends on their classification as follows:
(i) Financial liabilities at fair value through profit or loss include derivative financial liabilities which are classified as held for trading. Gains or losses on liabilities held for trading are recognised in the Group income statement; and
(ii) Other financial liabilities, which include the subordinated notes, are carried at amortised cost using the effective interest method.
Fair value of financial instrumentsFinancial instruments are categorised for disclosure purposes into a hierarchy consisting of three levels depending upon the source of input as required by IFRS 7 Financial Instruments: Disclosures.
Level 1 – The fair value of financial instruments which are actively traded in organised financial markets is determined by reference to quoted market bid prices at the close of business on the reporting date. The quoted market price used for financial assets held by the Society is the current bid price; the appropriate quoted market price for financial liabilities is the current offer price.
Level 2 – The fair value of financial instruments for which quoted market prices are not used for valuation purposes are derived both directly and indirectly from observable market conditions. The fair value of forward currency contracts is calculated by reference to current forward exchange rates for contracts with similar maturity profiles. The nominal value less estimated credit adjustments of trade receivables and payables are assumed to approximate to their fair values.
Level 3 – The fair value of financial instruments for which there is no observable quoted market price is determined by a variety of methods incorporating assumptions that are based, so far as possible, on market conditions existing at each reporting date.
Where the significance of the inputs used in the determination of the fair value of a financial instrument changes, the classification of the financial instrument in the fair value hierarchy is reviewed.
Where the assessment of the classification has changed, a transfer is made between the respective levels.
Amortised cost of financial instrumentsAmortised cost is computed using the effective interest method less any allowance for impairment and principal repayment or reduction. The calculation takes into account any premium or discount on acquisition and includes transaction costs and fees that are an integral part of the effective interest rate.
Impairment of financial assetsThe Society assesses at each reporting date whether there is an indication that an asset may be impaired. If any such indication exists, the asset is written down to its recoverable amount.
Derecognition of financial instrumentsInvestments are derecognised when the right to receive cash flows from the asset have expired or, in the case of a financial liability, when the obligation under the liability is cancelled or discharged.
Loans recoverableRecoverable Central Fund loans made to Hardship members are valued on a fair value basis and are designated as fair value through profit or loss. Any gains or losses arising from changes in the fair value are included in the Group income statement in the period in which they arise. Fair values are determined by reference to an estimate of the valuation of the underlying investments at the dates at which they may be exercised and discounted back to present day values. A security can normally only be exercised on the later date of death of the member or of their spouse. This date is assessed using actuarial assumptions.
Subordinated notes Subordinated debt is initially recognised at fair value, being the fair value of the consideration received net of issue costs associated with the borrowing.
After initial recognition, the subordinated debt is subsequently recorded at amortised cost using the effective interest rate over the period to the earliest option date. Amortised cost is calculated after taking into account issue costs and issue discount.
Cash and cash equivalentsFor the purposes of the Group statement of cash flows, cash comprises cash at banks and demand deposits, and cash equivalents comprise highly liquid investments that are convertible into cash with an insignificant risk of changes in value, with original maturities of less than three months.
Income recognitionIncome, which is stated net of value added tax, comprises the fair value of amounts receivable. Revenue arising in respect of members’ subscriptions, the market modernisation levy and Central Fund contributions is calculated by applying a percentage to management’s estimate of the future premium of each syndicate underwriting year. This future premium is estimated based on historical development trends. This approach therefore assumes that the premium written in the current year will develop in a similar pattern to that demonstrated in previous years.
Notes to the Financial Statements continued(For the year ended 31 December 2018)

Lloyd’s Annual Report 2018 131
Market ResultsStrategic Report Society Report Other Information
The impact of any potential anomalies in the premium earning pattern of any one particular year is mitigated by applying an average development factor which is calculated based on the experience of a number of years. The extrapolation factor is based on a development factor which is applied to the current year written premium. Income is recognised as follows:
(i) Members’ subscriptions, market charges and other services Members’ subscriptions, market charges and other services are recognised in the period for which the service is provided. They are recognised on a basis that reflects the timing, nature and value of the benefits provided.
(ii) Central Fund contributions Central Fund contributions from members underwriting in the year are recognised in the period for which the service is provided.
(iii) Interest incomeInterest receivable is recognised in the Group income statement on a time apportioned basis using the effective interest method.
Any unwinding of discount is recognised as interest income.
(iv) Dividend incomeDividend income from equity investments is included in the Group income statement on the ex-dividend date.
(v) Other incomeOther income is recognised when recoverability is agreed.
(q) New standards, interpretations and amendments to existing standards that have been adopted by the SocietyThe Society adopted the following new IFRSs, interpretations and amendments to existing standards, which are effective by EU endorsement for annual periods beginning on or after 1 January 2018:
— IFRS 9 Financial Instruments; and
— IFRS 15 Revenue from contracts with customers
In addition, the Society adopted the following with effect from 1 January 2018:
— IFRIC 22 Foreign currency transactions and advance consideration;
— Classification and measurement of share-based payment transactions (Amendments to IFRS 2);
— Applying IFRS 9 ‘Financial Instruments’ with IFRS 4 ‘Insurance contracts’ (Amendments to IFRS 4);
— Transfers of investment property (Amendments to IAS 40); and
— Annual improvements to IFRS standards 2014-2016 cycle (Amendments to IFRS 1, IFRS 12 and IAS 28).
Details of the impact of these new accounting standards on the Society financial statements, as well as the significant new accounting policies adopted from 1 January 2018 are set out opposite.
IFRS 9 – Financial instrumentsTransition at 1 January 2018IFRS 9 replaces IAS 39 and specifies how an IFRS reporter will recognise, measure, present and disclose financial instruments. The standard focuses on the three key areas:
— Classification and Measurement: determining how financial assets and financial liabilities are accounted for in financial statements and, in particular, how they are measured on an ongoing basis;
— Impairment: introducing a new expected loss impairment model that will require more timely recognition of expected credit losses; and
— Hedge accounting: by introducing a substantially reformed accounting model, with enhanced disclosures about risk management activity.
In accordance with the transitional provisions in IFRS 9 (paragraph 7.2.15 and paragraph 7.2.26), comparative figures have not been restated. The reclassifications and the adjustments arising from the new impairment rules are therefore not reflected in the Group statement of financial position as at 31 December 2017, but are recognised in the opening balance sheet on 1 January 2018.
The following table shows the adjustments recognised for each individual line item. Line items that were not affected by the changes have not been included.
Balance sheet (extract)
31 December 2017 as
originally presented
£m
IFRS 9adjustments
£m
1 January 2018
Restated£m
Financial investments 3,293 (3,293) –
Financial investments at fair value through profit and loss
– 2,566 2,566
Financial investments at amortised cost
– 727 727
There has been no impact on the presentation of the Group income statement or Group statement of other comprehensive income as a result of the implementation of IFRS 9. The adoption of IFRS 9 Financial Instruments from 1 January 2018 resulted in changes in accounting policies and adjustments to the amounts recognised in the financial statements. The new accounting policies are included on page 133.

132 Lloyd’s Annual Report 2018
IFRS 9 – Financial instruments continuedTransition at 1 January 2018 continuedOn 1 January 2018, the Group’s management has assessed which business models apply to the financial assets held by the Group and has classified its financial instruments into the appropriate IFRS 9 categories. An analysis of the valuation approaches adopted for the main balances in the Group statement of financial position is set out below:
Investment category Notes
31 December 2018
£m
1 January2018
£m
Valuation method
under IFRS 9
Previous valuation
method
Government fixed interest securities (i) 974 808 Fair value Fair value
Corporate securities (i) 678 733 Fair value Fair value
Emerging market (i) 164 336 Fair value Fair value
Equities (i) 249 392 Fair value Fair value
Hedge funds (i) 158 151 Fair value Fair value
Multi-asset (i) 263 48 Fair value Fair value
Loan investments (i) – 98 Fair value Fair value
Total financial investments at fair value through profit or loss 2,486 2,566
Short term and security deposits (ii) 468 241 Amortised cost Fair value
Statutory insurance deposits (ii) 629 486 Amortised cost Fair value
Total financial investments at amortised cost 1,097 727
Loans recoverable (iii) 36 40 Amortised cost Fair value
Trade and other receivables due within one year (iv) 214 265 Amortised cost Fair value
Cash and cash equivalents (iv) 601 497 Amortised cost Fair value
Subordinated notes 794 793 Amortised cost Amortised cost
Trade and other payables (iv) 507 481 Amortised cost Fair value
Notes to the Financial Statements continued(For the year ended 31 December 2018)
(i) Financial investmentsThe following investments continued to be recorded as financial assets at fair value through profit or loss: Government fixed interest securities, corporate securities, emerging market, equities, hedge funds, multi-asset and loan investments. These investments do not meet the IFRS 9 criteria for classification at amortised cost because their cash flows do not solely represent payments of principal and interest.
(ii) DepositsDeposits were reclassified from fair value to amortised cost (£727m as at 1 January 2018). At the date of initial application, the Group’s business model is to hold these investments for collection of contractual cash flows, and the cash flows solely represent payment of principal and interest on the principal amount. The fair value of £727m as at 1 January 2018 was equivalent to the amortised cost for these assets. There was no impact on retained earnings at 1 January 2018.
(iii) Loans recoverableLoans recoverable were reclassified from fair value to amortised cost (£40m as at 1 January 2018). At the date of initial application the Group’s business model is to hold these loans for collection of contractual cash flows, and the cash flows solely represent the payment of the principal. The fair value of these assets was £40m as at 1 January 2018 and there was no material difference between this and the amortised cost of these assets. There was no impact on retained earnings at 1 January 2018.
(iv) Other financial assets and liabilitiesTrade and other receivables due within one year, cash and cash equivalents and trade and other payables were all reclassified from fair value to amortised cost (fair value of each balance was £265m, £497m and £481m respectively as at 1 January 2018). At the date of initial application, the Group’s business model is to hold these items for collection or payment of contractual cash flows, and the cash flows solely represent payment of principal and interest on the principal amount (where applicable). The fair value of these balances as at 1 January 2018 was equivalent to the amortised cost for these balances. There was no impact on retained earnings at 1 January 2018.

Lloyd’s Annual Report 2018 133
Market ResultsStrategic Report Society Report Other Information
ImpairmentThe Society has a number of types of financial assets that are subject to the standard’s new expected credit loss model:
— Deposits;
— Loans recoverable;
— Trade and other receivables due within one year; and
— Cash and cash equivalents.
The Society was required to revise its impairment methodology under IFRS 9 for each of these classes of assets. The impact on the financial statements of the Society of implementing this new methodology was £0.4m.
DepositsManagement considers that the majority of the Society’s deposits are held with credit institutions which have a low credit risk. Further details of the credit rating of deposits held by the Society are set out in note 17, with the vast majority assigned a rating of A or above. For the purposes of calculating an appropriate impairment provision, management has considered:
— the rating assigned to individual deposits from an independent third party rating agency; and
— any specific circumstances relating to the individual holdings which need to be taken account of when considering recoverability.
Loans recoverableLoans recoverable represent Central Fund loans made to Hardship members. The balances due are secured on underlying assets such as property or other investments. Accordingly, management considers these loans to have a low credit risk and as a result no impairment provision has been recognised.
Trade and other receivables due within one yearManagement has reviewed the balances due to the Society within trade and other receivables, and considers them to be low credit risk. These balances are generally held with counterparties which are considered to have a low risk of default. As a result, management considers that no impairment provision is required.
Cash and cash equivalentsAs noted above regarding deposits, management considers that the majority of the Society’s deposits are held with credit institutions which have a low credit risk. For the purposes of calculating an appropriate impairment provision, management has considered:
— the credit rating assigned to individual deposits from an independent third party rating agency; and
— any specific circumstances relating to the individual holdings which need to be taken account of when considering recoverability.
Hedge The Society has not adopted hedge accounting, so there is no impact of the new accounting standard from that perspective.
New accounting policies adoptedFinancial assets ClassificationFinancial assets are classified, at initial recognition, in the following measurement categories:
— those to be measured at fair value through profit or loss; and
— those to be measured at amortised cost.
The classification depends on the Society’s business model for managing the financial assets and the contractual terms of the cash flows. The Society measures financial assets at amortised cost if both of the following conditions are met:
— the financial asset is held within a business model with the objective to hold financial assets in order to collect contractual cash flows, and
— the contractual terms of the financial asset give rise on specified dates to cash flows that are solely payments of principal and interest on the principal amount outstanding.
The Society’s financial assets at amortised cost includes short term and security deposits, statutory insurance deposits, loans recoverable, trade and other receivables due within one year, and subordinated notes.
Financial assets at fair value through profit or loss include financial assets held for trading, financial assets designated upon initial recognition at fair value through profit or loss, or financial assets mandatorily required to be measured at fair value. Financial assets are classified as held for trading if they are acquired for the purpose of selling or repurchasing in the near term. Derivatives are also classified as held for trading unless they are designated as effective hedging instruments. Financial assets with cash flows that are not solely payments of principal and interest are classified and measured at fair value through profit or loss, irrespective of the business model. This category includes government fixed interest securities, corporate securities, emerging market investments, equities, hedge funds, multi-asset investments and loan investments.
Initial recognition At initial recognition, the Society measures a financial asset at its fair value plus, in the case of a financial asset not valued at fair value through profit or loss, transaction costs that are directly attributable to the acquisition of the financial asset. Transaction costs of financial assets carried at fair value through profit and loss are expensed in the Group income statement.

134 Lloyd’s Annual Report 2018
New accounting policies adopted continuedSubsequent measurementThe subsequent measurement of financial instruments depends on their classification as follows:
— Financial instruments at fair value through profit or loss are carried in the Group statement of financial position at fair value. Gains and losses arising from changes in their fair value are included in the Group income statement in the period in which they arise. When financial assets are interest bearing, interest calculated using the effective interest method is recognised in the Group income statement; and
— Where financial instruments are carried at amortised cost, the value is computed using the effective interest rate method less any allowance for impairment and principal repayment or reduction. The calculation takes into account any premium or discount on acquisition and includes transaction costs and fees that are an integral part of the effective interest rate.
DerecognitionA financial asset (or, where applicable, a part of a financial asset or part of a group of similar financial assets) is derecognised when:
— The rights to receive cash flows from the asset have expired, or
— The Society has transferred its right to receive cash flows from the asset or has assumed an obligation to pay the received cash flows in full without material delay to a third party under a ‘pass-through’ arrangement; and either: (a) the Society has transferred substantially all the risks and rewards of the asset; or (b) the Society has neither transferred nor retained substantially all the risks and rewards of the asset, but has transferred control of the asset.
— The Society considers control to be transferred if and only if, the transferee has the practical ability to sell the asset in its entirety to an unrelated third party and is able to exercise that ability unilaterally and without imposing additional restrictions on the transfer.
When the Society has neither transferred nor retained substantially all the risks and rewards and has retained control of the asset, the asset continues to be recognised only to the extent of the Society’s continuing involvement, in which case, the Society also recognises an associated liability. The transferred asset and the associated liability are measured on a basis that reflects the rights and obligations that the Society has retained.
Continuing involvement that takes the form of a guarantee over the transferred asset is measured at the lower of the original carrying amount of the asset and the maximum amount of consideration the Society could be required to pay.
Notes to the Financial Statements continued(For the year ended 31 December 2018)
Impairment of financial assetsThe Society recognises an allowance for expected credit losses for all debt instruments not held at fair value through profit or loss. Expected credit losses are based on the difference between the contractual cash flows due in accordance with the contract and all the cash flows that the Society expects to receive, discounted at an approximation of the original effective interest rate (EIR). The expected cash flows will include cash flows from the sale of collateral held or other credit enhancements that are integral to the contractual terms.
Expected credit losses are recognised in two stages. For credit exposures for which there has not been a significant increase in credit risk since initial recognition, allowance is made for credit losses that result from default events that are possible within the next 12 months (12 month expected credit losses). For those credit exposures for which there has been a significant increase in credit risk since initial recognition, a loss allowance is required for credit losses expected over the remaining life of the exposure, irrespective of the timing of the default (lifetime expected credit losses).
For trade receivables and contract assets, the Society applies a simplified approach in calculating expected credit losses. Therefore, the Society does not track changes in credit risk, but instead recognises a loss allowance based on lifetime expected credit losses at each reporting date. The Society has established a provision matrix that is based on its historical credit loss experience, adjusted for forward-looking factors specific to the debtors and the economic environment.
The Society considers a financial asset in default when contractual payments are 90 days past due. However, in certain cases, the Society may also consider a financial asset to be in default when internal or external information indicates that the Society is unlikely to receive the outstanding contractual amounts in full before taking into account any credit enhancements held by the Society. A financial asset is written off when there is no reasonable expectation of recovering the contractual cash flows.
Financial liabilitiesInitial recognition and measurementFinancial liabilities are classified, at initial recognition, as financial liabilities at fair value through profit or loss, loans and borrowings, payables, or as derivatives designated as hedging instruments in an effective hedge, as appropriate. All financial liabilities are recognised initially at fair value and, in the case of loans and borrowings and payables, net of directly attributable transaction costs.
Subsequent measurementThe measurement of financial liabilities depends on their classification, as described opposite:

Lloyd’s Annual Report 2018 135
Market ResultsStrategic Report Society Report Other Information
Financial liabilities at fair value through profit or lossFinancial liabilities at fair value through profit or loss include financial liabilities held for trading and financial liabilities designated upon initial recognition as at fair value through profit or loss. Financial liabilities are classified as held for trading if they are incurred for the purpose of repurchasing in the near term. This category also includes derivative financial instruments entered into by the Society that are not designated as hedging instruments in hedge relationships as defined by IFRS 9. Gains or losses on liabilities held for trading are recognised in the Group income statement. Financial liabilities designated upon initial recognition at fair value through profit or loss are designated at the initial date of recognition, and only if the criteria in IFRS 9 are satisfied.
Loans and borrowingsAfter initial recognition, interest bearing loans and borrowings are subsequently measured at amortised cost using the EIR method. Gains and losses are recognised in the Group income statement when the liabilities are derecognised as well as through the EIR amortisation process. Amortised cost is calculated by taking into account any discount or premium on acquisition and fees or costs that are an integral part of the EIR. The EIR amortisation is included as finance costs in the Group income statement. This category generally applies to interest bearing loans and borrowings.
DerecognitionA financial liability is derecognised when the obligation under the liability is discharged or cancelled or expires. When an existing financial liability is replaced by another from the same lender on substantially different terms, or the terms of an existing liability are substantially modified, such an exchange or modification is treated as the derecognition of the original liability and the recognition of a new liability. The difference in the respective carrying amounts is recognised in the Group income statement.
IFRS 15 – Revenue from contracts with customersTransition at 1 January 2018IFRS 15 specifies how and when an IFRS reporter will recognise revenue as well as requiring such entities to provide users of financial statements with more informative, relevant disclosures. IFRS 15 was issued in May 2014 and applies to annual reporting periods beginning on or after 1 January 2018. The standard provides a single, principles-based five step model to be applied to all contracts with customers. Details of these steps are set out below:
— Identify the contract(s) with a customer;
— Identify the performance obligations in the contract;
— Determine the transaction price;
— Allocate the transaction price to the performance obligations in the contract; and
— Recognise revenue when the entity satisfies a performance obligation.
The Society has adopted IFRS 15 – Revenue from contracts with customers from 1 January 2018, although adoption of the new standard did not have a material impact on the amounts recognised in the financial statements. There were no new contract assets and liabilities recognised at transition date.
The accounting policy in respect of revenue recognition is set out below.
New accounting policies adoptedThe Society supports the market to underwrite risks through its trading rights and distribution network. It also ensures that the market remains well capitalised and provides services to enable the market’s efficient operation. Revenue consists of members’ subscriptions, various market charges and Central Fund contributions which are recognised over time because the customer simultaneously receives and consumes the benefits provided by the Society.
Revenue from contracts with customers is recognised when services are transferred to the customer at an amount that reflects the consideration to which the Society expects to be entitled in exchange for those services.
— Members’ subscriptions, market charges and other services are recognised in the period for which the service is provided. These are recognised on a basis that reflects the timing, nature and value of the benefits provided.
— Central Fund contributions from members underwriting in the year are recognised in the period for which the service is provided.
— Interest receivable is recognised on a time apportioned basis using the effective interest method. Any unwinding of discount is recognised as interest income.
— Dividend income from equity investments is included in the Group income statement on the ex-dividend date.
— Other income is recognised when recoverability is agreed.
For members’ subscriptions, market charges and other services, and Central Fund contributions, the period for which the service is provided is the financial year and performance obligations are satisfied within the financial year.

136 Lloyd’s Annual Report 2018
IFRS 15 – Revenue from contracts with customers continued Revenue arising in respect of members’ subscriptions, the market modernisation levy and Central Fund contributions is calculated by applying a percentage to management’s estimate of the future premium of each syndicate underwriting year. This future premium is estimated based on historical development trends. This approach therefore assumes that the premium written in the current year will develop in a similar pattern to that demonstrated in previous years.
The impact of any potential anomalies in the premium earning pattern of any one particular year is mitigated by applying an average development factor which is calculated based on the experience of a number of years. The extrapolation factor is based on a development factor which is applied to the current year written premium.
Contract balances relate to trade receivables which represent the Society’s right to an amount of consideration that is unconditional (i.e. only the passage of time is required before payment of the consideration is due).
(r) New standards and interpretations issued but not yet effectiveThe new and amended standards and interpretations that are issued, but not yet effective, up to the date of issuance of the Group’s financial statements are disclosed below. The Group intends to adopt these new and amended standards and interpretations, if applicable, when they become effective.
IFRS 16 – LeasesIFRS 16 specifies how an IFRS reporter will recognise, measure, present and disclose leases. IFRS 16 was issued on 1 January 2016 and applies to annual reporting periods beginning on or after 1 January 2019. The Society adopted IFRS 16 on 1 January 2019 using the modified retrospective approach, where the lease liability equals the right-of-use asset. Therefore there is no impact to the opening balance of equity as of 1 January 2019.
Society as a lesseeThe majority of the Society’s leases are longer term operating leases in respect of properties, within both the UK and a number of overseas locations. In addition, various Society assets are held under leases, the accounting for which will also be impacted by the new reporting standard.
The Society will elect not to recognise right-of-use assets and lease liabilities for short term leases of less than 12 months and leases of low value . Typically the Society’s leases classified as such are office equipment and furniture. The Society will continue to expense lease payments on a straight line basis.
Notes to the Financial Statements continued(For the year ended 31 December 2018)
The Society plans to adopt a number of transition reliefs permissible under IFRS 16 for lessees as detailed below:
— In identifying the population of contracts for transition, the Society has not reassessed the definition of a lease and will grandfather the assessment of which transactions are leases. Therefore the definition of a lease under IFRS 16 is applied only to contracts entered into or changed on or after 1 January 2019.
— Contracts with a lease term of less than 12 months at the date of transition are excluded from the population of leases accounted for in the Group statement of financial position, with the rental payments expensed through the Group income statement.
— A portfolio incremental borrowing rate is applied to the lease portfolio.
— On transition, the value of the right-of-use asset has been aligned to the value of the lease liability.
— The asset is adjusted on transition by the amount of any previously recognised onerous lease provision, as an alternative to performing an impairment review.
— Initial direct costs are excluded from the measurement of the right-of-use asset.
The Society plans to adopt the following accounting policies:
— As a lessee, the Society classifies leases as operating or finance leases based on its assessment of whether the lease transferred significantly all of the risks and rewards incidental to ownership of the underlying asset to the Society. Under IFRS 16, the Society recognises right-of-use assets and lease liabilities.
— The right-of-use asset is measured at cost, which comprises the initial amount of the lease liability adjusted for other costs such as dilapidation amounts. The right-of-use asset is subsequently depreciated using the straight line method from the commencement date to the earlier of the end of the useful life of the right-of-use asset or the end of the lease term. The right-of-use asset may be periodically adjusted to account for changes such as impairment losses, or adjustments to the dilapidation estimates.
— The lease liability is initially measured at the present value of the lease payments that are not paid at the commencement date, discounted using the Society’s incremental borrowing rate.
— The lease liability may be re-measured when a change to future lease payments arises or if the Society changes its assessment of whether it will exercise a purchase, extension or termination option.
— When the lease liability is re-measured in this way, a corresponding adjustment is made to the carrying amount of the right-of-use asset, or is recorded in the Group income statement if the carrying amount of the right-of-use asset has been reduced to zero.

Lloyd’s Annual Report 2018 137
Market ResultsStrategic Report Society Report Other Information
The Society has completed its assessment of the potential impact of IFRS 16 on its consolidated financial statements and confirmed that the most significant impact is that the Society will recognise new assets and liabilities for its office operating leases worldwide. In particular, the largest lease arrangement considered within the new accounting standard framework is that relating to the Lloyd’s 1986 Building in London, which has a current rental value of £17m per annum.
The estimated impact on the Group statement of financial position as at 31 December 2018 is summarised as follows:
£m
Assets –
Right-of-use assets 179
Liabilities –
Lease liabilities 171
Net impact on equity 8
The nature of expenses related to the lease portfolio will change because IFRS 16 replaces the straight line operating lease expense with a depreciation charge for right-of-use assets and interest expense on lease liabilities. The Society does not currently have any finance leases. Although the requirements of IFRS 16 do not change the total amount of cash flows between the parties to a lease, the recognition pattern of those cash flows will change, with the charge to the Group income statement in the earlier stages of a lease typically higher than currently. Due to the adoption of IFRS 16, the Society’s operating surplus will improve, while its interest expense will increase. This is due to the change in the accounting for expenses of leases that were classified as operating leases under IAS 17.
The actual impact of applying IFRS 16 on the financial statements in the year of initial application will depend on; the composition of the Society’s lease portfolio during the period and the Society’s latest assessment of whether it will exercise any lease renewal options.
Society as a lessorThe Society’s operates a number of lessor relationships in the UK and internationally. In all instances the Society’s tenants co-exist with the Society, with risk and rewards incidental to ownership of the underlying asset not substantially transferred to the lessee. For this reason they are classified as operating leases under IFRS 16.
The Society is an intermediate lessor, and as such, accounts for its interest in the head lease and the sub-lease separately. The lease classification of a sub-lease is assessed with reference to the right-of-use asset arising from the head lease, not with reference to the underlying asset.
IFRS 17 – Insurance ContractsIFRS 17 Insurance contracts was issued in May 2017 as replacement for IFRS 4, Insurance contracts. Its original effective date was for reporting periods beginning on or after 1 January 2021. However, in November 2018 the International Accounting Standards Board deferred the effective date of IFRS 17 by one year to 1 January 2022. The Society plans to adopt the standard from this date.
The standard is expected to have a material impact on the Society’s consolidated financial statements, driven by the insurance operations in China, Lloyd’s Insurance Company (China) Limited, and the Society’s new insurance subsidiary in Belgium, Lloyd’s Insurance Company S.A. However, as the insurance business is fully reinsured, the impact on the operating surplus and surplus for the year is not expected to be material. Further information on the Society’s current accounting policy for insurance contracts is provided in note 2(g) and note 6.
3. Segmental analysisSegmental information is presented in respect of the Society’s business segments. The primary business segments are based on the Society’s management and internal reporting structure.
Intra segment pricing is determined on an arm’s length basis.
Segmental results, assets and liabilities include items directly attributable to a segment as well as those that can be allocated on a reasonable basis.
Segmental capital expenditure is the total cost incurred during the year to acquire segment assets that are expected to be used for more than one period.
The Society’s primary business segments are as follows:
(i) Corporation of Lloyd’s: the main corporate purposes are to facilitate the carrying on of insurance business by members of Lloyd’s and the advancement and protection of their interests in this context. The activities of authorised insurance company subsidiary undertakings are included within this business segment; and
(ii) Lloyd’s Central Fund: these funds, comprising the New Central Fund and Old Central Fund, are assets of the Society and are held and administered at the discretion of the Council, primarily as funds available for the protection of the policyholders. Unless the approval of members is obtained, the New Central Fund may not be used for the purposes of extinguishing or reducing liabilities which have been reinsured by Equitas.

138 Lloyd’s Annual Report 2018
3. Segmental analysis continued
(a) Information by business segment Note
2018Corporation
of Lloyd’s£m
2018Lloyd’s
Central Fund£m
2018Society
total£m
Segment income
Total income 3(b) 352 149 501
Segment operating expenses
Central Fund claims and provisions incurred 5 – – –
Gross insurance claims and insurance expenses incurred 6 (189) – (189)
Insurance claims and expenses recoverable from reinsurers 6 189 – 189
Other Group operating expenses:
Employment (including pension costs) 8 (164) – (164)
Premises (55) – (55)
Legal and professional 7 (50) (1) (51)
Systems and communications (43) – (43)
Other (38) (11) (49)
Total other Group operating expenses (350) (12) (362)
Total segment operating expenses (350) (12) (362)
Total segment operating surplus 2 137 139
Finance costs 9 – (39) (39)
Finance income 9 14 79 93
Share of profits of associates 11 9 – 9
Segment surplus before tax 25 177 202
Tax charge 12 (39)
Surplus for the year 163
Segment assets and liabilities
Financial investments at fair value through profit and loss 17 146 2,340 2,486
Financial investments at amortised cost 17 918 179 1,097
Cash and cash equivalents 20 439 162 601
Other assets 362 334 696
Segment assets 1,865 3,015 4,880
Tax assets 12 31 – 31
Total assets 1,896 3,015 4,911
Segment liabilities (1,627) (836) (2,463)
Tax liabilities (36) 5 (31)
Total liabilities (1,663) (831) (2,494)
Total equity 233 2,184 2,417
Other segment information
Capital expenditure 14/15 9 – 9
Depreciation 15 5 – 5
Impairment of long lived assets 15 4 – 4
Average number of UK employees (permanent and contract) 951 – 951
Average number of overseas employees (permanent and contract) 269 – 269
Average number of total employees (permanent and contract) 1,220 – 1,220
Average employee numbers are on a full time equivalent basis.
Notes to the Financial Statements continued(For the year ended 31 December 2018)

Lloyd’s Annual Report 2018 139
Market ResultsStrategic Report Society Report Other Information
(a) Information by business segment Note
2017Corporation
of Lloyd’s£m
2017Lloyd’s
Central Fund£m
2017Society
total£m
Segment income
Total income 3(b) 351 125 476
Segment operating expenses
Central Fund claims and provisions incurred 5 – – –
Gross insurance claims and insurance expenses incurred 6 (212) – (212)
Insurance claims and expenses recoverable from reinsurers 6 212 – 212
Other Group operating expenses:
Employment (including pension costs) 8 (138) – (138)
Premises (52) – (52)
Legal and professional 7 (36) (1) (37)
Systems and communications (33) – (33)
Other (35) (11) (46)
Total other Group operating expenses (294) (12) (306)
Total segment operating expenses (294) (12) (306)
Total segment operating surplus 57 113 170
Finance costs 9 – (55) (55)
Finance income 9 9 53 62
Share of profits of associates 11 10 – 10
Segment surplus before tax 76 111 187
Tax charge 12 (31)
Surplus for the year 156
Segment assets and liabilities
Financial investments 645 2,648 3,293
Cash and cash equivalents 433 64 497
Other assets 581 154 735
Segment assets 1,659 2,866 4,525
Tax assets 37 (12) 25
Total assets 1,696 2,854 4,550
Segment liabilities (1,521) (834) (2,355)
Tax liabilities (30) 23 (7)
Total liabilities (1,551) (811) (2,362)
Total equity 145 2,043 2,188
Other segment information
Capital expenditure 14/15 8 – 8
Depreciation 15 6 – 6
Impairment of long lived assets 15 2 – 2
Average number of UK employees (permanent and contract) 902 – 902
Average number of overseas employees (permanent and contract) 255 – 255
Average number of total employees (permanent and contract) 1,157 – 1,157
Average employee numbers are on a full time equivalent basis.

140 Lloyd’s Annual Report 2018
3. Segmental analysis continued
Corporation of Lloyd’s Lloyd’s Central Fund Society total
(b) Income2018
£m2017
£m2018
£m2017
£m2018
£m2017
£m
Market charges
Managing agents and syndicates 170 156 – – 170 156
Members and members’ agents 18 13 – – 18 13
Total market charges 188 169 – – 188 169
Members’ subscriptions 128 133 – – 128 133
Market modernisation levy 33 31 – – 33 31
Members’ subscriptions rebate, net (12) – – – (12) –
Other charges 15 18 – – 15 18
Total operating income 352 351 – – 352 351
Central Fund income – – 149 125 149 125
Gross written premiums 176 253 – – 176 253
Outward reinsurance premiums (176) (253) – – (176) (253)
Total income 352 351 149 125 501 476
The table below analyses income by geographical segment:
2018£m
2017£m
UK China Other Total UK China Other Total
Total operating income 296 21 35 352 287 25 39 351
Central Fund income 149 – – 149 125 – – 125
Gross written premiums – 176 – 176 – 253 – 253
Outward reinsurance premiums – (176) – (176) – (253) – (253)
Total income 445 21 35 501 412 25 39 476
Central Fund contributions from members and Corporation of Lloyd’s subscriptionsDuring the year, members paid to the Corporation (members’ subscriptions) and to the Central Fund (Central Fund contributions from members) 0.36% and 0.35% respectively of their syndicate forecast gross written premium (2017: 0.40% and 0.35% respectively). Central Fund contributions in the first three years of membership are charged at 1.4% of syndicate forecast gross written premium. The ultimate amounts to be retained by the Corporation and the Central Fund for 2018 will be based on actual 2018 gross written premiums of members, the quantification of which will not be known until 2020. The £128m (2017: £122m) Central Fund contributions from members and £128m (2017: £133m) members’ subscriptions included in the Group income statement are based on the present best estimates of the ultimate amounts that will be retained by the Central Fund and the Corporation respectively. The Central Fund income includes recoveries from certain members that previously claimed against the Central Fund.
In order to fund the operation of the Society’s overseas network of offices, an overseas operating charge is levied on the market based on a set percentage of gross written premiums overseas. The collection method is quarterly with an adjustment after 12 months to the actual level of premiums written.
In addition to the above, a levy was charged to fund the costs of market modernisation, the levy is calculated as 0.09% (2017: 0.09%) of gross written premiums.
The rebate on members’ subscriptions is the net amount paid or payable to members in relation to targets for the adoption of the electronic placement of business within the market.
Central Fund income includes foreign exchange gains, market settlement recoveries, which represent continuing debt recoveries from the 1996 Reconstruction and Renewal settlement, and recoveries in respect of Undertakings previously given by the Central Fund.
Notes to the Financial Statements continued(For the year ended 31 December 2018)

Lloyd’s Annual Report 2018 141
Market ResultsStrategic Report Society Report Other Information
4. Revenue from contracts with Customers Disaggregated revenue informationSet out below is the disaggregation of the Group’s revenue from contracts with customers:
Corporation of Lloyd’s Lloyd’s Central Fund Society total
2018£m
2017£m
2018£m
2017£m
2018£m
2017£m
Type of service
Members’ subscriptions 128 133 – – 128 133
Market charges and other services
Market charges 188 169 – – 188 169
Market modernisation levy 33 31 – – 33 31
Members’ subscriptions rebate, net (12) – – – (12) –
Other charges 15 18 – – 15 18
Central Fund income – – 149 125 149 125
Total revenue from contracts with customers 352 351 149 125 501 476
Geographical markets
UK 296 287 149 125 445 412
China 21 25 – – 21 25
Other 35 39 – – 35 39
Total revenue from contracts with customers 352 351 149 125 501 476
Revenue recognised from previously satisfied performance obligations is £14m (2017: £12m). This represents the adjustment to members’ subscriptions, market modernisation levy and Central Fund contributions based on final premiums written for the year of account.
Timing of revenue recognition
Services transferred over time 352 351 – – 352 351
Services transferred at a point in time – – 149 125 149 125
Total revenue from contracts with customers 352 351 149 125 501 476
Contract balances
Note2018
£m2017
£m
Trade receivables 18 1 3
Trade receivables are non-interest bearing and are generally on terms of 1 to 30 days. The provision for expected credit losses on trade receivables is immaterial.
5. Central Fund claims and provisions incurred
Note2018
£m2017
£m
Net Undertakings granted 23 – –
Central Fund claims and provisions incurred – –
The Council grants Undertakings within financial limits to certain corporate members to use the New Central Fund to discharge the liability of those members where they have unpaid cash calls and do not have the resources to meet those cash calls (see note 2(m) for further information). Unutilised Undertakings as at 31 December 2018 were nil (2017: nil).

142 Lloyd’s Annual Report 2018
6. Insurance activitiesLloyd’s Insurance Company (China) LimitedLloyd’s Insurance Company (China) Limited (LICCL) is the principal insurance business of the Society. LICCL is a wholly owned subsidiary undertaking of the Society. The company’s principal activity is the reinsurance of non-life business in the China insurance market and direct non-life insurance in the Shanghai municipality. Lloyd’s syndicates participate in LICCL’s business by means of retrocession agreements which allow a 100% risk transfer.
For insurance contracts, claims provisions (comprising provisions for claims reported by policyholders and claims incurred but not reported) are established to cover the ultimate cost of settling the liabilities in respect of claims that have occurred and are estimated based on known facts at the reporting date. Outstanding claims provisions are discounted for the time value of money.
2018£m
2017£m
Insurance claims
Gross claims
Claims paid (108) (78)
Change in provisions for claims (31) (72)
Total gross claims (139) (150)
Reinsurance expenses (50) (62)
Total gross insurance claims and insurance expenses incurred (189) (212)
Claims recoverable from reinsurers
Claims recovered from reinsurers 108 78
Change in reinsurance contract assets 31 72
Total claims recoverable from reinsurers 139 150
Reinsurance expenses recovered from reinsurers 50 62
Total insurance claims and expenses recoverable from reinsurers 189 212
Insurance contract assets and liabilities are analysed as follows:
2018Insurance
contract liabilities
£m
2018 Reinsurer’s share of liabilities
£m
2018 Net
£m
2017 Insurance contract liabilities
£m
2017 Reinsurer’s share of liabilities
£m
2017 Net
£m
Provision for claims reported 136 (136) – 116 (116) –
Provision for IBNR claims 129 (129) – 117 (117) –
Total provision for insurance claims 265 (265) – 233 (233) –
Unearned premiums 82 (82) – 109 (109) –
Insurance contract liabilities 347 (347) – 342 (342) –
The balances result from the cumulative growth of the LICCL platform over time and the duration of claims payments.
Notes to the Financial Statements continued(For the year ended 31 December 2018)

Lloyd’s Annual Report 2018 143
Market ResultsStrategic Report Society Report Other Information
The movement in provision for insurance claims is analysed as follows:
2018Insurance
contract liabilities
£m
2018Reinsurer’s
share of liabilities
£m
2018Net£m
2017Insurance
contract liabilities
£m
2017Reinsurer’s
share of liabilities
£m
2017Net£m
At 1 January 233 (233) – 166 (166) –
Claims incurred/(released) 139 (139) – 150 (150) –
Claims paid (see below) (108) 108 – (78) 78 –
Effect of exchange rates 1 (1) – (5) 5 –
At 31 December 265 (265) – – 233 (233) –
Claims incurred consist of claims and claims handling expenses paid during the year, together with the movement in outstanding claims. Full provision is made, on the basis of available information, for the estimated ultimate cost of claims notified but not settled as at the date of the statement of financial position, after taking into account handling costs and settlement trends. A provision for claims incurred but not notified is also established as at that date on a statistical basis. The provision also reflects claims settlement expenses and anticipated reinsurance and other recoveries. The provision for outstanding claims is based on information available at the reporting date. Subsequent information and events may result in the ultimate liability being less than, or greater than, the amount provided.
Any differences between the provision and subsequent settlements are recorded in the Group income statements of later years.
Claims development table The table below shows the development of claims over a period of time on a gross basis. The claims development table shows the cumulative incurred claims, including both notified and IBNR claims for each successive year, together with cumulative claims at the current reporting date.
2014 and prior
£m2015
£m2016
£m2017
£m2018
£mTotal
£m
At end of underwriting year 104 72 122 108 82
One year later 106 77 164 168
Two years later 98 73 172
Three years later 98 71
Four years later 91
Current estimate of cumulative claims 91 71 172 168 82 584
Cumulative payments to date (86) (53) (111) (65) (4) (319)
Total provision for insurance claims 5 18 61 103 78 265
Due to the fully reinsured liabilities of the vast majority of the Society’s insurance business, the Society has not prepared a claims development table on a net basis.

144 Lloyd’s Annual Report 2018
6. Insurance activities continuedThe movement in provision for unearned premiums is analysed as follows:
2018Insurance
contract liabilities
£m
2018Reinsurer’s
share of liabilities
£m
2018Net£m
2017Insurance
contract liabilities
£m
2017Reinsurer’s
share of liabilities
£m
2017Net£m
At 1 January 109 (109) – 88 (88) –
Premiums written 176 (176) – 253 (253) –
Premiums earned (202) 202 – (231) 231 –
Effect of exchange rates (1) 1 – (1) 1 –
At 31 December 82 (82) – 109 (109) –
Insurance RiskInsurance risk represents the possibility of the occurrence of a risk event, which results in uncertainties in relation to claim payments and timing. Under the Society’s insurance contracts, the key insurance risk of the company is that the actual claim payment exceeds the carrying amount of insurance reserves provided. These risks are likely to take place under the following circumstances:
— Occurrence risk – the possibility that the number of risk events is different from expectation;
— Severity risk – the possibility that the cost of risk events is different from expectation; and
— Development risk – the possibility that there is a change in reserves before the end of the contract.
LICCL has reinsured and retroceded 100% of the insurance risk for all underwritten premiums. The concentration of insurance risk is presented by major line of business below:
2018%
2017%
Commercial property insurance 32 30
Agricultural insurance 15 12
Credit insurance 4 22
Engineering insurance 11 9
Hull insurance 10 7
Special risk insurance 4 4
Liability insurance 15 8
Other 9 8
100 100
RisksIn addition to the risks which are set out in the Financial Risk Management section on pages 113 to 114, LICCL is also subject to the following risks:
— Credit risk: there is a risk that a syndicate may be unable to fulfil its reinsurance obligations, in which case LICCL could potentially be exposed to a loss;
— Regulatory risk: as an overseas underwriting company, LICCL is subject to the requirements of the local regulator and could be subject to penalties if these regulations are not satisfied; and
— Management do not consider that LICCL is subject to insurance risk due to the fact that all business is 100% reinsured.
Notes to the Financial Statements continued(For the year ended 31 December 2018)

Lloyd’s Annual Report 2018 145
Market ResultsStrategic Report Society Report Other Information
Risk marginRisk margin is the reserves provided for the uncertainty of estimated future cash flows. As LICCL does not have sufficient cumulative historic data to perform an accurate computation of its risk margin, the margin for non-life business is determined based on an industry ratio. Under this basis, the risk margin of the unearned premium reserve is set at 3% and the risk margin of the outstanding claims reserve is set at 2.5% of the unbiased estimation of the respective future cash flows.
Credit RiskLICCL is exposed to credit risks primarily associated with insurance, reinsurance and retrocession arrangements with its insurance counterparties. Credit risk is minimised by actively monitoring the credit worthiness of counterparties and reviewing the pattern of aged debt across the portfolio to ensure this is managed proactively.
Significant accounting estimates Insurance contract reserves are calculated based on estimates of future payments arising from insurance contract obligations. The estimates are based on current available information as at the balance sheet date taking into account the respective probability of various scenarios.
Unearned premium reserveThe main assumptions used in the calculation of the unearned premium reserve relate to the loss ratio, expenses and the discount rate.
(a) Loss ratioThe insurance loss ratio is calculated by making estimates with reference to the historical experience of loss ratios in the London insurance market; the expected loss ratio provided by syndicates; and the Corporation’s actual claims experience.
(b) Expenses In determining expense assumptions, estimates are made based on analysis of future development trends and after taking inflation into account where applicable. The assumptions set for the inflation rate are consistent with those used for determining the discount rate.
(c) Discount rateThe discount rate used to calculate the unearned premium reserve is based on the market rate corresponding to the term and risk of liabilities. Discount rates are determined with reference to the 750 day moving average bond yield curve, taking liquidity, taxation and other factors into account. The discount rate assumption is affected by certain factors, such as future macroeconomics and capital markets and is therefore subject to uncertainty.
Outstanding claims reserveWhen calculating the outstanding claims reserve, the estimate is based on the expected ultimate cost of reported and unreported claims at the balance sheet date. The ultimate claim cost is determined based on historical experience; the expected loss ratio provided by the syndicates; actual claims experience and other elements. Claims expense reserves are calculated with reference to actual claims expenses and future developing trends.
Outstanding claims reserves are calculated taking the time value of money into account. The discount rate used is the same as that used for the calculation of the unearned premium reserve.
Lloyd’s Insurance Company S.A.The Society’s new European insurance subsidiary, Lloyd’s Insurance Company S.A., was officially inaugurated in November 2018 as a fully capitalised, Solvency II compliant insurance company. The company is authorised and regulated by the National Bank of Belgium and licensed to write all non-life risks from all markets within the EEA (excluding the UK). All Lloyd’s Brussels policies are 100% reinsured back to Lloyd’s syndicates. Lloyd’s Brussels is fully operational, and began successfully processing EEA risks incepting from 1 January 2019.

146 Lloyd’s Annual Report 2018
7. Other Group operating expenses
Note
2018Corporation
of Lloyd’s£m
2018Lloyd’s
Central Fund£m
2018Total
£m
Other Group operating expenses include:
Employment costs 8 164 – 164
Operating lease costs – Lloyd’s 1986 building 17 – 17
Operating lease costs – other 9 – 9
Legal and professional fees
Professional fees, including legal fees and related costs 48 1 49
Audit 1 – 1
Other services payable to PricewaterhouseCoopers LLP 1 – 1
Total legal and professional fees 50 1 51
Charitable donations 1 – 1
Other services payable to PricewaterhouseCoopers LLP include work undertaken on the Aggregate Accounts, Pro Forma Financial Statements and regulatory returns, in addition to actuarial and information technology services.
Note
2017Corporation
of Lloyd’s£m
2017Lloyd’s
Central Fund£m
2017Total
£m
Other Group operating expenses include:
Employment costs 8 138 – 138
Operating lease costs – Lloyd’s 1986 building 17 – 17
Operating lease costs – other 12 – 12
Legal and professional fees
Professional fees, including legal fees and related costs 34 1 35
Audit 1 – 1
Other services payable to PricewaterhouseCoopers LLP 1 – 1
Total legal and professional fees 36 1 37
Charitable donations 1 – 1
Other services payable to PricewaterhouseCoopers LLP include work undertaken on the Aggregate Accounts, Pro Forma Financial Statements and regulatory returns, in addition to actuarial and information technology services.
8. Employment
Note2018
£m2017
£m
Salaries and wages (including performance related bonus) 91 89
Lloyd’s Performance Plan (excluding social security costs) – –
Lloyd’s Pension Scheme costs 13 12 (2)
Other pension costs 7 4
Social security costs 11 11
Severance costs 5 6
Contract and agency employees 25 18
Other employment costs 13 12
Total employment costs 164 138
The emoluments of the Chairman, Chief Executive Officer and members of the Council and Board are included in the report of the Remuneration Committee on page 95.
Notes to the Financial Statements continued(For the year ended 31 December 2018)

Lloyd’s Annual Report 2018 147
Market ResultsStrategic Report Society Report Other Information
9. Finance costs and income2018
Corporation of Lloyd’s
£m
2018Lloyd’s
Central Fund£m
2018Total
£m
Finance costs
Interest payable on financial liabilities measured at amortised cost – (38) (38)
Amortisation of issue costs and discount – (1) (1)
Total finance costs - (39) (39)
Finance income
Bank interest received 5 6 11
Dividends received – 5 5
Other returns on investments designated at fair value through profit or loss 11 52 63
Unrealised fair value movement of forward contracts held for trading (5) 4 (1)
Realised fair value movement of forward contracts held for trading 3 12 15
Total finance income 14 79 93
2017Corporation
of Lloyd’s£m
2017Lloyd’s
Central Fund£m
2017Total
£m
Finance costs
Interest payable on financial liabilities measured at amortised cost – (51) (51)
Amortisation of issue costs and discount – (4) (4)
Total finance costs – (55) (55)
Finance income
Bank interest received 2 7 9
Dividends received – 7 7
Other returns on investments designated at fair value through profit or loss (2) 38 36
Unrealised fair value movement of forward contracts held for trading 9 (1) 8
Realised fair value movement of forward contracts held for trading – 2 2
Total finance income 9 53 62

148 Lloyd’s Annual Report 2018
10. Investments in subsidiary undertakingsSubsidiaries are those entities over which the Society directly or indirectly has the power to govern the operating and financial policies in order to gain economic benefits. The basis by which subsidiaries are consolidated in the Group financial statements is outlined in the basis of preparation (note 1).
The following subsidiaries principally affected the Group’s results as at 31 December 2018, as set out in the Society Group income statement.
Company name Nature of businessRegistered Address and Country of incorporation
Additional Underwriting Agencies (No. 5) Limited
Acts as members’ agent for Names c/o Clyde & Co LLP The St Botolph Building, 138 Houndsditch London, EC3A 7AREngland and Wales
Additional Securities Limited Provision of deposits overseas on behalf of Lloyd’s underwriters to comply with local insurance regulations
One Lime Street, London, EC3M 7HAEngland and Wales
Centrewrite Limited Authorised UK insurance company One Lime Street, London, EC3M 7HAEngland and Wales
Lloyd’s Finance Company Limited Capital management One Lime Street, London, EC3M 7HAEngland and Wales
Lloyd’s Housing Support Limited General commercial company One Lime Street, London, EC3M 7HAEngland and Wales
Lloyd’s Members Agency Services Limited
Acts as members’ agent for run off affairs One Lime Street, London, EC3M 7HAEngland and Wales
Omniline Services Limited Incorporated for the purpose of sale and leaseback of Lloyd’s 1958 Building
One Lime Street, London, EC3M 7HAEngland and Wales
Syndicate Underwriting Management Limited
Provision of insurance run off and related administrative services One Lime Street, London, EC3M 7HAEngland and Wales
Tutelle Limited Acts as a trustee of a fund established in order to secure the performance of obligations under certain indemnities given by the Society
One Lime Street, London, EC3M 7HAEngland and Wales
Lloyd’s Australia Limited Provision of administrative functions for Lloyd’s underwriters and acts as liaison office with the insurance regulatory authorities in Australia
Level 9, 1 O’Connell Street, Sydney NSW 2000, Australia
Lloyd’s Canada Inc. Provision of administration function on behalf of the Society and Lloyd’s underwriters in Canada
1155 Metcalfe Street, Suite 2200, Montreal, Quebec H3B 2V6, Canada
Lloyd’s Cyprus Limited Acts as general and fiscal representative for Lloyd’s underwriters in Cyprus
41-49 Agiou Nicolaou Street, Nimeli Court, Block C 2408 Engomi, Nicosia, Cyprus
Lloyd’s Escritorio de Representacao no Brasil Ltda.
Provides representative, administrative and management services on behalf of the Society and participant of Lloyd’s insurance market. Also acts as general and fiscal representative for Lloyd’s underwriters
Av. Almirante Barroso 52/2401 Rio de Janeiro, Brazil
Lloyd’s France SAS Provides administrative and management services on behalf of the Society and insurance market participants
8/10 rue Lamennais, 75008 Paris, France
Lloyd’s Iberia Representative S. L. U. Provides administrative and management services on behalf of the Society and participants of Lloyd’s insurance market
C/ Pinar, 7 1ª Drcha, 28006 Madrid, Spain
Lloyd’s Insurance Company (China) Limited
Authorised insurance company in China 3001, 3004, 3005, 3006, 3007, 3008, 30th Floor, No.501 Middle Yincheng Road, China (Shanghai) Free Trade Zone
Lloyd’s Insurance Company S.A. Authorised insurance company in Belgium for EEA business (excluding the UK)
Bastion Tower – Floor 145 Place du Champ de Mars, 1050 Bruxelles, Belgium
Lloyd’s Ireland Representative Limited Provides administrative and management services on behalf of the Society and participants of Lloyd’s insurance market. Also acts as general representative for Lloyd’s underwriters in Ireland
7/8 Wilton Terrace, Dublin 2, D02 KC57, Republic of Ireland
Lloyd’s Japan Inc. Acting as a general agent for the Society in Japan Tokyo Club Building 6F 3-2-6 Kasumigaseki Chiyoda-ku, Tokyo 100-0013 Japan
Notes to the Financial Statements continued(For the year ended 31 December 2018)

Lloyd’s Annual Report 2018 149
Market ResultsStrategic Report Society Report Other Information
Lloyd’s Labuan Limited Licensed to carry on business as underwriting manager in Malaysia Brighton Place,Ground FloorU0123-U0215 Jalan Bahasa87014 Labuan F.T, Malaysia
Lloyd’s Limited Provides administrative and management services on behalf of the Society and participants of Lloyd’s insurance market
Dubai International Financial Centre)Office 301, Precinct Building 2 DIFC, Dubai, United Arab Emirates
Lloyd’s Malta Limited Acts as a local general representative of the Society and those underwriting members of Lloyd’s who transact insurance business in Malta
171, Old Bakery Street, Valletta VLT 1455, Malta
Lloyd’s Netherlands Representative B. V.
Acts as representative office of Lloyd’s underwriters and the Society Beursplein 37Kant. H20.02 t/m H20.043011 AA Rotterdam, Netherlands
Lloyd’s of London (Asia) Pte Ltd Provides support for business development, administration and coordination services to the Society and Lloyd’s managing agents. Also provides administrative functions for Lloyd’s underwriters and acts as a liaison with the relevant regulatory authorities in Singapore
138 Market Street, #05-01 CapitaGreen, Singapore 048946
Lloyd’s of London (Representative Office) Greece SA
Acts as general and fiscal representative of Lloyd’s underwriters in Greece
25A Boukourestiou Street, 106 71 Athens, Greece
Lloyd’s Polska Sp. z o.o. Provides administrative and management services on behalf of the Society and participants of Lloyd’s insurance market
ul. Emilii Plater 53 . 00-113 Warszawa, Poland
Lloyd’s South Africa (Proprietary) Ltd Provision of administration function on behalf of the Society and Lloyd’s underwriters in South Africa
15th floor, The Forum2 Maude Street, SandtonSouth Africa
Lloyd’s America Ltd. Parent Company of Lloyd’s America Holding Inc. One Lime Street, London, EC3M 7HAEngland and Wales
Lloyd’s America Holdings Inc. Lloyd’s America Inc.
Provision of services to the Society and its brokers and customers in North America
42 West 54th St., 14th FloorNew York, NY 10019
Lloyd’s Kentucky Inc. Provision of services to the Society and its brokers and customers in North America
200 W. Main St.Frankfort, Kentucky KY 40601-1806
Lloyd’s Illinois Inc. Provision of services to the Society and its brokers and customers in North America
181 W Madison Street, Suite 3870Chicago, Illinois 60602
The main territory of operation of subsidiaries incorporated in England and Wales is the UK. For overseas subsidiaries, the principal country of operation is the same as the country of incorporation. All operating subsidiaries have a 31 December year end reporting date with the exception of Lloyd’s Japan Inc. with the year end reporting date of 31 March. All operating subsidiaries are 100% owned with the exception of Lloyd’s Escritorio de Representacao no Brasil Ltda. which is 99.99% owned by the Society and Lloyd’s Insurance Company S.A. which is 99% directly owned by the Society and 1% indirectly owned via Lloyd’s Finance Company Limited.
RestrictionsLloyd’s operates in more than 200 territories around the world and uses a number of different operating models depending upon local regulatory requirements. Different countries operate different regulatory regimes and, in some cases, these may place certain restrictions on the use of capital and assets that are held within those countries, including capital of RMB 1bn (2017: RMB 1bn) within Lloyd’s Insurance Company (China) Limited (LICCL) and 201m euro (2017: 6m euro) in Lloyd’s Insurance Company S.A. Lloyd’s proactively manages its international asset base to ensure that any such restrictions have a minimal impact upon the utilisation of capital and investments or upon the operations of the Corporation.

150 Lloyd’s Annual Report 2018
10. Investments in subsidiary undertakings continuedDormant subsidiariesThe Society has an ongoing interest in the following dormant subsidiaries. These subsidiaries are all 100% owned by the Society and they have not actively traded as at 31 December 2018.
Company nameRegistered Address and Country of incorporation
Additional Underwriting Agencies (No. 9) Limited One Lime Street, London, EC3M 7HAEngland and Wales
Additional Underwriting Agencies (No.10) Limited One Lime Street, London, EC3M 7HAEngland and Wales
Bankside Nominees Limited One Lime Street, London, EC3M 7HAEngland and Wales
Barder & Marsh Nominees Limited One Lime Street, London, EC3M 7HAEngland and Wales
CI de Rougemont (Nominees) Limited One Lime Street, London, EC3M 7HAEngland and Wales
CMA (CT&W) Nominees Limited One Lime Street, London, EC3M 7HAEngland and Wales
Crowe Agency Nominees Limited One Lime Street, London, EC3M 7HAEngland and Wales
Cuthbert Heath Nominees Limited One Lime Street, London, EC3M 7HAEngland and Wales
Devonshire Underwriting Agencies Nominees Limited One Lime Street, London, EC3M 7HAEngland and Wales
EHW (Nominees) Limited One Lime Street, London, EC3M 7HAEngland and Wales
EWC (Nominees) Limited One Lime Street, London, EC3M 7HAEngland and Wales
GP Eliot (Nominees) Limited One Lime Street, London, EC3M 7HAEngland and Wales
Gammell Kershaw Nominees Limited One Lime Street, London, EC3M 7HAEngland and Wales
GTUA Nominees Limited One Lime Street, London, EC3M 7HAEngland and Wales
Habit Nominees Limited One Lime Street, London, EC3M 7HAEngland and Wales
Hayter Brockbank Shipton Nominees Limited One Lime Street, London, EC3M 7HAEngland and Wales
Higgins Brasier Nominees Limited One Lime Street, London, EC3M 7HAEngland and Wales
Lloyd’s Nominees Director Limited One Lime Street, London, EC3M 7HAEngland and Wales
Lloyd’s Nominees Secretary Limited One Lime Street, London, EC3M 7HAEngland and Wales
Lloyd’s of London (Cassidy Members) Nominees Limited One Lime Street, London, EC3M 7HAEngland and Wales
Lloyd’s of London (Claremount) Nominees Limited One Lime Street, London, EC3M 7HAEngland and Wales
Lloyd’s of London (Harrison Brothers) Nominees Limited One Lime Street, London, EC3M 7HAEngland and Wales
Lloyd’s of London (Murray Lawrence) Nominees Limited One Lime Street, London, EC3M 7HAEngland and Wales
Notes to the Financial Statements continued(For the year ended 31 December 2018)

Lloyd’s Annual Report 2018 151
Market ResultsStrategic Report Society Report Other Information
Lloyd’s of London (Octavian) Nominees Limited One Lime Street, London, EC3M 7HAEngland and Wales
Lloyd’s of London (R J Kiln) Nominees Limited One Lime Street, London, EC3M 7HAEngland and Wales
Lloyd’s of London (Sedgwick) Nominees Limited One Lime Street, London, EC3M 7HAEngland and Wales
Lloyd’s of London (Spratt & White) Nominees Limited One Lime Street, London, EC3M 7HAEngland and Wales
Lloyd’s of London (Stewart Members) Nominees Limited One Lime Street, London, EC3M 7HAEngland and Wales
Lloyd’s of London (Wellington) Nominees Limited One Lime Street, London, EC3M 7HAEngland and Wales
Lloyd-Roberts & Gilkes Nominees Limited One Lime Street, London, EC3M 7HAEngland and Wales
Mander, Thomas & Cooper Nominees Limited One Lime Street, London, EC3M 7HAEngland and Wales
Meacock (Nominees) Limited One Lime Street, London, EC3M 7HAEngland and Wales
MFK Nominees Limited One Lime Street, London, EC3M 7HAEngland and Wales
Miles Smith Nominees Limited One Lime Street, London, EC3M 7HAEngland and Wales
Mocatta Dashwood Nominees Limited One Lime Street, London, EC3M 7HAEngland and Wales
MUA Nominees Limited One Lime Street, London, EC3M 7HAEngland and Wales
Mythzone Nominees Limited One Lime Street, London, EC3M 7HAEngland and Wales
Nomad Nominees Limited One Lime Street, London, EC3M 7HAEngland and Wales
Pieri Nominees Limited One Lime Street, London, EC3M 7HAEngland and Wales
Pound Nominees Limited One Lime Street, London, EC3M 7HAEngland and Wales
R F Kershaw (Nominees) Limited One Lime Street, London, EC3M 7HAEngland and Wales
Rilong Nominees Limited One Lime Street, London, EC3M 7HAEngland and Wales
Scott Caudle Hilsum Nominees Limited One Lime Street, London, EC3M 7HAEngland and Wales
Sturge Central Nominees Limited One Lime Street, London, EC3M 7HAEngland and Wales
Wendover Nominees Limited One Lime Street, London, EC3M 7HAEngland and Wales
WFDA Nominees Limited One Lime Street, London, EC3M 7HAEngland and Wales
Lloyd’s Aviation Limited One Lime Street, London, EC3M 7HAEngland and Wales
Lloyd’s Building Limited One Lime Street, London, EC3M 7HAEngland and Wales
Lloyd’s.com Limited One Lime Street, London, EC3M 7HAEngland and Wales

152 Lloyd’s Annual Report 2018
10. Investments in subsidiary undertakings continuedDormant subsidiaries continued
Company nameRegistered Address and Country of incorporation
Lloyd’s Information Services Limited One Lime Street, London, EC3M 7HAEngland and Wales
Lloyd’s Life Limited One Lime Street, London, EC3M 7HAEngland and Wales
Lloyd’s List Limited One Lime Street, London, EC3M 7HAEngland and Wales
Lloyd’s of London Press Limited One Lime Street, London, EC3M 7HAEngland and Wales
Lloyd’s Recoveries Limited One Lime Street, London, EC3M 7HAEngland and Wales
Lloyd’s Shelf Company 1 Limited One Lime Street, London, EC3M 7HAEngland and Wales
Lutine Nominees & Insurance Limited One Lime Street, London, EC3M 7HAEngland and Wales
Sharedealer Limited One Lime Street, London, EC3M 7HAEngland and Wales
All subsidiary undertakings are included in the consolidated Society Report. The proportions of the voting rights in the subsidiary undertakings held directly by the Society do not differ from the proportion of the ordinary shares held. With the exception of £1 preference share for Lloyd’s Building Limited, the Society does not have any preference shares of subsidiary undertakings included in the Group.
11. Investments in Associates and Joint VenturesThe Society has the following significant holdings which have been included as investments in associates and joint ventures.
Company NameRegistered Address and Country of Incorporation Proportion of equity capital held Nature of business
Ins-sure Holdings Limited Royal Pavilion, Wellesley Road, Aldershot, Hampshire, GU11 1PZEngland and Wales
25% Provision of premiums and claims accounting and settlement, policy production and ancillary insurance services principally to the London insurance market
Xchanging Claims Services Limited Royal Pavilion, Wellesley Road, Aldershot, Hampshire, GU11 1PZEngland and Wales
50% Provision of claims and recoveries services
The Message Exchange Limited One Lime Street, London, EC3M 7HAEngland and Wales
Limited by guarantee 25% Provision of messaging infrastructure to the London insurance market
Structured Data Capture Limited One Lime Street, London, EC3M 7HA England and Wales
Limited by guarantee 33% Provision of standardisation of data capture across the London market
London Market Operations and Strategic Sourcing Limited
One Lime Street, London, EC3M 7HA England and Wales
Limited by guarantee 33% A centralised capability to source and manage outsourced Market Services for the London insurance Market
The issued share capital of Ins-sure Holdings Limited is £4,000. There are three classes of shares. The Society holds 1,000,000 B shares of 0.1p each that have the right to participate in 25% of any profits available for distribution.
Notes to the Financial Statements continued(For the year ended 31 December 2018)

Lloyd’s Annual Report 2018 153
Market ResultsStrategic Report Society Report Other Information
The issued share capital of Xchanging Claims Services Limited is £4,001. There are three classes of shares. The Society holds 1,000 A shares of £1 each and 2,001 C shares of £1 each. The A and C shares have the following rights with respect to dividends:
(a) The A shares participate in 50% of any profits available for distribution after taking account of the dividend rights outlined above; and
(b) The C shares carry a right to a fixed cumulative preference dividend of 5% calculated on the nominal capital and a variable participating dividend calculated by reference to trading profits.
The Society entered into a joint venture agreement with International Underwriting Association of London Limited; London and International Brokers’ Association Limited; and Lloyd’s Market Association for an equal participation in The Message Exchange Limited which was incorporated on 27 August 2010. The Message Exchange Limited operates The Exchange – a simple messaging hub provided to the London insurance market to support its efforts to extend the use of electronic processing of business. As at 31 December 2018 and 2017, the net assets of The Message Exchange Limited had no material impact on the Society accounts.
In 2017, the Society entered into a joint venture agreement with International Underwriting Association of London Limited and Lloyd’s Market Association for an equal participation in Structured Data Capture Limited which was incorporated on 14 June 2017. The share capital of Structured Data Capture Limited is £3.
In 2018, the Society entered into a joint venture agreement with International Underwriting Association of London Limited and Lloyd’s Market Association for an equal participation in London Market Operations and Strategic Sourcing Limited which was incorporated on 7 March 2018.
Investments in Associates and Joint Ventures
2018£m
2017£m
At 1 January 18 7
Share of operating profits 12 11
Share of tax on profit on ordinary activities (3) (1)
Total share of profits of associates 9 10
Share of actuarial gains on pension liability 1 2
Share of tax on items taken directly to equity – (1)
Dividends received (9) –
At 31 December 19 18

154 Lloyd’s Annual Report 2018
Notes to the Financial Statements continued(For the year ended 31 December 2018)
11. Investments in Associates and Joint Ventures continued
Summarised statement of financial positionSummary of financial information for associates and joint ventures:
Ins-sure Holdings Limited
As at 31 December
Xchanging Claims Services Limited
As at 31 December
The Message Exchange Limited
As at 31 December
Structured Data Capture Limited
As at 31 December
London Market Operations and Strategic
Sourcing Limited As at 31 December
2018£m
2017£m
2018 £m
2017£m
2018£m
2017£m
2018£m
2017£m
2018£m
2017£m
Current assets
Debtors 21 21 4 6 – – – – – –
Prepayments and accrued income – 2 – – – – – – – –
Cash at bank and in hand 36 41 28 21 – – – – 2 –
Total current assets 57 64 32 27 – – – – 2 –
Non-current assets –
Tangible fixed assets – – – – – – – – – –
Intangible assets 34 35 – – – – – – – –
Deferred tax assets 3 2 – – – – – – – –
Pension asset – – 1 – – – – – – –
Total non-current assets 37 37 1 – – – – – – –
Current liabilities
Creditors falling due within one year (41) (39) (17) (14) – – – – (2) –
Current income tax liabilities (4) (9) (2) (2) – – – – – –
Provisions (1) – – – – – – – – –
Total current liabilities (46) (48) (19) (16) – – – – (2) –
Non-current liabilities
Creditors falling due after more than one year
– – – – – – – – – –
Pension liability – (3) – – – – – – – –
Total non-current liabilities – (3) – – – – – – – –
Net assets 48 50 14 11 – – – – – –
Summarised statement of comprehensive income
Ins-sure Holdings Limited
Xchanging Claims Services Limited
The Message Exchange Limited
Structured Data Capture Limited
London Market Operations and Strategic
Sourcing Limited
2018£m
2017£m
2018£m
2017£m
2018£m
2017£m
2018£m
2017£m
2018£m
2017£m
Revenues 94 101 32 32 2 1 3 1 2 –
Operating costs (65) (74) (22) (24) (2) (1) (3) (1) (2) –
Operating profit 29 27 10 8 – – – – – –
Tax on profit on ordinary activities (7) (2) (2) (2) – – – – – –
Profit for the financial year 22 25 8 6 – – – – – –
Other comprehensive income 2 8 – – – – – – – –
Total comprehensive income 24 33 8 6 – – – – – –

Lloyd’s Annual Report 2018 155
Market ResultsStrategic Report Society Report Other Information
12. Taxation(a) Tax charge
Note2018
£m2017
£m
Current tax:
Corporation tax based on profits for the year at 19% (2017: 19.25%) (42) (23)
Adjustments in respect of previous years (12) 1
Foreign tax suffered (4) (3)
Total current tax (58) (25)
Deferred tax:
Origination and reversal of timing differences
Current year 8 (7)
Prior year 11 1
Tax charge recognised in the Group income statement (39) (31)
Analysis of tax charge recognised in the Group statement of comprehensive income:
Tax charge on actuarial loss on pension liabilities:
Group (12) (9)
Associates – –
Tax charge recognised in the Group statement of comprehensive income (12) (9)
Total tax charge (51) (40)
(b) Reconciliation of effective tax rate
2018%
2018£m
2017%
2017£m
Surplus on ordinary activities before tax 202 187
Expected tax at the current rate 19.0% (38) 19.3% (36)
Expenses not deductible for tax purposes 1.3% (3) 0.5% (1)
Overseas tax (1.4%) 3 0.2% (1)
Difference between tax and accounting profit on investments – – (0.4%) 1
Share of profits of associates (0.9%) 2 (1.0%) 2
Deferred tax on restated fixed assets – – (0.3%) 1
Deferred tax adjustment relating to change in tax rate 1.0% (2) (0.5%) 1
Deferred tax prior year adjustments (5.6%) 11 (0.4%) 1
Current tax prior year adjustments 5.9% (12) (0.8%) 1
Tax charge 19.3% (39) 16.6% (31)
Notes to the Financial Statements continued(For the year ended 31 December 2018)

156 Lloyd’s Annual Report 2018
Notes to the Financial Statements continued(For the year ended 31 December 2018)
12. Taxation continued(c) Deferred tax
2018Balance at
1 January£m
2018Income
statement£m
2018Equity
£m
2018Balance at
31 December£m
Plant and equipment 5 1 – 6
Losses provided – 6 – 6
Financial investments (13) 13 – –
Pension liabilities 29 (1) (12) 16
Other employee benefits 2 (1) – 1
Provisions 1 1 – 2
Other items 1 – (1) –
Total deferred tax 25 19 (13) 31
In 2018 there were no unrecognised deductible temporary differences (2017: nil).
Deferred tax assets and liabilities are measured at the tax rate that will apply to the period when an asset is expected to be realised or a liability is expected to be settled. The applicable rate is that which has been enacted or substantively enacted by the balance sheet date.
The deferred tax asset is based on a corporation tax rate of 19% to 17% depending on when an asset is expected to unwind (2017: 19% to 17%). Reductions to the UK corporate tax rate to 19% from 1 April 2017 and 17% from 1 April 2020 were substantively enacted in September 2016.
2017Balance at
1 January£m
2017Income
statement£m
2017Equity
£m
2017 Balance at 31 December
£m
Plant and equipment 4 1 – 5
Financial investments (7) (6) – (13)
Pension liabilities 39 (1) (9) 29
Other employee benefits 3 (1) – 2
Provisions – 1 – 1
Other items 1 – – 1
Total deferred tax 40 (6) (9) 25

Lloyd’s Annual Report 2018 157
Market ResultsStrategic Report Society Report Other Information
13. Pension schemesThe Society operates a number of defined benefit and defined contribution pension schemes. In the UK, employees are entitled to join a Group Personal Pension Plan, and there is also a closed defined benefit scheme. Other schemes have been established for certain employees based overseas.
These schemes are generally funded by the payment of contributions to separately administered funds.
Defined benefit and contribution plansThe pension deficits of the schemes at 31 December 2018 are as follows:
2018£m
2017£m
Lloyd’s Pension Scheme (87) (161)
Overseas pension schemes (3) (3)
Total schemes deficit (90) (164)
The amounts charged/(credited) to the Group income statement and Group statement of comprehensive income in respect of defined benefit plans and defined contribution plan, are as follows:
2018£m
2017£m
Group income statement
Lloyd’s Pension Scheme 12 (2)
Overseas pension schemes 2 2
Other pension contributions 5 2
Total 19 2
Group statement of comprehensive income
Lloyd’s Pension Scheme (71) (48)
Overseas pension schemes – –
Total (71) (48)
Lloyd’s Group Personal Pension PlanUK employees are eligible to join the Lloyd’s Group Personal Pension Plan, which is administered by Aviva. The Group Personal Pension Plan was introduced in 2013, when the defined benefit pension scheme was closed to new members. The amount charged to the Group income statement in respect of Lloyd’s Group Personal Pension Plan is £5m.
Members of the Lloyd’s Group Personal Pension plan can elect their contribution rate (payable via salary sacrifice) and can change this at any time.
The contribution matrix for the Group Personal Pension Plan was enhanced in 2018 and is now:
Employee Lloyd’s Total
3% 8% 11%
4% 9% 13%
5% 10% 15%
6% 11% 17%
7% 12% 19%
8% 13% 21%
9% 14% 23%
10% or more 15% 25%
The cap on Lloyd’s contribution is 15%.

158 Lloyd’s Annual Report 2018
Notes to the Financial Statements continued(For the year ended 31 December 2018)
13. Pension schemes continued Lloyd’s Pension SchemeThe Lloyd’s Pension Scheme is a defined benefit pension scheme with assets held in a separately administered fund. The Scheme provides pensions to members on retirement, as well as benefits on the death of members. The Scheme operates in accordance with the Scheme’s Trust Deed and Rules and relevant legislation. A Board of Trustees manage and administer the Scheme; they are primarily responsible for ensuring that members are paid the correct benefits at the correct time, and that there are sufficient Scheme assets to pay benefits as they fall due.
The Lloyd’s Pension Scheme closed to new members in 2013 and closed to future accrual for existing members on 30 June 2018. Existing members of the Scheme at that time were enrolled into the Group Personal Pension Plan for future pension benefits.
Scheme contributions and funding valuationUK legislation requires the funding position of the Scheme to be assessed at least every three years by an independent qualified actuary. Following closure of the Scheme to future benefit accrual, there are no regular monthly contributions paid to the Scheme. However, where a funding deficit is identified, a recovery plan will be agreed between the Society and the Trustees, setting out the contributions required to meet the deficit.
The last formal actuarial valuation of the Scheme was carried out by Willis Towers Watson as at 30 June 2016 using the projected unit credit method. The total market value of the Scheme’s assets at the 2016 valuation was £667m, and the total value of accrued liabilities was £730m showing a funding deficit of £63m. These figures exclude both liabilities and the related assets in respect of money purchase Additional Voluntary Contributions (AVCs). A recovery plan is in place and has been agreed with the Trustees. The next formal actuarial valuation will be carried out as at 30 June 2019 and the results of this will be considered to determine whether a revised recovery plan is required.
Following the 2016 actuarial valuation, employer contributions to meet the cost of future accrual as a percentage of salaries were 35% for final salary members with an Normal Retirement Age (NRA) of 60, 30.8% for final salary members with an NRA of 65 and 18.6% for members accruing benefits on a career average basis. These contribution rates were in force until the Scheme closed on 30 June 2018.
Discretionary pension increases – treatment for funding purposesThere are no guaranteed increases in payment for pensions accrued before 6 April 1997. In 2003, Lloyd’s instructed Willis Towers Watson not to allow for such increases in calculating the Scheme’s liabilities for future actuarial funding valuations. Such increases have always been payable at the discretion of the Society and will continue to be considered on the basis of affordability, but are not taken into account by the actuary in determining the funding level.
Guaranteed minimum pension equalisationOn 26 October 2018, the High Court ruled on the equalisation of benefits for the gender effect on a member’s guaranteed minimum pension (GMP) for the Lloyds Banking Group pension scheme. The Court ruled that GMP equalisation on current and past members is required, and considered a number of options for achieving this. The judgement is expected to create a precedent for other schemes with GMPs, including the Society’s own scheme. In response to this, an allowance of £3m has been made within the scheme liabilities in respect of the cost to equalise member benefits. There remains some uncertainty with regard to the final outcome of the ruling, with further hearings to clarify certain details of the ruling scheduled in 2019. The possibility of an appeal to the original ruling also remains. The Trustees of the scheme have therefore taken the decision not to take any action in response to the ruling at this time, but will continue to monitor events closely.
Information about the risks of the Scheme to the SocietyThe ultimate cost of the Scheme to the Society will depend upon actual future events rather than the assumptions made. Many of the assumptions made are unlikely to be borne out in practice and as such the cost of the Scheme may be higher or lower than disclosed. In general, the risk to the Society is that the assumptions underlying the disclosures, or the calculation of contribution requirements, are not borne out in practice and the cost to the Society is higher than expected. This could result in a higher deficit disclosed and therefore higher recovery contributions required from the Society. This may also impact the Society’s ability to grant discretionary benefits or other enhancements to members.

Lloyd’s Annual Report 2018 159
Market ResultsStrategic Report Society Report Other Information
More specifically, the assumptions not being borne out in practice could include:
— The return on the Scheme’s assets being lower than assumed;
— Falls in asset values (particularly equities) not being matched by similar falls in the value of liabilities;
— A decrease in corporate bond yields will increase the Scheme’s liabilities, although this will be partially offset by an increase in the value of the Scheme’s bond assets;
— The majority of the Scheme’s assets are linked to inflation, and higher inflation will lead to higher liabilities; and
— Unanticipated future changes in mortality patterns leading to an increase in the life expectancy for members, resulting in higher liabilities. Future mortality rates cannot be predicted with certainty.
The Scheme’s investment strategyThe Scheme’s investment strategy apportions the Scheme’s assets into two portfolios. The risk-reducing portfolio, currently amounting to around 50% of the total assets, is invested in bonds, structured with the intention of generating cash flows that match as far as possible those required to meet a proportion of the Scheme’s obligations. The return-seeking portfolio is intended to generate returns which over the long term will fund the remainder of the Scheme’s obligations. This portfolio is invested in passive and active equities, and active property.
As the Scheme matures, the Trustees and the Society expect to continue to gradually reduce the proportion allocated to return-seeking assets and increase the proportion allocated to matching assets.
Principal actuarial assumptions in respect of IAS 19The demographic assumptions that are the most financially significant are those relating to the life expectancy of retired members. The mortality table used for the purposes of the IAS 19 valuation as at 31 December 2018 was 110% of SAPs S1 light tables for males and 115% SAPs S1 light tables for females, with allowance for future improvements in line with CMI’s published 2017 core projection model with 1.5% per annum long-term improvements (2017: 110% of SAPs S1 light tables for males and 115% SAPs S1 light tables for females, with allowance for future improvements in line with CMI’s 2015 core projections with 1.5% per annum trend improvement).
These assumptions are equivalent to expected longevity at age 60 approximately as follows:
— For pensioners currently aged 60: ranging from 28 years to 29 years (2017: 28 years to 29 years); and
— For non-pensioners currently aged 45: ranging from 29 years to 30 years (2017: 30 years to 31 years).
The other major financial assumptions used by the actuary as at 31 December 2018 for the purposes of IAS 19 were:
2018 % per annum
2017 % per annum
2016 % per annum
2015 % per annum
2014 % per annum
General salary and wage inflation N/A 4.2 4.4 4.2 4.1
Rate of increase in pensions in payment
6 April 1997 to 5 April 2005 3.1 3.1 3.2 3.1 3.0
Post 5 April 2005 2.2 2.2 2.3 2.2 2.2
Increases to final salary deferred pensions
Benefits accrued before April 2009 2.2 2.2 2.4 2.2 2.1
Benefits accrued from April 2009 2.2 2.2 2.4 2.2 2.1
CARE revaluation in service and in deferment, and increase in payment 2.2 2.2 2.3 2.2 2.2
Discount rate 2.9 2.4 2.6 3.8 3.7
Price inflation
Retail Price Inflation (RPI) 3.2 3.2 3.4 3.2 3.1
Consumer Price Inflation (CPI) 2.2 2.2 2.4 2.2 2.1

160 Lloyd’s Annual Report 2018
Notes to the Financial Statements continued(For the year ended 31 December 2018)
13. Pension schemes continued An allowance is made for members commuting 20% (2017: 20%) of their pension on retirement using the factors in use at the respective date.
For IAS 19 purposes, the Society recognises the cost of discretionary increases to pre 6 April 1997 benefits in payment when there is a constructive liability to make such increases. The Society provided £10m in 2007 and a further £20m in 2011 to meet the expected cost of future discretionary increases. This amount has been notionally segregated from the Scheme’s other assets (the ‘notional fund’) and its investment performance will be tracked on the assumption that it is invested in the same way as the Scheme’s other assets.
The notional fund will be used to facilitate the award of future discretionary pension increases when the Society carries out its annual review of pensions in accordance with the Scheme’s Definitive Trust Deed. As long as there is a notional fund set aside for this purpose, discretionary increases will continue to be made. As at 31 December 2018 the value of the notional fund was £26m (2017: £30m).
Sensitivity of pension obligation to changes in assumptionsThe actuarial valuation of liabilities under IAS 19 is particularly sensitive to changes in market conditions.
A change of 1% per annum in the discount rate as at 31 December 2018 would result in a change to the pension liabilities at that date of around 20%, or approximately £170m (2017: £190m).
A change of 1% per annum in the assumption for future inflation (both RPI and CPI) as at 31 December 2018, which would change future expectations of salary increases, pension increases and deferred revaluation, would result in a change to the pension liabilities at that date of around 10%, or approximately £85m (2017: £95m).
A change in the mortality assumptions could have a significant impact on the pension liability. For instance, if members aged 60 were instead expected to live for one year longer, with all other members’ life expectancies increasing by a proportionate amount, then the liability as at 31 December 2018 would be 3% higher (2017: 3%).
Amounts for the current and previous years were:
Asset/(liability) analysis of the Scheme
2018 Fair value
£m
2017 Fair value
£m
2016 Fair value
£m
2015 Fair value
£m
2014 Fair value
£m
Bonds
Corporate bonds 33 137 135 127 131
Index-linked gilts 374 142 141 124 128
Equities
UK equities 29 33 41 56 57
Overseas (excluding UK) equities 224 342 284 257 255
Property 85 97 91 86 77
Infrastructure 16 16 15 11 12
Cash and net current assets 12 29 23 13 20
Total market value of assets 773 796 730 674 680
Actuarial value of Scheme liabilities (860) (957) (958) (768) (763)
Deficit in the Scheme (87) (161) (228) (94) (83)
Irrecoverable surplus (effect of asset ceiling) – – – – –
Net defined benefit liability (87) (161) (228) (94) (83)
All of the Scheme’s assets are quoted in an active market. The Scheme is not currently invested in any of the Society’s own assets. Approximately 96% of the Scheme’s liabilities relate to final salary members and 4% relates to CARE members.

Lloyd’s Annual Report 2018 161
Market ResultsStrategic Report Society Report Other Information
Changes in the present value of the defined benefit obligations are:
2018£m
2017£m
Actuarial value of Scheme liabilities at 1 January 957 958
Interest cost on Pension Scheme liabilities 23 24
Current service cost (net of employee contributions) 5 11
Employee contributions 1 2
Benefits paid (30) (28)
Experience gains arising in Scheme liabilities 10 2
Curtailments – (20)
Scheme amendments 3 –
Change in assumptions underlying the present value of the Scheme liabilities
Demographic assumption change (27) (11)
Financial assumption change (82) 19
Actuarial value of Scheme liabilities at 31 December 860 957
Changes in fair value of plan assets were:
2018£m
2017£m
Fair value of Scheme assets at 1 January 796 730
Expected return on Pension Scheme assets 19 18
Employer contributions 15 17
Employee contributions 1 2
Benefits paid (29) (28)
Actuarial (loss)/gain on Scheme assets (28) 58
Administrative expenses (1) (1)
Fair value of Scheme assets at 31 December 773 796

162 Lloyd’s Annual Report 2018
Notes to the Financial Statements continued
(For the year ended 31 December 2018)
13. Pension schemes continuedAnalysis of the amount recognised in the Group statement of comprehensive income
2018£m
2017£m
Experience reductions arising on Scheme liabilities (10) (2)
Changes in the assumptions underlying the present value of the Scheme liabilities
Demographic assumption change 27 11
Financial assumption change 82 (19)
Actuarial gain/(loss) arising during period 99 (10)
Return on Fund assets greater than discount rate (28) 58
Remeasurement effects recognised in the Group statement of comprehensive income 71 48
Analysis of the amount charged to the Group income statement (recognised in other Group operating expenses)
2018£m
2017£m
Current service cost 5 12
Past service cost 3 –
Net interest on net defined benefit liability 4 6
Curtailments – (20)
Total operating charge/(credit) 12 (2)
Maturity profile of Defined Benefit ObligationThe Scheme is maturing over time, with 38% of the members in the Scheme at the 30 June 2016 valuation date being retired members and with an approximate duration of the Scheme’s liabilities of around 20 years.
The expected benefit payments from the Scheme over the next few years are as follows:
£m
Expected benefit payments during year ending 31 December 2019 26
Expected benefit payments during year ending 31 December 2020 23
Expected benefit payments during year ending 31 December 2021 24
Expected benefit payments during year ending 31 December 2022 26
Expected benefit payments during year ending 31 December 2023 27
Expected benefit payments during period 1 January 2024 to 31 December 2028 156
Expected benefit payments during period 1 January 2029 to 31 December 2033 181
Expected benefit payments from 1 January 2034 onwards 1,184

Lloyd’s Annual Report 2018 163
Market ResultsStrategic Report Society Report Other Information
Overseas pension schemesThe Society operates a number of defined benefit schemes for qualifying employees based overseas. The actuarial valuations of these pension schemes at 31 December 2018 resulted in a deficit of £3m (2017: £3m).
Development of net balance sheet position 2018
£m 2017
£m
Value of assets 3 3
Actuarial value of scheme liabilities (6) (6)
Deficit in the scheme (3) (3)
Net defined benefit liability (3) (3)
Defined contribution plansThe Society operates a number of defined contribution retirement benefit schemes for qualifying employees based overseas. The assets of the schemes are held separately from those of the Society in funds under the control of the Trustees.
In some countries, employees are members of state-managed retirement benefit schemes. The Society is required to contribute a specified percentage of payroll costs to fund these benefits. The only obligation of the Society with respect to the retirement benefit scheme is to make the specified contributions.
The total expense recognised in the Group income statement of £2m (2017: £2m) represents contributions payable to these schemes by the Society at pricing levels specified in the rules of these schemes.
14. Intangible assets Software development
£m
Cost
At 1 January 2017 5
Additions –
Disposals –
At 31 December 2017 5
Additions 6
Disposals –
At 31 December 2018 11
Amortisation
At 1 January 2017 (5)
Charge for the year –
Disposals –
At 31 December 2017 (5)
Charge for the year –
Disposals –
At 31 December 2018 (5)
Net book value at 31 December 2018 6
Net book value at 31 December 2017 –
Impairment lossesAs part of an assessment of the carrying value of assets, none of the intangible assets were written off in 2018 and 2017.

164 Lloyd’s Annual Report 2018
Notes to the Financial Statements continued(For the year ended 31 December 2018)
15. Tangible assetsPlant and equipment
Furniture and fittings
£m
Computer and
specialised equipment
£mTotal
£m
Cost
At 1 January 2017 32 24 56
Additions 5 3 8
Disposals (2) (2) (4)
At 31 December 2017 35 25 60
Additions 3 – 3
Disposals (1) (3) (4)
At 31 December 2018 37 22 59
Depreciation and impairment
At 1 January 2017 21 17 38
Depreciation charge for the year 3 3 6
Disposals (2) (2) (4)
Impairment losses – 2 2
At 31 December 2017 22 20 42
Depreciation charge for the year 3 2 5
Impairment losses 4 – 4
Disposals (1) (3) (4)
At 31 December 2018 28 19 47
Net book value at 31 December 2018 9 3 12
Net book value at 31 December 2017 13 5 18
Impairment lossesImpairment reviews are undertaken annually of the recoverability of the carrying value of plant and equipment assets held. As part of this review, £4m of plant and equipment was written off in 2018 (2017: £2m). As part of an assessment of the carrying value of assets, none of the intangible assets were written off in 2018 and 2017.
Lloyd’s CollectionThe Lloyd’s Collection represents various paintings, antiques and artefacts. The collection was valued at £15m by Gurr Johns Limited, valuers and fine art consultants in November 2018, on the basis of open market auction value assuming all items are not sold at the same time taking into account the nature, age, condition and quality of each chattel. This resulted in a revaluation gain of £2m.

Lloyd’s Annual Report 2018 165
Market ResultsStrategic Report Society Report Other Information
16. Loans recoverable
2018£m
2017£m
At 1 January 40 43
Recoveries during the year (4) (3)
Fair value movements recognised during the year – –
At 31 December 36 40
17. Financial investments
Note2018
£m2017
£m
Financial investments at amortised cost
Statutory insurance deposits 629 –
Short term and security deposits 468 –
Total financial investments at amortised cost 17(a) 1,097 –
Statutory insurance deposits – 486
Financial investments at fair value through profit and loss 17(b) 2,486 2,807
Financial investments – 3,293
(a) Financial investments at amortised costFinancial investments at amortised cost include statutory insurance deposits, short term deposits and security deposits.
Statutory insurance deposits include investments such as government bonds, treasury bills, letters of credit, call accounts, fixed term deposits and cash deposits held in certain countries to satisfy local trading authorisation requirements. These are excluded from cash and cash equivalents because these amounts are not available to finance the Society’s day to day operations.
The security deposits relate to Tutelle Limited. In 1996 the Council set aside £20m of the Old Central Fund, under a Lloyd’s special account, to secure the Society’s obligations under employee indemnities and certain indemnities that have been given by the Society to certain individuals and advisers in respect of the Reconstruction and Renewal plan. These include members of the Reserve Group, directors and officers of Equitas, members of the Council, their respective sub committees and Corporation employees.
Unless and until there is any default under the security documentation, interest earned on the trust fund is paid to the Old Central Fund. The security was deposited for an initial period of two years and the Council exercised its discretion to renew this in June 1998. The Council further amended the period of the deposit in November 1998, so that the security could only be released if the Council was satisfied that there was no reasonable prospect of a claim being made under these indemnities. The Council have now resolved to wind up the Tutelle arrangements and return the trust funds monies to the Old Central Fund.

166 Lloyd’s Annual Report 2018
Notes to the Financial Statements continued(For the year ended 31 December 2018)
17. Financial investments continued (a) Financial investments at amortised cost continued
Statutory insurance deposits
2018Securities
£m
2018Deposits
£m
2018Total
£m
At 1 January 12 474 486
Additions at cost 15 466 481
Disposal proceeds (16) (353) (369)
Surplus on the sale and revaluation of investments – 31 31
At 31 December 11 618 629
Statutory insurance deposits
2017Securities
£m
2017Deposits
£m
2017Total
£m
At 1 January 14 483 497
Additions at cost 27 477 504
Disposal proceeds (28) (458) (486)
Surplus on the sale and revaluation of investments (1) (28) (29)
At 31 December 12 474 486
Analysis of statutory insurance deposits2018
£m2017
£m
AAA 1 106
AA 371 164
A 238 196
BBB 8 8
Other 11 12
Total securities 629 486
Analysis of short term and security deposits2018
£m2017
£m
AAA 20 –
AA – –
A 348 –
BBB 100 –
Other – –
Total securities 468 –

Lloyd’s Annual Report 2018 167
Market ResultsStrategic Report Society Report Other Information
(b) Financial investments at fair value through profit and loss
2018 Corporation
of Lloyd’s£m
2018Lloyd’sCentral
Fund£m
2018Total
£m
Market value at 1 January 159 2,648 2,807
Transfers to amortised cost (159) (82) (241)
Additions at cost 214 1,570 1,784
Disposal proceeds (68) (1,797) (1,865)
Surplus on the sale and revaluation of investments – 1 1
Market value at 31 December 146 2,340 2,486
Analysis of securities at year end:
Listed securities
Fixed interest:
Government 112 862 974
Corporate securities 34 644 678
Emerging markets – 164 164
Total fixed interest 146 1,670 1,816
Global equities – 249 249
Total listed securities 146 1,919 2,065
Unlisted securities
Hedge funds – 158 158
Multi-asset – 263 263
Loan investments – – –
Total unlisted securities – 421 421
Market value 146 2,340 2,486
2018 Corporation
of Lloyd’s£m
2018Central
Fund£m
2018Total
£m
Analysis of securities:
AAA 36 386 422
AA 61 569 630
A 32 349 381
BBB 17 294 311
Other – 742 742
Total securities 146 2,340 2,486

168 Lloyd’s Annual Report 2018
Notes to the Financial Statements continued(For the year ended 31 December 2018)
17. Financial investments continued
2017Corporation
of Lloyd’s£m
2017Lloyd’s
CentralFund
£m
2017Total
£m
Market value at 1 January 175 2,688 2,863
Additions at cost – 1,197 1,197
(Decrease)/Increase in short-term deposits (16) 23 7
Disposal proceeds – (1,266) (1,266)
Deficit on the sale and revaluation of investments – 6 6
Market value 159 2,648 2,807
Analysis of securities at year end:
Listed securities
Fixed interest:
Government – 808 808
Corporate securities – 733 733
Emerging markets – 287 287
High yield – 49 49
Total fixed interest – 1,877 1,877
Global equities – 392 392
Total listed securities – 2,269 2,269
Unlisted securities
Hedge funds – 151 151
Commodities – 48 48
Loan investments – 98 98
Short-term deposits 159 62 221
Security deposits – 20 20
Total unlisted securities 159 379 538
Market value 159 2,648 2,807
2017Corporation
of Lloyd’s£m
2017Lloyd’s
CentralFund
£m
2017Total
£m
Analysis of corporate securities:
AAA 31 265 296
AA 27 810 837
A 95 313 408
BBB 6 314 320
Other – 946 946
Total securities 159 2,648 2,807

Lloyd’s Annual Report 2018 169
Market ResultsStrategic Report Society Report Other Information
18. Trade and other receivables due within one year
2018£m
2017£m
Due within one year
Trade (net of allowance for impairment) 1 3
Insurance and reinsurance receivables 177 196
Interest receivable 16 16
Taxation and social security 7 4
Overseas office deposits 3 2
Amounts due from underwriters 5 5
Other receivables 5 39
Total trade and other receivables 214 265
19. Financial risk management objectives and policiesThis note explains the Society’s exposure to financial risks and how these risks could affect the Society’s future financial performance.
Explanations of the Society’s financial instrument risk management objectives, policies and strategies are set out in the discussion of the Society’s financial risk management and treasury policies on pages 113 to 114 of the Financial Review.
The Society’s risk management is predominantly controlled by a central treasury department (Group Treasury) under policies approved by the board of directors. Group Treasury identifies, evaluates and hedges financial risks in close cooperation with the Society’s operating units. The Board provides written principles for overall risk management, as well as policies covering specific areas, such as foreign exchange risk, interest rate risk, credit risk, use of derivative financial instruments and non derivative financial instruments, and investment of excess liquidity.
Fair values and credit riskThe methods and assumptions used in estimating the fair value of financial instruments are detailed in note 2(p).
The fair value (based on the quoted offer prices) of subordinated debt is £840m (2017: £925m) against a carrying value measured at amortised cost of £794m (2017: £793m). All other financial instruments are either held at fair value or at an amount that approximates fair value.
At the reporting date there were no significant concentrations of credit risk. The maximum exposure to credit risk is represented by the carrying value of each financial asset, including derivative financial instruments, in the Group statement of financial position.

170 Lloyd’s Annual Report 2018
Notes to the Financial Statements continued(For the year ended 31 December 2018)
19. Financial risk management objectives and policies continuedImpairment lossesFinancial AssetsThe Group has the following types of financial assets that are subject to the expected credit loss model:
— Statutory insurance deposits;
— Debt instruments carried at amortised cost;
— Trade receivables; and
— Cash and cash equivalents.
While these financial assets are subject to the impairment requirements of IFRS 9, the identified impairment losses are immaterial.
Trade receivablesThe ageing of trade receivables as at 31 December 2018 and 2017 was as follows:
2018Gross
£m
2018 Impairment
£m
2018Net£m
2017Gross
£m
2017Impairment
£m
2017Net£m
1-30 days – – – 2 – 2
Past due 31-120 days 1 – 1 1 – 1
More than 120 days – – – – – –
Total 1 – 1 3 – 3
The Society’s normal credit terms are 30 days. There was no movement in the allowance for impairment in respect of trade receivables during the year.
Sensitivity analysisForeign currency exposureCurrency risk is the risk that the sterling value of the Society’s assets and liabilities will fluctuate due to changes in foreign exchange rates. The Society’s exposure to the risk of changes in the foreign exchange rates relates primarily to revaluation of loans recoverable and changes in the fair value of foreign currency denominated investments and forward contracts. Further details on foreign currency risk can be found on page 114.
The majority of foreign exchange exposures arising from investments denominated in foreign currencies are managed via a foreign exchange hedging programme. However, some net exposures to foreign currencies remain and the sterling value of the Society’s investments may be impacted by movements in exchange rates relating to these exposures. At 31 December 2018, a 10% rise in the value of sterling, against all other currencies, would have reduced the surplus before tax by £232m (2017: £150m). This analysis is presented net of foreign exchange hedges, and assumes that all other variables remain constant. In practice, actual results may differ.
Debt securities sensitivitiesThe value of the Society’s investments in debt securities is affected by changes in the level of yields, as determined by the financial markets. As at 31 December 2018, a consistent increase of 100 basis points in the yields applicable to all relevant securities would have reduced the surplus before tax by approximately £31m (2017: £35m). Relevant securities include investment grade sovereign and corporate bonds, floating rate notes and interest rate swaps. This analysis assumes that all other variables, in particular foreign currency exchange rates, remain constant. In practice, actual results may differ. Further details on market risk can be found on page 114.
Equity price riskEquity price risk is the risk that the market values of equity investments fall. At 31 December 2018, a 15% fall in the value of all the Society’s equity investments would have reduced the surplus before tax by approximately £62m (2017: £86m). This analysis assumes that all other variables, in particular foreign currency exchange rates, remain constant. In practice, actual results may differ. Further details on market risk can be found on page 114.

Lloyd’s Annual Report 2018 171
Market ResultsStrategic Report Society Report Other Information
Liquidity riskThe table below summarises the maturity profile of the Society’s non derivative financial liabilities as at 31 December 2018 based on undiscounted contractual cash flows:
As at 31 December 2018
Carrying amount
£m
Contractual cash flows
£m
Within 1 year
£m
1-2 years
£m
2-5 years
£m
More than 5 years
£m
Subordinated loan notes 794 (1,074) (38) (38) (115) (882)
Loans funding statutory insurance deposits 625 (625) (625) – – –
Trade and other payables 507 (507) (507) – – –
Total 1,926 (2,206) (1,170) (38) (115) (882)
As at 31 December 2017
Carrying amount
£m
Contractual cash flows
£m
Within 1 year
£m
1-2 years
£m
2-5 years
£m
More than 5 years
£m
Subordinated loan notes 793 (1,112) (38) (38) (115) (921)
Loans funding statutory insurance deposits 483 (483) (483) – – –
Trade and other payables 481 (481) (481) – – –
Total 1,757 (2,076) (1,002) (38) (115) (921)
The contractual cash flows have been based on the expectation, but not the obligation, that the subordinated notes are redeemed at the first option date.
Forward currency contracts are settled gross; notional amounts are a close proxy for gross cash flow amounts. Further details regarding the subordinated notes can be found in note 22 on page 176.
Derivative financial instrumentsThe Society enters into forward currency contracts to manage exposures to fluctuation of exchange rates and to provide a currency conversion service to the Lloyd’s market. The Society’s derivative financial instruments are categorised as fair value Level 2.
Analysis of forward currency contracts2018
£m2017
£m
Outstanding forward foreign exchange gains 11 16
Outstanding forward foreign exchange losses (10) (10)
The fair value and notional amounts of forward currency contracts, all of which mature within one year, are analysed as follows:
2018 Assets 2018 Liabilities
As at 31 December 2018Fair value
£mNotional
£mFair value
£mNotional
£m
Currency conversion service 1 152 (1) (152)
Other forward foreign exchange contracts 6 1,104 (8) (1,105)
Interest rate swaps 4 220 (1) (220)
Total 11 1,476 (10) (1,477)
2017 Assets 2017 Liabilities
As at 31 December 2017Fair value
£mNotional
£mFair value
£mNotional
£m
Currency conversion service 6 223 (6) (224)
Other forward foreign exchange contracts 8 545 (2) (538)
Interest rate swaps 2 179 (2) (179)
Total 16 947 (10) (941)

172 Lloyd’s Annual Report 2018
Notes to the Financial Statements continued(For the year ended 31 December 2018)
19. Financial risk management objectives and policies continuedFair value hierarchyTo provide further information on the valuation techniques the Society uses to measure assets carried at fair value, the Society has categorised the measurement basis for assets carried at fair value into a “fair value hierarchy” described as follows, based on the lowest level input that is significant to the valuation as a whole:
Level 1Inputs to Level 1 fair values are quoted prices in active markets for identical assets. An active market is one in which transactions for the asset occur with sufficient frequency and volume to provide pricing information on an ongoing basis. Examples are listed debt securities in active markets, listed equities in active markets, listed deposits held with credit institutions in active markets.
Level 2Inputs to Level 2 fair values are inputs other than quoted prices included within Level 1 that are observable for the asset, either directly (i.e. as prices) or indirectly (i.e. derived from prices) and fair value is determined through the use of models or other valuation methodologies. Level 2 inputs include quoted prices for similar (i.e. not identical) assets in active markets, quoted prices for identical or similar assets in markets that are not active or in which little information is released publicly, unlisted deposits held with credit institutions in active markets or low volatility hedge funds where tradeable net asset values are published.
Level 3Inputs to Level 3 fair values are inputs that are unobservable for the asset. Unobservable inputs have been used to measure fair value where observable inputs are not available, allowing for situations where there is little or no market activity. Unobservable inputs reflect assumptions that the Society considers that market participants would use in pricing the asset and have been based on a combination of independent third party evidence and internally developed models.
Notes
2018Level 1
£m
2018Level 2
£m
2018Level 3
£m
2018Total
£m
Financial assets at fair value through profit or loss
Listed securities 772 880 – 1,652
Equity investments 249 164 – 413
Unlisted securities – 421 – 421
Total 17 1,021 1,465 – 2,486
Derivative financial instruments
Currency conversion service – 1 – 1
Other forward foreign exchange contracts – 6 – 6
Interest rate swaps – 4 – 4
Total derivative financial instruments 19 – 11 – 11
Total financial assets at fair value through profit or loss 1,021 1,476 – 2,497
Financial liabilities at fair value through profit or loss
Derivative financial instruments
Currency conversion service – (1) – (1)
Other forward foreign exchange contracts – (8) – (8)
Interest rate swaps – (1) – (1)
Total derivative financial instruments 19 – (10) – (10)
Total financial liabilities at fair value through profit or loss – (10) – (10)

Lloyd’s Annual Report 2018 173
Market ResultsStrategic Report Society Report Other Information
Notes
2017 Level 1
£m
2017 Level 2
£m
2017 Level 3
£m
2017 Total
£m
Financial assets at fair value through profit or loss
Statutory insurance deposits
Listed securities – 4 – 4
Unlisted securities – 8 – 8
Deposits with credit institutions – 474 – 474
Total statutory insurance deposits 17 – 486 – 486
Other investments
Listed securities 808 885 – 1,693
Equity investments 392 184 – 576
Unlisted securities – 279 18 297
Deposits with credit institutions – 241 – 241
Total other investments 17 1,200 1,589 18 2,807
Derivative financial instruments
Currency conversion service – 6 – 6
Other forward foreign exchange contracts – 8 – 8
Interest rate swaps – 2 – 2
Total derivative financial instruments 19 – 16 – 16
Loans recoverable 16 – – 40 40
Total financial assets at fair value through profit or loss 1,200 2,091 58 3,349
Financial liabilities at fair value through profit or loss
Derivative financial instruments
Currency conversion service – (6) – (6)
Other forward foreign exchange contracts – (2) – (2)
Interest rate swaps – (2) – (2)
Total derivative financial instruments 19 – (10) – (10)
Total financial liabilities at fair value through profit or loss – (10) – (10)
Unlisted securitiesSenior secured loans represent corporate lending to third parties that are held directly by the Society and managed by an external specialist investment manager. Gains and losses arising from changes in fair value are included in the Group income statement in the period in which they arise. The revaluation process is carried out on a monthly basis.
When specific loans are insufficiently traded, the investment manager will determine fair value based on various unobservable factors and market inputs. This approach aligns with a Level 3 classification. Level 3 asset price estimation processes involve significant judgement including the input choice. The investment manager will determine the most appropriate valuation method, which may comprise of, but is not limited to: discounted cash flow models, option adjusted spread prices, trading values on comparable assets or indicative broker quote(s).
Fair values are determined using a pricing hierarchy structure for valuation purposes. The valuation principles employed are to provide the most accurate valuations, while also working to provide independent valuations. The pricing process employs a hierarchy that utilises numerous third party sources in a tiered system. The standard pricing hierarchy includes the following independent pricing vendors: FT Interactive Data, Reuters, Barclays Indices, Citigroup Indices, Merrill Lynch Indices, SNP (Standard & Poor’s), MarkIt/LoanX – senior secured loans, Broker/Dealer Pricing, Fair Value/Model Pricing and Spread Pricing.

174 Lloyd’s Annual Report 2018
Notes to the Financial Statements continued(For the year ended 31 December 2018)
19. Financial risk management objectives and policies continuedLoans recoverableRecoverable Central Fund loans made to hardship members are managed on a fair value basis and relate solely to the revaluation of hardship, Limited Financial Assistance Agreement and legal assets. Gains and losses arising from changes in the fair value are included in the Group income statement in the period in which they arise. The revaluation process is carried out twice a year at both interim and year end.
Fair values are determined by reference to an estimate of the valuation of the underlying securities at the dates at which they may be exercised and discounted back to present day values. In the calculation of the fair value, the securities include both properties that have had a 2% increase applied and hardship trust fund assets with an annual increase of 1.3%. Both securities have had the percentage increase applied until the date at which they may be exercised. The property market remained stable throughout 2018 and showed a slight increase in property values since 2017. A discount rate of 2.9% (2017: 2.4%) has also been applied to achieve present day fair value. The securities include both properties and hardship trust fund assets. A security can normally only be exercised on the later of the date of death of the member or of their spouse. This date is assessed using actuarial assumptions.
The fair value movements during the year are recognised as finance income or finance costs in the Group income statement.
The table below sets out a reconciliation from the opening balances to the closing balances of Level 3 fair values:
2018£m
2017£m
As at 1 January 58 61
Transfers to amortised cost valuation (40) –
Purchases – 10
Sales (14) (5)
Transfers from Level 3 (4) (7)
Total net loss recognised in the profit and loss – (1)
As at 31 December – 58
Sensitivity analysisThe majority of the Society’s investments are valued based on quoted market information or other observable market data.
Unlisted securities sensitivitiesWhere estimates are used to value unlisted securities, these are based on a combination of independent third party evidence and internally developed models, calibrated to market observable data where possible. While such valuations are sensitive to estimates, it is believed that changing one or more of the assumptions to reasonably possible alternative assumptions is unlikely to result in a significant change in fair value.
Loans recoverable sensitivitiesThe value of loans recoverable is affected by changes in both property and hardship trust fund values. The property values are determined by periodic valuations, together with applying Halifax price indices bi-annually to revalue the assets at interim and year end. Inflationary increases are then applied to both property values and hardship trust funds until the estimated exercised date and then discounted back to present day values. Inflationary increases are estimated taking current economic conditions into account.
As at 31 December 2018, a decrease of 100 basis points in the property values, comprising the greatest part of the total balance, would not have an impact on the surplus before tax (2017: nil). This analysis assumes that all other variables, including inflationary increases and discounted rates remain the same.

Lloyd’s Annual Report 2018 175
Market ResultsStrategic Report Society Report Other Information
20. Cash and cash equivalents
2018£m
2017£m
Cash at banks 314 251
Short term deposits 287 246
Total cash and cash equivalents 601 497
Cash at banks earns interest at floating rates based on daily bank deposit rates. Short term deposits are made for varying periods of between one day and three months, depending on the immediate cash requirements of the Society, and earn interest at the respective short term deposit rates. The fair value of cash and cash equivalents is £601m (2017: £497m).
21. EquityAccumulated reserves
2018£m
2017£m
Attributable to:
Corporation of Lloyd’s 175 94
Central Fund 2,184 2,043
Associates 19 18
Total accumulated reserves 2,378 2,155
Revaluation reserveThe revaluation reserve of £15m (2017: £13m) is used to record increases in the fair value of the Lloyd’s Collection and decreases to the extent that such decreases relate to the amount previously recognised in the Group statement of comprehensive income.
Translation reserveThe translation reserve of £24m (2017: £20m) is used to record foreign exchange gains and losses recognised in other comprehensive income as a result of translating the results and financial position of Group entities that have a functional currency different from the presentation currency.

176 Lloyd’s Annual Report 2018
Notes to the Financial Statements continued(For the year ended 31 December 2018)
22. Subordinated notes
2018£m
2017£m
Details of loans payable wholly or partly after more than five years:
4.875% subordinated notes of £300m maturing 7 February 2047 (Sterling 2017 Notes) 300 300
4.750% subordinated notes of £500m maturing 30 October 2024 (Sterling 2014 Notes) 500 500
800 800
Less issue costs to be charged in future years (4) (4)
Less discount on issue to be unwound in future years (2) (3)
Total 794 793
Subordinated notesThe notes are subordinated obligations of the Society. Each tranche of the notes will rank pari passu with the other in a winding-up of the Society. Upon the occurrence of any winding-up proceedings of the Society, payments on the notes will be subordinated in right of payment to the prior payment in full of all other liabilities of the Society, except for liabilities which rank equally with or junior to the notes. Payments on the notes will also be subordinated to certain payments which may be made out of central assets including payments made to discharge the liabilities of an insolvent member to any person (including any policyholders) arising out of, or in connection with, insurance business carried on at Lloyd’s by that insolvent member and payments made in respect of the costs required by or under any insolvency procedure to which the Society or the Lloyd’s market may be subject. However, in the event of a winding-up of the Society, the claims of the holders of the notes rank senior to the distribution of any central assets to members of Lloyd’s generally (other than payments made to members in their capacity as senior creditors of the Society).
The Sterling 2014 notes issued on 30 October 2014 mature on 30 October 2024 and bear interest at a rate of 4.75% per annum, payable annually in arrears on 30 October in each year.
The Sterling 2017 notes issued on 7 February 2017 mature on 7 February 2047 and bear interest at a rate of 4.875% per annum, payable annually in arrears on 7 February in each year.
23. Provisions
2018 Undertakings
given to insolvent
members£m
2018 Income
Assistance Scheme
£m
2018 Lease cost
provision£m
2018 Restructuring
£m
2018Obligations
underonerous
lease£m
2018Other risks
and charges£m
2018Total
£m
Balance at 1 January – 2 8 4 1 – 15
Charged in the year – – 5 5 2 – 12
Utilised in the year – – (5) (2) – – (7)
Balance at 31 December – 2 8 7 3 – 20
2017 Undertakings
given toinsolvent
members£m
2017 Income
Assistance Scheme
£m
2017 Lease cost
provision£m
2017 Restructuring
£m
2017 Obligations
under onerouslease
£m
2017Other risks
and charges£m
2017Total
£m
Balance at 1 January – 2 11 – – 1 14
Charged/(released) in the year – – 3 4 1 (1) 7
Utilised in the year – – (6) – – – (6)
Balance at 31 December – 2 8 4 1 – 15

Lloyd’s Annual Report 2018 177
Market ResultsStrategic Report Society Report Other Information
Undertakings given to insolvent members The Council grants Undertakings with financial limits to certain corporate members to use the New Central Fund to discharge the liability of those members where they have unpaid cash calls and do not have the resources to meet those cash calls.
The purpose of these Undertakings is primarily to allow valid claims made on policies underwritten by those insolvent members to continue to be paid in full. For those corporate members in provisional liquidation, the Council has also provided a supporting commitment, which will ensure that in no circumstance will an insurance creditor receive less than the amount it would have received in a winding-up commencing on the date of the provisional liquidation.
Income Assistance SchemeThe Income Assistance Scheme was effective from 1 January 2010 and replaced both the Hardship Income Top-up Scheme and the Income and Housing Support Scheme. The Income Assistance Scheme is permanent and replaces the discretionary nature of the previous schemes and guarantees ongoing payment of income assistance to eligible members of the previous schemes until the full undertaking has been utilised, other than in the event that Lloyd’s faces severe financial stress.
Lease cost provisionThe lease cost provision represents the Society’s obligations in respect of the contractual capital expenditure and dilapidation cost under fully repairing leases.
Restructuring provision The provision is mainly in respect of obligations arising from the implementation of the Corporation’s operating model programme.
Obligations under onerous leaseA provision is made for obligations under an operating lease when the physically separable part of a property is taken out of use by the Group and the unavoidable costs of meeting the obligations under the lease exceed the economic benefits expected to be received.
SensitivitiesUndertakings given to insolvent membersThis provision is calculated with reference to the financial exposure that is expected to be borne by the Central Fund based upon forecast member losses. It is therefore sensitive to both the likelihood of these losses occurring as well as the potential value of the losses.
Income Assistance SchemeThe provision covers expected future payments under the Income Assistance Scheme. The Names covered by the scheme receive quarterly payments until (a) death (or a spouse’s death depending upon the individual arrangements agreed), (b) earlier settlement of the debt by the Name or (c) default by the Name of their contractual obligations. The value of the provision is therefore sensitive to the factors above as well as changes in inflation rates.
Lease cost provisionsThe value of the lease cost provision is calculated with reference to the costs which are expected to be incurred during the remainder of the lease term. A 10% increase in these costs will therefore increase the value of the provision by 10%. The value of the provision is not sensitive to the timing of expenditure during the lease term.
Obligations under onerous leaseThe provision is calculated using future lease payments as per the lease contract discounted at the Society’s long-term borrowing rate, and is therefore sensitive to changes in this assumption.
Restructuring provision The provision is calculated using assumptions regarding the average salary and length of service of potentially impacted employees, and is therefore sensitive to changes in these assumptions.

178 Lloyd’s Annual Report 2018
Notes to the Financial Statements continued(For the year ended 31 December 2018)
24. Trade and other payables
2018£m
2017£m
Due within one year
Trade and other creditors 105 122
Insurance and reinsurance payables 346 320
Members’ subscriptions and contributions repayable 31 16
Taxation and social security 6 4
Arbitration awards 2 2
Interest payable on subordinated loan notes 17 17
Total trade and other payables 507 481
25. Cash generated from operations
Notes2018
£m2017
£m
Surplus before tax 202 187
Net finance income 9 (54) (7)
Share of profits of associates 11 (9) (10)
Operating surplus 139 170
Central Fund claims and provisions incurred – –
Operating surplus before Central Fund claims and provisions 139 170
Adjustments for:
Depreciation of plant and equipment 15 5 6
Impairment losses 15 4 2
Foreign exchange gain on operating activities – 3
Operating surplus before working capital changes and claims paid 148 181
Changes in pension obligations (3) (17)
Increase/(decrease) in receivables 45 (161)
Increase in payables 27 215
Increase in provisions other than for Central Fund claims 4 1
Cash generated from operations before claims paid 221 219
Claims paid in respect of corporate/insolvent members 23 – –
Cash generated from operations 221 219
Notes
1 January 2018
£mCash flows
£m
Non-cash changes
£m
31 December2018
£m
Subordinated notes 22 793 – 1 794
Loans funding statutory insurance deposits 483 172 (30) 625
Total 1,276 172 (29) 1,419

Lloyd’s Annual Report 2018 179
Market ResultsStrategic Report Society Report Other Information
26. Commitments(a) Capital expenditure commitmentsCapital expenditure commitments contracted but not provided for in the Financial Statements was nil (2017: nil).
(b) Operating lease commitments – Lloyd’s as lessee
2018£m
2017£m
Non-cancellable operating lease rentals are payable as follows:
Within one year 27 32
After one year but not more than five years 78 105
More than five years 121 166
Commitments outstanding under the terms of the lease for the Lloyd’s 1986 building have been included at the current rental value (£17m per annum) to the end of the lease term in February 2031. The lease is subject to a rent review every fifth year, the 2016 review was settled during the year and resulted in a £0.01m increase in rental commitments per year.
During the year ended 31 December 2018, the Society entered into two new lease agreements for:
— Lloyd’s Insurance Company S.A. in Brussels. The lease expires in January 2027.
— India Branch in Mumbai. The lease expires in October 2021.
During the year ended 31 December 2018, £26m (2017: £29m) was recognised as an expense in the Group income statement in respect of operating leases.
(c) Operating lease commitments – Lloyd’s as lessor
2018£m
2017£m
Non-cancellable operating lease rentals are receivable as follows:
Within one year 13 8
After one year but not more than five years 7 11
More than five years – –
There are no leases for the Lloyd’s 1986 building that extend beyond the Lloyd’s break option for the building in March 2021.
Subsidiary undertakings are party to a number of small operating leases for property sub-rental. The lease rentals receivable have been included at current rental value to the first break in the lease.
During the year ended 31 December 2018, £13m (2017: £15m) was recognised as income in the Group income statement in respect of operating leases.

180 Lloyd’s Annual Report 2018
27. Disclosure of related party transactionsThe Group Financial Statements include the financial statements of the Society and all its subsidiary undertakings, the Lloyd’s Central Fund and the Group’s interests in its associates and joint ventures as listed in note 10.
Services provided to Ins-sure Holdings Limited Group in the year ended 31 December 2018 included operating systems support and development, and other administrative services.
Services provided to Xchanging Claims Services Limited Group in the year ended 31 December 2018 included primarily administrative services.
Structured Data Capture Limited has been set up as part of the London Market Target Operating Model project to improve the efficiency of market reform contract processing and to implement standardisation of data capture across the market.
Services provided to The Message Exchange Limited in the year ended 31 December 2018 included the provision of messaging infrastructure.
London Market Operations & Strategic Sourcing Limited, a company limited by guarantee in which the Society holds a one third interest alongside the Lloyd’s Market Association and the International Underwriting Association, was incorporated on 7 March 2018. The Company has been set up to source and manage the market services used across the London Market including, but not limited to, those delivered out of the London Market Target Operating Model project.
The following table provides the total value of transactions entered into with Society related parties for the relevant financial years together with information regarding the outstanding balances at 31 December 2018 and 2017.
Sales torelated parties
Purchases fromrelated parties
Amounts owed byrelated parties
Amounts owed torelated parties
2018£m
2017£m
2018£m
2017£m
2018£m
2017£m
2018£m
2017£m
Associates:
Ins-sure Holdings Limited – – 2 2 – – 1 –
Xchanging Claims Services Limited – – – – – – – –
Joint ventures:
Structured Data Capture Limited – – 2 – – – – –
The Message Exchange Limited – – 2 1 – – – –
London Market Operations & Strategic Sourcing Limited – – 3 – – – – –
Transactions with associates and joint arrangements are priced on an arm’s length basis.
In the normal course of business, the Society may enter into transactions with Lloyd’s market businesses in which members of Council and the Board may have an interest.
Notes to the Financial Statements continued(For the year ended 31 December 2018)

Lloyd’s Annual Report 2018 181
Market ResultsStrategic Report Society Report Other Information
Five Year Summary (For the year ended 31 December 2018)
2018£m
2017£m
2016£m
2015£m
2014£m
Corporation operating income 352 351 332 239 220
Central Fund income 149 125 120 111 115
Gross written premiums 176 253 238 104 53
Outward reinsurance premiums (176) (253) (238) (104) (53)
Total income 501 476 452 350 335
Central Fund claims and provisions incurred – – (8) – (1)
Central Fund repayment to members – – – – (49)
Gross insurance claims and insurance expenses incurred (189) (212) (200) (69) (13)
Insurance claims and expenses recoverable from reinsurers 189 212 200 69 14
Other Group operating expenses
Employment (including pension costs) (164) (138) (147) (126) (108)
Premises (55) (52) (50) (40) (42)
Legal and professional (51) (37) (34) (27) (21)
Systems and communications (43) (33) (36) (26) (24)
Other (49) (46) (40) (40) (32)
Total other Group operating expenses (362) (306) (307) (259) (227)
Surplus before finance, associates and tax 139 170 137 91 59
Finance costs
Deficit on subordinated debt repurchase – – – – (9)
Interest payable on financial liabilities and other (39) (55) (54) (54) (49)
Finance income 62 314 43 93
Surplus on subordinated debt repurchase – – – – 7
Other 93 – – – –
Share of profits of associates 9 10 8 7 8
Surplus before tax 202 187 405 87 109
Tax charge (39) (31) (75) (13) (18)
Surplus for the year 163 156 330 74 91

182 Lloyd’s Annual Report 2018

Other InformationLloyd’s is the world’s specialist insurance and reinsurance market. Through the collective intelligence and strength of expert underwriters and brokers who share risk over more than 200 territories, Lloyd’s helps to create a braver world.
Market ResultsStrategic Report Society Report Other Information
Lloyd’s Annual Report 2018 183

Alternative Performance Measures (APMs)
The following metrics, which are consistently used to analyse financial performance in the Lloyd’s Market Results and/or in the Society Report, are considered to be Alternative Performance Measures (APMs) as defined in the European Securities and Markets Authority Guidelines (ESMA Guidelines) on Alternative Performance Measures.
Metric
Applicable part of the Annual Report Definition Reason for use
Combined ratio
Market Results Combined ratio is a measure of the profitability of an insurer’s underwriting activity. It is the ratio of net operating expenses plus claims incurred net of reinsurance to earned premiums net of reinsurance.
Combined ratio is used to measure the profitability of the underwriting activity across the Lloyd’s market. It also serves as a comparator of Lloyd’s market underwriting profitability to its peers.
Underwriting result
Market Results Underwriting result is a measure of the profitability of an insurer’s underwriting activity. It is earned premiums net of reinsurance less net operating expenses and claims incurred net of reinsurance.
Underwriting result is used to measure the profitability of the underwriting activity across the Lloyd’s market.
Accident year ratio
Market Results Accident year ratio is a measure of the profitability of the underwriting activity attributable to the current financial year. It is the ratio of net operating expenses plus claims incurred net of reinsurance and prior year releases to earned premium net of reinsurance.
Accident year ratio is used to measure the profitability of the underwriting activity of the Lloyd’s market attributable to the current financial year.
Return on capital
Market Results Return on capital is a measure of overall profitability. It is the ratio of result for the year before tax to the average of opening and closing total capital and reserves.
Return on capital ratio is used to measure the overall profitability and value creating potential of the Lloyd’s market.
Investment return
Market Results and Society Report
Investment return is a measure of performance of an insurer’s investing activity. It is the ratio of total investment return to the average of opening and closing financial investments and cash at bank and in hand.
Investment return ratio is used to measure the performance of the portfolio of investments and cash balances held across the Lloyd’s market.
Budgeted operating expenses
Society Report Operating expenses are budgeted on an annual basis as part of a Corporation-wide exercise. These are calculated on an IFRS basis using a bottom up approach, consolidating figures across the different countries and departments within the Corporation.
The annual budget is a key part of the financial control process within the Corporation and provides an estimate of expected future cost levels.
Free cash balances
Society Report Free cash represents the amounts, both at bank and on deposit, held in the UK and overseas, excluding any balances held in respect of insurance and arbitration activities.
Provides a measure of the cash resources available to the Corporation to meet operating expenses.
Operating surplus Society Report The operating surplus is calculated as income from members (including subscriptions, Central Fund contributions and the overseas levy), less any operating expenses. It excludes investment returns and related costs.
The operating surplus provides an indication of how the Society’s income covers its cost base. This also provides a comparison of whether Central Fund contributions cover the cost of claims arising on the fund.
184 Lloyd’s Annual Report 2018

Set out below is a guide to insurance and Lloyd’s-related terms. These are not precise definitions but are included to provide assistance to readers as to the general meaning of terms commonly used in the Lloyd’s market. Formal definitions are set out in the Definitions Byelaw.
Accident year ratio A measure of the profitability of the underwriting activity attributable to the current financial year. The accident year ratio is calculated as net operating expenses and net incurred losses (paid and reserves) for claims occurring in the year as a proportion of net premiums earned during the year. It excludes movements during the calendar year on claims, expenses and premium estimates for previous years.
Active underwriter A person employed by a managing agent with principal authority to accept insurance and reinsurance risks on behalf of the members of a syndicate.
Binding authority An agreement between a Lloyd’s managing agent and a coverholder under which the Lloyd’s managing agent delegates its authority to enter into a contract or contracts of insurance to be underwritten by the members of a syndicate.
Budgeted operating expenses Operating expenses are budgeted on an annual basis as part of a Corporation-wide exercise. These are calculated on an IFRS basis using a bottom up approach, consolidating figures across the different countries and departments within the Corporation.
Callable layer Central Fund assets may be supplemented by a ‘callable layer’ of up to 3% of members’ overall premium limits in any one calendar year. These funds would be drawn from premium trust funds.
Central assets The net assets of the Society including the Central Fund, but excluding the subordinated debt liability and the callable layer.
Central Fund The fund financed by (among other things) contributions from Lloyd’s members and administered by the Council primarily as a fund for the protection of policyholders, and includes both the ‘Old’ Central Fund and the New Central Fund.
Central SCR The Lloyd’s Central Solvency Capital Ratio is calculated to cover all of the risks facing the Society and the Central Fund at a 99.5% confidence level over a one year time horizon.
Combined ratio A measure of an insurer’s underwriting profitability based on the ratio of net incurred claims plus net operating expenses to net earned premiums. A combined ratio of 100% is break even (before taking into account investment returns). A ratio less than 100% is an underwriting profit.
Corporate member A company incorporated with limited liability, a Scottish limited partnership or a limited liability partnership, admitted to membership of the Society.
Corporation The Corporation of Lloyd’s provides the licences and other facilities that enable business to be underwritten on a worldwide basis by managing agents acting on behalf of members.
Council The Council, created by Lloyd’s Act 1982, the Council has the management and superintendence of the affairs of the Society and the power to regulate and direct the business of insurance at Lloyd’s.
Coverholder A firm either in the UK or overseas that is authorised by a managing agent under the terms of a binding authority to enter into contracts of insurance to be underwritten by members of a syndicate managed by the managing agent. A Lloyd’s broker may act as a coverholder.
Economic Capital Assessment The level of capital required to meet Lloyd’s financial strength, license and rating objectives.
Financial Conduct Authority (FCA) The FCA supervises the conduct of the UK financial services industry. Lloyd’s, managing agents, members’ agents and Lloyd’s brokers are regulated by the FCA.
Board The Board established by the Council with responsibility for creating and maintaining a commercial environment at Lloyd’s in which the long-term return to all capital providers is maximised. This includes setting the Risk Management Framework and profitability targets for the market.
Free cash balances Free cash represents the amounts, both at bank and on deposit, held in the UK and overseas, excluding any balances held in respect of insurance and arbitration activities.
Funds at Lloyd’s (FAL) Capital lodged and held in trust at Lloyd’s as security for the policyholders and to support a member’s overall underwriting business.
Integrated Lloyd’s Vehicle (ILV) An arrangement in which a syndicate’s capital is wholly provided by corporate members that are under the same ownership and control as the syndicate’s managing agent.
Investment return Investment return is a measure of performance of an insurer’s investing activity. It is the ratio of total investment return to the average financial investments and cash at bank and in hand.
Managing agent An underwriting agent responsible for managing a syndicate, or multiple syndicates.
Market wide SCR The Market Wide Solvency Capital Ratio is calculated to cover all of the risks arising on the syndicate activity, members’ capital provided at Lloyd’s and the Society taken together at a 99.5% confidence level over a one year time horizon.
Member (of the Society) A person admitted to the membership of the Society.
Members’ agent An underwriting agent appointed by a member to provide services and perform duties including advising the member on which syndicates he should participate.
Name A member of the Society who is an individual and who trades on an unlimited basis.
Glossary of Terms and Useful Links
Lloyd’s Annual Report 2018 185
Market ResultsStrategic Report Society Report Other Information

New Central Fund The New Central Fund constituted by and governed by the New Central Fund Byelaw (No. 23 of 1996).
Non-technical account Under UK GAAP the profit and loss account must be divided between the technical account and the non-technical account. Reported in the latter is all investment return, although an element will be reanalysed to the technical account, and any income and expenses that do not arise directly from the entity’s underwriting activity.
Operating surplus The operating surplus is calculated as income from members (including subscriptions, central fund contributions and the overseas levy), less any operating expenses. It excludes investment returns and related costs.
Premiums trust funds (PTF) The premiums and other monies that members receive in respect of their underwriting at Lloyd’s are held by their managing agents in trust for them subject to the discharge of their underwriting liabilities.
The premiums trust funds comprise a sterling fund, Lloyd’s American Trust Fund, Lloyd’s Dollar Trust Funds, Lloyd’s Canadian Trust Fund and the Lloyd’s Asia trust funds (which cover general business written through coverholders in Singapore). These premiums trust funds are available to fund overseas regulatory deposits, claims, return premiums, underwriting expenses and any profit that is payable to the member after providing for all future liabilities.
Prior years’ reserve movements This is calculated as movements in reserves established for claims that occurred in previous accident years.
Prudential Regulation Authority (PRA) The PRA is responsible for the prudential regulation and supervision of banks, building societies, credit unions, insurers and major investment firms. Lloyd’s and managing agents are regulated by the PRA.
Realistic Disaster Scenarios (RDS) A series of scenarios, both natural and man-made, which are used to assess the market’s risk profile to a variety of different catastrophes to enable better risk management practices within Lloyd’s.
Reinsurance to close (RITC) A reinsurance agreement under which members of a syndicate for a year of account to be closed are reinsured by members who comprise that or another syndicate for a later year of account against all liabilities arising out of insurance business written by the reinsured syndicate.
Reinsurance to close (RITC) syndicate A syndicate set up solely to underwrite the Reinsurance to Close of other syndicates.
Return on capital Return on capital is a measure of overall profitability. It is the ratio of result for the year before tax to the average of opening and closing total capital and reserves.
Service company A wholly owned subsidiary of either a managing agent or of a managing agent’s holding company and which is authorised to enter into contracts of insurance for members of its associated syndicate and/or associated insurance companies.
Solvency ratio The measure of an insurer’s solvency based on the ratio by which the net assets for solvency purposes exceed the solvency requirement.
Special Purpose Arrangement (SPA) A syndicate set up solely to underwrite a quota share reinsurance of another syndicate’s business for a year of account.
Spread syndicate A syndicate whose capital is provided by a number of different members, including those that have separate ownership and control, to the syndicate’s managing agent.
Spread vehicle A corporate member underwriting on a number of different syndicates.
Syndicate A member, or group of members, underwriting insurance business at Lloyd’s through the agency of a managing agent.
Syndicate allocated capacity In relation to a syndicate the aggregate of the member’s syndicated premium limits of all the members for the time being of the syndicate.
Technical account Under UK GAAP the profit and loss account must be divided between the technical account and the non-technical account. The technical account reports the results of the underwriting activity, premiums less claims, less expenses and also includes an element of the investment return reanalysed from the non-technical account.
Traditional syndicate A syndicate whose members underwrite insurance business at Lloyd’s for the current year of account and which is neither an SPA syndicate nor an RITC syndicate.
Underwriting result Underwriting result is a measure of the profitability of an insurer’s underwriting activity. It is earned premiums net of reinsurance less net operating expenses and claims incurred net of reinsurance.
Year of account The year to which a risk is allocated and to which all premiums and claims in respect of that risk are attributed. The year of account of a risk is usually determined by the calendar year in which the risk incepts. A year of account is normally closed by reinsurance to close at the end of 36 months.
Glossary of Terms and Useful Links continued
Useful LinksTo find out more information on Lloyd’s, visit:
— What is Lloyd’s lloyds.com/whatislloyds
— Lloyd’s market structure lloyds.com/thelloydsmarket
— Lloyd’s Corporation lloyds.com/corporation
— Lloyd’s capital structure lloyds.com/capitalstructure and chain of security
— Lloyd’s market governance lloyds.com/governance
— Full glossary of terms lloyds.com/glossary
186 Lloyd’s Annual Report 2018

Designed and produced by MerchantCantos www.merchantcantos.com Printed by Park Communications on FSC® certified paper.
Park is an EMAS certified company and its Environmental Management System is certified to ISO 14001.
100% of the inks used are vegetable oil based, 95% of press chemicals are recycled for further use and, on average 99% of any waste associated with this production will be recycled.
This document is printed on Galerie Art Matt, a paper containing material sourced from well-managed, responsible, FSC® certified forests and other controlled sources.

lloyds.com/annualreport2018