annual report 2020 - dll group
TRANSCRIPT

Annual Report 2020
}

Contents ContentsConsolidated financial statements Consolidated financial statementsCompany financial statements Company financial statementsManagement Report Management ReportSupervisory Report Supervisory Report
Accelerating our digital transformation: Daniela Weitmann, Head of Digital Transformation, on how DLL responded to our partners’ new digital momentum in the pandemic, and the need to transform the digital core to build the future.
ContentsManagement Report
Other information
Financial Statements
2 Chairman’s foreword
6 Who we are
14 What we do
19 Our value proposition
25 Partnering for a better world in the face of a pandemic
33 Financial performance & strategic outlook
36 Sustainability
44 Risk management and compliance
64 Remuneration
67 Corporate governance
73 Executive Board responsibility statement
77 Report of the Supervisory Board
154 Independent auditor’s report
172 Articles of association regulation concerning profit appropriation
82 Consolidated financial statements
136 Company financial statements
Supervisory Report
Management Report
In the interviews scattered through this report, DLL members talk about the impact of the COVID-19 pandemic on the five primary focus areas of the DLL strategy.
Due to the encouragement to work from home during the pandemic, all pictures in the Annual Report (except from the cover) are taken by family.
Maximizing our customer value: John Sparta, head of GBU Healthcare & Clean Technology, on how partnership proved its value in the pandemic and how DLL delivered meaningful solutions to partners and customers in the healthcare sector.
Becoming a global employer of choice: Eliza Ciarelli, HR Business Partner, and Simone Lisboa, HR Officer for Latin America, in Brazil, on how attention to people, culture and trust make DLL Brazil a Great Place To Work®, even when its workplaces are closed.
Driving innovation of products and services: Rob van der Zanden, Head of Group Analytics, and Nicoleta Onuta, Team Lead Artificial Intelligence (AI), on why commitment to innovation is crucial in a crisis and how DLL strengthened delivery models by accelerating AI and robotics innovation.
Ensuring a strong foundation: Ronald Majoor, Head of IT Governance and Infrastructure and Laura Whitt-Winyard, Head of Group Information Security, on how DLL’s reliable and secure IT infrastructure supported remote working – anytime, anyplace, anywhere.
22
60
74
4030
| }

Contents ContentsConsolidated financial statements Consolidated financial statementsCompany financial statements Company financial statementsManagement Report Management ReportSupervisory Report Supervisory Report
32
A year of learning
It was far from a perfect year, and like many other businesses, DLL encountered several challenges. At the same time, it is important to realize that the pandemic also delivered some very valuable lessons, perhaps none more important than helping to accelerate changes that were already underway in society and business and opening our eyes to new possibilities. Within DLL, we learned just how agile we could be in adapting to changing conditions.
In March 2020, almost our entire global team pivoted to working from home and demonstrated the ability to operate our business on a 100 percent remote basis in more than 30 countries. Completing this within a matter of weeks was no small feat, but it was aided greatly by the resilience and flexibility of our employees. It was further supported by the members of our IT organization, who had the prescience in 2017 to propose a bold program (fittingly named “Workplace 2020”) that would enable our employees to be mobile, productive and able to deliver value to our customers from any location and at any time.
DLL finished the year with new business volume reaching EUR 25.9 billion, which represented a small decline of 0.7 percent from the prior year, excluding currency movements. Despite this expected softening in demand, we ended the year with a portfolio of EUR 34.9 billion, a growth of 2 percent when adjusted for currency movements. This resilient top-line commercial performance was achieved under challenging market conditions and supported by our broad geographic diversification across more than 30 countries, as well as the spread of our business across multiple industry sectors.
Most importantly, DLL emerged from this harsh and unforgiving year without posting a financial loss. This is a proud tradition for our company; to maintain “black ink” even in times of crisis. Over the years, we have been fortunate enough to manage similar outcomes during prior recessions, and even during the Global Financial Crisis in 2009. In 2020, DLL recorded a net profit of EUR 180 million, which was a drop of 39 percent from the prior year. This result was heavily impacted by growing impairments, the vast majority of which were attributable to the COVID-19 pandemic.
We saw impairments almost double to EUR 409 million, representing 121 basis points of the average portfolio and well above DLL’s long-term (10-year) average of 49 basis points. Despite the significant impact the pandemic had on our risk costs, the underlying performance of DLL’s business model remained both positive and strong. We were able to grow net income to EUR 1,497 million, which represented almost 6 percent growth over the prior year.
Further, we also look at a measure that is labelled “All Except Risk” (AER), which is calculated by taking net income less operating expenses but excluding risk costs, and is used to gauge the overall health and efficiency of our business. In 2020, the AER totaled EUR 651 million. When eliminating an exceptional goodwill impairment, the AER increased by 11 percent compared to 2019, and reflected the strong income performance of our portfolio as well as the disciplined management of expenses.
But I also recognize that many of us were touched directly or indirectly by the pandemic, and I have been personally moved by stories from colleagues, business partners and customers who have mourned the loss of loved ones. I have watched others close to me grapple with dilemmas such as older parents needing care while in isolation, children struggling with home-schooling and young adults missing celebrated rites of passage like proms and graduations.
The “great pause” of 2020 impacted more than just business, as many of us watched friends and relatives put their future plans and dreams on hold, whether starting university, a new career or even a family. My thoughts and prayers remain with everyone who has been impacted by the pandemic.
A year of fortitude
The year was also one in which our business and our workforce displayed amazing adaptability and fortitude as we supported our partners and customers. It was reassuring to see that our portfolio continued to grow, albeit at a slower pace than our ambition, due to reduced customer demand and softer commercial volumes caused by the pandemic. Despite these less-than-optimal market conditions, it was promising to see that our underlying financial performance and the income-generation capabilities of our portfolio remained strong.
How can one reflect on the 2020 business year without making several citations to COVID-19? I wish it were possible to complete this Chairman’s foreword without any mention of the virus, but the unfortunate reality is that it touched every facet of our society and way of life. The result was an unprecedented year that generated many different emotions, outcomes and stories, some very sad, but also many stories that delivered messages full of hope and optimism about the resilience of the human spirit and our capacity to strive and overcome adversity.
A year of gratitude
When I look back on 2020, my first reaction is to give thanks. I remain grateful that both DLL and the majority of our 5,000-plus global workforce were fortunate enough to emerge from this year intact, and, even more importantly, with good health. Those same sentiments extend for our vendor partners and their distribution agents and customers, who had their personal and professional lives buffeted by this storm that we called “COVID-19.”
Chairman’s foreword
Bill StephensonCEO and Chairman of the Executive Board
| }

Contents ContentsConsolidated financial statements Consolidated financial statementsCompany financial statements Company financial statementsManagement Report Management ReportSupervisory Report Supervisory Report
54
For me, it is always personally fulfilling to see how our company and people can make a difference. I encourage to you read more about some of those inspiring stories in other parts of this report, which focus on our strategic theme “Partnering for a Better World” and how we translated that into our business, employee well-being and community involvement activities.
A year of renewed hope
With the start of vaccine distribution in many countries, our focus now shifts to adapting to the “new normal,” whether at home, school or work, and the promise of a return to better times. However, as we look ahead, the leadership team at DLL is not forgetting to also “look back” to learn as much as possible from our many valuable experiences in 2020, so that we can emerge from the pandemic as an even stronger and more agile company.
At DLL, we were fortunate to have a resilient business model that “weathered the storm” and endured much of the punishment this unforgiving pandemic inflicted upon society and the economy. That strength was only surpassed by the energy and engagement of our global workforce, who provided an amazing experience to our partners and customers during some very difficult moments.
In times of crisis, it is people, values and character that come to the forefront, and throughout this past year, I was consistently reminded of that fact by how our employees, partners and customers rose to these challenges. In the face of adversity, I was awed by the unflappable strength and adaptability of the human spirit, and it renewed my faith, both in mankind as well as in our collective path toward a brighter future.
So, as we enter 2021 with these elements in place, I could not be more confident about the future of our world “post-COVID-19” and, of course, the future of DLL as we resume our trajectory of continued growth and success.
Bill StephensonCEO and Chairman of the Executive Board
And our industry peers were equally impressed, with DLL winning the “Digital Innovator” award in November 2020 from Leasing Life, one of the top industry journals in Europe. The award was given to DLL to recognize some of the very tools, portals and technologies we were using to stay connected and support our partners during the pandemic, including the DLL Inspection App. Further, in the United States, we were proud to be named the #1 vendor finance company for the 12th straight year by the Monitor Daily, a leading industry publication considered the independent voice of the North American equipment finance and leasing market.
A year of helping those in need
Throughout the year, I saw some great examples where our financial services programs resulted in equipment being placed into the hands of hospitals and caregivers on the front lines of the pandemic. I was very proud of the efforts put forth by so many of our employees, who despite myriad challenges in their personal and professional lives, still managed to contribute their ideas, money and time to support a variety of charity and volunteering initiatives in their local communities.
In one great example, our Healthcare and IT sector business teams developed a program that allowed DLL to purchase more than 450 gently used iPad Minis from one of our equipment remarketing partners. These tablets were then donated to hospitals and other organizations, like Ronald McDonald House, to help patients stay connected with their loved ones amidst the COVID-19 quarantine restrictions.
DLL launched several initiatives, including a COVID-19 charitable giving program, with our global workforce that generated meaningful financial contributions for several local charities, and a global community involvement campaign that saw our workforce complete more than 1,400 individual acts of charity and volunteerism in many of the countries across our global network. As 2020 came to a close, we also launched a “Clean Out Your Closets” clothing drive, where we asked our employees to donate unused and unwanted clothes to local charities.
to online solutions, and provided our workforce with more than 16,000 additional online training opportunities via LinkedIn Learning. Our global workforce appreciated and used many of these course offerings as they sought to acquire new skills and approaches to contend with the challenges of remote working.
Given this exceptionally challenging year, we anxiously awaited the outcomes of our DLL Global Employee Engagement Survey, which was sent to our entire workforce and had a strong 74 percent response rate. It was personally gratifying to see that our engagement score, which we measure across four dimensions including trust, belonging, enablement and growth opportunities, increased to 85 percent (2019: 81 percent). At the same time, our employee Net Promoter Score (eNPS) improved to +47.5 (2019: +42). These very positive results validated our many efforts, and we remain confident that happier, engaged employees deliver a first-class experience that our customers can truly see and feel.
A year of innovation and recognitionThe pandemic also provided us with a valuable lesson and reminder that “necessity truly is the mother of invention.” One example of this was our new “DLL Inspection App,” which we introduced in 18 countries across our network. During the lifecycle of a financed asset, many events can trigger the need for an on-site asset inspection. By enabling a simple registration and photo upload with a smartphone, the DLL Inspection App was designed to replace intrusive and costly physical inspections, which were made even more difficult, if not impossible, due to COVID-19. By the end of 2020, our partners completed more than 20,000 asset inspections with this innovative tool.
With the right tools in our hands, we learned that we could stay “open for business” and remain connected with our vendor partners and customers, supporting them during their most critical time of need and funding the acquisition of new equipment, technology and software. They saw and felt our support, and that was reflected in our composite Global Partner Net Promoter Score (NPS®)1, which reflects our activities in vendor finance, commercial (inventory) finance and our joint venture with AGCO. Almost 6,000 partners across our global network responded to our surveys, and we saw our NPS score further improve to an exceptionally strong +48 (2019: +47).
At the same time, the extended period of working from home created new challenges for our workforce, and we quickly learned that DLL also needed to increase its focus on supporting new dimensions of well-being and work-life balance. So, we took several steps, such as enabling more flexible work schedules and providing financial assistance for employees to enhance their home office environments. We also launched “Choose Wellbeing,” an internal site and portal that provided resources and programs to educate and support our teams in these efforts.
We learned that personal development doesn’t stop just because people are not at the office. Over the past year, our Human Resources team made a Herculean effort to transition our broad curriculum of “in-person” training programs and master classes
1 Net Promoter, Net Promoter System, Net Promoter Score, NPS and the NPS-related emoticons are registered trademarks of Bain & Company, Inc., Fred Reichheld and Satmetrix Systems, Inc.
| }

Contents ContentsConsolidated financial statements Consolidated financial statementsCompany financial statements Company financial statementsManagement Report Management ReportSupervisory Report Supervisory Report
76
Our visionDLL believes in partnering with its customers to develop innovative and sustainable financial solutions that deliver meaningful value to the world.
We do this by:Agriculture & foodWe contribute to feeding the world by making mechanization and technology more attainable to the agricultural and food processing sectors to enhance productivity.
Construction, transportation & industrialWe connect communities to schools and hospitals by providing equipment to help modernize infrastructure and public services. We also support the manufacturing and industrial sectors, enabling the efficient and timely flow of products from factory to storefront.
TechnologyWe bring people together by delivering technologies that help connect and educate the world, improving communication and enhancing collaboration.
Office equipmentWe enable the real economy by providing businesses the tools they need to communicate and share ideas, increasing their overall productivity.
Clean technologyWe help the environment by enabling the use of alternative energy sources, energy-efficient lighting and waste management solutions that support a more sustainable future.
HealthcareWe improve longevity and well-being by increasing availability and access to medical devices and services that improve medical outcomes and care for the world’s population.
Mission“Partnering for a better world” starts with creating amazing customer experiences that enable businesses to easily access equipment and technology, and then we deliver insights and advice that drive smarter methods of use.
In 2019, encouraged by DLL’s unconditional dedication to align its product and service offering with customer needs and market developments, DLL established a new business unit, “Advanced Solutions,” as an addition to its vendor finance business. This was a logical answer to a demanding market where businesses want the flexibility to pay for their equipment and technology as they use it. Advanced Solutions leads DLL’s innovative approach around usage-based consumption products (sometimes referred to as Pay-Per-Use or “PPU”), and is also focused on developing a customer-direct business model.
With this addition, we have the following defined GBUs within DLL:– Construction, Transportation and Industrial
(CT&I)– Food and Agriculture (F&A)– Healthcare and Clean Technology (HC-CT)– Technology Solutions (TS)– Office Equipment (OE)– AGCO Finance (AGCO)– Commercial Finance (CF)– Advanced Solutions (AS)
Across these GBUs and throughout the company, our team combines customer focus with deep industry knowledge to deliver sustainable solutions for the complete asset life cycle, including the previously noted commercial (inventory) finance, as well as retail finance and used equipment finance. We believe that DLL is one of the few companies capable of providing true “end-to-end” support for a vendor partner, helping them closely manage their installed base of assets, retain customers and identify upgrade and trade-in opportunities.
We partner with equipment manufacturers, dealers and distributors, as well as end-customers on a direct basis, to enable businesses to more easily access equipment, technology and software. DLL also delivers insights and advice to partners and customers that drive smarter and more economical methods of use.
For over 50 years, our customers have benefited from DLL’s expertise in the industries we serve and our commitment to evolving with them in times of both prosperity and adversity.
DLL delivers specialized knowledge and expertise to each of these nine industry verticals through our global business units (GBUs) that set the commercial strategy and handle all aspects of relationship and program management on a global scale. In addition to GBUs that focus on each major industry sector, we also consider our long-standing joint venture with AGCO Corporation (“AGCO Finance”) as a GBU. This designation is based on the overall size and scope of the relationship, which dates back to 1990. AGCO Finance has a portfolio of EUR 9 billion as of the close of 2020 and is active in more than 20 countries.
DLL also manages its commercial (inventory) finance activities as a GBU, given its strategic importance and the integral role it plays in the distribution channels of our various vendor partners.
DLL is a global asset finance company for equipment and technology assets and is operating in more than 30 countries worldwide. In the Netherlands, we have a banking license, which is passported to several other European Union (EU) countries and is under regulatory supervision by the Dutch Central Bank and European Central Bank. Founded in 1969 and headquartered in Eindhoven, the Netherlands, DLL provides specialized asset-based financial solutions in nine distinct industry verticals:– Agriculture– Food– Healthcare– Clean technology– Construction– Transportation– Industrial equipment– Office equipment– Technology
Assets refer to the products supplied by our customers (manufacturers, distributors, dealers and resellers) to their customers (the end-users).
Who we are
| }
Contents ContentsConsolidated financial statements Consolidated financial statementsCompany financial statements Company financial statementsManagement Report Management ReportSupervisory Report Supervisory Report
98
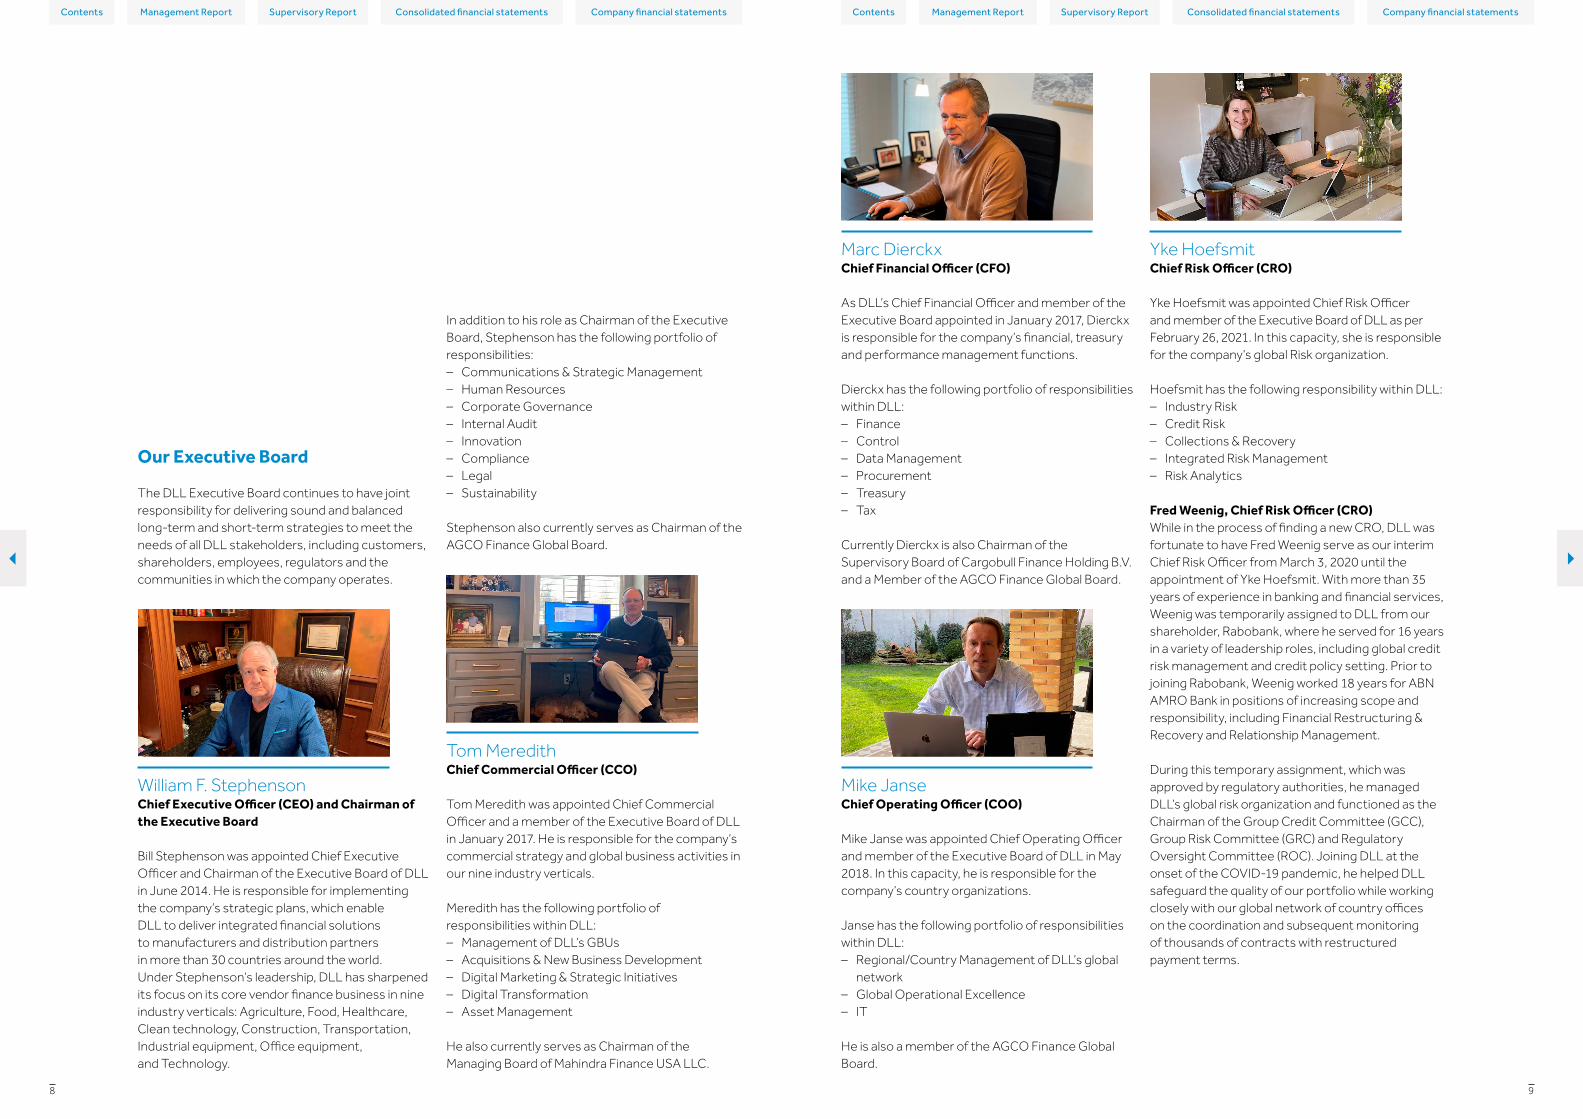
Yke HoefsmitChief Risk Officer (CRO)
Yke Hoefsmit was appointed Chief Risk Officer and member of the Executive Board of DLL as per February 26, 2021. In this capacity, she is responsible for the company’s global Risk organization.
Hoefsmit has the following responsibility within DLL:– Industry Risk– Credit Risk– Collections & Recovery– Integrated Risk Management– Risk Analytics
Fred Weenig, Chief Risk Officer (CRO)While in the process of finding a new CRO, DLL was fortunate to have Fred Weenig serve as our interim Chief Risk Officer from March 3, 2020 until the appointment of Yke Hoefsmit. With more than 35 years of experience in banking and financial services, Weenig was temporarily assigned to DLL from our shareholder, Rabobank, where he served for 16 years in a variety of leadership roles, including global credit risk management and credit policy setting. Prior to joining Rabobank, Weenig worked 18 years for ABN AMRO Bank in positions of increasing scope and responsibility, including Financial Restructuring & Recovery and Relationship Management.
During this temporary assignment, which was approved by regulatory authorities, he managed DLL’s global risk organization and functioned as the Chairman of the Group Credit Committee (GCC), Group Risk Committee (GRC) and Regulatory Oversight Committee (ROC). Joining DLL at the onset of the COVID-19 pandemic, he helped DLL safeguard the quality of our portfolio while working closely with our global network of country offices on the coordination and subsequent monitoring of thousands of contracts with restructured payment terms.
Marc DierckxChief Financial Officer (CFO)
As DLL’s Chief Financial Officer and member of the Executive Board appointed in January 2017, Dierckx is responsible for the company’s financial, treasury and performance management functions.
Dierckx has the following portfolio of responsibilities within DLL:– Finance– Control– Data Management– Procurement– Treasury– Tax
Currently Dierckx is also Chairman of the Supervisory Board of Cargobull Finance Holding B.V. and a Member of the AGCO Finance Global Board.
Mike JanseChief Operating Officer (COO)
Mike Janse was appointed Chief Operating Officer and member of the Executive Board of DLL in May 2018. In this capacity, he is responsible for the company’s country organizations.
Janse has the following portfolio of responsibilities within DLL:– Regional/Country Management of DLL’s global
network– Global Operational Excellence– IT
He is also a member of the AGCO Finance Global Board.
In addition to his role as Chairman of the Executive Board, Stephenson has the following portfolio of responsibilities:– Communications & Strategic Management– Human Resources– Corporate Governance– Internal Audit– Innovation– Compliance– Legal– Sustainability
Stephenson also currently serves as Chairman of the AGCO Finance Global Board.
Tom MeredithChief Commercial Officer (CCO)
Tom Meredith was appointed Chief Commercial Officer and a member of the Executive Board of DLL in January 2017. He is responsible for the company’s commercial strategy and global business activities in our nine industry verticals.
Meredith has the following portfolio of responsibilities within DLL:– Management of DLL’s GBUs– Acquisitions & New Business Development– Digital Marketing & Strategic Initiatives– Digital Transformation– Asset Management
He also currently serves as Chairman of the Managing Board of Mahindra Finance USA LLC.
Our Executive Board
The DLL Executive Board continues to have joint responsibility for delivering sound and balanced long-term and short-term strategies to meet the needs of all DLL stakeholders, including customers, shareholders, employees, regulators and the communities in which the company operates.
William F. StephensonChief Executive Officer (CEO) and Chairman of the Executive Board
Bill Stephenson was appointed Chief Executive Officer and Chairman of the Executive Board of DLL in June 2014. He is responsible for implementing the company’s strategic plans, which enable DLL to deliver integrated financial solutions to manufacturers and distribution partners in more than 30 countries around the world. Under Stephenson’s leadership, DLL has sharpened its focus on its core vendor finance business in nine industry verticals: Agriculture, Food, Healthcare, Clean technology, Construction, Transportation, Industrial equipment, Office equipment, and Technology.
| }

Contents ContentsConsolidated financial statements Consolidated financial statementsCompany financial statements Company financial statementsManagement Report Management ReportSupervisory Report Supervisory Report
1110
Belgium
1987U.K.
1989Italy
1991Spain
1995
Switzerland, Finland, Sweden
1997Austria
2001Denmark
1999Singapore
2003India
2013South Korea
2005
Germany
1988France
1990Ireland
1992Poland
1996Canada
2000Norway
2004
MexicoAustralia
New Zealand
2002
ChinaArgentina
Russia
2006
Brazil & U.S.
1998H ungaryPortugal
2008
ChileTurkey
2012
1969
1972
1982
1985
1980
In January 1985, De Lage Landen Translease was created, specializing in operational leasing of cars.
As a result of the merger between Raiff eisenbank and Boerenleenbank, the new Rabobank was established.
De Lage Landen was founded in the south of the Netherlands.
Development of the Operational Lease emerged as an investment incentive via the Dutch government. The fi rst operational leases were in the form of car leasing.
Service Lease was introduced for commercial vehicles sold in collaboration with Rabobank.
First Operational Lease Contract for Real Estate was fi nalized.
A new logo was launched: De Lage Landen, Partners in Finance. 1997
Freo was launched for online consumer fi nance in the Netherlands. 2007
The new DLL brand was launched. 2014
With the introduction of Leaseloket.nl, online leasing became available in the Netherlands. 2010
A new corporate identity was launched with De Lage Landen blue. 1989 Tokai Financial Services
was acquired by De Lage Landen FS, opening indirect sales channels throughout the U.S.
A joint venture was established with Schmitz Cargobull AG.2000
A joint venture was established with Philips Medical Capital in the U.S. 2002
De Lage Landen acquired Athlon Car lease, an international car leasing company. 2006
The joint venture Agricredit do Brazil was formed. 1998
Plans for acquisition of Agricredit Acceptance Corporation (AAC) became a joint venture between AGCO and De Lage Landen in North America. 1996
Car leasing was introduced in cooperation with Lease Plan Nederland. 1982
Mahindra Finance USA became a joint venture between De Lage Landen and Mahindra & Mahindra Financial Services Ltd., with front offi ces in Houston, Texas, and back offi ces in Des Moines, Iowa. 2011
De Lage Landen celebrated its 10-year anniversary.
New numerical credit-scoring system was implementedresulting in low level of arrears and a sound balance between income and expenditures, good information and selective credit scoring system contributing to eff ective credit assessments.
DLL opened Customer Engagement Hubs in Las Vegas, Nevada, and Jacksonville, Florida
DLL workforce began working from home due to COVID-19 pandemic
DLL opened a Customer Engagement Hub in Dallas, Texas, to bring service closer to its partners.
DLL celebrated its 50th anniversary on May 29
The fi rst E-Docs digital signature transaction was booked.
1990
2008
2018
2020
2017
2019
1979
1995
1999
DLL began Micro Leasing projects in Rwanda and Kenya.
2014De Lage Landen acquired Telia Finance Sweden.
2004
DLL sold mobility entity Athlon to Daimler AG.2016
DLL transferred the Dutch Financial Solutions business line to Rabobank.2017
< Expansions to countries
Historic overview
| }

Contents ContentsConsolidated financial statements Consolidated financial statementsCompany financial statements Company financial statementsManagement Report Management ReportSupervisory Report Supervisory Report
1312
Facts & figures 2020
The Great Place To Work®
-0.7%New business Volume*
* excluding currency impact
+48
+2%Lease and loan portfolio*
Net Promoter Score (NPS® recommendations)
* excluding currency impact
5,29455% 45%
EUR millions
+81 In millions of euros 2020 2019
Financial position and solvency on December 31
Total assets 38,625 40,689
Total equity 4,180 4,182
Non-controlling interest 472 470
Common Equity Tier 1 Capital (CET1) 3,552 3,302
Risk-weighted assets 19,784 20,937
CET1 ratio 18.0% 15.8%
Profit and loss account
Total net income 1,497 1,416
Total operating expenses (776) (766)
Credit losses and other impairments (479) (208)
Profit before tax 242 442
Profit for the year 180 297
Portfolio (in billions of euros)
Total portfolio 34.9 36.2
Employee data
Number of full-time employees (FTEs) average 5,294 5,073
Total net income
+6%Operating our business on an almost
100%
>80,000remote basis (in > 30 countries)
Volunteering in 2020
> 40 nationalities
Initiatives
3,890 actions
51%
Requests to restructure contract payments terms processed
certification to DLL offices in 14 countriesUnique member
participation rate (= 2,602 unique members)
Employees
Key figures
| }

Contents ContentsConsolidated financial statements Consolidated financial statementsCompany financial statements Company financial statementsManagement Report Management ReportSupervisory Report Supervisory Report
1514
By partnering with DLL, our vendor partners, whether manufacturers, dealers, distributors or resellers, can focus on their core business of producing and/or selling and servicing their products and leave the financing programs, including administration, to an expert. They can put all their effort into optimizing their equipment sales and driving customer adoption of related services and further enhancing the relationship that the vendor partner will have with their customer.
Examples of such services are maintenance, parts and supplies, insurance and warranty. We can help our vendor partners by bundling these services in the related financing packages. We can also provide financing for software licenses and other technology solutions. Through this, the end-user customer gets access to a wider variety of value-added services and options, as well as gaining a clearer understanding of the total cost of use for the equipment. Through our multiyear lease and finance agreements, our vendor partners can engage with their customers for longer periods, thereby increasing customer retention.
There is more to vendor finance solutions than simply providing capital and financial terms to customers seeking equipment from our vendor partners. We go beyond the commoditized administrative services of credit underwriting, billing and collection to create long-term, sustainable, mutually beneficial engagement with all the manufacturers, dealers, distributors and resellers that we support. We seek to become an integral part of the vendor partner’s overall business strategy and financial plans. It is not about simply supporting the first sale, but about managing a multiyear relationship and developing a strategy that will help the vendor partner achieve their goals over the long term in an efficient and sustainable way.
As a result, some of our most successful relationships have rich histories, many lasting more than 30 years. These long-term success stories are the best testament to the true value of vendor finance.
without its challenges. Firstly, it requires the manufacturer to make significant investments to build the required infrastructure. Secondly, because it is not typically a core competency of the manufacturer, they must also hire additional resources and subject matter experts. In many cases, they must also leverage their own balance sheet to finance their portfolio of leased equipment assets.
As a result, many manufacturers choose an alternative route of selecting a partner who can provide “captive-like” financial solutions on a third-party basis. This type of business is typically referred to as vendor finance and is at the heart of DLL’s successful business model. The form of cooperation between the vendor partner and DLL can range from formal joint ventures, where a separate legal entity is established to provide finance programs with both the manufacturer and DLL holding an ownership stake, to private-label equipment finance programs offered by DLL using the name of the manufacturer towards end-users.
Another variation is “quasi private-label” or “co-branded” programs that leverage the name and brand of the manufacturer, but also make clear that the finance program is being offered and administered through a third-party company such as DLL.
DLL delivers a strong and unique service to our vendor partners, which enables them to offer highly specialized and smart financing solutions to their customers. This facilitates the sales of the equipment and other ancillary products and services and helps them grow their market share and margins while developing new business models.
Our products become an integral part of the overall sales process and operation of our vendor partners. Such integration requires a true partnership focus that, in many instances, results in DLL being entrusted with not only our vendors’ business and their customers, but also their name and brand. In that respect, DLL offers a variety of private-label programs and co-branded programs that allow our vendors to offer their customers a seamless one-stop shopping experience for equipment, maintenance, parts service and finance, all leveraging the value of their brand.
Vendor finance
Vendor finance provides asset-based financing programs to manufacturers, distributors, dealers and resellers at their respective points of sale. Our vendor partners are constantly working to develop the most competitive and impactful propositions for their customers. To help them achieve their goals, we offer “end-to-end” financial solutions covering the full technical life cycle of their equipment. Our solutions are applicable to both new and pre-owned assets. These can be customized to better conform with and support vendor partners’ sales objectives, processes and distribution channels.
When it comes to developing equipment finance options for their end-user customers, manufacturers have several options. Some large manufacturers decide to establish their own finance capability in-house, so that they can integrate their financial products with their sales delivery. Although there can be benefits to this type of approach (traditionally known as a “captive finance” program), it is not
Vendor finance has been DLL’s core business for more than five decades and the foundation on which the company was built. Vendor finance is a highly specialized business model that delivers significant value to our vendor partners in manufacturing; their distribution agents, whether dealer, distributor or reseller; and of course, their customers, the ultimate end-users of the equipment.
What we do
| }

Contents ContentsConsolidated financial statements Consolidated financial statementsCompany financial statements Company financial statementsManagement Report Management ReportSupervisory Report Supervisory Report
1716
- Independent distribution: dealers act as stand-alone entities offering (in many cases) multiple brands of products and services, requiring financial solutions to support sales to the end-user customers.
Whatever approach our vendor partners choose, DLL can support a variety of different distribution models aimed at making our vendor partners more competitive and effective in their markets.
We are one of the few companies able to provide true end-to-end support for a vendor partner across their entire value chain, starting with our commercial (inventory) finance products that help manufacturers get more units of equipment out of the production factory and into the sales inventory, lots and showrooms of their distribution partners.
Once an asset is available for sale, DLL provides a full array of retail finance solutions that help the vendor partner get the equipment into the hands of their end-user customers as quickly and efficiently as possible. The product support that DLL provides to its vendor partners does not end there. We continue to provide the vendor partner with reports and tools that enhance their visibility and understanding of their entire installed base of leased assets. We also give them consultative support at the right time for upgrades and trade-ins and so on. Upon end of lease, customers will have various options, which include extending, acquiring or returning the asset. When a product does come off-lease and is returned, DLL will work with the vendor to develop refurbishing and remarketing programs, used equipment sales programs or other disposition methods.
It has always been DLL’s company priority to create an amazing experience for its customers and ensure that its product and service offerings continue to be aligned with customer needs and market developments. Today, the market is evolving rapidly. Businesses want the flexibility to pay for their equipment and technology as they use it, rather than owning the assets outright.
Therefore, last year, in addition to the company’s vendor finance business, the Advanced Solutions global business unit was established to lead DLL’s innovative approach around usage-based consumption products (sometimes referred to as Pay-Per-Use or “PPU”), and is also focused on developing a customer-direct business model.
Distribution channels vendor financeWe offer multiple products and services to give our vendor partners the necessary solutions for each segment of their distribution channels and facilitate their sales to their end-user customers. Vendor finance serves the following distribution channels:
- Direct distribution: the manufacturer sells directly through its own sales force to an end-user.
- Indirect distribution: the manufacturer accesses a network of authorized dealers and distributors to sell its products to the end-users.
Value of vendor finance
There are many benefits available to our vendor partners and their end-user customers:
For end-user customers- Capital conservation: by using leasing/
financing solutions, customers can preserve their working capital for more profitable deployment in other parts of their business.
- Little impact to bank/credit lines: by leasing through a third-party program, the customer can normally avoid tying up valuable and sometimes limited bank lines.
- Easy budgeting: leasing and financing programs are typically offered on a fixed-rate basis, delivering predictable periodic payments that a customer can easily budget for and increasing overall visibility toward usage costs.
- Reduced risk of obsolescence: by leasing equipment rather than buying outright, the customer can always guard against the equipment becoming outdated and exercise options to upgrade to the newest technologies.
- Equipment disposal: retiring old equipment can be a costly and difficult process for customers, particularly when environmental rules and other regulations come into play. With many leasing programs, the customer normally has the option to return the equipment at the end of the contract period, leaving proper disposal or recycling in the hands of the vendor partner and/or financing company.
- Little impact on ratios: since some of our products enable off-balance-sheet financing, financial ratios of our end-users are not impacted.
Direct distribution Manufacturer End-user
Independent distribution Dealer / Reseller End-user
Indirect distribution
Standard distribution �ow Second hand refurbishment cycles
Manufacturer End-userManufacturer / Dealer / Distributer
Vendor �nance distribution channels
For the vendor partner- Lead generation: attract and close sales with new prospects
and retain existing customers with targeted promotions, repeat business and special financing offers.
- Increased sales: low-cost monthly or quarterly payment quotations can minimize focus on up-front sales value and encourage customers to also acquire additional options and services.
- Preserved margins: minimize negotiations and price-cutting by focusing on affordable monthly or quarterly payments for end-users, rather than the up-front sales value of the equipment.
- Balance sheet management/capital conservation: by using inventory finance and floor-planning solutions from DLL, manufacturers can place more units into dealer inventory (without carrying the credit risk themselves). Furthermore, dealers can secure products without having to tie up their own critical cash and bank lines.
- Increased overall lifetime value: most maintenance and service plans are sold on an annual basis and require both effort and cost to renew each year. By bundling these plans in a multiyear leasing offer, they can be locked in for the full duration of a lease or finance contract (on average three to five years or longer).
- Customer retention: multiyear lease agreements lock in customers for longer periods. At or near the end of the initial lease term, and with help from DLL, the vendor partner can offer its customers attractive lease upgrade options, raising the potential to sell the next generation of technology to their customer.
- Installed base management: better understand how the equipment is being used and performs and identify the optimal moments for preventive maintenance and when to proactively offer the customer new technology that will raise productivity and/or limit costs.
- Secondary market control: off-lease equipment can be targeted for remanufacturing or refurbishment, so that it can be sold again, extending the life of the product and building new revenue streams.
| }

Contents ContentsConsolidated financial statements Consolidated financial statementsCompany financial statements Company financial statementsManagement Report Management ReportSupervisory Report Supervisory Report
1918
Using this approach, we have developed a powerful business model whereby DLL not only supports the strategic objectives of its vendor partners, but also has the potential to generate income on a single asset at three distinct points in its life cycle: inventory finance, retail finance and used equipment sale or finance. This is a significant contributor to our financial performance and success.
Primary solutions
To service the full distribution channel(s) of our vendor partners, DLL provides solutions that create value and support their growth ambitions. Our solutions include:– Commercial finance: comprises a suite of asset-
based financing solutions that support both manufacturers and their distribution partners. Our commercial finance products enable dealers and resellers to maintain healthy inventory levels without tying up critical cash and bank lines. This, in turn, helps manufacturers place more units into dealer inventory, with the bonus of not having to carry the credit risk on their balance sheets.
– Retail finance: spans a variety of products including loans, financial leases, fair market value leases and pay-per-use agreements. All these products are designed for use at the point of sale, enhancing our partners’ ability to place equipment with their end-user customers. In turn, these products allow end-user customers to easily acquire and use the equipment they need to operate their businesses. The prevalence of one financial product type over another can vary across the industries and geographies within which DLL operates, depending on the established local practices and preferences of the end-user customers. Retail finance represents the majority of DLL’s portfolio.
– Used equipment finance: DLL offers the same financial products for used, refurbished and remanufactured assets as we do for new equipment. By providing financing for equipment that is returned when lease contracts expire, we can support manufacturers and dealers wishing to remarket their used equipment to end-users. This ensures the sustainable reuse of equipment and creates second- and third-life revenue streams.
These financing models enable us to construct unique, highly relevant and added-value propositions for our vendor partners and their end-user customers. They also address the increasing market demands for convenience, flexibility and one-stop-shopping. As such, we expect a positive long-term outlook in the vendor finance market and have confidence in its ability to generate sustainable growth and long-term profitability.
These consultative services help make DLL indispensable to the vendor partner’s long-term success and act as a key differentiating factor that protects our relationships from competitive overtures.
Our unwavering focus on the success of our partners was further validated by the continued positive feedback that we received in our annual Global Partner Loyalty Survey. Our composite Global Net Promoter Score (NPS®)1, which reflects our activities in vendor finance, commercial (inventory) finance and our joint venture with AGCO, was an exceptionally strong +48, a slight increase compared to last year. Further, a clear majority of surveyed partners told us they were “satisfied” or “very satisfied” with the products, services and support they receive from DLL. They also cited our partnership focus and the behavior, knowledge and skills of our people as some of the main reasons they do business with DLL.
Our partnership focus
We only enter partnerships when we know that we can offer sustainable win-win solutions for both our vendor partner and DLL. Overall, success for us is linked to our ability to build long-term relationships with our vendor partners based on shared goals. We support our vendor partners through the complete economic cycle, as well as other issues and events that influence their specific equipment markets.
We seek to become an integral part of our vendor partners’ overall business strategy and financial plans. It is not about simply supporting the first sale, but also about managing a long-term relationship and developing a strategy that will help the vendor partner grow their market share and profitability in an efficient and sustainable way.
As part of our value proposition, we provide a variety of services and programs to support our vendor partners, from prospecting and targeting the right customers to time and territory management for their sales teams, so they can improve their sales effectiveness. We even help them develop tactics for retaining and developing their top performers.
Our value proposition
DLL’s value proposition consists of five distinct competencies: partnership; industry specialization; asset and risk management expertise; global capabilities and footprint; and people and culture. These competencies set DLL apart from our competition and enable us to deliver an amazing customer experience and provide the solutions that our vendor partners need to support and boost their business. We will continue to build our business and strategy on this strong foundation.
1 Net Promoter, Net Promoter System, Net Promoter Score, NPS and the NPS-related emoticons are registered trademarks of Bain & Company, Inc., Fred Reichheld and Satmetrix Systems, Inc.
| }

Contents ContentsConsolidated financial statements Consolidated financial statementsCompany financial statements Company financial statementsManagement Report Management ReportSupervisory Report Supervisory Report
2120
When successfully implemented, this integrated selling approach creates significant value for both the vendor partner and DLL. It truly is win-win. The vendor partner has a team of well-trained, highly effective salespeople who generate more revenue and profits by offering leasing and other financial products.
Our asset and risk management expertiseWith our focus on the business of asset-based financial solutions, we have the knowledge and experience to create new value for our vendor partners and can turn potential risks into healthy, sustainable rewards. We use our asset management expertise and understanding of the assets to make advanced risk decisions, generating a higher level of added value for our vendor partners and their customers.
Our efforts to understand the equipment we finance, to understand the application of the equipment in a normal business or production environment and finally, to understand the secondary markets for that equipment have played a significant role in differentiating DLL from many of our competitors. This also allows us to create a higher level of added value and successfully generate returns out of credit risks, future end-of-lease income, commercial (inventory) finance offerings, asset insurance products and more.
Our credit underwriting capabilities provide a great example of this. We do not rely solely on a basic review of the end-user customer’s balance sheet and income statement. Rather, we have expanded our capabilities to include behavioral underwriting, which involves looking more deeply into elements
Our industry specialization
We are very proud of the in-depth knowledge we have acquired in each of our equipment markets. This knowledge has been built on decades of accumulated experience, and we truly have a keen awareness of the markets in which our vendor partners operate. Only when you truly understand your partners and their markets is it possible to optimize sales and create differentiated solutions. We are a dedicated vendor finance company with a clear focus on a select number of industries: Agriculture, Food, Healthcare, Clean technology, Construction, Transportation, Industrial equipment, Office equipment, and Technology. So, whether our vendor partners are manufacturing and selling milking robots for a dairy farm or MRI scanners for deployment at a diagnostic imaging center, we speak a language they understand.
Over the years, we have sought to develop a high degree of expertise in these markets, acquiring an understanding of the distribution process, the sales process and the equipment itself. In many cases, we have recruited salespeople from the “hardware side” who had successful careers selling the equipment or managing a team of salespeople for a vendor partner. This gives them instant credibility with DLL’s clients and allows them to “talk shop,” framing our financial offerings in the right business context in a way that the vendor partner can easily understand.
that we are steering the business in a responsible and sustainable way. Our vendor partners have consistently told us that they regard this as a strength. It makes them feel they are dealing with “one company,” even though they may be working with DLL in multiple countries.
Although we strive for standardization where possible, we also subscribe to the view of “think global, act local,” not only ensuring that the standard principles of the program are delivered to each country, but also providing ample scope for adjustments to accommodate local market practices and culture.
We have a healthy spread of business activity across several regions, countries and industrial sectors, which provides an additional layer of resilience to our business model. This has played a significant role in how DLL has performed over the past decade.
Our people
Our members continue to be our most important asset and one of the unique elements that set DLL apart from our competition. We have a high-quality and engaged member base, who consistently deliver our value proposition to our customers. This is a message that we consistently hear in our surveys and focus groups that we periodically conduct with our vendor partners and end-user customers.
Our relationship model depends on our people making this connection. DLL members show great passion and commitment to the goal of servicing both our vendor partners and end-user customers. A strong entrepreneurial spirit that allows us to create solutions to help our vendor partners win in changing markets complements this approach. Therefore, we continue to make investments towards the personal and professional development of our members, so that DLL continues to be viewed as an employer of choice in the many countries in which we operate.
We also continue to facilitate member engagement by recognizing our members in a variety of ways, including global reward programs. Our “Winners Circle” program recognizes our top commercial performers globally, while our “Customer Champions” program recognizes DLL members who deliver superior service to both our internal and external customers.
such as asset utilization and essential use to truly understand whether a piece of equipment is mission critical to keeping an end-user customer and their business afloat. We believe this layered and nuanced approach has allowed us to sometimes delve more deeply into the market and support our vendor partners (and their customers) when other sources would not provide capital.
Thanks to our digital transformation, we are achieving high automatic decision rates and faster credit decisions, which are primary selling points in many of our key markets. By combining advanced monitoring tools and predictive risk models with the strong experience and knowledge of our Risk team, DLL has been able to continue improving the experience for our vendor partners and their end-user customers.
Our global capabilities and footprintDLL has been recognized by our vendors as a global vendor finance company with capabilities of delivering a consistent service and experience in over 30 countries across the globe. By combining our global footprint with experienced local teams, we provide a consistent service across the globe.
We support our core vendor partners in both their mature markets as well as their emerging growth markets. Our ability to deliver global solutions has helped us successfully establish new partnerships with leading manufacturers, expand our business into new markets and shield our existing partnerships from competitive overtures. Going forward, we continue to evaluate the mid-term needs of our vendor partners as a significant factor when considering expansion into new markets.
Our Global Account Management approach provides our vendor partners with a single point of contact that helps manage their portfolio and global business activity. We follow this up with regular business reviews and strategic planning sessions to ensure
| }

Contents ContentsConsolidated financial statements Consolidated financial statementsCompany financial statements Company financial statementsManagement Report Management ReportSupervisory Report Supervisory Report
2322
A global health crisis that unfolded in weeks injected a sense of urgency for governments and businesses across the world. Although the pandemic had significant adverse effects on many people’s personal and professional lives, DLL’s partners in the healthcare sector were actually confronted with a surge in demand for their products and services. In turn, they looked to DLL to help them close business quickly and efficiently to meet the unprecedented demand for medical equipment. “In normal times, DLL can receive a credit application for a quote in the morning, approve that deal in under 15 minutes, document that deal, and fund it by the end of the day,” says John. When the COVID-19 crisis struck, we responded by further scaling both our capabilities and controls to support our partners.”
How partnership proved its value in the pandemic
Fortunately, over the last several years, DLL has been implementing enabling technologies like videoconferencing, e-docs, e-signature and remote portals, so customers could more easily conduct business with DLL on a remote basis. “When the pandemic hit, I was very proud of our efforts to quickly pivot and adapt to the changing needs of our partners during this critical time,” says John.
A change in the business mix
Inevitably some companies came through the crisis in better shape than others. While demand for ventilators, ICU beds, ambulances and stretchers surged, dental and other medical practices suffered as patients delayed elective treatments. When owners of public gyms were forced to close their doors, equipment manufacturers saw orders rise for home-use equipment.
“The pandemic has recentered the importance of health and wellness everywhere in the world. DLL is proud of our enabling role in this sector and ability to deliver meaningful solutions to our partners and customers.”
John Sparta
Maximize ourcustomer value
The impacts of the pandemic hit DLL’s partners in the healthcare sector in different ways. For John Sparta, head of the global business unit (GBU) Healthcare & Clean Technology (HC&CT), industry specialization and partnership are the keys to managing a changing business mix while creating customer value.
Interview
| }

Contents ContentsConsolidated financial statements Consolidated financial statementsCompany financial statements Company financial statementsManagement Report Management ReportSupervisory Report Supervisory Report
2524
Having specialized knowledge about specific customer segments was vital when it came to contemplating the restructuring of payment terms. “Dentists, for instance, are unlikely to close their practices indefinitely or consider a material change in career,” says John. “We have a lot of confidence in our underwriting and historical performance in the dental sector. So if a practice closes for a few months, we have the confidence to approve the deferral of payments and rewrite that contract. Commercially, it’s all about truly listening to your customers and understanding their challenges. Once you have that understanding, you can design solutions that meet the needs of their business but also the requirements of DLL.”
To finance “crisis” solutions for healthcare providers around the world, John’s team worked with long-standing and leading partners and their customer providers to accelerate the acquisition of critical equipment and services, including: specialty hospital beds, mobile and fixed diagnostic imaging, laboratory testing, patient transport such as stretchers, and over 100 extra ambulances in the U.K. Together with joint venture Philips Medical Capital, DLL also supported Philips Respironics to provide increased credit and financing capacity to meet the large rise in customer demand for ventilators.
Creating deeper relationships with partnersJohn believes that DLL’s specialized industry knowledge and the trusted partnerships built over many years were key during this period. “We constantly stayed tuned in to our partners’ needs and supported them during continually shifting circumstances. As always, working together to determine the true needs and requirements of the end customer is where we provide added value.”
Take for instance the request from a partner to put together a six-month rental program for specialty beds and stretchers. “The hospitals needed the products for a specific period, not for permanent use. This can only work effectively with strong partnership so that they can help us remarket and resell the equipment when it comes back. It takes that level of collaboration and trust to provide an attractive rental product to the end-users.”
The NPS®1 score for the GBU HC&CT in October 2020 (in the midst of the pandemic) was +61, a significant improvement over the GBU’s +48 result in 2019. This NPS score also significantly outperformed the DLL global average of +48. “I think that’s a real testament to the appreciation our partners have for how we responded and supported both them and their customers during this critical period,” says John.
“Lending money and supporting customers in a pandemic is hard,” concludes John. “What do you base your decisions on? 2019 results? Interim reports? It’s extremely challenging. You really have to lean on your industry knowledge and customer relationships.”
1 Net Promoter, Net Promoter System, Net Promoter Score, NPS and the NPS-related emoticons are registered trademarks of Bain & Company, Inc., Fred Reichheld and Satmetrix Systems, Inc.
The DLL strategy outlines our strategic priorities and ambitions and has four primary focus areas that are built on a strong foundation. This foundation includes:– DLL’s core competencies:
• Partnership• Industry specialization• Global footprint• Asset and risk knowledge• People
– Foundational elements:• Financial stability• Reliable IT infrastructure• Solid internal controls• Regulatory compliance
The four primary focus areas that represent our key strategic objectives and priorities are:− Maximizing our customer value− Becoming a global employer of choice− Accelerating our digital transformation− Driving innovation of products and services
Our accomplishments in 2020 supported the key objectives and priorities in the Partnering for a better world strategy.
Partnering for a better world in the face of a pandemic
With the COVID-19 pandemic, our strategy theme “Partnering for a better world” took on a new and significant meaning. While we contended with a period of uncertainty, DLL continued to stand by its partnership promise and worked closely with our partners and customers to determine the best path forward during these challenging times. Our DLL strategy, which was introduced first in 2019, remained strong in 2020.
Ensure ourstrong foundation
by optimizingcore competencies,
�nancial stability,reliable IT, solid
controls andcompliance
Drive innovation of
products & services
Accelerate our digitaltransformation
Become a globalemployer of
choice
Maximize ourcustomer value
| }

Contents ContentsConsolidated financial statements Consolidated financial statementsCompany financial statements Company financial statementsManagement Report Management ReportSupervisory Report Supervisory Report
2726
Ensure ourstrong foundation
by optimizingcore competencies,
�nancial stability,reliable IT, solid
controls andcompliance
A strong foundation
Highlights 2020To achieve our strategic ambitions, DLL needs to safeguard its strong foundation while continuing to make investments to enhance the speed, quality and productivity of our business operations. To that point, many projects are focused on maintaining and enhancing our IT infrastructure so that our members have access to the best tools and services, whether working in an office or from a remote location. A very important factor during the first weeks of the pandemic was that we remained open for business. Thanks to the digital transformation DLL had gone through over the past few years, we were able to operate our business on an almost 100 percent remote basis in more than 30 countries.
Within our global footprint, we encountered the first COVID-19 challenges in Asia in January 2020, followed by Europe and then the Americas. Before COVID-19 reached the pandemic levels of the early part of March 2020, Business Continuity Plans were refined and proactively implemented locally to minimize risk to our members and help maintain service delivery to customers and partners. DLL had a Coronavirus Crisis Management Team in place with a global representation from our Executive Board, Human Resources, IT, Facilities, Communications and Risk (Business Continuity Management) departments. This team continuously monitored the situation and developments across our global network and provided additional updates, as necessary.
With regard to solid internal controls and regulatory compliance, a lot of effort was put into updating and implementing our risk control framework. In order to comply with new laws and regulations regarding credit risk for the financial industry, the CreditCore program was established, aiming to further enhance our credit risk framework, our core process in which loans are classified, managed, reported and handled.
In view of the rapidly changing economic environment and the increasing likelihood of a global recession, we also needed to make changes to our Credit Policy to ensure that we protected the quality of the DLL portfolio during the ongoing turbulence around the COVID-19 pandemic.
Our compliance function continued with the special CARE program designed to enhance our compliance efforts on Anti-Money Laundering (AML) regulations and the deployment of our “ROCK” system (Risk based On Customer Knowledge).
Maximize ourcustomer value
Maximize our customer value
Highlights 2020To retain and grow our customer base and provide incremental value to our partners and their end-user customers, we continued to optimize our customer experience and look for ways to increase the speed and ease of doing business with DLL.
The economic hardship brought on by the pandemic limited the ability of some customers to service their debt. To assist our customers, DLL processed more than 80,000 requests to restructure contract payments terms and provide customers with flexibility while they contended with softer business demand and reduced cashflow. Flexibility was key as we provided business resilience programs that enabled vendors to offer their customers deferral options with delayed payments.
On top of that, DLL worked closely with its vendor partners to make critical equipment available to hospitals and first responders. In the U.K., we funded ambulances for emergency use, as well as other essential equipment for NHS Trust to address the COVID-19 crisis. Programs were developed to expedite access to medical imaging equipment and ventilators, as well as short-term rental programs for hospital beds and financial solutions to labs working to stop the spread of COVID-19.
Furthermore, electrical vehicles with zero emissions were financed for a food delivery company, facilitating increased home delivery of groceries during lockdown. In the Netherlands, a special leasing program was developed together with a technology vendor partner to provide tablets to hospitals. The devices were used by patients to keep in contact with loved ones who could not visit them due to the quarantine conditions. Additionally, we offered financing solutions for laptops, mobile phones and cloud-computing software to support remote working and virtual classroom capabilities.
Our ambitious strategy requires us to attract new customers to DLL as well as to attain a significant amount of growth from our existing customer base. In 2020, we continued to roll out our new Customer Relationship Management (CRM) system in key markets. Data gleaned from CRM will enable us to enhance sales effectiveness and targeted marketing efforts with our partners, which will ultimately lead to sales growth, increased customer retention and salesforce effectiveness.
Become a globalemployer of
choice
Become a global employer of choice
Highlights 2020To be recognized as a global Great Place To Work®, DLL focuses on building a change-capable organization, where the engagement, development and well-being of our members is paramount.
To protect the health and safety of our employees and customers during the pandemic, we had varying levels of preventive measures in place at our offices around the world. These safety precautions were
designed to govern and limit business travel, office visitations and attendance at large meetings and gatherings, as well as comply with local public health and safety guidelines.
While the financing needs of so many of our customers accelerated and changed during the pandemic, DLL staff had to work from home, and we quickly realized there were new challenges being placed on them regarding work-life balance and well-being. To address these issues, we took steps to enable more flexible work schedules and deployed a special Member Allowance Program, which was designed to alleviate some of the additional costs associated with the extended period of working from home. The financial assistance provided by this program allowed members to address increased expenses for things like high-speed internet and electricity, or to further upgrade and improve their home office environment.
Besides our standard internal communication channels as well as virtual local meetings and leadership webinars, we deployed a weekly Executive Leadership vlog so that all our members globally could be kept updated and informed on the actions the company was taking to respond to the pandemic and maintain business and service levels. Additionally, we deployed more frequent Pulse Surveys with our member community to closely measure changes in morale and engagement. The feedback gathered from these surveys also allowed leadership to better understand how our members were coping with the pandemic and more quickly implement actions to address their needs. Response rates were high, with DLL members giving great input on their experiences and where they felt DLL could help them more.
At DLL, we believe that the well-being of our members not only contributes to their loyalty and engagement, but also results in higher productivity and an enhanced experience for our customers. We know that members who can optimize their work-life balance are going to be happier, healthier and more engaged. That is why a big part of our project to emerge from the COVID-19 pandemic as an even stronger, better and more agile company was focused on our members’ work-life balance and well-being. We started looking into all kinds of future developments with many of our vendor partners on how we can redesign and enhance our workplace of the future, whether at home or at a DLL location. We introduced a new Choose Wellbeing site to support, educate and empower members in embracing their overall well-being with resources and programs focused on 4 focus areas: Health, Connections, Lifestyle and Finances.
| }

Contents ContentsConsolidated financial statements Consolidated financial statementsCompany financial statements Company financial statementsManagement Report Management ReportSupervisory Report Supervisory Report
2928
The ambition to drive diversity and inclusion in our company also remained strong. Awareness was raised on topics like unconscious bias, pay inequality, the power of diverse teams and our commitment to a harassment-free work environment. Member resource groups (MRGs) were established to amplify voices for all of our members to foster a diverse and inclusive workplace.
We also asked our members to give back to the communities where DLL is present. In May 2020, DLL launched the DLL Coronavirus Pandemic Donations Program in which our entire workforce could contribute to a wide variety of charitable organizations in the countries and communities where we operate and play a role in helping families, healthcare workers and other first responders impacted by the pandemic. When members donated to one of these selected COVID-19 charities, DLL matched 100 percent of each donation. Further, a global community involvement campaign saw our members complete more than 1,400 individual acts of charity and volunteerism in many of the countries across our global network.
In 2020, a Member Engagement Score of 85 percent was achieved, significantly exceeding the average score of other high-performing organizations. We were also proud to earn The Great Place To Work® certification, which was awarded to DLL offices in 14 countries. We further developed our Commercial Academy sales training program, widening the offering of online courses and tools to our commercial teams and their partners.
Accelerate our digitaltransformation
Accelerate our digital transformationHighlights 2020It is DLL’s digital ambition to deliver an amazing customer experience for our customers and employees and to enable that experience from any location and at any time. Innovation and technology are an inseparable part of our journey to realize this ambition. We embrace technology and continuously evaluate how it can further improve the customer experience and enhance our business model. That focus is combined with transformative innovation concepts, Agile methodologies and a customer-centric approach to development projects.
This approach is not limited to our new technology development projects. The proactive approach DLL has taken in recent years to enhance its digital infrastructure (global initiative “Workplace 2020”) was thoroughly tested and validated in 2020, as we quickly adapted to the many remote working challenges created by the COVID-19 pandemic. As a result, DLL remained “open for business” across our entire global network, with almost 100 percent of our employees working remotely from home and delivering support to our partners and customers during their most critical time of need.
to empower our employees to help us create a culture of innovation that encourages creative thinking. In 2020, various new innovation ideas were approved for funding. Some ideas are directly applicable to DLL’s business, and many are focused on improving the customer experience. Further, DLL is collaborating with our stakeholders to accelerate our innovation efforts.
As soon as the COVID-19 crisis hit, DLL began to explore how we would react and handle this unprecedented event. Our DLL innovation team launched a campaign to collaboratively find solutions to tackle the 2020 challenges and prepare for the future. Ideas were generated around not only process transformations, but also disruptive and business model changes. The new markets team in our Advanced Solutions global business unit set up a series of virtual workshops along key focus areas, such as digital collaboration, health and well-being, online retail and logistics. We observed that in each of these areas, the crisis offered DLL an opportunity to make a difference with partners and customers alike. The approach was supported by the DLL innovation team, and the sessions also had a positive impact on members’ morale.
Given the impact and the potential of data science and its implications to financial services, DLL continued building on its Artificial Intelligence (AI) Lab. With the Portfolio Management discipline being a primary area of focus, a new AI model was developed to rank early delinquency cases based on the customer risk profile and previous payment patterns and behaviors, which were evolving as market conditions were impacted by the pandemic. This output from these models was invaluable and helped us improve overall collection productivity and reduce Non-Performing Loans and risk costs.
We also made strides in further developing our robotic process automation. Over the past year, DLL deployed several different bots (virtual employees) supporting multiple departments and functions. These bots took over some of the more time-consuming and repetitive tasks that are easily prone to error. As a result, we improved not only efficiency and productivity levels, but also data quality and customer satisfaction.
Our digital transformation has taken an “outside-in” approach, exploring the needs of our customers through comprehensive customer journey workshops. By conducting extensive interviews and “day-in-the life” observation sessions, DLL has been able to secure vital insights into how our customers do business and the enabling role that technology can play in that experience. These activities have spurred the creation of some exciting new technology solutions, such as the “DLL Inspection App” that replaces physical audits and inspections, which have been made even more difficult due to the COVID-19 pandemic. From September 2020 onwards, we have completed nearly 20,000 asset inspections with this innovative tool.
We also have been gathering feedback proactively from our user base on our partner portal and partner app tool to continuously improve, adapt and expand where possible. An online user panel enabled us to improve the user experience for our partners and work on new features based on their needs. By leveraging our application programming interface (API) solutions, we were in many cases able to directly integrate our services into the systems and processes of our vendor partners, allowing them to provide a more seamless experience to their distribution partners and customers, as well as “one-stop shopping” for products, services and financial solutions.
Drive innovation of
products & services
Drive innovation of products and servicesHighlights 2020DLL’s investment strategy has dedicated a portion of funds to be allocated toward ideas outside our existing business boundaries, and we have developed an organizational framework to incubate and protect these new ideas. We want
| }

Contents ContentsConsolidated financial statements Consolidated financial statementsCompany financial statements Company financial statementsManagement Report Management ReportSupervisory Report Supervisory Report
3130
In the Great Place To Work® (GPTW) awards DLL was rated number one financial institution in Brazil. HR Business Partner Eliza Ciarelli and HR Officer for Latin America Simone Lisboa reflect on successes and challenges in an exceptional year.
Eliza became involved with the Great Place To Work® journey when DLL Brazil first sought certification in 2017. “We’ve grown fast through the financial ranking. We came second last year, and now we’re the number one financial institution for the first time. 2020 was also the first year we won the regional Great Place To Work®.”
Make people feel they belong
The GPTW survey went out to DLL members in June, three months after they started working from home due to the pandemic. So, what makes DLL Brazil such a great place to work even when its “workplaces” are closed? Eliza and Simone are unanimous in response: “People and culture.”
“Emotional salary”
“Given that the financial sector is highly controlled in Brazil, work-life balance and flexibility are not part of the industry culture. DLL really stands out in that respect,” says Eliza.
Collective agreements mean that financial industry salaries are fairly standard. Simone adds, “When we compete with companies from other sectors, our benefits put us ahead. But compared to other financial institutions, it’s our ‘emotional salary’ that makes the difference – the non-tangible benefits, the people you work with and the culture.” Stemming from DLL Brazil’s values of trust and collaboration, emotional salary also relates to diversity, well-being and making people feel they belong.
“When we won the GPTW award, the pandemic did not allow us to do a group gathering, so we coordinated a virtual event that allowed every single member of our workforce to celebrate the moment with their colleagues. But equally important, they were able to recognize this moment with their loved ones at home, who played a significant role in enabling and supporting this success,” says Eliza.
This was just one of the many HR initiatives to reinforce the feeling of belonging in the months of isolation. Says Eliza, “Brazilians are sociable people who thrive on interaction. DLL already offered working from home as a benefit before the crisis, but most members preferred to collaborate face-to-face. So, it was quite a culture shock when we sent them home mid-March. Especially for the many members with young children.”
Send everyone home…
As luck would have it, when DLL Brazil was instructed to send everyone home, it was two weeks before completion of the Workforce 2020 project. This would provide all members with equipment for flexible working by the end of March. “We had all these laptops in the pipeline, so we accelerated the deliveries, and IT worked like crazy to get things done,” recalls Simone. It was a case of act fast, learn fast and stay creative. “All I could think was ‘I have to get everybody home.’ But first we needed to get all the basics working – ensure that every single member would have Internet access and be able to afford whatever they needed in terms of furniture and equipment.”
Become a globalemployer of
choice
Eliza Ciarelli
“People and culture make DLL a great place to work.”
Simone Lisboa
“it’s our ‘emotional salary’ that makes the difference.”
Interview
| }

Contents ContentsConsolidated financial statements Consolidated financial statementsCompany financial statements Company financial statementsManagement Report Management ReportSupervisory Report Supervisory Report
3332
…and stay connected
Once everyone was home, the HR team phoned every single leader to support them in the new experience of remotely managing teams for performance, from trusting people to get results, to training in social media, digital and videoconferencing skills, to specific support for priority cases. For instance, more flexibility for (single) parents juggling childcare and work. The fact that leaders also showed their own vulnerabilities in this period helped to further build trust and their connection with their teams.
In turn, the members supported their customers to do business digitally. “Our biggest agricultural equipment fair is in May. When it changed to a virtual format, we developed virtual opportunities and events to connect with customers. Even our most traditional farming customers found creative ways to attend online,” says Eliza.
HR transformed all its normal face-to-face interactions with staff into virtual opportunities. Office well-being activities such as yoga and stretching classes, went digital too. Access to mental health support was boosted. And members themselves found fun ways to stay in touch: from online happy hours and games to group baking sessions and digital dinner parties.
DLL Brazil’s exceptional results in 2020 were yet another cause for celebration. “The year we had the highest Great Place To Work® score is the year we had the best results in our business. Surely these must be connected,” concludes Eliza.
With more than 40 percent of its office locations having earned the prestigious Great Place To Work® award, DLL continues to focus on ways to bring out the best in our workforce, which not only creates superior outcomes for the company, but also enhances well-being for the individual. Competitive physical and mental health benefits also contribute to well-being, as do the strong culture and feeling of community that we seek to create at each location.
Fernando ValderrabanoGeneral Manager Latin America
“We see the authenticity, perseverance and consistency of our employees reflected every day in our customer loyalty and satisfaction metrics, and that translates to long-term, sustainable business value.”
The performance of GBUs was directly linked to COVID-19. Sectors that are less impacted, like the F&A sector, showed strong performance and even growth. Industries that were heavily impacted by lock downs, like transportation, showed a strong drop in new business.
Our portfolio, including leases and loans, decreased by 3.4 percent (2019: increase of 8 percent) to EUR 34.9 billion. That decrease was fully caused by movements in foreign exchange (FX) rates, as excluding currency effects, the portfolio increased by 2 percent. The portfolio movements mirror the developments in new business, as our F&A portfolio realized strong growth, while other business units experienced more headwind from the pandemic.
DLL’s net income is directly linked to the portfolio. The total net income increased by EUR 81 million (6 percent) compared to last year. Net interest income, which makes up the most of our net income, increased by 7 percent, as DLL managed to maintain strong portfolio income, while funding expenses slightly decreased. During 2020 we have not executed any new securitization transactions, which are slightly less (interest) cost efficient. Furthermore, our revised hedging strategy has resulted in a significant decrease in required hedging transactions and therefore lower hedging cost and lower interest expenses. Fair value movements of our derivatives increased by EUR 34 million and mainly include the results of our fair value hedging methodology.
30
25
20
15
10
5
0
Financing new assets
19 1921 22
25 2527 26
2013 2014 2015 2016 2017 2018 2019 2020
40
35
30
25
20
15
10
5
0
Lease and loan portfolio
2013 2014 2015 2016 2017 2018 2019 2020
2426
2831 31
3436 35
Financial performance
DLL’s performance has been severely impacted by COVID-19 and the governmental measures taken to mitigate the impact of the pandemic. The financial impact is visible across most financial indicators. New business volumes decreased compared to last year, portfolio growth was well below the historic trend, impairments were materially higher compared to previous years and our net profit decreased significantly.
Our net profit for 2020 amounted to EUR 180 million (2019: EUR 297 million), a decrease of 39 percent. The Return on Assets (ROA) amounted to 0.5 percent (2019: 0.7 percent).
Despite the pandemic, we still financed EUR 25.9 billion (2019: EUR 26.8 billion) of new assets, including EUR 11.7 billion (2019: EUR 11.6 billion) of short-term commercial finance. Adjusted for currency movements, our financed volumes decreased by 1 percent (2019: increase of 5 percent).
Financial performance & strategic outlook
| }

Contents ContentsConsolidated financial statements Consolidated financial statementsCompany financial statements Company financial statementsManagement Report Management ReportSupervisory Report Supervisory Report
3534
credit impairments amounted to EUR 229 million (2019: EUR 165 million), which reflect the difficult circumstances a growing number of our customers have encountered during 2020.
Our funding policy is such that we have limited risk appetite related to foreign currency, liquidity or interest rate risks, all defined in our Risk Appetite Statement. Interest rate and foreign currency derivatives are used to mitigate these risks. Most of our portfolio is funded by facilities obtained from our shareholder Rabobank. In locations where it is more efficient to obtain funding locally, we engage in funding partnerships with high-profile local banks. Due to the uncertainty and potential adverse effect of COVID-19 on financial markets, we have not issued any new securitization transactions in 2020. Furthermore, we are stimulating circular business for SME companies through funding obtained from the European Investment Bank (EIB). Through this facility from the EIB, our customers can benefit from a favorable interest rate.
During the course of 2020, our equity slightly decreased by EUR 2 million (2019: increase of EUR 251 million). Of our net profit of EUR 180 million (2019: EUR 297 million), EUR 40 million (2019: EUR 40 million) is attributable to the partners in our joint ventures. The remaining EUR 140 million (2019: EUR 257 million) is expected to be added to our retained earnings. We have not paid any dividend during 2020 to our shareholder. Our Common Equity Tier I ratio as of year-end amounts to circa 18.0 percent (2019: 15.8 percent).
As of year-end, we employed 5,420 full-time employees (FTEs) (2019: 5,184 FTEs), including both internal members and contractors.
Our operating costs increased by 1 percent (2019: 6 percent), or EUR 10 million. Our staff costs increased slightly as there was an increase in number of employees to address customers’ needs arising from the pandemic. Lower costs for travel and variable pay had a decreasing effect on staff costs. An impairment of goodwill of EUR 70 million that is related to our subsidiary in the Nordics has been recognized. The deteriorated outlook, the change in portfolio composition, the impact of COVID-19 on new business and impairments as also increasing capital requirements, have resulted in this impairment. After this impairment, there is no more goodwill left on the balance sheet.
Credit impairments increased significantly during the year to EUR 409 million (2019: EUR 208 million). COVID-19 has had a significant impact on our risk costs, as the deteriorated economic outlook has resulted in an increase in our stage 1 and 2 impairments to EUR 190 million (2019: EUR 43 million). This includes a top-level adjustment of EUR 58 million that has been recognized to reflect the impact of governmental measures on defaults and expected credit losses. These measures are expected to have a delayed effect on the defaults of our customers and expected credit losses, which is considered not sufficiently captured in our credit risk modelling. As such a top-level adjustment has been recognized. More information on expected credit losses and this top-level adjustment can be found in the consolidated financial statements. Stage 3
Outlook on 2021
During 2019, the Executive Board approved the new DLL strategy, “Partnering for a better world,” was rolled out through the end of 2019 and into early 2020, prior to the onset of the COVID-19 pandemic. The strategy focuses on four priorities:1. Maximizing customer value;2. Becoming a global employer of choice;3. Accelerating our digital transformation; and4. Driving innovation of products and services
The priorities are supported by a strong foundation, that ensures robust and controlled systems and processes. As a result of the COVID-19 pandemic, and the many new and emerging challenges in our market, we undertook a thorough review of these priorities and concluded that our strategy is still solid.
We continue to execute on the actions initiated in previous years. Our portfolio in China, where we are ceasing operations, continues to run off according to expectations. With a portfolio well below EUR 0.1 billion at year end 2020, we are on track for leaving China in the next couple of years. Due to the turmoil the COVID-19 pandemic has caused on financial markets, but also the uncertainty around the impact of relief programs offered to customers, we have not executed any asset-backed securities (ABS) transactions in 2020. However, we remain committed to our funding strategy and plan to place transactions in the market in 2021.
As we look to 2021, we have an ambitious plan in front of us to resume our trajectory of growth and success. To help us get there, we have identified a core set of 6 priorities and projects:
Targeted Operating ModelIn the U.S. market, we intend to deploy our next generation operating model built around smaller hub locations that span the country and time zones, allowing for more efficient coverage and response to customer needs. Supporting this new model will be
our Route 95 ambition, which has a bold ambition to fully digitize 95 percent of our small ticket business process to a low (or no) touch model that will further enhance response and processing times and make it easier for customers to do business with DLL. We want to realize this Route 95 ambition by 2022.
Optimal Commercial EffectivenessWe want to further expand the deployment of our Customer Relationship Management (CRM) system in our network and ensure our commercial organization is able to take full advantage of new tools to enhance their effectiveness and help grow our business. Supporting this effort will be a commercial training program focused on creating a renewed culture of activity-based management, profitable growth and accountability for results.
Stable Risk ManagementGiven the unprecedented challenges of 2020 we want to emerge from the pandemic with a healthy portfolio that reflects our historical position of 50 basis points risk, all supported by effective monitoring, measurement and controls.
Optimal Financial PerformanceEnsuring that DLL delivers on the financial performance commitments to our parent, Rabobank, in terms of net profit, return on invested capital (ROIC), cost-income ratio or other results. We strive to realize this goal, by further deploying disciplined monitoring and planning tools.
Further Realization of our “New Way of Working” visionWe want to emerge from the COVID-19 pandemic as an even stronger, better and more agile company. To further realize this vision, we are evaluating how we can redesign and enhance our workplace of the future, whether at home or at a DLL location. This means assessing our company culture, wellbeing programs and facilities to ensure they are enabled to support the “new way of working.” DLL made great strides in 2020, but we must maintain our momentum and continue to realize this ambition at more locations in our global network.
Strengthen our FoundationIt is essential that we continue to execute on all compliance programs so that DLL stays smart, efficient, regulatory compliant and in control.
| }

Contents ContentsConsolidated financial statements Consolidated financial statementsCompany financial statements Company financial statementsManagement Report Management ReportSupervisory Report Supervisory Report
3736
part of (annual) reviews of our strategic business relations. Additionally, DLL started analyzing and implementing climate-related rules and regulations that are emerging and constantly evolving in the market we operate in. Furthermore, we are also building a member base with a sustainability mindset by adding sustainability to our introduction and learning and development programs and integrating it in DLL DNA series.
Assuring a sustainable foundation while optimizing our performanceWe ensure a strong foundation by adhering to high ethical and environmental standards in doing business, assuring DLL is administratively carbon-neutral in its own operations and assessing the environmental impact of our endeavors.
Partnering for a better worldIn 2020 we started implementing our renewed sustainability strategy, which includes the transition to energy efficiency and renewable energy sources, as well as the transition to a circular economy by offering usage- and service-based solutions for the full life cycle of assets. At the same time, we are adhering to high ethical and environmental standards in the way we do business. We see that new Environmental, Social and Governance (ESG) and sustainability related regulations are coming into force, which need continuous monitoring, analysis and translation into DLL policies. ESG and sustainability performance assessments are
Sustainability
2020 has been a challenging year for the entire world and the business community due to the COVID-19 pandemic. We have tried to move sustainability forward within the context of this ongoing global pandemic and its economic consequences; the five-year anniversary of the Paris Climate Agreement; as well as a business community that for the first time ever put climate and the environment 3 times in the top 5 business concerns (both in likelihood and impact) at the World Economic Forum. This is a dynamic context, but is also full of opportunities, now that our business partners put increasing focus on purpose (combined with profitability). DLL is well positioned to take responsibility and create meaningful value for our customers.
– Financial stability
– Reliable IT infrastructure
– Solid internal controls
– Regulatory compliance
Core competencies:
Ensure our strong foundation while optimizing our performance
Our partnership
Our industry specialization
Our global footprint
Our asset and risk knowledge
Our people and culture
Environmental, Social and Governance risk and Business PrinciplesThe expectations and insights on how to do business and what is important from a consumer and regulator perspective have evolved over the years and will continue to evolve at an even faster pace. More and more emphasis is placed on being mindful of the impact we have on our environment and our contribution to the challenges the world is facing as also reflected by the United Nations Sustainable Development Goals 2015-2030.
DLL ensures that we run responsible business operations and are able to operate in line with upcoming legislation and regulatory demands. We assure our customers and members that we uphold high standards of ethical behavior in the way we do business. In 2020 we updated our ESG Risk policy, which provides a global framework and principles to identify, manage and monitor ESG risk related to the business relations of DLL. We seek to avoid the direct financing of certain assets and markets where we see a negative impact on society. The policy covers topics such as controversial weapons, human and labor rights and environmental and animal welfare and includes an expansion of ESG Risk assessment to end-users, local vendors and dealers. Human and labor rights are part of DLL’s ESG (Environmental, Social & Governance) Risk policy. In the related ESG Risk assessment these social elements are included to identify concerns. In case of potential issues the RepRisk tool and database helps us to conduct in-depth ESG risk research on companies including an ESG rating. The ESG Risk assessment is applied on DLL’s business relations on a risk-based approach. Additionally, DLL’s Business Principles Committee (BPC) met frequently over the course of last year and is functioning effectively addressing ESG-related topics and advising the Executive Board on DLL’s ethical course as well as promoting ethical behavior in the entire organization.
Reducing our CO2 footprint and being carbon neutralDLL’s own carbon footprint is globally monitored on a quarterly basis. This includes business flights and car kilometers and electricity, gas and paper consumption in our offices. Our commitment is to reduce our global CO2 emissions per full-time employee (FTE) by 20 percent by 2023. Up to 2020, DLL already had a global target to reduce 10 percent CO2 per FTE by 2020 compared with 2013. Looking at this target DLL outperformed. In 2019 we already achieved a 44 percent decrease per FTE and in 2020 this was a
CO2 reduction of 66 percent per FTE. The huge 2020 achievement is also explained by the COVID-19 pandemic with very limited business travel and working from home situation. DLL compensates its global footprint by buying internationally traded carbon credits in several clean tech projects. As a result, we are an “administratively” carbon-neutral company. Additionally, mid-2020, DLL joined the EP100 (Energy Productivity 100) initiative, which brings together leading businesses committed to improving their energy productivity. DLL commits to reduce its energy usage by 50 percent by 2030 from 2013 (base year) related to our own operations, including energy usage in our offices and business travel.
Climate ActionThroughout 2020, DLL joined Rabobank in its Climate Action endeavors. With DLL input, Rabobank released a climate publication “Rabobank and climate change – Making the change to safeguard our future,” setting out the Group climate strategy for the general public per key strategic theme/sector in which Rabobank is active, for example F&A, Energy, Mortgages and SME clients in the Netherlands. We will further accelerate in 2021, with dedicated staff identifying and assessing the climate risks in our portfolio, and we will start reporting on this and embedding climate risk in the overarching company strategy and risk policies.
Maximize ourcustomer value
Maximize our customer value
As consumer demand continues to put pressure on businesses to be increasingly mindful of the impact they have on the environment, we will support our partners in their endeavors to adopt sustainable business practices. Sustainability presents a business opportunity for our clients and therefore for our organization. This is, for instance, the case in the rise of the renewable energy sector, the development of sustainable food and agricultural practices and circular and usage business models. DLL maximizes customer value by offering these sustainable business solutions to our partners.
Creating sustainable customer valueDLL analyzes the sustainability performance of our larger clients and offers our customers financial solutions to achieve long-term sustainable business success. Based on insights derived from these assessments, DLL supports our clients with in-depth knowledge and advice on identified opportunities, such as demand for pay-per-usage, service models
| }

Contents ContentsConsolidated financial statements Consolidated financial statementsCompany financial statements Company financial statementsManagement Report Management ReportSupervisory Report Supervisory Report
3938
DLL COVID-19 responsesDuring the COVID-19 pandemic, DLL did its utmost to prevent business delays and continue to offer customer care through our IT infrastructure for remote working. DLL also supported programs with a clear societal impact, such as the exploration of short-term rental programs to meet immediate community needs for hospital beds, tech devices, ambulances for emergency use, ICU beds and COVID-19 test kits for healthcare professionals.
Furthermore, we organized a dedicated COVID-19 charitable giving campaign, in which 2,260 unique members participated (44 percent of our member base), to combat COVID-19 and its consequences. Sixty-three projects were selected, supporting healthcare workers, victims, elderly and vulnerable people and others impacted by the COVID-19 pandemic. DLL also bought 500 refurbished tablets to provide to hospitals so that family members could stay in contact while being in isolation.
Community involvementThroughout 2020, DLL continued to boost its global volunteering and charitable giving program. Through our Community Involvement Portal, in 2020, a total of 2,602 unique members found an initiative to support with their expertise, time or donation (in total 3,890 actions), which is 51 percent of the DLL total member base. Additionally, DLL supported good community causes with charitable donations.
Even more, social impact has been created in the Netherlands, where we organized the 17th edition of the Corporate Social Responsibility Matchmaking 040 dinner (“MO040 dinner”) focusing on “poverty reduction” and “inclusion in the labor market” as central themes. Thirty-five companies and civil society organizations participated in this year’s online version (adapting to the COVID-19 situation), exploring potential cooperation, not through one-off financial contributions but through expertise or product development. In addition to the successful MO040 dinners, DLL continues to be a driving force in the related Impact040 network, a business community for social impact, with a focus on inclusion and uniting people, participation and poverty reduction.
for circular opportunities as well as the energy transition. This is expected to generate recognition and goodwill from stakeholders, sustainability ratings and clients, resulting in more clients coming to DLL to enable their positive societal impact.
Sustainable innovations and new marketsGoing forward, we expect both Circular Solutions as well as Energy Transition solutions to increasingly gain ground. DLL accelerates climate-smart and circular business, also in collaboration with the European Investment Bank (EIB). In 2020, we provided EUR 100 million of circular EIB Investment Funding to customers in the Benelux region. The EIB additionally provided DLL with another loan of EUR 200 million to finance investments of SMEs in Spain and Italy. EIB/DLL will increase its financing to projects focused on the transition to a carbon-free economy, including installation of solar panels, replacement of self-propelled agricultural tractors and substitution of diesel-fueled forklifts with electric equipment.
Furthermore, DLL entered new markets, such as electro mobility. In 2020, the first DLL electro mobility deals were completed. The demand for electro mobility and sustainable concepts within smart cities has been accelerated by COVID-19, which has awakened people and governments to the benefits of cleaner air. As a consequence, more measures are implemented to stimulate electric vehicles adoption and alternative business models such as micro mobility.
Become a globalemployer of
choice
Societal impact
Our members play a critical role in delivering our value proposition to our customers. We acknowledge that current and future DLL members want to work for a transparent and socially responsible company. A strong Sustainability program, coupled with an inspiring community Involvement program, improves our ability to attract, retain and develop top talent. That is why we offer every member of DLL the opportunity to spend two days per year (with pay) doing volunteer work.
External knowledge and thought leadershipWe continue to develop our knowledge and thought leadership in Circular and Usage solutions. As an example, we joined the Platform for Accelerating the Circular Economy (PACE) in 2020. PACE is a public-private collaboration, co-chaired by the CEO of Philips and the heads of the Global Environment Facility and the UN Environment Programme and facilitated by the World Economic Forum. This year, a new PACE project called “Finance and Policy for Sustainable Agriculture” kicked off under co-leadership of DLL and Rabobank. Food & Agriculture is one of the thematic areas of PACE, aiming to create momentum towards a climate-smart and regenerative food system. Such a system should be based on three principles of Circular Economy: design out waste and pollution, keep products/materials in use and regenerate natural systems. The final result of this initiative will be a full report to debut at the World Economic Forum 2021.
We also externally shared our knowledge in other areas. DLL published blog posts regarding “The State of Clean Technology in Europe.” We also published our insights in tax incentives for energy efficiency HVAC retrofits in the U.S. government stimulus package, in response to COVID-19 economic impact (CARES Act). We published Lighting-as-a-Service (LaaS) articles, sharing best practices for partners to develop a LaaS offering. The need to reduce carbon footprint and the rising embrace of “green” solutions by businesses are addressed in DLL’s energy-efficiency whitepaper and blog post with focus on the U.K. market. Finally, DLL also analyzed trends and sustainable solutions in the food industry in “Three Trends That Will Shape the Food Industry Going Forward.” More blog posts on sustainability and food packaging are planned for 2021.
Drive innovation of
products & services
Drive sustainable innovations
DLL can lead by example on innovative sustainability topics if we are a thought leader and act as a first mover with the introduction of innovative and distinctive financial solutions
and rental solutions, as well as end-of-life solutions such as take-back and asset recycling services. We provide companies access to the latest technologies, enabling them to operate more efficiently.
DLL proactively drives the transition to renewable energy and carbon-neutral or even energy-generating asset types though our Clean Tech Business, with a target of 25 percent compound annual growth rate (CAGR) in Clean Tech originations YOY. DLL’s financing encompasses a diverse range of products and services that improve efficiency and operational performance while minimizing energy consumption, waste or environmental pollution. Our Clean Technology scope includes energy efficiency, renewable energy products and also other areas such as combined heat and power, recycling and energy storage. In 2020, Global Clean Tech net book value (NBV) decreased by 15 percent compared to last year, caused by COVID-reduced activity in the sector. However, we did see European NBV go up by 12 percent.
Another important trend is the transition to circular and usage business models. The 2020 Circularity Gap Report finds that the world is now only 8.6 percent circular. Of all the minerals, fossil fuels, metals and biomass that enter it each year, just 8.6 percent is cycled back. This report as well as the interest and circularity targets expressed by our customers, show massive opportunities in supporting the transition to circular business models. Customers increasingly take full responsibility for the reuse, refurbishment, remanufacturing, reengineering and recycling of the capital equipment they sell. This will provide incentive to extend the life of products and reduce pressure on the planet’s limited resources, stopping waste at the end of product use while capturing the economic value of materials. And it promotes usage models over ownership. DLL provides our customers with tailored financial services like operational lease, swapping of assets, extended usage, redeployment, second-life finance, et cetera. In 2020, in these economic uncertain times, we saw more interest in smarter use of equipment, driving our Used Equipment Finance solutions. Total share of NBV was 16.1 percent in Australia, 6.5 percent in Europe and 12.0 percent in North America. We are proud that DLL offers products and services that will support this transition to circular and usage-based business models joining forces on this important journey to a more sustainable world.
| }

Contents ContentsConsolidated financial statements Consolidated financial statementsCompany financial statements Company financial statementsManagement Report Management ReportSupervisory Report Supervisory Report
4140
In late 2019 DLL launched its new AI Lab, a dedicated R&D space for innovation headed by Nicoleta Onuta. “The commitment to innovation has been a conscious choice from DLL leadership. This allowed us to hit the ground running and put specialized AI expertise in place early in 2020, adding to existing robotics capabilities,” she explains. The work of the AI Lab and of the robotics teams helped DLL respond to customer needs when the pandemic hit. For instance, DLL was confronted with more than 80,000 requests from customers to restructure contract and payment terms throughout its global network. Further complicating matters, these requests needed to be processed and fulfilled by a virtually 100 percent remote workforce. This was a clear challenge in need of an innovative solution.
Intelligent automation solutions
“We built chatbot capabilities and prototyped email bots to facilitate omnichannel interactions with customers 24/7. This way we can quickly answer simple and routine questions,” explains Nicoleta. “When complemented with robotics applications the resulting intelligent automation solutions deliver timely resolution to customer inquiries. Which means that our customer service staff can focus on providing personalized support for the more complex requests and customer interactions.”
Adds Rob, “Intelligent automation allows us to automate longer and more complex processes. Here we’re looking at decisioning where cognitive capabilities are needed from a human perspective. It’s extremely powerful.”Rob relates that even other companies are learning from DLL’s AI Lab. “We are front-runners in our processes around developing and deploying (real-time) AI, the technologies we use and how we use them.”
Commitment to innovation crucial in a crisis
The objectives for Driving innovation of products and services stayed the same in 2020, but the focus shifted to the areas hardest hit by the pandemic. Rob van der Zanden, Head of Group Analytics, and Nicoleta Onuta, Team Lead Artificial Intelligence (AI), describe how DLL strengthened delivery models by accelerating innovation on AI and robotics.
“We are frontrunners in our processes around developing AI, the technologies we use and how we use them.”
Rob van der Zanden
Interview
| }

Contents ContentsConsolidated financial statements Consolidated financial statementsCompany financial statements Company financial statementsManagement Report Management ReportSupervisory Report Supervisory Report
4342
Drive innovation of
products & servicesIdentifying hidden risks and
opportunitiesThe global pandemic brought not only high volumes of customer inquiries, but also changes to risk profiles. In response, the team set up AI learning capabilities to quickly capture changes in risk profiles and applied AI to credit decisioning. “On the portfolio management side, we dedicated efforts to identify customers at risk very early in the delinquency process and focused resource allocation toward the customers in need,” explains Rob. These efforts have generated new tools for Collection & Recovery and portfolio risk management.
“As the consequences of the pandemic are still shifting, we’ve applied AI algorithms to identify hidden pockets of risk and opportunities for our customers,” says Nicoleta. For instance, the pandemic created heightened customer interest in reducing overall costs through more conscious and economical usage of their equipment. In turn, this drove interest and inquiries on pay-per-use business models across various industry segments. “It’s crucial that we keep innovating in strategic spaces with AI,” she explains. “It’s likely we’ll witness permanent shifts in buyer attitude and equipment
utilization patterns driven by the pandemic later in 2021-22, when the ‘new normal’ establishes. Responsible AI-powered innovations can support DLL in adapting to complex dynamics.”
“AI models are only as good as their historical data,” Nicoleta adds. “And we’ve never seen a COVID-19 crisis before, which is why we’re putting agile learning platforms in place to help us quickly see and learn from these shifts.”
Becoming AI frontrunners
Nicoleta believes that consistent commitment to innovation is crucial to emerge successfully from a crisis. The global pandemic has propelled change in all areas of business and the AI Lab is well equipped to respond. “We’ve set up AI Lab so that we can experiment and quickly find out if something works or not: we want to see a ‘go or no-go’ decision within 3 months,” explains Rob. “We look to make a difference by focusing on key AI capabilities and scaling them fast.”
The potential use cases often come through the “Gamechanger” innovation network that DLL has embedded in its offices around the world; which is made up of like-minded members of the workforce who have a passion for innovation. For Nicoleta, the Gamechangers are bilingual ambassadors. “They speak the language of AI and the language of the business.” Together they introduced the “AI front-runner recognition prize,” which is awarded every quarter for the most innovative AI ideas from DLL across the globe. “Engagement and communication on AI are priorities this year,” concludes Nicoleta. “We would like all our leaders to be AI front-runners.”
Nicoleta Onuta
“The commitment to innovation has been a conscious choice from DLL leadership.”
| }
Contents ContentsConsolidated financial statements Consolidated financial statementsCompany financial statements Company financial statementsManagement Report Management ReportSupervisory Report Supervisory Report
4544
processes. Our non-performing loan (NPL) ratio has increased over the past year as a consequence of the impact of COVID-19 on the economy and our portfolio. It is the expectation that the stricter EBA definition will further increase our NPL ratio. Therefore we are working on mitigating the impact this definition has on our NPL ratio and to keep the NPL ratio within our risk appetite, to avoid implications to our future capital and funding requirements and consequently to our pricing.
– In 2020, Asset Snapshot/Inspection App, has been rolled out to 20 DLL locations and coverage is still expected to expand across the globe throughout 2021. The expectation is that this will have a positive impact on the number of external frauds, as well as it will help in early detection. Furthermore, the control for the field audits is included in our RCF since 2020 and sharpened for 2021.
– A global definition of all products used within DLL providing alignment across countries has been completed. Additionally, a country-level inventory of all product/market combinations has been prepared, providing clarity across the organization.
– Identification has started for the climate risks within DLL’s portfolio due to, for example, droughts and flooding as well as (energy) transition risks. These risks may impact the asset risk and the credit risk but also the operational risk part of the portfolio. A plan of approach is to be defined in early 2021 regarding how to structurally identify the risks and address these risks via mitigating actions.
– A separate Loan Review function is being set up that will act as a second line and aims to review the credit risk process at the first and second line, from credit underwriting until default management and including portfolio management. The aim is to further improve the quality of credit risk management within DLL, improve the quality of the credit risk policies, and adherence thereof in the countries. Also, IT investments have been made to further strengthen efficient and proactive customer support, to be able to actively manage credit risk in our portfolios and to remain compliant with applicable laws and regulations.
We were able to quickly adapt to the new reality and continued delivering services to our customers, mainly through digital channels. Our members could continue their work virtually, mostly from their home. As a consequence of the digital transformation and members working remotely, increased cybercrime activity is observed but did not led to any significant impact for DLL as this was closely monitored. Additional awareness campaigns are provided and members are informed with actual examples with the aim to prevent these attacks from being successful.
As a consequence of the financial distress situation, DLL assessed an increased external fraud risk. However, this did not materialize yet. The operational risk losses and also the external fraud related losses in 2020 are lower than the optimistic scenario set out earlier in 2020, which assumed that we would see a strong increase in external fraud losses when the 3-6 months COVID-19 extension periods ends. So far this has not yet fully materialized. The continuing COVID-19 crisis will likely result in detecting external fraud more often when customers are defaulting.
In 2020, we also assessed and strengthened our overall risk management framework, despite the challenges that were brought by the COVID-19 pandemic and the pressure that put on our members. Some of the main developments concerning our risk management activities include the following:
– In 2020, activities and projects continued to further mature our Risk & Control Framework (RCF). The focus has been on topics like improving the first-line responsibility for risk control and compliance, fraud risk, outsourcing risk, training and monitoring and reporting.
– DLL launched a new enterprise-wide project dealing with the implications of the new definition of default (DoD) as issued by the European Banking Authority (EBA). We are in the process of implementing the new DoD in our systems and
As one of the consequences of COVID-19, our portfolio growth slowed down, and we were confronted with high credit impairments. We have provided support to approximately 35,000 customers, having around 80,000 contracts, that have in total a portfolio of circa EUR 3.7 billion. Enhanced risk management guidance for the COVID-19 restructured portfolio has been issued and credit acceptance and underwriting have been amended where needed.
The existing portfolio was reviewed and clients were proactively contacted to understand their financial status. There is a continued effort to assess the needs in the Collections and Recovery department to make certain these departments are adequately functioning and staffed. The mitigating activities resulted in an increased informed position regarding the quality developments in DLL’s portfolio, leading towards additional initiation of activity to protect the quality of the portfolio. It also resulted in increased attention for the organizational robustness to organize risk-mitigating activities locally.
DLL continues to monitor and respond to the unfortunate effects of the COVID-19 pandemic. During the yearly strategic risk assessment, the macro economic downturn was assessed as the highest risk for DLL at this moment. More information on the strategic risk assessment can be found in paragraph Strategic risk.
Risk management and compliance
At DLL, risk management activities are executed as part of daily business management to support informed decision-making and to add value to DLL. The risk management function provides requirements, monitors the execution and independently reports on developments impacting the risk profile of DLL. DLL maintains a robust risk management framework to identify and escalate emerging risks and to make decisions based on a conscious and careful risk-return tradeoff in line with the risk strategy that should remain within risk appetite.
Risk developments
2020 has been an unprecedented year, mostly because of the COVID-19 pandemic. Never before has DLL faced such rapidly changing circumstances. The impact has been enormous, not only on the health of many people, but also for the economy. Our customers, our vendors and all our members have been affected by multiple aspects of the COVID-19 pandemic.
Without taking risks, DLL will not achieve its strategic objectives. Therefore, risk is an inherent component of DLL’s business activities. The effective identification, assessment, management, monitoring and reporting of risks is critical for DLL to generate an appropriate return and achieve its strategic and financial objectives.
| }
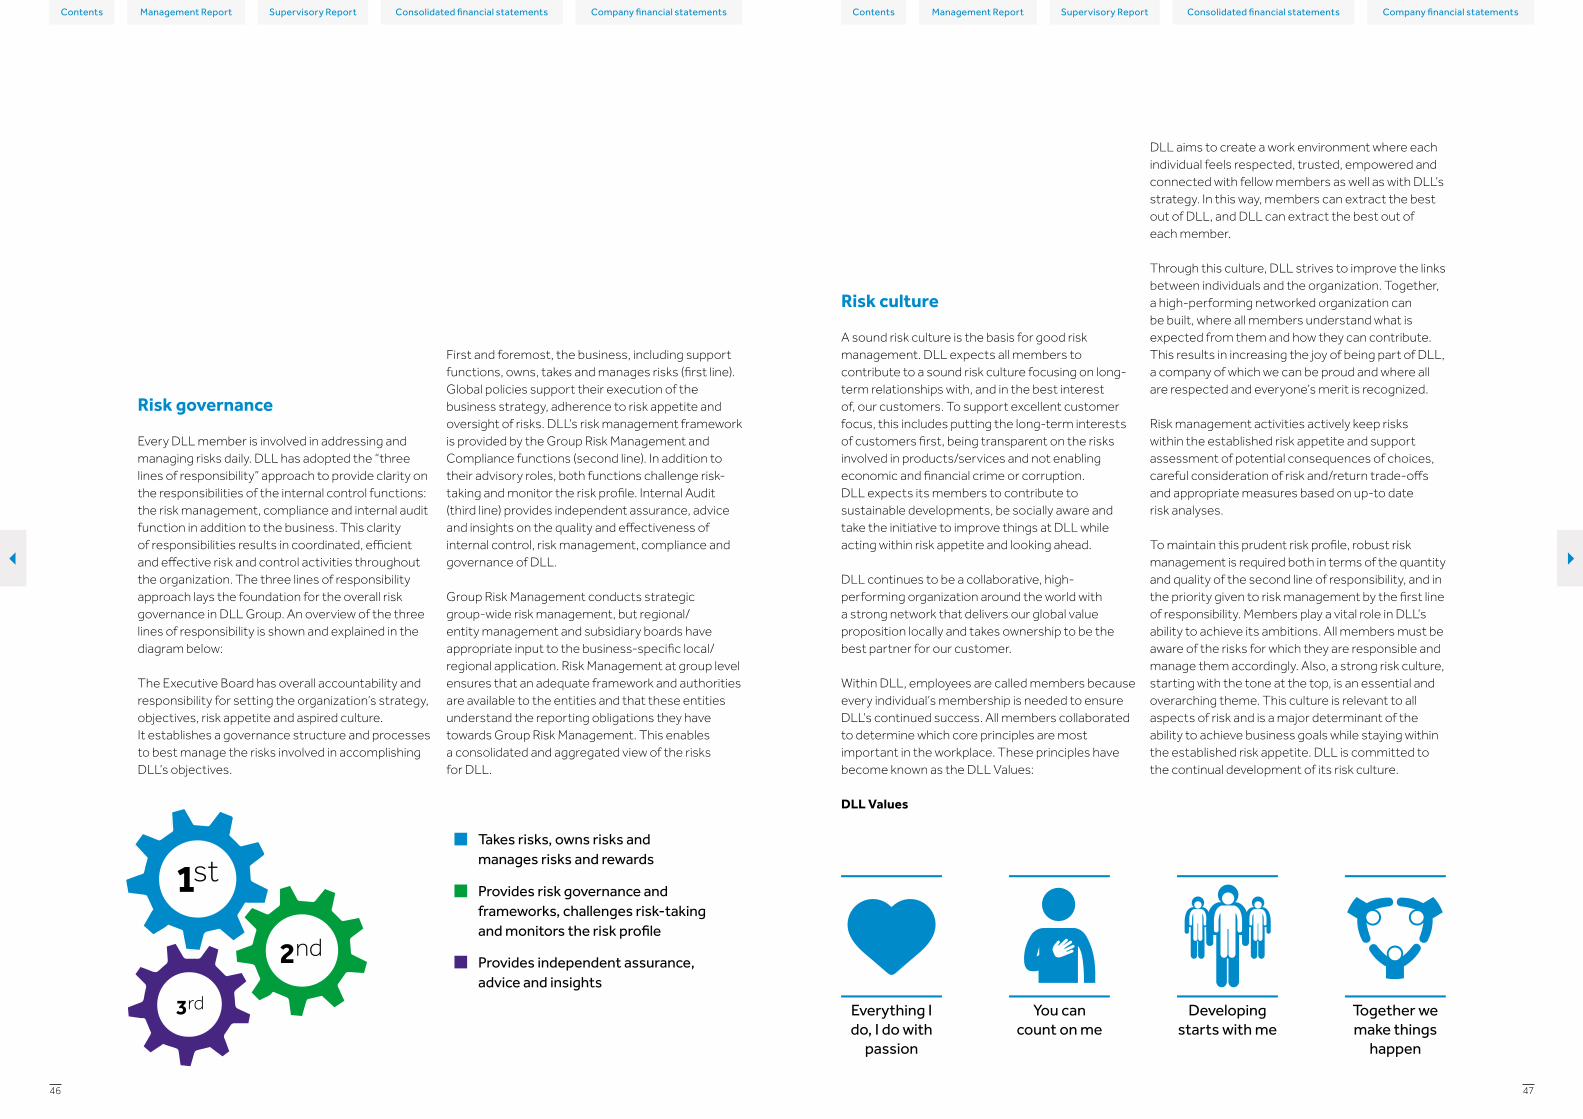
Contents ContentsConsolidated financial statements Consolidated financial statementsCompany financial statements Company financial statementsManagement Report Management ReportSupervisory Report Supervisory Report
4746
DLL aims to create a work environment where each individual feels respected, trusted, empowered and connected with fellow members as well as with DLL’s strategy. In this way, members can extract the best out of DLL, and DLL can extract the best out of each member.
Through this culture, DLL strives to improve the links between individuals and the organization. Together, a high-performing networked organization can be built, where all members understand what is expected from them and how they can contribute. This results in increasing the joy of being part of DLL, a company of which we can be proud and where all are respected and everyone’s merit is recognized.
Risk management activities actively keep risks within the established risk appetite and support assessment of potential consequences of choices, careful consideration of risk and/return trade-offs and appropriate measures based on up-to date risk analyses.
To maintain this prudent risk profile, robust risk management is required both in terms of the quantity and quality of the second line of responsibility, and in the priority given to risk management by the first line of responsibility. Members play a vital role in DLL’s ability to achieve its ambitions. All members must be aware of the risks for which they are responsible and manage them accordingly. Also, a strong risk culture, starting with the tone at the top, is an essential and overarching theme. This culture is relevant to all aspects of risk and is a major determinant of the ability to achieve business goals while staying within the established risk appetite. DLL is committed to the continual development of its risk culture.
Risk culture
A sound risk culture is the basis for good risk management. DLL expects all members to contribute to a sound risk culture focusing on long-term relationships with, and in the best interest of, our customers. To support excellent customer focus, this includes putting the long-term interests of customers first, being transparent on the risks involved in products/services and not enabling economic and financial crime or corruption. DLL expects its members to contribute to sustainable developments, be socially aware and take the initiative to improve things at DLL while acting within risk appetite and looking ahead.
DLL continues to be a collaborative, high-performing organization around the world with a strong network that delivers our global value proposition locally and takes ownership to be the best partner for our customer.
Within DLL, employees are called members because every individual’s membership is needed to ensure DLL’s continued success. All members collaborated to determine which core principles are most important in the workplace. These principles have become known as the DLL Values:
DLL Values
First and foremost, the business, including support functions, owns, takes and manages risks (first line). Global policies support their execution of the business strategy, adherence to risk appetite and oversight of risks. DLL’s risk management framework is provided by the Group Risk Management and Compliance functions (second line). In addition to their advisory roles, both functions challenge risk-taking and monitor the risk profile. Internal Audit (third line) provides independent assurance, advice and insights on the quality and effectiveness of internal control, risk management, compliance and governance of DLL.
Group Risk Management conducts strategic group-wide risk management, but regional/entity management and subsidiary boards have appropriate input to the business-specific local/regional application. Risk Management at group level ensures that an adequate framework and authorities are available to the entities and that these entities understand the reporting obligations they have towards Group Risk Management. This enables a consolidated and aggregated view of the risks for DLL.
Risk governance
Every DLL member is involved in addressing and managing risks daily. DLL has adopted the “three lines of responsibility” approach to provide clarity on the responsibilities of the internal control functions: the risk management, compliance and internal audit function in addition to the business. This clarity of responsibilities results in coordinated, efficient and effective risk and control activities throughout the organization. The three lines of responsibility approach lays the foundation for the overall risk governance in DLL Group. An overview of the three lines of responsibility is shown and explained in the diagram below:
The Executive Board has overall accountability and responsibility for setting the organization’s strategy, objectives, risk appetite and aspired culture. It establishes a governance structure and processes to best manage the risks involved in accomplishing DLL’s objectives.
Everything I do, I do with
passion
You can count on me
Developing starts with me
Together we make things
happen
Takes risks, owns risks and manages risks and rewards
Provides risk governance and frameworks, challenges risk-taking and monitors the risk pro�le
Provides independent assurance, advice and insights
1st
2nd
3rd
| }

Contents ContentsConsolidated financial statements Consolidated financial statementsCompany financial statements Company financial statementsManagement Report Management ReportSupervisory Report Supervisory Report
4948
The identified strategic top 10 risks are all assessed through the lens of the pandemic consequences. The assessment took place in a time when the long-term impact of COVID-19 on local economies was becoming clear. In various degrees, the pandemic has repercussions on all the risks and action plans determined, therefore COVID-19 has been presented as an overarching element of the identified strategic risks rather than as a separate individual risk.
Outcome of assessmentOf the 10 identified strategic top risks, eight require further follow-up actions since senior management wants to reduce the associated risks. Mapped against the four strategic pillars of the DLL strategy, these eight strategic top risks are described in the table below.
The follow-up and development of the identified strategic risks and subsequent action plans are monitored on a quarterly basis by the Group Risk Committee and the Executive Board.
Strategic pillar
Strategic top risk
The risk
Maximize our customer value
Macroeconomic downturn
That nations’ economies enter recession, which was forecasted to occur but was aggravated and accelerated by the COVID-19 pandemic. This leads to potential loss of business for DLL, increasing credit risk costs, increase in external fraud, margin pressure, increased volatility in the financial market and the availability of capital, which might limit our growth capabilities.
Regulatory environment
That DLL is unable to timely and accurately fulfill existing and increasing new regulatory requirements both locally and globally (e.g., EBA DoD, CAMS (Customer Due Diligence, Anti-Money Laundering, Counter Terrorist Financing and Sanctions Screening), privacy and Basel III Reform), resulting in outcomes such as operational inefficiencies, an increase in capital charges, impact on Non-Performing Loans (NPL), regulatory fines, or (ultimately) licenses being revoked.
Lifecycle management
That lack of lifecycle management of both hardware and software updates and maintenance (tech debt) caused by either resource restrictions or other priorities results in an increase in the number of business continuity outages, inability to perform normal business requirements and the loss of business and the increase of data security breaches.
Third-party management
That due to the rapid growth and reliance on vendors, dealers, outsourced partners and (intragroup) suppliers, DLL has insufficient control over the third party and may be exposed to potential regulatory fines, data breaches, financial loss, client dissatisfaction, loss of control over key processing functions, reputational damage (and in case of outsourcing: poor member morale due to job displacement).
Become a global employer of choice
Workforce of the future
That DLL will not be able to attract, train, develop and retain human resources with the right competencies (e.g., tech savvy and analytical) either because of scarcity of such competencies or because of budget constraints. The upskill and reskill of existing staff also requires significant efforts and cost, which could result in DLL being unable to achieve its business objectives. Another component of this risk is the adaptability and willingness of team leads to manage teams remotely in the post-COVID-19 new “normal.”
Accelerate our digital transformation
Cyber security That data security breaches and cyber-attacks, like espionage, hacks, phishing, denial of service and ransomware with the aim to disrupt businesses, result in loss of data or unauthorized access to critical systems, which in turn result in financial consequences, reputational damage or regulatory fines.
Digitalization That there is an insufficient embrace of digital thinking and the existing capabilities may not meet performance expectations related to quality, time to market, cost and innovation. Inadequately applied digitalization in business processes may lead to competitive disadvantage and loss of business volume and exposes DLL to reputational risk.
Drive innovation of products and services
Climate change That due to changing weather patterns and extreme weather events (hurricanes, floods, earthquakes, droughts, wildfires, et cetera.), DLL is exposed to business disruptions, loss of assets, economic loss and increased insurance premiums. Climate changes and the efforts to reduce CO2 emissions require DLL to measure the climate risk in our portfolio and adjust the composition of the portfolio to be less vulnerable to climate changes and to be more sustainable (financing of green assets is cheaper from a capital requirements perspective and cost of funds is lower).
This assessment takes the strategic objectives, current global footprint, market situation, organizational structure and culture into account. The assessment is based on the input from DLL senior management and the local management team, historical loss data, scenario analysis and external risk reports.
COVID-19When performing the strategic top risks assessment over 2020, the greatest event of the year, the COVID-19 pandemic, shifted the focus and outlook of all external risk reports that lay at the foundation of the assessment. The used external sources had not anticipated such an outbreak or any of its complex social, healthcare and macroeconomic consequences. However, since it has materialized, DLL has taken extensive mitigating actions to address its aftermath. Mitigating actions address the increased risks as a result of the pandemic, as well as adopting an (almost) exclusive virtual way of working.
Risk strategy
General principlesIn order to sustain the principles of its business strategy, DLL avoids risks that can potentially affect the fulfillment of its goals. This implies that risks endangering DLL’s continuity should be mitigated since DLL wants to continue to service its customers and members. As elaborated upon below, ensuring long-term continuity includes certain minimum reward requirements.
The performance of DLL, not only in terms of income, but also with respect to risk management, fully depends on its group entities. Therefore, the local entities share the responsibility for the results on a group level.
Three pillarsDLL distinguishes the following three pillars in its risk strategy:
1) Protect profit and profit growthMaintaining a continued profit level is an important source of capital. In order to continue to service our customers, members, our vendors and society in the long run, profitability must be predictable, consistent and sufficient to maintain a strong capital base and reputation. DLL makes transparent choices on where capital and resources can be used most efficiently or appropriately with respect to sectors and concentrations.
2) Maintain a solid balance sheetSolid balance sheet ratios for DLL are essential for continuity in our customer service and growth objectives. This means a stable funding base and diversity in portfolio, geographical spread and products.
Capital adequacy ratiosA strong solvency ratio engenders trust with customers, rating agencies and external commentators. It also acts as a buffer in the event of unexpected losses. DLL’s objective is maintaining a Common Equity Tier 1 ratio of at least 10.7 percent. Accordingly, DLL will be able to finance its growth from a solvency perspective through increased retained earnings.
FundingDLL has drafted a strategic funding plan. Rabobank, as shareholder, will remain DLL’s primary funder, but DLL’s aim will be to continue to diversify the funding base by expanding cost-effective options such as securitization platforms. Efforts will continue to attract additional European Investment Bank (EIB) funding where possible. Other opportunities will be evaluated where they can provide cost-effective funding diversification. DLL attracts limited customer deposits, focusing more so on other professional funding sources. Local funding will be sought where deemed more efficient than group funding.
LiquidityRabobank manages the consolidated Rabobank Group (including DLL) liquidity regulatory requirements, as DLL has obtained a solo supervision waiver for the DLL group level. However, DLL is responsible for managing regulatory liquidity ratios (such as Liquidity Coverage Ratio) in certain territories where the DLL subsidiary is solo supervised. This situation is likely to remain unaltered through 2021.
3) Protect identity and reputationDLL wants to protect the fundamental trust that its stakeholders have in DLL. To that end, it seeks to avoid losses that create unease with its stakeholders. Also, DLL does not want to receive negative press regarding its core values.
These three pillars are closely interrelated and fully dependent on maintaining sound governance and a strong risk culture throughout the organization. DLL can only deliver long-term, optimal customer value if it has a solid balance sheet. This results in low funding costs and supports the group’s profitability and reputation. In turn, maintaining a solid balance sheet requires healthy profitability and a sound reputation. Finally, reputation plays an important role in achieving satisfactory profit levels.
Strategic risk
Risk management activities are supporting the realization of the strategy and objectives of DLL. Internal and external developments are closely monitored to identify risks that may impact the realization of DLL’s strategic objectives. As such, DLL prepares an annual integrated risk assessment of the residual risks faced by the organization that are not yet managed properly by the existing policies and controls and that are strategic in nature.
| }
Contents ContentsConsolidated financial statements Consolidated financial statementsCompany financial statements Company financial statementsManagement Report Management ReportSupervisory Report Supervisory Report
5150
the DLL risk profile against the risk appetite limit. A risk report is prepared quarterly on the Key Risk Indicators to measure the risk appetite on DLL group level, including the assessment of the risk profile against the risk appetite limit. Reporting on the risk appetite performance also includes a forward-looking outlook of the expected development of risk performance.
In pursuit of the right balance between (accepted) risk and reward, we generally operate within the risk appetite, albeit with a higher overall risk profile for credit risk because of the COVID-19 pandemic. Apart from three Key Risk Indicators, one for integrated risk and two for credit risk, we have operated within our risk appetite over 2020. We are well aware of these risks and the underlying drivers for the risk
Over 2020, per material risk type the following risk appetite statements and Key Risk Indicators (KRIs) have been defined in the RAS:
Risk type Risk Appetite Statement Examples of Key Risk Indicators to support our RAS
Integrated risk We have not developed explicit risk appetite statements regarding business risk because it is primarily captured in an aggregated, integrated and comprehensive way in DLL’s business strategy. The Group Finance and Control and Group Risk departments deal with the challenge and “management” of this risk. The main reason is that the underlying risks are managed and mitigated through a structured program of scenario and sensitivity analyses to determine business risk. DLL’s Strategic Risks are considered in the selection of scenarios and sensitivities.
- Common Equity Tier 1 ratio (CET1 ratio)- Total return on invested capital (ROIC)
Credit risk DLL will maintain a credit portfolio with a manageable risk profile in order to limit the impact of bad debt costs on the profitability and reputation of the company.
- Non-performing loans- Coverage ratio non-performing loans- Loan impairment charges- Concentration limits
Balance sheet risk
Liquidity risk: DLL aims for an optimally diversified funding portfolio (in tenors and funding sources) that supports its customers’ activities and a balanced liquidity mismatch within its risk appetite. DLL must apply a “matched-funding” principle, except for a maximum mismatch of 10 percent.
- Consolidated DLL liquidity position
FX translation risk: DLL aims for a limited FX translation risk impact of exchange rate movements on the DLL CET1 ratio.
- FX basis point impact CET1 ratio
Interest rate risk: DLL must apply a “matched-funding” policy within approved limits to maintain DLL’s exposure to interest rate risk, within DLL’s risk appetite.
- Earnings at risk- Modified duration of equity
Asset risk DLL wants to minimize residual value impairments on leased assets. The general guidance at DLL is to have a varied and diversified portfolio in order to mitigate the risks inherent in an asset-based financing environment and provide a sufficient level of income for assuming this risk. Continued success in asset-based financing activities may result in increased asset risk concentrations that are acknowledged and accepted.
- Residual value concentration- Inventory aging
Operational risk
DLL will not tolerate aggregate operational risk losses exceeding a predefined threshold, nor is it acceptable to incur estimated losses exceeding this threshold under likely scenarios from its annual scenario program.
- Number of process execution failures- IT security- Customer due diligence
The DLL RAS limits are further specified in entity-specific risk appetite statements depending on materiality and governance structure. Key Risk Indicators, risk indicators and measurements are defined, monitored and reported upon quarterly. The breach management process in combination with appropriate governance ensures a timely and adequate response. Any limit breaches require risk committee approval and mitigating actions to be taken.
Constant assessments are performed to determine whether DLL remains within the set risk appetite. The purpose of risk monitoring is to keep track of risks that occur and the effectiveness of mitigating actions. Regular monitoring and reporting of the Key Risk Indicators is essential to measure and manage
Material risk
DLL’s risk management framework is designed to mitigate the risks DLL is facing in day-to-day business. When we do business with our customers, explore options or make decisions, we continually assess risks. DLL maintains effective processes to identify, assess, manage, monitor and report risks. These include internal control mechanisms and remuneration to consistently promote sound and effective risk management and independent monitoring and challenge by Group Risk Management and Compliance, thereby embracing the three lines of responsibilities model. Based on the risk identification, DLL is faced with the material risk types as shown below.
This risk-type classification provides clear definitions, a consistent terminology and compatible methodologies, including risk limits and risk controls, and promotes a common understanding of risk management throughout DLL.
The DLL risk management framework recognizes the economic substance of all risk exposures and consists of multiple policy documents that provide specific requirements to cover the material risks.
Risk appetiteDLL’s risk appetite is founded on our risk strategy, which is linked to our business strategy along the four strategic themes of:1. Maximizing our customer value,2. Becoming a global employer of choice,3. Accelerating our digital transformation and4. Driving innovation of products and services.
These four strategic themes define the high-level boundaries of the risk appetite within which DLL will operate. The risk strategy articulates the risk priorities that need to be managed to achieve the business strategy. The risk strategy is the starting point to further define the risk appetite, which is laid down in a Risk Appetite Statement (RAS).
The RAS defines per material risk type the levels of risk we are willing to accept to achieve our business objectives. The RAS articulates our overall maximum level of risk exposure, both quantitatively and qualitatively, and is used in all business activities to assess the desired risk profile against the risk-reward profile of a given activity. Risk appetite is reviewed and updated annually or more frequently following internal or external events with material impact. The risk appetite statement is supported by Key Risk Indicators (KRI) and Risk Indicators (RI) that ensure the actual risk profile is managed within the desired risk profile. KRI directly monitor the risk profile associated with the risk appetite while RI support additional monitoring of the risk appetite. For every KRI/RI, an Early Warning Limit (EWL) and/or Risk Appetite Limit (RAL) is determined to manage risk profile within the desired risk appetite.
Integrated risk
Creditrisk
Balancesheet risk
Assetrisk
Operationalrisk
| }

Contents ContentsConsolidated financial statements Consolidated financial statementsCompany financial statements Company financial statementsManagement Report Management ReportSupervisory Report Supervisory Report
5352
BrexitThe U.K. left the EU on January 31, 2020 and entered the transition period that expired at year-end 2020. The U.K. and the EU have negotiated their future relationship within this predetermined timeframe. Even though an agreement was reached, we anticipate a negative economic impact for the U.K. and the Netherlands too, as one of its main trading partners, and it is likely that our clients will face uncertainties in 2021. These uncertainties could negatively impact the risk profile of our U.K. business. DLL’s total assets in the U.K. represent 6.3 percent of the total assets of DLL. Due to the short tenor of our deals, strong vendor relationships, small ticket size and diversification, the implications from Brexit are well within our risk appetite.
DLL and climate risk: strategic embedding in risk frameworkClimate change poses both risks and opportunities to DLL’s business model. Climate risks are split in risks of an acute physical nature, where water stress (flooding, droughts) and the increase in occurrence of extreme weather events can impact DLL’s customers and quality of our portfolio. Also, there is an energy transition risk to a net zero carbon economy, with changing policies and legislation and an increased supervisory scrutiny. DLL’s portfolio needs to be assessed on both the physical and the energy transition risk, identifying the sectors that will feel impact, assessing the impact and where necessary, ensuring mitigating actions. Climate change will also lead to new innovative business opportunities for DLL’s business model, focusing on leasing, our asset knowledge and lifecycle management.
The regulatory framework gives guidance on the approach and scope, but universally agreed-upon methodologies as yet are lacking. We will adopt a phased approach towards climate risk management, including the Sustainability and Finance functions to ensure alignment, commitment and reach within DLL. Our goals revolve around the management of the impact of climate risks on DLL, mitigation of identified climate risks, compliance with rules and regulations and ultimately reporting and disclosure.
Risk profile performanceFor credit risk we have a higher risk profile than desired, partly because of COVID-19 and the higher impairment charges that breached our risk appetite limit. The residual risk is still assessed at amber because of the ongoing spreading developments of the COVID-19 pandemic. Therefore, we continued to implement and monitor risk-mitigating activities
– An efficient credit process: DLL pursues a high-quality and efficient credit process. This includes selecting the right business opportunities, with great risk consciousness employed in the front office, efficient processing of credit requests and efficient decision-making.
Credit risk management focuses on making balanced decisions on credit applications based on careful assessments to ensure that credit losses from the resulting portfolio are within agreed boundaries. DLL seeks to control credit risk by building a diversified portfolio from a market segment and geographical perspective and by closely monitoring payment performance. Furthermore, back testing is performed to adjust our risk taking on the actual risk in the portfolio.
To prevent unacceptable credit concentration risk and losses that endanger our financial health, DLL does not want to be significantly exposed to a concentration of credit in a country, industry, single end-user or vendor where a default could have a material adverse effect on DLL’s results.
Non-Performing LoansThe European Banking Authority has issued new regulations regarding NPL management. In March 2022, DLL must comply with the new definition of default (DoD), which explains that an obligor is in default when he is past due more than 90 days on any material credit obligation. With this new interpretation, the EBA wants to harmonize the definition of default and improve consistency in the way European Union (EU) banks apply regulatory requirements to their capital position. This stricter definition could result in an increase in the defaulted portfolio. This new definition could have a material impact on the NPL ratio and therefore the Better our Non-Performing Loans Together (BONT) project has started. Primary focus of this project will be on reducing the effect of the new Definition of Default and the impact to the NPL ratio within the DLL portfolio. A higher ratio will have a negative effect on our future capital requirements and our pricing. Efforts made so far are increasing the knowledge of DLL members of the impact of this new definition via e-learning and a video animation, dashboards have been set up, a governance structure for the project BONT has been put in place and the implementation of the new definition of default in DLL systems has started.
Forward-lookingThe decreasing growth rate of the world economy is expected to continue in 2021. Also, the pandemic crisis is not over yet, and together with uncertainties surrounding global trade extensions, this will impact DLL’s portfolio. As a consequence, the risk appetite limit for the TROIC indicator has been adjusted for 2021 to reflect this adjustment in financial performance with still a fairly high level of credit impairment charges as it is expected that a portion of the customers will move to non-performance during 2021.
Credit risk managementOver 2020 the COVID-19 pandemic has had a major impact on our company and our customers. We provided temporary financial relief to a total of approximately 35,000 customers which relates to in total approximately 80,000 contracts. The total amount of the rescheduled contracts portfolio, per end of December 2020, is EUR 2.7 billion. Towards the end of the year, nearly all holiday periods for the COVID-19 restructured portfolio were expired. The NPL ratio for the COVID-19 restructured portfolio ended at 7.3 percent, while NPL of the total portfolio ended at 3.1 percent, clearly indicating that the COVID-19 restructured portfolio requires proactive management and attention.
DLL pursues a solid risk/return profile at an acceptable cost. DLL wants to achieve this over a long period of time. This allows DLL to maintain long-term relationships and to service our clients through economic cycles, also in adverse economic times. Our current credit policy will remain in place; this entails that DLL focusses on the following goals within its credit risk strategy:– Maintain a credit portfolio within the risk capacity
of the company: in order to limit the impact of bad debt costs on the profitability and reputation of the company, DLL defines a risk appetite that includes early warning levels and risk appetite limits for Key Risk Indicators regarding credit risk.
– Solid risk/reward ratios: to assure a solid risk/return profile, DLL defines return targets, taking into account operational, capital, funding and risk costs.
appetite breaches. We actively monitor these risks and manage these risks down to previously agreed acceptance levels or consciously accept the higher risk profile for a given period of time. The following sections provide further details on the RAS performance per material risk type.
Integrated risk managementDLL actively manages capital requirements through DLL’s risk strategy, risk appetite and balance sheet management to ensure sufficient capital is held to cover contingent capital needs and to meet regulatory requirements. DLL has developed internal capital models to meet the minimum regulatory capital requirements. A prudent approach is applied to all capital requirement models, taking into account model uncertainty.
Stress tests are conducted regularly to determine whether DLL has sufficient financial resources to resist adverse economic scenarios. Over 2020, additional stress tests have been performed with various COVID-19 assumptions to assess the impact on portfolio growth, provision levels, income, operating costs and capital. Core risks are mitigated by DLL’s amply diversified business (both in terms of geographies and industries), as well as by additional vendor support in the form of loss pools and recourse, which lessen both credit and asset risk.
Risk profile performanceFor integrated risk we have a higher risk profile than desired. Total Return on Invested Capital (TROIC) breached the minimum risk appetite requirement as of Q2 2020. The breach is attributable to high credit risk costs resulting from the impact of COVID-19 and related macro-economic circumstances impacting DLL’s portfolio, which caused DLL’s net profit to decrease. Mitigation activities have been taken, however, this indicator is largely influenced by factors outside of DLL’s control, such as the duration of the pandemic and continued lockdowns and the governmental support programs.
| }

Contents ContentsConsolidated financial statements Consolidated financial statementsCompany financial statements Company financial statementsManagement Report Management ReportSupervisory Report Supervisory Report
5554
DLL’s foreign exchange framework is designed to maintain DLL’s ability to minimize its exposure to foreign exchange risk and aims to protect the absolute level of equity, which is aligned with DLL’s objective of delivering stable returns. DLL will always have some FX risk, as DLL has subsidiaries in over 30 countries, and all non-Eurozone subsidiaries will give rise to FX profit and loss results.
DLL selectively manages its FX Translation Risk regarding its Common Equity Tier 1 Capital (CET1) ratio by deliberately taking positions and/or hedges to reduce this risk on a foreign currency basis. With the ratio hedge approach DLL aims for a limited FX Translation Risk impact of exchange rate movements on the DLL CET1 ratio.
Risk profile performance and forward-lookingOver 2020, DLL operated within the defined risk appetite for balance sheet risk. There is currently no reason to revise the risk appetite or to amend the risk appetite framework for balance sheet risk in 2021.
Operational riskOperational risk involves the risk of losses resulting from inadequate or failed internal processes, people and systems or from external events. Since operational risks are an inherent part of day-to-day business activities, they can never be fully mitigated. The size and complexity of our organization permits us to have an overall tolerance for operational risk losses of approximately 3 percent of net budgeted income.
Management of operational risks is performed collectively. DLL’s Operational Risk Policy and Standards define a global and uniform approach to operational risk. Operational risks are actively managed and controlled via our Risk and Control Framework (RCF), which ensures DLL stays within the boundaries defined by DLL’s risk appetite.
The identification and assessment of key risks that could prevent DLL from reaching its strategic goals are the starting point of the risk and control cycle. Identifying and assessing risks structurally improves a forward-looking focus on uncertainty and leads to increased risk awareness. DLL requests from each entity and group department that risks are regularly reviewed and the completeness of the list of risks is confirmed. At least an annual risk assessment has to be performed. For the identified key risks, uniform and consistent key controls are designed and
Risk profile performance and forward-lookingOver 2020, DLL operated within the defined risk appetite for asset risk. Even considering COVID-19, there is currently no reason to revise the risk appetite or to amend the risk appetite framework for asset risk in 2021.
Balance sheet riskDLL’s balance sheet risk management focuses on interest rate, liquidity and foreign exchange (FX) risks. DLL’s balance sheet risk strategy is set in line with two key themes of DLL’s risk strategy: the protection of profit and profit growth while maintaining a solid balance sheet. DLL applies a matched funding policy to reduce its balance sheet risk exposures within its risk appetite. Match funding is done both in terms of liquidity and interest rate risk and is based on the currency and maturity profile. DLL centralizes all significant balance sheet risks at DLL Group Treasury. The balance sheet risk appetite is translated into a set of internal limits for the key underlying risk indicators defining the maximum level of risk DLL is willing to take.
DLL’s liquidity position is consolidated within the Rabobank regulatory returns, and ratios are managed by Rabobank Treasury on a group level. DLL’s risk appetite related to balance sheet risk is limited, as it is Rabobank’s policy to centralize funding and liquidity risks as much as possible. DLL is substantially funded by Rabobank. DLL received a waiver from De Nederlandsche Bank/Dutch Central Bank (DNB) for traditional liquidity indicators (such as Liquidity Coverage Ratio and Net Stable Funding Ratio) on a stand-alone basis. DLL aims for an optimally diversified funding portfolio (in tenors and funding sources) that supports its customers’ activities and a balanced liquidity mismatch within its risk appetite. Concentration in funding sources increases liquidity risk, therefore DLL continues to look at ways to diversify its funding base.
DLL aims to achieve stable earnings from the margin charged to cover credit, asset management and processing, and therefore DLL has limited appetite for interest rate risk. Interest rate exposures are mitigated based on their expected maturity terms (or repricing if shorter) and for the remaining portfolio financial assets on contractual maturity terms (or repricing if shorter). DLL has a policy for the mitigation of interest risk exposures through transacting money market and derivative instruments with Rabobank (when possible).
DLL assumes asset risk as a standard course of its business and seeks to earn a reward for that risk. The general guidance at DLL is to have a varied and diversified portfolio in order to mitigate the risks inherent in an asset-based financing environment and provide a sufficient level of income for assuming this risk. Continued success in asset-based financing activities may result in increased asset risk concentrations that are acknowledged and accepted.
DLL has authorized a strategy to take end-of-term investment positions, Residual Value (RV) in certain assets being financed to meet customer needs and provide additional sources of income. This approach provides “transactional” risk mitigation through an additional product offering that is separate and distinct from traditional “loan” financing. RV risk-taking is governed by the Global Asset and Remarketing Policy and is overseen by the Asset Management & Remarketing Product Overlay (AMR PO) department. Global RV concentration is monitored regularly to assure no concentration in any single Master Asset Type exceeds stated limits in the risk appetite statement. A global residual impairment assessment is executed at least annually to assess if any residual value impairments exist in the portfolio or in returned inventory. Where information allows, quarterly assessments are carried out on inventory levels to assess whether RV impairments are necessary. Regular periodic physical inspections of inventory held for sale at the remarketing premises are performed.
COVID-19Since the start of the pandemic, DLL has assessed the impact on customer behavior, inventory levels and equipment values across countries. Monthly reporting on these focus areas has also been provided to stakeholders across the business. Over the last half of 2020, inventory has trended downward, a testament to the efforts of country remarketing teams in effectively managing both end of lease and defaulted assets. Local remarketing teams have closely monitored assets types in more distressed segments (e.g., transportation) or those that show more difficulty in remarketing (e.g., large construction). The use of additional remarketing channels, like auction, have been implemented to help reduce aging.
to improve the quality of our portfolio. DLL is confident that we have a robust first and second line governance framework in place that allows us to ensure that we remain in control and manage credit risks appropriately.
Forward-lookingThe world economy is showing a decreasing growth rate. This will continue in 2021 as the uncertainties surrounding the COVID-19 pandemic, global trade tensions and Brexit persist. However, with the continued governmental support programs it is expected that the recovery of the economy will take place in 2021, the U.S. earlier than Europe and dependent on the progress on the vaccination program the economy will open up again. This uncertainty might lead to pressure on our portfolio. In addition, we foresee that climate change and sustainability will need continuous attention in the near future. Risks in both areas are expected to increase and might potentially affect the quality of our portfolio.
Asset riskAs a leasing company DLL runs asset risk. Asset risk is the current and prospective risk that the asset value depreciates differently in the market than anticipated, creating a difference between estimated residual value of the assets embedded in lease contracts and the market value of these assets. DLL wants to minimize residual value impairments on the portfolio of leased assets. Limits have been set in the risk appetite statement to manage asset risk in relation to residual value concentrations and inventory aging.
| }

Contents ContentsConsolidated financial statements Consolidated financial statementsCompany financial statements Company financial statementsManagement Report Management ReportSupervisory Report Supervisory Report
5756
Compliance
IntroductionDLL is a financial institution headquartered in the Netherlands, and therefore bound by Dutch and European laws and regulations. Where there is a local legal requirement that prevents local compliance with (parts of) this Policy and/or there is a higher standard that must be applied locally these local stricter rules prevail. Compliance takes into account applicable principles, guidelines and other regulatory requirements (e.g. Wft, Wwft, BCBS, CRDIV, EBA, GDPR).
DLL is firmly committed to conducting business with integrity and in compliance with the letter and the spirit of the law and other generally accepted rules and standards of business conduct of the countries and communities in which we operate. Acting responsibly and professionally will enable us to build a rock-solid company and contribute to the welfare and prosperity of our customers and the society we live in, and thus help us in “partnering for a better world.” As a minimum requirement, being compliant with relevant laws and regulations is always of the utmost importance and is expected by our customers and society.
The mission of the Compliance Function is to contribute to the trust that stakeholders and society in general have in DLL by promoting the integrity of all aspects of DLL and its members, especially through embedding good conduct, acting as a second line of defense and partnering with the business.
Compliance risk is defined as: The risk of impairment of DLL’s integrity due to unlawful, unethical or inappropriate conduct. Such conduct can damage the rights and interest of our customers as well as the reputation of DLL, leading to legal or regulatory sanctions and/or financial loss.
Unlawful, unethical or inappropriate conduct in the definition of Compliance Risk involves the failure to comply with DLL’s internal standards, rules or codes as well as applicable laws and regulations or external codes applicable to the activities of DLL. In addition, it includes acting beyond the boundaries of what is considered morally or socially acceptable according to universal standards or acting with lack of dignity and respect towards our stakeholders, even in the case that such conduct is not formally prohibited.
implemented. Risk and control activities are used by management throughout DLL to help ensure that policies, standards, procedures and systems, and the controls they contain, operate as designed and transactions are processed timely, completely and correctly in an ascertainable way.
Risk and control monitoring is performed to ascertain that risks are within the set risk appetite, (key) controls are in place and effective design and operational effectiveness and Key Risk Indicators (KRIs) and Key Control Indicators (KCIs) are within agreed thresholds. In case of breaches, appropriate actions have to be taken to solve the deficiencies, which are being monitored via the three lines of responsibilities.
Risk profile performance and forward-lookingDLL was able to stay within its risk appetite limits for operational risk, both quantitatively and qualitatively over 2020. However, some early warning limits were breached. These related to number of process execution failures, number of outsourced functions not meeting internal or external requirements and the number of overdue audit findings. When also considering the increased operational risk due to the COVID-19 pandemic, such as an expected increase in Sale out of Trust incidents and increased cybercrime activity, although these did not materialize yet for DLL, the overall operational risk profile over 2020 is assessed as amber.
In 2021, activities will continue to further improve and strengthen our RCF, for example via maturity assessments, regional in control meetings and further imbedding the RCF within the first line of responsibility. Furthermore, emphasis will be put on cybercrime and outsourcing and on completion of the Segregation of Duties project to further mitigate operational risks in these areas. Besides focusing on current operational risks, we are working to identify emerging risks to be able to take steps to face these risks up-front to reduce and mitigate them.
Within DLL the Compliance risks have been divided into 11 Compliance themes:
Compliance theme DescriptionTreating customers fairly Impairment of integrity as a result of insufficiently addressing customer characteristics
and interests when developing and providing products and services. As a consequence, the customer may not receive suitable services and may experience unfair treatment.
Fraud Impairment of integrity as a result of an act of deception/dishonesty intended for personal gain or to cause a loss or a gain to another party.
Conflicts of interest Impairment of integrity as a result of competing interests. Acting in the interest of one party can entail the (apparent/partial) inability to act in the interest of the other party (parties).
Corruption Impairment of integrity as a result of the abuse of entrusted power for private or company gain, including but not limited to bribery.
Money laundering1 Impairment of integrity as a result of involvement in money laundering (knowingly or unknowingly) by DLL, its customers (such as vendors, dealers and end-users) or members, defined as the process whereby the proceeds of a crime are transformed into seemingly legitimate money or other assets.
Terrorism financing Impairment of integrity as a result of DLL involvement (knowingly or unknowingly) in terrorist financing, defined as the financing of terrorist acts and of terrorist organizations.
Breach of sanctions Impairment of integrity as a result of the violation of financial or economic sanctions regulations. Sanctions are political instruments in the foreign and security policy of the United Nations, the European Union, the United States of America and other individual countries and jurisdictions, such as the Netherlands and the United Kingdom.
Market inefficiency and misconduct Impairment of integrity as a result of (including but not limited to):– An inadequate quality of trading execution processes (e.g., non-compliance with
transaction reporting requirements, insufficient quality of (electronic) trading of financial instruments and of market infrastructure)
– Unlawful proprietary trading– Market abuse (e.g., insider dealing/trading, unlawful disclosure of inside information and
market manipulation)
Breach of data privacy Impairment of integrity as a result of unlawful or careless processing of personal data of customers, members and other individuals.
Record keeping Impairment of integrity as a result of noncompliance with record keeping requirements due to inadequate retention, disposal, retrieval and the secure storage of records
Competition Impairment of integrity by communicating or conducting collusion2 with our competitors or aiding customers in colluding with the competitors in their business segment
1 The themes Money Laundering, Terrorism Financing and Breach of Sanctions are also referred to as CAMS.
2 Collusion: secret or illegal cooperation or conspiracy, especially in order to cheat or deceive others.
In order to obtain insight into the extent to which the risks mentioned above manifest themselves in DLL’s day-to-day activities. These risks and controls, are documented and assessed as part of Compliance Risk management, by e.g., conducting the Systematic Integrity Risk Analysis.
Compliance FunctionAs part of the second line of defense, the Compliance Function acts as a partner to the business in enabling DLL to achieve its strategic goals in a compliant manner. The Compliance Function supports management in its responsibility to become and remain compliant with regard to the external and internal rules related to the Compliance themes specified before. The Compliance Function also aims to maximize adherence to the Code of Conduct in the context of Compliance Risk.
The Compliance Function helps DLL and its members, customers and business partners to “do the right thing” following principles such as:– Compliance starts at the top.– Management is the “owner” of compliance.– Compliance requires each employee to pay
attention and behave in a compliant manner.– An effective Compliance Function exists at
all levels.– Adherence to global Code of Conduct and
compliance policies is necessary.
The Compliance Function has a global mandate and none of DLL’s activities or entities, nor the activities of branches, subsidiaries, joint ventures or outsourced activities, are excluded from Compliance’s scope of review or inquiry.
| }

Contents ContentsConsolidated financial statements Consolidated financial statementsCompany financial statements Company financial statementsManagement Report Management ReportSupervisory Report Supervisory Report
5958
the Supervisory Board) are informed immediately. The same applies for Rabobank Compliance and, when appropriate, the regulator.
The DLL Compliance Monitoring Framework sets forth a consistent risk-based approach to the monitoring activities of DLL with respect to compliance-related processes, controls and the reporting of the results of such activities. Compliance Monitoring is an integral part of the DLL Compliance Program.
Global Code of Conduct & PoliciesMembers on all levels are responsible for meeting compliance requirements as stated in the Global Code of Conduct and the compliance policies, standard and procedure that can be found in the Policy House Portal. Management is held accountable at a higher level for such adherence, for themselves and those under their direction, and must set an example to the members in their actions and behavior.
Global Code of ConductDLL strives for an open and encouraging culture, where employees can report alleged violations of the Global Code of Conduct or suspicions regarding incidents affecting the integrity of DLL. Furthermore, DLL has implemented a whistle-blowing mechanism. This provides employees the possibility to use an alternative channel (next to their standard hierarchical reporting line) for reporting suspected irregularities.
PoliciesGlobal compliance policies have been drafted and implemented within DLL. DLL’s management is responsible for implementation of the policies and monitoring of adherence to the policies. Main policies are implemented in the field of Financial and Economic Crime in order to provide global principles to ensure that DLL engages in relationships with reputable business partners and customers and mitigates potential corruption, anti-money laundering and fraud risk and to ensure compliance with sanctions regulations. Related to Conduct, policies have been implemented to ensure that DLL and its members avoid conflicts of interest; treat customers, customer information and other (personal) data confidential and with due care; set guidelines for disclosure and transparency and prevention of insider trading activities by DLL members; and offer DLL members (external) channels to report suspected irregularities.
Training and awareness regarding the updated Code of Conduct and annual attestation regarding Gift and Entertainment, Conflicts of Interest and Outside Business Activities have been provided to all DLL members and is actively monitored by improved tooling.
Responsibilities of the Compliance FunctionThe Compliance Target Operating Model defines the specific requirements for the Compliance Framework of the Compliance Function in more detail. The Target Operating Model is one of the building blocks of an effective approach to manage Compliance Risk and links with documents such as the Compliance Charter, policies and procedures, reports and plans.
Compliance reportingBased on DLL’s strategy, annual plan and a compliance risk analysis, a Group Annual compliance plan and regional and local plans are prepared. These plans reflect local and global compliance initiatives within DLL. This plan is approved by the DLL Executive Board and presented to the Supervisory Board. The Global Compliance Plan is reflected as well in the country and regional compliance plans. On a quarterly basis Group Compliance updates the Executive and Supervisory Board on the progress made on execution of the annual plan as well as other relevant matters.
On a global, region and country level, annual compliance plans are drafted. These plans reflect local and global compliance initiatives within DLL. The Executive Board, the Region Manager and the respective Country Manager review and approve these plans. The Global Compliance Plan is reflected in the country and regional compliance plans. The Global Compliance Plan is also presented to DLL’s Audit Committee.
The plans are based on DLL’s mid-term and annual plan, compliance risk analysis, information from the compliance network and an ongoing overview of relevant compliance topics aligned with DLL’s activities. They include the plans for policy and procedures setting, awareness, consultancy activities and monitoring.
In case of matters of high importance, such as major incidents, the HGC will ensure that the Executive Board (and through the CEO the Chair of
IndependenceThe Compliance Function must be able to perform its responsibilities without undue influence and based on its own initiative and professional judgment. The Compliance Function shall be independent from the business and administrative or control functions therefore Compliance Officers are not authorized to assume commercial or operational activities in their area of control.
The Head of Group Compliance (HGC) reports primary to DLL’s Chief Executive Officer (CEO) and is accountable to the Executive Board and the Supervisory Board of DLL, having an escalation line to both. The HGC also reports secondary to the Rabobank Chief Compliance Officer. The HGC meets with the chair of the Supervisory Board periodically, but at least twice a year.
The Corporate Compliance organization is positioned directly under the HGC consisting of 4 departments resp. Core, CAMS, Privacy and Conduct closely working together with the Regional and Local Compliance organization.
In order to safeguard the independent position of the Compliance Function, the Regional Chief Compliance Officers have a primary reporting line to the Regional Managers and a secondary reporting line to the HGC. The Country Compliance Officers have a primary reporting line to the Country Managers and a secondary reporting line to Regional Chief Compliance Officers.
Compliance activities
AMLIn terms of Wwft Compliance, DLL has introduced the CARE Program early 2018 with the purpose to further implement Dutch Anti-Money Laundering (AML)/Combating the Financing of Terrorism (CTF) requirements globally. In 2020, the CARE program has successfully transferred its deliverables and responsibilities to the first line, and further progress in the business-as-usual processes and remaining
projects is being monitored by a newly established CAMS Committee and the DLL Executive Board. More specifically in the U.S. and Canada, we executed a UBO implementation project assuring further alignment between the U.S. and Canadian local regulatory requirements and Wwft requirements.
The framework for Customer Due Diligence, Anti-Money Laundering, Terrorist Financing, and Sanctions (CAMS) is largely in place. Focus in 2020 has been on quality of the customer files, data remediation and transaction monitoring. Beside this, a new training and awareness program has been launched. Furthermore, we have progressed in the rollout of our Customer Due Diligence (CDD) system (ROCK), in which new and existing clients are being risk rated and (re)screened for the latest Sanctions, Political Exposed Persons (PEP) and other watch lists.
PrivacyAt corporate level in 2020 the Compliance Function has established and operates a three-pronged approach to privacy and data protection across DLL – oversight via a Privacy Committee, a Global Privacy Office and a Global Privacy Program. The Global Privacy Office, amongst other things, offers advisory, raises awareness, provides training and investigates data incidents. In addition, and in support of developing DLL’s maturity in this area a Global Privacy Program is in progress. The program will deliver better knowledge and understanding about obligations to data subjects (our members and customers), a risk-based approach when processing personal data and a solid foundation of policies, standards, procedures and guidelines for the business.
ConductOver the course of 2020, the Compliance Function has updated the compliance policy framework in the conduct area (e.g., Conflicts of Interest, market Abuse, Anti-Bribery and Corruption) and aligned it with the Rabobank policy framework. Focus in 2021 will be on implementation, training and awareness, and advisory services.
| }
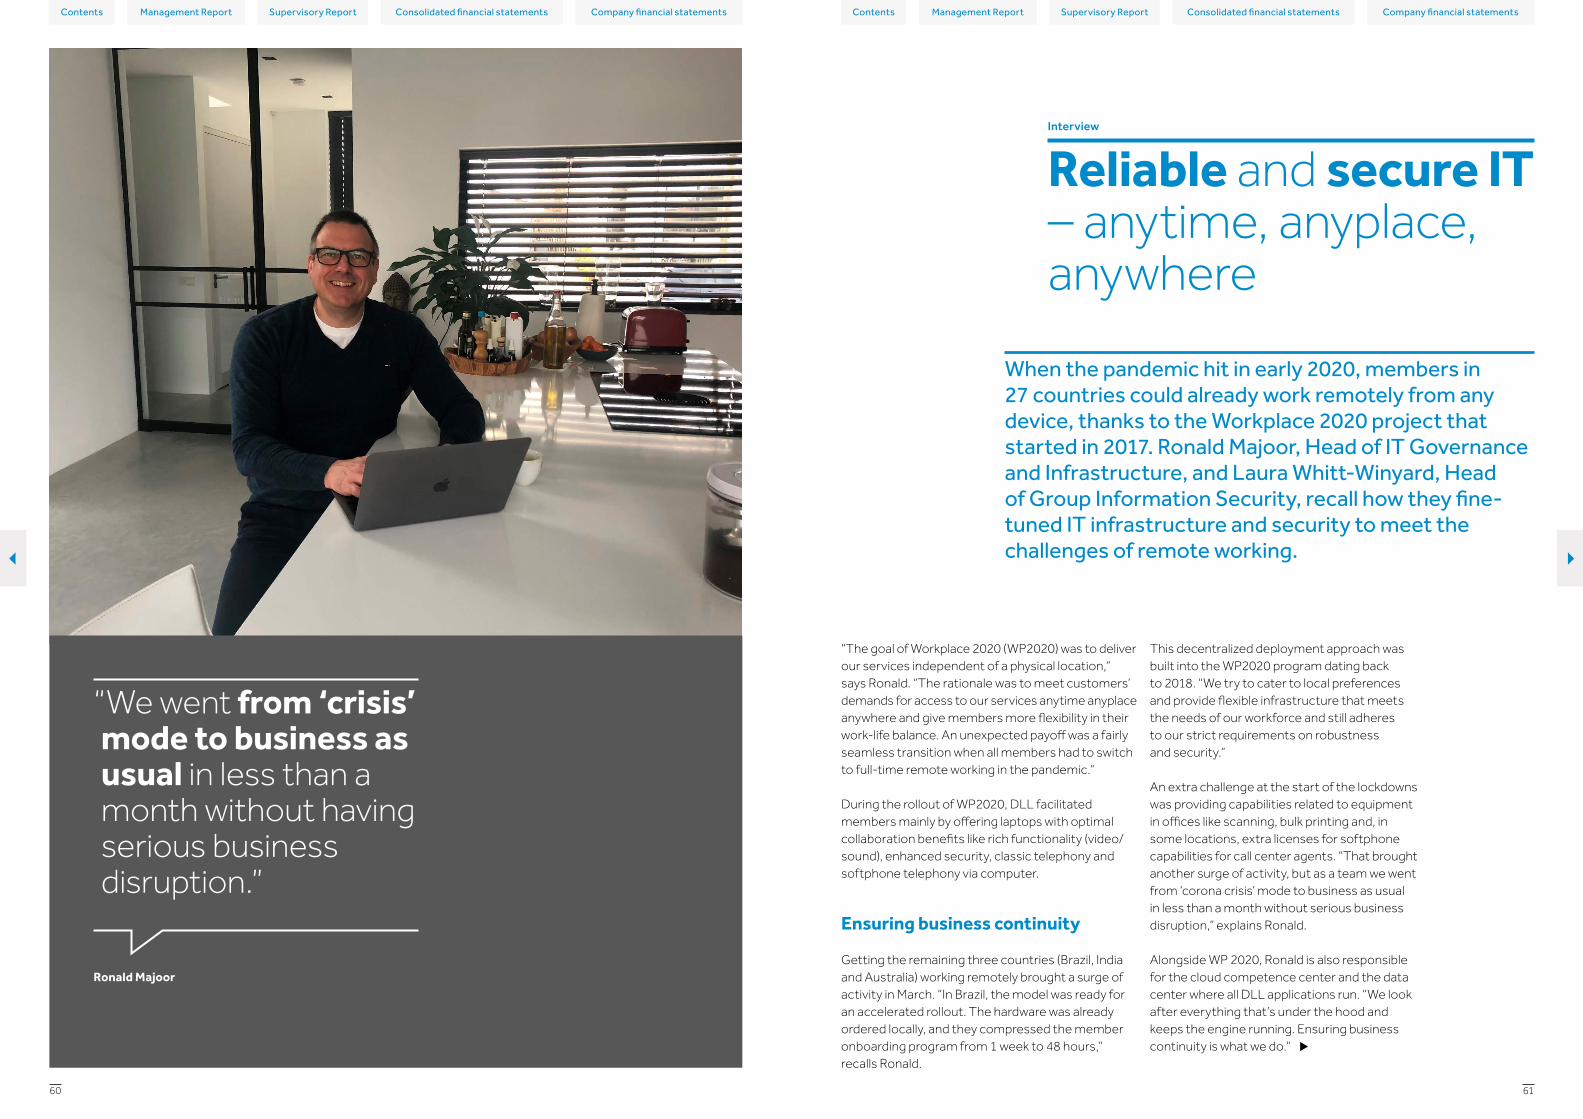
Contents ContentsConsolidated financial statements Consolidated financial statementsCompany financial statements Company financial statementsManagement Report Management ReportSupervisory Report Supervisory Report
6160
Reliable and secure IT – anytime, anyplace, anywhere
When the pandemic hit in early 2020, members in 27 countries could already work remotely from any device, thanks to the Workplace 2020 project that started in 2017. Ronald Majoor, Head of IT Governance and Infrastructure, and Laura Whitt-Winyard, Head of Group Information Security, recall how they fine-tuned IT infrastructure and security to meet the challenges of remote working.
“We went from ‘crisis’ mode to business as usual in less than a month without having serious business disruption.”
“The goal of Workplace 2020 (WP2020) was to deliver our services independent of a physical location,” says Ronald. “The rationale was to meet customers’ demands for access to our services anytime anyplace anywhere and give members more flexibility in their work-life balance. An unexpected payoff was a fairly seamless transition when all members had to switch to full-time remote working in the pandemic.”
During the rollout of WP2020, DLL facilitated members mainly by offering laptops with optimal collaboration benefits like rich functionality (video/sound), enhanced security, classic telephony and softphone telephony via computer.
Ensuring business continuity
Getting the remaining three countries (Brazil, India and Australia) working remotely brought a surge of activity in March. “In Brazil, the model was ready for an accelerated rollout. The hardware was already ordered locally, and they compressed the member onboarding program from 1 week to 48 hours,” recalls Ronald.
This decentralized deployment approach was built into the WP2020 program dating back to 2018. “We try to cater to local preferences and provide flexible infrastructure that meets the needs of our workforce and still adheres to our strict requirements on robustness and security.”
An extra challenge at the start of the lockdowns was providing capabilities related to equipment in offices like scanning, bulk printing and, in some locations, extra licenses for softphone capabilities for call center agents. “That brought another surge of activity, but as a team we went from ‘corona crisis’ mode to business as usual in less than a month without serious business disruption,” explains Ronald.
Alongside WP 2020, Ronald is also responsible for the cloud competence center and the data center where all DLL applications run. “We look after everything that’s under the hood and keeps the engine running. Ensuring business continuity is what we do.”
Ronald Majoor
Interview
| }

Contents ContentsConsolidated financial statements Consolidated financial statementsCompany financial statements Company financial statementsManagement Report Management ReportSupervisory Report Supervisory Report
6362
Remote working and a security mindsetWhile Ronald’s team helped to keep the hardware and applications running, Laura Whitt-Winyard and her Group Information Security team focused on a secure transition to home working.
Many DLL members suddenly found themselves working at the kitchen table alongside their partners, juggling home schooling and dealing with customers in distress. Laura recalls, “Initially we saw some people still figuring out how to do things, for instance, sending work to their personal email account to print off their home computer, which doesn’t always have the tighter security configuration of the DLL mail accounts and devices.”
Fortunately, the 2019 collaboration between Laura’s and Ronald’s teams on conditional access immediately proved its value in the crisis. “Conditional access means that if, for any reason, people work from a non-DLL device, they cannot do certain things in Office 365 applications, because we can’t guarantee the security of that device. You can read your emails, and you can reply, but you can’t send attachments or anything that would run the risk of exfiltrating data,” explains Laura.
In 2020 Group Information Security also implemented a Data Loss Prevention (DLP) solution to ensure that no data accidentally leaves the company. “DLL policy is that we don’t conduct business processes in email. Through the DLP exercise, we alerted members to more secure ways of exchanging data such as Application Programming Interface or a secure transfer protocol.”
Phishing awareness campaigns
In 2020, there was a 20 percent increase worldwide in phishing websites and phishing campaigns, particularly on themes relating to human resources, wellness, health benefits and COVID-19 shots − all playing to people’s vulnerabilities in a crisis.
Laura’s team immediately boosted its phishing awareness campaigns and published security tips for working remotely. Local communications teams shared these with members via various online and mobile channels and DLL leaders were encouraged to put security on the agenda in their team sessions and management meetings.
Says Laura, “Our main message is ‘If you delete a phishing email it helps you. But if you report a phishing mail it helps everyone.’ When somebody reports a phishing mail early, it gives us the opportunity to pull phishing emails back from people who hadn’t opened it already. And we can do some analytics and trending to see how many other people were exposed.”
Overall, there was a 27 percent increase in DLL member reports of phishing websites or campaigns. “Around June/July we noticed that people had settled into the groove of working from home and were much more security-conscious.”
Laura Whitt-Winyard
“If you delete a phishing email it helps you; if you report a phishing email it helps everyone.”
Our strong foundation
The “new normal”
Looking ahead, DLL is rolling out pilots in Sweden, Brazil and the Netherlands for the “new normal” of returning to the office. “The idea is that you meet co-workers in collaborative spaces at certain times, for projects where you need to brainstorm or work together on challenging things,” says Ronald. “To
do more routine work like processing emails you will still work from home, or at any place, if you prefer. If members stay security-conscious and work with DLL software on DLL devices, they can keep working anytime, anyplace, anywhere.”
| }

Contents ContentsConsolidated financial statements Consolidated financial statementsCompany financial statements Company financial statementsManagement Report Management ReportSupervisory Report Supervisory Report
6564
of the cases as laid down in the Rabobank Group Remuneration Policy. In 2020, no claw back was applied to any variable remuneration.
In addition to the measures mentioned above, the following general prohibitions also apply:– Personal hedging strategies are not permitted,
under any circumstances whatsoever.– A severance payment must reflect the quality of
an employee’s performance. We do not reward employees for failure or misconduct.
Identified StaffEmployees who can have a significant impact on DLL’s risk profile are designated as “Identified Staff.” In 2020, 47 roles within DLL were determined to be Identified Staff (excluding Supervisory Board members). In general, these members are not eligible for variable remuneration. In exceptional cases where they are eligible, their incentive is governed by the principles laid down in the Rabobank Group Remuneration Policy. The most important of these risk-mitigating measures are discussed below. As is the case for all other employees, Identified Staff must meet a proper balance of performance objectives. Identified Staff are specifically subject to performance measurements at Group, business unit and individual levels.
Supervisory Board
Fee structureDuring 2020, the Supervisory Board consisted of four members. From these four members, two external Supervisory Board members receive direct compensation from DLL based on board responsibilities. The other two Supervisory Board members are employed by Rabobank where the fee of the Supervisory Board activities is included in the remuneration received from Rabobank in their capacity as Rabobank employees. The total amount of remuneration for the external Supervisory Board members in 2020 was EUR 216 thousand (2019: EUR 183 thousand).
Wherever variable remuneration applies, a maximum is imposed. In the Netherlands, variable remuneration is capped to 20 percent of an employee’s fixed income. Outside of the Netherlands, the level of the fixed income, variable pay and benefits are based on the local market of the respective country. Variable remuneration is typically awarded based on a balanced mix of qualitative and quantitative objectives and cannot be higher than 100 percent of an employee’s fixed salary. DLL’s performance objectives are focused on achieving results, bringing our core values into practice and the personal development of employees. DLL’s objectives do not contain targets that encourage behavior that is not in the best interest of our vendor partners and/or their end-user customers.
Ex-ante testOn an annual basis, the Executive Board of DLL and the Managing Board of Rabobank validate whether payment of the proposed variable remuneration is justified, based on Rabobank Group’s qualifying capital and solvency ratio. This “ex-ante” test centers on the question of whether DLL and/or Rabobank can make the payments without any resulting financial problems. Subsequently, the test is submitted for approval to the Supervisory Boards of both DLL and the Rabobank Group.
Claw backIn exceptional circumstances, the Managing Board of Rabobank can withdraw an awarded sum with retroactive effect. This is referred to as “claw back.” Rabobank Group is authorized to reclaim all or a portion of variable remuneration from both employees and former employees in any
Rabobank Group Remuneration PolicyThe principles and guidelines of Rabobank’s vision on remuneration are detailed in the Rabobank Group Remuneration Policy. The requirements under external legislation and regulations are also enshrined in this policy, including the Dutch Financial Undertakings Remuneration Policy Act (Wbfo), the Regulations on Restrained Remuneration Policies, the Capital Requirements Directive IV (CRD IV) and the Dutch Banking Code. The Rabobank Group Remuneration Policy applies to the Rabobank Group as a whole, including DLL. Consequently, we follow this policy consistently. The policy supports solid and effective risk management processes and discourages employees from taking undesirable risks. It also encourages employees to consider the longer-term impact in the interests of both Rabobank Group and its clients.
Variable remunerationIn 2020, EUR 45 million (2019: EUR 49 million) of the total remuneration was variable for all DLL entities. The risk-controlling measures below apply to employees with variable remuneration. The variable remuneration is capped for all roles in all countries, and DLL does not grant guaranteed variable remuneration. The annual performance appraisal and remuneration cycle support acting in the interest of our long-term continuity and financial strength.
Remuneration policyWithin the framework of our parent’s vision on remuneration and Rabobank Group Remuneration Policy, we have our own global DLL remuneration policy. This policy is designed to promote fair and consistent employee compensation based on an effective job classification system. While the Global Remuneration Policy (GRP) applies to all DLL entities worldwide, minor differences may apply per country. This relates to the application of local legislation, national collective labor agreements or local labor market practices. Furthermore, the salary and incentive levels are country specific, aligned with local labor markets. In all countries we have implemented a remuneration package that consists of fixed and variable remuneration components and various fringe benefits. In many countries we have implemented a pension scheme.
The remuneration packages for the Executive Board are subject to review and approval by the Supervisory Board.
Remuneration
DLL seeks to hire the best talent in each local market and therefore aims to provide a remuneration package that is market competitive and in line with responsibilities and performance. Furthermore, the remuneration policy is aimed at encouraging behavior in line with our core values, global alignment, cooperation and personal development.
| }

Contents ContentsConsolidated financial statements Consolidated financial statementsCompany financial statements Company financial statementsManagement Report Management ReportSupervisory Report Supervisory Report
6766
In the U.S., the members of the Executive Board do not participate in a pension scheme but are eligible for the DLL 401K match. Additionally, they receive fixed compensation from the Supplemental Executive Retirement Plan.
Fringe benefitsMembers of the Executive Board are eligible for a package of fringe benefits in line with market standards.
Severance paymentsDLL complies with all existing laws and regulations concerning severance payment levels, meaning that Executive Board members would receive a maximum of one year’s salary. No Executive Board member received a severance payment in either 2019 or 2020.
Executive Board remunerationIn 2020, the remuneration of members of the Executive Board totaled EUR 3,954 thousand (2019: 4,039 thousand). One member of the Executive Board is the only individual who received total remuneration above EUR 1 million (2019: one member).
In total, there were 3,263 DRNs outstanding with the members of the Executive Board at year-end 2020 (2019: 6,256) related to variable remuneration granted prior to 2016. Refer to note 2.4 of the consolidated financial statements on more information on DRNs.
Executive Board
Remuneration packageThe primary remuneration package for the members of the Executive Board consists of fixed pay and pension entitlements. Additionally, Executive Board members receive fringe benefits in line with market practice. Executive Board members were no longer eligible for variable remuneration as of 2016.
PensionIn the Netherlands, the Rabobank pension scheme applies to members of the Executive Board and qualifies as a collective defined contribution scheme. As of January 1, 2020, the maximum income on which the Executive Board may accrue pension is EUR 104,123. Any income exceeding this amount is not pensionable. In line with local practice and to compensate for the pension cap, the members of the Executive Board receive an individual supplemental retirement allowance.
Management structure
DLL has a two-tier board structure consisting of an Executive Board and a Supervisory Board. Several subsidiaries have supervisory boards in place, with mainly DLL executive or senior managers being members of such boards.
Executive BoardThrough our governance framework and group management structure, the Executive Board oversees the strategic and other important decisions and actions to be taken throughout our organization.
The Executive Board is responsible for strategy setting and steering and managing the company, in line with the articles of association and the Executive Board Charter. The Executive Board consists of five members who are appointed and dismissed by the general meeting of shareholders. As a collective board, the Executive Board is responsible for creating and maintaining a sound balance of the long- and short-term interests of all stakeholders in the company, including customers, shareholders, employees, regulators and the communities in which we operate. Certain strategic and key actions or decisions to be taken require formal approval of the Executive Board. For more information about the Executive Board members, see Chapter 1 of this Management Report.
Supervisory BoardOur Supervisory Board oversees the management by the Executive Board and the general conduct of business. The Supervisory Board also monitors compliance with the law, the articles of association and other relevant rules and regulations. Key decisions of the Executive Board, including decisions on the strategy, annual plans and related budgets, are subject to the approval of the Supervisory Board.
Corporate structure
DLLDLL is structured as a matrix organization, consisting of global business units and regional organizations executing on the partnerships with our vendor partners. The majority of DLL’s group functions are located at our headquarters in Eindhoven, the Netherlands, which provides coordination and support to the country organizations and business units. Furthermore, group functions are responsible for DLL’s global strategic development and setting and monitoring DLL’s risk control framework.
The foundation of our organizational group structure is captured in our corporate governance framework, which supports us in achieving our objectives. De Lage Landen International B.V. is DLL’s holding company and has a banking license established under the laws of the Netherlands. The company is located and has its statutory seat in Eindhoven. DLL has subsidiaries and branch offices in more than 30 countries on most continents.
Since DLL has a Dutch banking license, our governance includes a Supervisory Board, as required by the Dutch Financial Supervision Act.
Shareholder RabobankDLL is a wholly owned subsidiary of Coöperatieve Rabobank U.A. (Rabobank), a Dutch bank headquartered in Utrecht. Rabobank has issued a so-called 403-statement in respect of DLL and certain of its Dutch subsidiaries, assuming liability for the debts arising from legal transactions of these entities. DLL’s financial information is fully consolidated into Rabobank’s consolidated financial statements. Certain key decisions and decisions not in the ordinary course of business are subject to the approval of Rabobank in its position as shareholder.
Corporate governance
| }

Contents ContentsConsolidated financial statements Consolidated financial statementsCompany financial statements Company financial statementsManagement Report Management ReportSupervisory Report Supervisory Report
6968
– Business Principles Committee (CEO)The Business Principles Committee (BPC) is authorized to address all (potential) ethical dilemmas in dealing with DLL business partners, customers and members when there is no clear previously defined policy and may refer matters for further discussion and decision-making to other bodies within DLL. This implies final decision-making on such matters, unless there is a deemed material impact on DLL in which event the case is submitted with a recommendation by the BPC for a decision by the DLL Executive Board.
The BPC functions as DLL’s ethics committee and advises the Executive Board on “what DLL stands for.” It acts as a sounding board to test company policies and decisions against internal and external standards of (business) behavior. The committee monitors ethical trends and developments in society.
– Internal Audit Committee (CEO)The Internal Audit Committee assists the Executive Board in the oversight of integrity of the company’s financial statements; the effectiveness of governance, risk management and control processes; compliance with legal and regulatory requirements and the Global Code of Conduct; and the performance of our internal audit function and the optimization of collaboration between internal audit and external audit with the aim of providing assurance at optimal costs.
– Executive Inclusion Council (CEO)The Executive Inclusion Council provides guidance and strategic counsel to the Global Chief Diversity Officer relating to the adoption and execution of DLL’s Diversity, Equity and Inclusion (DE&I) strategy and objectives. The Council is made up of senior leaders, with a mix of representation across identity, gender and regional presence who act as visible champions in support of the company’s DE&I goals. The Council approves the DE&I strategy and objectives each year and approves edits to the Global Diversity & Inclusion Policy.
The Supervisory Board consists of four members who are appointed and dismissed by the general meeting of shareholders. The composition of the Supervisory Board reflects the fact that we are a subsidiary of Rabobank: two of its members are shareholder representatives.
The roles and responsibilities of the Supervisory Board are set out in the Supervisory Board Charter. The Supervisory Board report includes more information about the (members of the) Supervisory Board and its supervision in 2020.
Global committeesDLL has several (permanent) global committees in place, with membership of executive and/or senior DLL managers. The committees receive their mandate from the Executive Board and are mostly chaired by an Executive Board member. The following describes the main responsibilities of the global committees, with the function that is the committee’s chair in parentheses:
– Leadership Development Committee (CEO)The Leadership Development Committee is mandated to make decisions around key positions in the areas of succession planning, appointments, terminations and remuneration for Identified Staff and other key positions within DLL, subject to regulatory approvals where required. Furthermore, it reviews and approves requests for international expatriate assignments of DLL employees. The Committee also approves Global Leadership Development Programs, Policies and Practices, International Trainee Programs and all exceptions to the Group Remuneration Policy, based on an advice of the DLL Monitoring Committee and subject to final Supervisory Board and/or Rabobank approval in certain cases.
– Global Risk Committee (CRO)The Global Risk Committee is the risk management committee that establishes and amends the risk management framework and the risk management policies and risk limits for DLL within its authority. It oversees the implementation of the risk management framework and is the ultimate arbiter on the assessment of risks and acts as the guardian of the risks taken by DLL. Furthermore, it conducts or authorizes any investigations into any matter within its scope of responsibilities.
– Regulatory Oversight Committee (CRO)This Regulatory Oversight Committee monitors and oversees changes in the global regulatory environment affecting our organization. The committee is responsible for the regulatory tracking, the internal allocation and the high-level monitoring of the implementation and embedding of these changes.
– Global Credit Committee (CRO)The Global Credit Committee is the highest credit authority within DLL for credit requests subject to the credit application process. For requests exceeding our maximum approval authority, the committee will formulate a positive recommendation for approval to DLL’s shareholder Rabobank. The committee decides on all credit elements presented and may give instructions in the context of credit risk management and strategic direction in the client relationship development as far as this relates to the credit appetite and pricing (risk/reward).
– Asset and Liability Committee (CFO)The Asset and Liability Committee is a risk management committee and has the responsibility to support the Executive Board in optimizing Asset and Liability Management (ALM) risks within the risk appetite statement set by the GRC and in line with our strategic direction; it is the forum for group-wide ALM issues. Furthermore, it is accountable for active optimization of funding and liquidity risks, interest rate risks, translation risks and treasury investments; it reviews the balance sheet in order to balance risk and returns tradeoffs; and it is the accountable body for evaluation of all systems for ALM and Funds Transfer Pricing mechanism. It evaluates other potential drivers of earnings volatility and optimization and defines hedging strategies against relevant risks.
– Data Governance Board (CFO)The Data Governance Board (DGB) exercises group-wide authority and control over the management of data, with the following goals:– Define, approve and communicate data
strategies, data policies, data standards, data architecture, procedures and metrics;
– Track and enforce regulatory compliance and conformance to data policies, standards, architecture and procedures;
– Initiate, track and oversee the delivery of data management projects and services;
– Manage the resolution of data-related issues; and– Understand and promote the value of
data assets.
– Finance Governance Committee (CFO)The main responsibilities of the Finance Governance Committee are: (1) to set and recommend for approval policies and instructions for Accounting, Reporting, Financial Control, Tax, Procurement and Supplier Management, Business Travel and Expense and Treasury-related matters; (2) to review and provide sign-off on matters within the area of responsibility of DLL Finance for which the Executive Board needs to provide approval; and (3) to review and approve independent external audit-related matters.
– Pricing Review Committee (CFO)The Pricing Review Committee (PRC) ensures that the Global Pricing Guidelines and Procedures are fully adhered to and agrees upon ongoing refinements and improvements thereto. It focuses on the pricing of large-ticket deals and provides governance mechanisms, particularly for those deals that are below agreed profitability hurdle rates.
– Compliance Anti-Money Laundering & Sanctions Committee (COO)
The Compliance Anti-Money Laundering & Sanctions (CAMS) Committee is established for oversight on group-wide CAMS activities and to take necessary action when deemed necessary. The CAMS Committee oversees the execution of DLL’s CAMS policies and standards. In this capacity the CAMS committee is authorized to issue binding directions. Its responsibilities include overseeing a properly functioning CAMS risk control framework and compliance with relevant legal and regulatory requirements and overseeing the execution of remediation plans to address CAMS-related deficiencies identified by the organization itself, regulators, Internal Audit, or other stakeholders.
| }

Contents ContentsConsolidated financial statements Consolidated financial statementsCompany financial statements Company financial statementsManagement Report Management ReportSupervisory Report Supervisory Report
7170
Diversity, Equity and Inclusion
DLL’s commitment to Diversity, Equity and Inclusion (DE&I) extends above and beyond ethical and performance issues, and instead is held as a strategic priority. Even as 2020 moved our workforce almost entirely virtual, our commitment across the globe to diversifying our organization has never been stronger. After hiring our new Chief Diversity & Inclusion Officer in late 2020, the Executive Inclusion Council approved our new 5-Year DE&I focus:
Our DE&I focus areas:– Amplify voices – Attract, hire, support and
elevate underrepresented members to learn and benefit from diverse perspectives and stimulate new ideas.
– Create allyship – Encourage members to actively promote and advance a culture of inclusion and equity through positive and conscious efforts that benefit all members.
– Build inclusive leaders – Equip leaders with the tools to recognize unconscious bias, understand born advantages and build diverse, innovative and inclusive teams.
– Grow the business – Ensure our business activities are inclusive and represent a broad base of dealers and customers, including DLL’s own procurement of inclusive products and services.
– Strengthen our communities – Support the communities where DLL operates through community outreach, volunteerism and corporate social responsibility initiatives.
These focus areas will take us through our current DLL strategy to become a global employer of choice and drive diversity & inclusion.
In 2020, we continued building a culture of allyship and accountability across our footprint with the Allies for Inclusion initiative. At the highest level, we define allyship as a commitment to learning (and unlearning) how to achieve equity and inclusion that is distributed throughout the structures and workforce of the organization. We pressed forward in our efforts, with some countries reaching 100 percent certification.
DLL has launched several initiatives to further improve diversity and inclusion, especially aimed at leadership positions. On the enterprise level, our Executive Inclusion Council (EIC) continued its momentum reviewing metrics and addressing
Regulatory framework and supervisionDe Lage Landen International B.V., DLL’s holding company, holds a Dutch banking license pursuant to the Dutch Financial Supervision Act (Wet op het financieel toezicht) and is supervised by the European Central Bank, the Dutch Central Bank and the Dutch Authority for the Financial Markets. We use our banking license for passporting it to branches in Germany, Italy, Portugal and Spain, where a license is required to offer certain leasing and/or loan products. These branches fall under the supervision of both the Dutch Central Bank as well as the respective local supervisory authority. Furthermore, several of our entities have local licenses that may be required for the offering of financial products in their respective countries. Depending on the type of license required, the relevant local supervisory authorities supervise these entities.
As a Dutch bank, we are subject to the European (e.g., Capital Requirements Regulation and Directive) and Dutch regulatory framework that is applicable to credit institutions. The Dutch Financial Supervision Act and the Decree on Prudential Rules for Financial Undertakings (Besluit prudentiële regels Wft), which stipulates the provisions of Part 3 (Prudential supervision of financial undertakings) of the Financial Supervision Act, define the (regulatory) basis for operating as a Dutch bank. Furthermore, the Guidelines on internal governance of the European Banking Authority (EBA) are incorporated in our governance framework.
As a Dutch bank being part of Rabobank, we adhere to the Dutch Banking Code on major parts and take the relevant areas into account in our governance framework. However, DLL is not required to comply on an individual basis with the Dutch Banking Code.
Furthermore, since DLL’s shares are not traded on a public (regulated) market or similar system, we are not required to comply with the Dutch Corporate Governance Code 2016. However, we do take the principles of this code into account in our governance framework.
Conduct and integrity
We consider good corporate governance to be more than a solid corporate governance framework with a clear organizational structure and being in control through a well-structured risk and control framework. Good governance should also be reflected in soft elements. These can be found in our values and culture and in the integrity, conduct and tone of voice of members throughout the company, starting from the top. Wherever in the world we are doing business, our members speak in the same tone of voice and conduct themselves in the same way when doing business. This is a result of DLL being a truly global network organization. Throughout our functional domains and business units as well as the country organizations, our members are closely connected, working with the same mindset and according to the same values.
Banker’s oathThe Dutch banking community, including DLL, considers it important that all those who work in the Dutch banking sector perform their work carefully and with integrity. The banker’s oath is a promise to do so in relation to customers, society and other stakeholders. In the banker’s oath, our Supervisory Board, Executive Board and members declare, amongst other things, that they are aware of their role in society and that they put the interests of the client first when performing their assigned work.
By taking the banker’s oath, all members working in the Netherlands confirm that they uphold the Code of Conduct for the banking sector. The banker’s oath is not without consequences: to promote the adherence of rules, disciplinary law is applicable to certain members. By taking the banker’s oath, a member submits herself or himself to this disciplinary law.
– Global Privacy Committee (COO)The Global Privacy Committee is mandated to oversee the implementation and maintenance of the DLL privacy and data protection risk management framework, enabling DLL to process personal data in a lawful, ethical manner, taking the interests of the different stakeholders into account.
– Monitoring Committee (Head of HR)The main task of the Monitoring Committee is advising the Executive Board about the design and execution of DLL remuneration policies within the framework of the Rabobank Group Remuneration Policy. The committee monitors if (the execution of) these policies (is) are compliant with the Remuneration Policy. The committee advises about all (proposed) exceptions to the Remuneration Policy.
– Speak Up Committee (Head of Compliance)The Speak Up Committee is a committee mandated to conduct a review to assess if a reported suspected irregularity falls into the scope of the Group Global Speak Up Policy. In addition, the Committee may perform or assign further investigations of the suspected irregularity. The Committee may appoint investigators from inside or outside the DLL organization, considering the specific expertise that might be necessary for investigations.
| }
Contents ContentsConsolidated financial statements Consolidated financial statementsCompany financial statements Company financial statementsManagement Report Management ReportSupervisory Report Supervisory Report
7372
2. We will foster a culture that supports and respects the values and needs of every individual. We will do this by leveraging the DE&I ambassadors in every country in which we operate.
3. We will ensure that our recruitment and selection processes are structured in a way that a diverse range of candidates are considered and that there are recruiting practices and policies in place to reduce bias, both conscious and unconscious.
4. We will establish strategic partnerships with diverse organizations in order to attract more diverse candidates to our recruitment candidate pools. We will build networks that support us in developing a diverse and inclusive workforce.
5. We will develop and deliver diversity awareness trainings that explain the dimensions of diversity and equip us with methods to combat unconscious bias.
6. We will design and implement talent management programs that will assist in the development of a broader and more diverse pool of skilled and experienced members. All members will have equal opportunities for advancement, including adequate sponsorship support and access to opportunities.
7. We will monitor all relevant metrics and report updates to the Executive Board on a quarterly basis.
Executive and Supervisory BoardOur Executive Board consists of one female and four male members, representing three different nationalities.
The Supervisory Board consists of four members, two of whom are external (and not shareholder representatives of Rabobank). The Supervisory Board membership is composed of one female and three male members, representing two different nationalities.
barriers that hinder our progress. On the Management Team level, we launched the diversity and inclusion playbook that provided specific actions they can immediately take to make DLL a more diverse and inclusive place to work. Finally, our Allies for Inclusion initiative remains strong with over 1,500 Allies in over 25 countries.
DLL currently has approximately 5,400 members within the organization (excluding contractors), and 45 percent are female. This represents a slight increase from 2019. It is important to note that in many countries we are limited in the demographic individual information we can collect (ethnicity, age or national origin). Despite the focus and tremendous effort, only 1.5 percent progress was made in 2020, far short of our goal for 5 percent progress in the short term. At the end of 2020, females in middle management made up 36 percent and females in senior management made up 14 percent.
The current gender distribution shows that women tend to be more prevalent in lower grades. Those roles are mainly supporting staff roles and tend not to be roles with net profit accountability. We also see that we have relatively few female representations in our middle management roles. The trend gets stronger when looking at senior management roles.
At DLL, we are committed to have our workforce match the labor force and hire and promote women and minorities at parity. DLL’s key focus areas therefore are:1. We will create an inclusive environment
respecting all cultural backgrounds and beliefs, which is marked by participation.
Executive Board responsibility statement
The Executive Board of De Lage Landen International B.V. (DLL) hereby declares that:– The financial statements give a true and fair view
of the assets, liabilities, financial position and profit of DLL and the companies included in the consolidation;
– The management report gives a true and fair view of the state of affairs as at the reporting date and of the course of affairs during the financial year at DLL and its affiliated entities whose information is included in its financial statements; and
– The management report describes the principal risks that DLL faces.
W.F. Stephenson, ChairmanM.M.A. Dierckx, CFOM. Janse, COOT.L. Meredith, CCOY.E. Hoefsmit, CRO
Eindhoven, April 28, 2021
| }

Contents ContentsConsolidated financial statements Consolidated financial statementsCompany financial statements Company financial statementsManagement Report Management ReportSupervisory Report Supervisory Report
7574
Accelerate our digitaltransformation
“Digital is an enabler and partner for our customer-centric business strategy that will fuel our growth in an era of digital disruption.”
“We started in the right place,” says Daniela Weitmann, DLL’s Head of Digital Transformation. “We were on top of customer requests in 2020, which is phenomenal.”
“DLL already started its digital roadmap a few years ago and has booked immense progress ever since. When COVID-19 hit we quickly adapted to the many remote working challenges. As a result, DLL remained ‘open for business’ across our entire global network, with almost 100 percent of our employees working remotely from home and delivering support to our partners and customers during their most critical time of need. Many competitors did not have that capability.”
Daniela joined the company in July 2020, bringing 20 years’ experience in leading B2C companies. She has worked closely with CIO Rob Welten to elevate digital experiences that are fundamental to DLL’s future digital journey. “Now we need to speed up that journey since many customers who didn’t have a digital strategy have developed one in response to COVID-19.”
Route 95
DLL has taken a very proactive approach to enhance its digital infrastructure. The company started with Route 95 and set the ambition to fully automate 95 percent of the small-ticket business in key markets by 2022. “This ensures we are on the right track, but we are not there yet,” adds Daniela. “Digital is more than technology and a high-quality infrastructure.
Transform the core and build the future
Many companies fast-tracked their digital strategy in 2020, propelled by the digital dynamic of the global pandemic. Thanks to ongoing digitalization initiatives DLL was well positioned to facilitate remote working in all regions and keep pace with customers’ digital acceleration.
Daniela Weitmann
Interview
| }

Contents ContentsConsolidated financial statements Consolidated financial statementsCompany financial statements Company financial statementsManagement Report Management ReportSupervisory Report Supervisory Report
7776
It is an enabler and partner for our customer-centric business strategy that will fuel our growth in an era of digital disruption. We need to bring digital to the next level.”
Becoming digital
“The digital momentum from vendor partners, dealers and their customers introduces fresh and urgent challenges. To deliver an amazing customer experience for customers and members, and to enable that experience from any location at any time, DLL must become digital and not just add digital,” says Daniela Weitmann. “It’s easy to add one mobile app to a portfolio of digital products, but to become digital you need to fully understand your customers’ changing needs and be fast, intuitive and nimble in your response.”
“Our initiatives must bring value to existing and future customers and help us reach our growth objectives. Otherwise, we shouldn’t be taking them on. This means nothing less than transforming the core and building the future by reimagining the corporate strategy so that we can grow and become fully customer centered.”
The new motto of DLL’s digital transformation is “Creating connections that matter.” In practice, this means that DLL will interact with customers at multiple stages of their customer journey, not just at the point of sale, and will provide tailored digital solutions that truly meet their future needs.
Partnering for better digital
To kick-start the new phase of digital transformation, Daniela Weitmann has worked with cross-functional teams including members from global business units, regions, sales, innovation, HR, and IT to refresh the vision and strategic priorities. Their mandate? To look into transforming the core, shaping a new Customer Engagement model, exploring new business models (including platform strategies) and determining what DLL needs to do to become truly digital.
“Leveraging knowledge and experience on digital journeys from experts from other companies and industries is fundamental for DLL’s Digital Transformation Strategy,” believes Daniela. She is also tapping into the experience and resources of the digital teams at DLL’s parent company, Rabobank.
It’s clear that digital transformation is a long-term process that touches on all focus areas at DLL. Becoming digital is just as much about implementing technology as it is about human change, says Daniela. “In fact, digital is never done. It’s a continuous change process to become even more customer centric – driven by agile processes and incorporating diverse gig talent, with cross-functional teamwork in a culture of experimentation.”
GeneralThe year 2020 was dominated by the consequences of the COVID-19 pandemic. The Supervisory Board has been in intense communication with the Executive Board to keep abreast of DLL’s situation. The Board monitored the quality of DLL’s portfolio and the well-being of DLL’s members, enabled by comprehensive information provided on a regular basis. The Board was impressed with the manner DLL adapted to a fully remote working mode throughout most of the year while keeping member engagement on a high level. DLL’s business model was put to the test and proved highly resilient. New business volume in 2020 was only slightly below budget – a remarkable achievement in uncertain times.
Obviously, credit impairments were on an elevated level, to a substantial extent because of IFRS 9 stage 1 and stage 2 provisioning, based on pessimistic economic scenarios. With a lot of effort, the Executive Board and the broader DLL organization kept control over the portfolio to the greatest extent possible. All in all, DLL weathered the storm in 2020 and – barring unforeseen circumstances – is well positioned to resume its growth path in 2021.
Composition and members of the Supervisory BoardThe Supervisory Board consists of four members. The Supervisory Board has two external members, both bringing specific knowledge and (international) experience to the table, which supports DLL in achieving its ambitions for the future and adds to the diversity of the Board. In 2020, the composition of the Supervisory Board was unchanged.
The members of the Supervisory Board are:– Berry Marttin, Chairman (member of the
Rabobank Managing Board)– Bart Leurs (member of the Rabobank Managing
Board)– Annelies Bouma (external member)– Ron De Feo (external member)
Roles and responsibilities of the Supervisory BoardThe Supervisory Board monitors, challenges and advises the Executive Board on the company’s general direction and a broad variety of financial, risk, regulatory, compliance, IT and HR topics. The Supervisory Board does not have subcommittees. The full Board performs the roles and responsibilities of a Risk, Audit, Nomination and Remuneration Committee according to applicable governance regulations. The roles and responsibilities of the Supervisory Board are described in more detail in DLL’s Supervisory Board Charter. An updated version of this charter was approved in August 2019.
Supervisory Board meetingsThe Supervisory Board holds at least four regular meetings a year. These meetings are attended by the members of the Executive Board. In 2020, the Supervisory Board had five formal meetings. One of these meetings was specifically dedicated to the Independent Auditor’s Report on financial statements 2019 and DLL’s Annual Report 2019. The financial statements for 2019 were discussed and approved at the Supervisory Board meeting of April 2020. Because of the COVID-19 pandemic, all meetings were conducted in a virtual setting.
Additionally, in light of the evolving COVID-19 pandemic, the Supervisory Board had regular informal meetings. At these meetings, updates were presented on commercial and financial developments, member well-being, the risk profile of DLL’s portfolio and measures taken by the Executive Board to address the consequences of the pandemic.
At the formal meetings of the Supervisory Board, the commercial and financial performance of DLL and organizational and IT developments were discussed, as well as the level of customer and employee satisfaction. Discussions were based on the quarterly reports prepared by the Executive Board. Compliance and audit topics were addressed in the presence of DLL’s Heads of Group Compliance and Internal Audit.
Report of the Supervisory Board
| }

Contents ContentsConsolidated financial statements Consolidated financial statementsCompany financial statements Company financial statementsManagement Report Management ReportSupervisory Report Supervisory Report
7978
DLL’s strategy “Partnering for a better world” served as the central reference point in the Board’s supervision. The strategy includes four focus areas, centering around Maximizing customer value, Becoming an employer of choice, Accelerating digital transformation and Driving innovation, and builds on a strong foundation of financial stability, solid internal controls and compliance with laws and regulations. The strategy fits in with Rabobank’s mission of “Growing a better world together.” The Board further approved the Annual Plan and related budget for 2021.
The Supervisory Board monitored major projects on the basis of quarterly project updates. This included among others the implementation throughout the company of a new definition of default based on European Banking Authority guidelines and DLL’s digital transformation initiatives. The Supervisory Board monitored the development of DLL’s portfolio and capital against the requirements set by DLL’s strategy and shareholder, as well as the regulatory capital requirements.
Quarterly updates on DLL’s main risk indicators were provided to the Supervisory Board. DLL’s large credit exposures and the development of DLL’s (credit) impairments were reported to the Supervisory Board on a quarterly basis as well. New regulation impacting DLL’s risk position were shared with the Supervisory Board when appropriate.
The DLL Risk Appetite Statement defines the type and level of risk, both financial and non-financial, that DLL is willing to accept relative to achieving its objectives. The Supervisory Board approved a revised DLL Risk Appetite Statement for 2020. This Statement translates into Risk Appetite Statements for DLL’s country organizations with on-balance portfolios exceeding a threshold of EUR 150 million.
The Supervisory Board took note of the Top Risk Report 2020, prepared by DLL Group Risk as a part of the annual Risk Control Self-Assessment Cycle. This report addresses the main risks DLL is facing in realizing its strategic objectives. The progress of mitigating actions is being monitored on a quarterly basis by the Global Risk Committee. The Supervisory Board is updated on progress made through the Risk section of the quarterly Executive Board Report.
With respect to Compliance, the Supervisory Board was informed on a regular basis about the progress made in further upgrading DLL’s Compliance Function and the compliance framework. The results
where necessary, improve the required expertise of the Supervisory Board members. This includes being aware of the social role of financial institutions and of the interests of various stakeholders. The learning program aims to cover relevant developments in the company, corporate governance in general and the financial sector, the duty of care towards the client, integrity, risk management, financial reporting and audits. In 2020, specific attention was paid to cybersecurity, DLL’s sustainability strategy and (IFRS 9) credit risk provisioning.
Self-assessmentThe Supervisory Board conducted a (self-)assessment under the guidance of an external facilitator. The assessment focused on the future functioning of the Board considering the composition with two shareholder representatives and two external members.The assessment identified several areas for improvement. These have been addressed and actions have been defined.
Proposal to the general meeting of shareholders and conclusionIn accordance with the relevant provisions of DLL’s Articles of Association, the Supervisory Board reviewed the Annual Report 2020 and the financial statements of DLL as well as other relevant associated information. The Supervisory Board discussed these documents with the Executive Board and the external independent auditor PwC and took note of the unqualified opinion expressed in the Independent Auditor’s Report issued by PwC on the 2020 financial statements.
The Supervisory Board would like to propose to the general meeting of shareholders of DLL to adopt the financial statements of 2020.
B.J. MarttinB. LeursA.E. BoumaR. De Feo
Utrecht, April 28, 2021
of the annual Systematic Integrity Risk Assessment on inherent and residual compliance risks have been shared with the Supervisory Board, as well as mitigating controls and considerations in this respect. The improvement programs that are being implemented will further reduce the residual risk. The Supervisory Board approved the Compliance Plan for 2021.
The Supervisory Board was informed about relevant developments in DLL’s internal audit function. The results of the audits performed, the trends in audit findings and the progress in resolving such audit findings was reported on a quarterly basis. The Executive Board approved the Internal Audit Plan for 2021.
In 2019, the Supervisory Board continued to pay attention to succession planning and diversity on the level of the Executive Board and senior management. The Supervisory Board approved that after the appointment of a new CRO and member of the Executive Board as per February 26, 2021, the Legal and Compliance function will continue to report to the CEO.
External independent auditorThe Independent Auditor’s Report on financial reporting 2019 was extensively discussed with a focus on key audit observations, the control environment and areas for further improvement of the internal control framework. The Supervisory Board approved PwC’s engagement as independent auditor for the year 2020, discussed the resulting Audit Plan 2020 with the PwC team and approved this Plan. The chairman of the Supervisory Board has one-on-one meetings with PwC.
Performance and developmentThe Chairman of the Supervisory Board has primary responsibility for the Supervisory Board’s learning program. The aim of the program is to maintain and,
| }

Contents ContentsConsolidated financial statements Consolidated financial statementsCompany financial statements Company financial statementsManagement Report Management ReportSupervisory Report Supervisory Report
8180
Financial Statements 2020
| }

Contents ContentsConsolidated financial statements Consolidated financial statementsCompany financial statements Company financial statementsManagement Report Management ReportSupervisory Report Supervisory Report
8382
Consolidated financial statements
Contents
Primary financial statements 84Consolidated statement of financial position 84Consolidated statement of profit or loss 85Consolidated statement of other comprehensive income 86Consolidated statement of changes in equity 87Consolidated statement of cash flows 88
Notes to the consolidated financial statements 89
Introduction 89i. Corporate information 89ii. Basis of preparation 89iii. Basis of consolidation 91iv. Key judgments and estimates 91v. Events occurring after reported period 92
Portfolios 921.1 Due from customers 921.2 Fixed assets under operating lease 941.3 Credit risk management 94
Performance 1012.1 Interest revenue and expense 1012.2 Gains/(losses) from financial instruments 1012.3 Fee and other income 1022.4 Staff expenses 1022.5 Other operating expenses 1042.6 Taxation 104
Funding & Liquidity 1063.1 Equity and capital management 1063.2 Short-term loans and long-term borrowings 1083.3 Issued debt securities 1093.4 Derivatives 1093.5 Due from banks 1133.6 Cash and cash equivalents 1143.7 Market and liquidity risk management 114
Other 1204.1 Goodwill and other intangible assets 1204.2 Accounts receivable and other assets 1214.3 Accounts payable and other liabilities 1244.4 Provisions 1254.5 Related party transactions 1264.6 Commitments and contingencies 1274.7 Group structure 1284.8 Country-by-country reporting 1324.9 Other significant accounting policies 133
Appendix 134C1 – List of acronyms 134
| }

Contents ContentsConsolidated financial statements Consolidated financial statementsCompany financial statements Company financial statementsManagement Report Management ReportSupervisory Report Supervisory Report
8584
Primary financial statements
Consolidated statement of financial position Consolidated statement of profit or lossfor the year ended December 31
in millions of euros Notes 2020* 2019*
Assets
Cash and cash equivalents 3.6 416 423
Accounts receivable and other short- term assets 4.2 593 740
Derivatives 3.4 18 40
Due from banks 3.5 2,201 2,434
Due from customers 1.1 32,331 33,631
Fixed assets under operating lease 1.2 2,647 2,916
Goodwill and other intangible assets 4.1 6 76
Current tax receivables 2.6 102 120
Deferred tax assets 2.6 134 113
Other assets 4.2 177 196
Total assets 38,625 40,689
Liabilities
Short-term loans and overdrafts 3.2 5,803 6,657
Accounts payable and other short-term liabilities 4.3 666 688
Issued debt securities 3.3 1,231 2,749
Provisions 4.4 98 90
Derivatives 3.4 113 119
Long-term borrowings 3.2 25,624 25,252
Current tax payables 2.6 86 52
Deferred tax liabilities 2.6 355 472
Other liabilities 4.3 469 428
Total liabilities 34,445 36,507
Equity
Share capital and share premium 3.1 1,233 1,233
Retained earnings 3.1 2,535 2,399
Foreign currency translation reserve 3.1 (60) 80
Total equity attributable to equity holders of the parent 3,708 3,712
Non-controlling interest 472 470
Total equity 4,180 4,182
Total liabilities and equity 38,625 40,689
* As on December 31
in millions of euros Notes 2020 2019
Interest revenue 2.1 1,670 1,770
Interest expense 2.1 (586) (759)
Net interest income 2.1 1,084 1,011
Revenue from operating leases 843 832
Depreciation and other operating lease expenses (664) (649)
Net operating lease income 179 183
Gains/(losses) from financial instruments 2.2 23 (11)
Fee and other income 2.3 229 250
Fee expenses (18) (17)
Total net income 1,497 1,416
Staff expenses 2.4 (519) (508)
Other operating expenses 2.5 (257) (258)
Total operating expenses (776) (766)
Impairment of goodwill 4.1 (70) -
Credit losses and other impairments 1.3 (409) (208)
Profit before tax 242 442
Income tax expense 2.6 (62) (145)
Profit for the year 180 297
Profit for the year attributable to:
Shareholders of the parent 140 257
Non-controlling Interest 40 40
| }

Contents ContentsConsolidated financial statements Consolidated financial statementsCompany financial statements Company financial statementsManagement Report Management ReportSupervisory Report Supervisory Report
8786
Consolidated statement of other comprehensive income Consolidated statement of changes in equityfor the year ended December 31
in millions of euros Notes 2020 2019
Profit for the year 180 297
Other comprehensive (expense)/income not to be reclassified to profit or loss in subsequent years
Employee benefit
Remeasurement of post-employment benefit reserve, before tax (2) 1
Income tax effect 2.6 - -
(2) 1
Other comprehensive expense to be reclassified to profit or loss in subsequent years
Foreign currency translation reserves
Losses during the year (174) -
(174) -
Other comprehensive (expense)/income for the year, net of tax (176) 1
Total comprehensive income for the year, net of tax 4 298
Total comprehensive (expense)/income attributable to:
Shareholders of the parent (2) 254
Non-controlling interest 6 44
Attributable to equity holders of the parent
in millions of euros
Notes
Share capital
and share premium*
Retained earnings* FCTR* Total
Non-controlling
interestTotal
equity
Balance on January 1, 2019 1,233 2,141 84 3,458 473 3,931
Profit for the year - 257 - 257 40 297
Other comprehensive expense - 1 (4) (3) 4 1
Remeasurement of post-employment benefit reserve, net of tax - 1 - 1 - 1
Fair value changes of derivatives designated for net investment hedging, net of tax - - (73) (73) (2) (75)
Exchange differences on translation of foreign operations - - 69 69 6 75
Total comprehensive income - 258 (4) 254 44 298
Dividends 3.1 - - - - (47) (47)
Balance on December 31, 2019 1,233 2,399 80 3,712 470 4,182
Balance on January 1, 2020 1,233 2,399 80 3,712 470 4,182
Profit for the year - 140 - 140 40 180
Other comprehensive expense - (2) (140) (142) (34) (176)
Remeasurement of post-employment benefit reserve, net of tax - (2) - (2) - (2)
Fair value changes of derivatives designated for net investment hedging, net of tax - - 130 130 4 134
Exchange differences on translation of foreign operations - - (270) (270) (38) (308)
Total comprehensive income - 138 (140) (2) 6 4
Dividends 3.1 - - - - (2) (2)
Issue of share capital - - - - (2) (2)
Other - (2) - (2) - (2)
Balance on December 31, 2020 1,233 2,535 (60) 3,708 472 4,180
* Refer to note 3.1.
| }

Contents ContentsConsolidated financial statements Consolidated financial statementsCompany financial statements Company financial statementsManagement Report Management ReportSupervisory Report Supervisory Report
8988
The Executive Board considers it appropriate to adopt the going concern basis of accounting in preparing these financial statements based on a financial forecast analysis and the equity position that supports the going concern assumption.
New and Amended Standards issued by the International Accounting Standards Board (IASB) and adopted by the European Union that apply in the Current Financial Year
Interest Rate Benchmark Reform Phase 1 (Amendments to IFRS 9, IAS 39 and IFRS 7)These amendments modify specific hedge accounting requirements, so that entities can apply those hedge accounting requirements assuming the interest rate benchmark is not altered as a result of the interest rate benchmark reform. The amendments are applicable as of January 1, 2020 and address the uncertainty in the period before the actual interest rate benchmark reform takes place. The hedging relationship is directly affected by interest rate benchmark reform only if the reform gives rise to uncertainties about:a) the interest rate benchmark (contractually or
noncontractually specified) designated as a hedged risk; and/or
b) the timing or the amount of interest rate benchmark-based cash flows of the hedged item or of the hedging instrument.
DLL has investigated that there is (currently) no uncertainty regarding the LIBOR’s designated in our hedge accounting relationships (only USD), neither in the designated hedged risk nor in the timing of the benchmark-based cash flows in the hedged item and or hedging instrument. The LIBOR rate remains the most liquid, is and remains separately identifiable and the cash flows are not altered. We are of the opinion that the uncertainty only arises when there is a material change in liquidity switch point and/or when there is a trigger/ cessation event. As these events did not occur before December 31, 2020, there is no impact on the 2020 financial statements and we did not need to use the relief offered by the Phase 1 amendments. We also note that the cash flow hedge relationship in our IFRS 9 currency basis solution is a fixed foreign currency Euro and therefore the highly probable requirement in the amendment is not applicable to DLL.
Introductioni. Corporate information
These consolidated financial statements of De Lage Landen International B.V. (the Company) and its subsidiaries (collectively DLL or the Group) for the year ended December 31, 2020, were authorized for issue in accordance with a resolution of the Executive Board (EB) on April 28, 2021.
DLL is a privately held limited liability company (in Dutch besloten vennootschap met beperkte aansprakelijkheid) incorporated and domiciled in Eindhoven, the Netherlands (Chamber of Commerce number 17056223). The registered office is located at Vestdijk 51, 5611 CA, Eindhoven. DLL is a wholly owned subsidiary of Coöperatieve Rabobank U.A. (Rabobank), a Dutch cooperative bank with statutory seat in Amsterdam, the Netherlands. Rabobank is the parent and the ultimate controlling party of DLL. Information on other related party relationships is provided in note 4.5.
DLL offers customers various financial solution products, mainly being leasing and lending, with presence in over 30 countries all across the world.
DLL has had a banking license in the Netherlands since 1988 and is regulated by the European Central Bank and the Dutch Central Bank (De Nederlandsche Bank or DNB). This license is passported to four European countries: Germany, Italy, Spain and Portugal.
Pursuant to Section 403 of Book 2 of the Dutch Civil Code, Coöperatieve Rabobank U.A. has assumed liability for the debts arising from the legal transactions of the following DLL entities:– De Lage Landen America Holdings B.V.– De Lage Landen Corporate Finance B.V.– De Lage Landen International B.V.– De Lage Landen Vendorlease B.V.
ii. Basis of preparation
The consolidated financial statements have been prepared in accordance with International Financial Reporting Standards (IFRS) as adopted by the European Union and the applicable articles of Book 2 of the Dutch Civil Code.
All figures are presented in euros with values rounded to the nearest million, except when indicated otherwise.
Consolidated statement of cash flows Notes to the for the year ended December 31
in millions of euros Notes 2020 2019
Cash flows from operating activities
Profit before tax 2.6 242 442
Adjustments to reconcile profit before tax to net cash flows:
Depreciation of fixed assets under operating lease 1.2 657 649
Impairment of fixed assets under operating lease 1.2 7 7
Loss/(gain) on disposal of fixed assets under operating lease 27 6
Depreciation of fixed assets for own use 4.2 22 21
Amortization and impairment of intangible assets 4.1 74 7
Net foreign exchange differences 2.2 (10) 2
Unrealized gains and losses from financial instruments (2) 56
Movements in provisions 4.4 10 (2)
Credit losses: charges & recoveries 1.3 393 193
Interest income 2.1 (1,670) (1,770)
Interest expenses 2.1 586 759
336 370
Net change in assets and liabilities:
Due from customers (863) (2,167)
Purchase of fixed assets under operating lease 1.2 (971) (1,149)
Proceeds from sale of fixed assets under operating lease 314 231
Due from banks 233 (364)
Short-term loans from banks and overdrafts (828) 1,585
Other assets 224 28
Other liabilities 15 (70)
(1,540) (1,536)
Interest received 1,692 1,752
Interest paid (595) (759)
Income tax paid (116) (53)
Other (13) (22)
Net cash flows from operating activities (572) (618)
Cash flows from investing activities
Purchase of fixed assets for own use 4.2 (23) (10)
Proceeds from sale of fixed assets for own use 1 -
Purchase of intangible assets 4.1 (4) (2)
Net cash flows from investing activities (26) (12)
Cash flows from financing activities
Drawdowns/(repayments) of other long-term borrowings 1,964 (134)
Issue of debt securities 3.3 - 2,063
Repayments of debt securities 3.3 (1,380) (1,228)
Equity contributions received* 2 -
Dividends paid (2) (47)
Net cash flows from financing activities 584 654
Net (decrease)/increase in cash and cash equivalents (14) 24
Net exchange differences 7 -
Cash and cash equivalents on January 1 423 399
Cash and cash equivalents on December 31 3.6 416 423
* Pro-rata contributions in capital of subsidiaries from respective holders of non-controlling interest (no change in ownership)
consolidated financial statements
| }
Contents ContentsConsolidated financial statements Consolidated financial statementsCompany financial statements Company financial statementsManagement Report Management ReportSupervisory Report Supervisory Report
9190
From the date the Group loses control over a subsidiary, the Group ceases to consolidate it. If the Group loses control over a subsidiary, it:– Derecognizes
• assets (including goodwill) and liabilities of the subsidiary
• carrying amount of any non-controlling interest• cumulative translation differences recorded in equity;
and– Recognizes
• fair value of the consideration received• fair value of any investment retained• any surplus or deficit in profit or loss• parent’s share of components previously recognized
in other comprehensive income to profit or loss or retained earnings, as appropriate, as would be required if the Group had directly disposed of the related assets or liabilities.
iv. Key judgments and estimates
The tables that follows summarize the key judgments made and key estimates used in the preparation of these consolidated financial statements.
Key judgments Notes
Classification of leases and loans to customers 1.1
Consolidation of special-purpose vehicles 3.3
Key estimates Notes
Residual value reassessment 1.2
Allowance for credit losses 1.3
Fair value of derivatives 3.4
Goodwill 4.1
Accounting implications of the COVID-19 pandemic
GeneralThe COVID-19 pandemic affected DLL’s portfolio in 2020. The lock-down measures to contain the virus that were taken by governments across the world resulted in lower economic activity in the markets in which DLL is active. The credit exposure of the portfolio was negatively affected in terms of credit quality, which led to high exposure inflow in stage 2. DLL expects that these higher stage 2 exposures will result in more defaults (stage 3) in coming periods and consequently will lead to credit losses. Already in the second half of 2020, stage 3 exposures and credit losses were increasing.
Recommendations ECB, EBA and ESMADLL adheres to the view of the European banking authority (EBA) that the application of public or private moratoria aimed at addressing the adverse impact of the COVID-19 pandemic should not in itself be deemed an automatic trigger to conclude that a significant increase in credit risk
The policies applied are the same as the previous financial year with the exception of the policies stated in ii. Basis of preparation.
iii. Basis of consolidation
These consolidated financial statements comprise the financial statements of the Group and its subsidiaries as on December 31, 2020. The Group structure on December 31, 2020, is presented in note 4.7.
The financial statements comply with IFRS as issued by IASB and adopted by the EU.
Subsidiaries are entities under control of the Group. Control is achieved when and only when the Group has:– power over the subsidiary (an ability to direct the activities
of the subsidiary that significantly affect its returns);– exposure, or rights, to variable returns from its
involvement with the subsidiary; and– the ability to use its power over the subsidiary to affect
its returns.
The acquisition method of accounting (recognizing net identifiable assets and goodwill) is used by the Group to account for business combinations.
The Group consolidates a subsidiary from the date it obtains control. The Group reassesses whether or not it controls an investee if there are changes to one or more of the three elements of control. Non-controlling interests in the results or equity of subsidiaries are shown separately in the consolidated statement of profit or loss, statement of comprehensive income, statement of changes in equity and statement of financial position.
Profit or loss and total comprehensive income are attributed to the equity holders of the parent of the Group and to the non-controlling interest, even if this results in the non-controlling interest having a deficit balance.
Investments in associates represent interests held in various entities where DLL exhibits significant influence. This is generally the case where the group holds 20% to 50% of the voting rights. Share of profit from associates is included in fee and other income within the statement of profit or loss. Investments in associates are accounted for using the equity method of accounting.
When necessary, adjustments are made to the financial information of subsidiaries to bring their accounting policies in line with the Group’s accounting policies. All intra-group assets and liabilities, equity, income, expenses and cash flows relating to transactions between Group companies are eliminated in full on consolidation.
for annual periods beginning on or after January 1, 2021 with a possibility of earlier application. DLL did not early adopt these amendments and does not expect the implementation of these amendments to significantly affect profit or equity since the relief intends to prevent the effect of changes in contractual cash flows of financial assets, financial liabilities, lease liabilities, or hedging relationship as a result of the benchmark rate replacement to have an impact on profit or equity.
IFRS 17 Insurance ContractsIn May 2017, the IASB issued IFRS 17 Insurance Contracts with an effective date of annual periods beginning on or after January 1, 2023. IFRS 17 establishes the principles for the recognition, measurement, presentation and disclosure of insurance contracts within the scope of the standard. The objective of IFRS 17 is to ensure that an entity provides relevant information that faithfully represents those contracts. This information provides a basis for users of financial statements to assess the effect that insurance contracts have on an entity’s financial position, financial performance and cash flows. The standard will affect DLL RE insurance activity. DLL is currently assessing the impact on its financial statements.
Other amendments to IFRSMinor amendments have been made to IAS 1 with an effective date of annual periods beginning on or after January 1, 2023, regarding the classification of liabilities as current or non-current. Amendments have also been made to IFRS 3, IAS 16, IAS 37 and the Annual Improvements 2018-2020. Although these new requirements are currently being analyzed and their impact is not yet known, DLL does not expect the implementation of these amendments to affect profit or equity.
Basis of preparation cash flow statementCash and cash equivalents include cash, cash in transit and deposits at banks. The cash flow statement is prepared using the indirect method and provides details of the source of the cash and cash equivalents that became available during the year as well as their application during the year. The net pre-tax cash flow from operating activities is adjusted for non-cash items in the statement of profit or loss and for non-cash changes in items in the statement of financial position. The consolidated statement of cash flows presents separately the cash flows from operating, investing and financing activities. Cash flows from operating activities include net changes in balances due from customers and fixed assets under operating lease. Investment activities include acquisitions and disposals of subsidiaries and investments in property, plant and equipment for own use. Financing activities include drawdowns and repayments of funding through Rabobank and other banks, debt securities and dividends paid. The difference between the net change presented in the statement of cash flows and the change in cash and cash equivalents included in the statement of financial position is due to exchange differences.
Amendment to IFRS 16: Leases Covid 19-Related Rent Concessions In May 2020, the IASB issued COVID-19 Related Rent Concessions, which amended IFRS 16 Leases.The amendments permit lessees, as a practical expedient, not to assess whether particular rent concessions occurring as a direct consequence of the COVID pandemic are lease modifications and instead to account for those rent concessions as if they are not lease modifications. The amendment does not affect lessors. As a lessee, DLL has not obtained any lease concessions due to COVID-19. As such, this amendment does not affect profit or equity.
Other Amendments to IFRSMinor amendments have been made to IFRS 3, IAS 1, and IAS 8, and to References to the Conceptual Framework in IFRS Standards. The implementation of these amendments does not affect profit or equity.
New and Amended Standards issued by IASB and adopted by the European Union that do not yet apply in the Current Financial Year
Amendments to IFRS 4 Insurance ContractsAmendments have been made to IFRS 4 regarding the deferral of IFRS 9. The amendments to IFRS 4 permit entities that predominantly undertake insurance activities the option to defer the effective date of IFRS 9 until January 1, 2023. The effect of such a deferral is that the entities concerned may continue to report under IAS 39 Financial Instruments: Recognition and Measurement. DLL RE DAC, a subsidiary that undertakes re-insurance activities has chosen to use the option to defer the effective date of IFRS 9 and therefore continues to apply IAS 39.
New Standards issued by IASB but not yet endorsed by the European Union
Interest Rate Benchmark Reform Phase 2 (Amendments to IFRS 9, IAS 39, IFRS 7, IFRS 4 and IFRS 16)In August 2020, the IASB issued amendments that complement those issued in 2019 (Phase 1) and focus on the effects of the interest rate benchmark reform on a company’s financial statements that arise when, for example, an interest rate benchmark used to calculate interest in a financial asset is replaced with an alternative benchmark rate. Phase 2 amendments address issues that might affect financial reporting during the reform of an interest rate benchmark, including the effects of changes to contractual cash flows or hedging relationships. In Phase 2, the IASB amended requirements in IFRS 9 Financial instruments, IAS 39 Financial instruments: Recognition and Measurement, IFRS 7 Financial instruments: Disclosures, IFRS 4 Insurance Contracts and IFRS 16 Lease relating to i) changes in the basis for determining contractual cash flows of financial assets, financial liabilities and lease liabilities ii) hedge accounting and iii) disclosures. These Phase 2 amendments apply only to changes required by the interest rate benchmark reform to financial instruments and hedging relationships. The amendments are effective
| }

Contents ContentsConsolidated financial statements Consolidated financial statementsCompany financial statements Company financial statementsManagement Report Management ReportSupervisory Report Supervisory Report
9392
fair value (basis adjustment) for assets that have been designated for macro fair value hedge accounting is included in amounts due from customers and amounted to positive EUR 111 million as on December 31, 2020 (2019: EUR 93 million).
Amounts due from customers pledgedDLL enters into securitization transactions in the ordinary course of its business. As part of those transactions, finance lease, operating lease and loan receivables were pledged as collateral for notes issued by the Group (asset-backed securities). As of December 31, 2020, EUR 1,991 million (2019: EUR 3,349 million) of assets have been pledged in various funding transactions. During 2020, DLL did not conduct any new securitization transactions. The decrease in pledged assets therefore reflects the regular redemption in securitized assets, which are detailed in note 3.3.
Unguaranteed residual valueThe value of unguaranteed residual values included in the carrying amount on December 31, 2020, was EUR 2,269 million (2019: EUR 2,365 million).
Residual value reassessmentResidual values in finance lease contracts are included in the carrying amount of the finance lease receivable. Unguaranteed residual values are influenced by asset market prices and are therefore subject to management estimation, requiring assumptions to be made. Residual values are reassessed regularly in line with the methodology applied to operating leases as described in note 1.2.
Investment in finance leasesThe below summarizes outstanding gross investment in finance lease receivables as well as unearned finance income, all net of impairment:
in millions of euros 2020* 2019*
Less than 1 year 5,825 6,612
More than 1 year, less than 5 years 10,947 11,158
More than 5 years 560 527
Gross investment in leases 17,332 18,297
Unearned finance income (1,320) (1,525)
Net investment in leases 16,012 16,772
* As on December 31
The table below summarizes the aging profile of DLL’s net investment in finance leases:
in millions of euros 2020* 2019*
Less than 1 year 5,751 6,461
More than 1, less than 5 years 9,816 9,897
More than 5 years 445 414
Net investment in leases 16,012 16,772
* As on December 31
has occurred. DLL also applies the European central bank (ECB), EBA and European securities and markets authority (ESMA) recommendations regarding the identification and classification of non-performing loans. Loans and leases can be renegotiated without diminishing the financial position of the lender or lessee. In other words, the net present value of cash flows of the loan or lease remains the same after modification. In this case, if the obligor remains likely to meet his obligations under the renegotiated contract, there is no need to classify the exposure as defaulted.
DLL’s relief measuresDLL provided a range of relief measures to support clients negatively impacted by COVID-19. In certain countries where DLL is active, the government has imposed mandatory general payment moratoria. However DLL also offered relief measures that do not fall under such a general payment moratorium but that allow clients to temporarily postpone principal repayment and/or interest payments.
Both the governmental moratoria and the additional relief measures offered by DLL have in common that they allow customers to postpone lease and loan payments for 3 months, or longer when required by local law. These delayed payments are subsequently paid by extending the lease or by increasing the future monthly payments.
Refer to note 1.3 for the impact of COVID-19 on credit impairments.
Furthermore COVID-19 has impacted the portfolio growth and credit losses negatively. For one of our subsidiaries, these developments have, besides other developments not related to COVID-19, resulted in an impairment of goodwill. Refer to note 4.1.
v. Events occurring after reported period
Events after the reporting date that relate to conditions that existed at the end of the reporting period have been reflected in these financial statements.
Portfolios1.1 Due from customers
DLL’s portfolio comprises asset-based financing that includes finance leases and loans. The table below shows the composition of DLL’s portfolio:
in millions of euros 2020* 2019*
Finance lease receivables 16,369 17,003
Loans to customers 16,571 16,997
32,940 34,000
Allowance for impairment finance lease receivables (357) (231)
Allowance for impairment loans to customers (252) (138)
(609) (369)
Total due from customers 32,331 33,631
* As on December 31
The table below displays an analysis of amounts due from customers by underlying asset type.
in millions of euros 2020* 2019*
Technology solutions 5,969 6,575
Construction, transportation and industrial equipment 8,615 9,099
Food and agricultural equipment 14,142 14,091
Healthcare and clean tech 3,551 3,501
Other 54 365
Total due from customers 32,331 33,631
* As on December 31
The decrease in the other category is caused by the run off of the portfolio in China and the allocation of a portfolio in Chile to the individual asset types.
Fair value of amounts due from customersOn December 31, 2020, the fair value of amounts due from customers was EUR 32,828 million (2019: EUR 33,874 million). The fair value was estimated using a discounted cash flow model where the discount rate is determined by a market-related credit risk spread (Level 2) over cost of funds and the relevant market interest rate extrapolated from a market yield curve. The credit spreads are based on those charged by DLL to customers on new leases and loans provided.
Since the inputs for this model are observable market inputs that are adjusted as necessary, these fair value measurements are fully classified as Level 2 within the fair value hierarchy as described in note 4.9.
Fair value changes of portfolios hedgedDLL applies a macro fair value hedge accounting model for the interest rate risk in the fixed-rate EUR and USD portfolios. The difference between amortized cost and
Key judgment: Classification of a finance lease, operational leases and loans to customersAn arrangement contains a lease if its fulfilment is dependent upon the right to use the asset. Leases that transfer substantially all the risks and rewards of ownership of such assets are classified as finance leases (others are classified as operating leases). Determination of transfer of substantially all the risks and rewards of ownership is subjective in nature and involves significant judgment. Contracts where the end-user has legal ownership of the asset and DLL provides financing are considered to be loans.
The vast majority of DLL’s lease portfolio is classified as finance lease, given that the vendor or end-customer bears substantially all of the economic risk associated with the underlying assets. DLL does not retain significant asset risk from these arrangements. Transactions where DLL retains significant asset risk are classified as operating lease. Refer to note 1.2.
Accounting policy for amounts due from customersA. Finance leases– Underlying assets are derecognized and a finance lease
receivable is recognized. These receivables equate to contractual lease payments and any unguaranteed residual value (i.e., gross investment in leases) discounted to present value (i.e., net investment in leases).
– Net investment in leases is presented net of allowance for impairment. Refer also to note 1.3 Credit risk management for further guidance relating to allowance for impairments.
– The difference between the gross investment in leases and the net investment in leases is recognized as unearned finance income.
– Lease income is determined using the rate implicit in the lease. This is the rate that discounts the net investment in the lease to the sum of the fair value of underlying assets and initial direct costs incurred.
– If there has been a reduction in the estimated unguaranteed residual value, the income allocation over the lease term is revised and any reduction in respect to amounts accrued is recognized immediately in the statement of profit or loss.
B. Loans to customers– Loans to customers are non-derivative financial assets
(classified as loans and receivables) with fixed or definable payments, not listed on an active market.
– Measurement is initially at fair value, including transaction costs.
– Subsequently, balances are carried at amortized cost less impairment allowance.
– Interest revenue on loans to customers is calculated using the Effective Interest Rate (EIR) in the loan. Refer also to note 4.9.
| }

Contents ContentsConsolidated financial statements Consolidated financial statementsCompany financial statements Company financial statementsManagement Report Management ReportSupervisory Report Supervisory Report
9594
Credit risk exposuresMaximum exposure to credit risk on amounts due from customers is reflected through their carrying amounts and for operating lease through book value of the underlying assets. The below tables summarize DLL’s credit risk exposures in its finance lease, loans and operating lease portfolios.
2020* 2019*
in millions of eurosMaximum exposure
Collateral coverage
(%)Maximum exposure
Collateral coverage
(%)
Due from customers 32,331 99.20% 33,631 99.01%
Fixed assets under operating lease 2,647 100.10% 2,916 95.72%
Total exposure 34,978 99.27% 36,547 98.75%
* As on December 31
Collateral and credit enhancementsDLL accepts collateral and other credit enhancements from end-users and third parties to manage the credit risk level. Material financing arrangements under finance leases and loans are secured by DLL’s title to or a lien/pledge on the underlying assets. The fair values of those assets are determined by DLL’s Global Asset Management department, which provides values based on, for example, the asset type, manufacturer, resale history, historic value depreciation, location and other factors.
These fair values are regularly reviewed by Global Asset Management Committees for each Global Business Unit, which focuses on respective industries.
Other types of credit enhancements include:– cash, which is received primarily in the form of security
deposits from end-users;– guarantees, which may be corporate and personal
guarantees or guarantees from our vendors, as well as from third parties related to an end-user lessee;
– credit insurance obtained externally by DLL for selected portfolios; and,
– loss pools: funded and unfunded security provided by vendors for specifically defined risks and vendor programs.
Credit risk concentrationAt group level, DLL manages if concentration of credit risks is within DLL’s risk appetite by monitoring its top 20 customers relative to exposure size (integral for finance lease, loans and operating lease exposures). The maximum exposure to top 20 customers on December 31, 2020, was EUR 1,303 million, comprising 4% of the total portfolio (2019: EUR 1,335 million, comprising 4% of the portfolio).
Apart from this, DLL further avoids significant concentrations by managing country limits, credit risk concentrations within countries as well as avoiding or limiting exposure to defined industries. These limits are included in the Local Risk Appetite Statements.
Credit risk policies, processes and governanceDLL pursues a credit risk policy aimed at maintaining a moderate credit risk profile. DLL has two levels of credit committees that manage credit risk:– a Global Credit Committee (GCC) operating at a global
level; and– Local Credit Committees (LCC) operating at country
level.
Authority limits are granted to the GCC by DLL’s Executive Board, who in turn is granted authority by Rabobank. Decisions for exposures above GCC authority require an approval from Rabobank. Authority limits for LCCs and the Group Risk department within DLL are granted and reviewed annually by the Global Risk Committee (GRC) under authority of DLL’s Executive Board. Credit authorities are also delegated to professionals within a country and within the Group Risk department, which oversees global risk activities. These limits are also reviewed annually.
The credit committees or authorized professionals decide on, or recommend to the next higher-level authority, credit applications for new, amended or unchanged:– exposure limits;– credit protections such as collateral or enhancements
required;– credit quality classifications;– specific impairment provisions for individual defaulted
accounts as well as collective provisions; and,– customer rating (i.e., probability of default (PD), loss given
default (LGD) and exposure at default (EAD) calculations, resulting in an appropriate collectively determined impairment provision).
Group Risk is responsible for credit and other risk-related policies, maintains oversight on underwriting and provisioning models, supports countries on credit risk matters and coordinates interaction with Rabobank concerning credit risk.
Exposure limitsDLL manages credit risk by setting limits on the amount of risk it accepts for individual exposures to counterparties, such as: end-users (lessees or borrowers) and vendors and dealers (collectively “vendors”). The vast majority of counterparties are assigned a risk rating, which reflects the level of associated credit risk. As a rule, all counterparty limits and risk ratings are reviewed at least once a year. Where a counterparty is assigned a higher-risk rating (i.e., greater credit risk), it is reviewed on a more frequent basis. Credit committees may request more frequent reviews.
DLL has policies in place to restrict or prohibit certain counterparty types, assets or industries, limiting credit risk as well as other risk types (based on, for example, compliance and reputational risk).
prices) by type of leased assets. Reassessments are based on a combination of realization of assets sold, expert knowledge and judgment of local markets.
Accounting policy for operating leasesDLL as a lessor– DLL as a lessor presents the assets subject to operating
leases in the balance sheet as fixed assets according to the nature of the asset.
– The leased asset is carried at cost less any accumulated depreciation and impairment losses.
– Operating lease installments are recognized as revenue on a straight-line basis over the lease term.
Determining the carrying amount of a leased asset– Cost of the asset comprises the purchase price and any
costs directly attributable to bringing the asset to the location and condition necessary for operation, such that future benefits can be derived from it.
– These assets are depreciated over their expected useful lives on a straight-line basis to the expected residual value. Expected useful lives for equipment are approximately between 5 and 20 years, respectively.
– Expected useful lives and residual values are reassessed annually (see above) with any changes being accounted for prospectively over the remaining lease term unless the total asset is considered to be impaired following this change in useful life and/or expected residual value.
Credit losses on assets under operating leaseCredit losses on assets under operating lease may arise from payment delinquency of lessees. The delinquency of lessees is considered to be an indication of impairment for the leased asset. If such indication exists, an impairment test is carried out to determine whether the carrying amount exceeds the recoverable amount.
1.3 Credit risk management
Credit risk definedCredit risk is the risk that DLL will incur a loss because its customers or counterparties fail to fulfill their obligations towards DLL. DLL aims to maintain a credit portfolio with a manageable risk profile in order to limit the impact of bad-debt costs on the profitability and reputation of the company. DLL manages credit risk through a process of ongoing identification, measurement and monitoring of risk exposures, subject to risk limits and other controls established by DLL’s Risk Appetite Statement and its credit risk policy.
Information regarding credit risk associated with amounts outstanding from counterparties (including current accounts, derivatives and loans to Rabobank, other banks as well as accounts receivable, which are not linked to the lease portfolio) is disclosed in respective notes (refer to notes 3.6, 3.4, 3.5 and 4.2).
1.2 Fixed assets under operating lease
DLL’s other core product is operating lease contracts provided to lessees. A typical tenor of an operating lease contract is between three and five years. The below table presents a reconciliation of the carrying amount of the assets under operating lease at the beginning and end of the year comprising a wide range of assets like trucks, forklifts, tractors and copiers:
in millions of euros 2020 2019
Cost 4,359 3,772
Accumulated depreciation and impairment (1,443) (1,169)
Carrying amount on January 1 2,916 2,603
Purchases 971 1,149
Transfer to inventories (104) (82)
Disposals (341) (237)
Depreciation (657) (649)
Impairment (7) (7)
Other 30 81
Net exchange differences (161) 58
Cost 4,153 4,359
Accumulated depreciation and impairment (1,506) (1,443)
Carrying amount on December 31 2,647 2,916
Under “other,” reclassifications between operating leases and finance lease receivables are included due to incorrect classifications amounting to EUR 60 million in 2019.
The table below summarizes future minimum lease payments under operating leases where DLL acts as a lessor:
in millions of euros 2020* 2019*
Less than 1 year 384 672
More than 1 year, less than 5 years 1,172 1,065
More than 5 years 32 55
Total minimum lease payments 1,588 1,792
* As on December 31
Refer to note 1.1 for key judgment in respect to classification of leases.
Assets under operating lease pledgedAs on December 31, 2020, DLL pledged EUR 385 million (2019: EUR 488 million) of assets under operating lease as collateral under term financing received from banks in the U.S. and the U.K. Refer to note 3.2.
Key estimate: residual value reassessmentResidual values of assets under operating lease form a significant part of the carrying amount of those assets. Residual values are influenced by asset market prices and are therefore subject to management estimation. Residual values are at least reassessed on an annual basis, or more often when necessary, by the Global Asset Management department using local market information (e.g., sales
| }

Contents ContentsConsolidated financial statements Consolidated financial statementsCompany financial statements Company financial statementsManagement Report Management ReportSupervisory Report Supervisory Report
9796
procedures ascertain whether the customer complies with the agreements made and whether this is expected to continue in the future. If doubts arise on creditworthiness of a customer, DLL monitors the exposures more frequently and maintains them on a watch list.
At initial recognition, an allowance is formed for the amount of the expected credit losses from possible defaults in the coming 12 months (“12-month ECL”). If credit risk increased significantly since origination (but remains non-credit-impaired), an allowance will be required for the amount that equals the expected credit losses stemming from possible defaults during the expected lifetime of the financial asset (“lifetime ECL”). If the financial instrument becomes credit-impaired the allowance will remain at the lifetime ECL. Financial instruments become credit-impaired, when one or more events have occurred that had a detrimental impact on estimated future cash flows.
The total loan impairment allowance consists of three components:– Specific allowance for impaired exposures (IFRS 9
stage 3) is determined for individually assessed impaired exposures. Thresholds for this allowance for impairment are country-specific and in some countries all defaults are assessed on an individual basis.
– Collective allowance for impaired exposures (IFRS 9 stage 3) is determined for impaired exposures that are not individually significant.
– Allowance for not credit-impaired exposures is determined as a collective provision for the portion of the portfolio that is not impaired and has a credit risk that either has not increased significantly since origination (stage 1) or has increased significantly since origination (stage 2).
Specific and collective impairments are based on actual portfolio analysis, with considerations of asset/collateral recovery and expected collections to establish the estimated loss on defaulted positions.
Credit risk models used for stage 1 and stage 2 for credit lossesTwo fundamental drivers of the IFRS 9 impairments requirements are: a) the methodology for the measurement of 12-month and lifetime expected credit losses; and b) the criteria used to determine whether a 12-month ECL, lifetime ECL non-credit-impaired or lifetime ECL credit-impaired should be applied (also referred to as stage determination criteria).
a) Methodology to determine expected credit lossesIn order to determine ECLs DLL utilizes point-in-time PD and LGD models for the majority of the portfolio in scope. Three macroeconomic scenarios (a baseline-minus, baseline and baseline-plus scenario for unemployment) is incorporated into these models and probability weighted in order to determine the expected credit losses.
The table below further analyzes credit quality of the portfolio (including aging analysis of past due but not impaired assets).
in millions of euros Due from customers
As on December 31, 2020
Neither past due nor impaired 29,885
Past due but not impaired 1,708
< 30 days 1,079
30 to 60 days 416
61 to 90 days 69
> 90 days 144
Impaired* 738
Total exposure 32,331
As on December 31, 2019
Neither past due nor impaired 30,952
Past due but not impaired 2,005
< 30 days 1,292
30 to 60 days 467
61 to 90 days 104
> 90 days 142
Impaired* 674
Total exposure 33,631
* Impaired category illustrates the gross amount of receivables individually determined to be impaired, before deducting the impairment allowance.
Allowance for impairmentImpairment is the difference between contractual and expected cash flows of a financial asset (e.g., finance lease or loan), both discounted to present value using the original implicit rate/effective interest rate. DLL presents allowance for impairment separately from the gross balance of respective assets rather than directly reducing their carrying amounts. Given the number of uncertainties involved in estimation of allowance for impairment, which even become more judgmental in view of COVID-19, it is considered by management to be a key estimate in preparation of these financial statements.
IFRS 9 establishes three different stages for measuring and recognizing expected credit losses. DLL implemented these three-stage expected credit loss impairment models, which involve a significant degree of management judgment. The impairment methodology for balances due from customers results in the recognition of allowances measured at an amount equal to 12-month expected credit losses (stage 1); allowances measured at an amount equal to lifetime expected credit losses for financial assets for which credit risk has increased significantly since initial recognition but that are not credit-impaired financial assets (stage 2); and financial assets that are credit-impaired (stage 3).
Impairment methodologyAfter DLL enters into a lease contract or grants a loan, it conducts continued credit management, closely monitoring payment behavior and for larger and/or higher risk exposures, periodically assesses new financial and non-financial information. DLL’s credit risk management
Non-creditimpaired
Credit impaired
Subject to 12-month
ECL
Subject to lifetime
ECL
Subject to lifetime
ECL
Total gross
exposure
Gross carrying amount in millions of euros Stage 1 Stage 2 Stage 3
December 31, 2020
(Virtually) no risk 640 10 - 650
Adequate to good 24,503 6,227 - 30,730
Vulnerable - 213 - 213
Defaulted - - 738 738
Total gross exposure 25,143 6,450 738 32,331
* Expected credit loss (ECL)
Non-creditimpaired
Credit impaired
Subject to 12-month
ECL
Subject to lifetime
ECL
Subject to lifetime
ECL
Total gross
exposure
Gross carrying amount in millions of euros Stage 1 Stage 2 Stage 3
December 31, 2019
(Virtually) no risk 925 25 - 950
Adequate to good 27,727 4,034 - 31,761
Vulnerable - 246 - 246
Defaulted - - 674 674
Total gross exposure 28,652 4,305 674 33,631
DLL also assesses credit quality of its portfolio within the following categories, which in turn drive the provisioning methodology:– Neither past due nor impaired (performing) are current
receivables within portfolios that are considered to be of good credit quality.
– Past due but not impaired (performing) are overdue balances for which no credit loss is anticipated.
– Impaired (non-performing) are receivables where DLL does not expect to recover all amounts due from customers. This category has low credit quality and includes all assets with default ratings.
DLL’s internal customer ratingIn the financing approval process, DLL uses the Rabobank Risk Rating (RRR), which reflects the risk of failure or the PD of the customer over a period of one year. The table below shows the credit quality of the portfolio related balance sheet items after deduction of the impairment allowance. The quality categories are determined on the basis of the internal RRR. The RRR consists of 21 performance ratings (R0-R20) and four default ratings (D1-D4). The performance ratings assess the probability of default within a period of one year. The rating is determined, in principle, on a cyclically neutral basis. D1-D4 ratings refer to default classifications. D1 represents 90 days past due (depending on local conditions, this may be extended to more than 90 days); D2 indicates high probability that the debtor is unable to pay; D3 indicates that the debtor’s assets will most likely need to be liquidated due to default; and D4 indicates bankruptcy status. The default ratings make up the total impaired exposure. The “vulnerable” category consists of performance ratings that are not (yet) classified as impaired.
Credit risk exposure within quality categories of portfolio assetsThe customer base of DLL mainly consists of small and medium-sized enterprises, which is also reflected in the table below that presents portfolio exposures, including operating leases, by underlying customer risk rating:
in millions of euros Due from customers FAOL*
Total exposure
December 31, 2020
(Virtually) no risk 650 128 778
Adequate to good 30,730 2,441 33,171
Vulnerable 213 20 233
Defaulted 738 58 796
Total exposure 32,331 2,647 34,978
December 31, 2019
(Virtually) no risk 950 131 1,081
Adequate to good 31,761 2,723 34,484
Vulnerable 246 14 260
Defaulted 674 48 722
Total exposure 33,631 2,916 36,547
* Fixed assets under operating lease
The following table shows the credit quality of the financial assets subject to impairment. The gross carrying amount of the financial assets, excluding operating leases, also represents the maximum exposure to credit risk on these assets. A significant part of the increase in stage 2 is caused by the impact of COVID-19.
| }

Contents ContentsConsolidated financial statements Consolidated financial statementsCompany financial statements Company financial statementsManagement Report Management ReportSupervisory Report Supervisory Report
9998
support packages will come to an end. DLL foresees that in that period more defaults will occur in the respective countries (postponed defaults). This base-case scenario is considered the most likely at a 70%, where both the downside and the upside scenarios have a 15% likelihood.
Baseline scenario: GeneralAt the start of 2020, the COVID-19 pandemic was considered just a downside risk to global economic growth, but it quickly developed into an event that has dramatically changed the growth forecasts around the globe and resulted in a global recession in 2020. The subsequent improvement in outlook in 2021 reflect a (partial) bounce-back.
Plus and minus scenarioWe used the plus and minus scenario that is provided by the National Institute Global Econometric Model (NiGEM). The procedure for the formulation involves two steps:1. Application of the stochastic function of NiGEM to run
1000 scenarios starting in the first quarter where the plus and minus scenarios may differ from the baseline and ending in the final quarter of the RaboResearch delivery. NiGEM uses historical residuals (randomly chosen) from the model equations to give shocks during the forecast period (Monte Carlo simulation). The result is the distribution of macroeconomic outcomes based on the historical variance of the world trade loss.
2. Look up the two scenarios which represent the 15% upper scenarios and the 15% lower scenarios of the distribution.
An analysis on the sensitivity of key forward-looking macroeconomic inputs used in the ECL modelling process for stage 1 and stage 2 provisioning and the probability-weights applied to the scenarios are presented below, where the weighted amount of EUR 335 million mentioned represents the ECL recognized in the balance sheet.
Subject to 12-month ECL
Subject to lifetime ECL non-credit impaired
Subject to lifetime ECL credit impaired Total
in millions of euros Stage 1 Stage 2 Stage 3 2020
Balance on January 1 28,652 4,305 674 33,631
New loans and advances originated 16,600 - - 16,600
Loans and advances that have been derecognized (11,693) (3,804) (191) (15,688)
Write-offs - - (183) (183)
Other changes (8,416) 5,949 438 (2,029)
Balance on December 31 25,143 6,450 738 32,331
Subject to 12-month ECL
Subject to lifetime ECL non-credit impaired
Subject to lifetime ECL credit impaired Total
in millions of euros Stage 1 Stage 2 Stage 3 2019
Balance on January 1 27,294 3,481 464 31,239
New loans and advances originated 16,132 - - 16,132
Loans and advances that have been derecognized (11,839) (2,015) - (13,854)
Write-offs - - (141) (141)
Other changes (2,935) 2,839 351 255
Balance on December 31 28,652 4,305 674 33,631
Judgments and estimates on model-based impairment allowances on financial assetsDLL applies the three-stage expected credit loss impairment model for measuring and recognizing expected credit losses, which involves a significant degree of management judgment. The impairment methodology results in the recognition of allowances measured at an amount equal to 12-month expected credit losses (stage 1); allowances measured at an amount equal to lifetime expected credit losses for financial assets for which credit risk has increased significantly since initial recognition but that are not credit-impaired financial assets (stage 2); and financial assets that are credit-impaired (stage 3).
We use estimates and management judgment in determining the expected credit loss in model-based impairment allowances for the following elements.
Significant increase in credit riskJudgment is required to transfer assets from stage 1 to stage 2. To demonstrate the sensitivity of the ECL to the PD thresholds, an analysis was prepared, which assumed all assets were below the PD threshold and apportioned a 12-month ECL. On the same asset base, an analysis was made that assumed all assets were above the PD threshold and apportioned a lifetime ECL. These analyses resulted in ECLs of EUR 307 million and EUR 413 million respectively, compared to current ECL of EUR 335 million.
Forward-looking information and macro-economic scenariosMuch of the impact on the expected credit losses resulting from the COVID-19 pandemic is related to changes to the forward-looking information that had an upward effect on IFRS 9 Stage 1 and 2 credit impairment allowances. The macroeconomic scenarios applied in 2020 were very different to those applied in 2019. During 2021 after a successful vaccination campaign, government financial
In order to allocate financial instruments between stages 1 and 2, DLL uses criteria such as days-past-due status, special asset management status and deterioration of the PD since origination.
For portfolios without individual PDs or with PDs that are not updated on a frequent basis such that an assessment of the change in PD is not possible, a collective assessment on groups of financial instruments with shared credit risk characteristics is made.
Composition of credit losses and other impairmentsThe following table presents the composition of credit losses and other impairments in profit or loss arising from allowance for impairments of due from customers:
in millions of euros 2020 2019
Charge for the year 431 232
Recoveries (38) (39)
Collection and recovery costs 16 15
Total credit losses and other impairments 409 208
Composition of allowance for impairmentThe following table presents movements in allowances of impairment as well as the composition of the allowance. A top-level adjustment of EUR 58 million to reflect the impact of governmental measures of customer defaults is reflected in the charge for the year. Refer to key estimates.
Subject to 12-month ECL
Subject to lifetime ECL non-credit impaired
Subject to lifetime ECL credit impaired Total
in millions of euros Stage 1 Stage 2 Stage 3 2020
Balance on January 1 80 77 212 369
Charge for the year 104 79 36 219
Written off - - (183) (183)
Net exchange differences (3) - (13) (16)
Stage transfers and remeasurement (12) 16 216 220
Balance on December 31 169 172 268 609
Subject to 12-month ECL
Subject to lifetime ECL non-credit impaired
Subject to lifetime ECL credit impaired Total
in millions of euros Stage 1 Stage 2 Stage 3 2019
Balance on January 1 67 46 164 277
Charge for the year 14 30 44 88
Written off - - (156) (156)
Net exchange differences - - - -
Stage transfers and remeasurement (1) 1 160 160
Balance on December 31 80 77 212 369
The following table presents an overview of the significant changes in the gross carrying amount of loans and advances to customers during the period that contributed to changes in the total impairment allowance. The amounts represented under Other changes mainly represent the change in staging, and include the impact of the top side adjustment on the ECL.
DLL uses internal models to estimate PD and LGD parameters as key inputs to its provision calculations. Different modelling methodologies are applied for different portfolios, ranging from statistical models to expert-based models that take into account quantitative and qualitative risk drivers. These models are embedded in the credit approval and internal reporting processes. All models of DLL are regularly reviewed and validated, following the model governance framework of DLL, which includes a Model Risk Committee. Policies ensure controlled procedures surrounding review, (re)development, validation, approval and implementation of models.
b) Stage determination criteriaIn order to allocate financial instruments in scope between the categories 12-month ECL (stage 1), lifetime ECL non-credit-impaired (stage 2) and lifetime ECL credit-impaired (stage 3), a framework of qualitative and quantitative factors has been developed. The criteria for allocating a financial instrument to stage 3 are fully aligned with the criteria for assigning a defaulted status, for example 90 days past due status, or if a debtor is likely to become unable to pay its credit obligations without liquidation of collateral by DLL.
| }

Contents ContentsConsolidated financial statements Consolidated financial statementsCompany financial statements Company financial statementsManagement Report Management ReportSupervisory Report Supervisory Report
101100
2.2 Gains/(losses) from financial instruments
in millions of euros 2020 2019
Gains/(losses) from derivatives held for trading 2 (30)
Foreign exchange differences 10 (2)
Gains from financial assets designated for fair value hedge accounting 16 63
Losses on derivatives used to hedge the interest risk on the portfolio (5) (42)
Total gains/(losses) from financial instruments 23 (11)
Gains/(losses) from derivativesGains/(losses) from derivatives relate to derivative transactions that are undertaken by DLL for risk-mitigation purposes. DLL applies a foreign net investment hedging model, which reduces the volatility of the gains/(losses) reflected in other comprehensive income. Refer to note 3.4.
DLL uses a macro fair value hedging model to hedge fixed-rate EUR and USD loan and finance lease portfolios. DLL opted to use the accounting policy choice of IFRS 9 to continue to apply the IAS 39 EU carve-out for such portfolio hedge accounting. This hedge accounting model is a model that comprises a portfolio of hedged items (finance lease receivables and loans) and a portfolio of hedging instruments (interest rate swaps). At each cash flow date, the model aims to designate an appropriate amount of hedged items to match the swap cash flow. The model performs two tests to determine effectiveness:– Prospective test: Performed at the start of the month,
it assesses the fair value movement of hedged items and hedging instruments due to a 1% parallel shift in interest rate curves.
– Retrospective test: Performed at the end of the month, it compares fair value movement over the period due to actual movement of interest rate curves.
For the model to be effective, the offsetting fair value changes of hedged items and hedging instruments must be within the 80%-125% range for both tests (IAS 39). Changes in the fair value of interest rate derivatives that are designated and qualify as fair value hedges are recorded in the profit or loss, together with the changes in the fair value of the effective part of the hedged items. The changes in fair value of the effective part of hedged items are included in gains/(losses) from financial assets designated for fair value hedge accounting. Refer to note 3.4.
All of the gains/(losses) from derivatives relate to derivatives transacted with Rabobank Group entities.
Foreign exchange differencesPlease refer to note 4.9 for a description of accounting policies related to foreign currency translation.
Performance
2.1 Interest revenue and expensein millions of euros 2020 2019
Interest revenue
Interest income from amounts due from customers 1,642 1,631
Interest income from loans to Rabobank 6 16
Interest income from derivatives with Rabobank 18 116
Other interest income 4 7
1,670 1,770
Interest expense
Interest expense on borrowings from Rabobank (319) (425)
Interest expense on derivatives with Rabobank (72) (136)
Interest expense on other borrowings (140) (131)
Interest expense on debt securities issued (53) (65)
Interest expense on derivatives with other banks (2) (1)
Other interest expense - (1)
(586) (759)
Net interest income 1,084 1,011
Accounting policy for interest revenue and expenseFor financial instruments measured at amortized cost, interest-bearing financial assets classified as measured at fair value and derivatives carried at fair value through profit or loss, interest income and expense are recorded on an accrual basis using the effective interest rate (EIR) method (refer to note 4.9). The calculation takes into account all of the contractual terms of the financial instruments and are an integral part of the EIR, with the exception of future credit losses.
Borrowing costsGeneral and specific borrowing costs that are directly attributable to the acquisition, construction or production of a qualifying asset are capitalized during the period of time that is required to complete and prepare the asset for its intended use or sale. Qualifying assets are assets that necessarily take a substantial period of time to get ready for their intended use or sale.
Investment income earned on the temporary investment of specific borrowings pending their expenditure on qualifying assets is deducted from the borrowing costs eligible for capitalization. Other borrowing costs are expensed in the period in which they are incurred.
Determining objective evidence for changes in creditworthiness and determining the magnitude of the recoverable amount form part of the processes that are surrounded by inherent uncertainty and that involve various assumptions and factors regarding the creditworthiness of the lessees/borrowers, expected future cash flows and the value of collateral.
The unusual circumstances due to the COVID-19 pandemic have led to model outcomes that required expert judgment and adjustments. In Europe, governments took measures to contain the COVID-19 virus. At the end of 2020, the British COVID-19 variant made various European governments decide to expand the lockdown measures. The national governments in Europe gave generous liquidity support to compensate for the effects of the lockdown measures. This support postponed the direct impact of the lockdown measures for most of our business clients. As a result, we have seen very low bankruptcies in Europe in 2020. When government support is reduced in 2021, DLL expects defaults and credit losses to increase. For this reason, management has judged that for the portfolio in Western and Southern Europe the IFRS 9 expected credit loss (ECL) model outcome did not appropriately reflect the increase in expected credit losses, as the credit risk models do not take into account government support.
Therefore management determined a top level adjustment of EUR 58 million using the IFRS 9 ECL model with altered Point in Time probability of default (PD), to incorporate the impact of this government support. PDs were adjusted differently per country and sector, as some sectors were much more impacted compared to other sectors. After PD adjustments the ECL per sector and country reflect the best estimate of management for the future credit risk cost in the portfolio.
Credit-related commitmentsDLL has credit-related commitment risk arising through its ordinary business activities. DLL may, in a number of cases, provide customers with preset credit facilities from which customers can draw. Such obligations expose DLL to similar risks as leases/loans even though these unfunded commitments are not recognized on the balance sheet. These risks are mitigated by the same control process and policies. Refer to note 3.7 for DLL’s liquidity risk management of credit-related commitments.
in millions of euros 2020* 2019*
Undrawn irrevocable credit facilities 5,375 4,990
Guarantees and other commitments 93 116
Total credit-related commitments 5,468 5,106
* As on December 31
in millions of euros
ECL unweighted Probability
Weighted ECL
December 31, 2020
Weighted ECL
December 31, 2019
Unemployment
Plus 315 15%
Baseline 335 70% 335 149
Minus 358 15%
Measurement of expected credit lossesThe PD, LGD and the EAD are used to estimate expected credit losses as inputs for the ECL models. When unexpected external developments or data quality issues are not sufficiently covered by these ECL models, an adjustment will be made based on judgments and estimates. The mentioned inputs also require estimates in the following way:– PD: the probability of default is an estimate of the
likelihood of default over a given time horizon.– LGD: the loss given default is an estimate of the loss
arising in the case where a default occurs at a given time. It is based on the difference between the contractual cash flows due and those that DLL would expect to receive, including cash flows expected from collateral and other credit enhancements.
– EAD: the exposure at default is an estimate of the exposure at a future default date, taking into account expected changes in the exposure after reporting date due to prepayment.
To demonstrate the sensitivity of the ECL for changes in these parameters, the table below shows the impact on the ECL in the baseline scenario resulting from changes in PD and LGD (collateral value).
in millions of euros Impact on ECL per
December 31, 2020
Impact on ECL per
December 31, 2019
PD rating 1 notch deterioration (PD) 118 94
PD rating 1 notch improved (PD) (78) (53)
Collateral value down by 10% (LGD) 35 19
Collateral value up by 10% (LGD) (31) (19)
Key estimate: allowance for impairmentDetermining a provision requires a significant degree of judgment, based on the evaluation of management of risks in the portfolio, the current and expected economic circumstances, customer payment trends, credit losses over the previous years, as well as developments in financial credits, industry sectors, business concentrations and geopolitics. Changes in judgment as well as further analyses may lead to changes in the magnitude of an impairment allowance over time.
| }

Contents ContentsConsolidated financial statements Consolidated financial statementsCompany financial statements Company financial statementsManagement Report Management ReportSupervisory Report Supervisory Report
103102
Key management personnelKey management personnel of DLL consist of the members of the Executive Board (EB) and the Supervisory Board (SB). DLL does not provide any loans, advance payments or guarantees to members of the Executive Board and the Supervisory Board.
Compensation of the Executive Board members:
in thousands of euros 2020 2019
Short-term employee benefits 3,840 3,927
Post-employment benefits 114 111
Total Executive Board compensation 3,954 4,038
Compensation for EB members consists of fixed pay and pension entitlements. They are also entitled to a package of fringe benefits. EB members are not eligible for variable remuneration as of 2016.
On December 31, 2020, a liability of EUR 99 thousand (2019: EUR 178 thousand) in instruments (DRNs) for EB members was recognized. At December 31, 2020, there were a total of 3,263 DRNs outstanding for the EB members (2019: 6,256 DRNs).
In the Netherlands, certain EB members participate in a collective defined contribution scheme. As of January 1, 2020, the maximum income on the basis of which the members of the EB can build up pension is EUR 104,123. Any income exceeding this amount is not pensionable.
One member (2019: one member) of the EB received a total compensation exceeding EUR 1 million in 2020.
The instrument component is converted into DRNs at the time of allocation on completion of the performance year. The number of DRNs is determined on the basis of the closing rates of the RCs as traded during the first five trading days of February of each year. This therefore represents both the instrument component of the direct and the deferred portion of the variable remuneration. The final number of DRNs relating to the deferred portion is established on vesting. The payment of the instrument component is subject to a one-year retention period. After the end of the retention period, the employee receives for each DRN (or a portion thereof) an amount in cash that corresponds with the value of the DRN at that moment.
The variable remuneration is measured in accordance with IAS 19R Employee benefits. The immediate portion of the variable remuneration is recognized in the performance year, whereas the deferred portion is recognized over a period of multiple years.
On December 31, 2020, a liability of EUR 435 thousand was included (2019: EUR 1,035 thousand) in respect to the instrument portion of the variable remuneration of the identified staff. No new variable compensation was awarded in 2020 (2019: EUR 27 thousand). The number of DRNs still outstanding is presented in the following table:
in thousands of DRNs 2020 2019
Opening balance on January 1 35 54
Awarded during the year - 3
Paid in cash during the year (20) (22)
Changes from previous year (1) -
Closing balance on December 31 14 35
The estimated future variable remuneration payments are shown in the following table:
in thousands of euros Year of payment
As on December 31, 2020 2021 2022 2023 2024 2025 Total
Variable remuneration excluding DRNs 25 14 10 - - 49
DRNs 383 25 15 12 - 435
Total 408 39 25 12 - 484
As on December 31, 2019 2020 2021 2022 2023 2024 Total
Variable remuneration excluding DRNs 404 41 14 11 - 470
DRNs 550 420 40 14 11 1,035
Total 954 461 54 25 11 1,505
2.4 Staff expensesin millions of euros 2020 2019
Short-term employee benefit 413 400
Wages and salaries 317 302
Social Security costs 59 60
Temporary staff 37 38
Other short-term benefits 78 82
Pension – defined contribution plans 25 23
Pension – defined benefit plans 1 1
Other long-term employee benefits 2 2
Total staff expenses 519 508
The average number of employees (both internal and external) for DLL was 5,294 (2019: 5,073) of whom 844 (2019: 822) were employed in the Netherlands.
DLL’s remuneration policy consists of fixed and variable remuneration components and various fringe benefits. According to DLL’s remuneration policy, in the Netherlands on average, variable remuneration may not exceed 20% of the fixed income. Outside of the Netherlands, the fixed income, variable pay and benefits are based on the local market of the respective country. In no case is the variable income higher than 100% of base salary, in line with the Rabobank Group Remuneration Policy.
Short-term benefits include wages, paid annual leave, sick leave and parental leave that are expected to be paid within 12 months.
Long-term employee benefits include retirement benefits such as pensions, national pension plan contributions and post-employment life insurance. The pension plans are typically defined contribution plans, for which DLL is obliged to pay periodical contributions. Other long-term employee benefits are DLL’s deferred bonus scheme (i.e., variable remuneration to identified staff).
Identified staffFor employees who have a material influence on the risk profile of DLL (identified staff), if variable remuneration is granted, it is partly deferred in line with EBA regulations (a minimum of 40%). The direct portion of variable remuneration (50%) is unconditional, whereas the deferred portion (50%) is conditional. Each year one-third part of the deferred variable remuneration becomes unconditional. The cash component of the direct portion is immediately paid after it has been awarded. The cash component of the deferred portion is awarded to employees only after vesting. The other 50% of the variable remuneration is awarded in the form of an underlying instrument, i.e. the Deferred Remuneration Note (DRN). The value of a DRN is linked directly to the price of a Rabobank Certificate (RC) as listed on Euronext Amsterdam.
2.3 Fee and other incomein millions of euros 2020 2019
Net early termination income 45 42
Other lease-related fee income 96 117
Insurance brokerage fee income 66 64
Other income 10 16
Net reinsurance income 12 11
Total fee and other income 229 250
Net early termination incomeThis is income arising from gains on lease contracts that were terminated early by the customer and for which penalties were charged.
Other lease-related fee incomeOther lease-related fee income includes lease syndication fees, brokerage commissions and documentation fees. Syndication fees relate to income generated by syndicating lease contracts to third parties. Brokerage commissions are commissions received for the setting up of leasing contracts. Finally, documentation fees relate to the origination services that DLL has performed for its customers (i.e., the assessment of a customer’s credit file), as well as processing fees for small contract changes.
Insurance brokerage fee incomeThis is fee income that DLL receives for brokering insurance contracts for its customers with third-party insurers.
Net reinsurance incomeNet reinsurance income is related to the reinsurance activities of DLL RE Designated Activity Company. For further details on net reinsurance income and its treatment, refer to note 4.4.
Accounting policy for fee incomeFees earned for services that are provided over a period of time are accrued and recognized over that period. Fees and commissions arising from negotiating or participating in the negotiation of a transaction for a third party are recognized on completion of these activities. Fees or components of fees that are linked to a certain performance are recognized only after fulfilling the corresponding criteria.
Fees that are an integral part of corresponding financial instruments are recognized as interest income through an adjustment to the EIR; refer to note 4.9.
| }

Contents ContentsConsolidated financial statements Consolidated financial statementsCompany financial statements Company financial statementsManagement Report Management ReportSupervisory Report Supervisory Report
105104
The statutory tax rate in the Netherlands is 25% (2019: 25%). There were no changes in the statutory tax rate in the Netherlands. The following table shows a reconciliation of the tax expense and the accounting profit multiplied by the domestic tax rate:
in millions of euros 2020 2019
Profit before income tax 242 442
Tax-exempt income (25) (40)
Non-deductible expenses 87 13
Non-recognizable fiscal losses 10 7
Utilization of previously unrecognized tax losses (2) (4)
Local tax credits (61) (13)
Other - (1)
Taxable income 251 404
Tax calculated using applicable tax rates 62 108
Effect of changes in tax rates (2) (3)
Adjustments for prior years 2 6
Other adjustments - 34
Tax expense for the year 62 145
The effect of changes in tax rate in 2020 is EUR (2) million (2019: EUR (3) million). DLL has uncertain tax positions in several countries. If outflow of cash is deemed probable, a current tax liability is recognized. Refer to note 4.4.
Deferred tax assets and liabilities are measured for all temporary differences using the liability method and are detailed as follows:
Reconciliation of the total tax chargeThe effective tax rate for 2020 was 26% and differs from the statutory rate that would arise using the Dutch corporate tax rate. This difference is explained as follows:
in millions of euros % 2020 % 2019
Operating profit before taxation 242 442
Applicable tax rate 25 61 25 111
Increase/(decrease) in taxes resulting from:
Tax-exempt income - (1) (2) (7)
Non-deductible expenses 8 20 1 5
Recognition of previously unrecognized tax losses - (1) - (1)
Other permanent differences 1 3 - 2
Adjustments of previous years 1 2 1 6
Adjustments due to changes in tax rates (1) (2) - (3)
Other non-recurring tax items (8) (20) 8 32
Total income tax 26 62 33 145
The other non-recurring tax items mainly comprise investment allowances.
The Group’s reconciliation of the total tax charge is based on the Dutch domestic tax rate, with a reconciling item in respect to tax rates applied by the Group companies in other jurisdictions. This reconciliation is based on an applicable tax rate that provides the most meaningful information to users.
Administrative expensesAdministrative expenses include costs of traveling, marketing and advertising, consultant fees and the independent auditor’s remuneration.
Administrative charges from parentRabobank recharges several costs and services that are directly attributable to DLL. These include certain central head office costs, but also the charges for bank taxes and resolution levies that all banks are required to pay. These are paid by Rabobank for all Rabobank group entities collectively and subsequently charged to various group entities, including DLL.
Depreciation and amortizationDepreciation and amortization expenses relate to usage of DLL-owned land, buildings and equipment, as well as the amortization of intangible assets. The amount for 2020 was EUR 26 million, compared to EUR 29 million for 2019.
IT-related costsIT-related costs include hardware rent, software rent and maintenance costs, as well as costs of developing software and maintenance costs that do not meet the capitalization criteria in terms of IAS 38 Intangible Assets.
Accounting policy for other operating expensesExpenses are recognized by DLL when the related goods or services have been received or rendered. Accruals are recognized for all such expenses that have been incurred but have not yet been invoiced.
2.6 Taxation
DLL’s key operating entities in the Netherlands are part of the fiscal unity for Dutch corporate income tax purposes of Rabobank (including a number of other domestic subsidiaries). Under the fiscal unity, each participating legal entity is jointly and severally liable for the fiscal unity’s corporate tax liabilities.
The following table summarizes the amounts of tax expenses recognized in profit or loss:
in millions of euros 2020 2019
Current tax charge for the year 169 76
Deferred tax (credit)/charge for the year (109) 63
Origination and reversal of temporary differences (107) 66
Effect of changes in tax rates (2) (3)
Adjustments for prior years 2 6
Tax charge for the year 62 145
Compensation of the Supervisory Board membersThe SB consists of four members. The two external board members receive direct compensation from DLL based on their SB responsibilities. The other SB members are employed by Rabobank and are compensated in that capacity by Rabobank. They do not receive an extra compensation for their SB responsibilities.
The total amount of remuneration for the SB in 2020 was EUR 216 thousand (2019: EUR 183 thousand).
DLL did not pay termination compensation to key management personnel in 2020 (2019: none).
2.5 Other operating expensesin millions of euros 2020 2019
Administrative expenses 112 116
Administrative charges from parent company 50 43
Depreciation and amortization 26 29
IT-related cost 69 70
Total other expenses 257 258
The table below indicates the composition of amounts expensed regarding the independent auditor and its network, included in administration expenses:
in millions of euros 2020 2019
Audit of financial statements 7 7
Other audit services 1 1
Permitted tax services 1 1
Other permitted (non-audit) services - -
Total expenses 9 9
The fees listed above relate to the procedures performed to DLL and its consolidated group entities by Pricewaterhouse-Coopers Accountants N.V. (PwC) and other member firms in the global PwC network, including their tax services and advisory groups. The audit fees relate to the audit of financial statements, regardless of whether the work was performed during the financial year. Next to the statutory audit of these financial statements our independent auditor, PricewaterhouseCoopers Accountants N.V., renders the following services to De Lage Landen International B.V. and its controlled entities: 1) review of the financial statements for one of its controlled entities; 2) audit and review procedures related to the (semi)annual financial reporting towards the parent company; 3) audit procedures in relation to the regulatory returns to be submitted to the regulators; 4) agreed-upon procedures on cost allocations within the group; and 5) audit procedures in relation to information provided to the Dutch Central Bank in relation to the Deposit Guarantee Scheme. The fees of PricewaterhouseCoopers Accountants N.V. for the aforementioned services amounted to EUR 2 million (2019: EUR 2 million).
Deferred tax assets/(liabilities) Profit or loss credit/(charge) Other comprehensive income credit
in millions of euros 2020* 2019* 2020 2019 2020 2019
Deferred tax assets
Leases 40 34 269 18 - -
Allowance for impairment 69 52 26 (3) - -
Provisions 7 6 1 - - -
Fixed assets for own use - - - 6 - -
Uncertain tax positions (4) (3) - 3 - -
Other 8 9 6 19 - -
Net operating losses 14 15 (195) 3 - -
Total deferred tax assets 134 113 107 46 - -
Deferred tax assets/liabilities Profit or loss credit/(charge) Other comprehensive income credit
in millions of euros 2020* 2019* 2020 2019 2020 2019
Deferred tax liabilities
Leases (413) (677) (31) (81) - -
Allowance for impairment 54 9 37 (56) - -
Fixed assets for own use 1 1 - - - -
General reserves - 2 - (6) - -
Uncertain tax postions 1 1 1 1 - -
Other (14) (20) (6) 4 - -
Net operating losses 16 212 1 29 - -
Total deferred tax liabilities (355) (472) 2 (109) - -
Net deferred tax liabilities (221) (359) - - - -
Net deferred tax benefit/(expense) - - 109 (63) - -
* As on December 31
| }

Contents ContentsConsolidated financial statements Consolidated financial statementsCompany financial statements Company financial statementsManagement Report Management ReportSupervisory Report Supervisory Report
107106
The total required CET1 capital ratio as of December 31, 2020, is therefore 7.01%. There is no specific Pillar 2 requirement or guidance issued by the regulator for DLL. As such the minimum requirements are the minimum capital requirements as referred to in European legislation. The actual capital ratios of DLL exceed these minimum capital ratios.
Also note that the following buffers for DLL equal 0% (reference is made to article 128 of the CRD; the combination of these buffers plus the capital conservation buffer is referred to as combined buffer requirement):– The G-SII buffer– The O-SII buffer– The systematic risk buffer
Taking into account the minimum requirements, DLL sets its internal objectives to extend available capital beyond the minimum requirements of supervisors as a response to market expectations and developments in legislation and regulations.
No changes have been made to the objectives, policies and processes of the capital management from the previous years. However, they are under constant review by the EB.
Stress testingStress testing is an important risk management tool for DLL that provides a forward-looking assessment of risk and assists in the optimization of risk capital. It enables the exploration of vulnerabilities in business models while overcoming the limitations of risk models and historical data.
Stress tests are used to measure the impact of extreme yet plausible events. Where necessary, measures are taken on the basis of the results of the stress tests that are in line with DLL’s risk appetite.
Stress test governanceGiven the importance of stress testing in terms of regulatory compliance and sound risk management, the stress testing process and governance warrant the involvement of senior and executive management via review and approval of the approach and results by DLL Global Risk Committee and DLL’s EB.
Stress test activitiesStress tests occur in different scopes. The current types of stress tests that are executed within DLL can be categorized by a variety of determinants, such as:– Scenario (different macroeconomic scenario);– Initiator (external versus internal);– Scope (mainly credit risk); and,– Type (baseline, adverse and reverse stress test).
Applied scenarios include scenarios for a set of regular macroeconomic stress tests, thematic stress tests driven by macroeconomic developments, regulator-provided stress tests, as well as scenarios generated as a result of risk
Regulatory capital requirementsThe relevant rules and regulations related to the capital adequacy process of EU banks are addressed in the Capital Requirements Regulation (CRR) and Capital Requirements Directive IV (CRD IV) comprehensive frameworks. These frameworks are the EU legal translation of the banking guidelines suggested by the Basel Committee – the so-called Basel III standards.
The CRR and the CRD IV define capital requirements for banks as the absolute minimum amount of capital required to cover the financial risks that a bank faces.
These rules, which became effective on January 1, 2014, are applied by DLL. DLL is under direct supervision of the European Central Bank as part of the Rabobank Group.
DLL received waivers for certain reporting requirements as defined in CRR (such as the exemption for solo reporting). Due to the organizational structure of DLL, DLL must, on a subconsolidated basis, meet certain CRR requirements.
The table below presents DLL’s regulatory capital and capital adequacy ratios:
in millions of euros 2020* 2019*
Common Equity Tier 1 capital (CET1) 3,552 3,302
Tier 1 capital (T1) 3,552 3,302
Total capital 3,613 3,306
Risk-weighted assets 19,784 20,937
CET1 ratio 17.95% 15.77%
T1 ratio 17.95% 15.77%
Total capital ratio 18.26% 15.79%
* As on December 31
Capital requirements in 2020 are managed actively by DLL following DLL’s risk strategy, risk appetite and balance sheet management policy. Refer to note 1.3 for description of credit risk management and to note 3.7 for a description of market and liquidity risk management.
Regulatory capital buffersThe buffers in the next overview are applicable as of 2016, and were gradually phased in until 2019. The table shows the minimum legal buffers based on CRR/CRD IV.
CET1 Tier 1 Own funds
Minimum (required) 4.50% 6.00% 8.00%
Pillar 2 0.00% 0.00% 0.00%
Capital conservation buffer 2.50% 2.50% 2.50%
7.00% 8.50% 10.50%
Countercyclical buffer 0.01%
Systemic buffer 0.00% 0.00% 0.00%
0.01%
Funding & Liquidity
3.1 Equity and capital management
Components of equityShare capital and share premiumOn December 31, 2020, DLL’s authorized capital was EUR 454 million (2019: EUR 454 million), divided into 950 ordinary A shares and 50 ordinary B shares (2019: 950 A and 50 B). The nominal value of each share is EUR 454,000 (2019: EUR 454,000). EUR 98 million (2019: EUR 98 million) is issued and paid up, consisting of 215 ordinary shares A (A1-A215) and 2 ordinary shares B (B1 and B2). Additional paid-in capital (share premium) on the outstanding shares amounts to EUR 1,135 million (2019: EUR 1,135 million). For the years 2020 and 2019 there is no difference in shareholders’ rights related to the class A and class B shares.
Retained earningsRetained earnings represents DLL’s undistributed cumulative net profits, where profit is appropriated upon decision of the shareholder. DLL’s retained earnings also include cumulative actuarial gains/losses on remeasurement of DLL’s defined benefit plans. Annual actuarial gains/losses resulting from this remeasurement are not recyclable through profit or loss and are therefore recognized directly in retained earnings rather than as a separate reserve in equity. These movements are recorded as a component of other comprehensive income in the period in which they arise.
Foreign currency translation reserve (FCTR)Exchange differences arising from translation of DLL’s net investment in foreign operations and the associated fair value movements of the hedge instruments used in a hedge relationship are recognized as FCTR. Movements in FCTR are recorded as a component of other comprehensive income in the period in which they arise. The hedging reserve on December 31, 2020, amounts to EUR 191 million (2019: EUR 61 million) and the translation reserve on December 31, 2020 amounts to EUR (251) million (2019: EUR 19 million).
DividendsIn 2020 no dividend was paid to the sole shareholder Coöperatieve Rabobank U.A. (2019: no dividend).
Capital managementDLL obtains its capital from its parent, Rabobank. DLL’s Executive Board (EB) is responsible for capital management of DLL and further ensures compliance with regulatory requirements imposed on DLL. Effective and efficient capital management is realized by a strong focus on capital allocation. The EB controls the local business and actual capital levels to ensure sufficient capital is held to meet local regulatory requirements as well.
Unrecognized deferred tax assetsNo deferred tax asset of EUR 5 million (2019: EUR 7 million) has been recognized for unused tax losses, because there are no sufficient future taxable profits expected to utilize these tax losses. These carry-forward losses relate to various tax jurisdictions and their term to maturity is above 3 years.
The movement in the net deferred tax liabilitiesThe movement in the net deferred tax liabilities can be summarized as follows:
in millions of euros 2020 2019
Net deferred tax liabilities on January 1 (359) (286)
Profit or loss credit/(charge) 109 (63)
Other comprehensive income credit/(charge) 1 (1)
Net exchange differences 23 (7)
Other 5 (2)
Net deferred tax liabilities on December 31 (221) (359)
Recognition of deferred tax assetsThe Group is subject to corporate income tax in numerous jurisdictions. Estimation is required in determining the Group’s deferred tax positions.
Deferred tax assets in a particular DLL entity are recognized for deductible temporary differences, unused tax losses and unused tax credits to the extent it is probable that taxable profits will be available in that entity against which the deferred tax asset can be utilized in the foreseeable future, as based on forecasts. Where an entity has a history of tax losses, no deferred tax asset is recognized until such time that there is certainty about future profitability of that entity.
Tax losses carried forwardThe future taxable profits available to utilize deferred tax assets (including deductible temporary differences, unused tax losses and unused tax credits), are regularly reassessed for respective entities, and recognized deferred tax asset balances are adjusted when required.
The Group recognizes deferred tax assets for the tax value of losses and tax credits carried forward to the extent that the realization of the related tax benefit through future taxable profits is probable. The deferred tax assets for the tax value of losses and tax credits carried forward amount to EUR 30 million (2019: EUR 227 million) of which EUR 3 million is expected to be recovered within a year (2019: EUR 1 million).
| }

Contents ContentsConsolidated financial statements Consolidated financial statementsCompany financial statements Company financial statementsManagement Report Management ReportSupervisory Report Supervisory Report
109108
DLL attracts external funding through securitizations as part of its overall funding strategy. The fair value of issued debt securities on December 31, 2020, was EUR 1,238 million (2019: EUR 2,749 million). This fair value was estimated using a discounted cash flow model where the discount rate is determined by cost of funds of DLL and the relevant market interest rate extrapolated from a market yield curve. Since the inputs for this model are observable market inputs that are adjusted as needed, these fair value measurements are classified as Level 2 within the fair value hierarchy as described in note 4.9.
Key judgment: consolidation of special purpose vehiclesControl over a special purpose vehicle (SPV) is usually not evidenced by direct shareholding/voting rights, but rather by indirect factors that require significant judgment.
DLL decides whether an SPV should be included in the consolidated financial statements on the basis of an assessment of its control over the SPV and its exposure to variable returns from its involvement. DLL takes a number of factors into consideration, including the activities carried out by the SPV, decision-making powers and the allocation of the benefits and risks (exposure to losses) associated with the activities of the SPV.
The securitization SPVs are deemed to be “auto-pilot” entities because their operations and cash flows are prescribed by the respective securitization documentation. DLL retains control over the operating activities related to the underlying (securitized) assets and retains most of the risks associated with these assets through the subordinated class B notes that it holds in each transaction. Accordingly, DLL concluded that it controls these SPVs and consolidates them in these financial statements.
Accounting policy for issued debt securitiesIssued debt securities, issued as a part of the securitization transaction, are financial liabilities carried at amortized cost. Issued debt securities are initially recognized at fair value, net of directly attributable transaction costs. After initial recognition, issued debt securities are measured at amortized cost using the EIR method. Please refer to note 4.9 for a description of the EIR method.
3.4 Derivatives
DLL enters into the vast majority of derivative transactions with Rabobank, except for the countries where Rabobank does not have an office or where Rabobank does not have the capability to offer financial derivatives to DLL. In such cases, DLL enters into derivative transactions with locally present high-profile banks (at least rated AA- for long term): as of December 31, 2020, the fair value of these derivatives was EUR (1) million (2019: EUR 1 million). There is no collateral posted or received regarding derivatives.
The fair value of long-term borrowings as on December 31, 2020, was EUR 25,461 million (2019: EUR 25,186 million). This fair value was estimated using a discounted cash flow model where the discount rate is determined based on observable yield curves at commonly quoted intervals. Since the inputs for this model are observable market inputs that are adjusted to the situation, these fair value measurements are classified as Level 2 within the fair value hierarchy as described in note 4.9. For short-term loans and overdrafts the carrying amount is deemed to reflect fair value.
Accounting policy for short-term loans and long-term borrowingsRecognition and measurementLoans and borrowings are financial liabilities carried at amortized cost. These are recognized when DLL becomes a party to a respective contract and are initially recognized at fair value net of directly attributable capitalized transaction costs. After initial recognition, short-term loans and borrowings are measured at amortized cost using the effective interest rate (EIR) method. Refer to note 4.9 for a description of the EIR method.
In case of premature repayment of the borrowings by DLL, lenders (including Rabobank) may charge DLL prepayment penalties, where such penalties are provided by the contract. Such prepayment penalties are accounted for as an expense when charged within interest expenses.
DerecognitionShort-term and long-term loans and borrowings are derecognized when the obligations of DLL under the respective contract are discharged (for instance, by repayment of all amounts due) or canceled or expire. Where gains and losses arise on derecognition, they are recognized in profit or loss.
3.3 Issued debt securities
Issued debt securities represent asset-backed securities issued by DLL in the following securitization transactions:
in millions of euros 2020* 2019*
Securitization transactions:
U.S. public finance securitizations 15 56
DLL 2017A 49 152
DLL 2018-1 LLC 123 327
DLL 2018-2 LLC 151 448
DLL UK Equipment Finance 2019 Plc 89 215
DLL 2019-1 LLC 178 330
DLL 2019-2 LLC 168 318
DLL 2019-3 LLC 458 903
Total issued debt securities 1,231 2,749
* As on December 31
EUR-denominated loans to Rabobank in the amount of EUR 919 million (2019: EUR 1,923 million), included in due from banks (refer to note 3.5). This structure relates to a loan-deposit structure between DLL and Rabobank that is used to mitigate DLL’s foreign currency risk in respect to net investments in foreign subsidiaries. These loans and deposits are floating and fixed-rate transactions and carry interest rates of EURIBOR and LIBOR, plus funding spreads where duration exceeds one year and maturity is in 2021. These loans are pledged as collateral for the corresponding borrowings. While the principal amounts and terms of these loans match, they do not qualify for offsetting and are recorded gross in the consolidated statement of financial position.
Other long-term borrowings are received by DLL local entities in several countries and include the following main borrowings:– A long-term funding program from the National Bank for
Economic and Social Development (BNDES) in Brazil is aimed at supporting financing of local industry, with a total agreed amount of EUR 733 million (2019: EUR 991 million) and a maturity ranging from 1 to 10 years. The carrying amount as on December 31, 2020, was EUR 717 million (2019: EUR 971 million) an annually pre-fixed rate of 0% to 8.4% or post-fixed rate of 1.6% to 12.87% plus Brazilian Long-term Interest Rate (5.02% for the year ended December 31, 2020) (2019: 4.87%).
– Long-term borrowing from the European Investment Bank (EIB) was received for the purpose of supporting small and medium-sized borrowers with a total facility amount of EUR 799 million (2019: EUR 970 million) and a maturity ranging from 1 to 5 years. The carrying amount as on December 31, 2020 was EUR 799 million (2019: EUR 970 million), with interest rates ranging from 0.044% to 2.141% (2019: 0.044% to 3.299%).
– Long-term collateralized financing was received in the U.S. from multiple financial counterparties with a maturity ranging from 0 to 4 years. The carrying amount as on December 31, 2020, was EUR 1,686 million with interest rates ranging between (0.57)% and 3.59% (2019: EUR 3,008 million, (0.57)% to 3.59%). DLL pledged operating lease receivables in the U.S. as collateral for this financing in the amount of EUR 375 million (2019: EUR 470 million), as well as finance receivables in the amount of EUR 1,688 million (2019: EUR 2,909 million); refer to note 1.1 and note 1.2.
Management monitors all contractual covenants regarding funding. In neither 2020 nor 2019 were there breaches of covenants that could give any lender a right to demand accelerated repayment of a respective borrowing.
For all short-term loans and overdrafts and long-term borrowings, expected maturities match respective contractual maturities. Contractual liquidity gap analysis as well as the principal and interest contractual cash flows of short-term loans and overdrafts and long-term borrowings are presented in note 3.7.
identification and ad hoc scenarios. In the various internal and external scenarios both macroeconomic and non-macroeconomic factors are taken into account. The macroeconomic factors include growth, unemployment, inflation and interest rates.
Once a scenario is generated, quantitative approaches are developed. The stress test models used for that are subject to review by the model validation team. Subsequently, the stress tests are executed.
The results of stress tests include impact on the CET1 ratio and its constituent parts (CET1 capital and Risk Weighted Assets) over a projected period of five years. In each scenario, the CET1 ratio is compared to the applied recovery trigger.
The results of stress testing in 2020 demonstrate that DLL’s capital levels were above the required thresholds across all five years forecasted and under each scenario.
3.2 Short-term loans and long-term borrowings
in millions of euros 2020* 2019*
Short-term loans and overdrafts
Short-term loans from Rabobank 5,786 6,609
Other short-term loans 17 48
5,803 6,657
Long-term borrowings
Long-term borrowings from Rabobank 23,059 22,068
Other long-term borrowings 2,565 3,184
25,624 25,252
Total short-term loans and long- term borrowings 31,427 31,909
* As on December 31
Short-term loans and overdrafts represent balances that are repaid within 12 months of reporting date.
DLL receives the majority of its funding from its parent, Rabobank, through individually agreed long- and short-term loans, which are part of a long-term multi-currency facility with no end-date. DLL acts within the limits of this facility. For maturity analysis of loans drawn under this facility, refer to note 3.7. While these tranches are mainly fixed-tenor loans, the specific terms of these loans (currency, maturity and interest rate) are individually agreed upon.
Also included in the long-term borrowings from Rabobank as of December 31, 2020, is a USD denominated loan of EUR 349 million (2019: EUR 465 million). The short-term loans from Rabobank on December 31, 2020, amount to EUR 528 million (2019: EUR 1,438 million). This adds up to total loans of EUR 877 million (2019: EUR 1,903 million). As the second leg of this loan-deposit structure, DLL issued
| }

Contents ContentsConsolidated financial statements Consolidated financial statementsCompany financial statements Company financial statementsManagement Report Management ReportSupervisory Report Supervisory Report
111110
DLL uses derivative financial instruments to mitigate interest rate risk as well as foreign exchange risk to which DLL is exposed. All derivative transactions are therefore undertaken for risk-mitigation purposes. DLL has implemented hedge accounting solutions for both foreign net investment hedging and macro fair value hedging. DLL uses the IAS 39 EU carve-out options, which allow the application of fair value portfolio hedge accounting to certain positions.
Fair value hedgesDLL uses interest rate swaps to manage the interest rate risk of the assets with a fixed-rate nature in both local and foreign currencies, such as finance leases and loans. DLL has implemented a macro fair value hedging model for EUR and USD. The hedge effectiveness is tested by comparing the changes in fair value of the hedged items against the changes in fair value of the hedge instruments, both prospectively and retrospectively. The model runs the tests on a monthly basis and is effective if the results are within the effectiveness range as defined by IAS 39.
Since the inputs for this model are observable market inputs that are adjusted to the situation, these fair value measurements are classified as Level 2 within the fair value hierarchy as described in note 4.9.
The ineffectiveness for the year ended December 31, 2020, was EUR 11 million (2019: EUR 21 million). The result on the hedging instrument amounted to EUR (5) million (2019: EUR (42) million), with the positive result from the hedged position to be allocated to the hedged risk, amounting to EUR 16 million (2019: EUR 63 million). Refer to note 2.2.
Net investment hedgesDLL uses foreign forward-exchange contracts to hedge the currency translation risk of net investments in foreign operations. On December 31, 2020, forward contracts with a nominal amount of EUR 854 million (2019: EUR 1,139 million) were designated as net investment hedges. These resulted in exchange gains of EUR 130 million for the year (2019: EUR 73 million), which were recorded in equity. For the years ended December 31, 2020, and December 31, 2019, DLL reported no material ineffectiveness resulting from the net investment hedges.
Key estimate: Fair value of derivativesThe fair value of derivatives is determined using valuation techniques and is based on discounted cash flow models using observable market inputs. Management therefore considers fair value of derivatives a key estimate. The discounting curve applied depends on the currency of the underlying derivative, where an appropriate cross-currency base adjustment is applied for cross-currency derivatives. When measuring the fair value, counterparty credit risks as well as own credit risk are taken into account (Credit/Debit Valuation Adjustment, respectively).
Hedges of net investments in foreign operations are measured at fair value, with changes in the fair value (to the extent that they are effective) being recognized in other comprehensive income. Changes in the hedged equity instrument resulting from exchange rate fluctuations are also recognized in other comprehensive income. Gains and losses accumulated in other comprehensive income are reclassified to profit or losses when the equity instrument is disposed of.
Notionals and measure- at-fair-value derivatives
2020* 2019*
in millions of euros Notional amounts
Fair value assets
Fair value liabilities
Notional amounts
Fair value assets
Fair value liabilities
Derivatives held for trading 1,421 13 (34) 7,694 35 (40)
Derivatives held for hedging 7,101 5 (79) 8,764 5 (79)
Total derivative financial assets/liabilities 8,522 18 (113) 16,458 40 (119)
Derivatives held for trading
- Foreign exchange forwards** 192 3 - 259 4 -
- Cross-currency swaps 384 10 (20) 335 14 (5)
- Interest rate swaps 845 - (14) 7,100 17 (35)
Total derivative held for trading 1,421 13 (34) 7,694 35 (40)
Derivatives designated as fair value hedge
- Cross-currency swaps - - - - - -
- Interest rate swaps 6,244 - (75) 7,616 4 (75)
Total derivatives designated as fair value hedge 6,244 - (75) 7,616 4 (75)
Derivatives designated as foreign net investment hedge
- Foreign exchange forwards** 857 5 (4) 1,148 1 (4)
Total derivatives designated as foreign net investment hedge 857 5 (4) 1,148 1 (4)
Total designated derivative financial instruments 7,101 5 (79) 8,764 5 (79)
* As on December 31** Including non-deliverable forwards.
Maturity profile and average interest rate of hedging instruments in fair value hedges
Remaining maturity
in millions of euros Notional amounts Less than 1 year 1 - 5 years Longer than 5 years
On December 31, 2020
Hedging instrument-hedge of finance lease receivables and loans 6,244 56 2,517 3,671
Average fixed interest rate 0.30% 0.37% 0.26% 0.32%
On December 31, 2019
Hedging instrument-hedge of finance lease receivables and loans 7,616 55 1,240 6,321
Average fixed interest rate 0.57% 0.70% 0.66% 0.45%
The main inputs of the estimated fair values are interest rate curves and currency rates. Sensitivity of the DLL exposures (including derivative exposures) to these variables is disclosed in note 3.7.
The estimation of the fair values of these derivatives is executed by DLL’s Treasury that operates within DLL control framework, which ensures sufficient governance and control within the process. The resulting fair values are reviewed and signed off on appropriately by DLL Treasury and DLL management.
Accounting policy: DerivativesDerivatives are recognized at trade date, being the date when DLL becomes a party to a derivative contract. These derivatives are classified as assets or liabilities measured at fair value through profit or loss. If and when a hedge is designated in a hedging relationship, at time of inception, derivatives are designated as one of the following:1) a hedge of the fair value of an asset, a group of assets or
a liability in the statement of financial position (fair value hedge); or
2) a hedge of a net investment in a foreign operation (net investment hedge).
Hedge accounting is applied for derivatives designated in this manner, provided that certain criteria are met, including the following:– There must be formal documentation of the hedging
instrument, the hedged item, the objective of the hedge, the hedging strategy and the hedge relationship.
– The hedge must be expected to be effective, within 80% to 125%, in covering changes in the hedged item’s measured fair value allocable to the hedged risks during the reporting period.
– The hedge must be continuously effective from the moment of its inception.
– There is an economic relationship between the hedged item and hedging instrument. As the hedging items (interest rate swaps) hedge the interest rate risk of the hedged items (lease assets) on a portfolio basis, specific rules have been implemented to include only permissible hedged items in the hedge accounting model.
Changes in the fair value of derivatives that are designated as fair value hedges and are effective in terms of the hedged risks are recognized in the statement of income in “Gains/(losses) from financial instruments,” together with the corresponding changes in the fair values of the assets or liabilities hedged. As and when the hedge no longer meets the criteria for hedge accounting, the cumulative adjustment to the fair value of the hedged assets or liabilities is amortized through profit and loss over the relevant interest repricing period. Refer to note 2.2.
| }

Contents ContentsConsolidated financial statements Consolidated financial statementsCompany financial statements Company financial statementsManagement Report Management ReportSupervisory Report Supervisory Report
113112
of EUR 349 million (2019: EUR 465 million) and short-term borrowings of EUR 528 million (2019: EUR 1,438 million) where the issued loans are pledged as collateral for these borrowings. These loans and deposits are floating and fixed-rate transactions that mature in 2021. The loans are designated in USD currency. They carry interest rates based on 1M USD LIBOR plus currency funding spreads. The EUR-designated deposits carry interest rates based on 1M EURIBOR plus EUR funding spreads. Refer to note 3.2.
While the principal amounts and terms of these loans match, they do not qualify for offsetting and are recorded gross in the consolidated statement of financial position.
The loans to and receivables from Rabobank relate to liquidity management and are short-term balances of both fixed and floating loans issued primarily in USD and EUR. These loans bear interest rates ranging between (0.5)% and 2.1% (2019: between (0.45)% and 2.64%).
2020 Remaining maturity per reporting date
in millions of euros Less than 1 year 1–5 years More than 5 years
Maturities
Notional amount of hedging instrument 1,731 - -
Carrying amountChanges in the value of the hedging instrument
recognized in other comprehensive income
in millions of euros Notional amount Assets Liabilities
Designed hedging instruments
Foreign exchange derivatives 854 855 854 (130)
Foreign exchange loans 877 - 877 Included in foreign exchange derivatives
in millions of euros
Change in value used for calculating hedge
ineffectivenessForeign currency translation
reserve for continuing hedges
Remaining foreign currency translation reserve from hedging relationships for which
hedge accounting is no longer applied
Designated hedged items
Net investment 270 249 3
2019 Remaining maturity per reporting date
in millions of euros Less than 1 year 1–5 years More than 5 years
Maturities
Notional amount of hedging instrument 2,596 488 -
Carrying amount
Change in fair value used for calculating hedge
ineffectiveness for current year
Changes in the value of the hedging instrument recognized in other comprehensive income
in millions of euros Notional amount Assets Liabilities
Designed hedging instruments
Foreign exchange derivatives 1,139 1,135 1,139 73 73
Foreign exchange loans1,944 - -
Included in foreign exchange derivatives
Included in foreign exchange derivatives
in millions of euros Change in value used for calculating hedge
ineffectivenessForeign currency translation
reserve for continuing hedges
Remaining foreign currency translation reserve from hedging relationships for which
hedge accounting is no longer applied
Designated hedged items
Net investment (69) (115) 96
3.5 Due from banksin millions of euros 2020* 2019*
Loans to and receivables from Rabobank 2,143 2,399
Reverse repurchase agreements with Rabobank 29 11
Loans to and receivables from other banks 29 24
Total due from banks 2,201 2,434
* As on December 31
DLL issued EUR-denominated loans to Rabobank entities amounting to EUR 919 million (2019: EUR 1,923 million) that relate to a loan-deposit structure between DLL and Rabobank, which is used to mitigate foreign currency risk of DLL’s net investments in foreign subsidiaries. These loans and deposits are floating and fixed-rate transactions carrying interest rates of EURIBOR and LIBOR, plus funding spreads where the durations exceed one year. Under these loan-deposit structures, DLL has received USD-denominated long-term borrowings from Rabobank
Designated hedging instruments in fair value hedges of interest rate risk
in millions of euros Carrying amount derivative financial assets
Carrying amount derivative financial liability
Change in fair value used for calculating hedge ineffectiveness
On December 31, 2020
Hedge of finance lease receivables and loans 68 6,176 (44)
Hedge of financial assets at fair value through OCI - - -
Hedge of issued debt securities - - -
On December 31, 2019
Hedge of finance lease receivables and loans 1,665 5,951 (74)
Hedge of financial assets at fair value through OCI - - -
Hedge of issued debt securities - - -
Designated hedged items in fair value hedges of interest rate risk
in millions of euros
Carrying amount
Accumulated amount of fair value hedge adjusted on the hedged
item included in the carrying amount of the hedged item
Change in fair value used for
calculating hedge ineffectiveness
Accumulated amount for fair value hedge adjustments remaining for any
hedged item that has ceased to be adjusted for hedging gain and losses
On December 31, 2020
Finance lease receivables and loans 6,627 (38) 42 -
Financial assets at fair value through OCI - - - -
Issued debt securities - - - -
On December 31, 2019
Finance lease receivables and loans 7,622 88 65 -
Financial assets at fair value through OCI - - - -
Issued debt securities - - - -
Hedge ineffectiveness of fair value hedges amounts to EUR 11 million (2019: EUR 21 million) and is included in the statement of income on line item “Gains/(losses) on financial assets and liabilities at fair value through profit or loss.”
Net investment hedgesDLL uses forward currency contracts to hedge a portion of the currency translation risk of net investments in foreign operations. For the changes in the value of the hedging instrument recognized in other comprehensive income and the amount reclassified from the net investment hedge reserve to profit or loss, reference is made to note 3.1: Capital management, reserves and retained earnings. Hedge ineffectiveness amounts to EUR 126 thousand (2019: EUR 40 thousand) and is included in the statement of income on line item “Gains/(losses) on financial assets and liabilities at fair value through profit or loss.”
| }

Contents ContentsConsolidated financial statements Consolidated financial statementsCompany financial statements Company financial statementsManagement Report Management ReportSupervisory Report Supervisory Report
115114
The monthly level of EatR is monitored by Group Treasury. Month on month there is some variation in terms of the total number. However, the level of EatR remains stable at a very small percentage of the total interest income (2020 0.4% vs 2019 0.5%). The EatR values on December 31, 2020, and December 31, 2019, are therefore representative of the entire respective years. DLL’s total EatR for the down scenario on December 31, 2020, across currencies and aggregating the impact of both fixed and floating interest impacts, was EUR 4.98 million (2019: EUR 4.97 million), while the steepening scenario was EUR 4.51 million (2019: EUR 5.13 million).
Interest rate risk exposureOn a consolidated DLL level, interest rate risk is managed by calculation of a one-basis-point delta move (PV01) on the net interest rate gap. This interest rate gap is monitored monthly against an overall limit. Interest rate risk is also managed at country level using a similar analysis per time bucket and monitored by Group Treasury. On December 31, 2020, DLL’s PV01 on the net interest rate gap was EUR (372,370) (2019: EUR (337,129)). The table below analyzes DLL’s interest rate risk exposure by presenting carrying amounts of interest-bearing financial instruments and operating leases at the earlier of repricing or contractual maturity. For finance lease and loan receivables, DLL manages repricing risk with reference to expected maturity rather than contractual maturity. Derivatives are presented at their net notional position per interest rate type (refer to note 3.4 for gross notional positions).
Securities received under reverse repurchase agreements are listed bonds issued by the Brazilian government with a fair value of EUR 29 million (2019: EUR 11 million).
For all due from banks, contractual maturities reflect their expected maturities. Contractual liquidity gap analysis as well as the principal and interest contractual cash flows of due from banks are presented in note 3.7.
The fair value of due from banks on December 31, 2020, was EUR 2,218 million (2019: EUR 2,427 million). This fair value was estimated using a discounted cash flow model where the discount rate is determined based on observable yield curves at commonly quoted intervals. Since the inputs for this model are observable market inputs that are adjusted as necessary, these fair value measurements are classified as Level 2 within the fair value hierarchy as described in note 4.9.
Accounting policy for due from banksDue from banks are non-derivative financial assets with fixed or determinable payments that are not quoted in an active market. They are initially recognized at fair value and are subsequently measured at amortized cost using the EIR method, less allowance for impairment. Refer to note 4.9 for a description of the EIR method.
Securities purchased under agreements to resell at a specified future date are not recognized in the statement of financial position. The consideration paid, including accrued interest, is recorded in the statement of financial position as due from banks (reverse repurchase agreements), reflecting the transaction’s economic substance as a loan by DLL. The difference between the purchase and resale prices is recorded in interest income and is accrued over the life of the agreement using EIR.
3.6 Cash and cash equivalentsin millions of euros 2020* 2019*
Current account Rabobank and its related entities 300 257
Current account other banks 116 166
Total cash and cash equivalents 416 423
* As on December 31
Cash and cash equivalents do not bear material credit risk, as cash is primarily maintained on the accounts of Rabobank (S&P A+ rating). Current accounts with other banks are held with banks holding A ratings or higher. Cash is usually held in the functional currency of the subsidiary that holds the account. All cash is directly available for use for DLL.
Accounting policy for cash and cash equivalentsCash and cash equivalents as referred to in the statement of cash flows and statement of financial position comprise cash on hand, non-restricted current accounts with banks
and amounts due from banks on demand or with an original maturity of three months or less. These cash and cash equivalents are held at amortized cost, which due to the short maturity approximates their fair value. These fair values are classified as Level 1 in the fair value hierarchy; refer to note 4.9 for further details.
3.7 Market and liquidity risk management
Market riskMarket risk is the risk that the fair value or future cash flows of financial instruments will fluctuate due to changes in market variables such as interest rates, foreign exchange rates or equity prices. Also considered part of market risk is prepayment risk. The main financial instruments held by DLL that are affected by market risk include financial lease receivables, loans issued, high-quality bonds and investments held, borrowings, debt securities issued, cash and derivatives.
For risk management purposes, DLL also recognizes an exposure to market risk on its operating lease portfolio. DLL manages market risk collectively for all portfolio assets (including operating leases) as part of the same processes and risk governance that are in line with industry standards, as well as DLL’s own risk strategy. DLL is not exposed to material risk on third-party equity instruments.
Interest rate riskInterest rate risk arises from the possibility that changes in interest rates will affect future cash flows or the fair values of financial instruments. DLL aims to achieve stable earnings from interest margins and not from exposure to uncertain or volatile interest rate risk position outcomes. This is achieved by a policy of mitigation of interest risk exposures through transacting money market and derivative instruments with mainly Rabobank and also some third-party banks. Additionally, DLL may incur financial loss because its customers and counterparties repay or request repayment earlier than expected. DLL manages prepayment risk as part of interest rate risk.
To manage the above risks, DLL applies a policy of match-funding, taking into account the equity that is deployed, to all asset-financing businesses from an interest rate perspective. Interest rate exposures on certain finance lease and loan portfolios are mitigated based on their expected maturity terms (or repricing if shorter) and for the remaining portfolio financial assets on contractual maturity terms (or repricing if shorter). DLL uses historic termination information to identify finance lease and loan portfolios with a consistent early termination pattern and calculates expected maturity terms using a minimum of three years’ data. These expected maturity terms are approved by DLL’s Asset and Liability Committee (ALCO) and are reviewed annually.
Where equity or short-term liquidity is used to fund assets, derivative transactions may be used to cover the longer-term interest rate risk with the approval of Group Treasury. DLL applies fair value hedge accounting for interest rate risk on its derivative portfolio.
Interest rate risk sensitivity analysisDLL assesses interest rate risk sensitivity through monthly calculation of an Earnings at Risk (EatR) sensitivity analysis. Four scenarios are tested (EatR interest rates up, EatR interest rates down, DNB interest rates down curve steepening and curve flattening) and analyzed per currency.
The scenarios are analyzed for movement in the fixed-rate (five-year) and floating rate (one-month) over a one- and two-year time horizon, and the cumulative impact of each scenario is converted into euro. This is tracked both in aggregate and per scenario per currency.
DLL monitors all scenarios in the one-year time horizon, with a specific loss limit of EUR 10 million set for all scenarios that yield a negative result. This limit is monitored on a monthly basis and any breaches are reported to DLL’s ALCO. There were no limit breaches in 2020 or 2019.
in millions of euros Carrying amount* < 1 month
1 to 3 months
3 to 12 months
1 to 5 years >5 years
As on December 31, 2020
Interest-bearing assets
Cash 416 416 - - - -
Due from banks 2,201 1,026 243 128 773 31
Due from customers 32,331 6,956 1,527 6,831 15,952 1,065
Fixed assets under operating lease 2,647 44 271 687 1,589 56
37,595 8,442 2,041 7,646 18,314 1,152
Interest-bearing liabilities
Short-term loans and overdrafts (5,803) (4,745) (887) (171) - -
Issued debt securities (1,231) (147) (152) (541) (391) -
Long-term borrowings (25,624) (3,958) (3,008) (5,414) (12,422) (822)
(32,658) (8,850) (4,047) (6,126) (12,813) (822)
Derivatives
Interest rate swap – net floating-rate notional 6,717 5,309 1,408 - - -
Interest rate swap – net fixed-rate notional (6,717) (189) (390) (1,283) (4,674) (181)
FX derivative net 2 2 - - - -
Derivative FV adjustment - - - - - -
Cross-currency swap – net floating-rate notional 193 174 19 - - -
Cross-currency swap – net fixed-rate notional (195) (9) (17) 9 (165) (13)
- 5,287 1,020 (1,274) (4,839) (194)
Net interest balance 4,937 4,879 (986) 246 662 136
* Except in the case of derivatives that are presented at notional value rather than carrying amount.
| }
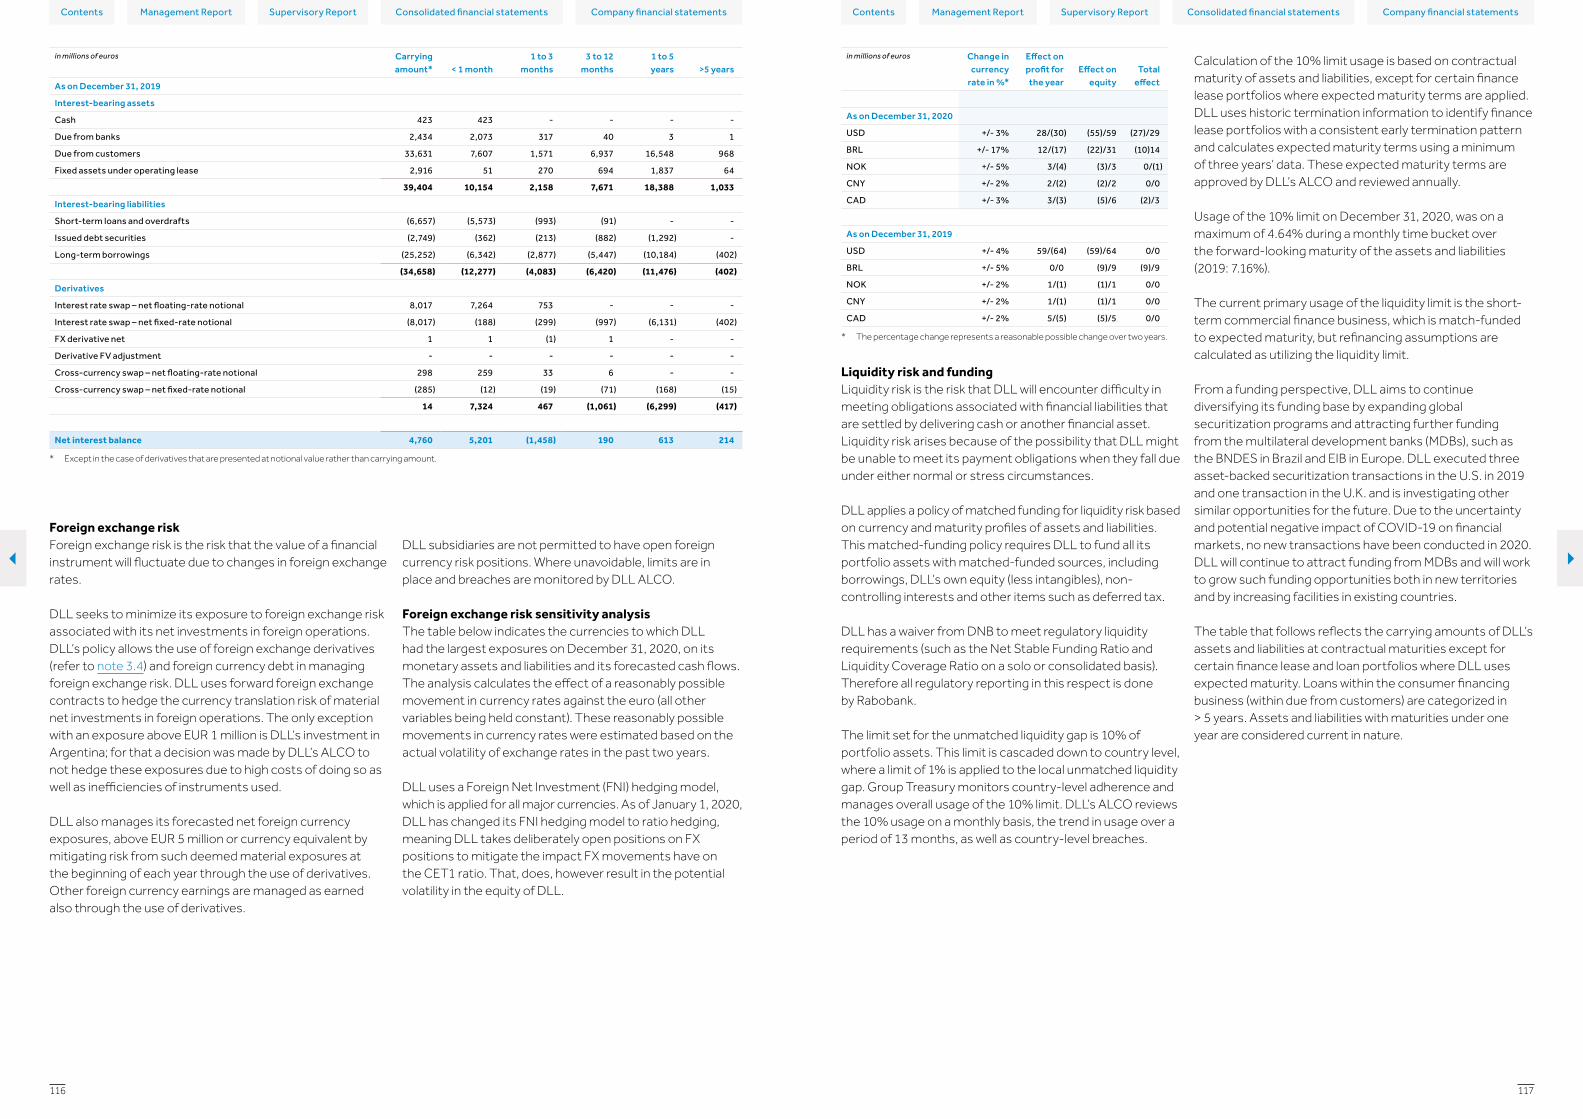
Contents ContentsConsolidated financial statements Consolidated financial statementsCompany financial statements Company financial statementsManagement Report Management ReportSupervisory Report Supervisory Report
117116
in millions of euros Change in currency
rate in %*
Effect on profit for
the yearEffect on
equityTotal
effect
As on December 31, 2020
USD +/- 3% 28/(30) (55)/59 (27)/29
BRL +/- 17% 12/(17) (22)/31 (10)14
NOK +/- 5% 3/(4) (3)/3 0/(1)
CNY +/- 2% 2/(2) (2)/2 0/0
CAD +/- 3% 3/(3) (5)/6 (2)/3
As on December 31, 2019
USD +/- 4% 59/(64) (59)/64 0/0
BRL +/- 5% 0/0 (9)/9 (9)/9
NOK +/- 2% 1/(1) (1)/1 0/0
CNY +/- 2% 1/(1) (1)/1 0/0
CAD +/- 2% 5/(5) (5)/5 0/0
* The percentage change represents a reasonable possible change over two years.
Liquidity risk and fundingLiquidity risk is the risk that DLL will encounter difficulty in meeting obligations associated with financial liabilities that are settled by delivering cash or another financial asset. Liquidity risk arises because of the possibility that DLL might be unable to meet its payment obligations when they fall due under either normal or stress circumstances.
DLL applies a policy of matched funding for liquidity risk based on currency and maturity profiles of assets and liabilities. This matched-funding policy requires DLL to fund all its portfolio assets with matched-funded sources, including borrowings, DLL’s own equity (less intangibles), non-controlling interests and other items such as deferred tax.
DLL has a waiver from DNB to meet regulatory liquidity requirements (such as the Net Stable Funding Ratio and Liquidity Coverage Ratio on a solo or consolidated basis). Therefore all regulatory reporting in this respect is done by Rabobank.
The limit set for the unmatched liquidity gap is 10% of portfolio assets. This limit is cascaded down to country level, where a limit of 1% is applied to the local unmatched liquidity gap. Group Treasury monitors country-level adherence and manages overall usage of the 10% limit. DLL’s ALCO reviews the 10% usage on a monthly basis, the trend in usage over a period of 13 months, as well as country-level breaches.
DLL subsidiaries are not permitted to have open foreign currency risk positions. Where unavoidable, limits are in place and breaches are monitored by DLL ALCO.
Foreign exchange risk sensitivity analysisThe table below indicates the currencies to which DLL had the largest exposures on December 31, 2020, on its monetary assets and liabilities and its forecasted cash flows. The analysis calculates the effect of a reasonably possible movement in currency rates against the euro (all other variables being held constant). These reasonably possible movements in currency rates were estimated based on the actual volatility of exchange rates in the past two years.
DLL uses a Foreign Net Investment (FNI) hedging model, which is applied for all major currencies. As of January 1, 2020, DLL has changed its FNI hedging model to ratio hedging, meaning DLL takes deliberately open positions on FX positions to mitigate the impact FX movements have on the CET1 ratio. That, does, however result in the potential volatility in the equity of DLL.
in millions of euros Carrying amount* < 1 month
1 to 3 months
3 to 12 months
1 to 5 years >5 years
As on December 31, 2019
Interest-bearing assets
Cash 423 423 - - - -
Due from banks 2,434 2,073 317 40 3 1
Due from customers 33,631 7,607 1,571 6,937 16,548 968
Fixed assets under operating lease 2,916 51 270 694 1,837 64
39,404 10,154 2,158 7,671 18,388 1,033
Interest-bearing liabilities
Short-term loans and overdrafts (6,657) (5,573) (993) (91) - -
Issued debt securities (2,749) (362) (213) (882) (1,292) -
Long-term borrowings (25,252) (6,342) (2,877) (5,447) (10,184) (402)
(34,658) (12,277) (4,083) (6,420) (11,476) (402)
Derivatives
Interest rate swap – net floating-rate notional 8,017 7,264 753 - - -
Interest rate swap – net fixed-rate notional (8,017) (188) (299) (997) (6,131) (402)
FX derivative net 1 1 (1) 1 - -
Derivative FV adjustment - - - - - -
Cross-currency swap – net floating-rate notional 298 259 33 6 - -
Cross-currency swap – net fixed-rate notional (285) (12) (19) (71) (168) (15)
14 7,324 467 (1,061) (6,299) (417)
Net interest balance 4,760 5,201 (1,458) 190 613 214
* Except in the case of derivatives that are presented at notional value rather than carrying amount.
Foreign exchange riskForeign exchange risk is the risk that the value of a financial instrument will fluctuate due to changes in foreign exchange rates.
DLL seeks to minimize its exposure to foreign exchange risk associated with its net investments in foreign operations. DLL’s policy allows the use of foreign exchange derivatives (refer to note 3.4) and foreign currency debt in managing foreign exchange risk. DLL uses forward foreign exchange contracts to hedge the currency translation risk of material net investments in foreign operations. The only exception with an exposure above EUR 1 million is DLL’s investment in Argentina; for that a decision was made by DLL’s ALCO to not hedge these exposures due to high costs of doing so as well as inefficiencies of instruments used.
DLL also manages its forecasted net foreign currency exposures, above EUR 5 million or currency equivalent by mitigating risk from such deemed material exposures at the beginning of each year through the use of derivatives. Other foreign currency earnings are managed as earned also through the use of derivatives.
Calculation of the 10% limit usage is based on contractual maturity of assets and liabilities, except for certain finance lease portfolios where expected maturity terms are applied. DLL uses historic termination information to identify finance lease portfolios with a consistent early termination pattern and calculates expected maturity terms using a minimum of three years’ data. These expected maturity terms are approved by DLL’s ALCO and reviewed annually.
Usage of the 10% limit on December 31, 2020, was on a maximum of 4.64% during a monthly time bucket over the forward-looking maturity of the assets and liabilities (2019: 7.16%).
The current primary usage of the liquidity limit is the short-term commercial finance business, which is match-funded to expected maturity, but refinancing assumptions are calculated as utilizing the liquidity limit.
From a funding perspective, DLL aims to continue diversifying its funding base by expanding global securitization programs and attracting further funding from the multilateral development banks (MDBs), such as the BNDES in Brazil and EIB in Europe. DLL executed three asset-backed securitization transactions in the U.S. in 2019 and one transaction in the U.K. and is investigating other similar opportunities for the future. Due to the uncertainty and potential negative impact of COVID-19 on financial markets, no new transactions have been conducted in 2020. DLL will continue to attract funding from MDBs and will work to grow such funding opportunities both in new territories and by increasing facilities in existing countries.
The table that follows reflects the carrying amounts of DLL’s assets and liabilities at contractual maturities except for certain finance lease and loan portfolios where DLL uses expected maturity. Loans within the consumer financing business (within due from customers) are categorized in > 5 years. Assets and liabilities with maturities under one year are considered current in nature.
| }

Contents ContentsConsolidated financial statements Consolidated financial statementsCompany financial statements Company financial statementsManagement Report Management ReportSupervisory Report Supervisory Report
119118
The table below summarizes the maturity profile of undiscounted contractual cash flows of DLL’s financial liabilities. Cash flows from gross-settled, non-trading derivatives are shown separately by their contractual maturity. Repayments subject to notice are treated as if notice was immediate.
in millions of euros
TotalOn
demand < 3 months3 to 12
months1 to 5 years > 5 years
As on December 31, 2020
Undiscounted financial liabilities
Short-term loans and overdrafts (5,801) (2,618) (2,203) (980) - -
Accounts payable* (611) - (611) - - -
Issued debt securities (1,256) (47) (176) (616) (417) -
Long-term borrowings (26,348) (1,234) (1,430) (7,268) (15,501) (915)
(34,016) (3,899) (4,420) (8,864) (15,918) (915)
Non-trading gross-settled derivatives
Derivative assets
Contractual amounts receivable 618 385 133 59 29 12
Contractual amounts payable (596) (379) (132) (51) (24) (10)
22 6 1 8 5 2
Derivative liabilities
Contractual amounts receivable 588 115 233 93 138 9
Contractual amounts payable (653) (121) (241) (113) (167) (11)
(65) (6) (8) (20) (29) (2)
(34,059) (3,899) (4,427) (8,876) (15,942) (915)
* The effects of discounting are immaterial, and therefore aggregated cash flows approximate carrying amount.
in millions of euros
TotalOn
demand < 3 months3 to 12
months1 to 5 years > 5 years
As on December 31, 2019
Undiscounted financial liabilities
Short-term loans and overdrafts (6,662) (5,438) (1,133) (91) - -
Accounts payable* (629) - (629) - - -
Issued debt securities (2,831) (89) (259) (1,043) (1,440) -
Long-term borrowings (26,033) (1,033) (1,655) (7,782) (15,065) (498)
(36,155) (6,560) (3,676) (8,916) (16,505) (498)
Non-trading gross-settled derivatives
Derivative assets
Contractual amounts receivable 739 226 234 120 142 17
Contractual amounts payable (722) (221) (232) (111) (142) (16)
17 5 2 9 - 1
Derivative liabilities
Contractual amounts receivable 882 609 161 41 63 8
Contractual amounts payable (1,025) (616) (171) (80) (147) (11)
(143) (7) (10) (39) (84) (3)
(36,281) (6,562) (3,684) (8,946) (16,589) (500)
* The effects of discounting are immaterial, and therefore aggregated cash flows approximate carrying amount.
Liquidity management of credit-related commitmentsUndrawn loan commitments are assessed and managed by DLL at the earliest date they can be drawn down by customers. For DLL, this is largely on demand. For issued financial guarantee contracts, the maximum amount of the guarantee is managed at the earliest period in which the guarantee could be called, which is also on demand. Refer to note 1.3 for DLL’s credit risk management of these credit-related commitments.
in millions of euros Carrying amount < 1 month
1 to 3 months
3 to 12 months
1 to 5 years > 5 years
No contractual maturity
As on December 31, 2020
Assets
Cash 416 416 - - - - -
Accounts receivable and other short-term assets 593 72 314 207 - - -
Derivatives 18 6 1 7 3 2 (1)
Due from banks 2,201 928 (47) 128 1,161 31 -
Due from customers 32,331 1,739 4,410 7,395 17,643 1,144 -
Fixed assets under operating lease 2,647 44 271 687 1,589 56 -
Goodwill and other intangible assets 6 - - - - - 6
Current tax receivable 102 - - - - - 102
Deferred tax asset 134 - - - - - 134
Other assets 177 - - - - - 177
38,625 3,205 4,949 8,424 20,396 1,233 418
Liabilities
Short-term loans and overdrafts (5,803) (2,618) (2,203) (982) - - -
Accounts payable and other short-term liabilities (666) - (666) - - - -
Issued debt securities (1,231) (44) (172) (604) (411) - -
Provisions (98) - - - - - (98)
Derivatives (113) (2) (3) (6) (9) - (93)
Long-term borrowings (25,624) (1,208) (1,376) (7,035) (15,107) (898) -
Current tax payable (86) - - - - - (86)
Deferred tax liability (355) - - - - - (355)
Other liabilities (469) - - - - - (469)
(34,445) (3,872) (4,420) (8,627) (15,527) (898) (1,101)
Net liquidity balance 4,180 (667) 529 (203) 4,869 335 (683)
in millions of euros Carrying amount < 1 month
1 to 3 months
3 to 12 months
1 to 5 years > 5 years
No contractual maturity
As on December 31, 2019
Assets
Cash 423 423 - - - - -
Accounts receivable and other short-term assets 740 90 394 256 - - -
Derivatives 40 3 - 6 10 2 19
Due from banks 2,434 1,579 1 40 813 1 -
Due from customers 33,631 1,699 4,881 7,676 18,334 1,041 -
Fixed assets under operating lease 2,916 51 270 694 1,837 64 -
Goodwill and other intangible assets 76 - - - - - 76
Current tax receivable 120 - - - - - 120
Deferred tax asset 113 - - - - - 113
Other assets 196 - - - - - 196
40,689 3,845 5,546 8,672 20,994 1,108 524
Liabilities
Short-term loans and overdrafts (6,657) (5,433) (1,133) (91) - - -
Accounts payable and other short-term liabilities (688) - (688) - - - -
Issued debt securities (2,749) (83) (249) (1,006) (1,411) - -
Provisions (90) - - - - - (90)
Derivatives (119) (3) (1) (1) (2) - (112)
Long-term borrowings (25,252) (1,002) (1,593) (7,517) (14,656) (484) -
Current tax payable (52) - - - - - (52)
Deferred tax liability (472) - - - - - (472)
Other liabilities (428) - - - - - (428)
(36,507) (6,521) (3,664) (8,615) (16,069) (484) (1,154)
Net liquidity balance 4,182 (2,676) 1,882 57 4,925 624 (630)
| }

Contents ContentsConsolidated financial statements Consolidated financial statementsCompany financial statements Company financial statementsManagement Report Management ReportSupervisory Report Supervisory Report
121120
B. Other intangible assetsOther intangible assets comprise mainly purchased and self-developed software. Purchased software is recognized at cost when this can be reliably measured and it is probable that economic benefits will flow to DLL. Internally developed software is capitalized only if these are capable of being separated from DLL or arise from contractual or other legal rights. Internal development occurs in two phases: research (planning and investigation); and development (the application of this). DLL expenses research cost while it capitalizes development cost.
Following initial recognition, other intangible assets are amortized on a straight-line basis over their estimated useful lives and carried at cost less accumulated amortization and impairment losses. All other intangible assets are amortized over the definite useful economic life (ranging from 5 to 10 years and reviewed each year). Amortization of intangible assets is included in other operating expenses. Other intangible assets are tested for impairment upon indication of impairment. Impairment losses are recognized immediately in profit or loss. Changes in the expected useful life or the expected future benefit related to the asset are accounted for prospectively.
4.2 Accounts receivable and other assetsin millions of euros 2020* 2019*
Accounts receivable and other short-term assets
Prepayments 72 86
VAT to be claimed 76 102
Inventory 85 105
Accounts receivable 153 197
Bond portfolio 207 250
593 740
Other assets
Fixed assets for own use 99 104
Investments in associates 24 24
Other 54 68
177 196
Total other assets 770 936
* As on December 31
Other
4.1 Goodwill and other intangible assetsin millions of euros Goodwill Other Total
Cost 71 159 230
Accumulated amortization and impairment (1) (153) (154)
Carrying amount as on January 1, 2020 70 6 76
Purchases - 4 4
Impairment (70) - (70)
Disposals - - -
Net exchange differences - - -
Amortization - (4) (4)
Closing balance - 6 6
Cost 71 160 231
Accumulated amortization and impairment (71) (154) (225)
Carrying amount as on December 31, 2020 - 6 6
Cost 72 162 234
Accumulated amortization and impairment - (151) (151)
Carrying amount as on January 1, 2019 72 11 83
Purchases - 2 2
Impairment (1) - (1)
Amortization - (7) (7)
Net exchange differences (1) - (1)
Closing balance 70 6 76
Cost 71 163 234
Accumulated amortization and impairment (1) (157) (158)
Carrying amount as on December 31, 2019 70 6 76
Goodwill is allocated to the lowest identifiable cash-generating unit (CGU). During 2020, the goodwill of EUR 70 million attributable to the CGU in the Nordics was fully impaired. The CGU includes all of DLL’s activities in Sweden, Norway, Finland and Denmark. The outlook for the future profitability of this subsidiary has deteriorated which was caused by lower future net profits due to the lower portfolio (due to COVID-19), the shift to relatively lower margin business and higher expected credit losses. These elements, in combination with the increase of future minimum required capital due to the Basel IV output floor implementation gave an indication of potential impairment of the goodwill. The test to establish whether this potential impairment had occurred, resulted in an impairment of goodwill of EUR 70 million.
Goodwill impairment testingGoodwill is tested for impairment annually by comparing the carrying amount of the CGU to which goodwill was allocated with the best estimate of that CGU’s recoverable amount that is determined based on its value in use. The recoverable amount of the CGU has been determined calculating the value in use, which amounts to EUR 198 million. A discounted
cash flow (DCF) model is applied in order to calculate the value in use. The two key parameters in application of the DCF are the discount rate and the cash flow forecasts.
Discount rateThe pre-tax discount rate is used to determine the present value of forecasted cash flows in order to determine the value in use of the CGU. As on December 31, 2020, the discount rate applied by DLL was 7.32% (2019: 5.49%). The discount rate is determined using the capital asset pricing model (CAPM), with key inputs being:– Risk-free rate: 20-year (2019: 20-year) government
bonds– Beta: an average across a selection of appropriate
companies– Equity market risk premium: Publicly available research
on market risk premiums prepared by external valuation experts
Cash flow forecastsFor this purpose, the best estimate of the value in use is determined on the basis of a cash flow forecast as derived from the annual internal capital adequacy assessment process (ICAAP). This forecast reflect management’s best estimates of market conditions, market restrictions, growth in and composition of operations and other relevant factors. The projections have taken into account developments and uncertainties around COVID-19 and are endorsed by management. Projections are made for a four-year period. A terminal growth rate of 1.0% (2019: 1.0%) is applied for the periods into perpetuity.
Accounting policy for goodwill and other intangible assets
A. GoodwillConsideration provided in a business combination in excess of the fair value of the identifiable net assets acquired is recognized as goodwill, subject to an assessment of its recoverability.
Following initial recognition, goodwill is measured at cost less any accumulated impairment losses. Goodwill is reviewed for impairment annually or more frequently if there are indicators of impairment.
For the purpose of impairment testing, goodwill acquired in a business combination is, from the acquisition date, allocated to each of DLL’s CGUs, which are expected to benefit from the synergies of the combination. Each unit to which the goodwill is allocated represents the lowest level within DLL at which the goodwill is monitored for internal management purposes and is not larger than an operating segment in accordance with IFRS 8 Operating Segments. When subsidiaries are disposed, associated goodwill is written off against the net proceeds and included in the result from disposal that is recorded in the statement of profit or loss.
InventoryInventory represents assets for resale, which comprise equipment returned to DLL after related lease contracts have ended. These assets are remarketed by DLL in the short term.
Prepayments and VAT represents non-interest-bearing assets that are settled on a short term.
Accounts receivableAccounts receivable represents non-interest-bearing amounts due to DLL. Among others, these receivables relate to maintenance fees and commissions.
Accounts receivable typically have a maturity of 30-90 days. On December 31, 2020, there were no material accounts receivable aged beyond 90 days (2019: none). Furthermore, due to the short-term nature of these accounts receivable, their carrying amount is assumed to approximate their fair value.
Bond portfolioThe fair value bond portfolio comprises investments in U.S. money market funds, Dutch government bonds and Argentina investments. The investments in Dutch bonds amount to EUR 91 million (2019: EUR 91 million) that are held by DLL in Sweden for the purpose of compliance with local regulatory liquidity requirements. This portfolio is measured using quoted market prices as of the reporting date (Level 1). Revaluation of these assets measured at fair value is recognized in a reserve in equity (via other comprehensive income). Investments in U.S. money market funds amount to EUR 114 million (level 1) (2019: EUR 159 million). These investments are held as part of securitization transactions issued. In 2020, Argentina invested EUR 2 million of excess in cash in a local fund. The funds invest in AAA-rated instruments. The risk on these bonds is deemed very low and, as a result no loss allowance is in place.
Fixed assets for own useFixed assets for own use represent land and buildings as well as office, other equipment and right-of-use assets used by DLL. DLL did not realize any gains or losses from the disposal of these assets during 2020. The table that follows presents key movements in the fixed assets balances:
| }

Contents ContentsConsolidated financial statements Consolidated financial statementsCompany financial statements Company financial statementsManagement Report Management ReportSupervisory Report Supervisory Report
123122
The lease liability is measured at the present value of the lease payments. The lease payments comprise the following payments for the right to use the underlying asset during the lease term that are not paid at the commencement date:– Fixed payments less any lease incentives received– Variable lease payments that depend on an index or a
rate, initially measured using the index or rate as at the commencement date
– Amounts expected to be payable by the lessee under residual value guarantees
– The exercise price of a purchase option if the lessee is reasonably certain to exercise that option
– Payments of penalties for terminating the lease, if the lease term reflects the lessee exercising an option to terminate the lease
The lease payments are discounted using the interest rate implicit in the lease. If that rate cannot be determined, the incremental borrowing rate is used, being the rate that DLL would have to pay to borrow the funds necessary to obtain an asset of similar value in a similar economic environment with similar terms and conditions. DLL defines the incremental borrowing rate as the internal funding rate (FTP rate) plus an asset-specific premium.
The right-of-use asset is measured at an amount equal to the lease liability, adjusted by the lease payments made at or before the commencement date less any lease incentives received and any initial direct costs and restoration costs. Payments associated with short-term leases and leases of low-value assets are recognized on a straight-line basis as an expense in profit or loss. Short-term leases are leases with a lease term of 12 months or less. DLL recognizes the right-of-use assets as part of the line item Property and Equipment and the lease liability as part of line item Other Liabilities in the Consolidated Statement of Financial Position.
Accounting policy for investments in associatesInvestments in associates are accounted using the equity method of accounting.
Accounting policy for bond portfolio and money market fundsFinancial assets measured at fair value include government bonds that are held to meet liquidity requirements in a regulated subsidiary of DLL and U.S. money market funds.
Unrealized gains or losses are recognized in other comprehensive income and adjusted in the fair value reserve until such time that the investment is derecognized. When the investment is derecognized, the cumulative gain or loss is recognized in gains/(losses) from financial instruments in profit or loss. Interest earned while holding fair value financial assets is reported as interest income using the effective interest rate (EIR) method. Refer to note 4.9 for a description of the EIR method.
Accounting policy for fixed assets for own useAll items classified as fixed assets for own use in the statement of financial position are initially measured at cost. After initial recognition, these are carried at historical cost less accumulated depreciation. Subsequent costs are only capitalized when future economic benefits are increased, probable and can be measured reliably.
Depreciation is calculated on the straight-line basis over the estimated useful life to the estimated residual value, as follows:
Type of asset Years
Land Indefinite
Own buildings 40 years
Equipment 3 - 20 years
An item of fixed assets for own use is derecognized upon disposal or when no future economic benefits are expected from its use or disposal. Any gain or loss arising on derecognition of the asset (calculated as the difference between the net disposal proceeds and the carrying amount of the asset) is included in profit or loss when the asset is derecognized.
The residual values, useful lives and method of depreciation are reviewed regularly and at least at each financial year-end. These are adjusted prospectively, if necessary.
Accounting policy for right-of-use assetsDLL as a lessee recognizes a right-of-use asset representing its right to use the underlying leased asset and a corresponding liability representing its obligation to make lease payments at the date at which the leased asset is available for use. Each lease payment is allocated between the lease liability and interest expense. The interest expenses are charged to profit or loss over the lease period so as to produce a constant periodic rate of interest on the remaining balance of the liability for each period. The right-of-use assets are depreciated over the lease term on a straight-line basis.
Investments in associatesInvestments in associates represent interests held in various European leasing entities where DLL exhibits significant influence but does not control the entity nor is entitled to significant economic benefits or risk associated with this ownership. The share of profit of associates attributable to DLL is included in other income.
Other assetsThese mainly consist of capitalized commissions and non-lease receivables related to operating lease contracts (maintenance).
Accounting policy for accounts receivableAccounts receivable are recognized for services performed by DLL or goods transferred for which DLL has not yet received payment for the revenues earned. They are carried at amortized cost, which approximates the nominal value due to its short-term nature.
Accounting policy for prepayments and VATPrepayments and VAT are carried at nominal value due to its short-term nature.
Accounting policy for inventoryInventory is valued at the lower of cost and net realizable value. The cost is determined as the net book value of a respective asset when this asset is returned to DLL after the related lease contract has ended. The net realizable value is the estimated selling price in the ordinary course of remarketing, less estimated selling costs.
in millions of euros Land and buildings Equipment
Right-of-use assets Total
Cost 86 93 44 223
Accumulated depreciation and impairment (47) (61) (11) (119)
Carrying amount at January 1, 2020 39 32 33 104
Disposals - (1) - (1)
Purchases - 4 19 23
Depreciation (2) (8) (12) (22)
Net exchange differences (2) (1) (1) (4)
Cost 83 82 59 224
Accumulated depreciation (48) (56) (20) (124)
Total carrying amount at December 31, 2020 35 26 39 100
Cost 86 100 - 186
Accumulated depreciation and impairment (45) (67) - (112)
Carrying amount at January 1, 2019 41 33 - 74
Adoption IFRS 16 - - 38 38
Purchases - 7 3 10
Depreciation (2) (8) (11) (21)
Net exchange differences - - 3 3
Total carrying amount at December 31, 2019 39 32 33 104
Right-of-use assetsDLL has several lease contracts as a lessee, predominantly related to property used as offices and cars for employees. The consolidated statement of financial position shows the following amounts relating to leases:
in millions of euros 2020* 2019*
Property lease 33 27
Car lease 6 6
Total right-of-use assets 39 33
Total lease liabilities 40 34
* As on December 31
Additions to right-of-use assets during 2020 were EUR 19 million (2019: EUR 3 million). The consolidated statement of profit or loss shows the following amounts relating to right-of-use assets:
in millions of euros 2020 2019
Property lease 9 8
Car lease 3 3
Depreciation charge of right-of-use assets 12 11
Interest expense 1 1
Expenses relating to short-term leases - -
Expense relating to low-value assets - -
Expense relating to variable lease payments not included in lease liabilities - -
The total cash outflow for leases in 2020 was EUR 14 million (2019: EUR 13 million).
| }

Contents ContentsConsolidated financial statements Consolidated financial statementsCompany financial statements Company financial statementsManagement Report Management ReportSupervisory Report Supervisory Report
125124
Insurance-related provisionsInsurance-related provisions include unearned reinsurance premium reserve and loss reserves (outstanding loss reserve and reserve for incurred but not reported losses, or incurred but not reported (IBNR) reserve). These reserves arise from reinsurance activities carried out by DLL through its subsidiary DLL RE Designated Activity Company in Ireland (DLL RE). These reinsurance activities are limited to providing reinsurance coverage to insurance companies related to insured property, personal accident and liability risks associated with assets that DLL finances to its customers.
DLL RE operates as a non-life reinsurance business, reinsuring programs underwritten by insurance companies insuring risks related to assets, leases and financing provided by DLL.
Insurance-related provisions comprised:
in millions of euros 2020* 2019*
Unearned premium reserve 61 54
Loss reserves 18 20
Total insurance-related provisions 79 74
* As on December 31
The analysis of the remaining maturity of the insurance-related provisions is included in the note 3.7.
Over 65% (2019: over 54%) of total premiums written are related to reinsurance of physical damage of motor vehicles (predominantly agricultural equipment).
Changes in insurance-related provisions are presented below:
in millions of euros 2020* 2019*
Unearned premium reserve
Opening balance 54 46
Premiums written 32 26
Premiums earned (21) (18)
Net exchange differences (4) -
Closing balance 61 54
Loss reserve
Opening balance 20 22
Movement in provision (1) (2)
Net exchange differences (1) -
Closing balance 18 20
* As on December 31
The total amount of premiums written by DLL RE was EUR 32 million (2019: EUR 26 million) net of movements in unearned premium reserve and loss reserves as detailed above. The total amount of claims paid of EUR 11 million (2019: EUR 10 million) is included in other income.
– Net interest income/expense is calculated by applying the discount rate to the net defined benefit liability or asset and is recognized directly in profit or loss in other interest income/expense as appropriate.
– Service costs – comprise current service costs, past service costs, gains and losses on curtailments and non-routine settlements recognized directly in profit or loss in staff expenses.
4.4 Provisionsin millions of euros 2020* 2019*
Provision for restructuring 12 6
Provision for legal claims 7 10
19 16
Insurance-related provisions 79 74
Total provisions 98 90
* As on December 31
Provision for restructuringProvisions for restructuring consist of future payments relating to redundancy and other costs directly attributable to a reorganization program. The outflow is expected to occur in 2021. Staff are notified before any provision for restructuring is recognized.
Provision for legal claimsLegal claims contain provisions related to legal claims against DLL. This provision is based on the best possible estimates of the outcomes that take into account legal advice received where available. The timing of the cash outflow of these provisions is uncertain because the outcome of the disputes and the time involved are complex to reasonably predict.
Changes in provisions (other than insurance provisions, which are presented separately below) were as follows:
in millions of euros
Provision for restructuring
Provision for legal
claims Total
As on January 1, 2020 6 10 16
Added 12 2 14
Released/ reclassified (3) (1) (4)
Exchange rate differences - (2) (2)
Utilized (3) (2) (5)
As on December 31, 2020 12 7 19
As on January 1, 2019 12 16 28
Added - 6 6
Released/ reclassified (1) (7) (8)
Utilized (5) (5) (10)
As on December 31, 2019 6 10 16
.
DLL SwedenThe defined benefit plan in Sweden is an unfunded plan. However, the fund administrator of DLL Sweden’s defined benefit plan issues credit insurance against which employee pensions are secured. Employees will therefore receive their pensions regardless of the financial position of DLL Sweden.
In 2020, there were no material changes to underlying assumptions.
Both defined benefit plans demonstrated no material sensitivity to a reasonably possible change in the key underlying assumptions (discount rate, income increase, inflation rate and mortality) on December 31, 2020 (nor on December 31, 2019).
Valuation of net defined benefit liabilitiesThe value of a defined benefit pension liability is determined through a full actuarial valuation by a qualified independent actuary. This valuation, performed annually, involves making assumptions about discount rates, expected rates of return on assets, future salary increases, mortality rates and future pension increases. These assumptions are developed by a qualified independent actuary and validated by the management of DLL Sweden (for DLL Sweden pension plan) or the management of Rabobank London Branch (for the DLL U.K. pension plan).
Accounts payable and other liabilitiesThese mainly consist of wage tax and Social Security to be paid and accrued expenses related to external service providers and pensions.
Accounting policy for accounts payableAccounts payable are recognized for services consumed by DLL or goods received for which DLL has not yet paid. They are carried at amortized cost, which approximates the nominal value due to its short-term nature.
Accounting policy for net defined benefit plan liabilities– The cost of providing benefits is determined separately
for each plan using the projected unit credit method.– Plan assets (only applicable to DLL U.K.) are measured at
fair value at balance sheet date.– Remeasurements comprise actuarial gains and losses,
the effect of the asset ceiling (excluding amounts included in net interest on the net defined benefit liability) and the return on plan assets (excluding amounts included in net interest on the net defined benefit liability). Remeasurements are recognized immediately in the statement of financial position with a corresponding adjustment to equity through other comprehensive income in the period in which they occur. Remeasurements are not reclassified to profit or loss in subsequent periods.
4.3 Accounts payable and other liabilities
in millions of euros 2020* 2019*
Accounts payable and other short-term liabilities
Accounts payable 553 562
Accrued expenses 58 67
VAT payable 55 59
666 688
Other liabilities
Deferred income 138 150
Net defined benefit plan liability 29 25
Lease liabilities 40 34
Other 262 219
469 428
Total other liabilities 1,135 1,116
* As on December 31
Accounts payableAccounts payables are non-interest-bearing short-term obligations due from DLL that and are normally settled on 60-day terms. Furthermore, due to the short-term nature of these accounts payable, their carrying amount approximates their fair value.
Net defined benefit plan liabilitiesA defined benefit pension plan is a retirement plan that defines an amount of pension benefit an employee is entitled to receive on retirement, dependent on one or more factors such as age, years of service and salary.
DLL has two defined benefit pension plans in the U.K. and in Sweden:
in millions of euros 2020* 2019*
DLL U.K.
Plan assets 10 10
Plan liabilities (17) (15)
Net defined benefit plan liability (7) (5)
DLL Sweden
Net defined benefit plan liability (22) (20)
Total net defined benefit plans liabilities (29) (25)
* As on December 31
DLL U.K.The defined benefit plan in the U.K. requires contributions to be made to a fund in which both DLL Leasing Limited and Rabobank London Branch participate. The fund is closed to new members and is therefore a runoff scheme with no active members and only deferred members and retired members on December 31, 2020. DLL has a constructive obligation to fund any deficits on the plan in relation to its (former) staff.
| }

Contents ContentsConsolidated financial statements Consolidated financial statementsCompany financial statements Company financial statementsManagement Report Management ReportSupervisory Report Supervisory Report
127126
From time to time DLL enters into transactions with its related parties. All related-party transactions were made at arm’s length on normal commercial terms and conditions and at market rates. Information about such transactions and associated balances, income and expenses are disclosed in these financial statements as follows:
Related party and type of transaction Note
Rabobank and members of Rabobank Group
Borrowings 3.2
Associated interest expenses 2.1
Derivatives 3.4
Associated gains and losses 2.2
Due from banks 3.5
Associated interest income 2.1
Issued debt securities 3.3
Cash and cash equivalents 3.6
Administrative cost from the parent 2.5
Net defined benefit liability 4.3
Associates
Investment in associates 4.2
Share of profit or loss of associates 4.2
Key management personnel of DLL
Short- and long-term benefits and other remuneration 2.4
4.6 Commitments and contingencies
CommitmentsFinancial guarantees and undrawn irrevocable credit facilitiesTo meet the financial needs of customers, DLL enters into various revocable and irrevocable commitments in the ordinary course of conducting its business. These commitments include financial guarantees and commitments to provide financing to customers. Even though these obligations are not recognized on the balance sheet, DLL is exposed to credit risk on these instruments and therefore includes them in its credit risk management process (refer to note 1.3). Given that these instruments can lead to a cash outflow, they are included in the liquidity management purposes framework of DLL (refer to note 3.7).
DLL does not have any other material commitments from contractual arrangements or constructive obligations.
Insurance-related provisionsUnearned premium reserve comprises the part of the gross reinsurance premiums written, which is to be allocated to the current financial period. The change in this reserve is taken to the statement of profit or loss as recognition of revenue over the period of risk.
Loss reserves include the outstanding claims provision and reserve for IBNR losses. The outstanding claims provision represents the estimated ultimate cost of settling all claims arising from events that have occurred up to the reporting date and have been identified by DLL. The IBNR reserve represents an estimate of loss and claims adjustment expenses associated with future likely claims activity based on historical actual results that establish a reliable pattern. This pattern is used to estimate IBNR amounts and the timing of those amounts for financial statements purposes.
4.5 Related party transactions
DLL identified the following related parties:
Parent companyThe immediate and ultimate parent of DLL is Coöperatieve Rabobank U.A. (refer to i. Corporate Information for further details).
Companies under common controlThese are all companies that are controlled by the Rabobank Group.
AssociatesDLL has investments in other entities that it does not control but exercises significant influence over (associates). Refer to note 4.2 for further details.
Key management personnelKey management personnel of DLL comprise members of DLL’s Executive Board and members of DLL’s Supervisory Board.
Defined benefit pension fundsDLL’s post-employment benefit plans for its employees are administered through the following separate pension funds in the U.K. and Sweden, respectively:– Rabobank London Branch Pension Fund– PRI Pensionsgaranti
Insurance risk managementThe DLL RE business assumes risk of losses from persons or organizations that are directly exposed to an underlying loss. Insurance risk arises from this risk transfer due to inherent uncertainties about the occurrence, amount and timing of insurance liabilities. The four key components of insurance risk are underwriting, reinsurance, claims management and reserving. DLL RE manages the insurance risk through underwriting limits, approval procedures and limits for transactions that involve new products or that exceed those limits, pricing guidelines, centralized management of reinsurance and monitoring of emerging issues.
Underwriting risk is the key risk involved in DLL RE’s reinsurance business. Underwriting risk is the risk that DLL RE does not receive premiums appropriate for the portfolio it reinsures. As part of its underwriting procedures, DLL RE undertakes careful and extensive analysis, taking external advice where necessary, before final approval by the DLL RE Risk committee or DLL RE Board.
DLL’s underwriting strategy it to provide insurance products associated with DLL’s existing business operations, adding value to the Group. Primary opportunities are set out in the DLL RE business plan, which outlines the classes of business to be written and respective territories. DLL RE currently does not retrocede any of its risks to third parties.
The principal assumptions underlying the DLL RE reserving policy are based on the probability that the expected future claims, in frequency and severity, shall be met by the claims liabilities provided. The provisions for outstanding claims and unexpired risks are established accordingly. DLL uses actuarial techniques for calculating loss reserves.
Accounting policy for provisionsProvisions other than insurance-related are recognized at nominal value when DLL has a legal or constructive obligation and future cash outflows associated with settlement of that obligation are probable and can be estimated. Expense relating to provisions is recorded in the profit or loss. Provisions for legal claims and make-good obligations are recognized when the group has a present legal or constructive obligation as a result of past events; it is probable that an outflow of resources will be required to settle the obligation and the amount can be reliably estimated. Provisions are not recognized for future operating losses.
ContingenciesLegal claimsDLL is involved in various litigation, arbitration and regulatory proceedings, both in the Netherlands and in other jurisdictions in the ordinary course of its business. DLL has formal controls and policies for managing legal claims. Based on professional legal advice, DLL provides and/or discloses amounts in accordance with its accounting policies described below.
On December 31, 2020, DLL had no material unresolved legal claims and disputes (2019: none) where a negative outcome and a respective cash outflow was possible (the probability is higher than “remote” but lower than “probable”). For legal claims with a probable negative outcome leading to a probable cash outflow in the future, DLL recognized provisions on its statement of financial position; refer to note 4.4.
Accounting policy for contingenciesWhere the probability of outflow is considered to be higher than remote, a contingent liability is disclosed. However, in the event DLL is of the opinion that disclosing these estimates on a case-by-case basis would prejudice their outcome, then DLL does not include detailed, case-specific disclosures.
Contingent liabilities disclosed by DLL are assessed continually to determine whether an outflow of funds was probable, in which case a provision is recognized in the financial statements of the period in which the change in probability occurs.
| }

Contents ContentsConsolidated financial statements Consolidated financial statementsCompany financial statements Company financial statementsManagement Report Management ReportSupervisory Report Supervisory Report
129128
Summarized profit or loss and other comprehensive income for AGCO Finance S.A.S.:
in millions of euros 2020 2019
Interest income from customers 45 43
Profit/(loss) for the year 19 (10)
Other comprehensive income - -
Profit allocated to non-controlling interest 9 (5)
Summarized financial information of subsidiaries that have material non-controlling interest is provided below:
Summarized statement of financial position for AGCO Finance S.A.S.:
in millions of euros 2020* 2019*
Assets
Due from customers 1,681 1,553
Other assets 262 261
Total assets 1,943 1,814
Liabilities
Borrowings 1,663 1,554
Other liabilities 62 61
Total liabilities 1,725 1,615
Net assets 218 199
Non-controlling interest share of net assets 107 97
* As on December 31
4.7 Group structure
The consolidated financial statements of DLL include the following key legal operating entities as on December 31, 2020. There were no changes to the group structure in the key operating entities compared to prior year.
Country of incorporation Entity name Principal activities% equity interest
December 31, 2020
Australia De Lage Landen Pty Limited Vendor financing 100
Brazil Banco De Lage Landen Brasil S.A. Vendor financing 78.6
Canada De Lage Landen Commercial Finance Inc. Vendor financing 100
Canada De Lage Landen Financial Services Canada Inc. Vendor financing 100
France AGCO Finance S.A.S. Vendor financing 51
Germany De Lage Landen Leasing GmbH Vendor financing 100
Ireland DLL Ireland Designated Activity Company Treasury entity 100
The Netherlands De Lage Landen Vendorlease B.V. Vendor financing 100
Sweden De Lage Landen Finans AB Vendor financing 100
United Kingdom De Lage Landen Leasing Limited Vendor financing 100
United States of America De Lage Landen Financial Services, Inc. Vendor financing 100
United States of America DLL Finance LLC Vendor financing 100
United States of America AGCO Finance LLC Vendor financing 51
Principal subsidiaries in which third parties have non-controlling interest (NCI) are listed below:
in millions of euros 2020* 2019*
Group entity Country %Dividends
paid to NCI
NCI equity
stake
Profit allocated
to NCI %Dividends
paid to NCI
NCI equity
stake
Profit allocated
to NCI
Individually material for the Group:
AGCO Finance S.A.S. France 49% - 107 9 49% 4 97 (5)
AGCO Finance LLC USA 49% - 59 13 49% 4 53 8
De Lage Landen Participações Limitada
Brazil21% - 47 6 21% 3 58 7
AGCO Finance GmbH Germany 49% - 33 1 49% 16 33 2
AGCO Finance Canada, Ltd Canada 49% - 15 2 49% 2 14 2
Philips Medical Capital, LLC USA 40% - 27 3 40% 6 27 7
Cargobull Finance Holding B.V The Netherlands 49% - 72 6 49% - 66 6
Mahindra Finance USA LLC USA 49% - 59 6 49% - 58 7
Other individually immaterial non-controlling interest 2 53 (6) 12 64 6
Total 2 472 40 47 470 40
* As on December 31
Summarized statement of financial position for AGCO Finance LLC:
in millions of euros 2020* 2019*
Assets
Due from customers 1,632 1,516
Other assets 302 339
Total assets 1,934 1,855
Liabilities
Borrowings 1,710 1,669
Other liabilities 103 78
Total liabilities 1,813 1,747
Net assets 121 108
Non-controlling interest share of net assets 59 53
* As on December 31
Summarized profit or loss and other comprehensive income for AGCO Finance LLC:
in millions of euros 2020 2019
Interest income from customers 80 79
Profit for the year 26 16
Other comprehensive income - -
Profit allocated to non-controlling interest 13 8
Summarized statement of financial position for DLL Participações Limitada:
in millions of euros 2020* 2019*
Assets
Due from customers 1,054 1,255
Other assets 50 35
Total assets 1,104 1,290
Liabilities
Borrowings 891 1,029
Other liabilities 20 16
Total liabilities 911 1,045
Net assets 193 245
Non-controlling interest share of net assets 47 58
* As on December 31
Summarized profit or loss and other comprehensive income for DLL Participações Limitada:
in millions of euros 2020 2019
Interest income from customers 89 102
Profit for the year 22 26
Other comprehensive income - -
Profit allocated to non-controlling interest 6 7
| }

Contents ContentsConsolidated financial statements Consolidated financial statementsCompany financial statements Company financial statementsManagement Report Management ReportSupervisory Report Supervisory Report
131130
Summarized statement of financial position for Cargobull Finance Holding B.V.:
in millions of euros 2020* 2019*
Assets
Due from customers 437 661
Other assets 185 181
Total assets 622 842
Liabilities
Borrowings 462 688
Other liabilities 14 20
Total liabilities 476 708
Net assets 146 134
Non-controlling interest share of net assets 72 66
* As on December 31
Summarized statement of financial position for AGCO Finance GmbH:
in millions of euros 2020* 2019*
Assets
Due from customers 159 300
Other assets 68 68
Total assets 227 368
Liabilities
Borrowings 157 300
Other liabilities 2 2
Total liabilities 159 302
Net assets 68 66
Non-controlling interest share of net assets 33 33
* As on December 31
Summarized profit or loss and other comprehensive income for AGCO Finance GmbH:
in millions of euros 2020 2019
Interest income from customers 7 13
Profit for the year 2 4
Other comprehensive income - -
Profit allocated to non-controlling interest 1 2
Summarized profit or loss and other comprehensive income for Cargobull Finance Holding B.V:
in millions of euros 2020 2019
Interest income from customers 19 24
Profit for the year 12 11
Other comprehensive income - -
Profit allocated to non-controlling interest 6 6
Summarized statement of financial position for AGCO Finance Canada, Ltd:
in millions of euros 2020* 2019*
Assets
Due from customers 391 446
Other assets 71 81
Total assets 462 527
Liabilities
Borrowings 404 478
Other liabilities 27 21
Total liabilities 431 499
Net assets 31 28
Non-controlling interest share of net assets 15 14
* As on December 31
Summarized profit or loss and other comprehensive income for AGCO Finance Canada, Ltd:
in millions of euros 2020 2019
Interest income from customers 21 25
Profit for the year 5 5
Other comprehensive income - -
Profit allocated to non-controlling interest 2 2
Summarized statement of financial position for Philips Medical Capital, LLC:
in millions of euros 2020* 2019*
Assets
Due from customers 428 443
Other assets 29 85
Total assets 457 528
Liabilities
Borrowings 367 443
Other liabilities 22 18
Total liabilities 389 461
Net assets 68 67
Non-controlling interest share of net assets 27 27
* As on December 31
Summarized profit or loss and other comprehensive income for Philips Medical Capital, LLC:
in millions of euros 2020 2019
Interest income from customers 27 27
Profit for the year 8 18
Other comprehensive income - -
Profit allocated to non-controlling interest 3 7
Summarized statement of financial position for Mahindra Finance USA LLC:
in millions of euros 2020* 2019*
Assets
Due from customers 823 939
Other assets 6 5
Total assets 829 944
Liabilities
Borrowings 702 819
Other liabilities 7 6
Total liabilities 709 825
Net assets 120 119
Non-controlling interest share of net assets 59 58
* As on December 31
Summarized profit or loss and other comprehensive income for Mahindra Finance USA LLC:
in millions of euros 2020 2019
Interest income from customers 53 59
Profit for the year 12 13
Other comprehensive income - -
Profit allocated to non-controlling interest 6 7
| }

Contents ContentsConsolidated financial statements Consolidated financial statementsCompany financial statements Company financial statementsManagement Report Management ReportSupervisory Report Supervisory Report
133132
4.9 Other significant accounting policies
Foreign currency translationFunctional and presentation currencyItems included in the financial statements of each of the group’s entities are measured using the currency of the primary economic environment in which the entity operates (the functional currency). The functional currency of DLL is the euro, which is also the presentation currency.
Transactions and balancesForeign currency transactions are translated into the functional currency using the exchange rates at the dates of the transactions. Foreign exchange gains and losses resulting from the settlement of such transactions and from the translation of monetary assets and liabilities denominated in foreign currencies at year-end exchange rates are recognized in profit or loss. They are presented on a net basis within gains/(losses) from financial instruments, except for translation differences on assets and liabilities carried at fair value, which are reported as part of the respective fair value gain or loss.
Group companiesThe results and financial position of foreign operations that have a functional currency different from the presentation currency are translated into the presentation currency as follows:– Assets and liabilities for each balance sheet presented are
translated at the closing rate at the date of that balance sheet.
– Income and expenses for each statement of profit or loss and statement of comprehensive income are translated at average exchange rates (if this is not a reasonable approximation of the cumulative effect of the rates prevailing on the transaction dates, then income and expenses are translated at the dates of the transactions).
– All resulting exchange differences are recognized in other comprehensive income (within the foreign currency translation reserve (FCTR)).
When a foreign operation is sold, the associated exchange differences are reclassified to profit or loss, as part of the gain or loss on sale.
Fair value measurementFair value is the price that would be received from selling an asset or paid to transfer a liability in an orderly transaction between market participants at the measurement date. The fair value measurement is based on the presumption that the transaction to sell the asset or transfer the liability takes place either in the principal market for the item, or in the case of absence of a principlal market, in the most advantageous market for the item.
4.8 Country-by-country reporting
DLL is active across over 30 countries, grouped in five main geographical areas. The country of domicile of DLL is the Netherlands. The table below includes specific information for each country, with allocation per country based on the location of the relevant subsidiary from which the transactions are initiated. The activities for all countries are lending and/or leasing, except for Ireland, where DLL’s central Treasury is located. In the table, the guidance of and definitions from the OECD/G20 Base Erosion and Profit Shifting Project on country-by-country reporting are applied.
December 31, 2020 (in millions of euros)
Geographic location
Country Revenues
Average number of FTEs
Profit/(loss) before tax
Income taxes
The Netherlands
The Netherlands 53.0 844 (15.2) (3.4)
Rest of Europe
Germany 102.4 299 8.0 (2.8)
France 70.4 146 7.9 (3.1)
Ireland 117.6 79 97.0 (10.4)
United Kingdom 80.3 268 2.3 (0.9)
Spain 35.6 130 4.4 (1.2)
Italy 65.5 151 28.8 (0.9)
Portugal 4.6 20 0.7 (0.3)
Austria 3.4 3 (0.9) 0.2
Switzerland 4.2 9 1.5 0.2
Sweden 33.3 168 (66.1) (0.3)
Norway 21.8 49 6.4 (1.4)
Finland 6.0 14 0.9 (0.1)
Denmark 19.4 30 2.9 (0.6)
Russia 24.0 78 15.3 (2.4)
Poland 18.8 79 6.3 (1.5)
Hungary 6.0 33 1.2 (0.2)
Turkey 3.5 21 1.7 (0.4)
Belgium 15.4 52 (3.1) 0.7
Romania 0.0 0 0.0 0.0
North America
United States 534.8 1,513 105.2 (20.6)
Canada 75.6 246 16.1 (3.8)
Latin America
Brazil 55.7 206 (3.5) 2.9
Argentina 2.3 15 0.7 (0.4)
Mexico 16.3 80 (5.8) 1.6
Chile 8.0 33 1.7 (0.5)
Asia Pacific
Australia 70.8 170 31.4 (9.4)
New Zealand 16.5 8 8.8 (2.5)
China 6.2 27 1.9 (1.0)
India 13.8 483 (18.0) 1.5
Singapore 3.1 19 0.7 0.0
South Korea 7.6 25 3.0 (0.6)
United Arab Emirates 0.1 1 (0.3) 0.0
December 31, 2019 (in millions of euros)
Geographic location
Country Revenues
Average number of FTEs
Profit/(loss) before tax
Income taxes
The Netherlands
The Netherlands 12.1 822 (139.5) 37.5
Rest of Europe
Germany 98.2 294 32.2 (9.1)
France 41.4 140 6.2 (23.8)
Ireland 117.8 76 101.1 (12.5)
United Kingdom 83.2 231 31.0 (5.8)
Spain 33.0 128 9.2 (3.9)
Italy 62.4 138 29.8 (2.9)
Portugal 4.8 19 1.0 (0.3)
Austria 2.9 4 0.3 0.1
Switzerland 4.1 7 1.5 (0.2)
Sweden 32.6 152 4.5 (3.0)
Norway 21.9 46 7.5 (1.7)
Finland 6.5 13 1.6 (0.3)
Denmark 16.5 30 5.7 (0.3)
Russia 26.7 69 20.5 (5.8)
Poland 20.2 89 9.1 (1.9)
Hungary 4.5 41 0.2 0.1
Turkey 4.5 22 2.3 (0.2)
Belgium 16.9 55 3.1 (1.0)
Romania 0.3 3 0.1 0.0
North America
United States 526.7 1,459 205.8 (55.9)
Canada 79.1 220 37.8 (9.6)
Latin America
Brazil 67.4 209 38.5 (12.9)
Argentina 2.4 19 (0.7) (0.2)
Mexico 17.8 73 3.9 (1.9)
Chile 7.5 33 1.3 (0.8)
Asia Pacific
Australia 61.9 155 28.4 (8.4)
New Zealand 14.9 6 9.2 (2.6)
China 12.9 30 1.3 (1.2)
India 12.5 463 (4.4) (1.9)
Singapore 3.5 17 (0.5) 0.0
South Korea 7.7 24 2.6 (0.5)
United Arab Emirates (0.2) 1 (0.5) 0.0
All assets and liabilities for which fair value is measured or disclosed in the financial statements are categorized within the fair value hierarchy. The levels are defined as follows, based on the lowest-level input significant to the measurement as a whole:– Level 1 – Quoted (unadjusted) market prices in active
markets for identical assets or liabilities– Level 2 – Valuation techniques for which the lowest-level
input that is significant to the fair value measurement is (in)directly observable
– Level 3 – Valuation techniques for which the lowest-level input that is significant to the fair value is unobservable
When fair values cannot be measured based on quoted prices in active markets, they are measured using valuation techniques including discounted cash flow models. Inputs to these models are taken from observable markets wherever possible, but where this is not feasible, a degree of judgment is required in establishing fair values.
All fair values disclosed in these financial statements are recurring fair values, except when otherwise indicated.
Financial instruments recognition dateFinancial assets and liabilities should be recognized either at trade date (the date that DLL committed itself to buy/sell a financial instrument) or settlement date (the date on which the instrument is actually delivered). All financial instruments that are measured at amortized cost are recognized by DLL at settlement date. Financial instruments that are measured at fair value are recognized at trade date.
Offsetting of financial instrumentsFinancial assets and financial liabilities are offset and the net amount is reported in the consolidated statement of financial position if there is a currently enforceable legal right to offset the recognized amounts and there is an intention to settle on a net basis, to realize the assets and settle the liabilities simultaneously.
Effective interest methodThe effective interest method is a method of calculating the amortized cost of a financial asset or financial liability (or a group of financial assets or financial liabilities) and of allocating the interest income or interest expense over the relevant period. The EIR is the rate that exactly discounts estimated future cash payments or receipts though the expected life of the financial instrument or, when appropriate, a shorter period to the net carrying amount of the financial asset or financial liability.
When calculating the EIR, DLL estimates cash flows considering all contractual terms of the financial instrument (prepayment, call and similar options) but does not consider future credit losses. The calculation includes all fees and points paid or received between the parties to the contract that are an integral part of the EIR, transaction costs and all other premiums and discounts.
| }

Contents ContentsConsolidated financial statements Consolidated financial statementsCompany financial statements Company financial statementsManagement Report Management ReportSupervisory Report Supervisory Report
135134
AppendixC1 – List of acronyms
AGCO AGCO Finance
ALCO Asset and Liability Committee
BNDES National Bank of Economic and Social Development
CC Corporate Center and other business
CET1 Common Equity Tier 1
CGU Cash Generating Unit
COVID-19 Coronavirus disease 2019
CRD IV Capital Requirements Directive IV
CRR Capital Requirements Regulation
CT&I Construction, Transportation and Industrial segment
DCF Discounted Cash Flow
DLL De Lage Landen International B.V.
DNB De Nederlandsche Bank/Dutch Central Bank
DRN Deferred Remuneration Note
EAD Exposure at default
EatR Earnings at Risk
EB Executive Board
EBA European Banking Authority
ECB European Central Bank
ECL Expected Credit Loss
EIR Effective Interest Rate
ESMA European Securities and Markets Authority
F&A Food and Agriculture segment
FCTR Foreign Currency Translation Reserve
FTEs Full-Time Equivalent
GBU Global Business Unit
GCC Global Credit Committee
GRC Global Risk Committee
HC&CT Health Care & Clean Tech segment
IASB International Accounting Standards Board
IBOR Interbank Offered Rate
IFRS International Financial Reporting Standards
LCC Local Credit Committee
LGD Loss given default
NCI Non-controlling interest
NiGEM National Institute Global Econometric Model
NRV Net Realizable Value
OT Office Technology segment
PD Probability of default
PwC PricewaterhouseCoopers Accountants N.V.
RC Rabobank Certificate
RRR Rabobank Risk Rating
S&P Standard & Poor’s
SB Supervisory Board
SPV Special purpose vehicle
SREP Supervisory Review and Evaluation Process
| }

Contents ContentsConsolidated financial statements Consolidated financial statementsCompany financial statements Company financial statementsManagement Report Management ReportSupervisory Report Supervisory Report
137136
Company financial statements
Company statement of financial position 138
Company statement of profit or loss 139
Notes to the company financial statements 1401. General 1402. Cash and cash equivalents 1403. Loans to banks 1414. Loans to subsidiaries 1415. Due from customers 1416. Composition of credit losses and other impairments 1427. Derivatives 1428. Investments in subsidiaries 1439. Investments in associates 14310. Goodwill and other intangible assets 14311. Tangible fixed assets 14312. Other assets 14413. Borrowings 14414. Deposits from customers 14515. Other liabilities 14516. Provisions 14517. Interest revenue and expense 14618. Other operating income 14619. Staff expenses 14620. Income tax 14621. Other operating expenses 14722. Independent auditor remuneration 14723. Commitments and contingencies 14724. Shareholders’ Equity 14825. List of subsidiaries 15026. Events occurring after reported period 152
Contents
| }
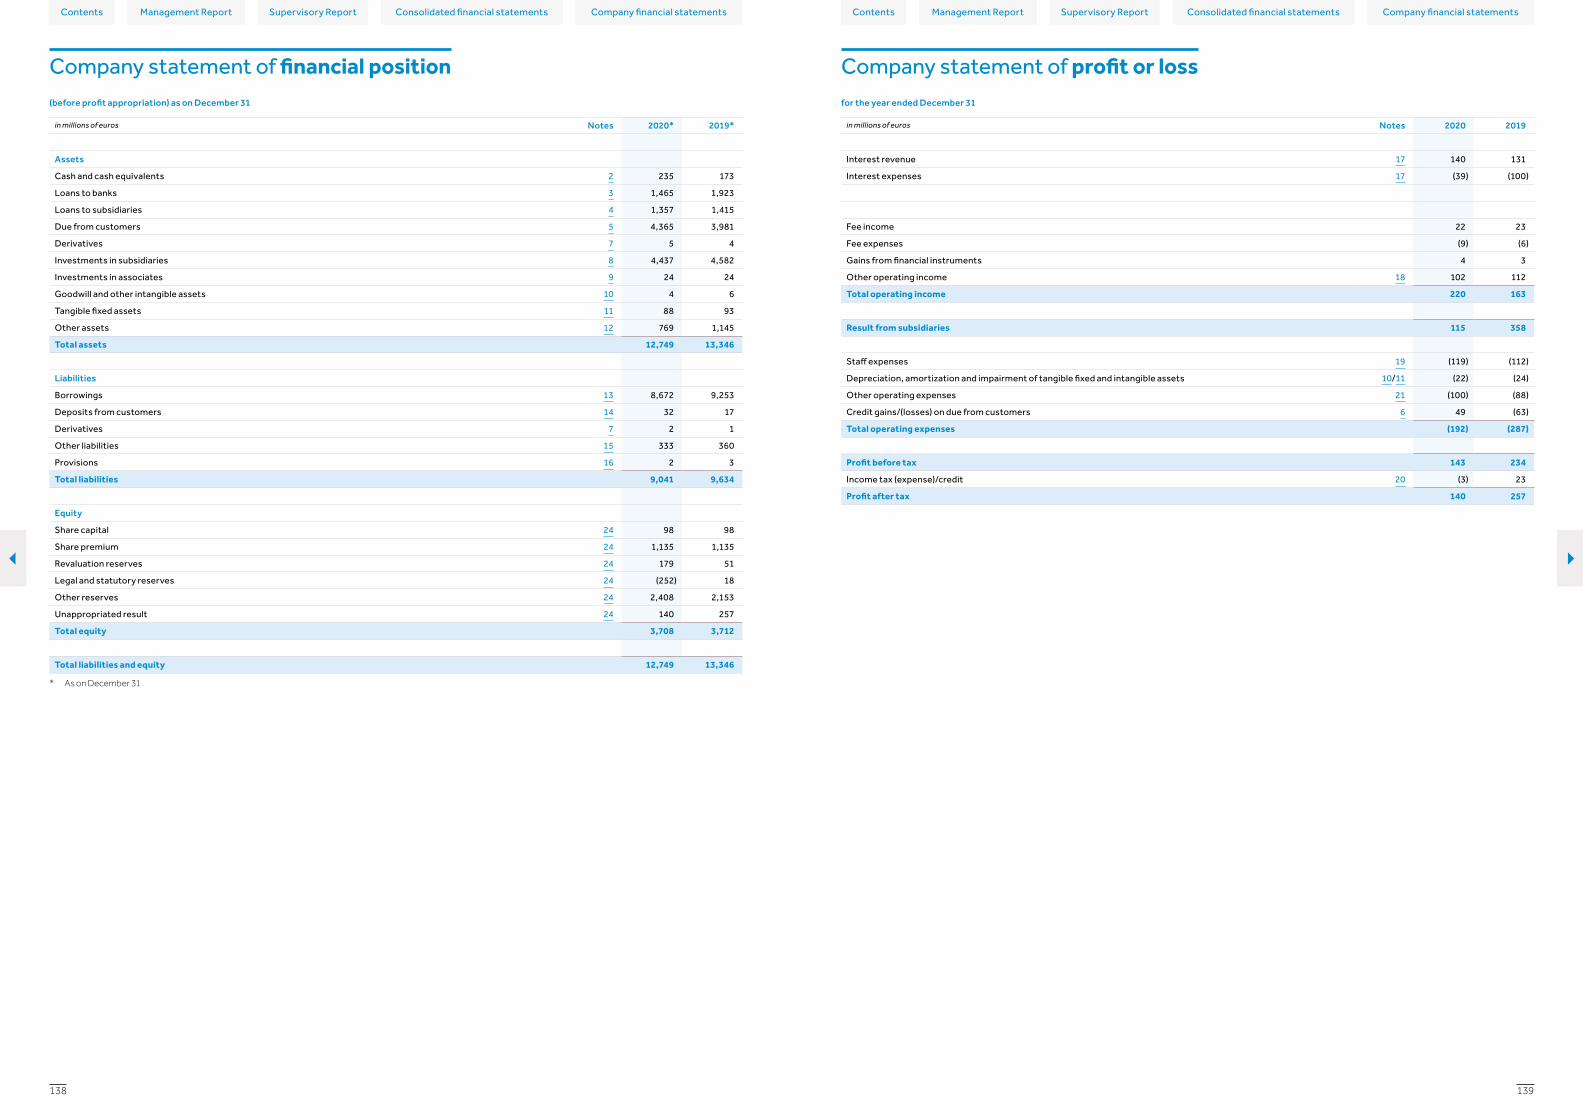
Contents ContentsConsolidated financial statements Consolidated financial statementsCompany financial statements Company financial statementsManagement Report Management ReportSupervisory Report Supervisory Report
139138
in millions of euros Notes 2020 2019
Interest revenue 17 140 131
Interest expenses 17 (39) (100)
Fee income 22 23
Fee expenses (9) (6)
Gains from financial instruments 4 3
Other operating income 18 102 112
Total operating income 220 163
Result from subsidiaries 115 358
Staff expenses 19 (119) (112)
Depreciation, amortization and impairment of tangible fixed and intangible assets 10/11 (22) (24)
Other operating expenses 21 (100) (88)
Credit gains/(losses) on due from customers 6 49 (63)
Total operating expenses (192) (287)
Profit before tax 143 234
Income tax (expense)/credit 20 (3) 23
Profit after tax 140 257
Company statement of financial position Company statement of profit or lossfor the year ended December 31(before profit appropriation) as on December 31
in millions of euros Notes 2020* 2019*
Assets
Cash and cash equivalents 2 235 173
Loans to banks 3 1,465 1,923
Loans to subsidiaries 4 1,357 1,415
Due from customers 5 4,365 3,981
Derivatives 7 5 4
Investments in subsidiaries 8 4,437 4,582
Investments in associates 9 24 24
Goodwill and other intangible assets 10 4 6
Tangible fixed assets 11 88 93
Other assets 12 769 1,145
Total assets 12,749 13,346
Liabilities
Borrowings 13 8,672 9,253
Deposits from customers 14 32 17
Derivatives 7 2 1
Other liabilities 15 333 360
Provisions 16 2 3
Total liabilities 9,041 9,634
Equity
Share capital 24 98 98
Share premium 24 1,135 1,135
Revaluation reserves 24 179 51
Legal and statutory reserves 24 (252) 18
Other reserves 24 2,408 2,153
Unappropriated result 24 140 257
Total equity 3,708 3,712
Total liabilities and equity 12,749 13,346
* As on December 31
| }

Contents ContentsConsolidated financial statements Consolidated financial statementsCompany financial statements Company financial statementsManagement Report Management ReportSupervisory Report Supervisory Report
141140
4. Loans to subsidiaries
The following table provides an overview of movements of loans to subsidiaries.
in millions of euros 2020 2019
Opening balance 1,415 1,321
Loans issued 1,579 1,384
Loans repaid (1,637) (1,290)
Interest accrued 8 20
Interest received (8) (20)
Closing balance 1,357 1,415
The maturity of these loans is as follows:
in millions of euros 2020* 2019*
Less than 3 months 228 200
More than 3 months, less than 1 year 70 292
More than 1 year, less than 5 years 999 892
More than 5 years 60 31
Total loans to subsidiaries 1,357 1,415
* As on December 31
The loans to subsidiaries have a fair value as on December 31, 2020, of EUR 1,377 million (2019: EUR 1,431 million).
5. Due from customers
DLL’s main portfolio includes finance leases that provide asset-based financing to customers and loans to customers that represent commercial, and other financing. These leases and loans are originated in the branches of DLL in Germany, Italy, Portugal and Spain. The balance on December 31 comprised the following:
in millions of euros 2020* 2019*
Finance lease receivables 2,293 2,232
Loans to customers 2,159 1,906
4,452 4,138
Allowance for impairment** (87) (157)
Total due from customers 4,365 3,981
* As on December 31** For a description of credit risk management policies and governance as well as
policies for the allowance for impairment, refer to note 1.3 of the consolidated financial statements. As from 2020, the allowance for impairment of the subsidiaries is recorded at the respective subsidiary level and consequently reflected in the net asset value of the respective subsidiary. The allowance for impairment of 2019 still includes stage 1 and 2 provision of portfolios of those subsidiaries.
Unguaranteed residual valueThe value of unguaranteed residual values on December 31, 2020, was EUR 274 million (2019: EUR 252 million).
3. Loans to banks
The following table provides an overview of movements of loans to banks:
in millions of euros 2020 2019
Opening balance 1,923 1,549
Loans issued 6,981 8,874
Loans repaid (7,439) (8,500)
Interest accrued (3) -
Interest received 3 -
Closing balance 1,465 1,923
The maturity of these loans is as follows:
in millions of euros 2020* 2019*
Less than 3 months 919 1,453
More than 3 months, less than 1 year - -
More than 1 year, less than 5 years - 470
More than 5 years 546 -
Total loans to banks 1,465 1,923
* As on December 31
DLL issued EUR-denominated loans and deposits to Rabobank entities in the amount of EUR 919 million (2019: EUR 1,923 million) that relate to a loan-deposit structure between DLL and Rabobank, which is used to mitigate foreign currency risk of DLL’s net investments in foreign operations. These loans and deposits are fixed- and floating-rate transactions, carry interest rates of EURIBOR and LIBOR plus funding spreads where the duration exceeds one year, mature in 2021 and have a fair value of EUR 918 million (2019 EUR 1,922 million). As the second leg of this loan-deposit structure, DLL received USD-denominated long-term borrowings from Rabobank amounting to EUR 349 million (2019: EUR 465 million), where the issued loans are pledged as collateral for these borrowings. Refer to note 13. The principal amounts and terms of these loans match, however they do not qualify for offsetting and are recorded gross in the statement of financial position.
In 2020, DLL issued USD deferral deposits, of which EUR 546 million had a starting date in 2020 and EUR 101 million has a starting date in 2021. The started deposits mature in 2028, have a fair value of EUR 555 million and have an interest ranging between 1.28% and 1.47%. The non-started deposits will start in 2021 and mature between 2028 and 2029, with interest ranging between 1.51% and 1.58%. The fair value of these deposits is EUR 103 million.
Basis of preparationIn these company financial statements DLL applied the accounting policies it used in its consolidated financial statements prepared under IFRS as adopted by the European Union.
The Executive Board considers it appropriate to adopt the going concern basis of accounting in preparing these financial statements based on a forecast analysis and the equity position that supports the going concern assumption.
The company financial statements provide comparative information for the year ended December 31, 2019, as required for financial statements prepared in full accordance with the provisions in Part 9, Book 2 of the Dutch Civil Code.
Risk exposure on financial instrumentsDLL manages risks at various levels within the organization. At the highest level, the Executive Board (under the supervision of the Supervisory Board) determines the risk strategy it will pursue, the risk appetite, the policy framework, as well as the limits. The Supervisory Board regularly assesses the risks attached to the activities and portfolio of DLL. The Chief Risk Officer, as a member of the Executive Board, is responsible for the risk management policy within DLL. DLL considers risks at company level the same as risks at consolidated level. We therefore refer to Section 1.3 Credit risk management and 3.7 Market and liquidity risk management of the consolidated financial statements.
2. Cash and cash equivalents
The following table provides an overview of cash balances at Rabobank and its related entities as well as balances at other banks.
in millions of euros 2020* 2019*
Current account Rabobank and its related entities 47 53
Current account DLL group entities 187 118
Other banks 1 2
Total cash and cash equivalents 235 173
* As on December 31
Current accounts with DLL group entities represents intra-group treasury balances that are readily available.
1. General
These company financial statements, are prepared for De Lage Landen International B.V. (DLL, Chamber of Commerce 17056223, seated in Eindhoven and incorporated and domiciled in the Netherlands) for the year ended December 31, 2020, pursuant to the provision in Part 9, Book 2, of the Dutch Civil Code. In these company financial statements DLL applied the accounting policies it used in its consolidated financial statements prepared under International Financial Reporting Standards (IFRS) as adopted by the European Union, pursuant to the provisions of Article 362, sub 8, Part 9, Book 2 of the Dutch Civil Code. In accordance with subsection 8 of section 362 of Book 2 of the Dutch Civil Code, the accounting policies in the company financial statements are the same as those used in preparing the consolidated financial statements of DLL. Reference is made to the accounting policies as set out in the relevant sections of the consolidated financial statements, with the exception regarding the measurement of interests held in group companies, as these are measures at net asset value and the measurement of loans from and to group companies, which are measured at amortized cost.
DLL is a wholly owned subsidiary of Coöperatieve Rabobank U.A. (Rabobank), a Dutch cooperative bank based in Amsterdam, the Netherlands. As such, DLL is part of the Rabobank Group.
Included in these company financial statements in the statement of financial position and the statement of profit or loss are the branches of DLL in Italy, Germany, Spain and Portugal.
DLL offers customers various financial solution products, mainly being leasing and lending.
DLL has had a banking license in the Netherlands since 1988 and is regulated by the European Central Bank and the Dutch Central Bank (De Nederlandsche Bank or DNB).
Pursuant to Section 403 of Book 2 of the Dutch Civil Code, Coöperatieve Rabobank U.A. has assumed liability for the debts arising from the legal transactions of the following DLL entities:– De Lage Landen America Holdings B.V.– De Lage Landen Corporate Finance B.V.– De Lage Landen International B.V.– De Lage Landen Vendorlease B.V.
Notes to the company financial statements
| }
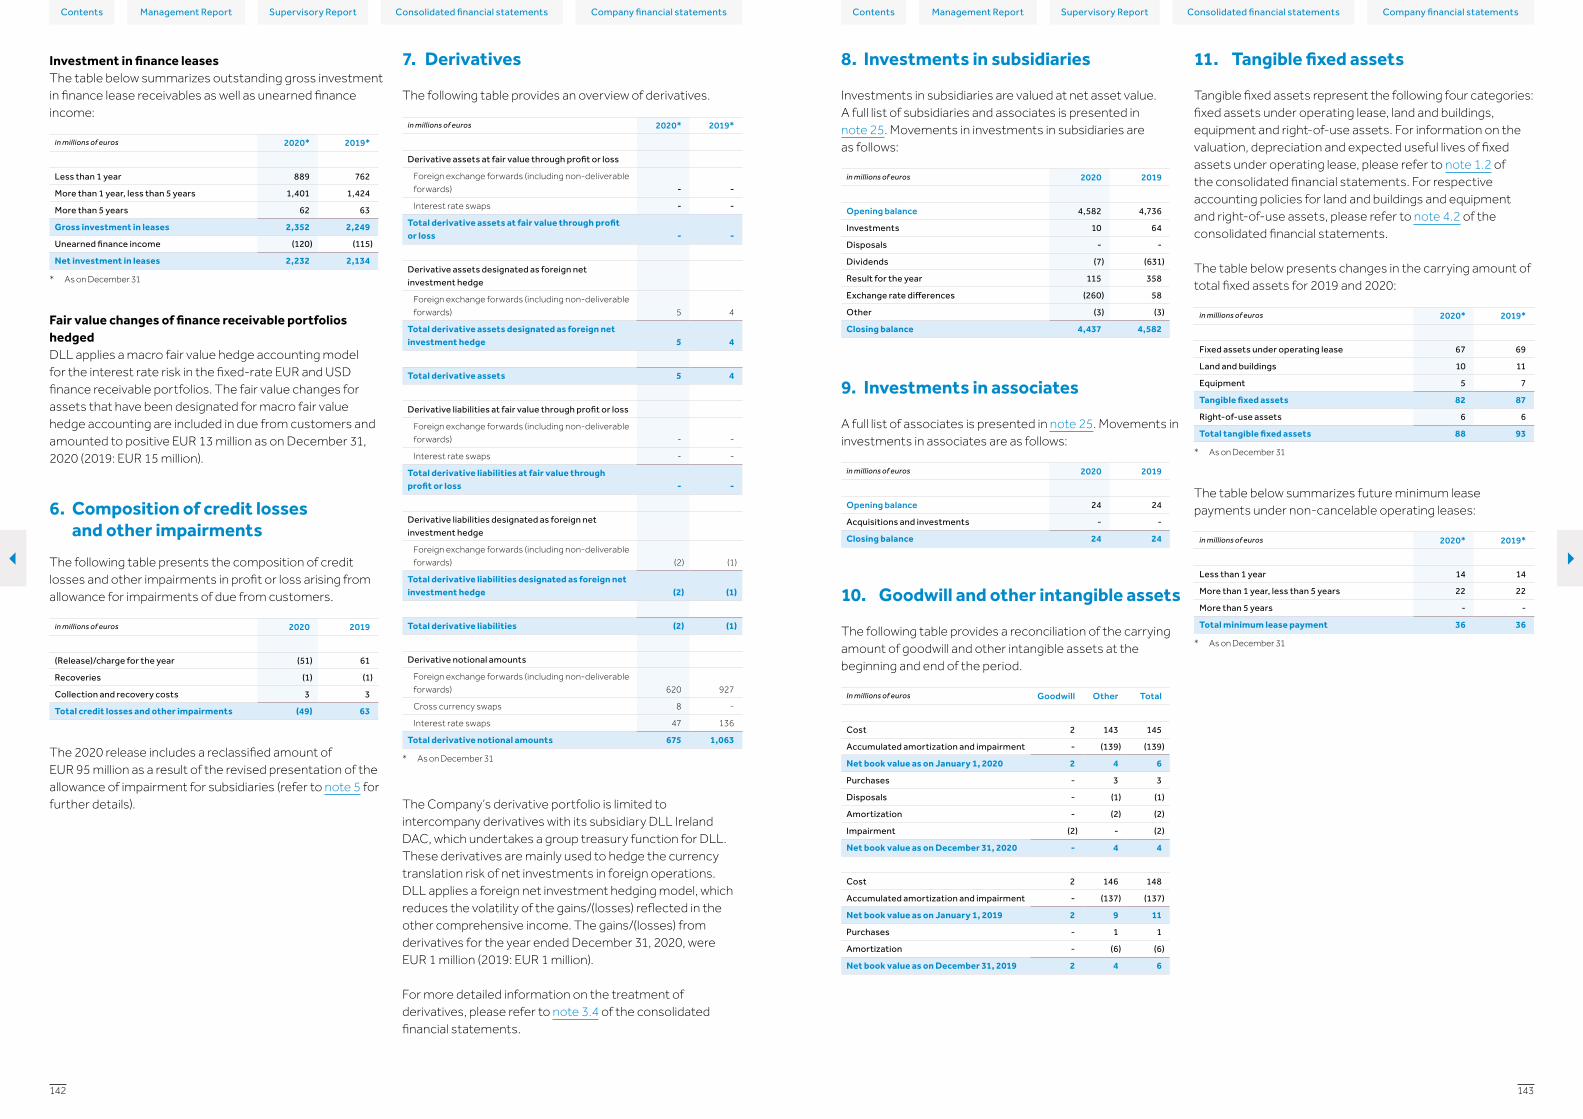
Contents ContentsConsolidated financial statements Consolidated financial statementsCompany financial statements Company financial statementsManagement Report Management ReportSupervisory Report Supervisory Report
143142
11. Tangible fixed assets
Tangible fixed assets represent the following four categories: fixed assets under operating lease, land and buildings, equipment and right-of-use assets. For information on the valuation, depreciation and expected useful lives of fixed assets under operating lease, please refer to note 1.2 of the consolidated financial statements. For respective accounting policies for land and buildings and equipment and right-of-use assets, please refer to note 4.2 of the consolidated financial statements.
The table below presents changes in the carrying amount of total fixed assets for 2019 and 2020:
in millions of euros 2020* 2019*
Fixed assets under operating lease 67 69
Land and buildings 10 11
Equipment 5 7
Tangible fixed assets 82 87
Right-of-use assets 6 6
Total tangible fixed assets 88 93
* As on December 31
The table below summarizes future minimum lease payments under non-cancelable operating leases:
in millions of euros 2020* 2019*
Less than 1 year 14 14
More than 1 year, less than 5 years 22 22
More than 5 years - -
Total minimum lease payment 36 36
* As on December 31
8. Investments in subsidiaries
Investments in subsidiaries are valued at net asset value. A full list of subsidiaries and associates is presented in note 25. Movements in investments in subsidiaries are as follows:
in millions of euros 2020 2019
Opening balance 4,582 4,736
Investments 10 64
Disposals - -
Dividends (7) (631)
Result for the year 115 358
Exchange rate differences (260) 58
Other (3) (3)
Closing balance 4,437 4,582
9. Investments in associates
A full list of associates is presented in note 25. Movements in investments in associates are as follows:
in millions of euros 2020 2019
Opening balance 24 24
Acquisitions and investments - -
Closing balance 24 24
10. Goodwill and other intangible assets
The following table provides a reconciliation of the carrying amount of goodwill and other intangible assets at the beginning and end of the period.
In millions of euros Goodwill Other Total
Cost 2 143 145
Accumulated amortization and impairment - (139) (139)
Net book value as on January 1, 2020 2 4 6
Purchases - 3 3
Disposals - (1) (1)
Amortization - (2) (2)
Impairment (2) - (2)
Net book value as on December 31, 2020 - 4 4
Cost 2 146 148
Accumulated amortization and impairment - (137) (137)
Net book value as on January 1, 2019 2 9 11
Purchases - 1 1
Amortization - (6) (6)
Net book value as on December 31, 2019 2 4 6
Investment in finance leasesThe table below summarizes outstanding gross investment in finance lease receivables as well as unearned finance income:
in millions of euros 2020* 2019*
Less than 1 year 889 762
More than 1 year, less than 5 years 1,401 1,424
More than 5 years 62 63
Gross investment in leases 2,352 2,249
Unearned finance income (120) (115)
Net investment in leases 2,232 2,134
* As on December 31
Fair value changes of finance receivable portfolios hedgedDLL applies a macro fair value hedge accounting model for the interest rate risk in the fixed-rate EUR and USD finance receivable portfolios. The fair value changes for assets that have been designated for macro fair value hedge accounting are included in due from customers and amounted to positive EUR 13 million as on December 31, 2020 (2019: EUR 15 million).
6. Composition of credit losses and other impairments
The following table presents the composition of credit losses and other impairments in profit or loss arising from allowance for impairments of due from customers.
in millions of euros 2020 2019
(Release)/charge for the year (51) 61
Recoveries (1) (1)
Collection and recovery costs 3 3
Total credit losses and other impairments (49) 63
The 2020 release includes a reclassified amount of EUR 95 million as a result of the revised presentation of the allowance of impairment for subsidiaries (refer to note 5 for further details).
7. Derivatives
The following table provides an overview of derivatives.
in millions of euros 2020* 2019*
Derivative assets at fair value through profit or loss
Foreign exchange forwards (including non-deliverable forwards) - -
Interest rate swaps - -
Total derivative assets at fair value through profit or loss - -
Derivative assets designated as foreign net investment hedge
Foreign exchange forwards (including non-deliverable forwards) 5 4
Total derivative assets designated as foreign net investment hedge 5 4
Total derivative assets 5 4
Derivative liabilities at fair value through profit or loss
Foreign exchange forwards (including non-deliverable forwards) - -
Interest rate swaps - -
Total derivative liabilities at fair value through profit or loss - -
Derivative liabilities designated as foreign net investment hedge
Foreign exchange forwards (including non-deliverable forwards) (2) (1)
Total derivative liabilities designated as foreign net investment hedge (2) (1)
Total derivative liabilities (2) (1)
Derivative notional amounts
Foreign exchange forwards (including non-deliverable forwards) 620 927
Cross currency swaps 8 -
Interest rate swaps 47 136
Total derivative notional amounts 675 1,063
* As on December 31
The Company’s derivative portfolio is limited to intercompany derivatives with its subsidiary DLL Ireland DAC, which undertakes a group treasury function for DLL. These derivatives are mainly used to hedge the currency translation risk of net investments in foreign operations. DLL applies a foreign net investment hedging model, which reduces the volatility of the gains/(losses) reflected in the other comprehensive income. The gains/(losses) from derivatives for the year ended December 31, 2020, were EUR 1 million (2019: EUR 1 million).
For more detailed information on the treatment of derivatives, please refer to note 3.4 of the consolidated financial statements.
| }

Contents ContentsConsolidated financial statements Consolidated financial statementsCompany financial statements Company financial statementsManagement Report Management ReportSupervisory Report Supervisory Report
145144
14. Deposits from customers
Deposits from customers mainly consist of 1-year interest-bearing deposits from retail customers.
15. Other liabilities
The following table provides an overview of the items comprising other liabilities.
in millions of euros 2020* 2019*
Payables to group companies 181 191
Accounts payable to suppliers 65 87
Accrued expenses 15 16
Staff-related expenses 16 16
Current tax liabilities 14 18
Deferred income 7 7
Lease liabilities 6 6
Other 29 19
Total other liabilities 333 360
* As on December 31
In general, other liabilities consist of current liabilities with the exception of deferred tax liabilities, deferred income and lease liabilities that can have a settlement period of more than one year.
Payables to group companies include current accounts with subsidiaries that are repaid within 12 months of the reporting date.
16. Provisions
The following table presents the composition of the balance for provisions as on December 31. For a detailed description of accounting policies regarding the relevant provisions, please refer to note 4.4 of the consolidated financial statements.
in millions of euros 2020* 2019*
Provision for restructuring 2 3
Provision for tax claims - -
Total provisions 2 3
* As on December 31
Included in the long-term borrowings from Rabobank as on December 31, 2020, are USD-denominated loans of EUR 349 million (2019: EUR 465 million). As the second leg of this loan-deposit structure, DLL issued EUR-denominated loans to Rabobank in the amount of EUR 919 million (2019: EUR 1,923 million), included in due from banks (refer to note 3). This structure relates to a loan-deposit structure between DLL and Rabobank that is used to mitigate DLL’s foreign currency risk in respect to net investments in foreign subsidiaries. These loans and deposits are floating-rate transactions, mature in 2021 and carry interest rates of EURIBOR and LIBOR, plus funding spreads where the duration exceeds one year. These loans are pledged as collateral for the corresponding borrowings. While the principal amounts and terms of these loans match, they do not qualify for offsetting and are recorded gross in the statement of financial position. Interest rates on these borrowings are 0.37% (2019: 0.76%/8.09%). The long-term borrowings from Rabobank have a fair value as on December 31, 2020, of EUR 928 million (2019: EUR 857 million).
Long-term borrowings from the group companies include loans received by DLL from its subsidiary DLL Ireland DAC, which undertakes a group treasury function for DLL. Interest rates on these borrowings are between (0.69)% and 4.52% (2019: (0.69)%/5.22%). The long-term borrowings from group companies have a fair value as on December 31, 2020, of EUR 4,737 million (2019: EUR 4,565 million).
Other long-term borrowings are long-term loans received by DLL from third parties and bear an interest rate between 0.00% and 4.55% (2019: 0.00%/4.55%). The other long-term borrowings have a fair value of EUR 942 million (2019: EUR 1,164 million).
The following table provides an overview of movements of long-term borrowings:
in millions of euros 2020 2019
Opening balance 6,566 7,164
Loans borrowed 10,630 10,390
Loans repaid (10,524) (11,055)
Interest paid (27) (80)
Interest accrued 27 76
Exchange rate differences (92) 71
Closing balance 6,580 6,566
The table below summarizes the aging of the total borrowings:
in millions of euros 2020* 2019*
Less than 1 year 3,119 3,860
More than 1 year, less than 5 years 2,514 2,985
More than 5 years 3,039 2,408
Total borrowing 8,672 9,253
* As on December 31
Receivables group companies include current accounts with subsidiaries that are repaid within 12 months of the reporting date. Subsidiaries in Germany and Ireland represent the entities with the major part of these current accounts.
13. Borrowings
The following table provides an overview of borrowings.
in millions of euros 2020* 2019*
Short-term loans and overdrafts
Short-term loans from Rabobank 1,805 2,447
Other short-term loans 287 240
2,092 2,687
Long-term borrowings
Long-term borrowings from Rabobank 928 857
Long-term borrowings from the group companies 4,708 4,549
Other long-term borrowings 944 1,160
6,580 6,566
Total borrowings 8,672 9,253
* As on December 31
Short-term loans and overdrafts represent primarily balances outstanding under overdraft facilities from Rabobank and other banks where DLL has current accounts.
in millions of euros
FAOL*Land and buildings Equipment
Right-of-use assets Total
Cost 98 39 25 8 170
Accumulated depreciation (29) (28) (18) (2) (77)
Carrying amount as on January 1, 2020 69 11 7 6 93
Additions 21 - 2 2 25
Disposals (11) - (1) - (12)
Depreciation charge (12) (1) (3) (2) (18)
Cost 99 39 17 9 164
Accumulated depreciation (32) (29) (12) (3) (76)
Carrying amount as on December 31, 2020 67 10 5 6 88
Cost 82 39 24 - 145
Accumulated depreciation (22) (26) (16) - (64)
Carrying amount as on January 1, 2019 60 13 8 - 81
Adoption IFRS 16 - - - 8 8
Additions 38 - 1 - 39
Disposals (17) - - - (17)
Depreciation charge (12) (2) (2) (2) (18)
Cost 98 39 25 8 170
Accumulated depreciation (29) (28) (18) (2) (77)
Carrying amount as on December 31, 2019 69 11 7 6 93
* Fixed assets under operating lease
12. Other assets
The following table describes the composition of the other assets balance.
in millions of euros 2020* 2019*
Receivables group companies 607 979
Current tax receivables 62 43
Prepayments 37 28
Transitory assets 1 1
VAT to be claimed 21 31
Deferred tax assets 28 45
Other 13 18
Total other assets 769 1,145
* As on December 31
In general, other assets consist of current assets with the exception of deferred tax assets that can have a settlement period of more than one year.
Deferred tax assets in DLL are recognized for deductible temporary differences, unused tax losses and unused tax credits. Recognition takes place, based on budgets and forecasts, to the extent it is probable that taxable profits will be available in that entity against which the deferred tax asset can be utilized in the foreseeable future. DLL does not have any unrecognized tax losses.
| }

Contents ContentsConsolidated financial statements Consolidated financial statementsCompany financial statements Company financial statementsManagement Report Management ReportSupervisory Report Supervisory Report
147146
On December 31, 2020, DLL had no material unresolved legal claims (2019: none), where a negative outcome and a respective cash outflow was possible (the probability is higher than “remote” but lower than “probable”). Legal claims contain provisions related to legal claims against DLL. This provision is based on the best possible estimates of the outcomes that take into account legal advice received where available. The timing of the cash outflow of these provisions is uncertain because the outcome of the disputes and the time involved are too complex to reasonably predict. For legal claims with a probable negative outcome leading to a probable cash outflow in the future, DLL recognized provisions on the statement of financial position.
Undrawn irrevocable credit facilitiesTo meet the financial needs of customers, DLL enters into various revocable and irrevocable commitments in the ordinary course of conducting its business. These commitments include commitments to provide financing to customers. Even though these obligations are not recognized on the statement of financial position, DLL is exposed to credit risk on these instruments and therefore includes them in its credit risk management process (refer to note 1.3 of the consolidated financial statements). Given that these instruments can lead to a cash outflow, they are included in the liquidity management purposes framework of DLL (refer to note 3.7 of the consolidated financial statements). There are no irrevocable facilities as per December 31, 2020, for De Lage Landen International B.V. (2019: EUR 30 million).
Master Guarantee AgreementIn 2016, DLL and Rabobank signed a master guarantee agreement (Master Guarantee Agreement) under which DLL may agree to guarantee specific obligations of any Group entity owed towards Rabobank. The only obligations presently subject to the Master Guarantee Agreement are the obligations of the Group’s treasury function, DLL Ireland DAC and De Lage Landen Finansal Kiralama A.S. (DLL Turkey) under a loan facility agreement with Rabobank. The maximum amount of the loan facility agreement of De Lage Landen International B.V. at year-end 2020 is EUR 16,147 million (2019: EUR 20,581 million).
Fiscal unityDLL is part of the fiscal unity for Dutch corporate income tax purposes of Rabobank (including a number of other domestic subsidiaries). Under the fiscal unity, each participating legal entity is jointly and severally liable for the fiscal unity’s corporate tax liabilities.
No other material contingencies exist.
The following table shows a reconciliation of the tax expense/(credit) and the accounting profit multiplied by the domestic tax rate:
in millions of euros 2020 2019
Profit before income tax 143 234
Tax-exempt income (1) (5)
Non-deductible expenses 15 7
Local tax credits (53) (1)
Other 1 1
Taxable income 105 236
Tax calculated using applicable tax rates (2) (29)
Effect of changes in tax rates - 1
Other adjustments 5 5
Tax expense/(credit) for the year 3 (23)
21. Other operating expenses
The following table provides an overview of other operating expenses.
in millions of euros 2020 2019
Administration expenses 32 24
IT-related cost 40 39
Administrative charges Rabobank 28 25
Total other operating expenses 100 88
22. Independent auditor remuneration
Included in other operating expenses are amounts that DLL paid to its independent auditor PricewaterhouseCoopers Accountants N.V. For details on these fees and their composition, please refer to note 2.5 of the consolidated financial statements.
23. Commitments and contingencies
Legal claimsDLL operates in a regulatory and legal environment that has an element of litigation risk inherent in its operations. As a result, DLL is involved in various litigation, arbitration and regulatory proceedings, both in the Netherlands and in other jurisdictions in the ordinary course of its business. DLL has formal controls and policies for managing legal claims. Based on professional legal advice, DLL provides and/or discloses amounts in accordance with its accounting policies described below.
19. Staff expenses
The following table provides an overview of staff expenses.
In millions of euros 2020 2019
Short-term employee benefits 86 82
Wages and salaries 58 54
Social Security costs 9 9
Temporary staff 19 19
Other short-term benefits 25 23
Pension-defined contribution plan expenses 8 7
Total staff expenses 119 112
The average number of staff (FTEs) of employees at DLL was 963 (2019: 929) of whom 626 (2019: 608) were employed in the Netherlands.
Key management personnel of DLL comprise members of the Executive Board and members of the Supervisory Board. For compensation of the Executive Board and the Supervisory Board please refer to note 2.4 of the consolidated financial statements.
Neither DLL nor any of its group companies has granted any loans, guarantees or advances to the members of the Executive Board or Supervisory Board.
DLL participates in the Rabobank Pension Fund for its Dutch pension plan. The scheme is a collective defined contribution plan with a pensionable age of 68 and a target accrual percentage of 2. Each year DLL pays pension contributions into the Rabobank Pension Fund based on a fixed system that aims to achieve the target pension accrual for services provided during the year of service based on a conditional career-average plan with a conditional indexation. DLL complies with all its pension obligations by paying the annual pension premium and therefore has no financial liabilities with regard to underlying membership years and already-accrued pension rights. The Dutch pension plan qualifies as a defined contribution plan under IAS 19. DLL’s obligation is limited to the premium payments owed, less previously made payments.
20. Income tax
The following table summarizes the amounts of tax expense/(credit) recognized in profit or loss:
in millions of euros 2020 2019
Current tax credit for the year (17) (11)
Deferred tax charge/(credit) for the year 20 (12)
Origination and reversal of temporary differences 20 (12)
Effect of changes in tax rates - -
Tax charge/(credit) for the year 3 (23)
Changes in provisions were as follows:
in millions of euros Restructuring Tax claims Total
As on January 1, 2020 3 - 3
Additions 1 - 1
Released (2) - (2)
As on December 31, 2020 2 - 2
As on January 1, 2019 4 2 6
Additions - - -
Released (1) (2) (3)
As on December 31, 2019 3 - 3
17. Interest revenue and expense
The following table provides an overview of interest revenue and expenses.
in millions of euros 2020 2019
Interest revenue
Interest income from finance leases 87 84
Interest income from loans to customers 50 41
Interest income from loans to banks 3 -
Interest income from subsidiaries - 6
140 131
Interest expenses
Interest expense on borrowings from Rabobank (4) (52)
Interest expense on other borrowings (26) (47)
Interest expense on subsidiaries (9) (1)
(39) (100)
Net interest income 101 31
18. Other operating income
The following table provides an overview of other operating income.
in millions of euros 2020 2019
Administrative income from subsidiaries 78 90
Other operating income 24 25
Result on disinvestment - (3)
Total other operating income 102 112
Administrative income from subsidiaries includes the central overhead and other costs that are recharged to DLL subsidiaries in accordance with the DLL transfer pricing policy. Other operating income is portfolio-related income.
| }

Contents ContentsConsolidated financial statements Consolidated financial statementsCompany financial statements Company financial statementsManagement Report Management ReportSupervisory Report Supervisory Report
149148
in millions of euros
Share capital
Share premium
Revaluationreserves
Legal and statutory
reservesOther
reservesUnappro-
priated resultsTotal
equity
Balance on January 1, 2019 98 1,135 123 (51) 1,833 320 3,458
Appropriation of results - - - - 320 (320) -
Profit for the year - - - - - 257 257
Remeasurement of post-employment benefit reserve, net of tax - - 1 - - - 1
Fair value changes of derivatives designated for net investment hedging, net of tax - - (73) - - - (73)
Exchange differences on translation of foreign operations, net of tax - - - 69 - - 69
Total amount recognized in equity - - (72) 69 - 257 254
Balance on December 31, 2019 98 1,135 51 18 2,153 257 3,712
Balance on January 1, 2020 98 1,135 51 18 2,153 257 3,712
Appropriation of results - - - - 257 (257) -
Profit for the year - - - - - 140 140
Remeasurement of post-employment benefit reserve, net of tax - - (2) - - - (2)
Fair value changes of derivatives designated for net investment hedging, net of tax - - 130 - - - 130
Exchange differences on translation of foreign operations, net of tax - - - (270) - - (270)
Total amount recognized in equity - - 128 (270) - 140 (2)
Dividends - - - - (2) - (2)
Balance on December 31, 2020 98 1,135 179 (252) 2,408 140 3,708
24. Shareholders’ Equity
Share capital and share premiumOn December 31, 2020, DLL’s authorized capital was EUR 454 million (2019: EUR 454 million), divided into 950 ordinary A shares and 50 ordinary B shares (2019: 950 A and 50 B). The nominal value of each share is EUR 454,000. EUR 98 million (2019: EUR 98 million) is issued and paid up, consisting of 215 ordinary shares A (A1-A215) and 2 ordinary shares B (B1 and B2). Additional paid-in capital (share premium) on the outstanding shares amounts to EUR 1,135 million (2019: EUR 1,135 million). For the years 2020 and 2019, there is no difference in shareholders’ rights related to the class A and class B shares.
The share premium includes the amount paid in excess of the nominal value of the share capital.
Legal reserves are non-distributable reserves relating to requirements to establish reserves for specific purposes either by the Articles of Association of the Company, Part 9, Book 2, of the Dutch Civil Code and/or by local law. The legal reserves relate to minimum reserves to be maintained for the non-distributable share in cumulated profits of subsidiaries and investments accounted for using the net asset value method.
Since the results and financial position of foreign operations that have a functional currency different from the presentation currency are translated into the presentation currency, all resulting exchange difference are recognized in legal and statutory reserves, which is the sole item comprising the legal reserve. The following table provides an overview of the movements of the legal reserves:
in millions of euros 2020 2019
Opening balance 18 (51)
Exchange differences on translation of foreign operations, net of tax (270) 69
Closing balance (252) 18
There are no statutory reserves prescribed in the Articles of Association of the Company.
DLL uses a Foreign Net Investment hedging model to hedge the CET1 ratio. The hedge effectiveness is tested by comparing the changes in fair value of the hedged items against the changes in fair value of the hedge instruments, both prospectively and retrospectively. The model runs the tests on a monthly basis and is effective if the results are within the effectiveness range as defined. In 2020, the hedge relations were highly effective within the effectiveness range set based on IFRS 9 regulations. In 2020, an amount of EUR (130) million in the revaluation reserves was accounted for due to changes in the fair value of financial instruments used as net investment hedges. This revaluation are tax exempted. Please refer to note 1.3 of the consolidated financial statements.
The Company appropriates prior-year profits into other reserves if no resolution is adopted on the distribution. On a proposal by the Executive Board, the General Meeting of Shareholders allocates the profits of the year and declares distributions from the profits or distributions from the reserves to the shareholders, subject to the Executive Board’s approval. The Executive Board proposes to the General Meeting of Shareholders to add the profit for the period ended December 31, 2020, to the other reserves. This proposal is not reflected in the statement of financial position.
The table on the next page presents the composition of shareholders’ equity and a reconciliation of opening and closing balances for the years ended December 31, 2020, and 2019.
| }

Contents ContentsConsolidated financial statements Consolidated financial statementsCompany financial statements Company financial statementsManagement Report Management ReportSupervisory Report Supervisory Report
151150
25. List of subsidiaries
The below list contains the names, registered office and (in)direct capital interest of all subsidiaries of De Lage Landen International B.V.
Name Registered office % Capital
2732932 Ontario Limited Oakville, Canada 100
AGCO Capital Argentina S.A. Buenos Aires, Argentina 51
AGCO Finance AG Zürich, Switzerland 51
AGCO Finance B.V. Eindhoven, The Netherlands 51
AGCO Finance Canada, Ltd Regina, Canada 51
AGCO Finance GmbH Düsseldorf, Germany 51
AGCO Finance GmbH, Landmaschinenleasing Vienna, Austria 51
AGCO Finance Limited Kenilworth, United Kingdom 51
AGCO Finance Designated Activity Company Dublin, Ireland 51
AGCO Finance Limited Te Awamutu, New Zealand 51
AGCO Finance LLC Moscow, Russia 51
AGCO Finance LLC Johnston, United States of America 51
AGCO Finance N.V. Mechelen, Belgium 51
AGCO Finance Pty Limited Sydney, Australia 51
AGCO Finance S.A.S. Beauvais, France 51
AGCO Finance Sp. z o.o. Warsaw, Poland 51
ALLCO-DLL Solar Trust Wilmington, United States of America 100
AM-DLL Solar Trust Wilmington, United States of America 100
Banco De Lage Landen Brasil S.A. Porto Alegre, Brazil 78.6
BBT 2016-1 Trust New York, United States of America 100
BBT 2018-1 Trust New York, United States of America 100
BSE-DLL Solar Trust Wilmington, United States of America 100
Cargobull Commercial Solutions, S.L.U. Madrid, Spain 51
Cargobull Finance A/S Søborg, Denmark 51
Cargobull Finance AB Stockholm, Sweden 51
Cargobull Finance GmbH Düsseldorf, Germany 51
Cargobull Finance Holding B.V. Eindhoven, The Netherlands 51
Cargobull Finance Limited Watford, United Kingdom 51
Cargobull Finance Sp. z o.o. Warsaw, Poland 51
CBSC Capital Inc. Brampton, Canada 51
De Lage Landen (China) Co., Ltd. Shanghai, China 100
De Lage Landen (China) Factoring Co., Ltd. Shanghai, China 100
De Lage Landen America Holdings B.V. Eindhoven, The Netherlands 100
De Lage Landen Asia Participations B.V. Eindhoven, The Netherlands 100
De Lage Landen Austria GmbH Vienna, Austria 100
De Lage Landen Chile S.A. Santiago, Chile 100
De Lage Landen China Participations B.V. Eindhoven, The Netherlands 100
De Lage Landen Co., Ltd Seoul, Republic of Korea 100
De Lage Landen Commercial Finance Inc. Oakville, Canada 100
De Lage Landen Corporate Finance B.V. Eindhoven, The Netherlands 100
De Lage Landen Cross-Border Finance, LLC Wayne, United States of America 100
De Lage Landen Erste Vorratsgesellschaft mbH Düsseldorf, Germany 100
De Lage Landen Europe Participations B.V. Eindhoven, The Netherlands 100
De Lage Landen Facilities B.V. Eindhoven, The Netherlands 100
De Lage Landen Finance Limited Liability Company Seoul, Republic of Korea 100
De Lage Landen Finance Zrt. Budapest, Hungary 100
De Lage Landen Finance, LLC Johnston, United States of America 100
De Lage Landen Financial Services Canada Inc. Oakville, Canada 100
De Lage Landen Financial Services India Private Limited Mumbai, India 100
De Lage Landen Financial Services, Inc. Wayne, United States of America 100
De Lage Landen Finans AB Stockholm, Sweden 100
De Lage Landen Finansal Kiralama Anonim Şirketi Istanbul, Turkey 100
De Lage Landen Leasing AG Zürich, Switzerland 100
De Lage Landen Leasing GmbH Düsseldorf, Germany 100
Name Registered office % Capital
De Lage Landen Leasing Kft. Budapest, Hungary 100
De Lage Landen Leasing Limited Watford, United Kingdom 100
De Lage Landen Leasing N.V. Mechelen, Belgium 100
De Lage Landen Leasing Polska S.A. Warsaw, Poland 100
De Lage Landen Leasing S.A.S. La Défense, France 100
De Lage Landen Limited Watford, United Kingdom 100
De Lage Landen Limited Te Awamutu, New Zealand 100
De Lage Landen Participações Limitada Porto Alegre, Brazil 78.6
De Lage Landen Pte. Limited Singapore, Singapore 100
De Lage Landen Pty Limited Sydney, Australia 100
De Lage Landen Public Finance LLC Wayne, United States of America 100
De Lage Landen Remarketing Solutions B.V. Eindhoven, The Netherlands 100
De Lage Landen Renting Solutions, S.L.U. Madrid, Spain 100
De Lage Landen Renting Solutions S.r.l. Milano, Italy 100
De Lage Landen South Africa (Proprietary) Limited Tokai, South Africa 100
De Lage Landen Vendorlease B.V. Eindhoven, The Netherlands 100
De Lage Landen, S.A. de C.V., Sociedad Financiera de Objeto Múltiple, Entidad no Regulada Huixquilucan, Mexico 100
DLL 2018-1 LLC Wayne, United States of America 100
DLL 2018-2 LLC Wayne, United States of America 100
DLL 2019-1 LLC Wayne, United States of America 100
DLL 2019-2 LLC Wayne, United States of America 51
DLL 2019-3 LLC Wayne, United States of America 100
DLL Capital Receivables 2017-A LLC Wayne, United States of America 100
DLL Company One B.V. Eindhoven, The Netherlands 100
DLL Corretora de Seguros Ltda. Barueri, Brazil 78.6
DLL Equipment Trading Middle East and Africa FZE Dubai, United Arab Emirates 100
DLL Finance LLC Johnston, United States of America 100
DLL I Limited Partnership Oakville, Canada 100
DLL Ireland Designated Activity Company Dublin, Ireland 100
DLL Leasing Argentina S.A. Buenos Aires, Argentina 100
DLL Leasing Designated Activity Company Dublin, Ireland 100
DLL Leasing S.A. de C.V. Huixquilucan, Mexico 100
DLL Polska Corporate Sp. z o.o. Warsaw, Poland 100
DLL Polska Participations Sp. z o.o. Warsaw, Poland 100
DLL Polska Participations Sp. z o.o. Sp. K. Warsaw, Poland 100
DLL Re Designated Activity Company Dublin, Ireland 100
DLL Securitization Trust 2017-A Wilmington, United States of America 100
DLL U.S. Holding Company, Inc. Wilmington, United States of America 100
DLL UK Equipment Finance 2019-1 PLC London, United Kingdom 100
DLL UK Equipment Finance Holdings Limited London, United Kingdom 100
Komatsu Administration France S.A.S. La Défense, France 95
Komatsu Financial Germany GmbH Düsseldorf, Germany 95
Komatsu Financial Italy S.p.A. in liquidazione Milano, Italy 97.2
LEAP Warehouse Trust No. 1 Sydney, Australia 100
Limited Liability Company Cargobull Finance Moscow, Russia 51
Limited Liability Company De Lage Landen Leasing Moscow, Russia 100
Mahindra Finance USA LLC Johnston, United States of America 51
MP2-DLL Solar Trust Wilmington, United States of America 100
NSE-DLL Solar Trust Wilmington, United States of America 100
OOO DLL Finance Moscow, Russia 100
Philips Medical Capital, LLC Wayne, United States of America 60
SE DLL Solar Trust Wilmington, United States of America 100
TE-DLL Solar Trust Wilmington, United States of America 100
Truckland Lease B.V. Eindhoven, The Netherlands 100
| }

Contents ContentsConsolidated financial statements Consolidated financial statementsCompany financial statements Company financial statementsManagement Report Management ReportSupervisory Report Supervisory Report
153152
Other information
26. Events occurring after reported period
Events after the reporting date that relate to conditions that existed at the end of the reporting period have been reflected in these financial statements.
On behalf of the Executive BoardW.F. Stephenson, ChairmanM.M.A. Dierckx, CFOM. Janse, COOT.L. Meredith, CCOY.E. Hoefsmit, CRO
On behalf of the Supervisory BoardB.J. Marttin, ChairmanB. Leurs, memberA.E. Bouma, memberR. De Feo, member
Eindhoven, April 28, 2021
| }
Contents ContentsConsolidated financial statements Consolidated financial statementsCompany financial statements Company financial statementsManagement Report Management ReportSupervisory Report Supervisory Report
155154
Independent auditor’s report
VZAX3CZHPDYE-183110474-90
PricewaterhouseCoopers Accountants N.V., Thomas R. Malthusstraat 5, 1066 JR Amsterdam, P.O. Box 90357, 1006 BJ Amsterdam, the Netherlands T: +31 (0) 88 792 00 20, F: +31 (0) 88 792 96 40, www.pwc.nl
‘PwC’ is the brand under which PricewaterhouseCoopers Accountants N.V. (Chamber of Commerce 34180285), PricewaterhouseCoopers Belastingadviseurs N.V. (Chamber of Commerce 34180284), PricewaterhouseCoopers Advisory N.V. (Chamber of Commerce 34180287), PricewaterhouseCoopers Compliance Services B.V. (Chamber of Commerce 51414406), PricewaterhouseCoopers Pensions, Actuarial & Insurance Services B.V. (Chamber of Commerce 54226368), PricewaterhouseCoopers B.V. (Chamber of Commerce 34180289) and other companies operate and provide services. These services are governed by General Terms and Conditions (‘algemene voorwaarden’), which include provisions regarding our liability. Purchases by these companies are governed by General Terms and Conditions of Purchase (‘algemene inkoopvoorwaarden’). At www.pwc.nl more detailed information on these companies is available, including these General Terms and Conditions and the General Terms and Conditions of Purchase, which have also been filed at the Amsterdam Chamber of Commerce.
Independent auditor’s report Financial Statements 31 December 2020 1 January 2020 De Lage Landen International B.V. Controle Goedkeurend 30121069A083 KVK Kvk Nummer uit DB (nog te doen) Create SBR Extension 1.0 Amsterdam 23 April 2021
To: the general meeting and the supervisory board of De Lage Landen International B.V.
Report on the financial statements 2020
Our opinion In our opinion: • the consolidated financial statements of De Lage Landen International B.V. together with its
subsidiaries (‘the Group’) give a true and fair view of the financial position of the Group as at 31 December 2020 and of its result and cash flows for the year then ended in accordance with International Financial Reporting Standards as adopted by the European Union (EU-IFRS) and with Part 9 of Book 2 of the Dutch Civil Code; and
• the company financial statements of De Lage Landen International B.V. (‘the Company’) give a true and fair view of the financial position of the Company as at 31 December 2020 and of its result for the year then ended in accordance with Part 9 of Book 2 of the Dutch Civil Code.
What we have audited We have audited the accompanying financial statements 2020 of De Lage Landen International B.V., Eindhoven. The financial statements include the consolidated financial statements of the Group and the company financial statements.
The consolidated financial statements comprise: • the consolidated statement of financial position as at 31 December 2020; • the following statements for 2020: the consolidated statement of profit or loss, the consolidated
statement of other comprehensive income, the consolidated statement of changes in equity and the consolidated statement of cash flows; and
• the notes, comprising significant accounting policies and other explanatory information.
The company financial statements comprise: • the company statement of financial position as at 31 December 2020; • the company statement of profit or loss for the year then ended; and • the notes, comprising the accounting policies applied and other explanatory information.
The financial reporting framework applied in the preparation of the financial statements is EU-IFRS and the relevant provisions of Part 9 of Book 2 of the Dutch Civil Code for the consolidated financial statements and Part 9 of Book 2 of the Dutch Civil Code for the company financial statements.
De Lage Landen International B.V. - VZAX3CZHPDYE-183110474-90
Page 2 of 18
The basis for our opinion We conducted our audit in accordance with Dutch law, including the Dutch Standards on Auditing. We have further described our responsibilities under those standards in the section ‘Our responsibilities for the audit of the financial statements’ of our report.
We believe that the audit evidence we have obtained is sufficient and appropriate to provide a basis for our opinion.
Independence We are independent of De Lage Landen International B.V. in accordance with the European Union Regulation on specific requirements regarding statutory audit of public-interest entities, the ‘Wet toezicht accountantsorganisaties’ (Wta, Audit firms supervision act), the ‘Verordening inzake de onafhankelijkheid van accountants bij assuranceopdrachten’ (ViO, Code of Ethics for Professional Accountants, a regulation with respect to independence) and other relevant independence regulations in the Netherlands. Furthermore, we have complied with the ‘Verordening gedrags- en beroepsregels accountants’ (VGBA, Dutch Code of Ethics).
Our audit approach Overview and context of the 2020 audit De Lage Landen International B.V. is a wholly-owned subsidiary of Coöperatieve Rabobank U.A. ('Rabobank') and offers clients asset based financial products, primarily leasing and lending in nine industry verticals. The Group has operations in more than 30 countries. The Group comprises of several components for which we considered our group audit scope and approach as set out in the section 'The scope of our group audit'.
As part of designing our audit, we determined materiality and assessed the risks of material misstatement in the financial statements. In particular, we considered where the executive board made important judgements, for example, in respect of significant accounting estimates that involved making assumptions and considering future events that are inherently uncertain. In note IV 'Key judgements and estimates' of the consolidated financial statements, the executive board describes their main areas of judgement and key estimates in applying accounting policies.
Of the estimates and judgements mentioned in the aforementioned paragraph, we consider the measurement of balances due from customers and the measurement of assets under operating lease a key audit matter, this primarily given the relevance and overall size of these balances in combination with the level of management judgement and inherent estimation uncertainty and the related risk of material misstatement. The economic uncertainty due to COVID-19 has heightened the impact of certain estimations and judgements made by the Group, specifically towards forward-looking assumptions applied in their calculations such as the probability of default, the macroeconomic scenarios and the expected credit losses that were applied across the Group’s finance lease and loan portfolio.
Furthermore, also being part of note IV 'Key judgements and estimates' of the consolidated financial statements, we have identified the application of macro fair value hedge accounting and the measurement of the derivatives as a key audit matter in view of the complexity of hedge accounting, the magnitude of the notional amounts and the estimation uncertainty.
| }

Contents ContentsConsolidated financial statements Consolidated financial statementsCompany financial statements Company financial statementsManagement Report Management ReportSupervisory Report Supervisory Report
157156
De Lage Landen International B.V. - VZAX3CZHPDYE-183110474-90
Page 3 of 18
We identified the impairment of goodwill for DLL Finans AB as a key audit matter due to the related significant judgement and assumptions regarding the future performance allocated to this cash-generating unit and the relevance of the recorded impairment loss for the profit or loss account 2020.
Refer to section ‘Our focus on the risk of fraud and non-compliance with laws and regulations’ for our audit approach on these themes.
In view of the importance of the IT environment on our audit of the financial statements, we, with the support of our IT specialists, assessed the IT environment. We addressed information technology general controls ('ITGCs') which are the policies and procedures used by the Company to ensure information technology ('IT') operates as intended and provides reliable data for financial reporting purposes. The IT environment of the Company and its components has been assessed in the context of and where relevant for the audit of the financial statements.
We ensured that audit teams, both at group and at component levels, had the appropriate skills and competences, necessary for the audit of a financial services company, offering leasing and lending services, holding banking licenses in several jurisdictions (including in the Netherlands) and an insurance license (Ireland). We also made use of specialists in the areas of IT, taxation, credit risk provisioning, regulatory reporting, valuation of goodwill, valuation of financial instruments and hedge accounting as well as experts in the area of employee benefits.
Impact of COVID-19 on our 2020 audit approach Following the COVID-19 outbreak, auditors are facing challenges in performing their audits. In response to that, we have considered the impact of the pandemic in our audit approach and throughout the execution of our audit. Inquiries and meetings with management and employees were done via video conferencing. With the effective use of technology, we were able to perform the audit procedures on group level. Teams were reminded of the importance of staying alert to the quality of audit evidence and to perform sufficient and appropriate tests and validations to be satisfied that the information provided is complete, accurate and authentic. The following highlights the areas of focus in our audit that we paid specific attention to: • the impact on audit materiality, including the basis on which our materiality is determined,
outlined in the section ‘Materiality’; • the impact on our risk assessment. Our risk assessment has not materially changed overall in
terms of specific response to COVID-19. This predominantly given that for example: 1. The Group has no considerable exposure to seasonal patterns or concentration risk 2. the business has not been halted or stopped for certain periods of time as a result of COVID-19 such as we have seen in other specific sectors;
• the impact on the control environment and fraud risks due to remote working. We assessed that the impact of the COVID-19 pandemic, including working in a remote environment, on the effective operation of controls was relatively limited. Based on our assessment of the design and existence of the Risk Control framework we have no indication that working remotely required particular framework adjustments. This is based on our interaction with the Group’s representatives throughout the year and our observations as part of our controls testing. The majority of the day-to-day accounting and operational processes, relevant to our audit, were already performed electronically and could be performed remotely;
De Lage Landen International B.V. - VZAX3CZHPDYE-183110474-90
Page 4 of 18
• accounting implications, such as the measurement of balances due from customers, the measurement of assets under operating lease and the impairment assessment of goodwill. The uncertainty within the current environment and the continual changing nature of the unprecedented impact of the COVID-19 pandemic has added further complexity and challenges when auditing accounting estimates. During our audit we, amongst others, specifically focused on understanding the substantial increase of IFRS 9 credit loss provisioning and the accounting implications of the rescheduling of contracts e.g. payment relief programs and governmental moratoria. Our procedures include assessments of these accounting matters and the adequacy of relevant disclosures in the financial statements in accordance with EU-IFRS and Dutch law; and
• the impact on our group audit. We have reassessed our planned audit procedures in relation to the work of component auditors, such as organising video conference site visits and meetings with local management and component teams instead of our annual physical site visits. Active dialogues and communication and effective use of technology have allowed us to direct and supervise the performance of our component teams. Based on inspection of the audit deliverables of the component audit teams and the calls with the component audit teams we have no indications that the effectiveness of the audit work was impaired due to remote working by the component audit teams.
The outline of our audit approach was as follows:
Materiality • Overall materiality: €19.5 million rounded (2019: €22.0 million
rounded).
Audit scope • We performed audit work on 22 individually significant
components in 14 countries. • Video conferencing meetings with the component teams and
local management in Canada, Germany, Italy and the United States.
• Audit coverage: 92% of consolidated assets, 90% of consolidated net income and 93% of consolidated profit before tax.
Key audit matters • Measurement of balances due from customers. • Measurement of assets under operating lease. • Application of macro fair value hedge accounting and
measurement of derivatives. • Impairment of goodwill.
Materiality The scope of our audit is influenced by the application of materiality, which is further explained in the section ‘Our responsibilities for the audit of the financial statements’.
Based on our professional judgement we determined certain quantitative thresholds for materiality, including the overall materiality for the financial statements as a whole as set out in the table below.
| }

Contents ContentsConsolidated financial statements Consolidated financial statementsCompany financial statements Company financial statementsManagement Report Management ReportSupervisory Report Supervisory Report
159158
De Lage Landen International B.V. - VZAX3CZHPDYE-183110474-90
Page 5 of 18
These, together with qualitative considerations, helped us to determine the nature, timing and extent of our audit procedures on the individual financial statement line items and disclosures and to evaluate the effect of identified misstatements, both individually and in aggregate, on the financial statements as a whole and on our opinion.
Overall group materiality
€19.5 million rounded (2019: €22.0 million rounded).
Basis for determining materiality
We used our professional judgement to determine overall materiality. As a basis for our judgement, we used 5% weighted average of profit before tax of the current year and previous two years, all equally weighted.
Rationale for benchmark applied
We have applied profit before tax, a generally accepted auditing practise, as the primary benchmark based on our analysis of the common information needs of users of the financial statements. On this basis, we believe that profit before tax is an important metric for measuring and assessing the overall financial performance of the Group. Furthermore, we utilised a 5% threshold, based on our professional judgement, noting it is within the range of commonly acceptable thresholds.
The applied multi-year average benchmark for materiality is in response to adverse economic trends and volatility in the profit before tax 2020 and attributable to the impact of COVID-19. In view of the significant impact of the expected credit losses on the current year’s profit and the inherently considerable estimation uncertainty of this item we considered a 3 year average of profit before tax an appropriate benchmark. Using our professional judgement, we determined materiality for this year at €19.5 million, which equates to approximately 8% of the current year’s profit before tax.
Component materiality
To each component in our audit scope, we, based on our judgement, allocated materiality that is less than our overall group materiality. The range of materiality allocated across components was between €1.5 million and €15 million.
We also take misstatements and/or possible misstatements into account that, in our judgement, are material for qualitative reasons.
We agreed with the supervisory board that we would report to them misstatements identified during our audit affecting profit or loss or equity with more than €975,000 (2019: €1 million), reclassifying misstatements above €975,000 (2019: €1 million) and exceeding 1% (2019: 1%) of the respective financial position or profit or loss line item as well as misstatements below that amount that, in our view, warranted reporting for qualitative reasons.
The scope of our group audit De Lage Landen International B.V. is the parent company of a group of entities. The financial information of this group is included in the consolidated financial statements of De Lage Landen International B.V.
We tailored the scope of our audit to ensure that we perform sufficient work to be able to give an opinion on the financial statements as a whole, taking into account the management structure of the
De Lage Landen International B.V. - VZAX3CZHPDYE-183110474-90
Page 6 of 18
Group, the nature of operations of its components, the accounting processes and controls and the markets in which the components of the Group operate. In establishing the overall group audit strategy and plan, we determined the type of work required to be performed at the component level and/or by the group engagement team.
Twenty-two components in fourteen countries were subject to full scope audits of their financial information for consolidation purposes, as we considered these components individually financially significant to the Group. In total, in performing these procedures, we achieved the following coverage on the consolidated financial statements line items:
Consolidated assets 92% Consolidated net income 90% Consolidated profit before tax 93%
None of the remaining components individually represented more than 2% of group net income, group profit before tax or group assets. For the remaining components we performed, among other procedures, analytical procedures to corroborate our assessment that there were no significant risks of material misstatements within these components.
For the individually financially significant Dutch components, the group engagement team performed the audit work. In the locations where component auditors performed the work, we determined the level of involvement we required to be able to conclude whether we obtained sufficient and appropriate audit evidence as a basis for our opinion on the group financial statements as a whole. All components in scope for group reporting are audited by PwC member firms. We performed, amongst others, the following procedures: • we issued detailed audit instructions to the component auditors prescribing the scope of work to
be performed, the risk assessment, other areas of audit focus, materiality to be applied and the reporting requirements to the group engagement team regarding the financial information;
• we closely collaborated during 2020 and 2021 to date with our component teams and had ongoing interactions with them, regarding amongst others, developments affecting the components, our audit instructions, their audit approach and audit findings regarding the control environment, accounting treatments and other matters;
• we assessed the component auditors' reports and observations were discussed with the component auditors and with group management;
• we performed file reviews for a selection of component auditors; and • since the COVID-19 outbreak limited our ability to physically visit components in scope of group
reporting this year, we conducted video conference site visits with local management along with component audit teams in Canada, Germany, Italy and the United States. During these meetings, we discussed the strategy and financial performance of the local businesses, as well as the audit plan of the component auditors and execution thereof, significant audit risks and other relevant audit topics.
| }
Contents ContentsConsolidated financial statements Consolidated financial statementsCompany financial statements Company financial statementsManagement Report Management ReportSupervisory Report Supervisory Report
161160
De Lage Landen International B.V. - VZAX3CZHPDYE-183110474-90
Page 7 of 18
The group engagement team performed audit procedures on the group consolidation, financial statements disclosures and various specific items at group level where central functions, such as IT, reporting, control, risk, tax, legal, compliance and internal audit are located. Areas included in the audit procedures performed by the group engagement team, amongst others, were: • entity level controls; • certain aspects of group-wide managed credit risk provisioning; • residual value reassessment of fixed assets under operating leases and finance leases; • impairment testing of goodwill; • measurement of derivatives and the application of macro fair value hedge accounting; and • measurement of the provisions for uncertain tax exposures. The internal audit department performs audits at group and component level in a variety of areas and on themes selected. Whilst we did not rely on the work performed by the internal audit department, we assessed the impact of their reporting and observations on our audit.
By performing the procedures above at component level, combined with the additional procedures at group level, we have obtained sufficient and appropriate audit evidence on the Group’s financial information as a whole to provide a basis for our opinion on the (consolidated) financial statements.
Our focus on the risk of fraud and non-compliance with laws and regulations Fraud The objectives of our audit with respect to fraud are: • to identify and assess the risks of material misstatement of the financial statements due to
fraud; • to obtain sufficient appropriate audit evidence regarding the assessed risks of material
misstatement due to fraud, through designing and implementing appropriate audit responses; and
• to respond appropriately to fraud or suspected fraud identified during the audit.
As in all of our audits, in assessing the risks of material misstatement in the financial statements, we also addressed the risk of management override of internal controls, including evaluating whether there was evidence of bias by the executive board that may represent a risk of material misstatement due to fraud. We evaluated (throughout the Group) the design and the implementation and, where considered appropriate, tested the operating effectiveness of internal controls that mitigate fraud risks, performed data analysis of specific journal entries and evaluated key estimates and judgements for bias by the executive board and we incorporated elements of unpredictability in our audit. We refer to the key audit matters ‘measurement of balances due from customers’ and ‘the measurement of assets under operating lease’ as an example of our approach to areas with higher risk due to accounting estimates involving significant management judgements.
As part of our procedures we met throughout the year with all members of the executive board and the heads of Compliance, Legal, Finance, Control, Risk and Internal Audit to understand and discuss emerging matters and potential exposures that they identify. We assessed their views on these exposures based upon our knowledge of the Company’s business model, relevant industry trends and the regulatory environment. We read the minutes of the executive board and the supervisory board meetings throughout the year and up to our signing date of our auditor’s report. We held regular bilateral meetings with the chairman of the supervisory board.
De Lage Landen International B.V. - VZAX3CZHPDYE-183110474-90
Page 8 of 18
The compliance and legal departments investigate, amongst others, reported internal integrity and fraud matters. We assessed the process that the Company has in place and discussed the investigation approach. We inspected a number of individual cases, evaluated the respective impact, assessed the documentation, conclusions, reporting and responses of management. The primary responsibility for the prevention and detection of fraud lies with the executive board with the oversight of the supervisory board.
Laws and regulations There is an industry risk that emerging compliance or litigation areas have not been properly identified and or addressed by management for financial statements purposes. This includes the consideration whether there is a need for the recognition of a provision or a contingent liability disclosure on the future outcome of legal or regulatory matters. The objectives of our audit with respect to non-compliance with laws and regulations are: • to identify and assess the risk of material misstatement of the financial statements due to non-
compliance with laws and regulations; and • to obtain reasonable assurance that the financial statements, taken as a whole, are free from
material misstatement, whether due to fraud or error when considering the applicable legal and regulatory framework.
In line with Standard 250 we made in our audit approach a distinction between those laws and regulations which: • have a direct effect on the determination of material amounts and disclosures in the financial
statements. For this category we obtained audit evidence regarding compliance with those laws and regulations; and
• do not have a direct effect on the determination of material amounts and disclosures in the financial statements, but where compliance may be fundamental to the operating aspects of the business, to the Company’s ability to continue its business or to avoid material penalties. For this category, we performed specific audit procedures to identify non-compliance with those laws and regulations that may have a material effect on the financial statements. In this context we took note, amongst others, of the measures taken and to be taken as part of the so-called group-wide CARE project which is focussed on further implementing the Wwft (Dutch money laundering and terrorist financing act) requirements throughout the Group.
The primary responsibility for the prevention and detection of non-compliance with laws and regulations lies with the executive board with the oversight of the supervisory board.
Key audit matters Key audit matters are those matters that, in our professional judgement, were of most significance in the audit of the financial statements. We have communicated and discussed the key audit matters with the supervisory board. The key audit matters are not a comprehensive reflection of all matters identified by our audit and that we discussed. In this section, we describe the key audit matters and included a summary of the audit procedures we performed on those matters.
We addressed the key audit matters in the context of our audit of the financial statements as a whole, and in forming our opinion thereon. We do not provide separate opinions on these matters or on specific elements of the financial statements. Any comment or observation we made on the results of our procedures should be read in this context.
| }

Contents ContentsConsolidated financial statements Consolidated financial statementsCompany financial statements Company financial statementsManagement Report Management ReportSupervisory Report Supervisory Report
163162
De Lage Landen International B.V. - VZAX3CZHPDYE-183110474-90
Page 9 of 18
Compared to prior year we considered the ‘Classification of client contracts as operational leases, finance leases or loans to customers’ not to be a key audit matter. Though this was a significant risk in our audit approach, it was not a matter of most significance in our audit of the financial statements of the current period. In deviation from prior year we considered the impairment of goodwill for DLL Finans AB to be a key audit matter due to the related significant judgement and assumptions regarding the future financial performance allocated to this cash-generating unit and the relevance of the recorded impairment loss for the profit or loss account 2020. We took the impact of the COVID-19 pandemic into consideration in the audit procedures we performed on the key audit matters.
Key audit matter How our audit addressed the matter
Measurement of balances due from customers [reference to notes 1.1 and 1.3 in the consolidated financial statements] Balances due from customers amounting to €32,331 million are included in the consolidated statement of financial position. This line item consists of finance lease receivables and loans to customers.
The Group is exposed to credit risk in relation to these balances. To account for the expected credit losses, loan loss provisions are recognized. In accordance with IFRS 9, management distinguishes the following provisions: • Performing finance leases and loans
(stage 1) – €169 million as at year-end 2020. • Underperforming finance leases and loans
(stage 2) – €172 million as at year-end 2020. • Credit-impaired finance leases and loans
(stage 3) – €268 million as at year-end 2020.
The stage 1, 2 and ‘small ticket’ stage 3 (exposures below €250,000) provisions are based on quantitative models. The ‘large ticket’ stage 3 provision is based on individual management judgement, including relevant governance and guidelines (such as authorizations and monitoring by the risk committee). Determining loan loss provisions requires a significant degree of management judgement based on aspects such as for example: • Judgement applied in key-parameters for the
model-based provisions (e.g. probability of default and loss given default).
• Expectations with respect to macro-economic scenarios which includes determining the relevant macro-economic variables and the assignment of appropriate risk weights to the different scenarios.
Controls design and operation effectiveness We evaluated the design of the relevant internal controls and subsequently tested the operating effectiveness of these controls regarding: • The governance in relation to development,
validation, calibration and implementation of probability of default and loss given default models.
• The accuracy and completeness of portfolio data that is used in the calculation of the stage 1, stage 2 and stage 3 provisions.
• The methodology and controls applied in measuring and determining significant increase in credit risk.
• The review and approval process that management has in place for the outputs of the models, and the adjustments applied to the outcome of the models.
In addition, we tested the IT environment and relevant IT applications that support data, models and reports utilised to determine the measurement. We focussed on the data lineage of contract and default data used in the development of model parameters and the client exposure allocation to stage 1, 2 or 3.
The majority of the controls were operating effectively and as such it was appropriate to place reliance on for the purpose of our audit. For controls which were not operating effectively, impact assessments were made and additional substantive audit procedures were performed. Substantive audit procedures We inquired with management throughout the year on credit risk developments in the various sectors and geographies. We have tested management’s process for loan loss provisioning, including their considerations of the economic disruption caused by COVID-19.
De Lage Landen International B.V. - VZAX3CZHPDYE-183110474-90
Page 10 of 18
Key audit matter How our audit addressed the matter
• Judgement in assessing the ‘large ticket’ stage 3 provision (including forward-looking information and the valuation of underlying collateral).
• The distinction between stage 1 performing finance leases/loans and stage 2 underperforming finance leases/loans (exposures with a significant increase in credit risk) for non-defaulted contracts.
• The distinction between stage 2 underperforming finance leases/loans and stage 3 non-performing finance leases/loans (credit- impaired financial assets) and the identification of respective qualitative impairment triggers.
• Judgement applied to determine the top level adjustment of €58 million to account for the impact of COVID-19.
The increased degree of estimation uncertainty due to economic impact of COVID-19 in developing macro- economic scenarios, including the associated weightings given the range of potential economic outcome and suitability of models used during COVID-19 have led to a high degree of management judgement regarding expected credit losses. In case when external developments were not sufficiently captured by the outcome of the IFRS 9 model, a management adjustment is made. This year management recognized a top level adjustment of €58 million in relation to COVID-19 to reflect the risk of expected further defaults and associated expected credit losses in certain jurisdictions as outlined in note 1.3 of the consolidated financial statements.
In certain finance lease contracts, the Group is exposed to residual value risk. For these finance leases a process is in place to determine and monitor residual values throughout the contractual period. Given the relevance and overall size of these balances and related loan loss provisions in combination with the significant level of management judgement and inherent high estimation uncertainty, we considered the measurement of balances due from customers a key audit matter.
As such we, with the assistance of our specialists, have performed, amongst other, the procedures outlined below.
Assessment of stage 1/2 provisions • Assessed whether the IFRS 9 model methodology
is in line with market and industry practices and as such is fit for purpose.
• Tested the appropriateness of stage 1 and stage 2 model updates.
• Replicated the stage 1 and stage 2 provisions based on the determined IFRS 9 methodology.
• Evaluated the reasonableness of the forecasted macro-economic scenarios, the probability weights assigned to the plus, baseline and minus scenarios and validated the relevant macro-economic variable (unemployment rate) with external market sources as a benchmark.
• Performed sensitivity analysis on relevant parameters (such as probability of default, loss given default and macro-economic scenarios).
• Evaluated the reasonableness of the probability of default and loss given default models being part of the IFRS 9 model landscape.
• Performed backtesting procedures on the outcome of the probability of default and loss given default models.
• Assessed the reasonableness of management’s top level adjustment of €58 million for the stage 1 and stage 2 provisions as the impact of COVID-19 was deemed to be insufficiently captured by the IFRS 9 model. We evaluated this adjustment by obtaining supporting evidence, assessing alternative and contradictory information to verify that this adjustment was necessary to address model limitations. Specifically, for this adjustment recognised in relation to COVID-19, we have exercised professional scepticism in our audit given the significance and subjective nature of this item. In doing so, we challenged management to consider various scenarios and information, such as historical credit losses, projected credit losses, sensitivity analysis to further substantiate and document the judgements made in this process.
| }

Contents ContentsConsolidated financial statements Consolidated financial statementsCompany financial statements Company financial statementsManagement Report Management ReportSupervisory Report Supervisory Report
165164
De Lage Landen International B.V. - VZAX3CZHPDYE-183110474-90
Page 11 of 18
Key audit matter How our audit addressed the matter
Assessment of stage 3 provisions and other procedures • Evaluated the methodology of the ‘small ticket’
stage 3 provisioning and the reasonableness of the applied loss given default percentages.
• Performed substantive audit procedures on the large ticket stage 3 provisions and evaluated whether management's key judgements were reasonable by assessing for example projected cash flows and underlying assumptions.
• Evaluated the actual credit losses 2020 and compared these to the level of provisioning at year-end 2019 and obtained explanations for identified trends and relevant shifts.
• Tested the reconciliation of relevant financial data between contract management systems, general ledgers and the financial statements.
• Tested on a sample basis critical data elements (e.g. exposure data, significant increase of credit risk, past days due, etc.) relevant for the loan loss provisioning.
• Evaluated whether the disclosures in the financial statements are adequate and in accordance with EU-IFRS.
Our audit procedures did not result in findings that would materially affect the measurement of balances due from customers.
Measurement of assets under operating lease [reference to note 1.2 in the consolidated financial statements] In the consolidated statement of financial position, the carrying value of fixed assets under operating lease amounts to €2,647 million. The fixed assets under operating lease contracts are measured at cost less any accumulated depreciation and any impairment losses. Management has a process in place in which it evaluates the residual values at least on an annual basis, typically during the fourth quarter.
The carrying value of the fixed assets under operating lease is affected by their economic life and residual value. The residual value can be affected by market price developments and is therefore subject to management judgement and estimation uncertainty.
Controls design and operation effectiveness We evaluated the design of the internal controls and subsequently tested the operating effectiveness of controls regarding the residual value setting at inception date of the lease contracts. Furthermore, we focussed on the annual process to reassess the recoverability of estimated residual values and the identification of impairment triggers as per IAS 36. In addition, we evaluated the IT environment and relevant IT applications that support data and reports utilised in the annual process to reassess the recoverability of estimated residual values and the identification of impairment triggers. We focussed on the data lineage of contract and asset data used in the residual value setting process and the annual residual value assessment.
De Lage Landen International B.V. - VZAX3CZHPDYE-183110474-90
Page 12 of 18
Key audit matter How our audit addressed the matter
Applied assumptions regarding the estimated residual value, at inception date of the lease and during the contract period, are sensitive to (local and/or regional) economic developments.
IAS 16 ‘Property, Plant and Equipment’, requires a review of the residual value and the useful life of an asset at least at each financial year-end. When expectations differ from previous estimates, the change(s) shall be accounted for as ‘changes of an accounting estimate’. A change in the estimated residual value results in a prospective depreciation adjustment and consequently affects the carrying value and depreciation expense of the assets over the remaining lease period. Furthermore, IAS 36 ‘Impairment of assets’ requires a periodical assessment for impairment triggers which in turn might lead to adjustment of the carrying value of the fixed assets under operating leases. Given the magnitude of the residual values embedded in the carrying value of the assets under operating lease, the large variety of asset classes and the number of regions in which the Group operates and the significant level of management judgement involved in determining expected residual values and impairments, we considered the measurement of assets under operating lease a key audit matter.
The majority of the controls were operating effectively and as such it was appropriate to place reliance on for the purpose of our audit. For controls which were not operating effectively impact assessments were made and additional substantive audit procedures were performed. Substantive audit procedures We tested the annual residual value assessment, performed by management, consisting of quantitative (such as an evaluation of residual value results recognized during the year to assess the proper residual value setting) and qualitative (such as testing management's expectations regarding market trends and external outlook for asset classes) factors. This to determine the expected residual value at expiration date, and where applicable to determine the impact on future deprecation during the remaining economic life of the asset and potential impairment triggers.
For a sample of adjustments to residual values, we assessed the adjustments recorded against the underlying data (i.e. residual value realizations) and evaluated management’s assessments about market developments.
Reconciliations made by management between contract management systems and general ledgers were tested.
Our audit procedures did not indicate findings that would materially affect the measurement of fixed assets under operating lease.
Application of macro fair value hedge accounting and measurement of derivatives [reference to note 3.4 in the consolidated financial statements] Management used interest rate derivatives to manage the interest rate risk linked to the floating rate loans used to fund an essentially fixed rate portfolio of finance leases and loans to customers.
By applying macro fair value hedge accounting for the €- and $-positions, the Group recognized the results of the hedged items and hedging instruments in the profit or loss account simultaneously, to the extent the hedge relationship is effective.
Controls design and operation effectiveness We evaluated the design of the internal controls and subsequently tested the operating effectiveness of controls regarding the macro fair value hedge accounting and the measurement of interest rate derivatives. We focused on the adequacy of hedge documentation, the monthly effectiveness testing, the controls in place to ensure proper recording of the derivative transactions, and the valuation techniques, models and assumptions applied to ensure compliance with IAS 39.
| }

Contents ContentsConsolidated financial statements Consolidated financial statementsCompany financial statements Company financial statementsManagement Report Management ReportSupervisory Report Supervisory Report
167166
De Lage Landen International B.V. - VZAX3CZHPDYE-183110474-90
Page 13 of 18
Key audit matter How our audit addressed the matter
The €- and $-models to determine the change in fair value of the hedged items and hedging instruments and the amount of (in)effectiveness are complex in nature.
The fair value of derivatives is determined using valuation techniques that are based on discounted cash flow models using market observable inputs in the discounting and forward curves.
In view of the magnitude of the interest rate derivatives’ notional amounts and the hedged items, the complexity of macro fair value hedge accounting, the potential significant impact on recognizing ineffectiveness in the statement of profit or loss and the implicit valuation uncertainty of the derivatives, we considered the application of macro fair value hedge accounting and the measurement of derivatives to be a key audit matter.
We concluded that we could rely on these internal controls for the purpose of our audit and we determined substantive audit procedures necessary to obtain sufficient and appropriate audit evidence, as further outlined below.
Substantive audit procedures We, assisted by our specialists, tested methodologies and models used by the Group for determining hedge effectiveness on the basis of the IAS 39 requirements. We evaluated the results of the hedge effectiveness tests for macro fair value hedging for the €- and $-models. In addition, we tested the accuracy and completeness of the contract information included in the models with the associated finance lease/loan contracts and respective derivatives. Key elements covered in our substantive testing were the notional amounts, maturities and underlying interest and currency rates.
We validated the hedge documentation and the effectiveness testing conducted throughout the year. Next to that, we tested whether the hedge effectiveness is within the bandwidth as defined in IAS 39 during the year. We tested the results on the hedge relationships in the statement of profit or loss by reconciling these to the hedge accounting model output.
Lastly, we tested the measurement of derivatives that comprised substantively repricing a sample of individual derivative trades based on our independent valuation model.
Our substantive audit procedures did not indicate findings that would materially affect the measurement of derivatives, the effectiveness of hedges or the application of macro fair value hedge accounting.
Impairment of goodwill [reference to note 4.1 in the consolidated financial statements] During 2020, goodwill allocated to DLL Finans AB (a regulated entity located in Stockholm) of €70 million was fully impaired. In accordance with IAS 36.10b this goodwill is tested for impairment at least on an annual basis. An impairment loss shall be recognised for a cash-generating unit (being DLL Finans AB) if, and only if, the recoverable amount of the cash-generating unit is less than the carrying amount.
Substantive audit procedures With the assistance of our valuation experts, our procedures included, among others, evaluation of the assumptions and methodologies used in the annual impairment test, an assessment of the mathematical accuracy of the calculations and an assessment of the reasonableness of the financial projections.
De Lage Landen International B.V. - VZAX3CZHPDYE-183110474-90
Page 14 of 18
Key audit matter How our audit addressed the matter
The recoverable amount of a cash-generating unit is the higher of its fair value less costs of disposal and its value in use. The periodic impairment test is based on a discounted cash flow model to calculate the value in use.
This goodwill impairment test involves significant management judgement and is based on assumptions about expected market and economic conditions, forecasted financial performance, new regulatory capital requirements (Basel IV) against a discount rate and allocated to the cash-generating unit. Based on the respective results of the impairment test, including additional sensitivity tests and relevant scenario analysis, management concluded that a full impairment of the goodwill should be recorded. The main drivers for the goodwill impairment are outlined in note 4.1 of the consolidated financial statements.
We identified the impairment of goodwill for DLL Finans AB as a key audit matter due to the considerable financial impact of the impairment loss on the 2020 group result and the significant judgement and assumptions used in the calculation about the future financial performance.
We have challenged management, primarily on their assumptions applied to which the outcome of the impairment test is most sensitive, in particular, the projected revenue growth, projected margin, projected credit losses and the applied discount rate.
We performed independent testing and analysis of the peer group composition for the discount rate as well as the alternative fair value valuations (as required under IAS 36 to determine fair value) using listed peers and comparable transactions.
We challenged management by comparing the relevant assumptions with historic performance data of DLL Finans AB and local economic developments, taking into account the sensitivity of the goodwill balance for changes in the respective assumptions.
Furthermore, we evaluated whether the disclosures in the financial statements are adequate and in accordance with EU-IFRS.
On the basis of the audit evidence obtained we consider the valuation method and the underlying assumptions to be reasonable and an adequate basis for the recorded impairment of goodwill.
Report on the other information included in the annual report
In addition to the financial statements and our auditor’s report thereon, the annual report contains other information that consists of: • the management report; • the supervisory report; and • the other information pursuant to Part 9 of Book 2 of the Dutch Civil Code.
Based on the procedures performed as set out below, we conclude that the other information: • is consistent with the financial statements and does not contain material misstatements; and • contains the information that is required by Part 9 of Book 2 of the Dutch Civil Code.
We have read the other information. Based on our knowledge and understanding obtained in our audit of the financial statements or otherwise, we have considered whether the other information contains material misstatements.
By performing our procedures, we comply with the requirements of Part 9 of Book 2 of the Dutch Civil Code and the Dutch Standard 720. The scope of such procedures was substantially less than the scope of those performed in our audit of the financial statements.
| }

Contents ContentsConsolidated financial statements Consolidated financial statementsCompany financial statements Company financial statementsManagement Report Management ReportSupervisory Report Supervisory Report
169168
De Lage Landen International B.V. - VZAX3CZHPDYE-183110474-90
Page 15 of 18
The executive board is responsible for the preparation of the other information, including the management report and the other information in accordance with Part 9 of Book 2 of the Dutch Civil Code.
Report on other legal and regulatory requirements
Our appointment We were appointed as auditors of De Lage Landen International B.V. on 9 December 2016 by the supervisory board following the passing of a resolution by the shareholders at the annual meeting held on 18 June 2015. Our appointment has been renewed annually by shareholders representing a total period of uninterrupted engagement appointment of five years.
No prohibited non-audit services To the best of our knowledge and belief, we have not provided prohibited non-audit services as referred to in Article 5(1) of the European Regulation on specific requirements regarding statutory audit of public-interest entities.
Services rendered The services, in addition to the audit, that we have provided to the Company, for the period to which our statutory audit relates, are disclosed in note 2.5 to the consolidated financial statements.
Responsibilities for the financial statements and the audit
Responsibilities of the executive board and the supervisory board for the financial statements The executive board is responsible for: • the preparation and fair presentation of the financial statements in accordance with EU-IFRS
and with Part 9 of Book 2 of the Dutch Civil Code; and for • such internal control as the executive board determines is necessary to enable the preparation of
the financial statements that are free from material misstatement, whether due to fraud or error.
As part of the preparation of the financial statements, the executive board is responsible for assessing the Company’s ability to continue as a going concern. Based on the financial reporting frameworks mentioned, the executive board should prepare the financial statements using the going concern basis of accounting unless the executive board either intends to liquidate the Company or to cease operations, or has no realistic alternative but to do so. The executive board should disclose events and circumstances that may cast significant doubt on the Company’s ability to continue as a going concern in the financial statements.
The supervisory board is responsible for overseeing the Company’s financial reporting process.
Our responsibilities for the audit of the financial statements Our responsibility is to plan and perform an audit engagement in a manner that allows us to obtain sufficient and appropriate audit evidence to provide a basis for our opinion. Our objectives are to obtain reasonable assurance about whether the financial statements as a whole are free from material misstatement, whether due to fraud or error and to issue an auditor’s report that includes our opinion. Reasonable assurance is a high but not absolute level of assurance, which makes it possible that we
De Lage Landen International B.V. - VZAX3CZHPDYE-183110474-90
Page 16 of 18
may not detect all material misstatements. Misstatements may arise due to fraud or error. They are considered to be material if, individually or in the aggregate, they could reasonably be expected to influence the economic decisions of users taken on the basis of the financial statements.
Materiality affects the nature, timing and extent of our audit procedures and the evaluation of the effect of identified misstatements on our opinion.
A more detailed description of our responsibilities is set out in the appendix to our report.
Amsterdam, 28 April 2021 PricewaterhouseCoopers Accountants N.V.
/PwC_Partner_Signature/
Original has been signed by C.C.J. Segers RA
| }

Contents ContentsConsolidated financial statements Consolidated financial statementsCompany financial statements Company financial statementsManagement Report Management ReportSupervisory Report Supervisory Report
171170
De Lage Landen International B.V. - VZAX3CZHPDYE-183110474-90
Page 17 of 18
Appendix to our auditor’s report on the financial statements 2020 of De Lage Landen International B.V.
In addition to what is included in our auditor’s report, we have further set out in this appendix our responsibilities for the audit of the financial statements and explained what an audit involves.
The auditor’s responsibilities for the audit of the financial statements We have exercised professional judgement and have maintained professional scepticism throughout the audit in accordance with Dutch Standards on Auditing, ethical requirements and independence requirements. Our audit consisted, among other things of the following: • Identifying and assessing the risks of material misstatement of the financial statements, whether
due to fraud or error, designing and performing audit procedures responsive to those risks, and obtaining audit evidence that is sufficient and appropriate to provide a basis for our opinion. The risk of not detecting a material misstatement resulting from fraud is higher than for one resulting from error, as fraud may involve collusion, forgery, intentional omissions, misrepresentations, or the intentional override of internal control.
• Obtaining an understanding of internal control relevant to the audit in order to design audit procedures that are appropriate in the circumstances, but not for the purpose of expressing an opinion on the effectiveness of the Company’s internal control.
• Evaluating the appropriateness of accounting policies used and the reasonableness of accounting estimates and related disclosures made by the executive board.
• Concluding on the appropriateness of the executive board’s use of the going concern basis of accounting, and based on the audit evidence obtained, concluding whether a material uncertainty exists related to events and/or conditions that may cast significant doubt on the Company’s ability to continue as a going concern. If we conclude that a material uncertainty exists, we are required to draw attention in our auditor’s report to the related disclosures in the financial statements or, if such disclosures are inadequate, to modify our opinion. Our conclusions are based on the audit evidence obtained up to the date of our auditor’s report and are made in the context of our opinion on the financial statements as a whole. However, future events or conditions may cause the Company to cease to continue as a going concern.
• Evaluating the overall presentation, structure and content of the financial statements, including the disclosures, and evaluating whether the financial statements represent the underlying transactions and events in a manner that achieves fair presentation.
Considering our ultimate responsibility for the opinion on the consolidated financial statements, we are responsible for the direction, supervision and performance of the group audit. In this context, we have determined the nature and extent of the audit procedures for components of the Group to ensure that we performed enough work to be able to give an opinion on the financial statements as a whole. Determining factors are the geographic structure of the Group, the significance and/or risk profile of group entities or activities, the accounting processes and controls, and the industry in which the Group operates. On this basis, we selected group entities for which an audit or review of financial information or specific balances was considered necessary.
We communicate with the supervisory board regarding, among other matters, the planned scope and timing of the audit and significant audit findings, including any significant deficiencies in internal control that we identify during our audit.
De Lage Landen International B.V. - VZAX3CZHPDYE-183110474-90
Page 18 of 18
In this respect, we also issue an additional report to the supervisory board in accordance with Article 11 of the EU Regulation on specific requirements regarding statutory audit of public-interest entities. The information included in this additional report is consistent with our audit opinion in this auditor’s report.
We provide the supervisory board with a statement that we have complied with relevant ethical requirements regarding independence, and to communicate with them all relationships and other matters that may reasonably be thought to bear on our independence, and where applicable, related actions taken to eliminate threats or safeguards applied.
From the matters communicated with the supervisory board, we determine those matters that were of most significance in the audit of the financial statements of the current period and are therefore the key audit matters. We describe these matters in our auditor’s report unless law or regulation precludes public disclosure about the matter or when, in extremely rare circumstances, not communicating the matter is in the public interest.
| }
Contents ContentsConsolidated financial statements Consolidated financial statementsCompany financial statements Company financial statementsManagement Report Management ReportSupervisory Report Supervisory Report
173172
Article 11 of the articles of association determines profit, loss and distribution on shares. On a proposal by the Executive Board, the General Meeting allocates the profits determined by the adoption of the annual accounts, determines how a shortfall will be accounted for and declares interim distributions from the profits or distributions from the reserves. Profit or reserves may only be distributed to the extent that the Company’s equity exceeds the total amount of the reserves referred to in article 2:216 (1) BW.
Notwithstanding the provisions of article 2:216 (1) BW, a resolution to distribute profits or reserves is subject to the Executive’s Board’s approval. If at the time when the profits are allocated, no resolution is adopted on the distribution or the addition to the reserves of these profits, the profits will be added to the reserves.
Articles of association regulation concerning profit appropriation
Colophon
Published byDLL About the Annual Report 2020DLL has integrated both the financial information and the management report information in the Annual Report 2020. The Annual Report 2020 is based on, among other things, the financial statements and other information about DLL as required under Title 9 of Book 2 of the Dutch Civil Code and other applicable laws and regulations. The Annual Report 2020 has been filed at the offices of the Trade Registry at the Chamber of Commerce under number 17056223 after the adoption of DLL’s financial statements by Coöperatieve Rabobank U.A. An independent auditor’s report has been issued for the financial statements, as required under Article 2:393, Paragraph 1 of the Dutch Civil Code. This report takes the form of an unqualified opinion. The section “Report of the Supervisory Board” does not form part of the statutory management report. The Annual Report 2020 is available on our website:www.dllgroup.com TrademarksDLL® and DLL Financial Solutions PartnerSM are service marks of De Lage Landen International B.V. ContactDLL has exercised the utmost care in the preparation of the Annual Report 2020. If you have questions or suggestions on how we can improve our reporting, please send them by email to [email protected] DLLVestdijk 515611 CA EindhovenThe Netherlands Phone +31 40 233 9911 E-mail [email protected]
| }

Contents Consolidated financial statements Company financial statementsManagement Report Supervisory Report
174
De Lage Landen International B.V.Vestdijk 51, 5611 CA EindhovenP.O. Box 652, 5600 AR EindhovenThe Netherlands
www.dllgroup.com
|