annual report 2020 the conglomerate shows it strength
TRANSCRIPT

The conglomerate
shows it strength
Annual Report 2020
INVESTOR PRESENTATION
5 March 2021

Vis/skjul grid: ALT+F9
A portfolio of six strong businesses
2
INTRODUCTION
Quality feed for
fish and shrimps
Fabrics for diapers
and hygiene
Textiles for indus-
trial applications
Electronic Manu-
facturing Services
Hydraulic compo-
nents & solutions
Remanufactured
automotive parts
Aquaculture feed Nonwovens Industrial solutions
Revenue
DKK 11.6bn
Employees
~1,400
~45% of Group EBITDA
Revenue
DKK 2.1bn
Employees
~750
Revenue
DKK 1.8bn
Employees
~1,000
Revenue
DKK 2.9bn
Employees
~3,600
Revenue
DKK 2.0bn
Employees
~1,150
Revenue
DKK 0.9bn
Employees
~1,500
~30% of Group EBITDA ~25% of Group EBITDA

Vis/skjul grid: ALT+F9
The strength of theconglomerate
INTRODUCTION
Active ownership
enabling long-term
and responsible
transformation
Long-term
and visionaryTaking risk and
investing
long-term
Results are
created by peopleCreating returns in a
proper and trust-
worthy manner
Patient,
but demandingOwnership through
and with the
management
teams
Making every
penny countIndustrial mindset
and operational
streamlining
A relevant
ownerContinually adapt
and safeguard
reputation and
values

Return back
above target
ROIC ex GW per cent
Strong earnings and cash flow in 2020
4
2020 STATUS
2019 2020
20,9 21,3
+1,6%
2019
2,209
2020
1,951
+13%
2019
2,296
2020
1,410
+63%
12.3
2019
15.3
2020
+3.0pp
Growth in
unprecedented yearStrong uplift
in profitabilityVery strong cash flow
generation
Revenue DKKbn EBITDA DKKm Cash Flow Op. DKKm
2019 2020
3,107
3,738
-17%
Solid decline in
Net Working Capital
NWC DKKm

Vis/skjul grid: ALT+F9
2020 was a very unusual year
5
2020 STATUS
▪ A portfolio of strong and well-invested
businesses with solid prospects
▪ Solid capital structure with room to seek
opportunities and sustain the long-term
momentum
▪ From an overall perspective, well underway
to achieve its strategic goals both short and
long term
STARTING POINT
▪ BioMar successfully ran in production at
the new factory in Australia, completed
building a factory in China and signed
agreement to start operations in Vietnam
▪ Fibertex Personal Care delivered
EBITDA of more than DKK 400m and
approved investments in Malaysia and the
USA
▪ Fibertex Nonwovens lifted earnings to
highest level ever, driven by high capacity
utilisation
▪ GPV had positive effects from large order
for ventilators
▪ HydraSpecma saw negative impact of
coronavirus in Sweden, but with offsetting
effects from efficiency improvements and
growth in wind business.
▪ Borg Automotive completed acquisition
of TMI in Spain and implemented
substantial adjustment of workforce in
Poland.
A TURBULENT YEAR
▪ In a year of unprecedented events the
conglomerate model showed its strength
▪ Schouw & Co.’s strategy unchanged: focus
remains on long-term growth and
transformation
▪ Capital resources and management
resources in place for sustained growth and
development.
CONGLOMERATE STRENGTH
▪ Corona-driven lockdowns have challenged
efficiency and limited demand, especially in
the automotive segments
▪ Lower exchange rates to DKK, especially in
Norwegian kroner and US dollars, have
reduced revenue by more than DKK 600
million.
▪ Lower prices of raw materials leading to
temporary income flows in the Fibertex
businesses
▪ Lower costs due to less travel activity,
reduced marketing, etc.
▪ Demand for PPEs and hygiene products
increasing volume sales, enhancing
efficiency at the Fibertex businesses.
POSITIVE FACTORS IN 2020 NEGATIVE FACTORS IN 2020

Vis/skjul grid: ALT+F9
Schouw & Co. Group NWC DKK million, %
▪ Net Working Capital decreased by more than DKK 600m in 2020
▪ Key focus area across all businesses and management teams
▪ Use of Supply Chain Financing unchanged from 2019 to 2020
▪ Effect from lower raw material prices in 2020 compared to 2019
▪ DKK ~60m from extended government payment terms and
Y/Y effect from lower FX of DKK ~100m
GPV
Strong NWC development in 2020
2020 STATUS
3,172
Jun 2019
Dec 2018
17.3%
19.4%18.4%
Mar 2019
3,107
Sep 2019
18.3%17.8%
Dec 2019
18.2%
Mar 2020
14.9%
Sep 2020
14.6%
Dec 2020
3,4413,725
3,9383,795 3,738 3,829
3,681
17.5%
Jun 2020
-631m (-17%)
NWC NWC% of sales
-46
Dec ’19
+73
701
Q1 Q2
+12
Q3
-104
Q4 Dec ’20
766
-9%BioMar
HydraSpecmaFPC
BorgFIN
-11
Dec ’19 Q2
+187
Q1
-97
-439
Q3 Q4 Dec ’20
1,315
955
-27%
Dec ’19
-3
Q1
-29
Q2
-8
Q3
-4
Q4 Dec ’20
665
621
-7%
-18
250
Dec ’19 Q1
-31
Q2
-35
Dec ’20Q3
+3
Q4
332
-25%
Dec ’19
156-16
Q1
-55
Q2
-25
Q3
+52
Q4 Dec ’20
113
-28%
-12
Dec ’19 Q1
-7
Q2
-10
Q3
-9
Q4 Dec ’20
510
472
-8%
Figures in DKK million

Vis/skjul grid: ALT+F9
Net Interest-Bearing Debt DKK million
Significant net debt reduction following strong cash generation and low M&A and capex activity
Significant NIBD reduction in 2020
7 Notes: 1) Adjustments to EBITDA relate to provisions and divestments
Cash Flow from Operations
DKK 2,296m
Investments
DKK 533m
2020 STATUS
471 309
493
336
Adj.
19
EBITDANIBD 2019 M&ANWC
45
94
Financials Tax
60
Dividends Other NIBD 2020Capex
3,298
2,2091,936
-41%

Vis/skjul grid: ALT+F9
BioMar
Capex set to increase in 2021
2020 STATUS
Schouw & Co.
2016 2017 2018
493
2019 2020 2021
841 811715
792
~1,000
FPC FIN GPV HydraSpecma Borg
’20’19
~150
’16 ’17 ’18 ’21
274
202226
445
152
’18 ’21’16 ’17 ’19 ’20
~250
361
319
153
55
93 98
’19’16 ’17 ’18 ’20 ’21
108
164
12392
~370
’16
~150
’17 ’18 ’19 ’20 ’21
4273
11288
32
’16 ’17 ’18 ’20’19 ’21
57 42
8455
113~80
’18’17’16 ’19 ’20 ’21
15 1841 27
11~35
Mainly
maintenance
Mainly line 9,
Malaysia and
print line 2, US
Spunlacing lines
in Europe and
US, phase 1
Thailand and Sri
Lanka expansion and
postponed capex
Finalising new
sites in Sweden
and Denmark
Mainly
maintenance
▪ 2019 marked the end of a major investment
program and 2020 capex was lower than
recent years
▪ 2021 capex will pick up on development
initiatives and form the basis for new growth
▪ Major projects are FPC’s line 9 expansion in
Malaysia (total DKK ~250m in 2020-21) and
FIN’s two new spunlacing lines in Europe
and US (total DKK ~550m in 2021-22)
Figures in DKK million

Vis/skjul grid: ALT+F9
Revenue DKK million
Depreciations DKK million
Profit DKK million
2021 guidance
9
OUTLOOK
2021E 2020R
BioMar 950-1,020 972
Fibertex Personal Care 320-360 406
Fibertex Nonwovens 220-250 270
GPV 220-250 271
HydraSpecma 210-230 211
Borg Automotive 130-150 108
Other -35 -29
Total EBITDA 2,015-2,225 2,209
PPA depreciations -85 -89
Other depreciations -775 -744
Total EBIT 1,155-1,365 1,376
Associates etc. 40 -36
Divestments - 2
Other financial items -90 -133
Profit Before Tax 1,125-1,315 1,209
2021E 2020R
BioMar c. 12,000 11,649
Fibertex Personal Care c. 2,200 2,118
Fibertex Nonwovens c. 1,850 1,791
GPV c. 2,700 2,887
HydraSpecma c. 2,100 1,977
Borg Automotive c. 1,050 871
Other - -19
Total Revenue c. 21,900 21,273
2021E 2020R
BioMar 348 335
Fibertex Personal Care 138 137
Fibertex Nonwovens 103 104
GPV 120 120
HydraSpecma 94 88
Borg Automotive 56 48
Other 1 1
Total Depreciations 860 833

Vis/skjul grid: ALT+F9
A global leader in quality feed for aquaculture focusing on
responsible use of sustainable raw materials, food safety and
traceability in the entire value chain
BioMar: Solid ’20 despite corona uncertainty
10
PORTFOLIO COMPANIES
EBITDA DKK million
▪ FY volume growth, especially in
salmon (Norway, Chile, Australia)
▪ Corona uncertainty throughout most
of the year
▪ Q4 profitability declines due to difficult
markets in Chile and Ecuador
▪ Ramping up in Australia and China
▪ NWC declines DKK +350m following
reduced receivables and inventories
▪ ROIC solid at 18.4%
▪ Innovative products/concepts and
close collaboration with customers
Revenue DKK billion
20202016 20192017
11.2
2021E2018
8.910.0 10.3
11.6 12.0+7.1%
20202016 2017 2018 2019 2021E
722 712 713
972966960-1,030+7.7%
CAGR
▪ Some degree of normalisation in
HoReCa demand expected
▪ Volumes expected to increase in ‘21
▪ Deal signed for majority ownership of
Vietnamese shrimp feed factory
▪ Investments in IT and technological
innovation
▪ Continue improvements in the salmon
markets/Norway
▪ Significant improvement in associate
Salmones Austral expected
Solid 2020 with 5% growth in
volumes despite corona
Uncertainty continues in 2021,
but strong growth platform

Vis/skjul grid: ALT+F9
Fresh Norwegian Atlantic Salmon gutted (NOK/kg)
Salmon prices
11
PORTFOLIO COMPANIES
Source: Kontali
0
10
20
30
40
50
60
70
80
90
Week
401 10 20 30 50
Fresh Chilean Atlantic Salmon fillets (USD/kg)
0
1
2
3
4
5
6
7
8
9
10
11
12
13
14
50
Week
1 403010 20
2020High-Low 2008-2018 2019 2021

Vis/skjul grid: ALT+F9
Market leader in spunbond fabrics used in hygiene
applications improving everyday health and well-being for
millions of people worldwide
FPC: Volume increase and high efficiency
12
PORTFOLIO COMPANIES
EBITDA DKK million
▪ Nonwovens volumes up +10%
leading to full capacity utilisation
▪ Significant effect of FX in contracts
and raw material prices in Q1-Q3
▪ Print volumes up almost 20% with
print being 17% of revenue
▪ Certified circular PolyPropylene
▪ Expansion in Malaysia with new
nonwovens line
▪ US print still loss-making but volumes
ramping up and second line ordered
▪ ROIC reaching 18.3%
Revenue DKK billion
20192016 2017 2018 2020 2021E
2.2
1.82.0
2.2 2.1 2.2
+4.3%
2016 2017 20192018 2020 2021E
362 365315
352406
320-360
+2.9%
CAGR
▪ Increasing raw materials will have
significant negative impact in 2021
▪ Good demand outlook in both Asia
and Europe
▪ Focus on innovation, speciality
products and post-treatment
applications
▪ Increase in revenue solely from
higher raw materials which similar
has a negative EBITDA impact
Very strong 2020 with high
capacity utilisation
Current demand pattern
expected to in 2021
Vis/skjul grid: ALT+F9
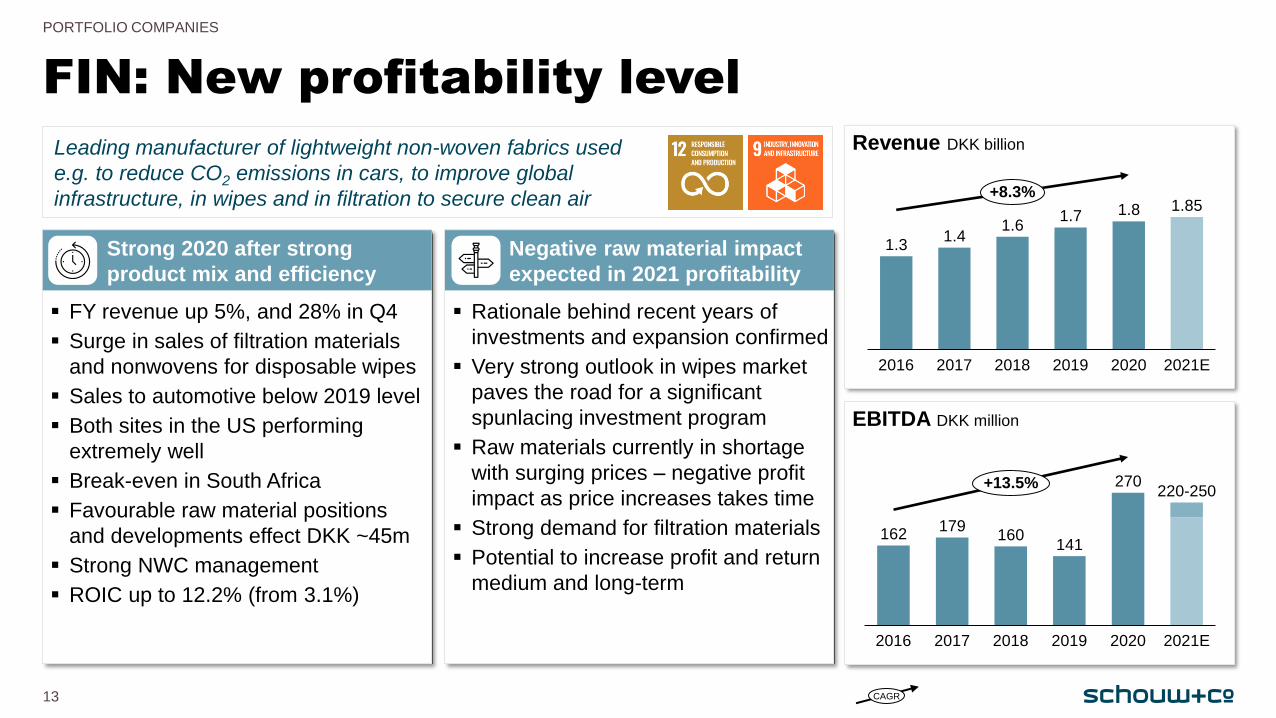
Leading manufacturer of lightweight non-woven fabrics used
e.g. to reduce CO2 emissions in cars, to improve global
infrastructure, in wipes and in filtration to secure clean air
FIN: New profitability level
13
PORTFOLIO COMPANIES
EBITDA DKK million
▪ FY revenue up 5%, and 28% in Q4
▪ Surge in sales of filtration materials
and nonwovens for disposable wipes
▪ Sales to automotive below 2019 level
▪ Both sites in the US performing
extremely well
▪ Break-even in South Africa
▪ Favourable raw material positions
and developments effect DKK ~45m
▪ Strong NWC management
▪ ROIC up to 12.2% (from 3.1%)
Revenue DKK billion
20182016 2020
1.8
2017
1.85
2021E2019
1.31.4
1.61.7
+8.3%
20192016 2017
270
162
2021E2018 2020
179160
141
220-250+13.5%
CAGR
▪ Rationale behind recent years of
investments and expansion confirmed
▪ Very strong outlook in wipes market
paves the road for a significant
spunlacing investment program
▪ Raw materials currently in shortage
with surging prices – negative profit
impact as price increases takes time
▪ Strong demand for filtration materials
▪ Potential to increase profit and return
medium and long-term
Strong 2020 after strong
product mix and efficiency
Negative raw material impact
expected in 2021 profitability

Vis/skjul grid: ALT+F9
Polypropylene ICIS (EUR/ton)
1,300
1,000
1,100
1,200
1,400
950
1,050
1,150
1,250
1,350
1,450
Dec 17
Dec 16
Jan 16
Dec 19
Jun 16
Jun 17
Jun 18
Dec 18
Jun 19
Jun 20
Dec 20
Virgin PET PCI China (USD/kg)
Fibertex: Surging raw material prices in 2021
14
PORTFOLIO COMPANIES
Viscose PCI China (USD/kg)
1.5
1.0
2.0
1.1
1.3
1.2
0.8
1.4
1.9
1.6
1.8
2.2
0.9
1.7
2.1
Jun 20
Jun 19
Dec 18
Jan 16
Jun 16
Dec 16
Jun 17
Dec 17
Jun 18
Dec 19
Dec 20
1.40
0.60
1.00
0.80
1.10
1.20
1.30
0.65
0.70
0.75
0.85
1.25
0.90
0.95
1.05
1.15
1.35
Dec 17
Jun 17
Dec 16
Jun 16
Jan 16
Jun 18
Dec 18
Jun 19
Dec 19
Jun 20
Dec 20
2021R 2020R 2016-2019R
2016-2019
Avg. 1.06
2020
Avg. 0.79
2016-2019
Avg. 1.81
2020
Avg. 1.21
2016-2019
Avg. 1,302
2020
Avg. 1,144

Vis/skjul grid: ALT+F9
European top 10 EMS company serving global industrial and
cleantech customers from Asian factories with significant
better-than average health & safety and working conditions
GPV: Very strong finish to 2020
15
PORTFOLIO COMPANIES
EBITDA DKK million
▪ 1% improvement in FY revenue
▪ Reduced demand in certain markets
and segments since Q2
▪ Very strong sales to MedTech with
ventilator order of DKK +200m
▪ Tight cost management and FTE
reduction
▪ CCS integration completed
▪ Inventory management lowers NWC
▪ ROIC increases to 11%
Revenue DKK billion
2021E2016
2.7
2017 20192018 2020
1.20.9
1.1
2.9 2.9+34.7%
115
2016 20192017 2018 2021E
107
2020
84
196
271220-250
+33.9%
CAGR
▪ Strong European market coverage in
both Scandinavia and DACH
▪ Factory footprint optimisation
▪ Expanding big Asian sites in Thailand
and Sri Lanka
▪ Solid customer pipeline management
▪ General uncertainty to affect
customer demand in 2021
▪ 2021 revenue guidance below 2020
▪ Component shortage to increase
inventories and affect profitability
Very strong end to a very
unusual year
2021 profitability without
effect of ventilator order

Vis/skjul grid: ALT+F9
Leading Nordic Power & Motion hydraulic component and
solutions specialist servicing wind turbine and other cleantech
customers globally
HydraSpecma: High activity in wind segment
16
PORTFOLIO COMPANIES
EBITDA DKK million
▪ FY revenue down 7%, however Q4
revenue up 1% Y/Y
▪ Strong sales to wind throughout 2020
with sales ~30% of total revenue
▪ Vehicles and mobile OEM affected by
lockdowns and declining demand
▪ EBITDA margin increased to 10.7%
▪ NWC focus reduces inventories
▪ ROIC declines to 12.9%
Revenue DKK billion
2018 2021E202020172016 2019
2.01.7 1.8
2.12.0
2.1
+3.1%
2021E2019201820172016 2020
170148
175
215 211210-230
+5.5%
CAGR
▪ Vehicle segment expected to grow
back to pre-corona levels
▪ Hydraulics market is volatile and
dependent on end markets
▪ Building sites in Sweden and
Denmark
▪ Further focus on product range within
electrification
▪ 2021 profitability better than 2020
level
Significant corona impact but
strong sales to wind segment
Stable outlook despite
uncertainty in some segments
Vis/skjul grid: ALT+F9
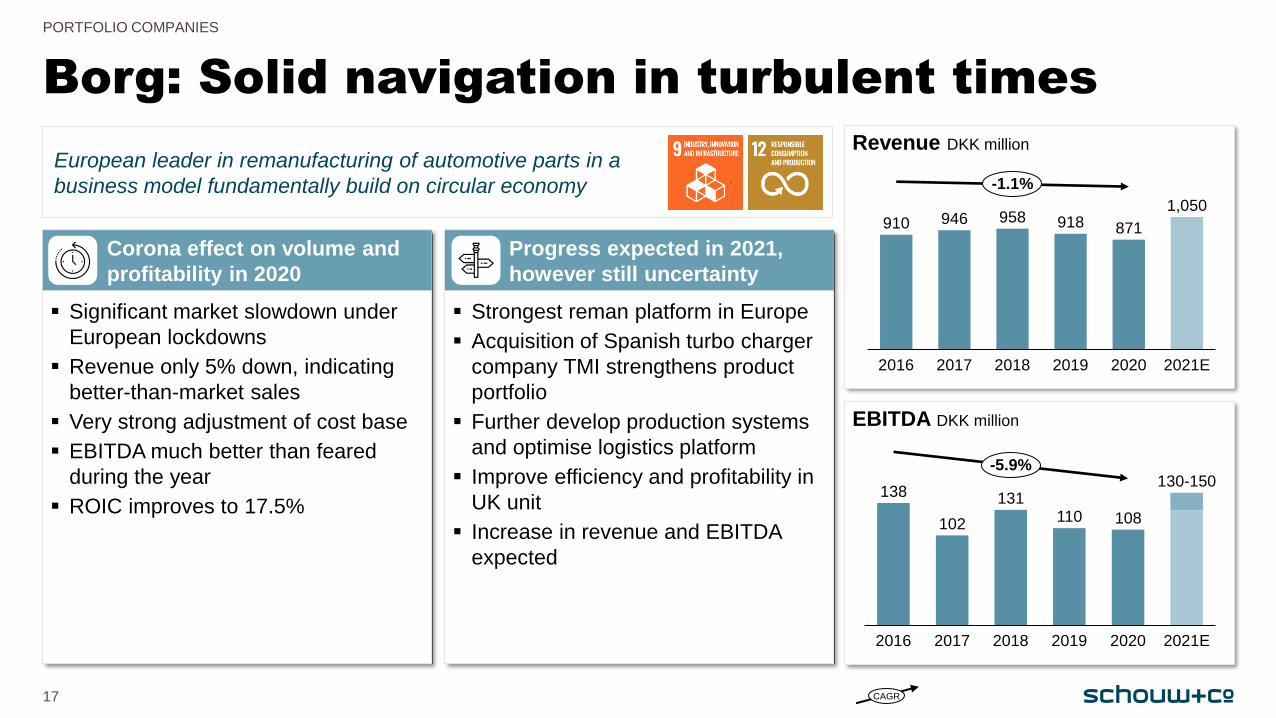
European leader in remanufacturing of automotive parts in a
business model fundamentally build on circular economy
Borg: Solid navigation in turbulent times
17
PORTFOLIO COMPANIES
EBITDA DKK million
▪ Significant market slowdown under
European lockdowns
▪ Revenue only 5% down, indicating
better-than-market sales
▪ Very strong adjustment of cost base
▪ EBITDA much better than feared
during the year
▪ ROIC improves to 17.5%
Revenue DKK million
20182017 2021E2016 2019 2020
910 946871
958 9181,050
-1.1%
110
2016
102
2017 2018 2019 2021E2020
138 131
108
130-150-5.9%
CAGR
▪ Strongest reman platform in Europe
▪ Acquisition of Spanish turbo charger
company TMI strengthens product
portfolio
▪ Further develop production systems
and optimise logistics platform
▪ Improve efficiency and profitability in
UK unit
▪ Increase in revenue and EBITDA
expected
Corona effect on volume and
profitability in 2020
Progress expected in 2021,
however still uncertainty

Vis/skjul grid: ALT+F9
2021 priorities: Group and company level
18
OUTLOOK
▪ Ensure scalability and operational excellence
▪ Integrate TMI and fix underperforming UK
▪ Strengthen electrification, grow in wind, and
develop Nordic aftermarket
▪ Optimise footprint (building in Sweden/Denmark)
▪ Internationalise design/engineering
▪ Develop footprint and operational management
▪ Improve Mexico
▪ Continue globalising BioMar (incl. Asia)
▪ Innovate further with technology
▪ Sustain momentum in wipes and nano/filter
▪ Build spunlace capacity
▪ Regain volumes in automotive
▪ Increase capacity, but ensure utilisation at sites
▪ Introduce sustainable products, enhance R&D
Schouw & Co. (Group level)
Improve earnings
▪ Optimize pricing (margins),
adjust cost base
▪ Close or develop activities that
reduce earnings
Business level
Investments in growth
▪ Allocate capital for continued
transformation
▪ Investments/M&A to strengthen
long-term competitiveness
Optimisation of capital use
▪ Optimize workflows to
reduce NWC
▪ Ensure full asset utilization
Future-proofing
▪ Think long-term but seize
opportunities as they arise
▪ Take responsibility

Aktieselskabet Schouw & Co.
Chr. Filtenborgs Plads 1 8000 Aarhus C Denmark
+45 86 11 22 22
www.schouw.dk
www.linkedin.com/company/schouw
Nasdaq Copenhagen ticker SCHO
Enabling long-term and responsible transformation