annual report - fbpfunds.comfbpfunds.com/.../06/fbp-annual-report-3-31-2019.pdf · 3/31/2019 ·...
TRANSCRIPT

FBP Equity & Dividend Plus FundFBP Appreciation & Income Opportunities Fund
Annual ReportMarch 31, 2019
No-Load Funds
Beginning on January 1, 2021, as permitted by regulations adopted by the U.S. Securities and Exchange Commission, paper copies of the Funds’ shareholder reports like this one will no longer be sent by mail, unless you specifically request paper copies of the reports from the Funds or from your financial intermediary, such as a broker-dealer or bank. Instead, the reports will be made available on a website, and you will be notified by mail each time a report is posted and provided with a website link to access the report.
If you already elected to receive shareholder reports electronically, you will not be affected by this change and you need not take any action. You may elect to receive shareholder reports and other communications from the Funds electronically by contacting the Funds at 1-866-738-1127 or, if you own these shares through a financial intermediary, by contacting your financial intermediary.
You may elect to receive all future reports in paper free of charge. You can inform the Funds that you wish to continue receiving paper copies of your shareholder reports by contacting the Funds at 1-866-738-1127. If you own shares through a financial intermediary, you may contact your financial intermediary or follow instructions included with this document to elect to continue to receive paper copies of your shareholder reports. Your election to receive reports in paper will apply to all Funds held with the Fund complex or at your financial intermediary.


1
Letter to Shareholders May 1, 2019
We are pleased to report on your Funds and their investments for the annual period ended March 31, 2019, and to provide some additional information since we last communicated with you.
Economic and Market UpdateEquity markets have been quite volatile since our last semi-annual report to you. Stocks experienced a sharp correction during the final calendar quarter of 2018 that erased gains generated earlier during the year. The sell-off was especially acute in December, giving investors a holiday that only Scrooge could enjoy. The downturn was marked by wild trading, some days experiencing 1,000-point intraday swings for the Dow Jones Industrial Average.
Several factors were at work that brought about the sharp change in investor sentiment. The most likely spark that lit the flame of worry was Fed Chairman Jerome Powell’s comments in October in which he implied that the Fed was “a long way” from normalizing interest rates to neutral levels. The idea that we could get much higher rates in a shorter amount of time clearly spooked investors. In December, despite public criticism from President Trump, the FOMC made good on its telegraphed plan to raise interest rates one more time in 2018, taking the fed funds rate to near 2.5%. With the ten-year Treasury then yielding 2.7%, the yield curve became quite flat. Trade fears also came back into focus with news that the U.S. and China were at odds over tariffs. Oil prices tanked. Commodity investors seemed to realize all at once that with loosened sanctions on Iranian crude and global economic growth slumping, there could be a glut of supply on the market. The mid-term election, impeachment rumors, Brexit and the government shutdown, were all factors that worked to pressure consumer confidence and equity markets.
Then on December 26th, investors came back from the holiday in the mood for bargains. Corporate earnings surged more than 20% last year, in large part due to the 2017 corporate tax rate cut and regulatory reform. With earnings up and stock prices down, the price to forward earnings ratio for the S&P 500, at 14.4 times, looked more attractive at the end of calendar 2018 than it had in more than five years. We believe the significantly more attractive valuation played a major role in moving stocks higher. Additionally, many of the prior concerns were mitigated after the Fed backed off its hawkish posture, trade negotiations with China seemed to be progressing, and GDP, while slowing, continued to show steady growth. The stage was set for positive stock market performance.
As 2019 started, the S&P 500 produced its strongest quarterly return since 2009 and its best first quarter return in twenty years. International markets rebounded strongly as well. Recession, trade and interest rate fears, which were rampant in the fourth quarter, seemed to fade away as investor sentiment improved markedly. Simply put, we believe there was emotional selling of stocks in the fourth quarter of last year, which was exacerbated by lack of liquidity in late December. As reason returned and investors correctly viewed stock valuations relative to inflation and earnings growth, the sell-off proved to be short-lived.
March marked the ten-year anniversary of the beginning of the current bull market. After years of economic growth and nice stock market gains, it is natural to be concerned about the next recession and the timing of when it may happen. Recessions normally occur when excesses build up in the economy, and the Fed is forced to raise interest rates to slow growth and control inflation. We are far from that situation today. While the cycle is long at ten years, the current expansion has been characterized by slower growth than prior cycles. Inflation appears under control, interest rates remain low, and very few capacity constraints are evident. With the strong market so far in calendar 2019, valuations have moved higher to just over 16.5 times

2
earnings. We believe the stock market remains reasonably valued with earnings projected to grow 5-7% this year and with interest rates still very low. In our opinion, with the economy still showing resiliency, stocks should continue to outperform other asset classes going forward.
FBP Equity & Dividend Plus Fund ReviewThe FBP Equity & Dividend Plus Fund returned 5.64% for the fiscal year ended March 31, 2019. The Russell 1000 Value Index and the S&P 500 Index (the “Index”) returned 5.67% and 9.50%, respectively, over the same period. The Fund was 91.7% equity and 8.3% cash at fiscal year-end.
Since our last report to you, the more defensive sectors of the Fund have provided better returns. Real Estate and Utilities, relatively small sectors by weight, performed especially well as interest rates fell and concerns over slower growth surfaced. Consumer Staples generally produced positive returns with Procter & Gamble leading the way. The stock should benefit from the company having improved pricing power and better earnings. Merck and Pfizer in Health Care also performed well. Broadcom, a newer addition to the Fund continued to act well, as did Cisco Systems. Weakness in AT&T and CenturyLink dragged down the Communication Services sector for the Fund, while Tapestry and Nordstrom held back returns in the Consumer Discretionary sector. Financials were negatively affected by the growth scare and the flattening of the yield curve, putting pressure on bank net interest margins. The Fund added to existing positions in DowDuPont, Broadcom and United Parcel Service. New stocks added were Carnival and Intel. Conoco Phillips, General Electric and Eli Lilly were eliminated from the Fund.
The Fund does utilize as part of its investment discipline the use of covered call options as individual securities approach the top of the Adviser’s growth and price expectations. The Fund’s purpose in selling the call option is to generate additional cash flow to the Fund and to hedge the possibility that the security may not achieve its price objective. In very strong stock markets, this discipline may limit the upside of the securities where options have been written, but in flat to negative markets, it may provide additional return. During the fiscal year ended March 31, 2019, the amount of premiums generated from selling covered call options was $481,633.
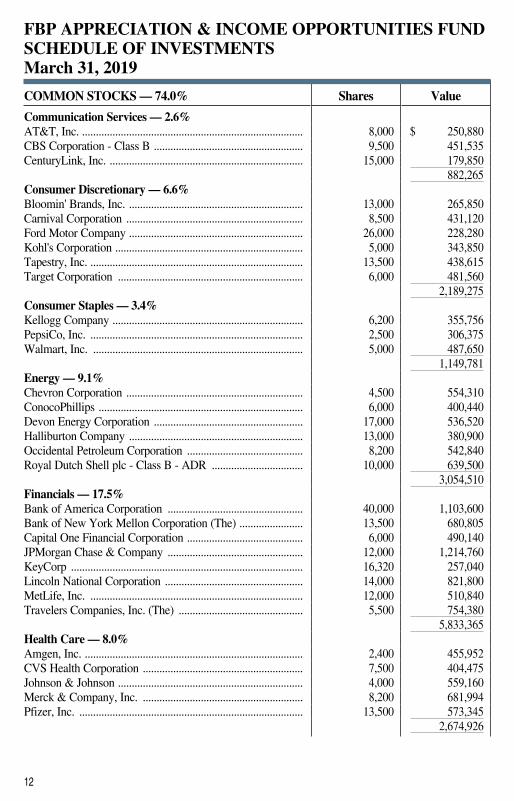
FBP Appreciation & Income Opportunities Fund ReviewThe FBP Appreciation & Income Opportunities Fund returned 3.44% for the fiscal year ended March 31, 2019. The Russell 1000 Value and the S&P 500 Index (the “Index”) returned 5.67% and 9.50% respectively, while the Bloomberg Barclays U.S. Government/Credit Index returned 4.48% over the same period. The Fund was 74.0% equity, 17.4% fixed income and 8.6% cash at fiscal year-end.
Just as with the Equity & Dividend Plus Fund, defensive sectors were the better performers for the Fund since our last report. Utilities, Real Estate, and the Consumer Staples sectors did well. Individually, Ventas, Broadcom, Cisco Systems, Travelers and Merck helped returns. The Fund’s returns were held back by weakness in CenturyLink and AT&T in the Communication Services sector, Schlumberger in the Energy sector and both Freeport-McMoRan and Compass Minerals in the Materials sector. The Industrials sector also had a tough period as investors became concerned about possible slowing economic growth. New positions in the Fund were Kellogg, Haliburton and Carnival. Halliburton was a replacement for Schlumberger, which was eliminated from the Fund. The Fund increased positions in CBS and Broadcom, while reducing positions in successful investments in Eli Lilly, ConocoPhillips, Apple, and Ventas, which was eliminated.
The Fund does utilize as part of its investment discipline the use of covered call options as individual securities approach the top of the Adviser’s growth and price expectations. The Fund’s purpose in selling the call option is to generate additional income to the Fund and to hedge the possibility that the security may not achieve its price objective. In very strong stock markets, this discipline may limit the upside of the

3
securities where options have been written, but in modest to negative markets, it may provide additional return. During the fiscal year ended March 31, 2019, the amount of premiums generated from selling covered call options was $83,192.
We want to thank you for your continued support and investment in the Flippin, Bruce & Porter Funds. Please visit our website at www.fbpfunds.com for information on your Funds and the investment philosophy and process we utilize to achieve their investment objectives.
John T. Bruce, CFA President - Portfolio Manager May 1, 2019
Data presented reflects past performance, which is no guarantee of future results. Investment results and principal value will fluctuate so that shares, when redeemed, may be worth more or less than their original cost. Due to market volatility, current performance may be higher or lower than the performance shown. Updated performance information, current through the most recent month-end, is available by contacting the Funds at 1-866-738-1127.
This report is submitted for the general information of the shareholders of the Funds. It reflects our views, opinions and portfolio holdings as of the date of this letter. These views are subject to change at any time based upon market or other conditions. For more current information throughout the year, please visit www.fbpfunds.com or call the Funds at 1-866-738-1127. This report is not authorized for distribution to prospective investors in the Funds unless accompanied by a current prospectus.

4
Performance for each Fund is compared to the most appropriate broad-based index, the Standard and Poor’s 500® Index, an unmanaged index of 500 large common stocks. Each Fund’s performance results are also compared to the Russell 1000 Value Index and the Consumer Price Index, a measure of inflation.
FBP Equity & Dividend Plus FundComparison of the Change in Value of a $10,000 Investment in FBP Equity & Dividend Plus Fund,
the Standard & Poor’s 500® Index, the Consumer Price Index and the Russell 1000 Value Index
Standard & Poor’s 500® IndexFBP Equity & Dividend Plus Fund Consumer Price Index
Past performance is not predictive of future performance.
$5000
$10000
$15000
$20000
$25000
$30000
$35000
$40000
$45000
$30,115
$43,810
$11,910
3/15 3/163/13 3/143/123/113/103/09 3/193/17 3/18
Russell 1000 Value Index
$38,803
THE FLIPPIN, BRUCE & PORTER FUNDS COMPARATIVE PERFORMANCE CHARTS (Unaudited)

5
FBP Appreciation & Income Opportunities Fund
Comparison of the Change in Value of a $10,000 Investment in FBP Appreciation & Income Opportunities Fund, the Standard & Poor’s 500® Index, the Consumer Price Index,
the Russell 1000 Value Index and the Bloomberg Barclays U.S. Government/Credit Index
FBP Appreciation & Income Opportunities Fund
Consumer Price Index
Standard & Poor’s 500® Index
Russell 1000 Value Index
Bloomberg Barclays U.S. Government/Credit Index
$5000
$10000
$15000
$20000
$25000
$30000
$35000
$40000
$45000
$25,272
$43,810Past performance is not predictive of future performance.
$11,910
3/16 3/173/14 3/153/133/123/113/103/09 3/193/18
$38,803
$14,694
Average Annual Total Returns(for periods ended March 31, 2019)
1 Year 5 Years 10 Years
FBP Equity & Dividend Plus Fund (a) 5.64% 6.37% 11.65%FBP Appreciation & Income
Opportunities Fund (a) 3.44% 4.75% 9.71%Standard & Poor’s 500® Index 9.50% 10.91% 15.92%Consumer Price Index 1.52% 1.49% 1.76%Russell 1000 Value Index 5.67% 7.72% 14.52%Bloomberg Barclays U.S.
Government/Credit Index 4.48% 2.79% 3.92%
(a) Total returns are a measure of the change in value of an investment in the Fund over the periods covered, which assumes any dividends or capital gains distributions are reinvested in shares of the Fund. Returns do not reflect the deduction of taxes a shareholder would pay on the Fund’s distributions or the redemption of Fund shares.
THE FLIPPIN, BRUCE & PORTER FUNDS COMPARATIVE PERFORMANCE CHARTS (Unaudited) (Continued)

6
Sector Diversification vs. the S&P 500® Index
S&P 500® IndexFBP Equity & Dividend Plus Fund
(%of
Net
Ass
ets)
0.0%
5.0%
10.0%
15.0%
20.0%
25.0%
Commun
icatio
n Serv
ices
Consu
mer Disc
retion
ary
Consu
mer Stap
les
Energ
y
Financ
ials
Health
Care
Indu
strial
s
Info
rmati
on T
echn
ology
Mate
rials
Real E
state
Utiliti
es
Cash E
quiva
lents
Ten Largest Equity Holdings % of Net AssetsProcter & Gamble Company (The) 3.3%International Business Machines Corporation 3.0%Merck & Company, Inc. 2.7%Cisco Systems, Inc. 2.6%United Parcel Service, Inc. - Class B 2.5%Pfizer, Inc. 2.5%BB&T Corporation 2.5%Broadcom, Inc. 2.4%U.S. Bancorp 2.4%Exxon Mobil Corporation 2.4%
FBP EQUITY & DIVIDEND PLUS FUND PORTFOLIO INFORMATION March 31, 2019 (Unaudited)
Asset Allocation (% of Net Assets)8.3%
91.7%
Common StocksCash Equivalents
General Information
Net Asset Value Per Share $ 25.19Total Net Assets (Millions) $ 28.6Current Expense Ratio 1.07%Portfolio Turnover 18%Fund Inception Date 7/30/1993
Stock Characteristics FundS&P 500®
IndexNumber of Stocks 53 500 Weighted Average Market
Capitalization (Billions) 141.0 230.3Price-to-Earnings Ratio
(Bloomberg 1 Year Forecast EPS) 12.7 16.5
Price-to-Book Value 2.3 3.4

7
Common Stock Portfolio (74.0% of Net Assets)
Number of Stocks 52Weighted Average Market
Capitalization (Billions) 165.5Price-to-Earnings Ratio
(Bloomberg 1 Year Forecast EPS) 12.1
Price-to-Book Value 2.1
Five Largest Sectors % of Net AssetsFinancials 17.5%Information Technology 14.8%Energy 9.1%Health Care 8.0%Industrials 6.8%
Fixed-Income Portfolio (17.4% of Net Assets)
Number of Fixed-Income Securities 11
Average Quality BBB+Average Weighted Maturity 2.37 yrs.Average Effective Duration 2.23 yrs.
Sector Breakdown % of Net AssetsU.S. Government &
Agency Obligations 1.5%Consumer Staples 1.5%Energy 1.5%Financials 6.1%Health Care 1.5%Industrials 3.8%Utilities 1.5%
Ten Largest Equity Holdings % of Net AssetsJPMorgan Chase & Company 3.6%Bank of America Corporation 3.3%Cisco Systems, Inc. 3.1%Microsoft Corporation 2.5%Lincoln National Corporation 2.5%Travelers Companies, Inc. (The) 2.3%Apple, Inc. 2.2%International Business Machines
Corporation 2.2%Merck & Company, Inc. 2.0%Bank of New York Mellon
Corporation (The) 2.0%
FBP APPRECIATION & INCOME OPPORTUNITIES FUND PORTFOLIO INFORMATION March 31, 2019 (Unaudited)
General Information
Net Asset Value Per Share $ 18.91Total Net Assets (Millions) $ 33.4Current Expense Ratio 1.00%Portfolio Turnover 21%Fund Inception Date 7/3/1989
Asset Allocation (% of Net Assets)
8.6%
74.0%
17.4%
Common Stocks Fixed Income
Cash Equivalents

8
FBP EQUITY & DIVIDEND PLUS FUND SCHEDULE OF INVESTMENTS March 31, 2019
COMMON STOCKS — 91.7% Shares Value
Communication Services — 3.2%AT&T, Inc. ................................................................................ 20,300 $ 636,608CenturyLink, Inc. (a) .................................................................. 24,000 287,760
924,368Consumer Discretionary — 10.1%Carnival Corporation ................................................................ 8,700 441,264Ford Motor Company ............................................................... 35,000 307,300Kohl's Corporation (a) ................................................................ 6,000 412,620Nordstrom, Inc. (a) ..................................................................... 8,900 394,982Tapestry, Inc. ............................................................................. 8,300 269,667Target Corporation (a) ................................................................ 8,000 642,080Williams-Sonoma, Inc. (a) ......................................................... 7,400 416,398
2,884,311Consumer Staples — 10.2%Coca-Cola Company (The) (a) .................................................. 6,000 281,160Hershey Company (The) (a) ...................................................... 4,100 470,803Kellogg Company ..................................................................... 7,500 430,350PepsiCo, Inc. (a) ......................................................................... 3,500 428,925Procter & Gamble Company (The) (a) ..................................... 9,000 936,450Walmart, Inc. ............................................................................ 3,700 360,861
2,908,549Energy — 10.0%Chevron Corporation (a) ............................................................ 4,800 591,264Exxon Mobil Corporation ........................................................ 8,400 678,720Occidental Petroleum Corporation .......................................... 7,200 476,640Royal Dutch Shell plc - Class B - ADR ................................. 9,500 607,525Schlumberger Ltd. .................................................................... 11,800 514,126
2,868,275Financials — 16.0%BB&T Corporation ................................................................... 15,500 721,215JPMorgan Chase & Company ................................................. 6,500 657,995KeyCorp .................................................................................... 30,200 475,650MetLife, Inc. ............................................................................. 10,200 434,214People's United Financial, Inc. ................................................. 25,000 411,000Prudential Financial, Inc. .......................................................... 6,000 551,280U.S. Bancorp ............................................................................. 14,200 684,298Wells Fargo & Company ......................................................... 13,000 628,160
4,563,812Health Care — 8.8%Amgen, Inc. ............................................................................... 1,400 265,972CVS Health Corporation (a) ...................................................... 7,300 393,689Johnson & Johnson (a) ............................................................... 2,600 363,454Merck & Company, Inc. (a) ...................................................... 9,400 781,798Pfizer, Inc. ................................................................................. 17,000 721,990
2,526,903

9
FBP EQUITY & DIVIDEND PLUS FUND SCHEDULE OF INVESTMENTS (Continued)
COMMON STOCKS — 91.7% (Continued) Shares Value
Industrials — 6.7%Eaton Corporation plc (a) ........................................................... 8,000 $ 644,480Emerson Electric Company (a) ................................................. 4,000 273,880United Parcel Service, Inc. - Class B ...................................... 6,500 726,310United Technologies Corporation ........................................... 2,200 283,558
1,928,228Information Technology — 15.5%Apple, Inc. (a) ............................................................................. 2,200 417,890Broadcom, Inc. .......................................................................... 2,300 691,633Cisco Systems, Inc. (a) ............................................................... 14,000 755,860HP, Inc. (a) .................................................................................. 27,500 534,325Intel Corporation (a) ................................................................... 6,200 332,940International Business Machines Corporation ........................ 6,100 860,710Microsoft Corporation (a) .......................................................... 2,700 318,438Western Union Company (The) .............................................. 28,000 517,160
4,428,956Materials — 4.5%Compass Minerals International, Inc. ...................................... 5,500 299,035DowDuPont, Inc. ...................................................................... 8,900 474,459Nucor Corporation (a) ................................................................ 9,000 525,150
1,298,644Real Estate — 2.5%Public Storage ........................................................................... 1,500 326,670Ventas, Inc. (a) ............................................................................ 6,000 382,860
709,530Utilities — 4.2%Dominion Energy, Inc. ............................................................. 4,000 306,640FirstEnergy Corporation (a) ....................................................... 15,000 624,150PPL Corporation ....................................................................... 8,500 269,790
1,200,580
Total Common Stocks (Cost $21,007,394) .......................... $ 26,242,156

10
FBP EQUITY & DIVIDEND PLUS FUND SCHEDULE OF INVESTMENTS (Continued)
MONEY MARKET FUNDS — 9.3% Shares Value
Fidelity Institutional Money Market Government Portfolio - Class I, 2.30% (b) (Cost $2,646,658) ................................... 2,646,658 $ 2,646,658
Total Investments at Value — 101.0% (Cost $23,654,052) ............................................................... $ 28,888,814
Liabilities in Excess of Other Assets — (1.0%) ................. (274,060)
Net Assets — 100.0% ............................................................. $ 28,614,754
ADR - American Depositary Receipt.(a) Security covers a written call option.(b) The rate shown is the 7-day effective yield as of March 31, 2019.See accompanying notes to financial statements.

11
FBP EQUITY & DIVIDEND PLUS FUND SCHEDULE OF OPEN OPTION CONTRACTS March 31, 2019
COVERED WRITTEN CALL OPTIONS Contracts
Notional Value
Strike Price
Expiration Date
Value of Options
Apple, Inc. ........................... 22 $ 417,890 $ 185.00 07/19/19 $ 27,940CenturyLink, Inc. ............... 124 148,676 14.00 07/19/19 2,976Chevron Corporation .......... 24 295,632 130.00 09/20/19 7,440Cisco Systems, Inc. ............ 55 296,945 50.00 06/21/19 25,850Coca-Cola Company (The) . 60 281,160 48.00 08/16/19 6,720CVS Health Corporation .... 28 151,004 90.00 05/17/19 28Eaton Corporation plc ........ 36 290,016 82.50 04/18/19 1,440Emerson Electric Company . 40 273,880 75.00 09/20/19 4,560FirstEnergy Corporation .... 80 332,880 41.00 04/18/19 7,200Hershey Company (The) ... 41 470,803 115.00 08/16/19 22,673HP, Inc. ............................... 275 534,325 20.00 08/16/19 26,125Intel Corporation ................ 62 332,940 55.00 06/21/19 11,160Johnson & Johnson ............ 11 153,769 160.00 06/21/19 132Kohl's Corporation ............. 60 412,620 80.00 07/19/19 9,000Merck & Company, Inc. .... 34 282,778 80.00 04/18/19 12,410Merck & Company, Inc. .... 27 224,559 85.00 07/19/19 5,400Microsoft Corporation ........ 27 318,438 120.00 10/18/19 18,441Nordstrom, Inc. ................... 50 221,900 70.00 04/18/19 150Nucor Corporation .............. 38 221,730 70.00 04/18/19 114PepsiCo, Inc. ....................... 13 159,315 125.00 04/18/19 1,040Procter & Gamble
Company (The) .............. 45 468,225 92.50 06/21/19 51,750Procter & Gamble
Company (The) .............. 45 468,225 100.00 07/19/19 25,200Target Corporation ............. 37 296,962 85.00 10/18/19 14,615Ventas, Inc. ......................... 60 382,860 65.00 05/17/19 7,500Williams-Sonoma, Inc. ...... 25 140,675 62.50 08/16/19 4,750Williams-Sonoma, Inc. ...... 49 275,723 65.00 08/16/19 6,076
Total Covered Written Call Options (Premiums received $244,092) .............. $ 7,853,930 $ 300,690
See accompanying notes to financial statements.
12
FBP APPRECIATION & INCOME OPPORTUNITIES FUND SCHEDULE OF INVESTMENTS March 31, 2019
COMMON STOCKS — 74.0% Shares Value
Communication Services — 2.6%AT&T, Inc. ................................................................................ 8,000 $ 250,880CBS Corporation - Class B ...................................................... 9,500 451,535CenturyLink, Inc. ...................................................................... 15,000 179,850
882,265Consumer Discretionary — 6.6%Bloomin' Brands, Inc. ............................................................... 13,000 265,850Carnival Corporation ................................................................ 8,500 431,120Ford Motor Company ............................................................... 26,000 228,280Kohl's Corporation .................................................................... 5,000 343,850Tapestry, Inc. ............................................................................. 13,500 438,615Target Corporation ................................................................... 6,000 481,560
2,189,275Consumer Staples — 3.4%Kellogg Company ..................................................................... 6,200 355,756PepsiCo, Inc. ............................................................................. 2,500 306,375Walmart, Inc. ............................................................................ 5,000 487,650
1,149,781Energy — 9.1%Chevron Corporation ................................................................ 4,500 554,310ConocoPhillips .......................................................................... 6,000 400,440Devon Energy Corporation ...................................................... 17,000 536,520Halliburton Company ............................................................... 13,000 380,900Occidental Petroleum Corporation .......................................... 8,200 542,840Royal Dutch Shell plc - Class B - ADR ................................. 10,000 639,500
3,054,510Financials — 17.5%Bank of America Corporation ................................................. 40,000 1,103,600Bank of New York Mellon Corporation (The) ....................... 13,500 680,805Capital One Financial Corporation .......................................... 6,000 490,140JPMorgan Chase & Company ................................................. 12,000 1,214,760KeyCorp .................................................................................... 16,320 257,040Lincoln National Corporation .................................................. 14,000 821,800MetLife, Inc. ............................................................................. 12,000 510,840Travelers Companies, Inc. (The) ............................................. 5,500 754,380
5,833,365Health Care — 8.0%Amgen, Inc. ............................................................................... 2,400 455,952CVS Health Corporation .......................................................... 7,500 404,475Johnson & Johnson ................................................................... 4,000 559,160Merck & Company, Inc. .......................................................... 8,200 681,994Pfizer, Inc. ................................................................................. 13,500 573,345
2,674,926

13
FBP APPRECIATION & INCOME OPPORTUNITIES FUND SCHEDULE OF INVESTMENTS (Continued)
COMMON STOCKS — 74.0% (Continued) Shares Value
Industrials — 6.8%Eaton Corporation plc .............................................................. 7,200 $ 580,032FedEx Corporation ................................................................... 2,500 453,525General Electric Company ....................................................... 17,000 169,830Ingersoll-Rand plc .................................................................... 4,700 507,365United Technologies Corporation ........................................... 4,200 541,338Westinghouse Air Brake Technologies Corporation .............. 134 9,879
2,261,969Information Technology — 14.8%Apple, Inc. ................................................................................. 3,900 740,805Broadcom, Inc. .......................................................................... 2,200 661,562Cisco Systems, Inc. ................................................................... 19,000 1,025,810HP, Inc. ...................................................................................... 20,000 388,600International Business Machines Corporation ........................ 5,200 733,720Microsoft Corporation .............................................................. 7,000 825,580Nokia Corporation - ADR ........................................................ 67,000 383,240Western Union Company (The) .............................................. 10,000 184,700
4,944,017Materials — 2.4%Compass Minerals International, Inc. ...................................... 3,000 163,110Freeport-McMoRan, Inc. ......................................................... 11,000 141,790Mosaic Company (The) ........................................................... 8,000 218,480Nucor Corporation .................................................................... 4,500 262,575
785,955Utilities — 2.8%Dominion Energy, Inc. ............................................................. 4,000 306,640FirstEnergy Corporation ........................................................... 8,000 332,880PPL Corporation ....................................................................... 9,000 285,660
925,180
Total Common Stocks (Cost $16,193,563) .......................... $ 24,701,243
U.S. GOVERNMENT AGENCY OBLIGATIONS — 1.5% Par Value Value
Federal National Mortgage Association — 1.5%1.20%, due 07/17/2020 (Cost $500,000) ............................ $ 500,000 $ 492,495

14
FBP APPRECIATION & INCOME OPPORTUNITIES FUND SCHEDULE OF INVESTMENTS (Continued)
CORPORATE BONDS — 15.9% Par Value Value
Consumer Staples — 1.5%Kroger Company (The), 2.60%, due 02/01/2021 ................... $ 500,000 $ 497,478
Energy — 1.5%Pioneer Natural Resources Company,
3.95%, due 07/15/2022 ........................................................ 500,000 514,417
Financials — 6.1%American Express Company, 3.40%, due 02/27/2023 .......... 500,000 507,619Citigroup, Inc., 2.90%, due 12/08/2021 .................................. 500,000 499,868Unum Group, 3.00%, due 05/15/2021 .................................... 500,000 499,837Wells Fargo & Company, 3.50%, due 03/08/2022 ................ 500,000 509,329
2,016,653Health Care — 1.5%Anthem, Inc., 2.25%, due 08/15/2019 .................................... 500,000 499,067
Industrials — 3.8%Norfolk Southern Corporation, 3.85%, due 01/15/2024 ........ 500,000 519,779Ryder System, Inc., 2.50%, due 05/11/2020 .......................... 750,000 747,756
1,267,535Utilities — 1.5%PSEG Power, LLC, 3.00%, due 06/15/2021 .......................... 500,000 497,665
Total Corporate Bonds (Cost $5,246,941) ........................... $ 5,292,815
MONEY MARKET FUNDS — 8.6% Shares Value
Fidelity Institutional Money Market Government Portfolio - Class I, 2.30% (a) (Cost $2,883,392) .................................... 2,883,392 $ 2,883,392
Total Investments at Value — 100.0% (Cost $24,823,896) ............................................................... $ 33,369,945
Other Assets in Excess of Liabilities — 0.0% (b) ................ 6,465
Net Assets — 100.0% ............................................................. $ 33,376,410
ADR- American Depositary Receipt.(a) The rate shown is the 7-day effective yield as of March 31, 2019.(b) Percentage rounds to less than 0.1%.See accompanying notes to financial statements.

15
THE FLIPPIN, BRUCE & PORTER FUNDS STATEMENTS OF ASSETS AND LIABILITIES March 31, 2019
FBP Equity & Dividend Plus Fund
FBP Appreciation
& Income Opportunities
Fund
ASSETSInvestments in securities:
At cost .................................................................................... $ 23,654,052 $ 24,823,896At value (Note 2) ................................................................... $ 28,888,814 $ 33,369,945
Cash ............................................................................................. — 2,491Receivable for capital shares sold ............................................. 2,698 —Dividends and interest receivable ............................................. 54,590 77,363Other assets ................................................................................. 3,640 5,162
TOTAL ASSETS .................................................................. 28,949,742 33,454,961
LIABILITIESWritten call options, at value (Notes 2 and 5)
(premiums received $244,092) ................................................. 300,690 —Distributions payable ................................................................. 1,599 12,780Payable for capital shares redeemed ......................................... 10,391 40,150Accrued investment advisory fees (Note 4) ............................. 13,723 17,151Payable to administrator (Note 4) ............................................. 5,700 5,700Other accrued expenses ............................................................. 2,885 2,770
TOTAL LIABILITIES ......................................................... 334,988 78,551
NET ASSETS ................................................................................ $ 28,614,754 $ 33,376,410
Net assets consist of:Paid-in capital ............................................................................. $ 23,273,511 $ 24,364,205Accumulated earnings ................................................................ 5,341,243 9,012,205
Net assets ........................................................................................ $ 28,614,754 $ 33,376,410
Shares of beneficial interest outstanding (unlimited number of shares authorized, $0.01 par value) ...... 1,135,799 1,765,027
Net asset value, offering price and redemption price per share (Note 2) ......................................... $ 25.19 $ 18.91
See accompanying notes to financial statements.

16
THE FLIPPIN, BRUCE & PORTER FUNDS STATEMENTS OF OPERATIONS For the Year Ended March 31, 2019
FBP Equity & Dividend Plus Fund
FBP Appreciation
& Income Opportunities
Fund
INVESTMENT INCOMEDividends .................................................................................... $ 961,566 $ 842,669Foreign withholding taxes on dividends ................................... — (2,579)Interest ......................................................................................... — 162,928
TOTAL INVESTMENT INCOME ..................................... 961,566 1,003,018
EXPENSESInvestment advisory fees (Note 4) ............................................ 196,694 241,757Administration fees (Note 4) ..................................................... 60,000 60,000Professional fees ......................................................................... 24,161 24,161Trustees' fees and expenses (Note 4) ........................................ 13,652 13,652Registration and filing fees ........................................................ 9,755 8,117Compliance service fees (Note 4) ............................................. 8,400 8,400Custodian and bank service fees ............................................... 8,596 6,891Postage and supplies .................................................................. 7,020 5,427Printing of shareholder reports .................................................. 6,561 4,159Account maintenance fees ......................................................... 1,416 3,134Insurance expense ...................................................................... 1,194 1,036Other expenses ........................................................................... 7,367 8,850
TOTAL EXPENSES ............................................................. 344,816 385,584Fees voluntarily waived by the Adviser (Note 4) .................... (44,155) (40,217)
NET EXPENSES .................................................................. 300,661 345,367
NET INVESTMENT INCOME ................................................ 660,905 657,651
REALIZED AND UNREALIZED GAINS (LOSSES) ON INVESTMENTS AND WRITTEN OPTION CONTRACTS
Net realized gains (losses) from:Investment transactions .............................................................. 746,525 1,239,712Written option contracts (Note 5) ............................................. 125,606 (52,718)
Net change in unrealized appreciation (depreciation) on:Investment transactions .............................................................. (104,656) (756,448)Written option contracts (Note 5) ............................................. (15,297) 80,889
NET REALIZED AND UNREALIZED GAINS ON INVESTMENTS AND WRITTEN OPTION CONTRACTS .......................................................................... 752,178 511,435
NET INCREASE IN NET ASSETS FROM OPERATIONS .............................................................. $ 1,413,083 $ 1,169,086
See accompanying notes to financial statements.

17
FBP EQUITY & DIVIDEND PLUS FUND STATEMENTS OF CHANGES IN NET ASSETS
Year Ended March 31,
2019
Year Ended March 31,
2018 (a)
FROM OPERATIONSNet investment income .............................................................. $ 660,905 $ 586,459Net realized gains from:
Investment transactions ......................................................... 746,525 1,141,946Written option contracts (Note 5) ......................................... 125,606 122,178
Net realized gains from in-kind redemptions ........................... — 498,179Net change in unrealized appreciation (depreciation) on:
Investments ............................................................................ (104,656) (230,632)Written option contracts (Note 5) ......................................... (15,297) (77,199)
Net increase in net assets resulting from operations .................... 1,413,083 2,040,931
DISTRIBUTIONS TO SHAREHOLDERS (Note 2) ............. (2,062,656) (2,286,616)
FROM CAPITAL SHARE TRANSACTIONSProceeds from shares sold ......................................................... 3,064,232 415,812Net asset value of shares issued in reinvestment of
distributions to shareholders ................................................. 2,041,105 2,251,859Payments for shares redeemed .................................................. (2,119,514) (3,558,200)
Net increase (decrease) in net assets from capital share transactions ........................................................... 2,985,823 (890,529)
TOTAL INCREASE (DECREASE) IN NET ASSETS ......... 2,336,250 (1,136,214)
NET ASSETSBeginning of year ....................................................................... 26,278,504 27,414,718End of year ................................................................................. $ 28,614,754 $ 26,278,504
CAPITAL SHARE ACTIVITYShares sold .................................................................................. 116,050 16,167Shares reinvested ........................................................................ 79,830 89,387Shares redeemed ........................................................................ (83,445) (138,180)Net increase (decrease) in shares outstanding .......................... 112,435 (32,626)Shares outstanding, beginning of year ...................................... 1,023,364 1,055,990Shares outstanding, end of year ................................................ 1,135,799 1,023,364
(a) The presentation of Distributions to Shareholders has been updated to reflect the changes prescribed in amendments to Regulation S-X, effective November 5, 2018 (Note 2). For the year ended March 31, 2018, distributions to shareholders consisted of $586,581 and $1,700,035 from net investment income and from net realized gains from investment transactions, respectively. Undistributed net investment income as of March 31, 2018 was $2,581.
See accompanying notes to financial statements.

18
FBP APPRECIATION & INCOME OPPORTUNITIES FUND STATEMENTS OF CHANGES IN NET ASSETS
Year Ended March 31,
2019
Year Ended March 31,
2018 (a)
FROM OPERATIONSNet investment income .............................................................. $ 657,651 $ 739,449Net realized gains (losses) from:
Investment transactions ......................................................... 1,239,712 791,841Written option contracts (Note 5) ......................................... (52,718) 39,716
Net change in unrealized appreciation (depreciation) on:Investments ............................................................................ (756,448) 1,095,760Written option contracts (Note 5) ......................................... 80,889 (83,560)
Net increase in net assets resulting from operations .................... 1,169,086 2,583,206
DISTRIBUTIONS TO SHAREHOLDERS (Note 2) ............. (1,299,655) (2,251,693)
FROM CAPITAL SHARE TRANSACTIONSProceeds from shares sold ......................................................... 859,694 470,661Net asset value of shares issued in reinvestment of
distributions to shareholders ................................................. 1,237,225 2,180,127Payments for shares redeemed .................................................. (3,204,096) (2,436,914)
Net increase (decrease) in net assets from capital share transactions ........................................................... (1,107,177) 213,874
TOTAL INCREASE (DECREASE) IN NET ASSETS ......... (1,237,746) 545,387
NET ASSETSBeginning of year ....................................................................... 34,614,156 34,068,769End of year ................................................................................. $ 33,376,410 $ 34,614,156
CAPITAL SHARE ACTIVITYShares sold .................................................................................. 44,797 24,569Shares reinvested ........................................................................ 64,997 115,761Shares redeemed ........................................................................ (167,520) (128,348)Net increase (decrease) in shares outstanding .......................... (57,726) 11,982Shares outstanding, beginning of year ...................................... 1,822,753 1,810,771Shares outstanding, end of year ................................................ 1,765,027 1,822,753
(a) The presentation of Distributions to Shareholders has been updated to reflect the changes prescribed in amendments to Regulation S-X, effective November 5, 2018 (Note 2). For the year ended March 31, 2018, distributions to shareholders consisted of $740,853 and $1,510,840 from net investment income and from net realized gains from investment transactions, respectively. Distributions in excess of net investment income as of March 31, 2018 was ($1,981).
See accompanying notes to financial statements.

19
FBP EQUITY & DIVIDEND PLUS FUND FINANCIAL HIGHLIGHTS
Selected Per Share Data and Ratios for a Share Outstanding Throughout Each Year
Years Ended March 31,
2019 2018 2017 2016 2015
Net asset value at beginning of year ........................ $ 25.68 $ 25.96 $ 22.65 $ 24.89 $ 24.78
Income (loss) from investment operations:Net investment income ........................................ 0.60 0.57 0.50 0.61 0.50Net realized and unrealized gains
(losses) on investments .................................... 0.83 1.38 3.37 (1.21) 0.57Total from investment operations ............................ 1.43 1.95 3.87 (0.60) 1.07
Less distributions:Dividends from net investment income .............. (0.60) (0.57) (0.50) (0.61) (0.51)Distributions from net realized gains .................. (1.32) (1.66) (0.06) (1.03) (0.45)
Total distributions .................................................... (1.92) (2.23) (0.56) (1.64) (0.96)
Net asset value at end of year .................................. $ 25.19 $ 25.68 $ 25.96 $ 22.65 $ 24.89
Total return (a) ........................................................... 5.64% 7.91% 17.29% (2.31%) 4.23%
Net assets at end of year (000’s) .............................. $ 28,615 $ 26,279 $ 27,415 $ 24,764 $ 28,782
Ratio of total expenses to average net assets .......... 1.23% 1.24% 1.25% 1.19% 1.17%
Ratio of net expenses to average net assets (b) ........ 1.07% 1.07% 1.07% 1.07% 1.07%
Ratio of net investment income to average net assets (b) ............................................. 2.35% 2.19% 2.07% 2.60% 1.98%
Portfolio turnover rate .............................................. 18% 18% 19% 21% 19%
(a) Total return is a measure of the change in value of an investment in the Fund over the periods covered, which assumes any dividends or capital gains distributions are reinvested in shares of the Fund. The returns shown do not reflect the deduction of taxes a shareholder would pay on Fund distributions or the redemption of Fund shares. The total returns would have been lower if the Adviser had not waived advisory fees.
(b) Ratios were determined after voluntary advisory fee waivers by the Adviser (Note 4).
See accompanying notes to financial statements.

20
FBP APPRECIATION & INCOME OPPORTUNITIES FUND FINANCIAL HIGHLIGHTS
Selected Per Share Data and Ratios for a Share Outstanding Throughout Each Year
Years Ended March 31,
2019 2018 2017 2016 2015
Net asset value at beginning of year ........................ $ 18.99 $ 18.81 $ 16.55 $ 18.53 $ 18.97
Income (loss) from investment operations:Net investment income ........................................ 0.37 0.41 0.28 0.31 0.26Net realized and unrealized gains
(losses) on investments .................................... 0.28 1.03 2.28 (1.11) 0.19Total from investment operations ............................ 0.65 1.44 2.56 (0.80) 0.45
Less distributions:Dividends from net investment income .............. (0.37) (0.41) (0.28) (0.32) (0.26)Distributions from net realized gains .................. (0.36) (0.85) (0.02) (0.86) (0.63)
Total distributions .................................................... (0.73) (1.26) (0.30) (1.18) (0.89)
Net asset value at end of year .................................. $ 18.91 $ 18.99 $ 18.81 $ 16.55 $ 18.53
Total return (a) ........................................................... 3.44% 7.91% 15.58% (4.48%) 2.36%
Net assets at end of year (000’s) .............................. $ 33,376 $ 34,614 $ 34,069 $ 31,669 $ 38,991
Ratio of total expenses to average net assets .......... 1.12% 1.10% 1.12% 1.05% 1.04%
Ratio of net expenses to average net assets (b) ........ 1.00% 1.00% 1.00% 1.00% 1.00%
Ratio of net investment income to average net assets (b) ............................................. 1.89% 2.16% 1.57% 1.75% 1.36%
Portfolio turnover rate .............................................. 21% 10% 18% 23% 12%
(a) Total return is a measure of the change in value of an investment in the Fund over the periods covered, which assumes any dividends or capital gains distributions are reinvested in shares of the Fund. The returns shown do not reflect the deduction of taxes a shareholder would pay on Fund distributions or the redemption of Fund shares. The total returns would have been lower if the Adviser had not waived advisory fees.
(b) Ratios were determined after voluntary advisory fee waivers by the Adviser (Note 4).
See accompanying notes to financial statements.

21
1. OrganizationFBP Equity & Dividend Plus Fund and FBP Appreciation & Income Opportunities Fund (each a “Fund” and collectively the “Funds”) are no-load, diversified series of Williamsburg Investment Trust (the “Trust”), an open-end management investment company registered under the Investment Company Act of 1940, as amended (the “1940 Act”). The Trust was organized as a Massachusetts business trust on July 18, 1988. Other series of the Trust are not included in this report.
FBP Equity & Dividend Plus Fund seeks to provide above-average and growing income while also achieving long-term growth of capital.
FBP Appreciation & Income Opportunities Fund seeks long term capital appreciation and current income, assuming a moderate level of investment risk.
2. Significant Accounting PoliciesIn August 2018, the U.S. Securities and Exchange Commission (the “SEC”) adopted regulations that eliminated or amended disclosure requirements that were redundant or outdated in light of changes in the SEC requirements, accounting principles generally accepted in the United States of America (“GAAP”), International Financial Reporting Standards or changes in technology or the business environment. These regulations were effective November 5, 2018, and the Funds are complying with them effective with these financial statements.
Each Fund follows accounting and reporting guidance under Financial Accounting Standards Board (“FASB”) Accounting Standards Codification (“ASC”) Topic 946, “Financial Services – Investment Companies.” The following is a summary of the Funds’ significant accounting policies. These policies are in conformity with GAAP.
New accounting pronouncements — In March 2017, FASB issued Accounting Standards Update No. 2017-08 (“ASU 2017-08”), “Receivables – Nonrefundable Fees and Other Costs (Subtopic 310-20): Premium Amortization on Purchased Callable Debt Securities.” ASU 2017-08 shortens the amortization period for certain callable debt securities, held at a premium, to be amortized to the earliest call date. ASU 2017-08 does not require an accounting change for securities held at a discount, which continues to accrete to maturity. ASU 2017-08 is effective for fiscal years and interim periods within those fiscal years beginning after December 15, 2018. Management is currently evaluating the impact, if any, of applying ASU 2017-08
In August 2018, FASB issued Accounting Standards Update No. 2018-13 (“ASU 2018-13”), “Disclosure Framework – Changes to the Disclosure Requirements for Fair Value Measurement,” which amends the fair value measurement disclosure requirements of ASC Topic 820 (“ASC 820”), “Fair Value Measurement.” ASU 2018-13 includes new, eliminated, and modified disclosure requirements for ASC 820. In addition, ASU 2018-13 clarifies that materiality is an appropriate consideration when evaluating disclosure requirements. ASU 2018-13 is effective for fiscal years beginning after December 15, 2019, including interim periods therein. Early adoption is permitted, and the Funds have adopted ASU 2018-13 with these financial statements.
THE FLIPPIN, BRUCE & PORTER FUNDS NOTES TO FINANCIAL STATEMENTS March 31, 2019

22
THE FLIPPIN, BRUCE & PORTER FUNDS NOTES TO FINANCIAL STATEMENTS (Continued)
Securities valuation — The Funds’ portfolio securities are valued as of the close of business of the regular session of the New York Stock Exchange (normally 4:00 p.m. Eastern time). Securities traded on a national stock exchange, including common stocks and closed-end investment companies, if any, are valued based upon the closing price on the principal exchange where the security is traded, if available, otherwise, at the last quoted bid price. Securities that are quoted by NASDAQ are valued at the NASDAQ Official Closing Price. Covered call options written by the Funds are valued at the last quoted sale price or, in the absence of a sale, at the ask price on the principal exchanges on which they are traded. Investments representing shares of money market funds and other open-end investment companies are valued at their net asset value (“NAV”) as reported by such companies. When using a quoted price and when the market is considered active, securities will be classified as Level 1 within the fair value hierarchy (see below).
Fixed income securities, including U.S. government agency obligations and corporate bonds, are typically valued on the basis of prices provided by an independent pricing service. The prices provided by the pricing service are determined with consideration given to institutional bid and last sale prices and take into account securities prices, yields, maturities, call features, ratings, institutional trading in similar groups of securities, and developments related to specific securities. Given the inputs used by the pricing service, these securities are classified as Level 2 within the fair value hierarchy.
When market quotations are not readily available, if a pricing service cannot provide a price, or if the investment adviser believes the price received from the pricing service is not indicative of market value, securities will be valued in good faith at fair value using methods consistent with procedures adopted by the Board of Trustees and will be classified as Level 2 or 3 within the fair value hierarchy, depending on the inputs used. Such methods of fair valuation may include, but are not limited to: multiple of earnings, multiple of book value, discount from market of a similar freely traded security, purchase price of the security, subsequent private transactions in the security or related securities, or a combination of these and other factors.
GAAP establishes a single authoritative definition of fair value, sets out a framework for measuring fair value and requires additional disclosures about fair value measurements. Various inputs are used in determining the value of each Fund’s investments. These inputs are summarized in the three broad levels listed below:
• Level 1 – quoted prices in active markets for identical securities
• Level 2 – other significant observable inputs
• Level 3 – significant unobservable inputs
The inputs or methodology used for valuing securities are not necessarily an indication of the risks associated with investing in those securities. The inputs used to measure fair value may fall into different levels of the fair value hierarchy. In such cases, for disclosure purposes, the level in the fair value hierarchy within which the fair value measurement falls in its entirety is determined based on the lowest level input that is significant to the fair value measurement.
23
THE FLIPPIN, BRUCE & PORTER FUNDS NOTES TO FINANCIAL STATEMENTS (Continued)
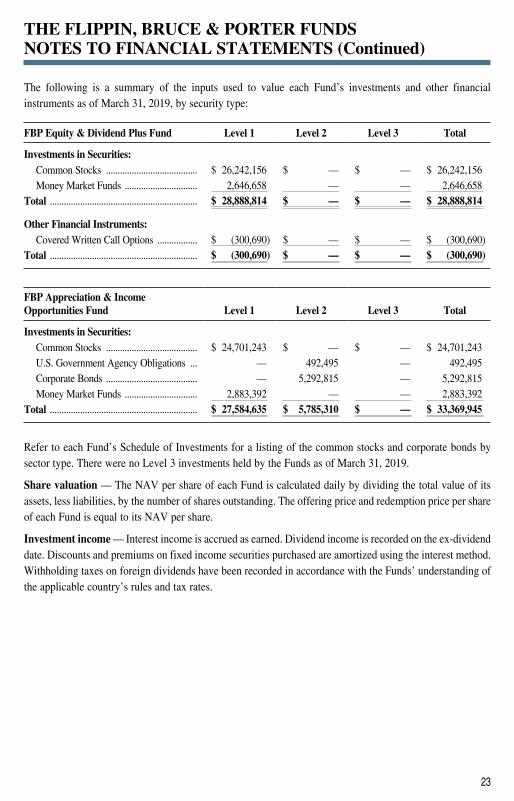
The following is a summary of the inputs used to value each Fund’s investments and other financial instruments as of March 31, 2019, by security type:
FBP Equity & Dividend Plus Fund Level 1 Level 2 Level 3 Total
Investments in Securities:Common Stocks ....................................... $ 26,242,156 $ — $ — $ 26,242,156Money Market Funds ............................... 2,646,658 — — 2,646,658
Total ............................................................... $ 28,888,814 $ — $ — $ 28,888,814
Other Financial Instruments:Covered Written Call Options ................. $ (300,690) $ — $ — $ (300,690)
Total ............................................................... $ (300,690) $ — $ — $ (300,690)
FBP Appreciation & Income Opportunities Fund Level 1 Level 2 Level 3 Total
Investments in Securities:Common Stocks ....................................... $ 24,701,243 $ — $ — $ 24,701,243U.S. Government Agency Obligations ... — 492,495 — 492,495Corporate Bonds ....................................... — 5,292,815 — 5,292,815Money Market Funds ............................... 2,883,392 — — 2,883,392
Total ............................................................... $ 27,584,635 $ 5,785,310 $ — $ 33,369,945
Refer to each Fund’s Schedule of Investments for a listing of the common stocks and corporate bonds by sector type. There were no Level 3 investments held by the Funds as of March 31, 2019.
Share valuation — The NAV per share of each Fund is calculated daily by dividing the total value of its assets, less liabilities, by the number of shares outstanding. The offering price and redemption price per share of each Fund is equal to its NAV per share.
Investment income — Interest income is accrued as earned. Dividend income is recorded on the ex-dividend date. Discounts and premiums on fixed income securities purchased are amortized using the interest method. Withholding taxes on foreign dividends have been recorded in accordance with the Funds’ understanding of the applicable country’s rules and tax rates.

24
THE FLIPPIN, BRUCE & PORTER FUNDS NOTES TO FINANCIAL STATEMENTS (Continued)
Distributions to shareholders — Dividends arising from net investment income are declared and paid quarterly to shareholders of each Fund. Net realized short-term capital gains, if any, may be distributed throughout the year and net realized long-term capital gains, if any, are distributed at least once each year. The amount of distributions from net investment income and net realized capital gains are determined in accordance with federal income tax regulations, which may differ from GAAP. These “book/tax” differences are either temporary or permanent in nature. Dividends and distributions are recorded on the ex-dividend date. The tax character of distributions paid during the years ended March 31, 2019 and 2018 was as follows:
Year
EndedOrdinary Income
Long-Term Capital Gains
Total Distributions
FBP Equity & Dividend Plus Fund 03/31/19 $ 676,801 $ 1,385,855 $ 2,062,65603/31/18 $ 636,626 $ 1,649,990 $ 2,286,616
FBP Appreciation & Income 03/31/19 $ 650,647 $ 649,008 $ 1,299,655Opportunities Fund 03/31/18 $ 816,087 $ 1,435,606 $ 2,251,693
Investment transactions — Investment transactions are accounted for on trade date for financial reporting purposes. Realized gains and losses on investments sold are determined on a specific identification basis.
Common expenses — Common expenses of the Trust are allocated among the Funds and the other series of the Trust based on relative net assets of each series or the nature of the services performed and the relative applicability to each series.
Options transactions — When the Funds’ investment adviser believes that individual portfolio investment securities held by the Funds are approaching the top of the adviser’s growth and price expectations, covered call options can be written (sold) against such securities and the Funds will receive a premium in return. The Funds write options only for income generation and hedging purposes and not for speculation. The premiums received from writing the options are recorded as a liability and are subsequently valued daily at the closing prices on their primary exchanges. Premiums received from writing options that expire are treated as realized gains. Premiums received from writing options that are exercised increase the proceeds used to calculate the realized gain or loss on the sale of the underlying security. If a closing purchase transaction is used to terminate a Fund’s obligation on a call option, a gain or loss will be realized, depending upon whether the price of the closing purchase transaction is more or less than the premium previously received on the call option written.
Estimates — The preparation of financial statements in conformity with GAAP requires management to make estimates and assumptions that affect the reported amounts of assets and liabilities and the disclosure of contingent assets and liabilities as of the date of the financial statements and the reported amounts of income and expenses during the reporting period. Actual results could differ from those estimates.

25
THE FLIPPIN, BRUCE & PORTER FUNDS NOTES TO FINANCIAL STATEMENTS (Continued)
Federal income tax — Each Fund has qualified and intends to continue to qualify as a regulated investment company under the Internal Revenue Code of 1986, as amended (the “Code”). Qualification generally will relieve the Funds of liability for federal income taxes to the extent 100% of their net investment income and any net realized capital gains are distributed in accordance with the Code.
In order to avoid imposition of the excise tax applicable to regulated investment companies, it is also each Fund’s intention to declare as dividends in each calendar year at least 98% of its net investment income (earned during the calendar year) and 98.2% of its net realized capital gains (earned during the twelve months ended October 31) plus undistributed amounts from prior years.
The following information is computed on a tax basis for each item as of March 31, 2019:
FBP Equity & Dividend Plus Fund
FBP Appreciation & Income
Opportunities Fund
Tax cost of portfolio investments and written option contracts ................ $ 23,409,960 $ 24,824,272Gross unrealized appreciation ..................................................................... $ 6,347,053 $ 9,178,922Gross unrealized depreciation ..................................................................... (1,168,889) (633,249)Net unrealized appreciation ......................................................................... 5,178,164 8,545,673Undistributed ordinary income ................................................................... 79,684 18,179Undistributed long-term capital gains ........................................................ 84,994 476,304Accumulated other losses ............................................................................ — (15,171)Distributions payable ................................................................................... (1,599) (12,780)Accumulated distributable earnings ........................................................... $ 5,341,243 $ 9,012,205
The difference between the federal income tax cost of portfolio investments and the financial statement cost of portfolio investments for FBP Appreciation & Income Opportunities Fund is due to certain differences in the recognition of capital gains and losses under income tax regulations and GAAP. These “book/tax” differences are temporary in nature and are primarily due to differing methods in the amortization of discounts and premiums on fixed income securities.
Qualified late year capital losses incurred after October 31, 2018 and within the current taxable year are deemed to arise on the first day of a Fund’s next taxable year. For the year ended March 31, 2019, FBP Appreciation & Income Opportunities Fund deferred $15,171 of post-October capital losses to April 1, 2019 for federal income tax purposes.
The Funds recognize the tax benefits or expenses of uncertain tax positions only when the position is “more likely than not” to be sustained assuming examination by tax authorities. Management has reviewed the tax positions taken by each Fund on federal income tax returns for all open tax years (generally, three years) and has concluded that no provision for unrecognized tax benefits or expenses is required in these financial statements.

26
THE FLIPPIN, BRUCE & PORTER FUNDS NOTES TO FINANCIAL STATEMENTS (Continued)
3. Investment TransactionsInvestment transactions, other than short-term investments and U.S. government securities, were as follows for the year ended March 31, 2019:
FBP Equity & Dividend Plus Fund
FBP Appreciation & Income
Opportunities Fund
Purchases of investment securities ............................................................. $ 5,285,624 $ 6,446,914Proceeds from sales and maturities of investment securities .................... $ 4,749,235 $ 7,818,497
4. Transactions with Related Parties
INVESTMENT ADVISORY AGREEMENTSEach Fund’s investments are managed by Flippin, Bruce & Porter, Inc. (the “Adviser”) under the terms of an Investment Advisory Agreement. Under the Investment Advisory Agreements, each Fund pays the Adviser a fee, which is computed and accrued daily and paid monthly, at an annual rate of 0.70% of its average daily net assets up to $250 million; 0.65% of the next $250 million of such assets; and 0.50% of such assets in excess of $500 million.
During the year ended March 31, 2019, the Adviser voluntarily limited the total annual operating expenses of FBP Equity & Dividend Plus Fund and FBP Appreciation & Income Opportunities Fund to 1.07% and 1.00%, respectively, of average net assets; accordingly, the Adviser voluntarily waived $44,155 and $40,217 of its investment advisory fees from FBP Equity & Dividend Plus Fund and FBP Appreciation & Income Opportunities Fund, respectively. These amounts are not subject to recapture in future periods.
Certain officers and a Trustee of the Trust are also officers of the Adviser.
OTHER SERVICE PROVIDERSUltimus Fund Solutions, LLC (“Ultimus”) provides administration, fund accounting, compliance and transfer agent services to the Funds. The Funds pay Ultimus fees in accordance with the agreements for such services. In addition, the Funds pay out-of-pocket expenses including, but not limited to, postage, supplies, and costs of pricing the Funds’ portfolio securities. Certain officers of the Trust are also officers of Ultimus, or of Ultimus Fund Distributors, LLC (the “Distributor”), the principal underwriter of each Fund’s shares and an affiliate of Ultimus. The Distributor is compensated by the Adviser (not the Funds) for acting as principal underwriter.
COMPENSATION OF TRUSTEESTrustees and officers affiliated with the Adviser or Ultimus are not compensated by the Trust for their services. Each Trustee who is not an affiliated person of the Adviser or Ultimus receives from the Trust an annual retainer of $20,000, payable quarterly; a fee of $2,000 for attendance at each meeting of the Board of Trustees (except that such fee is $3,000 for the independent chair); and a fee of $1,000 for attendance at each meeting of any committee of the Board (except that such fee is $1,500 for the committee chair); plus reimbursement of travel and other expenses incurred in attending meetings. Each Fund pays its proportionate share of such fees along with the other series of the Trust.

27
THE FLIPPIN, BRUCE & PORTER FUNDS NOTES TO FINANCIAL STATEMENTS (Continued)
5. Derivatives TransactionsFBP Appreciation & Income Opportunities Fund had no open derivative positions as of March 31, 2019.
The location in the Statements of Assets and Liabilities of FBP Equity & Dividend Plus Fund’s derivative positions as of March 31, 2019 is as follows:
FBP Equity & Dividend Plus Fund
Fair Value
Gross Notional Amount
Outstanding
Type of Derivative (Risk) LocationAsset
DerivativesLiability
DerivativesMarch 31,
2019
Call options written (Equity) Written call options, at value $ — $ (300,690) $ (7,853,930)
The Funds’ transactions in derivative instruments during the year ended March 31, 2019 are recorded in the following locations in the Statements of Operations:
FBP Equity & Dividend Plus Fund
Type of Derivative (Risk) Location
Net Realized
Gains Location
Change in Unrealized
Appreciation (Depreciation)
Call options written (Equity) Net realized gains (losses) from written option contracts
$ 125,606 Net change in unrealized appreciation (depreciation) on written option contracts
$ (15,297)
FBP Appreciation & Income Opportunities Fund
Type of Derivative (Risk) Location
Net Realized Losses Location
Change in Unrealized
Appreciation (Depreciation)
Call options written (Equity) Net realized gains (losses) from written option contracts
$ (52,718) Net change in unrealized appreciation (depreciation) on written option contracts
$ 80,889
The average monthly notional amount of written call options during the year ended March 31, 2019 is $6,097,918 and $1,199,436 for FBP Equity & Dividend Plus Fund and FBP Appreciation & Income Opportunities Fund, respectively.

28
6. Contingencies and Commitments The Funds indemnify the Trust’s officers and Trustees for certain liabilities that might arise from the performance of their duties to the Funds. Additionally, in the normal course of business the Funds enter into contracts that contain a variety of representations and warranties and which provide general indemnifications. The Funds’ maximum exposure under these arrangements is unknown, as this would involve future claims that may be made against the Funds that have not yet occurred. However, based on experience, the Trust expects the risk of loss to be remote.
7. Subsequent EventsThe Funds are required to recognize in the financial statements the effects of all subsequent events that provide additional evidence about conditions that existed as of the date of the Statements of Assets and Liabilities. For non-recognized subsequent events that must be disclosed to keep the financial statements from being misleading, the Funds are required to disclose the nature of the event as well as an estimate of its financial effect, or a statement that such an estimate cannot be made. Management has evaluated subsequent events through the issuance of these financial statements and has noted no such events.
THE FLIPPIN, BRUCE & PORTER FUNDS NOTES TO FINANCIAL STATEMENTS (Continued)

29
THE FLIPPIN, BRUCE & PORTER FUNDS REPORT OF INDEPENDENT REGISTERED PUBLIC ACCOUNTING FIRM
To the Shareholders of The Flippin, Bruce & Porter Funds and Board of Trustees of Williamsburg Investment Trust
Opinion on the Financial StatementsWe have audited the accompanying statements of assets and liabilities, including the schedules of investments and open option contracts, of The Flippin, Bruce & Porter Funds, comprising FBP Equity & Dividend Plus Fund and FBP Appreciation & Income Opportunities Fund, (the “Funds”), each a series of Williamsburg Investment Trust, as of March 31, 2019, and the related statements of operations for the year then ended, the statements of changes in net assets for each of the two years in the period then ended, including the related notes, and the financial highlights for each of the four years in the period then ended (collectively referred to as the “financial statements”). In our opinion, the financial statements present fairly, in all material respects, the financial position of each of the Funds as of March 31, 2019, the results of their operations for the year then ended, the changes in their net assets for each of the two years in the period then ended, and the financial highlights for each of the four years in the period then ended, in conformity with accounting principles generally accepted in the United States of America.
The Funds’ financial highlights for the period ended March 31, 2015, were audited by other auditors whose report dated May 22, 2015, expressed an unqualified opinion on those financial highlights.
Basis for OpinionThese financial statements are the responsibility of the Funds’ management. Our responsibility is to express an opinion on the Funds’ financial statements based on our audits. We are a public accounting firm registered with the Public Company Accounting Oversight Board (United States) (“PCAOB”) and are required to be independent with respect to the Funds in accordance with the U.S. federal securities laws and the applicable rules and regulations of the Securities and Exchange Commission and the PCAOB.
We conducted our audits in accordance with the standards of the PCAOB. Those standards require that we plan and perform the audit to obtain reasonable assurance about whether the financial statements are free of material misstatement, whether due to error or fraud.
Our audits include performing procedures to assess the risks of material misstatement of the financial statements, whether due to error or fraud, and performing procedures that respond to those risks. Such procedures include examining, on a test basis, evidence regarding the amounts and disclosures in the financial statements. Our procedures included confirmation of securities owned as of March 31, 2019, by correspondence with the custodian and brokers. Our audits also included evaluating the accounting principles used and significant estimates made by management, as well as evaluating the overall presentation of the financial statements. We believe that our audits provide a reasonable basis for our opinion.
We have served as the Funds’ auditor since 2016.
COHEN & COMPANY, LTD. Cleveland, Ohio May 22, 2019

30
THE FLIPPIN, BRUCE & PORTER FUNDS BOARD OF TRUSTEES AND EXECUTIVE OFFICERS (Unaudited)
Overall responsibility for management of the Funds rests with the Board of Trustees. The Trustees serve during the lifetime of the Trust and until its termination, or until death, resignation, retirement or removal. The Trustees, in turn, elect the officers of the Funds. The officers have been elected for an annual term. The following are the Trustees and executive officers of the Funds:
Trustees and Officers Address
Year of
BirthPosition Held with the Trust
Length of Time Served
Robert S. Harris, Ph.D. 225 Pictoria Drive, Suite 450 Cincinnati, OH
1949 Chairman and Trustee
Since January 2007
* John P. Ackerly, IV One James Center 901 E. Cary Street Richmond, VA
1963 Trustee and President of Davenport Funds
Since July 2012
* John T. Bruce 800 Main Street Lynchburg, VA
1953 Trustee and President of FBP Funds
Since September 1988
George K. Jennison 225 Pictoria Drive, Suite 450 Cincinnati, OH
1957 Trustee Since January 2015
Harris V. Morrissette 225 Pictoria Drive, Suite 450 Cincinnati, OH
1959 Trustee Since March 1993
Elizabeth W. Robertson 225 Pictoria Drive, Suite 450 Cincinnati, OH
1953 Trustee Since February 2014
Norman D. Darden, III 800 Main Street Lynchburg, VA
1965 Vice President Since February 2018
John H. Hanna, IV 800 Main Street Lynchburg, VA
1955 Vice President Since February 2007
David J. Marshall 800 Main Street Lynchburg, VA
1956 Vice President Since February 2007
Robert G. Dorsey 225 Pictoria Drive, Suite 450 Cincinnati, OH
1957 Vice President Since November 2000
Mark J. Seger 225 Pictoria Drive, Suite 450 Cincinnati, OH
1962 Treasurer Since November 2000
David K. James 225 Pictoria Drive, Suite 450 Cincinnati, OH
1970 Secretary Since September 2018
Simon H. Berry 225 Pictoria Drive, Suite 450 Cincinnati, OH
1971 Chief Compliance Officer
Since May 2017
* Messrs. Ackerly and Bruce, as affiliated persons of investment advisers to the Trust, are “interested persons” of the Trust within the meaning of Section 2(a)(19) of the 1940 Act.

31
THE FLIPPIN, BRUCE & PORTER FUNDS BOARD OF TRUSTEES AND EXECUTIVE OFFICERS (Unaudited) (Continued)
Each Trustee oversees ten portfolios of the Trust, including the Funds. The principal occupations of the Trustees and executive officers of the Funds during the past five years and public directorships held by the Trustees are set forth below:
Robert S. Harris, Ph.D. is the C. Stewart Sheppard Professor of Business Administration at The Darden Graduate School of Business Administration at the University of Virginia. He was previously the dean at Darden. Professor Harris has published widely on corporate finance, financial markets and mergers and acquisitions and has served as a consultant to corporations and government agencies.
John P. Ackerly, IV is Senior Vice President and Portfolio Manager of Davenport & Company LLC (a broker-dealer and investment advisory firm).
John T. Bruce is President, Director and member of the Executive Committee of the Adviser.
George K. Jennison is President of Oyster Consulting, LLC (a management consulting firm). He previously was a financial adviser with Wells Fargo Advisors, LLC.
Harris V. Morrissette is President of China Doll Rice and Beans, Inc. and Dixie Lily Foods. He is also a Director of Trustmark Corporation (bank holding company).
Elizabeth W. Robertson serves as a Trustee of TowneBank Foundation, TowneBank Corporate Board, TowneBank Audit Committee Chair and TowneBank Community Board since 2015. She previously was Chief Financial Officer of Monument Restaurants LLC.
Norman D. Darden, III is Senior Portfolio Manager, Analyst and Principal of the Adviser.
John H. Hanna, IV is Vice President, Director and member of the Executive Committee of the Adviser.
David J. Marshall is Secretary, Director and member of the Executive Committee of the Adviser.
Robert G. Dorsey is a Vice Chairman of Ultimus Fund Solutions, LLC and Ultimus Fund Distributors, LLC. He previously was Co-CEO of Ultimus Fund Solutions, LLC (1999-2019).
Mark J. Seger is a Vice Chairman of Ultimus Fund Solutions, LLC and Ultimus Fund Distributors, LLC. He previously was Co-CEO of Ultimus Fund Solutions, LLC (1999-2019).
David K. James is an Executive Vice President and Chief Legal and Risk Officer of Ultimus Fund Solutions, LLC (2018 to present). He previously was Managing Director and Managing Counsel at State Street Bank and Trust Company (2009 to 2018).
Simon H. Berry is a Senior Attorney of Ultimus Fund Solutions, LLC (2016 to present). He previously was an Attorney at the Kentucky Department of Financial Institutions (2009-2016).
Additional information about members of the Board of Trustees and executive officers is available in the Statement of Additional Information (“SAI”). To obtain a free copy of the SAI, please call 1-866-738-1127.

32
We believe it is important for you to understand the impact of costs on your investment. All mutual funds have operating expenses. As a shareholder of a Fund, you incur ongoing costs, including management fees and other operating expenses. These ongoing costs, which are deducted from each Fund’s gross income, directly reduce the investment return of the Funds.
A mutual fund’s ongoing costs are expressed as a percentage of its average net assets. This figure is known as the expense ratio. The following examples are intended to help you understand the ongoing costs (in dollars) of investing in the Funds and to compare these costs with the ongoing costs of investing in other mutual funds. The examples below are based on an investment of $1,000 made at the beginning of the period shown and held for the entire period (October 1, 2018 through March 31, 2019).
The table below illustrates each Fund’s ongoing costs in two ways:
Actual fund return – This section helps you to estimate the actual expenses that you paid over the period. The “Ending Account Value” shown is derived from each Fund’s actual return, and the fourth column shows the dollar amount of operating expenses that would have been paid by an investor who started with $1,000 in the Funds. You may use the information here, together with the amount you invested, to estimate the expenses that you paid over the period.
To do so, simply divide your account value by $1,000 (for example, an $8,600 account value divided by $1,000 = 8.6), then multiply the result by the number given for the Funds under the heading “Expenses Paid During Period.”
Hypothetical 5% return – This section is intended to help you compare the Funds’ ongoing costs with those of other mutual funds. It assumes that each Fund had an annual return of 5% before expenses during the period shown, but that the expense ratio is unchanged. In this case, because the returns used are not the Funds’ actual returns, the results do not apply to your investment. The example is useful in making comparisons because the SEC requires all mutual funds to calculate expenses based on a 5% return. You can assess each Fund’s ongoing costs by comparing this hypothetical example with the hypothetical examples that appear in shareholder reports of other funds.
Note that expenses shown in the table are meant to highlight and help you compare ongoing costs only. The Funds do not charge sales loads or redemption fees.
The calculations assume no shares were bought or sold during the period. Your actual costs may have been higher or lower, depending on the amount of your investment and the timing of any purchases or redemptions.
More information about the Funds’ expenses, including annual expense ratios for the past five fiscal years, can be found in this report. For additional information on operating expenses and other shareholder costs, please refer to the Funds’ prospectus.
THE FLIPPIN, BRUCE & PORTER FUNDS ABOUT YOUR FUNDS’ EXPENSES (Unaudited)

33
THE FLIPPIN, BRUCE & PORTER FUNDS ABOUT YOUR FUNDS’ EXPENSES (Unaudited) (Continued)
Beginning Account Value
October 1, 2018
Ending Account Value
March 31, 2019
Net Expense Ratio(a)
Expenses Paid
During Period(b)
FBP Equity & Dividend Plus Fund
Based on Actual Fund Return $1,000.00 $ 962.40 1.07% $5.24Based on Hypothetical 5%
Return (before expenses) $1,000.00 $ 1,019.60 1.07% $5.39
FBP Appreciation & Income Opportunities Fund
Based on Actual Fund Return $1,000.00 $ 959.80 1.00% $4.89Based on Hypothetical 5%
Return (before expenses) $1,000.00 $ 1,019.95 1.00% $5.04
(a) Annualized, based on each Fund’s most recent one-half year expenses.(b) Expenses are equal to each Fund’s annualized net expense ratio multiplied by the average account value over the
period, multiplied by 182/365 (to reflect the one-half year period).

34
THE FLIPPIN, BRUCE & PORTER FUNDS OTHER INFORMATION (Unaudited)
The Trust files a complete listing of portfolio holdings for the Funds with the SEC as of the end of the first and third quarters of each fiscal year on Form N-Q. The filings are available upon request, by calling 1-866-738-1127. Furthermore, you may obtain a copy of these filings on the SEC’s website at http://www.sec.gov.
A description of the policies and procedures that the Funds use to determine how to vote proxies relating to portfolio securities is available without charge upon request by calling toll-free 1-800-327-9375, or on the SEC’s website at http://www.sec.gov. Information regarding how the Funds voted proxies relating to portfolio securities during the most recent 12-month period ended June 30 is also available without charge upon request by calling toll-free 1-866-738-1127, or on the SEC’s website at http://www.sec.gov.
FEDERAL TAX INFORMATION (Unaudited)
For the fiscal year ended March 31, 2019, FBP Equity & Dividend Plus Fund and FBP Appreciation & Income Opportunities Fund designated $1,385,855 and $649,008, respectively, as 20% long-term capital gain distributions.
Qualified Dividend Income – FBP Equity & Dividend Plus Fund and FBP Appreciation & Income Opportunities Fund each designates 100%, or up to the maximum amount of such dividends allowable pursuant to the Internal Revenue Code, as qualified dividend income eligible for the reduced tax rate of 15%.
Dividends Received Deduction – Corporate shareholders are generally entitled to take the dividends received deduction on the portion of a fund’s dividend distribution that qualifies under tax law. For FBP Equity & Dividend Plus Fund and FBP Appreciation & Income Opportunities Fund’s fiscal year 2019 ordinary income dividends, 100% qualifies for the corporate dividends received deduction.
35
THE FLIPPIN, BRUCE & PORTER FUNDS DISCLOSURE REGARDING APPROVAL OF INVESTMENT ADVISORY AGREEMENTS (Unaudited)
At an in-person meeting held on February 26, 2019, the Board of Trustees, including a majority of the Independent Trustees, approved the continuance for a one-year period of the Investment Advisory Agreements with the Adviser on behalf of the FBP Equity & Dividend Plus Fund and the FBP Appreciation & Income Opportunities Fund (individually, a “Fund,” collectively, the “Funds”). Below is a discussion of the factors considered by the Board of Trustees along with the conclusions with respect thereto that formed the basis for the Board’s approval.
In approving the continuance of the Investment Advisory Agreements, the Independent Trustees considered all information they deemed reasonably necessary to evaluate the terms of the Agreements. The principal areas of review by the Independent Trustees were the nature, extent and quality of the services provided by the Adviser and the reasonableness of the fees charged for those services. These matters were considered by the Independent Trustees consulting with experienced counsel for the Independent Trustees, who is independent of the Adviser.
The Independent Trustees’ evaluation of the quality of the Adviser’s services took into consideration their knowledge gained through presentations and reports from the Adviser over the course of the preceding year. The Independent Trustees considered that the Adviser had provided its views on the overall conditions of the economy and the markets, including the factors that may have influenced the markets, investor preferences and market sentiment during the past year. Both short-term and long-term investment performance of the Funds were considered. Each Fund’s performance was compared to its performance benchmark, a peer group of funds with similar investment objectives and strategies, and to the Adviser’s comparably managed private accounts. The Independent Trustees also considered: the scope and quality of the in-house capabilities of the Adviser and other resources that it dedicates to performing services for the Funds; the quality of administrative and other services, including the Adviser’s role in coordinating the activities of the Funds’ other service providers; the Adviser’s compliance with investment policies of the Funds and applicable laws and regulations; information provided by management and the Funds’ independent public accounting firm in periodic meetings with the Trust’s Audit Committee; the business reputation of the Adviser; the qualifications of the Adviser’s key investment and compliance personnel; and the Adviser’s financial resources.
In reviewing the fees payable under the Investment Advisory Agreements, the Independent Trustees compared the advisory fees and overall expense levels of each Fund with those of funds with similar investment objectives and strategies as well as the private accounts managed by the Adviser. The Independent Trustees considered information provided by the Adviser concerning the Adviser’s profitability with respect to each Fund, including the assumptions and methodology used in preparing the profitability information, in light of applicable case law relating to advisory fees. For these purposes, the Independent Trustees considered not only the fees paid by the Funds, but also so-called “fallout” benefits to the Adviser. The Independent Trustees also considered the Adviser’s representations that the Funds’ portfolio trades were executed based on the best available price and execution, and that the Adviser does not participate in any revenue sharing arrangements relating to the Funds. In evaluating the Funds’ advisory fees, the Trustees considered the complexity and quality of the investment process that is applied in the management of the Funds.

36
THE FLIPPIN, BRUCE & PORTER FUNDS DISCLOSURE REGARDING APPROVAL OF INVESTMENT ADVISORY AGREEMENTS (Unaudited) (Continued)
Based upon their review of this information, the Independent Trustees concluded that: (i) during the 2018 calendar year, each Fund placed below the return of the S&P 500 Index but above its Morningstar peer group average, and the Adviser has provided satisfactory services to each Fund; (ii) the advisory fees for each Fund, after fee waivers, are competitive with (and in the case of the FBP Dividend Plus Fund, lower than) similarly managed funds; (iii) the total operating expense ratio of each Fund, after fee waivers, is competitive with the average expense ratio for comparably managed funds, according to statistics derived from Morningstar, Inc.; (iv) the Adviser’s decision to cap overall operating expenses of each Fund by voluntarily waiving a portion of its investment advisory fees has enabled the Funds to increase returns for their shareholders and to maintain an overall expense ratio that is competitive with the average for similarly managed funds, despite the small size of the Funds; and (v) the Adviser did not realize any profits with respect to its management of the Funds.
Given the current size of the Funds and their expected growth, the Independent Trustees did not believe that it was relevant to consider the extent to which economies of scale would be realized as the Funds grow, and whether fee levels reflect these economies of scale. The Independent Trustees did consider the “fallout” benefits to FBP with respect to the Funds, but given the amounts involved viewed these as secondary factors in connection with the evaluation of the reasonableness of the advisory fees paid by the Funds.
No single factor was considered in isolation or to be determinative to the decision of the Independent Trustees to approve the continuance of the Investment Advisory Agreements. Rather the Independent Trustees concluded, after weighing and balancing of all factors considered, that it was in the best interests of each Fund and its shareholders to continue the Investment Advisory Agreements without modification to its terms, including the fees charged for services thereunder.

This page intentionally left blank.

38
Investment AdviserFlippin, Bruce & Porter, Inc.800 Main Street, Second FloorP.O. Box 6138Lynchburg, Virginia 24505Toll-Free 1-800-851-3804www.fbpfunds.com
AdministratorUltimus Fund Solutions, LLCP.O. Box 46707Cincinnati, Ohio 45246-0707Toll-Free 1-866-738-1127
CustodianU.S. Bank, N.A.425 Walnut StreetCincinnati, Ohio 45202
Independent Registered Public Accounting FirmCohen & Company, Ltd. 1350 Euclid Avenue, Suite 800Cleveland, Ohio 44115
Legal CounselSullivan & Worcester LLP1666 K Street, N.W.Washington, DC 20006
OfficersJohn T. Bruce, President and Portfolio ManagerNorman D. Darden, III, Vice PresidentJohn H. Hanna, IV, Vice President David J. Marshall, Vice President
TrusteesRobert S. Harris, Ph.D., ChairmanJohn P. Ackerly, IVJohn T. BruceGeorge K. JennisonHarris V. MorrissetteElizabeth W. Robertson