annual report & accounts for the year ended 30 … report & accounts for the year ended 30...
TRANSCRIPT

Annual Report & Accounts for the year ended 30 September 2012
Positioned for growth.
TT11 | AR 2012 | 20/12/2012 | Proof 5

Our growth levers: Creating shareholder value
•DeliveringMainstreamgrowth> Unique holidays only available
from TUI Travel> Distributed directly to the customer –
growth from online> Leveraging our scale
•OrganicSpecialist&Activitygrowth
•LeveragingourgloballeadershippositioninAccommodationWholesalerthroughgrowthinexistingmarketsandnewmarketentry
•InvestinginAccommodationOTA–focusonhighgrowthandnewmarkets
•Focusonfreecashflowgeneration
TheinvestmentcaseReasons to invest in TUI Travel PLC
www.tuitravelplc.com
TT11 | AR 2012 | 20/12/2012 | Proof 5

TUI Travel PLC Annual Report & Accounts 2012 1
TT11 | AR 2012 | 20/12/2012 | Proof 5
Groupoverview
www.tuitravelplc.com
Contents
Group overview ifc The investment case 02 TUI Travel overview 04 Our structure 06 Operational and financial highlights
Strategic overview 08 Chairman’s statement 09 Chief Executive’s statement 10 TUI Travel at a glance 12 Why we do it: Market overview 14 How we do it: Strategic framework 15 How we do it: Business models 16 How we do it: Strategy 18 How we measure it: Key performance indicators 20 What are the risks? Principal risks 28 Our people 30 Health & Safety 32 Sustainable development
Business and financial review 36 Group performance 39 Segmental performance 48 Current trading and outlook
Governance 50 Board of Directors 52 Directors’ report 55 Directors’ responsibilities statement 56 Corporate Governance report 66 Remuneration report
Financial statements 78 IndependentAuditors’report(Group)
79 Consolidatedfinancialstatements 79 Consolidated income statement 80 Consolidated statement of comprehensive income 81 Consolidated balance sheet 82 Consolidated statement of changes in equity 83 Consolidated statement of cash flows 84 Notes to the consolidated financial statements
147 IndependentAuditors’report(ParentCompany)
148 ParentCompanyfinancialstatements 148 Company balance sheet 149 Notes to the Company’s financial statements
Shareholder information 154 Financial calendar 154 Contacts and advisers 154 Glossary of key terms 155 Shareholder discount 156 Index
TUITravelPLCisoneoftheworld’sleadingleisuretravelgroups
www.tuitravelplc.com
The Annual Report & Accounts contain forward-looking statements that are subject to risk factors associated with, amongst other things, the economic and business circumstances occurring from time to time in countries and Sectors in which the Group operates. It is believed that the expectations reflected in these statements are reasonable but they may be affected by a wide range of variables which could cause actual results to differ from those currently anticipated.
StrategicoverviewB
usinessandfinancialreviewG
overnanceFinancialstatem
entsShareholderinform
ation

2 TUI Travel PLC Annual Report & Accounts 2012
TT11 | AR 2012 | 20/12/2012 | Proof 5
www.tuitravelplc.com
Our visionMaking travel experiences special.
Who we areTUI Travel PLC (TUI Travel or the Group) is one of the world’s leading leisure travel groups operating in approximately 180 countries worldwide and comprising over 240 brands. We serve more than 30 million customers across 31 source markets making us a global player in a growing industry. Headquartered in the UK, we employ approximately 54,000 people and operate six airlines consisting of 141 aircraft.
Through our global brand portfolio and our travel expertise we are focused on delivering a wide variety of leisure travel experiences designed for our customers’ ever changing needs.
The Group reported through four business Sectors until 30 September 2012: Mainstream, Specialist & Activity, Accommodation & Destinations and Emerging Markets. As of the 1 October 2012, the Group will be reporting in a new structure which you can review in the ‘How we do it: Our new structure’ section of this Annual Report and Accounts.
TUI Travel is listed on the London Stock Exchange and is a member of the FTSE 250 and FTSE4Good Indices with the ticker code TT.
For more information visit www.tuitravelplc.com
Group overview
TUITraveloverview

www.tuitravelplc.com
TUI Travel PLC Annual Report & Accounts 2012 3G
roup overview
TT11 | AR 2012 | 20/12/2012 | Proof 5
Group overview
Where we operateTUI Travel is a global business operating across 31 key source markets in 180 countries worldwide.
AustraliaAustriaBelgiumBrazilCanadaChinaCzech RepublicDenmarkFinlandFranceGermanyHungaryIndiaIrelandItalyLuxembourg
MexicoThe NetherlandsNew ZealandNorwayPolandRussiaSingaporeSloveniaSpainSweden SwitzerlandThailand UkraineUnited KingdomUnited States
Our featured brandsTUI Travel operates over 240 brands which are available to view on our website www.tuitravelplc.com/brand-experience. A selection of our featured brands includes:
Our 31 key source markets are:
In Germany TUI is one of the best known consumer brands and the favourite holiday brand for consumers and travel agencies alike. It has a market-leading position.
www.tui.com
Jetair is TUI Belgium’s master brand. It is a tour operator which offers a range of air and car holidays and city trips.
www.jetair.be
Thomson has been selling holidays from the UK for over 50 years. It is one of the UK’s most well-known holiday brands, delivering unique and modern holiday experiences. In 2013, 90% of hotels in its brochures will be exclusive to Thomson.
www.thomson.co.uk
Fritidsresor is the leading tour operator and retail business in the Swedish source market offering package tours to destinations worldwide including the Mediterranean, Canary Islands and Thailand.
www.fritidsresor.se
LateRooms.com offers a large array of accommodation across the UK and worldwide from B&Bs to castles to hotels to apartments to chalets.
www.laterooms.com
Hotelbeds is the leading global accommodation wholesaler, supplying over 50,000 hotels across 147 countries to travel agents, airlines and tour operators.
www.hotelbeds.com
airtours is a luxury holiday brand which, for more than 40 years, has offered the most comprehensive, individual and exclusive holidays in the German speaking market.
www.airtours.de
Intercruises Shoreside & Port Services is an experienced global business offering first class ground handling and port agency services to the ocean and river cruise industry.
www.intercruises.com
For over 20 years, Quark Expeditions has been the leading provider of polar adventure travel. With its diverse fleet of specially equipped vessels and seasoned expedition leaders, it offers travellers unparalleled access to the most remote regions on earth.
www.quarkexpeditions.com
TUI Netherlands operates Arke, the leading B2C travel brand in the Dutch source market and a household name. Besides tour operating, it operates 130 travel shops, a call centre and the website Arke.nl. Arke is an important supplier of passengers to the airline ArkeFly, also operated by TUI Netherlands.
www.arke.nl
The Moorings is the world’s leading yacht charter company with over 650 yachts in 27 cruising destinations worldwide. The Moorings offers a collection of memorable getaways from hands-on sailing or power yacht vacations to all-inclusive private luxury crewed yachts.
www.moorings.com
With over 30 years’ experience, Crystal is the UK’s number one ski operator taking customers to more of the world’s best snow resorts than anyone else. From self-catering apartments to cosy, friendly ski chalets.
www.crystalski.co.uk

www.tuitravelplc.com
4 TUI Travel PLC Annual Report & Accounts 2012
TT11 | AR 2012 | 20/12/2012 | Proof 5
BusinessSectors
Group overview
Ourstructure
Mainstream Sector
The Mainstream Sector makes up the largest part of our Group in terms of financial performance, scale, scope and number of employees. This Sector incorporates our familiar ‘power’ brands such as our tour operators with circa 1,800 retail stores across Europe and six airlines consisting of 141 aircraft throughout our key source markets. Previously it has been structured in the following regions:
Northern
The Northern Region comprises the distribution, tour operating businesses and airlines in the UK & Ireland, Canada, the Nordic Countries (Sweden, Norway, Denmark and Finland) and the Hotels division consisting of hotel management companies and joint ventures in hotels.
Central Europe
Central Europe comprises distribution, tour operating businesses and airlines in the source markets of Germany, Austria, Switzerland and Poland. Germany is the largest market in terms of customer numbers and TUI is the market-leading brand, both here and in Austria.
Western Europe
Western Europe comprises the leading tour operators and airlines in the Netherlands, Belgium and France and two smaller tour operators in Italy and Spain.
Accommodation & Destinations Sector
Accommodation & Destinations (A&D) Sector is a global provider of accommodation and inbound travel services. Its businesses provide hotel accommodation, transfers, excursions and tours, meetings and events and cruise handling services to the travel trade, corporate clients and direct to customers worldwide. A&D competes in fast-growing areas of the travel sector through three business lines: Accommodation Wholesaler; Accommodation OTA (online travel agent) and Inbound Services. It has market-leading brands including the global brands Hotelbeds, Intercruises, Destination Services, Worldcome and Pacific World and leading local brands including LateRooms.com, AsiaRooms.com and, from 23 September 2012, MalaPronta.com.
Specialist & Activity Sector
If you can dream it, we can take you there. That’s the ethos of our Specialist & Activity Sector. Comprising more than 100 global travel businesses, the Sector offers a wide range of unique activity and experience-based holidays that truly capture the spirit of adventure to provide long-lasting holiday memories. Skiing, sailing, safaris and nature, polar expeditions, sports tourism, volunteering, cycling and trekking holidays, cultural tours, canal boating, family activity, sustainable travel and educational travel; this Sector brings a diverse and exciting range of holidays to 1.5m customers from around the world.
Emerging Markets Sector
The Emerging Markets Sector works closely with the senior management across the Group to develop and implement our participation strategies in the emerging markets. Through a combination of organic and acquisitional growth our objective is to establish a leading position in these developing economies, delivering long-term growth and optimum shareholder value.
Mainstream Sector
Accommodation & Destinations Sector
Specialist & Activity Sector
79%
12%
9%
Underlying operating profit mix** by Sector **before central costs and Emerging Markets
During the financial year ended 30 September 2012 TUI Travel was organised and managed through four business Sectors: Mainstream, Accommodation & Destinations, Specialist & Activity and Emerging Markets.

Group overview
www.tuitravelplc.com
TUI Travel PLC Annual Report & Accounts 2012 5G
roup overview
TT11 | AR 2012 | 20/12/2012 | Proof 5
Ournewstructure
From the start of the new financial year, TUI Travel PLC will report in three sectors: Mainstream, Specialist & Activity and Accommodation & Destinations. The businesses within our sectors follow either the Tour Operator or Online Accommodation business model depending on which market they address (see How we do it: Business models).
As previously announced in April 2012, the Mainstream Sector will be reporting via key source markets instead of regionally. The Emerging Markets Sector has been absorbed into other sectors depending on whether the specific business addresses the Tour Operator or Online Accommodation market.
The Accommodation & Destinations Sector divisions will now report through two business lines – Online Accommodation and Inbound Services. Online Accommodation includes the Accommodation Wholesaler and Accommodation OTA businesses. Inbound Services include our businesses that provide transfers, excursions, tours, tailor-made products, cruise handling services and meetings and events. This business line straddles both models as its businesses serve both individual travellers and tour operators.
UK & Ireland
France
Nordics
Germany
Other
Inbound Services
Online Accommodation
Online Accommodation
Tour Operator
Mainstream
Specialist & Activity
Accommodation & Destinations

www.tuitravelplc.com
6 TUI Travel PLC Annual Report & Accounts 2012
TT11 | AR 2012 | 20/12/2012 | Proof 5
•Recordyearofprofitandimprovedoperationalefficiency> Operating profit increase of 12% to £526m on a constant currency* basis.
Underlying operating profit of £490m (2011: £471m), an increase of 4%.> Record Mainstream underlying operating profits, on a constant currency* basis,
in all markets with the exception of France and Southern Europe.> Outstanding performance in the UK with a record underlying operating profit
of £197m (2011: £149m) and operating profit margins of 5.4%, up from 4.2% in the prior year.
> Business improvement programme outperformance with £42m delivered in the year.> Strong underlying earnings per share growth of 9% to 25.8p (2011: 23.6p).
Statutory earnings per share grew by 62% to 12.5p (2011: 7.7p).> Final dividend increase of 4% to 8.3p per share (2011: 8.0p), resulting
in a full year dividend of 11.7p per share (2011: 11.3p).
•ModernMainstreamstrategydeliveringresults> Sales of higher margin unique holidays increased by three percentage points
to 65% of Mainstream holidays.> Online sales up three percentage points to 33% of Mainstream sales.
Direct distribution up two percentage points to 65% of Mainstream sales.
•SignificantinternationalexpansionacrossOnlineAccommodation> Online Accommodation profits up 3% to £35m, including an £11m investment
in our Accommodation OTA. > Accommodation Wholesaler continues to consolidate its global leadership
position; TTV growth of 13% to £1.4bn.> Accommodation OTA continues its investment in high growth markets;
TTV growth of 4% to £447m including AsiaRooms growth of 25%.
•Clearstrategycontinuingtodrivestrongtradingmomentum> Very encouraging Winter 2012/13 trading.> Strong Summer 2013 bookings in the UK, Nordics and Germany.
Significant growth in profitable market share in the UK.> Clear roadmap for sustainable future growth with an annualised underlying
operating profit growth rate of between 7 to 10%. *Constant currency basis calculated by translating the 2012 results at 2011 exchange rates
Group overview
Operationalandfinancialhighlights

Group overview
www.tuitravelplc.com
TUI Travel PLC Annual Report & Accounts 2012 7G
roup overview
TT11 | AR 2012 | 20/12/2012 | Proof 5
Revenue
12 £14,460m -2%11 £14,687m
Underlying operating profit
12 £490m +4%11 £471m
Underlying profit before tax
12 £390m +8%11 £360m
Free cash flow
12 £240m -47%11 £451m
Basic underlying earnings per share
12 25.8p +9%11 23.6p
Dividend per share
12 11.7p +4%11 11.3p
Underlying results1 Statutory results 2012 2011 Change 2012 2011 Year ended 30 September £m £m % £m £m
Revenue 14,460 14,687 -2% 14,460 14,687Operating profit 490 471 +4% 301 255Profit before tax 390 360 +8% 201 144Free cash flow 240 451 -47% 240 451Basic earnings per share (pence) 25.8 23.6 +9% 12.5 7.7Dividend per share (pence) 11.7 11.3 +4% 11.7 11.3
1) Underlying operating profit excludes separately disclosed items, amortisation of business combination intangibles, acquisition related expenses, impairment of goodwill and available for sale financial assets, predecessor accounting for Magic Life in 2011 and interest and taxation of results of the Group’s joint ventures and associates.

TT11 | AR 2012 | 20/12/2012 | Proof 5
www.tuitravelplc.com
8 TUI Travel PLC Annual Report & Accounts 2012
Our statutory profit before tax (PBT) has increased 40% in the year from £144m to £201m and our statutory earnings per share (EPS) rose 62% from 7.7p to 12.5p. These results prove that we have the right strategy and are executing it well.
DividendsThe Board is recommending a final dividend of 8.3p per share (2011: 8.0p). On 8 May 2012, the Board recommended an interim dividend of 3.4p per share (2011: 3.3p) resulting in a full year dividend of 11.7p per share, a 4% increase on the previous year (2011: 11.3p). The Group has a progressive dividend policy and will look to maintain underlying dividend cover at around two times.
Dividend increase on 2011
+4%BoardAt the beginning of our financial year Johan Lundgren was appointed Deputy Chief Executive from 20 October 2011 with the responsibility for the Mainstream Sector. On 19 October 2011 Sir Michael Hodgkinson joined the Remuneration Committee and Clare Chapman, previously Non-Executive Director, resigned from her post. On 2 December 2011, Minnow Powell and Harold Sher were appointed to the Nomination Committee. Bill Dalton retired from the Board on 29 May 2012 while Janis Kong and Coline McConville were appointed Independent Non-Executive Director and Remuneration Committee Chairman respectively. Janis subsequently joined the Remuneration and Audit Committees on 26 July 2012. Post year end, Tony Campbell
stepped down from the Remuneration and Audit Committee from 1 October 2012. Finally, I will be stepping down as Chairman of TUI Travel PLC from September 2013.
Sustainable developmentOur vision is to make travel experiences special whilst minimising environmental impact, respecting culture and people, and bringing economic benefit to communities. During the year we launched our three-year Sustainable Holidays Plan highlighting our continued commitment to sustainable development. The plan highlights significant integration of environmental and social principles into the way we do business. Achieving our vision is critical to the future health of our own business, the wider industry, the customers we serve and the communities they visit.
ColleaguesThe record performance that we have achieved this year comes down to one thing in particular, our colleagues. Across the world, 54,000 people strive to make our strategy come to life and it is their commitment, passion and ambition that results in the ultimate success of our business. We aim to make travel experiences special. A large number of our colleagues are customer facing and it is their service that makes the difference between a good holiday and a great one. The Board and I would like to personally thank each and every one of our colleagues for their continuing commitment and hard work.
Dr Michael FrenzelNon-Executive Chairman
2012 has been a record year for our business. We are pleased to be reporting a 4% increase in underlying operating profit for the full year to £490m (2011: £471m). This is even more impressive against a backdrop of global economic uncertainty, political turmoil, weak consumer sentiment, the Eurozone crisis, natural catastrophes and downgrades to forecasts across numerous consumer industries.
Underlying operating profit
+4%The travel and tourism industry has grown by an average of 4% every year since 1995. This year is no different with the number of international arrivals set to reach one billion in 2012. The market today is directly worth over US$2 trillion to global GDP and supports 98 million jobs worldwide.
By offering our customers exactly what they want, not what we think they need, we are very well positioned to benefit from the size and growth of this vast industry in the long-term.
ResultsThe Group has achieved record results this year. Whilst we have witnessed a slight decrease in revenue to £14,460m (2011: £14,687m), mainly due to foreign exchange translations following the Eurozone crisis, we have seen record underlying operating profit increase 4% to £490m (2011: £471m). Underlying profit before tax is up 8% to £390m (2011: £360m) for the full year whilst underlying basic earnings per share increased by 9% to 25.8p (2011: 23.6p).
Strategic overview
Chairman’sstatement

www.tuitravelplc.com
TUI Travel PLC Annual Report & Accounts 2012 9Strategic overview
TT11 | AR 2012 | 20/12/2012 | Proof 5
cycle, which in turn helps us to manage capacity and therefore efficiency. We are always looking for opportunities to develop the portfolio of unique holidays across the Group and this will continue into 2013 and beyond.
Our direct distribution channels are central to the Group’s continued growth. We have room to expand these in all our markets which will lead to improved margins and better results. The core contribution of our direct distribution comes from online channels.
At present we consider ourselves to be an online-driven Group, however, we can do more. The online drive continues across the Group from front-end customer interaction at the time of booking to back office functions. Technology is an integral part of the direction we are heading in and as such, in March 2012, we appointed Mittu Sridhawa as the Group’s Chief Information Officer and member of the Group Management Board.
We have been successful in implementing Group-wide cost efficiency and business improvement programmes as we have done over previous years. The total savings made this year of these activities equates to £42m. The drive for operational efficiency is Group-wide.
The UK has had a great year delivering a record underlying operating profit, up 32% on the previous year, to £197m (2011: £149m). This has been achieved through the increase in sales of our unique holidays and continued focus on direct distribution, with online as the core contributor, as well as our operational efficiency programmes.
Our strategy has evolved over the year. It now stems from two very prominent customer demands in the leisure travel market – individualisation and commoditisation. We see these trends as central to our future growth and have developed two strong business models
(see How we do it: Business models section) that satisfy these customer demands. One model addresses the Tour Operator segment of the market, satisfying the individualisation demands of our customers. In practice, this means offering unique holidays to customers through our Mainstream Sector, such as Sensatori in the UK, Sensimar in Germany and Blue Village in the Nordics, and also includes our Specialist & Activity Sector offering, focused on tailor-made holidays, including private jet tours, polar expeditions and sailing experiences among many others. The other model addresses the Online Accommodation segment of the market, satisfying the commoditisation demands of our customers. We are able to take advantage of our scale and technological developments to offer our customers a wide variety of choice at very competitive prices. We have the market-leading position in Accommodation Wholesale and continue to invest in our own Accommodation Online Travel Agent (OTA) business.
We have had a good start to the new financial year with strong Winter 2012/13 trading. For the two markets on sale for Summer 2013 we have increased capacity, showing our confidence in the market and our ability to deliver growth. Our Mainstream Sector has begun reporting from 1 October 2012 in its new structure which has been developed to accelerate more rapidly the move to modern mainstream.
We could not do any of this without our fantastic colleagues, all 54,000 of them. I am hugely proud of every single one of them and would like to personally thank them all for their consistent effort, determination and successes in a challenging macro-economic environment.
Peter LongChief Executive
This has been a year of record success across the Group, proving that our strategy is delivering results. We have recorded our largest underlying profit figure to date, despite the negative foreign exchange translation of £36m. On a constant currency basis, our underlying profit increased 12% to £526m (2011: £471m).
Underlying profit*
+12%These are the results of a resilient and flexible business with the right strategy for the market and a large number of colleagues who care about our customers, are passionate about our leisure travel experiences and can plan, implement and deliver growth.
Our return on invested capital has increased again this year, now standing at 12.2%. With our weighted average cost of capital at 10% we continue to generate returns in excess of our cost of capital. We are therefore well positioned to invest further in the business and accelerate our growth plans.
Return on invested capital
+12.2%Overall, the Group has expanded its unique holidays portfolio (this is our differentiated and exclusive products combined) which books earlier and provides higher margins for our businesses. The sales of these products have continued to increase contributing to the success of the Group this year. The feedback received from our customers experiencing these products has been incredibly positive. This helps lead to repeat bookings, often early in the booking
*On a constant currency basis
Strategic overview
ChiefExecutive’sstatement

TT11 | AR 2012 | 20/12/2012 | Proof 5
Strategic overview
TUITravelataglance
www.tuitravelplc.com
10 TUI Travel PLC Annual Report & Accounts 2012
Why we do it
Marketoverview
Leisure Travel market:
•DirectlyworthUSD$2trilliontoglobalGDPin2012
•Directlysupports98millionjobsworldwide
•Averagegrowthrateof4%since1995andsettocontinue
•2012willbethefirstyearwhereinternationalarrivalsbreaktheonebillionmark
•Twosidestothemarket,customersdemandingindividualisationandthosewhodemandcommoditisation
•Wehavestrategiesthataddressboth,explainedinthe‘Howwedoit’section
We are well positioned to benefit from the market’s size and growth.
What we do
Make travel experiences special
FOR MORE SEE PAGE 12

TT11 | AR 2012 | 20/12/2012 | Proof 5
How we do it
Strategicframework,BusinessmodelsandStrategy
•Our StrategyThroughourglobalbrandportfolioandtravelexpertisewearefocusedondeliveringleisuretravelexperiencesdesignedforourcustomers’everchangingneeds
•Two strong business modelsaddressingthedifferentcustomerdemandswithinthemarket.ThedemandforindividualisationisaddressedthroughourTourOperatingmodelandthedemandforcommoditisationisaddressedthroughourOnlineAccommodationmodel
•Our Strategic Drivers Content,Brands&Distribution,Technology,Growth&ScaleandPeople
•Our Values CustomerDriven,PlayingtoWin,ResponsibleLeadershipandValueDriven
Strategic overview
www.tuitravelplc.com
TUI Travel PLC Annual Report & Accounts 2012 11Strategicoverview
How we measure it
OurKPIs
•Returnoninvestedcapital
2012 12.2% vs 2011 11.3%
•Cashconversion1%
2012 75% vs 2011 121%1) Freecashflowadjustedfornetpre-delivery
paymentsof£53m(2011:£34m)
•UniqueholidaysmixasaproportionoftotalMainstreamSectorholidays
2012 65% vs 2011 62%
•Directdistributionmix,asaproportionoftotalMainstreamSectorholidays
2012 65% vs 2011 63%
•Onlinedistributionmix,asaproportionoftotalMainstreamSectorholidays
2012 33% vs 2011 30%
•Turnaroundandcostsavingsdelivered
2012 £42m
•TotalTransactionValueintheOnlineAccommodationbusiness
£1.8bn, an increase of 10% over the prior year
•Carbonefficiency,measuredthroughTUITravelairlines’averagecarbonemissionsperrevenuepassengerkilometre(CO2/RPK):
2012 73.0g CO2/RPK vs
2011 75.9g CO2/RPK
What are the risks?
Principalrisks
Strategic risks
•Consumerpreferencesanddesires
•Businessimprovementopportunities
•Emergingmarkets,acquisitionsandinvestments
Operational risks
•Globalfinancialfactors
•Economicenvironment
•Talentmanagement
•Politicalvolatility,naturalcatastrophesandoutbreaks
Compliance risk
•Regulatoryenvironment
FOR MORE SEE PAGE 14 FOR MORE SEE PAGE 18 FOR MORE SEE PAGE 20

TT11 | AR 2012 | 20/12/2012 | Proof 5
www.tuitravelplc.com
12 TUI Travel PLC Annual Report & Accounts 2012
The political climate As a global organisation, we feel the impact of government regulation in all of the markets in which we operate. Some of our activities, such as those undertaken by our airline, are heavily regulated. Many of our lawmakers, particularly in Europe, are becoming increasingly focused upon measures to protect customers.
The policy of our political and regulatory affairs team is to seek to engage with legislators at an early stage in relation to all of those areas of regulation that might have a material impact upon the way we do business. Our focus is always to work with governments to bring forward legislation that is fit for purpose, is no more burdensome on industry than it needs to be and does not discriminate between different business models.
Our engagement with the European institutions has been particularly important over the last 12 months as we seek to achieve a proper balance between the aviation industry and the customer in the area of passenger rights. This will also remain an area of focus in the coming 12 months.
The work of the European institutions in relation to the revision of the European Directive on Package Travel also continues. We are confident that the European institutions are convinced of the need for reform and will bring forward a proposal in the first quarter of 2013.
Over the last 12 months, Eurozone countries have had to come to grips with austerity measures placed on them by national governments, some more severe than others. We continue to monitor the developments across the region and do not expect this to have a major impact on our business. The good relationships we have with our suppliers and the flexibility in our business model means we are well positioned to deal with any eventuality.
Aviation taxation also remains on the agenda as governments across the world look for ways to increase revenue. Our role is to remind them of the importance of the travel and tourism industry as a driver for growth.
In the UK, the debate on airport capacity continues. We will take a full part in that debate as it develops in order to ensure that the specific requirements of leisure airlines and passengers are fully understood.
Both segments are being driven by high growth in online bookings and, while the uncertain economic environment has had an effect on consumer travel spending habits, demand for leisure travel remains strong.
Our business models (see How we do it: Business models section) aims to cater to these trends – individualisation and commoditisation – to best serve the changing needs of our customers. We consider individualisation to be the Tour Operator market and commoditisation as the Online Accommodation market.
The sustainability challengeTravel and tourism accounts for 9% of global GDP*. The industry will continue to be one of the world’s fastest growing sectors, with emerging economies in particular seen as engines of such growth and the UNWTO expecting international tourist arrivals to exceed 1 billion in 2012. Travel and tourism today is responsible for 9% of global employment* but also for 5% of global carbon dioxide emissions**. From a sustainable development perspective this poses a challenge – the growth of an industry highly dependent on fossil fuels and biodiversity in a world of finite natural resources.
Our businesses have been facing up to this challenge for over a decade. For TUI Travel, responding to these issues means bringing sustainability centre stage, to build on the efficiency and resilience of our business and the services it provides. Our Sustainable Holidays Plan is a major step forward for TUI Travel in our journey towards providing special travel experiences whilst minimising environmental impact, respecting the culture and people in destinations and bringing real economic benefit to local communities. See our Sustainable Development section for more information.
Reference
*World Travel and Tourism Council’s Economic Impact Report 2011.
**United Nations World Tourism Organisation (UNWTO), United Nations Environment Programme (UNEP) and World Meteorological Organisation (WMO) October 2007 Climate Change and Tourism: Responding to Global Challenges.
The MarketThe economic environmentThe global economic recovery has slowed down over the past six months. In addition to the Eurozone crisis and the unrest in the Middle East and North Africa, growth in a number of major emerging market economies has been lower than previously forecast. The IMF projects real GDP growth worldwide at 3.5% for 2012. Growth is expected to be driven by emerging and developing economies which are forecast to expand by 5.6% in 2012. In comparison, advanced economies are expected to grow by only 1.4%.
Our two largest source markets, the UK and Germany, are expected to grow by 0.2% and 1% respectively in 2012. Within the Eurozone, the unemployment rate currently stands at 11.4%, up 120 percentage points from last year. Compared to other Eurozone countries, both Germany and the UK have withstood the economic crisis in the Eurozone with unemployment at just 5.5% in Germany and 8.1% in the UK.
The economic outlook for 2013 seems more positive with real GDP growth worldwide projected at 3.9% driven by the expansion of both advanced and emerging markets. While advanced economies are forecast to grow at 1.9%, emerging and developing economies are projected to expand by 5.9%.
The leisure travel marketDemand for international tourism remained strong in 2011 with international arrivals growing by 4.6% compared to 2010. The percentage increase was slightly below 2010 (7%), driven primarily by economic factors coupled with unrest in the Middle East and North Africa, which were the only regions to record a decline in arrivals, -8% and -9% respectively (UNWTO).
Europe, home to the majority of our core markets and accounting for over half of all international arrivals worldwide, together with Asia, were the fastest growing regions globally.
The travel and tourism market continues to experience a clear polarisation of demand. On one hand, we have customers who demand individualisation, i.e. unique holidays with bespoke services. On the other hand, we have customers who are increasingly moving towards commoditisation, i.e. flights in combination with hotels with minimal levels of differentiation.
Strategic overview
WhywedoitMarket overview

TT11 | AR 2012 | 20/12/2012 | Proof 5
Strategic overview
www.tuitravelplc.com
TUI Travel PLC Annual Report & Accounts 2012 13Strategicoverview
MarketSize&Coverage
OurFootprint
Our 10 core markets, including the UK, Sweden, Germany, France, Belgium, the Netherlands, Austria, Poland, Switzerland and Canada, account for £405bn of global travel spend (Euromonitor). Our four largest source markets of the UK & Ireland, Germany, France and Sweden make up 70% of this spend.
Due to the niche nature of Specialist & Activity businesses, it is hard to quantify total worldwide spend on these holidays but their geographical reach and popularity continues to rise.
The total Online Accommodation market accounts for £82bn of global travel spend.
The Accommodation Wholesaler market accounts for £15bn of this spend with the Accommodation Online Travel Agent (OTA) market accounting for the remaining £67bn.
Our Group’s addressable market in the Accommodation OTA segment (including UK and Asia-Pacific focus markets) makes up £7.5bn of the total OTA market.
MarketGrowth Our core markets are projected to grow at a 3% CAGR over the next five years. The mainstream holiday market remains resilient and has actually seen resurgence in a tough economic environment.
Online Accommodation is the fastest growing segment of the travel market and is expected to grow at a CAGR of 7.5% over the next five years.
OurPositioning We are the number one tour operator in Europe with strong positions in each of our core markets.
In addition, we have market-leading positions in a number of specialist segments with a portfolio of unique holidays, unrivalled product knowledge and superb customer experience.
Our Accommodation Wholesaler business (Hotelbeds and Bedsonline) is the market leader in the B2B space.
With our Accommodation OTA business we are positioned strongly in the UK (LateRooms.com) and Asia-Pacific (AsiaRooms.com) and have recently established ourselves in the Latin American market through the acquisition of MalaPronta.com, Brazil’s fourth largest online accommodation OTA.
KeyTrends&FutureOutlook
Customers are increasingly moving towards online channels to fulfil their travel needs and we expect this trend to continue into 2013 and beyond. We, therefore, remain focused on improving our online presence, increasing our participation in social media and moving towards an online-driven company culture.
Demand for unique holiday experiences continues to see strong growth and with a diverse range of experiences on offer, TUI Travel remains well placed.
Online Accommodation has seen tremendous growth over the last few years fuelled by the growth in online bookings and supplemented by strong demand from the emerging markets. Online Accommodation, therefore, remains a key area of focus for TUI Travel where we look to consolidate our leadership position within the Accommodation Wholesaler market and build on our strong position in the Accommodation OTA segment.
TourOperatorMarket(individualisation)
OnlineAccommodationMarket(commoditisation)

www.tuitravelplc.com
14 TUI Travel PLC Annual Report & Accounts 2012
TT11 | AR 2012 | 20/12/2012 | Proof 5
Strategic overview
HowwedoitStrategic framework & Business models
Strategicframework
Our Strategic Framework underpins everything we do and comprises of our Vision, Strategy, Strategic Drivers and the Values that are innate within our business culture.
Making travel experiences special
Throughourglobalbrandportfolio&travelexpertisewearefocusedondeliveringleisuretravelexperiences
designedforourcustomers’everchangingneeds
Vision
Strategy
StrategicDrivers
Values
Content Brands&Distribution Technology Growth
&Scale
CustomerDriven
PlayingtoWin
ResponsibleLeadership
ValueDriven
People
Customer DrivenWe respect our customers and never forget that they choose to spend their leisure time with us. We share a duty to maintain their loyalty and trust. We anticipate customer desires and everything we do is with them in mind. We believe there is no such thing as a mass market but a huge market of individuals.
Playing to WinWe are passionate about being the best and about winning with integrity. We seek the ideas and trends that change leisure-time markets for the better and move quickly to action them. We thrive on teamwork. We are not afraid of making brave decisions. We want to do something new every day and we love what we do.
Value DrivenWe share an infectious entrepreneurial streak and a clear focus on the need for profitability. We look for opportunities that have a commercial advantage for us and add value to our customers’ experiences. We predict, translate and bring to market new leisure-time products based on their genuine appeal to customers.
Responsible LeadershipWe are committed to sustainable development and to making a positive impact on society. We know leadership has to be earned and we never take it for granted. We communicate openly and easily and help each other develop and grow. We celebrate local differences and actively seek to contribute to a better world.

www.tuitravelplc.com
TUI Travel PLC Annual Report & Accounts 2012 15Strategic overview
TT11 | AR 2012 | 20/12/2012 | Proof 5
Strategic overview
Businessmodels
We have refined our business model to focus on the two key areas of long-term growth within the market. The Tour Operator model addresses the individualisation needs of the customer while the Online Accommodation model addresses the commoditisation needs. The strategic drivers of both areas are ingrained in our Strategic Framework with a clear focus on Content, Brands & Distribution, Technology, Growth & Scale and People.
› Range and diversity of hotel stock
› Global destination and source market coverage
› Leveraging scale
› Well known Accommodation Wholesaler and Accommodation OTA brands
› Online
› Market-leading technology
› Knowledge & expertise
› Driving innovation
› Unique, inclusive holidays
› Tailor-made holidays
› Leveraging scale
› Market-leading brands
› Trusted brands – safety & security
› High levels of controlled distribution – focus on online
› Flexible technological platforms to support growth
› Knowledge & expertise
› Driving innovation
Content
Brands&Distribution
Technology
Growth&Scale
People
Tour Operator Online Accommodation
Online Driven + Cost Efficiency

TT11 | AR 2012 | 20/12/2012 | Proof 5
www.tuitravelplc.com
16 TUI Travel PLC Annual Report & Accounts 2012
Strategic overview
HowwedoitStrategy
Tour Operator
Online Accommodation
Unique holidays – Why is it important?
›Puts the customer’s needs first and foremost.
›Provides value added services and features which command a margin premium over commodity products.
›Leads to higher customer loyalty and an increase in repeat bookings.
›Books early when compared to commodity products enabling us to manage our capacity and yield more effectively.
What are we doing about it?
›Unique holidays form the backbone of our Tour Operator strategy.
›Our specialist businesses, through their unique holiday portfolio, provide tailor-made holidays to cater to a wide range of customer needs.
› In the Mainstream Sector, the levels of unique holidays have continued to grow. In 2012, they represented 65% of total holidays booked, compared to 62% in 2011. We have clear targets and plans to grow the proportion of unique holidays across all markets in 2013 and beyond.
Content Diversity – Why is it important?
›Customers have an ever-increasing choice of destinations to fly to. It is only logical that we keep pace and provide our customers with an ever-increasing range of hotels to complement their flights.
›Geographical diversity and reach of our content will be the key growth driver within the Online Accommodation space.
What are we doing about it?
› Increasing the range and diversity of our hotel stock is core to our strategy within the Online Accommodation space. We want to be able to offer our customers a one-stop-shop for their accommodation needs.
›From FY11 to FY12, our Accommodation Wholesaler business has seen a 20% increase in hotel inventory. In the same time period, our Accommodation OTA business has seen a 32% rise in hotels on offer.
›TUI Travel has a clear strategy of continuing to increase its hotel offering even further in the coming years with a strong focus on emerging markets.
Brands & Distribution – Why is it important?
›Online-driven – Increased online distribution improves our proportion of direct distribution, reduces reliance on third party distributors and reduces our distribution costs.
›Online-driven – The higher the proportion of direct distribution, the better we understand our customers and their needs. It provides us with tangible and useful information about customer preference. In that sense, online-driven also contributes to the success of our unique holidays. The more we understand our customer, the better and more tailored the products we can offer and directly market to them.
›Brands – Having multiple touch points with our customers enables us to build stronger brand and product loyalty whilst ensuring that customers come back to TUI Travel for another unique holiday experience. Strong brands also increase organic traffic to our websites which has a higher conversion rate.
What are we doing about it?
›TUI Travel is focusing on being an ‘online-driven’ business providing customers with an easy and inspiring online experience. We have widened the traditional definition of ‘online’ as a distribution channel to being ‘online-driven’ which encompasses the entire customer journey; dreaming, planning, booking, pre-departure, experiencing and sharing.
›Over the past year we have increased our online sales by three percentage points across the Mainstream Sector (from 30% in 2011 to 33% in 2012) and have clear strategic plans and targets in place to drive online sales further in all source markets.
›Our Specialist businesses leverage a strong brand portfolio offering everything from adventure holidays to sailing holidays and private jet tours. We are investing in our online platforms to enhance booking and search functionality and provide our customers with inspirational content to showcase our products.
Brands & Distribution – Why is it important?
›Brand awareness – To be the first place that customers turn to for their accommodation needs. Reduces online advertising spend and attracts customers directly to our websites.
›Distribution – Being an ‘online-only’ business it is critical that we provide our customers with an effective and easy-to-use search and booking experience.
What are we doing about it?
›Our Accommodation Wholesaler business is the market leader operating in over 100 countries with a global distribution presence. The current five year plan focuses on leveraging our existing distribution network, maintaining growth across Europe and expanding further into the Americas and Asia.
› In Accommodation OTA our focus is to build on our strong brand positioning of LateRooms.com in the UK and expand in the emerging markets through AsiaRooms.com across Asia and in Brazil with the recent acquisition of MalaPronta.com.
›Following the launch of five language sites, AsiaRooms.com launched a pan-regional brand development campaign to drive sales and increase brand awareness. The campaign, entitled ‘The Right Room for You’, focused on the uniqueness of each traveller and their travel preferences delivering good results. Traffic growth from Singapore and Malaysia grew over 49% and 132% respectively in 2012.
Content Brands&Distribution

www.tuitravelplc.com
TUI Travel PLC Annual Report & Accounts 2012 17Strategic overview
TT11 | AR 2012 | 20/12/2012 | Proof 5
Strategic overview
“Through our global brand portfolio and travel expertise we are focused on delivering leisure travel experiences designed for our customers’ ever changing needs.” Wehavetwostrongbusinessmodelsthatsharethesamestrategicdrivers.OurstrategydiffersdependinguponwhetherwearetalkingabouttheTourOperatororOnlineAccommodationmodel.Wehave,therefore,setoutbelowwhyourstrategicdriversareimportantforeachandwhatwearedoingaboutthemtoensurethelong-termgrowthofourbusiness.
Technology – Why is it important?
›Online-driven – Critical support structure for seamless front-end interaction with the customer.
›Robust finance and reservation systems to support business operations but also to provide reliable and actionable management information.
›Flexible technological platforms which can adapt to changing customer demands.
What are we doing about it?
›Within Mainstream, we are in the process of upgrading our web front-end reservation and finance systems across all source markets. These technology upgrades will provide our websites with new search functionalities, improved personalisation and richer content as well as enhanced mobile capability as our customers increasingly research and book their holidays on mobile devices.
›Our specialist businesses have made good progress in consolidating their finance and reservation systems to leverage our scale across multiple brands and continue on their journey of standardisation while balancing the varied requirements of the different holiday experiences they offer.
Technology – Why is it important?
›Online-driven – Provide market-leading technological platforms to support seamless front-end interaction with the customer.
›Robust finance and reservation systems support business operations but also provide reliable and actionable management information.
›Flexible technological platforms which can adapt to changing customer demands.
What are we doing about it?
›Both Accommodation Wholesaler and Accommodation OTA businesses are supported by effective and efficient IT platforms.
›Accommodation Wholesaler operational systems are being upgraded and updated in order to be able to continue improving its service delivery to global customers.
›In our Accommodation OTA business we have been investing in a new platform to support our growth strategy.
Growth & Scale – Why is it important?
›Growth – Consolidating our market-leading positions and seizing new growth opportunities will be the key driver of success going forward.
›Scale – Leveraging our scale and driving further cost efficiencies will provide added value to customers.
What are we doing about it?
›As Europe’s largest tour operator we are leveraging our scale across all source markets to consolidate our market-leading position and grow the number of customers travelling with us.
›Growth in new markets is an important area of focus for TUI Travel. Our Russian tour operator business has given us a position in this market and a platform for further growth.
›Our customers demand ‘value for money’ for their travel spend and we are constantly reviewing areas where we can optimise our operations and be as cost efficient as possible without compromising on customer experience.
Growth & Scale – Why is it important?
›Scale is a critical success factor for any online accommodation business.
›In a price-driven, lower-margin business it is imperative for us to achieve high volumes which can be leveraged to gain competitive advantage.
What are we doing about it?
›TUI Travel is a firm market leader in the Accommodation Wholesaler market. We have a clear strategy of consolidating our market-leading position even further by continuing to grow our existing destinations whilst accelerating our expansion into new markets with particular focus on Asia, Latin America and Africa.
›Within the Accommodation OTA space we are concentrating our growth strategy in attractive emerging markets which exhibit the highest growth potential in this segment. AsiaRooms is now an established and growing brand in the Asia-Pacific region. The acquisition of MalaPronta.com, Brazil’s fourth largest accommodation-only OTA, gives TUI Travel a foothold into the fast-growing and lucrative Latin American market.
›LateRooms is now ranked as the number two accommodation-only OTA in the UK market. We aim to continue delivering superior growth by developing new distribution channels and new customer segments in this market.
People – Why are they important?
›People are a key differentiator at TUI Travel. It is their unrivalled knowledge and expertise that is the driving force of our successful business.
›Our people are the face of our company. It is their ability to delight our customers which ensures high customer satisfaction scores and repeat bookings.
What are we doing about it?
› Investing in training and development of our people to ensure that they have the right skills and expertise to provide us with a competitive advantage.
›Making sure that we work closely with our people to drive high levels of pride and engagement within the Company.
›Our International Graduate Leadership Programme continues to attract high quality talent from across the world and is considered among the best in the industry.
›Bi-annual talent reviews ensure that we monitor the talent and capabilities within our organisation and have clear succession plans in place for business critical roles.
›Established ‘Centres of Excellence’ which enable best practice sharing across the Group and make sure that good ideas are not limited to one source market but flow through the entire organisation.
People – Why are they important?
›People are the key driver of any online business where agility, speed and innovation are essential elements of success.
›Talent retention and acquisition are increasingly gaining priority in a market characterised by rapid changes and high competition for top talent.
What are we doing about it?
›Building a strong brand proposition to attract and retain the best online talent.
›Identifying knowledge gaps within the organisation and providing colleagues with the necessary tools and skills to succeed in the online world.
›Developing an online-driven culture where employees are encouraged to keep abreast of latest trends whilst providing an environment which fosters new ideas and innovation.
›The international nature of our business necessitates that we look beyond European boundaries when it comes to sourcing talent. TUI Travel continues to tap into the vast talent pool of markets like Brazil and South East Asia to fuel its global growth ambitions.
Technology Growth&Scale People

www.tuitravelplc.com
18 TUI Travel PLC Annual Report & Accounts 2012
TT11 | AR 2012 | 20/12/2012 | Proof 5
Strategic overview
HowwemeasureitKey performance indicators (KPIs)
Financial
Product
Distribution
Operational efficiency
Online Accommodation growth
Responsible leadership
Strategy Target Performance Keyperformanceindicators
Our main strategic objective is to continue to improve the Group’s profitability and free cash flow and therefore deliver superior returns on investment. This improvement will allow us to invest further in the future of our business which will benefit our customers, colleagues and shareholders.
We target continuous improvement in Group ROIC and cash conversion of at least 70% of profit before tax.
To measure our financial progress we have two financial KPIs: (i) the return on invested capital (ROIC); and (ii) the conversion of underlying profit before tax to adjusted free cash flow.
ROIC has improved again this year by 0.9 percentage points to 12.2%. This increase was driven by an improvement in earnings during the year and a deterioration in the carrying value of net assets resulting from the increasing strength of Sterling.
We generated a cash conversion rate of 75% in 2012. As expected, this number has fallen from the prior year due to investments in capital expenditure to improve the underlying businesses. We continue to target a cash conversion rate of at least 70% going forward.
ROIC
2012 12.2% 201111.3% 20109.7%1
Cash conversion2
2012 75% 2011121% 2010116%1
1) 2010 re-presented for Jet4You and Magic Life predecessor accounting; 2010 profits based on pro forma unaudited underlying operating profit excluding the impact of volcanic ash
2) Free cash flow adjusted for net pre-delivery payments of £53m (2011: £34m)
Our unique holidays form the backbone of our Mainstream businesses and are exclusive to us. By increasing our unique holiday portfolio we can achieve earlier bookings, higher margins and superior customer satisfaction and retention rates. Due to our existing brand loyalty and experience in designing and operating new concepts it is very difficult for our competitors to replicate these holidays.
We are targeting a unique holiday mix of 76% as a proportion of total Mainstream Sector holidays over the next five years.
In the year, we increased the unique holidays mix by three percentage points across the Mainstream Sector as a whole. Within this, the Nordic region improved by five percentage points and the UK by four percentage points.
Unique holidays mix as a proportion of total Mainstream Sector holidays
2012 65% 201162% 201055%
By increasing the direct distribution of our holidays we lower distribution costs and can build on our customer relationships. As an online-driven business, we have a focus on the online booking experience. Increasing our direct distribution leads to better value for customers. Customer trends support a shift towards the online channel with social media and richer content all helping drive higher conversion rates.
We are targeting a direct distribution mix of 80% and an online distribution mix of 49% in our Mainstream Sector over the next five years.
To measure our progress, we have two distribution KPIs: (i) direct distribution mix; and (ii) online distribution mix.
Direct distribution mix improved by two percentage points over the year, with a strong performance by the UK which saw a five percentage point increase over the prior year. The improvement in direct distribution was driven by the online channel which also increased by three percentage points in 2012.
Direct distribution mix, as a proportion of total Mainstream Sector holidays.
2012 65% 201163% 201062%Online distribution mix, as a proportion of total Mainstream Sector holidays
2012 33% 201130% 201027%Our objective is to be as cost efficient as possible without compromising customer experience. Within Mainstream, we target overheads of less than 5% in each source market. We also continue to make cost savings in our other Sectors including centralisation of back-office functions where appropriate.
We are targeting a further £65m of business improvement opportunities over the next two to three years to be delivered in broadly even tranches.
We delivered £42m of operational efficiency savings through the business improvement programme in the last 12 months. This exceeded original guidance given at the start of the financial year. We made progress in a number of areas including the restructuring within the French and German markets as well as Jet4You.
Turnaround and cost savings delivered
2012 £42m
Our Online Accommodation business enjoys high-margin and growth characteristics. We currently have a leading global position in Accommodation Wholesaler and strong presence within the UK and Asian markets in Accommodation OTA. A combination of organic and acquisitive growth will be a key driver of profit growth in this business.
We are targeting an underlying operating profit growth of between 15% to 20% per annum over the next five years.
Accommodation Wholesaler continued to consolidate its global leadership position over the year with TTV growth of 13% to £1.4bn. In Accommodation OTA, we continued to invest in high-growth markets delivering TTV growth of 4% to £447m. This included AsiaRooms which delivered TTV growth of 25%.
Total Transaction Value in the Online Accommodation business
2012 £1.8bn an increase of 10% over the prior year
We are experiencing greater stakeholder interest in sustainability and believe that creating more sustainable holidays will help protect our product into the future and also support product differentiation, brand loyalty, customer satisfaction and competitive advantage.
We are targeting our airlines to reduce per passenger carbon emissions by 6% by 2013/14 (against a baseline of 2007/08). See Sustainable development section.
Four years ago TUI Travel airlines set a relative target to reduce carbon emissions by 6% by 2013/14, against a baseline of 2007/08. In 2011/12 TUI Travel airlines’ relative carbon emissions were 73g per revenue passenger kilometre (CO2/RPK), i.e. 6.3% less than 2007/08 therefore the six-year target has been achieved within four years.
Carbon efficiency, measured through TUI Travel airlines’ average carbon emissions per revenue passenger kilometre (CO2/RPK)*
2012 73.0g CO2/RPK 2011 75.9g CO2/RPK 2010 76.1g CO2/RPK 2009 78.1g CO2/RPK
* Achieved through operational efficiencies, fuel conservation activities and capacity amendments.

www.tuitravelplc.com
TUI Travel PLC Annual Report & Accounts 2012 19Strategic overview
TT11 | AR 2012 | 20/12/2012 | Proof 5
Strategic overview
Strategy Target Performance Keyperformanceindicators
Our main strategic objective is to continue to improve the Group’s profitability and free cash flow and therefore deliver superior returns on investment. This improvement will allow us to invest further in the future of our business which will benefit our customers, colleagues and shareholders.
We target continuous improvement in Group ROIC and cash conversion of at least 70% of profit before tax.
To measure our financial progress we have two financial KPIs: (i) the return on invested capital (ROIC); and (ii) the conversion of underlying profit before tax to adjusted free cash flow.
ROIC has improved again this year by 0.9 percentage points to 12.2%. This increase was driven by an improvement in earnings during the year and a deterioration in the carrying value of net assets resulting from the increasing strength of Sterling.
We generated a cash conversion rate of 75% in 2012. As expected, this number has fallen from the prior year due to investments in capital expenditure to improve the underlying businesses. We continue to target a cash conversion rate of at least 70% going forward.
ROIC
2012 12.2% 201111.3% 20109.7%1
Cash conversion2
2012 75% 2011121% 2010116%1
1) 2010 re-presented for Jet4You and Magic Life predecessor accounting; 2010 profits based on pro forma unaudited underlying operating profit excluding the impact of volcanic ash
2) Free cash flow adjusted for net pre-delivery payments of £53m (2011: £34m)
Our unique holidays form the backbone of our Mainstream businesses and are exclusive to us. By increasing our unique holiday portfolio we can achieve earlier bookings, higher margins and superior customer satisfaction and retention rates. Due to our existing brand loyalty and experience in designing and operating new concepts it is very difficult for our competitors to replicate these holidays.
We are targeting a unique holiday mix of 76% as a proportion of total Mainstream Sector holidays over the next five years.
In the year, we increased the unique holidays mix by three percentage points across the Mainstream Sector as a whole. Within this, the Nordic region improved by five percentage points and the UK by four percentage points.
Unique holidays mix as a proportion of total Mainstream Sector holidays
2012 65% 201162% 201055%
By increasing the direct distribution of our holidays we lower distribution costs and can build on our customer relationships. As an online-driven business, we have a focus on the online booking experience. Increasing our direct distribution leads to better value for customers. Customer trends support a shift towards the online channel with social media and richer content all helping drive higher conversion rates.
We are targeting a direct distribution mix of 80% and an online distribution mix of 49% in our Mainstream Sector over the next five years.
To measure our progress, we have two distribution KPIs: (i) direct distribution mix; and (ii) online distribution mix.
Direct distribution mix improved by two percentage points over the year, with a strong performance by the UK which saw a five percentage point increase over the prior year. The improvement in direct distribution was driven by the online channel which also increased by three percentage points in 2012.
Direct distribution mix, as a proportion of total Mainstream Sector holidays.
2012 65% 201163% 201062%Online distribution mix, as a proportion of total Mainstream Sector holidays
2012 33% 201130% 201027%Our objective is to be as cost efficient as possible without compromising customer experience. Within Mainstream, we target overheads of less than 5% in each source market. We also continue to make cost savings in our other Sectors including centralisation of back-office functions where appropriate.
We are targeting a further £65m of business improvement opportunities over the next two to three years to be delivered in broadly even tranches.
We delivered £42m of operational efficiency savings through the business improvement programme in the last 12 months. This exceeded original guidance given at the start of the financial year. We made progress in a number of areas including the restructuring within the French and German markets as well as Jet4You.
Turnaround and cost savings delivered
2012 £42m
Our Online Accommodation business enjoys high-margin and growth characteristics. We currently have a leading global position in Accommodation Wholesaler and strong presence within the UK and Asian markets in Accommodation OTA. A combination of organic and acquisitive growth will be a key driver of profit growth in this business.
We are targeting an underlying operating profit growth of between 15% to 20% per annum over the next five years.
Accommodation Wholesaler continued to consolidate its global leadership position over the year with TTV growth of 13% to £1.4bn. In Accommodation OTA, we continued to invest in high-growth markets delivering TTV growth of 4% to £447m. This included AsiaRooms which delivered TTV growth of 25%.
Total Transaction Value in the Online Accommodation business
2012 £1.8bn an increase of 10% over the prior year
We are experiencing greater stakeholder interest in sustainability and believe that creating more sustainable holidays will help protect our product into the future and also support product differentiation, brand loyalty, customer satisfaction and competitive advantage.
We are targeting our airlines to reduce per passenger carbon emissions by 6% by 2013/14 (against a baseline of 2007/08). See Sustainable development section.
Four years ago TUI Travel airlines set a relative target to reduce carbon emissions by 6% by 2013/14, against a baseline of 2007/08. In 2011/12 TUI Travel airlines’ relative carbon emissions were 73g per revenue passenger kilometre (CO2/RPK), i.e. 6.3% less than 2007/08 therefore the six-year target has been achieved within four years.
Carbon efficiency, measured through TUI Travel airlines’ average carbon emissions per revenue passenger kilometre (CO2/RPK)*
2012 73.0g CO2/RPK 2011 75.9g CO2/RPK 2010 76.1g CO2/RPK 2009 78.1g CO2/RPK
* Achieved through operational efficiencies, fuel conservation activities and capacity amendments.

www.tuitravelplc.com
20 TUI Travel PLC Annual Report & Accounts 2012
TT11 | AR 2012 | 20/12/2012 | Proof 5
Strategic overview
Whataretherisks?Principal risks
Operational Risk GovernanceWhilst ultimate responsibility for risk management rests with the Board, effective day-to-day management of risk rests within the business. Management is responsible for setting the right tone at the top and establishing a culture where employees are expected to be risk aware, control minded and to ‘do the right thing’.
GRMC: The GRMC is a committee of the Group Management Board (GMB) comprising the full membership of the GMB supported by key members of the risk & control community. It is chaired by the Chief Executive and meets four times a year. The GRMC oversees the risk management process operating throughout the Group and ensures that the most significant risks to the Group are identified, debated and managed appropriately. Individual members of the GRMC are accountable for specific risks on the Group Risk Profile. Risk & Control Summaries are presented which set out the key controls on which reliance is placed and further actions as necessary to achieve targeted risk level. These risks, controls and targets are reviewed and approved at the GRMC and then communicated top down to the wider business to ensure that risks are managed within these levels through the organisation. The Executive Directors in the GRMC feed back to the full Board the key risks under consideration for its formal review and approval.
Recognising the speed at which risks can materialise into issues (risk velocity) and the impact this can have on the Group, the GRMC has developed tailored response plans for each of the Group’s key risks. The GRMC also recognises the interaction of individual risks and the extent to which individual risks may be offset through natural hedging or amplified through specific risk combinations.
GroupCapabilityCommittee: The Capability Committee supports the risk governance process by assessing the Group’s current capability against its future needs in the achievement of its strategic objectives.
GroupInvestmentCommittee: The Investment Committee ensures that risk and reward is closely scrutinised prior to any acquisitions, capital expenditure and major investments.
GroupCross-ProjectReviewCommittee: The Committee oversees cross-Group projects and ensures that interdependencies and risks (both upside and downside) are understood fully and guidance provided, as appropriate.
shareholder value. Through this process a strategy is progressively developed and refined that best fits the business, its culture, capabilities and resource. The strategy, once fully defined and approved by the Board, is then incorporated into the Group’s five year plan.
RisksTOtheStrategy:Having determined the appropriate level of risk for the business, in relation to the potential for reward, the Board then ensures that risks to the delivery of the strategic objectives are identified, assessed and managed effectively.
While the Nomination Committee ensures an optimum balance of skills, knowledge and experience required within the executive management team to deliver the strategy, the Remuneration Committee ensures the appropriate incentivisation to drive high performance with commensurate control. Business performance relating to the achievement of strategic, operational and financial objectives is reviewed and monitored closely at Business Review Meetings chaired by the Chief Executive.
The Audit Committee, on behalf of the Board, seeks assurance that the risk management process is operating effectively throughout the organisation and that risks to the delivery of the strategy and long-term viability of the business are being managed effectively in line with the risk appetite and tolerance levels determined by the Board. The Audit Committee receives this assurance from the three lines of defence – Management, Group Oversight & Support Functions and Internal Audit (see the Audit Committee report in the Corporate Governance section).
• Management: The Audit Committee invites presentations from management on a routine basis to understand the key risks facing their businesses and how these are being addressed.
• GroupOversight&SupportFunctions: The Group Risk Management Committee (GRMC) and Group Risk function present on activities relating to risk management while the Group Compliance Functions present on activities relating to the establishment of control standards and adherence to them.
• InternalAudit: The Audit Committee receives assurance from Internal Audit over the processes and business transformation initiatives most critical to the Group’s continued success.
Risk GovernanceSuccessful risk management is critical to the long-term success of our business and a key area of management focus. We continue to strengthen our risk governance framework which enables us to understand more fully the threats and opportunities in the market place, to match these against the strengths and weaknesses of our Group and respond accordingly. Our risk management process, and the risk software supporting it, helps to drive clarity, consistency, transparency and accountability at every level of the organisation. It enables us to manage our risk exposures across the Group so that, at any given time, we are incurring the right level and the right type of risk to pursue effectively our strategic goals.
OurRiskGovernanceFrameworkOur Risk Governance Framework is set out on page 21 and summarises the various risk related roles, responsibilities and relationships throughout the Group.
Strategic Risk GovernanceRisksOFtheStrategy:The Board determines the strategic direction of the business and agrees the nature and extent of the risk it is prepared to take to achieve its strategic objectives.
Effective risk management is dependent on the capability and commitment of our people. The Nomination Committee ensures that an appropriate balance of skills, knowledge and experience exists in the Boardroom to understand and manage the risk environment at a strategic level, providing a culture whereby risks and assumptions are rigorously and freely challenged and debated.
To ensure that the strategic direction chosen by the business represents the best of the strategic options open to it, the Board is supported by the Group Strategy function. This exists to facilitate and inform the process of assessing the risk landscape and developing potential strategies to drive long-term shareholder value. On an annual basis it develops an in-depth fact base, in a consistent format which outlines the market attractiveness, competitive position and financial performance by Sector and source market. These are presented to the full Board by the Executive Directors and time set aside in April, July and September to allow full consideration and debate as to the level and type of risk that the Board finds appropriate in the pursuit of enhanced

www.tuitravelplc.com
TUI Travel PLC Annual Report & Accounts 2012 21Strategic overview
TT11 | AR 2012 | 20/12/2012 | Proof 5
Strategic overview
Board> Sets the tone at the top by determining the nature and extent of the significant
risks it is willing to take in achieving its strategic objectives> Participates actively in the ‘top-down’ identification, assessment and acceptance
of strategic or highly material (upside/downside) risk
Sub-Committeesa) Oversee the effectiveness of the internal control and risk management systems
across the organisationb) Ensure an appropriate balance of skills, knowledge and experience on the Board
to effectively manage the risk environment c) Ensure the appropriate incentivisation of the senior executive
Management> Sets the tone at the top by promoting a culture of risk awareness, control focus
and ‘doing the right thing’ within the business area> Identifies, assesses and manages risk and reports upwards> Self certifies mitigating controls and actions and reports upwards
Nominated Risk Champions> Support Sector and source market management by promoting and implementing
Group risk management policy and procedure within the relevant business areas > Co-ordinate the ‘bottom-up’ reporting process through collating risks identified and
assessed by management (along with associated mitigating controls and actions)
Group Functions> Identify opportunities to further mitigate common Group-wide risks and set required
control standards (proportionate to risk), communicate and educate management> Support management by promoting and implementing Group risk management
policy and procedure within the functional area> Participate in the ‘bottom-up’ reporting process through collating risks identified
and assessed within the function (along with associated mitigating controls and actions) and assist in the validation of risks reported by management
Group Risk & Control Functionsa) Develop and implement Group strategy for insurable risk, including placement
into the External Insurance market where economically appropriate and provide advice to subsidiary companies on all insurance related matters
b) Provide fact base and a range of strategic options for Board consideration and decision-making
c) Provide guidance, support and challenge to management in the development of an effective risk management process and act as a central point for co-ordinating, monitoring and reporting across the Group
d) Validate management controls and self certification and provide expert guidance on policy setting
Independent Assurance> Provides independent and objective assessment of the effectiveness of risk
management, operational controls and governance processes.> Provides guidance to management on risk and control through ad-hoc consulting
activities, as required
Group Management Board> Sets the tone at the top by the way it manages risk in the day-to-day management
of the organisation> Ensures the appropriate incentivisation of management in relation to risk and control
Sub-Committeesa) Ensure investment and major transactions align with the risk tolerances set
by the Boardb) Ensure an appropriate balance of skills, knowledge and experience is available
to the organisationc.1) Set the tone at the top by reinforcing the importance of risk management
throughout the organisationc.2) Actively participate in the identification, assessment and mitigation of risk
where these are significant to the organisationc.3) Ensure the risk management process applied within each business area
is appropriate and aligned to the activities undertaken within that aread) Monitor progress on key transformational projects to ensure in line with
reported milestones and key risks and issues are mitigated
Risk Governance Framework
ST
RAT
EGIC
GO
VER
NA
NC
EO
PER
ATIO
NA
L G
OV
ERN
AN
CE
1ST
LIN
E O
F D
EFEN
CE
2ND
LIN
E O
F D
EFEN
CE
3RD
LIN
E
OF
DEF
ENC
E
INDEPENDENT ASSURANCE
GROUP FUNCTIONS
a)Group
Insurance
a)GroupAuditServices
b)Group
Strategy
c)GroupRisk
d)Group
Compliance
a)Audit
Committee
b)NominationCommittee
c)Remuneration
Committee
BOARD
GROUP MANAGEMENT BOARD
a)Group
InvestmentCommittee
b)Group
CapabilityCommittee
c)GroupRisk
ManagementCommittee
d)CrossProject
ReviewCommittee
MANAGEMENT
a)Mainstream
b)Independent
c)EmergingMarkets

www.tuitravelplc.com
22 TUI Travel PLC Annual Report & Accounts 2012
TT11 | AR 2012 | 20/12/2012 | Proof 5
Strategic overview
Whataretherisks?continuedPrincipal risks
RiskDescriptions:The nature of the risk is articulated, including the possible causal factors that may give rise to the risk materialising. This allows the Sectors/source markets and the Group to assess the interaction of risks and the triggering events before developing appropriate mitigation strategies.
RiskAssessment: Risks are assessed in relation to potential impact and likelihood as measured against predefined financial and non-financial criteria relevant to the specific business area. The current (net) risk position which takes into account existing controls is then considered in relation to the risk appetite and tolerances determined by the GRMC, on behalf of the Board. Where the current risk position is considered too high, relative to the targets of the Group, management identify mitigating actions to achieve the target (planned) risk position.
Mitigating Controls: For the Principal Risks (reviewed and monitored by the GRMC) and the next layer of risks (reviewed and monitored at Sector/source market level) the controls on which reliance is placed are formally documented by management as required. These controls are articulated in detail (control type, control owner, control operators, control frequency) and are subject to independent validation by Internal Audit.
Risk Management ProcessThe Group Risk function supports the GRMC by providing guidance, support and challenge to management whilst acting as the central point for co-ordinating, monitoring and reporting on risk across the Group.
The Group Risk function applies a consistent risk methodology across all key areas of the business. This is underpinned by the new risk and control software implemented during the year which has reinforced clarity of language, visibility of risks, controls and actions and accountability of ownership.
RiskIdentification: On a quarterly basis line management closest to the risks identify the gross risks within their business area in the context of:
• longer-term strategic and emerging threats;
• medium-term challenges associated with business change programmes;
• shorter-term risks triggered by changes in the external and regulatory environment;
• shorter-term risks in relation to internal operations and control.
Mitigating Actions: Where mitigating actions are required these are also articulated in detail (action plan owner, action task owners, initial and revised delivery dates) and then tracked by the GRMC or Sector/source market.
ReviewandApproval: It is the responsibility of Sector Boards across the Group (and senior management teams beneath them) to review and agree the risk profile for their area of responsibility, including signing off on the effectiveness of controls and the progression of action plans within agreed delivery timescales.
The Group Risk function consolidates the Sector/source market risk registers and reports this ‘bottom-up’ to the GRMC for review alongside the Group’s key risks. New risks are added to the Group Risk Profile if deemed to be of a significant nature so that the ongoing status and the progression of key action plans can be managed in line with the Group’s targets and expectations.
Enhancing Risk Management CapabilitiesAs the Group’s risk management capabilities and governance framework continue to mature we will further develop and formalise our suite of key risk and control indicators so that the status of the Group’s risks can be managed within justifiable and tolerable levels.
Understandmarket
Adaptstrategy
Managechange
Control andmonitor
Internal
Leadershipand structure
Changemanagement
Resourceand skills
Technologychange
ProcesseffectivenessIntegration and
synergy delivery
Employeerelations
Economicenvironment
Naturalcatastrophes
Geopoliticalevents
Legal action/litigation
Fuel andFX hedging
Counterpartyrisk
Competition
Compliance
Taxation
Differentiatedproduct
Sustainabledevelopment
Controlleddistribution
Efficiencyimprovements
Technologyinnovation
Consumerbehaviour
Data security
Completenessand accuracy
CustomersatisfactionRecruitment
and retention
Healthand safety
Business interruption/reliability
Talentmanagement
Reportingand control
Budgetingand forecasting
Liquidity andcash management
External and regulatory
Internaloperations
Strategic and emerging
Businesschange
ChangingNew
StableKnown
External
TheEnterprise
Risk aide memoire

www.tuitravelplc.com
TUI Travel PLC Annual Report & Accounts 2012 23Strategic overview
TT11 | AR 2012 | 20/12/2012 | Proof 5
Strategic overview
Principal Risk Table
CONSUMER PREFERENCES & DESIRES
Strategic drivers
› Content
› Brands&Distribution
› Technology
› Growth&Scale
Context
Price, product and social media play a key part in the consumer’s decision-making process. Consumers are increasingly turning online to research and book holidays and are moving towards booking nearer the time of travel.
“Our direct distribution channels are central to the Group’s continued growth. We have room to expand these in all our markets which will lead to improved margins and better results. The core contribution of our direct distribution comes from online channels.”
“At present we consider ourselves to be an online-driven Group, however, we can do more. The online drive continues across the Group from front-end customer interaction at the time of booking to back office functions.”
Risk
We do not respond quickly enough to changes in consumer preferences and do not keep up with latest technological developments.
Potential impact
Our market positions come under pressure resulting in lower short to medium-term growth rates and reduced margins.
Group-wide
›Our strategy emphasises our vision of being ‘online-driven’ and ensures we focus on providing our customers with an easy and inspiring online experience. We continue to develop and enhance the nature and mix of our distribution channels including increasing our participation in social media according to the preference of our customers encompassing the entire customer journey from dreaming and planning, through to experiencing and sharing.
Tour Operator
›We have implemented a distribution strategy tailored to the specific customer preferences and market dynamics of each of our source markets. We remain focused on our strategy of controlled distribution through which we will enhance our customer access and reduce costs. Within our Mainstream business we are now leveraging our new structure to enhance the portfolio of unique and exclusive products which will increase our competitive advantage, command a premium margin and attract greater customer loyalty. Within our Specialist business we have developed a strong brand portfolio of tailor-made products and services and will continue to look for specialist innovative products and attractive markets that cater for changing customer needs and that will provide future growth.
›We are in the process of upgrading our web front-end reservation and finance systems across all source markets within our Mainstream Sector. These technology upgrades will provide our websites with new search functionalities, improved personalisation and richer content as well as enhanced mobile capability as our customers increasingly research and book their holidays on mobile devices. Our Specialist businesses have made good progress in consolidating their finance and reservation systems to leverage our scale across multiple brands and continue on their journey of standardisation while balancing the varied requirements of the different holiday experiences they offer.
Online Accommodation
›We have a wide and diverse range of hotel stock and our strategy focuses on increasing this further as we seek to provide our customers with a one-stop-shop for their accommodation needs.
›We seek to ensure that both our Accommodation Wholesaler and Accommodation OTA businesses are supported by effective and efficient IT platforms. Within the Accommodation Wholesaler business our operational systems are being upgraded and updated in order to continue improving service delivery to global customers and in the Accommodation OTA business we have been investing, and continue to invest, in a new platform to support our growth strategy.
Risk Nature and Current category extent of risk mitigation
STRATEGIC

TT11 | AR 2012 | 20/12/2012 | Proof 5
www.tuitravelplc.com
24 TUI Travel PLC Annual Report & Accounts 2012
Strategic overview
Whataretherisks?continuedPrincipal Risk Table continued
BUSINESS IMPROVEMENT OPPORTUNITIES
Strategic drivers
› Content
› Brands&Distribution
› Technology
› Growth&Scale
Context
The Group is heavily reliant on legacy systems, processes and structures which, in some cases, are outdated, complex and inefficient.
“We have been successful in implementing Group-wide cost efficiency and business improvement programmes as we have done over previous years. The total savings made this year of these activities equates to £42m. The drive for operational efficiency is Group-wide.”
“Technology is an integral part of the direction we are heading in and as such, in March 2012, we appointed Mittu Sridhara as the Group’s Chief Information Officer and member of the Group Management Board. The online drive continues across the Group from front-end customer interaction at the time of booking to back office functions.”
Risk
We do not address successfully the legacy inefficiencies and complexities of our existing infrastructure.
Potential Impact
We incur higher costs due to inefficiencies, impacting our ability to optimise business performance and provide a value added service to our consumers.
Group-wide
›We have progressed our ambition to strengthen our internal control environment through the rollout of the COSO control framework across the Group and we continue to implement business continuity management in our various businesses in order to build resilience into our operations.
›We continue to drive stronger and more cost-effective relationships with our key service providers through better co-ordination of key procurement activities across the Group, better targeting of prepayments as well as closer scrutiny of the financial standing of our key partners and their achievement of required standards of customer service, Health & Safety and sustainable development.
Tour Operator
›We have consolidated our tour operator businesses in French Mainstream to create a single business and have repositioned our French airline as a scheduled carrier specialising in long-haul through delivery of the Corsairfly transformation project. Our strategy within German Mainstream is progressing and starting to deliver growth through differentiated and exclusive products. Our focus now is to use our new Mainstream structure to leverage scale in order to grow and consolidate our leading position within Europe. We review continuously areas where the efficiency of our operations can be improved without compromising on customer experience.
›As mentioned under consumer preferences and desires we are in the process of upgrading our web front-end reservation and finance systems across all source markets with plans progressing well in our key source markets i.e. Germany and UK. This will deliver significant improvement in both the customer booking experience and back office process efficiencies and we continue to examine opportunities to further consolidate in our other source markets.
Online Accommodation
›Our scale is a key factor in driving our Online Accommodation business and in a price-driven environment with lower margins high volumes can be leveraged to gain competitive advantage. We are a firm leader in the Accommodation Wholesaler market and have a clear strategy of consolidating this position further by continuing to grow our existing destinations and accelerating our expansion into new markets. Within the Accommodation OTA market we are concentrating our growth strategy on attractive emerging markets which exhibit the highest growth potential in this segment.
›Our IT transformation programme in both the Accommodation Wholesaler and Accommodation OTA businesses looks to improve overall competitiveness and to facilitate the rapid integration of new brands whether acquired or organically developed.
Risk Nature and Current category extent of risk mitigation
STRATEGIC

TT11 | AR 2012 | 20/12/2012 | Proof 5
www.tuitravelplc.com
TUI Travel PLC Annual Report & Accounts 2012 25Strategicoverview
Strategic overview
Principal Risk Table continued
EMERGING MARKETS, ACqUISITIONS & INVESTMENTS
Strategic drivers
› Content
› Growth&Scale
GLOBAL FINANCIAL FACTORS
Strategic drivers
› Growth&Scale
Context
The cross-border nature of trading exposes our business to fluctuations in exchange rates and complex tax laws. In addition a significant proportion of operating expenses are in relation to aircraft fuel which is also subject to fluctuation. Pressure in the travel and tourism and banking sectors is set to continue due to the inherent risks within travel and tourism, the Eurozone debt crisis and the introduction of Basel III.
“Over the last 12 months, Eurozone countries have had to come to grips with austerity measures placed on them by national governments, some more severe than others. We continue to monitor the developments across the region and do not expect this to have a major impact on our business. The good relationships we have with our suppliers and the flexibility in our business model means we are well positioned to deal with any eventuality.”
“We have recorded our largest underlying profit figure to date, despite the Eurozone crisis which led to a negative foreign exchange translation. We reviewed and approved the Group’s overall taxation strategy during the year. This covered the key factors for the Group’s overall tax position and forecasts for the future tax charge and cash taxes and we remain satisfied with our funding and liquidity position and have three main sources of long-term debt funding.”
Risk
We do not manage adequately the volatility of exchange rates and fuel prices or other rising input costs; we face an increase in tax authorities taking a more strident tax approach in order to fund local fiscal deficits and we face difficulties in securing additional facilities, if needed and at a reasonable cost.
Potential Impact
We suffer increased costs which reduce demand resulting in lower revenue and/or margins. We face a negative impact on cash flow, lengthy tax litigation processes and possible reduction in Group’s after-tax earnings.
Group-wide
›We have a team dedicated to exploring and evaluating our strategic options and growth opportunities worldwide through desktop and local research.
Tour Operator
›We have established a significant presence in the fast-growing Russian and the CIS markets as part of our longer-term growth strategy and these businesses are now starting to reach critical mass. We have also launched small tour operating businesses in the Indian and Chinese markets.
Online Accommodation
›We are concentrating our growth strategy on attractive emerging markets which exhibit the highest growth potential in this segment. AsiaRooms is now an established and growing Accommodation OTA brand in the Asia-Pacific region and we are expanding further in to the Americas and Asia with our Accommodation Wholesaler business.
›We recently acquired MalaPronta.com, Brazil’s fourth largest accommodation-only OTA which has given us a foothold into the fast-growing and lucrative Latin American (LATAM) market. We are now concentrating on our expansion into other attractive emerging markets which exhibit high growth potential and are accelerating our expansion plans with particular focus on Asia, Latin America and Africa.
Group-wide
›Our policy is to ensure hedging cover for fuel and foreign currency is taken out ahead of source market customer booking profiles in order to provide certainty of input costs when planning pricing and capacity.
›We track closely the foreign exchange and fuel markets to ensure the most up-to-date market intelligence and we monitor continuously the appropriateness of our hedging policies.
›We have developed, and continue to maintain, high quality relationships with tax authorities and are in regular communication to keep them abreast of the commercial reality of our business operations. Where appropriate, we minimise uncertainty through recording of provisions to reflect potential tax exposures.
›We review our funding and liquidity position and continue to ensure our key facilities are refinanced well ahead of maturity. We have three main sources of debt funding; including external bank revolving syndicated credit facilities totalling £970m which mature in June 2015 and are used to manage the seasonality of the Group’s cash flows and liquidity, a £350m convertible bond (due October 2014) issued in October 2009, and a £400m convertible bond (due April 2017) issued in April 2010.
›We have developed, and continue to maintain, high quality relationships with the Group’s key financiers and monitor compliance actively with the covenants contained within our financing facilities.
OPERATIONAL
STRATEGIC continued
Risk Nature and Current category extent of risk mitigation
Context
The Group continues to look into new markets as the traditional Mainstream markets mature. Specialist businesses, accommodation online and the Emerging Markets represent a significant opportunity to participate in longer-term travel growth trends and have higher growth potential.
“During the year, we consolidated our existing businesses (in Russia and CIS source market) into a single brand (TUI) featuring all destinations, establishing a strong platform for the future. The sector now has close to 600,000 customers, up 15% on prior year.”
“We successfully entered the Brazilian market through the acquisition of MalaPronta.com in September 2012.”
Risk
We do not maximise opportunities to deliver results in Emerging Markets because we have limited experience in these markets and/or we have difficulty in integrating operations and systems.
Potential Impact
Our potential long-term growth rates and margins are impacted with cash flows lower than anticipated and significant absorption of resource.

TT11 | AR 2012 | 20/12/2012 | Proof 5
www.tuitravelplc.com
26 TUI Travel PLC Annual Report & Accounts 2012
Strategic overview
Whataretherisks?continuedPrincipal Risk Table continued
ECONOMIC ENVIRONMENT
Strategic drivers
› Content
› Distribution
› Growth&Scale
TALENT MANAGEMENT
Strategic drivers
› People
Context
Spending on travel and tourism is discretionary and price sensitive. The economic outlook remains uncertain with different source markets at different points in the recovery cycle. Consumers are also waiting longer to book their trips in order to assess their financial situation.
“Whilst the uncertain economic environment has had an effect on consumer travel spending habits, demand for leisure travel remains strong.”
“Overall, the Group has expanded its unique holidays portfolio (this is our differentiated and exclusive products combined) which books earlier and provides higher margins for our businesses.”
“We are able to take advantage of our scale and technological developments to offer our customers a wide variety of choice at very competitive prices. We have the market-leading position in Accommodation Wholesale and continue to invest in our own Accommodation Online Travel Agent (OTA) business.”
Risk
We do not respond successfully to changes in consumer demand and/or the consumer preference for late booking.
Potential Impact
Our short-term growth rates and margins are lower than anticipated.
Context
The Group’s success depends on its ability to retain key management and it relies on having good relations with its colleagues.
“Our results are reflective of our resilient and flexible business with the right strategy for the market and a large number of colleagues who care about our customers, who are passionate about our leisure travel experiences and can plan, implement and deliver growth.”
Risk
We are unable to attract and retain talent, build future leadership capability and maintain the commitment and trust of our employees.
Potential Impact
We do not maximise on our operating results and financial performance.
Group-wide
›We are working across our Mainstream Sector to ensure our unique holidays and distribution channels are aligned closely with the aspirations and preferences of our customers to drive more benign business conditions (see Consumer Preferences & Desires risk). We also ensure that we exploit the flexibility and resilience of our business model and the functionality of sophisticated capacity and yield management systems to the fullest extent. Through their active management we can ensure that capacity is aligned very closely to forecasts in order to protect margins and profit growth. Within our overall accommodation online business, the model involves minimum commitment or risk and operates extremely well in relation to the latest market.
Group-wide
›We assess continuously our current capability against that required to maximise current and future shareholder value.
›We have ensured succession plans are in place for all identified business critical roles, in particular emergency successors for all source market and Sector board roles, and these plans are reviewed every six months.
›Our succession planning for senior management appointments was reviewed during the year by the Nomination Committee, as was the broader issue of talent management across the Group.
›Our talent management priorities are overseen on an ongoing basis by the Capability Committee which assesses the strength of the talent pool relative to the needs of the business. It uses inputs from a number of sources such as the Group Risk Management Committee to inform those priorities and take the necessary action to deliver the balance of skills, knowledge and experience required to deliver the business strategy.
›We use our Group-wide leadership framework to develop and recruit all senior roles and to drive high levels of pride and engagement.
›This year we conducted competency testing, in conjunction with Korn Ferry, of our key finance management which enabled us to assess the adequacy of the skill-set of individual finance managers as well as the competency of the finance community within key businesses and across the Group as a whole. We also launched our Finance Academy to drive up levels of financial maturity within our various businesses which has been very well received by our employees.
›We continue to invest in international and tailored graduate programmes and more generally in the training and development of our people to ensure they have the right skills. This is further supported by the introduction of centres of excellence to enable the sharing of best practice so that skills are not limited to one source market.
›This year we refreshed the performance and talent management guidelines and have continued to drive high performance and engagement through our performance review, development plans and career planning process.
OPERATIONAL continued
Risk Nature and Current category extent of risk mitigation

www.tuitravelplc.com
TUI Travel PLC Annual Report & Accounts 2012 27Strategic overview
TT11 | AR 2012 | 20/12/2012 | Proof 5
Strategic overview
POLITICAL VOLATILITy, NATURAL CATASTROPHES AND OUTBREAKS
Strategic drivers
› Content
› Growth&Scale
Context
Providers of holiday and travel services are exposed to the inherent risk of domestic and/or international incidents affecting some of the countries/destinations within its operations.
“2012 has been a record year for our business. We are pleased to be reporting a 4% increase in underlying operating profit for the full year to £490m (2011: £471m). This is even more impressive against a backdrop of global economic uncertainty, political turmoil, weak consumer sentiment, the Eurozone crisis and natural catastrophes.”
Risk
We are not able to respond efficiently and effectively to large scale events.
Potential Impact
We suffer significant operational disruption in our source markets and destinations leading to significant losses (holiday cancellations, repatriation of customers) and a general decline in consumer demand and increase in our insurance premiums.
Group-wide
›Our business model is based on having a balanced destination mix to minimise concentration and having flexible supplier agreements in order to enable capacity to be switched as required.
›We have strong relationships with local tourism bodies, travel and aviation industry associations and monitor actively the political situation in volatile destinations and act upon security intelligence advice as it is received.
›We seek continuously to minimise the impact of any negative events in our source markets and destinations should they occur by ensuring the effective execution of our established incident management and emergency response plans and the deployment of our experienced leadership teams to support and repatriate stranded customers.
›We promote the benefits of travelling with a recognised and leading tour operator to increase consumer confidence throughout source markets.
REGULATORy ENVIRONMENT
Strategic drivers
› Content
› Growth&Scale
Context
Industries in which the Group operates are highly regulated, particularly in relation to consumer protection, aviation and the environment.
“As a global organisation, we feel the impact of government regulation in all of the markets in which we operate. Some of our activities, such as those undertaken by our airline, are heavily regulated. Our focus is always to work with governments to bring forward legislation that is fit for purpose, is no more burdensome on industry than it needs to be and does not discriminate between different business models.”
“Our Sustainable Holidays Plan is a major step forward for TUI Travel in our journey towards providing special travel experiences whilst minimising environmental impact, respecting the culture and people in destinations and bringing real economic benefit to local communities.”
Risk
We do not establish an effective system of internal control to ensure we operate in compliance with all legal and regulatory requirements.
Potential Impact
We suffer negative impact which damages our reputation and incurs higher costs.
Group-wide
›We continue to address issues affecting the industry and our customers through our skilled public affairs team who work closely with governments and regulators to ensure our position is communicated clearly and understood.
›We believe we have taken appropriate action and established appropriate monitoring controls to minimise the impact of the recent ruling by the European Court on delayed flights.
›We are committed to developing more sustainable holidays and to reducing the environmental impact at each stage of our customer’s journey. We have a dedicated sustainable development team who support the Group and work closely with business management (see our Sustainable Development section).
›We are focused on delivering our carbon management strategy through commitment to reducing TUI Travel’s airlines’ per revenue passenger carbon emissions by 6% by 2013/2014 (against a baseline of 2007/08 – see our Sustainable Development section).
›We have submitted TUI Travel’s annual 2011 airline data, which has been externally assured, to the relevant authorities in line with the EU Emission Trading Scheme (see our Sustainable Development section).
›Our decentralised structure for Health & Safety management enables our source markets to focus on specific risks in the context of their bespoke operating and legal environments while ensuring appropriate oversight at Group level.
›We have rolled out a comprehensive Anti-Bribery & Corruption training programme across the Group in order to raise awareness of the provisions of the Bribery Act 2010 with the intent of preventing bribery and corruption in the countries in which we operate. We monitor the adequacy and effectiveness of the procedures and measures established including legal compliance self certification twice a year by our businesses across the Group.
COMPLIANCE
OPERATIONAL continued
Risk Nature and Current category extent of risk mitigation
Principal Risk Table continued

www.tuitravelplc.com
28 TUI Travel PLC Annual Report & Accounts 2012
TT11 | AR 2012 | 20/12/2012 | Proof 5
Group Management Board (GMB)The strategic direction of the Group is set by the Group Management Board (GMB) in conjunction with the Board (see Board of Directors section). The GMB consists of tour operating, online accommodation and function experts from across the Group. This highly experienced, international team manages and executes TUI Travel’s day-to-day operations and is responsible for the overall performance of the Group. During the year and post year-end, there have been some changes to the composition of the GMB.
• Johan Lundgren was appointed Deputy Chief Executive with overall responsibility for the Mainstream Sector on 20 October 2011.
• Christian Clemens joined the GMB on 26 April and was appointed Managing Director, TUI Germany, in October 2012.
• David Burling joined the GMB in his capacity as Managing Director, TUI UK & Ireland, on 26 April 2012.
• Dr Volker Böttcher, was appointed as Managing Director of German Specialist Businesses following the restructuring of the Mainstream Sector on 26 April 2012.
• Mittu Sridhara joined the GMB when he was appointed Chief Information Officer on 25 June 2012.
• Bart Brackx, Managing Director, Western Europe, stepped down on 30 September 2012.
• John Wimbleton, Managing Director, Specialist & Activity, will leave the GMB on 31 December 2012.
Our peopleWe are in an industry where people are the key differentiator. We have 54,000 colleagues in 180 countries and they are the face of our organisation, working hard to make travel experiences special for our customers. This is why our values*: Customer Driven, Playing to Win, Responsible Leadership and Value Driven continue to be so important at TUI Travel. They act as cornerstones of our culture and support the future success of our business.* (for more information on ‘Our values’ see the How we do it:
Strategic framework section).
Investing in our leadersTo deliver our strategy, we must have the most capable leaders, both today and in the future, and we have many initiatives in place to support this. In 2011 we launched a new development programme, Global High Performance Leadership, for senior leaders who demonstrate potential for further success in a global environment. The programme was delivered in conjunction with the highly renowned International Institute for Management Development (IMD) in Switzerland and leadership consultancy Lane4. The modules are linked to our strategic objectives and have an immediate application in TUI Travel as they focus on real
Strategic overview
Our people
Our team (as at 3 December 2012)
1. 2.
3. 4.
6.
9. 10.
7. 8.
5.
1. Peter Long, Chief Executive
2. William Waggott, Chief Financial Officer
3. Johan Lundgren, Deputy Chief Executive
4. Dr Volker Böttcher, Managing Director, German Specialist Businesses
5. David Burling, Managing Director, TUI UK & Ireland
6. Mittu Sridhara, Chief Information Officer
7. Joan Vilà, Managing Director, Accommodation & Destinations
8. Christian Clemens, Managing Director, TUI Germany
9. Andrew John, Group Legal Director & Company Secretary
10. Jacky Simmonds, Group HR Director

www.tuitravelplc.com
TUI Travel PLC Annual Report & Accounts 2012 29Strategic overview
TT11 | AR 2012 | 20/12/2012 | Proof 5
Strategic overview
The Your Voice survey is an important way to measure whether we are meeting our people goals overall and it helps us ensure that we are continually driving improvements. It is also a tool that we use to benchmark ourselves against high performing organisations externally. The survey had a 69% response rate. Some highlights include respondents feeling high levels of pride* working for our organisation and strong results when it comes to our organisation being customer focused**.
Our people have great ideas and are the ones that understand our business the best. In addition to the global survey, we have a substantial number of employee representative forums in place to make sure we get input on matters that impact our business and colleagues. We do this both by consulting elected employee representatives and by liaising with our people in team meetings and open forums.
Valuing everyone’s contributionWith 54,000 colleagues in 180 countries we have a diverse workforce serving a varied customer base. We believe that having people from a range of different backgrounds and cultures is a significant advantage allowing us to truly understand our customers.
At TUI Travel, diversity means understanding that each individual in the organisation is unique and making the most of our people’s differences. Everyone’s contribution is valued and our people are treated fairly and with respect. We believe that all colleagues should have the same opportunities and no one should suffer discrimination on any basis. We give full and fair consideration to applications for employment from those who may be disabled and, wherever possible, continue to employ colleagues who have become disabled, ensuring they have equal access to development and career opportunities. We have guidelines in place, both globally and locally, to support these aspects of our culture.
Our most senior leadership group (236 leaders) illustrates the diverse nature of our organisation. They are based in 24 different countries, with over a quarter being female. If we look at our total workforce, 42% of managers are female. This year we have started taking part in a programme which focuses on mentoring, specifically for female talent, as part of our commitment to increase the number of women in senior roles within TUI Travel. * 79% of respondents feel proud to work for our
Company.
** 84% of respondents feel that we are customer focused and that we work hard to understand the needs of our customers.
graduates from the Netherlands, Italy, Poland, France, Russia, Great Britain, Bulgaria and Germany have joined us. In the UK, TUI Travel was voted as a Top 20 employer for graduate programmes and is ranked number three in the leisure and hospitality industry.
We have graduate schemes in both of our largest Mainstream source markets: Germany and the United Kingdom. Both took on graduates during the year, as did our Specialist & Activity Sector. Within some of our larger businesses our approach is to support young people in gaining valuable work experience by offering apprenticeships.
We continue to develop talent through our Finance Academy which has proved very successful. The course, open to all employees, has now trained over 300 members of finance teams across the Group from different countries and Sectors. The Finance Academy is working on developing more training content and courses that will help us perform finance roles more effectively.
People are now increasingly looking to social media to find out about TUI Travel, our brands, what it is like to work for our organisation and to search for vacancies. As a result, we are increasingly using social media for recruitment activities, with Facebook and LinkedIn being two key ways that we engage with potential future employees.
We are also developing an employer brand that will convey the essence of working for TUI Travel. This is an exciting opportunity for us to capitalise on the value of all of our brands and make sure that we integrate this promise between our company and our employees in everything that we do.
Engaging and involving our peopleThere is a clear link between our overall strategy and the role our people play. For us it is important that we engage everyone with our Company’s vision so they can see the impact that their contribution has on driving business performance. Engaged people are more productive and customer focused, they become advocates of our business and go above and beyond what is expected of them, which in turn creates a high performance work climate. For example, in the UK, we have an employee share incentive scheme which helps align our business targets with those of our people.
For the first time this year, everyone in our Group was invited to take part in one global opinion survey which was undertaken in over 30 countries and across 14 languages.
business initiatives. This year 14 people participated and we will continue to run the programme on an annual basis.
During the year we have also taken leaders to Thailand as part of our Global Responsible Development Programme which has been in place since 2008. The initiative is particularly important as it is aligned to our Sustainable Development agenda. The aim is for leaders to gain insight into their personal leadership styles, have greater cultural appreciation and work together with colleagues from other parts of the business. It is also an opportunity for those taking part to make a contribution to the local community in which we operate by providing business advice to make the community as self-sufficient as possible. The programme emphasises the importance of respect and diversity whilst developing communication and influencing skills in different cultures.
The Horizons programme is designed to develop global, future leaders. It focuses on developing both leadership and strategic business skills. Since its launch in 2008, over 200 people across the Group have been included and this year we had 30 managers take part in this successful development programme.
We have a TUI Travel leadership framework in place which is used for attraction, selection, development and performance management of all leaders. It provides a consistent approach to drive a high-performance culture whilst supporting development and career progression for our leaders. We have formed the Capability Committee as a Committee of the Group Management Board (GMB) and all members are directly involved in ensuring that we have the right capability and succession plans in place, now and in the future.
Attracting and developing talentWe pride ourselves on developing talent and offering career prospects in a dynamic and exciting industry. There are several ways that we can do this. In many cases we support our people in gaining professional qualifications relevant to their role and we also aim to provide opportunities to move between business areas and countries.
Creating a talent pipeline is crucial and we continue to invest in graduate recruitment both internationally and within individual Sectors and markets. Our International Graduate Leadership programme is open to outstanding university graduates from all over the world and provides unique opportunities for participants to build their skills and gain invaluable business experience. This year 13 international

www.tuitravelplc.com
30 TUI Travel PLC Annual Report & Accounts 2012
TT11 | AR 2012 | 20/12/2012 | Proof 5
Strategic overview
Health & Safety
The Group H&S induction programme ‘Safety in Your Workplace’ continues to provide employees with the relevant H&S knowledge for their workplace.
Within the UK, any relevant injuries, diseases or dangerous occurrences are reported under the Reporting of Injuries, Diseases and Dangerous Occurrences Regulations (RIDDOR). The incident statistics for the UK for 2011/12 are given below.
Local and national authorities continue to visit various Group premises offering advice and highlighting relevant issues. No enforcement notices or convictions have occurred within the 2011/12 financial year.
Customer safetyEach of the Sectors has responsibility for ensuring that sound H&S practices and robust safety management systems are embedded within their businesses.
In Mainstream, the UK & Ireland business has outsourced certain aspects of its H&S activities to a specialist external third party provider. The third party provider is instructed and monitored by a UK-based team which sets the H&S strategy, agrees the audit schedule and takes responsibility for the development and implementation of the UK & Ireland Mainstream safety management system.
The specialist third party provider undertakes audits of overseas accommodation, transport and excursion suppliers, utilising a mix of physical visits and self-assessments. Where high-risk areas are identified, specialist intervention may be commissioned such as, for example, the deployment of specialist food, water or hygiene consultants.
H&S is a standing agenda item at the monthly UK & Ireland Board meetings. The Distribution & Customer Director reports directly to the UK & Ireland Board in respect of H&S and is responsible for implementing all necessary actions on its behalf.
Health & SafetyThe Group attaches great importance to the Health & Safety (H&S) of its customers and employees at all levels of the business. Andrew John, the Group Legal Director & Company Secretary continues to be the Group Management Board (GMB) member with responsibility for reporting to the GMB on H&S matters.
TUI Travel has decentralised responsibility for H&S management, enabling Sectors to focus on their specific risks in the context of their bespoke operating and legal environments.
Sectors, and the divisions and businesses within them, continue to liaise, co-operate and share best practice with the overall direction found in the TUI Travel H&S Policy Statement issued and signed by the Chief Executive, Peter Long.
In August 2012, a H&S checklist was sent to all businesses across the Group by the Group Legal & Regulatory Compliance function. This was done to assess the consistency of base-level H&S controls in place around the Group and the results are currently being analysed.
Employee safetyAs the Group continues to expand into new areas, the nature of hazards faced by employees changes. The likelihood and impact of these hazards needs to be continually assessed and mitigating measures put in place where appropriate. Hazards range from relatively low-risk office to the higher-risk airline engineering environments.
A programme of workplace risk assessment continues to be undertaken, highlighting any areas of concern. Where significant risk exists, the assessments are used to understand better the various hazards involved and identify and implement appropriate mitigating measures. Safety management systems continue to be developed and improved by individual businesses with assistance from the relevant Sector and divisional H&S professionals.
UK incident data October 2011 to September 2012 Crawley Airline UK & and otherUK incident category Airline equivalent1 Ireland businesses Total
Number of incidents 525 54 20 599
Number of RIDDOR over-three-day incidents2, 3 13 28 4 0 45
Number of RIDDOR major incidents 2 7 2 0 11
Number of RIDDOR fatalities 0 0 0 0 0
1 Where an incident occurs outside of the UK it is not reportable under the RIDDOR legislation but, within the Group, incidents are reported as a ‘RIDDOR equivalent’.
2 Where, due to an accident at work, an employee is unable to perform their normal work duties for more than three consecutive days (not including the day of the accident).
3 As of 6 April 2012, RIDDOR’s over-three-day injury reporting requirement has changed. The trigger point has increased from over three days’ to over seven days’ incapacitation (not including the day of the accident).

Strategic overview
www.tuitravelplc.com
TUI Travel PLC Annual Report & Accounts 2012 31Strategic overview
TT11 | AR 2012 | 20/12/2012 | Proof 5
Each business within SAS is ‘risk profiled’ and appropriate safety management systems devised and implemented according to the risks identified within each business. The profile of each business is amalgamated into a Divisional Risk Summary – the results of which are presented to the SAS Board on a regular basis.
Additionally, the number of businesses complying with safety management system requirements set by external accreditation bodies, such as the School Travel Forum (STF), the Council for Learning Outside the Classroom (CLoTC), British Activity Providers Association (BAPA) and British Standard for Adventurous Activities outside the UK (BS8848), continues to grow. Late 2012 saw the launch of the SAS internal ‘kite mark’ and accreditation logo which will be awarded to businesses demonstrating the highest levels of compliance with SAS Safety Management System standards.
In the Accommodation & Destinations Sector, H&S is managed by each individual division and business. Hotelbeds actively pursues the collection of H&S data on hotels by means of the ‘Sure2Care’ due diligence system.
Intercruises has a dedicated H&S manager who is responsible for the implementation and development of the Intercruises’ safety management system. The operations of suppliers of services which are part of the core Intercruises business (for example accommodation, transport and excursions) are assessed by physical inspections and, in the case of accommodation, by means of the ‘Sure2Care’ in-house due diligence system.
TUI Germany’s Mainstream Sector has a dedicated H&S Team which is responsible for all matters of H&S together with the development and implementation of standards to ensure the wellbeing of all customers. Regular checks of all relevant areas are continuously monitored and reviewed to identify risk areas. The focus over the last year included pool safety and the H&S management participated in a major project to minimise the risk of suction entrapment in pools with the DRV (German Travel Association).
In TUI Nordic, H&S activities for mainstream businesses (Sweden, Norway, Denmark and Finland) are co-ordinated through the Crisis Management & Sustainability Business Development team. This team is responsible for setting H&S strategy, undertaking audits and for the operation and development of the TUI Nordic safety management system.
Specially-trained employees in TUI Nordic undertake audits of overseas accommodation, excursion suppliers, hygiene standards, sustainability status and transport (except air carriers and cruise liners). These are completed through physical visits/revisits and self-assessments. When high risks are identified, specialist intervention may be commissioned to safeguard high and safe standards of food, water and hygiene for TUI Nordic clients. The Crisis & Sustainable Development Manager reports directly to the Director of Product, Content & Aviation and any issues can be raised during weekly meetings.
The Specialist & Activity Sector (SAS) operates a Sector-specific H&S function. The Sector’s H&S team comprises 16 staff based in the UK and overseas for all seven SAS divisions. Audits of suppliers are undertaken utilising a mix of physical inspections and the use of supplier self-assessments by means of ‘Sure2Care’ – the in-house web-based due diligence system. The SAS H&S function was internally audited by Group Audit Services in August 2012. All key H&S controls were found to be in place and documented.

www.tuitravelplc.com
32 TUI Travel PLC Annual Report & Accounts 2012
TT11 | AR 2012 | 20/12/2012 | Proof 5
Sustainable Holidays PlanOur new Sustainable Holidays Plan 2012-14 marks the next step in our journey towards a more sustainable future.
It shows significant integration of environmental and social principles into the way we do business – performance measures, processes and the customer proposition. It sets out four ambitious goals underpinned by 20 commitments in our priority areas – taking care in destinations, reducing carbon emissions and engaging our colleagues and customers in sustainability.
These goals will be hard to achieve but this plan already has the support of many of our internal and external stakeholders who are key to its success. We will build these partnerships as the plan progresses, working with colleagues, customers, partners, suppliers, governments, trade associations, NGOs, academics and other stakeholders to achieve the goals and commitments we share.
Travel and tourism is one of the world’s largest industries. The growth and employment it creates makes it of critical importance to the global economy. However, from a sustainable development perspective, the industry’s high dependency on fossil fuel and biodiversity poses a challenge, one which our businesses have been addressing for over a decade. Our vision is to make travel experiences special whilst minimising environmental impact, respecting culture and people and bringing economic benefits to communities.
In 2011/12 we were pleased that our performance was recognised as follows:
• For the fifth consecutive year TUI Travel was featured in the Carbon Disclosure Leadership Index and was ranked in the top 10% of the FTSE 350 for our approach to carbon disclosure and governance (www.cdproject.net).
• We continue to be listed on the FTSE4Good Index in recognition of meeting strict social, environmental and governance standards.
• We were featured in the 2012 SAM Sustainability Year Book which highlights the best performing 15% of companies who submit data to the Dow Jones Sustainability Index in each industry sector. TUI Travel also received a Silver Class distinction and Sector Mover status for its achievements (www.sam-group.com/yearbook).
For further details on awards and our latest Sustainable Development Report, see www.tuitravelplc.com/sustainability.
Managing sustainable developmentCommitment at the most senior level is vital for us to achieve our goal of leading the leisure travel sector in sustainable development. Johan Lundgren, Deputy Chief Executive Officer, is responsible for reporting on sustainable development to the TUI Travel PLC Board and Jacky Simmonds, Group HR Director, is responsible for reporting on sustainable development to the Group Management Board. Jane Ashton is the Director of Group Sustainable Development and the Group Management Board acts as the Steering Committee, setting the strategic direction and long-term objectives for sustainable development.
The Group Sustainable Development Department’s role is to drive change towards a more sustainable business and to forge Sector leadership. Our Group-wide work streams meet regularly to tackle issues and develop programmes of work. Each Sector within the Group has a sustainable development co-ordinator or team with a remit to develop and implement sustainable development strategy, supported by a network of champions.
To review performance and to measure progress, we have incorporated sustainable development questions into regular colleague surveys at Sector and Group level and we conduct an annual sustainability evaluation of TUI Travel tour operating businesses, as well as specific surveys of airlines, hotels and water transport operations.
Strategic overview
Sustainable development
Carbon
Goal by 2015: We will operate Europe’s most fuel-efficient airlines and save more than 20,000 tonnes of carbon from our ground operations.
Destinations
Goal by 2015: We will deliver 10 million ‘greener and fairer’ holidays.
Colleagues
Goal by 2015: Our colleagues will rate TUI Travel as a leader in sustainability.
Customers
Goal by 2015: Customers will regard TUI Travel as a leader in delivering more sustainable holidays.
For further details on our Sustainable Holidays Plan including our 20 commitments, see www.tuitravelplc.com/sustainability
Our three-year Sustainable Holidays Plan
Viewpoint
Stephanie Draper, Director of System Innovation at Forum for the Future, comments: ‘’This plan recognises the need to combine external engagement with internal performance… This approach shows the increasing maturity of TUI Travel’s sustainability journey – differentiating themselves through sustainability in tricky times and starting to shape the market for a better future.’’
www.forumforthefuture.org
EU Air Traffic Project
TUIfly is a strategic partner in the EU’s SESAR (Single European Skies) project – an ambitious initiative to reform the architecture and efficiency of European air traffic management. The goal of SESAR is to enable a 10% reduction in the environmental impact of European aviation by 2020.

www.tuitravelplc.com
TUI Travel PLC Annual Report & Accounts 2012 33Strategic overview
TT11 | AR 2012 | 20/12/2012 | Proof 5
Strategic overview
* Carbon efficiency, measured through TUI Travel airlines’ average carbon emissions per revenue passenger kilometre (CO2/RPK).
** Carbon footprint covers Scope 1 (direct emissions) and Scope 2 & 3 (indirect emissions). This data has been third party verified by Arqum, an independent environment consultancy based in Germany.
We have developed collaborative partnerships with many stakeholders whose insight and guidance continue to help us develop our position on aviation and climate change. Examples include: Carbon Disclosure Project, Sustainable Aviation Fuel Users Group (SAFUG), Sustainable Aviation, Forum for the Future in the UK, Aviation Initiative for Renewable Energy in Germany (aireg) and Platform Sustainable Aviation in the Netherlands.
TUI Travel airlines carbon efficiency in 2011/12 (measured by CO2 per RPK)*
Arkefly 75.2gCorsair international 90.8gJetairfly 75.2gThomson Airways 70.6gTUIfly 66.5gTUIfly Nordic 65.4gTUI Travel airlines (average) 73.0g
CarbonTravel and tourism is responsible for around 5% of global CO2 emissions (UNEP, 2011). Climate change impacts the attractiveness, weather and comfort of our holiday destinations which are critical factors in the quality of the holiday experiences we deliver.
In 2011/12 TUI Travel airlines’ total carbon emissions were 5,248,262 tonnes. As a leading tour operator, our challenge is to prepare for a low carbon future by further reducing our environmental impacts and helping those in our value chain do the same.
We are embedding carbon management into our key business practices to limit our contribution to climate change both now and in the future, to drive cost efficiency and to be well prepared for associated regulatory proposals.
Goal by 2015: We will operate Europe’s most fuel-efficient airlines and save more than 20,000 tonnes of carbon from our ground operations.
We will measure this through TUI Travel airlines’ average carbon emissions per revenue passenger kilometre (CO2/RPK)* and CO2 saved from our major premises, retail outlets, brochure paper production, differentiated hotels and fleets of vehicles (against 2011 baseline).
Key achievements in 2011/12 include:
• CO2 per revenue passenger kilometre (RPK)* across TUI Travel airlines in 2011/12 of 73.0g (an improvement of 6.3% since 2007/08) – making us one of the most efficient airlines in Europe and beyond.
• 89% of our aircraft are now fitted with fuel-saving winglets, reducing fuel burn by up to 5%.
• A third of our modern coach fleet in Spain has been fitted with the latest EURO V engine technology to further improve fuel efficiency, reducing fuel burn by 8%.
• Our Mainstream German, Austrian and Swiss businesses have partnered with myclimate to offset the carbon emissions from all customer rental cars from Summer 2013.
• Intercruises Shoreside & Port Services achieved the ISO 14001 environmental management standard for their head offices in Barcelona.
• Quark Expeditions has offset the emissions of the Ocean Diamond, its newest ship, thereby offering the first carbon neutral voyage in polar travel history.
• The Moorings achieved the Sailors of the Sea Clean Regattas certification for its 31st Interline Regatta held annually in the British Virgin Islands recognising its commitment to responsible sailing.
• Carbon emissions have been reduced by 7.7% year-on-year across the TUI UK & Ireland retail estate.
90.5%
4.1%
0.7%
0.6%
3.6%
0.5%
TUI Travel airlines and aviation
Water transport
Ground transport
Major premises
Differentiated hotels
Other (indirect emissions including business travel by air)
Breakdown of TUI Travel’s carbon footprint in 2011/12**
Stakeholder engagement in destinations
As an industry we need to understand the socio-economic impacts of tourism better. In 2011/12 we worked with Sustainable Travel International and Oxford University to understand the long-term sustainability issues in three destinations key to TUI Travel (Turkey, Cape Verde and Tunisia). Destination stakeholder workshops took place and we are now planning and implementing our operational response.
TUIfly most fuel-efficient charter airline
TUIfly was ranked the most fuel-efficient charter airline worldwide for short-haul and long-haul flights in the 2012 Airline Index published by the German environmental NGO, atmosfair, indicating how TUIfly’s investment in modern, more fuel-efficient aircraft and focus on efficient aeronautical procedures are yielding results. Thomson Airways came second for most efficient charter airline for short haul flights.

www.tuitravelplc.com
34 TUI Travel PLC Annual Report & Accounts 2012
TT11 | AR 2012 | 20/12/2012 | Proof 5
Strategic overview
Sustainable development continued
• Investment in clean energy and energy efficiency projects in key destinations are set to deliver 1 million tonnes of CO2 savings by 2014. We have exclusively funded two wind farms in Turkey which bring renewable energy to coastal communities.
• TUI Deutschland partnered with the German Government Development agency GIZ to support a major project in Tunisia which focuses on training hotel managers and hotel schools and promoting tourism employment opportunities for women.
• We are a key partner in the Travel Foundation’s Taste of Fethiye project in Turkey – working with farmers’ cooperatives to increase the amount of local produce supplied to our hotels.
• We continue to work with the Travel Foundation and Overseas Development Institute on research and pilot projects to understand and improve the socio-economic impact of our unique hotels.
• As part of our measures to protect biodiversity, we support sea turtle projects in Turkey, Greece and Mexico. For example, we are working with Karisma Hotels to help conserve sea turtles along the Riviera Maya.
We are conscious of the pressures that tourism can place on local populations and resources and therefore work collaboratively with communities, governments and a range of other partners to support sustainable management of destinations. Examples include: The Tour Operators Initiative, Global Sustainable Tourism Council, Sustainable Travel International, Dutch Association of Travel Agents & Tour Operators, Deutscher ReiseVerband, GIZ, Association of British Travel Agents, The Overseas Development Institute, The Travel Foundation and Born Free.
ColleaguesColleagues tell us our commitment to sustainability is important and it helps us attract new talent. We want to make sustainable development a real priority for each and every colleague within our business.
We communicate regularly about the progress we are making on securing a sustainable future for our industry. We build sustainability into induction and training programmes, including development programmes for managers. Our core value of Responsible Leadership is being built into behaviour and performance measurements.
Goal by 2015: Our colleagues will rate TUI Travel as a leader in sustainability.
We will measure this through the Leadership Voice Survey and Your Voice global opinion survey results – aiming to meet high performing scores for responsibility towards the environment and community.
DestinationsTUI Travel has a global supply chain. The businesses that supply us have a significant role in managing our impact on the local community, economy and environment. We are already helping many of them save money through eco-efficiencies which ultimately give customers better value for money. Our challenge is to extend our influence to all suppliers and to monitor their progress.
We do not believe sustainability has to mean giving up on luxuries and we are building our business around the idea of unique hotels and holiday experiences. We are prioritising bringing more hotels into credible sustainability certifications and environmental management systems to ensure they embark on a journey of continuous improvement.
We want our holidays to benefit local livelihoods and protect the environment to maintain the quality, viability and desirability of our products for years to come. We are involved in hundreds of projects that support communities and reduce environmental impacts. Our projects cover the following areas: carbon reduction, supporting communities, saving water, reducing waste, protecting biodiversity, animal welfare, protecting children and investing in training.
Goal by 2015: We will deliver 10 million ‘greener and fairer’ holidays.
We will measure this by the number of customers we take to hotels with credible sustainability certifications from 2012 to 2014, e.g. sustainability certifications working with the Global Sustainable Tourism Council such as Travelife and international environmental management standards such as ISO 14001 and EMAS.
Key achievements in 2011/12 include:
• We featured over 850 hotels with sustainability certifications at the end of September 2012.
• Over 1.5 million customers stayed in hotels which had sustainability certifications at the end of September 2012.
• 29% of our unique hotels had an environmental management standard such as ISO 14001 or EMAS.
• We organised sustainability supplier conferences in Germany, Rhodes, Turkey and the Caribbean islands of Bonaire, Curacao and Aruba.
• Environmental consultancy projects were initiated with 60 of TUI UK & Ireland’s hotels and 43 of TUI Nordic’s Blue Star hotels to achieve best practice sustainability standards.
• We are actively working to develop international animal welfare industry best practice guidance with the Association of British Travel Agents (ABTA).
Lanzarote leading the way
Lanzarote is leading the way in sustainable tourism according to the Global Sustainable Tourism Council’s (GSTC) destination criteria, designed to improve the sustainable management of tourist destinations. Hotelbeds in Lanzarote is also playing its part by developing a unique hop on/hop off coach excursion running on sustainable biofuel which brings local economic benefits to many communities.
Fair Trade Tourism holiday package
TUI Nederland is the first major travel company in the Netherlands to develop a Fair Trade Tourism holiday package. All accommodations and activities during this holiday are Fair Trade Tourism certified by Fair Trade in Tourism South Africa (FTTSA). This means fair wages and good working conditions for owners and employees.

Strategic overview
www.tuitravelplc.com
TUI Travel PLC Annual Report & Accounts 2012 35Strategic overview
TT11 | AR 2012 | 20/12/2012 | Proof 5
Goal by 2015: Customers will regard TUI Travel as a leader in delivering more sustainable holidays.
We will measure this by our performance in consumer research in our key source markets.
Key achievements in 2011/12 include:
• Sawadee won the 2011 Green Feather sustainable tourism award for their water and plastic saving initiatives involving customers.
• Businesses within the Specialist & Activity Sector are leading the way by developing brochure apps for customers and reducing printed materials.
• TUI Nordic’s 5+5 programme gives customers the opportunity to donate 5 Swedish Krona which we then match and invest into carbon and water projects via Plan Vivo and Water Aid. To date over €1.5m has been raised.
• We are developing an online platform called Spreading Smiles to bring our sustainability initiatives to life, engaging customers and colleagues through real-life stories on the ground.
• An estimated 250,000 children were engaged in sustainable tourism through the UK schools’ Eco-traveller education programme in 2011/12. The programme, developed in collaboration with the National Schools Partnership, teaches children how they could make a difference on holiday (www.thomson.co.uk/blog/2012/06/ holidays-forever-tui-eco-travellers/).
Charitable giving In the last year, our businesses supported many source market and destination charities. Key achievements in 2011/12 include:
• TUI Travel is the biggest corporate funder of the Travel Foundation, a charity which helps the travel industry understand, manage and take effective action on sustainable tourism. Since 2004 we have raised more than £3.3 million (www.thetravelfoundation.org.uk).
• We are the largest corporate sponsor of the Family Holiday Association (FHA), a charity that provides holidays to disadvantaged children and their families. Since 2009 we have raised more than £1.5 million (www.fhaonline.org.uk).
• Street Child World Cup has been selected as the Specialist & Activity Sector’s chosen charity, with a target to raise over £400,000 by 2014. The charity helps vulnerable children living on the streets around the world. Colleagues have been involved in raising funds through various challenges and a charity ball (www.streetchildworldcup.org).
Key achievements in 2011/12 include:
• Organisation of sustainability awareness-raising initiatives at head offices and overseas. For example TUI Deutschland organised a Green Day for their 1,800 colleagues in Hanover themed ‘Treasures of the Earth’ and TUI UK & Ireland’s colleagues and customers supported the Travel Foundation’s ‘Make Holidays Greener’ month in June.
• Community volunteering programmes are developing across the Group with great feedback from colleagues and communities. For example, 150 Accommodation & Destination colleagues in Palma de Mallorca volunteered as part of their charity rock concert event, supporting Caritas Mallorca and attracting over 4,500 people.
• TUI Nederland’s green loyalty programme for travel agencies (based on the sales of green accommodation) raised over €53,000 for biodiversity and social projects.
• TUI Travel was the lead sponsor of the Taking Responsibility for Tourism conference held at South Africa House, London in June 2012. The conference reflected on progress since 2002 and declared priorities for responsible tourism over the next 10 years, with TUI Travel Directors taking part in panel discussions.
We have developed a number of core questions relating to Responsible Leadership and Sustainable Development that businesses and Sectors include in colleague opinion surveys. Our 2012 Your Voice Survey for all colleagues confirmed that:
• 74% agree that our Company acts responsibly on environmental matters.
• 68% agree that our Company is socially responsible (it brings benefits to the communities in which it operates).
We also gather feedback from colleagues on sustainability issues through focus groups.
CustomersTo help achieve many of our goals we need our customers’ support, through the purchases they make and the personal actions they take. Our research shows that customers value our approach to the environment and communities – we are working to increase their awareness in this respect and to promote and increase demand for responsible holiday choices.
We are encouraging holidaymakers to engage in sustainable tourism through our kids’ club activities, school education initiatives, customer donation schemes and sustainable tourism campaigns.
Green Ideas Factory
In 2012 we launched the Green Ideas Factory competition giving colleagues the chance to get creative about sustainability and submit their ideas on how we can be more ‘green’ whilst improving our business. 120 ideas came in from 18 countries with nearly 1,500 colleagues voting for their favourite concepts. 10 finalists developed their ideas with the help of mentors from TUI Travel and Forum for the Future, a sustainable development think tank. One of the competition winning ideas focused on replacing airside cars with electric vehicles at airports (Jetairfly).
Sustainable tourism food project
The Taste of Fethiye project in Turkey creates linkages between tourist hotels and local farmers. The project is run by the Travel Foundation and supported by TUI UK & Ireland and other industry partners. In its first season of production more than 570 tonnes of high quality, competitively priced and sustainably produced fresh fruit and vegetables were produced by 22 Taste of Fethiye farmers across five villages.

www.tuitravelplc.com
36 TUI Travel PLC Annual Report & Accounts 2012
TT11 | AR 2012 | 20/12/2012 | Proof 5
This was driven by strong performances in the UK, Nordic region, Belgium, and Canada as well as the delivery of £42m cost savings through the business improvement programme. However, these positive results were partially offset by the retranslation of fourth quarter Eurozone profits into Sterling, the inclusion of Magic Life winter losses, investment in Accommodation OTA and Corsair weakness.
A reconciliation of underlying operating profit to statutory operating profit is as follows:
2012 2011Year ended 30 September £m £m
Underlying operating profit 490 471Separately disclosed items (92) (74)Predecessor accounting for Magic Life – (17)Acquisition related expenses (62) (82)Impairment of goodwill (20) (39)Impairment of available for sale financial asset (10) –Interest and taxation on results of joint ventures and associates (5) (4)
Statutory operating profit 301 255
Group revenue declined by 2% from the prior year at £14,460m (2011: £14,687m). This result was driven by organic growth of 2% and a foreign currency translation impact of -4%. Organic revenue growth was driven by higher volumes and average selling prices in many source markets.
The main drivers of the year-on-year improvement in underlying operating profit are:
£m
2011 underlying operating profit 471Magic Life winter losses (17)
2011 underlying operating profit (incl Magic Life winter losses) 454
Trading 54Flooding in Thailand – Nordics (13)Investment in Accommodation OTA (11)Business improvement 42
2012 underlying operating profit at constant currency 526FX translation (36)
2012 underlying operating profit 490
Underlying operating profit improved by £72m to £526m in 2012, on a constant currency basis and including the Magic Life winter losses.
Business and financial review
Group performanceYear ended 30 September
Underlying results1 Statutory results £m 2012 2011 Change % 2012 2011
Revenue 14,460 14,687 -2% 14,460 14,687Operating profit 490 471 +4% 301 255Profit before tax 390 360 +8% 201 144Free cash flow 240 451 -47% 240 451Basic EPS (pence) 25.8 23.6 +9% 12.5 7.7Dividend per share (pence) 11.7 11.3 +4% 11.7 11.3
1) Underlying operating profit excludes separately disclosed items, amortisation of business combination intangibles, acquisition related expenses, impairment of goodwill and available for sale financial assets, predecessor accounting for Magic Life in 2011 and interest and taxation of results of the Group’s joint ventures and associates.
William WaggottChief Financial Officer

TT11 | AR 2012 | 20/12/2012 | Proof 5
www.tuitravelplc.com
TUI Travel PLC Annual Report & Accounts 2012 37B
usiness and financial review
Business and financial review
DividendsThe Board is recommending a final dividend of 8.3p per share (2011: 8.0p). On 8 May 2012 the Board recommended an interim dividend of 3.4p per share (2011: 3.3p), making a full year dividend of 11.7p per share (2011: 11.3p). The final dividend will be paid on 10 April 2013 to holders of relevant shares on the register at 8 March 2013.
The Group’s policy is to maintain underlying dividend cover at around two times. We intend to continue to operate a dividend re-investment plan as an alternative to receiving a cash dividend.
Cash and liquidityThe net debt position (cash and cash equivalents less loans, overdrafts and finance leases) at 30 September 2012 was £108m (30 September 2011: net cash of £4m). The two main impacts in the year were advances under finance leases for three aircraft, totalling £83m and FX retranslation effect of £70m of net debt balances in the Eurozone.
This consisted of £830m of cash and £70m of current interest-bearing loans and liabilities and £868m of non-current interest-bearing loans and liabilities. As at 30 September 2012, undrawn committed borrowing facilities totalled £1,018m (2011: £1,044m).
Cash flow conversion is 75% of underlying profit before tax, excluding the net pre-delivery payments on aircraft of £53m (2011: £34m). Free cash flow deteriorated by 47% to £240m (2011: £451m), analysed as follows:
2012 2011 £m £m
Underlying operating profit 490 471Depreciation and amortisation included within underlying operating profit 152 172
Underlying EBITDA1 642 643 Working capital movement 60 218 Capital expenditure (net of disposals) (262) (162)Other2 (200) (248)
Free cash flow 240 451
1) Earnings before interest, tax, depreciation and amortisation.
2) Includes pension funding, tax, interest and cash impact of separately disclosed items.
Acquisitions & InvestmentsThe Group invested £16m in acquisitions in 2012.
In September 2012, the Accommodation & Destinations Sector acquired MalaPronta.com, Brazil’s fourth largest accommodation-only OTA with a strong reputation and brand positioning. MalaPronta.com has achieved 117% compound annual revenue growth in the past seven years growing to its current level of more than 130,000 room nights sold last year. The acquisition of MalaPronta.com is part of the Accommodation OTA strategy to build its offering and positioning globally particularly in the emerging markets.
TaxationUnderlying profit before tax for the year was £390m. The effective tax rate on these profits is 27%. Based on the current structure of the business and existing local taxation rates and legislation, it is expected that the underlying tax rate will be maintained at this level in the medium term. The actual tax rate for the year ended 30 September 2012 is 33%. This differs from the underlying tax rate due to the tax effect of separately disclosed items and non-recognition of deferred tax assets in certain loss making territories.
The cash tax rate is expected to be lower than the underlying income tax rate as we utilise our deferred tax assets generated from restructuring expenditure and trading losses. In the coming year, we envisage a cash tax rate of approximately 20% of underlying profit before tax.
Earnings per shareUnderlying basic earnings per share was 25.8p (2011: 23.6p). Basic earnings per share was 12.5p (2011: 7.7p).

www.tuitravelplc.com
38 TUI Travel PLC Annual Report & Accounts 2012
TT11 | AR 2012 | 20/12/2012 | Proof 5
Business and financial review
Group performance continued
We remain satisfied with our funding and liquidity position. We have three main sources of long-term debt funding as at 30 November 2012 – these include the external bank revolving syndicated credit facilities totalling £1,020m which mature in June 2015, a £350m convertible bond (due October 2014) and a £400m convertible bond (due April 2017). The external bank revolving facility is used to manage the seasonality of the Group’s cash flows and liquidity.
Separately disclosed items (SDIs)Separately disclosed items net to a £92m expense in the year (2011: £74m expense). The following table provides a breakdown of these items:
2012 2011 £m £m
Restructuring costs 102 137 Pension – (63)Incremental costs caused by volcanic ash disruption in 2010 – (7)Other (10) 7
Total SDIs 92 74
Restructuring costs of £102m were incurred in the year. The largest items by division were as follows:
• £66m in France in relation to the ongoing restructuring of the tour operator and airline;
• £5m relating to the restructure of the Moroccan airline Jet4You;
• £7m credit in Germany in relation to an unused restructuring provision;
• £24m in the Specialist & Activity and A&D sectors.
The remaining costs related primarily to Group head office companies.
Further information is included within Note 4.

TT11 | AR 2012 | 20/12/2012 | Proof 5
www.tuitravelplc.com
TUI Travel PLC Annual Report & Accounts 2012 39B
usiness and financial review
Business and financial review
Segmental performance
Segmental performance is based on underlying financial information (which excludes certain items, including separately disclosed items, acquisition related expenses and predecessor accounting for Magic Life in 2011).
Mainstream
The Mainstream Sector reported an underlying operating profit of £420m (2011: £370m). On a constant currency basis, underlying operating profit increased by 22% to £451m.
Mainstream 2012 2011 Change %
Customers (‘000)1
Northern Region 6,660 6,867 -3%Central Europe 7,382 7,282 +1%Western Europe 6,067 6,101 -1%
Total 20,109 20,250 -1%
Revenue (£m)Northern Region 4,743 4,671 +2%Central Europe 4,544 4,841 -6%Western Europe 3,031 3,151 -4%
Total 12,318 12,663 -3%
Underlying operating profit (£m)2
Northern Region 295 250 +18%Central Europe 101 103 -2%Western Europe 24 17 +41%
Total 420 370 +14%
1) Customer figures have been restated for 2011 to reflect redefined product reporting following the implementation of a new system.
2) Underlying operating profit excludes separately disclosed items, amortisation of business combination intangibles, acquisition related expenses, impairment of goodwill and available for sale financial assets, predecessor accounting for Magic Life and interest and taxation of results of the Group’s joint ventures and associates.

www.tuitravelplc.com
40 TUI Travel PLC Annual Report & Accounts 2012
TT11 | AR 2012 | 20/12/2012 | Proof 5
Marketing the Dreamliner
The latest marketing campaign has been designed to showcase the Thomson brand by putting our innovative new 787 Dreamliner at the heart of our advertising. Being the first UK airline to receive this state-of-the-art plane, the campaign shows how Thomson is ‘bringing you a new way to fly on holiday’. The messages focus on being first to fly as well as all the benefits the aircraft brings including greater cabin space, reduced jet-lag and quieter flight, plus significantly improved efficiency and environmental impact.
First Choice is now all-inclusive
Summer 2012 saw the first customers enjoying the new ‘Home of All-Inclusive’ holidays from First Choice. In this fast-growing sector, First Choice is unique and offers the most comprehensive range of all-inclusive holidays including the flagship Holiday Villages and SplashWorld Resorts.
Northern Region
The Northern Region reported an underlying operating profit of £295m (2011: £250m). Most divisions improved year-on-year, with a particularly strong performance by the UK, increasing underlying operating profit by 32% to £197m.
The main drivers of the year-on-year change in underlying operating profit are summarised in the following table:
Nordic Northern£m UK Region Canada Hotels Region
2011 149 70 18 13 250 Magic Life winter losses – – – (17) (17)
2011 (incl Magic Life winter losses) 149 70 18 (4) 233 Trading 44 16 3 8 71 Flooding in Thailand – Nordics – (13) – – (13)Business improvement 4 – – – 4 FX translation – (2) – 2 –
2012 197 71 21 6 295
Northern Region 2012 2011 Change %
Customers (‘000)UK & Ireland 5,158 5,440 -5%Nordic region 1,502 1,427 +5%
Total 6,660 6,867 -3%
Revenue (£m)UK & Ireland 3,634 3,588 +1%Nordic region 1,084 1,054 +3%Canada – – –Hotels 25 29 -14%
Total 4,743 4,671 +2%
Underlying operating profit (£m)1
UK & Ireland 197 149 +32%Nordic region 71 70 +1%Canada 21 18 +17%Hotels 6 13 -54%
Total 295 250 +18%
1) Underlying operating profit excludes separately disclosed items, amortisation of business combination intangibles, acquisition related expenses, impairment of goodwill and available for sale financial assets, predecessor accounting for Magic Life and interest and taxation of results of the Group’s joint ventures and associates.
Business and financial review
Segmental performance continued

TT11 | AR 2012 | 20/12/2012 | Proof 5
www.tuitravelplc.com
TUI Travel PLC Annual Report & Accounts 2012 41B
usiness and financial review
Business and financial review
Blue Village Aegean Park Rhodes
Part of the unique holidays strategy for Rhodes was to develop a new tailor-made, high-end family adapted Blue Village. The hotel was designed as CO2 emission-free, challenging all previous knowledge in building resorts in Rhodes and this was a key message in the marketing campaign. The hotel itself combined this with 35% swim up rooms, spacious pool areas, beach location, a unique interior design, a choice of food and beverage outlets and Nordic adapted entertainment which resulted in the most profitable hotel with the highest customer satisfaction in the Nordic region.
Solar heating in Crete
In Spring 2012 two Blue Village Hotels, Caldera Beach and Creta Paradise, were equipped with 800m2 of solar panels that supply the energy used in hot water production. To optimise the efficiency of the solar heating systems, they were equipped with energy meters and data-log monitoring which register the energy production. The outcomes achieved were: optimal efficiency and a resulting saving on fossil fuels, reduced CO2 emissions and a reliable benchmarking tool for other Blue Village Hotels. This project saves money and the environment.
Nordic RegionThe Nordic region achieved an improved underlying operating profit of £71m (2011: £70m), delivering an operating margin of 6.5% for the year, one of the highest in the Group. The region delivered a broadly flat performance over the year, despite a £13m negative impact during the first half of 2012 as a result of flooding in Bangkok which adversely affected consumer demand to Thailand and reduced yields.
Unique holidays (differentiated and exclusive product combined) accounted for 92% of total holidays in 2012, up five percentage points on 2011. This increase in unique content was partly driven by two new Blue Villages: Blue Village Exotic in Thailand that launched during the Winter season and Blue Village Bodrum Imperial in Turkey that launched in the summer.
The Nordic region continues to successfully implement its online strategy, with online bookings accounting for 65% of the total in 2012, up four percentage points on 2011. Direct distribution increased by one percentage point versus the prior year to 87% in 2012.
CanadaThe strategic venture with Sunwing in Canada continues to perform well, delivering an improved operating profit of £21m (2011: £18m). The result was driven by a strong trading performance, as a result of improved margins and volumes during the period.
HotelsThe Hotels division comprises hotel management companies and joint ventures in hotel assets. The division delivered underlying operating profit of £6m in 2012 (2011: £13m). The result was impacted by the inclusion of winter losses for the Magic Life companies acquired in July 2011 that were not incurred in the prior year. The underlying like-for-like trading position (including Magic Life winter losses in both years) moved forward by £8m (excluding FX). This improvement was driven by changes in a number of hotel concepts and the winter closure of unprofitable hotels.
UK & IrelandThe UK & Ireland businesses delivered a £48m improvement in underlying operating profit to £197m (2011: £149m), as a direct result of the strategy of focusing on higher margin unique holidays (differentiated and exclusive product combined) distributed increasingly online. This improvement in profit led to record underlying operating profit margins for the UK business of 5.4%.
Unique holidays (differentiated and exclusive product combined), such as Sensatori, SplashWorld and Couples, continues to drive value for our business. Unique holidays accounted for 79% of total holidays in 2012, up four percentage points on 2011. We continue to grow a number of our concepts including Couples, which offers child-free hotels within the programme and Small and Friendly, a collection of intimate hotels, which complements our core offering.
Online sales grew by five percentage points to 44% of bookings in 2012, more customers now book using our websites than by any other distribution channel. Thomson remains one of the top most visited travel websites in the UK. Further enhancements were made to the First Choice website to improve navigation and enhance content, which has resulted in a higher conversion rate of visits to the website. Direct distribution increased by five percentage points versus the prior year to 87% in 2012.
The UK business delivered £4m of efficiency savings towards the business improvement programme in the year.

www.tuitravelplc.com
42 TUI Travel PLC Annual Report & Accounts 2012
TT11 | AR 2012 | 20/12/2012 | Proof 5
Sensimar Couples resorts
Sensimar Hotels & Resorts is our very popular unique holiday brand in Germany specifically targeting couples looking for relaxation. These hotels operate under the motto ‘Time for the two of us’ and making sure this TUI quality happens for our customers is the Sensimar goal. In keeping with this, a consistent concept has been created for the hotels: all properties offer four to five star comfort, a maximum of 250 rooms and are located with a sea view in the front row on the beach. Spaciousness with numerous areas for peace and quiet, modern wellness facilities as well as a high quality, stylish atmosphere are all part of the hotel concept.
Business and financial review
Segmental performance continued
Central Europe
Central Europe delivered underlying operating profit of £101m (2011: £103m).
This result was delivered despite an adverse foreign exchange impact of £18m due to the retranslation of Eurozone profits into Sterling during the fourth quarter. The main drivers of the year-on-year change in underlying operating profit are summarised in the following table:
Central £m Germany Austria Switzerland Poland Europe
2011 89 11 5 (2) 103 Trading (1) 1 1 – 1 Business improvement 14 – – 1 15 FX translation (15) (2) (1) – (18)
2012 87 10 5 (1) 101
Central Europe 2012 2011 Change %
Customers (‘000)Germany1 6,425 6,424 FlatAustria 525 543 -3%Switzerland1 211 149 +42%Poland 221 166 +33%
Total 7,382 7,282 +1%
Revenue (£m)Germany 3,917 4,235 -8%Austria 308 333 -8%Switzerland 207 184 +13%Poland 112 89 +26%
Total 4,544 4,841 -6%
Underlying operating profit/(loss) (£m)2
Germany 87 89 -2%Austria 10 11 -9%Switzerland 5 5 FlatPoland (1) (2) +50%
Total 101 103 -2%
1) Customer figures for Germany and Switzerland have been restated for Q1 2011 to reflect redefined product reporting following the implementation of a new system.
2) Underlying operating profit/(loss) excludes separately disclosed items, amortisation of business combination intangibles, acquisition related expenses, impairment of goodwill and available for sale financial assets and interest and taxation of results of the Group’s joint ventures and associates.

TT11 | AR 2012 | 20/12/2012 | Proof 5
www.tuitravelplc.com
TUI Travel PLC Annual Report & Accounts 2012 43B
usiness and financial review
Business and financial review
Other Central European businessesThe other Central European businesses of Austria, Switzerland and Poland performed largely in line with the prior year. Austria reported underlying operating profit of £10m (2011: £11m). An increase in underlying trading was offset by the adverse impact of foreign currency translation. In Switzerland, underlying operating profit was £5m, in line with last year (2011: £5m). In Poland, the underlying operating loss was £1m (2011: £2m loss). The Polish business delivered £1m of business improvement in the year.
GermanyIn Germany, underlying operating profit was £87m (2011: £89m). This included a £15m adverse impact from foreign currency translation, partly offset by £14m of efficiency savings from the business improvement programme. On a constant currency basis, the underlying operating profit increased by 30%, despite absorbing the impact from a turbulent Greek political and economic situation.
Unique holidays (differentiated and exclusive product combined) maintained a share of 47% of total holidays in 2012. We launched several new concept hotels during the year including brands such as Best Family, Puravida and Sensimar.
Online bookings accounted for 18% of the total in 2012. Whilst in the Mainstream business online bookings accounted for 4% of bookings, a new TUI.com website was launched during the year as part of a strategy to focus on and improve online sales in the Mainstream business.
The German business delivered £14m of efficiency savings towards the business improvement programme in the year. The savings related to our GET 2015 programme focusing on cost reduction and growth and were delivered through back office restructuring.
Supporting tourism in Tunisia
TUI Deutschland has partnered with the German Government Development agency GIZ to support a major project in Tunisia to foster and develop tourism in a socially sustainable manner. The project focuses on the economic integration of women in the regions of Hammamet, Sousse and Port el Kantaoui. The project has three areas of activity: firstly a further training initiative for hotel managers for improving working conditions and the working environment as well as covering ecological and social sustainability; secondly, the improvement of the training quality in the hotel colleges; and, thirdly, the continuation of Tunisian traditional arts and crafts.

www.tuitravelplc.com
44 TUI Travel PLC Annual Report & Accounts 2012
TT11 | AR 2012 | 20/12/2012 | Proof 5
Business and financial review
Segmental performance continued
Western Europe
Western Europe reported an underlying operating profit of £24m (2011: £17m).
The main drivers of the year-on-year change in underlying operating profit are summarised in the following table:
Southern Western£m France Netherlands Belgium Europe Europe
2011 (53) 22 50 (2) 17 Trading (6) 1 5 (2) (2)Business improvement 14 – 8 – 22 FX translation (2) (3) (8) – (13)
2012 (47) 20 55 (4) 24
Western Europe 2012 2011 Change %
Customers (‘000)France 1,956 2,057 -5%Netherlands 1,455 1,360 +7%Belgium 2,528 2,541 -1%Southern Europe 128 143 -10%
Total 6,067 6,101 -1%
Revenue (£m)France 1,263 1,363 -7%Netherlands 839 783 +7%Belgium 840 902 -7%Southern Europe 89 103 -14%
Total 3,031 3,151 -4%
Underlying operating (loss)/profit (£m)1
France (47) (53) +11%Netherlands 20 22 -9%Belgium 55 50 +10%Southern Europe (4) (2) -100%
Total 24 17 +41%
1) Underlying operating (loss)/profit excludes separately disclosed items, amortisation of business combination intangibles, acquisition related expenses, impairment of goodwill and available for sale financial assets and interest and taxation of results of the Group’s joint ventures and associates.
FranceFrance reported an underlying operating loss of £47m (2011: loss of £53m), an improvement of £6m versus the prior year. The decreased loss was driven by an improved performance by the French tour operators and offset by an increased loss in the airline Corsair.
France 2012 2011 Change %
Underlying operating loss (£m)1
Tour operator (32) (43) +26%Airline (15) (10) -50%
Total (47) (53) +11%
1) Underlying operating loss excludes separately disclosed items, amortisation of business combination intangibles, acquisition related expenses, impairment of goodwill and available for sale financial assets and interest and taxation of results of the Group’s joint ventures and associates.
Jetair offers Azores as part of growth strategy
This year, TUI Belgium’s airline, Jetairfly.com, announced that it is operating Belgium’s only direct flights to Ponta Delgada in the Azores. TUI Belgium’s leading tour operator, Jetair, supports this new service offering holidays and activities across the Azores islands. This new destination adds value and differentiated content to TUI Belgium’s offering whilst highlighting the continuing search for new, exclusive and original destinations for the Belgium market.
Reaching west coast of USA with ArkeFly
As of June 2012 TUI Netherlands’ airline, ArkeFly, started to operate flights to Las Vegas, Los Angeles and San Francisco. This has made America’s west coast the fastest growing and best-selling destination for the airline. By offering competitive prices, ArkeFly has made this destination affordable for its customers which has resulted in a fivefold increase in passengers and a market share of 74% on these long-haul flights.

TT11 | AR 2012 | 20/12/2012 | Proof 5
www.tuitravelplc.com
TUI Travel PLC Annual Report & Accounts 2012 45B
usiness and financial review
Business and financial review
NetherlandsThe Netherlands delivered underlying operating profit of £20m (2011: £22m), reflecting a more challenging market. A number of new destinations were launched during the year including Western USA and Zanzibar for our long-haul routes and Venice, Croatia and Israel in our mid-haul routes.
BelgiumUnderlying operating profit in Belgium increased by £5m to £55m (2011: £50m), despite absorbing an £8m adverse FX impact. The performance reflects a record Winter that saw volumes increase by 10% and better airline utilisation.
Direct distribution increased by three percentage points during the period to 62%, whilst sales through the online channel rose by six percentage points to 43%.
Our Moroccan low cost airline Jet4You was consolidated into the Belgian business from 1 April 2012. This is a natural fit as Jet4You is currently owned and operated by the Belgian business and Jetairfly is our lowest cost airline. This helped drive internal synergies and the business improvement programme delivered an £8m improvement in the year from Jet4You.
Southern EuropeSouthern Europe, which consists of tour operators based in the Italian and Spanish source markets, reported an underlying operating loss of £4m (2011: loss of £2m). This reflects the heavy reliance on North Africa, much of which was disrupted during the same period last year.
FranceThe tour operator reported a reduced loss of £32m (2011: loss of £43m). The improvement of £11m versus the prior year was driven by the successful delivery of £8m of efficiency savings towards the business improvement programme in the year and stronger late summer trading. This was partially offset by continued lower demand for North African destinations. The tour operator is particularly reliant on these destinations – historically Egypt, Tunisia and Morocco have made up around 40% of their capacity in total, and around 65% for Marmara alone. Whilst trading conditions remain very challenging, we saw demand pick up for both Tunisia and Morocco, particularly in the later part of the summer season.
Progress to consolidate the businesses of the French tour operators continues with the aim of creating a single business with a long-term viable future. The legal merger was completed in January 2012 and the integration timetable for this restructuring is progressing to plan.
The airline result reported a loss of £15m (2011: loss of £10m), reflecting the continuing competitive market place, a reduction in capacity on certain routes and an increase in fuel prices which could only partially be passed on to the customer. However, the business improvement programme is progressing as planned delivering £6m of efficiency savings in the year.
We are continuing to evaluate our strategic participation options in the Chinese and Indian market. In India, our tour operating and retail business TUI India was re-launched with an increased focus on targeting the more affluent consumer segments with a range of new products including family clubs in Goa and Mauritius, driving controlled distribution more aggressively and a focus on online with the launch of a re-branded website. In China, we continue to assess our market participation options and have been further developing our plans in the outbound segment via TUI China, our joint venture co-operation with China Travel Service (CTS).
Emerging Markets
Emerging Markets reported an underlying operating loss of £15m in the year (2011: loss of £12m). The result for this Sector reflects our continued investment in brand and distribution in Russia and the CIS and the continued impact of unrest in Egypt. During the year, we consolidated our existing businesses into a single brand (TUI) featuring all destinations, establishing a strong platform for the future. The Sector now has close to 600,000 customers, up 15% on the prior year.
Emerging Markets (share of joint ventures) 2012 2011 Change %
Underlying operating loss (£m)1 (15) (12) -25%
1) Underlying operating loss excludes separately disclosed items, amortisation of business combination intangibles, acquisition related expenses, impairment of goodwill and available for sale financial assets and interest and taxation of results of the Group’s joint ventures and associates.
In the 2012/13 financial year the Emerging Markets Sector will no longer exist. Emerging Markets will be included in the Mainstream Sector but reported separately, while India and China will sit within and be reported in the Accommodation & Destinations Sector.
Launch of first social media campaign
TUI India has launched its first social media campaign which is now live on Facebook. TUI India is focusing on providing advice on destinations and tours using four travel experts to answer customer questions – Vicky the Vacationer, Sonya the Desi Nomad, Jai the Euro Tripper and Yash Mr High Life. Each character has its own preferred holiday style with an individual profile page including overviews of trips offered including recommendations, hints and tips. TUI India now has over 170,000 Facebook fans and 3,000 engaged users talking about TUI India and sharing comments.
Airline launch
In the Russian market, TUI has historically bought seat capacity from a variety of airlines which has given us no cost advantage, no brand awareness and a varying degree of service. This year we have taken the lead in the market by branding our aircraft with TUI and delivering a service in line with TUI European standards. This is unique in the market place and gives us a strong competitive advantage. We have signed a three-year contract with a Russian airline to deliver this which has also given us significant cost savings. The results of this summer have shown excellent customer feedback.

www.tuitravelplc.com
46 TUI Travel PLC Annual Report & Accounts 2012
TT11 | AR 2012 | 20/12/2012 | Proof 5
Business and financial review
Segmental performance continued
Roomnights for Accommodation OTA increased by 7% due to a good performance from LateRooms and AsiaRooms. Accommodation OTA TTV grew by 4% to £447m, including AsiaRooms growth of 25%. LateRooms showed year-on-year room night and commission growth partly driven from offline marketing to drive brand awareness and development of mobile offering to meet changing consumer channel preferences. The expansion and roll out of the AsiaRooms brand is on track, with significant market share gains in both Malaysia and Singapore. Local language traffic now represents the largest single source of traffic. We entered the Brazilian market through the acquisition of MalaPronta.com in September 2012.
Inbound ServicesThe Inbound Services business delivered underlying operating profit of £31m (2011: £38m), reflecting a reallocation of costs from the Emerging Markets Sector to the Accommodation & Destinations Sector and the adverse impact of foreign currency translation.
Inbound Services remains the market leader in a fragmented market. We have simplified the way we present ourselves to third party providers through the launch of the brands Destination Services and Worldcome. We are also looking at opportunities with the independent traveller segment of this market.
Incoming passenger volumes were flat over the prior year. In cruise handling, the number of port calls handled increased by 12%.
Accommodation & Destinations
Accommodation & Destinations (A&D) delivered an underlying operating profit of £66m (2011: £72m). This included an £11m investment in Accommodation OTA, a £4m adverse impact of foreign currency translation and a £3m impact relating to the reallocation of costs from the Emerging Markets Sector to the Accommodation & Destinations Sector.
The main drivers of the year-on-year change in underlying operating profit are summarised in the table below:
Online Inbound Accommodation £m accommodation services & Destinations
2011 34 38 72Trading 14 (2) 12Investment in OTA (11) – (11)Reallocation of costs – Emerging Markets – (3) (3)FX translation (2) (2) (4)
2012 35 31 66
Accommodation & Destinations 2012 2011 Change %
Customers (‘000)Accommodation Wholesaler roomnights +13%Accommodation OTA roomnights (Online) +7%Incoming passenger volumes Flat
Revenue (£m) 664 652 +2%
Underlying operating profit (£m)1
Online Accommodation 35 34 +3%Inbound Services 31 38 -18%
Total 66 72 -8%
1) Underlying operating profit excludes separately disclosed items, amortisation of business combination intangibles, acquisition related expenses, impairment of goodwill and available for sale financial assets and interest and taxation of results of the Group’s joint ventures and associates.
TTV for the Sector increased by 8% to £2.8bn (2011: £2.6bn). This was driven by growth in Hotelbeds and Bedsonline in Accommodation Wholesaler, by LateRooms/AsiaRooms in Accommodation OTA and by our cruise handling business, Intercruises.
The Accommodation & Destinations Sector divisions will now be described as follows:
• Online Accommodation: Includes Accommodation Wholesaler and Accommodation OTA.
• Inbound Services: Businesses that provide transfers, excursions, tours, tailor-made products, cruise handling services and meetings and events.
Online AccommodationThe Online Accommodation business delivered a £1m improvement in underlying operating profit to £35m (2011: £34m). The result included a trading improvement of £14m offset by a £11m investment in Accommodation OTA and a £2m adverse impact of foreign currency translation.
Roomnights for the Accommodation Wholesaler increased by 13% due to strong organic growth from the brands Hotelbeds and Bedsonline, where the key area of focus remains on international expansion, particularly in the Americas and Asia. Accommodation Wholesaler TTV grew by 13% to £1.4bn.
AsiaRooms.com brand development campaign
Following the launch of five language sites, AsiaRooms.com launched a pan-regional brand development campaign to drive sales and increase brand awareness. The campaign entitled ‘The Right Room for You’, focused on the uniqueness of each traveller and their travel preferences, and delivered good results with Singapore and Malaysia site visits growing by over 49% and 132% respectively in the year to date.
Hotelbeds 10 years 10 causes
As part of its 10-year anniversary celebrations, Hotelbeds launched the ‘10 years 10 causes’ campaign. This initiative engaged over 6,000 Hotelbeds’ colleagues from around the world to propose and participate in local initiatives related to different causes – Health; Integration; Education; Sustainable Tourism; Youth; Sharing; Giving Back; Biodiversity; Cultural Diversity and Children. The initiatives and activities that took place can be found at www.10causes.com

TT11 | AR 2012 | 20/12/2012 | Proof 5
www.tuitravelplc.com
TUI Travel PLC Annual Report & Accounts 2012 47B
usiness and financial review
Business and financial review
The North American Specialist division saw an improvement in underlying operating profit driven by a switch in mix towards higher margin products offered by operators such as Starquest (private jet tours) and Quark (polar expeditions) and improved cost control. The Sport division benefited from the Olympics and the 2012 UEFA European Championships.
Specialist & Activity
Specialist & Activity reported a profit of £48m (2011: £65m), down £17m, due to declines in the Adventure and Education divisions partly offset by North American Specialist and Sport divisions. This included £1m adverse impact from foreign currency translation and £2m adverse impact of unrest in the Middle East and North Africa. The business improvement programme delivered a £1m improvement in the year. Specialist & Activity 2012 2011 Change %
Customers (‘000) 1,586 1,500 +6%
Revenue (£m) 1,478 1,372 +8%
Underlying operating profit (£m)1 48 65 -26%
1) Underlying operating profit excludes separately disclosed items, amortisation of business combination intangibles, acquisition related expenses, impairment of goodwill and available for sale financial assets and interest and taxation of results of the Group’s joint ventures and associates.
Adventure was impacted by the unrest in the Middle East and North Africa and the reduction in demand to Australia due to the global financial crisis and a strengthening Australian dollar. The result also reflected the consolidation of first-half losses from our strategic venture with Intrepid Travel. Education continued to be impacted by a reduction in party sizes and demand for gap year travel due to the downturn in the UK economy and rise in university tuition fees. The high cost of accommodation in London due to the 2012 Olympics and strength of Sterling also impacted demand in our language school businesses. We are making progress with the restructuring of the Education division, as outlined last year, to reduce back office costs, drive operational efficiencies and have simplified the management structure.
Sawadee gets international recognition for sustainability
Sawadee won the ‘Best Carbon Reduction Initiative’ category at the Responsible Travel Awards during the 2012 World Travel Market in London. Sawadee received the award for identifying effective ways of reducing carbon footprints of their trips. They have identified that changing to direct ‘point-to-point’ flights results in a reduction in carbon emissions by an average of 10%.
Around the world partnership with Four Seasons
Seattle-based TCS & Starquest Expeditions partnered with the Four Seasons for an exclusive around-the-world journey. Priced from $66,950 per person, the 22-day programme features TCS’ signature private jet experience combined with accommodations at Four Seasons properties around the globe and enhanced by a dedicated Four Seasons’ concierge. The partnership was so popular that more departures will follow in 2013.

www.tuitravelplc.com
48 TUI Travel PLC Annual Report & Accounts 2012
TT11 | AR 2012 | 20/12/2012 | Proof 5
Business and financial review
Current trading and outlook
In Germany, bookings are up 2% against a capacity decline of 3%. Long-haul continues to perform well. Average selling price is up 6%. Sales of unique holidays (differentiated and exclusive product combined) are up 8% compared with this time last year, accounting for 55% of holidays sold to date, up five percentage points on the prior year. Booked load factor is currently 56%.
In France, we have reduced capacity by 34%, with sizeable reductions in loss-making capacity to Egypt and a number of long-haul destinations. As a result of this, bookings are down 28%, which is in line with our expectations. Booked load factor is currently 55%.
In A&D bookings are up 12% and sales (TTV) are up 20% versus the prior year. This was driven by both Accommodation Wholesaler, where bookings are up 14% and Accommodation OTA, where bookings increased by 7%.
Sales in Specialist & Activity are down 3%, driven by the Education and Sport divisions. Trading in the Education division reflects the challenging market place and in the Sport division trading is down following tough comparatives from the same period last year due to the IRB Rugby World Cup.
Summer 2013It is still early in the bookings cycle for Summer 2013, however trading to date has been very encouraging in those markets on sale.
In the UK, bookings are up by 12%, ahead of a 3% increase in capacity. Whilst it is early in the booking cycle, we are significantly outperforming a flat market. Average selling prices are up by 3%. Sales of unique holidays (differentiated and exclusive product combined) are up by 18% compared to the same period last year accounting for 83% of holidays sold to date, up by two percentage points. Online sales account for 32% of Summer holidays booked, in line with the prior year. To date, 20% of the programme has been sold.
As a result of our new Mainstream Sector structure announced in April 2012, where the regional structure was disbanded from 1 October 2012, we are now reporting Mainstream Sector trading in the format below with a focus on our four largest markets.
Winter 2012/13Strong trading momentum from Summer 2012 has continued into Winter 2012/13 across all major markets with the exception of France. Our focus on unique holidays distributed online is delivering very pleasing year-on-year volume growth with margins that are in line with expectations.
In the UK, bookings are up by 1% against a flat capacity. Average selling price is up 4%, partly reflecting the successful pass-through of inflationary cost increases of circa 2-3%. Sales of unique holidays (differentiated and exclusive product combined) are up 5% compared with this time last year and account for 78% of holidays sold to date, up three percentage points on the prior year. Online sales continue to grow, accounting for 44% of Winter holidays booked, up by three percentage points on the prior year. Booked load factor is currently 49%.
In the Nordic region, bookings are up by 5%, in line with its capacity increase. Average selling price is up 5%. Sales of unique holidays (differentiated and exclusive product combined) are up 5% compared with this time last year, accounting for 83% of holidays sold to date, in line with the prior year. Online sales continue to grow, accounting for 63% of Winter holidays booked, up by two percentage points on the prior year. Booked load factor is currently 73%.
Current trading1
Winter 2012/13 Risk only Total Total Total ASP2 sales2 customers2 Capacity3 Left to sell3Year-on-year variation %
MainstreamUK +4 +5 +1 Flat -2Nordic region +5 +10 +5 +4 +3Germany +6 +8 +2 -3 -14France tour operators +8 -22 -28 -34 -35Other4 +1 Flat -1
Total Mainstream +4 +3 -1
Specialist & Activity n/a -3 n/a Accommodation & Destinations5 +7 +20 +12
1) These statistics are up to 25 November 2012 and are shown on a constant currency basis.
2) These statistics relate to all customers whether risk or non-risk.
3) These statistics include all risk capacity programmes.
4) Other includes Austria, Belgium, Netherlands, Poland and Switzerland.
5) These statistics refer to online accommodation businesses only; Sales refer to total transaction value (TTV) and customers refers to roomnights.

TT11 | AR 2012 | 20/12/2012 | Proof 5
www.tuitravelplc.com
TUI Travel PLC Annual Report & Accounts 2012 49B
usiness and financial review
Business and financial review
OutlookOverall trading remains positive across all our major source markets with the exception of France where the environment remains extremely challenging. Strong trading momentum from Summer 2012 has continued into Winter 2012/13, particularly in the UK and the Nordics, where our unique holidays (differentiated and exclusive product combined) are selling well and growth in our direct distribution channels continues to have a positive effect on margins. While still early in the booking cycle, the Summer 2013 programme in the UK, Nordics and Germany is showing strong signs of growth, with additional capacity in the UK and Nordics.
Our strategy of increasing our unique holiday (differentiated and exclusive product combined) offering, selling through direct distribution channels with a focus on online and driving continued operational efficiency throughout the business is paying dividends. Our strong business models, which have evolved through a deep understanding of the leisure travel market and the needs of our customers, lay the foundations for continued success and long-term sustainable growth. We have set out a road map for growth over the next five years and will deliver improved customer experiences and increased shareholder value.
Roadmap for growthOur new roadmap for growth enables us to provide updated guidance for the future prospects of the Group. We believe that TUI Travel has the ability to deliver an underlying operating profit CAGR of between 7% to 10% over the next five years. This includes growing customer numbers while enhancing the margin within the Mainstream business, growth in our Specialist & Activity portfolio, as well as positive contributions from our fast growing Online Accommodation business.
In the Nordic region, bookings are up 16% and average selling prices up 3%. Sales of unique holidays (differentiated and exclusive product combined) are up by 18% compared to the same period last year, accounting for 94% of holidays sold to date, up by two percentage points. Online sales continue to grow, accounting for 60% of Summer holidays booked, up by two percentage points on the prior year. To date, 12% of the programme has been sold.
In Germany, the Summer 2013 programme launched very recently. We are encouraged by early trading with bookings up by 9% and average selling prices up by 3%. To date, 10% of the programme has been sold.
Fuel/Foreign exchangeWe have hedged the majority of our fuel and currency requirements for the seasons currently on sale, which gives us certainty of costs when planning capacity and pricing. The following table shows the percentage of our forecast requirement that is currently hedged for Euros, US Dollars and jet fuel. As previously indicated, jet fuel costs account for approximately 10% of our cost base and at current market rates we estimate our fuel costs would increase by circa 10% for 2013.
Winter Summer 2012/13 2013
Euro 96% 86%US Dollars 76% 87%Jet fuel 93% 81%
As at 29 November 2012
Business improvement programmeWe announced at the start of our financial year that we expected to deliver £107m of business improvement, in broadly even tranches over the next three years. We have delivered £42m of operational efficiency savings through the business improvement programme in the last 12 months.
Current trading1
Summer 2013 Risk only Total Total Total ASP2 sales2 customers2 Capacity3 Left to sell3Year on year variation %
UK +3 +15 +12 +3 +1Nordic region +3 +20 +16 +4 +3Germany +3 +12 +9 Flat -1
1) These statistics are up to 25 November 2012.
2) These statistics relate to all customers whether risk or non-risk.
3) These statistics include all risk capacity programmes.

1. 2. 3.
7. 8. 9.
10. 11. 12.
13. 14. 15.
4. 5. 6.
Governance
Board of Directorsas at 30 September 2012
www.tuitravelplc.com
50 TUI Travel PLC Annual Report & Accounts 2012
TT11 | AR 2012 | 20/12/2012 | Proof 5

Governance
www.tuitravelplc.com
TUI Travel PLC Annual Report & Accounts 2012 51G
overnance
TT11 | AR 2012 | 20/12/2012 | Proof 5
of Heathrow Airport Limited for five years as well as the Chairman of Heathrow Express. She is also currently a non-executive director at two other publicly-quoted companies, Kingfisher PLC and Portmeirion Group PLC. In addition, Janis is a non-executive director of Network Rail and VisitBritain as well as a non-executive Board member of Copenhagen Airports A/S. She stood down as Chairman of the Board of Trustees of Forum for the Future in July 2012 after six years.
11. Coline McConville Independent Non-Executive Director (Age 48)Coline McConville joined the Board of TUI Travel PLC on 21 September 2011. Her background is in management, marketing and consulting. She spent 10 years at Clear Channel International Limited where, as Chief Executive for Europe, she was responsible for operations across 58 countries including the UK, France, Italy and Spain. Coline began her career in management consultancy, working with both McKinsey & Co in London and the LEK Partnership in Munich. She is a law graduate with an MBA from Harvard. Coline was appointed as a non-executive director of Wembley National Stadium Limited on 29 March 2012 and of UTV Media PLC with effect from 21 November 2012.
12. Minnow PowellIndependent Non-Executive Director (Age 58)Minnow Powell became a Non-Executive Director of TUI Travel PLC in April 2011. During his 35 years at Deloitte, he became a senior partner and concentrated on looking after Deloitte’s major clients including BAA, Hammerson, Reed Elsevier, Anglo American and BSkyB. He was also a member of the UK’s Audit Practices Board for six years. Minnow was appointed as a non-executive director of SuperGroup plc with effect from 1 December 2012.
13. Dr Erhard SchipporeitIndependent Non-Executive Director (Age 63)Dr Erhard Schipporeit joined the Board of TUI Travel PLC as a Non-Executive Director on 29 October 2007. He started his career in 1979 in the Bosch Group and in 1981 he joined VARTA AG/VARTA Battery AG, at that time a leading European battery company, where he became Chief Financial Officer in 1990 and Chief Executive and Chairman of the Executive Board in 1993. After the successful restructuring of VARTA the next move in his career brought him to the Munich based conglomerate company VIAG AG as CFO. VIAG merged in 2000 with VEBA AG to form the new E.ON AG, one of the world’s leading utility companies. Erhard was CFO and Executive Board Member of E.ON from 2000 until his resignation in November 2006. From 2007 to 2010 he was Senior Advisor for BNP Paribas SA. Erhard is currently a non-executive director of a number of companies including SAP AG, Deutsche Boerse AG, Talanx AG and Hanover Rueckversicherung AG.
14. Dr Albert SchunkIndependent Non-Executive Director (Aged 71)Dr Albert Schunk joined the Board of TUI Travel PLC as a Non-Executive Director on 29 October 2007. Albert studied economics at university and carried out a research project for the German Government in Latin America. After joining IG-Metall, he has served on the supervisory board of Volkswagen and other German Companies since 1976. In 1994 he became a member of the European Economic and Social Council in Brussels and has recently been advising the Riu Group in Spain.
15. Harold SherIndependent Non-Executive Director (Age 65)Harold Sher joined the Board of TUI Travel PLC as a Non-Executive Director on 29 October 2007. He studied commerce at university and started his career as a Chartered Accountant. Harold moved to industry early in his career holding a range of executive positions before being appointed Chief Executive of Amalgamated Metal Corporation PLC in 1992, a position he still holds. He has served as president of a major North American Steel Services Group and, together with his role at Amalgamated Metal Corporation, this has provided him with broad international commercial experience.
Chief Financial Officer of TUI Travel PLC in November 2010. Will spent the early part of his career with Coopers & Lybrand and Courtaulds Textiles plc, where he performed various senior group finance and divisional director roles. He entered the leisure travel industry when he joined Airtours plc and held a number of positions including UK leisure group finance director, prior to joining Thomson Travel Group in 2001. He then went on to become Chief Financial Officer of TUI Tourism in 2006.
6. Dr Volker BöttcherManaging Director, German Specialist Businesses (Age 53)Volker Böttcher joined the Board of TUI Travel PLC on 19 June 2007 and is responsible for the German Specialist Businesses. After an early career in law, Volker joined Touristik Union International in 1987 as a legal adviser. Having occupied various management positions, he became head of TUI’s Special Programmes Division in 1996 which included responsibility for long-haul destinations, city tours and the Eastern Mediterranean. In 2003 Volker was appointed Chairman for Central Europe for TUI AG, being responsible for all tourism activities in the source markets of Germany, Austria, Switzerland and Poland. He was appointed to the board of TUI Deutschland GmbH in April 2000. Following the restructuring of TUI’s business model in Germany, he was appointed CEO of TUI Deutschland GmbH in July 2001.
7. Horst Baier Non-Executive Director (Age 55)Horst Baier joined the Board of TUI Travel PLC as a Non-Executive Director on 13 October 2009. He commenced his professional career in the Treasury Department of Continental AG, the German tyre manufacturer. Between 1994 and 1996 Horst was responsible for Group Financing for the Fürth-based Schickedanz Group. In 1996, he took over responsibility for the Treasury, Accounting and Tax Department at TUI AG. Since 2001, Horst has been responsible for Accounting & Reporting for TUI AG and, in November 2007, was appointed to the Executive Board of TUI AG with responsibility for the Controlling function. In February 2010, Horst was appointed Chief Financial Officer of TUI AG.
8. Tony CampbellIndependent Non-Executive Director (Age 62)Tony Campbell became a Non-Executive Director of First Choice Holidays PLC in April 1997 and joined the Board of TUI Travel PLC on 28 June 2007 as a Non-Executive Director. Tony was Deputy Chief Executive of Asda Stores Limited until March 2001. He is currently the Chairman of T M Lewin Group Limited, The White Company (UK) Limited and EAT Limited, a non-executive director of The Original Factory Shop and a director of Data Transfer & Communications Limited.
9. Rainer FeuerhakeNon-Executive Director (Age 68)Rainer Feuerhake joined the Preussag Group (now TUI AG) in 1968 and by 1980 was responsible for group accounting. Rainer was appointed as Chief Financial Officer of Preussag AG in November 1988 and subsequently TUI AG (following a resolution to rename Preussag AG on 1 July 2002). In this position Rainer was responsible for the departments of Accounting & Reporting, Finance, Investor Relations, Tax Affairs, Mergers & Acquisitions, Destination Management and the Shared Service Centre. He resigned as Chief Financial Officer in February 2010 and is now acting as a consultant for TUI AG. He joined the Board of TUI Travel PLC on 28 June 2007.
10. Janis KongIndependent Non-Executive Director (Age 61)Janis Kong joined the Board of TUI Travel PLC on 29 May 2012 as a Non-Executive Director. Janis brings a wealth of experience to the Group having had a 33-year career with BAA where she held numerous operational positions including Managing Director at Gatwick Airport. Before leaving BAA in 2006, Janis was Chairman
1. Dr Michael FrenzelNon-Executive Chairman (Age 65)Dr Michael Frenzel joined the Board of TUI Travel PLC on 28 June 2007 as Non-Executive Chairman. Michael studied law at Ruhr University in Bochum and completed his doctorate whilst working at the university as a scientific assistant. He joined Westdeutsche Landesbank (WestLB), Düsseldorf, in 1981 where he was promoted to various managerial positions and became manager of the Industrial Holdings Department in 1983 and overall manager of WestLB’s Equity Holdings Division in 1985 – including holdings in banking, leasing and real estate.
In 1988, he became a member of the Preussag AG executive board, being responsible for Trading and Logistics. Michael has held the position of Chief Executive and Chairman of the Executive Board of TUI AG (formerly Preussag AG) since January 1994, overseeing its extensive acquisition programme in the late 1990s, which resulted in the acquisitions of TUI AG’s stake in Hapag-Lloyd and of leading tourism businesses such as Thomson Travel and Nouvelles Frontières. Michael is also currently a member of the supervisory board of a number of companies including AXA Konzern AG and AWD Holding AG.
2. Sir Michael Hodgkinson Non-Executive Deputy Chairman and Senior Independent Director (Age 68) Sir Michael Hodgkinson joined the Board of First Choice Holidays PLC as a Non-Executive Director in January 2004 and became Chairman in March 2004. He joined the Board of TUI Travel PLC on 28 June 2007 as Non-Executive Deputy Chairman and is the Senior Independent Director. Following an early career in the automotive industry, he was appointed Chief Executive of Grand Metropolitan’s European Food Division in 1986 and in 1992 he joined BAA plc, becoming Chief Executive in 1999, a post from which he retired in June 2003.
Sir Michael was Senior Non-Executive Director at Royal Mail and Chairman of Post Office Limited until September 2007, a director of Bank of Ireland plc from May 2004 until July 2006, a non-executive director of Dublin Airport until November 2011 and a non-executive director of Transport for London and Crossrail Limited until June 2012. He has been Chairman of Keolis (UK) Limited since 11 October 2011.
3. Peter LongChief Executive (Age 60)Peter Long joined the Board of TUI Travel PLC on 28 June 2007 as Chief Executive. In November 1996 he was appointed Group Managing Director of First Choice Holidays PLC and became Chief Executive in September 1999. Prior to joining First Choice, he was Chief Executive of Sunworld Holidays.
From February 2001 to June 2005 Peter was a non-executive director of RAC plc, and from April 2006 to July 2009 he was a non-executive director of Debenhams plc. Peter was appointed as a non-executive director of Rentokil Initial Plc in 2005 and is currently the Senior Independent Non-Executive Director.
4. Johan LundgrenDeputy Chief Executive (Age 45)Having worked in the tourism industry for 26 years, Johan is the Deputy Chief Executive of TUI Travel PLC responsible for the Mainstream Sector and was appointed to the Board of TUI Travel PLC on 21 December 2007. Prior to his appointment as Deputy Chief Executive in October 2011, he was Managing Director of the Northern Region of TUI Travel’s Mainstream Sector which includes source markets, UK and Ireland, Canada, Sweden, Norway, Denmark and Finland. Prior to the merger of First Choice Holidays PLC and the Tourism Division of TUI AG, Johan was Chief Executive of TUI Nordic and also took responsibility for tourism sales in the source markets of Italy and Russia.
5. William WaggottChief Financial Officer (Age 49)William Waggott joined the Board of TUI Travel PLC on 28 June 2007 as Commercial Director. He was appointed

www.tuitravelplc.com
52 TUI Travel PLC Annual Report & Accounts 2012
TT11 | AR 2012 | 20/12/2012 | Proof 5
suppliers are conducted. Due to the nature of the Group’s operations, and in common with the industry as a whole, payments are often made in advance for the provision of goods and services. The Group does not follow any code or statement on payment practice but it is Group policy that payments to suppliers, whether in advance or after the provision of the goods or services, are made on the basis of the terms that have been agreed with them.
The Company had no trade creditors at 30 September 2012 (2011: £nil) and consequently creditor days have not been presented. Where the Company is the recipient of goods or services, payment of suppliers is conducted by one of the Group companies in accordance with the policy set out above. The Group’s trade creditor days as at 30 September 2012 were 37 days (2011: 33 days).
Charitable giving and political donationsDuring the year, the Group made charitable donations of £376,054 (2011: £380,680). For further details see page 35. The Group made no political contributions during the year (2011: £nil).
Directors and their interestsDetails of Directors and their biographies can be found in a separate section called ‘Board of Directors’ on page 50 and Directors’ interests are given in the Remuneration Report on page 77.
Powers for the Company issuing or buying back its own shares The Company was authorised by shareholders, at the AGM held in February 2012, to purchase in the market up to 10% of the Company’s issued share capital, as permitted under the Company’s Articles. No shares have been bought back under this authority during the year ended 30 September 2012. This standard authority is renewable annually and the Directors will seek to renew this authority at the AGM to be held on 7 February 2013. The Directors were granted authority in 2012 to allot relevant securities up to maximum nominal amount of £74,534,044.60. That authority will apply until the conclusion of the 2013 AGM.
At the AGM in February 2013, shareholders will be asked to grant an authority to allot shares in the capital of the Company up to a maximum nominal amount of £74,534,044.60 representing the ABI guideline limit of approximately 66% of the Company’s issued ordinary share capital. Of this amount, 372,670,223 shares (representing approximately 33% of the Company’s issued ordinary share capital) can only be allotted pursuant to a rights issue. The power will last until the conclusion of the AGM in 2014 or if earlier on 7 May 2014. The Directors have no present intention of exercising this authority but they consider it appropriate to maintain the flexibility that this authority provides.
A special resolution will also be proposed to renew the Directors’ authority to repurchase the Company’s ordinary shares in the market. The authority will be limited to a maximum of 111,801,067 ordinary shares and sets the minimum and maximum prices which will be paid. This authority will expire at the end of the AGM held in 2014 or, if earlier, on 7 May 2014.
Director’s indemnity arrangementsThroughout the financial year and at the date of approval of these financial statements, the Company has purchased and maintained Directors’ and Officers’ liability insurance in respect of itself and its Directors whether in their capacity as Directors of the Company or associated companies. The Directors also have the benefit of indemnity provisions in the Company’s Articles of Association. These provisions are qualifying third party indemnity provisions as defined in section 234 of the Companies Act 2006.
The Directors submit their report and the audited consolidated financial statements of the Company and the Group to the members of TUI Travel PLC (the Company) for the year ended 30 September 2012.
Principal activityThe principal activity of the TUI Travel PLC group of companies (the Group) is that of an international leisure travel business and the principal activity of the Company is that of a holding company. The Group provides a broad and diverse range of leisure travel experiences to more than 30 million customers in 31 key source markets. For further information see TUI Travel overview page 2.
Annual General MeetingThe Annual General Meeting (AGM) will be held on Thursday 7 February 2013 at 10.30am at the offices of Herbert Smith Freehills, Exchange House, Primrose Street, London EC2A 2HS. An explanation of the business to be transacted at the AGM has been circulated to shareholders and can be found on the website http://www.tuitravelplc.com/investors-media.
Business performanceA summary of the business performance for the year ended 30 September 2012, prepared in accordance with the Companies Act 2006, is set out on pages 36 to 47 and forms part of the Directors’ report.
Results and dividendsThe Group profit before taxation for the year ended 30 September 2012 was £201m (2011: £144m). The Directors recommend a final dividend of 8.3 pence per ordinary share (2011: 8.0p), payable on 10 April 2013 to holders on the register at the close of business on 8 March 2013. When taken with the interim dividend of 3.4 pence per ordinary share paid on 3 October 2012 (2011: 3.3p), this gives a total dividend of 11.7 pence per share (2011: 11.3p) relating to the year ended 30 September 2012. For further information on dividends please see Note 9 in the Notes to the consolidated financial statements.
Key performance indicators and principal risks and uncertaintiesSee page 18 for the key performance indicators and page 20 for the principal risks.
Corporate Governance reportThe Corporate Governance report for the year ended 30 September 2012, prepared in accordance with rule 7.2 of the FSA’s Disclosure and Transparency Rules, is set out on pages 56 to 60 and forms part of the Directors’ report.
SuppliersTUI Travel benefits from both its economies of scale and application of purchasing power. Our principal suppliers are hotel owners and operators and aircraft suppliers. Amongst others, our key strategic relationships are with hotel chains such as RIU, Fiesta, Atlantica and aircraft manufacturers such as Boeing. Each source market has local and overseas teams to engage in effective procurement strategies to deliver optimum benefits to the Group. Co-operative working is fundamental to our relationships with key suppliers to ensure that the highest standards in terms of health and safety and quality are maintained. Suppliers falling below these expectations are removed from our programmes.
The operating units within the Group are responsible for agreeing the terms and conditions under which business transactions with their
Governance
Directors’ report

TT11 | AR 2012 | 20/12/2012 | Proof 5
www.tuitravelplc.com
TUI Travel PLC Annual Report & Accounts 2012 53G
overnance
Governance
• the Free Float of the Company is less than 30% of the issued ordinary shares for at least five consecutive dealing days (where the Free Float is (a) all outstanding ordinary shares of the Company less those held by or on behalf of TUI AG, its associates and any persons acting in concert with it and (b) the ordinary shares underlying the outstanding secured exchangeable bonds due 2013 issued by Nero Finance Limited on 16 January 2008).
£400 million 4.90% convertible bondsIn April 2010, the Company issued £400 million of 4.90% convertible bonds with a conversion price set at 382.34 pence per share. The settlement took place on 27 April 2010. The convertible bonds contain terms which give the bondholders the right to redeem the bonds at their principal amount, together with accrued and unpaid interest up to the date of redemption, if a change of control occurs. For the purpose of the convertible bonds a change of control occurs if:
• following a takeover offer to acquire all or a majority of the shares in the Company being declared unconditional in all respects or becoming effective, the offeror and/or its associates have or will have more than 50% of the voting rights in the Company; or
• the Free Float of the Company is less than 30% of the issued ordinary shares for at least five consecutive dealing days (where the Free Float is (a) all outstanding ordinary shares of the Company less those held by or on behalf of TUI AG, its associates and any persons acting in concert with it and (b) the ordinary shares underlying the outstanding secured exchangeable bonds due 2013 issued by Nero Finance Limited on 16 January 2008).
TUI AG subscribed, at the issue price, for 50% of the convertible bond offering to prevent the potential dilution of its majority shareholding.
£80 million of bonding facility agreementsAgreements between a number of surety companies and the Company relating to bonding facilities of £80m currently provided to the Company contain terms which give the sureties the right to cancel all commitments to the Company and to declare all outstanding bonds immediately due and payable if a change of control occurs. For the purpose of this agreement a change of control occurs if:
• any person or group of persons acting in concert gains control of the Company; or
• TUI AG and any persons acting in concert with it acquires or acquire 75% or more of the voting shares in the Company.
£275m partnership arrangements In May 2011, the Company entered into a limited liability partnership arrangement and a Scottish limited partnership arrangement with three of its UK defined benefit pension schemes to address the ongoing funding and management of the pension schemes. Under the partnership arrangements, the Company committed to making payments of up to £275 million in 2026, if and to the extent that the pension schemes remain in deficit at that time. The partnership agreements contain terms which give the pension schemes the right to wind-up the partnerships and require an injection of up to £275 million by the Company if there is a restructuring or reorganisation of the assets of the Company which results in a reduction of the Company’s consolidated net assets to less than £1,100 million following the occurrence of a change of control. For the purposes of the partnership agreements a change of control occurs if:
• Following a takeover offer for the Company a person or group of persons acting in concert acquire more than 30% of the voting rights in the Company; or
• TUI AG and any persons acting in concert with it acquires or acquire 75% or more of the voting rights in the Company and/or the Company’s listing is cancelled.
Significant agreements – change of controlThe Companies Act 2006 requires us to disclose any significant agreements that take effect, alter or terminate on a change of control of the Company.
Relationship Agreement with TUI AGThe Relationship Agreement between TUI AG and TUI Travel, dated 29 June 2007, includes the principle that TUI Travel will operate independently of TUI AG and records the understanding between TUI AG and TUI Travel regarding the relationship between them and the governance of TUI Travel. The Relationship Agreement will remain in force until either the shares in TUI Travel are no longer traded on the London Stock Exchange, or TUI AG has less than 10% of the rights to vote at general meetings. In addition, in the event that another party acquires control of TUI AG during the term of the Relationship Agreement, TUI AG will lose certain rights under the Relationship Agreement including its rights in respect of the composition of the Board.
The Relationship Agreement contains restrictions on the acquisition by TUI AG of additional shares in TUI Travel which result in the increase of its shareholding to more than 55% of the voting rights on a fully-diluted basis (save where TUI AG makes a general offer to acquire all TUI Travel shares in issue). A number of bonds are held on TUI AG’s behalf and, if converted at the conversion price set on the launch date, would give rise to 52,309,463 new shares. On a fully-diluted basis (if shares held by all bondholders were converted), TUI AG had a holding of 51.50% as at 30 September 2012. As a percentage of shares in issue, TUI AG’s holding as at 30 September 2012 was 56.26%.
TUI AG has anti-dilution rights in respect of further issues of shares in TUI Travel other than on a pre-emptive basis. TUI Travel has also agreed that certain matters will require the prior approval of 80% of the Directors present at the meeting of the Board at which such matter is considered, including material changes to the business of any Group company, acquisitions and disposals of a value which exceeds £10m, the entry into, variation or redemption prior to their due date of any borrowing facilities and the approval of the annual budget.
£1,155 million bank revolving credit facility agreementAn agreement dated 17 May 2011 between a number of relationship banks and the Company relating to a £1,155m bank revolving credit facility currently provided to the Company, contains terms which give the lending banks the right to cancel all commitments to the Company and to declare all outstanding credits and accrued interest immediately due and payable if a change of control occurs. For the purpose of this agreement a change of control occurs if:
• any person or group of persons acting in concert gains control of the Company; or
• TUI AG and any persons acting in concert with it acquires or acquire 75% or more of the voting shares in the Company.
£350 million 6.0% convertible bondsIn September 2009, the Company issued £350 million of 6.0% convertible bonds with a conversion price set at 349.30p per share. The settlement took place on 5 October 2009. The convertible bonds contain terms which give the bondholders the right to redeem the bonds at their principal amount, together with accrued and unpaid interest up to the date of redemption, if a change of control occurs. For the purpose of the convertible bonds a change of control occurs if:
• following a takeover offer to acquire all or a majority of the shares in the Company being declared unconditional in all respects or becoming effective, the offeror and/or its associates have or will have more than 50% of the voting rights in the Company; or

www.tuitravelplc.com
54 TUI Travel PLC Annual Report & Accounts 2012
TT11 | AR 2012 | 20/12/2012 | Proof 5
Governance
Directors’ report continued
Other informationOther information relevant to the Directors’ report can be found in the following sections of the Annual Report:
Information Location in Annual Report
Our people Page 28Sustainable development Page 32Charitable and political donations Page 35Outlook Page 49Board and Committee Membership Page 50Financial risk management Page 130Pension schemes Financial statements – Note 6(C)Acquisitions Financial statements – Note 13Post balance sheet events Financial statements – Note 34Share capital Financial statements – Note 23
The Directors’ report was approved by a duly authorised Committee of the Board of Directors on 3 December 2012 and signed on its behalf by Andrew John, the Company Secretary.
By Order of the Board
Andrew JohnCompany Secretary3 December 2012Company Number: 6072876
Restrictions on the transfer of shares At 30 September 2012, 233,366,705 ordinary shares of the Company, representing 20.87% of the Company’s share capital on an undiluted basis had previously been sold by TUI AG to two independent special purpose companies and were restricted from being transferred. TUI AG remains entitled to receive the dividend yields of these shares and also has the voting rights attached to these shares. TUI AG is entitled to repurchase 146,399,656 of these shares by April 2013 at the latest and 86,967,049 of these shares by July 2014 at the latest.
In April 2010, the Company issued a £400m fixed rate 4.9% convertible bond, of which Antium Finance Ltd, an independent single purpose company subscribed for 50%. TUI AG entered into a forward purchase agreement with Antium Finance Ltd for these £200m convertible bonds, in order to prevent dilution of its majority shareholding. TUI AG is entitled to receive the interest coupon on these bonds and to repurchase these bonds by July 2014 at the latest.
Significant shareholders At the date of approval of the Annual Report & Accounts 2012, the Company had been notified of the following holdings in excess of 3% in its issued share capital.
Shareholder Number of shares Percentage (%)
TUI AG 630,988,003 56.44Monteray Enterprises 60,053,493 5.37BlackRock 36,667,683 3.28
Going concern After making appropriate enquiries, the Directors have reasonable expectation that the Company and Group have adequate resources to continue operations for the foreseeable future. For this reason, they continue to adopt the going concern basis in preparing the financial statements.
A further summary of funding and liquidity is included in Note 1(B)(v) to the consolidated financial statements.
Post balance sheet eventsDetails of post balance sheet events are included in Note 34 of the consolidated financial statements.
Contractual arrangementsThe Group has contractual arrangements with numerous third parties in support of its business activities.
AuditorsA resolution to re-appoint PricewaterhouseCoopers LLP will be proposed at the Annual General Meeting.

TT11 | AR 2012 | 20/12/2012 | Proof 5
www.tuitravelplc.com
TUI Travel PLC Annual Report & Accounts 2012 55G
overnance
Governance
Directors’ responsibilities statement
The Directors are responsible for the maintenance and integrity of the Company’s website. Legislation in the United Kingdom governing the preparation and dissemination of financial statements may differ from legislation in other jurisdictions.
Each of the Directors, whose names and functions are listed on page 51 confirm that, to the best of their knowledge:
• the Group financial statements, which have been prepared in accordance with IFRSs as adopted by the EU, give a true and fair view of the assets, liabilities, financial position and profit of the Group; and
• the Directors’ Report includes a fair review of the development and performance of the business and the position of the Group, together with a description of the principal risks and uncertainties that it faces.
The Directors also confirm that:
• so far as they are aware, there is no relevant audit information of which the Company’s auditors are unaware; and
• they have taken all the steps that they ought to have taken as a Director in order to make themselves aware of any relevant audit information and to establish that the Company’s auditors are aware of that information.
The Directors’ Responsibilities Statement was approved by a duly authorised Committee of the Board of Directors on 3 December 2012 and signed on its behalf by William Waggott, Chief Financial Officer.
William WaggottChief Financial Officer3 December 2012
The Directors are responsible for preparing the Annual Report, the Directors’ Remuneration Report and the financial statements in accordance with applicable law and regulations.
Company law requires the Directors to prepare financial statements for each financial year. Under that law the Directors have prepared the Group financial statements in accordance with International Financial Reporting Standards (IFRSs) as adopted by the European Union, and the Parent Company financial statements in accordance with United Kingdom Generally Accepted Accounting Practice (United Kingdom Accounting Standards and applicable law). Under company law the Directors must not approve the financial statements unless they are satisfied that they give a true and fair view of the state of affairs of the Group and the Company and of the profit or loss of the Group for that period. In preparing these financial statements, the Directors are required to:
• select suitable accounting policies and then apply them consistently;
• make judgements and accounting estimates that are reasonable and prudent;
• state whether IFRSs as adopted by the European Union and applicable UK Accounting Standards have been followed, subject to any material departures disclosed and explained in the Group and Parent Company financial statements respectively;
• prepare the financial statements on the going concern basis unless it is inappropriate to presume that the Company will continue in business.
The Directors are responsible for keeping adequate accounting records that are sufficient to show and explain the Company’s transactions and disclose with reasonable accuracy at any time the financial position of the Company and the Group and enable them to ensure that the financial statements and the Directors’ Remuneration Report comply with the Companies Act 2006 and, as regards the Group financial statements, Article 4 of the IAS Regulation. They are also responsible for safeguarding the assets of the Company and the Group and hence for taking reasonable steps for the prevention and detection of fraud and other irregularities.

www.tuitravelplc.com
56 TUI Travel PLC Annual Report & Accounts 2012
TT11 | AR 2012 | 20/12/2012 | Proof 5
Governance
Corporate Governance report
Board procedures/responsibilitiesThe Board meets regularly, including away days, and is responsible for the overall leadership, strategy and control of the Group. The schedule of matters specifically reserved to it for decision includes:
• determining the strategy of the Group;
• amendments to the structure and capital of the Group;
• approval of financial reporting;
• oversight of the Group’s internal controls;
• approval of capital and revenue expenditure of a significant size;
• acquisitions, disposals and share dealings;
• Board membership and appointments;
• approval of remuneration of Directors and certain senior management;
• corporate governance matters; and
• approval of Group policies and risk management strategies.
The Board has overall responsibility for ensuring the effectiveness of the Group’s system of internal control and risk management framework and this has been developed in accordance with the Code. This system of control is designed to manage and mitigate rather than eliminate the risk of failure to achieve business objectives. In pursuing these objectives, internal controls – which include financial, operational and compliance controls – and risk management can only provide reasonable, and not absolute, assurance against material loss.
The role of management is to implement Board policies on risk and control and the Board has delegated the day-to-day management of the Company to the Chief Executive and, through him, to the other Executive Directors and the Group Management Board (GMB).
The key elements of the control framework and review processes in place across the Group are as follows:
• The Board sets corporate strategy and business objectives. The GMB and Sector management integrate these objectives into their operational and financial business plans.
• The GMB meets regularly, together with other senior executives, to consider Group operational and financial performance and business development. The Chief Executive reports to the Board on behalf of the GMB on significant changes in the business and the external environment. The Chief Financial Officer provides the Board with financial information which includes key performance and risk indicators.
• The Group operates a risk management process which is integrated within the short and long-term business planning processes (see page 20).
• The Treasury position of the Group, including cash, foreign exchange and fuel hedging exposure, is managed centrally in accordance with policies appropriate for each Sector and is the responsibility of the Chief Financial Officer and Group Treasurer.
• Financial forecasts, providing predicted results with sensitivity analysis, are prepared routinely throughout the year for review by the GMB and the Board. These forecasts also include details of the Group’s ongoing compliance with its regulatory and banking requirements.
• The Group has established investment appraisal and authorisation procedures and its capital expenditure is reviewed against budgets which have been approved by the Board.
• The Group also routinely assesses the capability of its people to deliver the business objectives set and responds accordingly. This is supported by the three lines of defence.
The Company has complied with all relevant provisions of the UK Corporate Governance Code (“the Code”) except in the areas detailed in the report and set out on page 60.
The Board The Company is controlled through its Board of Directors – the Directors at year end and the date of this report are:
Director’s name Title
Horst Baier Non-Executive DirectorDr Volker Böttcher Managing Director, German Specialist BusinessesTony Campbell Independent Non-Executive DirectorRainer Feuerhake Non-Executive DirectorDr Michael Frenzel Non-Executive ChairmanSir Michael Hodgkinson Independent Non-Executive Deputy Chairman
& Senior Independent DirectorJanis Kong Independent Non-Executive DirectorPeter Long Chief ExecutiveJohan Lundgren Deputy Chief ExecutiveColine McConville Independent Non-Executive DirectorMinnow Powell Independent Non-Executive DirectorDr Erhard Schipporeit Independent Non-Executive DirectorDr Albert Schunk Independent Non-Executive DirectorHarold Sher Independent Non-Executive DirectorWilliam Waggott Chief Financial Officer
Johan Lundgren was appointed Deputy Chief Executive with effect from 20 October 2011 and Clare Chapman resigned on 19 October 2011. Janis Kong was appointed as an Independent Non-Executive Director on 29 May 2012.
Following an announcement made by TUI AG in July 2012, TUI Travel announced that Dr Michael Frenzel will retire from his position as Chairman of the Board in September 2013.
As at 30 September 2012, the Board comprised four Executive Directors and 11 Non-Executive Directors (including the Chairman). Biographical details of all the Directors are set out on page 51.
In accordance with the Code, all Directors will be subject to annual re-election by shareholders. To enable shareholders to make an informed decision, the 2013 Notice of the Annual General Meeting (AGM) includes biographical details and a statement as to why the Company believes the Directors should be re-elected. The Chairman intends to confirm at the AGM that the performance of each individual continues to be effective and demonstrates commitment to the role.
The Board recommends to shareholders the re-appointment of all Directors retiring at the meeting on the basis that they are all effective Directors of the Company and demonstrate the appropriate level of commitment in their respective roles.
The terms of the Directors’ service contracts are disclosed in the Remuneration Report commencing on page 66. Directors’ interests in the shares of the Company are disclosed on page 77.
Directors’ service contracts and the letters of appointment of the Non-Executive Directors are available for inspection at the Company’s registered office and will be available at the AGM which is scheduled to take place on Thursday 7 February 2013.
Following the appointment of any new Director, the Chairman, in conjunction with the Company Secretary, ensures that a full, formal and tailored induction to the Company is made available. The Company Secretary is on hand to answer any questions which may arise. All Directors have been given a detailed induction and training manual. During the year, Coline McConville and Janis Kong have been given specific overviews on certain parts of the business as part of their induction programme and other Non-Executive Directors are invited to join these briefings.

TT11 | AR 2012 | 20/12/2012 | Proof 5
www.tuitravelplc.com
TUI Travel PLC Annual Report & Accounts 2012 57G
overnance
Governance
Directors’ conflicts of interests Under the Companies Act 2006, the Directors have a statutory duty to avoid a situation where they have, or could have, a direct or indirect interest that conflicts, or possibly may conflict, with the interests of the Company. Directors of public companies may authorise conflicts and potential conflicts where appropriate, if the articles of association contain a provision to this effect.
The Company’s articles of association permit the Board to authorise actual or potential conflicts of interest. The Company has established formal procedures for the disclosure and review of any conflicts, or potential conflicts, of interest which the Directors may have and for the authorisation of such conflict matters by the Board. In deciding whether to authorise a conflict or potential conflict the Directors must have regard to their general duties under the Companies Act 2006. The authorisation of any conflict matter, and the terms of authorisation, may be reviewed at any time and will be reviewed formally by the Board on an annual basis. The Board believes that the procedures established to deal with conflicts of interest are operating effectively.
Board effectiveness and individual performance of Directors An effectiveness survey of the Board and its Committees (Audit, Remuneration & Nomination) was undertaken during June/July 2012. The survey comprised a series of questions in relation to the running of, and business conducted at, Board meetings and the performance of individual Directors (including the Chairman). The survey was undertaken online and was facilitated, and the responses collated, by an external provider which has no connection with the Company. Each Director was asked to place a score against a variety of questions and the Directors were able to make additional comments where appropriate.
Summary reports were produced by the external facilitator following analysis of the responses by broad category and by reference to a traffic-light system showing the number of red, amber and green scores. These reports, which included conclusions reached by the facilitator, were presented to a meeting of the Board in September 2012 on an anonymous basis and were considered and debated. Various action points were agreed.
Independence of Non-Executive DirectorsThe Chairman, Dr Michael Frenzel, did not meet the independence criteria laid out in the provisions of the Code at the time of his appointment. This is because Dr Frenzel is the Chief Executive of TUI AG – a 56.26% shareholder of the Company as at 30 September 2012.
Details of the Chairman’s other significant commitments are given in his biography on page 51. The Chairman does have a number of other external roles but the Board is satisfied that these do not interfere with the performance of his duties as Chairman of the Company.
Of the other 10 Non-Executive Directors, two are not considered to be independent – Horst Baier is also an Executive Director of TUI AG and Rainer Feuerhake was a member of TUI AG’s Executive Board until his resignation in February 2010.
The Non-Executive Directors considered to be independent are Sir Michael Hodgkinson, Tony Campbell, Janis Kong, Coline McConville, Minnow Powell, Dr Erhard Schipporeit, Dr Albert Schunk and Harold Sher.
The Board recognises that the Code requires that at least half the Board, excluding the Chairman, should be independent Non-Executive Directors. The Company was compliant with provision B1.1 of the Code throughout the year ended 30 September 2012. The Board is committed to ensure that its membership is refreshed regularly.
Processes are in place to ensure appropriate action is taken where necessary to remedy any deficiencies identified through the Group’s internal control and risk management processes.
These key elements of effective risk management are reviewed and monitored at the Group Risk Management Committee (GRMC).
The GRMC is chaired by the Chief Executive and comprises members of the GMB, the Director of Group Audit Services, the Director of Financial Reporting & Control and the Chief Information Officer. Meetings of the GRMC are held four times a year and membership is reviewed annually.
The GRMC’s core duties are to assist the Board in fulfilling its responsibilities through:
• providing an oversight of the framework for managing risk throughout the Group;
• reviewing the effectiveness of the Group’s risk management framework and internal control systems for managing risk;
• determining the nature and extent of the significant risks the Group is willing to take;
• monitoring performance and changes in the Group risk profile; and
• identifying the most significant risks to the Group and agreeing responsibility for appropriate mitigating strategies.
The Audit Committee, on behalf of the Board, has reviewed the effectiveness of internal controls during the year and confirms that:
• there is an ongoing process for identifying, evaluating and managing the significant risks faced by the Group;
• this has been in place for the year under review and up to the date of approval of the Annual Report and Accounts;
• the process is regularly reviewed by the Board; and
• the process accords with the Code.
The division of responsibilities between the Chairman and Chief Executive is clearly established, has been agreed by the Board and is reviewed by the Company Secretary on a regular basis. The Board approves any necessary changes to reflect changes in legislation, policy and practices.
All Directors have access to the advice and services of the Company Secretary and can take independent professional advice, if necessary, at the Company’s expense. To the Company Secretary’s knowledge, no such advice was sought by any Director during the year.
The Company Secretary is responsible for ensuring Board procedures are followed including the formal minuting of any unresolved concerns that any Director may have in connection with the operation of the Company. During the year there were no such unresolved issues.
During the year an iPad-based paperless meeting system was introduced with the intention of replacing hard copy packs for Board meetings with electronic papers. In the first instance it was rolled out to the TUI Travel PLC Board and its Committees and subsequently to the Group Management Board (GMB) and other Sector Boards and Committees. The plan had been to introduce the iPad gradually alongside hard copy Board papers but it became clear that this would not be required as the Board welcomed paperless meetings from the start and were impressed with the speedy delivery of papers and ease of use during meetings. This supports TUI Travel’s online drive across the Group and is consistent with reducing the impact of our operations on the environment.
The Terms of Reference for the Board and its Committees are available for inspection on the Group’s website www.tuitravelplc.com and will be available at the AGM.

www.tuitravelplc.com
58 TUI Travel PLC Annual Report & Accounts 2012
TT11 | AR 2012 | 20/12/2012 | Proof 5
Governance
Corporate Governance report continued
Committee and Remuneration Committee due to commitments made prior to her appointment to the TUI Travel PLC Board.
Nomination Committee The Nomination Committee comprises three independent Non-Executive Directors and two Shareholder Directors (the latter being appointed in accordance with the Relationship Agreement).
As at 30 September 2012, the Committee comprised three Independent Non-Executive Directors and two Shareholder Directors. The Chairman is Sir Michael Hodgkinson and the other members are Minnow Powell (Independent), Harold Sher (Independent), Dr Michael Frenzel (Shareholder) and Rainer Feuerhake (Shareholder). Clare Chapman (Independent) resigned on 19 October 2011 and Minnow Powell and Harold Sher were both appointed on 2 December 2011.
The Committee did not comply with the provision that a majority of the Directors be independent following Jeremy Hicks’ resignation in January 2011 and Clare Chapman’s resignation in October 2011 until the appointments of Minnow Powell and Harold Sher in December 2011. Dr Frenzel and Mr Feuerhake, being Shareholder Directors, are not considered independent.
Meetings Four meetings of the Nomination Committee took place during the year – in October and December 2011 and May and September 2012. These meetings were in respect of the appointments of Johan Lundgren as Deputy Chief Executive, Sir Michael Hodgkinson as a member of the Remuneration Committee (following Clare Chapman’s resignation), Bill Dalton’s appointment as Chairman of the Remuneration Committee, the appointments of Minnow Powell and Harold Sher as members of the Nomination Committee, the appointment of Coline McConville to the Audit and Remuneration Committees and the appointment of Janis Kong as a Non-Executive Director. In September 2012, the Committee focused on succession planning and talent management across the Group.
Nomination Committee Effectiveness SurveyIn the Nomination Committee effectiveness survey some suggestions were made in respect of refining the processes through which the Committee operates and the Chairman of the Committee is implementing these.
See page 61 for full details of the Nomination Committee and work during the year.
Meetings of the Non-Executive DirectorsA meeting of the Non-Executive Directors was scheduled to take place in February 2012 with Dr Frenzel in the Chair. Unfortunately, due to a sudden illness, Dr Frenzel was unable to attend and the Senior Independent Director – Sir Michael Hodgkinson – took the Chair. The main focus of the meeting was to discuss meetings that had been held with shareholders prior to the Annual General Meeting. In March 2012, a further meeting of the Non-Executive Directors, led by Sir Michael and without the Chairman being present, was held to appraise the Chairman. It was concluded that the Chairman manages meetings well and allows full and open debate. Two meetings have been scheduled for 2013 and others will be held as the need arises.
Attendance of Directors at meetings of the Board and its Committees Nomination Audit Remuneration Board Committee Committee Committee meetings meetings meetings meetings
Horst Baier (Non-Executive) 8(8) – – –Dr Volker Böttcher (MD German Specialist Businesses) 7(8) – – –Tony Campbell (Independent Non-Executive) 8(8) – 10(11) 6(7)Clare Chapman (Independent Non-Executive) 0(1) 0(1) – 1(1)Bill Dalton (Independent Non-Executive) 4(6) – 4(7) 5(6)Rainer Feuerhake (Non-Executive) 6(8) 3(4) – 6(7)Dr Michael Frenzel (Non-Executive Chairman) 7(8) 4(4) – 6(7)Sir Michael Hodgkinson (Deputy Chairman & Senior Independent Director) 8(8) 4(4) 10(11) 6(6)Janis Kong (Independent Non-Executive) 2(2) – 1(2) 1(1)Peter Long (Chief Executive) 8(8) – – –Johan Lundgren (Deputy Chief Executive) 8(8) – – –Coline McConville (Independent Non-Executive) 7(8) – 6(9) 4(5)Minnow Powell (Independent Non-Executive) 8(8) 2(2) 11(11) –Erhard Schipporeit (Independent Non-Executive) 6(8) – – –Dr Albert Schunk (Non-Executive) 7(8) – – –Harold Sher (Non-Executive) 8(8) 1(2) – –Will Waggott (Chief Financial Officer) 8(8) – – –
Figures in brackets indicate the maximum number of meetings during the year in which the individual was a Board member.
Dr Frenzel was unable to attend the Annual General Meeting and the Board meeting in February 2012 due to a sudden illness which prevented him from flying.
Coline McConville was not present for two of the three meetings of the Audit Committee which were held to approve announcements. She was unable to attend the May meetings of the Board, Audit
TUI Travel PLC
Nomination Committee Remuneration CommitteeAudit Committee
Delegated authoritiesSets remuneration and incentives for the Executive Directors; approves and monitors remuneration and incentive plans for the Group.
MembersColine McConville ChairmanDr M H F FrenzelR FeuerhakeSir Michael HodgkinsonJanis Kong
Delegated authoritiesEnsures that the Board and Committee composition has the optimum balance of skills, knowledge and experience by nominating suitable candidates for approval by the Board to fill executive and non-executive vacancies.
MembersSir Michael Hodgkinson ChairmanDr Michael FrenzelRainer FeuerhakeMinnow PowellHarold Sher
Delegated authoritiesMonitors the Group’s integrity in financial reporting and reviews the effectiveness of the risk management framework.
MembersMinnow Powell ChairmanJanis KongSir Michael HodgkinsonColine McConville
Board governance structure

TT11 | AR 2012 | 20/12/2012 | Proof 5
www.tuitravelplc.com
TUI Travel PLC Annual Report & Accounts 2012 59G
overnance
Governance
Anti-Bribery & Corruption Following the implementation of the Bribery Act 2010 in July 2011 (affecting UK companies, their worldwide subsidiaries and associated companies, agents and suppliers), TUI Travel has rolled out a comprehensive Anti-Bribery and Anti-Corruption training programme (the ABC programme) across all Group companies led by the new Group Legal & Regulatory Compliance function and implemented by newly-recruited Sector Compliance leads and Human Resources’ functions (see ‘Compliance at TUI Travel’). The ABC programme adopts a COSO Project-compatible control-environment approach with a consistent level of control across the Group while also recognising the requirements of the various jurisdictions in which the Company operates. In August 2012, an ABC checklist was sent to all businesses across the Group to assess the consistency of base-level operational Legal & Regulatory controls in place around the Group and the results are currently being analysed.
All of the Group Reward Population (GRP) – our senior directors and managers – pledged to support the ABC programme and agreed to communicate their commitment to their employees, establishing TUI Travel’s ‘tone from the top’ anti-corruption culture. The TUI Travel PLC Board, all Sector Boards, Group Management Board, Group Risk Management Committee, all inhouse legal counsel, the GRP and the majority of senior managers have undergone 1.5 hours of risk-focused, travel-industry specific face-to-face legal training on their specific responsibilities under anti-bribery legislation. In addition, just under half (circa 26,000) of all of our employees have also undertaken online ‘E-learning’ training in ABC issues, with all appropriate employees on target to complete this training by 31 December 2012.
Anti-Bribery and Gifts & Hospitality policies have been communicated across the Group. Additional reporting channels consisting of a Compliance Information Line ([email protected]) and new Employee Hotlines have been established. A Compliance intranet page to give greater online visibility of our initiatives is in development.
Group Audit Services administer a yearly Conflict of Interest declaration for 2,000 senior managers which will extend to new joiners in 2012/13. ABC awareness is being added to induction procedures around the Group. Anti-Bribery contractual clauses for supplier contracts have also been rolled out across the Group and a Supplier Code of Conduct detailing TUI Travel expectations of its suppliers’ ABC procedures is in development. ABC issues specific to the travel industry have been discussed at industry and Government level and TUI Travel continues to foster these relationships.
Audit Committee The Audit Committee comprises four independent Non-Executive Directors.
From 1 October 2011 until 31 January 2012, the membership of the Audit Committee was Minnow Powell, Tony Campbell, Bill Dalton and Sir Michael Hodgkinson – all being independent Non-Executive Directors.
Coline McConville (Independent Non-Executive Director) was appointed a member of the Committee on 2 December 2011 and Bill Dalton resigned with effect from 29 May 2012. Janis Kong (Independent Non-Executive Director) was appointed on 26 July 2012 and Tony Campbell resigned on 1 October 2012. Therefore the Company complied with the provision that the Audit Committee should consist of at least three Independent Non-Executive Directors throughout the year. The Chairman, Chief Executive, Chief Financial Officer, Director of Group Audit Services and the external auditor are invited, and routinely attend all meetings and other Non-Executive Directors may also attend.
MeetingsThe Audit Committee met 11 times during the year – three of these meetings were specifically called to review and approve draft announcements, results and trading statements of the Company.
Audit Committee Effectiveness SurveyNo major concerns were raised in the survey.
See page 62 for full details of the Audit Committee and work during the year.
Remuneration CommitteeThe Remuneration Committee comprises four independent Non-Executive Directors and two Shareholder Directors (the latter being appointed in accordance with the Relationship Agreement).
Clare Chapman was Chairman of the Remuneration Committee until her resignation on 19 October 2011 when she was replaced by Bill Dalton. Coline McConville was appointed a member of the Committee on 2 December 2011 and replaced Bill Dalton as Chairman following his resignation on 29 May 2012. Janis Kong was also appointed as a member of the Committee on 26 July 2012 and Tony Campbell will step down as a member of the Committee with effect from 1 October 2012.
Meetings The Remuneration Committee met seven times during the year (see page 58).
Remuneration Committee Effectiveness SurveyNo major concerns were raised in the survey.
See the Remuneration Report (on page 66) for full details of the Remuneration Committee and its work during the year.
www.tuitravelplc.com
60 TUI Travel PLC Annual Report & Accounts 2012
TT11 | AR 2012 | 20/12/2012 | Proof 5
Governance
Corporate Governance report continued
As a result of the extensive investor feedback provided by the Chief Executive, the Chief Financial Officer, and those NEDs who did meet with shareholders, the remaining Non-Executive Directors did not consider it necessary to meet with other major shareholders during the year. They believe that they are kept aware of all issues, which are fed back to them at Board meetings, and therefore additional meetings were not required. However, they would make themselves available if any shareholder requested such a meeting.
Regular updates are produced by our brokers and circulated to the Board to keep them informed of market and industry views. The updates also include analyst views of TUI Travel’s position in the market.
There is an opportunity for shareholders to question the Chairman and other Directors (including the Chairmen of the Audit, Remuneration and Nomination Committees) at the AGM. The AGM also provides a forum for the Non-Executive Directors to discuss the views of shareholders with them directly.
In respect of general meetings of the Company:
• The Company prepares separate resolutions on each substantially separate issue and does not combine resolutions together inappropriately;
• Proxy appointment forms provide shareholders with the option to vote for, against or to withhold their vote. The proxy form makes it clear that a ‘vote withheld’ is not a vote in law and will not be counted;
• All postal proxy votes are returned to Equiniti (the Company’s Registrar) which is responsible for ensuring votes are properly received and counted;
• Proxy counts are displayed at the close of the AGM and the final poll results are posted on the Company’s website www.tuitravelplc.com following the closure of the meeting; and
• The Annual Report and Accounts is laid before shareholders at the AGM.
UK Corporate Governance Code ProvisionsFor the reasons disclosed within this Annual Report, during the year the Company did not fully comply with the following provisions:
• Code Provision A2.2. The Chairman should on appointment meet the independence criteria set out in Code A3.1 (see page 57);
• Code Provision B2.1. The majority of members of the Nomination Committee should be independent non-executive directors. Following Clare Chapman’s resignation in October 2011 until the appointment of Minnow Powell and Harold Sher (both Independent) on 2 December 2011, the majority of the members was not independent. Dr Michael Frenzel and Rainer Feuerhake are not considered independent for the reasons given on page 57;
• Code Provision D2.1. If the Company Chairman is a member of the Remuneration Committee, he must be considered independent on appointment (see page 57).
Andrew JohnCompany Secretary3 December 2012
Whistle-blowing Employees in the UK, Germany, USA, Canada, Poland, Switzerland, Belgium, the Netherlands, Norway, Denmark, Sweden and Finland now have access to confidential whistle-blowing hotlines and webmail facilities. Austria, Bulgaria, China, France, Greece, Italy, Portugal, Russia, Spain and the Ukraine are currently going through the approval process with each country’s Data Protection Authority. Together, these confidential hotlines and webmail reporting facilities cover 80% of our total employees and 98% of Group revenue. Hotlines and webmail reporting facilities have also been commissioned to cover the remaining 20% of employees in all our jurisdictions, where the law permits, by the end of the calendar year 2012.
Any matters arising from the use of the whistle-blowing channels are investigated and appropriate and a summary provided to the Audit Committee.
The TUI Travel Code of Conduct (the Code of Conduct) makes it clear that employees can approach senior executives, or Group Audit Services, to make reports and emphasises that anyone making a report with honest intentions need not fear any adverse consequences even if the information provided proves to be unfounded.
Communication with shareholdersThe Chief Executive, Chief Financial Officer and members of the Investor Relations’ team hold regular meetings with major shareholders to review the Group’s performance and prospects. The views of shareholders are communicated to all members of the Board following such meetings. During the course of these meetings the issue of governance is discussed. Presentations to major shareholders are made at least twice yearly, after the announcement of the interim and preliminary results, details of which, together with the Group’s financial reports and other announcements, can be accessed via the Group’s website www.tuitravelplc.com/investors-media.
The Code recommends that the Senior Independent Director meets with a range of major shareholders to gain an understanding of their views. Both Sir Michael Hodgkinson (Senior Independent Director) and Clare Chapman (Former Chairman of the Remuneration Committee) met with major shareholders during the course of the year. In December 2011, discussions covered business strategy and remuneration philosophy. An update was given on performance measures applied to certain LTIP schemes and the promotion of Johan Lundgren to the role of Deputy Chief Executive was also covered.
Minnow Powell had three meetings with major shareholders prior to last year’s AGM which was held in February 2012. The three meetings were arranged to discuss the change of auditors and the Group’s control environment was also addressed.
Coline McConville and Sir Michael Hodgkinson have meetings scheduled with several major shareholders for October 2012 to introduce Coline as Chairman of the Remuneration Committee, explain the changes in the Committee membership and to discuss remuneration policy generally.

TT11 | AR 2012 | 20/12/2012 | Proof 5
www.tuitravelplc.com
TUI Travel PLC Annual Report & Accounts 2012 61G
overnance
DiversityThe Nomination Committee’s objectives are to:
• achieve at least 25% female representation among the Board’s membership by 2015;
• ensure that at least half of the initial applicant pool for Board appointments consists of women;
• engage executive search firms who have signed up to the voluntary Code of Conduct on gender diversity and best practice;
• report annually against these objectives and other initiatives taking place within the Company which promote gender, international, ethnic and other forms of diversity; and
• report annually on the outcome of the Board evaluation, the composition and structure of the Board as well as any issues and challenges the Board is facing when considering the diverse make-up of the Company.
Focus for 2012/13The plan is to:
• ensure that the composition of the Board is refreshed by a rigorous selection process taking into account all aspects of diversity and the appropriate mix of skills;
• continue to support succession plans and the development of the executive director team;
• ensure that talent is recognised and nurtured across the organisation and that suitable development programmes are in place for key managers;
• review ongoing knowledge and training for all directors on a continual basis; and
• assist the development of a pipeline of high-calibre candidates by encouraging a broad range of senior individuals within the business to take on additional roles to gain valuable board experience.
Sir Michael HodgkinsonChairman & Senior Independent Director3 December 2012
During the year we recommended two major appointments to the Board. Johan Lundgren was appointed Deputy Chief Executive with effect from 20 October 2011 and Janis Kong was appointed as an Independent Non-Executive Director on 29 May 2012. Janis succeeds Bill Dalton following his retirement.
Prior to appointing Janis, a description of the role and required capabilities was prepared. The composition of the Board was reviewed in terms of nationality, gender, background, experience, independence, skillsets and the collective knowledge of the Board to ensure that the right mix was achieved. Consideration was also given to whether Janis would have sufficient time available to devote to her duties. We felt that Janis’ experience in senior roles such as non-executive director of Network Rail, Kingfisher, Royal Bank of Scotland and BAA, together with executive roles over 33 years with BAA plc, meant that she had a wealth of experience behind her. This experience would be extremely beneficial and enable her to effectively challenge and add value to the Board’s discussions.
Janis was given a comprehensive Induction & Training Manual and has also received tailored presentations on specific areas of the Group during the year. Further information on the Company’s induction programme can be found on page 56.
The appointment of Janis, together with that of Coline McConville in September 2011, means that the percentage of women on the Board has increased from 6.7% in the prior year to 13.3%.
The composition of the Committee was also reviewed during the year. Minnow Powell and Harold Sher were both appointed to refresh its membership and ensure the Company’s compliance with the Code.
We have focused on ensuring that succession is a key agenda item and consideration was given to this at a meeting held in September 2012. This was in respect of the Executive Directors and senior management team as well as the Board over the medium to long-term. The meeting also considered talent management across the Group.
Governance
Nomination Committee
Sir Michael HodgkinsonChairman

www.tuitravelplc.com
62 TUI Travel PLC Annual Report & Accounts 2012
TT11 | AR 2012 | 20/12/2012 | Proof 5
As Chairman of the Audit Committee it is my responsibility to ensure that the Committee is rigorous and effective in its role of monitoring and reviewing:
• the integrity of the financial statements of the Company (including formal announcements relating to the Company’s financial performance and the significant financial reporting judgements contained therein);
• the effectiveness of internal controls and the risk management framework (including presentations from Group, Sector, regional and functional management);
• the effectiveness of Internal Audit (including agreeing in advance the work of Group Audit Services and reviewing the results of the work undertaken);
• the arrangements by which employees may raise concerns regarding potential impropriety in confidence and ensuring these concerns are investigated appropriately; and
• the integrity of the Group’s relationship with the external auditors and the effectiveness of the audit process (including reviewing the policy for the engagement of the external auditors to supply non-audit service, considering the appointment, re-appointment and removal and approving the remuneration and terms of engagement of the external auditors).
During the year we have continued to focus on improving key financial controls, processes and procedures. While I am pleased with the progress we have achieved this year in fulfilling our responsibilities, there are still further significant improvements to be implemented and embedded across the Group over the next two years.
I am satisfied that the Audit Committee was presented with papers of good quality during the year, provided in a timely fashion to allow due consideration of the subjects under review. I am also satisfied that meetings were scheduled to allow sufficient time to enable full and informed debate. We also reviewed our Terms of Reference of the Committee during the year and these were approved by the Board. These are available on www.tuitravelplc.com/investors-media.
During the year we invited a number of members of management to present to the Committee on key areas of risk and control. I met, individually and in private, with management in order to understand more fully the context and challenges
of their business operations and thereby ensure the Committee’s time was used most effectively. We, together and individually, visited various parts of the business and met informally with a number of members of management below Board level to gain a deeper insight into areas relevant to the role of the Committee.
The Committee held private sessions with the Director of Group Audit Services and also the Lead Partner from our external auditors during the year, both without management present.
The activities of the Committee members during the last year have enabled us to gain a good understanding of the culture of the organisation, the risks and challenges faced and the adequacy and timeliness of the action being taken to address them.
We held eleven meetings during the year ending September 2012 (see page 58) and have reported to the Board on how we have discharged our responsibilities.
During the year activities of the Committee included the following:
The Integrity of Financial Reporting We reviewed the integrity of the financial statements of the Company and all formal announcements relating to the Company’s financial performance. This has included review and debate over areas of significance in relation to integrity of Financial Reporting taking into account the view of the external auditors. For instance we looked at:
Revenue RecognitionWe reviewed the judgements made in respect of revenue recognition. In one part of the Group the exercise involved a detailed review to understand all factors and nuances relating to the judgement in the context of the guidance contained in IAS18 as to whether the Group acts as a principal or an agent.
We were satisfied that the in-depth review validated the approach taken historically by the Group.
Going ConcernWe assessed our available facilities, facility headroom, our banking covenants and the sensitivity analyses on these items.
We reviewed the management analysis which was consistent with last year and included forecasts
Governance
Audit Committee
Minnow PowellChairman

TT11 | AR 2012 | 20/12/2012 | Proof 5
www.tuitravelplc.com
TUI Travel PLC Annual Report & Accounts 2012 63G
overnance
Governance
The effectiveness of internal controls and the risk management frameworkWe recognise that a robust and effective system of internal control is critical to achieving reliable and consistent business performance. On behalf of the Board we review the effectiveness of the risk management and control systems in relation to material financial, operational and compliance controls. We oversaw a number of improvements in this area during the year. We noted a good level of sustained improvement in the financial control environments within our UK & Ireland and French businesses as well as the continued management focus on the implementation of the COSO framework of internal control across the organisation, the development of the risk management methodology and application and the strengthening of the three lines of defence. Whilst we are pleased with the progress achieved there remains much still to do and work in these areas will be ongoing in 2013.
First line of defenceManagement We spent time with management below Board level in order to understand their concerns and the risks, controls and challenges in their respective business areas. This included presentations by them and discussions with them on:
• the financial control environment existing within each of the key business areas with follow up presentations and debate on those areas of greater concern; and
• significant projects being undertaken across the Group, e.g. financial and reservations systems development.
Local Compliance functionsWe noted the investment in local compliance functions within our key businesses during the year which will serve to strengthen the control environment closer to the front-end of businesses across the organisation as appropriate.
Second line of defenceRisk ManagementWe received a presentation from the Group Risk Management function on the risk management structure and approach as well as an assessment of stakeholder engagement and effectiveness by key business area. We reviewed and approved proposed changes to the risk approach and methodology designed to drive greater transparency and accountability in the risk management process across the organisation at every level. These improvements have been supported by the roll out of new risk management software. We also reviewed the findings of an independent audit on the effectiveness of the Group Risk function. We were satisfied that the recommendations raised in this report had already been identified and were being addressed by the Group Risk Function. In addition, we have received regular updates on the work of the Group Risk Management Committee during the last year in relation to risk management.
While significant improvements have been made in the year, further work to embed them into all our processes and procedures is planned for 2013.
adjusted for downturns in budgeted trading. Reduced customer deposits were factored explicitly into the model and an assessment of the degree of flexibility in the creditors’ ledger at the cash low point in December was also taken into account.
We were satisfied that the going concern basis of preparation continues to be appropriate in the context of the Group’s funding and liquidity position.
Annual Goodwill Impairment ReviewDuring the year we also considered the judgements made in relation to the valuation methodology adopted by management and the model inputs used.
We also reviewed and approved the sensitivities used by management which were consistent with 2011 and ‘a reasonably possible’ change to model inputs including the related disclosure, as required by IAS 36.
Aircraft Maintenance ProvisionWe considered the relative merits of two accounting bases of estimation historically in use across the Group in order to identify the most appropriate and achieve consistency.
Due to the complex nature of the issue, a joint review was initiated with the external auditors and involved site visits to understand and debate fully the two options available.
The findings of this review were presented and discussed at the Audit Committee where we approved the decision to adopt ‘next event’ based provisioning methodology (i.e. where the provision relates to the expected cost of the next event in an aircraft’s life) representing, we believe, the more appropriate estimation under International Accounting Standards (IAS).
Provision for claimsWe reviewed the risks relating to the main legal cases facing the Group and the adequacy of provisions made against them. Management presented papers detailing the background to each case, the latest developments, their assessment of the respective risks, the mitigating action taken and amounts provided.
We agreed with the judgements reached by management in each of the cases presented.
Separately Disclosed Items (SDIs)SDIs are those significant items which in management’s judgement are highlighted by virtue of their size or incidence to enable a full understanding of the Group’s financial performance. We reviewed the items proposed by management to be reported as SDIs each quarter to validate that it was appropriate for such items to be reported this way, and agreed with their judgement.
TaxWe reviewed and approved the Group’s overall taxation strategy during the year. This covered the key factors for the Group’s overall tax position and forecasts for the future tax charge and cash taxes. We also considered the UK corporation tax legislation changes made in 2012 that applied to asset backed contributions to UK defined benefit pension schemes and concluded these had been appropriately treated within the Group’s accounts. In addition we reviewed the judgements together with any related provisions in respect of open areas including the ongoing dispute with the Spanish tax authorities.

www.tuitravelplc.com
64 TUI Travel PLC Annual Report & Accounts 2012
TT11 | AR 2012 | 20/12/2012 | Proof 5
Governance
Audit Committee continued
ProcessesWe welcomed the development of a risk-ranked auditable universe which has enabled a more systematic approach to the development of the annual audit plan and more informed discussions with management as to the key risks facing the business. It also enabled a clear summary for management, and the Committee, as to what would be audited and why as well as what would not be audited and why. It provided clarity for management and the Committee as to the potential impact to the audit plan of flexing resource up or down. In addition we were pleased with the focus on control reporting through the change of report rating criteria, the focus on driving audit reporting on a more timely basis and the focus on reporting on the timeliness of closure of priority findings by Sector and Source Market. We are looking to further improvements in the timeliness of issuing reports and closing audit findings in 2013.
SystemsWe were pleased to see the implementation of audit software and analytical tools during the year which will drive greater consistency and reliability in audit work performed thereby improving the assurance provided.
PeopleWe noted the focus placed on restructuring, assessing and developing the Internal Audit team as an essential element in building a high-performance Internal Audit function.
The effectiveness of Internal AuditDuring the year we requested a review on the effectiveness of Internal Audit. The review covered internal effectiveness of the function (positioning, processes, systems and people) benchmarked against best practice as well as the external effectiveness of the function as perceived by 14 key stakeholders (senior management and Non-Executive Directors). We noted that the issues raised from this review had been identified in the transformation plan set out by the Director of Group Audit Services which is currently being implemented.
The arrangements by which staff may raise concerns regarding potential impropriety in confidence and that these concerns will be investigated appropriatelyWe received updates during the year on the arrangements by which the business encourages feedback from management and staff on instances of potential impropriety. This included the development of the whistle-blowing hotlines across the Group.
The integrity of the Group’s relationship with External Audit and the effectiveness of the External Audit processEffectiveness of External AuditWe requested a review of the effectiveness of External Audit as perceived by 14 senior financial personnel and senior management closely involved in the year-end reporting process as well as members of the Audit Committee. We also requested a review of the results of the Audit Inspection Unit’s (now called Audit Quality Review Team) assessment of the effectiveness of the external auditor relative to its peers. We were satisfied with the results of this review and the actions noted.
Audit plan and approachDuring the year we reviewed the effectiveness of the audit approach and audit plan which took into account issues of size, complexity and the control environment.
Group Compliance We noted the continued development and strengthening of the Group Compliance functions during this year. There are three Group Compliance teams.
• Group Financial Compliance. Created in 2011 to provide assurance that individual company balance sheets across the Group are fairly stated through a programme of site visit reviews to ensure that companies in the Group comply with existing and developing financial reporting requirements.
– We received feedback on the ongoing programme of education, communication and independent validation of the financial minimum controls as well as feedback on quarterly self-assessment returns.
• Group Legal & Regulatory Compliance was created in January 2012 to manage legal and regulatory risk across the Group, including Anti-Bribery & Corruption (ABC) and whistle-blowing.
– We received feedback during the year on the progress being achieved in relation to ABC, whistle-blowing and governance structures.
• Group IT Compliance. Created in March 2012 to provide a compliance framework across the Group’s IT function by producing and/or publicising appropriate standards and monitoring compliance to those standards using a mixture of self-assessment and a programme of review visits.
– We received reports on the Group’s compliance with PCI DSS along with updates on the effectiveness of Business Continuity Planning and Disaster Recovery and noted the need to build on the existing contingency planning in this area.
A Group Compliance Steering Committee (CSC) has been created to lead and co-ordinate compliance issues across the Group and ensure a consistent approach. The CSC includes the Group Directors of Financial Reporting, Legal and Audit Services as well as the new Group Heads of Financial, Legal & Regulatory and IT Compliance. The CSC is also attended by the Group Heads of Fraud and Risk Management.
Talent management We reviewed the talent pool of senior financial management during the year noting the development of competency testing, in conjunction with Korn Ferry, for key finance management and the foundation of a Finance Academy to develop and train our employees.
We also noted the development of detailed risk and control objectives for Group Managing Directors and Financial Directors across the organisation. Changes were made in prioritising these objectives in relation to the overall objectives in order to ensure a greater focus on risk and control and ‘doing the right thing’.
Third line of defenceInternal AuditWe noted a number of improvements in the development and effectiveness of the Internal Audit function during the year.
We also noted the development of a closer collaboration between the key control functions of Group Compliance, Internal and External Audit which is resulting in a more integrated approach to the provision of risk and controls’ assurance.
We received a presentation on the transformation plan set out by the Director of the Internal Audit function and have noted the progress achieved against that plan during the last year.

TT11 | AR 2012 | 20/12/2012 | Proof 5
www.tuitravelplc.com
TUI Travel PLC Annual Report & Accounts 2012 65G
overnance
Governance
Re-appointment of external auditorsWe have reviewed and recommended to the Board the re-appointment of the external auditors (now in their second year) and have approved the audit fees incurred.
Non-audit servicesWe have sought to ensure that the provision of non-audit services does not impair the integrity, independence and objectivity of the Company’s external auditor. We have achieved this by adhering to the Accounting Practices Board Ethical Standard Number 5 relating to ‘non-audit services provided to audited entities’. We have reviewed and monitored the nature and extent of non-audit services and have challenged it where appropriate.
We have also reviewed the fees (both individually and in aggregate relative to the audit fee) and management’s compliance with the approval thresholds set out in the Company’s non-audit services policy.
We acknowledge that, in some circumstances, the external auditors’ understanding of the business can be beneficial in improving the efficiency and effectiveness of advisory work and, therefore, it has been considered appropriate that the external auditors be engaged.
In total £2.1m was spent on non-audit services during the year. Significant expenditure, i.e. exceeding £250,000, is outlined below:
Non-Audit Services – Significant ExpenditureBusiness Work Rationale for use Area undertaken of the external auditor £000s
A&D Restructuring/ Knowledge of the complex efficiency project business legal entity and operational structure 309
Group HR Tax advice relating to ex-pats Won on competitive tender 300
UK&I IT consultancy Knowledge of the complex relating to and interrelated IT systems security architecture and business processes 266
In addition fees totalling £189,000 were paid to the external auditors in respect of the half year and regulatory returns.
Minnow PowellChairman3 December 2012

www.tuitravelplc.com
66 TUI Travel PLC Annual Report & Accounts 2012
TT11 | AR 2012 | 20/12/2012 | Proof 5
I am pleased to be given the opportunity to introduce the Directors’ Remuneration Report for the year ended 30 September 2012.
The Committee aims to ensure that remuneration packages are offered which:
• Set the total remuneration package at an appropriate level to reflect the competitive markets in which the Group operates;
• Link a substantial proportion of the total remuneration package to the achievement of demanding financial performance targets;
• Structure the reward of senior management to align their interests with those of shareholders over the long-term;
• Enable the retention and stability of the management team; and
• Reinforce a high-performance culture throughout the Group.
During the year the Committee refreshed its membership and sought to improve the overall balance of independence. I was appointed Chairman following Bill Dalton’s resignation in May 2012, Janis Kong was appointed a member of the Committee in July 2012 and Tony Campbell stepped down from the Committee in October 2012.
The Committee is strongly committed to open and transparent dialogue with shareholders on remuneration matters. We believe that it is important to meet regularly with our key shareholders to understand their views on our remuneration arrangements and discuss our policy going forward. During the year we consulted with the Company’s largest shareholders and the main shareholder representative bodies, as a result of which we have made certain improvements to the operation of our ongoing remuneration policy.
In particular, the Committee considered the application of the Company’s policy on remuneration for executives leaving the Group and committed to ensuring a consistent approach to the application of our policy in future to ensure that we do not pay more than is necessary.
Sir Michael Hodgkinson has been the Senior Independent Director of TUI Travel for over five years. Some concerns have been raised that his tenure as a Non-Executive Director should include the period when he was Chairman of First Choice Holidays PLC. Our major shareholders have confirmed that they wish Sir Michael to continue as Deputy Chairman and Senior Independent Director, particularly given the retirement of the Chairman later in 2013.
William Waggott’s role expanded during the year to include additional commercial responsibilities. Having taken account of the increase awarded to William at the time of his promotion to Chief Financial Officer in December 2010, and his outstanding performance in this expanded role to date, the Committee decided to increase his base salary by 12% in December 2011. No other increases to Executive Director salaries are anticipated in the year ending 30 September 2013.
No changes were made to the performance measures used under our incentive plans following the changes described in last year’s Remuneration Report and we have made no increases to incentive plan quantum.
This is a year in which there has been much public debate about executive remuneration and governance. In April 2012 we responded to the consultation document issued by the Department for Business, Innovation and Skills (BIS) on Executive Remuneration. In anticipation of the revised reporting regulations, and in line with evolving best practice, we have provided additional disclosures in this Remuneration Report in advance of being required to do so.
On behalf of the Committee I hope that you find the report comprehensive, clear and informative.
Coline McConvilleRemuneration Committee Chairman3 December 2012
Governance
Remuneration report
Coline McConvilleChairman

TT11 | AR 2012 | 20/12/2012 | Proof 5
www.tuitravelplc.com
TUI Travel PLC Annual Report & Accounts 2012 67G
overnance
Governance
• Approval of the Directors’ Remuneration Report for the year ended 30 September 2011.
• Consideration of the outcome of the AGM vote on the Directors’ Remuneration Report and shareholder feedback.
• Consideration of market trends in executive remuneration and corporate governance.
• Review of the executive shareholding guidelines and their application.
• Consideration of remuneration benchmarking and review and agreement of Executive Director and GMB remuneration.
• Agreement of the Annual Bonus, Performance Share Plan and Deferred Annual Bonus Scheme performance targets for the year ended 30 September 2012.
• Approval of changes to the Rules of the Performance Share Plan, Deferred Annual Bonus Scheme and Deferred Annual Bonus Long-Term Incentive Scheme to ensure compliance with Disguised Remuneration legislation.
• Review of the outcome of the annual effectiveness survey of the Committee.
• Consultation with shareholders and external bodies on our remuneration policy.
AdvisersMaterial advice or services were provided to the Committee during the year by:
Deloitte LLP (Deloitte)Herbert Smith Freehills LLP (Herbert Smith Freehills)Andrew John – Company SecretaryPeter Long – Chief ExecutiveJacky Simmonds – Group Human Resources DirectorTim Taylor – Group Reward Director
The Group HR Director has direct access to the Chairman of the Committee and, together with the Group Reward Director, advised the Committee on reward matters relating to the Executive Directors and members of the GMB. They also advised the Committee on broader Group HR strategy and policy.
The Chief Executive attends meetings of the Committee to make recommendations relating to the performance and remuneration of his direct reports and the Company Secretary acts as Secretary to the Committee. The Chief Executive, Company Secretary and Group HR Director are not in attendance when their own remuneration is considered.
The Committee is authorised by the Board to seek any information that it requires from any employee of the Group. The Committee is also authorised to require the attendance of any executive at any of its meetings.
Deloitte provided independent advice to the Committee on all aspects of senior management remuneration. Deloitte is a founding member of the Remuneration Consultants Group and adheres to its Code in relation to executive remuneration consulting in the UK. Deloitte also provides, as required, taxation services to the Group.
Herbert Smith Freehills advised the Committee on various legal issues relating to the Company’s share schemes. Herbert Smith Freehills also provides, as required, other legal services to the Group as a whole.
The Directors’ Remuneration Report for the financial year ended 30 September 2012 has been prepared on behalf of the Board by the Remuneration Committee. It complies with the requirements of the Companies Act 2006 and Schedule 8 of the Large and Medium Sized Companies and Groups (Accounts and Reports) Regulations 2008. This report will be presented to shareholders for approval at the Annual General Meeting on Thursday 7 February 2013.
Remuneration CommitteeThe role of the Remuneration Committee (‘the Committee’) is to:
• set and review the Company’s executive remuneration principles and framework; and
• determine the remuneration arrangements of the Company’s Chairman, Chief Executive, Executive Directors and members of the Group Management Board (‘GMB’).
The activities of the Committee are governed by its Terms of Reference. To reflect best practice and legal developments, the Terms of Reference were amended by the Board on 29 May 2012. The updated Terms of Reference can be found on our website
(http://www.tuitravelplc.com/investors-media/corporate-governance/management-and-committees/committees).
The Committee is currently comprised of five Non-Executive Directors, three of which the Board deems to be wholly independent.
Coline McConville – Independent ChairmanSir Michael Hodgkinson (Independent)Dr Michael FrenzelRainer FeuerhakeJanis Kong (Independent)
Clare Chapman resigned in October 2011. Bill Dalton was appointed Chairman of the Committee in her place until his resignation from the Board in May 2012. Coline McConville was appointed a member of the Committee in December 2011 and was appointed Chairman in May 2012. Janis Kong was appointed in July 2012 and Tony Campbell stepped down as a member of the Committee in October 2012.
Dr Michael Frenzel and Rainer Feuerhake are not considered by the Company to be independent. Dr Frenzel is a member of the Executive Board of TUI AG and Rainer Feuerhake was a member of TUI AG’s Executive Board until his resignation in February 2010.
TUI AG is a 56.26% (51.50% on a fully-diluted basis) shareholder of TUI Travel PLC as at 30 September 2012. The appointments of Dr Michael Frenzel and Rainer Feuerhake are pursuant to the Relationship Agreement between TUI AG and the Company.
No member of the Committee has any personal financial interest, other than as a shareholder, in the matters to be decided by the Committee. The three independent members of the Committee have no conflicts of interest arising from cross-directorships and none of the members of the Committee participate in any bonus schemes, pension plans, share awards or any employee share schemes. Members of the Committee have no day-to-day involvement in the running of the Company.
The Committee met seven times during the year. Details of attendance can be found in the Corporate Governance Report. During the year, the Committee carried out the following activities:
• Assessment of the achievement of Executive Directors’ and GMB members’ performance against their annual bonus objectives.
• Assessment of performance for the vesting of the 2008 Performance Share Plan and Deferred Annual Bonus Scheme awards.

www.tuitravelplc.com
68 TUI Travel PLC Annual Report & Accounts 2012
TT11 | AR 2012 | 20/12/2012 | Proof 5
Governance
Remuneration report continued
Group performance-related measures are chosen carefully to ensure a strong link between reward and underlying financial performance. Individual performance is measured through an assessment of comprehensive business unit deliverables, financial targets and the achievement of specific objectives. The weightings of the annual bonus measures for the financial year ended 30 September 2012 were:
Group Group average Sector Sector Individual profit/ headroom profit/ average business cash cash cash net debt objectives
Peter Long 50% 30% 20%Johan Lundgren 50% 30% 20%William Waggott 50% 30% 20%Dr Volker Böttcher 20% 35% 25% 20%
At a minimum, the individual performance of the Executive Directors is assessed on an annual basis.
When determining executive remuneration, the Committee considers the pay and conditions of employees across the Group and executives employed by companies of a similar size and complexity to TUI Travel. Factors taken into account when determining the appropriate benchmark group of organisations include size, industry and global scope. The data used is provided by Deloitte.
Remuneration policy – Executive Directors and senior executivesDifferent elements of executive reward are delivered over the short and longer-terms. Our remuneration policy approach is summarised below:
Fixed remuneration
Base salary
Performance related remuneration
Short-termAnnual
PerformanceBonus
Long-termDeferred AnnualBonus Scheme
and PerformanceShare Plan
Benefits
Pension contribution
UK All Employee Share Plan
GMB shareholding guidelines
The policy is designed to provide the appropriate balance between fixed remuneration and variable ‘at-risk’ reward which is linked to the performance of both the Group and the individual. The average remuneration mix is:
• Fixed (salary and benefits) ~ 30%
• Annual bonus ~ 10%
• Long-term incentives (LTI), i.e. Deferred Annual Bonus Scheme and Performance Share Plan ~ 60%
The graph below illustrates (for the financial year ended 30 September 2012) the split of total remuneration for the Executive Directors at target performance.
Policy/Target PeterLong
JohanLundgren
WilliamWaggott
VolkerBöttcher
Target LTI Target annual bonus Target fixed remuneration
0%
20%
40%
60%
80%
100%

TT11 | AR 2012 | 20/12/2012 | Proof 5
www.tuitravelplc.com
TUI Travel PLC Annual Report & Accounts 2012 69G
overnance
Governance
Summary of remuneration policyNo changes to policy are anticipated for the financial year ending 30 September 2013.
Element Purpose Operation Opportunity
Base salary To attract and retain executives of the right calibre.
To reflect the executive’s skills, experience and role within the Group.
Salaries are paid monthly in cash and are reviewed annually in October.
Salaries are benchmarked against companies of a similar size, complexity and international scale.
Internal relativities are also taken into account.
Changes to salaries during the year are described below.
No salary increases are anticipated for the financial year ending 30 September 2013.
Pension and Benefits
To attract and retain executives of the right calibre.
The Executive Directors’ benefits include pension, medical insurance, life assurance, car provision, holiday and travel concessions.
The Executive Directors currently have pension entitlements of between 25% and 50% of base salary.
No changes were made to the pension and benefits policy or quantum during the year.
Annual Performance Bonus
To encourage and reward the attainment of challenging financial and strategic performance targets during a one-year period.
Stretching financial and business performance targets are set by the Committee at the beginning of each financial year.
These measures closely align the strategy of the business and shareholder value creation.
For the financial year ended 30 September 2012 the maximum bonus opportunity (as a percentage of salary) was 175% for Peter Long, 140% for Johan Lundgren and William Waggott and 120% for Dr Volker Böttcher.
No changes were made to the annual performance bonus policy or quantum during the year, and none are anticipated for the financial year ending 30 September 2013.
Deferred Annual Bonus Scheme
To directly align short-term and long-term reward through compulsory deferral of annual bonus into shares.
To drive and reward delivery of sustained long-term performance.
To align executive and shareholder interests.
Deferral of at least 25%, and up to 50%, of any annual performance bonus award into shares for three years.
Matching awards are then provided which are subject to continued employment and the satisfaction of stretching performance conditions over a three-year period: Earnings Per Share (EPS) growth relative to the UK Retail Prices Index (RPI) (50%), relative Total Shareholder Return (TSR) (25%), and improvement in Return on Invested Capital (ROIC) (25%).
No Matching shares will vest unless the ratio of the Company’s ROIC to the Company’s Weighted Average Cost of Capital (WACC) measured on average over a period of three financial years exceeds one.
The performance measures have been selected to ensure a strong link between reward, underlying Group financial performance and shareholder returns.
Matching share-based awards of up to four times the deferred amount.
No changes were made to the annual Deferred Annual Bonus Scheme policy or matching ratio during the year.
Performance Share Plan
Annual awards to incentivise long-term value creation.
To align interests of executives and shareholders.
To support the retention of key senior executives.
Performance is measured over a three-year period.
Awards are subject to continued employment and the satisfaction of the same stretching performance conditions as DABS Matching Awards over a three-year period. Likewise no shares will vest unless the Company’s ROIC to WACC ratio exceeds one.
The performance measures have been selected to ensure a strong link between reward, underlying Group financial performance and shareholder returns.
For the financial year ended 30 September 2012 the maximum PSP opportunity (as a percentage of salary) was 200% for Peter Long, 120% for Johan Lundgren and William Waggott and 100% for Dr Volker Böttcher.
No changes were made to the Performance Share Plan policy or quantum during the year.
It is anticipated that the maximum PSP opportunity (as a percentage of salary) for the financial year ending 30 September 2013 will be 200% for Peter Long and 120% for Johan Lundgren and William Waggott. An award is not planned for Dr Volker Böttcher.
UK All Employee Share Plan
To encourage employees to build a shareholding in the Company.
The HMRC-approved Share Incentive Plan is open to all UK eligible employees, including Executive Directors and GMB members.
Employees can allocate part of their pre-tax salary to purchase shares in the Company. Shares purchased are held in Trust prior to transfer to participating employees.
Participants currently receive a Matching share for every four shares bought under the Plan. Matching shares are not subject to performance conditions.
The maximum amount that can be purchased is £1,500 in any one tax year.
No changes were made to the UK All Employee Share Plan policy or quantum during the year.

www.tuitravelplc.com
70 TUI Travel PLC Annual Report & Accounts 2012
TT11 | AR 2012 | 20/12/2012 | Proof 5
Incentive plans Deferred Annual Bonus Scheme (DABS) Matching awards and Performance Share Plan (PSP) awards made after 1 October 2011• Up to half of awards will vest based on growth in the Company’s
reported earnings per share (EPS) in excess of growth in the UK Retail Price Index (RPI), as follows:
Average annual EPS growth in excess of RPI growth Proportion of award that vests
Less than 4% 0%Between 4% and 13% (inclusive) Between 10% and 100% (inclusive) (straight-line basis)Greater than 13% 100%
• Up to one-quarter of awards will vest based on the Group’s total shareholder return (TSR) performance relative to an average of the TSR performance of an index of international travel and leisure companies which are considered the most relevant peers in terms of size, global scope, business type and exposure to external factors.
The companies included in the index are:1 Aer Lingus Group 13 International Consolidated Airlines Group2 Air Berlin 14 Kuoni Reisen Holding3 Air France-KLM 15 National Express Group4 Carnival 16 Norwegian Air Shuttle5 Club Mediterranee 17 Pierre & Vacances6 Deutsche Lufthansa 18 Priceline.com7 easyJet 19 Royal Caribbean Cruises8 Expedia 20 Ryanair Holdings9 Finnair 21 Stagecoach Group10 FirstGroup 22 Thomas Cook Group11 Flight Centre 23 Wotif.com Holdings12 Hertz Global Holdings
The vesting schedule for the portion of awards subject to TSR performance is as follows:
TUI Travel PLC’s TSR Performance Proportion of award that vests
Below index 0%Between index and index +8% Between 15% and 100% per annum (straight-line basis)Exceeding index +8% per annum 100%
• Up to one-quarter of the awards will vest based on the Company’s ROIC performance over the performance period.
Average annual ROIC Proportion of award that vests
Below 14.1% 0%Between 14.1% and 15.6% Between 15% and 100% (straight-line basis)Greater than 15.6% 100%
A performance hurdle of ROIC (requiring ROIC to be on average at least equal to WACC measured over three years) is used to ensure that the long-term incentive awards pay out only when shareholder value is being created over the performance period. If the ROIC/WACC performance hurdle is not met no shares will vest.
The Committee assesses the EPS and the ROIC tests based on audited information. Independent calculations of TSR performance for outstanding awards are performed by Deloitte.
Base salary Peter Long’s base salary has not been increased since 1 October 2008, as the Committee wants to continue to leverage his long-term reward to align his interests with shareholders.
As announced last year Johan Lundgren was promoted to the role of Deputy CEO on 20 October 2011. Johan has overall responsibility for the Mainstream Sector of the Group which represented approximately 84% of revenues and 86% of underlying profits during the year. Taking a unified approach across the Mainstream business is already delivering improved financial results. To reflect this progression and broadened responsibilities, Johan’s salary was increased to £700,000 as disclosed in last year’s Annual Report. No salary increase or other changes to his package are anticipated during this financial year.
Following William Waggott’s excellent performance in his expanded role as Chief Financial Officer, with additional commercial responsibility for the Hotels Division, the Committee decided to increase his salary from £490,000 to £550,000 effective December 2011 – an increase of 12%. This increase reflects the fact that his salary was increased by 4% at the time of his appointment as CFO, with a view to allowing him to establish himself before fully adjusting his salary. The new salary has been set at a level that reflects the expanded nature of his responsibilities and external market conditions. No salary increase is anticipated during this financial year and there are no changes to the rest of his package.
As a result of the Mainstream Sector changes Dr Volker Böttcher’s role has been reduced in scope. To reflect his new responsibilities, the Committee deemed that it was appropriate to reduce his remuneration package on a phased basis. No PSP award will be made in December 2012. Furthermore, Dr Böttcher will be awarded a reduced quantum of Matching shares for the financial year ending 30 September 2013. From October 2013 his salary will be reduced, his maximum bonus potential will be decreased and a lower PSP award may be granted.
During 2012 annual salary increases were awarded to some employees across the Group. These typically ranged from 2.5%-3% and were determined in line with local conditions and legislation.
BenefitsIn addition to the items outlined in the summary of remuneration policy, Johan Lundgren received education benefits and tax assistance as part of the ongoing support relating to his relocation to the UK from Sweden on 1 August 2009.
The Group’s UK pension policy for Executive Directors, and other members of the GMB, is that, in the event that a participant in a registered pension scheme may reach or exceed HMRC lifetime or annual thresholds and therefore chooses not to accept further registered pension contributions, a contribution to an unregistered long-term investment scheme or a non-pensionable cash payment, (equivalent to the Group’s contribution to the registered pension scheme), will be offered in lieu. Pension scheme participants will not be compensated for any adverse tax consequences of exceeding the HMRC lifetime allowance limit.
In the event of death in service, the arrangements for the Executive Directors and other members of the GMB, provide lump sums for the purchase of dependants’ pensions of the greater of eight times salary or the value of the pension fund in addition to which a lump sum of four times salary is payable. Following the changes to the tax rules from April 2006, any dependant’s pension may be paid as an additional lump sum subject to HMRC limits.
Dr Volker Böttcher participates in separate pension arrangements in Germany at a cost to the Company of 25% of base salary.
Governance
Remuneration report continued

TT11 | AR 2012 | 20/12/2012 | Proof 5
www.tuitravelplc.com
TUI Travel PLC Annual Report & Accounts 2012 71G
overnance
Governance
The graph below compares the TSR performance of TUI Travel PLC, assuming dividends are re-invested, with the TSR performance of an index of international travel and leisure companies. This index is considered by the Committee to be the most appropriate benchmark for comparison purposes. From October 2011 this index has also been used for performance measurement under the Company’s long-term incentive schemes. For additional reference, the TSR performance of the FTSE 100 and FTSE 250 indices and the Company’s main UK-listed competitor have also been shown.
Shareholding guidelinesWithin five years of their appointment Executive Directors are expected to build, and then maintain, a holding of shares in the Company as set out below:
Chief Executive 200% of base salaryOther Executive Directors 150% of base salary
Other members of the GMB are expected to build, and then maintain, a holding equal to 100% of their base salary.
To qualify for inclusion the shares must have vested (i.e. have become unconditional) and be held beneficially by the executive (or the spouse of the executive).
Executive Directors’ external appointments Executive Directors are able to accept non-executive appointments outside the Company (as long as this does not lead to a conflict of interest) with the consent of the Board as such appointments can enhance their experience and add value to the Company. Any fees received (excluding positions where the Director is appointed as the Company’s representative) are retained by the Director.
For the year ended 30 September 2012, Peter Long received and retained non-executive directors’ fees in respect of an appointment with Rentokil Initial PLC of £63,750 (2011: £75,000). No other Executive Director currently holds an external non-executive director post.
Deferred Annual Bonus Scheme (DABS) Matching awards and Performance Share Plan (PSP) awards made before 1 October 2011For DABS awards made before October 2011, up to three-quarters of awards will vest based on growth in the Company’s adjusted EPS in excess of growth in RPI and up to one-quarter of awards will vest based on relative TSR performance. For PSP awards made before October 2011, up to half of awards will vest based on growth in the Company’s adjusted EPS in excess of growth in RPI and up to half will vest based on relative TSR performance. The EPS and TSR performance schedules are as follows:
• Growth in the Company’s adjusted EPS in relation to the growth in RPI:
Average annual EPS growth in excess of RPI growth Proportion of award that vests
Less than 4% 0%Between 4% and 13% Between 10% and 100% (straight-line basis)Greater than 13% 100%
• The Company’s TSR performance ranking relative to the TSR performance of the companies in the FTSE 100 ranked 30th to 100th by market capitalisation (as at the date of the award) as shown in the table below:
TSR Ranking Proportion of award that vests
Below median 0%Between median and upper quartile Between 15% and 100% (straight-line basis)Above upper quartile 100%
No new shares were issued during the year and therefore the Company has remained within its headroom limits for the use of new shares under share incentive schemes. All share incentive awards made, and all future share incentive awards, will normally be settled with shares purchased in the market.
Schedule 8 to the Large and Medium-sized Companies and Groups (Accounts and Reports) Regulations 2008 requires that the Company must provide a graph comparing the TSR performance of a hypothetical holding of shares in the Company with a broad equity market index over a five-year period.
TUI Travel PLC
FTSE 100
FTSE 250
International Travel & Leisure (excl TUI)
Thomas Cook Group
Source: Datastream
TUI Travel PLCTotal Shareholder Return
120
100
80
40
60
20
30 Sept2007
30 Sept2008
30 Sept2009
30 Sept2010
30 Sept2011
30 Sept2012

www.tuitravelplc.com
72 TUI Travel PLC Annual Report & Accounts 2012
TT11 | AR 2012 | 20/12/2012 | Proof 5
Governance
Remuneration report continued
Remuneration policy – Non-Executive DirectorsNon-Executive Directors, including the Chairman, do not have service contracts and do not participate in the Group’s pension scheme, annual bonus scheme or long-term incentive schemes.
Non-Executive Directors have letters of appointment which can be terminated by either party by serving three months’ notice, with the exception of Horst Baier whose initial term expired in October 2012 and provided for six months’ notice. His new letter of appointment is on the same terms as the other Non-Executive Directors, i.e. three months’ notice by either party.
In accordance with the requirements of the UK Corporate Governance Code, all Directors will be subject to re-election at the Annual General Meeting on Thursday 7 February 2013.
Number period by either Non-Executive Director Effective date of contract Company or Director
Dr Michael Frenzel 3 September 2012 3 monthsSir Michael Hodgkinson 3 September 2012 3 monthsHorst Baier 13 October 2012 3 monthsTony Campbell 3 September 2012 3 monthsColine McConville 21 September 2011 3 monthsRainer Feuerhake 3 September 2012 3 monthsJanis Kong 29 May 2012 3 monthsMinnow Powell 4 April 2012 3 monthsHarold Sher 29 October 2012 3 monthsDr Erhard Shipporeit 29 October 2012 3 monthsDr Albert Schunk 29 October 2012 3 months
Non-Executive Directors are paid a fee which is approved by the Board on the recommendation of the Chairman and the Executive Directors, having taken account of the fees paid in other companies of a similar size and complexity and the skills and experience of the individuals. The Chairman’s fee is approved by the Remuneration Committee, excluding the Chairman.
Non-Executive Director Annual Fee
Chairman £300,000Deputy Chairman (also the Senior Independent Director) £200,000Basic Fee for Non-Executive Director £55,000Additional fee for Chairman of the Audit Committee £15,000Additional fee for Chairman of the Remuneration Committee £10,000
Contracts of ServiceThe Committee’s policy is for Executive Directors to have rolling contracts with a 12-month notice period.
Peter Long, Johan Lundgren, William Waggott and Dr Volker Böttcher currently have service agreements with a 12-month notice period. It is intended that all new appointments will also have 12-month notice periods. However, on occasion, to complete an external recruitment successfully, a longer initial period may be used reducing to 12 months, following guidance in the UK Corporate Governance Code.
Number of months’ notice by either Executive Director Effective date of contract Company or Director
Peter Long 19 February 2008 12Johan Lundgren 20 March 2009 12William Waggott 22 April 2008 12Dr Volker Böttcher 25 July 2012 12
Exit Payments PolicyThe Committee has considered the Company’s policy on remuneration for executives leaving the Group. We are committed to ensuring a consistent approach to the application of our policy in this area in order to ensure that we do not pay more than is necessary. Our policy for service contracts is in line with general market practice:
• Notice periods are limited to 12 months’ base pay and contractual benefits subject to mitigation.
• Payment in lieu of notice is payable where 12 months’ notice is not given to the Director or when the Director gives 12 months’ notice and the Company does not wish them to serve notice. If a notice period is served, the compensation is reduced. In the event that a Director is terminated for cause, the Company may terminate the contract with no compensation payable.
• There is no provision for additional compensation on termination following a change of control.
• There is no provision for liquidated damages of any kind. In the event of an early termination of a contract, the policy is to seek to minimise any liability.
• Incentives:
– Bonus. With the exception of termination for cause, resignation and gardening leave, Executive Directors are only eligible (subject to performance) for the bonus relating to the proportion of the financial year worked.
– Performance Share Plan. Leaver provisions were approved by shareholders when they approved the plan. For good leavers awards generally vest after three years pro-rated for time and subject to performance. Awards are generally forfeited where departure is for other reasons (for example resignation and termination for cause).
– Deferred Annual Bonus Scheme. Leaver provisions were approved by shareholders when they approved the plan. On termination, unvested shares representing deferred annual bonus shall vest (other than on dismissal for cause). For good leavers Matching awards generally vest after three years pro-rated for time and subject to performance. Matching awards are generally forfeited where departure is for other reasons (for example resignation and termination for cause).

TT11 | AR 2012 | 20/12/2012 | Proof 5
www.tuitravelplc.com
TUI Travel PLC Annual Report & Accounts 2012 73G
overnance
Governance
Remuneration for the year ended 30 September 2012The information provided in the following pages of this report has been audited by PricewaterhouseCoopers LLP.
Directors’ remuneration Total remuneration excluding pensions For the For the Basic year ended year ended salaries Annual 30 September 30 September and fees bonus¹ Benefits² 2012 2011 £000 £000 £000 £000 £000
Executive DirectorsPeter Long 850 729 24 1,603 1,618Johan Lundgren 695 485 88 1,268 1,037William Waggott 540 381 18 939 848Dr Volker Böttcher3 453 255 18 726 769Non-Executive DirectorsDr Michael Frenzel (Chairman) 300 – – 300 300Sir Michael Hodgkinson (Deputy Chairman) 200 – – 200 200Horst Baier 55 – – 55 55Tony Campbell 55 – – 55 55Coline McConville 58 – – 58 2Rainer Feuerhake 55 – – 55 55Janis Kong 19 – – 19 –Minnow Powell 70 – – 70 35Harold Sher 55 – – 55 55Dr Erhard Schipporeit 55 – – 55 55Dr Albert Schunk 55 – – 55 55Clare Chapman 3 – – 3 65Bill Dalton 43 – – 43 55
Total 3,561 1,850 148 5,559 5,259
1) Annual Bonus figures include bonus awards in cash in respect of participation in the Annual Bonus Plan but exclude bonus awards in deferred shares, details of which are set out in the Long-term incentives section.
2) Benefits incorporate all tax assessable benefits arising from the individual’s employment. For Peter Long and William Waggott, this relates in the main to the provision of a car allowance and private healthcare cover, and for Dr Volker Böttcher the provision of a fully expensed company car. In addition to the provision of a car allowance and private healthcare cover, Johan Lundgren received education benefits and tax assistance as part of the ongoing support relating to his relocation to the UK from Sweden on 1 August 2009.
3) In calculating remuneration for Dr Volker Böttcher, payments made during the year in EUR have been converted at 1.2035 to 1 GBP, being the average exchange rate for the period 1 October 2011 to 30 September 2012.

www.tuitravelplc.com
74 TUI Travel PLC Annual Report & Accounts 2012
TT11 | AR 2012 | 20/12/2012 | Proof 5
Governance
Remuneration report continued
Long-term incentivesDeferred Annual Bonus Scheme (DABS)The Executive Directors participated in the Deferred Annual Bonus Scheme during the year ended 30 September 2012. 50% of their annual performance bonus awards will be deferred into share based awards for three years. It is anticipated that awards will be granted by 6 December 2012 as follows:
Value of December 2012 awardExecutive Director £000
Peter Long 729Johan Lundgren 485William Waggott 381Dr Volker Böttcher 255
Total 1,850
The DABS shares awarded on 28 November 2008 were released on 5 December 2011. The vesting of the Matching shares was subject to three performance conditions and continued employment.
• A performance hurdle of ROIC requiring ROIC to be on average at least equal to WACC. This condition was satisfied.
• Growth in the Company’s adjusted EPS in relation to the growth in RPI. This applied to 75% of the allocation and was achieved at 100%.
• The Company’s ranking of total shareholder return (TSR) performance relative to the TSR performance of the companies in the FTSE 100 ranked 30th to 100th by market capitalisation (as at the date of the award). This applied to the remaining 25% of the allocation. The condition performed at 0%.
Therefore the overall result was that 75% of the shares vested. The share price on the release date was 166.4 pence per share.
Pension Accruals in respect of pension contributions or allowance for the year ended 30 September 2012Executive Director £000
Peter Long 425Johan Lundgren 229William Waggott 178Dr Volker Böttcher 113
Total 945
Total pension contributions or allowances accrued in respect of the year ended 30 September 2012 were £945,000. Of this amount, payments totalling £520,000 have been made as at the date of this report. In calculating these totals, payments made in EUR have been converted at 1.2035 to 1 GBP, being the average exchange rate for the period 1 October 2011 to 30 September 2012.
William Waggott has deferred pension entitlements under the Defined Benefit section of the TUI Pension Scheme (UK). He ceased to be an active member of the Defined Benefit section on 3 September 2007 and, therefore, no increase in accrued benefit has occurred during the year. Additional information is as follows:
• The accrued benefits including deferred revaluation to 30 September 2012 are a pension of £57,940.43 per annum, payable from age 60.
• The transfer value as at 30 September 2012, calculated on the current basis, is £1,503,860.
• The transfer value as at 30 September 2011, calculated on the basis in force at that time, was £1,164,159. The Cash Equivalent Transfer Value (CETV) basis in the TUI Pension Scheme (UK) was changed with effect from 1 October 2011.
• The only change in accrued benefits over the financial year is another year of deferred revaluation (fixed at 5% per annum). The accrued benefits at the start of the year were £55,181.36 per annum so there has been an increase in pension of £2,759.07 per annum over the year.
• There have been no contributions by Mr Waggott over the financial year into the TUI Pension Scheme (UK). The change in transfer value is £339,701.
Annual performance bonusThe performance of each of the Executive Directors has been reviewed by the Committee against the stretching financial and business performance targets which were established and agreed at the start of the year. The bonuses awarded were as follows:
Executive Director Bonus award as a % of potential
Peter Long 98%Johan Lundgren 99%William Waggott 99%Dr Volker Böttcher 94%

TT11 | AR 2012 | 20/12/2012 | Proof 5
www.tuitravelplc.com
TUI Travel PLC Annual Report & Accounts 2012 75G
overnance
Governance
Deferred Annual Bonus SchemeAwards made under the DABS, and which remain outstanding at 30 September 2012 are: DABS shares DABS shares DABS shares Maximum awarded vested released value based during during during Maximum on share DABS shares the year Market the year Market Planned/ the year DABS shares price of held at ended price per ended price per Market actual ended held at 234.1p at 1 Oct 30 Sept Award share at 30 Sept share at value at vesting 30 Sept Release 30 Sept 28 SeptDirectors 2011 2012 date award 2012 vesting vesting (£) date 2012 date 2012 2012 (£)
Peter Long 172,4721, 3 28.11.08 205.25p 02.12.09 172,472 28.11.11 – – 1,169,3042 28.11.08 205.25p 876,978 166.40p 1,459,291 05.12.11 876,978 05.12.11 – – 154,5921, 3 02.12.09 243.30p 02.12.09 154,592 361,900 1,048,0882 02.12.09 243.30p 04.12.12 1,048,088 2,453,574 324,7811 06.12.10 229.00p 06.12.13 324,781 760,312 1,299,1242 06.12.10 229.00p 06.12.13 1,299,124 3,041,249 451,5781 07.12.11 164.70p 07.12.14 451,578 1,057,144 1,806,3122 07.12.11 164.70p 07.12.14 1,806,312 4,228,576
Total 4,168,361 2,257,890 876,978 1,459,291 1,049,450 5,084,475 11,902,755
Johan Lundgren 79,9131, 3 28.11.08 205.25p 02.12.09 79,913 28.11.11 – – 541,7842 28.11.08 205.25p 406,338 166.40p 676,146 05.12.11 406,338 05.12.11 – – 62,4591, 3 02.12.09 243.30p 02.12.09 62,459 146,217 423,4522 02.12.09 243.30p 04.12.12 423,452 991,301 158,5151 06.12.10 229.00p 06.12.13 158,515 371,084 634,0602 06.12.10 229.00p 06.12.13 634,060 1,484,334 220,4001 07.12.11 164.70p 07.12.14 220,400 515,956 881,6002 07.12.11 164.70p 07.12.14 881,600 2,063,826
Total 1,900,183 1,102,000 406,338 676,146 486,251 2,380,486 5,572,718
William Waggott 57,4901, 3 28.11.08 205.25p 02.12.09 57,490 28.11.11 – – 389,7682 28.11.08 205.25p 292,326 166.40p 486,430 05.12.11 292,326 05.12.11 – – 52,1371, 3 02.12.09 243.30p 02.12.09 52,137 122,053 353,4722 02.12.09 243.30p 04.12.12 353,472 827,478 123,1441 06.12.10 229.00p 06.12.13 123,144 288,280 492,5762 06.12.10 229.00p 06.12.13 492,576 1,153,120 208,2571 07.12.11 164.70p 07.12.14 208,257 487,530 833,0282 07.12.11 164.70p 07.12.14 833,028 1,950,119
Total 1,468,587 1,041,285 292,326 486,430 349,816 2,062,614 4,828,580
Dr Volker 104,8091 28.11.08 205.25p 104,809 166.40p 174,402 05.12.11 104,809 05.12.11 – –Böttcher 419,2362 28.11.08 205.25p 314,427 166.40p 523,207 05.12.11 314,427 05.12.11 – – 101,8191 02.12.09 243.30p 04.12.12 101,819 238,358 407,2762 02.12.09 243.30p 04.12.12 407,276 953,433 121,5681 06.12.10 229.00p 06.12.13 121,568 284,591 486,2722 06.12.10 229.00p 06.12.13 486,272 1,138,363 170,3061 07.12.11 164.70p 07.12.14 170,306 398,686 681,2242 07.12.11 164.70p 07.12.14 681,224 1,594,745
Total 1,640,980 851,530 419,236 679,609 419,236 1,968,465 4,608,176
Grand total 9,178,111 5,252,705 1,994,878 3,319,476 2,304,753 11,496,040 26,912,229
1) Deferred award: The deferred element of annual bonus, subject to forfeiture for gross misconduct, bankruptcy or certain other circumstances in accordance with the scheme rules.
2) Matching award: A multiple of the deferred award, subject to continued employment to the release date and performance conditions over the three-year vesting period as specified in this Report and in accordance with the scheme rules.
3) During the financial year ended 30 September 2010 these Directors and the Company agreed to enter into a joint election pursuant to section 431(1) of the Income Tax (Earnings and Pensions) Act 2003 in respect of this award. Consequently, the Remuneration Committee agreed to vest this award early and release sufficient shares to satisfy the tax liability arising from the joint election. The remaining shares were held as restricted shares subject to claw-back conditions and were released after the third anniversary of the award date in accordance with the scheme rules.
• A performance hurdle of ROIC requiring ROIC to be on average at least equal to WACC. This condition was satisfied.
• Growth in the Company’s adjusted EPS in relation to the growth in UK RPI. This applied to 50% of the allocation and was achieved at 100%.
• The Company’s ranking of total shareholder return (TSR) performance relative to the TSR performance of the companies in the FTSE 100 ranked 30th to 100th by market capitalisation (as at the date of the award). This applied to the remaining 50% of the allocation. The condition performed at 0%.
Therefore, the overall result was that 50% of the shares vested. The share price on the release date was 166.4 pence per share.
Performance Share Plan (PSP)It is anticipated that awards will be granted by 6 December 2012 as follows:
Value of December 2012 awardExecutive Director £000
Peter Long 1,700Johan Lundgren 840William Waggott 660
Total 3,200
The PSP shares awarded on 28 November 2008 were released on 5 December 2011. The vesting of the shares was subject to three performance conditions.

www.tuitravelplc.com
76 TUI Travel PLC Annual Report & Accounts 2012
TT11 | AR 2012 | 20/12/2012 | Proof 5
Performance Share Plan (PSP)Awards made under the Performance Share Plan, and which remain outstanding at 30 September 2012 are: Maximum PSP shares PSP shares PSP shares Maximum awarded vested released value based Maximum during during during Maximum on share PSP shares the year Market the year Market Planned/ the year PSP shares price of held at ended price per ended price per Market actual ended held at 234.1p at 1 Oct 30 Sept Award share at 30 Sept share at value at vesting 30 Sept Release 30 Sept 28 SeptDirectors 2011 2012 date award 2012 vesting vesting (£) date 2012 date 2012 2012 (£)
Peter Long 828,258 28.11.08 205.25p 414,129 166.40p 689,111 05.12.11 414,129 28.11.11 – – 698,725 02.12.09 243.30p 04.12.12 05.12.11 698,725 1,635,715 742,358 06.12.10 229.00p 06.12.13 742,358 1,737,860 1,032,179 07.12.11 164.70p 07.12.14 1,032,179 2,416,331
Total 2,269,341 1,032,179 414,129 689,111 414,129 2,473,262 5,789,906
Johan Lundgren 287,106 28.11.08 205.25p 143,553 166.40p 238,872 05.12.11 143,553 28.11.11 – – 248,664 02.12.09 243.30p 04.12.12 05.12.11 248,664 582,122 264,192 06.12.10 229.00p 06.12.13 264,192 618,473 850,030 07.12.11 164.70p 07.12.14 850,030 1,989,920
Total 799,962 850,030 143,553 238,872 143,553 1,362,886 3,190,515
William Waggott 209,500 28.11.08 205.25p 104,750 166.40p 174,304 05.12.11 104,750 28.11.11 – – 176,736 02.12.09 243.30p 04.12.12 05.12.11 176,736 413,739 256,769 06.12.10 229.00p 06.12.13 256,769 601,096 400,728 07.12.11 164.70p 07.12.14 400,728 938,104
Total 643,005 400,728 104,750 174,304 104,750 834,233 1,952,939
Dr Volker 221,829 28.11.08 205.25p 110,914 166.40p 184,561 05.12.11 110,914 05.12.11 – –Böttcher 203,639 02.12.09 243.30p 04.12.12 05.12.11 203,639 476,719 202,615 06.12.10 229.00p 06.12.13 202,615 474,322 283,843 07.12.11 164.70p 07.12.14 283,843 664,476
Total 628,083 283,843 110,914 184,561 110,914 690,097 1,615,517
Grand total 4,340,391 2,566,780 773,346 1,286,848 773,346 5,360,478 12,548,877
Governance
Remuneration report continued
TT11 | AR 2012 | 20/12/2012 | Proof 5
www.tuitravelplc.com
TUI Travel PLC Annual Report & Accounts 2012 77G
overnance
Governance
Directors’ shareholdingsAs noted previously the Executive Directors are subject to a shareholding obligation. Peter Long is expected to hold shares at least equal to 200% of his base salary. The remaining Executive Directors are expected to hold shares at least equal to 150% of base salary. Using the mid-closing share price on Friday 28 September 2012 of 234.1 pence, the levels of share ownership as a percentage of pay were:
Shareholding as at Shareholding as a Executive Director 30 September 2012 percentage of salary
Peter Long 3,774,589 1,040%Johan Lundgren 882,964 295%William Waggott 675,962 288%Dr Volker Böttcher 376,762 195%
As at 30 September 2012, the Non-Executive Directors’ interests in ordinary shares of the Company were:
Shareholding as atExecutive Director 30 September 2012
Horst Baier –Tony Campbell 49,980Rainer Feuerhake –Dr Michael Frenzel (Chairman) –Sir Michael Hodgkinson (Deputy Chairman) 20,000Janis Kong 15,000Coline McConville –Minnow Powell 6,891Dr Erhard Schipporeit –Dr Albert Schunk –Harold Sher –
The Company’s Register of Directors’ Interests, which is open to inspection at the Registered Office, contains full details of Directors’ shareholdings and will be available for inspection before and during the Annual General Meeting on Thursday 7 February 2013.
During the year, the price of the Company’s ordinary shares ranged between 136.7 pence and 234.1 pence and the mid-closing price on Friday 28 September 2012 was 234.1 pence.
On 3 October 2012, William Waggott and Tony Campbell were allocated 53 and 691 additional shares respectively under the Dividend Reinvestment Plan (open to all shareholders under the same terms). No further changes took place between 30 September 2012 and the date of approval of the Report and Accounts.
The Remuneration Report was approved by a duly authorised Committee of the Board of Directors on 3 December 2012 and signed on its behalf by:
Coline McConvilleRemuneration Committee Chairman3 December 2012

www.tuitravelplc.com
78 TUI Travel PLC Annual Report & Accounts 2012
Opinion on other matter prescribed by the Companies Act 2006In our opinion the information given in the Directors’ report for the financial year for which the Group financial statements are prepared is consistent with the Group financial statements.
Matters on which we are required to report by exceptionWe have nothing to report in respect of the following:
Under the Companies Act 2006 we are required to report to you if, in our opinion:
• certain disclosures of Directors’ remuneration specified by law are not made; or
• we have not received all the information and explanations we require for our audit.
Under the Listing Rules we are required to review:
• the Directors’ statement, set out on page 54, in relation to going concern;
• the part of the Corporate Governance statement relating to the Company’s compliance with the nine provisions of the UK Corporate Governance Code specified for our review; and
• certain elements of the report to shareholders by the Board on Directors’ remuneration.
Other matterWe have reported separately on the Parent Company financial statements of TUI Travel PLC for the year ended 30 September 2012 and on the information in the Directors’ Remuneration Report that is described as having been audited.
Roger de Peyrecave (Senior Statutory Auditor)for and on behalf of PricewaterhouseCoopers LLP Chartered Accountants and Statutory AuditorsLondon3 December 2012
We have audited the Group financial statements of TUI Travel PLC for the year ended 30 September 2012 which comprise the consolidated income statement, the consolidated statement of comprehensive income, the consolidated balance sheet, the consolidated statement of changes in equity, the consolidated statement of cash flows and the related notes. The financial reporting framework that has been applied in their preparation is applicable law and International Financial Reporting Standards (IFRSs) as adopted by the European Union.
Respective responsibilities of Directors and auditorsAs explained more fully in the Directors’ responsibilities statement set out on page 55, the Directors are responsible for the preparation of the Group financial statements and for being satisfied that they give a true and fair view. Our responsibility is to audit and express an opinion on the Group financial statements in accordance with applicable law and International Standards on Auditing (UK and Ireland). Those standards require us to comply with the Auditing Practices Board’s Ethical Standards for Auditors.
This report, including the opinions, has been prepared for and only for the Company’s members as a body in accordance with Chapter 3 of Part 16 of the Companies Act 2006 and for no other purpose. We do not, in giving these opinions, accept or assume responsibility for any other purpose or to any other person to whom this report is shown or into whose hands it may come save where expressly agreed by our prior consent in writing.
Scope of the audit of the financial statementsAn audit involves obtaining evidence about the amounts and disclosures in the financial statements sufficient to give reasonable assurance that the financial statements are free from material misstatement, whether caused by fraud or error. This includes an assessment of: whether the accounting policies are appropriate to the Group’s circumstances and have been consistently applied and adequately disclosed; the reasonableness of significant accounting estimates made by the Directors; and the overall presentation of the financial statements. In addition, we read all the financial and non-financial information in the Annual Report & Accounts to identify material inconsistencies with the audited financial statements. If we become aware of any apparent material misstatements or inconsistencies we consider the implications for our report.
Opinion on financial statements In our opinion the Group financial statements:
• give a true and fair view of the state of the Group’s affairs as at 30 September 2012 and of its profit and cash flows for the year then ended;
• have been properly prepared in accordance with IFRSs as adopted by the European Union; and
• have been prepared in accordance with the requirements of the Companies Act 2006 and Article 4 of the lAS Regulation.
Financial statements
Independent Auditors’ report to the members of TUI Travel PLC
TT11 | AR 2012 | 20/12/2012 | Proof 5

www.tuitravelplc.com
TUI Travel PLC Annual Report & Accounts 2012 79Financial statem
ents
Year ended Year ended 30 September 30 September 2012 2011 Note £m £m
Revenue 3 14,460 14,687 Cost of sales (12,965) (13,351)
Gross profit 1,495 1,336
Administrative expenses (1,199) (1,094)Share of profits of joint ventures and associates 12 5 13
Operating profit 301 255
Analysed as: Underlying operating profit 3 490 471 Separately disclosed items 4 (92) (74)Predecessor accounting for Magic Life – (17)Acquisition related expenses 13(A) (62) (82)Impairment of goodwill 10 (20) (39)Impairment of available for sale financial asset 12 (10) – Taxation on profits and interest of joint ventures and associates 12 (5) (4)
301 255
Financial income 5 96 83 Financial expenses 5 (196) (194)
Net financial expenses (100) (111)
Profit before tax 201 144 Taxation charge 8 (64) (57)
Profit for the year 137 87
Attributable to: Equity holders of the parent 138 85 Non-controlling interests (1) 2
Profit for the year 137 87
Year ended Year ended 30 September 30 September 2012 2011 Pence Pence
Basic and diluted earnings per share for profit attributable to the equity holders of the Company during the yearBasic earnings per share 32 12.5 7.7Diluted earnings per share 32 12.3 7.6
Financial statements
Consolidated income statementfor the year ended 30 September 2012
TT11 | AR 2012 | 20/12/2012 | Proof 5

www.tuitravelplc.com
80 TUI Travel PLC Annual Report & Accounts 2012
Financial statements
Consolidated statement of comprehensive incomefor the year ended 30 September 2012
Year ended Year ended 30 September 30 September 2012 2011 Note £m £m
Profit for the year 137 87
Other comprehensive (expense)/income Foreign exchange translation (160) (18)Actuarial losses arising in respect of defined benefit pension schemes 6(C) (172) (89)Tax on actuarial losses 8(iii) 32 (7)Cash flow hedges: – movement in fair value 25(J) (42) 85 – amounts recycled to the consolidated income statement 25(J) (30) (4)Tax on cash flow hedges 8(iii) 15 (22)Available for sale financial assets: – movement in fair value 12 (4) (2)– amounts recycled to the consolidated income statement 12 10 1
Other comprehensive loss for the year net of tax (351) (56)
Total comprehensive (loss)/income for the year (214) 31
Total comprehensive (loss)/income for the year Attributable to: Equity holders of the parent (211) 26 Non-controlling interests (3) 5
Total (214) 31
TT11 | AR 2012 | 20/12/2012 | Proof 5

www.tuitravelplc.com
TUI Travel PLC Annual Report & Accounts 2012 81Financial statem
ents
Financial statements
Consolidated balance sheetat 30 September 2012
30 September 30 September 2012 2011 Note £m £m
Non-current assets Intangible assets 10 4,482 4,642 Property, plant and equipment 11 1,096 1,001 Investments in joint ventures and associates 12 258 242 Other investments 12 66 72 Trade and other receivables 16 225 202 Retirement benefit asset 6(C) – 1 Derivative financial instruments 25(I) 21 30 Deferred tax assets 14 125 138
6,273 6,328
Current assets Inventories 15 61 69 Other investments 17(B) 19 22 Trade and other receivables 16 1,312 1,472 Income tax recoverable 15 62 Derivative financial instruments 25(I) 98 185 Cash and cash equivalents 17(A) 830 902 Assets classified as held for sale 18 13 13
2,348 2,725
Total assets 8,621 9,053
Current liabilities Interest-bearing loans and borrowings 19 (70) (96)Retirement benefits 6(C) (2) (3)Derivative financial instruments 25(I) (125) (133)Trade and other payables 20 (4,549) (4,622)Provisions for liabilities 21 (300) (317)Income tax payable (39) (133)
(5,085) (5,304)
Non-current liabilities Interest-bearing loans and borrowings 19 (868) (802)Retirement benefits 6(C) (646) (511)Derivative financial instruments 25(I) (20) (18)Trade and other payables 22 (48) (56)Provisions for liabilities 21 (316) (353)Deferred tax liabilities 14 (29) (71)
(1,927) (1,811)
Total liabilities (7,012) (7,115)
Net assets 1,609 1,938
Equity Called up share capital 23 112 112 Convertible bond reserve 24 88 85 Other reserves 24 2,627 2,846 Accumulated losses 24 (1,262) (1,155)
Total equity attributable to equity holders of the parent 24 1,565 1,888 Non-controlling interests 24 44 50
Total equity 24 1,609 1,938
The financial statements on pages 79 to 146 were approved by a duly authorised Committee of the Board of Directors on 3 December 2012 and signed on its behalf by:
Peter J Long William H WaggottChief Executive Chief Financial Officer
Company number: 6072876
TT11 | AR 2012 | 20/12/2012 | Proof 5

www.tuitravelplc.com
82 TUI Travel PLC Annual Report & Accounts 2012
Other reserves Called up Convertible Equity Non- share bond Merger Translation Hedging Accumulated holders controlling Total capital reserve reserve reserve reserve losses of parent interests equity £m £m £m £m £m £m £m £m £m
At 1 October 2010 112 83 2,521 292 (19) (1,014) 1,975 1 1,976
Profit for the year – – – – – 85 85 2 87Other comprehensive (loss)/income for the year – – – (3) 56 (112) (59) 3 (56)
Total comprehensive (loss)/income for the year – – – (3) 56 (27) 26 5 31
Transactions with ownersShare-based payment – – – – – 19 19 – 19Acquisition of shares by Employee Benefit Trust – – – – – (7) (7) – (7)Dividends – – – – – (122) (122) (2) (124)Capital increase in Magic Life – – 2 – – – 2 – 2Disposals to non-controlling interests – – – (3) – (4) (7) 46 39Change in deferred tax rate on equity portion of convertible bond – 2 – – – – 2 – 2
At 30 September 2011 112 85 2,523 286 37 (1,155) 1,888 50 1,938
Other reserves Called up Convertible Equity Non- share bond Merger Translation Hedging Accumulated holders controlling Total capital reserve reserve reserve reserve losses of parent interests equity £m £m £m £m £m £m £m £m £m
At 1 October 2011 112 85 2,523 286 37 (1,155) 1,888 50 1,938
Profit for the year – – – – – 138 138 (1) 137 Other comprehensive loss for the year – – – (157) (62) (130) (349) (2) (351)
Total comprehensive (loss)/income for the year – – – (157) (62) 8 (211) (3) (214)
Transactions with ownersShare-based payment – charge for the year – – – – – 16 16 – 16Share-based payment – disposal on award of shares – – – – – (5) (5) – (5)Dividends – – – – – (125) (125) (3) (128)Acquisition of non-controlling interests – – – – – (1) (1) – (1)Change in deferred tax rate on equity portion of convertible bond – 3 – – – – 3 – 3
At 30 September 2012 112 88 2,523 129 (25) (1,262) 1,565 44 1,609
Details of reserve movements are set out in Note 24 to the consolidated financial statements.
Financial statements
Consolidated statement of changes in equity
TT11 | AR 2012 | 20/12/2012 | Proof 5

www.tuitravelplc.com
TUI Travel PLC Annual Report & Accounts 2012 83Financial statem
ents
Year ended Year ended 30 September 30 September 2012 2011 Note £m £m
Profit/(loss) for the year 137 87Adjustment for:Depreciation and amortisation 10,11 219 238Impairment of intangible assets and property, plant and equipment 10,11 22 30 Impairment of goodwill 10 20 39 Equity-settled share-based payment expenses 6(D) 16 19 (Profit)/loss on sale of property, plant and equipment 7 (9) 6 Share of profit of joint ventures and associates 12 (5) (13)Loss on foreign exchange 7 14 38 Impairment of available for sale financial asset 12 10 – Dividends received from joint ventures and associates 12 4 7 Pension curtailment gain recognised in consolidated income statement 6(C) (1) (64)Financial income 5 (96) (83)Financial expenses 5 196 194 Taxation 8 64 57
Operating cash flow before changes in working capital and provisions 591 555 Decrease/(increase) in inventories 17 (9)Increase in trade and other receivables (55) (68)Increase in trade and other payables 126 140 (Decrease)/increase in provisions and retirement benefits (35) 125
Cash flows generated from operations 644 743 Interest paid (75) (86)Interest received 15 9 Income taxes paid (82) (53)
Cash flows generated from operating activities 502 613
Investing activities Proceeds from sale of property, plant and equipment 116 148 Acquisition of subsidiaries net of cash acquired 13(B) (23) (33)Proceeds from other investments 1 3 Investment in joint ventures, associates and other investments 12 (25) (18)Acquisition of property, plant and equipment (287) (257)Acquisition of intangible assets 10 (91) (56)
Cash flows used in investing activities (309) (213)
Financing activities Proceeds from new loans and deposits taken 14 26 Repayment of borrowings (43) (556)Repayment of finance lease liabilities (19) (145)Dividends paid to ordinary and non-controlling interests 24 (128) (124)Shares purchased by Employee Benefit Trust 23 – (7)
Cash flows used in financing activities (176) (806)
Net increase/(decrease) in cash and cash equivalents 17 (406)Cash and cash equivalents at start of the year 17 902 1,304 Effect of foreign exchange on cash held (89) 4
Cash and cash equivalents at end of the year 17 830 902
Movements in cash and net debt are presented in Note 26.
Financial statements
Consolidated statement of cash flowsfor the year ended 30 September 2012
TT11 | AR 2012 | 20/12/2012 | Proof 5

Financial statements
www.tuitravelplc.com
84 TUI Travel PLC Annual Report & Accounts 2012
impairment of goodwill and available for sale financial assets, interest and taxation of joint ventures and associates and separately disclosed items included within the operating result.
Underlying earnings used in the calculation of underlying earnings per share is profit after tax from continuing operations excluding the impact of predecessor accounting, acquisition related expenses, impairment of goodwill and available for sale financial assets and separately disclosed items included within the operating result. For the purpose of this calculation, an underlying tax charge is used which excludes the tax effects of separately disclosed items, acquisition related expenses, goodwill and available for sale financial asset impairment charges and separately disclosable tax items.
It should be noted that the definitions of underlying items being used in these consolidated financial statements are those used by the Group and may not be comparable with the term ‘underlying’ as defined by other companies within both the same sector or elsewhere.
Reconciliation of underlying operating profit to underlying profit before tax Year ended Year ended 30 September 30 September 2012 2011 Note £m £m
Underlying operating profit 3 490 471 Net underlying financial expenses 5 (100) (111)
Underlying profit before tax 390 360
(iii) Separately disclosed itemsSeparately disclosed items are those significant items which in management’s judgement are highlighted by virtue of their size or incidence to enable a full understanding of the Group’s financial performance. Such items are included within the income statement caption to which they relate (Note 4).
(iv) Business and Performance ReviewThe Group’s business activities, together with factors likely to affect its future development, performance and position are set out in the Business performance section. In addition, Note 25 sets out the Group’s objectives, policies and processes for managing its capital, financial risks, financial instruments and hedging activities as well as its exposures to credit and liquidity risk.
(v) Funding and LiquidityThe Board remains satisfied with the Group’s funding and liquidity position. At 30 September 2012, the main sources of debt funding included:
• A total of £970m syndicated bank revolving credit facilities which mature in June 2015;
• £186m of drawn finance lease obligations with repayments up to March 2022;
• £350m convertible bond due October 2014; and
• £400m convertible bond due April 2017.
The ratio of earnings before interest, taxation, depreciation, amortisation and operating lease rentals (EBITDAR) to fixed charges (being the aggregate amount of interest and any other finance charges in respect of borrowings and including all payments under operating leases) and the ratio of net debt to earnings before interest, taxation, depreciation and amortisation (EBITDA), which the Board believes to be the most useful measures of cash generation and gearing, as well as being the main basis for the Group’s credit facility covenants, are well within the covenant limits at the date of the balance sheet. Forecasts reviewed by the Board, including forecasts adjusted for significantly worse economic conditions, show continued compliance with these covenants. For both covenants, earnings are calculated on an underlying basis as described in Note 1(B)(ii).
1. Accounting policiesThe accounting policies adopted in the preparation of these consolidated financial statements are consistent with those followed in the preparation of the Group’s consolidated financial statements for the year ended 30 September 2011, except for the adoption of the following amended International Financial Reporting Standards (IFRS) and Interpretations that are applicable for the year ended 30 September 2012:
• IAS 24 (revised) ‘Related party disclosures’
• Amendment to IFRS 7 ‘Financial instruments: Transfers of financial assets’
• Amendment to IFRIC 14 ‘Prepayments of a minimum funding requirement’
• Annual improvements project (2010) (partly applicable for the year ended 30 September 2012)
These amended standards and interpretations have no significant impact on the consolidated results or financial position.
The consolidated financial statements are presented in the Group’s presentation currency of Sterling, rounded to the nearest million.
(A) Statement of complianceThe consolidated financial statements for the year ended 30 September 2012 have been prepared and approved by the Directors in accordance with International Financial Reporting Standards and IFRIC interpretations as adopted by the European Union (Adopted IFRS) and the Companies Act 2006 applicable to companies reporting under IFRS. The consolidated financial statements were approved on 3 December 2012.
(B) Basis of preparationThe consolidated financial statements are prepared on the historical cost basis other than derivative financial instruments, financial instruments held for trading and financial instruments classified as available for sale, which are stated at their fair value. Non-current assets and disposal groups held for sale are stated at the lower of their carrying amount and fair value less costs to sell.
(i) Parent CompanyTUI Travel PLC (the Company) is a company incorporated and domiciled in England and Wales and listed on the London Stock Exchange. The Registered Office of the Company is TUI Travel House, Crawley Business Quarter, Fleming Way, Crawley, West Sussex, RH10 9QL.
The Company has elected to prepare its Parent Company financial statements in accordance with UK GAAP.
(ii) Underlying measures of profits and lossesThe Group believes that underlying operating profit, underlying profit before tax and underlying earnings per share provide additional guidance to statutory measures to help understand the underlying performance of the business during the financial year. The term underlying is not defined under IFRS. It is a measure that is used by management to assess the underlying performance of the business internally and is not intended to be a substitute measure for adopted IFRS GAAP measures. The Group defines these underlying measures as follows:
Underlying operating profit is operating profit from continuing operations stated before separately disclosed items, the impact of predecessor accounting, acquisition related expenses, impairment of goodwill and available for sale financial assets and interest and taxation on the Group’s share of the results of joint ventures and associates.
Underlying profit before tax is profit from continuing operations before taxation (Group and share of joint ventures and associates), the impact of predecessor accounting, acquisition related expenses,
Financial statements
Notes to the consolidated financial statements
TT11 | AR 2012 | 20/12/2012 | Proof 5

Financial statements
www.tuitravelplc.com
TUI Travel PLC Annual Report & Accounts 2012 85Financial statem
ents
or gains and losses being recognised in the consolidated income statement. When control is lost, any remaining interest in equity is remeasured to fair value and a gain or loss is recognised in the consolidated income statement.
(iv) Transactions eliminated on consolidationIntra-group balances and any unrealised gains or income and expenses arising from intra-group transactions are eliminated in preparing the consolidated financial statements. Unrealised gains arising from transactions with associates and jointly controlled entities are eliminated to the extent of the Group’s interest in the entity. Unrealised losses are eliminated in the same way as unrealised gains but only to the extent that there is no evidence of impairment.
(v) Acquisition in stagesWhere a Group gains control of a subsidiary undertaking through a step acquisition, the existing interest owned is remeasured at fair value with the difference between fair value and book value being recognised in the income statement. The accounting impact of changes in share ownership which do not affect control is accounted for through reserves.
(vi) Acquisition related expensesAcquisition related expenses comprise amortisation of business combination intangibles, other acquisition related expenses and remuneration for post-combination services. Directly attributable acquisition costs are expensed in the consolidated income statement rather than included as part of the purchase price.
(vii) Contingent considerationContingent consideration (for business combinations up until 30 September 2009)Contingent consideration is recognised when the payment amount becomes probable and the amounts can be reliably measured. The purchase price is subsequently adjusted against goodwill or negative goodwill as the estimate of the amount payable is revised.
Contingent consideration (for business combinations from 1 October 2009)Contingent consideration is accounted for at fair value at the acquisition date with subsequent changes in the fair value being recognised in the income statement. Contingent consideration dependent upon continuing service of an employee is charged to the income statement over the related service period.
The term contingent consideration has been used throughout these financial statements to describe the part of the overall consideration paid to the former shareholders of businesses acquired on or after October 2009 that is contingent upon the future results of those acquired businesses, including where the payment is contingent on those former shareholders undertaking employment with the Group for a predetermined period after the relevant business combination. IFRS 3 (revised) requires that these amounts are charged to the consolidated income statement as a post acquisition employment cost over the term of the relevant post combination employment period. The Group includes the relevant income statement charge within acquisition related expenses (Note 13) and which are included within operating profit.
Contingent consideration arising in a business combination that had been accounted for in accordance with IFRS 3 (2004) that has not been settled or otherwise resolved at the effective date of IFRS 3 (revised) continues to be accounted for in accordance with IFRS 3 (2004). Contingent consideration is discounted to present value where the time value of money is material.
On the basis of its forecasts, both base case and adjusted as described above, and available facilities, the Board has concluded that the going concern basis of preparation continues to be appropriate.
(C) Basis of consolidationThe Group financial statements consolidate those of the Company and its subsidiaries (together referred to as the Group) and equity accounts for the Group’s interest in joint ventures and associates. The Parent Company financial statements present information about the Company as a separate entity and not about the Group. Accounting policies of subsidiaries, joint ventures and associates are amended where necessary to be consistent with those adopted by the Group. Where audited financial statements are not coterminous with those of the Group, the financial information is derived from the last audited accounts available and unaudited management accounts for the period up to the Group’s balance sheet date.
(i) SubsidiariesSubsidiaries are entities controlled by the Group. Control exists when the Group has the power, directly or indirectly, to govern the financial and operating policies of an entity so as to obtain benefits from its activities. In assessing control, potential voting rights that are currently exercisable or convertible are taken into account. The financial statements of subsidiaries are included in the consolidated financial information from the date that control commences until the date that control ceases.
(ii) Joint ventures and associatesJoint ventures are jointly controlled entities whose activities the Group has the power to control jointly, established by contractual agreement. Associates are those entities in which the Group has the ability to exercise significant influence, but not control, over the financial and operating policies. The consolidated financial statements include the Group’s share of the total recognised income and expense and changes in equity of joint ventures and associates on an equity accounted basis, from the date that joint control or significant influence respectively commences until the date that it ceases. Associates and joint ventures are recorded at cost as adjusted for post-acquisition changes in the Group’s share of net assets of the entity including goodwill net of accumulated impairment loss. When the Group’s share of losses exceeds the carrying amount of the joint venture or associate, the carrying amount is reduced to £nil and recognition of further losses is discontinued except to the extent that the Group has incurred legal or constructive obligations or made payments on behalf of the joint venture or associate.
(iii) Non-controlling interestsIn the consolidated balance sheet, the share of net assets attributable to non-controlling interests is disclosed as a separate component of equity after share capital and reserves. The consolidated income statement discloses the amount of the result for the year attributable to non-controlling interests.
Where the Group has a written put option in respect of a non-controlling interest and has an unavoidable obligation to purchase the shareholding, the obligation is recorded as a financial liability at fair value, rather than being reported as a separate component of equity. Changes to the fair value of the financial liability are recorded at each period end in the income statement within financial income or financial expenses.
On purchase or sale of a non-controlling interest held in a Group subsidiary, the Group recognises increases or decreases in the value of its interest directly in equity providing there is no overall change in control. As such, these transactions do not result in goodwill
Financial statements
TT11 | AR 2012 | 20/12/2012 | Proof 5

www.tuitravelplc.com
86 TUI Travel PLC Annual Report & Accounts 2012
retranslation have been recognised directly in equity in the translation reserve, a designated foreign exchange reserve, since 1 January 2007.
Foreign exchange gains and losses arising from a monetary item receivable from or payable to a foreign operation, the settlement of which is neither planned nor likely in the foreseeable future, are considered to form part of a net investment in a foreign operation and are recognised directly in equity in the translation reserve.
(iii) Net investment in foreign operationsForeign currency differences arising on the retranslation of a financial liability designated as a hedge of a net investment in a foreign operation are recognised in the consolidated statement of comprehensive income to the extent that the hedge is effective and are presented within equity in the translation reserve. To the extent that the hedge is ineffective, such differences are recognised in profit or loss. When the hedged part of a net investment is disposed, the relevant amount in the translation reserve is transferred to profit or loss as part of the profit or loss on disposal.
(E) Financial instruments(i) Financial assetsFinancial assets are either classified as loans and receivables, available for sale financial assets, or financial assets at fair value through profit or loss. Financial assets include cash and cash equivalents, trade receivables, loans, trade and other investments, derivative financial instruments and other receivables, but excludes financial deposits, prepayments and taxes. The Group determines the classification of its financial assets at initial recognition. Financial assets are recognised initially at fair value, normally being the transaction price plus, in the case of financial assets not at fair value through profit or loss, directly attributable transaction costs. The subsequent measurement of financial assets depends on their classification, as follows:
Loans and receivablesLoans and receivables are non-derivative financial assets with fixed or determinable payments that are not quoted in an active market. Such assets are carried at amortised cost using the effective interest method if the time value of money is significant. Gains and losses are recognised in income when the loans and receivables are derecognised or impaired, as well as through the amortisation process. This category of financial assets includes trade and other receivables.
Available for sale financial assetsAvailable for sale financial assets are those non-derivative financial assets that are not classified as loans and receivables or financial assets at fair value through profit or loss. After initial recognition, available for sale financial assets are measured at fair value, with gains or losses recognised within other comprehensive income until the investment is derecognised or until the investment is determined to be impaired, at which time the cumulative gain or loss previously reported in other comprehensive income is included in the consolidated income statement. Note 1(W)(iv) describes the basis on which fair value is determined.
Financial assets at fair value through profit or lossFinancial assets at fair value through profit or loss are measured at fair value after initial recognition. The gain or loss is included in the consolidated income statement. Note 1(W)(iv) describes the basis on which fair value is determined.
Cash and cash equivalentsCash and cash equivalents comprise cash balances and call deposits which are readily convertible to known amounts of cash and which are subject to insignificant risk of changes in value and have an original maturity of three months or less. Bank overdrafts that are repayable on demand and form an integral part of the Group’s cash management are included as a component of cash and cash equivalents for the purpose only of the consolidated statement of cash flows.
1. Accounting policies continued(viii) Non-current assets held for saleThe Group classifies non-current assets or disposal groups containing a non-current asset as held for sale if their carrying amount will be recovered principally through a sale transaction rather than through continuing use. To be classified as held for sale, the assets must be available for immediate sale in their present condition, subject only to terms that are usual and customary for the sale of such assets, and their sale must be highly probable. Sale is considered to be highly probable when management are committed to a plan to sell the assets and an active programme to locate a buyer and complete the plan has been initiated, at a price that is reasonable in relation to their current fair value, and there is an expectation that the sale will be completed within one year from the date of classification.
On initial classification as held for sale, non-current assets and disposal groups are measured at the lower of previous carrying amount and fair value less costs to sell with any adjustments taken to profit or loss. The same applies to gains and losses on subsequent remeasurement.
Any impairment loss on a disposal group is allocated first to goodwill and then to remaining applicable assets on a pro rata basis (except no loss is allocated to inventories, financial assets, deferred tax assets or employee benefit assets, which continue to be measured in accordance with the Group’s accounting policies).
Certain assets and liabilities are excluded from the measurement basis of IFRS 5 including deferred tax assets (IAS 12 ‘Income Taxes’), assets arising from employee benefits (IAS 19 ‘Employee Benefits’) and financial assets within the scope of IAS 39 ‘Financial Instruments: Recognition and Measurement’.
(ix) Business combinations between entities under common controlThe results of business combinations between entities under common control are incorporated as if the acquired entity had always been combined. This is also known as ‘predecessor accounting’. Where this applies, all necessary comparatives for the prior year financial statements are restated to reflect the inclusion of results from the commencement of the earliest comparative period, in accordance with IAS 8.
(D) Foreign currency(i) Foreign currency transactionsTransactions in foreign currencies are translated at the foreign exchange rate ruling at the date of the transaction. Monetary assets and liabilities denominated in foreign currencies at the balance sheet date are translated at the foreign exchange rate ruling at that date. Foreign exchange differences arising on translation are recognised in the income statement (except for differences arising on the retranslation of a financial liability designated as a hedge of the net investment in a foreign operation, or qualifying cash flow hedges, which are recognised directly in equity). Non-monetary assets and liabilities that are measured in terms of historical cost in a foreign currency are translated using the exchange rate at the date of the transaction. Non-monetary assets and liabilities denominated in foreign currencies that are stated at fair value are translated at foreign exchange rates ruling at the dates the fair values were determined.
(ii) Foreign operationsThe assets and liabilities of foreign operations, including goodwill and fair value adjustments arising on consolidation, are translated to Sterling at the foreign exchange rates ruling at the balance sheet date.
The revenues and expenses of overseas operations are translated at rates approximating to the foreign exchange rates ruling at the dates of the transactions. Foreign exchange differences arising on
Financial statements
Notes to the consolidated financial statements continued
TT11 | AR 2012 | 20/12/2012 | Proof 5

Financial statements
www.tuitravelplc.com
TUI Travel PLC Annual Report & Accounts 2012 87Financial statem
ents
(iii) Derivative financial instrumentsThe Group uses derivative financial instruments to hedge its exposure to foreign exchange and fuel price risks arising from operational, financing and investment activities. In accordance with its treasury policy, the Group does not hold or issue derivative financial instruments for trading purposes. However, derivatives that do not qualify for hedge accounting are accounted for as trading instruments.
Derivative financial instruments are initially recognised at fair value on the date a derivative contract is entered into and are subsequently remeasured at fair value. The method of recognising the resulting gain or loss depends on whether the derivative is designated as a hedging instrument and if so the nature of the item being hedged. The gain or loss on remeasurement to fair value on derivatives not designated as a hedging instrument is recognised immediately in the income statement against the opposite line of income or expense. The accounting policy for derivatives that qualify for hedge accounting is included in Note 1(F).
(iv) Share capitalOrdinary shares are classified as equity. Incremental costs directly attributable to the issue of ordinary shares and share awards are recognised as a deduction from equity, net of any tax effects.
(F) Hedge accountingThe Group designates certain derivatives as cash flow hedges of highly probable forecast transactions.
On initial designation of the hedge, the Group formally documents the relationship between the hedging instrument(s) and hedged item(s), including the risk management objectives and strategy in undertaking the hedge transaction, together with the methods that will be used to assess the effectiveness of the hedging relationship. The Group makes an assessment, both at the inception of the hedge relationship as well as on an ongoing basis, whether the hedging instruments are expected to be ’highly effective’ in hedging cash flows during the period for which the hedge is designated and whether the actual results of each hedge are within a range of 80-125%. The transaction being hedged should be highly probable to occur and should present an exposure to variations in cash flows that could ultimately affect reported net income.
Derivatives are recognised initially at fair value. Subsequent to initial recognition, derivatives are measured at fair value.
Where a derivative financial instrument is designated as a hedge of the variability in cash flows arising from a recognised asset or liability, or a highly probable forecast transaction, the effective part of any fair value gain or loss on the derivative financial instrument is recognised directly in the hedging reserve. Any ineffective portion of the hedge is recognised immediately within the consolidated income statement.
When the forecast transaction subsequently results in the recognition of a non-financial asset or non-financial liability, the associated cumulative gain or loss is removed from the hedging reserve and is included in the initial cost or other carrying amount of the non-financial asset or liability. If a hedge of a forecast transaction subsequently results in the recognition of a financial asset or a financial liability, the associated gains and losses that were recognised directly in equity are reclassified into the consolidated income statement in the same period or periods during which the asset acquired or liability assumed affects profit or loss.
For cash flow hedges, other than those covered by the preceding two paragraphs, the associated cumulative gain or loss is removed from equity and recognised in the consolidated income statement in the same period or periods during which the hedged forecast transaction affects the consolidated income statement.
DerivativesDerivatives are accounted for in accordance with the policy in Note 1(E)(iii).
DerecognitionThe Group derecognises a financial asset when the contractual rights to the cash flows from the asset expire, or it transfers the rights to receive the contractual cash flows on the financial asset in a transaction in which substantially all the risks and rewards of ownership of the financial asset are transferred. Any interest in transferred financial assets that is created or retained by the Group is recognised as a separate asset or liability.
(ii) Financial liabilitiesFinancial liabilities are either classified as financial liabilities measured at amortised cost, or financial liabilities at fair value through profit or loss. Financial liabilities include trade and other payables (excluding tax and social security and deferred income), accruals, finance debt and derivative financial instruments. The Group determines the classification of its financial liabilities at initial recognition. Financial liabilities are recognised initially at fair value, normally being the transaction price plus, in the case of financial liabilities not at fair value through profit or loss, directly attributable transaction costs. The subsequent measurement of financial liabilities depends on their classification, as follows:
Financial liabilities measured at amortised costAll financial liabilities are initially recognised at fair value. For interest-bearing loans and borrowings this is the fair value of the proceeds received net of issue costs associated with the borrowing. After initial recognition, financial liabilities other than those at fair value through profit or loss are subsequently measured at amortised cost using the effective interest method. Amortised cost is calculated by taking into account any issue costs and any discount or premium on settlement. Gains and losses arising on the repurchase, settlement or cancellation of liabilities are recognised respectively in interest, other revenues and finance costs. This category of financial liabilities includes trade and other payables.
Convertible bondsConvertible bonds are separated into three components: liability; issuer call option and equity at inception. Each component is recognised separately.
The initial fair value of the liability component of the convertible bond is determined using the market interest rate for an equivalent non-convertible bond and is subsequently recorded at an amortised cost basis using the effective interest method until extinguished on conversion or maturity of the bonds. The issuer call option is fair valued using a valuation model and is measured at each balance sheet date with changes in fair value recognised in the income statement. The remainder of the proceeds are recognised in shareholders’ equity in a separate convertible bond reserve.
Issue costs are apportioned between the liability and equity components of a convertible bond based on the allocation of proceeds to the liability and equity components when the instruments are first recognised.
DerivativesDerivatives are accounted for in accordance with the policy in Note 1(E)(iii).
DerecognitionThe Group derecognises a financial liability when the contractual obligations to pay the contractual cash flows on the financial liability are discharged, cancelled or expire.
TT11 | AR 2012 | 20/12/2012 | Proof 5

www.tuitravelplc.com
88 TUI Travel PLC Annual Report & Accounts 2012
Financial statements
Notes to the consolidated financial statements continued
(H) Expenses(i) Operating lease paymentsPayments made under operating leases are recognised in the consolidated income statement on a straight line basis over the term of the lease. Lease incentives received are recognised in the consolidated income statement as an integral part of the total lease expense over the term of the lease.
(ii) Finance lease paymentsMinimum lease payments are apportioned between the finance charge and the reduction of the outstanding liability. The finance charge is allocated to each period during the lease term so as to produce a constant periodic rate of interest on the remaining balance of the liability.
(iii) Marketing and other direct sales costsMarketing, advertising and other promotional costs, including those related to the production of brochures, are expensed when the benefit of the goods or services is made available to the Group. In particular, brochure and advertising costs are expensed to the consolidated income statement when the Group’s suppliers have delivered the relevant material.
(I) Employee benefits(i) Defined contribution plansObligations for contributions to defined contribution pension plans are recognised as an expense in the consolidated income statement as incurred.
(ii) Defined benefit plansThe Group’s net obligation in respect of defined benefit pension plans is calculated separately for each plan by estimating the amount of future benefit that employees have earned in return for their service in current and prior periods. That benefit is discounted to determine its present value and any unrecognised past service costs and the fair value of any plan assets is deducted in calculating the overall liability. The liability discount rate is the yield at the balance sheet date on AA credit-rated bonds denominated in the currency of, and having the same maturity dates approximating to, the terms of the Group’s obligations. The calculation is performed by a qualified actuary using the projected unit credit method.
Where the calculation results in a benefit to the Group, the asset recognised is limited to the present value of any future refunds from the plan or reductions in future contributions to the plan which are under the control of the Group.
When the benefits of a plan are amended, the portion of the increase/decrease in benefit relating to past services by employees is recognised as an expense/income in the consolidated income statement on a straight line basis over the average period until the benefits become vested. To the extent that the benefits vest immediately, the expense/income is recognised immediately in the consolidated income statement.
All actuarial gains and losses are recognised in the period they occur through the consolidated statement of comprehensive income. Either monthly or annual contributions are made to funded schemes. The current service cost is included in the consolidated income statement as a personnel expense. Any change in the present value of pension scheme liabilities relating to employee service in prior periods but arising in the current period as a result of benefit amendments is charged/credited to operating expenses over the period during which such amendments vest.
The expected return on the schemes’ assets and the increase during the period in the present value of the schemes’ liabilities arising from the passage of time are included in financial income.
1. Accounting policies continuedProspective hedge testing is performed at the inception of the hedge relationship and subsequently at each balance sheet date, through comparison of the critical terms of the hedged forecast transaction and the hedging instrument using regression analysis. Retrospective hedge testing is performed at each reporting date principally using a dollar offset analysis, comparing the cumulative changes in the fair values of the forecast hedged transaction and the hedging instrument.
When a hedging instrument no longer meets the criteria for hedge accounting, expires or is sold, terminated or exercised, or the entity revokes designation of the hedge relationship, hedge accounting is discontinued prospectively. If the hedged forecast transaction is still expected to occur, the cumulative gain or loss at that point remains in equity and is recognised in accordance with the above policy when the transaction occurs. If the hedged transaction is no longer expected to take place, the cumulative unrealised gain or loss recognised in equity is recognised in the consolidated income statement immediately.
(G) RevenueRevenue represents the aggregate amount earned from inclusive tours, scheduled and charter flying, provision of incoming agency destination services, travel agency and intermediary commission received and other services supplied to customers in the ordinary course of business. Revenue excludes intra-group transactions and is stated after the deduction of trade discounts and sales taxes. Revenue is reported gross of fixed charges which are a liability of the tour operator or airline. These include Air Passenger Duty and other per passenger charges and levies, including the ATOL Protection Contribution in the UK.
(i) Revenue recognitionRevenue is recognised in the consolidated income statement when the significant risks and rewards of ownership have been transferred to the buyer. Travel agency and intermediary commissions and other revenues received from the sale of third party product are recognised when they are earned, typically on receipt of final payment. Revenue in respect of in-house product is recognised on the date of departure. Revenue from individual travel modules directly booked by the customer with airlines, hotels and incoming agencies is recognised when the customer departs or uses the respective service. Revenue from the sale of travel insurance is recognised at the point of sale.
No revenue is recognised if there are significant uncertainties regarding recovery of the consideration due or associated costs.
(ii) Client monies received in advance (deferred income)Client monies received at the balance sheet date relating to holidays commencing and flights departing after the year end are deferred and included within trade and other payables.
(iii) Measurement of revenueWhere the Group acts as principal, revenue is stated at the contractual value of goods and services provided.
Where the Group acts as an agent between the service provider and the end customer, revenue is presented on a net basis as the difference between the sales price to the customer and the cost of the services purchased and not the total transaction sales value. Businesses are identified as intermediaries dependent on a number of criteria, principally including the control exercised over the provision of service, inventory risk and customer credit risk.
(iv) Aircraft lease incomeOperating lease rental income is recognised in operating income as earned, on a straight line basis over the lease term.
TT11 | AR 2012 | 20/12/2012 | Proof 5

Financial statements
www.tuitravelplc.com
TUI Travel PLC Annual Report & Accounts 2012 89Financial statem
ents
liabilities in a transaction that is not a business combination and differences relating to investments in subsidiaries to the extent that they will probably not reverse in the foreseeable future. The amount of deferred tax asset recognised is based on the expected manner of realisation or settlement of the carrying amount of assets and liabilities, using the tax rate at which the asset or liability is expected to reverse in future periods, based on tax laws enacted or substantively enacted at the balance sheet date.
A deferred tax asset is recognised only to the extent that it is probable that future taxable profits will be available against which the asset can be utilised. Deferred tax assets are reduced to the extent that it is no longer probable that the related tax benefit will be realised.
(L) DividendsDividend distribution to the Company’s shareholders is recognised as a liability in the Group’s financial statements in the period in which the dividends are appropriately authorised and approved for payment and are no longer at the discretion of the Company. Interim dividends are recognised when paid. Unpaid dividends that do not meet these criteria are disclosed in the notes to the financial statements.
(M) Earnings per shareThe Group presents basic and diluted earnings per share (EPS) data for its ordinary shares. Basic EPS is calculated by dividing the profit or loss attributable to ordinary shareholders of the Company by the weighted average number of ordinary shares outstanding during the period. Diluted EPS is determined by adjusting the weighted average number of ordinary shares outstanding for the effects of all dilutive potential ordinary shares. EPS measures for continuing operations have been presented in accordance with IAS 33. The Group also presents a basic and diluted underlying EPS measure based on underlying earnings as defined in Note 1(B)(ii) above. Further details of the EPS calculation are presented in Note 32.
(N) InvestmentsUnless designated at fair value through profit and loss, trade investments are classified as available for sale assets and are included under non-current assets. They are recorded at fair value with movements in value taken to other comprehensive income. Any impairment to value is recorded in the income statement.
Short term investments in debt and equity securities which are held for trading are classified as current assets and are stated at fair value, with any resultant gain or loss recognised in the income statement.
(O) Intangible assets(i) GoodwillAll business combinations are accounted for by applying the purchase method.
Goodwill represents amounts arising on acquisition of subsidiaries, joint ventures and associates. Goodwill represents the difference between the fair value of consideration paid or payable and the net fair value of the identifiable assets, liabilities and contingent liabilities acquired. Identifiable intangibles, such as brands and customer relationships, are those which can be sold separately or which arise from contractual or legal rights regardless of whether those rights are separable, and the fair value can be reliably measured. Goodwill is stated at cost less any accumulated impairment losses.
Goodwill is allocated to those cash generating units (CGUs) expected to benefit from the business combination and is not amortised but tested annually for impairment. Impairment testing is based on assets grouped at the lowest level at which goodwill is monitored for internal management purposes. In respect of joint ventures and associates, the carrying amount of goodwill is included in the carrying amount of the investment in the joint venture or associate.
(iii) Share-based payment transactionsThe Group’s share award programmes allow certain Group employees to acquire shares of the Company. These shares are awarded by the Company. For equity-settled transactions, the fair value of services is measured by the fair value of the shares at the time awarded and is recognised as an employee expense with a corresponding increase in equity. The fair value is spread over the period during which the employee becomes entitled to the awards.
For cash-settled transactions, the resulting liability for the Group is charged to expenses at its fair value as at the date of the performance of the service by the beneficiary. Until payment of this liability, the fair value of the liability is remeasured at every reporting date and all changes are included in the consolidated income statement.
For both types of share-based payment transactions, the fair value of the awards is measured using option valuation models, taking into account the terms and conditions upon which the awards were made. The amount recognised as an expense is adjusted to reflect the actual number of share awards that vest except where forfeiture is due only to market based performance conditions not meeting the threshold for vesting.
(iv) Own shares held by the Employee Benefit Trust Transactions of the Group-sponsored Employee Benefit Trust (the Trust) are included in the Group’s consolidated financial statements. In particular, the Trust’s purchase of shares in the Company is debited directly in equity to retained earnings/accumulated losses.
(v) Short term benefitsShort term employee benefits are measured on an undiscounted basis and are expensed as the related service is provided.
(J) Financial income and expensesFinancial income comprises interest income on funds invested (including available for sale financial assets), dividend income, gains on the disposal of available for sale financial assets and changes in the fair value of financial assets or liabilities at fair value through profit or loss. Interest income is recognised as it accrues in profit or loss, using the effective interest method. Dividend income is recognised in profit or loss on the date the Group’s right to receive payment is established which, in the case of quoted securities, is the ex-dividend date. Foreign currency gains and losses are reported on a net basis.
Financial expenses comprise interest expense on borrowings, unwinding of the discount on provisions and changes in the fair value of financial assets or liabilities at fair value through profit or loss. All borrowing costs are recognised in profit or loss using the effective interest method. Foreign currency gains and losses are reported on a net basis.
(K) TaxationIncome tax comprises current and deferred tax. Income tax is recognised in the consolidated income statement except to the extent that it relates to items recognised in other comprehensive income or directly in equity, in which case the related tax is also recognised in other comprehensive income, or directly in equity, as appropriate.
(i) Current taxCurrent tax is the expected tax payable on the taxable income for the period, using tax rates enacted or substantively enacted at the balance sheet date, and any adjustment to tax payable in respect of previous periods.
(ii) Deferred taxDeferred tax is provided or recognised using the balance sheet liability method, providing for temporary differences between the carrying amounts of assets and liabilities for financial reporting purposes and the amounts used for taxation purposes. The following temporary differences are not provided for: the initial recognition of goodwill not deductible for tax purposes, the initial recognition of assets or
TT11 | AR 2012 | 20/12/2012 | Proof 5

www.tuitravelplc.com
90 TUI Travel PLC Annual Report & Accounts 2012
Financial statements
Notes to the consolidated financial statements continued
(P) Property, plant and equipment(i) Owned assetsItems of property, plant and equipment are stated at cost less accumulated depreciation and impairment losses. Cost includes the original purchase price of the asset and the costs attributable to bringing the asset to its working condition for its intended use.
Where significant parts of an item of property, plant and equipment have different useful lives, they are accounted for as separate items of property, plant and equipment.
(ii) Leased assetsLeases in which the Group assumes substantially all the risks and rewards of ownership are classified as finance leases. Leased assets acquired by way of a finance lease are stated at an amount equal to the lower of their fair value and the present value of the minimum lease payments at the inception of the lease, less accumulated depreciation and impairment losses. Lease payments are accounted for as set out in Note 1(H)(ii) above.
(iii) DepreciationDepreciation is charged to the consolidated income statement on a straight line basis over the estimated useful economic lives of each part of an item of property, plant and equipment. Freehold land is not depreciated. The useful economic lives are as follows:
Freehold properties Up to 50 yearsShort leasehold improvements Lease period or useful
economic life if shorterOwned aircraft Up to 18 yearsFinance leased aircraft and equipment Lease period or useful
economic life if shorterAircraft spares 12 yearsCruise ships 40 yearsYachts 5-15 yearsMotor boats 15-24 yearsComputer equipment including retail computer equipment 3-5 yearsRetail fixtures and fittings 8 yearsOther assets Up to 7 years
The cost of major overhauls of owned airframes and engines is capitalised and depreciated over the period until the next scheduled major overhaul.
The depreciation methods, useful economic lives and residual values are reassessed annually. Revisions to useful economic lives and residual values are accounted for prospectively from the date of change.
Assets under construction and advance payments, including capitalised borrowing costs for future aircraft, are not depreciated. Upon the delivery of the aircraft, the advance payments are re-categorised to aircraft assets and depreciation is commenced.
(iv) Borrowing costsIn respect of borrowing costs relating to qualifying assets, the Group capitalises borrowing costs directly attributable to the acquisition, construction or production of a qualifying asset as part of the cost of that asset.
The Group has capitalised borrowing costs with respect to pre-delivery payments relating to aircraft.
(v) Sale and leaseback transactionsWhen a sale and leaseback results in a finance leaseback, any gain on the sale is deferred and recognised as income over the lease term. Any loss on the sale is immediately recognised in the profit and loss account if there is evidence that the asset’s carrying value exceeds the fair value.
1. Accounting policies continuedFair value adjustments are made in respect of acquisitions. If at the balance sheet date, the amounts of fair values of the acquiree’s identifiable assets and liabilities can only be established provisionally, then these values are used. Any adjustments to these values are taken as adjustments to goodwill and must be recorded within 12 months of the acquisition. Negative goodwill arising on an acquisition is recognised in the income statement upon acquisition.
(ii) Computer software, software in development and other intangible assetsComputer software consists of all software that is not an integral part of the related computer hardware and is stated at cost less accumulated amortisation and impairment losses.
Costs associated with maintaining computer software programmes are recognised as an expense as incurred. Development costs that are directly attributable to the design and testing of identifiable and unique software products controlled by the Group are recognised as intangible assets when the following criteria are met:
• It is technically feasible to complete the software product so that it will be available for use;
• Management intends to complete the software product and use or sell it;
• There is an ability to use or sell the software product;
• It can be demonstrated how the software product will generate probable future economic benefits;
• Adequate technical, financial and other resources to complete the development and to use or sell the software product are available; and
• The expenditure attributable to the software product during its development can be reliably measured.
Directly attributable costs that are capitalised as part of the software product include the software development employee costs and an appropriate portion of relevant overheads.
Other development expenditures that do not meet these criteria are recognised as an expense as incurred. Development costs previously recognised as an expense are not recognised as an asset in a subsequent period.
Separately acquired trademarks and licences are shown at historical cost. Licences acquired in a business combination are recognised at fair value at the acquisition date. Licences have a finite useful life and are carried at cost less accumulated amortisation.
(iii) Brands and customer relationshipsBrands and contractual customer relationships acquired in a business combination are recognised at fair value at the acquisition date. Both intangibles have a finite useful life and are carried at cost less accumulated amortisation.
(iv) AmortisationAmortisation is charged to the consolidated income statement on a straight line basis over the estimated useful economic life of each type of intangible asset as follows:
Computer software 3-10 yearsBrands 15-20 yearsOrder book at date of acquisition Over the period until travel occursCustomer relationships Over the period during which value will be
obtained by the Group (up to 15 years)Licences Over the term of licence
Software in development is not amortised. Upon completion of development and bringing the software into use, the costs are re-categorised into computer software and amortisation commences.
TT11 | AR 2012 | 20/12/2012 | Proof 5

Financial statements
www.tuitravelplc.com
TUI Travel PLC Annual Report & Accounts 2012 91Financial statem
ents
Impairment losses are recognised in profit or loss. Impairment losses recognised in respect of CGUs are allocated first to reduce the carrying amount of goodwill allocated to the CGU and then to reduce the carrying amount of other assets in the unit on a pro rata basis.
An impairment loss in respect of goodwill is not reversed. In respect of other assets, impairment losses recognised in prior periods are assessed at each reporting date for any indications that the loss has decreased or no longer exists. An impairment loss is reversed if there has been a change in the estimates used to determine the recoverable amount. An impairment loss is reversed only to the extent that the asset’s carrying amount does not exceed the carrying amount that would have been determined, net of depreciation or amortisation, if no impairment loss had been recognised.
(R) InventoriesInventories are measured at the lower of cost or net realisable value. Net realisable value is the estimated selling price less the estimated costs incurred until the sale and the estimated variable costs required to sell. All inventories are written down individually where the net realisable value of inventories is lower than their carrying amounts. The measurement method applied to similar inventory items is the weighted average cost formula.
(S) ProvisionsA provision is recognised in the consolidated balance sheet when the Group has a legal or constructive obligation as a result of a past event, it is probable that an outflow of economic benefits will be required to settle the obligation and the outflow of economic benefits can be reliably estimated. If the effect is material, provisions are determined by discounting the expected future cash flows at a pre-tax rate that reflects current market assessments of the time value of money and the risks specific to the liability.
(i) Maintenance provision for leased aircraftTo reflect the legal obligations placed upon the Group under the terms of certain operating leases, provision is made for the maintenance, overhaul and repair costs of operating leased airframes, engines and certain other components. The provision is based on the present value of the anticipated external costs of the next maintenance event calculated by reference to costs experienced and published manufacturers’ data. The charge to the consolidated income statement is calculated by reference to the number of hours and cycles flown and by reference to the length of the full overhaul cycle. Costs incurred are charged against the provision. Neither the timing nor the value of the expenditure can be precisely determined but they can be averaged over time and over a fleet. The unwinding of discounted values is charged to the consolidated income statement as a financial expense.
(ii) Restructuring provisionA provision for restructuring is recognised when the Group has approved a detailed and formal restructuring plan, and the restructuring either has commenced or has been announced publicly. Future operating costs are not provided for.
(iii) Onerous contractsA provision for onerous contracts is recognised when the expected benefits to be derived by the Group from the contract are lower than the unavoidable cost of meeting its obligations under the contract. The provision is measured at the present value of the lower of the expected cost of terminating the contract and the expected net cost of continuing with the contract. Before a provision is established, the Group recognises any impairment loss on the assets associated with that contract.
If the leaseback is classified as an operating lease, then any gain is recognised immediately if the sale and leaseback terms are demonstrably at fair value. Otherwise, the sale and leaseback is accounted for as follows:
• If the sale price is below fair value, then the gain or loss is recognised immediately, other than to the extent that a loss is compensated for by future rentals at a below-market price, then the loss is deferred and amortised over the period that the asset is expected to be used.
• If the sale price is above fair value, then any gain is deferred and amortised over the useful life of the asset.
• If the fair value of the asset is less than the carrying amount of the asset at the date of the transaction, then that difference is recognised immediately as a loss on the sale.
(Q) Impairments(i) Financial assetsA financial asset is assessed at each reporting date to determine whether there is any objective evidence that it is impaired. A financial asset is considered to be impaired if objective evidence indicates that one or more events have had a negative effect on the estimated future cash flows of that asset.
An impairment loss in respect of a financial asset is calculated as the difference between its carrying amount and its recoverable amount. An impairment loss in respect of an available for sale financial asset is calculated by reference to its fair value. The recoverable amount of the Group’s receivables which are carried at amortised cost is calculated as the present value of estimated future cash flows, discounted at the original effective interest rate (i.e. the effective interest rate computed at initial recognition of these financial assets). Receivables with a short duration are not discounted.
Individually significant financial assets are tested for impairment on an individual basis. The remaining financial assets are assessed collectively in groups that share similar credit risk characteristics.
All impairment losses are recognised in profit or loss. Any cumulative loss in respect of an available for sale financial asset previously recognised in equity is transferred to profit or loss. An impairment loss is reversed if the reversal can be related objectively to an event occurring after the impairment loss was recognised. For financial assets measured at amortised cost and available for sale financial assets that are debt securities, the reversal is recognised in profit or loss. For available for sale financial assets that are equity securities, the reversal is recognised directly in equity.
(ii) Non-financial assetsThe carrying amount of the Group’s non-financial assets, other than inventory and deferred tax assets, are reviewed at each balance sheet date to determine whether there is any indication of impairment. If such an indication exists, the asset’s recoverable amount is estimated. For goodwill, the recoverable amount is estimated at each balance sheet date.
An impairment loss is recognised whenever the carrying amount of an asset or its CGU exceeds its recoverable amount. The recoverable amount of an asset or CGU is the greater of its value in use and fair value less costs to sell. In assessing value in use, the estimated future cash flows are discounted to their present value using a pre-tax discount rate that reflects current market assessments of the time value of money and the risks specific to the asset. A CGU is the smallest identifiable group of assets that generates cash inflows that are largely independent of the cash inflows from other assets or groups of assets. The largest unit to which goodwill is allocated is an operating segment level as defined in IFRS 8 before applying aggregation criteria.
TT11 | AR 2012 | 20/12/2012 | Proof 5

www.tuitravelplc.com
92 TUI Travel PLC Annual Report & Accounts 2012
Financial statements
Notes to the consolidated financial statements continued
(iii) InventoriesThe fair value of inventories acquired in a business combination is determined based on the estimated selling price in the ordinary course of business, less the estimated costs of completion and sale, and a reasonable profit margin based on the effort required to complete and sell the inventories.
(iv) Investments in equity and debt securitiesThe fair value of financial assets at fair value through profit or loss and available for sale financial assets is determined by reference to their quoted closing bid price at the reporting date, where available. If there is no market price available the fair value is calculated based on other valuation techniques, including assessments of future cash flows, estimated selling price and other available information. The fair value of held to maturity investments is determined on initial recognition and thereafter for disclosure purposes only.
(v) Trade and other receivablesTrade receivables are recognised at their fair value and subsequently recorded at amortised cost using the effective interest method as reduced by allowances for estimated irrecoverable amounts. An allowance for irrecoverable amounts is established when there is objective evidence that the Group will not be able to collect all amounts due according to the original terms of the receivables. The amount of allowance is the difference between the asset’s carrying amount and the present value of estimated future cash flows.
(vi) Trade payablesTrade payables are recognised at their fair value and subsequently recorded at amortised cost using the effective interest method.
(vii) DerivativesThe fair value of foreign currency contracts, fuel forward contracts and option contracts is their forward market price at the balance sheet date, based on external valuations or internal valuations using market data.
(viii) Non-derivative financial liabilitiesFair value, which is determined for disclosure purposes, is calculated based on the present value of future principal and interest cash flows, discounted at the market rate of interest at the reporting date. For finance leases, the market rate of interest is determined by reference to similar lease agreements.
(ix) Share-based paymentsThe fair value of the shares awarded is measured using option valuation models, taking into account the terms and conditions upon which the awards were made. The valuation basis is identical whether the awards will be settled in cash or shares.
(X) New Standards and interpretations not yet adoptedThe following standards are applicable to the Group and will be applied to the accounting period beginning on 1 October 2012:
• Amendment to IAS 12 ‘Income taxes’ on deferred tax. This new amendment introduces an exception to the existing principle for the measurement of deferred tax assets or liabilities arising on investment property, measured at fair value. The amendment has not yet been endorsed by the EU and is not expected to have a significant impact on the Group’s financial statements.
• Amendment to IAS 1 ‘Presentation of financial statements on OCI’ requires items presented in the consolidated statement of comprehensive income to be disclosed between those items that are potentially reclassifiable to profit or loss at a later date and those items that will not. The amendment has been endorsed by the EU and will only impact presentation disclosures in the Group’s financial statements.
1. Accounting policies continued(T) Related partiesFor the purpose of these consolidated financial statements, parties are considered to be related to the Group if the Group has the ability directly or indirectly, to control the party or exercise significant influence over the party making financial and operating decisions, or vice versa, or where the Group and the party are subject to common control or significant influence. Related parties may be individuals or entities.
(U) Segment reportingAn operating segment is a component of an entity that:
• Engages in business activities from which it may earn revenues and incur expenses (including revenues and expenses relating to transactions with other components of the same entity);
• Whose operating results and financial position are regularly reviewed by the chief operating decision maker to make decisions about resources to be allocated to the segment and assess its performance; and
• For which discrete financial information is available.
As described in Note 3, all underlying operating items are allocated to the segment’s underlying profit except central costs and net financial expenses.
(V) Use of estimates and judgementsThe preparation of financial statements requires management to make judgements, estimates and assumptions that affect the application of accounting policies and the reported amounts of assets, liabilities, income and expenses. Actual results may differ from these estimates.
Estimates and underlying assumptions are reviewed on an ongoing basis. Revisions to accounting estimates are recognised in the period in which the estimates are revised and in any future periods affected. Details of critical judgements, significant estimates and assumptions are disclosed in the relevant notes to the consolidated financial statements. The key accounting estimates and judgements are described in Note 2.
(W) Determination of fair valuesA number of the Group’s accounting policies and disclosures require the determination of fair value, for both financial and non-financial assets and liabilities. Fair values have been determined for measurement and/or disclosure purposes based on the following methods. When applicable, further information about the assumptions made in determining fair values is disclosed in the note specific to that asset or liability.
(i) Property, plant and equipmentThe fair value of property, plant and equipment recognised as a result of a business combination is based on market values. The market value of property is the estimated amount for which a property could be exchanged on the date of valuation between a willing buyer and a willing seller in an arm’s length transaction after proper marketing wherein the parties had each acted knowledgeably, prudently and without compulsion. The market value of items of plant, equipment, fixtures and fittings is based on the quoted market prices for similar items.
(ii) Intangible assetsThe fair value of intangible assets recognised as a result of a business combination, including brands, customer relationships and the customer order book at the date of acquisition, is valued by reference to external market values or income-based methods. Income-based methods estimate the future economic benefits to be derived from ownership of the asset by identifying, quantifying and separating cash flows attributable to the asset and capitalising their present value.
TT11 | AR 2012 | 20/12/2012 | Proof 5

Financial statements
www.tuitravelplc.com
TUI Travel PLC Annual Report & Accounts 2012 93Financial statem
ents
The amendment to IAS 19 ‘Employee benefits’ makes significant changes to the recognition and measurement of defined benefit pension expense and termination benefits and to the disclosures for all employee benefits. Had the standard been applied in the current financial year, the Group’s profit before tax would have been £11m lower.
IAS 27 (revised) ‘Separate financial statements’ includes the provisions on separate financial statements that are left after the control provisions of IAS have been included in the new IFRS 10.
IAS 28 (revised) ‘Investments in associates and joint ventures’ includes the requirements for joint ventures, as well as associates, to be equity accounted following the issue of IFRS 11.
The amendments to IAS 32 and IFRS 7 on offsetting financial instruments and liabilities clarify some of the requirements for offsetting financial assets and financial liabilities on the balance sheet.
The Group continues to monitor the potential impact of these and other new standards and interpretations which may be endorsed by the European Union and require adoption by the Group in future accounting periods.
2. Key accounting estimates and judgementsThe preparation of consolidated financial statements under adopted IFRS requires the Directors to make estimates and judgements that affect the reported amounts of assets and liabilities, the disclosure of contingent assets and liabilities and the reported amount of revenue and expenses during the year. The Directors evaluate the estimates and judgements on an ongoing basis. Such estimates and judgements are based upon historical experience and other factors it believes to be reasonable under the circumstances. Actual results may differ from estimates.
Management has discussed with the Audit Committee the development, selection and disclosure of the Group’s critical accounting policies and estimates and the applications of these policies and estimates. Key estimates and judgements have been made in respect of the following areas:
(A) EstimatesIntangible assets – Goodwill carrying valueA full impairment review has been performed of all goodwill, together with intangible and tangible balances held across the Group on a CGU basis. In the current year, the impairment review has been performed on a ‘value in use’ basis for all CGUs, which requires estimation of future net operating cash flows, the time period over which they will occur and appropriate discount and growth rates. In the prior year, one CGU was valued using the ‘fair value less costs to sell’ methodology. Further details, including sensitivity analysis, are given in Note 10 and the accounting policy is set out in Note 1(Q)(ii).
Defined benefit pension plansA qualified independent actuary undertakes the estimation of the present value of the Group’s obligations under defined benefit pension schemes using assumptions taken from a range of possible actuarial assumptions. These assumptions may not be borne out in practice, especially due to the long timescales involved. In particular, the valuation of scheme assets is based on the fair value at the balance sheet date. As these assets are not intended to be sold in the short term, their value may change significantly prior to realisation. In reviewing the work of the qualified independent actuary, management was required to exercise judgement to satisfy itself that appropriate weight had been afforded to macroeconomic factors. Details of the actual assumptions used, including sensitivity analysis, are set out in Note 6(C).
The following standards, revisions and amendments to current standards which have been issued and are considered applicable to the Group in future years are as follows. None of these have yet been endorsed by the EU with the exception of the revision to IAS 19 ‘Employee benefits’.
Effective date: accounting Standard periods commencing on or after
Amendment to IFRS 7 ‘Financial Instruments: Disclosures’ 1 January 2015IFRS 9 ‘Financial instruments’ 1 January 2015IFRS 10 ‘Consolidated financial statements’ 1 January 2013IFRS 11 ‘Joint arrangements’ 1 January 2013IFRS 12 ‘Disclosure of interests in other entities’ 1 January 2013Amendment to IFRS 10, 11 and 12 on transition guidance 1 January 2013IFRS 13 ‘Fair value measurement’ 1 January 2013IAS 19 (revised 2011) ‘Employee benefits’ 1 January 2013IAS 27 (revised 2011) ‘Separate financial statements’ 1 January 2013IAS 28 (revised 2011) ‘Investments in associates and joint ventures’ 1 January 2013Amendment to IFRS 1 ‘First time adoption on government grants’ 1 January 2013Amendments to IAS 32 and IFRS 7 on Financial instruments: asset and IFRS 7 amendment: 1 January 2013 liability offsetting IAS 32 amendment: 1 January 2014Annual improvements 2011 1 January 2013
The amendment to IFRS 7 ‘Financial Instruments’ requires additional financial instruments disclosures on transition from IAS 39 to IFRS 9. IFRS 9 ‘Financial instruments’, including amendments to IFRS 9 since its initial publication, is the first step in the process to replace IAS 39 ‘Financial instruments: recognition and measurement’. IFRS 9 introduces new requirements for classifying and measuring financial assets, financial liabilities and some contracts to buy or sell non-financial items.
IFRS 10 ‘Consolidated financial statements’ establishes principles for the presentation and preparation of consolidated financial statements when an entity controls one or more other entities. The IFRS supersedes IAS 27 ‘Consolidated and separate financial statements’ and SIC-12 ‘Consolidation – Special purpose entities’. IAS 27 (revised 2011) ‘Separate financial statements’ has therefore also been revised.
IFRS 11 ‘Joint arrangements’ establishes principles for financial reporting by parties to a joint arrangement. The IFRS supersedes IAS 31 ‘Interests in joint ventures’ and SIC-13 ‘Jointly controlled entities – non-monetary contributions by venturers’. The IFRS is concerned principally with both the structure of the arrangement and that an entity had a choice of accounting treatment for interests in jointly controlled entities.
IFRS 12 ‘Disclosure of interests in other entities’ applies to entities that have an interest in a subsidiary, a joint arrangement, an associate or an unconsolidated structured entity. The IFRS requires an entity to disclose information that enables users of financial statements to evaluate both the nature of, and risks associated with, its interests in other entities and the effects of those interests on its financial position, financial performance and cash flows.
The amendment to IFRS 10, 11 and 12 on transition guidance provides additional transitional relief in IFRSs 10, 11 and 12 limiting the requirement to provide adjusted comparative information to only the preceding comparative period. The amendment also requires certain comparative disclosures under IFRS 12 upon transition.
IFRS 13 ‘Fair value measurement’ defines fair value, sets out in a single IFRS a framework for measuring fair value and requires disclosures about fair value measurements.
TT11 | AR 2012 | 20/12/2012 | Proof 5

www.tuitravelplc.com
94 TUI Travel PLC Annual Report & Accounts 2012
Financial statements
Notes to the consolidated financial statements continued
Recoverable amounts of deposits and prepaymentsJudgements have been made in respect of the volumes of future trading with hoteliers and the credit-worthiness of those hoteliers in order to assess the recoverable amounts of deposits and prepayments made to those hoteliers.
Fair value measurementsManagement has to make judgements regarding the valuation of some financial instruments that use inputs that are not observable in active markets. These are disclosed in Note 25(H).
3. Segmental informationIFRS 8 requires segmental information to be presented on the same basis as that used for internal management reporting. Segmental information is reported by the Group’s business sectors to the Group Management Board (GMB). The GMB consists of tour operating and functional experts drawn from across the Group who execute TUI Travel’s day-to-day operations, allocate resources to and assess the performance of, the operating segments. Consequently, the GMB is considered to be the chief operating decision maker for the purposes of IFRS 8.
Group structureThe Group presents segmental information in respect of its four Sectors. For the year ended 30 September 2012, the four Sectors are divided into either Regions (Mainstream Sector) or divisions (Sectors other than Mainsteam), which are further sub-divided into operating segments. Aggregation criteria is then used to combine certain of these operating segments into reported segments.
The Mainstream Sector consists of three Regions: Northern, Central Europe and Western Europe. The Northern Region comprises the distribution, tour operating and airline businesses in the UK & Ireland, Canada, the Nordic Countries (comprising the markets of Sweden, Norway, Denmark and Finland) and the Hotels division comprising hotel management companies and joint ventures in hotel assets.
Central Europe comprises the distribution, tour operating businesses and an airline in the source markets of Germany, Austria, Switzerland and Poland.
Western Europe comprises the distribution, tour operating and airline businesses in France, Belgium, the Netherlands and Southern Europe (comprising Spain and Italy). The Moroccan based airline, Jet4You, has been integrated into Belgium during the year, with internal reporting to the GMB being amended to reflect this change.
Each source market within each Region represents an operating segment, for the purposes of segmental information.
The Specialist & Activity Sector operates under seven divisions: Adventure, Education, Languages, Marine, North American Specialist, Sport and Specialist Holidays Group. The Sector has over 100 international specialist and activity brands delivering a range of unique customer experiences. The Specialist & Activity Sector is considered to be one operating segment, in line with internal management reporting.
The Accommodation & Destinations Sector (A&D) provides a range of services in destinations to tour operators, travel agents, corporate clients and direct to the consumer worldwide. A&D is structured along the following divisions: Accommodation Wholesaler (previously known as Business to Business (B2B)), Accommodation OTA (previously known as Business to Customer (B2C)) and Specialist, although the A&D Sector in total is considered as one operating segment, in line with internal management reporting.
2. Key accounting estimates and judgements continuedDerivative financial instrumentsJudgement is required in the assessment of prospective effectiveness and specifically in the assessment of the probability of forecast transactions, both at hedge inception and during the period over which hedge accounting is adopted. The fair value of derivative financial instruments can also involve judgement. Where appropriate, external valuations from financial institutions are undertaken to support the carrying value of such items. Details of sensitivity analysis are set out in Note 25(K).
(B) JudgementsSeparately disclosed itemsSeparately disclosed items are those significant items which in management’s judgement are highlighted by virtue of their size or incidence to enable a full understanding of the Group’s financial performance. Such items are included within the income statement caption to which they relate (Note 4).
Revenue recognitionIn recognising revenue, judgement is required in the consideration of whether each individual business acts as a principal or agent and whether revenues should be recognised on a gross or net basis, in accordance with IAS 18. Judgement is required when considering the balance of risk and rewards of the sale, including delivery and non-performance risk, credit risk, inventory risk and the ability to establish prices.
Business combinationsIn the case of business combinations, judgement and estimation is required in the identification and valuation of separable assets and liabilities on acquisitions. In particular, judgement and estimation is required in the identification and valuation of separable intangible assets, being brands, orders books and customer databases, and determining appropriate useful economic lives for these assets. Judgement and estimation is also required in determining contingent consideration payable in respect of acquisitions. Details of acquisitions are set out in Note 13.
LiabilitiesIn accounting for provisions, judgement is required in determining occurrence probability, maturity and level of risk. Judgement and estimation is required in determining aircraft maintenance, restructuring, legal and onerous lease provisions. It is also required to determine the provision methodology and for certain provisions, considering external information on which to base the amount of provision. Due to the volume of transactions and the materiality of period end accruals, judgement is also required in respect of the recognition and derecognition of airline and accommodation operating accruals. Details of provisions made and the basis on which the provisions have been calculated is disclosed in Note 21 and the accounting policy is set out in Note 1(S).
TaxationThe Group has, from time to time, contingent tax liabilities arising from trading and corporate transactions in the UK and overseas jurisdictions. After taking appropriate external advice, the Group makes provision for these liabilities based on the probable level of economic loss that may be incurred and which is reliably measurable. Judgement is also required in the assessment of the future recoverability of tax losses and recognition of deferred tax assets. Details of unrecognised tax losses are given in Note 14.
TT11 | AR 2012 | 20/12/2012 | Proof 5

Financial statements
www.tuitravelplc.com
TUI Travel PLC Annual Report & Accounts 2012 95Financial statem
ents
The Emerging Markets Sector is a growing portfolio of travel businesses, currently focusing on the specific source markets of Russia and Ukraine and is considered to be one operating segment.
Reportable and reported segmentsUnder IFRS 8, the results of the UK & Ireland and Germany are reported separately within the Northern Region and Central Europe respectively due to the size and importance of these core markets and both meeting the threshold of being individual reportable segments. The results of Nordics are shown separately from other Northern Region segments as it exceeds the quantitative threshold defined in IFRS 8. Canada and the Hotels division have been reported separately as these two segments do not meet the majority of the aggregation criteria of IFRS 8.
The results of Austria, Switzerland and Poland have been aggregated into the Rest of Central Europe segment as these are considered to be economically similar over the long term and their activities are also considered to be similar in nature under the aggregation criteria of IFRS 8.
The French Airline, Corsair, has been separately disclosed from the Rest of Western Europe because, as a scheduled airline within the Group, it has a different business model to the rest of the Group’s integrated tour operators. Following the integration of Jet4You into Belgium during the year, the results of Jet4You are now included within those of Belgium. Belgium, the Netherlands, Southern Europe and the French tour operating businesses form the Rest of Western Europe as these segments meet the aggregation criteria.
The Specialist & Activity Sector is reported separately as this qualifies as a reportable segment under IFRS 8. The results of Accommodation & Destinations and Emerging Market Sectors are reported voluntarily to be consistent with internal management reporting.
Segmental information for both the current and prior year has been presented using this structure, with the prior year information being restated to reflect the inclusion of Jet4You into Belgium.
Corporate costs are in respect of central costs including finance, human resources, legal, facility costs and some information technology costs that do not relate to each business segment and hence are not allocated.
Information regarding the results of each reportable segment is provided below. Segmental performance is evaluated based on underlying operating profit and is measured consistently with underlying operating profit or loss in the consolidated financial statements and as defined in Note 1(B)(ii).
Intersegmental sales and transfers reflect arm’s length prices as if sold or transferred to third parties. Financial income and expenses are not allocated to the reportable segments as this activity is managed by the Group’s treasury function which manages the overall net debt position of the Group.
No one customer exceeds 10% of entity revenues in any segment. Intangible asset impairment losses arising are detailed in Note 10 and are recognised in the consolidated income statement.
Segment assets comprise capital expenditure (as this is the only measure of assets reported monthly to the GMB) and represent the amounts purchased in the year.
TT11 | AR 2012 | 20/12/2012 | Proof 5

Financial statements
Notes to the consolidated financial statements continued
www.tuitravelplc.com
96 TUI Travel PLC Annual Report & Accounts 2012
3. Segmental information continuedSegmental analysis Year ended 30 September 2012 Underlying Intersegmental Total external operating Total revenue revenue revenue profit/(loss)Sector £m £m £m £m
UK & Ireland 3,756 (122) 3,634 197 Canada – – – 21Nordics 1,085 (1) 1,084 71 Hotels 191 (166) 25 6
Total Northern Region 5,032 (289) 4,743 295
Germany 3,932 (15) 3,917 87 Rest of Central Europe 670 (43) 627 14
Total Central Europe 4,602 (58) 4,544 101
French Airline 403 (43) 360 (15)Rest of Western Europe 2,702 (31) 2,671 39
Total Western Europe 3,105 (74) 3,031 24
Total Mainstream 12,739 (421) 12,318 420
Specialist & Activity 1,479 (1) 1,478 48 Accommodation & Destinations 859 (195) 664 66 Emerging Markets – – – (15)All other segments and unallocated items – – – (29)
Total Group 15,077 (617) 14,460 490
Year ended 30 September 2011 Underlying Intersegmental Total external operating Total revenue revenue revenue profit/(loss)Sector £m £m £m £m
UK & Ireland 3,648 (60) 3,588 149Canada – – – 18Nordics 1,055 (1) 1,054 70Hotels 184 (155) 29 13
Total Northern Region 4,887 (216) 4,671 250
Germany 4,261 (26) 4,235 89Rest of Central Europe 666 (60) 606 14
Total Central Europe 4,927 (86) 4,841 103
French Airline 426 (70) 356 (10)Rest of Western Europe 2,805 (10) 2,795 27
Total Western Europe 3,231 (80) 3,151 17
Total Mainstream 13,045 (382) 12,663 370
Specialist & Activity 1,373 (1) 1,372 65Accommodation & Destinations 879 (227) 652 72Emerging Markets – – – (12)All other segments and unallocated items – – – (24)
Total Group 15,297 (610) 14,687 471
Reconciliation of Group underlying operating profit to profit before tax Year ended Year ended 30 September 30 September 2012 2011 Note £m £m
Group underlying operating profit 490 471 Separately disclosed items 4 (92) (74)Predecessor accounting for Magic Life – (17)Acquisition related expenses 13 (62) (82)Impairment of goodwill 10 (20) (39)Impairment of available for sale financial asset 12 (10) – Taxation on profits and interest of joint ventures and associates 12 (5) (4)
Operating profit 301 255 Net financial expenses 5 (100) (111)
Profit before tax 201 144
TT11 | AR 2012 | 20/12/2012 | Proof 5

Financial statements
www.tuitravelplc.com
TUI Travel PLC Annual Report & Accounts 2012 97Financial statem
ents
Other segmental information Total depreciation of property, plant and equipment and Capital expenditure amortisation of intangible assets 2012 2011 2012 2011 £m £m £m £m
UK & Ireland 231 103 79 83Nordics 5 12 3 5Hotels 9 18 14 11
Total Northern Region 245 133 96 99
Germany 32 15 13 13Rest of Central Europe 4 3 2 3
Total Central Europe 36 18 15 16
French Airline 70 58 15 19Rest of Western Europe 16 26 24 30
Total Western Europe 86 84 39 49
Total Mainstream 367 235 150 164
Specialist & Activity 43 53 39 44Accommodation & Destinations 30 25 29 30All other segments and unallocated items 19 7 1 –
Total Group 459 320 219 238
Total depreciation of property, plant and equipment and amortisation of intangible assets of £219m (2011: £238m) comprises £92m (2011: £101m) of amortisation of intangible assets as shown in Note 10 and £127m (2011: £137m) of depreciation of property, plant and equipment as shown in Note 11.
Reconciliation of capital expenditure to amounts included in the financial statements Year ended Year ended 30 September 30 September 2012 2011 Note £m £m
Total Group capital expenditure as shown above 459 320Analysed as:Additions to intangible assets 88 53Additions to property, plant and equipment 371 267
459 320
Reconciliation to the notes to the financial statementsAdditions to intangible assets in segmental analysis 88 53Additions to goodwill 3 –
Intangible assets: total additions 10 91 53
Additions to property, plant and equipment in segmental analysis 371 267
Property, plant and equipment: total additions 11 371 267
Entity wide disclosuresThe UK is the Group’s country of domicile. Revenues from external customers and non-current assets are split geographically as follows:
UK Germany France Other Europe Rest of the World Total 2012 2011 2012 2011 2012 2011 2012 2011 2012 2011 2012 2011 £m £m £m £m £m £m £m £m £m £m £m £m
Revenue from external customers 4,497 4,454 3,919 4,248 1,288 1,396 3,970 3,883 786 706 14,460 14,687Non-current assets 2,767 2,655 546 589 374 393 1,088 1,176 803 830 5,578 5,643
Revenue is classified based on the source of the supply. In addition to the United Kingdom, revenue relating to an individual country is separately disclosed when it represents broadly 10% or more of total revenue. Other Europe is defined as Continental Europe and Eire excluding UK, Germany and France. Non-current assets for the table above excludes all financial instruments, deferred tax assets and post-employment benefit assets in accordance with IFRS 8.
TT11 | AR 2012 | 20/12/2012 | Proof 5

Financial statements
Notes to the consolidated financial statements continued
www.tuitravelplc.com
98 TUI Travel PLC Annual Report & Accounts 2012
4. Separately disclosed items Year ended Year ended 30 September 30 September 2012 2011 £m £m
Restructuring and other separately disclosed items 102 137 Pension related credit – (63)Litigation provisions 17 – Change in accounting estimates (27) – Items relating to the prior year – 7
Total pre-volcanic ash 92 81 Incremental costs caused by volcanic ash disruption – (7)
Total 92 74
Separately disclosed items within operating profit are included within the consolidated income statement as follows: Year ended Year ended 30 September 30 September 2012 2011 £m £m
Cost of sales – (6)Administrative expenses 92 80
Total 92 74
Restructuring and other separately disclosed itemsMainstream restructuring costs account for £66m of the total incurred in the year ended 30 September 2012 and principally relate to: the restructuring programme in France where a single tour operating business, TUI France, is being created and the airline is also being restructured (£66m in total); the restructure of the Moroccan airline Jet4You (£5m); offset by a release of £7m of unused provision now that the German tour operator restructuring programme has been completed.
In addition there has been a total of £24m restructuring costs incurred across the Specialist & Activity and Accommodation & Destinations Sectors. £8m of this total has arisen from restructuring actions taken in the Adventure division; £6m has arisen from the write-down of specific ski chalet assets which are now being actively marketed for disposal and where transactions are expected to complete within 12 months; £4m has arisen from actions taken in the Marine division and £3m from the finalisation of restructuring programmes in Greece, Morocco and Tunisia. A total of £12m of costs have been incurred in Group head office companies, being primarily to support the various restructuring programmes around the Group.
Included in the year ended 30 September 2011 were Mainstream restructuring costs of £97m which principally related to a substantial programme to reduce costs and improve efficiencies in the German business (£32m); the ongoing restructure of Corsair, the scheduled French airline, and the retail network of Nouvelles Frontières in France (£35m in total); and further restructuring initiatives in the UK (£19m) including rationalising the retail distribution network. In addition there was £15m of restructuring costs incurred in the Specialist & Activity Sector, £8m in the Accommodation & Destinations Sector and £17m of restructuring costs incurred in Group head office companies.
Litigation provisionsAt the year end the Group has continued to assess the likely outcome of the legal actions it is involved in and, in accordance with IAS 37, has recognised provisions where it is more likely than not that an outflow of resources will be required to settle the obligation. Due to the increasingly litigious environment the Group operates in, this year the process has resulted in a charge to the income statement of £17m which due to its size has been included as a separately disclosed item.
Change in accounting estimatesDuring the year ended 30 September 2012, the Group reviewed the estimates used in calculating aircraft maintenance provisions and empty leg provisions to ensure consistency of application of the latest estimates across the Group. This process resulted in a credit to the income statement of £27m, which due to its size has been included as a separately disclosed item.
Pension related creditIn the year ended 30 September 2011, the Company engaged in a consultation process with the members of its defined benefit pension schemes which resulted in a restriction to salary increases used under the rules of the pension schemes to calculate benefits to a maximum of 2.5% in any one year. This change resulted in a reduction in accrued pension liabilities measured under IAS 19 of £63m, which under IAS 19 was recognised fully in the income statement in the period in which it occurred. Therefore a £63m credit was included in the consolidated income statement in relation to this curtailment, which was included as a separately disclosed item.
TT11 | AR 2012 | 20/12/2012 | Proof 5

Financial statements
www.tuitravelplc.com
TUI Travel PLC Annual Report & Accounts 2012 99Financial statem
ents
Items relating to the prior yearDuring the year ended 30 September 2011, two errors were identified which related to the balance sheet as at 30 September 2010. The omission of an elimination of surplus sundry payables from the Group balance sheet resulted in an overstatement of current liabilities of £38m. This was offset by an understatement of current liabilities within Nouvelles Frontières, the French tour operator, of £45m. As both errors offset within cost of sales and trade and other payables and did not materially change the profit, net assets or overall financial position of the Group, the correction of the errors was made through the profit and loss account in the year ended 30 September 2011.
Impact of volcanic ashIncluded previously in separately disclosed items were the incremental direct costs incurred by the Group in respect of welfare costs to look after the customers who were affected by the closure of European airspace in April 2010. These costs principally included hotel costs for stranded inbound and outbound customers and the cost of repatriation of inbound customers. In the year ended 30 September 2011, there was a release of £7m of unused accruals as costs in relation to the disruption in 2010 were finalised with third party suppliers.
5. Net financial expenses Year ended Year ended 30 September 30 September 2012 2011 £m £m
Financial incomeBank interest receivable 15 10Interest on pension scheme assets (Note 6(C)) 72 73Other financial income 9 –
Total 96 83
Financial expensesBank interest payable on loans and overdrafts (19) (11)Finance charges on convertible bond (62) (62)Interest on pension scheme liabilities (Note 6(C)) (86) (84)Interest payable in respect of loans from parent (2) (4)Finance lease charges (7) (10)Unwinding of discount on provisions (Note 21) (8) (11)Other financial expenses (12) (12)
Total (196) (194)
Net financial expenses (100) (111)
TT11 | AR 2012 | 20/12/2012 | Proof 5

Financial statements
Notes to the consolidated financial statements continued
www.tuitravelplc.com
100 TUI Travel PLC Annual Report & Accounts 2012
6. Employees(A) Average number of employeesThe average monthly number of employees in the year in the Group by Sector, including Directors on service contracts and key management was as follows:
Year ended Year ended 30 September 30 September 2012 2011 Number Number
By SectorMainstream 38,235 39,198Specialist & Activity 6,773 5,686Accommodation & Destinations 8,732 8,012Emerging Markets – 5Corporate 350 346
Total 54,090 53,247
(B) Employee costs Year ended Year ended 30 September 30 September 2012 2011 £m £m
Wages and salaries 1,412 1,437 Social security costs 252 249 Pension costs : Defined benefit pension scheme – curtailment gain disclosed in separately disclosed items – (63)Pension costs : Defined benefit pension scheme cost 26 33 Pension costs : Defined contribution pension scheme cost 27 25 Share-based payments (Note 6(D)) 17 20
Total 1,734 1,701
Included within wages and salaries are £35m (2011: £42m) of wages and salaries and £16m (2011: £4m) of social security costs in relation to redundancy and integration costs that are included within separately disclosed items in Note 4. In 2011, the curtailment gain of £63m in relation to the changes in the UK pension schemes was also included within separately disclosed items in Note 4.
(C) Pension costsThe Group operates pension schemes for employees eligible and wishing to participate in the schemes. These comprise both defined contribution and defined benefit schemes. Pension obligations vary reflecting the different legal and market conditions in each country of operation. Defined contribution schemes are funded by the payment of contributions to private and state-run organisations, whilst defined benefit schemes comprise both funded and unfunded schemes. The assets of all the funded defined benefit schemes are held separately from the assets of the Group.
Defined contribution schemes for employees and Directors Current contributions are recognised as an expense in the year and once paid the Group has no further liability. Pension costs of £27m (2011: £25m) relating to defined contribution schemes were charged to the income statement.
Defined benefit pension schemes The movement of defined benefit pension obligations and assets is detailed below, summarised as UK, Germany and Other. Other includes funded schemes in Ireland, the Netherlands, Switzerland and Norway, whilst the main unfunded arrangements are in Austria and France. Almost all UK schemes are funded whilst German schemes are unfunded.
TT11 | AR 2012 | 20/12/2012 | Proof 5

Financial statements
www.tuitravelplc.com
TUI Travel PLC Annual Report & Accounts 2012 101Financial statem
ents
The principal funded schemes in the UK are shown in the table below. These are closed to new members, with the exception of existing employees working towards their entry qualification date.
With effect from April 2011, the schemes’ future benefit accrual was amended as follows:
1) The rate of increase in future pensionable salary was capped at 2.5% per annum for employees earning over £30,000 per annum.
2) Normal retirement age was increased to age 65 (where this was not already the case) and the option to retire before normal retirement date without actuarial reduction, where it existed, was removed.
3) Future index linked increases are linked to the Consumer Price Index, CPI, instead of the Retail Price Index, RPI.
In addition, some employee contribution rates were increased.
The Group has established a Pension Funding Partnership arrangement (PFP) including TUI Travel Amber Scot LP (SLP) & TUI Travel Amber E&W LLP (LLP), together the Partnerships (the Partnerships). The main operating brands of the UK business, namely Thomson and First Choice, were transferred to the LLP and three pension schemes subscribed for interests in the LLP via the SLP. TUI UK Limited pays a royalty to the LLP for the use of the brands. The Britannia Airways Limited Superannuation and Life Assurance Scheme, the TUI Pension Scheme (UK) and the Thomson Airways Pension Scheme in aggregate are entitled to an annual income distribution of approximately £17m. The PFP has a life of 15 years from inception, after which the schemes will receive a payment equal to their outstanding funding deficit, up to a maximum of £275m in aggregate, in return for their interest in the PFP.
The Partnerships are controlled by the Group and their results are consolidated by the Group. There is no net impact on the Group balance sheet, the IAS 19 deficit or income statement. The investment held by the pension schemes does not meet the definition of a scheme asset under IAS 19, and is therefore not included within the fair value of scheme assets disclosed in the Group financial statements. The recognition of the brand assets in the Group financial statements remains unaffected by the establishment of the PFP, although the Thomson and First Choice brands, the latter of which is recognised on the Group balance sheet, are now being held as security for the PFP. See Note 10 for more information.
Date of last full Average employee Scheme name actuarial valuation Average Group contribution rate contribution rate
Britannia Airways Limited Superannuation and Life Assurance Scheme 31 March 2010 5.6% plus £19.2m per annum deficit contribution plus £11.9m PFP income 11.9%TUI Pension Scheme (UK) 31 March 2010 7.6% plus £4.4m per annum deficit contribution plus £4.1m PFP income 7.2%Thomson Airways Pension Scheme 31 March 2010* 14.4% plus £1.9m per annum deficit contribution plus £0.5m PFP income 16.1%
*There was no full valuation of the new scheme. All four predecessor schemes which were merged into this Scheme had their previous valuations updated to 31 March 2010 to support the merger and the PFP arrangement and for the purposes of implementing a new recovery plan.
Where there is more than a single class of membership, contribution rates reflect weighted average values within the scheme. Contribution rates are stated before adjustment for salary sacrifice arrangements where applicable.
The principal unfunded schemes in Germany are shown below. These were all subject to a full actuarial valuation within three months preceding the balance sheet date:
Scheme name Status
Versorgungsordnung’ Hapag-Lloyd Fluggesellschaft GmbH Open to new membersVersorgungsordnung’ TUI Deutschland GmbH Closed to new membersVersorgungsordnung’ TUI Leisure Travel GmbH Closed to new members
Valuations of the schemes are made by qualified actuaries using market based valuations for the assets and the projected unit method for the liabilities. The Group recognises all actuarial gains or losses in the consolidated statement of comprehensive income.
The assets of each scheme have been taken at market value and liabilities in each territory have been calculated using the following principal assumptions:
UK1 per annum Germany per annum Other3 per annum 2012 2011 2012 2011 2012 2011 % % % % % %
RPI inflation 2.7 3.2 2.6 2.5 2.2 2.1Pensionable salary inflation 2.5 2.62 2.5 2.5 2.7 2.8Discount rate 4.5 5.3 3.3 4.8 3.0 4.1
1 Pension increases in payment across the UK Schemes reflect either fixed increases or index linked increases, subject to minimum and maximum limits applicable to each class of benefit.
2 UK pensionable salary increase is capped at 2.5% for all employees earning over £30,000.
3 The assumptions for Other are a weighted average.
TT11 | AR 2012 | 20/12/2012 | Proof 5

Financial statements
Notes to the consolidated financial statements continued
www.tuitravelplc.com
102 TUI Travel PLC Annual Report & Accounts 2012
6. Employees continuedThe mortality assumptions underlying the value of the accrued liabilities for each territory are set out in the tables below. The mortality assumptions are based on relevant standard mortality tables in each territory:
UK life expectancy (weighted average) 2012 2011 Years Years
MalesLife expectancy in years for a pensioner retiring aged 65, on the balance sheet date 22.6 23.1Life expectancy in years for a pensioner retiring aged 65, 20 years after the balance sheet date 23.9 24.2FemalesLife expectancy in years for a pensioner retiring aged 65, on the balance sheet date 24.5 25.5Life expectancy in years for a pensioner retiring aged 65, 20 years after the balance sheet date 26.1 26.4
Germany life expectancy 2012 2011 Years Years
MalesLife expectancy in years for a pensioner retiring aged 65, on the balance sheet date 18.6 18.5Life expectancy in years for a pensioner retiring aged 65, 20 years after the balance sheet date 21.3 21.2FemalesLife expectancy in years for a pensioner retiring aged 65, on the balance sheet date 22.7 22.6Life expectancy in years for a pensioner retiring aged 65, 20 years after the balance sheet date 25.3 25.1
Other life expectancy (weighted average) 2012 2011 Years Years
MalesLife expectancy in years for a pensioner retiring aged 65, on the balance sheet date 21.6 20.7Life expectancy in years for a pensioner retiring aged 65, 20 years after the balance sheet date 22.7 21.7FemalesLife expectancy in years for a pensioner retiring aged 65, on the balance sheet date 23.8 23.3Life expectancy in years for a pensioner retiring aged 65, 20 years after the balance sheet date 24.9 23.7
The fair value of assets of the schemes in each territory are set out below:
UK Germany Other Total 2012 2011 2012 2011 2012 2011 2012 2011 £m £m £m £m £m £m £m £m
Equities 483 524 – – 1 46 484 570Government debt 241 229 – – 101 55 342 284Corporate bonds 222 196 – – – 1 222 197Property 70 15 – – – 1 70 16Cash and cash equivalents 6 10 – – 9 10 15 20Other 174 103 – – 36 32 210 135
Total 1,196 1,077 – – 147 145 1,343 1,222
The expected rates of return on each category of assets in each territory are as follows:
UK Germany Other 2012 2011 2012 2011 2012 2011 % % % % % %
Equities 7.1 7.8 n/a n/a 7.0 7.9Government debt 2.6 3.8 n/a n/a 2.6 4.3Corporate bonds 4.5 5.3 n/a n/a 3.3 4.7Property 6.1 5.8 n/a n/a 5.0 4.8Cash and cash equivalents 0.5 0.5 n/a n/a 0.5 0.8Other 6.2 7.4 n/a n/a 2.0 2.6
Overall expected rate of return 5.5 6.2 n/a n/a 2.4 4.8
The overall expected rate of return is calculated by weighting the individual rates in accordance with the anticipated balance in the schemes’ investment portfolio. The fair values of the schemes’ assets are not intended to be realised in the short term and may be subject to significant change before they are realised.
TT11 | AR 2012 | 20/12/2012 | Proof 5

Financial statements
www.tuitravelplc.com
TUI Travel PLC Annual Report & Accounts 2012 103Financial statem
ents
Changes in the fair value of scheme assets in each territory are as follows:
UK Germany Other Total 2012 2011 2012 2011 2012 2011 2012 2011 £m £m £m £m £m £m £m £m
Balance at beginning of year 1,077 1,073 – – 145 142 1,222 1,215 Expected return on scheme assets 67 67 – – 5 6 72 73 Company contributions 56 50 – – 4 5 60 55 Member contributions – 3 – – 2 2 2 5 Benefits paid (71) (62) – – (7) (5) (78) (67)Experience gains/(losses) 67 (54) – – 9 (8) 76 (62)Foreign exchange – – – – (11) 3 (11) 3
Balance at end of year 1,196 1,077 – – 147 145 1,343 1,222
Actual return on scheme assets 134 13 – – 14 (2) 148 11
Employer contributions in the following year are expected to be £56m in respect of the UK and £3m in respect of Other. The UK value includes £17m in respect of income distribution from the PFP.
The composition of the fair value of scheme assets in each territory is as follows:
UK Germany Other Total 2012 2011 2012 2011 2012 2011 2012 2011 £m £m £m £m £m £m £m £m
Schemes with surplus of assets – – – – 9 9 9 9Schemes with deficit of assets 1,196 1,077 – – 138 136 1,334 1,213
Total 1,196 1,077 – – 147 145 1,343 1,222
Changes in the present value of defined benefit obligations in each territory are as follows:
UK Germany Other Total 2012 2011 2012 2011 2012 2011 2012 2011 £m £m £m £m £m £m £m £m
Balance at beginning of year 1,436 1,422 129 117 171 170 1,736 1,709 Current service cost 14 19 7 8 6 6 27 33 Interest cost on obligation 74 73 6 5 6 6 86 84 Benefits paid (71) (62) (2) (2) (9) (5) (82) (69)Member contributions – 3 – – 2 2 2 5 Curtailment – (63) – – (1) (1) (1) (64)Actuarial losses/(gains) 171 44 41 (6) 36 (11) 248 27 Reclassification – – – 8 1 – 1 8 Foreign exchange – – (13) (1) (13) 4 (26) 3
Balance at end of year 1,624 1,436 168 129 199 171 1,991 1,736
The amounts recognised in the consolidated income statement for the years ended 30 September 2012 and 30 September 2011 for each territory are as follows:
UK Germany Other Total 2012 2011 2012 2011 2012 2011 2012 2011 £m £m £m £m £m £m £m £m
Current service cost 14 19 7 8 6 6 27 33Curtailment – (63) – – (1) (1) (1) (64)Interest on defined benefit pension scheme obligation 74 73 6 5 6 6 86 84Expected return on defined benefit pension scheme (67) (67) – – (5) (6) (72) (73)
Total 21 (38) 13 13 6 5 40 (20)
The prior year UK curtailment gain reflects the future growth in pensionsable salary being capped at 2.5% per annum for employees earning more than £30,000 per annum.
TT11 | AR 2012 | 20/12/2012 | Proof 5

Financial statements
Notes to the consolidated financial statements continued
www.tuitravelplc.com
104 TUI Travel PLC Annual Report & Accounts 2012
6. Employees continuedThese amounts are included within the following expense/(income) categories in the consolidated income statement:
UK Germany Other Total 2012 2011 2012 2011 2012 2011 2012 2011 £m £m £m £m £m £m £m £m
Cost of sales 6 (33) 6 7 4 2 16 (24)Administrative expenses 8 (11) 1 1 1 3 10 (7)Financial expenses 74 73 6 5 6 6 86 84 Financial income (67) (67) – – (5) (6) (72) (73)
Total 21 (38) 13 13 6 5 40 (20)
The amounts recognised directly in equity for the year ended 30 September 2012 and for the year ended 30 September 2011 for each territory are as follows: UK Germany Other Total 2012 2011 2012 2011 2012 2011 2012 2011 £m £m £m £m £m £m £m £m
Cumulative losses brought forward 552 454 13 20 31 34 596 508 Losses/(gains) recognised during the year 104 98 41 (6) 27 (3) 172 89 Foreign exchange – – (3) (1) (3) – (6) (1)
Cumulative losses carried forward 656 552 51 13 55 31 762 596
Trend analysis information in respect of the UK, Germany and Other territories is as follows:
UK 2012 2011 2010 2009 2008 £m £m £m £m £m
Present value of scheme liabilities (1,624) (1,436) (1,422) (1,327) (1,015)Fair value of scheme assets 1,196 1,077 1,073 942 810
Deficit (428) (359) (349) (385) (205)
2012 2011 2010 2009 2008 £m £m £m £m £m
Experience (loss)/gain on scheme liabilities (2) (22) (3) (23) 14 Change in actuarial assumption (loss)/gain (169) (22) (51) (249) 170
Total actuarial (loss)/gain on scheme liabilities (171) (44) (54) (272) 184 Experience gain/(loss) on scheme assets 67 (54) 39 37 (178)
Total actuarial (loss)/gain (104) (98) (15) (235) 6
Germany 2012 2011 2010 2009 2008 £m £m £m £m £m
Present value of scheme liabilities (168) (129) (117) (97) (50)Fair value of scheme assets – – – – –
Deficit (168) (129) (117) (97) (50)
2012 2011 2010 2009 2008 £m £m £m £m £m
Experience (loss)/gain on scheme liabilities (1) – 3 3 1 Change in actuarial assumption (loss)/gain (40) 6 (19) (16) 7
Total actuarial (loss)/gain on scheme liabilities (41) 6 (16) (13) 8 Experience gain on scheme assets – – – – –
Total actuarial (loss)/gain (41) 6 (16) (13) 8
TT11 | AR 2012 | 20/12/2012 | Proof 5
Financial statements
www.tuitravelplc.com
TUI Travel PLC Annual Report & Accounts 2012 105Financial statem
ents
Other 2012 2011 2010 2009 2008 £m £m £m £m £m
Present value of scheme liabilities (199) (171) (170) (156) (113)Fair value of scheme assets 147 145 142 137 114
(Deficit)/surplus (52) (26) (28) (19) 1
2012 2011 2010 2009 2008 £m £m £m £m £m
Experience (loss)/gain on scheme liabilities (4) (1) 2 1 (4)Change in actuarial assumption (loss)/gain (32) 12 (13) (21) 9
Total actuarial (loss)/gain on scheme liabilities (36) 11 (11) (20) 5 Experience gain/(loss) on scheme assets 9 (8) – (3) (15)
Total actuarial (loss)/gain (27) 3 (11) (23) (10)
Total 2012 2011 2010 2009 2008 £m £m £m £m £m
Present value of scheme liabilities (1,991) (1,736) (1,709) (1,580) (1,178)Fair value of scheme assets 1,343 1,222 1,215 1,079 924
Deficit (648) (514) (494) (501) (254)
2012 2011 2010 2009 2008 £m £m £m £m £m
Experience (loss)/gain on scheme liabilities (7) (23) 2 (19) 11 Change in actuarial assumption (loss)/gain (241) (4) (83) (286) 186
Total actuarial (loss)/gain on scheme liabilities (248) (27) (81) (305) 197 Experience gain/(loss) on scheme assets 76 (62) 39 34 (193)
Total actuarial (loss)/gain recognised in other comprehensive income (172) (89) (42) (271) 4
Reconciliation of defined benefit obligations and scheme assets to values recognised in the balance sheet:
UK Germany Other Total 2012 2011 2012 2011 2012 2011 2012 2011 £m £m £m £m £m £m £m £m
Present value of unfunded defined benefit obligations 1 1 168 129 17 18 186 148 Present value of funded defined benefit obligations 1,623 1,435 – – 182 153 1,805 1,588 Fair value of scheme assets (1,196) (1,077) – – (147) (145) (1,343) (1,222)
428 359 168 129 52 26 648 514 Unrecognised past service cost – – – – – (1) – (1)
Recognised liability for defined benefit obligation 428 359 168 129 52 25 648 513
Analysed as: Retirement benefit non-current assets – – – – – (1) – (1)Retirement benefit current liabilities – – 2 2 – 1 2 3 Retirement benefit non-current liabilities 428 359 166 127 52 25 646 511
Total 428 359 168 129 52 25 648 513
The sensitivity of the fair value of the defined pension deficit to the key financial and demographic assumptions is illustrated below:
UK Germany Other Total 2012 2012 2012 2012 £m £m £m £m
Decrease to deficit of increasing discount rate by 0.25% (72) (8) (8) (88)Increase to deficit of reducing discount rate by 0.25% 77 8 8 93 Increase to deficit of increasing all life expectancies by 1 year 48 3 6 57
TT11 | AR 2012 | 20/12/2012 | Proof 5

Financial statements
Notes to the consolidated financial statements continued
www.tuitravelplc.com
106 TUI Travel PLC Annual Report & Accounts 2012
6. Employees continued(D) Share award schemesThe Company operates three principal share award schemes which are designed to link remuneration to the future performance of the Group. The schemes are the Performance Share Plan (PSP), the Deferred Annual Bonus Scheme (DABS) and the Deferred Annual Bonus Long-Term Incentive Scheme (DABLIS). The DABLIS scheme is described below and the other two schemes are described in the Remuneration report along with the relevant vesting criteria.
At 30 September 2012, the shares allocated and outstanding in respect of ordinary shares, were as follows:
Share award scheme Number of shares Date due to vest/date vested
Performance Share Plan 1,864,433 4 December 2012 695,082 19 March 2013 1,988,854 6 December 2013 3,234,113 7 December 2014 193,242 1 June 2015Deferred Annual Bonus Scheme 3,148,956 4 December 2012 3,825,685 6 December 2013 5,376,936 7 December 2014Deferred Annual Bonus Long Term Incentive Scheme 1,924,199 4 December 2012 2,131,122 6 December 2013 3,866,944 7 December 2014
Total 28,249,566
The number of share awards at the beginning and end of the year is as follows:
Number of awards 30 September 2012
Outstanding at beginning of the year – excluding deferred shares 26,346,949 Forfeited during the year (4,784,495)Reclassified as share appreciation rights (219,552)Exercised during the year (5,882,575)Granted during the year 12,789,239
Outstanding at the end of the year – excluding deferred and delayed shares 28,249,566
In addition to the above shares, there are 2,491,300 (2011: 1,310,340) deferred shares outstanding in relation to the Deferred Annual Bonus Scheme. These are due to vest between 4 December 2012 and 7 December 2014.
In respect of the Deferred Annual Bonus Long-Term Incentive Scheme there are an additional 4,406,287 (2011: 2,176,746) deferred shares. These are due to vest between 4 December 2012 and 7 December 2014.
The weighted average share price of the shares exercised was £1.66. No material awards have been made to date under the Group’s HMRC approved Share Incentive Plan which is an all-employee share plan.
The fair value of services received in return for shares awarded during the year is measured by reference to the fair value of the shares awarded. The fair value at the date the shares were awarded has been estimated using a binomial methodology for all schemes except where there is a market-based performance condition attached to vesting, in which case a Monte Carlo simulation was used. The principal assumptions required by these methodologies were:
2012 2011
Information relating to fair values of shares awardedFair value at measurement date £0.85-£1.46 £1.50-£1.94Share price £1.66 £2.29Expected volatility 36.1% 56.1%Award life 3 years 3 yearsExpected dividends 4.47% 5.56%Risk free interest rate 0.54% 1.0%
Participants are not entitled to dividends prior to vesting. Expected volatility is based on historic volatility adjusted for changes to future volatility indicated by publicly available information. Shares were awarded under a service condition.
TT11 | AR 2012 | 20/12/2012 | Proof 5

Financial statements
www.tuitravelplc.com
TUI Travel PLC Annual Report & Accounts 2012 107Financial statem
ents
Employee expenses for the yearEmployee expenses for the current and prior year relating to share-based schemes are: Year ended Year ended 30 September 30 September 2012 2011 £m £m
Equity-settled 16 19Expense arising for share appreciation rights 1 1
Total 17 20
Share appreciation rightsCertain participants (other than board directors) are eligible to receive their awards on a cash settled basis, the calculation of which exactly replicates the formal share-based scheme.
Long term incentivesDeferred Annual Bonus Long-Term Incentive SchemeThe Deferred Annual Bonus Long-Term Incentive Scheme (DABLIS) is for participants below the GMB level and requires a 25% deferral of any annual performance bonus award into shares. Matching shares may also be awarded up to four times the deferred amount and are subject to the achievement of stretching performance conditions over a three year period. Awards of deferred and matching shares are subject to forfeiture conditions until the release date. The earliest point at which the shares are eligible for release is at the end of three years following deferral.
For awards of matching shares made during the year, no shares will vest unless the annual average of the ratio of the Group’s return on invested capital (ROIC) to the weighted average cost of capital (WACC) meets or exceeds one over the three year period. A hurdle of ROIC, being at least equal to WACC, is used to ensure that the relevant long term incentive awards pay out only when shareholder value is being created over the performance periods. If the ROIC/WACC hurdle is met, shares will only vest to the extent to which three further performance conditions are satisfied over the three year period as follows:
• Up to half of the matching shares will vest based on achievement of an aggregate EBITA profit target for the participants’ Sector over the three year performance period.
Achievement of aggregate EBITA target Proportion of relevant shares which may vest
At or below 75% 0%Between 75% and 100% On a straight line basis between 10% and 100%At or above 100% 100%
• Up to one quarter of the matching shares will vest based on growth in the Group’s earnings per share (EPS), in relation to the growth in the UK Retail Price Index (RPI) as shown in the table below:
Average annual EPS growth in excess of RPI growth Proportion of matching shares vesting
Below 4% 0%Between 4% and 13% On a straight line basis between 10% and 100%13% or above 100%
• In respect of awards made prior to 30 September 2011, up to one quarter of the matching shares will vest based on the Group’s ranking of total shareholder return (TSR) performance relative to companies ranked 30th to 100th by market capitalisation on the London Stock Exchange as at the date of the award as shown in the table below:
TSR Ranking Proportion of matching shares vesting
Below median 0%Between median and upper quartile On a straight line basis between 15% and 100%At or above upper quartile 100%
In respect of awards made after 1 October 2011, up to one quarter of the matching shares will vest based on the Group’s total shareholder return (TSR) performance relative to an average of the TSR performance of an index of international travel and leisure companies. Deloitte provides the Group with the TSR measurement as required. The index is considered to be the most appropriate benchmark for comparison purposes. The companies included in the index are:
1 Aer Lingus Group 9 Finnair 17 Pierre & Vacances2 Air Berlin 10 FirstGroup 18 Priceline.com3 Air France-KLM 11 Flight Centre 19 Royal Caribbean Cruises4 Carnival 12 Hertz Global Holdings 20 Ryanair Holdings5 Club Mediterranee 13 International Consolidated Airlines Group 21 Stagecoach Group6 Deutsche Lufthansa 14 Kuoni Reisen Holding 22 Thomas Cook Group7 easyJet 15 National Express Group 23 Wotif.com Holdings8 Expedia 16 Norwegian Air Shuttle
TT11 | AR 2012 | 20/12/2012 | Proof 5

Financial statements
Notes to the consolidated financial statements continued
www.tuitravelplc.com
108 TUI Travel PLC Annual Report & Accounts 2012
6. Employees continuedTUI Travel’s TSR performance Proportion of matching shares vesting
Below index 0%Between index and index +8% per annum (inclusive) On a straight line basis between 15% and 100%Exceeding index +8% per annum 100%
(E) Remuneration of Directors Year ended Year ended 30 September 30 September 2012 2011 £m £m
Emoluments 7 8Pensions and other retirement benefits 1 1
Total 8 9
Further information is provided in the audited section of the Remuneration report.
7. Income, expenses and auditors’ remuneration Year ended Year ended 30 September 30 September 2012 2011 £m £m
Included within operating profit in the consolidated income statement for the year are the following (credits)/charges: Operating lease income: aircraft (47) (54)Operating lease income: land and buildings (2) (4)Operating lease rentals: land and buildings 194 198 Operating lease rentals: aircraft and other equipment 425 460 Depreciation of property, plant and equipment 127 137 Amortisation of intangible assets: business combination intangibles 59 66 Amortisation of intangible assets: other intangibles 33 35 Charge for share-based payments 17 20 (Profit)/loss on sale of property, plant and equipment (9) 6 Loss on foreign currency retranslation 14 38 Impairment of goodwill and other intangibles 30 51 Impairment of property, plant and equipment 12 18
Operating lease rentals: land and buildings includes £10m (2011: £12m) of costs included in separately disclosed items (Note 4) as provisions for onerous leases, primarily related to vacated properties. In addition to the operating lease rentals disclosed above, charges of £186m (2011: £184m) were incurred in respect of hotel accommodation rentals which are disclosed as operating leases under IFRIC 4: Determining whether an arrangement contains a lease.
The Group leases aircraft throughout the year, and in certain circumstances, sub-leases a number of such aircraft when it has the capacity to do so, in order to maximise operational efficiency. Up to 14 aircraft are ‘wet leased’ exclusively to another European airline company at fixed rates. In addition, up to 13 aircraft are ‘wet leased’ to the Sunwing Travel Group, an associate of the Group. The aircraft leased to Sunwing are winter only leases and are at market rates. The expected income from future minimum lease payments under non-cancellable operating leases is as follows:
Year ended Year ended 30 September 30 September 2011 2012 (restated)Minimum lease payments under non-cancellable operating leases expiring: £m £m
Within one year 38 40Between one and five years 64 92Later than five years 30 40
Total 132 172
The prior year comparatives have been revised to reflect only minimum committed income under these contracts.
TT11 | AR 2012 | 20/12/2012 | Proof 5

Financial statements
www.tuitravelplc.com
TUI Travel PLC Annual Report & Accounts 2012 109Financial statem
ents
Services provided by the Company’s auditors and its associatesDuring the year the Group (including its overseas subsidiaries) obtained the following services from the Company’s auditor and its associates:
Year ended Year ended 30 September 30 September 2012 2011 £m £m
Fees payable to the Company‘s auditors for the audit of the Parent Company and consolidated financial statements 1 1Fees payable to the Company‘s auditors and its associates for other services:Audit of the Company’s subsidiaries pursuant to legislation 4 3
Auditors‘ remuneration for audit services 5 4Other services provided to comply with legislation* 1 1
Audit and audit related services 6 5
All other services 2 2
* Relate principally to the interim review and airline regulatory returns.
8. TaxationThe tax charge can be summarised as follows:
(i) Analysis of charge in the year Year ended Year ended 30 September 30 September 2012 2011 Note £m £m
Current tax charge UK corporation tax on profit/loss for the year – 24 Non-UK tax on profit/loss for the year 70 50 Adjustments in respect of previous years (42) (3)
28 71
Deferred tax charge/(credit) Origination and reversal of temporary differences: Current year UK 21 (40)Current year non-UK 9 41 Changes in tax rates 11 14 Adjustments in respect of previous years (5) (29)
36 (14)
Total income tax charge in consolidated income statement 14 64 57
Following a review of the local tax positions in a number of the Group’s major operating jurisdictions during the year, certain tax balances have been adjusted to reflect the position of the latest local statutory accounts and tax returns. These adjustments in respect of prior years have been reflected in the current year income statement tax charge.
(ii) Reconciliation of effective tax rateThe total tax charge (2011: charge) for the year is higher (2011: higher) than the standard rate of corporation tax in the UK of 25% (2011: 27%). The differences are explained below: Year ended Year ended 30 September 2012 30 September 2011 £m % £m %
Profit before tax reported in the consolidated income statement 201 144 Less share of profit in joint ventures and associates (Note 12) (5) (13)
196 131
Income tax on profit before tax excluding share of profit of joint ventures and associates at the standard rate of UK tax of 25% (2011: 27%) 49 25 35 27 Expenses not deductible for tax purposes 23 12 29 22 Income not taxable (10) (5) (14) (11)Tax losses not recognised as an asset 38 19 64 49 Utilisation of tax losses not previously recognised (4) (2) (30) (23)Higher tax rates on overseas earnings/losses 3 2 (3) (2)Changes in tax rates 12 6 8 6 Adjustments to taxation in respect of previous years (47) (24) (32) (24)
Total income tax charge in consolidated income statement 64 33 57 44
TT11 | AR 2012 | 20/12/2012 | Proof 5

Financial statements
Notes to the consolidated financial statements continued
www.tuitravelplc.com
110 TUI Travel PLC Annual Report & Accounts 2012
8. Taxation continuedThe underlying effective rate of taxation for the year ended 30 September 2012 is calculated based on the underlying profit before tax (excluding separately disclosed items, acquisition related expenses and impairment charges) and is calculated at 27%. The actual tax rate of 33% differs from the underlying effective tax rate due to the tax effect of the non-recognition of tax losses in France, the recognition of additional deferred tax losses in Austria and the successful conclusion of tax audits in Morocco and Turkey.
(iii) Deferred tax recognised outside of the consolidated income statementThe following taxation (credit)/charge has been recognised outside of the consolidated income statement: Year ended Year ended 30 September 30 September 2012 2011 £m £m
Tax relating to components of other comprehensive income Cash flow hedges (15) 22 Defined benefit pension plans (32) 3 Other – 4
Total tax (credited)/debited to other comprehensive income (47) 29
Tax credited directly to equityConvertible bonds (3) (2)
Total (50) 27
(iv) Factors affecting future tax chargeA) On 22 June 2010, the UK Government announced a phased reduction in the main UK corporation tax rate from 28% to 24%, with the first 1% reduction taking effect from 1 April 2011 (having been substantively enacted on 20 July 2010). Subsequent UK Budget Statements have announced additional reductions in the main UK corporation tax rate to 26% taking effect from 1 April 2011, and 24% taking effect from 1 April 2012.
At the balance sheet date, the Finance Act 2012 had been substantively enacted confirming that the main UK corporation tax rate will be 23% from 1 April 2013. Therefore, at 30 September 2012, deferred tax assets and liabilities have been calculated based on a rate of 23% where the temporary difference is expected to reverse after 1 April 2013.
Further proposals to reduce the main UK corporation tax rate to 22% on 1 April 2014 had not been substantively enacted at the balance sheet date and are therefore not included in these financial statements.
This may reduce the Group’s future current tax charge accordingly. It has not yet been possible to quantify the full anticipated effect of the announced further 1% rate reduction, although this should further reduce the Group’s future current tax charge and reduce the Group’s deferred tax liabilities/assets accordingly.
B) In the Group’s financial statements for 2010 and 2011, it was disclosed that the Spanish tax authorities were contesting the Spanish corporate income tax treatment of two transactions, undertaken by two of the Group’s Spanish subsidiary companies during the period 2002 to 2006. Throughout the tax audit process, the Group has engaged fully and openly with the Spanish tax authorities and has supplied considerable documentary support and Spanish technical tax analysis to explain the commercial and economic rationale and Spanish corporate income tax treatment for the transactions. These transactions were implemented after the Group had taken specialist external advice.
The position remains unresolved and earlier in 2012 became the subject of a formal judicial investigation into whether or not either or both of the transactions may have amounted to a tax offence in Spain. This judicial investigation is expected to continue for a further 12-18 months. Following this investigation process, it is possible that one or more prosecutions may ensue or the matter may be closed and returned to the tax authorities for civil settlement.
The original tax deduction arising from the transactions being challenged by the Spanish tax authorities was approximately €28m. In prior years, the Directors recorded a tax creditor for their best estimate of the tax and interest that they believed may become payable in the event that the Spanish tax authorities are successful in their challenge. This creditor continues to be held at 30 September 2012, within income taxes payable. If the current challenge instigated by the tax authorities is successful ultimately, the Group may be liable to further interest, penalties and fines, the extent of which at this stage is uncertain. To mitigate the extent of such potential penalties all of the disputed tax has now been either paid or deposited in court. On the basis of independent legal advice taken, the Group firmly believes that should the investigation result in a prosecution or further civil claim by the tax authorities, it could be defended robustly. It is likely that the resolution of this matter will take a number of years to reach a final conclusion.
TT11 | AR 2012 | 20/12/2012 | Proof 5

Financial statements
www.tuitravelplc.com
TUI Travel PLC Annual Report & Accounts 2012 111Financial statem
ents
C) During 2012 the German tax authorities issued new guidance on how certain items of expenditure should be treated for the purposes of German trade tax. There remains considerable uncertainty about the application of this guidance to certain tour operating activities and hence further clarification of this guidance has been sought from the German tax authorities. It is possible that the issue will have to be litigated through the German tax courts and it could take a considerable amount of time to bring to a resolution.
It is difficult to estimate accurately the potential liability should the German tax authorities challenge successfully the Group’s interpretation of the guidance, due to the differing nature of the contracts which could be impacted by any such challenge. As a result there is a range of possible outcomes. If the Group is successful in its arguments there would be no exposure. However, it is possible that the liability over the last five years’ could be up to a total of approximately £64m, although the Group strongly believes that the guidance should not apply to standard tour operating contracts and that any liability will be more likely to be substantially less than this.
D) Other factors which may affect the future tax charge include the mix of jurisdictions with different tax rates in which profits and losses arise, changes in tax rates and the potential future recognition of tax losses for which a deferred tax asset has not been recognised at the year end (Note 14).
9. DividendsThe following dividends which relate to ordinary shares have been deducted from equity in the year:
Year ended Year ended 30 September 30 September Pence 2012 2011 per share £m £m
Dividends relating to the year ended 30 September 2010 Interim dividend (paid October 2010) 3.2 – 36Final dividend (paid April 2011) 7.8 – 86
11.0 – 122
Dividends relating to the year ended 30 September 2011 Interim dividend (paid October 2011) 3.3 36 –Final dividend (paid April 2012) 8.0 89 –
11.3 125 –
The interim dividend in respect of the year ended 30 September 2012 of 3.4p per share was paid on 3 October 2012 and this dividend of £38m will be recognised as a deduction from equity in the year ending 30 September 2013.
Subsequent to the balance sheet date, the Directors have proposed a final dividend of 8.3p per share (2011: final dividend of 8.0p per share) payable on 10 April 2013 to the holders of relevant shares on the register at 8 March 2013. The final proposed dividend amounts to £92m and will, after approval by shareholders, be recognised in the consolidated financial statements for the year ending 30 September 2013. The final ordinary dividend of 8.3p per share, together with the interim dividend of 3.4p per share, makes a total dividend of 11.7p per share relating to the year ended 30 September 2012.
A dividend reinvestment plan is in operation. Those shareholders who have not elected to participate in this plan, and who would like to participate with respect to the 2012 final dividend, may do so by contacting Equiniti directly on 0871 384 2030 or via the overseas helpline on +44 121 415 7047. The last day for election for the final proposed dividend is 25 March 2013 and any requests should be made in good time ahead of that date.
TT11 | AR 2012 | 20/12/2012 | Proof 5

Financial statements
Notes to the consolidated financial statements continued
www.tuitravelplc.com
112 TUI Travel PLC Annual Report & Accounts 2012
10. Intangible assets Customer Computer Software in Goodwill Brands relationships software Licences development Other Total £m £m £m £m £m £m £m £m
CostAt 1 October 2010 4,478 447 200 422 36 27 163 5,773 Additions – – 1 47 1 3 1 53 Acquisition through business combinations 57 9 – 2 – – 7 75 Disposals (18) – – (24) (2) – – (44)Reclassification from assets held for sale 11 – – 1 – – – 12 Foreign exchange 20 3 2 2 1 – – 28 Reclassification of asset class 1 – 2 (1) 1 – (3) –
At 30 September 2011 4,549 459 205 449 37 30 168 5,897
Additions 3 – 1 40 – 43 4 91 Acquisition through business combinations 8 7 – 1 – – – 16 Disposals (1) – – (29) (1) – – (31)Reclassification to assets held for sale – – – – (8) – – (8)Foreign exchange (147) (11) (11) (13) (1) (1) (2) (186)Reclassification of asset class 1 – – 11 (1) (10) (1) –
At 30 September 2012 4,413 455 195 459 26 62 169 5,779
Accumulated amortisation and impairment losses At 1 October 2010 (597) (72) (45) (312) (15) – (73) (1,114)Amortisation for the year – (30) (14) (47) (1) – (9) (101)Impairment loss (39) (6) (1) – (1) (4) – (51)Disposals – – – 24 1 – – 25 Reclassification from assets held for sale (8) – – – – – – (8)Foreign exchange (2) (1) (1) (1) – (1) – (6)
At 30 September 2011 (646) (109) (61) (336) (16) (5) (82) (1,255)
Amortisation for the year – (27) (14) (40) (2) – (9) (92)Impairment loss (20) (2) – – (8) – – (30)Reclassification to assets held for sale – – – – 7 – – 7 Disposals – – – 28 – – – 28 Foreign exchange 29 3 3 7 1 1 1 45
At 30 September 2012 (637) (135) (72) (341) (18) (4) (90) (1,297)
Net book valueAt 1 October 2010 3,881 375 155 110 21 27 90 4,659
At 30 September 2011 3,903 350 144 113 21 25 86 4,642
At 30 September 2012 3,776 320 123 118 8 58 79 4,482
Amortisation of intangible assets is recognised within cost of sales in the consolidated income statement. Amortisation of business combination and other intangibles combined with depreciation of property, plant and equipment is disclosed by segment in Note 3.
Additions to computer software in development of £43m includes costs relating to a major IT project within the UK & Ireland segment to replace the reservation and accounting systems. Licences totalling £8m have been impaired in the year, £6m of which has arisen from the write-down of specific ski chalet assets which are now being actively marketed for disposal and where transactions are expected to complete within 12 months. The remaining assets, which relate to the Specialist & Activity Sector, have then been transferred to assets held for resale as they met criteria set out in IFRS 5. The impairment charge to the consolidated income statement has been included within administrative expenses and is included within separately disclosed items in Note 4.
TT11 | AR 2012 | 20/12/2012 | Proof 5

Financial statements
www.tuitravelplc.com
TUI Travel PLC Annual Report & Accounts 2012 113Financial statem
ents
In 2011, the Group established a Pension Funding Partnership arrangement (PFP). The main operating brands of the UK business, namely Thomson and First Choice, were sold into the PFP and three UK pension schemes subscribed for interests in the PFP. The recognition of the two brand assets in the Group financial statements remains unaffected by the establishment of the PFP, although the Thomson and First Choice brands, the latter of which is recognised on the Group balance sheet at a value of £101m (2011: £108m), are now being held as security for the PFP.
Individual intangible assets other than goodwill that are considered material to the Group are as follows:
Brands Customer relationships Other intangible assets 2012 2011 2012 2011 2012 2011 £m £m £m £m £m £m
First Choice brand 101 108 – – – –Marmara brand 27 32 – – – –Accommodation & Destinations (Accommodation Wholesaler) – customer relationships – – 70 84 – –Landing slots – – – – 30 32
128 140 70 84 30 32
The First Choice and Marmara brands are major brands of the UK & Ireland and French businesses respectively and have a remaining amortisation period of 15 years (2011: 16 years). The customer relationships within the Accommodation & Destinations (Accommodation Wholesaler) Sector are in respect of commercial contractual relationships with travel agents and have a remaining amortisation period of 10 years (2011: 11 years). The landing slots are in respect of the UK & Ireland business for airports in the UK and have a remaining amortisation period of 15 years (2011: 16 years).
Goodwill impairment testingIAS 36 requires that impairment tests are carried out on CGUs, following the level at which the Group’s management measures returns on operations.
Once every year, or more frequently if events or a change in the economic environment indicate a risk of impairment, the Group assesses the recoverable amount of goodwill allocated to its CGUs as required by IAS 36 ‘Impairment of assets’. The recoverable value of goodwill for all CGUs has been determined to be ‘value in use’.
The calculation of recoverable value for CGUs based on value in use includes the following assumptions:
• Cash flow projections based on the Group’s latest approved five year business plan.
• Cash flows beyond the plan period are extrapolated using an inflation only growth rate of between 1% and 3.9% (2011: between 1.25% and 4%). The growth rate used is less than or equal to third party estimates of the medium term GDP growth rates of the key geographic markets in which the specific CGU operates at the time the projections are prepared.
• Cash flows are discounted using the Group’s WACC adjusted as appropriate for business specific factors, such as geographic risk.
• Cash flows exclude planned enhancement capital expenditure, together with the associated benefit that the expenditure is expected to produce.
• Cash flows include the impact of working capital in both the asset base and the impact on cash flows over the plan period.
• Central group overheads are borne in full by CGUs and are allocated pro rata to the CGU’s underlying operating profit.
Assumptions used in the five year plan take past experience into account with CGU specific and central contingencies in the five year plan being allocated to all CGUs.
Since determination of an appropriate Group WACC is judgemental, sensitivities also address how increases in the base Group WACC might impact the results of the impairment tests. The Group’s WACC is based on a capital asset pricing model calculation using a mixture of in-house data and externally available information.
TT11 | AR 2012 | 20/12/2012 | Proof 5

Financial statements
Notes to the consolidated financial statements continued
www.tuitravelplc.com
114 TUI Travel PLC Annual Report & Accounts 2012
10. Intangible assets continuedAn analysis of the aggregate and material carrying amounts of goodwill allocated to each principal CGU, together with the growth rates being applied to cash flows beyond the plan period and the pre-tax discount rates used for each CGU or group of similar CGUs is as follows:
Growth rate applied to Goodwill cash flows after five year plan Pre-tax discount rate used 30 September 30 September 30 September 30 September 2012 2011 2012 2011 2012 2011Sector CGU £m £m % % % %
Mainstream – Northern Region UK & Ireland 1,490 1,495 2.3 2.0 10 10Mainstream – Central Europe Germany 364 409 1.5 2.0 11 11Accommodation & Accommodation Destinations Wholesaler 354 398 2.0 2.0 12 11Mainstream – Northern Region Nordics 268 276 2.25 2.0 11 10Accommodation & Destinations Accommodation OTA 232 234 3.15 2.25 10 10Mainstream – Western Europe France 180 205 1.8 2.0 11 11Specialist & Education & Languages Activity (formerly Student) 133 134 2.2 2.0 11 10Specialist & Activity Adventure 131 134 3.25 3.0 11 10Specialist & Activity TUI Marine 105 109 2.1 2.1 11 10All Sectors Multiple CGUs 519 509 1.0-3.9 1.25-4.0 10-14 10-13
Total goodwill 3,776 3,903
The multiple CGUs not separately listed above do not individually represent more than 3% of total Group goodwill. All of the Group’s goodwill has been allocated to each CGU and all CGUs have been tested for impairment.
Goodwill impairment chargesIf the recoverable amount of a CGU is estimated to be less than the total of its operating non-current assets, goodwill and other intangibles, an impairment loss is recognised immediately in the income statement. The impairment loss is allocated first to reduce the carrying amount of any goodwill allocated to the CGU and then to the other assets on a pro rata basis. The total impairment loss recognised in the year of £20m is equal to the difference between the net book values and the recoverable amounts.
Impairment charges of £7m and £4m have been recognised in the year in respect of the Italian and Spanish CGUs as a result of a deterioration in forecast trading results compared to the prior year. The impairment test for both of these CGUs was based on the value in use calculation. Both impairment charges are disclosed within administrative expenses and shown separately on the face of the consolidated income statement. The impairments arise since the cash flow model based on the current five year plan did not support the carrying amount of goodwill and all other assets for these two CGUs. The pre-tax discount rate used for these two businesses was 11% for Italy and 12.6% for Spain and the growth rates beyond the five year plan used were 1% for the Italian CGU and 1.9% for the Spanish CGU.
A further £9m goodwill impairment has been recognised in respect of two small businesses that have been identified as non-core to the Group and the potential net proceeds in the event of a disposal have provided an indication in the current year that the goodwill attached to these businesses is no longer supportable. The value of goodwill assigned to these two businesses, together with £2m of brands have been fully impaired. The Board considers the disposal of these businesses to be the more likely option.
In 2011, a £39m impairment charge was recognised in respect of the French CGU, being that of the French tour operator, following a deterioration in the trading results of the French source market due to the political unrest in North Africa.
Sensitivity analysis for goodwillThe calculation of recoverable amount is particularly sensitive to forecast future earnings and the discount rates used. The Directors have considered the separate impacts of: i) increasing WACC by 0.5%; ii) a reduction in underlying earnings of 5% across all years; and iii) a reduction in the long term percentage growth rate beyond the five year plan on all tour operating CGUs to nil as being reasonably possible changes.
Impact of a reasonably possible change in assumption Reduction in Reduction in the long term Increase in underlying percentage WACC of 0.5% earnings of 5% growth rate to nil
CGUs where an impairment would arise following a reasonably possible change in assumptions £m £m £m
Italy – Mainstream Sector 2 2 2Spain – Mainstream Sector – – 1Sport – Specialist & Activity Sector 3 6 10TUI Marine – Specialist & Activity Sector 15 9 54
20 17 67
In addition to these sensitivities, there is no remaining headroom in the goodwill impairment test of the Accommodation OTA CGU if the long term growth rate after five years falls to 2.3%, which is considered to be a reasonably possible change to this assumption.
TT11 | AR 2012 | 20/12/2012 | Proof 5

Financial statements
www.tuitravelplc.com
TUI Travel PLC Annual Report & Accounts 2012 115Financial statem
ents
These sensitivities disclosed immediately above do not take account of any mitigating action that management would take should earnings decrease.
No other impairments to goodwill would arise following these reasonably possible changes in these key assumptions.
Based on all of the calculations undertaken, the Directors consider that the recoverable amount of goodwill in each CGU exceeds its current carrying value.
11. Property, plant and equipment Advance payment Yachts, motor for future Land and boats and Aircraft and delivery Computer Other buildings cruise ships equipment of aircraft equipment equipment Total £m £m £m £m £m £m £m
CostAt 1 October 2010 354 352 934 137 176 491 2,444 Foreign exchange 13 1 8 (1) 3 (3) 21 Acquisitions through business combinations 1 – – – 2 3 6 Transfers from inventory – – 30 – – – 30 Additions 20 60 28 73 14 72 267 Disposals (8) (7) (229) (39) (1) (51) (335)Reclassifications 3 14 10 – 1 (28) – Transferred from/(to) assets held for sale 1 (1) (52) – – – (52)
At 30 September 2011 384 419 729 170 195 484 2,381
Foreign exchange (18) (4) (33) (8) (3) (20) (86)Acquisitions through business combinations – – – – – 3 3 Transfers from inventory – 8 – – – 2 10 Additions 12 32 109 133 10 75 371 Disposals (34) (20) (96) (80) (12) (29) (271)Reclassifications 16 (1) 9 – 2 (26) – Transferred to assets held for sale (2) (1) (31) – (5) (3) (42)
At 30 September 2012 358 433 687 215 187 486 2,366
Accumulated depreciation and impairmentAt 1 October 2010 (183) (111) (648) – (155) (324) (1,421)Foreign exchange (3) – (4) – (3) 1 (9)Acquisitions through business combinations – – – – (2) (2) (4)Transfer from inventory – – (21) – – – (21)Provided in the year (14) (22) (51) – (8) (42) (137)Disposals 6 – 154 – – 27 187 Impairments (2) (12) (4) – – – (18)Reclassifications (3) (7) – – – 10 – Transferred to assets held for sale – – 43 – – – 43
At 30 September 2011 (199) (152) (531) – (168) (330) (1,380) Foreign exchange 9 2 23 – 3 12 49 Provided in the year (16) (21) (43) – (12) (35) (127)Disposals 28 11 94 – 12 21 166 Impairments (1) – (6) – – (5) (12)Reclassifications (10) – – – (1) 11 – Transferred to assets held for sale 2 – 26 – 3 3 34
At 30 September 2012 (187) (160) (437) – (163) (323) (1,270)
Net book valueAt 1 October 2010 171 241 286 137 21 167 1,023
At 30 September 2011 185 267 198 170 27 154 1,001
At 30 September 2012 171 273 250 215 24 163 1,096
TT11 | AR 2012 | 20/12/2012 | Proof 5

Financial statements
Notes to the consolidated financial statements continued
www.tuitravelplc.com
116 TUI Travel PLC Annual Report & Accounts 2012
11. Property, plant and equipment continuedImpairment chargesOf the impairment charge in the year ended 30 September 2012 of £12m (2011: £18m), £6m relates to the impairment of one aircraft owned within the UK & Ireland operating segment, £5m relates to the impairment of motor vehicles within the Specialist & Activity Sector and £1m relates to the impairment of office lease holding improvements within the France tour operating segment.
Of the impairment charge of £18m in the year ended 30 September 2011, £12m related to the impairment of one owned ship within the UK & Ireland operating segment, the ‘Island Escape’.
Additions to aircraft and equipmentAdditions of £109m (2011: £28m) to aircraft and equipment relate to three aircraft (2011: none) purchased on finance leases during the year as well as fleet improvements and capitalised maintenance on owned aircraft.
Advance payments for future delivery of aircraftAdditions of £133m (2011: £73m) to advance payments for future delivery of aircraft were due to payments made for the future delivery of 16 aircraft (2011: 16 aircraft) and interest of £9m (2011: £7m) that has been capitalised during the year at a rate of 5.4% (2011: 5.4%).
The disposal of £80m (2011: £39m) from advance payments for future delivery of aircraft arises because of the delivery and then sale and leaseback of eight aircraft (2011: four aircraft) and the delivery and sale of two (2011: one) spare aircraft engines, one (2011: one) of which was then subject to a leaseback.
Other disclosuresOther equipment with a combined net book value as at 30 September 2012 of £163m (2011: £154m) includes £101m (2011: £112m) of fixtures and fittings, £42m (2011: £17m) of property, plant and equipment under construction and £20m (2011: £24m) of motor vehicles.
Land and buildings comprise freehold and long leasehold properties with net book values of £120m (2011: £135m) and short leasehold properties with a net book value of £51m (2011: £50m) respectively.
The net book value of assets held under finance leases and hire purchase contracts at 30 September 2012 was £224m (2011: £146m). This includes £94m (2011: £103m) of ships, yachts and motorboats, £115m (2011: £26m) of aircraft, £6m (2011: £8m) of land and buildings and £9m (2011: £9m) of other assets, mainly vehicles.
The net book value of property, plant and equipment with restrictions on title, being pledged as security for bank loans, amounted to £32m (2011: £29m).
TT11 | AR 2012 | 20/12/2012 | Proof 5

Financial statements
www.tuitravelplc.com
TUI Travel PLC Annual Report & Accounts 2012 117Financial statem
ents
12. Investment in joint ventures, associates and other investmentsThe Group’s equity investment in its joint ventures and associates is recorded in the consolidated financial statements as follows:
Share of net Share of net Total assets of assets of share of joint ventures associates net assets £m £m £m
At 1 October 2010 86 125 211 Share of (losses)/profits before amortisation, interest and tax for the year (3) 23 20 Share of interest and tax charge (4) – (4)Share of amortisation for the year – (3) (3)Additions 23 2 25 Dividends paid (2) (5) (7)
At 30 September 2011 100 142 242
Share of (losses)/profits before amortisation, interest, and tax for the year (6) 22 16 Share of interest and tax charge (3) (2) (5)Share of amortisation for the year (1) (5) (6)Additions 25 – 25Dividends paid (2) (2) (4)Reclassifications and other movements (1) (2) (3)Foreign exchange (7) – (7)
At 30 September 2012 105 153 258
The Group’s share of joint venture and associate profit after interest and tax was £5m (2011: £13m).
The principal joint ventures and associates and the proportion of voting rights are shown below:
Proportion of Country of Name of company voting rights held % Nature of business registration/incorporation
Joint venturesTravco Group Holding SAE 50.0 Incoming agency Egypt Le Passage to India Tours and Travels Private Limited 50.0 Incoming agency India Atlantica Hellas SA 50.0 Hotel operator GreeceAtlantica Hotels & Resorts Limited 49.9 Hotel operator Cyprus Togebi Holdings Limited 49.0 Tour operator Cyprus AssociatesSunwing Travel Group Inc 25.0 Tour operator CanadaTUI InfoTec GmbH 49.9 IT Services Germany
Subsequent to the year end, the Group acquired the remaining 50.1% shareholding in TUI InfoTec GmbH that it did not already own. With the exception of Sunwing Travel Group Inc, the Group’s interest is in the ordinary share capital of each joint venture and associate. In respect of Sunwing Travel Group Inc, the Group holds a 100% interest in its Class Q (non voting) and Class Y Non-Voting Common shares and 25% interest in its Class Z Special Voting shares.
TT11 | AR 2012 | 20/12/2012 | Proof 5

Financial statements
Notes to the consolidated financial statements continued
www.tuitravelplc.com
118 TUI Travel PLC Annual Report & Accounts 2012
12. Investment in joint ventures, associates and other investments continuedA summary of the Group’s share of the results of its associates and joint ventures for the year ended 30 September 2012 and share of the assets and liabilities at this date is shown below: Joint Joint ventures Associates Total ventures Associates Total 2012 2012 2012 2011 2011 2011 £m £m £m £m £m £m
Revenue 405 121 526 359 398 757 Operating costs (412) (104) (516) (360) (380) (740)
Operating (loss)/profit (7) 17 10 (1) 18 17 Net interest (payable)/receivable (2) 1 (1) (2) – (2)
(Loss)/profit before taxation (9) 18 9 (3) 18 15 Taxation (1) (3) (4) (2) – (2)
(Loss)/profit after taxation for the year (10) 15 5 (5) 18 13
Non-current assets 129 134 263 89 131 220 Current assets 111 134 245 146 123 269
Total assets 240 268 508 235 254 489
Non-current liabilities (88) (105) (193) (104) (86) (190)Current liabilities (47) (10) (57) (31) (26) (57)
Total liabilities (135) (115) (250) (135) (112) (247)
Net assets 105 153 258 100 142 242
Togebi Holdings LimitedThe Group has an agreement with S-Group Capital Management Limited (SGCM), regarding Togebi Holdings Limited, a jointly-owned investment holding company, owned 51% by SGCM and 49% by the Group. The joint venture owns four subsidiary tour operators and travel agency groups in Russia and Ukraine.
All major decisions have to be agreed by both shareholders and under IAS 31 ‘Interests in joint ventures’ the entity is therefore accounted for as a joint venture.
SGCM is owned by a significant shareholder of TUI AG and is therefore considered to be a related party. Togebi Holdings Limited and its subsidiary undertakings are therefore considered to be related parties by virtue of SGCM being the joint venturer to this investment.
Details of loan and other balances with Togebi Holdings Limited and its subsidiary undertakings are disclosed in Note 30.
Sunwing Travel Group IncThe strategic venture with Sunwing Travel Group Inc is accounted for as an associate as the Group does not control or jointly control this business.
Other investments Trade Non- and listed consolidated investments entities Total £m £m £m
At 1 October 2010 56 23 79 Additions – 1 1 Disposals (4) – (4)Investments consolidated for the first time – (1) (1)Impairment during the year – (2) (2)Change in the fair value of available for sale financial asset (1) – (1)
At 30 September 2011 51 21 72 Impairment loss (4) – (4)Foreign exchange (1) (1) (2)
At 30 September 2012 46 20 66
Trade and listed investments at 30 September 2012 represented the Group’s 14.3% (2011: 14.3%) shareholding in The Airline Group Limited (which in turn has a 42% shareholding in National Air Traffic Services Limited), a 4.4% (2011: 6.0%) shareholding in Air Berlin PLC and a 10% (2011: 10%) shareholding in Atlantica Leisure Group Limited. Further disclosure regarding the valuation of The Airline Group is provided in Note 25 (H).
The Group’s investment in Air Berlin PLC is carried at fair value, determined by reference to its equity share price at the balance sheet date. Due to the significant and prolonged decline in the equity share price of Air Berlin PLC, combined with its large operating losses and the restructuring programme it has commenced, it is considered that the investment is now impaired. In accordance with IAS 39, the diminution in value of the investment of £10m (£6m of which was previously charged to the consolidated statement of comprehensive income) has now been charged to the consolidated income statement.
Non-consolidated entities are recorded at cost and reflect the Group’s net investment held in circa 50 subsidiaries which, due to the immaterial size of their revenues, result and financial position, have not been consolidated. Balances between these entities and consolidated subsidiaries have not been eliminated.
TT11 | AR 2012 | 20/12/2012 | Proof 5

Financial statements
www.tuitravelplc.com
TUI Travel PLC Annual Report & Accounts 2012 119Financial statem
ents
13. Investments(A) Acquisitions in the year ended 30 September 2012Acquisitions were made in the year for a total investment value of £16m in order to expand business operations in line with the Group’s growth strategy. In accordance with the provisions of IFRS 3 (revised), incidental acquisition costs of £3m have been expensed within administrative expenses (and disclosed as an acquisition related expense) in the consolidated income statement in the year. These acquisitions gave rise to provisional goodwill of £8m. The one significant business acquired and its acquisition date was:
Business Description Date Country
Accommodation & Destinations SectorMala Pronta Viagens e Turismo Ltda (‘Mala Pronta‘) Online accommodation 23 September 2012 Brazil
The Group acquired 93.34% of the voting equity instruments of Mala Pronta. Other individually insignificant businesses acquired during the year include 21 European-based travel agency businesses and a further 26% of Boomerang-Reisen GmbH, in addition to the 49% previously owned.
The relative size of the acquisitions made is set out in the table below:
Total TotalConsideration Number of consideration goodwill£m acquisitions £m £m
1 – 5 3 5 45 – 10 1 8 2
Total 4 13 6Other individually insignificant businesses 21 3 2
Total 25 16 8
Excluding employment-linked contingent consideration that is charged to the consolidated income statement over the service period, the consideration paid comprised entirely of cash. The total provisional net assets acquired are set out below: Fair value of net assets acquired £m
Intangible assets 8 Property, plant and equipment 3 Trade receivables 2 Cash 3 Current liabilities (6)Non current liabilities (2)
Total 8
Total consideration 16Less net assets acquired (as above) (8)
Total goodwill 8
All acquisitions have been accounted for using the purchase method, as required by IFRS 3 (revised). Certain non-significant fair value adjustments have necessarily been prepared on a provisional basis due to the recent timing of certain acquisitions. Experience may result in revisions to fair values in the subsequent accounting period. No material amount of goodwill is expected to be deductible for tax purposes. There are no material accounting policy adjustments nor any significant differences between the book and fair values of assets and liabilities acquired. No single acquisition in the current year is considered material to goodwill.
Residual goodwillA consistent process is undertaken at each acquisition to identify the fair value of separable assets and liabilities acquired, including the fair value of intangible assets, such as brands, order books, licences, customer relationships and other intangible assets that may exist. The residual goodwill on acquisition represents the value of assets and earnings that do not form separable assets under IFRS 3 (revised) but nevertheless are expected to contribute to the future results of the Group.
Residual goodwill in respect of current year acquisitions represents principally:
• Market knowledge of, and access to the Brazilian travel market; and
• The ability to sell acquired product through existing channels and existing product through acquired channels.
TT11 | AR 2012 | 20/12/2012 | Proof 5

Financial statements
Notes to the consolidated financial statements continued
www.tuitravelplc.com
120 TUI Travel PLC Annual Report & Accounts 2012
13. Investments continuedAcquisition related expensesIFRS 3 (revised) requires consideration that is contingent on future service by the vendor to be expensed over the service period and acquisition costs to be expensed as incurred. In this respect, £3m (2011: £16m) has been expensed in the year and included in the acquisition related expenses in the consolidated income statement.
Year ended Year ended 30 September 30 September 2012 2011 £m £m
Acquisition related expenses in operating profit Amortisation of business combination intangibles 59 66Other acquisition related expenses 3 11Remuneration for post-combination services – 5
Total 62 82
Consideration payableMovements in deferred and contingent consideration in the year were as follows:
Deferred Contingent consideration consideration Loan notes Total £m £m £m £m
At 1 October 2011 4 16 1 21 Recognised in the year relating to current year acquisitions – 1 – 1 Adjustments to amounts recognised in respect of prior period acquisitions 2 (5) – (3)Cash paid (3) (7) – (10)
At 30 September 2012 3 5 1 9
Deferred and contingent consideration payable is dependent on the results of the businesses over a number of future periods and in some cases is also dependent upon the previous owners or management of those businesses remaining in employment with the Group during the earn out period.
Adjustments to amounts recognised in respect of prior year acquisitions reflects changes in the expected amounts still to pay in future years. This follows the latest assessment of the range of projections to expected earnings figures by these acquired entities, with the consideration payable being based upon a multiple of the appropriate earnings figures.
An estimate of the range of undiscounted amounts of contingent and deferred consideration payable for acquisitions in the current year and in prior years, where the consideration remains payable, is listed below. The amounts payable will be dependent on the results of the acquired businesses over the following periods:
Basis of calculation Financial year Period for calculation Range of considerationAcquisition of consideration of acquisition of consideration payable £m
Lima Tours S.A.C. Earnings and employment 2011 Up to 30 June 2014 1-4Mala Pronta Earnings and employment 2012 Up to 31 March 2014 0-1Other individually insignificant Earnings (alone) and considerations payable earnings & employment 2008-2012 Up to 31 March 2014 0-6
Total of range of contingent consideration payable in respect of current and prior year acquisitions 1-11
The expected contingent consideration for all acquisitions above is calculated using multiples of underlying earnings, with some amounts payable dependent upon employment. There have been no material changes to the amounts recognised in respect of previous years’ acquisitions during the current year.
(B) Cash flows arising in respect of acquisitionsTotal cash flows relating to acquisitions in the year, including amounts paid in respect of deferred and contingent consideration arising on prior period acquisitions, are as follows: Cash paid 2012 £m
Acquisitions in the current year (excluding acquisition related expenses) 16 Cash acquired with acquisitions (3)
Net cash outflow in the year relating to current year acquisitions 13 Cash paid relating to prior period acquisitions 10
Net cash outflow in the year relating to acquisitions 23 Acquisition related expenses charged to the income statement 3
Total cash outflows in the year relating to acquisitions 26
TT11 | AR 2012 | 20/12/2012 | Proof 5

Financial statements
www.tuitravelplc.com
TUI Travel PLC Annual Report & Accounts 2012 121Financial statem
ents
(C) Consolidated income statementIf the results of the acquired businesses had been included in these consolidated financial statements from 1 October 2011 until each of their respective acquisition dates, the Group‘s revenue would have been approximately £5m higher. There would have been no significant impact on the Group’s result after adjusting for amortisation of business combination intangibles had those intangible assets been recognised since 1 October 2011.
As the more significant acquisitions were at the end of the Group’s financial year, the acquired businesses have had no material impact on the Group’s revenue or profit figures (including amortisation of business combination intangibles).
(D) Acquisitions post balance sheet dateSubsequent to 30 September 2012, the Group acquired the remaining 50.1% of TUI InfoTec GmbH that it did not previously own. The accounting for this acquisition has not yet been finalised but is not considered material to the Group.
(E) Prior period revisions to fair valuesIn the year ended 30 September 2011, the Group acquired various businesses for a total consideration of £69m. The finalisation of the acquisition balance sheets for these businesses has not led to a material adjustment to goodwill presented in the 2011 accounts and therefore there is no restatement of the results for the year ended 30 September 2011, or balance sheet as at 30 September 2011 in respect of these finalisations.
(F) Gains and losses in subsequent periodsThe Group has impaired the goodwill and brand of Caradonna Dive Adventures by £5m and £1m respectively and the goodwill and brand of Pinnacle Tours by £4m and £1m respectively. In the comparative year, the Group impaired the brand of Island Escape by £5m and the customer list of Explorers Travel by £1m.
14. Deferred tax assets and liabilities Assets Liabilities Net Year ended Year ended Year ended Year ended Year ended Year ended 30 September 30 September 30 September 30 September 30 September 30 September 2012 2011 2012 2011 2012 2011 £m £m £m £m £m £m
Intangible assets 7 21 (147) (93) (140) (72)Finance lease transactions – – (2) (2) (2) (2)Property, plant and equipment 77 85 (38) (40) 39 45 Financial instruments and foreign exchange 19 – (14) (16) 5 (16)Employee benefits 105 88 – – 105 88 Other short term temporary differences 215 161 (200) (218) 15 (57)Tax value of losses carried forward 74 81 – – 74 81
Total 497 436 (401) (369) 96 67 Set off of deferred tax within the same jurisdiction (372) (298) 372 298 – –
Net deferred tax assets/(liabilities) 125 138 (29) (71) 96 67
The Group has recognised deferred tax assets relating to tax losses in individual tax jurisdictions based on forecast future taxable profits.
The deferred tax balance associated with the pension deficit has been adjusted to reflect the current tax benefit obtained in the current year following the contribution in the previous year of the First Choice and Thomson brands into the Pension Schemes, as explained in Note 6(C).
Unrecognised deferred tax assetsDeferred tax assets have not been recognised in respect of the following items (reported at the applicable tax rate): 30 September 30 September 2012 2011 £m £m
Capital losses 2 3Other losses 259 233
Total losses 261 236
TT11 | AR 2012 | 20/12/2012 | Proof 5

Financial statements
Notes to the consolidated financial statements continued
www.tuitravelplc.com
122 TUI Travel PLC Annual Report & Accounts 2012
14. Deferred tax assets and liabilities continuedThese assets have not been recognised principally because the Directors are not certain of the timing of any benefits that might arise in the future. Other losses includes £12m which are subject to a 4 year expiry period. The balance of losses are not subject to time expiry and are available for utilisation against profits arising in future periods in the territories in which they have arisen. There are no other unprovided deferred tax liabilities nor unrecognised deferred tax assets.
Movements in deferred taxation during the current year: Recognised Charged in the outside of the Balance at consolidated consolidated Balance at 1 October Arising on Extinguished income income Foreign 30 September 2011 acquisition on disposal Reclassification statement statement exchange 2012 £m £m £m £m £m £m £m £m
Intangible assets (72) – – (72) (2) – 6 (140)Finance lease transactions (2) – – – – – – (2)Property, plant and equipment 45 – – – (8) 2 39 Financial instruments and foreign exchange (16) – 4 – – 15 2 5 Employee benefits 88 – – – (14) 32 (1) 105 Other short term temporary differences (57) (1) – 72 (8) 3 6 15 Tax value of losses carried forward 81 – – – (4) – (3) 74
Total 67 (1) 4 – (36) 50 12 96
A provision against the recoverability of an intangible deferred tax asset of £72m has been reclassified from other short term temporary differences to intangible assets to better reflect the category that is represented by the underlying asset.
Movements in deferred taxation during the prior year are analysed as follows:
Recognised/ (Charged)/ (charged) recognised in the outside of the Balance at consolidated consolidated Balance at 1 October Arising on Extinguished income income Foreign 30 September 2010 acquisition on disposal statement statement exchange 2011 £m £m £m £m £m £m £m
Intangible assets (149) 3 (3) (21) 107 (9) (72)Finance lease transactions (32) – – 29 – 1 (2)Property, plant and equipment 50 – – (5) (1) 1 45Financial instruments and foreign exchange (5) – (2) 12 (20) (1) (16)Employee benefits 126 1 (2) (34) (3) – 88Other short term temporary differences 9 1 3 39 (110) 1 (57)Tax value of losses carried forward 87 – – (6) – – 81
Total 86 5 (4) 14 (27) (7) 67
Intangible asset temporary differences arise in respect of assets recognised on acquisition. Property, plant and equipment temporary differences principally relate to tax depreciation in the UK, France and Germany. Employee benefits temporary differences arise in respect of defined benefit pension scheme liabilities and future deductions available on the vesting of employee awards. Financial instruments and foreign exchange temporary differences arise in respect of financial instruments accounted for under IAS 39 and principally reflect the fair value at 30 September 2012 of cash flow hedging derivatives that will be settled against future transactions. Other short term temporary differences relate to operating expenses and related accruals and provisions for which a tax deduction has not yet been recognised.
15. Inventories 30 September 30 September 2012 2011 £m £m
Marine inventories 28 31Airline spares and operating equipment 19 24Other operating inventories 14 14
Total 61 69
Included within cost of sales in the year is a write-down of inventories by £7m (2011: £1m) to net realisable value.
TT11 | AR 2012 | 20/12/2012 | Proof 5

Financial statements
www.tuitravelplc.com
TUI Travel PLC Annual Report & Accounts 2012 123Financial statem
ents
16. Trade and other receivables 30 September 2012 30 September 2011 Non- Non- Current current Total Current current Total assets assets assets assets assets assets £m £m £m £m £m £m
Trade receivables, gross 548 – 548 568 – 568 Less: provision for impairment (49) – (49) (58) – (58)
499 – 499 510 – 510 Amounts owed by related parties (Note 30) 52 34 86 48 – 48 Interest bearing other receivables – 12 12 – 13 13 Other receivables 196 56 252 241 42 283
747 102 849 799 55 854 Prepayments 565 123 688 673 147 820
Total 1,312 225 1,537 1,472 202 1,674
Other receivables include aircraft related receivables, lease and security deposits, derivative settlement receivables and various end of season rebates due from suppliers.
The maximum exposure to credit risk for financial assets, as defined in Note 1(E)(i), which are included within trade and other receivables by geographic region was: 30 September 30 September 2012 2011 £m £m
United Kingdom 191 199Germany 111 95France 91 67Other European countries 216 213Rest of the World 101 119
Total 710 693
Trade receivables are disclosed net of provisions for bad and doubtful debts, an analysis of which is shown below: 30 September 30 September 2012 2011 £m £m
Balance at the beginning of the year 58 55Foreign exchange – (1)Charge to the consolidated income statement 9 25Utilisation of provision (18) (21)
Total 49 58
The ageing of the financial assets included within trade and other receivables at the balance sheet date was:
30 September 2012 30 September 2011 Gross Provision Net Gross Provision Net £m £m £m £m £m £m
Not overdue 482 (5) 477 481 (3) 478Overdue 1-30 days 136 (1) 135 143 (3) 140Overdue 31-90 days 65 (6) 59 64 (2) 62Overdue 91-180 days 17 (6) 11 16 (4) 12Overdue more than 180 days 59 (31) 28 47 (46) 1
Total 759 (49) 710 751 (58) 693
No individually material bad debt provision movements or charges have been recorded in the year. Based on past experience and the post balance sheet period to the date of approval of these consolidated financial statements, the Group considers that the provision allowance recorded is adequate. Within the provision there are no individually material amounts held. Trade receivables not overdue and not impaired include amounts due from travel agencies, tour operators and hoteliers in respect of Mainstream, Specialist & Activity and Accommodation & Destinations Sectors. Provisions for doubtful debts in respect of trade receivable balances are managed by each underlying business unit where the debts arise and are based on local management experience. Factors considered include the age of the receivable, previous experience with the counterparty and the economic environment in which the counterparty is located.
TT11 | AR 2012 | 20/12/2012 | Proof 5

Financial statements
Notes to the consolidated financial statements continued
www.tuitravelplc.com
124 TUI Travel PLC Annual Report & Accounts 2012
16. Trade and other receivables continuedCredit exposure to individual passengers booking holidays directly is limited as full payment is required before the issue of tickets and holiday departure. In the case of travel services sold by third party agents, the credit risk depends on the creditworthiness of those third parties, but this risk is also limited because of the relatively short period of credit. The Directors do not consider there to be significant concentration of credit risk relating to trade and other receivables.
The provision against overdue receivables of £44m (2011: £55m) relates to gross receivables of £78m (2011: £77m).
There are £199m of receivables that are overdue and not impaired at 30 September 2012 (2011: £193m).
Amounts owed by related parties are disclosed further in Note 30.
17. Cash and cash equivalents(A) Cash and cash equivalents 30 September 30 September 2012 2011 £m £m
Cash in hand 21 20Cash at bank 265 267Deposits 544 615
Cash and cash equivalents 830 902
Cash and cash equivalents includes £34m (2011: £46m) that is not available for immediate use by the Group. This is made up of monies held to meet regulatory requirements, together with cash balances on short term deposits, held on a restricted basis by the Group’s captive insurance funds as part of their ongoing operations.
(B) Other investmentsOther current investments disclosed in the consolidated balance sheet comprise of £17m deposit balances (2011: £20m) held to meet regulatory requirements with a term exceeding three months and £2m (2011: £2m) of other deposits with a maturity in excess of three months.
18. Assets classified as held for sale 30 September 30 September 2012 2011 £m £m
Yachts and motor boats 1 –Land and buildings – 1Aircraft 5 7Other 7 5
Net assets classified as held for sale 13 13
Assets held for sale are expected to be sold within 12 months. Further disclosure of assets being classified as held for sale within the year is included in Notes 4 and 10.
19. Interest-bearing loans and borrowings 30 September 30 September 2012 2011 £m £m
Current liabilitiesAmounts owed to related parties – 26Bank loans 6 11Loan notes – 1Finance leases (and hire purchase contracts) 23 19Other financial liabilities 41 39
Total 70 96
Other financial liabilities mainly comprise the fair value of two put options written by the Group to the sole remaining non-controlling interest shareholder in L’TUR Tourismus AG that may require the Group to purchase the non-controlling interest shareholding totalling 30%. The first put option over 20% of the shares may be exercised at any time until 2015. A second put option written by the Group to the same non-controlling interest shareholder for the remaining 10% shareholding has no time limit. Details of the fair value of these options are included in Note 25(H).
TT11 | AR 2012 | 20/12/2012 | Proof 5

Financial statements
www.tuitravelplc.com
TUI Travel PLC Annual Report & Accounts 2012 125Financial statem
ents
Fair value changes in the put option liability are included within financial expenses or financial income.
30 September 30 September 2012 2011 £m £m
Non-current liabilitiesAmounts owed to related parties 10 10Bank loans 17 19Loan notes 1 –Finance leases (and hire purchase contracts) 163 113Convertible bonds 675 654Other financial liabilities 2 6
Total 868 802
The bank loans and loan notes are repayable:
30 September 30 September 2012 2011 £m £m
Within one year 6 12Between one and five years 18 19
Total 24 31
Certain loans are secured on the underlying assets of the company in whose name the borrowings are made, including all finance leases which are secured against their respective underlying assets.
Details of amounts owed to related parties are included in Note 30.
Finance lease liabilities relate primarily to the leasing of aircraft, boats and cruise ships. Group obligations under finance leases and hire purchase contracts are payable as follows:
Minimum lease payments 30 September 30 September Principal Interest 2012 Principal Interest 2011 £m £m £m £m £m £m
In respect of aircraft, yachts and equipment payable within:One year 23 6 29 19 5 24One to five years 66 25 91 71 13 84After five years 97 16 113 42 14 56
Total 186 47 233 132 32 164
Convertible bonds 30 September 30 September 2012 2011 £m £m
£350m convertible bond 6.0% October 2014 326 315£400m convertible bond 4.9% April 2017 349 339
Total 675 654
The Group has two convertible bonds in issue, details of which are as follows:
• A £350m fixed rate 6% bond was issued in October 2009 raising £341m net of issue costs. The bond is convertible at the option of the holder, before or upon maturity in October 2014. Conversion into ordinary shares will occur at a premium of 33% to the Group’s share price on the date of issuance.
• A £400m fixed rate 4.9% bond was issued in April 2010 raising £391m net of issue costs. The bond is convertible at the option of the holder, before or upon maturity in April 2017. Conversion into ordinary shares will occur at a premium of 33% to the Group’s share price on the date of issuance.
The Group holds an Issuer call option to redeem the convertible bonds at their principal amounts, together with accrued interest, upon fulfilment of certain pre-determined criteria. The fair value of this option was negligible at 30 September 2012. The equity portion of the bonds of £114m (2011: £114m), gross of deferred tax of £26m (2011: £29m), is included in the convertible bond reserve.
TT11 | AR 2012 | 20/12/2012 | Proof 5

Financial statements
Notes to the consolidated financial statements continued
www.tuitravelplc.com
126 TUI Travel PLC Annual Report & Accounts 2012
19. Interest-bearing loans and borrowings continuedReconciliation of face value to carrying amount £350m £400m Total convertible convertible convertible bond bond bonds £m £m £m
Convertible bond – face value 350 400 750Issue cost (9) (9) (18)
Cash received 341 391 732Equity portion (48) (66) (114)Interest accretion in prior years 18 13 31Issue costs amortised in prior years 4 1 5
Carrying amount at 30 September 2011 315 339 654Interest accretion 9 9 18Amortisation of issue costs 2 1 3
Carrying amount at 30 September 2012 326 349 675
20. Current trade and other payables 30 September 30 September 2012 2011 £m £m
Trade payables 1,058 1,360Deferred and contingent consideration (Note 13(A)) 4 10Other payables 105 140Amounts owed to related parties (Note 30) 94 99Other taxes and social security costs 98 87Accruals and deferred income 1,521 1,222Client money received in advance 1,669 1,704
Total 4,549 4,622
Further disclosure of amounts owed to related parties is included in Note 30.
21. Provisions for liabilities Aircraft maintenance Restructuring Other Total £m £m £m £m
At 1 October 2011 435 60 175 670 Provided in the year 149 51 62 262 Released in the year (28) (15) (12) (55)Unwinding of discounted amount (Note 5) 6 – 2 8 Costs incurred (149) (27) (63) (239)Foreign exchange (15) (6) (9) (30)
At 30 September 2012 398 63 155 616
Analysed as:Non-current 235 2 79 316 Current 163 61 76 300
398 63 155 616
At 30 September 2011
Analysed as:Non-current 263 29 61 353 Current 172 31 114 317
435 60 175 670
TT11 | AR 2012 | 20/12/2012 | Proof 5

Financial statements
www.tuitravelplc.com
TUI Travel PLC Annual Report & Accounts 2012 127Financial statem
ents
Aircraft maintenanceIn respect of aircraft, provision is made for maintenance, overhaul and repair costs of operating leased airframes, engines and certain other components based on the anticipated external costs of the next maintenance event calculated by reference to costs experienced and published manufacturers’ data. The charge to the consolidated income statement is calculated by reference to the number of hours and cycles flown and by reference to the length of the full overhaul cycle. Costs incurred are charged against the provision. Neither the timing nor the value of the expenditure can be precisely determined but they can be averaged over time and over the number of aircraft in the fleet.
During the year the Group reviewed the estimates for aircraft maintenance to ensure consistency of application of the latest estimates across the Group. The impact has, due to its size, been presented in separately disclosed items (Note 4).
RestructuringRestructuring, which includes severance payments, relates to provisions arising as a result of reorganisation and restructuring plans that are irrevocably committed. Further details of restructuring projects in the current year are set out in Note 4.
The provision is expected to be utilised within 18 months of the balance sheet date.
OtherOther provisions relate to litigation (including provisions for contingent liabilities recorded on the merger of First Choice), obligations under denied boarding compensation requirements, onerous lease contracts that have been entered into in the ordinary course of business and other future obligations, the amount or timing of which is uncertain. A significant portion of the provision is anticipated to be utilised within 12 months of the balance sheet date, while the remainder is expected to be utilised within one to four years of the balance sheet date, although the timing and payments related to individual litigation claims are estimated and are inherently uncertain.
The Group has a policy to mitigate the financial risk of litigation and disaster through insurance with third party providers and the use of captive insurance companies. The Group’s exposure to risk is capped by single event and aggregate limits, with insurance in place for exposures above these limits.
The Group provides for outstanding claims, including settlement expenses, using a consistent methodology based upon historical claims patterns, average claims amounts, external legal advice and future expectations.
22. Non-current trade and other payables 30 September 30 September 2012 2011 £m £m
Deferred and contingent consideration (Note 13(A)) 4 10Other payables 28 13Amounts owed to related parties 1 –Accruals and deferred income 13 33Client money received in advance 2 –
Total 48 56
23. Called up share capital 30 September 30 September 2012 2011 £m £m
Issued and fully paid1,118,010,670 (2011: 1,118,010,670) ordinary shares of 10p each 112 112
Total 112 112
As described more fully in Note 35, the ultimate parent company, TUI AG, is the beneficial owner of 56.26% (2011: 55.47%) of the Company’s issued ordinary share capital as at 30 September 2012.
At 30 September 2012, 9,545,591 shares (2011: 12,700,211 shares) were held by the Group’s Employee Benefit Trust. Based on 30 September 2012 share price of £2.34 (2011: £1.49) the value of shares held was £22,336,683 (2011: £18,961,415).
During the year ended 30 September 2012, the Group’s Employee Benefit Trust did not acquire any shares. In the year ended 30 September 2011, the Group’s Employee Benefit Trust acquired 3m shares at market value for consideration of £7m.
Details of dividends debited to equity in the year are set out in Note 9.
Whilst the Company has the authority to purchase its own shares, it has not done so in either the current or prior years.
TT11 | AR 2012 | 20/12/2012 | Proof 5

Financial statements
Notes to the consolidated financial statements continued
www.tuitravelplc.com
128 TUI Travel PLC Annual Report & Accounts 2012
24. Capital and reserves Other reserves Convertible Equity Non- Called up bond Merger Translation Hedging Accumulated holders controlling Total share capital reserve reserve reserve reserve losses of parent interests equity Note £m £m £m £m £m £m £m £m £m
Balance at 1 October 2010 112 83 2,521 292 (19) (1,014) 1,975 1 1,976
Profit for the year – – – – – 85 85 2 87 Other comprehensive (loss)/ income for the year Foreign exchange translation – – – (3) (3) (15) (21) 3 (18)Actuarial losses 6(C) – – – – – (89) (89) – (89)Tax on actuarial losses 8(iii) – – – – – (7) (7) – (7)Cash flow hedges:– movement in fair value 25(J) – – – – 85 – 85 – 85 – amounts recycled to the
consolidated income statement 25(J) – – – – (4) – (4) – (4)Tax on cash flow hedges 8(iii) – – – – (22) – (22) – (22)Available for sale financial assets: – movement in fair value – – – – – (2) (2) – (2)– amounts recycled to the consolidated
income statement – – – – – 1 1 – 1
Other comprehensive (loss)/ income for the year – – – (3) 56 (112) (59) 3 (56)
Total comprehensive (loss)/ income for the year – – – (3) 56 (27) 26 5 31
Transactions with owners Share-based payment – charge for the year – – – – – 19 19 – 19 Acquisition of shares by Employee Benefit Trust – – – – – (7) (7) – (7)Dividends 9 – – – – – (122) (122) (2) (124)Capital increase in Magic Life – – 2 – – – 2 – 2 Disposals to non-controlling interest – – – (3) – (4) (7) 46 39 Change in deferred tax rate on equity portion of convertible bond – 2 – – – – 2 – 2
At 30 September 2011 112 85 2,523 286 37 (1,155) 1,888 50 1,938
TT11 | AR 2012 | 20/12/2012 | Proof 5

Financial statements
www.tuitravelplc.com
TUI Travel PLC Annual Report & Accounts 2012 129Financial statem
ents
Other reserves Convertible Equity Non- Called up bond Merger Translation Hedging Accumulated holders controlling Total share capital reserve reserve reserve reserve losses of parent interests equity Note £m £m £m £m £m £m £m £m £m
Balance at 1 October 2011 112 85 2,523 286 37 (1,155) 1,888 50 1,938
Profit for the year – – – – 138 138 (1) 137 Other comprehensive (loss)/ income for the year Foreign exchange translation – – – (157) (5) 4 (158) (2) (160)Actuarial losses 6(C) – – – – – (172) (172) – (172)Tax on actuarial losses 8(iii) – – – – – 32 32 – 32 Cash flow hedges:– movement in fair value 25(J) – – – – (42) – (42) – (42)– amounts recycled to the
consolidated income statement 25(J) – – – – (30) – (30) – (30)Tax on cash flow hedges 8(iii) – – – – 15 – 15 – 15 Available for sale financial assets: – movement in fair value 12 – – – – – (4) (4) – (4)– amounts recycled to the
consolidated income statement 12 – – – – – 10 10 – 10
Other comprehensive loss for the year – – – (157) (62) (130) (349) (2) (351)
Total comprehensive (loss)/ income for the year – – – (157) (62) 8 (211) (3) (214)
Transactions with owners Share-based payment – charge for the year – – – – – 16 16 – 16 Share-based payment – disposal on award of shares – – – – – (5) (5) – (5)Dividends 9 – – – – – (125) (125) (3) (128)Acquisition of non-controlling interest – – – – – (1) (1) – (1)Change in deferred tax rate on equity portion of convertible bond – 3 – – – – 3 – 3
At 30 September 2012 112 88 2,523 129 (25) (1,262) 1,565 44 1,609
Convertible bond reserveThe convertible bond reserve comprises the equity element of the convertible bonds and the related portion of the bonds’ issue costs (see Note 19). The equity element is calculated in accordance with the accounting policy described in Note 1(E)(ii) and is presented net of deferred tax.
Other reservesDetails of dividends to equity holders of the parent debited to equity in the year are set out in Note 9.
Exchange gains or losses arising on the translation to the Group’s reporting currency are recorded in the translation reserve. The hedging reserve records the portion of the cumulative gains or losses on hedging instruments in cash flow hedges that are determined as effective. Gains or losses arising on cash flow hedges are initially recorded in the hedge reserve and are recycled to the consolidated income statement in accordance with the accounting policy in Note 1(F).
The Group also has a capital reserve of £0.1m at 30 September 2012 (2011: £0.1m). The capital reserve is non-distributable.
TT11 | AR 2012 | 20/12/2012 | Proof 5

Financial statements
Notes to the consolidated financial statements continued
www.tuitravelplc.com
130 TUI Travel PLC Annual Report & Accounts 2012
25. Financial instruments(A) Treasury risk overviewThe Group is exposed to a variety of financial risks:
• Market risk (in respect of foreign currency rate risk, jet fuel price risk and interest rate risk);
• Liquidity risk (in respect of the Group’s ability to meet its liabilities);
• Credit risk (in respect of recovery of amounts owing to the Group); and
• Capital risk (in respect of its capital structure and cost of capital).
The Group’s key financial market risks are in relation to foreign currency rates and jet fuel prices. Currency risk results from the substantial cross-border element of the Group’s trading and arises on sales, purchases and borrowings that are denominated in a currency other than the functional currencies of individual Group businesses. The risk is managed by the use of foreign exchange forward, swap and option contracts. The Group’s exposure to jet fuel prices results from the aircraft fleet operations and is managed using commodity swaps and options.
The Group is exposed to interest rate risk that arises principally from the Group’s floating rate aircraft leases and floating rate bank loans and cash balances. Certain finance leases and loans have fixed interest rates.
Credit risk and liquidity risk are considered in Notes 25(D) and 25(F) respectively. Capital management, including capital risk and cash conversion, is considered in Notes 26(B) and 33.
The Board of Directors has overall responsibility for the establishment and oversight of the Group’s risk management framework and for ensuring that the Group has adequate policies, procedures and controls to successfully manage the financial risks that it faces. These form part of the Group’s overall Risk Management Framework (the framework).
Incorporated within the framework’s terms of reference are the determination of all treasury policies and the monitoring of the effectiveness of those policies. Group Treasury implements the agreed policies on a day-to-day basis. The procedures also stipulate the levels of authority applied to approving and to dealing the types of hedging financial instrument used to manage these exposures. Transactions are only undertaken to hedge underlying exposures. Financial instruments are not traded, nor are speculative positions taken.
The treasury position of the Group, including liquidity, foreign exchange and fuel hedging exposure, is managed centrally in accordance with policies appropriate to cover specific risks faced by each business unit and is the responsibility of the Chief Financial Officer and Group Treasurer.
Group Treasury conducts regular reviews of financial risks with business unit management teams and receives regular cash flows and, where relevant, jet fuel usage forecasts from each business unit to ensure hedging instruments match the currency or fuel requirements of each operating business. Reports and forecasts for the Group, showing hedging instruments and forecast requirements, are submitted monthly to the GMB and to each Board meeting of TUI Travel PLC.
In line with its established policy, the Group has monitored throughout the year its counterparty exposure with individual financial institutions. Such counterparty risk can arise by way of cash deposited or derivative instruments traded.
(B) Currency risk managementThe Group is exposed to currency risk on sales, purchases and borrowings that are denominated in a currency other than the functional currencies of individual Group businesses (which are principally Sterling, US Dollar, Euro and Swedish Krona).
The Group hedges its foreign currency exposures on a seasonal basis, that is Winter and Summer, with each season comprising a six-month period. At the start of a season the Group will have hedged substantially all of its foreign currency exposure (forecast sales and purchases and related assets and liabilities) for that season, using predominantly forward exchange contracts and option based instruments, most with a maturity of less than one year from the reporting date.
In respect of other monetary assets and liabilities denominated in foreign currencies, the Group ensures that its net exposure is kept to an acceptable level, principally by using forward contracts in respect of non-Sterling denominated airline maintenance provision balances, loan balances and deposits.
The Group publishes its consolidated financial statements in Sterling and, as a result, it is also subject to foreign currency exchange translation risk in respect of the translation of the results and underlying net assets of its foreign operations into Sterling.
The following significant exchange rates to the Group’s Sterling presentation currency (excluding the impact of hedged transactions) are illustrative of the rates applied during the current and prior year:
Average rate Mid-spot rate Year ended Year ended 30 September 30 September 30 September 30 September£1 GBP equivalent 2012 2011 2012 2011
US Dollar 1.589 1.573 1.620 1.558Euro 1.203 1.158 1.253 1.154Swedish Krona 10.635 10.657 10.588 10.683
As at 30 September 2012, the Group has hedged forecast transactions for $4.1bn (2011: $3.9bn) and €1.8bn (2011: €1.6bn) for periods up until Winter 2014 principally relating to Winter 2012 and Summer 2013.
TT11 | AR 2012 | 20/12/2012 | Proof 5

Financial statements
www.tuitravelplc.com
TUI Travel PLC Annual Report & Accounts 2012 131Financial statem
ents
25. Financial instruments continued(C) Commodity riskFuel commodity risk arises from the Group’s operation of aircraft.
The Group hedges its fuel commodity exposures on a seasonal basis, being Winter and Summer with each season comprising a six-month period. At the start of a season the Group will have hedged substantially all of its fuel commodity exposure for that season, using predominantly commodity swaps or options, most with a maturity of less than one year from the reporting date.
As at 30 September 2012, the Group has hedged transactions for fuel of 2.0m metric tonnes (2011: 1.8m metric tonnes) for periods up until Winter 2013.
Details of fuel forward derivative instruments are set out in Note 25(I).
(D) Credit riskCredit risk refers to the risk that a counterparty will default on its contractual obligations resulting in financial loss to the Group. Credit risk arises from cash balances (including bank deposits and cash and cash equivalents) and derivative financial instruments, as well as credit exposures to customers, including outstanding receivables, financial guarantees and committed transactions. Credit risk is managed separately for treasury and operating related credit exposures.
The Group minimises its financial credit risk through the application of risk management policies approved and monitored by the Board. While counterparties are limited to major banks and financial institutions, Group policy ensures that individual counterparty limits are adhered to and that there are no significant concentrations of credit risk. The Group monitors the credit ratings of its counterparties (where applicable) as part of its ongoing assessment of its credit exposure. Financial instruments are only transacted with major financial institutions with strong credit rating of A1/P1.
Loans and other receivables exposures are managed locally in the operating units where they arise and credit limits are set as deemed appropriate for the customer. There is no material concentration of credit risk with respect to trade and other receivables as the Group has a large number of internationally dispersed customers.
The carrying amount of financial assets represents the maximum credit exposure. The maximum exposure to credit risk at the balance sheet date was:
Carrying value Carrying value 30 September 30 September 2012 2011 £m £m
Trade and other receivables (Note 16) 710 693Cash and cash equivalents (Note 17(A)) 830 902Derivatives – contracts used for hedging (Note 25(I)) 119 215Trade and listed investments (Note 12) 46 51Other investments (Note 17(B)) 19 22
Total 1,724 1,883
The maximum exposure to credit risk for total trade and other receivables at the balance sheet date and by geographic region as well as their ageing is disclosed in Note 16. Trade and other receivables are shown net of provision for bad and doubtful debts of £49m (2011: £58m).
Cash, cash equivalents and other investments principally comprise money market deposits and other short term investments. The investments are with counterparties with a strong credit rating of A1/P1. At 30 September 2012, approximately 27% (2011: 31%) of the Group’s unrestricted cash and cash equivalents were invested with counterparties based in the United Kingdom, and 53% (2011: 53%) were based with counterparties based in the Republic of Ireland.
Trade and other receivables exclude prepaid accommodation and other prepayments which do not meet the definition of a financial instrument. Prepayments for hotel accommodation, whilst not meeting the definition of a financial asset under IAS 39, give rise to a risk similar to credit risk due to the inherent risk of the Group not recovering the prepayment through full delivery of the related goods and services. From time to time prepayments can concentrate risk with specific counterparties which are based overseas. The carrying amount of prepayments (which are presented within current and non-current assets) forms the maximum credit exposure, before taking into account any security or collateral held by the Group. Where appropriate, the Group obtains security collateral over the related accommodation property to mitigate credit risk. At 30 September 2012, prepaid accommodation which is recoverable after more than one year was £122m (2011: £140m).
TT11 | AR 2012 | 20/12/2012 | Proof 5

Financial statements
Notes to the consolidated financial statements continued
www.tuitravelplc.com
132 TUI Travel PLC Annual Report & Accounts 2012
25. Financial instruments continued(E) Interest rate riskThe Group has exposure to interest rate risk arising principally on Sterling, US Dollar, and Euro floating interest rates that are attached to the Group’s floating rate aircraft leases and floating rate bank loans and cash balances.
The Group does not account for any fixed rate financial liabilities at fair value through profit and loss.
The Group’s loans and borrowings are measured at amortised cost with the exception of the other financial liabilities which are carried at fair value as follows:
Carrying Carrying amount amount 30 September 30 September Nominal 2012 2011 Financial instrument Currency interest rate Year of maturity £m £m
Convertible bonds (Note 19) Sterling 4.9% – 6.0% 2014 – 2017 675 654Shareholder loan EUR 4.3% 2012 – 26Secured bank loans Sterling 2.0% – 3.2% 2013 – 2018 18 14 EUR 5.0% – 5.8% 2012 – 2017 2 2 USD 2012 – 1Unsecured bank loans EUR 1.4% – 7.0% 2012 – 2016 3 11 USD 2012 – 2 23 30Finance leases EUR 1.0% – 8.4% 2012 – 2046 80 100 USD 4.5% – 9.0% 2012 – 2022 101 29 MAD 5.9% – 6.5% 2014 – 2017 2 2 AUD 7.2% – 11.8% 2012 – 2015 3 1 186 132
Loan notes USD 6.5% – 6.6% 2016 1 1
Amounts owed to related parties USD 5.9% 2016 10 10
Other financial liabilities EUR 0% – 5.0% 2012 – 2014 43 45
Total interest-bearing liabilities 938 898
Analysed between:Fixed rate instruments 817 714Variable rate instruments 121 184 938 898
(F) Liquidity riskLiquidity risk is the risk that the Group will not be able to meet its financial obligations as they fall due. The Group’s approach is to ensure that it will have sufficient liquidity to meet its liabilities when due, under both normal and stressed circumstances.
The Group’s liquidity peaks in July and August, during the European summer holiday season, with the liquidity low point being in December and January. To manage the liquidity position the Group is able to draw cash advances under its existing bank facilities which, at 30 September 2012, principally comprised the following main sources of long term debt funding:
• The external bank revolving syndicated credit facilities totalling £970m (2011: £970m) plus bonding and letter of credit facilities totalling £185m (2011: £185m) which all mature in June 2015. From these facilities, £162m has been utilised for letter of credit purposes at 30 September 2012 (2011: £111m);
• A £350m convertible bond (due October 2014) issued in October 2009; and
• A £400m convertible bond (due April 2017) issued in April 2010.
The external bank revolving credit facility is used to manage the seasonality of the Group’s cash flows and liquidity. Cash positions, liquidity and available facility headroom are monitored daily by the Group Treasury Department.
The Board remains satisfied with the Group’s funding and liquidity position. Fixed charges cover and the ratio of net debt to EBITDA, which the Board believes to be the most useful measures of cash generation and gearing, as well as being the main basis for covenants in the external credit facilities, were met at the year end and throughout the year. Fixed charges cover is defined as earnings before interest, tax, depreciation, amortisation and operating lease rentals charge (EBITDAR) divided by net interest plus operating lease rentals. EBITDA is defined as earnings before interest, tax, depreciation and amortisation. Both covenants are measured on an ‘underlying basis’ as defined in Note 1(B)(ii).
In respect of the delivery of new aircraft, the Group’s established strategy is to refinance new aircraft in advance of their delivery dates and therefore the Group does not forecast to use internal cash resources for new aircraft purchases. Details of aircraft purchase commitments at the year end are given in Note 28.
TT11 | AR 2012 | 20/12/2012 | Proof 5

Financial statements
www.tuitravelplc.com
TUI Travel PLC Annual Report & Accounts 2012 133Financial statem
ents
The following are the undiscounted contractual cash flows of financial liabilities, including interest payments calculated using interest rates in force at each balance sheet date:
Between Between Carrying Contractual Within one and two and More than amount cash flows one year two years five years five years30 September 2012 £m £m £m £m £m £m
Non-derivative financial liabilitiesConvertible bonds 675 901 41 41 819 –Secured bank loans 20 21 4 12 5 –Unsecured bank loans 3 4 – 4 – –Finance leases 186 233 29 23 68 113Loan notes 1 1 – – 1 –Related parties 10 11 – – 11 –Other financial liabilities 43 44 44 – – –Trade and other payables 2,618 2,618 2,581 37 – –Derivative financial liabilitiesContracts used for hedging 145 138 125 13 – –
Total 3,701 3,971 2,824 130 904 113
Between Between Carrying Contractual Within one and two and More than amount cash flows one year two years five years five years30 September 2011 £m £m £m £m £m £m
Non-derivative financial liabilitiesConvertible bonds 654 941 41 41 440 419Shareholder loan 26 27 27 – – –Secured bank loans 17 18 3 3 12 –Unsecured bank loans 13 14 8 3 3 –Finance leases 132 164 24 26 58 56Loan notes 1 1 1 – – –Related parties 10 11 – – 11 –Other financial liabilities 47 48 48 – – –Trade and other payables 2,191 2,191 2,178 13 – –Derivative financial liabilitiesContracts used for hedging 151 127 116 11 – –
Total 3,242 3,542 2,446 97 524 475
The actual repayment of revolving credit facilities will vary. The timing reflected in the tables is based on the first date that the Group can be required to settle the liability.
Trade and other payables exclude customers’ monies received in advance, deferred income, contingent consideration and other non-contractual payables.
At 30 September 2012, the Group had available undrawn committed borrowing facilities of £1,018m (2011: £1,044m), comprising letters of credit, guarantees and revolving, floating rate credit facilities for cash borrowings. Any non-compliance with covenants underlying the Group’s financing arrangements could, if not waived, constitute an event of default with respect to any such arrangements. The Group was in full compliance with its financial covenants throughout each of the periods presented.
TT11 | AR 2012 | 20/12/2012 | Proof 5

Financial statements
Notes to the consolidated financial statements continued
www.tuitravelplc.com
134 TUI Travel PLC Annual Report & Accounts 2012
25. Financial instruments continuedUndrawn facilities are analysed as follows:
30 September 30 September 2012 2011 £m £m
Expiring:In more than one year but less than five years 1,018 1,044
(G) Analysis of total financial assets and financial liabilitiesThe tables below set out the Group’s IAS 39 classification for each of its financial assets and liabilities:
Financial Derivative assets and financial liabilities at fair instruments Financial value through used in hedge Available for sale Loans and liabilities at Total profit and loss accounting financial assets receivables amortised cost carrying valueAt 30 September 2012 £m £m £m £m £m £m
Cash and cash equivalents – – – 830 – 830 Borrowings due within one year (38) – – – (32) (70)Borrowings due after more than one year – – – – (868) (868)Derivative assets 17 102 – – – 119Derivative liabilities (21) (124) – – – (145)Other financial assets 30 – 16 729 – 775Other financial liabilities (3) – – – (2,615) (2,618)
Total (15) (22) 16 1,559 (3,515) (1,977)
Financial Derivative assets and financial liabilities at fair instruments Financial Restated value through used in hedge Available for sale Loans and liabilities at total profit and loss accounting financial assets receivables amortised cost carrying valueAt 30 September 2011 £m £m £m £m £m £m
Cash and cash equivalents – – – 902 – 902Borrowings due within one year (39) – – – (57) (96)Borrowings due after more than one year – – – – (802) (802)Derivative assets 42 173 – – – 215Derivative liabilities (61) (90) – – – (151)Other financial assets 30 – 22 715 – 767Other financial liabilities (4) – – – (2,191) (2,195)
Total (32) 83 22 1,617 (3,050) (1,360)
Other financial assets comprise trade receivables, other receivables which are receivable within and after more than one year as well as other investments due within one year. Other financial liabilities comprise trade payables, accruals and other financial liabilities which are payable within and after more than one year.
Interest payable on financial instruments carried at amortised cost (comprising bank loans, loans from parent and finance lease liabilities) is disclosed in Note 5.
Derivatives presented under held for trading under IAS 39 classifications are analysed in Note 25(I) between cash flow hedges and derivatives not hedge accounted.
TT11 | AR 2012 | 20/12/2012 | Proof 5

Financial statements
www.tuitravelplc.com
TUI Travel PLC Annual Report & Accounts 2012 135Financial statem
ents
(H) Fair values of financial assets and financial liabilitiesThe fair values of financial assets and liabilities, together with carrying amounts shown in the consolidated balance sheet at 30 September 2012 and at 30 September 2011, are as follows: 30 September 2012 30 September 2011 Carrying Fair Carrying Fair amount value amount value £m £m £m £m
Cash and cash equivalents 830 830 902 902 Borrowings Convertible bond (675) (750) (654) (544)Shareholder loan – – (26) (26)Bank loans (23) (23) (30) (30)Loan notes (1) (1) (1) (1)Finance lease liabilities (186) (191) (132) (131)Other financial liabilities (43) (43) (45) (45)Amounts owed to related parties (10) (10) (10) (10)Derivative financial instruments Forward exchange contracts used for hedging – assets 75 75 161 161 – liabilities (129) (129) (100) (100)Commodity contracts used for hedging – assets 44 44 54 54 – liabilities (16) (16) (51) (51)Other financial assets Trade and other receivables 710 710 693 693 Trade and listed investments 46 46 51 51 Other investments 19 19 22 22 Other financial liabilities Current trade and other payables (2,581) (2,581) (2,180) (2,180)Non-current trade and other payables (37) (37) (15) (15)
Total (1,977) (2,057) (1,361) (1,250)
The basis for fair value measurement of financial assets and liabilities is set out in Note 1(W).
Fair value measurementsIFRS 7 requires enhanced disclosures about fair value measurements of financial instruments through the use of a three level fair value hierarchy that prioritises the valuation techniques used in fair value calculations.
The levels can be broadly described as follows:
• Level 1 – use of unadjusted quoted prices in active markets for identical assets or liabilities
• Level 2 – use of observable inputs other than quoted prices included within level 1, such as quoted prices for similar assets or liabilities in active markets
• Level 3 – use of inputs not based on observable market data but reflecting management’s own assumptions about pricing the asset or liability.
The Group maintains policies and procedures to value instruments using the most relevant data available. If there are multiple inputs available that fall into different levels of the hierarchy, the instrument is categorised on the basis of the lowest level input.
TT11 | AR 2012 | 20/12/2012 | Proof 5

Financial statements
Notes to the consolidated financial statements continued
www.tuitravelplc.com
136 TUI Travel PLC Annual Report & Accounts 2012
25. Financial instruments continuedThe Group’s financial assets and liabilities, excluding finance lease liabilities, measured at fair value at 30 September 2012 are categorised as follows:
Total Level 1 Level 2 Level 3 fair valueAt 30 September 2012 £m £m £m £m
AssetsTrade and listed investments 10 – 36 46 Derivative financial instruments – 119 – 119
Total assets 10 119 36 165
LiabilitiesDerivative financial instruments – (145) – (145)Other financial liabilities – – (41) (41)
Total liabilities – (145) (41) (186)
Total 10 (26) (5) (21)
Total Level 1 Level 2 Level 3 fair valueAt 30 September 2011 £m £m £m £m
AssetsTrade and listed investments 14 – 37 51Derivative financial instruments – 215 – 215
Total assets 14 215 37 266
LiabilitiesDerivative financial instruments – (151) – (151)Other financial liabilities – – (43) (43)
Total liabilities – (151) (43) (194)
Total 14 64 (6) 72
The movements in level 3 instruments, measured on a recurring basis, for the year ended 30 September 2012 are as follows:
Trade Other Total and other financial level 3 investments liabilities instruments £m £m £m
At 1 October 2011 37 (43) (6)Cash settlement of deferred consideration – 3 3 Adjustment of deferred consideration through goodwill – (2) (2)Foreign exchange (1) 1 –
At 30 September 2012 36 (41) (5)
Trade and listed investmentsAs at 30 September 2012, £36m (2011: £37m) of trade and other investments were categorised as level 3 instruments. These consist of the Group’s investment in The Airline Group Limited (£30m) and other trade investments in the equity of unlisted companies (£6m). The Group’s investment in The Airline Group Limited is valued by a third party using a discounted cash flow methodology. The key assumptions include estimates of future operating results and the level of future contributions to the pension schemes. The level of future pension contributions are currently a key uncertainty in the valuation.
The level 1 trade investment mainly consists of the Group’s holding in Air Berlin PLC. See Note 12 for further details of investments.
Derivative assets and liabilitiesDerivatives are valued in the market using discounted cash flow techniques.
These techniques incorporate inputs at level 2, such as interest rates and foreign currency exchange rates. These market inputs are used in the discounted cash flow calculation incorporating the instrument’s term, notional amount, volatility, discount rate and taking credit risk into account.
As significant inputs to the valuation are observable in the markets, these instruments are categorised as level 2 in the hierarchy.
Other financial liabilitiesThe put options to acquire the remaining equity stake in L’TUR Tourismus AG (£38m) (2011: £39m) are classified as an other financial liability with changes in fair value included in operating profit. They have been valued using the minimum price stipulated in the contracts plus adjustments based on estimated operating results in the three years preceding any exercise of the options. Deferred consideration (£3m) (2011: £4m) is also measured at fair value based on the relevant contracts.
There are no reasonably possible changes in assumptions which would materially alter the value of these level 3 financial instruments.
TT11 | AR 2012 | 20/12/2012 | Proof 5

Financial statements
www.tuitravelplc.com
TUI Travel PLC Annual Report & Accounts 2012 137Financial statem
ents
(I) Derivative instrumentsAt the balance sheet date the fair value of the Group’s derivative financial assets and liabilities was as follows:
30 September 2012 30 September 2011 Assets Liabilities Total Assets Liabilities Total Fair value Fair value fair value Fair value Fair value fair value £m £m £m £m £m £m
Cash flow hedgesForeign exchange forwards 58 (108) (50) 119 (39) 80 Commodity options 5 (2) 3 3 (8) (5)Commodity swaps 39 (14) 25 51 (43) 8
102 (124) (22) 173 (90) 83 Derivatives not hedge accounted Foreign exchange forwards 17 (21) (4) 42 (61) (19)
Total 119 (145) (26) 215 (151) 64
Analysed as: Current 98 (125) (27) 185 (133) 52 Non-current 21 (20) 1 30 (18) 12
Total 119 (145) (26) 215 (151) 64
The following table indicates the periods in which the cash flows associated with derivatives are expected to occur. Future cash flows have been estimated based on spot rates and prices at 30 September 2012. The net cash flows are shown net for each instrument.
Projected cash flows Between Between Less than one and two and Over one year two years five years five years30 September 2012 £m £m £m £m
Derivative financial assetsForeign exchange forwards 72 6 – – Commodity swaps 50 19 1 –Commodity options 3 – – –
125 25 1 –
Derivative financial liabilitiesForeign exchange forwards (121) (13) – – Commodity swaps (4) – – –
(125) (13) – –
Total – 12 1 –
Projected cash flows Between Between Less than one and two and Over one year two years five years five years30 September 2011 £m £m £m £m
Derivative financial assetsForeign exchange forwards 129 22 1 –Commodity swaps 50 3 – –
179 25 1 –
Derivative financial liabilitiesForeign exchange forwards (86) (2) – –Commodity options (3) – – –Commodity swaps (27) (9) – –
(116) (11) – –
Total 63 14 1 –
TT11 | AR 2012 | 20/12/2012 | Proof 5
Financial statements
Notes to the consolidated financial statements continued
www.tuitravelplc.com
138 TUI Travel PLC Annual Report & Accounts 2012
25. Financial instruments continuedIneffectivenessIneffectiveness in respect of cash flow hedges has been recognised in the consolidated income statement for the year. Ineffectiveness for the year ended 30 September 2012 comprised a credit of £3m (2011: credit £1m) relating to fuel hedging and this is included within underlying operating profit. In respect of foreign exchange hedging ineffectiveness, this comprised a debit of £2m (2011: £nil) which is included in the underlying operating profit in the consolidated income statement.
(J) Amounts recognised in equityThe following amounts have been recognised in equity during the year: Year ended Year ended 30 September 30 September 2012 2011 £m £m
Hedging reserveEffective portion of changes in fair value of cash flow hedging instruments (42) 85 Fair value of cash flow hedges transferred to the consolidated income statement (30) (4)
(72) 81
Deferred tax on the above items recognised outside of the consolidated income statement is shown in Note 8(iii).
(K) Sensitivity analysisThe sensitivity analysis is for illustrative purposes only and should not be considered a projection of likely future events and gains or losses.
The sensitivity analysis includes the following assumptions:
• Changes in market interest rates only affect interest income or expense of variable financial instruments;
• Changes in market interest rates only affect interest income or expense in relation to financial instruments with fixed interest rates if these are recognised at fair value;
• Changes in market interest, currency and fuel rates affect the fair value of derivative financial instruments designated as hedging instruments and the majority of hedges are expected to be highly effective; and
• Changes in the fair value of derivative financial instruments and other financial assets or liabilities are estimated by discounting the future cash flows to net present values using appropriate market rates prevailing at the year end.
The Group has used a sensitivity analysis technique that measures the estimated change to the consolidated income statement and equity of a 1% (100 basis points) difference in market interest rates or a 10% strengthening or weakening in Sterling against all other currencies and in fuel prices, from the rates applicable at the balance sheet date, with all other variables remaining constant, these being considered to be reasonably possible changes to interest rates, Sterling rates and fuel prices.
Interest rate riskUnder the above assumptions, a 100 basis points increase in interest rates would result in an increase in interest expense in the consolidated income statement and equity of £3m (2011: immaterial increase). A 100 basis points reduction in interest rates is not considered reasonably possible.
Currency riskSimilarly, under the above assumptions, a 10% strengthening or weakening of Sterling against all principal exchange rates would have reduced profit before tax by £5m (2011: reduced profit before tax by £6m) or increased it by £6m (2011: increased profit before tax by £8m) respectively. Equity (before tax) would have decreased by £207m (2011: £217m) or increased by £253m (2011: £265m) respectively.
Fuel price riskThe sensitivity analysis is based on a 10% increase or decrease in fuel prices and the sensitivity will differ correspondingly if the fuel markets are more or less volatile. Under these assumptions, with a 10% increase or decrease in the unit price of fuel, profit before tax would neither increase nor decrease materially, because of the fuel price hedging policy and appropriate pricing adjustments. Equity (before tax) would increase by £110m (2011: £105m), or decrease by £109m (2011: £109m) respectively.
TT11 | AR 2012 | 20/12/2012 | Proof 5

Financial statements
www.tuitravelplc.com
TUI Travel PLC Annual Report & Accounts 2012 139Financial statem
ents
26. Movements in cash and net debt and cash conversion(A) Movements in cash and net debt Cash Amounts due Other and cash Convertible to related Bank Loan Finance financial equivalents bonds parties loans notes leases liabilities Total £m £m £m £m £m £m £m £m
At 1 October 2010 1,304 (633) (575) (36) (2) (269) (38) (249)Cash movement (406) – 530 5 1 145 (6) 269Non-cash movement – (21) – – – (7) (1) (29)Foreign exchange 4 – 9 1 – (1) – 13
At 30 September 2011 902 (654) (36) (30) (1) (132) (45) 4 Cash movement 17 – 23 5 – 19 1 65 Non-cash movement – (21) – – – (83) (3) (107)Foreign exchange (89) – 3 2 – 10 4 (70)
At 30 September 2012 830 (675) (10) (23) (1) (186) (43) (108)
The 2012 and 2011 non-cash movement of £21m per annum in convertible bonds relate to the accretion of the equity portion of the convertible bonds.
(B) Cash conversionThe Group targets conversion of underlying profit before tax to free cashflow of at least 70%. ‘Underlying’ as a measure of operating profit is defined in Note 1(B)(ii). ‘Free cashflow’ is defined as the movement in cash net of debt during the year before dividend payments, acquisitions and business disposal proceeds and acquisitions of shares for share-based payments. Calculations for the current and prior year are:
Year ended Year ended 30 September 30 September 2012 2011 Note £m £m
Underlying operating profit Consolidated income statement 490 471 Net financial expense 5 (100) (111)
Underlying profit before tax 390 360
Movement in cash net of debt 26(A) 65 269 Add: Dividends paid to ordinary and non-controlling interests Consolidated statement of cash flows 128 124 Acquisition of subsidiaries net of cash acquired Consolidated statement of cash flows 23 33 Investment in joint ventures, associates and other investments Consolidated statement of cash flows 25 18 Proceeds from other investments Consolidated statement of cash flows (1) – Shares purchased by Employee Benefit Trust Consolidated statement of cash flows – 7
Free cashflow 240 451
Cash conversion 62% 125%
27. Operating lease commitmentsTotal Group obligations under non-cancellable operating lease contracts are payable as follows:
Aircraft, ships, Aircraft, ships, Land and yachts and Land and yachts and buildings equipment buildings equipment 30 September 30 September 30 September 30 September 2012 2012 2011 2011 £m £m £m £m
Total commitments under non-cancellable operating leases expiring:Within one year 245 366 355 378Between one and five years 496 725 548 847Later than five years 209 201 243 194
Total 950 1,292 1,146 1,419
Operating lease commitments in respect of land and buildings comprise commitments in respect of the Group’s retail estate, its hotel estate, including those commitments that are required to be disclosed as leases under IFRIC 4, and its office premises.
The future commitment under the Group’s floating rate aircraft operating leases at 30 September 2012 was £100m (2011: £108m) and is included within the table above.
In total the Group operates 129 aircraft on operating leases at 30 September 2012 (2011: 137 aircraft), a minority of which contain purchase options. Yachts are held on operating leases in TUI Marine as part of the Group’s Sunsail and The Moorings fleets, whilst cruise ships are held on operating leases in the UK source market.
TT11 | AR 2012 | 20/12/2012 | Proof 5

Financial statements
Notes to the consolidated financial statements continued
www.tuitravelplc.com
140 TUI Travel PLC Annual Report & Accounts 2012
28. Capital commitmentsThe Group’s capital commitments are as follows: 30 September 30 September 2012 2011 £m £m
Contracted but not provided for:Property, plant and equipment – 1Intangible assets 6 1
Total 6 2
In addition to the above items, at the year end the Group had contracted to purchase 31 (2011: 40) aircraft with initial deliveries to start in the last quarter of the calendar year 2012. At list price, the total order value was US$4,067m (2011: US$4,634m) before escalations and discounts.
The Group intends to finance these aircraft in advance of their delivery dates and therefore does not expect to use its own cash resources for their purchase.
The Group’s joint ventures and associates had no material capital commitments at 30 September 2012 (2011: £nil).
29. Contingent liabilitiesThe Group is at any time defending a number of actions against it arising in the normal course of business. Provision is made for these actions where this is deemed appropriate. The Directors consider that adequate provision has been made for all known liabilities. See Note 8 for more details on contingent tax exposures and Note 21 for details on provisions.
30. Related party transactionsApart from with its own subsidiaries which are included in the consolidated financial statements, the Group, in carrying out its ordinary business activities, maintained direct and indirect relationships with related parties including consolidated or related companies of its ultimate parent company, TUI AG. These companies either purchased or delivered services to companies in the Group.
Shareholder loanA shareholder loan was advanced to the Company by TUI AG on 13 July 2011, in respect of acquiring Magic Life. The loan bore interest at EURIBOR plus a margin of 2.75% per annum. The principal element of the loan at 30 September 2011, excluding interest, was €30m. In accordance with the repayment schedule, the loan was fully repaid by 30 September 2012.
Convertible bondIn April 2010, the Company issued a £400m fixed rate 4.9% convertible bond, of which Antium Finance Ltd, an independent special purpose company, subscribed for 50%. TUI AG entered into a forward purchase agreement with Antium Finance Ltd for these £200m convertible bonds, in order to prevent dilution of its majority shareholding. TUI AG is entitled to receive the interest coupon on these bonds and to repurchase these bonds by July 2014 at the latest.
Trademark Licence AgreementThe Trademark Licence Agreement incorporates trademark licences granted from TUI AG to members of the TUI Tourism Group in relation to TUI Tourism’s use of the TUI name and logo and other trademarks from within TUI AG’s portfolio of trademarks used in the former TUI Tourism’s business. Licence fees payable under each licence are an annual fee equal to 0.02 percent of the average annual gross turnover of the relevant licensee under the relevant trademarks measured over a three year period. Total licence fees charged for the year ended 30 September 2012 were £3m (2011: £3m). Each licence’s standard terms are for five years with an option for the relevant licensee to extend for a further five years on the same terms.
Hotel Framework AgreementTUI Deutschland has signed an exclusivity agreement with TUI AG’s Robinson hotel portfolio. Under the terms of the agreement, TUI Deutschland paid €8m in the financial year ended 30 September 2012 and must pay €10m in the financial year ending 30 September 2013 and €12m per year thereafter. The contract also contains performance related elements linked to occupancy rates under which either more can be paid or refunds received.
TT11 | AR 2012 | 20/12/2012 | Proof 5

Financial statements
www.tuitravelplc.com
TUI Travel PLC Annual Report & Accounts 2012 141Financial statem
ents
Details of transactions with related parties and balances outstanding at the balance sheet date are set out in the tables below:
Income Expenses (including interest) Restated Year ended Year ended Year ended Year ended 30 September 30 September 30 September 30 September 2012 2011 2012 2011 £m £m £m £m
Related partyUltimate parent TUI AG 7 6 6 34Hotel and resort subsidiaries of TUI AG 8 11 332 319Other subsidiaries of TUI AG 4 – 2 –Joint ventures and associates of TUI AG 13 10 73 74Joint ventures of the Group 47 27 75 82Associates of the Group 17 15 24 32
Total 96 69 512 541
Income earned from TUI AG includes airline revenue of £3m (2011: £4m) and recharges of administrative costs of £3m (2011: £3m).
Income earned from hotels and resort subsidiaries of TUI AG, joint ventures and associates of TUI AG and joint ventures of the Group includes accommodation and destination services provided by the Group to the related entities. The income relating to the Group’s joint ventures includes £35m (2011: £25m) from Togebi Holdings Limited, the Group’s joint venture in Russia, and its subsidiaries.
Income received from associates of the Group principally represents aircraft sublease income from Sunwing, as detailed in Note 7.
Expenses paid to TUI AG includes interest expense of £2m (2011: £4m). The remaining expenses paid to TUI AG of £4m (2011: £30m) relates to aircraft lease costs and licence fees.
In addition to the amounts disclosed above, £10m (2011: £10m) of the interest payable in the year in respect of the Group’s convertible bonds has been paid to Antium Finance Ltd, a special purpose company which purchased £200m of the Group’s 4.9% convertible bond. TUI AG remains entitled to receive the interest on these bonds from Antium Finance Ltd.
Expenses relating to hotels and resort subsidiaries of TUI AG, joint ventures and associates of TUI AG and joint ventures and associates of the Group relate to travel related services, primarily made up of accommodation and destination services costs.
Related party receivables 30 September 2012 30 September 2011 Current Non-current Total Current Non-current Total assets assets assets assets assets assets £m £m £m £m £m £m
Related party Subsidiaries of TUI AG 11 – 11 5 – 5 Joint ventures and associates of TUI AG 5 – 5 8 – 8 Joint ventures of the Group 30 34 64 33 – 33 Associates of the Group 6 – 6 2 – 2
Total 52 34 86 48 – 48
Receivables due from related parties are reported in Note 16. Amounts owed from subsidiaries of TUI AG of £11m (2011: £5m) are in respect of current trade and other receivables.
Amounts owed by joint ventures of the Group that are due after more than one year of £34m (2011: £nil) include a loan of US$12m, equating to £7m (2011: £nil) from TUI Travel Holdings Limited, a direct subsidiary of the Company, to Togebi Holdings Limited. This loan is unsecured, bears interest at a rate of 7% and is repayable by February 2017. The remaining balance due after more than one year principally comprises hotel prepayments made to the Atlantica Leisure Group of companies.
Amounts owed by joint ventures that are due within one year of £30m (2011: £33m) include accommodation costs due from Togebi Holdings Limited and its subsidiaries of £16m (2011: £14m), which were non interest bearing balances. The remaining balance due within one year principally comprises current hotel prepayments made to the Atlantica Leisure Group of companies.
TT11 | AR 2012 | 20/12/2012 | Proof 5

Financial statements
Notes to the consolidated financial statements continued
www.tuitravelplc.com
142 TUI Travel PLC Annual Report & Accounts 2012
30. Related party transactions continuedRelated party payables 30 September 2012 30 September 2011 Current Non-current Total Current Non-current Total liabilities liabilities liabilities liabilities liabilities liabilities £m £m £m £m £m £m
Related party Ultimate parent TUI AG 8 – 8 45 – 45 Hotel and resort subsidiaries of TUI AG 45 – 45 37 – 37 Other subsidiaries of TUI AG – – – 2 – 2 Joint ventures and associates of TUI AG 19 – 19 13 – 13 Joint ventures of the Group 10 11 21 11 10 21 Associates of the Group 12 – 12 17 – 17
Total 94 11 105 125 10 135
Payables outstanding from related parties are reported in Notes 19, 20 and 22.
The above balances exclude £200m (nominal value) of the Group’s convertible bonds 4.9% April 2017 which have been sold to Antium Finance Ltd. TUI AG is entitled to receive the interest coupon on these bonds and to repurchase these bonds by July 2014 at the latest. Further details of the convertible bonds are given in Note 19. Included within the amount payable to TUI AG of £8m (2011: £45m) is a shareholder loan of £nil (2011: £26m).
Amounts owed to joint ventures of the Group due after more than one year include a US$15m loan, equating to £10m (2011: £10m), to TUI Travel Holdings Limited, from Borublita Holdings Limited, a subsidiary of Togebi Holdings Limited. The loan is unsecured, bears interest at a rate of 5% plus USD 12 month LIBOR and is conditionally repayable in September 2016.
Amounts payable to hotels and resorts of TUI AG and joint ventures and associates of TUI AG are in respect of current trade payables primarily associated with accommodation and destination services costs.
Details on interest rate and liquidity risks in respect of balances with related parties are included in Notes 25(E) and 25(F) respectively.
Key management compensation In accordance with IAS 24, key management functions within the Group (the GMB and the Directors of the Company) were related parties whose remuneration had to be listed separately. The compensation paid in respect of key management personnel (including Directors) was as follows:
Year ended Year ended 30 September 30 September 2012 2011 £m £m
Short term employee benefits 9 8Termination benefits 1 1 Post-retirement benefits 1 2Share-based payments 9 10
Total 20 21
Details of Directors’ remuneration are given in the Remuneration report.
TT11 | AR 2012 | 20/12/2012 | Proof 5

Financial statements
www.tuitravelplc.com
TUI Travel PLC Annual Report & Accounts 2012 143Financial statem
ents
31. Principal operating subsidiariesOther than as stated below, all the principal operating subsidiaries listed are wholly owned. Principal operating subsidiaries are those which, in the opinion of the Directors, significantly affected the Sector’s results and net assets during the year. A full list will be included in the Company’s next annual return to Companies House. The Directors consider that those companies not listed are not significant in relation to the Sector specified. TUI UK Limited is presented within the Mainstream Sector – Northern Region to reflect its principal operations but the Company also includes certain UK Specialist & Activity businesses at 30 September 2012.
Subsidiary Country Nature of business
Mainstream SectorMainstream – Northern RegionFalcon Leisure Group (Overseas) Limited United Kingdom Tour operatorFritidsresor AB Sweden Tour operatorOy Finnmatkat AB Finland Tour operator Star Tour A/S Denmark Tour operatorStartour-Stjernereiser AS Norway Tour operatorSuntopia Otel Hizmetleri Turizm Ve Ticaret Anonim Sirketi Turkey Hotel operatorThomson Airways Limited United Kingdom AirlineTUI UK Limited United Kingdom Tour operatorTUI UK Retail Limited United Kingdom Travel agentTUIfly Nordic AB Sweden AirlineMainstream – Central EuropeBerge & Meer Touristik GmbH Germany Tour operatorL’TUR Tourismus AG (70%) Germany Tour operatorTUI (Suisse) AG Switzerland Tour operatorTUI Austria Holding GmbH Austria Tour operatorTUI Aviation GmbH Germany Leasing companyTUI Deutschland GmbH Germany Tour operatorTUI Leisure Travel GmbH Germany Travel agentTUI Poland Sp Zoo Poland Tour operatorTUIfly GmbH Germany AirlineMainstream – Western EuropeCorsair SA France AirlineTUI France SAS* France Tour operatorJetAir NV Belgium Tour operatorSociété d’Investissement Aérien SA Morocco AirlineTUI Airlines Belgium NV Belgium AirlineTUI Airlines Nederland BV Netherlands AirlineTUI Nederland NV Netherlands Tour operatorAccommodation & Destinations SectorA&D Peru Company Limited SA Peru Tour operatorAsiarooms Pte Ltd Singapore Online accommodationBeds On Line SLU Spain Online accommodationBlue Travel Partner Services SA (99%) Dominican Republic Destination servicesClub Turavia SA de CV Mexico Accommodation wholesalerHotelbeds Dominicana SA Dominican Republic Accommodation wholesalerHotelbeds Product, SLU Spain Online accommodationHotelbeds, SLU Spain Accommodation wholesalerHotelbeds Spain, SLU Spain Accommodation wholesalerHotelbeds UK Limited United Kingdom Accommodation wholesalerHotelbeds USA, Inc. USA Accommodation wholesalerIntercruises Shoreside & Port Services, Inc. USA Cruise handlingIntercruises Shoreside & Port Services, SLU Spain Cruise handlingLate Rooms Limited United Kingdom Online accommodationPacific World Singapore Pte Limited Singapore Destination servicesTantur Turizm Seyahat Anonim Sirketi Turkey Destination servicesTransfar-Agencia de Viagens e Turismo Unipessoal LDA Portugal Destination servicesTUI Hellas Travel Tourism and Airlines AE Greece Destination servicesTUI Portugal-Agencia de Viagens e Turismo SA Portugal Destination servicesTUI España Turismo SA Spain Destination servicesUltramar Express Transport SA Spain Destination services
TT11 | AR 2012 | 20/12/2012 | Proof 5

Financial statements
Notes to the consolidated financial statements continued
www.tuitravelplc.com
144 TUI Travel PLC Annual Report & Accounts 2012
31. Principal operating subsidiaries continuedSubsidiary Country Nature of business
Specialist & Activity SectorAdventure Tours Australia Group Pty Ltd (60%) Australia Tour operatorBrightspark Travel Inc. USA Tour operatorCrown Blue Line Limited United Kingdom Tour operatorCrown Travel Limited United Kingdom Tour operatorEAC Language Centres (UK) Limited United Kingdom Language teachingELC English Limited United Kingdom Language teachingExodus Travels Limited (60%) United Kingdom Tour operatorFanfirm Pty Limited* Australia Tour operatorFirst Choice Sailing, Inc. USA Tour operatorGullivers Sports Travel Limited United Kingdom Tour operatorHayes & Jarvis (Travel) Limited United Kingdom Tour operatorIntrepid Travel Pty Ltd (60%) Australia Tour operatorMariner International Travel, Inc. USA Tour operatorPeregrine Adventures Pty Ltd (60%) Australia Tour operatorPorter and Haylett Limited United Kingdom Boat owning companyQuark Expeditions, Inc. USA Tour operatorReal Travel Limited* United Kingdom Tour operatorSki Bound Limited United Kingdom Tour operatorSpecialist Holidays (Travel) Limited United Kingdom Tour operatorSportsworld Group Limited United Kingdom Tour operatorSunsail Limited United Kingdom Tour operatorSunsail Worldwide Sailing Limited United Kingdom Tour operatorTCS and Starquest Expeditions, Inc. USA Tour operatorThe Moorings Limited British Virgin Islands Tour operatorThomson Sport (UK) Limited* United Kingdom Tour operatorTravcoa Corporation USA Tour operatorTravel Turf, Inc. United Kingdom Tour operatorTrek America Travel Limited (60%) United Kingdom Tour operatorTTSS Limited United Kingdom Tour operatorWilliment Travel Group Limited New Zealand Tour operatorWorld Challenge Expeditions Limited United Kingdom Tour operatorWorld Challenge Expeditions Pty Limited Australia Tour operatorYour Man Tours, Inc. USA Tour operatorZegrahm Expeditions, Inc. USA Tour operator
* All subsidiaries except those marked with an asterisk are held indirectly by the Company.
In addition to the ownership of 100% of the ordinary shares of the above listed principal operating subsidiaries, the Group also owns the following shares in these companies:
Principal operating subsidiary Additional classes of shares
Porter and Haylett Limited 180,000 £1 redeemable ordinary sharesSki Bound Limited 167,502 £1 ‘A’ ordinary sharesClub Turavia SA de CV 2,317,133 MXP1 variable shares
TT11 | AR 2012 | 20/12/2012 | Proof 5

Financial statements
www.tuitravelplc.com
TUI Travel PLC Annual Report & Accounts 2012 145Financial statem
ents
32. Earnings per shareThe basic earnings per share is calculated by dividing the result attributable to ordinary shareholders by the applicable weighted average number of shares in issue during the year, excluding those held in the Employee Benefit Trust. The diluted earnings per share is calculated on the result attributable to ordinary shareholders divided by the adjusted potential weighted average number of ordinary shares, which takes account of the outstanding share awards and the impact of the conversion of the convertible bonds, where their conversion is dilutive. The additional underlying earnings per share measures have been presented to provide the reader of the accounts with a better understanding of the results.
Basic and diluted earnings per share are as follows:
Weighted Weighted average no. Earnings average no. Earnings Earnings of shares per share Earnings of shares per share 2012 2012 2012 2011 2011 2011 £m Millions Pence £m Millions Pence
Basic earnings per share 138 1,108 12.5 85 1,107 7.7 Effect of dilutive options – 10 – 11
Diluted earnings per share 138 1,118 12.3 85 1,118 7.6
For the statutory measure of diluted earnings per share, the effects of including the convertible bonds are anti-dilutive in both years and therefore this is not included within the calculation.
Alternative measures of earnings per share Weighted Weighted average no. Earnings average no. Earnings Earnings of shares per share Earnings of shares per share 2012 2012 2012 2011 2011 2011 £m Millions Pence £m Millions Pence
Basic earnings per share 138 1,108 12.5 85 1,107 7.7
Acquisition related expenses and impairments 92 – 121 – Predecessor accounting for Magic Life – – 17 – Separately disclosed items 92 – 74 – Tax base difference (36) – (36) –
Basic underlying earnings per share 286 1,108 25.8 261 1,107 23.6Effect of dilutive options – 10 – 11 Effect of convertible bond (net of tax) 47 205 45 205
Diluted underlying earnings per share 333 1,323 25.2 306 1,323 23.1
The tax base difference primarily represents the difference between the actual charge in the consolidated income statement and the Group’s underlying tax charge, as disclosed in Note 8. The dilutive effect of the convertible bonds is included solely to calculate diluted underlying earnings per share.
Reconciliation of profit for the year from continuing operations attributable to ordinary shareholders from continuing operations Year ended Year ended 30 September 30 September 2012 2011 £m £m
Profit attributable to ordinary shareholders from continuing operations 138 85Result attributable to non-controlling interests from continuing operations (1) 2
Profit for the year from continuing operations 137 87
Non-GAAP measureReconciliation of underlying operating profit to underlying earnings Year ended Year ended 30 September 30 September 2012 2011 Note £m £m
Underlying operating profit 490 471 Net underlying financial expenses 5 (100) (111)
Underlying profit before tax 390 360 Underlying tax charge at 27% (2011: 27%) (105) (97)
Underlying profit for the year 285 263
Attributable to ordinary shareholders 286 261 Attributable to non-controlling interests (1) 2
Underlying profit for the year 285 263
TT11 | AR 2012 | 20/12/2012 | Proof 5

Financial statements
Notes to the consolidated financial statements continued
www.tuitravelplc.com
146 TUI Travel PLC Annual Report & Accounts 2012
33. Capital managementThe capital structure of the Group consists of debt, cash and cash equivalents and equity attributable to the Parent Company. The Board’s policy has been to maintain a strong capital base in order to maintain investor, creditor and market confidence and to sustain future development of the business. The Board’s objectives when managing capital are to safeguard the Group’s ability to continue as a going concern in order to provide returns for shareholders and benefits for other stakeholders and to maintain an optimal capital structure. This includes maintaining the level of dividends at a level commensurate with underlying operating profitability of the Group and obtaining sufficient long and short term debt facilities that are appropriate for the seasonality of the business.
The Group has a roadmap to deliver sustainable long term value to shareholders with a return on invested capital (ROIC) greater than the Group’s pre-tax weighted average cost of capital. Progress in achieving this objective has been made during this year by improving underlying operating profit, which increases ROIC to 12.2% (2011: 11.3%).
The Group is required to comply with external banking credit facility covenants, with compliance being tested twice a year. The Group has complied with these covenants throughout the year and up to the date of signing these financial statements. Further information on these covenants is provided in Note 1(B)(v).
ROIC is defined as ‘Underlying NOPAT’/‘Average Invested Capital’. Underlying NOPAT is underlying net operating profit after tax charge at the effective annual rate. ‘Underlying’ as a measure of operating profit is defined in Note 1(B)(ii).
Average Invested Capital comprises an average of the net assets (at the start and end of the year) of the Group, adjusted to add back net debt, cumulative goodwill impairment charges and defined benefit pension scheme net deficits. There is also an adjustment to adjust net debt to reflect a seasonal average cash balance. Calculations for the current and prior years are:
Year ended Year ended 30 September 30 September 2012 2011Return on invested capital Note £m £m
Underlying operating profit Consolidated income statement 490 471 Taxation at the underlying effective rate of 27% (2011: 27%) (132) (127)
Underlying NOPAT 358 344
Net assets Consolidated balance sheet 1,609 1,938 Net debt/(cash) 26A 108 (4)Seasonal net debt adjustment 400 300 Cumulative goodwill impairment charge 190 170 Defined benefit pension net deficit 6C 648 513
Invested Capital 2,955 2,917
Average Invested Capital 2,936 3,033
ROIC 12.2% 11.3%
The Board seeks to maintain a balance between the levels of debt borrowings undertaken and the advantages and security afforded by a sound capital position. An analysis of net debt at the year end is in Note 26.
Certain subsidiaries have external capital requirements as a result of applicable travel industry regulations in their jurisdictions. Compliance with these regulations is mandatory for the relevant operating businesses in those countries in order that they are able to continue trading. Key countries with such mandatory capital requirements are France, Belgium, the Netherlands, Germany and Australia. The capital requirements in these countries stipulate maintaining minimum equity/net asset levels in operating subsidiaries. All such capital requirements were complied with as at 30 September 2012. None of these requirements are individually or collectively significant to the overall Group and do not place any significant restriction on the Group’s funding or operations.
34. Post balance sheet eventsDetails of acquisitions since the balance sheet date are set out in Note 13.
On 13 November 2012, the Company entered into a further committed borrowing facility of £50m with one of the Group’s relationship banks which matures on 30 June 2015, along with the main £1,155m syndicated revolving credit facility. The terms and conditions applying to this additional facility are identical to those of the existing facility.
35. Ultimate parent companyThe ultimate parent company is considered to be TUI AG, a company registered in Berlin and Hanover (Federal Republic of Germany). At 30 September 2012, TUI AG was the beneficial owner of 56.26% of the ordinary share capital of the Company.
In addition a number of bonds are held indirectly by TUI AG and, if converted, this would give rise to 52,309,463 of new shares. On a fully diluted basis, if all bonds were converted, TUI AG’s shareholding would be 51.50% at 30 September 2012.
TUI AG prepares consolidated financial statements which include the results of the Group. TUI AG is the parent undertaking of the smallest and largest group to consolidate these financial statements. The accounting reference date of TUI AG is 30 September. Copies of the TUI AG financial statements are publicly available and can be obtained from the registered office of this company situated at Karl-Wiechert-Allee 4, 30625 Hanover, Federal Republic of Germany.
TT11 | AR 2012 | 20/12/2012 | Proof 5

www.tuitravelplc.com
TUI Travel PLC Annual Report & Accounts 2012 147Financial statem
ents
Financial statements
Independent Auditors’ report to the members of TUI Travel PLC
Opinion on other matters prescribed by the Companies Act 2006 In our opinion:
• the part of the Directors’ Remuneration Report to be audited has been properly prepared in accordance with the Companies Act 2006; and
• the information given in the Directors’ Report for the financial year for which the Parent Company financial statements are prepared is consistent with the Parent Company financial statements.
Matters on which we are required to report by exception We have nothing to report in respect of the following matters where the Companies Act 2006 requires us to report to you if, in our opinion:
• adequate accounting records have not been kept by the Parent Company, or returns adequate for our audit have not been received from branches not visited by us; or
• the Parent Company financial statements and the part of the Directors’ Remuneration Report to be audited are not in agreement with the accounting records and returns; or
• certain disclosures of Directors’ remuneration specified by law are not made; or
• we have not received all the information and explanations we require for our audit.
Other matter We have reported separately on the Group financial statements of TUI Travel PLC for the year ended 30 September 2012.
Roger de Peyrecave (Senior Statutory Auditor)for and on behalf of PricewaterhouseCoopers LLPChartered Accountants and Statutory AuditorsLondon3 December 2012
We have audited the Parent Company financial statements of TUI Travel PLC for the year ended 30 September 2012 which comprise the Parent Company balance sheet and the related notes. The financial reporting framework that has been applied in their preparation is applicable law and United Kingdom Accounting Standards (United Kingdom Generally Accepted Accounting Practice).
Respective responsibilities of Directors and auditors As explained more fully in the Directors’ responsibilities statement set out on page 55, the Directors are responsible for the preparation of the Parent Company financial statements and for being satisfied that they give a true and fair view. Our responsibility is to audit and express an opinion on the Parent Company financial statements in accordance with applicable law and International Standards on Auditing (UK and Ireland). Those standards require us to comply with the Auditing Practices Board’s Ethical Standards for Auditors.
This report, including the opinions, has been prepared for and only for the Company’s members as a body in accordance with Chapter 3 of Part 16 of the Companies Act 2006 and for no other purpose. We do not, in giving these opinions, accept or assume responsibility for any other purpose or to any other person to whom this report is shown or into whose hands it may come save where expressly agreed by our prior consent in writing.
Scope of the audit of the financial statementsAn audit involves obtaining evidence about the amounts and disclosures in the financial statements sufficient to give reasonable assurance that the financial statements are free from material misstatement, whether caused by fraud or error. This includes an assessment of: whether the accounting policies are appropriate to the Parent Company’s circumstances and have been consistently applied and adequately disclosed; the reasonableness of significant accounting estimates made by the Directors; and the overall presentation of the financial statements. In addition, we read all the financial and non-financial information in the Annual Report & Accounts to identify material inconsistencies with the audited financial statements. If we become aware of any apparent material misstatements or inconsistencies we consider the implications for our report.
Opinion on financial statements In our opinion the Parent Company financial statements:
• give a true and fair view of the state of the Company’s affairs as at 30 September 2012;
• have been properly prepared in accordance with United Kingdom Generally Accepted Accounting Practice; and
• have been prepared in accordance with the requirements of the Companies Act 2006.
TT11 | AR 2012 | 20/12/2012 | Proof 5

www.tuitravelplc.com
148 TUI Travel PLC Annual Report & Accounts 2012
30 September 30 September 2012 2011 Note £m £m
Fixed assets Investments D 1,255 1,430
Current assets Derivative financial instruments – 1 Debtors E 156 384 Cash at bank 250 33
406 418 Creditors: amounts falling due within one year F (197) (398)
Net current assets 209 20
Total assets less current liabilities 1,464 1,450 Creditors: amounts falling due after more than one year G (950) (926)Provision for liabilities H (18) (24)
Net assets 496 500
Capital and reserves Called up share capital I 112 112 Profit and loss account J 263 277 Convertible bond reserve J 88 85 Other reserves J 33 26
Total shareholders’ funds J 496 500
The financial statements were approved by a duly authorised Committee of the Board of Directors on 3 December 2012 and were signed on its behalf by:
Peter J Long William H WaggottChief Executive Chief Financial Officer
Company number: 6072876
The notes on pages 149 to 153 form part of these financial statements.
Financial statements
Company balance sheetat 30 September 2012
TT11 | AR 2012 | 20/12/2012 | Proof 5

www.tuitravelplc.com
TUI Travel PLC Annual Report & Accounts 2012 149Financial statem
ents
Financial statements
Notes to the Company’s financial statements
Derivative financial instrumentsDerivative financial instruments are stated at fair value. The gain or loss on re-measurement to fair value is recognised immediately in the income statement. However, where derivatives qualify for hedge accounting, recognition of any resultant gain or loss depends on the nature of the item being hedged.
Convertible bondsThe convertible bonds are split into two components: a debt component and a component representing the embedded derivatives in the bond. The debt component represents the Group’s liability for future interest coupon payments and the redemption amount. The embedded derivatives represent the value of the option that bondholders have to convert into ordinary shares of the Company. These derivatives were valued on inception and recognised in the convertible bond reserve in equity.
The debt component of the convertible bonds is measured at amortised cost and therefore increases as the present value of the interest coupon payments and redemption amount increases, with a corresponding charge to finance cost. The debt component decreases by the cash interest coupon payments made. The embedded derivatives are measured at fair value at each balance sheet date and changes in fair value are recognised in the income statement.
Issue costs are apportioned between the liability and derivative components of the related convertible bond based on the allocation of proceeds to the liability and derivative components when the instruments are first recognised.
Share-based paymentsThe Company operates share-based payment schemes for the employees of the Company and its subsidiaries. The fair value of shares awarded to employees is an employee expense and is borne by fellow Group subsidiaries. The fair value is measured at the award date and is spread over the period during which the employee becomes unconditionally entitled to the awards. Calculating the fair value takes into account various factors including the expected volatility of the shares, the dividend yield and the risk free interest rate.
The Company makes awards of its own shares to the employees of its subsidiaries and as such recognises an increase in the cost of investment in its subsidiaries equivalent to the equity-settled share-based payment charge recognised in its subsidiaries’ financial statements with the corresponding credit being recognised directly in equity. The increase in investments and credit to equity for the year ended 30 September 2012 is £11m net of deferred tax (30 September 2011: £19m). Further information on the share schemes is provided in Note 6(D) to the consolidated financial statements.
Transactions of the Company’s Employee Benefit Trust are included in the Company’s financial statements. In particular, the Trust‘s purchases and sales of shares in the Company are debited and credited directly to equity.
Related partiesFor the purpose of these financial statements, parties are considered to be related to the Company if the Company has the ability, directly or indirectly, to control the party or exercise significant influence over the party making financial and operating decisions, or vice versa, or where the Company and the party are subject to common control or common significant influence. Related parties may be individuals or entities. The Company has taken advantage of the exemption contained within FRS 8 and has not therefore disclosed transactions or balances with entities which are wholly-owned subsidiaries.
A. Accounting policies Basis of preparationThe following accounting policies have been applied consistently in dealing with items which are considered material in relation to the Company’s financial statements.
Accounting conventionThe financial statements have been prepared in accordance with applicable UK accounting standards and under the historical cost convention as modified for derivative financial instruments, convertible bonds and share-based payments. The financial statements have been prepared on the going concern basis, which assumes that the Company will continue in operational existence for the foreseeable future. The Company has taken advantage of the exemption under Section 408 of the Companies Act 2006 from presenting its own profit and loss account. The profit after tax included in the financial statements of the Company determined in accordance with the Act, was £114m (2011: £174m).
The Company has taken advantage of the exemption contained within FRS 29 and has not provided the required financial instruments disclosure on the basis that the Group’s consolidated financial statements include consolidated IFRS 7 disclosures which are compliant with the requirements of FRS 29.
Foreign currenciesTransactions in foreign currencies are translated at the foreign exchange rate ruling at the date of the transaction. Monetary assets and liabilities denominated in foreign currencies at the balance sheet date are translated to Sterling at the foreign exchange rate ruling at that date. Foreign exchange differences arising on translation are recognised in the income statement. Non-monetary assets and liabilities that are measured in terms of historical cost in a foreign currency are translated using the exchange rate at the date of the transaction. Non-monetary assets and liabilities denominated in foreign currencies that are stated at fair value are translated to Sterling at foreign exchange rates ruling at the dates the fair values were determined.
InvestmentsInvestments in subsidiaries are stated at cost less provision for impairment. Dividends received and receivable are credited to the Company’s profit and loss account.
Interest-bearing borrowingsInterest-bearing borrowings are recognised initially at fair value less attributable transaction costs. Subsequent to initial recognition, interest-bearing borrowings are stated at amortised cost with any differences between cost and redemption value being recognised in the income statement over the period of the borrowings on an effective interest rate basis.
Classification of financial instruments issuedFinancial instruments issued by the Company are treated as equity only to the extent that they meet the following conditions: they include no contractual obligation upon the Company to deliver cash or other financial assets or to exchange financial assets or financial liabilities with another party under conditions that are potentially unfavourable to the Company; and where the instrument will or may be settled in the Company’s own equity instruments, it is either a non-derivative that includes no obligation to deliver a variable number of the Company’s own equity instruments or is a derivative that will be settled by the Company exchanging a fixed amount of cash or other financial assets for a fixed number of its own equity instruments.
TT11 | AR 2012 | 20/12/2012 | Proof 5

www.tuitravelplc.com
150 TUI Travel PLC Annual Report & Accounts 2012
Additions in the year of £147m comprise the following increases in investments: £132m increase in the cost of investment into TUI France SAS during the year (previously named TT Holdings France SA), for the purposes of recapitalising the Group’s French business and £15m of share-based payment liabilities incurred. The costs of the share-based schemes, which are operated for employees of the Company’s subsidiaries, are borne by the subsidiaries, subject to local accounting standards. The Company recognises an increase in the investment in the subsidiary and a credit to other reserves in accordance with FRS 20 ‘Share-based payments‘.
Details of the principal operating subsidiaries held directly and indirectly by the Company in the year ended 30 September 2012 can be found in Note 31 of the consolidated financial statements.
Included within the total impairment charge of £320m is a £20m impairment charge of the investment in World Challenge Holdings Limited following the receipt of a £14m dividend from this subsidiary combined with a Group restructure of that company’s subsidiaries during the year. An impairment of £300m (2011: £10m) has been charged in the year in respect of the cost of investment into TUI France SAS, following the recapitalisation during the year and the outcome from the Group’s annual impairment exercise.
The investment into TUI France SAS principally relates to two CGUs that are the same as those used in the Group’s annual impairment test. These two CGUs are the French tour operator and the French airline, Corsair. Detailed disclosure of the impairment test and the basis for calculation have been set out in Note 10 of the consolidated financial statements. The cost of investment has been compared against the value in use of Corsair and the French tour operator, using discounted cash flows as a basis of measurement.
The calculation of recoverable value for these two CGUs use the following assumptions:
• Cash flow projections based on the Group’s latest approved five year business plan;
• Cash flows beyond the plan period are extrapolated using an inflationary only growth rate of 1.8% (2011: 2%);
• Cash flows include the impact of working capital in both the asset base and the impact on cash flows over the plan period; and
• Cash flows are discounted using the Group’s WACC adjusted as appropriate for business specific factors, such as business risk. The risk-adjusted pre-tax WACC for these two CGUs was 11% (2011: 11%).
Financial statements
Notes to the Company’s financial statements continued
TaxationThe charge for taxation is based on the profit or loss for the period and takes into account taxation deferred because of timing differences between the treatment of certain items for taxation and accounting purposes. Except as otherwise required by accounting standards, full provision without discounting is made for all timing differences which have arisen but not reversed at the balance sheet date. Timing differences arise when items of income and expenditure are included in tax computations in periods different from their inclusion in the financial statements.
Dividends on shares presented within shareholders’ fundsDividends distributed to the Company’s shareholders are recognised as a liability and deducted from equity in the Group’s financial statements in the period in which the dividends are appropriately authorised and approved for payment and are no longer at the discretion of the Company. Unpaid dividends that do not meet these criteria are disclosed in the notes to the financial statements.
Auditors’ remunerationThe Company’s 2012 audit fee was £25,000 (2011: £25,000).
B. Directors’ remuneration and employeesDetails of Directors’ remuneration, gains made by them on vesting of share awards, amounts receivable by them under long term incentive schemes and pension entitlements in the current and prior years are contained in the audited section of the Remuneration report and in Note 6 of the consolidated financial statements. The Company had eight employees (2011: seven) in the year. Details of all share awards issued by the Company are given in Note 6(D) of the consolidated financial statements. All Directors’ remuneration is borne by subsidiary companies.
C. DividendsDetails of dividends paid and proposed by the Company in the current and prior year and details of dividends proposed subsequent to the balance sheet date are given in Note 9 of the consolidated financial statements.
D. Investments Shares in subsidiaries £m
CostAt 1 October 2011 1,444 Additions 147Disposals (2)
At 30 September 2012 1,589
Provision for impairmentAt 1 October 2011 (14)Impairment (320)
At 30 September 2012 (334)
Net book valueAt 30 September 2011 1,430
At 30 September 2012 1,255
TT11 | AR 2012 | 20/12/2012 | Proof 5
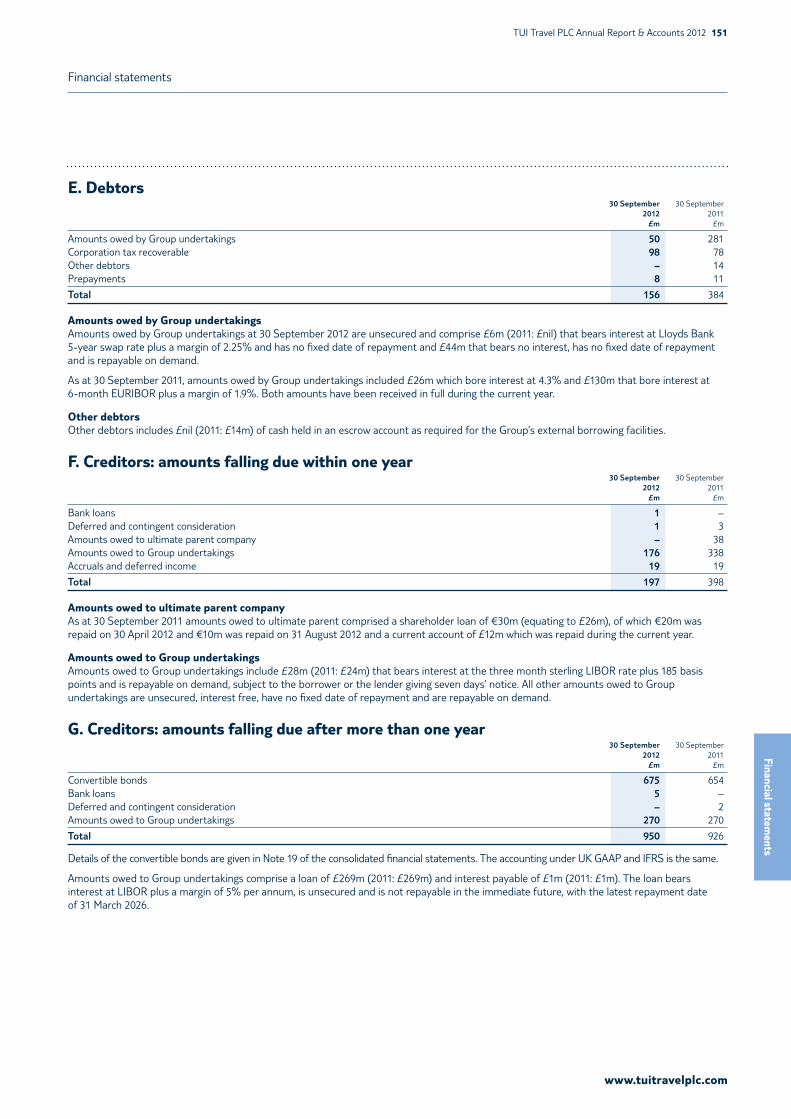
Financial statements
www.tuitravelplc.com
TUI Travel PLC Annual Report & Accounts 2012 151Financial statem
ents
E. Debtors 30 September 30 September 2012 2011 £m £m
Amounts owed by Group undertakings 50 281Corporation tax recoverable 98 78Other debtors – 14Prepayments 8 11
Total 156 384
Amounts owed by Group undertakingsAmounts owed by Group undertakings at 30 September 2012 are unsecured and comprise £6m (2011: £nil) that bears interest at Lloyds Bank 5-year swap rate plus a margin of 2.25% and has no fixed date of repayment and £44m that bears no interest, has no fixed date of repayment and is repayable on demand.
As at 30 September 2011, amounts owed by Group undertakings included £26m which bore interest at 4.3% and £130m that bore interest at 6-month EURIBOR plus a margin of 1.9%. Both amounts have been received in full during the current year.
Other debtorsOther debtors includes £nil (2011: £14m) of cash held in an escrow account as required for the Group’s external borrowing facilities.
F. Creditors: amounts falling due within one year 30 September 30 September 2012 2011 £m £m
Bank loans 1 –Deferred and contingent consideration 1 3Amounts owed to ultimate parent company – 38Amounts owed to Group undertakings 176 338Accruals and deferred income 19 19
Total 197 398
Amounts owed to ultimate parent companyAs at 30 September 2011 amounts owed to ultimate parent comprised a shareholder loan of €30m (equating to £26m), of which €20m was repaid on 30 April 2012 and €10m was repaid on 31 August 2012 and a current account of £12m which was repaid during the current year.
Amounts owed to Group undertakingsAmounts owed to Group undertakings include £28m (2011: £24m) that bears interest at the three month sterling LIBOR rate plus 185 basis points and is repayable on demand, subject to the borrower or the lender giving seven days‘ notice. All other amounts owed to Group undertakings are unsecured, interest free, have no fixed date of repayment and are repayable on demand.
G. Creditors: amounts falling due after more than one year 30 September 30 September 2012 2011 £m £m
Convertible bonds 675 654Bank loans 5 – Deferred and contingent consideration – 2Amounts owed to Group undertakings 270 270
Total 950 926
Details of the convertible bonds are given in Note 19 of the consolidated financial statements. The accounting under UK GAAP and IFRS is the same.
Amounts owed to Group undertakings comprise a loan of £269m (2011: £269m) and interest payable of £1m (2011: £1m). The loan bears interest at LIBOR plus a margin of 5% per annum, is unsecured and is not repayable in the immediate future, with the latest repayment date of 31 March 2026.
TT11 | AR 2012 | 20/12/2012 | Proof 5

www.tuitravelplc.com
152 TUI Travel PLC Annual Report & Accounts 2012
Financial statements
Notes to the Company’s financial statements continued
H. Provision for liabilities £m
Deferred tax Other timing differences 18
Total provision for liabilities 18
At 1 October 2011 24Deferred tax charge to profit and loss account (7)Deferred tax credit to equity 1
At 30 September 2012 18
Other timing differences comprise the deferred tax charge on the equity portion of the convertible bonds and share-based payments.
I. Called up share capital 30 September 30 September 2012 2011 £m £m
Issued and fully paid1,118,010,670 (2011: 1,118,010,670) ordinary shares of 10p each 112 112
Total 112 112
As described more fully in Note 35, the ultimate parent company, TUI AG, is the beneficial owner of 56.26% (2011: 55.47%) of the Company’s issued ordinary share capital as at 30 September 2012.
At 30 September 2012 9,545,591 shares (2011: 12,700,211 shares) were held by the Group’s Employee Benefit Trust. Based on 30 September 2012 share price of £2.34 (2011: £1.49) the value of shares held was £22,336,683 (2011: £18,961,415).
During the year ended 30 September 2012, the Group’s Employee Benefit Trust did not acquire any shares. In the year ended 30 September 2011, the Group’s Employee Benefit Trust acquired 3m shares at market value for consideration of £7m.
Details of dividends debited to equity in the year are set out in Note 9 of the consolidated financial statements. Whilst the Company has the authority to purchase its own shares, it has not done so in either the current or prior years.
J. Capital and reserves Called up Total share Profit and Convertible Other shareholders’ capital loss account bond reserve reserves funds £m £m £m £m £m
At 1 October 2010 112 227 83 23 445 Acquisition of shares by Employee Benefit Trust – – – (7) (7)Disposal on award of shares – – – (9) (9)Share-based payment costs (net of deferred tax) – – – 19 19 Profit for the financial year – 174 – – 174 Foreign exchange on net investment hedge – (2) – – (2)Effect of rate change on convertible bond – – 2 – 2 Dividends paid – (122) – – (122)
At 30 September 2011 112 277 85 26 500 Disposal on award of shares – (9) – 4 (5)Share-based payment costs (net of deferred tax) – – – 11 11 Transfer from share-based payment reserve to retained earnings – 8 – (8) – Profit for the financial year – 114 – – 114 Foreign exchange on net investment hedge – (2) – – (2)Effect of rate change on convertible bond – – 3 – 3 Dividends paid – (125) – – (125)
At 30 September 2012 112 263 88 33 496
The share-based payment costs for the year ended 30 September 2012 of £15m (2011: £19m) has an associated deferred tax charge of £4m (2011: £nil).
TT11 | AR 2012 | 20/12/2012 | Proof 5

Financial statements
www.tuitravelplc.com
TUI Travel PLC Annual Report & Accounts 2012 153Financial statem
ents
K. Contingent liabilitiesThere were contingent liabilities at 30 September 2012 in respect of guarantees and indemnities entered into as part of the ordinary course of the Group’s business. These guarantees cover payables by the Company’s subsidiaries for items such as insurance and credit facilities, car leases, aviation fuel, ground handling and airport services. The Company has also guaranteed the contractual obligations of various subsidiary companies in respect of the supply of a number of the Group’s aircraft fleet. No material losses are currently expected to be incurred by the Company from such contingent liabilities.
Where the Company enters into financial guarantee contracts to guarantee the indebtedness of other companies within its Group, the Company considers these to be insurance arrangements and accounts for them as such. In this respect, the Company treats the guarantee contract as a contingent liability until such time as it becomes probable that the Company will be required to make a payment under the guarantee. At 30 September 2012, the Company had contingent liabilities in respect of counter-guarantees for letters of credit amounting to £162m (2011: £111m).
Under the terms of guarantees given to the Civil Aviation Authority and other relevant authorities by the Company in respect of certain subsidiaries, in the event of default the Company could be held liable to the extent of the subsidiaries’ net trading liabilities at the time of default.
No amount is recognised in the Company’s balance sheet in respect of any of the above guarantees as it is not probable that there will be an outflow of resources.
The Company may be required to recapitalise direct subsidiaries in certain countries where there is a legal requirement to do so in the event that the net assets or reserves fall below a determined level. Where recapitalisation is required, the recapitalisaton will be accounted for as an increase in the cost of investment in that subsidiary, and subsequently tested for impairment (see Note D).
The Company, and its subsidiaries, is at any time defending a number of actions against it arising in the normal course of business. Provision is made for these actions where this is deemed appropriate. The Directors consider that adequate provision has been made for all known liabilities.
L. Related party transactionsApart from with its own subsidiaries which are included in the consolidated financial statements, TUI Travel PLC, in carrying out its ordinary business activities, had transactions with its ultimate parent company, TUI AG which delivered services to companies in the Group.
Details of transactions with related parties and balances outstanding at the balance sheet date are set out in the tables below:
Interest received Expenses and interest payable Year ended Year ended Year ended Year ended 30 September 30 September 30 September 30 September 2012 2011 2012 2011 £m £m £m £m
Ultimate parent TUI AG – 2 2 6
Total – 2 2 6
Creditors 30 September 30 September 2012 2011 £m £m
Ultimate parent TUI AG – 38
Total – 38
In addition to the above balances, Antium Finance Ltd purchased £200m (nominal value) of the Company’s convertible bond 4.9% April 2017. Antium Finance Ltd is a special purpose entity, independent of TUI AG. TUI AG entered into a forward purchase agreement with Antium Finance Ltd for these £200m convertible bonds, in order to prevent dilution of its majority shareholding. TUI AG is entitled to receive the interest coupon on these bonds from Antium Finance Ltd, (amounting to £10m per annum) and to repurchase these bonds by July 2014 at the latest. Further details of the convertible bonds are given in Notes 19 and 30 of the consolidated financial statements.
M. Post balance sheet eventsOn 9 October 2012, the Company received a €200m dividend from a subsidiary company, Leibniz-Service GmbH, equating to £161m. On 25 November 2012, the Company injected €70m of capital into TUI France SAS, equating to £56m, to fund seasonal requirements.
On 13 November 2012, the Company entered into a further committed borrowing facility of £50m with one of the Group’s relationship banks which matures on 30 June 2015, along with the main £1,155m syndicated revolving credit facility. The terms and conditions applying to this additional facility are identical to those of the existing facility.
Details of post balance sheet events relevant to the Group are given in Note 34 of the consolidated financial statements.
TT11 | AR 2012 | 20/12/2012 | Proof 5

www.tuitravelplc.com
154 TUI Travel PLC Annual Report & Accounts 2012
A&D Accommodation & Destinations Sector
AGMAnnual General Meeting
APACAsia Pacific region
ASPAverage selling price
Asset-rightOptimum mix of owned and leased assets
B2BBusiness-to-Business
B2CBusiness-to-Consumer
bn Billion
CAGRCompound annual growth rate
CISCommonwealth of Independent States
CO2/RPKCarbon dioxide emissions per revenue passenger kilometre
Controlled distributionOwned and franchised retail shops, call centre and website
COSOThe Committee of Sponsoring Organizations of the Treadway Commission
DABS Deferred Annual Bonus Scheme
Direct distribution Retail, call centre and website
EPSEarnings per share
ETS European Emissions Trading Scheme
GDP Gross Domestic Product
GMB Group Management Board
IFRS International Financial Reporting Standards
JV Joint venture
KPIs Key performance indicators
LCCs Low cost carriers
Load factor Passenger volumes as a percentage of capacity
m Million
Merger The business combination of the Tourism Division of TUI AG (excluding certain hotel assets) and First Choice Holidays PLC
OTA Online travel agent
PSP Performance Share Plan
PwC PricewaterhouseCoopers LLP
ROIC Return on invested capital
RPI Retail Price Index
SASSpecialist & Activity Sector
SectorSubset of TUI Travel PLC whose businesses share similar characteristics
Summer season May to October
The Board TUI Travel PLC Board of Directors
The Company TUI Travel PLC
The Group The TUI Travel PLC group of companies
TSR Total Shareholder Return
TTV Total transaction value
TUI AG TUI Travel PLC’s majority shareholder
Unique holidaysIncludes hotels and products that have been tailored to offer additional services and facilities to our customers
UNWTO United Nations World Travel Organisation
VCSP Value Creation Synergy Plan
WACC Weighted average cost of capital
Winter season November to April
Contacts and advisersSecretary and Registered OfficeA L JohnTUI Travel HouseCrawley Business QuarterFleming WayCrawleyWest Sussex RH10 9QLTelephone: 01293 645700Facsimile: 01293 645704
Registered number 6072876
Independent AuditorsPricewaterhouseCoopers LLP1 Embankment PlaceLondonWC2N 6RH
Financial adviserLazard
StockbrokersBarclaysBank of America Merrill Lynch
SolicitorsHerbert Smith Freehills
BankersHSBC Bank plcUnicredit BankBarclays Bank plcCitigroup NARoyal Bank of Scotland plcSociété Générale
Registrars and transfer officeEquiniti LimitedAspect HouseSpencer RoadLancing BN99 6DAShareholder Contact Centre No: 0871 384 2030International: +44 (0) 121 415 7047Website: www.shareview.co.uk
Company websitewww.tuitravelplc.com
Shareholder information
Financial calendar
Annual General Meeting 7 February 2013Interim results May 2013Preliminary results December 2013
Glossary of key terms
TT11 | AR 2012 | 20/12/2012 | Proof 5

www.tuitravelplc.com
TUI Travel PLC Annual Report & Accounts 2012 155
ExodusBest land only price on the www.exodus.co.uk website plus a further 5% discount per adult.
Quark ExpeditionsBest land only price on the www.quarkexpeditions.com website plus a further 5% discount per adult.
SkiBound*Best price on the www.skiboundholidays.co.uk website plus a further discount of £20 per adult to a maximum of £40 per booking on all our French club hotel destinations.* Discounts are not valid on accommodation-only bookings and cannot be used in
conjunction with any discretionary discounts, group savings or other promotional offers.
** Discounts are not valid on accommodation or flight-only bookings and cannot be used in conjunction with other promotional offers including but not restricted to group discounts. Valid on charter flights to European destinations only.
In order to qualify for the discount, private shareholders (including those holding through a nominee account) must hold at least 500 ordinary shares in the Company on the date of booking the holiday and must have been on the register of shareholders for a minimum period of one year on that date.
To register for your discount call the Equiniti TUI Travel Shareholder discount line on 0871 384 2810 (or +44 121 415 0124 if you are calling from outside the United Kingdom). Opening hours are Monday to Friday 0830-1730hrs. You will be required to provide details to confirm you are an eligible shareholder – in the case of a nominee account, this would normally be a letter from the registered shareholder. Once confirmed, you will be given a unique code.
To make a booking call us on: 0844 800 3104 (Monday, Wednesday and Friday 0900-1800hrs, Tuesday 1000-1800hrs and Saturday 0900-12.30hrs). You will be asked for your unique code and your discount will be applied.
Share dealing serviceAn execution-only share-dealing service for the purchase and sale of TUI Travel PLC shares is available from Equiniti. Equiniti is authorised and regulated by the Financial Services Authority and is a member of the London Stock Exchange and PLUS.
For details, please contact:
Equiniti Share Dealing ServiceSuite 1/1 3 Minster CourtMincing LaneLondon EC3R 7DDTelephone 0808 208 4433
Find out moreTUI Travel PLC has a corporate website which can be accessed through www.tuitravelplc.com
Shareholder information
Shareholder discount
Eligible shareholders are entitled to the following discounts (which are subject to change) when booking holidays through our dedicated Shareholder Discount Line. The shareholder must be the lead name on the booking.
Best price on the dedicated website plus a further discount of £20 per adult to a maximum of £40 per booking (cruise, short/medium-haul destinations) or £40 per adult to a maximum of £80 per booking (long-haul destinations) for the following:
First Choice* www.firstchoice.co.ukThomson* www.thomson.co.ukThomson Worldwide* www.thomsonworldwide.comCitalia* www.citalia.comJetsave* www.jetsave.co.ukMeon Villas* www.meonvillas.comSovereign* www.sovereign.comHayes & Jarvis* www.hayesandjarvis.co.ukThomson Lakes & Mountains** www.thomsonlakes.co.ukThomson Ski & Snowboarding** www.thomsonski.co.ukCrystal Ski** www.crystalski.co.ukCrystal Summer** www.crystalsummer.co.uk
Thomson AirwaysBest price on the www.thomson.co.uk website plus a further discount of £10 per person for a return journey (short/medium-haul destinations) or £20 per person for a return journey (long-haul destinations).
HotelopiaBest price on all hotels on the www.hotelopia.co.uk website plus an additional 14% discount.
Trek America*Best price on the website www.trekamerica.com plus an additional 10% discount.
The Moorings*Best price on the www.moorings.com website plus a further discount of £20 per adult to a maximum of £40 per booking (short-haul destinations) or £40 per adult to a maximum of £80 per booking (long-haul destinations).
Sunsail*Best price on the www.sunsail.co.uk website plus a further discount of £20 per adult to a maximum of £40 per booking (short-haul destinations) or £40 per adult to a maximum of £80 per booking (long-haul destinations).
Le Boat*Best price on the www.leboat.co.uk website plus a further discount of £20 per adult to a maximum of £40 per booking on all destinations.
Real Gap*Inspired BreaksBest price on the www.realgap.co.uk website plus a further discount of 10%.
TT11 | AR 2012 | 20/12/2012 | Proof 5

www.tuitravelplc.com
156 TUI Travel PLC Annual Report & Accounts 2012
Index
AAccommodation &
Destinations Sector 4, 46Accounting Policies 84, 149Acquisitions 37, 119Annual General Meeting 52Audit Committee 59, 62Auditors 54
BBalance sheet 81, 148Board Committees 58Board of Directors 50Brands 3Business and financial review 36Business models 15
CChairman’s statement 8Charitable giving 35Chief Executive’s statement 9Company balance sheet 148Consolidated balance sheet 81Consolidated income statement 79Consolidated statement
of cash flows 83Consolidated statement
of changes in equity 82Consolidated statement
of comprehensive income 80Contacts and advisers 154Corporate Governance report 56Current trading 48
DDirectors’ biographies 51Directors’ remuneration 66Directors’ report 52Directors’ responsibilities 55Dividends 37, 111
EEarnings Per Share 37, 145Emerging Markets Sector 4, 45
FFinancial calendar 154Financial highlights 6Financial statements 79, 148
GGovernance 56Group Management Board 28Group overview 2Group performance 36
HHealth & Safety 30
IIndependent Auditors’ Report 78, 147Investment case ifc
KKey Performance Indicators 18
MMainstream Sector 4, 39Market overview 12
NNomination Committee 61Notes to the consolidated
financial statements 84
OOperational highlights 6Outlook 49
PPensions 100People 28Principal operating subsidiaries 143Principal risks 20
RRemuneration Committee 67Remuneration Report 66
SSegmental performance 39Separately disclosed items 38, 98Shareholder discount 155Specialist & Activity Sector 4, 47Strategic drivers 14, 15, 16, 17Strategic overview 8Strategy 16Suppliers 34, 52Sustainable development 32
TTax 109, 121Total Shareholder Return 71TUI Travel at a glance 10
WWhere we operate 3Who we are 2
TT11 | AR 2012 | 20/12/2012 | Proof 5

TT11 | AR 2012 | 20/12/2012 | Proof 5
Designed by Boone Design. Produced by Magenta Digital.
Printed by www.cousin.uk.com on Amadeus Primo Silk FSC® certified paper.
Amadeus Primo Silk is certified FSC and is made using ECF pulp, is manufactured according to ISO 9001 and ISO 14001.
100% of the inks used are vegetable oil based, 95% of press chemicals are recycled for further use and, on average, 99% of any waste associated with this production will be recycled.
Photography supplied by TUI Travel PLC businesses.
www.tuitravelplc.com

TUI Travel PLCTUI Travel HouseCrawley Business QuarterFleming WayCrawleyWest SussexRH10 9QL
Telephone: 0044 (0)1293 645700
www.tuitravelplc.com
TT11 | AR 2012 | 20/12/2012 | Proof 5