annual report and accounts 2012 - alrayaholding.com
TRANSCRIPT
Annual Reportand Accounts
2012
Gulf Investm
ent Corporation G
.S.C. and Subsidiaries
Annual R
eport and Accounts 2012

Contents
Mission Statement 1
Financial Highlights 2
Board Of Directors 3
Chairman’s Statement 5
Economic Review 9
Financial Review 23
Risk Management 27
Basel II Disclosure 39
Consolidated Financial 55Statements
Stand-alone Statement 99 of Financial Position
Direct Investments 100
Investment Products 101
Corporate Directory 102
Contact Details 103

1
GIC’s mission is to foster the economic growth, the economic diversity and the capital markets development of the GCC.
Mission Statement
Annual Report and Accounts 2012Gulf Investment Corporation G.S.C. and Subsidiaries
2
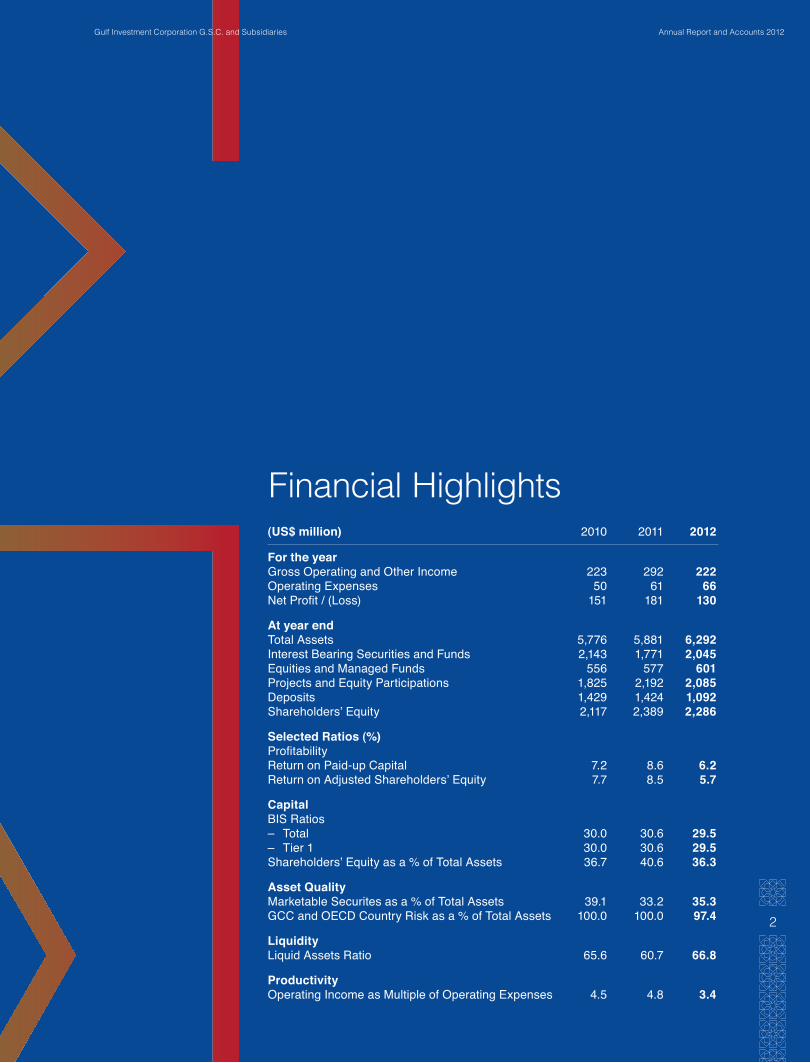
Financial Highlights(US$ million) 2010 2011 2012
For the year Gross Operating and Other Income 223 292 222Operating Expenses 50 61 66Net Profit / (Loss) 151 181 130
At year end Total Assets 5,776 5,881 6,292Interest Bearing Securities and Funds 2,143 1,771 2,045Equities and Managed Funds 556 577 601Projects and Equity Participations 1,825 2,192 2,085Deposits 1,429 1,424 1,092Shareholders’ Equity 2,117 2,389 2,286
Selected Ratios (%) Profitability Return on Paid-up Capital 7.2 8.6 6.2Return on Adjusted Shareholders’ Equity 7.7 8.5 5.7
Capital BIS Ratios – Total 30.0 30.6 29.5– Tier 1 30.0 30.6 29.5Shareholders’ Equity as a % of Total Assets 36.7 40.6 36.3
Asset Quality Marketable Securites as a % of Total Assets 39.1 33.2 35.3GCC and OECD Country Risk as a % of Total Assets 100.0 100.0 97.4
Liquidity Liquid Assets Ratio 65.6 60.7 66.8
Productivity Operating Income as Multiple of Operating Expenses 4.5 4.8 3.4

3
Board ofDirectors

Annual Report and Accounts 2012Gulf Investment Corporation G.S.C. and Subsidiaries
4
Senior Management Team
Mr. Rashid Bin Rasheed Deputy Chief Executive Officer& Head of Finance & Administration
Dr. Russell Read Deputy Chief Executive Officer& Chief Investment Officer
Mr. Ibrahim Ali AlQadhi Chief Executive Officer
* Member of the Executive Committee ** Member of the Audit Committee *** Member of the Risk Management Committee**** Member of the Remuneration and Human Resources Committee
Kingdom of Bahrain
United Arab Emirates
State of Qatar
Sultanate of Oman
H.E. Dr. Zakaria Ahmed Hejres * ****Chief Executive Officer Global Banking Corporation B.S.C. (closed)
H.E. Mr. Faisal Ali Almansouri * ***Director of Strategic Plannning & PerformanceDepartment Minister Office, Ministry of Finance
H.E. Shaikh Fahad Faisal Al-Thani * ****Deputy GovernorQatar Central Bank
H.E. Mr. Darwish Ismail Ali Al-Bulushi * **** Vice Chairman of the Board& Chairman of the Executive Committee - Gulf Investment CorporationMinister Responsible for Financial Affairs Ministry of Finance
H.E. Mr. Bader Al-Ajeel * ***Chairman of the Risk Management Committee -Gulf Investment CorporationExecutive Director- General Reserve SectorKuwait Investment Authority
H.E. Mr. Khaled S. Al-Khattaf * ***Chairman of the Board - Gulf Investment CorporationChief Executive Officer & Managing DirectorNomura Saudi Arabia
Kingdom of Saudi Arabia
H.E. Mr. Khalid A. Al-Bassam ** *** Chairman Bahrain Islamic Bank
H.E. Mr. Saeed Rashed AlYateem ** ****Chairman of Remuneration andHuman Resources Committee -Gulf Investment CorporationAssistant Undersecretary of Budget and Revenue Ministry of Finance
H.E. Dr. Hussain Ali Al-Abdulla ** *** Chairman of the Audit Committee - Gulf Investment CorporationBoard Member - Executive Qatar Investment Authority
H.E. Mr. Abdul Kader Askalan ** ***Chief Executive Officer Oman Arab Bank
H.E. Mr. Faisal M. H. Boukhadour ** ****Advisor in the Diwan of H.H. the Prime Minister
H.E. Mr. Turki AlMalik ** **** Deputy Chief Executive OfficerChief Operating OfficerSaudi Arabian Investment Co. (Sanabil Investments)
State of Kuwait

5

Chairman’sStatement
Annual Report and Accounts 2012Gulf Investment Corporation G.S.C. and Subsidiaries
6
Chairman’s Statement
7
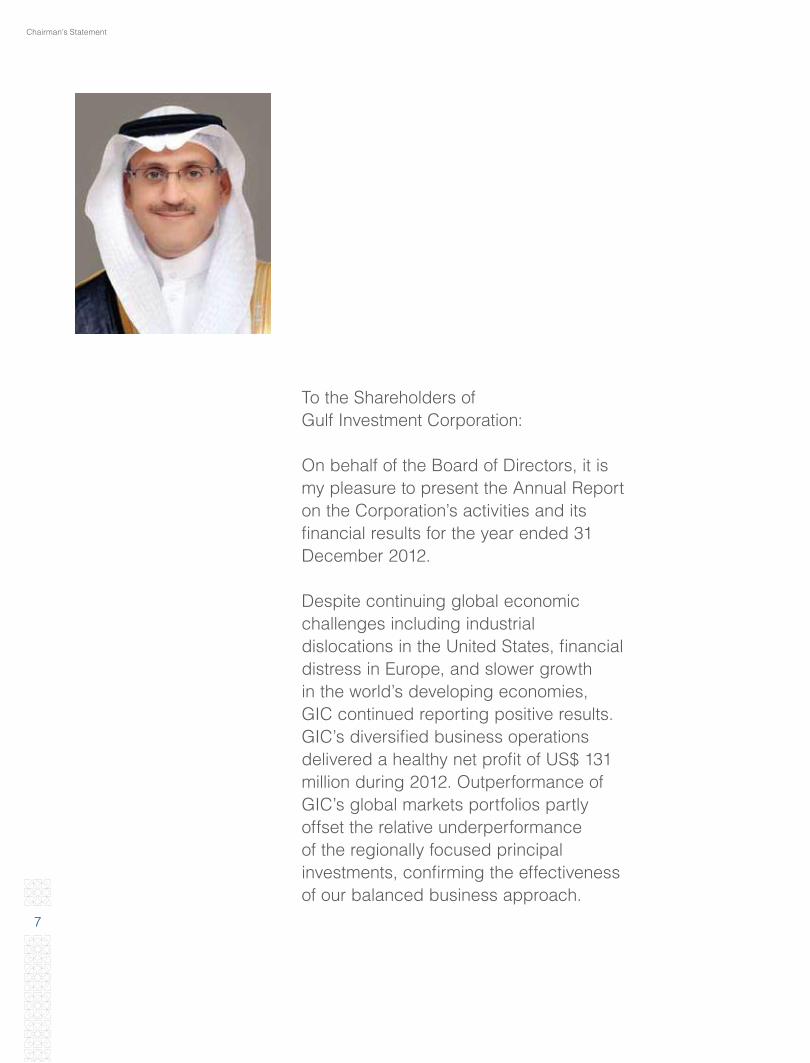
To the Shareholders of Gulf Investment Corporation:
On behalf of the Board of Directors, it is my pleasure to present the Annual Report on the Corporation’s activities and its financial results for the year ended 31 December 2012.
Despite continuing global economic challenges including industrial dislocations in the United States, financial distress in Europe, and slower growth in the world’s developing economies, GIC continued reporting positive results. GIC’s diversified business operations delivered a healthy net profit of US$ 131 million during 2012. Outperformance of GIC’s global markets portfolios partly offset the relative underperformance of the regionally focused principal investments, confirming the effectiveness of our balanced business approach.
Annual Report and Accounts 2012Gulf Investment Corporation G.S.C. and Subsidiaries
8
The corporation’s financial condition remains robust with
continuing strength in each of its key financial indicators.
GIC’s capital base is in excess of US$ 2.3 billion at 31st
December 2012, and its Tier 1 capital ratio stands at a
solid 29.5%, well above regional and international minimum
requirements. Other positive attributes of the balance sheet
included high liquidity levels and a strong funding profile.
During the year, total assets grew modestly at 7%, resulting
in a conservative leverage multiple of 2.8 times for aggregate
assets to total shareholders’ equity. Sound enterprise risk
management, effective internal control frameworks, and
international corporate governance standards will continue to
be important elements of the GIC corporate strategy.
GIC continues to focus on principal investment projects and
the capital markets within the GCC countries, thus fulfilling
its mission as the GCC’s development investor. Although
the book value of GIC’s regional project investments stood
at US$ 2.2 billion as of the 2012 year end, the intrinsic (fair
market) value underlying these investments are significantly
higher. In addition to commitments made into ventures
in sectors of historical interest including power & water,
telecommunications, financial services, and industrial
manufacturing, the business team is also exploring the
viability of investments in new sectors of particular interest
for GCC development including agri-business, healthcare
and education. The strong foundation for successful
project investing established over the years will enable the
corporation to embark on an accelerated growth plan for
direct investments in the GCC region. In this way, GIC seeks to
expand its already significant impact on the economic growth,
economic diversification, and capital markets development of
the GCC countries for years to come.
GIC is also keen to contribute towards the development of
the regional capital markets through its expanded asset
management and investment banking activities. With its deep
knowledge of the region’s business environment and strong
networking capabilities within the private and public sectors,
GIC intends to become an increasingly important player in
development of GCC capital markets while also producing
cash profits for its operations in the process.
Likewise, GIC will continue to contribute significantly to
human resource development in the GCC region by providing
opportunities for job creation in key industrial sectors as well
as by establishing on-the-job training programs for young
professionals. It is GIC’s objective to introduce and impart
international best practice concepts to the regional talent pool.
And last but not least, and on behalf of the Board of Directors,
I wish to take this opportunity to extend my appreciation
to the Royal Highnesses, Kings and Amirs, rulers of the
GCC countries for their continuous support, and special
thanks to the State of Kuwait for hosting GIC’s headquarters
and extending all the support needed for its continued
effectiveness. I would also like to extend my appreciation to the
Excellencies the Ministers of Finance of the Gulf Cooperation
Council for their support. I would like to emphasize here the
valuable contributions by members of Board’s executive, risk,
audit and HR Committees, and take this opportunity to express
gratitude, as well as to the management and staff of GIC for
their commitment and efforts.
With its solid capital position, excellent professional
capabilities, and strong track record, GIC has established
itself as a regional leader in its chosen fields of business
and is well positioned to take advantage of the emerging
opportunities for year to come. The Board will continue to
play a vital role in providing strategic guidance and support
to the management at GIC and look forward to its
continuing success.
H.E. Mr. Khaled S. Al-Khattaf
Chairman

9
Economic Review

Annual Report and Accounts 2012Gulf Investment Corporation G.S.C. and Subsidiaries
101 Consensus Forecasts, October 2012: “Global Outlook: 2012-2020” 2 BCA July 23, “European Crisis: The Next Installment”.3 FRB Speech, Bernanke B. “U.S. Monetary Policy and International Implications”, October 14.4 The IMF WEO Update, January 2013.5 EIA August 2012: “Oil Prices Peaked Early in 2012”.6 EIA Brief January 2013: “Average 2012 crude oil prices remain near 2011 levels”.7 EIA March 2013: “Short-term Energy Outlook”.8 Helbling T.: “On the Rise”, Finance & Development, March 2013.
Global Economic PerformanceIn 2012, the global economic performance was moderated by several headwinds that included contagion risks from the ongoing European debt crisis, the U.S. policy uncertainty, global trade contraction, regression of several emerging economies in Asia and Latin America and the geopolitical tensions in the Middle East. In the eurozone, rounds of negotiations and summits failed to restore normalcy in the single currency area and the dismal European economic performance largely weighed on global economic growth in 2012. Spikes of upheaval included the crisis of the EU bailout of Greece following formation of the three-party coalition government with strong anti austerity sentiments, the resignation of the technocrat government in Italy, and the spread of uncertainty over global markets and the crisis of Spanish banks and the downgrading of many European banks by rating agencies. In addition to Greece, the financial health of other peripheral economies, notably Italy and Spain, deteriorated markedly in the summer of 2012 and their long term debt sore over the summer to levels (+7%)1. With policy wrangling over bailouts and the debate over austerity versus growth, the single European currency remained markedly weak during the year. Furthermore, with staggering debt to GDP ratios in the EU, especially Italy, Greece, and Portugal and high deficit to GDP especially in Ireland at 13%, the transmission from global macro decisions to global markets was very swift and the response of global markets to the stream of gloomy news has been equally fast and disappointing2. Confidence was partially restored and markets rallied when the European Central Bank chief pledged to do whatever it takes to protect the eurozone from collapse - including fighting unreasonably high government borrowing costs. As a result, global equity markets closed the year realizing fairly good gains.
Despite massive monetary easing programs and improvements in the auto and housing markets, the growth of the U.S economy remained frustratingly slow throughout the year largely due to government policy uncertainty and the wrangling of the two major political parties over mounting debt and budget reform in an election year that led to the imminence of the fiscal cliff outcome. Other headwinds include the effects of deleveraging by households, the still-weak U.S. housing market, tight credit conditions in some sectors, spillovers from the situation in Europe, fiscal contraction at all levels of government, and concerns about the medium-term U.S. fiscal outlook3. As a result, the US economy grew at about 2% during 2012 but the adverse effects of fiscal contraction weighed heavily on future prospects.
Under these conditions of malaise in the EU and the US, sharp contraction of global trade occurred which adversely affected emerging economies and caused economic slowdown in China, India and Brazil. Overall, emerging and developing economies decelerated from 6.3% in 2011 to 5.1% as a result of the EU and US crises. However, economic growth in the MENA region was in the vicinity of 5.1%, which is higher than the rate realized in 2011, 3.5%4.
Crude oil prices rose during the first quarter of 2012 as concerns about possible international supply disruptions pushed up petroleum prices. Prices then fell during the second quarter before turning sharply upward at the start of the third quarter. Both Brent and U.S. West Texas Intermediate (WTI) crude oil started 2012 above $100 per barrel and reached a peak in early March of just over $125 per barrel for Brent and almost $110 per barrel for WTI as positive economic news that could lead to stronger oil demand and worries about supply disruptions linked to Iran’s nuclear program contributed to higher prices5. Global slowdown and market uncertainty caused oil prices to tumble towards the end of the year compared to their higher levels in the first and third quarters. Average crude oil prices in 2012 were at historically high levels for the second year in a row. Brent crude oil averaged $111.67 per barrel, slightly above the 2011 average of $111.26. West Texas Intermediate oil averaged $94.05 per barrel in 2012, down slightly from $94.88 in 2011. The differential between Brent and WTI spot prices historically was just a few dollars per barrel in either direction. The surge in production of shale rock and tight rock or sand formation caused oil price differentials to increase6.
To illustrate, U.S. oil production exceeded an average level of 7 million barrels per day during November and December 2012, the highest volume since December 19927. In 2011, the Brent premium over WTI averaged $16.38 per barrel; however, in 2012 this premium widened to $17.61 per barrel and the average OPEC oil price for the year hovered around $111 to the barrel. The sudden takeoff in the production of oil and gas from unconventional sources in recent years is another case in which high prices and new technologies combined to turn a previously uneconomical resource into an economically viable one8. Yet, the interaction of increased tight and shale oil production in North America, the regression of global economy and geopolitical risks in the MENA region buttressed overall oil price volatility.

Economic Review
11
With fiscal policy in check, the mature economies pursued coordinated and massively expansionary monetary easing policies. While possibly succeeded in preventing further economic deteriorations, there is no evidence that the concerted global central bank’s monetary easing efforts yielded appreciable impact on the stalling global growth.
All considered international organizations and experts steadily revised downwards their estimates of the overall world economic growth in 2012: For instance, the WTO revised it downwards to 2.5% from its earlier forecasts of 3.7%. Likewise, the IMF put the global growth at 3.1% while the EIU projected global GDP, in PPP, at around 3.1%. The World Bank Global Economic Prospects (GEP) 2012 expects the world economy in 2012 to grow at just 2.5 percent, weighed down by ripple effects from the 2008 financial crisis and the EU contagion.
In the absence of inflationary threats and with actual inflation rates in the US and EU at or below their target levels, policy rates of mature economies remained low, aiming to stimulate economic growth. Accordingly, short term interest rates were well below one percent in nominal terms, 0.10% in Japan, 0.25% in the U.S. and 0.50% in the UK, and 0.75% in the Euro area. However, with widespread fiscal policy and market uncertainties along with heavily indebted household sectors and sluggish spending increase, direct investments did not materialize in any significant amounts especially in view of the continuation of credit lending crunch by major international banks. As well, because of the general global economic slowdown which kept commodity prices in check, inflation rates receded in most emerging and developing economies, to 6.1% in 2012. Accordingly, the monetary policy stance of emerging economies was largely accommodative and bank rates in the Asian and Latin America economies contracted from 9.1% and 7.6% in 2011 to 7.3% and 6.6% in 2012 respectively. In the course of time, higher short term interest rates in conjunction with more rapid economic growth in Latin America and Emerging Asia attracted more capital inflows into these regions, estimated at $5.7bn and $23.6bn respectively in 20129. The resulting appreciation of domestic currencies along with cycle movements of capital inflows were tail risks to emerging economies in 2012. Bond spreads in the euro area periphery declined, while prices for many risky assets, notably equities, rose globally. By year-end, the short-term cost of borrowing on 3-months euro deposits decreased from 1.4% in 2011 to 0.6% in 2012 as funding markets conditions eased and liquidity risks subdued. The borrowing costs increased, though slightly however, on 6-months U.S. dollar deposits from 0.5% to 0.7% while it remained unchanged on 6-months Japanese yen deposits, at 0.3%10.
Despite the sluggish growth of the global economy and the fiscal policy uncertainty, global equity markets in mature economies finished the year with marked gains that varied between nearly 6% in FTSE to as high as 29% in Dax. The confidence was restored to the markets after the ECB pledged to do all what it takes to safeguard the Eurozone. Figure xx below shows the slow global economic performance versus the annual y-o-y growth of selected equity indices.
Figure 1: Daily Prices of WTI and Brent Crudes ($/Barrel), 2012.
Source: Bloomberg.
Differentials
1-Jan-12 1-Feb-12 1-Mar-12 1-Apr-12 1-May-121-Jun-12 1-Jul-12 1-Aug-12
1-Sep-121-Oct-12 1-Nov-12
1-Dec-12
0140
-5120
-10100
-15
80
-20
60
-25
40
-30
20
0
WTI BRENT
Differentials (RHS)Price (LHS)
$/Ba
rrel
$/Ba
rrel
9 IIF Research Note, January 22, 2013.10 IMF, WEO Update, January 30, 2013.

Annual Report and Accounts 2012Gulf Investment Corporation G.S.C. and Subsidiaries
12
Source: IMF-WEO, Bloomberg.
Figure 2: 2012 GDP Growth, Inflation and Stock Market Performance for Selected Regions and Countries
CAC40
15.2%
29.1%
5.8%
DOW JONES
7.3%
16%
13.4%
DAX NASDAQ
FTSE S&P
Global Equity Indices YoY Growth
GDP Growth,Germany, 0.9%
GDP Growth,Spain, -1.4%
GDP Growth,Italy, -2.3%
Inflation,Italy, 3.0%
Inflation,Germany, 2.2% Inflation,
USA, 2.0%
GDP Growth,EU, -0.2%
GDP Growth,USA, 2.2%
Global Economic Growth
Inflation,EU, 2.5%
Inflation,Spain, 2.4%
11 Espinoza R. and Prasad, A 2012, “Monetary policy transmission in the GCC COUNTRIES” IMF WP/12/132.
GCC Economic PerformanceIn 2012, the GCC economies achieved an overall real economic growth that GIC estimates at 6.2% with KSA realizing 6.6%, Kuwait 6.3%, Qatar 6.2%, Oman 5.5%, the UAE 4.2% and Bahrain at 3.5%. The drivers of GCC economic growth are anchored on several solid foundations. The first is the continued fiscal expansion that the GCC economies have been pursuing since 2008 along with the solidified partnership with private sector corporations and institutions. The partnership yielded dividends seen by the rising share of the non-oil sector in the total GDP of the GCC economies; for instance in KSA, the non-oil private sector grew at nearly 7% in 2012. The expansive fiscal pace, gauged by the annual increases in government spending on social programs and investment projects, is indicated by apparent increase in actual outlays year-on-year as well as by the high share of government in the GDP of the GCC economies, 35% on average. Secondly, the GCC economies have embarked on massive projects especially in the energy and infrastructure sectors which tend to have high investment multiplier effect. It is estimated that the GCC investments in these sector will exceed the $1.1 trillion mark over the course of the next ten years. Thirdly, the economies benefitted from firm oil prices which averaged around $111 to the barrel during 2012. The fourth foundation is in terms of the continued efforts to reform the economic and administrative environments including the mortgage law, the labor market mobility, the enhanced investment and doing business measures and laws and the increased competitiveness rankings of the GCC economies among countries of the world. These improvements also resulted in a steady increase in foreign direct investments flows. In 2012 the net FDI, FDI inward minus FDI outward, reached $27.9 billion during 2012, which is comparatively less than 2009 record high of 36 billion dollars but is higher by about $4 billion than the net inflows of 2011. Saudi Arabia has the highest stock of 15 billion dollars followed by UAE and Qatar.
The GCC economies continued to follow USD-pegged or nearly-pegged exchange rate and an open capital accounts policy. Accordingly, the discount rates followed those of the US rates. For instance, the discount rate of KSA remains at 0.3% from Jan to December 2012. Kuwait had a higher rate of 2.5% until October when the Central Bank reduced it by 50 basis point to 2%. The rest of the GCC also maintain higher discount rates, in part to attract deposits and affect broad money and liquidity. In addition to policy rates, the GCC monetary authorities use reserve requirements, loan-to-deposit ratios, and other macro-prudential tools to affect liquidity, credit and price stability11. Average lending rates are markedly higher than discount rates in the GCC and range between 4.8% in Kuwait to 5.5% and 5.7% in Qatar and Oman respectively with the highest average lending rate in Bahrain at 6%. While credit expansion remained moderate throughout the year under 3% for 2012, it grew at somewhat higher rates in KSA, Qatar and Oman.
A key economic policy anchor is the stability of domestic prices for consumers and producers. Arguably, price stability is important for the GCC economies for three principle reasons: First, it helps reduce inflation risk premia in interest rates (i.e. compensation creditors ask for the risks associated with holding nominal assets). This reduces real interest rates and increases incentives to invest. Second, price stability creates transparency of the price mechanism and enhances the efficiency of concluding economic transactions. Third, price stability helps attract foreign investments and maintain project costs according to plans while keeping demands for wage increases satisfied at least budgetary increments for public and private enterprises and agencies.

Economic Review
13
During 2012, official and international sources suggest that price changes remained in the range of 1% to 5% in virtually all the six countries. Lowest inflation rates were in the UAE, under 1%, Qatar and Kuwait had rates in the vicinity of 3 to 3.5% while Oman and KSA experienced rates of 4.1% and 5% respectively which are slightly higher than rates of mature economies, but lower than those that obtained in emerging countries such as India and China.
The GCC trade increased in 2012 relative to 2011 in terms of imports and exports. Taken as a whole block, the GCC exports to the world grew at 12.6% during the ten-month Jan-Oct 2012 relative to the same monthly period in 2011. Imports from the world economies into the GCC also increased, at slightly a higher rate of 12.91%. Commensurate with the pattern that has been realizing over the past few years, the directions of GCC trade is changing. For instance in 2012, GCC exports to China and Japan increased by 20% and 14% respectively while GCC exports to the EU contracted by 2.75% relative to levels of 2011. Likewise, GCC imports from Japan and China grew at 30% and 18% respectively while GCC imports from the EU experienced a modest growth of 5%12. By and large the GCC economies continue to realize substantial trade surpluses which range between 10% and 30% of GDP.
As a result of sustained growth over the past few years and the realization of extensive trade surpluses, the GCC economies have been able to accumulate significant foreign reserves and retire their government and total debt, private and public. For instance, KSA whose total external debt was 122.7 USD billion during 2005, has been dropping steadily until it reached 36.2 USD billion in 2012. The UAE currently owes 84 USD Billion in 2012. In terms of share in GDP, total and external debts tend to be small, ranging between less than 0 percent to about under 50% in most GCC economies.
Stock Markets Despite the prevailing uncertainty in the global markets and especially in the US, US indices managed to achieve significant gains year on year, led by Nasdaq at 16% followed by S&P500 at 13.4%. Nasdaq’s growth spur is attributed mainly to the technology denominated indices. Dow Jones realized smaller growth in 2012 at 7.3%. Third quarter of 2012 was the most profitable compared to third quarter 2011 when all three US indices leaped by an y-o-y average growth of 26.5%. The performance of the US indices failed to sustain during the last quarter of the year as tension elevated over the nation’s fiscal cliff.
Likewise, European indices fared well in 2012 compared to US indices as risk of Greece exiting the EU was silenced by the second bailout agreement and strong continuous support from Germany, the European Central Bank (ECB) and other EU countries. The first two quarters of the year were characterized by severe losses across most EU indices during the grueling negotiations for Greece bailout plans and Spain’s request for support for its banking sector. Greece’s stock index tumbled by 52.2% y-o-y by June 2012, followed by 35% y-o-y drop in Portugal’s index as Spain and Italy’s indices incurred y-o-y losses of 29% and 32% respectively. Equity markets recovered during the second half of the year leading to double digit 2012 gains of 15.2% for Cac, 17% for Iseq and a soaring 29% for Dax as Greece, Italy, UK and Portugal indices trailed behind at 9.5%, 7.8%, 5.8% and 2.9% respectively for the year. Spain’s index ended 2012 at a loss of 4.5%.
12 IMF, Directions of Trade, DOTS, March 2013. To-date, monthly data are available in DOS for 2012 from Jan to October and hence our assessment above is not based on full-year trade analysis.
Source: Bloomberg.
Figure 3: EU and BRIC Indices 2012 performance
IBOV
7.4%
22.9%
HSI
PSI20
2.9%
9.5%
ASE
FTSE MIB
7.8%
17.1%
ISEQ
SENSEX
25.7%
22.9%
NIKKEI
RTS STD
5.4%
-4.8%
MADX
The economic slowdown in China, India and Japan did not prevent their equity market indices from realizing double digit gains for 2012. They picked up the pace during the last 2 quarters of the year as risk and uncertainty about the EU crisis receded. India’s stock market index posted a 25.7% rise y-o-y, followed by 22.9% for Hang Seng and Nikkei each.

Annual Report and Accounts 2012Gulf Investment Corporation G.S.C. and Subsidiaries
14
Government Bond Yields Across the year 2012, most of the European countries 10-yr government bonds yields declined during the year. Because of the bailout, Greece displayed the highest yields among the euro area, with levels as high as 34.3% in January which dropped to 11.9% in December. Portugal followed 7.011% during December 2012.
However, the Brazilian and Russian equity indices realized modest growth at 7.4% and 5.4% respectively.
Despite the pouring liquidity into the emerging markets, the performance of the GCC stock indices was bleak. Abu Dhabi and KSA indices improved the most in 2012 by 9.5% and 6% respectively as Kuwait and Oman equity indices trailed behind at 2.1% and 1.2% respectively in 2012. Bahrain and Qatar stock indices retreated in 2012, incurring a y-o-y loss of 6.8% and 4.8% respectively.
Source: Bloomberg.
Figure 4: GCC Indices 2012 performance
2.1%
6.0%
Bahrain Kuwait Oman
-6.8%
-4.8%
Qatar KSA UAE
1.2%
9.5%
Source: Bloomberg.
Figure 5: PIIGS Bond Yields (%)
20 40
35
30
25
20
15
10
5
0
15
10
5
0
Jan-
12
Feb-
12
Mar
-12
Apr-1
2
May
-12
Jun-
12
Jul-1
2
Sep-
12
Aug-
12
Oct
-12
Nov-1
2
Dec-1
2
Portugal Ireland Spain Italy Greece (RHS)

Economic Review
15
The table below summarizes average yields together with volatility and spreads between opening and closing levels.
By the end of the year Germany displayed the lowest yields at 1.314%, followed by the UK at 1.826%. France displayed slightly higher yields at 1.988%. Although both Italy and Ireland’s 10 and 9 year bonds ended the year at 4.497% and 4.525% respectively, Ireland saw larger drops year on year at -46.32%, while Italy’s 10 year bond yields dropped by -36.73%.
10-year bonds in the US remained relatively steady, with year-on-year decrease of -6.3%. The year-end rate was 1.757% relative to the rate at the start of the year, 1.78%. In Emerging markets, India displayed highest bond yield rates at just over 8% in December, followed by Russia at 6.9%. China and Brazil ended the year at lower rates of 3.6% and 2.5% respectively during December of 2012. That said, China was the only BRIC country whose yields rose, albeit marginally, at 4.41% y-o-y, relative to India, Russia and Brazil where the yields declined year-on-year by -6.0%, -18.8% and -35.5% respectively.
USA Portugal Ireland Greece Spain Italy UK France Germany Brazil Russia India China
Opening Value (Jan 1, 2012) 1.876 13.361 8.430 34.963 5.088 7.108 1.975 3.137 1.825 3.972 8.500 8.567 3.450
Closing Value (Dec 31, 2012) 1.757 7.011 4.525 11.900 5.265 4.497 1.826 1.988 1.314 2.562 6.900 8.050 3.602
Average 1.783 10.581 6.221 24.049 5.859 5.460 1.864 2.515 1.562 3.134 7.811 8.267 3.482
Standard Deviation 0.201 2.210 1.087 6.740 0.613 0.595 0.232 0.404 0.224 0.474 0.394 0.168 0.099
MinimumValue 1.388 6.934 4.399 11.666 4.850 4.394 1.437 1.952 1.166 2.330 6.800 8.046 3.253
MaximumValue 2.377 17.393 8.481 37.101 7.621 7.159 2.442 3.358 2.054 3.972 8.550 8.783 3.618
Table 1: Volatility of Spreads, 2012
Source: Bloomberg.
Source: Bloomberg.
Figure 6: Three Major Euro Area Bond Yields (%)
0.0
0.5
1.0
1.5
2.0
2.5
3.0
3.5
4.0
Jan-12 Feb-12 Mar-12 Apr-12 May-12 Jun-12 Jul-12 Sep-12Aug-12 Oct-12 Nov-12 Dec-12
UK France Germany

Annual Report and Accounts 2012Gulf Investment Corporation G.S.C. and Subsidiaries
16
Table 2: Government Bond Yields (%) during 2012
Source: Bloomberg.
End of Month USA Portugal Ireland Greece Spain Italy UK France Germany Brazil Russia India China
January 1.797 16.399 7.288 34.314 4.974 5.954 1.968 3.043 1.786 3.746 8.310 8.276 3.414
February 1.971 13.751 7.009 34.792 4.989 5.188 2.147 2.872 1.817 3.536 7.915 8.199 3.568
March 2.209 11.529 6.845 21.084 5.353 5.116 2.201 2.879 1.792 3.509 7.820 8.542 3.538
April 1.914 10.626 6.820 20.177 5.768 5.512 2.111 2.954 1.662 3.349 7.985 8.670 3.561
May 1.558 12.026 7.364 30.827 6.561 5.895 1.568 2.348 1.199 3.551 7.985 8.498 3.402
June 1.645 10.161 6.466 25.829 6.329 5.819 1.731 2.679 1.581 3.260 7.985 8.183 3.347
July 1.468 11.196 6.088 25.455 6.749 6.083 1.468 2.056 1.284 2.747 8.155 8.247 3.303
August 1.548 9.311 5.941 23.407 6.857 5.847 1.463 2.152 1.333 2.838 7.925 8.241 3.410
September 1.634 9.002 5.109 19.494 5.938 5.092 1.725 2.174 1.441 2.649 7.885 8.151 3.486
October 1.690 8.185 4.733 17.767 5.616 4.960 1.851 2.239 1.462 2.607 7.430 8.216 3.590
November 1.616 7.636 4.494 16.131 5.317 4.498 1.773 2.046 1.385 2.497 6.980 8.176 3.552
December 1.757 7.011 4.525 11.900 5.265 4.497 1.826 1.988 1.314 2.562 6.900 8.050 3.602
Y-O-Y % change -6.33 -47.53 -46.32 -65.96 3.48 -36.73 -7.54 -36.63 -28.00 -35.50 -18.82 -6.03 4.41
Credit Default Swaps (CDS)Credit Default Swaps (CDS) experienced improvements in 2012 due to improved sentiments and reduced volatility relative to 2011. As summarized in Table 3 below, the decline in CDS averaged 44%, with a maximum value of -69% and a minimum of -26%. The CDS of Ireland dropped by 69% during the year followed by Portugal and Greece whose respective CDS trended down by 59% 51%. The CDS of the USA were also declined by 26% at year-end 2012. As MENA geopolitical tensions cooled down, the level of CDS dropped led by a 50% decline in Bahrain and 48% drop in Dubai.
Table 3: CDS for the EU, USA and GCC during 2012.
Source: Bloomberg.
Portugal Ireland Greece Spain Italy USA Bahrain Abu Dhabi Dubai KSA Qatar
Opening Value 1085.00 707.99 8617.90 405.00 490.11 50.92 376.90 125.54 436.44 127.65 126.55
Closing Value 442.94 220.00 4265.00 299.50 289.00 37.69 190.00 84.00 225.00 72.00 82.43
Average 855.23 475.70 10049.35 431.03 404.35 39.56 315.61 115.76 331.77 110.55 116.50
Standard Deviation 299.43 180.36 4740.99 99.49 93.28 6.48 69.87 17.92 65.51 22.72 17.93
Minimum Value 410.75 176.30 4193.50 271.70 230.00 28.87 190.00 76.50 215.00 67.85 76.76
Maximum Value 1581.66 724.36 25960.76 642.42 570.24 51.36 430.00 150.33 473.16 150.58 150.50
Economic Review
17
GCC Equity Markets Review - 2012
Overview
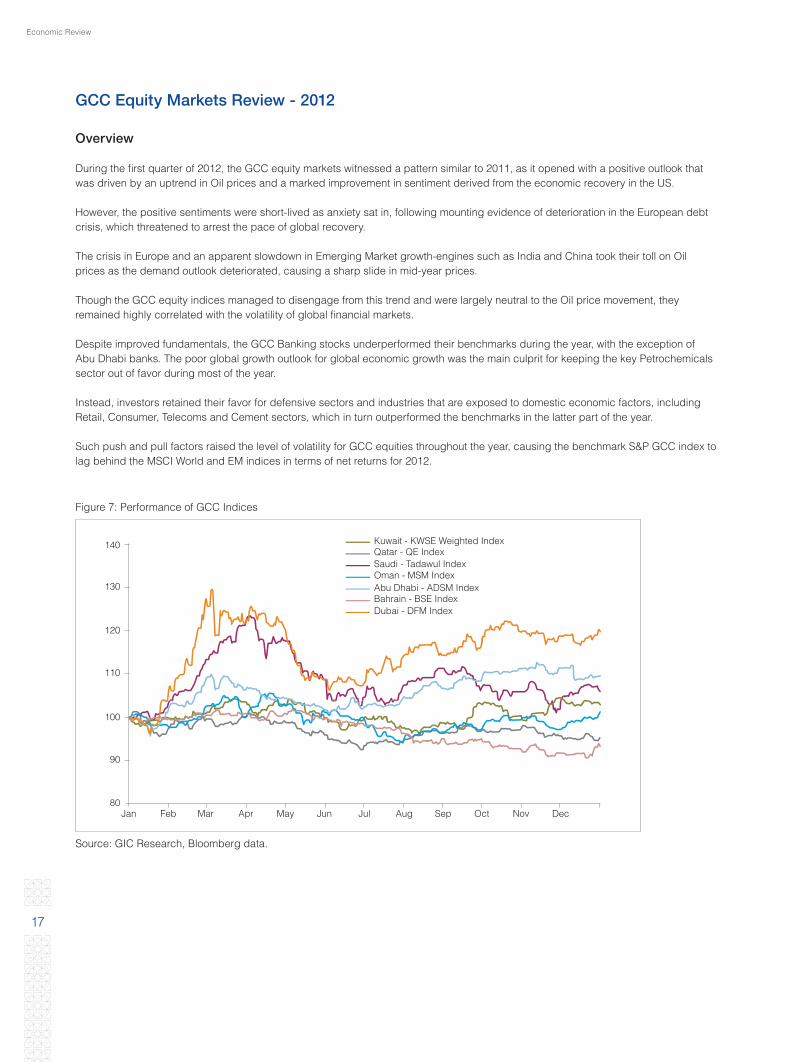
During the first quarter of 2012, the GCC equity markets witnessed a pattern similar to 2011, as it opened with a positive outlook that was driven by an uptrend in Oil prices and a marked improvement in sentiment derived from the economic recovery in the US.
However, the positive sentiments were short-lived as anxiety sat in, following mounting evidence of deterioration in the European debt crisis, which threatened to arrest the pace of global recovery.
The crisis in Europe and an apparent slowdown in Emerging Market growth-engines such as India and China took their toll on Oil prices as the demand outlook deteriorated, causing a sharp slide in mid-year prices.
Though the GCC equity indices managed to disengage from this trend and were largely neutral to the Oil price movement, they remained highly correlated with the volatility of global financial markets.
Despite improved fundamentals, the GCC Banking stocks underperformed their benchmarks during the year, with the exception of Abu Dhabi banks. The poor global growth outlook for global economic growth was the main culprit for keeping the key Petrochemicals sector out of favor during most of the year.
Instead, investors retained their favor for defensive sectors and industries that are exposed to domestic economic factors, including Retail, Consumer, Telecoms and Cement sectors, which in turn outperformed the benchmarks in the latter part of the year.
Such push and pull factors raised the level of volatility for GCC equities throughout the year, causing the benchmark S&P GCC index to lag behind the MSCI World and EM indices in terms of net returns for 2012.
Source: GIC Research, Bloomberg data.
Figure 7: Performance of GCC Indices
Kuwait - KWSE Weighted IndexQatar - QE IndexSaudi - Tadawul IndexOman - MSM IndexAbu Dhabi - ADSM IndexBahrain - BSE IndexDubai - DFM Index
140
130
120
110
100
90
80Jan Feb Mar Apr May Jun Jul Aug Sep Oct Nov Dec
Annual Report and Accounts 2012Gulf Investment Corporation G.S.C. and Subsidiaries
18
Source: GIC Research, Bloomberg data.
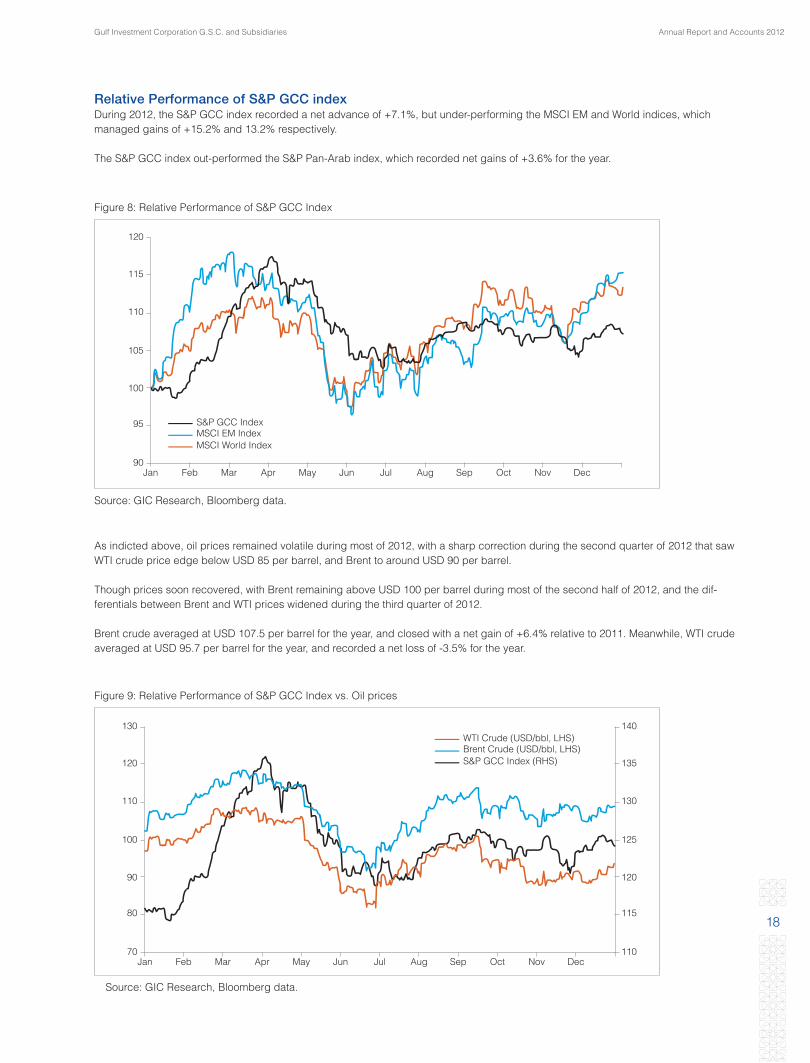
Figure 8: Relative Performance of S&P GCC Index
Source: GIC Research, Bloomberg data.
Figure 9: Relative Performance of S&P GCC Index vs. Oil prices
Relative Performance of S&P GCC indexDuring 2012, the S&P GCC index recorded a net advance of +7.1%, but under-performing the MSCI EM and World indices, which managed gains of +15.2% and 13.2% respectively.
The S&P GCC index out-performed the S&P Pan-Arab index, which recorded net gains of +3.6% for the year.
As indicted above, oil prices remained volatile during most of 2012, with a sharp correction during the second quarter of 2012 that saw WTI crude price edge below USD 85 per barrel, and Brent to around USD 90 per barrel.
Though prices soon recovered, with Brent remaining above USD 100 per barrel during most of the second half of 2012, and the dif-ferentials between Brent and WTI prices widened during the third quarter of 2012.
Brent crude averaged at USD 107.5 per barrel for the year, and closed with a net gain of +6.4% relative to 2011. Meanwhile, WTI crude averaged at USD 95.7 per barrel for the year, and recorded a net loss of -3.5% for the year.
120
115
105
95
90
100
110
Jan Feb Mar Apr May Jun Jul Aug Sep Oct Nov Dec
S&P GCC IndexMSCI EM IndexMSCI World Index
140
135
125
115
70 110
120
130
120
100
80
90
110 130
FebJan Mar Apr May Jun Jul Aug Sep Oct Nov Dec
WTI Crude (USD/bbl, LHS)Brent Crude (USD/bbl, LHS)S&P GCC Index (RHS)
Economic Review
19
Dec ‘11 Dec ‘12 % Chg
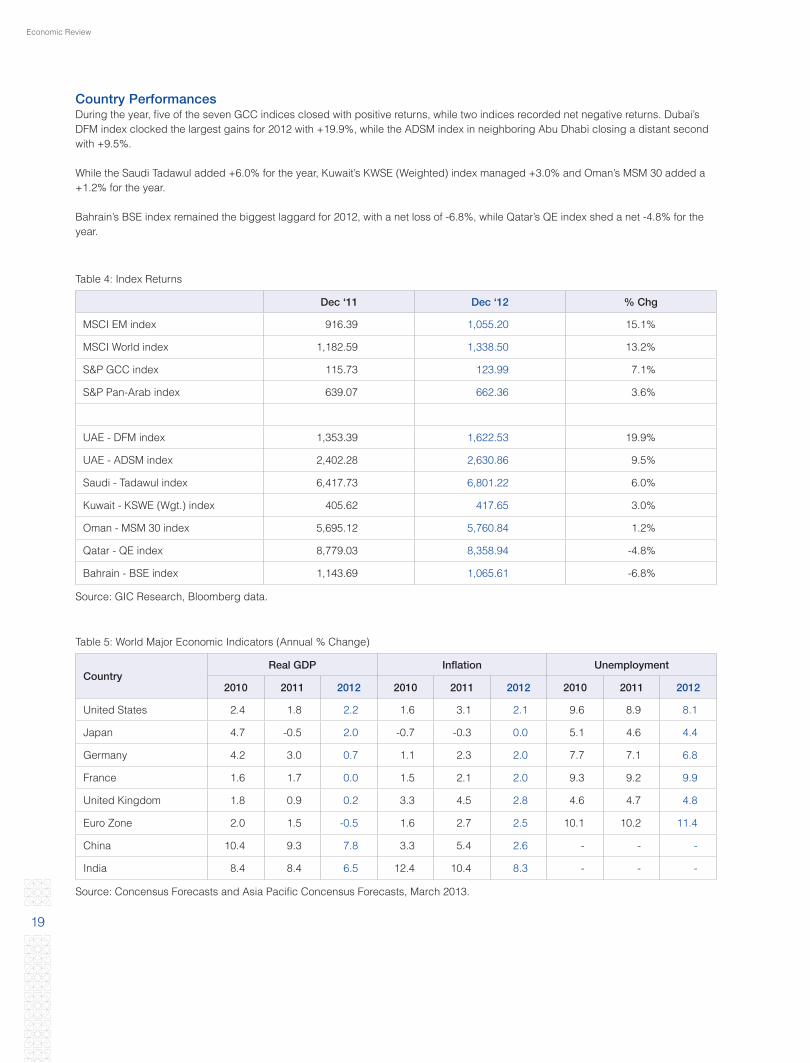
MSCI EM index 916.39 1,055.20 15.1%
MSCI World index 1,182.59 1,338.50 13.2%
S&P GCC index 115.73 123.99 7.1%
S&P Pan-Arab index 639.07 662.36 3.6%
UAE - DFM index 1,353.39 1,622.53 19.9%
UAE - ADSM index 2,402.28 2,630.86 9.5%
Saudi - Tadawul index 6,417.73 6,801.22 6.0%
Kuwait - KSWE (Wgt.) index 405.62 417.65 3.0%
Oman - MSM 30 index 5,695.12 5,760.84 1.2%
Qatar - QE index 8,779.03 8,358.94 -4.8%
Bahrain - BSE index 1,143.69 1,065.61 -6.8%
Country PerformancesDuring the year, five of the seven GCC indices closed with positive returns, while two indices recorded net negative returns. Dubai’s DFM index clocked the largest gains for 2012 with +19.9%, while the ADSM index in neighboring Abu Dhabi closing a distant second with +9.5%.
While the Saudi Tadawul added +6.0% for the year, Kuwait’s KWSE (Weighted) index managed +3.0% and Oman’s MSM 30 added a +1.2% for the year.
Bahrain’s BSE index remained the biggest laggard for 2012, with a net loss of -6.8%, while Qatar’s QE index shed a net -4.8% for the year.
Table 4: Index Returns
Table 5: World Major Economic Indicators (Annual % Change)
Source: GIC Research, Bloomberg data.
Source: Concensus Forecasts and Asia Pacific Concensus Forecasts, March 2013.
CountryReal GDP Inflation Unemployment
2010 2011 2012 2010 2011 2012 2010 2011 2012
United States 2.4 1.8 2.2 1.6 3.1 2.1 9.6 8.9 8.1
Japan 4.7 -0.5 2.0 -0.7 -0.3 0.0 5.1 4.6 4.4
Germany 4.2 3.0 0.7 1.1 2.3 2.0 7.7 7.1 6.8
France 1.6 1.7 0.0 1.5 2.1 2.0 9.3 9.2 9.9
United Kingdom 1.8 0.9 0.2 3.3 4.5 2.8 4.6 4.7 4.8
Euro Zone 2.0 1.5 -0.5 1.6 2.7 2.5 10.1 10.2 11.4
China 10.4 9.3 7.8 3.3 5.4 2.6 - - -
India 8.4 8.4 6.5 12.4 10.4 8.3 - - -
Annual Report and Accounts 2012Gulf Investment Corporation G.S.C. and Subsidiaries
20
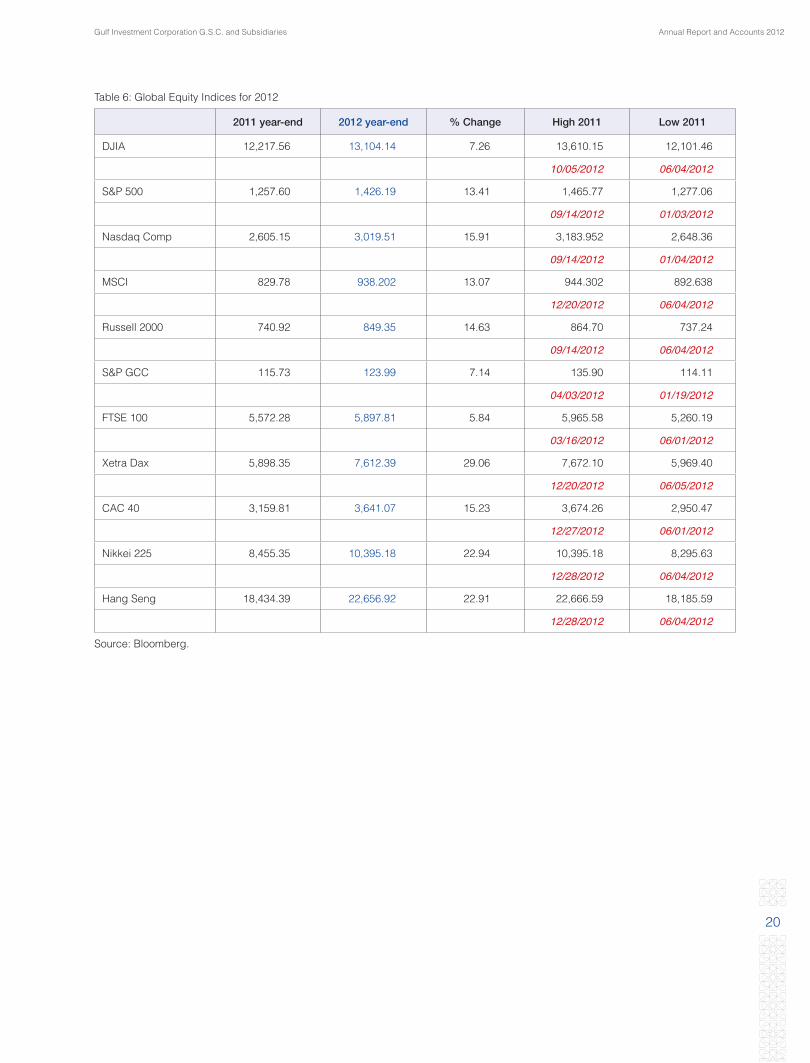
2011 year-end 2012 year-end % Change High 2011 Low 2011
DJIA 12,217.56 13,104.14 7.26 13,610.15 12,101.46
10/05/2012 06/04/2012
S&P 500 1,257.60 1,426.19 13.41 1,465.77 1,277.06
09/14/2012 01/03/2012
Nasdaq Comp 2,605.15 3,019.51 15.91 3,183.952 2,648.36
09/14/2012 01/04/2012
MSCI 829.78 938.202 13.07 944.302 892.638
12/20/2012 06/04/2012
Russell 2000 740.92 849.35 14.63 864.70 737.24
09/14/2012 06/04/2012
S&P GCC 115.73 123.99 7.14 135.90 114.11
04/03/2012 01/19/2012
FTSE 100 5,572.28 5,897.81 5.84 5,965.58 5,260.19
03/16/2012 06/01/2012
Xetra Dax 5,898.35 7,612.39 29.06 7,672.10 5,969.40
12/20/2012 06/05/2012
CAC 40 3,159.81 3,641.07 15.23 3,674.26 2,950.47
12/27/2012 06/01/2012
Nikkei 225 8,455.35 10,395.18 22.94 10,395.18 8,295.63
12/28/2012 06/04/2012
Hang Seng 18,434.39 22,656.92 22.91 22,666.59 18,185.59
12/28/2012 06/04/2012
Table 6: Global Equity Indices for 2012
Source: Bloomberg.
Economic Review
21
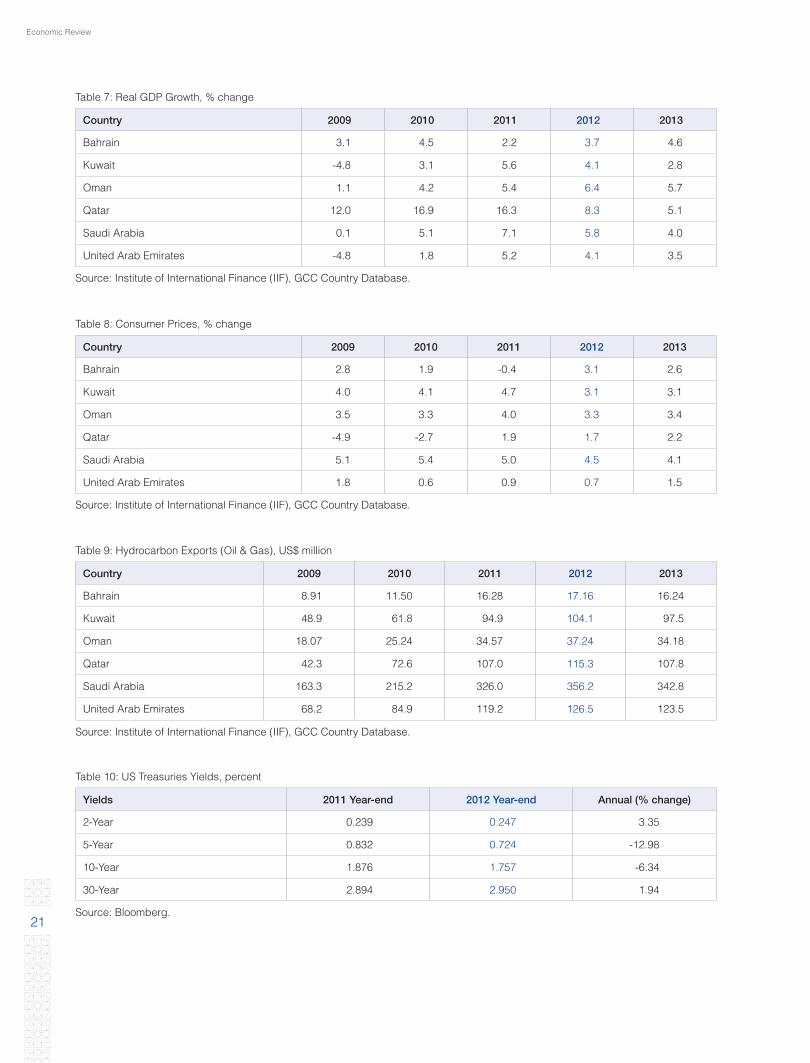
Country 2009 2010 2011 2012 2013
Bahrain 3.1 4.5 2.2 3.7 4.6
Kuwait -4.8 3.1 5.6 4.1 2.8
Oman 1.1 4.2 5.4 6.4 5.7
Qatar 12.0 16.9 16.3 8.3 5.1
Saudi Arabia 0.1 5.1 7.1 5.8 4.0
United Arab Emirates -4.8 1.8 5.2 4.1 3.5
Country 2009 2010 2011 2012 2013
Bahrain 2.8 1.9 -0.4 3.1 2.6
Kuwait 4.0 4.1 4.7 3.1 3.1
Oman 3.5 3.3 4.0 3.3 3.4
Qatar -4.9 -2.7 1.9 1.7 2.2
Saudi Arabia 5.1 5.4 5.0 4.5 4.1
United Arab Emirates 1.8 0.6 0.9 0.7 1.5
Country 2009 2010 2011 2012 2013
Bahrain 8.91 11.50 16.28 17.16 16.24
Kuwait 48.9 61.8 94.9 104.1 97.5
Oman 18.07 25.24 34.57 37.24 34.18
Qatar 42.3 72.6 107.0 115.3 107.8
Saudi Arabia 163.3 215.2 326.0 356.2 342.8
United Arab Emirates 68.2 84.9 119.2 126.5 123.5
Yields 2011 Year-end 2012 Year-end Annual (% change)
2-Year 0.239 0.247 3.35
5-Year 0.832 0.724 -12.98
10-Year 1.876 1.757 -6.34
30-Year 2.894 2.950 1.94
Table 7: Real GDP Growth, % change
Table 8: Consumer Prices, % change
Table 9: Hydrocarbon Exports (Oil & Gas), US$ million
Table 10: US Treasuries Yields, percent
Source: Institute of International Finance (IIF), GCC Country Database.
Source: Institute of International Finance (IIF), GCC Country Database.
Source: Institute of International Finance (IIF), GCC Country Database.
Source: Bloomberg.

Annual Report and Accounts 2012Gulf Investment Corporation G.S.C. and Subsidiaries
22
Table 11: LIBOR Rates
Table 12: Historical and current Spot Crude Prices, Yearly Average (US$/bl)
Source: Bloomberg.
Source: Middle East Petroleum and Economic Publications (MEES), 15 March 2013.
LIBOR Rates 2011 Year-end 2012 Year-end Annual (% change)
US 3-Months 0.581 0.306 -47.33
US 1-Year 1.128 0.844 -25.18
Euro 3-Months 1.292 0.129 -90.02
Euro 1-Year 1.913 0.440 -77.00
OPEC Basket Y/Y % change Brent Y/Y % change WTI Y/Y % change
TD 2012 109.44 1.84% 111.70 0.72% 94.18 -0.94%
YTD 2011 107.46 38.75% 110.90 38.02% 95.07 19.45%
Year 2010 77.45 26.84% 80.35 30.27% 79.59 28.62%
Year 2009 61.06 -35.35% 61.68 -36.65% 61.88 -38.12%
Year 2008 94.45 36.73% 97.37 34.21% 100.00 38.33%
Year 2007 69.08 13.10% 72.55 11.34% 72.29 9.46%
Year 2006 61.08 20.60% 65.16 19.70% 66.04 16.90%

23
Financial Review
Annual Report and Accounts 2012Gulf Investment Corporation G.S.C. and Subsidiaries
24
NET INCOME ANALYSIS Gulf Investment Corporation (GIC) posted net profit of US$ 130 million for the year 2012 compared to US$ 181 million in 2011. This is after provision of US$ 25 million (2011: US$ 49 million) which mainly relates to investments in few subsidiary companies and some holdings in international private equity funds.
In a challenging global market scenario GIC’s investment in capital markets, private equity and managed funds posted excellent results for the year providing support to GIC’s core business of project investments, which by nature are for long-term and are subject to various industrial phases. Decline in profit for the year resulting mainly due to lower income from few major projects in line with the global trends in respective industries was significantly restricted by outstanding performance of debt and equity portfolios reflecting the resilience of GIC’s business model in achieving the overall objective of the economic development of GCC region. Analysis of the contributing components to the net profit confirms good asset quality and the strength of GIC’s investment philosophy.
INTEREST INCOMEInterest income is generated from the portfolio of debt securities, structured products, the money market book and loans.
Gross interest and similar income increased marginally by 2% to US$ 42 million during 2012, accruing mainly from interest bearing securities, investment in which increased by 15% during the year. An ideal mix of high yield bonds, emerging market bonds, international corporate bonds, GCC and Islamic bonds contributed to the enhancement of the overall interest income in a continued low interest rate scenario.
NET GAINS FROM INVESTMENTSNet gains from investments represent the realized gain on sale of financial assets and mark-to-market gain on financial assets at fair value, booked through statement of income.
GIC recorded a net gain of US$ 78 million during 2012, compared to US$ 33 million in the prior year. Net gains for the year comprise of realized gain of US$ 40 million on financial assets available for sale, market gain of US$ 34 million from financial assets at fair value through statement of income and US$ 4 million from partial liquidation of an associate.
DIVIDEND INCOMEDividend income of US$ 28 million (2011: US$ 24 million) comprises of receipts from private equity funds, equities and managed funds and equity participations. Dividends from equity participations amounted to US$ 21 million whereas the balance contribution is from equities and managed funds portfolios (US$ 4 million) and private equity funds (US$ 3 million).
SHARE OF RESULTS OF ASSOCIATESShare of results from associates accounted during the year amounted to US$ 98 million showing notable decline compared to prior year income of US$ 227 million, which can be mainly attributed to two major projects – one in chemicals which witnessed the peak in the prior year and another in steel industry, global downward trend in which continued throughout the current year. Investment in communication sector started showing the signs of growth recording 60% growth in income over prior year. It must be noted that the portfolio also includes new ventures, contributions from which are currently moderate, though expected to enhance significantly in the coming years, as they progress. Further, GIC’s investments in mega projects within the power, utilities, re-insurance and other sectors are expected to provide the direction for future growth.
NET FEES, COMMISSION AND OTHER INCOMEIncome from fees, commission and other income for the year amounted to US$ 26 million (2011: US$ 20 million). Fee income is mainly generated from project development/consultancy, fund management activity, financial advisory business and by providing custodial and administrative services to the funds managed by third parties. Income for the year includes project development/consultancy fees of US$ 9 million and management fees of US$ 10 million besides other income.
OTHER OPERATING INCOMEOther operating income represents the income from consolidated and other subsidiaries which at US$ 10 million increased by appox. 43% compared to prior year.
Financial Review
25
INTEREST EXPENSEInterest expense increased by 3% compared to prior year to reach US$ 61 million for the year, which can be partially attributed to raising of new funds in the last quarter of the current year. New funds were raised in anticipation of likely increase in interest rates and to prepare for the funding/refinancing requirements as per the future business plans.
OPERATING EXPENSES Control over expenses and efficiency in operations restricted the increase in operating expenses to 7% amounting to US$ 65 million for the year.
PROVISION FOR IMPAIRMENTS/MARK-TO-MARKET LOSSES Net charge for the year in impairment/mark-to-market losses totaled US$ 25 million, compared to US$ 49 million recorded in 2011. Additional provisions during 2012 relate mainly to exposures in international private equity funds and investments in few projects. The Corporation continues to adhere to its conservative provisioning policy, based on mark-to-market/fair valuations where-ever possible. A detailed break down is provided in Note 20 to the Financial Statements.
BALANCE SHEET ANALYSIS After restructuring and consolidating the balance sheet in prior years, emphasis has been to work out an ideal mix of assets and liabilities with the ultimate objective of achieving sustainable and enhanced risk adjusted return profile. Initiatives were implemented both, on the assets and liabilities sides. A growth of 7% was recorded in total assets to reach US$ 6.3 billion at the end of the year. Equity at US$ 2.3 billion declined by US$ 103 million primarily due to cash flow hedge loss of few associate companies.
The Corporation’s strategic focus continues to be on the GCC states and their major trading partners in the industrialized world. Note 22.3.1 to the Financial Statements sets out the geographic distribution of the Corporation’s credit risk exposure.
The following sections provide details on the key components of the balance sheet:
FINANCIAL ASSETS AT FAIR VALUE THROUGH STATEMENT OF INCOMEThis category includes investments in trading equities and funds of US$ 54 million, trading bond and other debt funds of US$ 177 million and alternative equity investments of US$ 390 million. The portfolio increased by US$ 56 million or 10% compared to the previous year primarily due to major increase in debt funds and alternative assets.
FINANCIAL ASSETS AVAILABLE FOR SALEAs at 31 December 2012, financial assets available for sale amounted to US$ 2,800 million, an increase of 6% over the prior year level. Debt and other interest bearing securities, constituting 67% of the financial assets available for sale increased by US$ 243 million or 15% during the year. Net exposure to GCC & Islamic Bonds and Emerging Markets Bonds & Funds was increased whereas investment in structured debt instruments declined due to redemptions, asset backed securities were fully liquidated and there was net decline of investment in International Bonds.
The debt portfolio is mainly made up of plain floating rate notes or fixed rate securities swapped into floating rate using interest rate swaps. This portfolio is monitored against stringent internal guidelines, ensuring that high quality is maintained. Major portion of the portfolio is comprised of investment grade issuers and high quality GCC sovereign credits. To diversify the risk profile and to enhance the returns, new investments were made in high yield bonds, emerging markets bonds and debt funds. A credit risk analysis of the investment securities portfolio is provided in the risk management section of this report.
Financial assets available for sale also includes investments in equities and managed funds of US$ 158 million, equity participation amounting to US$ 526 million and international & GCC private equity fund exposures of US$ 249 million. While investment in equities and managed funds broadly remained at prior year level, active management of the portfolio resulted in net cash inflow and enhancement of market gains.
Investment in equity participations declined by US$ 68 million to reach US$ 526 million at the end of the current year mainly due to decline in the market value of a major quoted project.

Annual Report and Accounts 2012Gulf Investment Corporation G.S.C. and Subsidiaries
26
The private equity funds are principally invested in equity investments of a structured finance nature with a wide range of externally managed private equity funds. These funds invest in leveraged and un-leveraged acquisitions, privatizations, recapitalizations, rapidly growing companies, expansion financings, turnaround situations and other special equity situations.
Investments in private equity funds are carried at fair value. An amount of US$ 8 million was charged to income statement for mark-to-market losses during the year.
Details on financial assets available for sale are provided in Note 5 to the financial statements.
INVESTMENT IN ASSOCIATESAn associate is a company over which the Group exerts significant influence, usually evidenced by a holding/voting power of 20% or more of the investee company. The Corporation’s investments in associates are accounted for using the equity method of accounting. Under the equity method, investment in associate is initially recognized at cost and adjusted thereafter for the post-acquisition change in the Corporation’s share of net assets of the investee company.
Principal investments in viable business ventures in the GCC region is a core activity of GIC. Over the years, the Corporation has become a predominant player and prime mover of such projects in the private sector. The focus has been on niche sectors like metal, petrochemical, power & utilities, financial services and building materials, where a sustainable competitive advantage has been built.
Investment in associates at US$ 1,559 million declined marginally by US$ 38 million, which is comprised of equity accounted income, transfer of equity bridge loans and commitment, dividend received and change due to liquidation and new investment. Gross increase in the investment was more than offset by cash flow hedge loss, detail of which is provided under “Equity” section.
OTHER ASSETSIncluding property and fixed assets, total other assets amounted to US$ 356 million at 31 December 2012. Of this US$ 110 million related to property and other fixed assets. The remaining US$ 246 million comprised of accrued interest and fees receivable, accounts receivable, margin money for derivative products, prepaid expenses and other miscellaneous assets. Details are set out in Note 7 to the Financial Statements.
LIQUIDITY AND FUNDINGTotal borrowings at US$ 3,640 million increased by US$ 507 million over the previous year. Increase of US$ 952 million in term finance is partially offset by decline in deposits by –US$ 332 million and in repos by –US$ 113 million. During the year GIC successfully raised new funds through four new issues – two in Malaysian Ringgit, one each is Swiss Franc and US Dollar. Part of the proceeds of new issues was utilized in redeeming the maturing repos and deposits.
A more detailed discussion on liquidity and funding, the various risks associated with our business activities, and capital strength is included in the Risk Management section that follows.
OTHER LIABILITIESAt US$ 349 million other liabilities comprise of trade payables of subsidiaries, accrued interest, accrued expenses, margin money for derivative products and negative fair value of derivative instruments.
EQUITYCorporation’s equity declined by – US$ 103 million to reach US$ 2,286 million. Decline in the equity is comprised of net profit for the year US$ 130 million, cash flow hedge loss of associates - US$ 261 million and investment revaluation reserve US$ 28 million.
As per the detail of cash flow hedge loss of associates provided in Note 13 of the Financial Statements, management believes that these negative fair values do not reflect the economic reality of the cash flows expected to be generated by the Associates for the reasons mentioned therein.

27
Risk Management

Annual Report and Accounts 2012Gulf Investment Corporation G.S.C. and Subsidiaries
28
The ERM Framework identifies and defines a broad spectrum of risks to which GIC’s business and operations may be exposed. These risks are: Credit, Market, Funding and Liquidity, and Operational risks.
Management of these risks through investment in knowledge and systems has been a priority at GIC. A successful blend of talent, experienced staff working with quantitative-based analytical tools, and utilizing continuously-upgraded technological infrastructure that keeps up with technological innovations are critical resources that GIC applies in order to manage risks effectively. The qualitative and quantitative techniques utilized to optimize the risk return profile incorporate information from the past with emerging trends in the current business environment along with futuristic scenarios and expectations.
The management of risk is an integral part of the corporate strategic objective. The Corporation’s business activities, in striving to achieve their financial goal of earning consistent competitive returns, entail risks. Cognizant of the interrelationship between risk and returns, the goal of risk management is to understand, analyze and manage these risks. Besides its vital role as business protector, the risk function of the Corporation strives to contribute as a business enabler as well.
In line with the corporate strategy of maintaining a robust Enterprise Risk Management (ERM) framework, several initiatives were implemented in 2012. A key aspect of GIC’s ERM efforts is its focus on effectively embedding prudent risk management practices across the various business and support functions across the institution. GIC’s solid capital adequacy, high quality asset base, strong liquidity and liability profile, moderate leverage level, sound internal processes and robust earnings are all testimony to the success of these initiatives. GIC remains a significantly resilient, measurably strong and stable financial institution. The continuous and rapidly changing business environment has increased the complexity and diversity of risks.
The goal of risk management is not to avoid risks, but rather to comprehend and manage them.
The various business activities of the Corporation expose GIC to a wide spectrum of risks. The primary goal of the risk management is to ensure that an appropriate balance is maintained between risk taking activities, the expected return and GIC’s risk appetite.
An independent Risk Management Division (RMD) formalizes the ERM Framework. The ERM framework encompasses all facets of prudent risk management via strong enterprise-wide policies, procedures and limits. With these tools Risk Management is able to identify strategic opportunities and reduce uncertainty from both operational and strategic perspectives. It also enhances GIC’s ability to manage risks, evaluate performance and allocate capital.
Risk Types
Risk Principals
Risk Appetite
Risk Processesand Tools
Enterprise Risk Consolidates

Risk Management
29
Structurally, risk management begins with the Risk Management Committee (RMC) which is composed of members from the GIC Board of Directors and senior management which defines and recommends the Corporation’s risk appetite to the Board of Directors. Sequentially, this is followed by a three step process:
a) Identifying and measuring the various risks generated,
b) Monitoring, reporting and controlling them, and finally,
c) Optimizing in relation to the return.
The Risk Management team of GIC acts as the critical link between management and the risk taking divisions by firstly assisting management to define / quantify its risk appetite. The team then effectively communicates these risk appetite parameters to the concerned risk takers in the Corporation, in order to ensure that the risk taking activity is within the management’s acceptable levels.
Within the Corporation, the responsibility for the management of risk is not restricted to a single division. The philosophy has been to encourage a culture of prudent risk management across all business and support areas.
From the “Internal Control” perspective, the process of risk management is facilitated by a set of independent functions in addition to the RMD. These units report directly to senior management, including Financial Control, Internal Audit and Compliance. This multi-faceted approach upholds the effective management of risks by identifying and monitoring them from a variety of perspectives.
The process of managing the risk categories identified above is discussed in more detail in the following sections.
CREDIT RISK Credit risk refers to the risk of an economic loss that might arise from the failure of counterparty to fulfill its contractual obligations.
World credit markets for 2012 remained stable on the backdrop of events including the debt crisis and budgetary scale down in the United States of America and the European financial crisis. The impact from most of these linger on at varying levels of intensity. GIC with its active portfolio management registered an impressive performance on the credit portfolios. GIC remained totally unscathed during the year, registering nil credit losses, thanks to prudent proactive measures, stringent control frameworks and continuous monitoring. While the Corporation’s credit portfolio, mainly made up of debt securities, constitutes a material portion of the overall asset base, strong internal risk guidelines and proactive portfolio management ensure that high quality is maintained at all times. Notwithstanding the Corporation’s rigorous and prudent policies for provisioning, no material write-downs were required during 2012. This is a reflection of the good quality of the portfolio. GIC’s credit portfolios recorded valuations gains of approximately US$ 80.7 million during the year in review.
GIC’s credit portfolios contains no material exposure to troubled European sovereigns. Moreover, GIC continued to focus on regional credit markets where the team has a better understanding of inherent risks. This has resulted in an enhanced risk return profile. The size of the high quality asset backed securities portfolio continued to contract, a result of accelerated prepayments and maturities, with minimal impact on profitability and earnings, while contributing to the overall reduction of credit risk. The Corporation continued to be flexible and ready to adapt rapidly to unforeseen events along with the efficient utilization of conventional risk management tools, including mathematical and statistical models.
The primary tool used in the management of credit risk is a set of well defined credit policies and procedures. In addition to communicating management’s risk appetite in the form of country, product, industry and obligor limits, these policies also detail the process of measurement, monitoring and reporting. The stringent credit approval framework mandates a rigorous and thorough evaluation of creditworthiness of each obligor, after which limits are approved by management. Additionally, limits for product and industry are also defined to ensure broad diversification of credit risk. Credit policies and procedures are designed to identify, at an early stage, exposures which require more detailed monitoring and review.
The credit risk management process applies pertinent statistical methods as well, to estimate expected and unexpected loss amounts for the various business activities. The system, based on the Creditmetrics methodology, enables accurate credit risk measurement on an individual exposure as well as a portfolio basis. Expected and Unexpected loss estimates are computed based on Probabilities of Default (PD) and Loss Given Default (LGD) data published by leading rating agencies.
The Debt Capital Markets (DCM) portfolio which forms the largest asset class and constitutes approximately 33% of the balance sheet is monitored against a Credit Value at Risk (credit VaR) limit, approved by the board. The US$ 190 million VaR limit (99.96% confidence, 1 year), which supplements the existing notional limits for this portfolio, is based on the Creditmetrics methodology and is measured using Monte Carlo simulation techniques.
Annual Report and Accounts 2012Gulf Investment Corporation G.S.C. and Subsidiaries
30
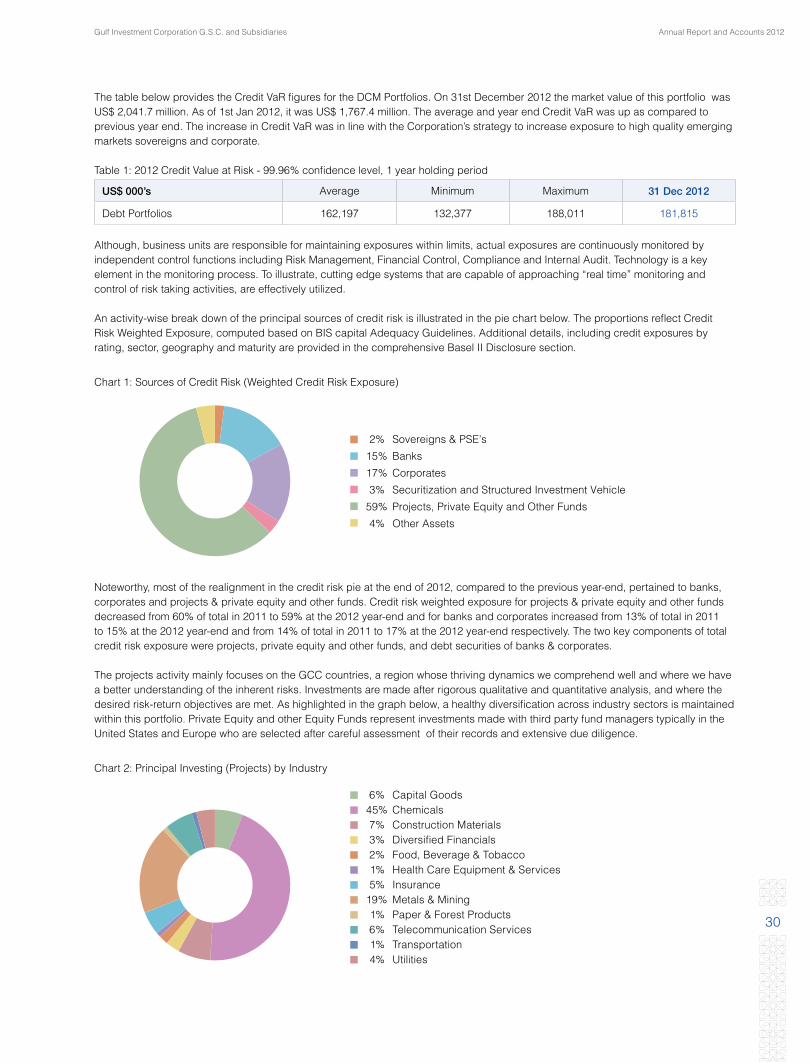
The table below provides the Credit VaR figures for the DCM Portfolios. On 31st December 2012 the market value of this portfolio was US$ 2,041.7 million. As of 1st Jan 2012, it was US$ 1,767.4 million. The average and year end Credit VaR was up as compared to previous year end. The increase in Credit VaR was in line with the Corporation’s strategy to increase exposure to high quality emerging markets sovereigns and corporate.
Table 1: 2012 Credit Value at Risk - 99.96% confidence level, 1 year holding period
US$ 000’s Average Minimum Maximum 31 Dec 2012
Debt Portfolios 162,197 132,377 188,011 181,815
Although, business units are responsible for maintaining exposures within limits, actual exposures are continuously monitored by independent control functions including Risk Management, Financial Control, Compliance and Internal Audit. Technology is a key element in the monitoring process. To illustrate, cutting edge systems that are capable of approaching “real time” monitoring and control of risk taking activities, are effectively utilized.
An activity-wise break down of the principal sources of credit risk is illustrated in the pie chart below. The proportions reflect Credit Risk Weighted Exposure, computed based on BIS capital Adequacy Guidelines. Additional details, including credit exposures by rating, sector, geography and maturity are provided in the comprehensive Basel II Disclosure section.
Chart 1: Sources of Credit Risk (Weighted Credit Risk Exposure)
2% Sovereigns & PSE’s
15% Banks
17% Corporates
3% Securitization and Structured Investment Vehicle
59% Projects, Private Equity and Other Funds
4% Other Assets
Noteworthy, most of the realignment in the credit risk pie at the end of 2012, compared to the previous year-end, pertained to banks, corporates and projects & private equity and other funds. Credit risk weighted exposure for projects & private equity and other funds decreased from 60% of total in 2011 to 59% at the 2012 year-end and for banks and corporates increased from 13% of total in 2011 to 15% at the 2012 year-end and from 14% of total in 2011 to 17% at the 2012 year-end respectively. The two key components of total credit risk exposure were projects, private equity and other funds, and debt securities of banks & corporates.
The projects activity mainly focuses on the GCC countries, a region whose thriving dynamics we comprehend well and where we have a better understanding of the inherent risks. Investments are made after rigorous qualitative and quantitative analysis, and where the desired risk-return objectives are met. As highlighted in the graph below, a healthy diversification across industry sectors is maintained within this portfolio. Private Equity and other Equity Funds represent investments made with third party fund managers typically in the United States and Europe who are selected after careful assessment of their records and extensive due diligence.
Chart 2: Principal Investing (Projects) by Industry
6% Capital Goods 45% Chemicals 7% Construction Materials 3% Diversified Financials 2% Food, Beverage & Tobacco 1% Health Care Equipment & Services 5% Insurance 19% Metals & Mining 1% Paper & Forest Products 6% Telecommunication Services 1% Transportation 4% Utilities
Risk Management
31
Off-balance Sheet Financial InstrumentsIn the normal course of its business, the Corporation utilizes derivatives and foreign exchange instruments to meet the financial needs of its customers, to generate trading revenues and to manage its exposure to market risk. In the case of derivatives and foreign exchange transactions, procedures similar to on balance sheet products are used for measuring and monitoring credit risk. Credit risk weighted exposure to off balance sheet products amounted to nearly 4.4% of total credit risk weighted exposure. This figure represents the mark-to-market or replacement cost of these transactions. At the yearend 2012, outstanding derivatives held for trading were foreign exchange contracts and put options, 49 % of which were short term with a maturity of less than one year. Credit risk amounts arising from these transactions relate to major banks. Off balance sheet transactions also include credit-related contingent items designed to meet the financial requirement of the Corporation’s customers. A detailed credit risk analysis of credit-related contingent items, derivatives and foreign exchange products is set in Notes 22 & 23 to the Consolidated Financial Statements.
As uncertainty and volatility in the global credit markets escalate, the Corporation will continue to adhere to strong internal risk controls. While the mechanism of risk monitoring and control has been fostered further, the risk management function is now more engaged with the business units, having been brought forward within the investment process. In addition to incorporating additional credit information, including Credit Default Swaps (CDS) prices, equity prices and market implied ratings within the credit analyses framework, the monitoring and reporting frequency has also been increased.
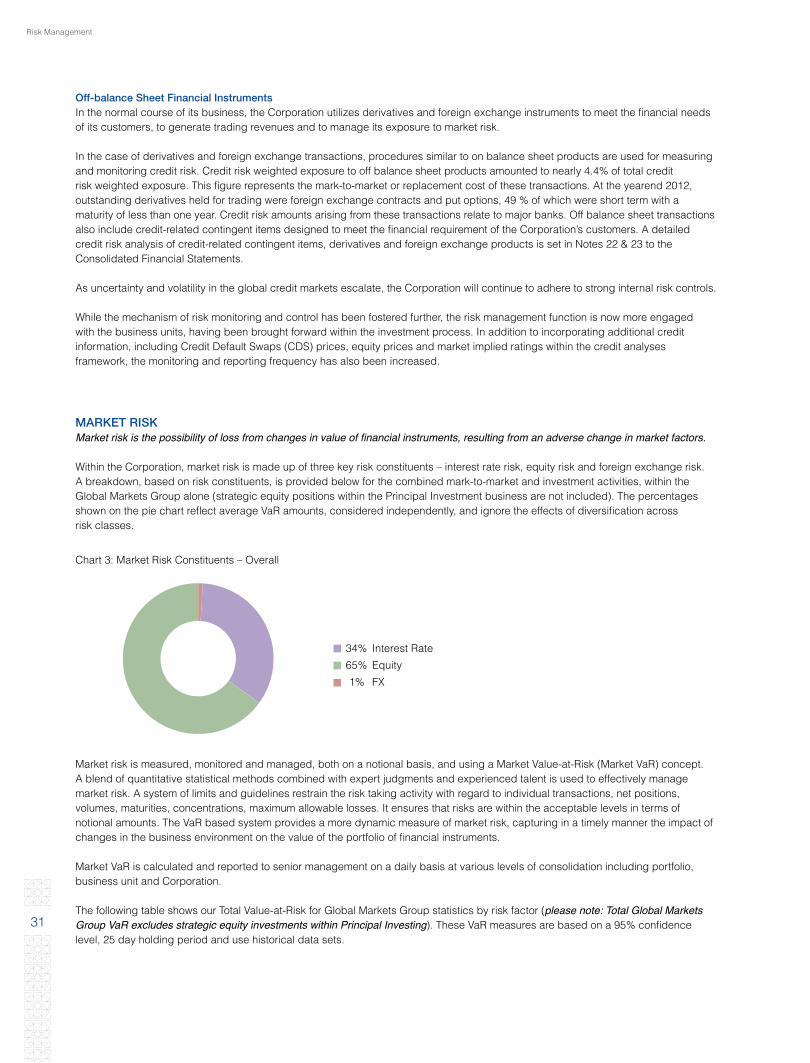
MARKET RISKMarket risk is the possibility of loss from changes in value of financial instruments, resulting from an adverse change in market factors.
Within the Corporation, market risk is made up of three key risk constituents – interest rate risk, equity risk and foreign exchange risk. A breakdown, based on risk constituents, is provided below for the combined mark-to-market and investment activities, within the Global Markets Group alone (strategic equity positions within the Principal Investment business are not included). The percentages shown on the pie chart reflect average VaR amounts, considered independently, and ignore the effects of diversification across risk classes.
Chart 3: Market Risk Constituents – Overall
34% Interest Rate
65% Equity
1% FX
Market risk is measured, monitored and managed, both on a notional basis, and using a Market Value-at-Risk (Market VaR) concept. A blend of quantitative statistical methods combined with expert judgments and experienced talent is used to effectively manage market risk. A system of limits and guidelines restrain the risk taking activity with regard to individual transactions, net positions, volumes, maturities, concentrations, maximum allowable losses. It ensures that risks are within the acceptable levels in terms of notional amounts. The VaR based system provides a more dynamic measure of market risk, capturing in a timely manner the impact of changes in the business environment on the value of the portfolio of financial instruments.
Market VaR is calculated and reported to senior management on a daily basis at various levels of consolidation including portfolio, business unit and Corporation.
The following table shows our Total Value-at-Risk for Global Markets Group statistics by risk factor (please note: Total Global Markets Group VaR excludes strategic equity investments within Principal Investing). These VaR measures are based on a 95% confidence level, 25 day holding period and use historical data sets.

Annual Report and Accounts 2012Gulf Investment Corporation G.S.C. and Subsidiaries
32
Table 2: Market Value at Risk for Global Markets Group alone - 25 day holding period, 95% confidence level
2012
US$ 000’s Average Minimum Maximum 31-Dec-12
Interest rate 7,801 3,693 11,864 4,130
Equity 14,935 9,926 18,436 10,458
Foreign Exchange 366 211 842 639
Total* 15,405 10,266 17,909 10,688
2011
US$ 000’s Average Minimum Maximum 31-Dec-11
Interest rate 5,434 2,664 8,021 6,277
Equity 15,313 11,551 17,430 15,460
Foreign Exchange 1,636 590 3,538 2,597
Total* 15,597 10,859 17,712 16,656
* Total VaR incorporates benefits of diversification
Market risk at the 2012 year end, as measured by VaR, declined by over 35% compared to 31st December 2011. Most of the decline resulted from proportionately lower levels of equity VaR and interest rate VaR. The issuance of fixed rate notes via the EMTN programme resulted in 5 year fixed rate liabilities, which offset to some extent the duration on the high quality bond portfolios on the assets side, thereby reducing overall interest rate risk. The lower levels of equity VaR in 2012 resulted from lower volatility levels across most of the invested markets, while exposures remained at about the same level. Total market risk VaR remained within limits as approved by the Risk Management Committee and the Board of Directors. The Corporation will closely monitor the operating environment and seek to take on appropriate market risk at opportune times.
Chart 4: Profile of daily VaR – 25 day holding period, 95% confidence level, VaR (US$ 000’s):
Total VAR
J F M A M J J A S O N D0
5,000
10,000
15,000
20,000
We should note that certain portfolios and positions are not included in the market VaR analysis, where VaR is not the most suitable measure of risk. These include the principal project investments in the GCC and the portfolio of international private equity funds. The market risk relating to these investments are measured in terms of a 10% sensitivity measure – an estimated decline in asset values. The fair values of the underlying positions may be sensitive to changes in a number of factors, including but not limited to: the financial performance of the companies, projected timing and amount of future cash flows, discount rates, trends within sectors and underlying business models. The table below provides the sensitivity measure for 2012 and 2011. The principal investment and private equity portfolios are both categorized as available-for-sale; hence, the 10% sensitivity measure provided in the table below reflects the impact on shareholders equity and not on profits.

Risk Management
33
Table 3: Sensitivity Measure: for assets not included in market VaR (US$ 000s)
Asset Categories 10% sensitivity measure 10% sensitivity measure(impact on shareholders’ equity)
31-Dec-12 31-Dec-11
Principal Investments Underlying asset value 216,052 231,175
Private Equity Funds Underlying asset value 24,879 26,877
Likewise, scenario analysis is an essential component of the market risk management framework. The assumption of normality on which the statistical models are based may become invalid due to the occurrence of certain events. Future scenarios that result in a breakdown of the historical behavior and relationships between risk constituents are projected, and potential loss amounts are determined. Most of these scenarios are derived from historical macroeconomic trends adjusted for fermenting and unfolding developments and expectations about futuristic events.
Liquidity Risk ManagementLiquidity risk is the failure to meet all present and future financial obligations in a timely manner and without undue effort, whether it is a decrease in liabilities or increase in assets. This risk may be further compounded by the inability of the Corporation to raise funds at an acceptable cost to meet its obligations in due time.
There are two sources of liquidity risk that GIC takes into account, which are: a) Cash flow illiquidity, arising from the inability to honor financial commitments or to procure funds at reasonable rates and
required maturities; andb) Asset illiquidity, relating to the lack of market depth during times when assets are to be liquidated on a forced basis.
The Corporation believes that capital plays a special role in liquidity planning inasmuch as liquidity problems could arise in the short run if the market believes that capital has been so impaired that in the long run the Corporation may not be able to pay-off its liabilities.
GIC’s management of liquidity considers an overall balance sheet approach that brings together all sources and uses of liquidity. More specifically, liquidity requirements cover various needs that are addressed by the Corporation’s senior management. Among these needs are:
a) Meeting day-to-day cash outflows;
b) Providing for seasonal fluctuation of sources of funds;
c) Providing for cyclical fluctuations in economic conditions that may impact availability of funds;
d) Minimizing the adverse impact of potential future changes in market conditions affecting GIC’s ability to fund itself; and
e) Surviving the consequences of loss of confidence that might induce fund providers to withdraw funding to GIC.
Liquidity LimitsAs part of the funding and liquidity plan, liquidity limits, liquidity ratios, market triggers, and assumptions for periodic stress tests are established and approved. The size of the limit depends on the size of the balance sheet, depth of the market, the stability of the liabilities, and liquidity of the assets. Generally, limits are established such that in stressed scenarios, GIC could be self-funded.
The liquidity limits that are regularly monitored include the following:
a) Maximum daily cash outflow limit for major currencies;
b) Maximum cumulative cash outflow which should include likely outflows as a result of draw-down of commitments, etc; and
c) Net liquid asset ratio – this ratio is calculated by taking a conservative view of marketability of liquid assets, with a discount to cover price volatility and any drop in price in the event of a forced sale. The ratio is the proportion of such liquid assets to volatile liabilities.
The net liquid asset ratio as of 31st December 2012 was 175%. This figure was determined taking into account the following basic criteria:
a) A 3-month remaining maturity is used to establish the time threshold by which balance sheet items are determined to be liquid or illiquid, stable or volatile;
b) Appropriate “haircuts” are applied on liquid assets to reflect potential market discounts; and
c) A “business as usual” posture is maintained in ascertaining the level of assets to be liquidated or pledged to avoid sending a wrong signal to the market.

Annual Report and Accounts 2012Gulf Investment Corporation G.S.C. and Subsidiaries
34
The Corporation’s investment portfolio is managed so that holdings of un-pledged, marketable securities that comprised the strategic reserve are equivalent to approximately 50% of the projected maximum 30 day cumulative cash outflow. By the end of December 2012, investments in marketable securities tallied at approximately US$ 2.6 billion, and are primarily made up of investment grade securities.
The quantities of pledged securities are reviewed periodically in order to ensure that the quantity of pledged securities does not exceed the amounts actually required to secure funding or for other purposes. Additionally, to the greatest extent possible, the selection of securities to be pledged is made in a manner whereby the longest term and/or least marketable securities are utilized.
Market Access for LiquidityEffective liquidity management includes assessing market access and determining various funding options. That said, GIC deems it critical to maintain market confidence to attain the flexibility necessary to capitalize on opportunities for business expansion, and to protect the Corporation’s capital base.
Proactive and prudent liquidity management requires a stable and diversified funding structure. To this end, GIC always maintains a well-balanced portfolio of liabilities in order to generate a stable flow of financing and to provide protection against sudden market disruptions. To the extent practical and consistent with other GIC objectives, the Corporation emphasizes both minimal reliance on short-term borrowed funds as well as the use of intermediate and long-term borrowings in place of short-term funding.
A diversity of funding sources, currencies, and maturities are used in order to gain a broad access to the investor base. Several initiatives to strengthen the Corporation’s liquidity profile were successfully executed during 2012. Significant among these was the raising of approximately US$ 500 million of medium term finance during the year. In June 2012, GIC issued Malaysian Ringgit (MYR) 155 million 15 year Sukuk & MYR 170 million 10 year Sukuk in Malaysia. This was followed by the raising of CHF 300 million 3 year term finance from global investors in the last quarter. GIC’s success in raising this quantum of longer term finance at competitive rates, in the wake of severely distressed financial markets, is a reflection of the Corporation’s strong credit quality. As of 31 December 2012, the Corporation’s term financing stood at US$ 2,102 million.
Further, the Corporation was successful in enhancing the diversity of its depositor base, a reflection of increased market confidence. At year-end 2012 the Corporation’s deposit base stood at about US$ 1,092 million, of which approximately 93% is due to GCC depositors. GCC deposits had proven to be a stable source of funds over the years.
Additional short term funding is acquired through the use of repurchase agreements secured by a portfolio of high-grade securities. Such form of funding accounted for close to 12% of total funding at year-end 2012.
The table below provides the breakdown of the Corporation’s funding source for the comparative years 2011 to 2012.
US$ Millions 2012(US$) 2012(%) 2011(US$) 2011(%)
GCC Deposits 1,020 17% 1,346 24%
International Deposits 72 1% 78 1%
Repo Financing 425 7% 538 9%
Term Financing 2,102 34% 1,141 20%
Shareholder›s funds & Others 2,535 41% 2,632 46%
Total 6,154 100% 5,735 100%
Contingency Funding PlanWithin GIC, liquidity is managed through a well-defined process to ensure that all funding requirements are met properly. This process includes establishment of an appropriate contingency funding plan (CFP).
GIC’s CFP prepares the Corporation for the unlikely event of a liquidity crisis caused by material changes in the financial market conditions, including credit rating downgrades. CFP procedures are articulated clearly in the Corporation’s Liquidity policy document. These procedures include:
a) A suite of measures to be undertaken in the absence of liquidity crisis to enhance GIC’s available liquidity in the event of a crisis;
b) Careful identification of specific triggers that would prompt activation of CFP; and;
c) Specification of exact guidelines for adequate management of liquidity crisis. Throughout the challenging year, our liquidity position remained adequate to carry on with our strategy.
Risk Management
35
Interest Rate Gapping RiskGIC actively manages its interest rate exposure to enhance net interest income and limit potential losses arising from the mismatches between placements, investments and borrowings. It is one of the primary responsibilities of the Treasury management group. The Interest Rate Gap is measured in Eurodollar futures contract equivalents. It is widely accepted that the rate calculated from short-dated (up to two years) Eurodollar futures contract is effectively the forward interest rate of the underlying. Any funding, placements or borrowing that has a maturity or re-pricing of over two (2) years are either matched or hedged.
Since GIC also runs gapping positions in other major currencies apart from the USD, the gaps on these currency positions are translated to USD equivalents in order to estimate the equivalent number of Eurodollar futures contract.
The Eurodollar futures contract, given its liquidity, is a reasonable proxy to gauge interest rate risk on the short-term funding gap. The rationale behind this type of measurement is, if necessary, positive (negative) gaps within a given time bucket could be covered by selling (buying) Eurodollar futures contracts equivalent to the notional amount of the gaps. Potential contracts from individual time buckets are accumulated for each currency and then subsequently aggregated for all major currencies. The maximum number of notional contract is currently set at 3,500.
Treasury is responsible for monitoring and ensuring that potential short-term interest rate risk exposure remains within the authorized limits. However, proper escalation procedures are in place to address temporary and permanent excesses.
The Eurodollar futures contract position value as at December 31, 2012 was 10,702 contracts, with an estimated VaR of US$ 0.6 million. This is significantly higher than the levels of the previous year (31st December 2011: 1,172 contracts), primarily due to the US$ 500 million fixed rate EMTN issued in Q4 2012. Excluding the impact of this EMTN issuance, the number of contracts, at 31st December 2012, would be approximately 1,700 contracts.
Maturity profile of assets and liabilitiesA detailed breakdown of the maturity profile by individual asset and liability category is provided in Note 22 to financial statements. At December 31st 2012, roughly 61% of total assets were due to mature within 3 months, based on internal assessment of the Corporation’s right and ability to liquidate these instruments. Comparatively, on the same basis, approximately 40% of total liabilities were in the same time bucket. The sizable portfolio of high quality marketable securities contributed to the relatively high ratio of liquid assets. The Corporation’s GCC retention record shows that short maturity deposits from GCC governments, central banks and other regional financial institutions have been regularly renewed over the past several years. With the success achieved in raising medium term finance, the Corporation was able to optimize the asset liability maturity gap, especially within the medium and long term buckets.
CREDIT RATING Both rating agencies (Moody’s & Fitch) reaffirmed GIC’s credit ratings during the year. GIC’s strong financial indicators were acknowledged in the rating reports . As of end 2012, GIC’s long term deposits were rated BBB by Fitch and Baa2 by Moody’s. All ratings carry a stable outlook. GIC continues to be rated AAA by Rating Agency Malaysia (RAM).
Moody’s Fitch RAMLong-term Deposits Baa2 BBB AAAShort-term Deposits P2 F3 P1Bank Financial Strength (BFSR) D
CAPITAL STRENGTHCapital represents the shareholder’s investment and is a key strategic resource which supports the Corporation’s risk taking business activities. In line with the Corporation’s financial objective, management strives to deploy this resource in an efficient and disciplined manner to earn competitive returns. Capital also reflects financial strength and security to the Corporation’s creditors and depositors. Capital management is fundamental to GIC’s risk management philosophy, and takes into account economic and regulatory requirements.
The Corporation’s capital base stood at USD 2.3 billion at 2012 year end. GIC continues to be one of the best capitalized financial institutions in the region.

Annual Report and Accounts 2012Gulf Investment Corporation G.S.C. and Subsidiaries
36
Regulatory CapitalThe Basel Committee on Banking Supervision has introduced a revised capital adequacy framework that promotes the adoption of stronger risk management practices, and more risk-sensitive capital requirements that are conceptually sound and at the same time pay due regard to particular features of the present supervisory and accounting systems in individual member countries.
The Central Bank of Kuwait (CBK) had issued a directive for banks in Kuwait to implement the revised accord beginning December 2005. While GIC does not fall under the purview of the CBK, the Corporation’s view is that it is prudent to implement the recommendations set forth under the revised accord with the following primary objectives:
a) the Corporation has been subjecting itself to the standards of Basel I (1988) and the amendments introduced in 1998 (market risk). As a natural progression, adoption of the modified standards as outlined in the revised capital accord underscores the Corporation’s commitment to be in line with international standards;
b) GIC acknowledges the importance of the qualitative and quantitative approaches set out in Basel II that impose rigor and discipline with respect to capital adequacy assessment; and
c) adopting the Basel II capital accord is viewed to enhance risk culture within the organization and further strengthen GIC’s market image, thus, resulting to improvements in external credit ratings assigned by international rating agencies, thereby ensuring continued access to capital markets.
Under the new accord, the Corporation’s Total capital ratio at the end of December 2012 was 29.5%. The Tier 1 ratio was the same, since the existing small quantum of Tier 2 capital was reduced to nil after deductions. Comparatively, the Total and Tier 1 capital ratios the previous year was 30.5%. The continued enhancement in capital adequacy ratios was driven by the strengthening of the core capital base. Moreover, the scaling down of risk exposures also had a positive impact on capital ratios. The standardized approach was used to calculate the capital requirement to cover credit and operational risks. Market risk capital cover calculation, on the other hand, employed the VaR-based approach. Going forward, GIC aims to achieve convergence of regulatory capital with economic capital as it adopts more advanced measurements for capital adequacy. Details of the regulatory capital ratio computations are provided in the Basel II disclosure section of this annual report.
Economic Capital In addition to maintaining capital reserves based on regulatory requirements, economic capital sufficiency based on internal models is also determined. The economic capital computation process has three fundamental objectives: determine economic capital sufficiency, in addition to regulatory capital adequacy; assist in equitable / standardized performance measurement of businesses, on a ‘real’ (risk adjusted) basis; and assist in optimizing resource allocation to achieve target risk adjusted Return On Equity (ROE) for the Corporation.
Economic capital is a measure of risk and can be defined as the amount of capital required to cover unexpected losses, arising from doing business. It is the amount of capital that is required to achieve equilibrium between expected return and risk of bankruptcy. The need for economic capital arises due to the uncertainty of positive returns and or future cash flows. For each asset / exposure, portfolio, business unit, group and entity, economic capital reflects the quantification of the unexpected loss amounts arising from the four principal risk forms: Credit risk, Market risk, Liquidity risk and Operational risk.
Asset allocation targets, particularly within the global markets investments, are derived based on rigorous optimization techniques utilizing quantitative and qualitative inputs. Portfolios are constructed to maximize the efficiency of capital utilization, while ensuring risks are within acceptable levels.
OPERATIONAL RISKOperational Risk is the risk of loss resulting from inadequate or failed processes, people, or systems, either internally or externally.
Other risks to which GIC is exposed to include Regulatory, Strategic, and Reputational:• Regulatory risk is controlled through a framework of Compliance policies and procedures;• Strategic risk is managed through the close monitoring of reviews, targets and goals, by senior management; and • Reputational risk is controlled through clear and transparent guidelines and the GIC Code of Conduct.
KEY AIMS: The management of Operational Risk has the following key objectives:
• to identify, assess, control and mitigate operational risk and the effective reporting of risk and emerging risk issues; and• to embed operational risk awareness in all our activities, including the practices and controls used to manage other types
of risks.

Risk Management
37
OVERVIEW: GIC’s Operational Risk Framework is composed of four key components:–
a) Risk and Control Self-Assessment framework;
b) Loss Event framework;
c) Corrective Action Plans framework; and
d) Operational Risk Reporting framework.
By providing a basis for the institutional understanding of Operational Risk, the framework supports a culture in which employees are aware of the risk inherent in the daily operations, and are encouraged to proactively identify existing, emerging and/or other potential problems.
a. Risk and Control Self- Assessment (RCSA) FrameworkThe RCSA procedures establishes a consistent framework for describing the key business activities, risks and controls. The controls are then assessed on a regular frequency. It is a process which transparently assesses the businessís risks and analyzes the strength or weakness of controls that are put in place to in order to manage the identified risks.
The assessment of fraud detection controls have also been integrated within the RCSA process.
b. Loss Event FrameworkOperational loss events are reported in a central database. Comprehensive information about these events is collected, and includes information regarding amount, occurrence, discovery date, business area and product involved, and detailed root cause analysis.
In keeping with our broad definition of Operational Risk, we began to include data on events with non-monetary impacts and near-miss events in our collection and analysis activities.
c. Corrective Action Plans (CAPs) FrameworkThe CAPs framework is a key component of management practice to identify, document and resolve control issues or any high risk exposures. This includes issues identified through our integrated RCSA and monitoring program, internal audits, Compliance reviews, business continuity readiness reviews, or Operational Risk loss event reporting.
It will enable management to demonstrate to audit (internal and external) and regulators, that management is aware and is actively addressing issues as well as monitoring the timely resolution of these issues.
The Risk Management Committee will be kept abreast of all material Operational Risk issues that have been identified.
d. Operational Risk Reporting Framework The Reporting framework is used to ensure that all Operational Risk types and events are categorized and reported
consistently following the Basel II ratings methodology. This will help to:• establish a common language regarding Operational Risk, throughout the Corporation; and• facilitate the correlation of similar events and to identify causes (rather than symptoms) of risk within departments.
OPERATION RISK WEIGHTED EXPOSURE:The Operational Risk Weighted Exposure sets out the risk measurement framework, i.e. the quantitative criteria for calculating the capital charge for operational risk that broadly follows the Standardized Approach developed by the Basel Committee on Banking Supervision.
The Corporationís business activities are categorized within the identified business lines to be used i.e Principal Investment, Debt Capital Market, Equities Investments, Alternative Investments, Treasury, Asset Management, Corporate Finance, and Head Quarters.
INSURANCE:As part of the Enterprise Risk Management solution, the Corporation uses a comprehensive suite of insurance policies to mitigate the impact of operational risks and to ensure the that GIC has comprehensive insurance coverage which closely align to the operational risk profile and are cost beneficial to GIC.

Annual Report and Accounts 2012Gulf Investment Corporation G.S.C. and Subsidiaries
38
BUSINESS CONTINUITY AND DISASTER RECOVERY PLANNING:The Business Continuity Plan Team, led by Operational Risk and Information Technology, are responsible for creating, managing and continuously improving GICís disaster recovery planning.
Currently there are three active disaster recovery sites:-
• Kuwait (Local)
• Bahrain (Regional)
• Luxembourg (Outer-Regional)
LEGAL RISK MANAGEMENT:GIC has a dedicated General Counsel, for the effective management of legal risks corporation-wide by the provision of legal advice and litigation management.
INFORMATION SECURITY FRAMEWORK:A secure information security framework is in place to identify the responsibilities at every level of information handling, i.e. from data ownership (encoding) to data access. Periodic audits are conducted to ensure compliance with the policies and standards set, by Internal Audit, and through the Information Security Risk and Control Self-Assessment review.
OPERATIONAL LOSS EVENT PROFILE FOR 2012:The Corporation monitors the Operational Loss events by business units and the Basel II loss event categories.
During 2012, the highest frequency of events occurred under the “execution, delivery and process management” (94%) category and “business disruption and system failures” (6%) category. There were no losses under any other categories.
The “execution, delivery and process management” category had 100% of the losses attributed by value to it.
% of Total Loss Events (by count)
Execution, delivery & process, management
Business disruption & system failures
Internal fraud
External fraud
Employment practices & workplace safety
Client, products & business practices
Damage to physical assets
96%
4%
0%
0%
0%
0%
0%
39
Basel II Disclosure

Annual Report and Accounts 2012Gulf Investment Corporation G.S.C. and Subsidiaries
40
Basel II Rationale:Aligning banking risk management with Capital Requirements
As Basel II continues to further evolve, the Basel Committee moves closer to its goal of aligning banking risk and its management with capital requirements. The primary objective of the new accord is to improve safety and soundness in the financial system by placing increased emphasis on bank’s internal controls and risk management processes and models, the supervisory review process, and market discipline.
Basel II encourages the ongoing improvements in risk assessments and mitigation. Thus, over time, it presents banks with the opportunity to gain competitive advantage by allocating capital to business activities that demonstrate a strong risk-return ratio. Developing a better understanding of the risk/reward trade-off for capital supporting specific business or products is one of the most important business benefits banks may derive from compliance to the new accord.
The Architecture of Basel II – The Three PillarsWith Basel II, the Basel Committee abandons Basel I’s ‘one-size-fits all’ method of calculating minimum regulatory capital requirements and introduced a three-pillar concept that seeks to align regulatory requirements with economic principles of risk management. At the same time, by putting operational risk management on every bank’s agenda, Basel II encourages a new focus on its management and sound and comprehensive corporate governance practices.
The Three Pillars DefinedPillar 1 - Minimum Capital Requirements
Pillar 1 sets out minimum regulatory capital requirements – meaning the amount of capital banks must hold against risks. The new framework provides a continuum of approaches from basic to advanced methodologies for the measurement of both credit and operational risks. It provides a flexible structure in which banks, subject to supervisory review, will adopt approaches that best fit their level of sophistication and their risk profile. The framework also deliberately builds in rewards for stronger and more accurate risk measurement.
Pillar 2 - Supervisory Review Pillar 2 defines the process for supervisory review of a bank’s risk management framework and ultimately, its capital adequacy. It sets out specific oversight responsibilities for the board and senior management, thus reinforcing principles of internal controls and corporate governance practices. Financial supervisors would be responsible for evaluating how well banks are assessing their capital adequacy needs relative to their risks. Intervention would be exercised, where appropriate.
Pillar 3 - Market Discipline Pillar 3 aims to bolster market discipline through enhanced disclosure by banks. It sets out disclosure requirements and recommendations in several areas, including the way a bank calculates its capital adequacy and its risks assessment methods. The intended result is enhanced transparency and comparability with other banks.
Gulf Investment Corporation G.S.C. (GIC or ‘the Corporation’) – Market DisclosureThe following sections set out the Corporation’s disclosure details prepared in line with the new accord’s requirements via its publication dated June 2006 – A Revised Framework for International Convergence of Capital Measurement and Capital Standard, and increased capital requirement for market risk as proposed in Basel Committee’s document ‘Revision to the Basel II market risk framework’ dated July 2009.

Basel II Disclosure
41
1. Capital Structure GIC is an investment company incorporated in the State of Kuwait on November 15, 1983 as a Gulf Shareholding Company. It is
equally owned by the governments of the six member states of the Gulf Cooperation Council (GCC), i.e., Bahrain, Kuwait, Oman, Qatar, Saudi Arabia, and the United Arab Emirates. The Corporation has no subsidiaries or significant investments in banking, insurance, securities, and other financial entities.
Table 1 presents the Corporation’s regulatory capital resources for the years ending December 2012 and December 2011. Basel II permits recognition of general provision (albeit subject to a maximum of 1.25% of credit risk weighted assets) as part of Tier 2 capital. Meanwhile, the portion of significant investments in financial and commercial entities that exceed a certain materiality threshold; and exposures to ‘securitization’ that fall below a cut-off risk grade are deducted 50% from Tier 1 and 50% from Tier 2 capital, respectively. For 2012, full deduction is made from Tier 1 capital due to negative fair value adjustment. Total eligible regulatory capital was US$ 1,784.8 million by year-end December 2012 compared to US$ 1,849.9 million recorded in December 2011. The Corporation has adopted a conservative policy for the treatment of net fair value reserve, wherein, if negative - the total amount is deducted from eligible capital, and if positive - only 45% of fair value reserve is included within eligible capital.
Table 1: Eligible Regulatory Capital
In US$ millions 31 December 2012 31 December 2011
Paid-up capital 2,100.0 2,100.0
Disclosed reserves 541.5 505.3
Retained earnings (291.6) (385.1)
Less: Goodwill 38.7 39.0
Less: Adjustment for Fair value reserve 109.6 -
Less: Deductions 416.8 331.3
Total Tier 1 Capital 1,784.8 1,849.9
Fair value reserve (55% discount) - 75.7
General Provision 1.5 2.0
Less: Deductions 1.5 77.7
Total Tier 2 Capital - -
Total eligible regulatory capital 1,784.8 1,849.9
2. Capital Adequacy Management The Corporation’s primary guiding principle to its capital adequacy management is to maintain a strong capital base that could
support current as well as future growth in business activities, and at the same time, with the objective of maintaining satisfactory capital ratios and high credit ratings.
GIC’s process of assessing the capital requirements commences with the compilation of the annual business plan by individual business units which are then consolidated into the annual budget plan of the Corporation. The annual budget plan provides the estimated overall growth in assets, its impact on capital and targeted profitability for the forthcoming fiscal year. Utilizing the financial projections generated from the budget plan, capital is allocated to the various business units in such a way that the allocations remain consistent with the risk profile of the business activity. These capital allocations as well as corresponding Return On Risk-Adjusted Capital (RORAC) are reviewed on an ongoing basis during the budget year in order to optimally deploy capital to achieve targeted returns. Whilst the Corporation acknowledges the benefits of higher leverage to Return on Equity (ROE), it also believes in the advantage and benefit of keeping a strong capital position. As such, GIC maintains a prudent balance among the major components of its capital. Current internal policy aims to maintain a floor of 16% total capital adequacy ratio.
The annual dividend payout, meanwhile, is prudently determined and proposed by the Board of Directors, endeavoring to meet shareholder expectations while ensuring adequate retention of capital to support organic growth.
Finally, the Corporation targets a credit risk rating of single ‘A’ or better. This would allow easy access to capital from the market at competitive pricing in the event additional funding needs to be appropriated. GIC is among a select few financial institutions in the region to maintain high ratings by both major international agencies (Moody’s & Fitch). Details of the Corporation’s ratings are provided on page 35 of this annual report.
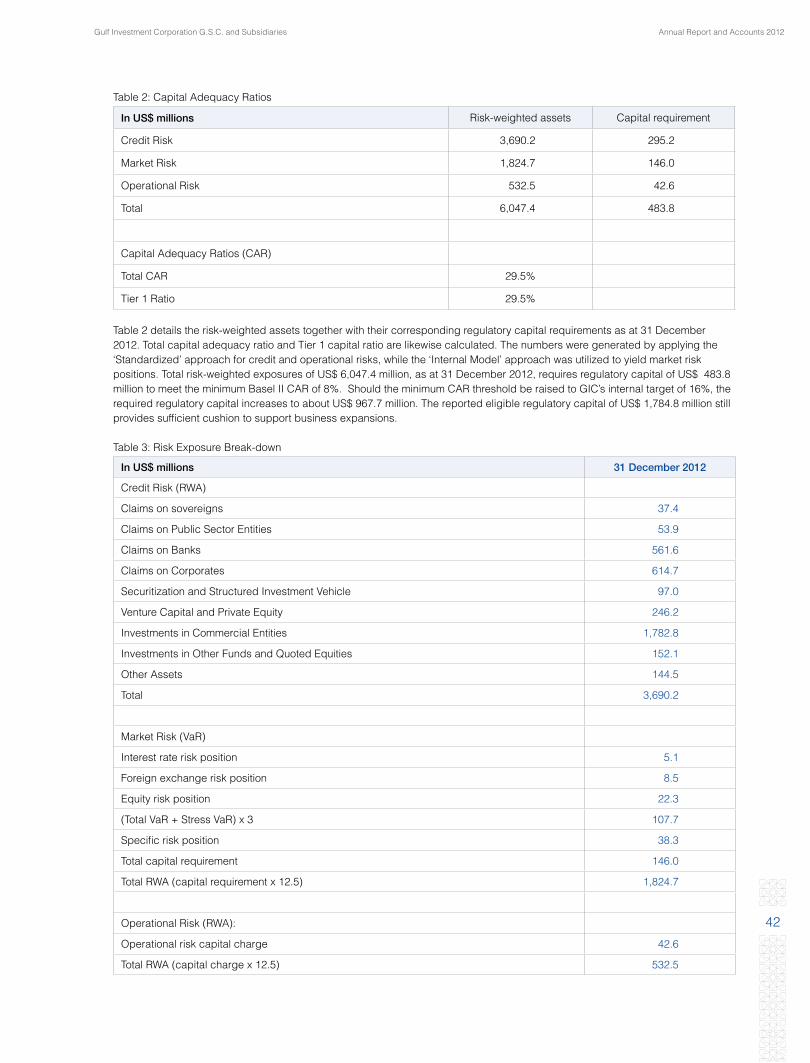
Annual Report and Accounts 2012Gulf Investment Corporation G.S.C. and Subsidiaries
42
Table 2: Capital Adequacy Ratios
In US$ millions Risk-weighted assets Capital requirement
Credit Risk 3,690.2 295.2
Market Risk 1,824.7 146.0
Operational Risk 532.5 42.6
Total 6,047.4 483.8
Capital Adequacy Ratios (CAR)
Total CAR 29.5%
Tier 1 Ratio 29.5%
Table 2 details the risk-weighted assets together with their corresponding regulatory capital requirements as at 31 December 2012. Total capital adequacy ratio and Tier 1 capital ratio are likewise calculated. The numbers were generated by applying the ‘Standardized’ approach for credit and operational risks, while the ‘Internal Model’ approach was utilized to yield market risk positions. Total risk-weighted exposures of US$ 6,047.4 million, as at 31 December 2012, requires regulatory capital of US$ 483.8 million to meet the minimum Basel II CAR of 8%. Should the minimum CAR threshold be raised to GIC’s internal target of 16%, the required regulatory capital increases to about US$ 967.7 million. The reported eligible regulatory capital of US$ 1,784.8 million still provides sufficient cushion to support business expansions.
Table 3: Risk Exposure Break-down
In US$ millions 31 December 2012
Credit Risk (RWA)
Claims on sovereigns 37.4
Claims on Public Sector Entities 53.9
Claims on Banks 561.6
Claims on Corporates 614.7
Securitization and Structured Investment Vehicle 97.0
Venture Capital and Private Equity 246.2
Investments in Commercial Entities 1,782.8
Investments in Other Funds and Quoted Equities 152.1
Other Assets 144.5
Total 3,690.2
Market Risk (VaR)
Interest rate risk position 5.1
Foreign exchange risk position 8.5
Equity risk position 22.3
(Total VaR + Stress VaR) x 3 107.7
Specific risk position 38.3
Total capital requirement 146.0
Total RWA (capital requirement x 12.5) 1,824.7
Operational Risk (RWA):
Operational risk capital charge 42.6
Total RWA (capital charge x 12.5) 532.5
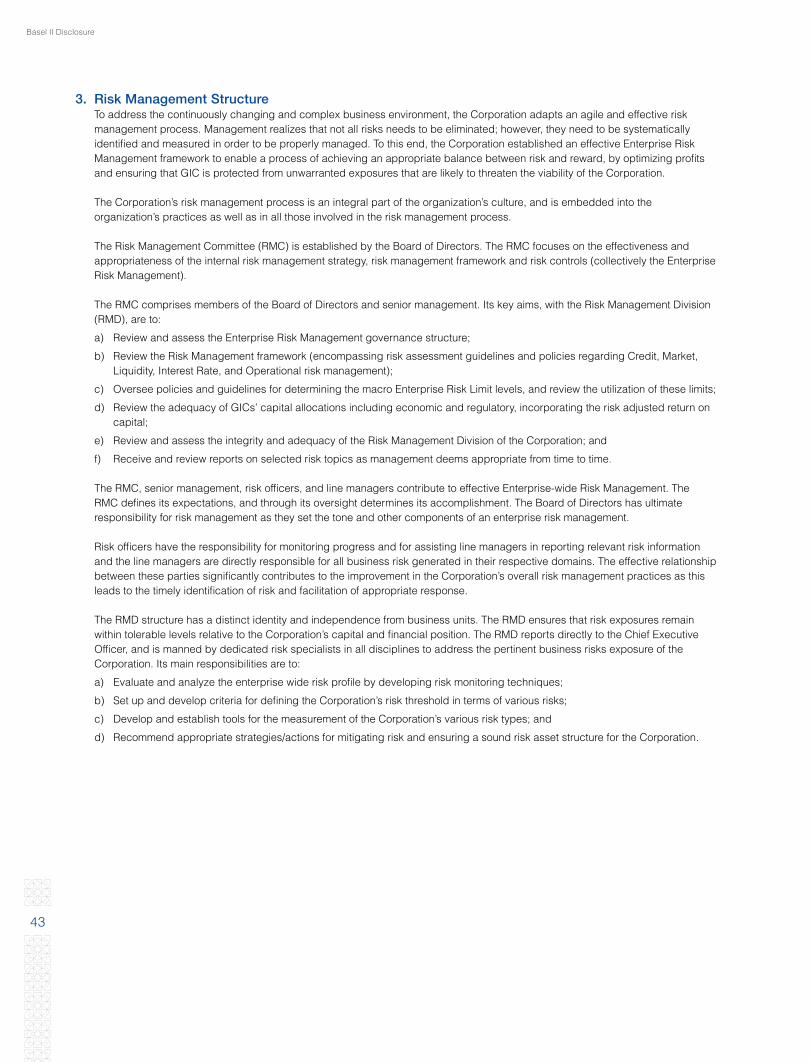
Basel II Disclosure
43
3. Risk Management Structure To address the continuously changing and complex business environment, the Corporation adapts an agile and effective risk
management process. Management realizes that not all risks needs to be eliminated; however, they need to be systematically identified and measured in order to be properly managed. To this end, the Corporation established an effective Enterprise Risk Management framework to enable a process of achieving an appropriate balance between risk and reward, by optimizing profits and ensuring that GIC is protected from unwarranted exposures that are likely to threaten the viability of the Corporation.
The Corporation’s risk management process is an integral part of the organization’s culture, and is embedded into the organization’s practices as well as in all those involved in the risk management process.
The Risk Management Committee (RMC) is established by the Board of Directors. The RMC focuses on the effectiveness and appropriateness of the internal risk management strategy, risk management framework and risk controls (collectively the Enterprise Risk Management).
The RMC comprises members of the Board of Directors and senior management. Its key aims, with the Risk Management Division (RMD), are to:
a) Review and assess the Enterprise Risk Management governance structure;
b) Review the Risk Management framework (encompassing risk assessment guidelines and policies regarding Credit, Market, Liquidity, Interest Rate, and Operational risk management);
c) Oversee policies and guidelines for determining the macro Enterprise Risk Limit levels, and review the utilization of these limits;
d) Review the adequacy of GICs’ capital allocations including economic and regulatory, incorporating the risk adjusted return on capital;
e) Review and assess the integrity and adequacy of the Risk Management Division of the Corporation; and
f) Receive and review reports on selected risk topics as management deems appropriate from time to time.
The RMC, senior management, risk officers, and line managers contribute to effective Enterprise-wide Risk Management. The RMC defines its expectations, and through its oversight determines its accomplishment. The Board of Directors has ultimate responsibility for risk management as they set the tone and other components of an enterprise risk management.
Risk officers have the responsibility for monitoring progress and for assisting line managers in reporting relevant risk information and the line managers are directly responsible for all business risk generated in their respective domains. The effective relationship between these parties significantly contributes to the improvement in the Corporation’s overall risk management practices as this leads to the timely identification of risk and facilitation of appropriate response.
The RMD structure has a distinct identity and independence from business units. The RMD ensures that risk exposures remain within tolerable levels relative to the Corporation’s capital and financial position. The RMD reports directly to the Chief Executive Officer, and is manned by dedicated risk specialists in all disciplines to address the pertinent business risks exposure of the Corporation. Its main responsibilities are to:
a) Evaluate and analyze the enterprise wide risk profile by developing risk monitoring techniques;
b) Set up and develop criteria for defining the Corporation’s risk threshold in terms of various risks;
c) Develop and establish tools for the measurement of the Corporation’s various risk types; and
d) Recommend appropriate strategies/actions for mitigating risk and ensuring a sound risk asset structure for the Corporation.
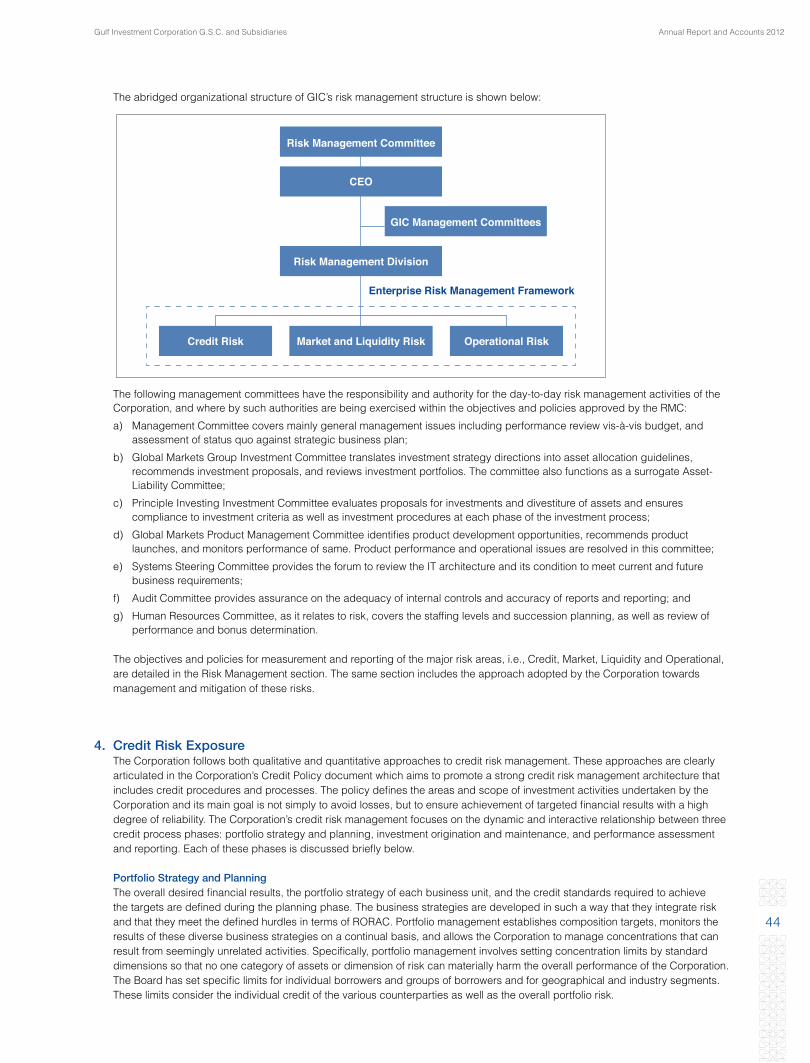
Annual Report and Accounts 2012Gulf Investment Corporation G.S.C. and Subsidiaries
44
The following management committees have the responsibility and authority for the day-to-day risk management activities of the Corporation, and where by such authorities are being exercised within the objectives and policies approved by the RMC:
a) Management Committee covers mainly general management issues including performance review vis-à-vis budget, and assessment of status quo against strategic business plan;
b) Global Markets Group Investment Committee translates investment strategy directions into asset allocation guidelines, recommends investment proposals, and reviews investment portfolios. The committee also functions as a surrogate Asset-Liability Committee;
c) Principle Investing Investment Committee evaluates proposals for investments and divestiture of assets and ensures compliance to investment criteria as well as investment procedures at each phase of the investment process;
d) Global Markets Product Management Committee identifies product development opportunities, recommends product launches, and monitors performance of same. Product performance and operational issues are resolved in this committee;
e) Systems Steering Committee provides the forum to review the IT architecture and its condition to meet current and future business requirements;
f) Audit Committee provides assurance on the adequacy of internal controls and accuracy of reports and reporting; and
g) Human Resources Committee, as it relates to risk, covers the staffing levels and succession planning, as well as review of performance and bonus determination.
The objectives and policies for measurement and reporting of the major risk areas, i.e., Credit, Market, Liquidity and Operational, are detailed in the Risk Management section. The same section includes the approach adopted by the Corporation towards management and mitigation of these risks.
4. Credit Risk Exposure The Corporation follows both qualitative and quantitative approaches to credit risk management. These approaches are clearly
articulated in the Corporation’s Credit Policy document which aims to promote a strong credit risk management architecture that includes credit procedures and processes. The policy defines the areas and scope of investment activities undertaken by the Corporation and its main goal is not simply to avoid losses, but to ensure achievement of targeted financial results with a high degree of reliability. The Corporation’s credit risk management focuses on the dynamic and interactive relationship between three credit process phases: portfolio strategy and planning, investment origination and maintenance, and performance assessment and reporting. Each of these phases is discussed briefly below.
Portfolio Strategy and Planning The overall desired financial results, the portfolio strategy of each business unit, and the credit standards required to achieve
the targets are defined during the planning phase. The business strategies are developed in such a way that they integrate risk and that they meet the defined hurdles in terms of RORAC. Portfolio management establishes composition targets, monitors the results of these diverse business strategies on a continual basis, and allows the Corporation to manage concentrations that can result from seemingly unrelated activities. Specifically, portfolio management involves setting concentration limits by standard dimensions so that no one category of assets or dimension of risk can materially harm the overall performance of the Corporation. The Board has set specific limits for individual borrowers and groups of borrowers and for geographical and industry segments. These limits consider the individual credit of the various counterparties as well as the overall portfolio risk.
Operational RiskMarket and Liquidity RiskCredit Risk
Risk Management Division
CEO
Risk Management Committee
GIC Management Committees
Enterprise Risk Management Framework
The abridged organizational structure of GIC’s risk management structure is shown below:

Basel II Disclosure
45
The Investment Committees The Committees monitor and approve investment proposals and review portfolio concentrations in terms of economic sectors
and asset class. These limits are reviewed annually to ensure that there are no undue concentrations in one sector or asset class, and that the limits are within those set out by the Corporation. For counter-party limits, such as limits for banks and financial institutions, credit line approval follows a strict process of credit review, with proper authority levels delegated to senior credit officers. Foreign exchange trading and interest rate gap limits, together with ancillary limits (e.g., daylight, overnight, stop loss, etc.) are recommended by Treasury for the review of risk management, and eventual approval by the RMC. The RMD quantifies the Corporation’s credit risk appetite in line with the overall strategy. The RMD employs a process of allocating capital on a portfolio level for the total credit exposure assumed by each business unit. The business units’ actual capital consumption is assessed against the budget, and variances are appropriately reported to senior management.
Investment Origination and Maintenance The business units solicit, evaluate, and manage credit exposure according to the strategies and portfolio parameters established
during the portfolio strategy and planning phase. Investments are generated within well-defined criteria, product structure, and are approved on the basis of risk and return assessment. The processes involved under credit maintenance include documentation review and disbursement, and review of the status of exposures. Within this phase, origination and underwriting for distribution to investors takes place. The business units remain the sponsor and main risk managers of their proposals. While the risk management team independently reviews investment/product proposals prior to granting approvals to ensure that the proposals are within the tolerable risk appetite of the Corporation and are consistent with its policy, prior to disbursement of funds.
Performance Assessment and Reporting The performance assessment and reporting phase allow both the senior management and business units to monitor results
and improve performance continually. Both portfolio and process trends are monitored in order to make appropriate and timely adjustments to business strategies, portfolio parameters, credit policies and investment origination and maintenance practices. This phase of the credit process draws on information within the Corporation and external benchmarks to help evaluate performance. The goal of performance assessment is to achieve a balanced portfolio of assets, well diversified, and generating returns consistent with targets. Credit performance is assessed through analysis of:
a) Portfolio concentrations by obligor, industry, risk rating, maturity, asset class, as well as other dimensions;
b) Generated Return On Capital Employed (ROCE);
c) Additional economic value created by individual projects;
d) Exceptions to risk acceptance criteria; and
e) Other policy exceptions.
Inherent in the Corporation’s business activity is the presence of ‘portfolio risk’, which arises whenever there is high positive correlation between individual credit portfolios. To address this particular risk, the Corporation employs the ‘Credit Manager’ system promoted by the Risk Metrics Inc. (part of MSCI). The system is a quantitative based program where overall portfolio ‘Credit Value at Risk’ (CreditVaR) is measured and controlled. This model calculates CreditVaR based on credit ratings of the names, default probabilities, loss given default, current market prices of the credits, while considering the impact of correlation of the various credits in the portfolio. In order to institute a common language for understanding and dimensioning credit risk across GIC’s range of investments in projects, RMD is in the process of developing an Internal Credit Risk Rating (ICRR) model that would assist management in determining level of capital allocation and other strategic schemes applicable to the investment credit rating. Naturally, the model will also be used to benchmark the required return given a particular level of risk. Additionally, the rating results will subsequently be used as valuable inputs into the ‘Credit Manager’ system mentioned above.
Credit Risk as per Basel II Standardized Approach Under the credit risk ‘Standardized’ approach, credit exposures are categorized to standard portfolios that are subject to
a distinctive risk-weighting scale based on standard characteristics of the nature of borrower as well as the external credit assessments of international rating agencies where available. GIC uses the credit ratings assigned by Moody’s, S&P and Fitch for this purpose. When more than one counter-party rating is available, Basel II’s multiple assessment guidelines are invoked. In order to provide a common platform into which different notations used by the aforementioned rating agencies can be mapped, a scale of uniform Credit Quality Grades (CQG) represented by the numerals 1 to 5 or 6 are used to represent the relevant risk weights of each standard portfolio. Separate scales are prepared for risk-weighting both long-and short-term issues.
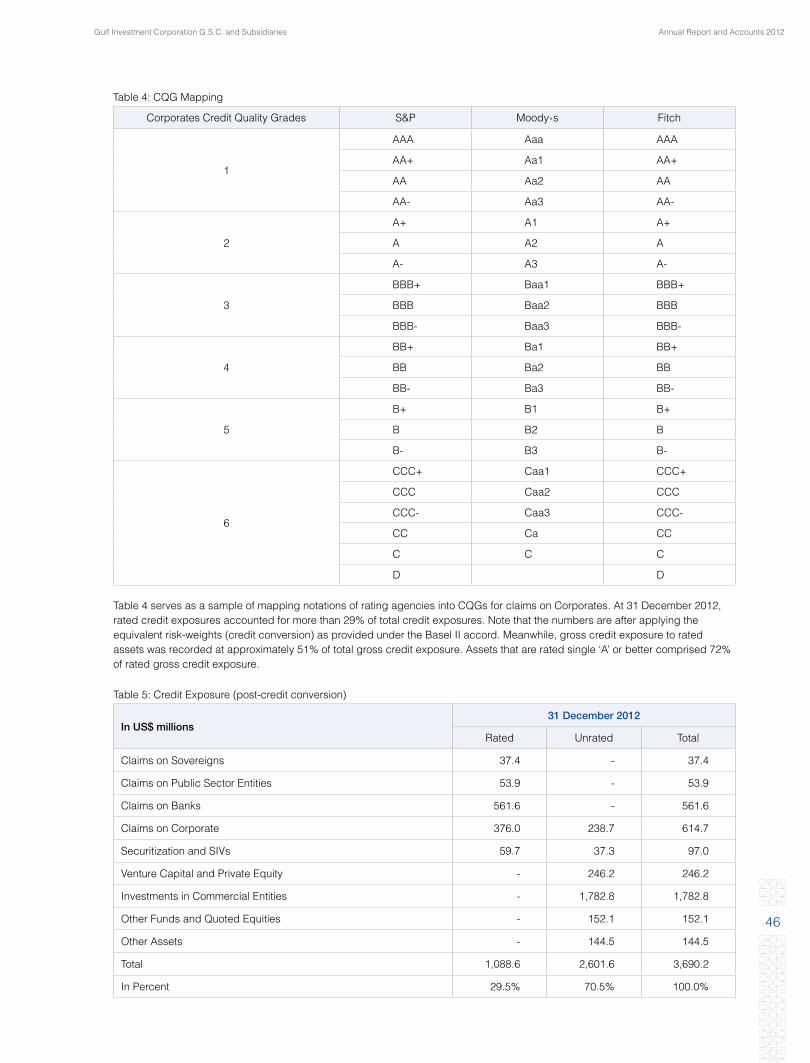
Annual Report and Accounts 2012Gulf Investment Corporation G.S.C. and Subsidiaries
46
Table 4: CQG Mapping
Corporates Credit Quality Grades S&P Moody›s Fitch
1
AAA Aaa AAA
AA+ Aa1 AA+
AA Aa2 AA
AA- Aa3 AA-
2
A+ A1 A+
A A2 A
A- A3 A-
3
BBB+ Baa1 BBB+
BBB Baa2 BBB
BBB- Baa3 BBB-
4
BB+ Ba1 BB+
BB Ba2 BB
BB- Ba3 BB-
5
B+ B1 B+
B B2 B
B- B3 B-
6
CCC+ Caa1 CCC+
CCC Caa2 CCC
CCC- Caa3 CCC-
CC Ca CC
C C C
D D
Table 4 serves as a sample of mapping notations of rating agencies into CQGs for claims on Corporates. At 31 December 2012, rated credit exposures accounted for more than 29% of total credit exposures. Note that the numbers are after applying the equivalent risk-weights (credit conversion) as provided under the Basel II accord. Meanwhile, gross credit exposure to rated assets was recorded at approximately 51% of total gross credit exposure. Assets that are rated single ‘A’ or better comprised 72% of rated gross credit exposure.
Table 5: Credit Exposure (post-credit conversion)
In US$ millions31 December 2012
Rated Unrated Total
Claims on Sovereigns 37.4 - 37.4
Claims on Public Sector Entities 53.9 - 53.9
Claims on Banks 561.6 - 561.6
Claims on Corporate 376.0 238.7 614.7
Securitization and SIVs 59.7 37.3 97.0
Venture Capital and Private Equity - 246.2 246.2
Investments in Commercial Entities - 1,782.8 1,782.8
Other Funds and Quoted Equities - 152.1 152.1
Other Assets - 144.5 144.5
Total 1,088.6 2,601.6 3,690.2
In Percent 29.5% 70.5% 100.0%

Basel II Disclosure
47
Table 6: Gross Credit Exposure (pre-credit conversion)
In US$ millions31 December 2012
Rated Unrated Total
Claims on Sovereigns 172.4 - 172.4
Claims on Public Sector Entities 150.7 - 150.7
Claims on Banks 1,693.1 - 1,693.1
Claims on Corporate 527.7 238.7 766.4
Securitization and SIVs 200.7 37.3 238.0
Venture Capital and Private Equity - 246.2 246.2
Investments in Commercial Entities - 1,782.8 1,782.8
Other Funds and Quoted Equities - 152.1 152.1
Other Assets - 144.5 144.5
Total 2,744.6 2,601.6 5,346.2
In Percent 51.3% 48.7% 100.0%
Tables 5 and 6 present the breakdown of credit exposures pre and post-credit conversion.
Table 7: Gross Credit Exposure before Credit Risk Migitation (CRM)
In US$ millions31 December 2012
Funded Unfunded Total
Claims on Sovereigns 172.4 - 172.4
Claims on Public Sector Entities 150.7 - 150.7
Claims on Banks 1,665.2 27.9 1,693.1
Claims on Corporate 557.7 208.7 766.4
Securitization and SIVs 238.0 - 238.0
Venture Capital and Private Equity 246.2 - 246.2
Investments in Commercial Entities 1,782.8 - 1,782.8
Other Funds and Quoted Equities 152.1 - 152.1
Other Assets 144.5 - 144.5
Total 5,109.6 236.6 5,346.2
In Percent 95.6% 4.4% 100.0%
In terms of facility type (Table 7), US$ 5,109.6 million or approximately 96% is funded. The balance is ascribed to guarantees issued and commitments made by the Corporation, as well as credit exposures on outstanding forward and swap transactions with banks.

Annual Report and Accounts 2012Gulf Investment Corporation G.S.C. and Subsidiaries
48
Table 8: Gross Credit Exposure by Geographic Distribution
In US$ millions31 December 2012
GCC Europe Americas Others Total
Claims on Sovereigns 155.8 5.2 5.1 6.3 172.4
Claims on Public Sector Entities 145.6 - - 5.1 150.7
Claims on Banks 1,035.6 301.7 265.6 90.2 1,693.1
Claims on Corporate 476.2 203.9 23.0 63.3 766.4
Securitization and SIVs - 106.3 131.7 - 238.0
Venture Capital and Private Equity 32.3 53.5 139.5 20.9 246.2
Investments in Commercial Entities 1,675.6 - 20.0 87.2 1,782.8
Other Funds and Quoted Equities 68.4 11.9 61.8 10.0 152.1
Other Assets 56.1 60.4 4.3 23.7 144.5
Total 3,645.6 742.9 651.0 306.7 5,346.2
In Percent 68.2% 13.9% 12.2% 5.7% 100.0%
The geographical distribution (Table 8) is based on either the primary purpose of the exposure or the place of incorporation of the debt security issuer, or incorporation of the fund manager. A sizable portion of credit exposure is in the GCC region tallying at US$ 3,645.6 million, or 68.2% of the total. Following suit are exposures to Europe and Americas, 13.9% and 12.2% respectively. These exposures are due in great part to investments in global securities and funds with varying investment themes.
Table 9: Gross Credit Exposure by Industry Sector
In US$ millions31 December 2012
Banks & Financial Institutions
Trading & Manufacturing Utilities Government
Agencies Others Total
Claims on Sovereigns - - - 172.4 - 172.4
Claims on Public Sector Entities - - - 150.7 - 150.7
Claims on Banks 1,693.1 - - - - 1,693.1
Claims on Corporate - 220.1 418.5 - 127.8 766.4
Securitization and SIVs 238.0 - - - - 238.0
Venture Capital and Private Equity 246.2 - - - - 246.2
Investments in Commercial Entities 142.9 1,432.5 162.7 - 44.7 1,782.8
Other Funds and Quoted Equities 152.1 - - - - 152.1
Other Assets 72.6 43.8 10.8 15.1 2.2 144.5
Total 2,544.9 1,696.4 592.0 338.2 174.7 5,346.2
In Percent 47.6% 31.7% 11.1% 6.3% 3.3% 100.0%
The table on industry distribution (Table 9) of the gross credit exposure reveals a concentration on Banks and financial institutions, amounting to 47.6% of total exposure. Again, this is traced to the Corporation’s debt securities and fund investments as it diversifies its asset from purely equity holdings. Meanwhile, in line with GIC’s commitment to support the industrial growth within the GCC region, equity investments in commercial entities are focused in the trading and manufacturing sectors.
Table 10: Credit Exposure by Residual Contractual Maturity

Basel II Disclosure
49
In US$ millions31 December 2012
Within 3 months 3 months to 1 year 1 to 5 years Over 5 years Total
Claims on Sovereigns - - 103.2 69.2 172.4
Claims on Public Sector Entities - - 118.9 31.8 150.7
Claims on Banks 1,003.5 104.7 482.8 102.1 1,693.1
Claims on Corporate 87.7 43.2 491.6 143.9 766.4
Securitization and SIVs - 49.5 68.5 120.0 238.0
Venture Capital and Private Equity - - - 246.2 246.2
Investments in Commercial Entities - - - 1,782.8 1,782.8
Other Funds and Quoted Equities - - - 152.1 152.1
Other Assets 32.5 31.7 13.7 66.6 144.5
Total 1,123.7 229.1 1,278.7 2,714.7 5,346.2
In Percent 21.0% 4.3% 23.9% 50.8% 100.0%
The residual maturity of gross credit exposure broken down by standard credit risk exposure is shown in Table 10. Approximately 51% of gross credit exposure falls within the longest time bucket of over five years.
Recognition of Impairment of Assets The Corporation assesses at each balance sheet date whether there is any objective evidence that a financial asset is impaired.
Investments are treated as impaired when there has been a significant or prolonged decline in the fair value below its cost or where other objective evidence of impairment exists. The determination of what is ‘significant’ or ‘prolonged’ requires considerable judgment. In addition, the Corporation evaluates other factors, including normal volatility in share price for quoted equities and the future cash flows and the discount factors for projects and unquoted equities. The Corporation reviews its problem loans and advances, and investment in debt instruments at each reporting date to assess whether a provision for impairment should be recorded in the statement of income. In particular, considerable judgment by management is required in the estimation of the amount and timing of future cash flows when determining the level of provisions required. Such estimates are necessarily based on assumptions about several factors involving varying degrees of judgment and uncertainty, and actual results may differ resulting in future changes to such provisions. Noteworthy, the Corporation has taken a strategic decision to wind down its lending activities. An insignificant amount of impaired assets stemming from project loan provided to a manufacturing company based in the GCC has been fully provided for.
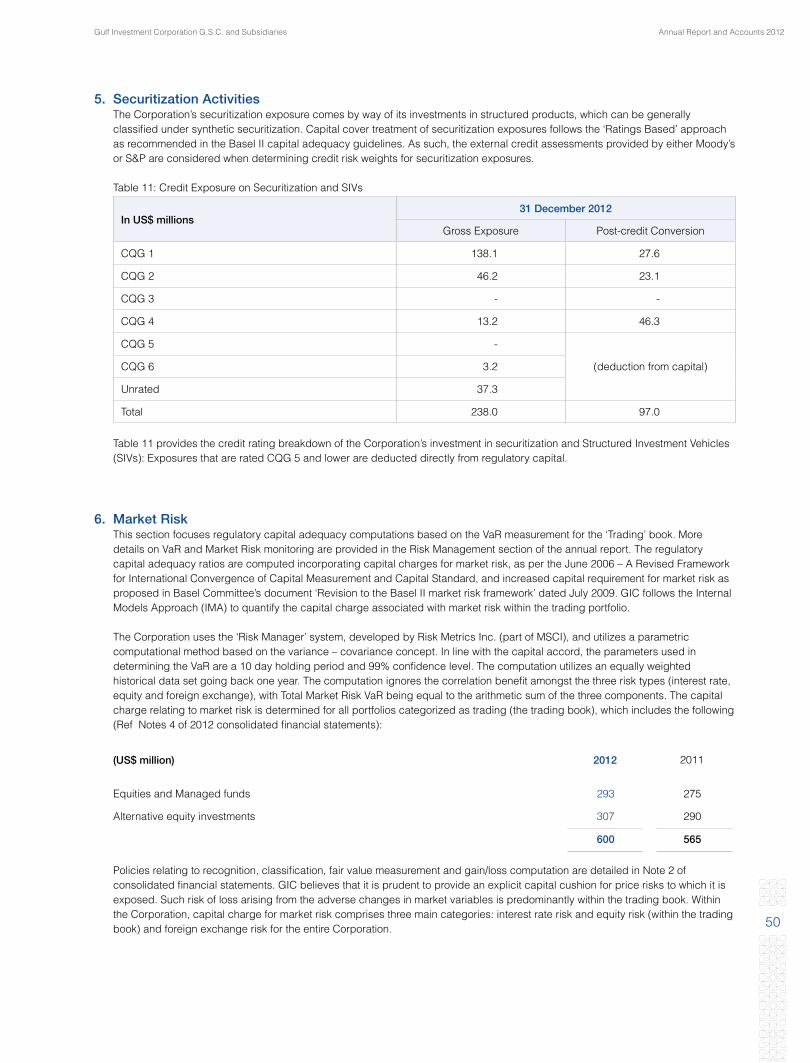
Annual Report and Accounts 2012Gulf Investment Corporation G.S.C. and Subsidiaries
50
5. Securitization Activities The Corporation’s securitization exposure comes by way of its investments in structured products, which can be generally
classified under synthetic securitization. Capital cover treatment of securitization exposures follows the ‘Ratings Based’ approach as recommended in the Basel II capital adequacy guidelines. As such, the external credit assessments provided by either Moody’s or S&P are considered when determining credit risk weights for securitization exposures.
Table 11: Credit Exposure on Securitization and SIVs
In US$ millions31 December 2012
Gross Exposure Post-credit Conversion
CQG 1 138.1 27.6
CQG 2 46.2 23.1
CQG 3 - -
CQG 4 13.2 46.3
CQG 5 -
(deduction from capital) CQG 6 3.2
Unrated 37.3
Total 238.0 97.0
Table 11 provides the credit rating breakdown of the Corporation’s investment in securitization and Structured Investment Vehicles (SIVs): Exposures that are rated CQG 5 and lower are deducted directly from regulatory capital.
6. Market Risk This section focuses regulatory capital adequacy computations based on the VaR measurement for the ‘Trading’ book. More
details on VaR and Market Risk monitoring are provided in the Risk Management section of the annual report. The regulatory capital adequacy ratios are computed incorporating capital charges for market risk, as per the June 2006 – A Revised Framework for International Convergence of Capital Measurement and Capital Standard, and increased capital requirement for market risk as proposed in Basel Committee’s document ‘Revision to the Basel II market risk framework’ dated July 2009. GIC follows the Internal Models Approach (IMA) to quantify the capital charge associated with market risk within the trading portfolio.
The Corporation uses the ‘Risk Manager’ system, developed by Risk Metrics Inc. (part of MSCI), and utilizes a parametric computational method based on the variance – covariance concept. In line with the capital accord, the parameters used in determining the VaR are a 10 day holding period and 99% confidence level. The computation utilizes an equally weighted historical data set going back one year. The computation ignores the correlation benefit amongst the three risk types (interest rate, equity and foreign exchange), with Total Market Risk VaR being equal to the arithmetic sum of the three components. The capital charge relating to market risk is determined for all portfolios categorized as trading (the trading book), which includes the following (Ref Notes 4 of 2012 consolidated financial statements):
(US$ million) 2012 2011
Equities and Managed funds 293 275
Alternative equity investments 307 290
600 565
Policies relating to recognition, classification, fair value measurement and gain/loss computation are detailed in Note 2 of consolidated financial statements. GIC believes that it is prudent to provide an explicit capital cushion for price risks to which it is exposed. Such risk of loss arising from the adverse changes in market variables is predominantly within the trading book. Within the Corporation, capital charge for market risk comprises three main categories: interest rate risk and equity risk (within the trading book) and foreign exchange risk for the entire Corporation.

Basel II Disclosure
51
The Value-at-Risk concept is a sound basis for the quantification of market risk, and the variance – co-variance methodology adequately suits the Corporation’s asset types. Most of the exposures within the trading book entail very little optionality and are mostly linear in nature. The VaR based system provides a dynamic measure of market risk capturing, in a timely manner, the impact of changes in environment on the value of the portfolio of financial instruments. The VaR model is a statistical tool, based on simplifying assumptions, and as such has certain limitations (examples: occurrence of ‘fat tails’, non-normal distributions and event risks; the past not being a good approximation of future, etc). To a large extent, these limitations are addressed by the back-testing exercise and related multiplication factor used. For all the portfolios within the trading book, the same variance – co-variance methodology is used to compute VaR, which is computed on a daily basis as per the parameters described above.
Scenario analysis and stress testing is an essential component of the market risk management framework. The assumption of normality on which the statistical models are based may become invalid due to the occurrence of certain events. Future scenarios, which result in a breakdown of the historical behavior and relationships between risk constituents, are projected, and potential loss amounts are determined. Most of these scenarios are derived from macroeconomic events of the past, modified with the expectations for the future.
Back-testing The objective of ‘back-testing’ is to measure/validate the accuracy of the internal VaR model. Back-testing essentially deals with
the process of comparing actual trading results with the model generated risk measures (estimates). Back-testing is conducted in line with the ‘Supervisory Framework Document’ issued by the Basel Committee. The parameters for back-testing are a one-day holding period and 99% confidence level. To the extent that the back-testing program is viewed purely as a statistical test of the integrity of the calculation of Value-at Risk (VaR) measure, the Corporation felt it appropriate to utilize the ‘hypothetical portfolio’ approach. In this approach, a static hypothetical model portfolio, with similar characteristics of the actual portfolio, is created and daily change in market value is computed based on actual price observations. VaR is also computed for this static portfolio using the model and comparisons are made between actual results and model estimates. The advantage of this method is that the value change outcomes are not ‘contaminated’ by changes in the portfolio (which could happen if the actual portfolio were used).
The multiplication factor of 3 is used for capital calculation, in line with the Basel guidelines.
Capital charge for market risk is determined based on the following formula: Capital Charge (market risk) = (Max {Vavg,Vend} + Max{SVavg,SVend})X Mf Where, Vavg equals: Average Total VaR for the trading book over the previous 60 business days Vend equals: End of period Total VaR for the trading book SVavg equals: Average Stressed VaR for the trading book over the previous 60 business days SVend equals: End of period Stressed VaR for the trading book Mf equals: Multiplication factor (a factor of three issued based on the results of back-testing)
Table 12: Trading Book VaR (US$ 000’s) – 10 day holding period, 99% confidence level. For the last 60 business days in 2012
In US$ millions Interest Rate Equity FX Total
Max 2.2 6.4 2.0 10.6
Min 1.1 1.1 1.1 3.3
Average 1.3 6.0 1.8 9.1
31-Dec-12 1.3 5.9 2.7 9.9
Stress VaR 3.8 16.4 5.8 26.0
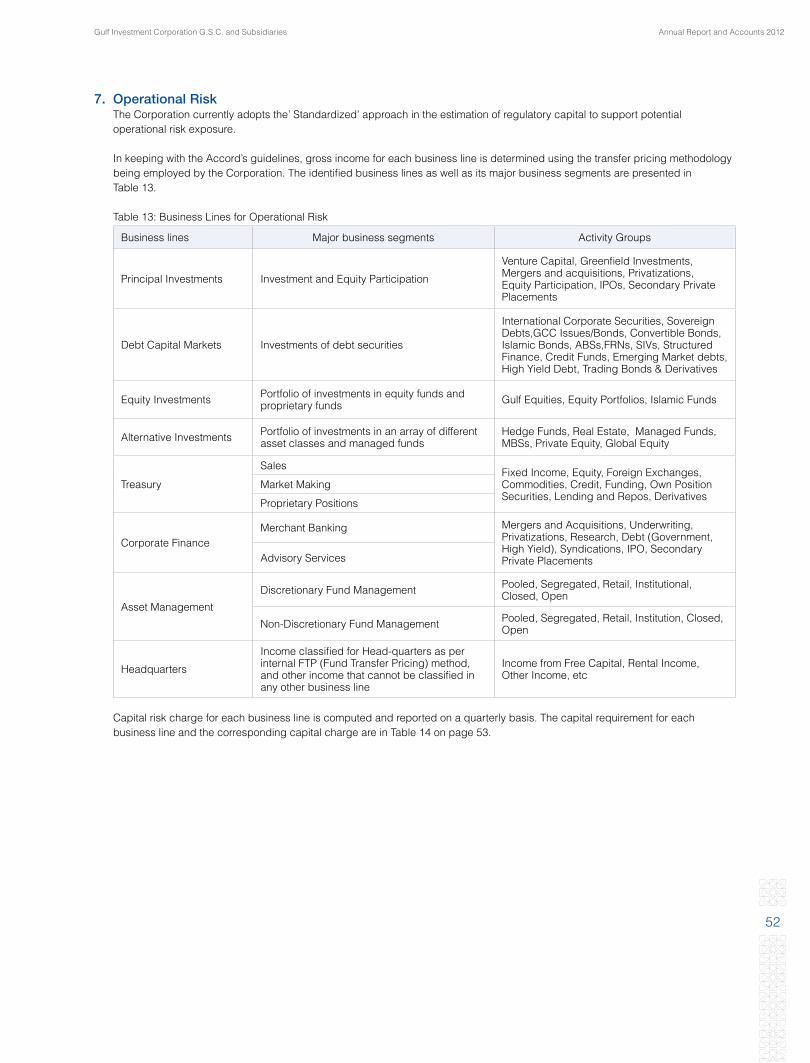
Annual Report and Accounts 2012Gulf Investment Corporation G.S.C. and Subsidiaries
52
7. Operational Risk The Corporation currently adopts the’ Standardized’ approach in the estimation of regulatory capital to support potential
operational risk exposure.
In keeping with the Accord’s guidelines, gross income for each business line is determined using the transfer pricing methodology being employed by the Corporation. The identified business lines as well as its major business segments are presented in Table 13.
Table 13: Business Lines for Operational Risk
Business lines Major business segments Activity Groups
Principal Investments Investment and Equity Participation
Venture Capital, Greenfield Investments, Mergers and acquisitions, Privatizations, Equity Participation, IPOs, Secondary Private Placements
Debt Capital Markets Investments of debt securities
International Corporate Securities, Sovereign Debts,GCC Issues/Bonds, Convertible Bonds, Islamic Bonds, ABSs,FRNs, SIVs, Structured Finance, Credit Funds, Emerging Market debts, High Yield Debt, Trading Bonds & Derivatives
Equity Investments Portfolio of investments in equity funds and proprietary funds Gulf Equities, Equity Portfolios, Islamic Funds
Alternative Investments Portfolio of investments in an array of different asset classes and managed funds
Hedge Funds, Real Estate, Managed Funds, MBSs, Private Equity, Global Equity
Treasury
SalesFixed Income, Equity, Foreign Exchanges, Commodities, Credit, Funding, Own Position Securities, Lending and Repos, Derivatives
Market Making
Proprietary Positions
Corporate FinanceMerchant Banking Mergers and Acquisitions, Underwriting,
Privatizations, Research, Debt (Government, High Yield), Syndications, IPO, Secondary Private PlacementsAdvisory Services
Asset Management
Discretionary Fund Management Pooled, Segregated, Retail, Institutional, Closed, Open
Non-Discretionary Fund Management Pooled, Segregated, Retail, Institution, Closed, Open
Headquarters
Income classified for Head-quarters as per internal FTP (Fund Transfer Pricing) method, and other income that cannot be classified in any other business line
Income from Free Capital, Rental Income, Other Income, etc
Capital risk charge for each business line is computed and reported on a quarterly basis. The capital requirement for each business line and the corresponding capital charge are in Table 14 on page 53.
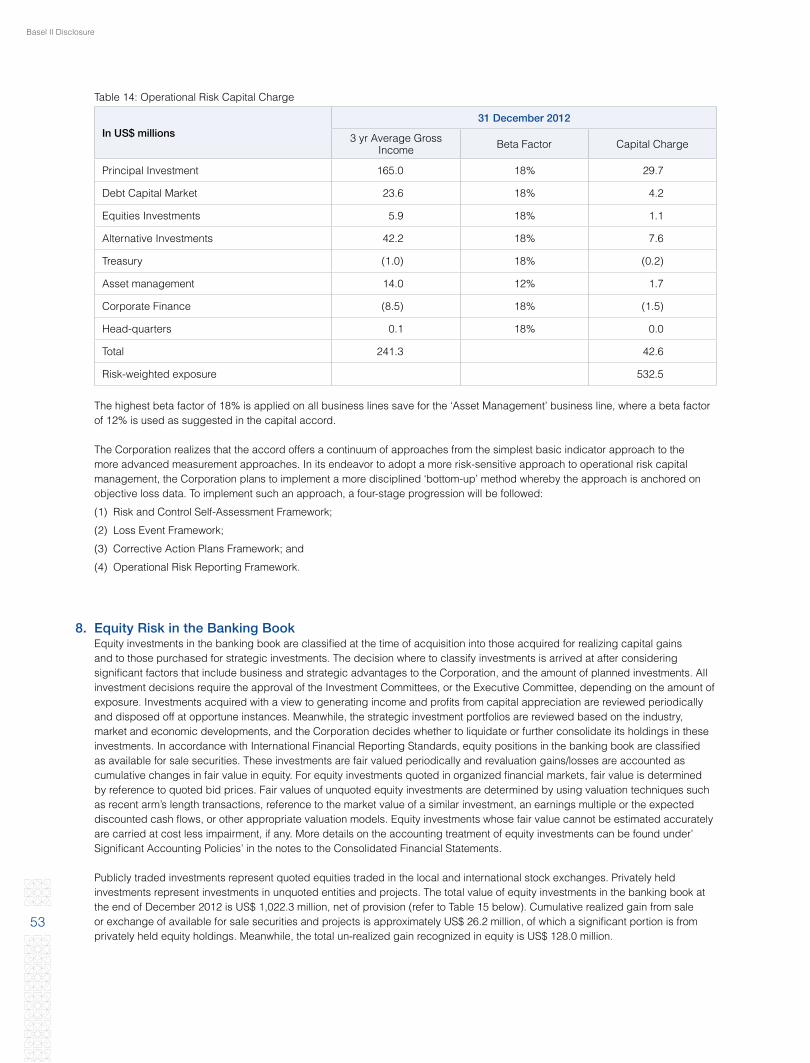
Basel II Disclosure
53
Table 14: Operational Risk Capital Charge
In US$ millions31 December 2012
3 yr Average Gross Income Beta Factor Capital Charge
Principal Investment 165.0 18% 29.7
Debt Capital Market 23.6 18% 4.2
Equities Investments 5.9 18% 1.1
Alternative Investments 42.2 18% 7.6
Treasury (1.0) 18% (0.2)
Asset management 14.0 12% 1.7
Corporate Finance (8.5) 18% (1.5)
Head-quarters 0.1 18% 0.0
Total 241.3 42.6
Risk-weighted exposure 532.5
The highest beta factor of 18% is applied on all business lines save for the ‘Asset Management’ business line, where a beta factor of 12% is used as suggested in the capital accord.
The Corporation realizes that the accord offers a continuum of approaches from the simplest basic indicator approach to the more advanced measurement approaches. In its endeavor to adopt a more risk-sensitive approach to operational risk capital management, the Corporation plans to implement a more disciplined ‘bottom-up’ method whereby the approach is anchored on objective loss data. To implement such an approach, a four-stage progression will be followed:
(1) Risk and Control Self-Assessment Framework;
(2) Loss Event Framework;
(3) Corrective Action Plans Framework; and
(4) Operational Risk Reporting Framework.
8. Equity Risk in the Banking Book Equity investments in the banking book are classified at the time of acquisition into those acquired for realizing capital gains
and to those purchased for strategic investments. The decision where to classify investments is arrived at after considering significant factors that include business and strategic advantages to the Corporation, and the amount of planned investments. All investment decisions require the approval of the Investment Committees, or the Executive Committee, depending on the amount of exposure. Investments acquired with a view to generating income and profits from capital appreciation are reviewed periodically and disposed off at opportune instances. Meanwhile, the strategic investment portfolios are reviewed based on the industry, market and economic developments, and the Corporation decides whether to liquidate or further consolidate its holdings in these investments. In accordance with International Financial Reporting Standards, equity positions in the banking book are classified as available for sale securities. These investments are fair valued periodically and revaluation gains/losses are accounted as cumulative changes in fair value in equity. For equity investments quoted in organized financial markets, fair value is determined by reference to quoted bid prices. Fair values of unquoted equity investments are determined by using valuation techniques such as recent arm’s length transactions, reference to the market value of a similar investment, an earnings multiple or the expected discounted cash flows, or other appropriate valuation models. Equity investments whose fair value cannot be estimated accurately are carried at cost less impairment, if any. More details on the accounting treatment of equity investments can be found under’ Significant Accounting Policies’ in the notes to the Consolidated Financial Statements.
Publicly traded investments represent quoted equities traded in the local and international stock exchanges. Privately held investments represent investments in unquoted entities and projects. The total value of equity investments in the banking book at the end of December 2012 is US$ 1,022.3 million, net of provision (refer to Table 15 below). Cumulative realized gain from sale or exchange of available for sale securities and projects is approximately US$ 26.2 million, of which a significant portion is from privately held equity holdings. Meanwhile, the total un-realized gain recognized in equity is US$ 128.0 million.

Annual Report and Accounts 2012Gulf Investment Corporation G.S.C. and Subsidiaries
54
Table 15: Equity Holdings in Banking Book
In US$ millions31 December 2012
Publicly Traded Privately Held Total
Fair Value of Equity Investments 544.2 478.0 1,022.3
Realized gains recorded in P/L 2.3 23.9 26.2
Unrealized gains recorded in equity 121.4 6.5 128.0
45% unrealized gain in Tier 2 Capital 54.7 2.9 57.6
9. Interest Rate Risk in the Banking Book Treasury manages short term interest rate gapping by means of monitoring overall interest rate exposure in the next 24 months
as measured in Eurodollar futures contract equivalents. Treasury is not allowed to mismatch positions over two years unless appropriate management approval has been obtained. Any funding, placements or borrowing that has a maturity or re-pricing profile of more than two years are either matched or hedged. The rate calculated from short-dated (up to two years) Eurodollar futures contract is effectively the forward interest rate of the underlying, i.e. Eurodollar deposits. Total USD placements and borrowings transacted by Treasury are profiled in time buckets from one week and then monthly thereafter until 24 months. The same procedure is applied to other currencies, the gaps on these currency positions are translated to USD equivalents in order to ascertain the equivalent number of Eurodollar futures contracts for the individual major currencies
A maximum limit of 3,500 Eurodollar contracts is currently set, with the maximum VaR at US$ 3.08 million. The calculation of VaR
equivalent is derived from the 30 day average price volatility of 3 month Eurodollar futures. The current yield is adjusted by the average volatility before it is applied on the position value. The resulting number is then scaled up to a 95% level of confidence.
The Eurodollar futures contract position value as at December 31, 2012 was 10,702 contracts, with an estimated VaR of US$ 0.6
million. This is significantly higher than the levels of the previous year (31st December 2011: 1,172 contracts), primarily due to the US$ 500 million fixed rate EMTN issued in Q4 2012. Excluding the impact of this EMTN issuance, the number of contracts, at 31st December 2012, would be approximately 1,700 contracts.

55
ConsolidatedFinancial
Statements31 December 2012
Annual Report and Accounts 2012Gulf Investment Corporation G.S.C. and Subsidiaries
56
57Independent Auditors’ Report
58Consolidated Statement of Financial Position
59Consolidated Statement of Income
60Consolidated Statement of Comprehensive Income
61Consolidated Statement of Changes in Equity
62Consolidated Statement of Cash Flows
63Notes to the Consolidated Financial Statements
Contents

57
Independent Auditors’ Report To The Shareholders Of Gulf Investment Corporation G.S.C.
Report on the Consolidated Financial StatementsWe have audited the accompanying consolidated financial statements of Gulf Investment Corporation G.S.C. (the “Corporation”) and its subsidiaries (together the “Group”), which comprise the consolidated statement of financial position as at 31 December 2012, consolidated statements of income, comprehensive income, changes in equity and cash flows for the year then ended, and a summary of significant accounting policies and other explanatory information.
Management’s Responsibility for the Consolidated Financial StatementsThe Corporation’s management is responsible for the preparation and fair presentation of these consolidated financial statements in accordance with International Financial Reporting Standards as adopted for use by the State of Kuwait, and for such internal control as management determines is necessary to enable the preparation of consolidated financial statements that are free from material misstatement, whether due to fraud or error.
Auditor ResponsibilityOur responsibility is to express an opinion on these consolidated financial statements based on our audit. We conducted our audit in accordance with International Standards on Auditing. Those standards require that we comply with ethical requirements and plan and perform the audit to obtain reasonable assurance about whether the consolidated financial statements are free from material misstatement.
An audit involves performing procedures to obtain audit evidence about the amounts and disclosures in the consolidated financial statements. The procedures selected depend on the auditors’ judgment, including the assessment of the risks of material misstatement of the consolidated financial statements, whether due to fraud or error. In making those risk assessments, the auditor considers internal control relevant to the Corporation’s preparation and fair presentation of the consolidated financial statements in order to design audit procedures that are appropriate in the circumstances, but not for the purpose of expressing an opinion on the effectiveness of the Group’s internal control. An audit also includes evaluating the appropriateness of accounting polices used and the reasonableness of accounting estimates made by management, as well as evaluating the overall presentation of the consolidated financial statements.
We believe that the audit evidence we have obtained is sufficient and appropriate to provide a basis for our audit opinion.
OpinionIn our opinion, the consolidated financial statements present fairly, in all material respects, the financial position of the Group as at 31 December 2012, and its financial performance and cash flows for the year then ended in accordance with International Financial Reporting Standards as adopted for use by the State of Kuwait.
Report on Other Legal and Regulatory RequirementsFurthermore, in our opinion, proper books of account have been kept by the Corporation and the consolidated financial statements, together with the contents of the report of the Corporation’s board of directors relating to these consolidated financial statements, are in accordance therewith. We further report that we obtained all the information and explanations that we required for the purpose of our audit and that the consolidated financial statements incorporate all information that is required by the Companies Law No. 25 of 2012, and by the Corporation’s articles of association, that an inventory was duly carried out and that, to the best of our knowledge and belief, no violations of the Companies Law No. 25 of 2012, nor of the Corporation’s articles of association, have occurred during the year ended 31 December 2012 that might have had a material effect on the business of the Corporation’s or on its financial position.
We further report that, during the course of our audit, to the best of our knowledge and belief, we have not become aware of any material violations of the provisions of Law No. 32 of 1968, as amended, concerning currency, the Central Bank of Kuwait and the organisation of banking business, and its related regulations during the year ended 31 December 2012.
Ernst & YoungAl Aiban, Al Osaimi & PartnersP.O. Box 74, Safat 13001 Safat, KuwaitBaitak Tower, 18 - 21st FloorSafat Square, Ahmed Al Jaber St., KuwaitTels: 22452880 / 22955000 Fax: [email protected]/me
Waleed A. Al OsaimiLicense No. 68 A of Ernst & YoungAl Aiban, Al Osaimi & Partners
28 February 2013Kuwait
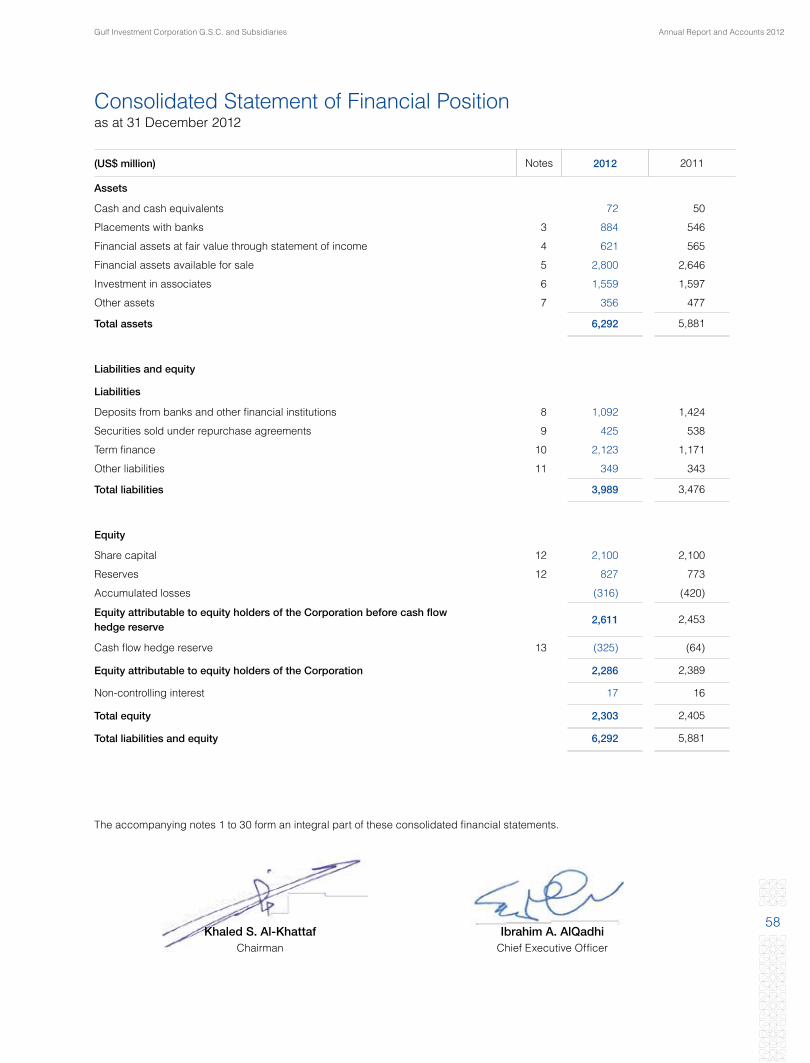
Annual Report and Accounts 2012Gulf Investment Corporation G.S.C. and Subsidiaries
58
(US$ million) Notes 2012 2011
Assets
Cash and cash equivalents 72 50
Placements with banks 3 884 546
Financial assets at fair value through statement of income 4 621 565
Financial assets available for sale 5 2,800 2,646
Investment in associates 6 1,559 1,597
Other assets 7 356 477
Total assets 6,292 5,881
Liabilities and equity
Liabilities
Deposits from banks and other financial institutions 8 1,092 1,424
Securities sold under repurchase agreements 9 425 538
Term finance 10 2,123 1,171
Other liabilities 11 349 343
Total liabilities 3,989 3,476
Equity
Share capital 12 2,100 2,100
Reserves 12 827 773
Accumulated losses (316) (420)
Equity attributable to equity holders of the Corporation before cash flow hedge reserve
2,611 2,453
Cash flow hedge reserve 13 (325) (64)
Equity attributable to equity holders of the Corporation 2,286 2,389
Non-controlling interest 17 16
Total equity 2,303 2,405
Total liabilities and equity 6,292 5,881
Consolidated Statement of Financial Positionas at 31 December 2012
The accompanying notes 1 to 30 form an integral part of these consolidated financial statements.
Khaled S. Al-KhattafChairman
Ibrahim A. AlQadhiChief Executive Officer

Consolidated Financial Statements
59
(US$ million) Notes 2012 2011
Interest income 14 42 41
Net gains from investments 15 78 33
Dividend income 16 28 24
Share of results from associates 6 98 227
Net fees, commission and other income 17 26 20
Foreign exchange gain (loss) 1 (1)
Total income 273 344
Interest expense 18 (61) (59)
Other operating income 19 10 7
Net operating income 222 292
Staff cost (49) (42)
Premises cost (2) (2)
Other operating expense (15) (17)
Impairment losses 20 (25) (49)
Profit for the year 131 182
Attributable to:
Equity holders of the Corporation 130 181
Non-controlling interest 1 1
131 182
Consolidated Statement of Incomefor the year ended 31 December 2012
The accompanying notes 1 to 30 form an integral part of these consolidated financial statements.

Annual Report and Accounts 2012Gulf Investment Corporation G.S.C. and Subsidiaries
60
(US$ million) Notes 2012 2011
Profit for the year 131 182
Other comprehensive (loss) income:
Financial assets available for sale: - Net unrealised gain arising during the year - Transferred to consolidated statement of income on sale - Transferred to consolidated statement of income on impairment, net
1520
65(40)
7
77(27)
50
Share of cash flow hedge loss of associates 13 (261) (10)
Share of other comprehensive (loss) income of associates (4) 1
Other comprehensive (loss) income for the year (233) 91
Total comprehensive (loss) income for the year (102) 273
Attributable to:
Equity holders of the Corporation (103) 272
Non-controlling interest 1 1
(102) 273
Consolidated Statement of Comprehensive Incomefor the year ended 31 December 2012
The accompanying notes 1 to 30 form an integral part of these consolidated financial statements.
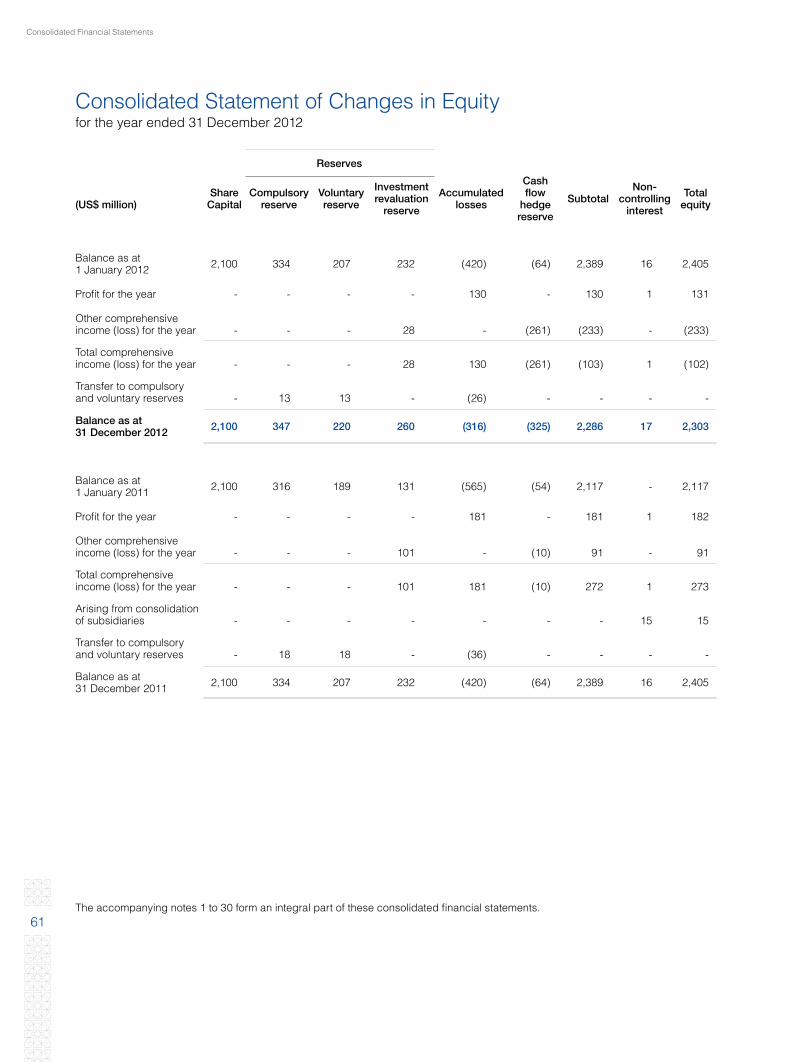
Consolidated Financial Statements
61
Reserves
(US$ million)Share
CapitalCompulsory
reserveVoluntary reserve
Investment revaluation
reserve
Accumulated losses
Cash flow
hedge reserve
SubtotalNon-
controlling interest
Total equity
Balance as at 1 January 2012 2,100 334 207 232 (420) (64) 2,389 16 2,405
Profit for the year - - - - 130 - 130 1 131
Other comprehensive income (loss) for the year - - - 28 - (261) (233) - (233)
Total comprehensive income (loss) for the year - - - 28 130 (261) (103) 1 (102)
Transfer to compulsory and voluntary reserves - 13 13 - (26) - - - -
Balance as at 31 December 2012 2,100 347 220 260 (316) (325) 2,286 17 2,303
Balance as at 1 January 2011 2,100 316 189 131 (565) (54) 2,117 - 2,117
Profit for the year - - - - 181 - 181 1 182
Other comprehensive income (loss) for the year
- - - 101 - (10) 91 - 91
Total comprehensive income (loss) for the year - - - 101 181 (10) 272 1 273
Arising from consolidation of subsidiaries - - - - - - - 15 15
Transfer to compulsory and voluntary reserves - 18 18 - (36) - - - -
Balance as at 31 December 2011 2,100 334 207 232 (420) (64) 2,389 16 2,405
Consolidated Statement of Changes in Equityfor the year ended 31 December 2012
The accompanying notes 1 to 30 form an integral part of these consolidated financial statements.

Annual Report and Accounts 2012Gulf Investment Corporation G.S.C. and Subsidiaries
62
(US$ million) Notes 2012 2011
Cash flows from operating activities:
Profit for the year 131 182
Adjustments for:
Impairment losses 20 25 49
Realised gain on financial assets available for sale 15 (40) (27)
Realised gain on sale of associates 15 (4) -
Share of results of associates 6 (98) (227)
Amortisation of net discount / premium on debt securities 1 (1)
Dividend income 16 (28) (24)
(13) (48)
Changes in operating assets and liabilities:
Placements with banks (338) 86
Financial assets at fair value through statement of income (56) 76
Financial assets available for sale (77) 303
Deposits from banks and other financial institutions (332) (5)
Movement in other assets and other liabilities, (net) (27) 26
Dividend income received 16 28 24
Net cash flows (used in) from operating activities (815) 462
Cash flows from investing activities:
Dividends from associates 50 13
Proceeds from sale of investment in associates 2 -
Additional contribution to associates (33) (136)
Net cash flows from (used in) investing activities 19 (123)
Cash flows from financing activities:
Decrease in securities sold under repurchase agreements (113) (318)
New term finance obtained 931 547
Term finance repaid - (555)
Net cash flows from (used in) financing activities 818 (326)
Increase in cash and cash equivalents 22 13
Non-controlling interest arising on consolidation - 15
Cash and cash equivalents at 1 January 50 22
Cash and cash equivalents at 31 December 72 50
Consolidated Statement of Cash Flowsfor the year ended 31 December 2012
The accompanying notes 1 to 30 form an integral part of these consolidated financial statements.
Consolidated Financial Statements
63
Notes to the Consolidated Financial Statementsfor the year ended 31 December 2012
1 INCORPORATION AND ACTIVITY Gulf Investment Corporation G.S.C. (“the Corporation”) is an investment company incorporated in the State of Kuwait on 15
November 1983 as a Gulf Shareholding Company. It is equally owned by the governments of the six member states of the Gulf Co-operation Council (“GCC”) – Bahrain, Kuwait, Oman, Qatar, Saudi Arabia and the United Arab Emirates. The Corporation is engaged in various investing and financing activities including investment advisory and asset management services.
The Corporation is domiciled in Kuwait and its registered office is at Jaber Al Mubarak Street, Al Sharq, Kuwait.
The consolidated financial statements of the Corporation and its subsidiaries (collectively “the Group”) for the year ended 31 December 2012 were authorised for issue in accordance with a resolution of the directors on 28 February 2013. The Annual General Assembly of Shareholders has the power to amend these consolidated financial statements after issuance.
2 SIGNIFICANT ACCOUNTING POLICIES
2.1 Statement of compliances The consolidated financial statements of the Group have been prepared in accordance with the regulations of the
Government of the State of Kuwait for financial services institutions regulated by the Central Bank of Kuwait. These regulations require adoption of all International Financial Reporting Standards (IFRS) except for the IAS 39 requirement for collective provision, which has been replaced by the Central Bank of Kuwait’s requirement for a minimum general provision as described under the accounting policy for impairment of financial assets. In addition, the consolidated financial statements have been prepared in accordance with the requirements of the Kuwait Commercial Companies Law No. 25 of 2012, as amended, Ministerial Order No.18 of 1990 and the Corporation’s memorandum and articles of association.
2.2 Basis of preparation The consolidated financial statements are prepared on a historical cost basis as modified for the revaluation at fair
value of financial assets at fair value through statement of income, financial assets available for sale, derivative financial instruments and financial assets forming part of effective fair value hedging relationships, except those financial assets for which a reliable measure of fair value is not available.
The consolidated financial statements are presented in United States Dollars, and all values are rounded to the nearest million.
Changes in accounting policy and disclosures The accounting policies used in the preparation of these consolidated financial statements are consistent with those
used in previous year, except for the following new and amended IFRS effective as of 1 January 2012. However, the implementation of new and amended IFRS did not have a significant impact on the Group’s consolidated financial statements.
IFRS 7 Financial Instruments: Disclosures The amendment requires additional disclosure about financial assets that have been transferred but not derecognised
to enable the user of the Group’s consolidated financial statements to understand the relationship with those assets that have not been derecognised and their associated liabilities. In addition, the amendment requires disclosures about the entity’s continuing involvement in derecognised assets to enable the users to evaluate the nature of, and risks associated with, such involvement. The amendment is effective for annual periods beginning on or after 1 July 2011. The Group does not have any assets with these characteristics and accordingly there has been no effect on the presentation of its consolidated financial statements.
Standards issued but not yet effective Standards issued but not yet effective up to the date of issuance of the Group’s consolidated financial statements
are listed below. This listing of standards issued is those that the Group reasonably expects to have an impact on disclosures, financial position or performance when applied at a future date. The Group intends to adopt these standards when they become effective.
Annual Report and Accounts 2012Gulf Investment Corporation G.S.C. and Subsidiaries
64
Notes to the Consolidated Financial Statementsfor the year ended 31 December 2012
2 SIGNIFICANT ACCOUNTING POLICIES (continued)
2.2 Basis of preparation (continued)
Standards issued but not yet effective (continued)
IAS 1 Financial Statement Presentation: The amendments to IAS 1 change the grouping of items presented in other comprehensive income. Items that could
be reclassified (or ‘recycled’) to profit or loss at a future point in time (for example, upon derecognition or settlement) would be presented separately from items that will never be reclassified. The amendment is effective for annual periods beginning on or after 1 July 2012.
IFRS 9 ‘Financial Instruments’: The standard was issued in November 2009 and becomes effective for annual periods beginning on or after 1 January
2015. IFRS 9 improves the ability of the users of the consolidated financial statement to assess the amount, timing and uncertainty of future cash flows of the entity by replacing many financial instrument classification categories, measurement and associated impairment methods. The application of IFRS 9 will result in amendments and additional disclosures relating to financial instruments and associated risks.
IFRS 10 Consolidated Financial Statements IFRS 10 replaces the portion of IAS 27 Consolidated and Separate Financial Statements that addresses the accounting
for consolidated financial statements. It also includes the issues raised in SIC-12 Consolidation - Special Purpose Entities. It establishes a single control model that applies to all entities including special purpose entities. The changes introduced by IFRS 10 will require management to exercise significant judgement to determine which entities are controlled, and therefore, are required to be consolidated by a parent, compared with the requirements that were in IAS 27. This standard becomes effective for annual periods beginning on or after 1 January 2013. The Group is in the process of assessing the impact of adoption of this standard.
IFRS 11 Joint Arrangements IFRS 11 replaces IAS 31 Interests in Joint Ventures and SIC-13 Jointly-controlled Entities - Non-monetary Contributions
by Ventures. IFRS 11 removes the option to account for jointly controlled entities (JCEs) using proportionate consolidation. Instead, JCEs that meet the definition of a joint venture must be accounted for using the equity method. The amendment is deemed to have no impact on the financial statements of the Group. This standard becomes effective for annual periods beginning on or after 1 January 2013.
IFRS 12 Disclosure of Involvement with Other Entities IFRS 12 includes all of the disclosures that were previously in IAS 27 related to consolidated financial statements, as
well as all of the disclosures that were previously included in IAS 31 and IAS 28. These disclosures relate to an entity’s interests in subsidiaries, joint arrangements, associates and structured entities. A number of new disclosures are also required. This standard becomes effective for annual periods beginning on or after 1 January 2013.
IFRS 13 Fair Value Measurement IFRS 13, which will be effective 1 January 2013, replaces the guidance on fair value measurement in existing IFRS
accounting literature with a single standard. IFRS 13 defines fair value, provides guidance on how to determine fair value and requires disclosures about fair value measurements. However, IFRS 13 does not change the requirements regarding which items should be measured or disclosed at fair value.
IAS19EmployeeBenefits(Revised) Amended standard is effective for annual periods beginning on or after 1 January 2013, with earlier application
permitted. With very few exceptions, retrospective application is required. Numerous changes or clarifications are made under the amended standard. Among these numerous amendments, the most important changes are making the distinction between short-term and other long-term employee benefits based on expected timing of settlement rather than employee entitlement.
The application of the above standards is not expected to have a material impact on the financial position or performance of the Group as and when they become effective or early adopted, except for IFRS 9 and IFRS 13 which will result in amendments and/or additional disclosures relating to classification, measurement and associated risks of financial instruments.

Consolidated Financial Statements
65
2 SIGNIFICANT ACCOUNTING POLICIES (continued)
2.3 Basis of consolidation The consolidated financial statements comprise the financial statements of the Corporation and its subsidiaries as at
31 December 2012.
Subsidiaries are fully consolidated from the date of acquisition, being the date on which the Group obtains control, and continue to be consolidated until the date when such control ceases. The financial statements of the subsidiaries are prepared for the same reporting period as the Corporation, using consistent accounting policies. The financial statements of subsidiaries are consolidated on a line-by-line basis by adding together like items of assets, liabilities, income and expenses. All intra-group balances, transactions, unrealised gains and losses resulting from intra-group transactions and dividends are eliminated in full. The financial statements of the subsidiaries are prepared using uniform accounting policies for like transactions and other events in similar circumstances.
Losses within a subsidiary are attributed to the non-controlling interest even if that results in a deficit balance.
A change in the ownership interest of a subsidiary, without a loss of control, is accounted for as an equity transaction. If the Group loses control over a subsidiary, it:
• Derecognises the assets (including goodwill) and liabilities of the subsidiary • Derecognises the carrying amount of any non-controlling interest • Derecognises the cumulative translation differences recorded in other comprehensive income • Recognises the fair value of the consideration received • Recognises the fair value of any investment retained • Recognises any surplus or deficit in profit or loss • Reclassifies the Corporation’s share of components previously recognised in other comprehensive income to the
consolidated statement of income or retained earnings, as appropriate.
The results of the subsidiaries acquired or disposed off during the year are included in the consolidated statement of income from the date of acquisition or up to the date of disposal, as appropriate.
2.4 Business Combination and Goodwill Business combinations are accounted for using the acquisition accounting method. The cost of an acquisition is
measured as the aggregate of the consideration transferred, measured at acquisition date fair value and the amount of any non-controlling interest in the acquiree. For each business combination, the acquirer measures the non-controlling interest in the acquiree either at fair value or at the proportionate share of the acquiree’s identifiable net assets. Acquisition costs incurred are expensed and included in administrative expenses.
When the Group acquires a business, it assesses the financial assets and liabilities assumed for appropriate classification and designation in accordance with the contractual terms, economic circumstances and pertinent conditions as at the acquisition date. This includes the separation of embedded derivatives in host contracts by the acquiree.
If the business combination is achieved in stages, the acquisition date fair value of the acquirer’s previously held equity interest in the acquiree is remeasured to fair value at the acquisition date through the consolidated statement of income.
Any contingent consideration to be transferred by the acquirer will be recognised at fair value at the acquisition date. Subsequent changes to the fair value of the contingent consideration which is deemed to be an asset or liability, will be recognised in accordance with IAS 39 either in profit or loss or as a change to other comprehensive income. If the contingent consideration is classified as equity, it should not be remeasured until it is finally settled within equity.
Goodwill is initially measured at cost being the excess of the cost of the business combination over the Group’s share in the net fair value of the acquiree’s identifiable assets, liabilities and contingent liabilities. If the cost of acquisition is less than the fair value of the net assets of the subsidiary acquired, the difference is recognised directly in the consolidated statement of income.
Notes to the Consolidated Financial Statementsfor the year ended 31 December 2012

Annual Report and Accounts 2012Gulf Investment Corporation G.S.C. and Subsidiaries
66
2 SIGNIFICANT ACCOUNTING POLICIES (continued)
2.4 Business Combination and Goodwill (continued)
After initial recognition, goodwill is measured at cost less any accumulated impairment losses. For the purpose of impairment testing, goodwill acquired in a business combination is, from the acquisition date, allocated to each of the Group’s cash-generating units that are expected to benefits from the synergies of the combination, irrespective of whether other assets or liabilities of the acquiree are assigned to those units.
Where goodwill forms part of a cash-generating unit (group of cash generating units) and part of the operations within that unit is disposed of, the goodwill associated with the operation disposed of is included in the carrying amount of the operation when determining the gain or loss on disposal of the operation. Goodwill disposed of in this circumstance is measured based on the relative values of the operation disposed of and the portion of the cash generation unit retained.
2.5 Cash and cash equivalents Cash and cash equivalents comprise of cash and balances with banks and financial institutions, balances with Central
Banks and placements with banks and other financial institutions maturing within seven days.
2.6 Placements with banks Placements with banks are stated at amortised cost using the effective interest method less any amounts written off
and provision for impairment.
2.7 Financial assets(i) Recognition Regular-way purchases and sales of financial assets are recognised on trade date, the date on which the Group
commits to purchase and sell the assets. Regular-way purchases or sales are purchases or sales of financial assets that require delivery of assets within the time frame generally established by regulation or convention in the market place.
Financial assets are recognised initially at fair value plus, in the case of financial assets other than fair value through statement of income, directly attributable transaction costs.
The Group’s financial assets include quoted and unquoted financial instruments, other assets and derivative financial instruments.
(ii) Classification and measurement The classification of financial assets is determined by the Group at initial recognition depending upon the purpose for
which the financial assets were acquired and their characteristics.
Financial assets at fair value through statement of income includes financial assets held for trading and financial assets designated upon initial recognition at fair value through statement of income.
Financial assets are classified as held for trading if they are acquired for the purpose of selling in the near term or principally held for the purpose of short-term profit taking. Derivatives are classified as held for trading unless they are designated as effective hedging instruments.
The Group designates an investment as at fair value through statement of income in the following cases:
• The designation eliminates or significantly reduces the inconsistent treatment that would otherwise arise from measuring the assets or liabilities or recognising gains or losses on them on a different basis.
• When the assets and liabilities are part of a group of financial assets which are managed and their performance is evaluated on a fair value basis, in accordance with a documented risk management or investment strategy.
Notes to the Consolidated Financial Statementsfor the year ended 31 December 2012
Consolidated Financial Statements
67
2 SIGNIFICANT ACCOUNTING POLICIES (continued)
2.7 Financial assets (continued)
(ii) Classification and measurement (continued)
After initial recognition financial assets at fair value through statement of income are remeasured at fair value with all changes in fair value recognised in the consolidated statement of income.
Financial assets held to maturity are financial assets with fixed or determinable payments and fixed maturity that the Group has the intention and ability to hold to maturity. Held to maturity investments are measured at amortised cost, less provision for impairment in value, if any. The losses arising from impairment of such investments are recognised in the consolidated statement of income.
Loans and receivables are non-derivative financial assets with fixed or determinable payments other than those financial assets acquired with the intention of short-term profit taking or financial assets quoted in an active market. Loans and receivables are stated at amortised cost using the effective interest method less any amounts written off and provision for impairment. The calculation takes into account any premium or discount on acquisition and includes transaction costs and fees that are an integral part of the effective interest rate.
Financial assets available for sale are those non-derivative financial assets that are designated as available-for-sale or
are not classified in any of the preceding categories. After initial measurement, financial assets available for sale are subsequently measured at fair value with gains or
losses being recognised in other comprehensive income in the investment revaluation reserve until the investment is derecognised or the investment is determined to be impaired, at which time the cumulative gain or loss is recognised in the consolidated statement of income. Investments whose fair value cannot be reliably measured are carried at cost less impairment losses, if any.
The Group evaluated whether its ability and intention to sell its financial assets available for sale in the near term
is still appropriate. When the Group is unable to trade these financial assets due to inactive markets and/or the management’s intent significantly changes to do so in the foreseeable future, the Group may elect to reclassify these financial assets in rare circumstances.
Derivatives include interest rate swaps, futures, cross currency swaps, forward exchange contracts and options on interest rates and foreign currencies. Derivatives are recorded at fair value and carried as assets when their fair value is positive and as liability when their fair value is negative. Changes in fair value of derivatives held for trading are recognised in the consolidated statement of income.
(iii) Impairment The Group assesses at each reporting date whether there is any objective evidence that a financial asset or a group
of financial assets is impaired. A financial asset or a group of financial assets is deemed to be impaired if, and only if, there is objective evidence of impairment as a result of one or more events that has occurred after the initial recognition of the asset (an incurred ‘loss event’) and that loss event has an impact on the estimated future cash flows of the financial asset or the group of financial assets that can be reliably estimated. Evidence of impairment may include indications that the debtors or a group of debtors is experiencing significant financial difficulty, default or delinquency in interest or principal payments; the probability that they will enter bankruptcy or other financial reorganisation; and where observable data indicate that there is a measurable decrease in the estimated future cash flows, such as changes in arrears or economic conditions that correlate with defaults.
Financial assets carried at amortised cost For financial assets carried at amortised cost, the Group first assesses individually whether objective evidence of
impairment exists individually for financial assets that are individually significant, or collectively for financial assets that are not individually significant. If the Group determines that no objective evidence of impairment exists for an individually assessed financial asset, whether significant or not, it includes the asset in a group of financial assets with similar credit risk characteristics and collectively assesses them for impairment. Assets that are individually assessed for impairment and for which an impairment loss is, or continues to be, recognised are not included in a collective assessment of impairment.
Notes to the Consolidated Financial Statementsfor the year ended 31 December 2012

Annual Report and Accounts 2012Gulf Investment Corporation G.S.C. and Subsidiaries
68
2 SIGNIFICANT ACCOUNTING POLICIES (continued)
2.7 Financial assets (continued)
(iii) Impairment (continued) If there is objective evidence that an impairment loss has incurred, the amount of the loss is measured as the
difference between the asset’s carrying amount and the present value of estimated future cash flows (excluding future expected credit losses that have not yet been incurred). The present value of the estimated future cash flows is discounted at the financial assets original effective interest rate. If a financial asset has a variable interest rate, the discount rate for measuring any impairment loss is the current effective interest rate.
The carrying amount of the asset is reduced through the use of an allowance account and the amount of the loss is recognised in the consolidated statement of income. If, in a subsequent year, the amount of the estimated impairment loss increases or decreases because of an event occurring after the impairment was recognised, the previously recognised impairment loss is increased or reduced by adjusting the allowance account.
Financial assets available for sale For financial assets available for sale, the Group assesses at each reporting date whether there is objective evidence
that an investment or a group of investments is impaired.
In the case of equity investments classified as available for sale, objective evidence would include a significant or prolonged decline in the fair value of the investment below its cost. ‘Significant’ is to be evaluated against the original cost of the investment and ‘prolonged’ against the period in which the fair value has been below its original cost. Where there is evidence of impairment, the cumulative loss (measured as the difference between the acquisition cost and the current fair value, less any impairment loss on that investment previously recognised in the consolidated statement of income) is removed from other comprehensive income and recognised in the statement of income. Impairment losses on equity investments are not reversed through the consolidated statement of income; increases in their fair value after impairment are recognised directly in other comprehensive income.
In the case of debt instruments classified as available for sale, impairment is assessed based on the same criteria as financial assets carried at amortised cost. Subsequent increase in fair value of a debt instrument which is objectively related to an event occurring after the impairment loss was recognised, is credited to the consolidated statement of income.
In addition, in accordance with Central Bank of Kuwait instructions, the Group makes a minimum general provision on all applicable credit facilities (net of certain categories of collateral) that are not subject to specific provision. No other general provisions are made.
(iv) Derecognition A financial asset (or, where applicable a part of a financial asset or part of a group of similar financial assets) is
derecognised when:
• The rights to receive cash flows from the asset have expired; or
• The Group has transferred its rights to receive cash flows from the asset or has assumed an obligation to pay the received cash flows in full without material delay to a third party under a ‘pass-through’ arrangement; and either (a) the Group has transferred substantially all the risks and rewards of the asset, or (b) the Group has neither transferred nor retained substantially all the risks and rewards of the asset, but has transferred control of the asset.
When the Group has transferred its rights to receive cash flows from an asset or has entered into a pass-through arrangement, and has neither transferred nor retained substantially all the risks and rewards of the asset nor transferred control of the asset, the asset is recognised to the extent of the Group’s continuing involvement in the asset.
In that case, the Group also recognises an associated liability. The transferred asset and the associated liability are measured on a basis that reflects the rights and obligations that the Group has retained.
Continuing involvement that takes the form of a guarantee over the transferred asset is measured at the lower of the original carrying amount of the asset and the maximum amount of consideration that the Group could be required to repay.
Notes to the Consolidated Financial Statementsfor the year ended 31 December 2012
Consolidated Financial Statements
69
2 SIGNIFICANT ACCOUNTING POLICIES (continued)
2.8 Financial liabilities(i) Recognition Financial liabilities are classified as financial liabilities at fair value through statement of income and loans and
borrowings, as appropriate. The Group determines the classification of its financial liabilities at initial recognition.
Financial liabilities are recognised initially at fair value and in the case of term finance, including directly attributable transaction costs.
The Group’s financial liabilities include short and long term borrowings and accounts payable and accruals.
(ii) Classification and measurement The measurement of financial liabilities depends on their classification as follows:
Loans and borrowings After initial measurement, all non-trading financial liabilities, debt issued and other borrowings are subsequently
measured at amortised cost using the effective interest rate method. Amortised cost is calculated by taking into account any discount or premium on the issue and fees that are an integral part of the effective interest rate.
Accounts payable and accruals Liabilities are recognised for amounts to be paid in the future for goods or services received, whether billed by the
supplier or not.
Depositsfrombanksandfinancialinstitutions Deposits from banks and financial institutions are stated at amortised cost using effective interest method.
Termfinance Term finance is initially recognised at fair value of consideration received less directly attributable transaction costs.
After initial recognition, interest bearing loans and borrowings are subsequently measured at amortised cost using effective interest method.
Financial guarantees The Group gives financial guarantees on behalf of its associates. These guarantees are initially recognised in the
consolidated financial statements at fair value on the date the guarantee is given, being the premium received. Subsequently, the Group recognises its liability under each guarantee at the higher of the amortised premium and the best estimate of expenditure required to settle any financial obligation arising as a result of the guarantee. Any increase in the liability is recognised in the consolidated statement of income. The Group recognises the premium received in the consolidated statement of income on a straight line basis over the life of the guarantee.
(iii) Derecognition A financial liability is derecognised when the obligation under the liability is discharged or cancelled or expires.
Where an existing financial liability is replaced by another from the same lender on substantially different terms, or the terms of an existing liability are substantially modified, such an exchange or modification is treated as a derecognition of the original liability and the recognition of a new liability, and the difference in the respective carrying amounts is recognised in the consolidated statement of income.
2.9 Offsetting Financial assets and liabilities are offset and the net amount is reported in the consolidated statement of financial
position if, and only if, there is a currently enforceable legal right to offset the recognised amounts and there is an intention to settle on a net basis, or to realise the assets and settle the liabilities simultaneously.
2.10 Fair value of financial instruments For investments and derivatives traded in organised financial markets, fair value is determined by reference to quoted
market bid prices at the close of business on the reporting date. The fair value of mutual fund investments, unit trusts, or similar investment vehicles is based on the last reported net asset values from the fund managers.
Notes to the Consolidated Financial Statementsfor the year ended 31 December 2012

Annual Report and Accounts 2012Gulf Investment Corporation G.S.C. and Subsidiaries
70
2 SIGNIFICANT ACCOUNTING POLICIES (continued)
2.10 Fair value of financial instruments (continued)
For investments where there is no quoted market price, a reasonable estimate of the fair value is determined by using valuation techniques such as recent arm’s length transactions, reference to the current fair value of another instrument that is substantially the same, an earnings multiple, or is based on the expected cash flows of the investment discounted at current rates applicable for items with similar terms and risk characteristics. Fair value estimates take into account liquidity constraints and assessment for any impairment.
Investments with no reliable measures of their fair values and for which no fair value information could be obtained are carried at their initial cost less impairment in value.
The fair value of interest bearing financial instruments is estimated based on discounted cash flows using interest rates for items with similar terms and risks characteristics.
An analysis of fair value of financial instruments and further details as to how they are measured are provided in Note 26.
2.11 Impairment of non-financial assets The Group assesses at each reporting date whether there is an indication that a non-financial asset may be impaired.
If any such indication exists, or when annual impairment testing for an asset is required, the Group estimates the asset’s recoverable amount. An asset’s recoverable amount is the higher of an asset’s or cash-generating unit’s (CGU) fair value less costs to sell and its value in use and is determined for an individual asset, unless the asset does not generate cash inflows that are largely independent of those from other assets or groups of assets. Where the carrying amount of an asset or CGU exceeds its recoverable amount, the asset is considered impaired and is written down to its recoverable amount. In assessing value in use, the estimated future cash flows are discounted to their present value using a pre-tax discount rate that reflects current market assessments of the time value of money and the risks specific to the asset. In determining fair value less costs to sell, an appropriate valuation model is used. These calculations are corroborated by valuation multiples, quoted share prices for publicly traded entities or other available fair value indicators.
Impairment losses of continuing operations are recognised in the consolidated statement of income in those expense categories consistent with the function of the impaired asset.
An assessment is made at each reporting date as to whether there is any indication that previously recognised impairment losses may no longer exist or may have decreased. If such indication exists, the Group estimates the assets or CGUs recoverable amount. A previously recognised impairment loss is reversed only if there has been a change in the assumptions used to determine the asset’s recoverable amount since the last impairment loss was recognised. The reversal is limited so that the carrying amount of the assets does not exceed its recoverable amount, nor exceed the carrying amount that would have been determined, net of depreciation, had no impairment loss been recognised for the asset in prior years. Such reversal is recognised in the consolidated statement of income.
2.12 Repurchase and resale arrangements The Group enters into purchases / sales of securities under agreements to resell / repurchase substantially identical
securities at a specified date in the future at a fixed price.
Investments sold under repurchase agreements continue to be recognised in the consolidated statement of financial position and are measured in accordance with the relevant accounting policy for that investment. The proceeds from the sale of the investments are reported as part of liabilities as securities sold under repurchase agreements. The difference between the sales price and repurchase price is treated as interest expense and is accrued over the life of the agreement using the effective interest method.
Notes to the Consolidated Financial Statementsfor the year ended 31 December 2012

Consolidated Financial Statements
71
2 SIGNIFICANT ACCOUNTING POLICIES (continued)
2.13 Investment in associates An associate is an entity over which the Group exerts significant influence usually evidenced by a holding of 20% to
50% of the voting power of the investee company. The Group’s investment in associates is accounted for using the equity method of accounting. Where an associate is acquired and held exclusively for resale, it is accounted for as a non-current asset held for sale under IFRS 5.
Under the equity method, investment in associate is initially recognised at cost and adjusted thereafter for the post-
acquisition change in the Group’s share of net assets of the investee. Goodwill relating to an associate is included in the carrying amount of the investment and is not amortised or separately tested for impairment. The Group recognises in the consolidated statement of income its share of the results of the associate from the date that influence or ownership effectively commenced until the date that it effectively ceases. Where there has been a change recognised directly in the equity of the associate, the Group recognises its share of any changes and discloses this, when applicable, in the consolidated statement of comprehensive income. Distributions received from an associate reduce the carrying amount of the investment.
Unrealised gains on transactions with an associate are eliminated to the extent of the Group’s share in the associate. Unrealised losses are also eliminated unless the transaction provides evidence of impairment in the asset transferred.
The reporting dates of the associates and the Group are identical and in case of different reporting date of an associate, which are not more than three months, from that of the Group, adjustments are made for the effects of significant transactions or events that occur between that date and the date of the Group’s consolidated financial statements. The associate’s accounting policies conform to those used by the Group for like transactions and events in similar circumstances.
After application of the equity method, the Group determines whether it is necessary to recognise an additional impairment loss on the Group’s investment in its associates. The Group determines at each reporting date whether there is any objective evidence that the investment in the associate is impaired. If this is the case the Group calculates the amount of impairment as the difference between the recoverable amount of the associate and its carrying value and recognises the amount in the consolidated statement of income.
The associates are listed in Note 30.
2.14 Other provisions Other provisions are recognised in the consolidated statement of financial position when the Group has a present
obligation (legal or constructive) as a result of a past event, from which it is both probable and measurable that an outflow of economic benefits will be required to settle the obligation.
2.15 Property, plant and equipment Property, plant and equipment are carried at historical cost less accumulated depreciation and impairment losses.
An impairment loss is recognised in the consolidated statement of income whenever the carrying amount of an asset exceeds its recoverable amount. The recoverable amount of assets is the greater of their fair value less estimated cost to sell and value in use. Depreciation is computed on a straight-line basis over the estimated useful life of each asset category.
2.16 Fiduciary activities Assets managed for third parties or held in trust or in a fiduciary capacity are not treated as assets of the Group and
accordingly are not included in the consolidated statement of financial position.
Notes to the Consolidated Financial Statementsfor the year ended 31 December 2012
Annual Report and Accounts 2012Gulf Investment Corporation G.S.C. and Subsidiaries
72
2 SIGNIFICANT ACCOUNTING POLICIES (continued)
2.17 Hedge accounting The Group enters into derivative instrument transactions to manage exposure to interest rate and foreign currency.
All derivative financial instruments of the Group are recorded in the consolidated statement of financial position at fair value. The fair value of a derivative is the equivalent of the unrealised gain or loss from marking to market the derivative using prevailing market rates or internal pricing models. Positive and negative fair values are reported as assets and liabilities respectively and are offset when there is both an intention to settle net and a legal right to offset exists.
For the purposes of hedge accounting, hedges are classified into two categories: (a) fair value hedges which hedge the exposure to changes in the fair value of a recognised asset or liability; and (b) cash flow hedges which hedge exposure to variability in cash flows that is either attributable to a particular risk associated with a recognised asset or liability or a forecasted transaction.
A hedging relationship exists where:
• at the inception of the hedge there is formal documentation of the hedge;
• the hedge is expected to be highly effective;
• the effectiveness of the hedge can be reliably measured;
• the hedge is highly effective throughout the reporting period; and
• for hedges of a forecasted transaction, the transaction is highly probable and presents an exposure to variations in cash flows that could ultimately affect net profit or loss.
In relation to fair value hedges which meet the conditions for hedge accounting, any gain or loss from remeasuring the hedging instrument is recognised immediately in the consolidated statement of income. The hedged items are also adjusted for fair value changes relating to the risk being hedged and the difference is recognised in the consolidated statement of income.
In relation to cash flow hedges which meet the conditions for hedge accounting, the portion of the gain or loss on the
hedging instrument that is determined to be an effective hedge is recognised initially in equity and any ineffective portion is recognised in the consolidated statement of income. The gains or losses on cash flow hedges recognised initially in equity are transferred to the consolidated statement of income in the period in which the hedged transaction impacts the consolidated statement of income. Where the hedged transaction results in the recognition of an asset or liability, the associated gains or losses that had initially been recognised in equity are included in the initial measurement of the cost of the related asset or liability.
For hedges that do not qualify for hedge accounting, any gains or losses arising from changes in fair value of the hedging instrument are taken directly to the consolidated statement of income.
Hedge accounting is discontinued when the hedging instrument expires or is sold, terminated or exercised, no longer qualifies for hedge accounting or is revoked by the Group. For cash flow hedges, any cumulative gain or loss on the hedging instrument recognised in equity remains in equity until the forecasted transaction occurs. In the case of fair value hedges of interest bearing financial instruments, any adjustment relating to the hedge is amortised over the remaining term to maturity. Where the hedged transaction is no longer expected to occur, the net cumulative gain or loss recognised in equity is transferred to the consolidated statement of income.
2.18 Recognition of income and expenses Revenue is recognised to the extent that it is probable that the economic benefits will flow to the Group and the
revenue can be reliably measured. Revenue is measured at the fair value of the consideration received. The following specific recognition criteria must also be met before revenue is recognised:
Interest income and expense Interest income and expense are recognised in the consolidated statement of income for all interest bearing financial
assets and liabilities using the effective interest method. The effective interest rate is the rate that exactly discounts estimated future cash payments or receipts through the expected life of the financial asset or liability or a shorter period, where appropriate to the net carrying amount of the financial asset or liability. Fees which are considered an integral part of the effective yield of a financial asset are recognised using the effective yield method.
Notes to the Consolidated Financial Statementsfor the year ended 31 December 2012
Consolidated Financial Statements
73
2 SIGNIFICANT ACCOUNTING POLICIES (continued)
2.18 Recognition of income and expenses (continued)
Fees and commission income Fees earned for providing of services over a period of time are accrued over that period. Fee income for providing
transaction services are recognised on completion of the underlying transaction. Performance fees are recognised when earned, being the time the risk of realisation of such fees no longer exists.
Investment income Investment income represents results arising from investment trading activities, including all gains and losses from
changes in fair value and related interest income or expense and dividends for financial assets and financial liabilities held for trading.
Dividend income Dividend income is recognised when the right to receive payment is established.
Sale of goods Revenue from sale of goods is recognised when the significant risks and rewards of ownership have been transferred
to the customer.
2.19 End of service benefits Provision is made for amounts payable to employees under the Kuwaiti Labour Law, employee contracts and
applicable labour laws in the countries where the subsidiaries operate. This liability, represents the amount payable to each employee as a result of involuntary termination on the statement of financial position date. The obligations are paid into a plan which is administrated by an independent trustee.
2.20 Foreign currency The consolidated financial statements are presented in US Dollars which is also the Corporation’s functional and
presentation currency. Each entity in the Group determines its own functional currency and items included in the financial statements of each entity are measured using that functional currency.
Transactions in foreign currencies are translated to US Dollars at the rate of exchange prevailing at the date of the transaction. Monetary assets and liabilities denominated in foreign currencies are translated into US Dollars at market rates of exchange prevailing on the reporting date. Realised and unrealised foreign exchange gains and losses are included in the consolidated statement of income.
Non-monetary items that are measured in terms of historical costs in a foreign currency are translated using the exchange rates as at the dates of the initial transactions. Translation gains or losses on non monetary items are included in equity as part of the fair value adjustment on financial assets available for sale, unless they form part of an effective hedging strategy.
Non-monetary items measured at fair value in a foreign currency are translated using the exchange rates at the date when the fair value was determined. Translation differences on non-monetary items at fair value through statement of income are recognised in the consolidated statement of income within the fair value net gain or loss. Any goodwill arising on the acquisition of a foreign operation and any fair value adjustments to the carrying amounts of assets and liabilities arising on the acquisition are treated as assets and liabilities of the foreign operations and translated at closing rate of exchange at the reporting date.
As at the reporting date, the assets and liabilities of foreign subsidiaries, and the carrying amount of foreign associates, are translated into the Corporation’s presentation currency at the rate of exchange ruling at the reporting date, and their statements of income are translated at the weighted average exchange rates for the year. Exchange differences arising on translation are taken directly to foreign exchange translation adjustments within equity. On disposal of a foreign entity, the cumulative amount recognised in equity relating to the particular foreign operation is recognised in the consolidated statement of income.
Notes to the Consolidated Financial Statementsfor the year ended 31 December 2012
Annual Report and Accounts 2012Gulf Investment Corporation G.S.C. and Subsidiaries
74
2 SIGNIFICANT ACCOUNTING POLICIES (continued)
2.21 Segment reporting A segment is a distinguishable component of the Group that is engaged either in providing products or services
(business segment), or in providing products or services within a particular economic environment (geographical segment), which is subject to risks and rewards that are different from those of other segments.
2.22 Significant accounting judgements and estimates The preparation of the Group’s consolidated financial statements require management to make judgements, estimates
and assumptions that affect the reported amounts of revenues, expenses, assets and liabilities and the disclosure of contingent liabilities, at the reporting date. However, uncertainty about the assumptions and estimates could result in outcomes that require a material adjustment to the amount of the asset or liability affected in future periods.
Judgements In the process of applying the Group’s accounting policies, management has made the following judgements, which
have the most significant effect in the amounts recognised in the consolidated financial statements:
Classificationofinvestments Management decides on acquisition of a security whether it should be classified as held to maturity, held for trading,
designated at fair value through statement of income, or available for sale.
For those deemed to be held to maturity, management ensures that the requirements of IAS 39 are met and in particular, the Group’s intention and ability to hold these to maturity.
The Group classifies securities as trading if they are acquired primarily for the purpose of making a short term profit by
the dealers.
Classification of investments designated at fair value through statement of income depends on how management monitors the performance of these investments. When they are not classified as held for trading but have readily available reliable fair values and the changes in fair values are reported as part of profit or loss in the management accounts, they are classified as fair value through statement of income.
All other investments are classified as available for sale.
Impairment of equity investments The Group treats investments as impaired when there has been a significant or prolonged decline in the fair value
below its cost or where other objective evidence of impairment exists. The determination of what is “significant” or “prolonged” requires considerable judgement. In addition, the Group evaluates other factors, including normal volatility in share price for quoted equities and the future cash flows and the discount factors for projects and unquoted equities.
Estimation uncertainty The key assumptions concerning the future and other key sources of estimation uncertainty at the reporting date, that
have a significant risk of causing a material adjustment to the carrying amounts of assets and liabilities within the next financial year are discussed below:
Impairment losses on investment in debt instruments The Group reviews its investment in debt instruments at each reporting date to assess whether a provision for
impairment should be recorded in the consolidated statement of income. In particular, considerable judgment by management is required in the estimation of the amount and timing of future cash flows when determining the level of provisions required. Such estimates are necessarily based on assumptions about several factors involving varying degrees of judgment and uncertainty, and actual results may differ resulting in future changes to such provisions.
Notes to the Consolidated Financial Statementsfor the year ended 31 December 2012
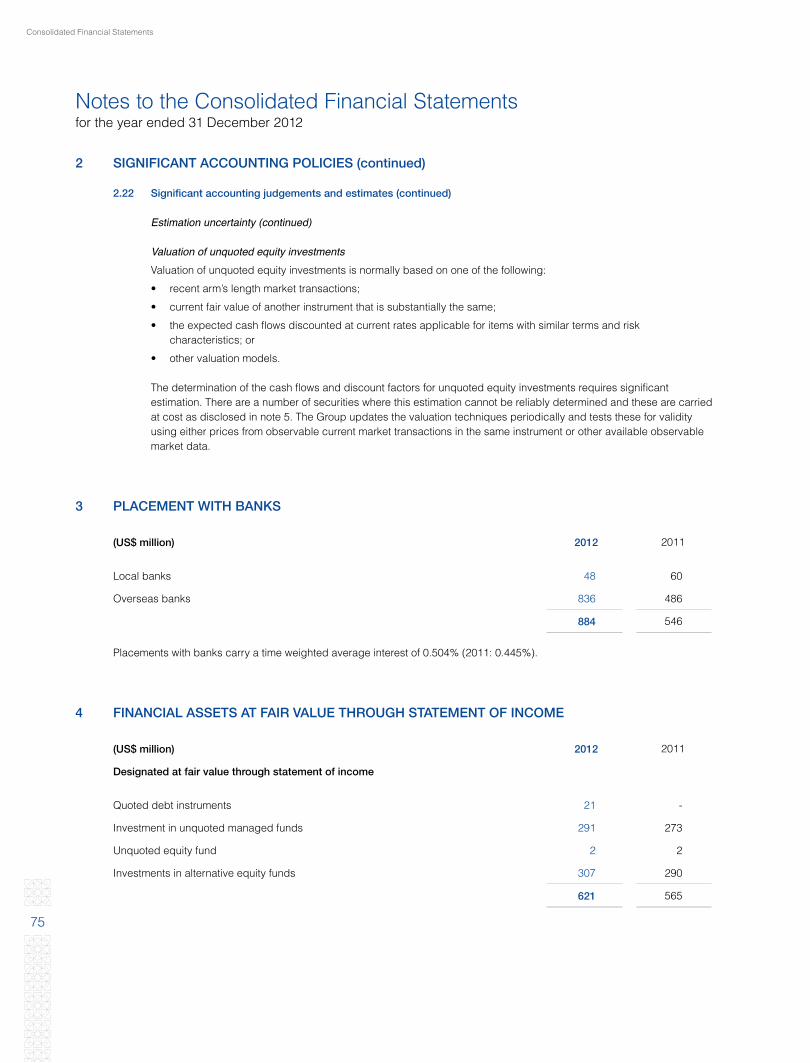
Consolidated Financial Statements
75
2 SIGNIFICANT ACCOUNTING POLICIES (continued)
2.22 Significant accounting judgements and estimates (continued)
Estimation uncertainty (continued)
Valuation of unquoted equity investments Valuation of unquoted equity investments is normally based on one of the following:
• recent arm’s length market transactions;
• current fair value of another instrument that is substantially the same;
• the expected cash flows discounted at current rates applicable for items with similar terms and risk characteristics; or
• other valuation models.
The determination of the cash flows and discount factors for unquoted equity investments requires significant estimation. There are a number of securities where this estimation cannot be reliably determined and these are carried at cost as disclosed in note 5. The Group updates the valuation techniques periodically and tests these for validity using either prices from observable current market transactions in the same instrument or other available observable market data.
3 PLACEMENT WITH BANKS
(US$ million) 2012 2011
Local banks 48 60
Overseas banks 836 486
884 546
Placements with banks carry a time weighted average interest of 0.504% (2011: 0.445%).
4 FINANCIAL ASSETS AT FAIR VALUE THROUGH STATEMENT OF INCOME
(US$ million) 2012 2011
Designated at fair value through statement of income
Quoted debt instruments 21 -
Investment in unquoted managed funds 291 273
Unquoted equity fund 2 2
Investments in alternative equity funds 307 290
621 565
Notes to the Consolidated Financial Statementsfor the year ended 31 December 2012
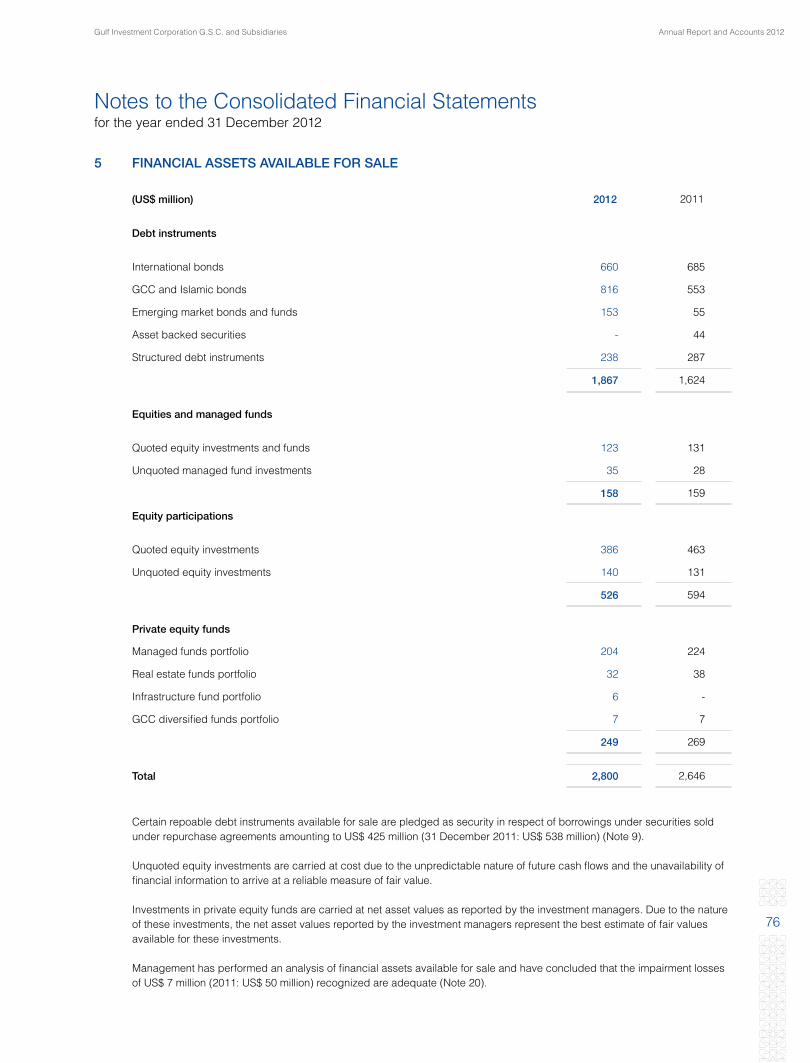
Annual Report and Accounts 2012Gulf Investment Corporation G.S.C. and Subsidiaries
76
5 FINANCIAL ASSETS AVAILABLE FOR SALE
(US$ million) 2012 2011
Debt instruments
International bonds 660 685
GCC and Islamic bonds 816 553
Emerging market bonds and funds 153 55
Asset backed securities - 44
Structured debt instruments 238 287
1,867 1,624
Equities and managed funds
Quoted equity investments and funds 123 131
Unquoted managed fund investments 35 28
158 159
Equity participations
Quoted equity investments 386 463
Unquoted equity investments 140 131
526 594
Private equity funds
Managed funds portfolio 204 224
Real estate funds portfolio 32 38
Infrastructure fund portfolio 6 -
GCC diversified funds portfolio 7 7
249 269
Total 2,800 2,646
Certain repoable debt instruments available for sale are pledged as security in respect of borrowings under securities sold under repurchase agreements amounting to US$ 425 million (31 December 2011: US$ 538 million) (Note 9).
Unquoted equity investments are carried at cost due to the unpredictable nature of future cash flows and the unavailability of financial information to arrive at a reliable measure of fair value.
Investments in private equity funds are carried at net asset values as reported by the investment managers. Due to the nature of these investments, the net asset values reported by the investment managers represent the best estimate of fair values available for these investments.
Management has performed an analysis of financial assets available for sale and have concluded that the impairment losses of US$ 7 million (2011: US$ 50 million) recognized are adequate (Note 20).
Notes to the Consolidated Financial Statementsfor the year ended 31 December 2012
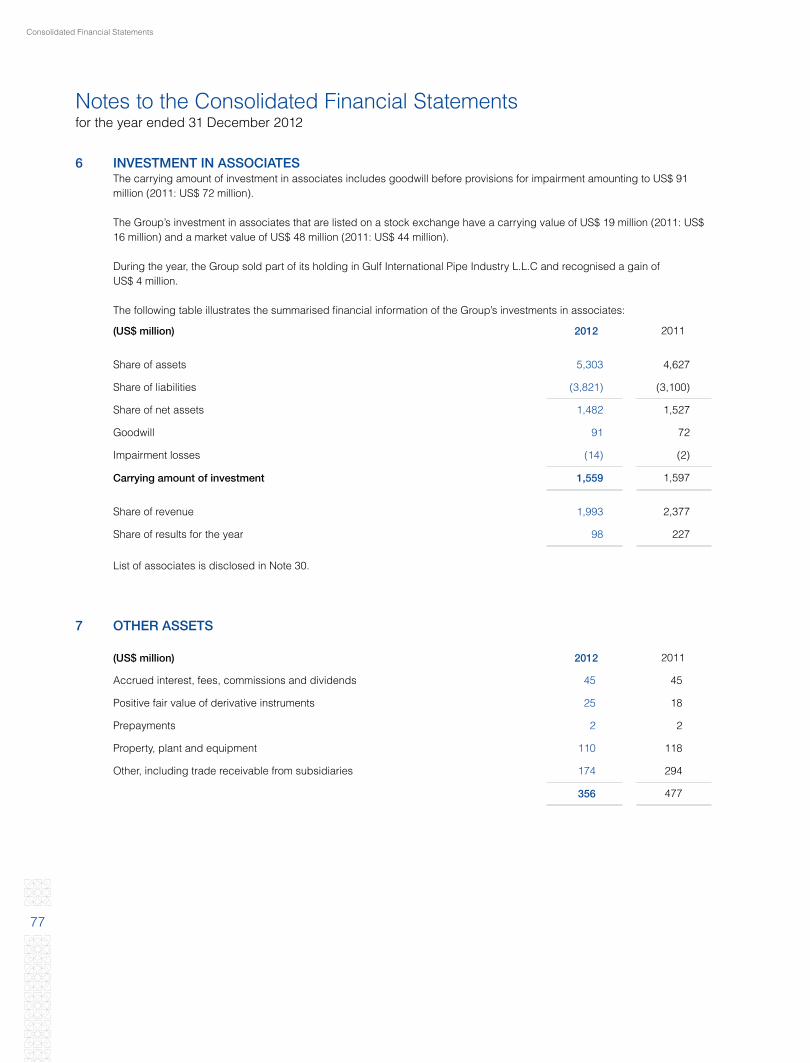
Consolidated Financial Statements
77
6 INVESTMENT IN ASSOCIATES The carrying amount of investment in associates includes goodwill before provisions for impairment amounting to US$ 91
million (2011: US$ 72 million).
The Group’s investment in associates that are listed on a stock exchange have a carrying value of US$ 19 million (2011: US$ 16 million) and a market value of US$ 48 million (2011: US$ 44 million).
During the year, the Group sold part of its holding in Gulf International Pipe Industry L.L.C and recognised a gain of US$ 4 million.
The following table illustrates the summarised financial information of the Group’s investments in associates:
(US$ million) 2012 2011
Share of assets 5,303 4,627
Share of liabilities (3,821) (3,100)
Share of net assets 1,482 1,527
Goodwill 91 72
Impairment losses (14) (2)
Carrying amount of investment 1,559 1,597
Share of revenue 1,993 2,377
Share of results for the year 98 227
List of associates is disclosed in Note 30.
7 OTHER ASSETS
(US$ million) 2012 2011
Accrued interest, fees, commissions and dividends 45 45
Positive fair value of derivative instruments 25 18
Prepayments 2 2
Property, plant and equipment 110 118
Other, including trade receivable from subsidiaries 174 294
356 477
Notes to the Consolidated Financial Statementsfor the year ended 31 December 2012
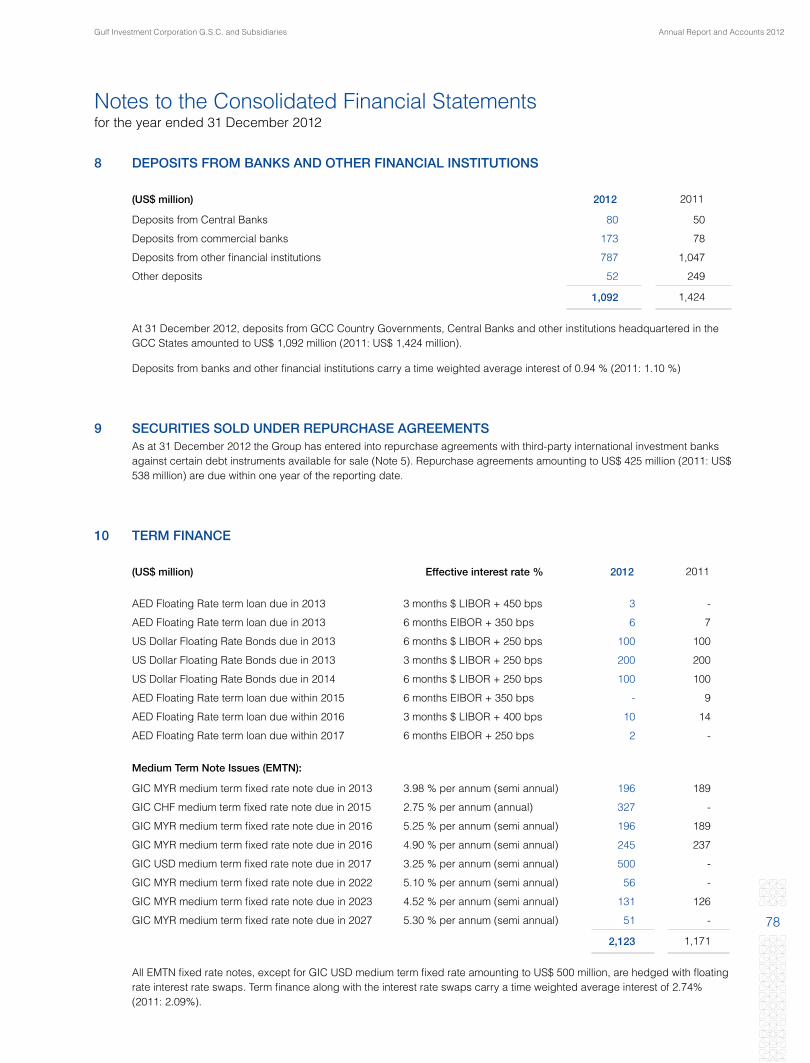
Annual Report and Accounts 2012Gulf Investment Corporation G.S.C. and Subsidiaries
78
8 DEPOSITS FROM BANKS AND OTHER FINANCIAL INSTITUTIONS
(US$ million) 2012 2011
Deposits from Central Banks 80 50
Deposits from commercial banks 173 78
Deposits from other financial institutions 787 1,047
Other deposits 52 249
1,092 1,424
At 31 December 2012, deposits from GCC Country Governments, Central Banks and other institutions headquartered in the
GCC States amounted to US$ 1,092 million (2011: US$ 1,424 million).
Deposits from banks and other financial institutions carry a time weighted average interest of 0.94 % (2011: 1.10 %)
9 SECURITIES SOLD UNDER REPURCHASE AGREEMENTS As at 31 December 2012 the Group has entered into repurchase agreements with third-party international investment banks
against certain debt instruments available for sale (Note 5). Repurchase agreements amounting to US$ 425 million (2011: US$ 538 million) are due within one year of the reporting date.
10 TERM FINANCE
(US$ million) Effective interest rate % 2012 2011
AED Floating Rate term loan due in 2013 3 months $ LIBOR + 450 bps 3 -
AED Floating Rate term loan due in 2013 6 months EIBOR + 350 bps 6 7
US Dollar Floating Rate Bonds due in 2013 6 months $ LIBOR + 250 bps 100 100
US Dollar Floating Rate Bonds due in 2013 3 months $ LIBOR + 250 bps 200 200
US Dollar Floating Rate Bonds due in 2014 6 months $ LIBOR + 250 bps 100 100
AED Floating Rate term loan due within 2015 6 months EIBOR + 350 bps - 9
AED Floating Rate term loan due within 2016 3 months $ LIBOR + 400 bps 10 14
AED Floating Rate term loan due within 2017 6 months EIBOR + 250 bps 2 -
Medium Term Note Issues (EMTN):
GIC MYR medium term fixed rate note due in 2013 3.98 % per annum (semi annual) 196 189
GIC CHF medium term fixed rate note due in 2015 2.75 % per annum (annual) 327 -
GIC MYR medium term fixed rate note due in 2016 5.25 % per annum (semi annual) 196 189
GIC MYR medium term fixed rate note due in 2016 4.90 % per annum (semi annual) 245 237
GIC USD medium term fixed rate note due in 2017 3.25 % per annum (semi annual) 500 -
GIC MYR medium term fixed rate note due in 2022 5.10 % per annum (semi annual) 56 -
GIC MYR medium term fixed rate note due in 2023 4.52 % per annum (semi annual) 131 126
GIC MYR medium term fixed rate note due in 2027 5.30 % per annum (semi annual) 51 -
2,123 1,171
All EMTN fixed rate notes, except for GIC USD medium term fixed rate amounting to US$ 500 million, are hedged with floating rate interest rate swaps. Term finance along with the interest rate swaps carry a time weighted average interest of 2.74% (2011: 2.09%).
Notes to the Consolidated Financial Statementsfor the year ended 31 December 2012
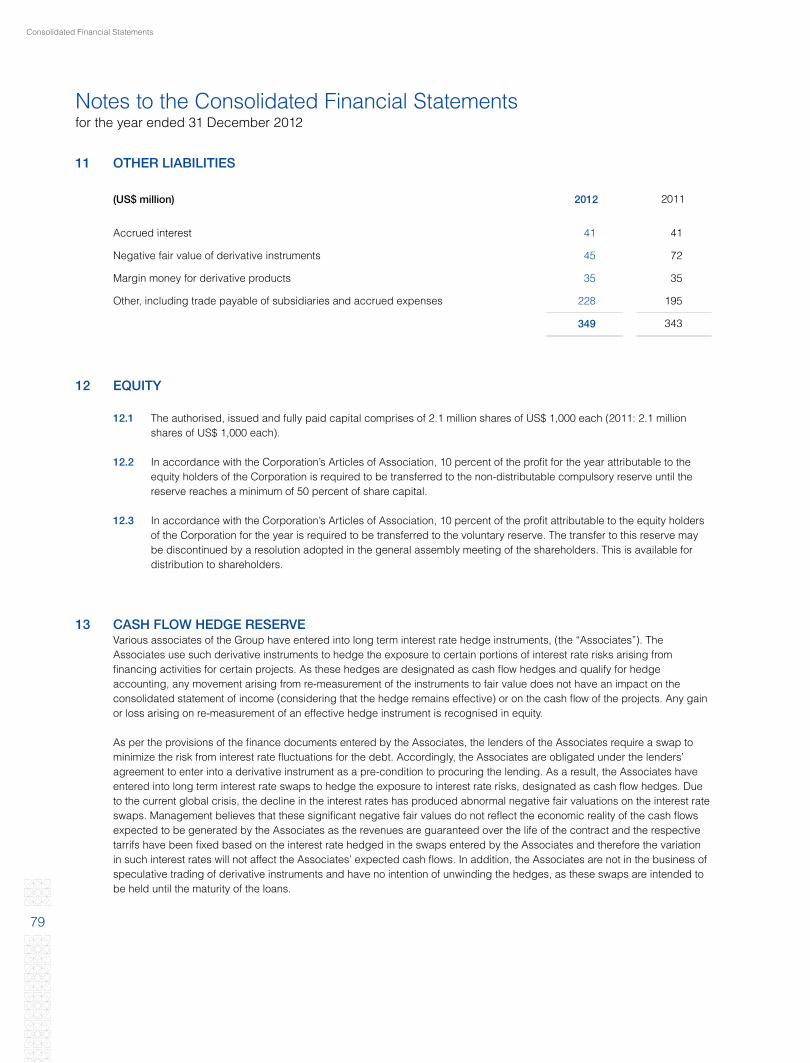
Consolidated Financial Statements
79
11 OTHER LIABILITIES
(US$ million) 2012 2011
Accrued interest 41 41
Negative fair value of derivative instruments 45 72
Margin money for derivative products 35 35
Other, including trade payable of subsidiaries and accrued expenses 228 195
349 343
12 EQUITY
12.1 The authorised, issued and fully paid capital comprises of 2.1 million shares of US$ 1,000 each (2011: 2.1 million shares of US$ 1,000 each).
12.2 In accordance with the Corporation’s Articles of Association, 10 percent of the profit for the year attributable to the equity holders of the Corporation is required to be transferred to the non-distributable compulsory reserve until the reserve reaches a minimum of 50 percent of share capital.
12.3 In accordance with the Corporation’s Articles of Association, 10 percent of the profit attributable to the equity holders of the Corporation for the year is required to be transferred to the voluntary reserve. The transfer to this reserve may be discontinued by a resolution adopted in the general assembly meeting of the shareholders. This is available for distribution to shareholders.
13 CASH FLOW HEDGE RESERVE Various associates of the Group have entered into long term interest rate hedge instruments, (the “Associates”). The
Associates use such derivative instruments to hedge the exposure to certain portions of interest rate risks arising from financing activities for certain projects. As these hedges are designated as cash flow hedges and qualify for hedge accounting, any movement arising from re-measurement of the instruments to fair value does not have an impact on the consolidated statement of income (considering that the hedge remains effective) or on the cash flow of the projects. Any gain or loss arising on re-measurement of an effective hedge instrument is recognised in equity.
As per the provisions of the finance documents entered by the Associates, the lenders of the Associates require a swap to
minimize the risk from interest rate fluctuations for the debt. Accordingly, the Associates are obligated under the lenders’ agreement to enter into a derivative instrument as a pre-condition to procuring the lending. As a result, the Associates have entered into long term interest rate swaps to hedge the exposure to interest rate risks, designated as cash flow hedges. Due to the current global crisis, the decline in the interest rates has produced abnormal negative fair valuations on the interest rate swaps. Management believes that these significant negative fair values do not reflect the economic reality of the cash flows expected to be generated by the Associates as the revenues are guaranteed over the life of the contract and the respective tarrifs have been fixed based on the interest rate hedged in the swaps entered by the Associates and therefore the variation in such interest rates will not affect the Associates’ expected cash flows. In addition, the Associates are not in the business of speculative trading of derivative instruments and have no intention of unwinding the hedges, as these swaps are intended to be held until the maturity of the loans.
Notes to the Consolidated Financial Statementsfor the year ended 31 December 2012
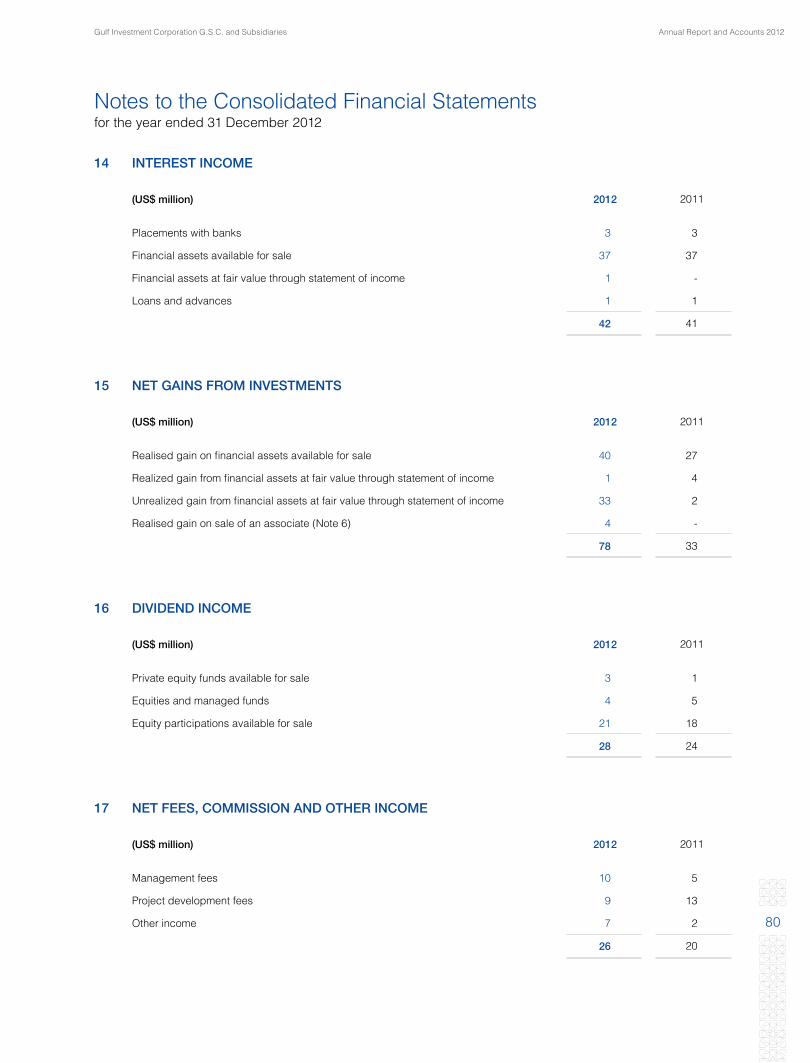
Annual Report and Accounts 2012Gulf Investment Corporation G.S.C. and Subsidiaries
80
14 INTEREST INCOME
(US$ million) 2012 2011
Placements with banks 3 3
Financial assets available for sale 37 37
Financial assets at fair value through statement of income 1 -
Loans and advances 1 1
42 41
15 NET GAINS FROM INVESTMENTS
(US$ million) 2012 2011
Realised gain on financial assets available for sale 40 27
Realized gain from financial assets at fair value through statement of income 1 4
Unrealized gain from financial assets at fair value through statement of income 33 2
Realised gain on sale of an associate (Note 6) 4 -
78 33
16 DIVIDEND INCOME
(US$ million) 2012 2011
Private equity funds available for sale 3 1
Equities and managed funds 4 5
Equity participations available for sale 21 18
28 24
17 NET FEES, COMMISSION AND OTHER INCOME
(US$ million) 2012 2011
Management fees 10 5
Project development fees 9 13
Other income 7 2
26 20
Notes to the Consolidated Financial Statementsfor the year ended 31 December 2012
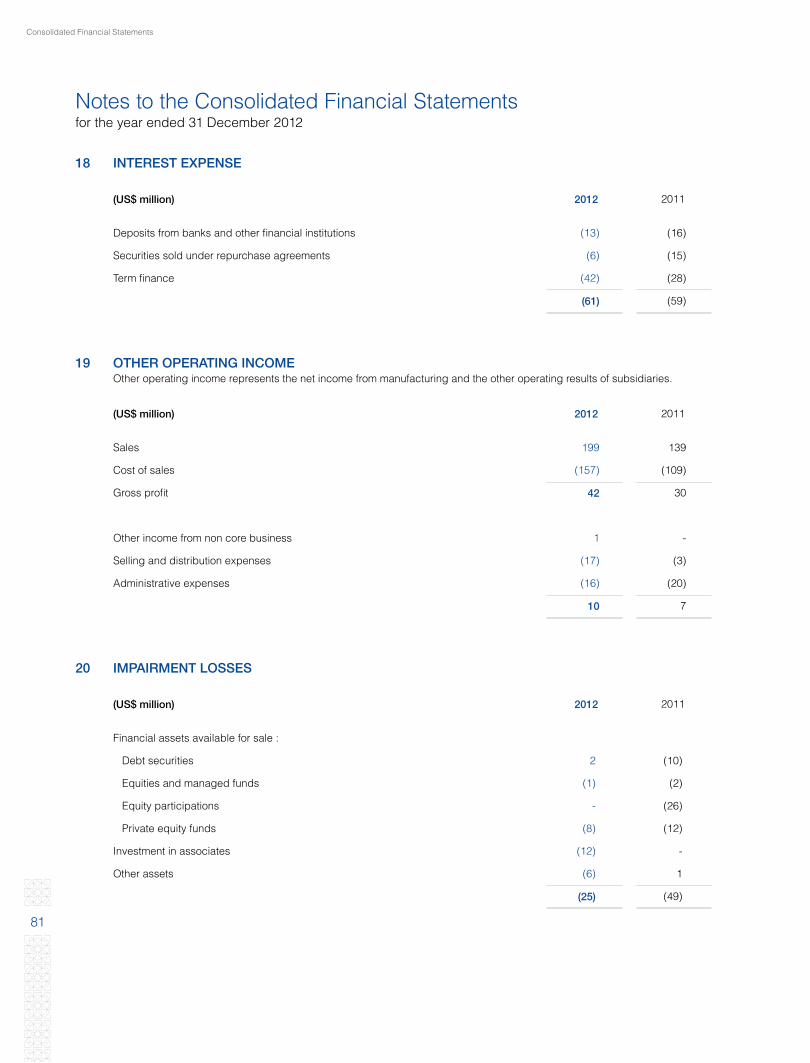
Consolidated Financial Statements
81
18 INTEREST EXPENSE
(US$ million) 2012 2011
Deposits from banks and other financial institutions (13) (16)
Securities sold under repurchase agreements (6) (15)
Term finance (42) (28)
(61) (59)
19 OTHER OPERATING INCOME Other operating income represents the net income from manufacturing and the other operating results of subsidiaries.
(US$ million) 2012 2011
Sales 199 139
Cost of sales (157) (109)
Gross profit 42 30
Other income from non core business 1 -
Selling and distribution expenses (17) (3)
Administrative expenses (16) (20)
10 7
20 IMPAIRMENT LOSSES
(US$ million) 2012 2011
Financial assets available for sale :
Debt securities 2 (10)
Equities and managed funds (1) (2)
Equity participations - (26)
Private equity funds (8) (12)
Investment in associates (12) -
Other assets (6) 1
(25) (49)
Notes to the Consolidated Financial Statementsfor the year ended 31 December 2012
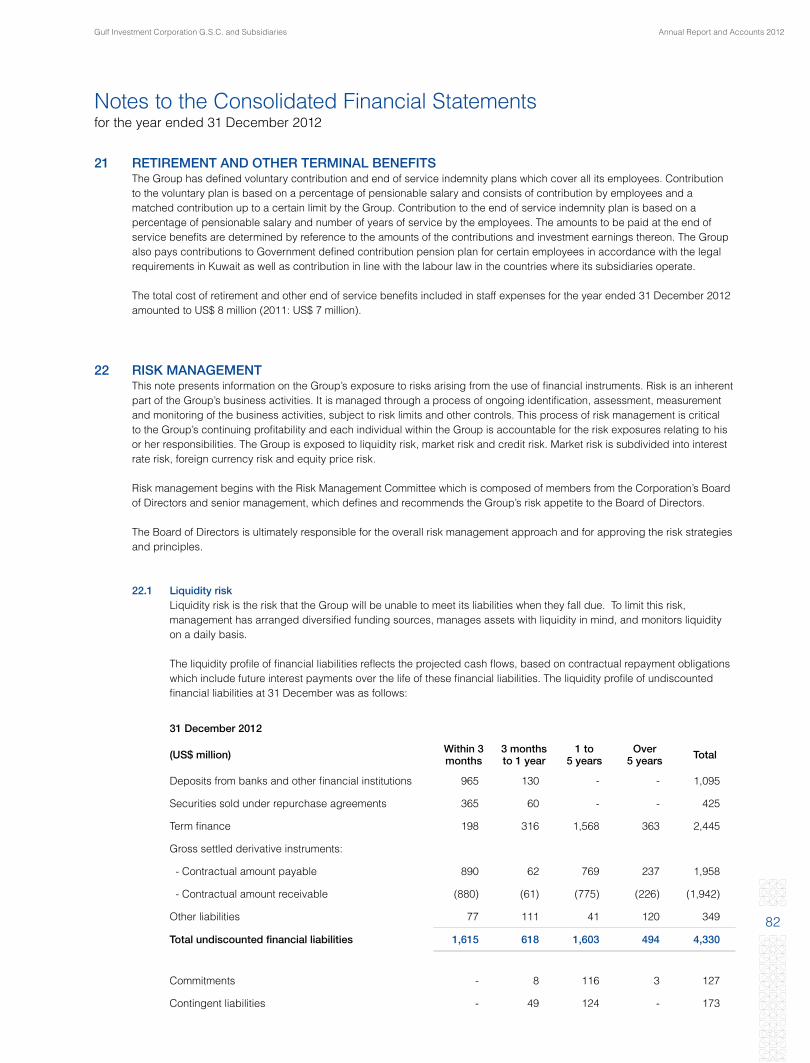
Annual Report and Accounts 2012Gulf Investment Corporation G.S.C. and Subsidiaries
82
21 RETIREMENT AND OTHER TERMINAL BENEFITS The Group has defined voluntary contribution and end of service indemnity plans which cover all its employees. Contribution
to the voluntary plan is based on a percentage of pensionable salary and consists of contribution by employees and a matched contribution up to a certain limit by the Group. Contribution to the end of service indemnity plan is based on a percentage of pensionable salary and number of years of service by the employees. The amounts to be paid at the end of service benefits are determined by reference to the amounts of the contributions and investment earnings thereon. The Group also pays contributions to Government defined contribution pension plan for certain employees in accordance with the legal requirements in Kuwait as well as contribution in line with the labour law in the countries where its subsidiaries operate.
The total cost of retirement and other end of service benefits included in staff expenses for the year ended 31 December 2012 amounted to US$ 8 million (2011: US$ 7 million).
22 RISK MANAGEMENT This note presents information on the Group’s exposure to risks arising from the use of financial instruments. Risk is an inherent
part of the Group’s business activities. It is managed through a process of ongoing identification, assessment, measurement and monitoring of the business activities, subject to risk limits and other controls. This process of risk management is critical to the Group’s continuing profitability and each individual within the Group is accountable for the risk exposures relating to his or her responsibilities. The Group is exposed to liquidity risk, market risk and credit risk. Market risk is subdivided into interest rate risk, foreign currency risk and equity price risk.
Risk management begins with the Risk Management Committee which is composed of members from the Corporation’s Board of Directors and senior management, which defines and recommends the Group’s risk appetite to the Board of Directors.
The Board of Directors is ultimately responsible for the overall risk management approach and for approving the risk strategies and principles.
22.1 Liquidity risk Liquidity risk is the risk that the Group will be unable to meet its liabilities when they fall due. To limit this risk,
management has arranged diversified funding sources, manages assets with liquidity in mind, and monitors liquidity on a daily basis.
The liquidity profile of financial liabilities reflects the projected cash flows, based on contractual repayment obligations which include future interest payments over the life of these financial liabilities. The liquidity profile of undiscounted financial liabilities at 31 December was as follows:
31 December 2012
(US$ million) Within 3 months
3 months to 1 year
1 to 5 years
Over 5 years Total
Deposits from banks and other financial institutions 965 130 - - 1,095
Securities sold under repurchase agreements 365 60 - - 425
Term finance 198 316 1,568 363 2,445
Gross settled derivative instruments:
- Contractual amount payable 890 62 769 237 1,958
- Contractual amount receivable (880) (61) (775) (226) (1,942)
Other liabilities 77 111 41 120 349
Total undiscounted financial liabilities 1,615 618 1,603 494 4,330
Commitments - 8 116 3 127
Contingent liabilities - 49 124 - 173
Notes to the Consolidated Financial Statementsfor the year ended 31 December 2012

Consolidated Financial Statements
83
22 RISK MANAGEMENT (continued) 22.1 Liquidity risk (continued)
31 December 2011
(US$ million) Within 3 months
3 months to 1 year
1 to 5 years
Over 5 years Total
Deposits from banks and other financial institutions 993 436 - - 1,429
Securities sold under repurchase agreements 279 263 - - 542
Term finance 8 6 1,160 190 1,364
Gross settled derivative instruments:
- Contractual amount payable 936 31 635 126 1,728
- Contractual amount receivable (931) (30) (651) (123) (1,735)
Other liabilities 87 87 74 95 343
Total undiscounted financial liabilities 1,372 793 1,218 288 3,671
Commitments - - 113 - 113
Contingent liabilities 20 27 133 72 252
The asset and liability maturity profile shown in the table below is based on management’s assessment of the Group’s right and ability (and not necessarily the intent) to liquidate these instruments based on their underlying liquidity characteristics.
(US$ million) Within 3 months
3 months to 1 year
1 to 5 years
Over 5 years Total
At 31 December 2012
Assets
Cash and cash equivalents 72 - - - 72
Placements with banks 884 - - - 884
Financial assets at fair value through statement of income 619 2 - - 621
Financial assets available for sale 2,174 246 63 317 2,800
Investment in associates - - - 1,559 1,559
Other assets 80 78 34 164 356
Total assets 3,829 326 97 2,040 6,292
Liabilities
Deposits from banks and other financial institutions 964 128 - - 1,092
Securities sold under repurchase agreements 365 60 - - 425
Term finance 196 310 1,380 237 2,123
Other liabilities 77 111 41 120 349
Total liabilities 1,602 609 1,421 357 3,989
Net gap 2,227 (283) (1,324) 1,683
Notes to the Consolidated Financial Statementsfor the year ended 31 December 2012
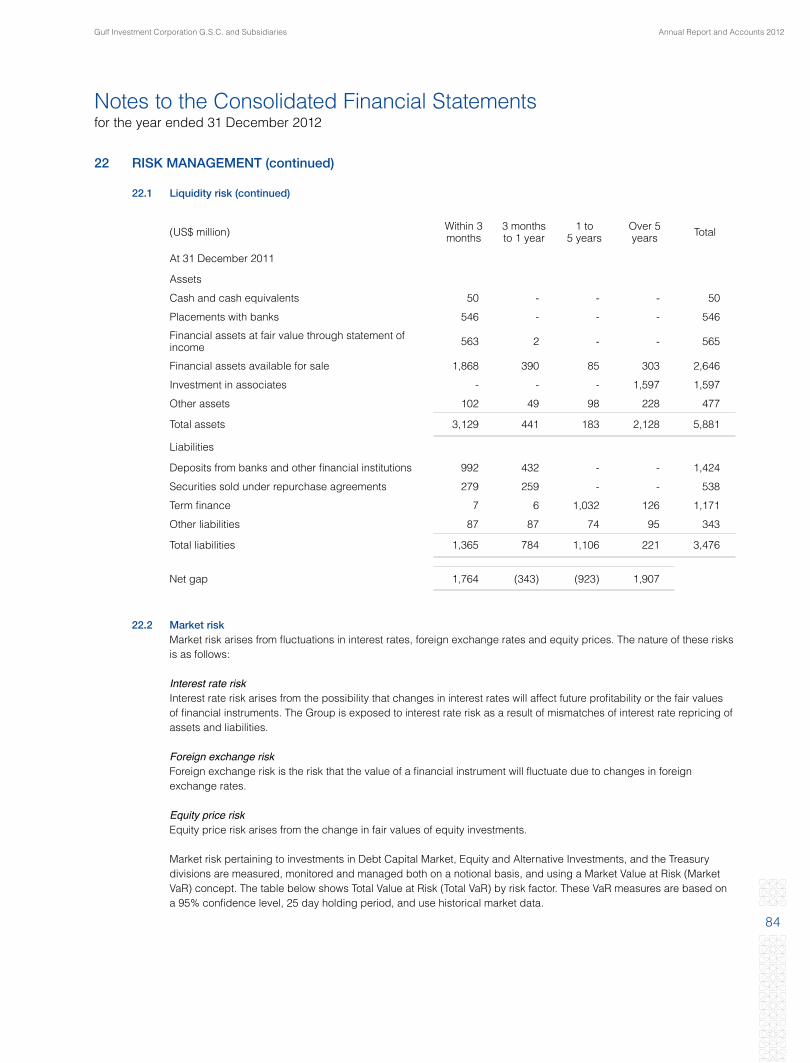
Annual Report and Accounts 2012Gulf Investment Corporation G.S.C. and Subsidiaries
84
22 RISK MANAGEMENT (continued)
22.1 Liquidity risk (continued)
(US$ million) Within 3 months
3 months to 1 year
1 to 5 years
Over 5 years Total
At 31 December 2011
Assets
Cash and cash equivalents 50 - - - 50
Placements with banks 546 - - - 546
Financial assets at fair value through statement of income 563 2 - - 565
Financial assets available for sale 1,868 390 85 303 2,646
Investment in associates - - - 1,597 1,597
Other assets 102 49 98 228 477
Total assets 3,129 441 183 2,128 5,881
Liabilities
Deposits from banks and other financial institutions 992 432 - - 1,424
Securities sold under repurchase agreements 279 259 - - 538
Term finance 7 6 1,032 126 1,171
Other liabilities 87 87 74 95 343
Total liabilities 1,365 784 1,106 221 3,476
Net gap 1,764 (343) (923) 1,907
22.2 Market risk Market risk arises from fluctuations in interest rates, foreign exchange rates and equity prices. The nature of these risks
is as follows: Interest rate risk Interest rate risk arises from the possibility that changes in interest rates will affect future profitability or the fair values
of financial instruments. The Group is exposed to interest rate risk as a result of mismatches of interest rate repricing of assets and liabilities.
Foreign exchange risk Foreign exchange risk is the risk that the value of a financial instrument will fluctuate due to changes in foreign
exchange rates.
Equity price risk Equity price risk arises from the change in fair values of equity investments.
Market risk pertaining to investments in Debt Capital Market, Equity and Alternative Investments, and the Treasury divisions are measured, monitored and managed both on a notional basis, and using a Market Value at Risk (Market VaR) concept. The table below shows Total Value at Risk (Total VaR) by risk factor. These VaR measures are based on a 95% confidence level, 25 day holding period, and use historical market data.
Notes to the Consolidated Financial Statementsfor the year ended 31 December 2012
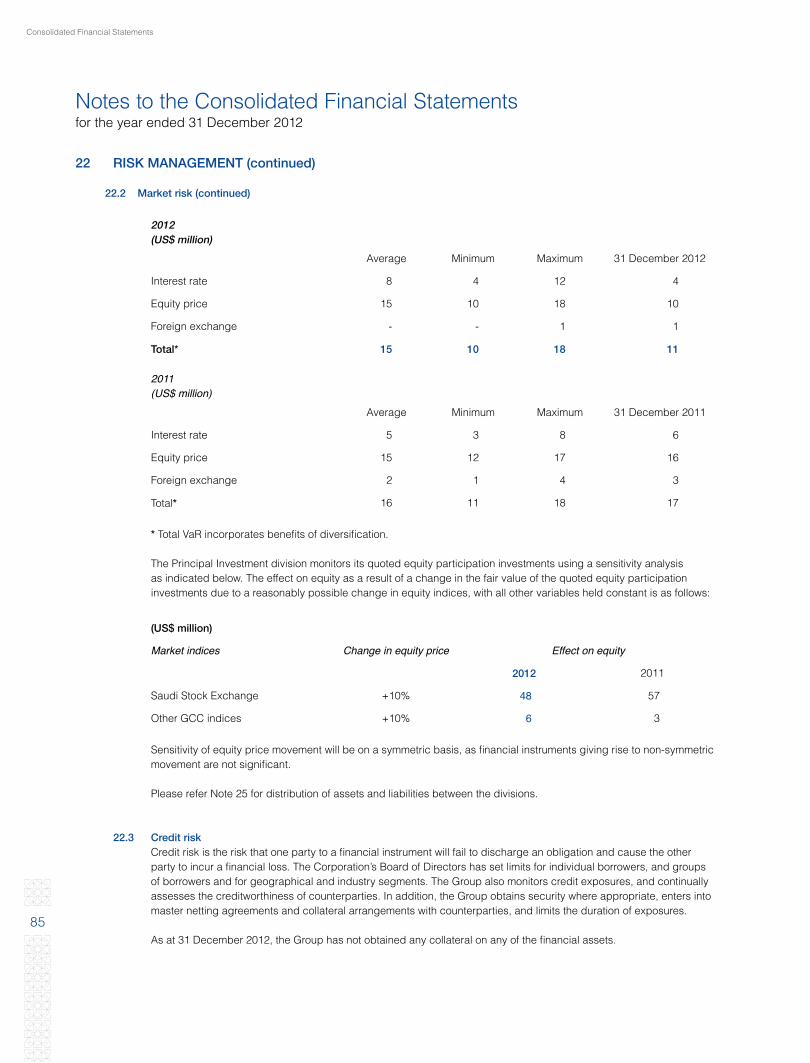
Consolidated Financial Statements
85
22 RISK MANAGEMENT (continued) 22.2 Market risk (continued)
2012(US$ million)
Average Minimum Maximum 31 December 2012
Interest rate 8 4 12 4
Equity price 15 10 18 10
Foreign exchange - - 1 1
Total* 15 10 18 11
2011(US$million)
Average Minimum Maximum 31 December 2011
Interest rate 5 3 8 6
Equity price 15 12 17 16
Foreign exchange 2 1 4 3
Total* 16 11 18 17
* Total VaR incorporates benefits of diversification.
The Principal Investment division monitors its quoted equity participation investments using a sensitivity analysis as indicated below. The effect on equity as a result of a change in the fair value of the quoted equity participation investments due to a reasonably possible change in equity indices, with all other variables held constant is as follows:
(US$ million)
Market indices Change in equity price Effect on equity
2012 2011
Saudi Stock Exchange +10% 48 57
Other GCC indices +10% 6 3
Sensitivity of equity price movement will be on a symmetric basis, as financial instruments giving rise to non-symmetric movement are not significant.
Please refer Note 25 for distribution of assets and liabilities between the divisions.
22.3 Credit risk Credit risk is the risk that one party to a financial instrument will fail to discharge an obligation and cause the other
party to incur a financial loss. The Corporation’s Board of Directors has set limits for individual borrowers, and groups of borrowers and for geographical and industry segments. The Group also monitors credit exposures, and continually assesses the creditworthiness of counterparties. In addition, the Group obtains security where appropriate, enters into master netting agreements and collateral arrangements with counterparties, and limits the duration of exposures.
As at 31 December 2012, the Group has not obtained any collateral on any of the financial assets.
Notes to the Consolidated Financial Statementsfor the year ended 31 December 2012

Annual Report and Accounts 2012Gulf Investment Corporation G.S.C. and Subsidiaries
86
22 RISK MANAGEMENT (continued)
22.3.1 Maximum exposure to credit risk The maximum credit exposure of the Group is as follows:
(US$ million) Maximum exposure
2012 2011
Cash and cash equivalents 72 50
Placements with banks 884 546
Debt securities at fair value through income statement 178 147
Debt securities available for sale 1,867 1,624
Other assets 201 357
Credit exposure on assets 3,202 2,724
Credit commitments 173 252
Total credit exposure 3,375 2,976
Credit risk in respect of derivative financial instruments is limited to those with positive fair values, which are included under other assets.
Concentrations arise when a number of counterparties are engaged in similar business activities, or activities in the same geographic region, or have similar economic features that would cause their ability to meet contractual obligations to be similarly affected by changes in economic, political or other conditions. Concentrations indicate the relative sensitivity of the Group’s performance to developments affecting a particular industry or geographic location. The maximum credit exposure to a single counterparty (rated as investment grade) is US$ 85 million (2011: US$ 84 million).
The Group’s concentration of credit risk exposure by geographic region is as follows:
(US$ million) GCC Europe America Asia/Africa Total
At 31 December 2012
Cash and cash equivalents 70 1 1 - 72
Placements with banks 607 202 75 - 884
Debt securities at fair value through income statement 157 8 13 - 178
Debt securities available for sale 784 462 524 97 1,867
Other assets 78 84 6 33 201
Credit exposure on assets 1,696 757 619 130 3,202
Credit commitments 165 - - 8 173
Total credit exposure 1,861 757 619 138 3,375
Notes to the Consolidated Financial Statementsfor the year ended 31 December 2012
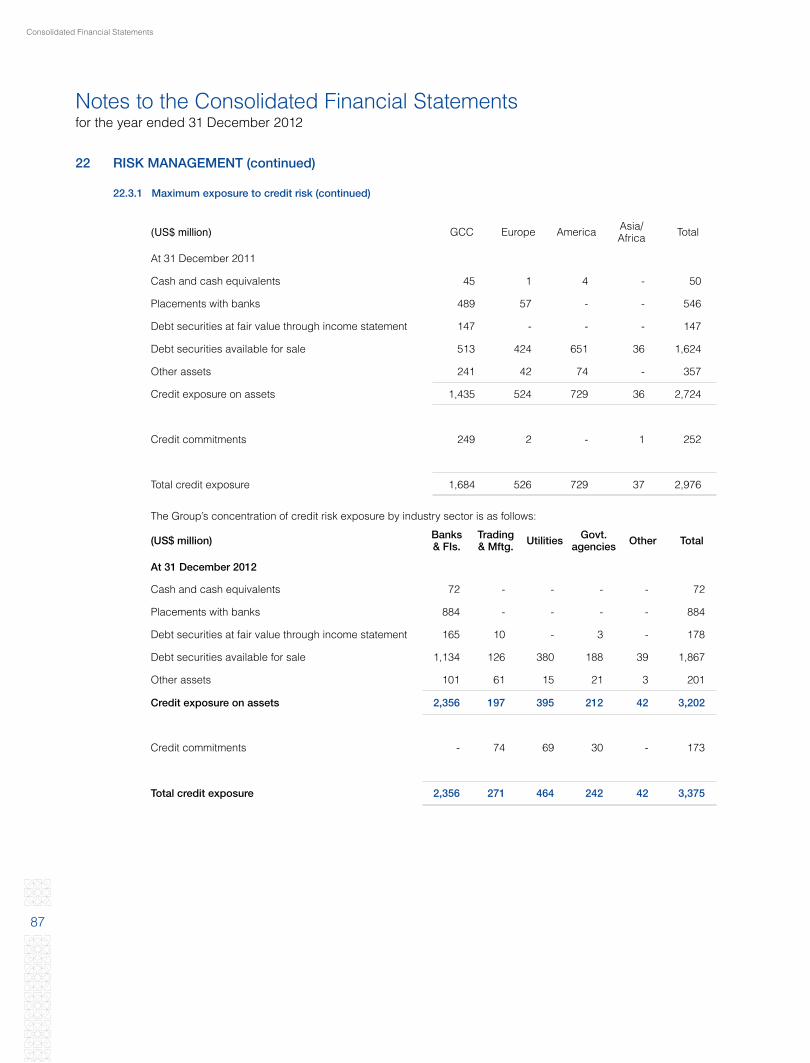
Consolidated Financial Statements
87
22 RISK MANAGEMENT (continued)
22.3.1 Maximum exposure to credit risk (continued)
(US$ million) GCC Europe America Asia/Africa Total
At 31 December 2011
Cash and cash equivalents 45 1 4 - 50
Placements with banks 489 57 - - 546
Debt securities at fair value through income statement 147 - - - 147
Debt securities available for sale 513 424 651 36 1,624
Other assets 241 42 74 - 357
Credit exposure on assets 1,435 524 729 36 2,724
Credit commitments 249 2 - 1 252
Total credit exposure 1,684 526 729 37 2,976
The Group’s concentration of credit risk exposure by industry sector is as follows:
(US$ million) Banks & FIs.
Trading& Mftg. Utilities Govt.
agencies Other Total
At 31 December 2012
Cash and cash equivalents 72 - - - - 72
Placements with banks 884 - - - - 884
Debt securities at fair value through income statement 165 10 - 3 - 178
Debt securities available for sale 1,134 126 380 188 39 1,867
Other assets 101 61 15 21 3 201
Credit exposure on assets 2,356 197 395 212 42 3,202
Credit commitments - 74 69 30 - 173
Total credit exposure 2,356 271 464 242 42 3,375
Notes to the Consolidated Financial Statementsfor the year ended 31 December 2012

Annual Report and Accounts 2012Gulf Investment Corporation G.S.C. and Subsidiaries
88
22 RISK MANAGEMENT (continued)
22.3.1 Maximum exposure to credit risk (continued)
(US$ million) Banks & FIs.
Trading& Mftg. Utilities Govt.
agencies Other Total
At 31 December 2011
Cash and cash equivalents 50 - - - - 50
Placements with banks 546 - - - - 546
Debt securities at fair value through income statement 147 - - - - 147
Debt securities available for sale 1,059 128 181 61 195 1,624
Other assets 175 90 82 - 10 357
Credit exposure on assets 1,977 218 263 61 205 2,724
Credit commitments - 92 155 5 - 252
Total credit exposure 1,977 310 418 66 205 2,976
22.3.2 Credit quality of financial assets In managing its portfolio, the Group utilises external ratings and other measures and techniques which seek to take
account of all aspects of perceived risk. Credit exposures classified as ‘Investment grade’ quality are those where the ultimate risk of financial loss from the obligor’s failure to discharge its obligation is assessed to be low. These include facilities to corporate entities with financial condition, risk indicators and capacity to repay which are considered to be good to excellent. All investment grade securities are rated by well known rating agencies. Credit exposures classified as ‘Unrated’ quality comprise all other facilities whose payment performance is fully compliant with contractual conditions and which are not ‘impaired’, but are not assigned any published ratings. The ‘Unrated’ quality includes investment in high quality GCC debt securities and unrated debt funds where the underlying is mostly investment grade.
The table below shows the credit quality by class of assets:
(US$ million) Neither past due nor impaired Total
Investment grade Unrated
At 31 December 2012
Cash and cash equivalents 72 - 72
Placements with banks 884 - 884
Debt securities at fair value through income statement 167 11 178
Debt securities available for sale 1,749 118 1,867
Other assets 107 94 201
Credit exposure on assets 2,979 223 3,202
Credit commitments 173 - 173
Total credit exposure 3,152 223 3,375
Notes to the Consolidated Financial Statementsfor the year ended 31 December 2012

Consolidated Financial Statements
89
22 RISK MANAGEMENT (continued)
22.3.2 Credit quality of financial assets (continued)
(US$ million) Neither past due nor impaired Total
Investment grade Unrated
At 31 December 2011
Cash and cash equivalents 50 - 50
Placements with banks 546 - 546
Debt securities at fair value through income statement 138 9 147
Debt securities available for sale 1,456 168 1,624
Other assets 247 110 357
Credit exposure on assets 2,437 287 2,724
Credit commitments 252 - 252
Total credit exposure 2,689 287 2,976
23 COMMITMENTS AND CONTINGENT LIABILITIES In the usual course of meeting the requirements of customers, the Group has commitments to extend credit and provide
financial guarantees and letters of credit to guarantee the performance of customers to third parties. The credit risk on these transactions is generally less than the contractual amount. The table below sets out the notional principal amounts of outstanding commitments.
Notional principal amount
2012 2011
Credit Risk Amounts(US$ million)
Transaction-related contingent items:
- Letter of guarantees 170 244
- Others 3 8
173 252
The above commitments and contingent liabilities have off balance-sheet credit risk because only origination fees and accruals for probable losses are recognised in the consolidated statement of financial position until the commitments are fulfilled or expired. Many of the contingent liabilities and commitments will expire without being advanced in whole or in part. Therefore, the amounts do not represent expected future cash flows. The transaction related contingent liabilities are net of allowance of US $ 1 million (2011: US $ 1 million).
The Group had the following non credit commitments as at the reporting date:
(US$ million) 2012 2011
Undrawn commitments for investments in private equity funds 104 77
Undrawn commitments for investments in associates and other equity participations 12 36
Other commitments 11 -
127 113
Notes to the Consolidated Financial Statementsfor the year ended 31 December 2012
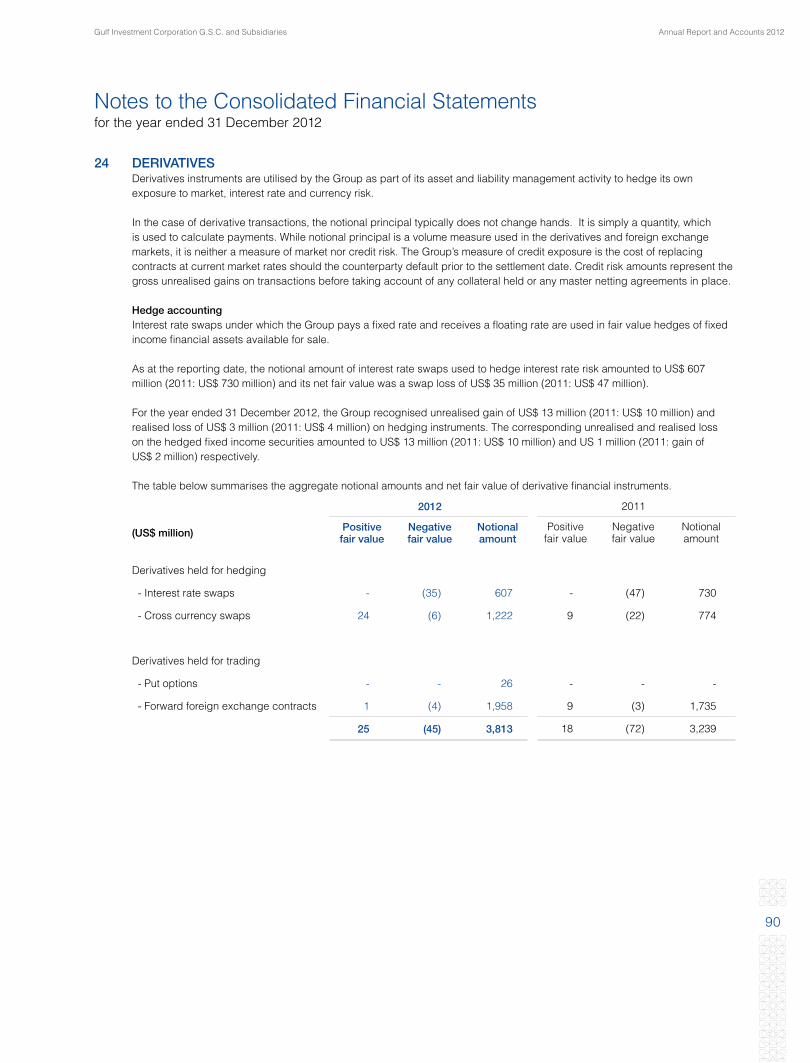
Annual Report and Accounts 2012Gulf Investment Corporation G.S.C. and Subsidiaries
90
24 DERIVATIVES Derivatives instruments are utilised by the Group as part of its asset and liability management activity to hedge its own
exposure to market, interest rate and currency risk.
In the case of derivative transactions, the notional principal typically does not change hands. It is simply a quantity, which is used to calculate payments. While notional principal is a volume measure used in the derivatives and foreign exchange markets, it is neither a measure of market nor credit risk. The Group’s measure of credit exposure is the cost of replacing contracts at current market rates should the counterparty default prior to the settlement date. Credit risk amounts represent the gross unrealised gains on transactions before taking account of any collateral held or any master netting agreements in place.
Hedge accounting Interest rate swaps under which the Group pays a fixed rate and receives a floating rate are used in fair value hedges of fixed
income financial assets available for sale. As at the reporting date, the notional amount of interest rate swaps used to hedge interest rate risk amounted to US$ 607
million (2011: US$ 730 million) and its net fair value was a swap loss of US$ 35 million (2011: US$ 47 million).
For the year ended 31 December 2012, the Group recognised unrealised gain of US$ 13 million (2011: US$ 10 million) and realised loss of US$ 3 million (2011: US$ 4 million) on hedging instruments. The corresponding unrealised and realised loss on the hedged fixed income securities amounted to US$ 13 million (2011: US$ 10 million) and US 1 million (2011: gain of US$ 2 million) respectively.
The table below summarises the aggregate notional amounts and net fair value of derivative financial instruments.
2012 2011
(US$ million) Positivefair value
Negative fair value
Notionalamount
Positivefair value
Negative fair value
Notionalamount
Derivatives held for hedging
- Interest rate swaps - (35) 607 - (47) 730
- Cross currency swaps 24 (6) 1,222 9 (22) 774
Derivatives held for trading
- Put options - - 26 - - -
- Forward foreign exchange contracts 1 (4) 1,958 9 (3) 1,735
25 (45) 3,813 18 (72) 3,239
Notes to the Consolidated Financial Statementsfor the year ended 31 December 2012
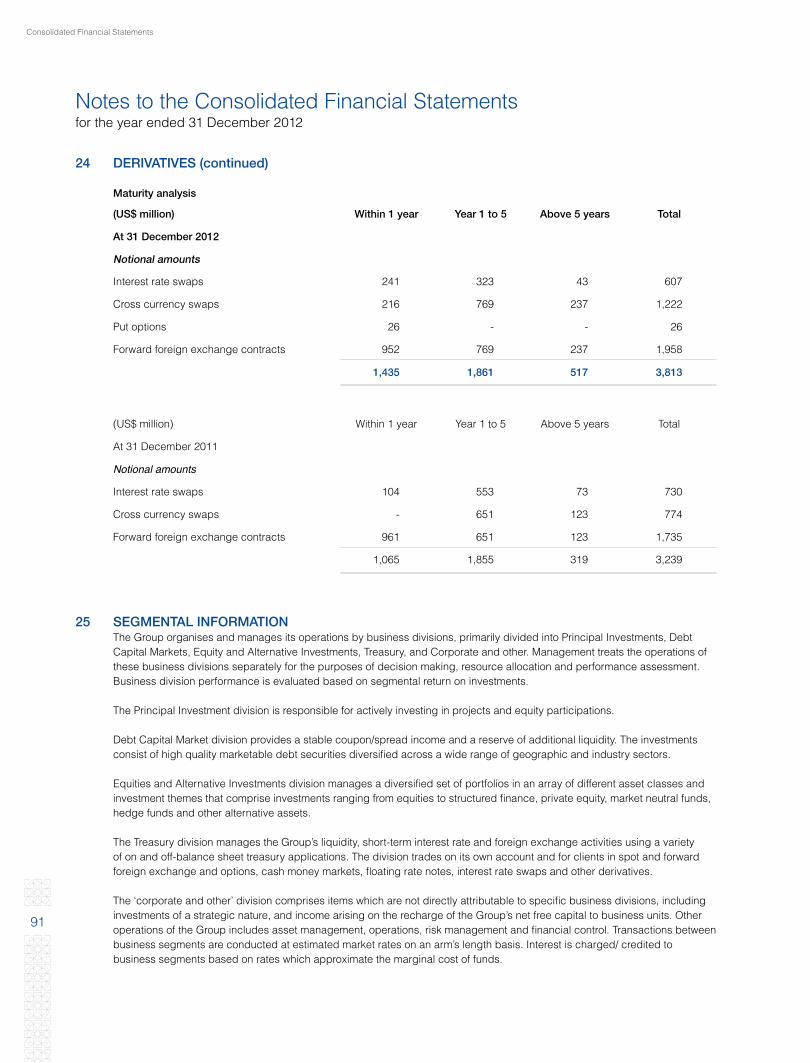
Consolidated Financial Statements
91
24 DERIVATIVES (continued)
Maturity analysis
(US$ million) Within 1 year Year 1 to 5 Above 5 years Total
At 31 December 2012
Notional amounts
Interest rate swaps 241 323 43 607
Cross currency swaps 216 769 237 1,222
Put options 26 - - 26
Forward foreign exchange contracts 952 769 237 1,958
1,435 1,861 517 3,813
(US$ million) Within 1 year Year 1 to 5 Above 5 years Total
At 31 December 2011
Notional amounts
Interest rate swaps 104 553 73 730
Cross currency swaps - 651 123 774
Forward foreign exchange contracts 961 651 123 1,735
1,065 1,855 319 3,239
25 SEGMENTAL INFORMATION The Group organises and manages its operations by business divisions, primarily divided into Principal Investments, Debt
Capital Markets, Equity and Alternative Investments, Treasury, and Corporate and other. Management treats the operations of these business divisions separately for the purposes of decision making, resource allocation and performance assessment. Business division performance is evaluated based on segmental return on investments.
The Principal Investment division is responsible for actively investing in projects and equity participations. Debt Capital Market division provides a stable coupon/spread income and a reserve of additional liquidity. The investments
consist of high quality marketable debt securities diversified across a wide range of geographic and industry sectors.
Equities and Alternative Investments division manages a diversified set of portfolios in an array of different asset classes and investment themes that comprise investments ranging from equities to structured finance, private equity, market neutral funds, hedge funds and other alternative assets.
The Treasury division manages the Group’s liquidity, short-term interest rate and foreign exchange activities using a variety of on and off-balance sheet treasury applications. The division trades on its own account and for clients in spot and forward foreign exchange and options, cash money markets, floating rate notes, interest rate swaps and other derivatives.
The ‘corporate and other’ division comprises items which are not directly attributable to specific business divisions, including
investments of a strategic nature, and income arising on the recharge of the Group’s net free capital to business units. Other operations of the Group includes asset management, operations, risk management and financial control. Transactions between business segments are conducted at estimated market rates on an arm’s length basis. Interest is charged/ credited to business segments based on rates which approximate the marginal cost of funds.
Notes to the Consolidated Financial Statementsfor the year ended 31 December 2012
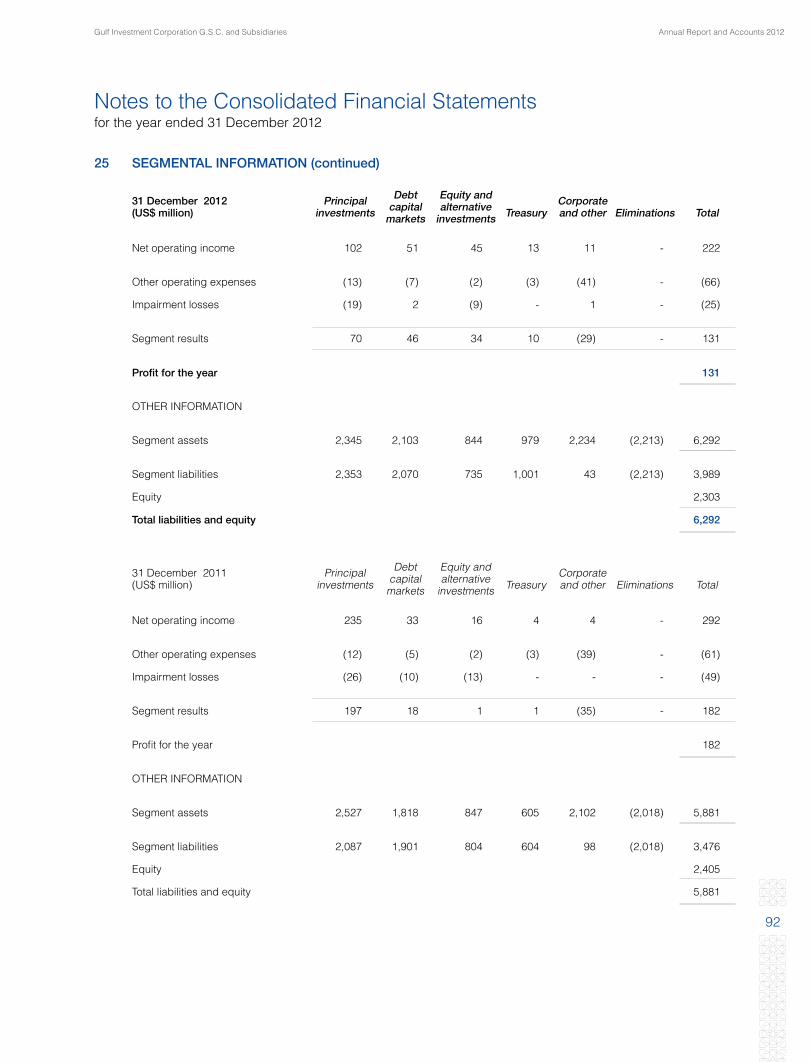
Annual Report and Accounts 2012Gulf Investment Corporation G.S.C. and Subsidiaries
92
25 SEGMENTAL INFORMATION (continued)
31 December 2012(US$ million)
Principalinvestments
Debt capital
markets
Equity and alternative
investments TreasuryCorporateand other Eliminations Total
Net operating income 102 51 45 13 11 - 222
Other operating expenses (13) (7) (2) (3) (41) - (66)
Impairment losses (19) 2 (9) - 1 - (25)
Segment results 70 46 34 10 (29) - 131
Profit for the year 131
OTHER INFORMATION
Segment assets 2,345 2,103 844 979 2,234 (2,213) 6,292
Segment liabilities 2,353 2,070 735 1,001 43 (2,213) 3,989
Equity 2,303
Total liabilities and equity 6,292
31 December 2011(US$ million)
Principalinvestments
Debt capitalmarkets
Equity and alternative
investments TreasuryCorporateand other Eliminations Total
Net operating income 235 33 16 4 4 - 292
Other operating expenses (12) (5) (2) (3) (39) - (61)
Impairment losses (26) (10) (13) - - - (49)
Segment results 197 18 1 1 (35) - 182
Profit for the year 182
OTHER INFORMATION
Segment assets 2,527 1,818 847 605 2,102 (2,018) 5,881
Segment liabilities 2,087 1,901 804 604 98 (2,018) 3,476
Equity 2,405
Total liabilities and equity 5,881
Notes to the Consolidated Financial Statementsfor the year ended 31 December 2012
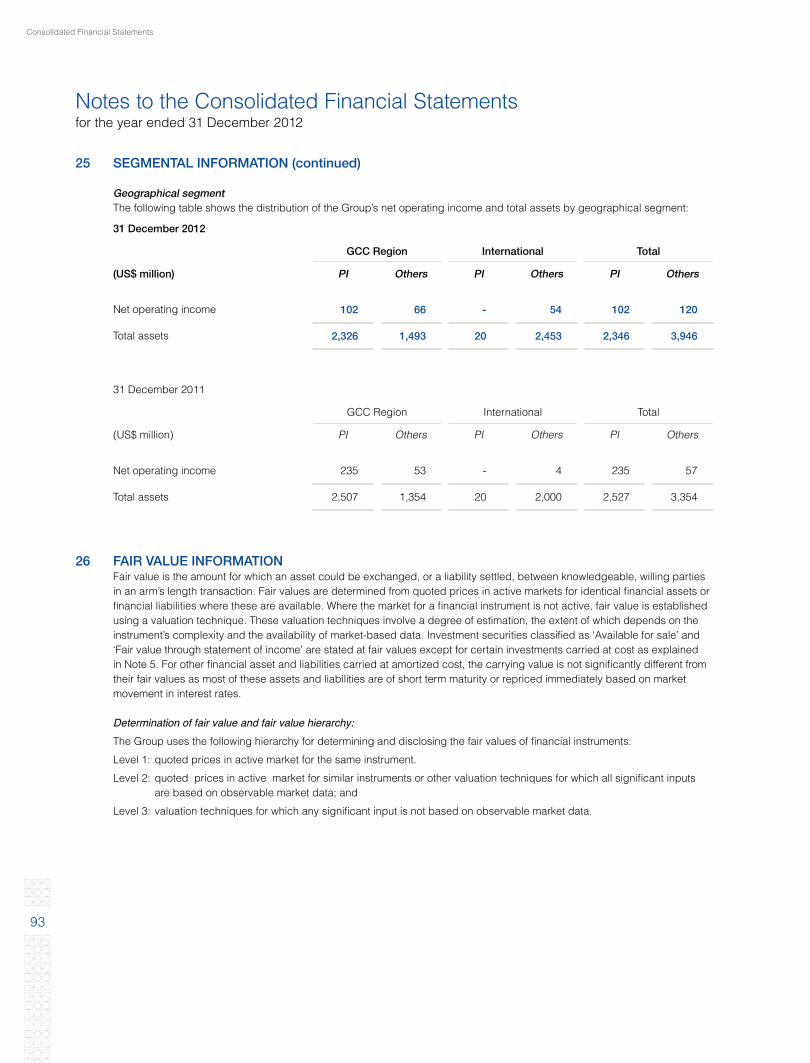
Consolidated Financial Statements
93
25 SEGMENTAL INFORMATION (continued)
Geographical segment The following table shows the distribution of the Group’s net operating income and total assets by geographical segment:
31 December 2012
GCC Region International Total
(US$ million) PI Others PI Others PI Others
Net operating income 102 66 - 54 102 120
Total assets 2,326 1,493 20 2,453 2,346 3,946
31 December 2011
GCC Region International Total
(US$ million) PI Others PI Others PI Others
Net operating income 235 53 - 4 235 57
Total assets 2,507 1,354 20 2,000 2,527 3,354
26 FAIR VALUE INFORMATION Fair value is the amount for which an asset could be exchanged, or a liability settled, between knowledgeable, willing parties
in an arm’s length transaction. Fair values are determined from quoted prices in active markets for identical financial assets or financial liabilities where these are available. Where the market for a financial instrument is not active, fair value is established using a valuation technique. These valuation techniques involve a degree of estimation, the extent of which depends on the instrument’s complexity and the availability of market-based data. Investment securities classified as ‘Available for sale’ and ‘Fair value through statement of income’ are stated at fair values except for certain investments carried at cost as explained in Note 5. For other financial asset and liabilities carried at amortized cost, the carrying value is not significantly different from their fair values as most of these assets and liabilities are of short term maturity or repriced immediately based on market movement in interest rates.
Determination of fair value and fair value hierarchy: The Group uses the following hierarchy for determining and disclosing the fair values of financial instruments:
Level 1: quoted prices in active market for the same instrument.
Level 2: quoted prices in active market for similar instruments or other valuation techniques for which all significant inputs are based on observable market data; and
Level 3: valuation techniques for which any significant input is not based on observable market data.
Notes to the Consolidated Financial Statementsfor the year ended 31 December 2012
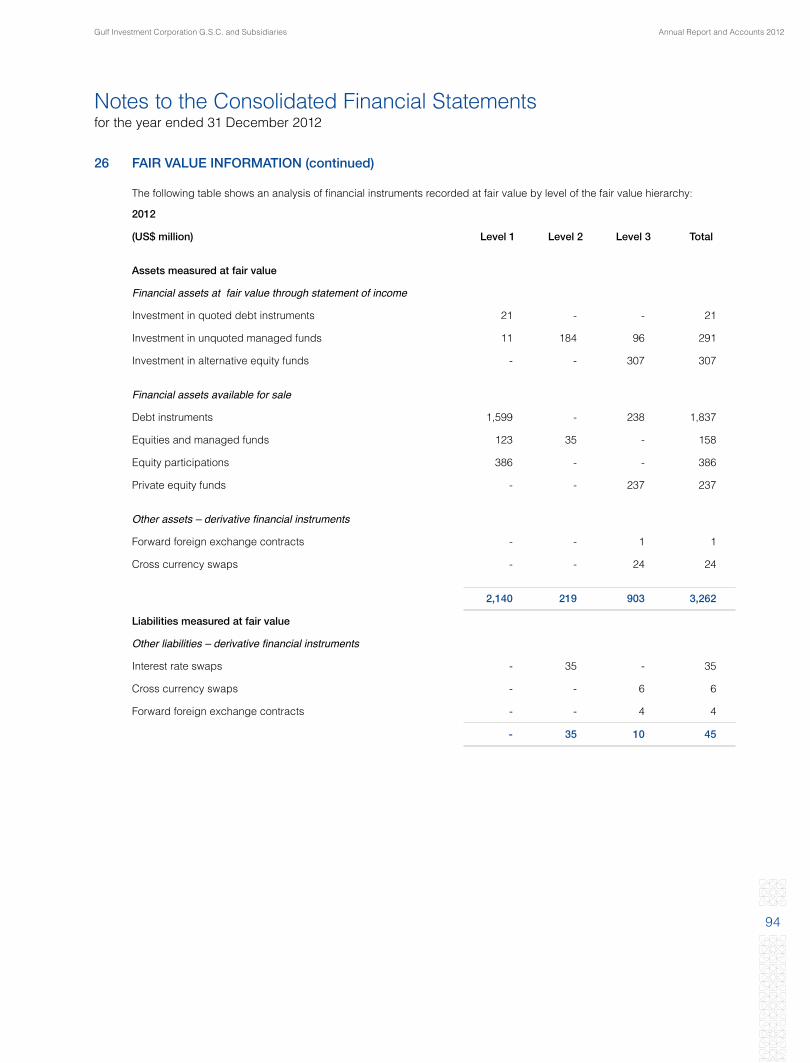
Annual Report and Accounts 2012Gulf Investment Corporation G.S.C. and Subsidiaries
94
26 FAIR VALUE INFORMATION (continued)
The following table shows an analysis of financial instruments recorded at fair value by level of the fair value hierarchy:
2012
(US$ million) Level 1 Level 2 Level 3 Total
Assets measured at fair value
Financial assets at fair value through statement of income
Investment in quoted debt instruments 21 - - 21
Investment in unquoted managed funds 11 184 96 291
Investment in alternative equity funds - - 307 307
Financial assets available for sale
Debt instruments 1,599 - 238 1,837
Equities and managed funds 123 35 - 158
Equity participations 386 - - 386
Private equity funds - - 237 237
Otherassets–derivativefinancialinstruments
Forward foreign exchange contracts - - 1 1
Cross currency swaps - - 24 24
2,140 219 903 3,262
Liabilities measured at fair value
Otherliabilities–derivativefinancialinstruments
Interest rate swaps - 35 - 35
Cross currency swaps - - 6 6
Forward foreign exchange contracts - - 4 4
- 35 10 45
Notes to the Consolidated Financial Statementsfor the year ended 31 December 2012
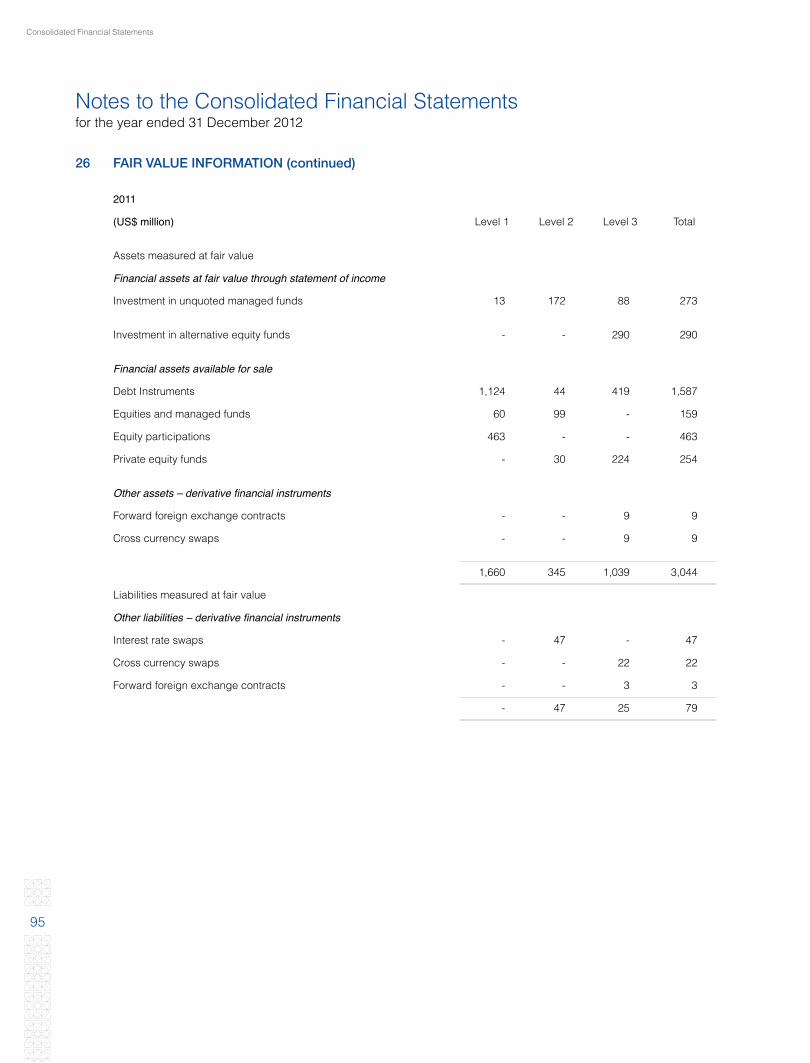
Consolidated Financial Statements
95
26 FAIR VALUE INFORMATION (continued)
2011
(US$ million) Level 1 Level 2 Level 3 Total
Assets measured at fair value
Financial assets at fair value through statement of income
Investment in unquoted managed funds 13 172 88 273
Investment in alternative equity funds - - 290 290
Financial assets available for sale
Debt Instruments 1,124 44 419 1,587
Equities and managed funds 60 99 - 159
Equity participations 463 - - 463
Private equity funds - 30 224 254
Otherassets–derivativefinancialinstruments
Forward foreign exchange contracts - - 9 9
Cross currency swaps - - 9 9
1,660 345 1,039 3,044
Liabilities measured at fair value
Otherliabilities–derivativefinancialinstruments
Interest rate swaps - 47 - 47
Cross currency swaps - - 22 22
Forward foreign exchange contracts - - 3 3
- 47 25 79
Notes to the Consolidated Financial Statementsfor the year ended 31 December 2012

Annual Report and Accounts 2012Gulf Investment Corporation G.S.C. and Subsidiaries
96
27 RELATED PARTY TRANSACTIONS Related parties represent major shareholders, directors and key management personnel of the Corporation, and entities
controlled, jointly controlled or significantly influenced by such parties. Pricing policies and terms of these transactions are approved by the Corporation’s management.
Transactions with associates during the year are as follows:
(US$ million) 2012 2011
Net fees and commissions and other income 14 4
Guarantees and commitments 154 233
Receivables from associates 6 8
Compensation of key management personnel
The remuneration of key management personnel during the year is as follows:
(US$ million) 2012 2011
Salaries and short-term employee benefits 15 12
Post employment and termination benefits 3 3
18 15
Included in other assets are loans to key management personnel amounting to US$ 1million (2011: US$ 1 million).
28 FIDUCIARY ACTIVITIES At 31 December 2012, third party assets under management amounted to US$ 235 million (2011: US$ 205 million). These
assets are managed in a fiduciary capacity and are therefore excluded from the consolidated statement of financial position. The related income from fiduciary activities amounted to US$ 2 million (2011: US$ 2 million).
Notes to the Consolidated Financial Statementsfor the year ended 31 December 2012
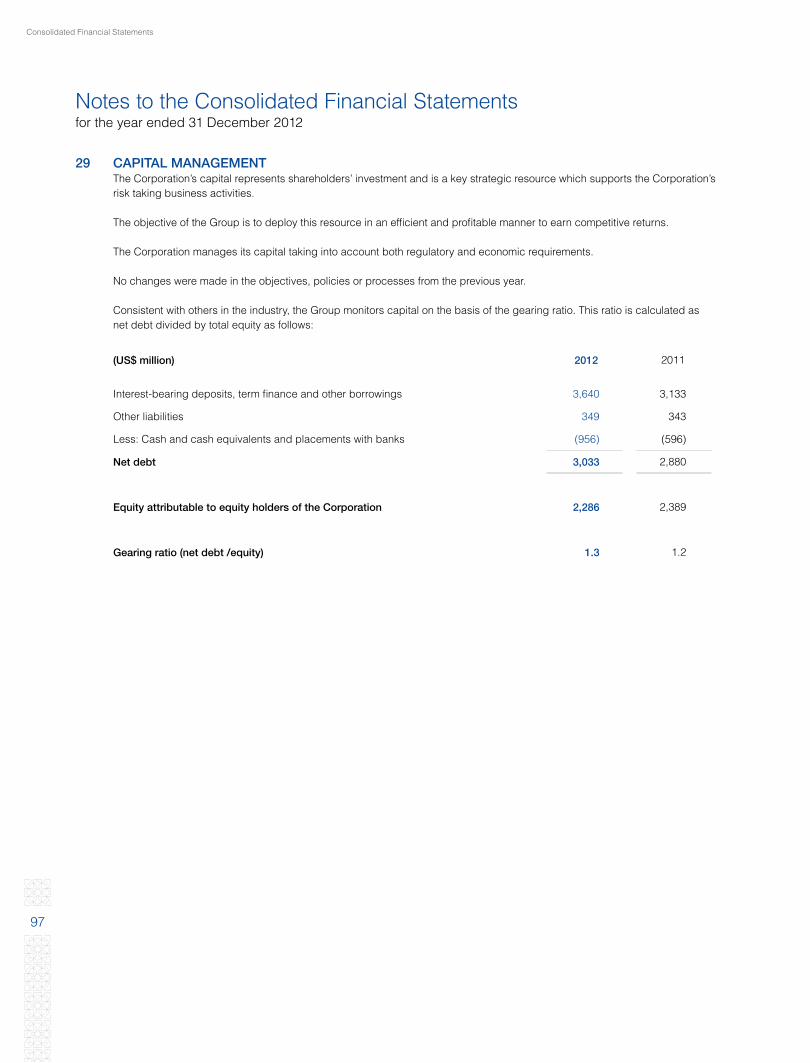
Consolidated Financial Statements
97
29 CAPITAL MANAGEMENT The Corporation’s capital represents shareholders’ investment and is a key strategic resource which supports the Corporation’s
risk taking business activities.
The objective of the Group is to deploy this resource in an efficient and profitable manner to earn competitive returns.
The Corporation manages its capital taking into account both regulatory and economic requirements.
No changes were made in the objectives, policies or processes from the previous year.
Consistent with others in the industry, the Group monitors capital on the basis of the gearing ratio. This ratio is calculated as net debt divided by total equity as follows:
(US$ million) 2012 2011
Interest-bearing deposits, term finance and other borrowings 3,640 3,133
Other liabilities 349 343
Less: Cash and cash equivalents and placements with banks (956) (596)
Net debt 3,033 2,880
Equity attributable to equity holders of the Corporation 2,286 2,389
Gearing ratio (net debt /equity) 1.3 1.2
Notes to the Consolidated Financial Statementsfor the year ended 31 December 2012

Annual Report and Accounts 2012Gulf Investment Corporation G.S.C. and Subsidiaries
98
30 PRINCIPAL SUBSIDIARIES AND ASSOCIATES The principal subsidiaries and associates of the Corporation are set out below:
Country ofincorporation
Effective equityinterest as at
Principal business activity
2012 2011
Principal Subsidiaries
Bituminous Products Company Limited (Bitumat) Saudi Arabia 100.0 100.0 Building Material Manufacturing
GI Corporation for General Trading & Contracting Company
Kuwait 100.0 100.0 Holding Company
Investel Holdings W.L.L. Bahrain 100.0 100.0 Holding Company
GIC Financial Services Ltd Cayman Islands 100.0 100.0 Holding Company
GIC Investment Holding Ltd Cayman Islands 100.0 100.0 Holding Company
Power and Water Investments Limited Jersey 100.0 100.0 Holding Company
GIC Funds Company B.S.C. (Closed) Bahrain 100.0 100.0 Holding Company
GIC Management Cayman Islands 100.0 100.0 Holding Company
GIC Funding Limited Cayman Islands 100.0 100.0 Holding Company
Gulf Partners LP Limited UAE 100.0 - Holding Company
Gulf Partners GP Limited UAE 100.0 - Holding Company
Gulf Partners I LP UAE 100.0 - Holding Company
GIC First PanGulf Holding Co. Limited UAE 100.0 - Holding Company
GIC First Saudi Holding Co. LLC Saudi Arabia 100.0 - Holding Company
GIC Second Saudi Holding Co. LLC Saudi Arabia 100.0 - Holding Company
Gulf Paramount for Electrical Services Company WLL Kuwait 92.8 92.8 Electrical Services
Gulf Electronic Tawasul Company KSCC Kuwait 86.5 86.5 Information Technology
GIC Technologies Company W.L.L Kuwait 80.0 80.0 Technical Advisory
Gulf Jyoti International L.L.C UAE 70.0 70.0 Construction & Engineering
Crown Paper Mill Ltd. FZC UAE 58.7 58.7 Paper Manufacturing
Associates
Gulf Re Holdings Limited UAE 50.0 50.0 Re-insurance
Gulf United Steel Holding Company (Foulath) B.S.C (c) Bahrain 50.0 50.0 Holding Company
Oman Investment Corporation SAOC Oman 50.0 50.0 Investing Activities
Al Ezzel Power Company B.S.C. (c) Bahrain 45.0 45.0 Power & Water Utility Project
Bahrain Industrial Pharmaceutical Co. W.L.L Bahrain 40.0 40.0 Pharmaceuticals
Orimix Concrete Products L.L.C UAE 40.0 40.0 Building Materials
A’Saffa Foods SAOG Oman 33.3 33.3 Poultry & Dairy Products
The National Titanium Dioxide Co., Ltd. (Cristal) Saudi Arabia 33.0 33.0 Production of Titanium Dioxide
SGA Marafiq Holdings Saudi Arabia 33.3 33.3 Power & Water Utility Project
Shuqaiq International Power and Water CompanyLimited
Saudi Arabia 33.0 33.0 Power & Water Utility Project
Technical Supplies & Services Co. Ltd. UAE 30.7 30.7 Refrigeration & Cooling Services
Al Dur Holding Company Limited Bahrain 25.0 25.0 Power & Water Utility Project
Jeddah Cable Company Ltd. and Energy Group Saudi Arabia 25.0 25.0 Manufacturing Cables
ALUMCO L.L.C UAE 24.5 24.5 Building Materials
Interplast Company Limited (L.L.C.) UAE 23.5 23.5 Plastic
Celtex Weaving Mills Co. Ltd. Bahrain 23.0 23.0 Textiles
Emirates Rawabi (PJSC) UAE 22.5 22.5 Dairy Products
Wataniya Telecom Algeria Algeria 20.0 20.0 Telecom Service Provider
Gulf Stone Company SAOG Oman 20.0 20.0 Building Materials
Saudi Mechanical Industries Company Limited Saudi Arabia 20.0 - Manufacturing of Engineering Products
Notes to the Consolidated Financial Statementsfor the year ended 31 December 2012

99
Gulf Investment Corporation G.S.C.Stand-alone Statement of Financial Position as at 31 December 2012
(US$ million) 2012 2011
Assets
Cash and cash equivalents 46 14
Placements with banks 878 546
Financial assets at fair value through statement of Income 621 565
Financial assets available for sale 2,800 2,646
Investment in associates 1,507 1,531
Investment in subsidiaries 158 172
Other assets 144 261
Total assets 6,154 5,735
Liabilities and equity
Liabilities
Deposits from banks and other financial institutions 1,092 1,424
Securities sold under repurchase agreements 425 538
Term finance 2,102 1,141
Other liabilities 249 243
Total liabilities 3,868 3,346
Equity
Share capital 2,100 2,100
Reserves 827 773
Accumulated losses (316) (420)
Total Equity before cash flow hedge reserve 2,611 2,453
Cash flow hedge reserve (325) (64)
Total Equity 2,286 2,389
Total liabilities and equity 6,154 5,735
The following appendix represents the statement of financial position of Gulf Investment Corporation excluding the aasets and liabilties of its subsidiaries do not form part of the consolidated financial statements of the Corporation.
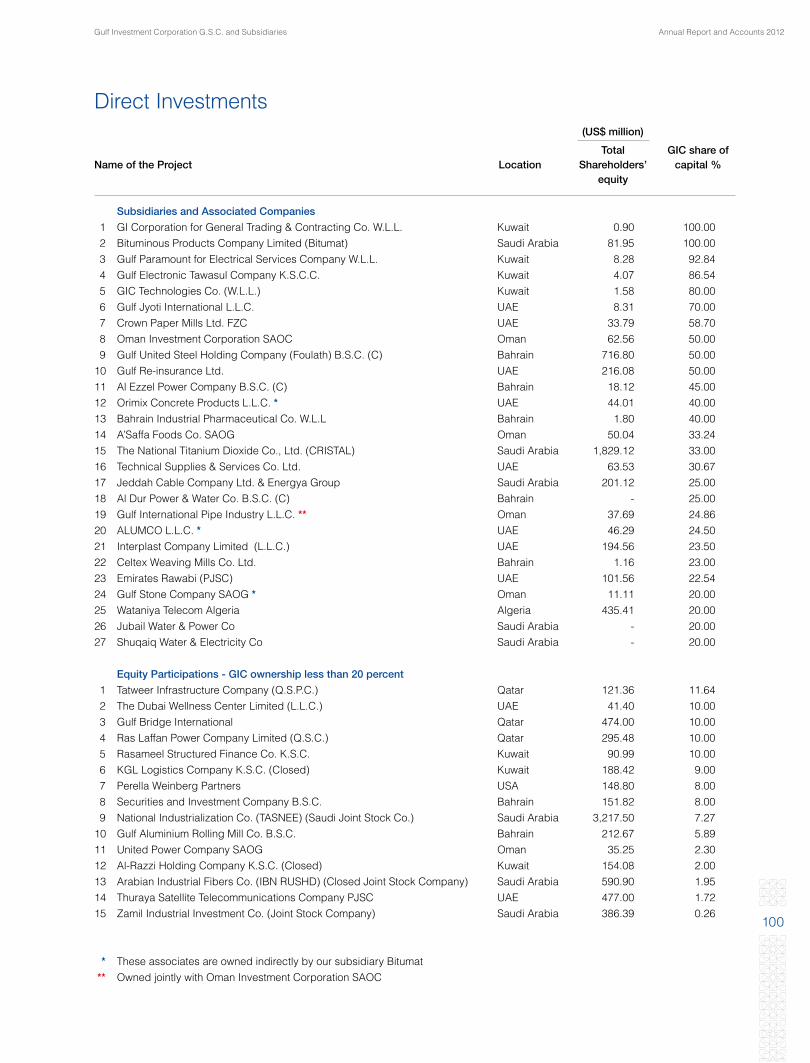
100
(US$ million)
Total GIC share of Name of the Project Location Shareholders’ capital % equity
Subsidiaries and Associated Companies
1 GI Corporation for General Trading & Contracting Co. W.L.L. Kuwait 0.90 100.00 2 Bituminous Products Company Limited (Bitumat) Saudi Arabia 81.95 100.00 3 Gulf Paramount for Electrical Services Company W.L.L. Kuwait 8.28 92.84 4 Gulf Electronic Tawasul Company K.S.C.C. Kuwait 4.07 86.54 5 GIC Technologies Co. (W.L.L.) Kuwait 1.58 80.00 6 Gulf Jyoti International L.L.C. UAE 8.31 70.00 7 Crown Paper Mills Ltd. FZC UAE 33.79 58.70 8 Oman Investment Corporation SAOC Oman 62.56 50.00 9 Gulf United Steel Holding Company (Foulath) B.S.C. (C) Bahrain 716.80 50.00 10 Gulf Re-insurance Ltd. UAE 216.08 50.00 11 Al Ezzel Power Company B.S.C. (C) Bahrain 18.12 45.00 12 Orimix Concrete Products L.L.C. * UAE 44.01 40.00 13 Bahrain Industrial Pharmaceutical Co. W.L.L Bahrain 1.80 40.00 14 A’Saffa Foods Co. SAOG Oman 50.04 33.24 15 The National Titanium Dioxide Co., Ltd. (CRISTAL) Saudi Arabia 1,829.12 33.00 16 Technical Supplies & Services Co. Ltd. UAE 63.53 30.67 17 Jeddah Cable Company Ltd. & Energya Group Saudi Arabia 201.12 25.00 18 Al Dur Power & Water Co. B.S.C. (C) Bahrain - 25.00 19 Gulf International Pipe Industry L.L.C. ** Oman 37.69 24.86 20 ALUMCO L.L.C. * UAE 46.29 24.50 21 Interplast Company Limited (L.L.C.) UAE 194.56 23.50 22 Celtex Weaving Mills Co. Ltd. Bahrain 1.16 23.00 23 Emirates Rawabi (PJSC) UAE 101.56 22.54 24 Gulf Stone Company SAOG * Oman 11.11 20.00 25 Wataniya Telecom Algeria Algeria 435.41 20.00 26 Jubail Water & Power Co Saudi Arabia - 20.00 27 Shuqaiq Water & Electricity Co Saudi Arabia - 20.00
Equity Participations - GIC ownership less than 20 percent
1 Tatweer Infrastructure Company (Q.S.P.C.) Qatar 121.36 11.64 2 The Dubai Wellness Center Limited (L.L.C.) UAE 41.40 10.00 3 Gulf Bridge International Qatar 474.00 10.00 4 Ras Laffan Power Company Limited (Q.S.C.) Qatar 295.48 10.00 5 Rasameel Structured Finance Co. K.S.C. Kuwait 90.99 10.00 6 KGL Logistics Company K.S.C. (Closed) Kuwait 188.42 9.00 7 Perella Weinberg Partners USA 148.80 8.00 8 Securities and Investment Company B.S.C. Bahrain 151.82 8.00 9 National Industrialization Co. (TASNEE) (Saudi Joint Stock Co.) Saudi Arabia 3,217.50 7.27 10 Gulf Aluminium Rolling Mill Co. B.S.C. Bahrain 212.67 5.89 11 United Power Company SAOG Oman 35.25 2.30 12 Al-Razzi Holding Company K.S.C. (Closed) Kuwait 154.08 2.00 13 Arabian Industrial Fibers Co. (IBN RUSHD) (Closed Joint Stock Company) Saudi Arabia 590.90 1.95 14 Thuraya Satellite Telecommunications Company PJSC UAE 477.00 1.72 15 Zamil Industrial Investment Co. (Joint Stock Company) Saudi Arabia 386.39 0.26
* These associates are owned indirectly by our subsidiary Bitumat ** Owned jointly with Oman Investment Corporation SAOC
Annual Report and Accounts 2012Gulf Investment Corporation G.S.C. and Subsidiaries
Direct Investments

101
Investment Products
The Fund Currency Inception Date Investment Objectives
GCC Funds
Equity
1. Gulf Premier Fund US$April 2003
• Attain capital appreciation through investments in GCC equity markets.
• Achieve competitive returns against a GCC equities index.
2. Gulf Islamic Fund US$January
2008
• Attain capital appreciation throught investments in GCC Sharia compliant equity markets.
• Achieve competitive returns against a GCC Sharia compliant equities index.
Bonds
1. GIC KD Bond Fund KDMay 2003
• Maximize current income and price appreciation consistent with preservation of capital and lower volatility through investment in debt issues in GCC & Kuwaiti markets.
2. Gulf Bond Fund US$May 2005
• Maximize income returns through investments in debt issues of GCC entities.
• Preservation of capital and lower volatility of total returns.
Global Funds
1. Alternative Strategies Fund US$August 1999
• The fund is a portfolio of hedge funds that is diversified across a broad mix of styles and strategies that seek to generate long term capital appreciation while maintaining a low correlation with traditional global financial markets.
• Risk Objective: Less volatile than traditional equity investments, emphasizing preservation of capital in down markets.
• Achieve annual total returns in the range of LIBOR plus 3% to 5%.
• Provide returns with low volatility 2% - 4%.
2. GIC Event-Driven Fund US$July 2002
• A fund of hedge funds focused on event-driven hedge fund strategies.
• Absolute annual returns in the range of LIBOR plus 4% to 8%.
• Achieve those returns within volatility of 3% to 5%.
• Provide returns with low correlation to the general direction of the traditional equity, fixed income and credit markets.
3. GIC Global REITS Fund US$December
2005
• Deliver capital appreciation through investments in global Real Estate securities listed in US,Europe and Asian equity markets.
• Achieve competitive and stable returns.

Annual Report and Accounts 2012Gulf Investment Corporation G.S.C. and Subsidiaries
102
Senior Management
Mr. Ibrahim Ali AlQadhiChief Executive Officer
Dr. Russell Read Deputy Chief Executive Officer & Chief Investment Officer
Mr. Rashid Bin Rasheed Deputy Chief Executive Officer & Head of Finance & Administration
Global Markets
Mr. Malek Al-AjeelHead of Business Development Div. & Head of Sales, Products & Marketing Div.
Mr. Talal Al-TawariHead of GCC Equities Div.
Mr. Fahmi Al-Ali Head of Managed Funds Div.
Mr. Tarek El RohayemHead of GCC Research Div.
Mr. Martin JoyHead of Treasury Div.
Mr. Raffaele BertoniHead of Debt Capital Markets Div.
Principal Investing
Mr. Shafic AliHead of Financial Services & Utilities Projects Div.
Mr. Khaled Al-QadeeriHead of Manufacturing Projects Div.
Mr. Mohammad Al-MelhemHead of Diversified Projects Div.
Mr. Muthuswamy ChandrasekaranHead of Corporate Finance Div.& Head of PI Monitoring Div.
Mr. Fadi TwainyHead of Private Equity Div.
Finance & Administration
Mr. Hani Al-ShakhsHead of Information Technology Div.
Mr. Shawki KhalafHead of Operations Div.
Mr. Hazem El-RafieHead of Financial Control Div.
Ms. Eman Al-BedahHead of Human Resources Div.
Mr. Qais Al-ShattiHead of Public Relations & Communication Dept.
Corporate Office
Dr. Sulayman Al-QudsiHead of Economics Div.
Mr. Sebastian Vadakumcherry Head of Risk Management Div.
Dr. Khaled BukhamseenHead of Internal Audit Div.
Mr. Khalid KhanHead of General Counsel Div.
Mr. Fahad AlabdulkaderHead of BOD Secretariat Div.
Mr. Adil JawadHead of Compliance Dept.
Corporate Directory

103103
Mailing Address
P.O. Box 3402, Safat 13035, Kuwait
Courier Address
Sharq, Jaber Al-Mubarak Street, Kuwait
Websitewww.gic.com.kw
S.W.I.F.T.
GCOR KWKW
Telephone
(+965) 2222 5000
Fascimile
(+965) 2222 5010
Contact Details