annual report and accounts 2014 - gkn have continued with our progressive dividend policy and are...
TRANSCRIPT
ENGINEERING THAT MOVES THE WORLD
ENGINEERING THAT MOVES THE WORLD
ENGINEERING THAT MOVES THE WORLD
ENGINEERING THAT MOVES THE WORLD
Annual Report and Accounts 2014
ENGINEERING THAT MOVES THE WORLD
ENGINEERING THAT MOVES THE WORLD
→ Visit our website for more information www.gkn.com
GKN
plc Annual Report and Accounts 2014
Engineering that moves the world
Visit our website for more information www.gkn.com
GKN is a global engineering business. Every day we drive the wheels of hundreds of millions of cars, we help thousands of aircraft to fly, we deliver the power to move earth and harvest crops, and we make essential components for industries that touch lives across the globe.
GKN plc PO Box 55 Ipsley House Ipsley Church Lane Redditch Worcestershire B98 0TL Tel +44 (0)1527 517715 Fax +44 (0)1527 517700
London Office 50 Pall Mall London SW1Y 5JH Tel +44 (0)20 7930 2424Fax +44 (0)20 7930 3255
[email protected] www.gkn.com Registered in England No. 4191106
This annual report is available on our website.
Registrar Equiniti Aspect HouseSpencer RoadLancingWest SussexBN99 6DA
Tel 0871 384 2962* (+44 121 415 7039 from outside UK)
Fax 0871 384 2100 (+44 1903 833113 from outside UK)
www.equiniti.com www.shareview.co.uk
* Calls to this number cost 8p per minute plus network extras. Lines are open 8.30 am to 5.30 pm, Monday to Friday, excluding bank holidays.
Cautionary statement This annual report and accounts has been prepared for the members of GKN plc and should not be relied upon by any other party or for any other purpose. It contains forward looking statements which are made in good faith based on the information available at the time of its approval. It is believed that the expectations reflected in these statements are reasonable but they may be affected by a number of risks and uncertainties that are inherent in any forward looking statement which could cause actual results to differ materially from those currently anticipated. Nothing in this document should be regarded as a profits forecast.
Contact information

Financial Statements Other InformationGovernanceStrategic Report
01GKN plc Annual Report and Accounts 2014
Chief Executive’s reviewPage 16
Our strategic framework Page 08
Key performance indicators Page 14
GlobalfootprintPage 04
Chairman’s statement Page 06
ContentsSTRATEGIC REPORTGKN at a glance 022014 at a glance 03Global footprint 04Chairman’s statement 06Our strategic framework 08Our business model 10Our business model / Global markets 12Key performance indicators 14Chief Executive’s review 16Business review / Group performance 20Business review / GKN Aerospace 22Business review / GKN Driveline 26Business review / GKN Powder Metallurgy 30Business review / GKN Land Systems 34Business review / Other financial information 38Risk management 42Sustainability report 52
GOVERNANCEBoard of Directors 60Chairman’s introduction to governance 62Corporate governance 63Nominations Committee report 70Audit Committee report 72Directors’ remuneration report 78Additional information 99Statement of Directors’ responsibilities 102
FINANCIAL STATEMENTSIndependent auditors’ report (Group) 103Group financial statements 111Independent auditors’ report (Company) 158Company financial statements 160Group financial record 163
OTHER INFORMATIONKey subsidiaries and joint ventures 164Shareholder information 166Contact information IBC
Pages 60 to 102 comprise the Directors’ report.
02 GKN plc Annual Report and Accounts 2014
STRATEGIC REPORT
→ See pages 22 – 37 for more information on our divisions
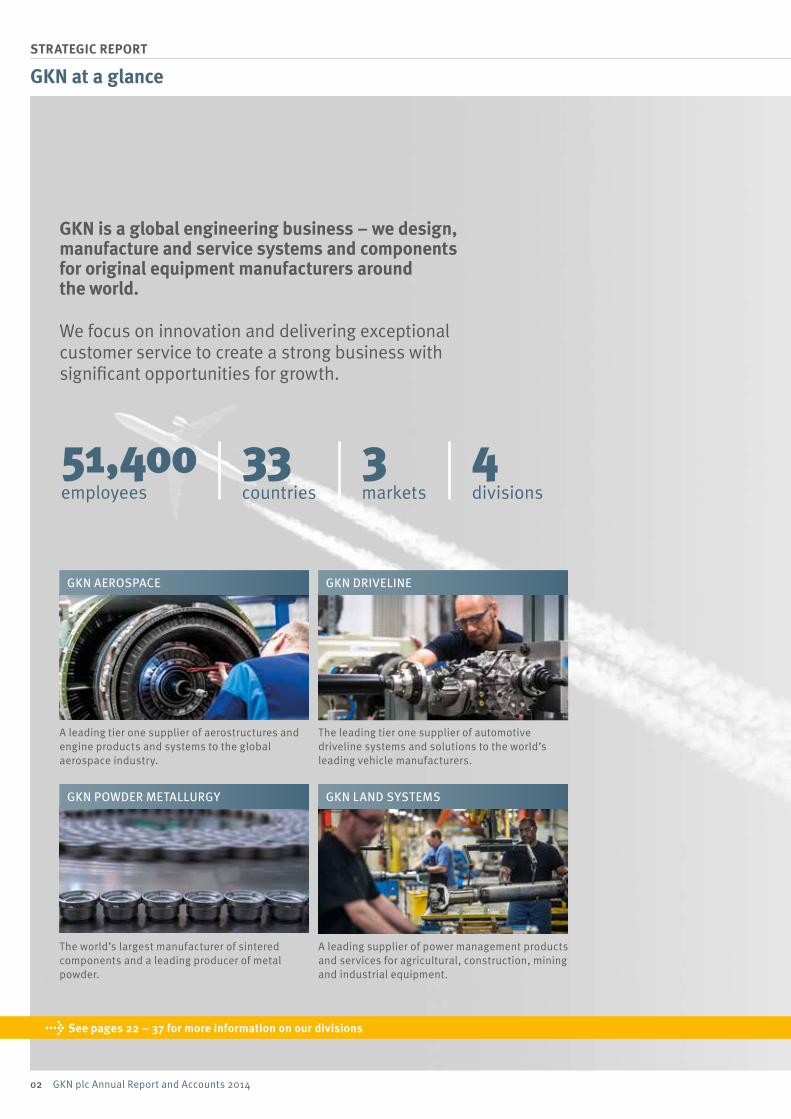
GKN is a global engineering business – we design, manufacture and service systems and components for original equipment manufacturers around the world.
We focus on innovation and delivering exceptional customer service to create a strong business with significant opportunities for growth.
51,400employees
33countries
3markets
4divisions
A leading tier one supplier of aerostructures and engine products and systems to the global aerospace industry.
The world’s largest manufacturer of sintered components and a leading producer of metal powder.
The leading tier one supplier of automotive driveline systems and solutions to the world’s leading vehicle manufacturers.
A leading supplier of power management products and services for agricultural, construction, mining and industrial equipment.
GKN at a glance
GKN DRIVELINEGKN AEROSPACE
GKN POWDER METALLURGY GKN LAND SYSTEMS
Financial Statements Other InformationGovernanceStrategic Report
03GKN plc Annual Report and Accounts 2014
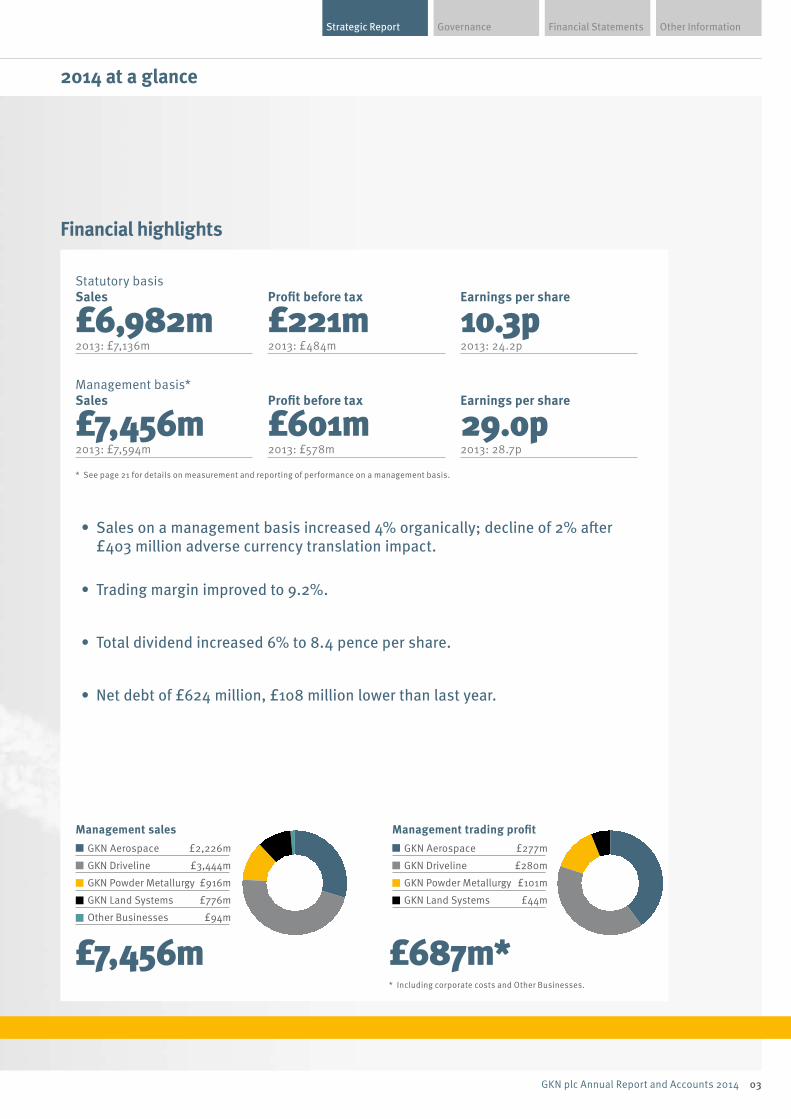
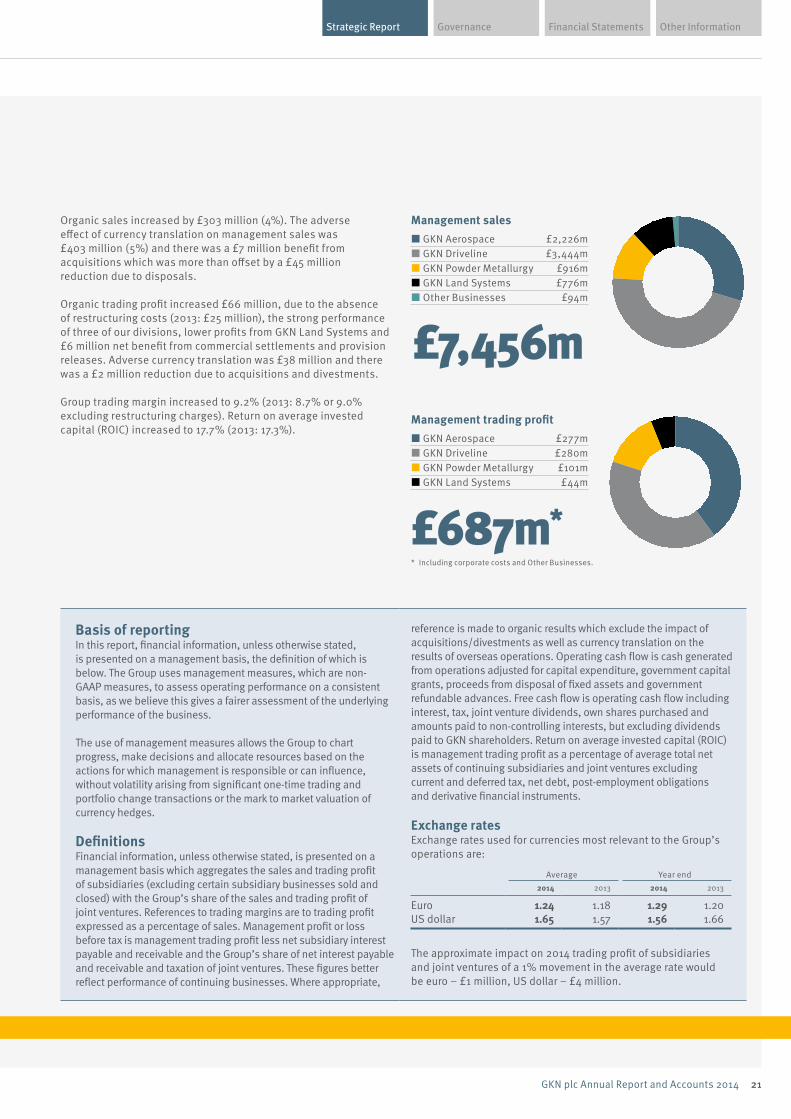
GKN Aerospace £2,226m
GKN Driveline £3,444m
GKN Powder Metallurgy £916m
GKN Land Systems £776m
Other Businesses £94m
Management salesGKN Aerospace £277m
GKN Driveline £280m
GKN Powder Metallurgy £101m
GKN Land Systems £44m
Management trading pro�t
2014 at a glance
Financial highlights
£687m*
Statutory basisSales Profit before tax Earnings per share
£6,982m £221m 10.3p2013: £7,136m 2013: £484m 2013: 24.2p
Management basis*Sales Profit before tax Earnings per share
£7,456m £601m 29.0p2013: £7,594m 2013: £578m 2013: 28.7p
* See page 21 for details on measurement and reporting of performance on a management basis.
£7,456m
• Sales on a management basis increased 4% organically; decline of 2% after £403 million adverse currency translation impact.
• Trading margin improved to 9.2%.
• Total dividend increased 6% to 8.4 pence per share.
• Net debt of £624 million, £108 million lower than last year.
* Including corporate costs and Other Businesses.
04 GKN plc Annual Report and Accounts 2014
STRATEGIC REPORT
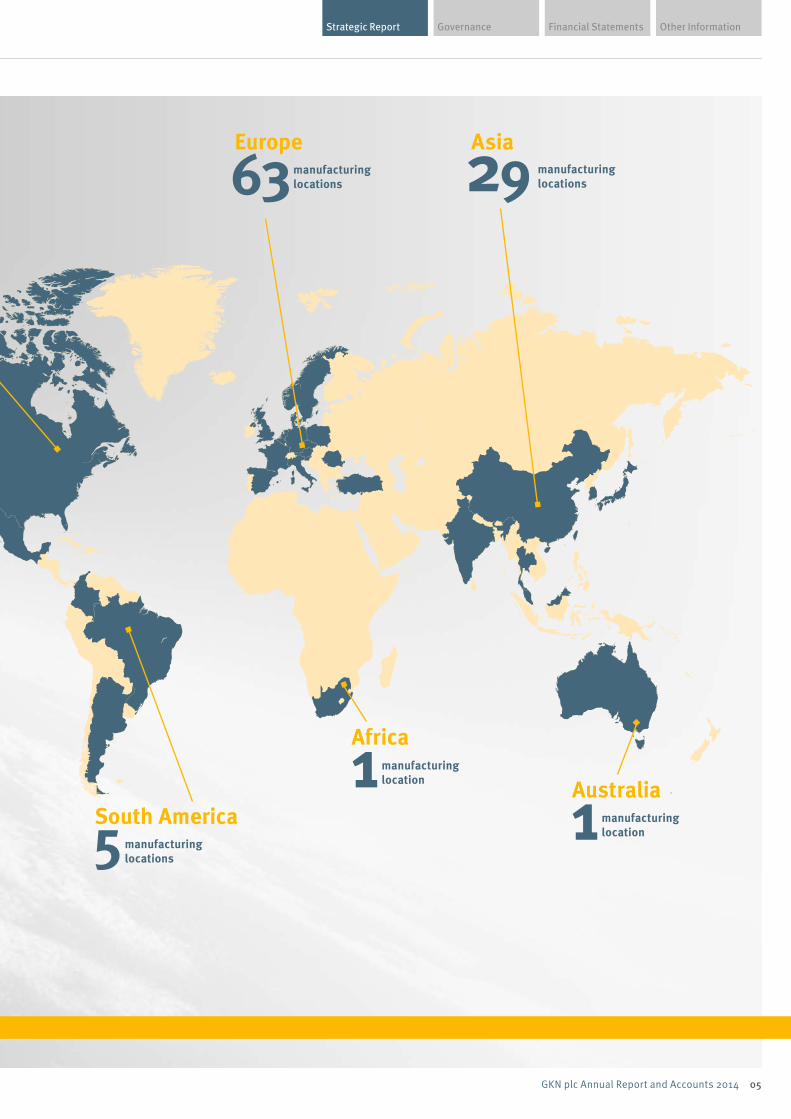
North America 63Asia
South America
1manufacturinglocation
1manufacturinglocations
Australia
Europe
Africa
1manufacturinglocation 5manufacturing
locations
5manufacturinglocations 29 manufacturing
locations
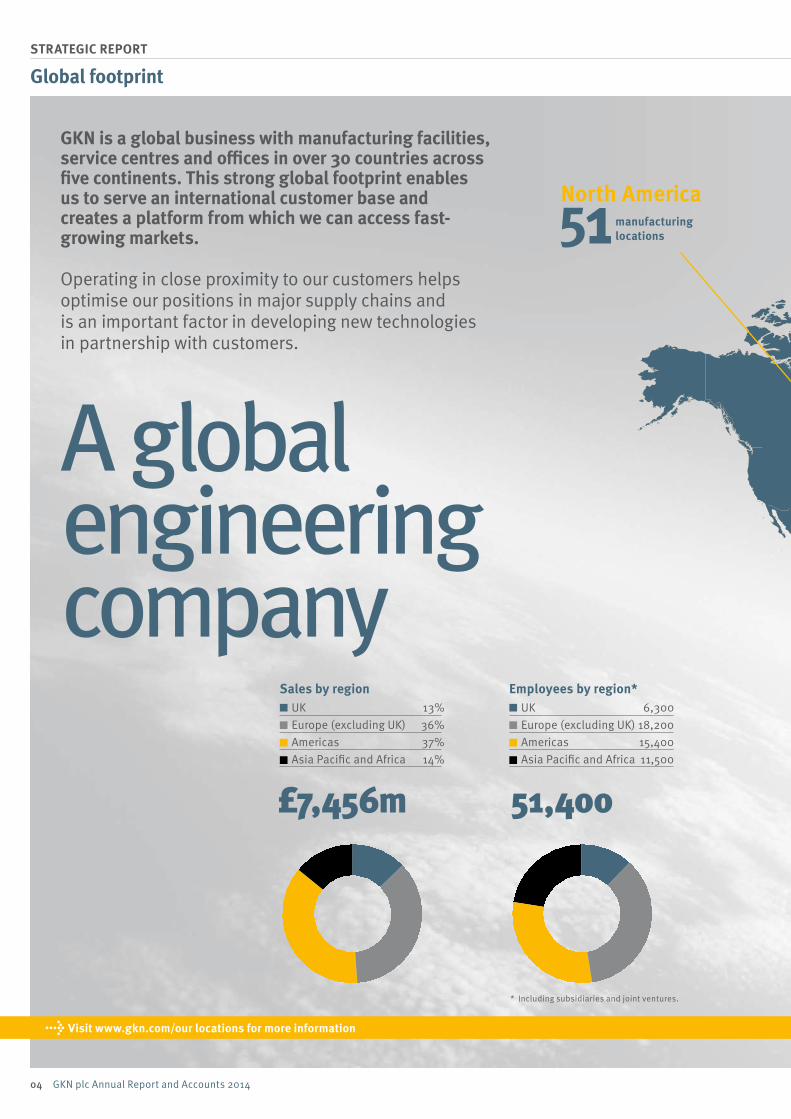
UK 13%Europe (excluding UK) 36%Americas 37%Asia Paci�c and Africa 14%
Sales by regionUK 6,300Europe (excluding UK) 18,200Americas 15,400Asia Paci�c and Africa 11,500
Employees by region*
→ Visit www.gkn.com/our locations for more information
Global footprint
GKN is a global business with manufacturing facilities, service centres and offices in over 30 countries across five continents. This strong global footprint enables us to serve an international customer base and creates a platform from which we can access fast-growing markets.
Operating in close proximity to our customers helps optimise our positions in major supply chains and is an important factor in developing new technologies in partnership with customers.
A global engineering company
£7,456m 51,400
* Including subsidiaries and joint ventures.
Financial Statements Other InformationGovernanceStrategic Report
05GKN plc Annual Report and Accounts 2014
North America 63Asia
South America
1manufacturinglocation
1manufacturinglocations
Australia
Europe
Africa
1manufacturinglocation 5manufacturing
locations
5manufacturinglocations 29 manufacturing
locations
06 GKN plc Annual Report and Accounts 2014
STRATEGIC REPORT
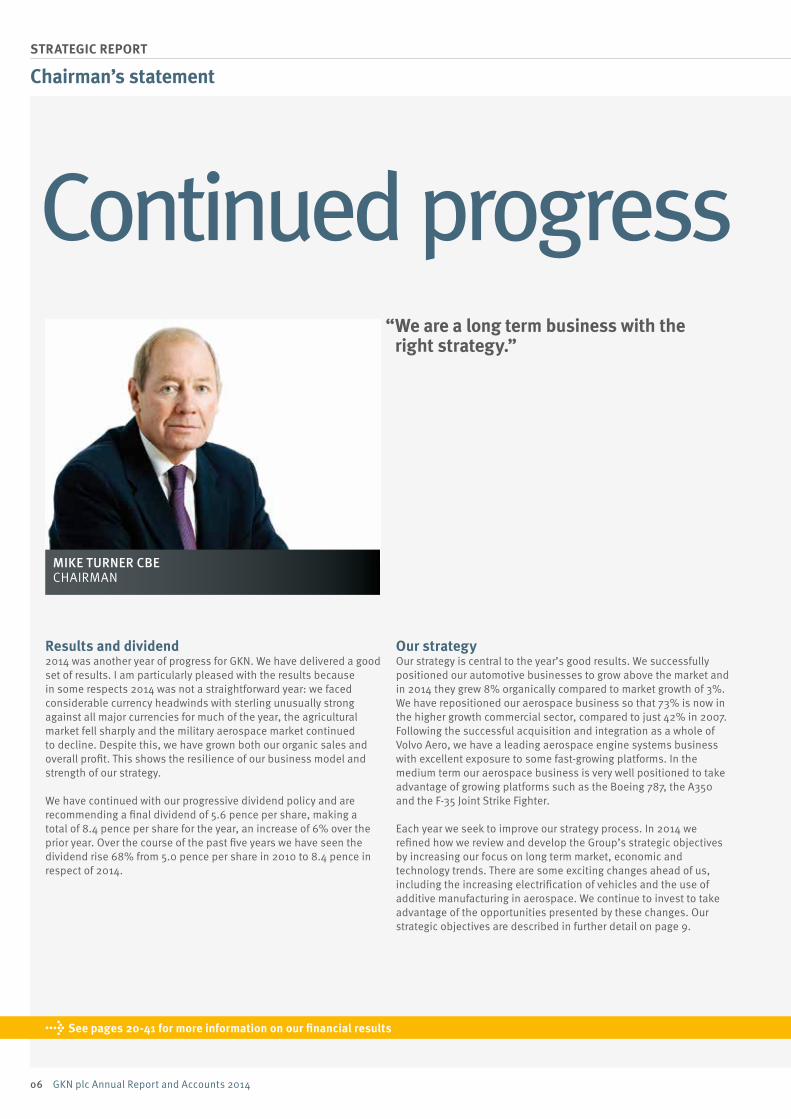
MIKE TURNER CBECHAIRMAN
→ See pages 20-41 for more information on our financial results
Chairman’s statement
Results and dividend2014 was another year of progress for GKN. We have delivered a good set of results. I am particularly pleased with the results because in some respects 2014 was not a straightforward year: we faced considerable currency headwinds with sterling unusually strong against all major currencies for much of the year, the agricultural market fell sharply and the military aerospace market continued to decline. Despite this, we have grown both our organic sales and overall profit. This shows the resilience of our business model and strength of our strategy.
We have continued with our progressive dividend policy and are recommending a final dividend of 5.6 pence per share, making a total of 8.4 pence per share for the year, an increase of 6% over the prior year. Over the course of the past five years we have seen the dividend rise 68% from 5.0 pence per share in 2010 to 8.4 pence in respect of 2014.
Continued progress
Our strategyOur strategy is central to the year’s good results. We successfully positioned our automotive businesses to grow above the market and in 2014 they grew 8% organically compared to market growth of 3%. We have repositioned our aerospace business so that 73% is now in the higher growth commercial sector, compared to just 42% in 2007. Following the successful acquisition and integration as a whole of Volvo Aero, we have a leading aerospace engine systems business with excellent exposure to some fast-growing platforms. In the medium term our aerospace business is very well positioned to take advantage of growing platforms such as the Boeing 787, the A350 and the F-35 Joint Strike Fighter.
Each year we seek to improve our strategy process. In 2014 we refined how we review and develop the Group’s strategic objectives by increasing our focus on long term market, economic and technology trends. There are some exciting changes ahead of us, including the increasing electrification of vehicles and the use of additive manufacturing in aerospace. We continue to invest to take advantage of the opportunities presented by these changes. Our strategic objectives are described in further detail on page 9.
“ We are a long term business with the right strategy.”
Financial Statements Other InformationGovernanceStrategic Report
07GKN plc Annual Report and Accounts 2014
We did not make any major acquisitions in 2014, taking a disciplined approach to potential opportunities and choosing to focus on thoroughly integrating our engine systems business following the acquisition of Volvo Aero in 2012. During 2014 we were awarded investment grade status with all three of the major rating agencies and continued to pay down our debt. We are now in a strong position to make further acquisitions, but will continue to take a focused approach.
Sustainability and riskGKN has a long history of behaving ethically; of doing the right thing. We recognise that we continuously need to ensure that we set the right tone from the top and engage with our people to ensure that they understand the behaviours that we expect of them. For this reason we revised the GKN Code during 2014, making it clearer and more engaging, and updating it to bring additional focus to areas such as diversity and inclusion, and quality. We have also strengthened our diversity and inclusion programme, which is visibly supported by the Board, and we have worked hard to improve quality and product safety through the ‘Voice of the Customer’ initiative described by Nigel on page 18.
We have well developed risk management processes, but are not complacent and note the emphasis on risk management in the revised 2014 UK Corporate Governance Code. We continue to work to improve our risk management processes and control systems. We have described our work in this area in greater detail on pages 42-51.
The BoardAdam Walker joined the Board at the start of 2014 and quickly became an effective member of the team. I am confident that he will be an asset to the Company. On 31 December 2014 Marcus Bryson CBE retired from his role as Chief Executive Aerospace and Land Systems and from the Board. Marcus joined GKN in 1994 and since then his contribution to the creation of the GKN we see today, and in particular our aerospace division, has been significant. He fully deserves the CBE recently awarded for his contribution to the UK aerospace industry. We have not replaced Marcus on the Board for now and have chosen instead to strengthen the Executive Committee with the appointment of Kevin Cummings, CEO GKN Aerospace, Peter Oberparleiter, CEO GKN Powder Metallurgy, and Philip Swash, CEO GKN Land Systems. They will regularly attend Board meetings to
ensure that the Board continues to have a good feel for what is happening in each division. The Board has real diversity of experience and technical expertise, and the Board dynamic continues to be excellent with all Directors making a valuable contribution.
Our peopleMeeting a wide range of customer expectations is never easy, but GKN’s culture is to persevere and through the commitment of our people we have delivered a good set of results. They have again demonstrated GKN’s resilience and ability to grow above the market. I would like to take this opportunity to thank them for all that they have done.
I have written in the past about a pressing need for a global talent pool that is well stocked with young people with the necessary scientific and mathematical skills. That remains the case and I am glad to report that around the world GKN continues to engage in hundreds of local initiatives designed to encourage young people to choose engineering as a possible future career.
Looking forwardAs we enter 2015, political and economic uncertainty will continue to affect GKN. But we are a long term business with the right strategy. I am therefore confident that the Group will continue to grow and generate sustainable returns for our shareholders during 2015 and beyond.
Mike Turner CBEChairman
08 GKN plc Annual Report and Accounts 2014
STRATEGIC REPORT
→ See pages 10 – 11 for more information on our business model
Our strategic framework
We aim to create long term and sustainable shareholder value in the form of steadily growing earnings and dividends through the delivery of growth in sales, rising profitability and increasing return on invested capital.
We have excellent positions in long term global growth markets and build strong relationships with international original equipment manufacturers (OEMs) and prime contractors. To create value we have five strategic objectives.
Creating sustainable value
Financial Statements Other InformationGovernanceStrategic Report
09GKN plc Annual Report and Accounts 2014
LEVERAGING A STRONG GLOBAL
PRESENCE
2
1LEADING IN OUR
CHOSEN MARKETS
DRIVING OPERATIONAL EXCELLENCE
4
5SUSTAINING ABOVE MARKET GROWTH
DIFFERENTIATING OURSELVESTHROUGH
TECHNOLOGY
3DELIVERING
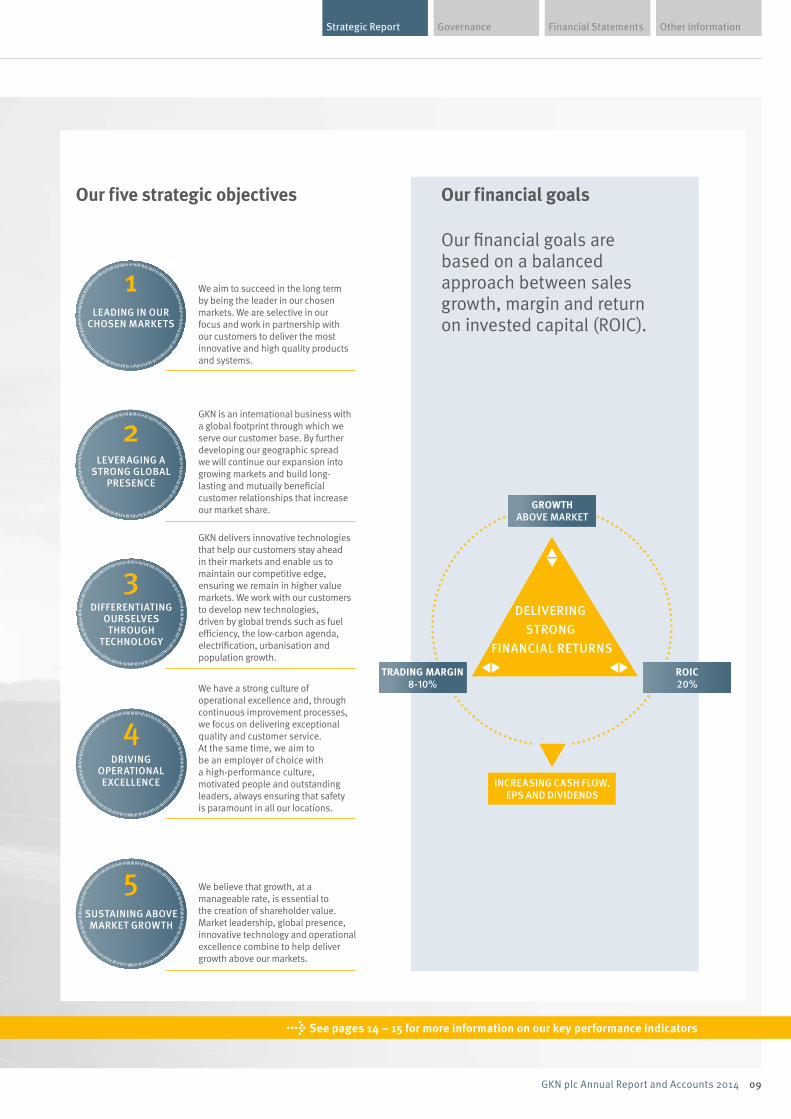
STRONG FINANCIAL RETURNS
TRADING MARGIN8-10%
GROWTHABOVE MARKET
INCREASING CASH FLOW,EPS AND DIVIDENDS
ROIC20%
→ See pages 14 – 15 for more information on our key performance indicators
Our financial goals are based on a balanced approach between sales growth, margin and return on invested capital (ROIC).
Our five strategic objectives
We aim to succeed in the long term by being the leader in our chosen markets. We are selective in our focus and work in partnership with our customers to deliver the most innovative and high quality products and systems.
GKN is an international business with a global footprint through which we serve our customer base. By further developing our geographic spread we will continue our expansion into growing markets and build long-lasting and mutually beneficial customer relationships that increase our market share.
We believe that growth, at a manageable rate, is essential to the creation of shareholder value. Market leadership, global presence, innovative technology and operational excellence combine to help deliver growth above our markets.
We have a strong culture of operational excellence and, through continuous improvement processes, we focus on delivering exceptional quality and customer service. At the same time, we aim to be an employer of choice with a high-performance culture, motivated people and outstanding leaders, always ensuring that safety is paramount in all our locations.
GKN delivers innovative technologies that help our customers stay ahead in their markets and enable us to maintain our competitive edge, ensuring we remain in higher value markets. We work with our customers to develop new technologies, driven by global trends such as fuel efficiency, the low-carbon agenda, electrification, urbanisation and population growth.
Our financial goals
10 GKN plc Annual Report and Accounts 2014
STRATEGIC REPORT
→ See pages 8 – 9 for more information on our strategic framework
Our business model
Our business model supports our strategy to create long term and sustainable value for shareholders. It highlights how we combine our advanced engineering value chain in global markets with our strong core competencies and clear values.
Our business modelStrong core competencies GKN’s extensive industry know-how, engineering capability and strong customer relationships are central to our value chain and ensure we are well positioned to sustain above market growth and deliver strong financial returns.
Industry know-howUnderstanding our markets and working closely with our customers, academic institutions and government agencies to identify future technology requirements gives us the expertise to deliver market-leading solutions and provides continued opportunities for sustainable growth.
Engineering capabilityWe are committed to developing and maintaining a diverse range of engineering talent across the Group and continually investing in technology to enable the efficient design and delivery of high quality, innovative solutions.
Strong customer relationshipsWe work in partnership with our customers, wherever they are in the world, to deliver customer-valued innovation and exceptional service. Listening to feedback and constantly striving to improve our products and processes helps us build and maintain these strong relationships.
Financial Statements Other InformationGovernanceStrategic Report
11GKN plc Annual Report and Accounts 2014
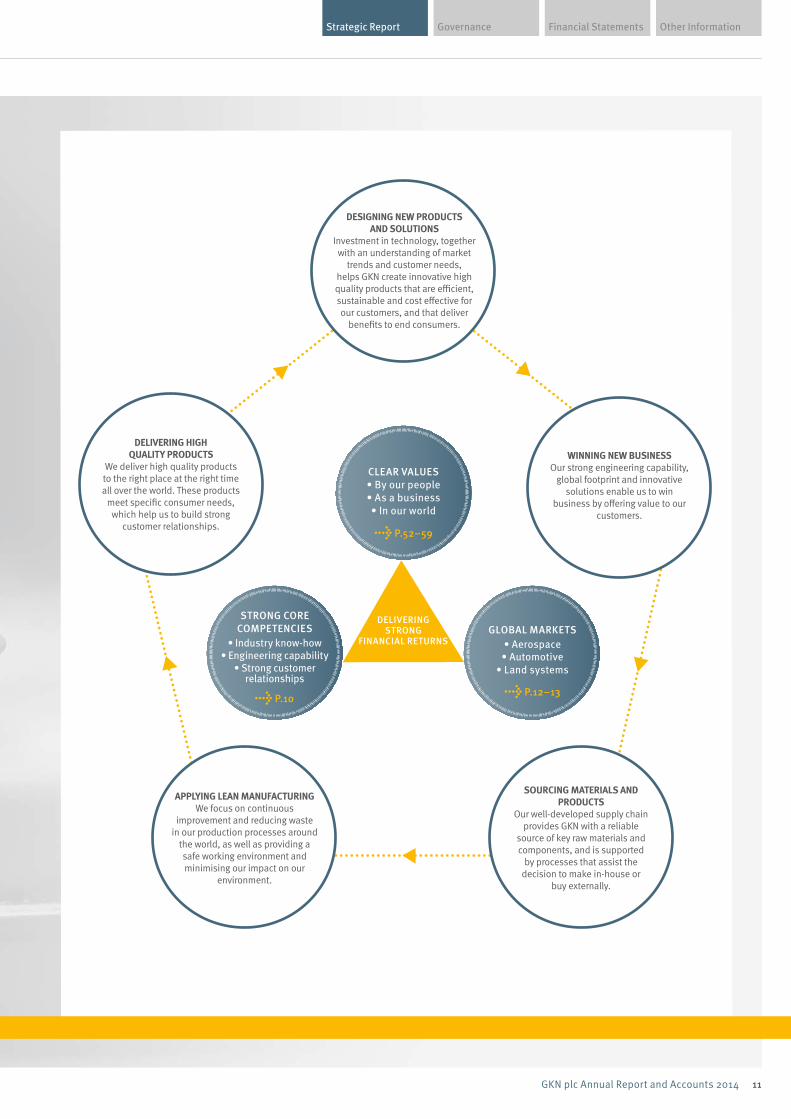
STRONG CORE COMPETENCIES
• Industry know-how• Engineering capability
• Strong customer relationships
GLOBAL MARKETS• Aerospace• Automotive
• Land systems
CLEAR VALUES• By our people• As a business• In our world
→ P.52–59
DELIVERING STRONG
FINANCIAL RETURNS
→ P.10 → P.12–13
DESIGNING NEW PRODUCTS AND SOLUTIONS
Investment in technology, together with an understanding of market
trends and customer needs, helps GKN create innovative high quality products that are efficient, sustainable and cost effective for our customers, and that deliver
benefits to end consumers.
WINNING NEW BUSINESSOur strong engineering capability,
global footprint and innovative solutions enable us to win
business by offering value to our customers.
SOURCING MATERIALS AND PRODUCTS
Our well-developed supply chain provides GKN with a reliable
source of key raw materials and components, and is supported
by processes that assist the decision to make in-house or
buy externally.
APPLYING LEAN MANUFACTURINGWe focus on continuous
improvement and reducing waste in our production processes around
the world, as well as providing a safe working environment and minimising our impact on our
environment.
DELIVERING HIGH QUALITY PRODUCTS
We deliver high quality products to the right place at the right time all over the world. These products
meet specific consumer needs, which help us to build strong
customer relationships.
12 GKN plc Annual Report and Accounts 2014
STRATEGIC REPORT
GLOBAL MARKETS• Aerospace
• Automotive • Land systems
→ See pages 24, 28 and 36 for more information on our markets
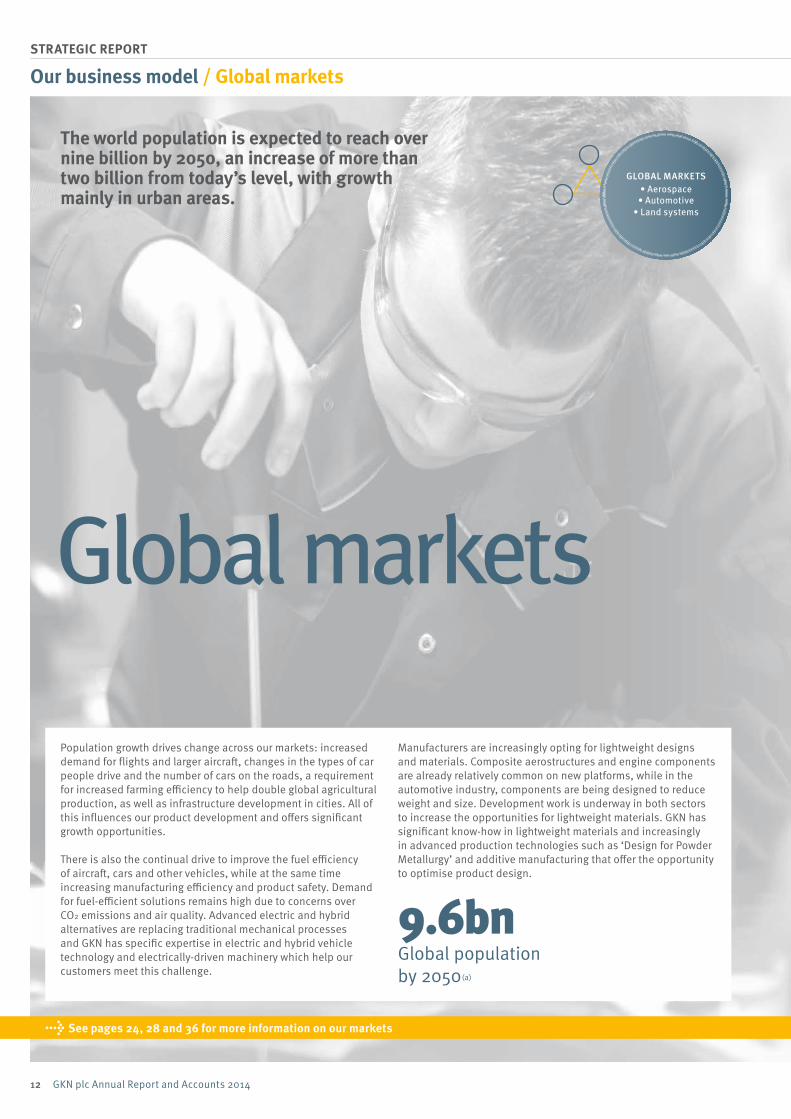
The world population is expected to reach over nine billion by 2050, an increase of more than two billion from today’s level, with growth mainly in urban areas.
Our business model / Global markets
Population growth drives change across our markets: increased demand for flights and larger aircraft, changes in the types of car people drive and the number of cars on the roads, a requirement for increased farming efficiency to help double global agricultural production, as well as infrastructure development in cities. All of this influences our product development and offers significant growth opportunities.
There is also the continual drive to improve the fuel efficiency of aircraft, cars and other vehicles, while at the same time increasing manufacturing efficiency and product safety. Demand for fuel-efficient solutions remains high due to concerns over CO2 emissions and air quality. Advanced electric and hybrid alternatives are replacing traditional mechanical processes and GKN has specific expertise in electric and hybrid vehicle technology and electrically-driven machinery which help our customers meet this challenge.
Manufacturers are increasingly opting for lightweight designs and materials. Composite aerostructures and engine components are already relatively common on new platforms, while in the automotive industry, components are being designed to reduce weight and size. Development work is underway in both sectors to increase the opportunities for lightweight materials. GKN has significant know-how in lightweight materials and increasingly in advanced production technologies such as ‘Design for Powder Metallurgy’ and additive manufacturing that offer the opportunity to optimise product design.
9.6bn Global population by 2050(a)
Global markets
Financial Statements Other InformationGovernanceStrategic Report
13GKN plc Annual Report and Accounts 2014
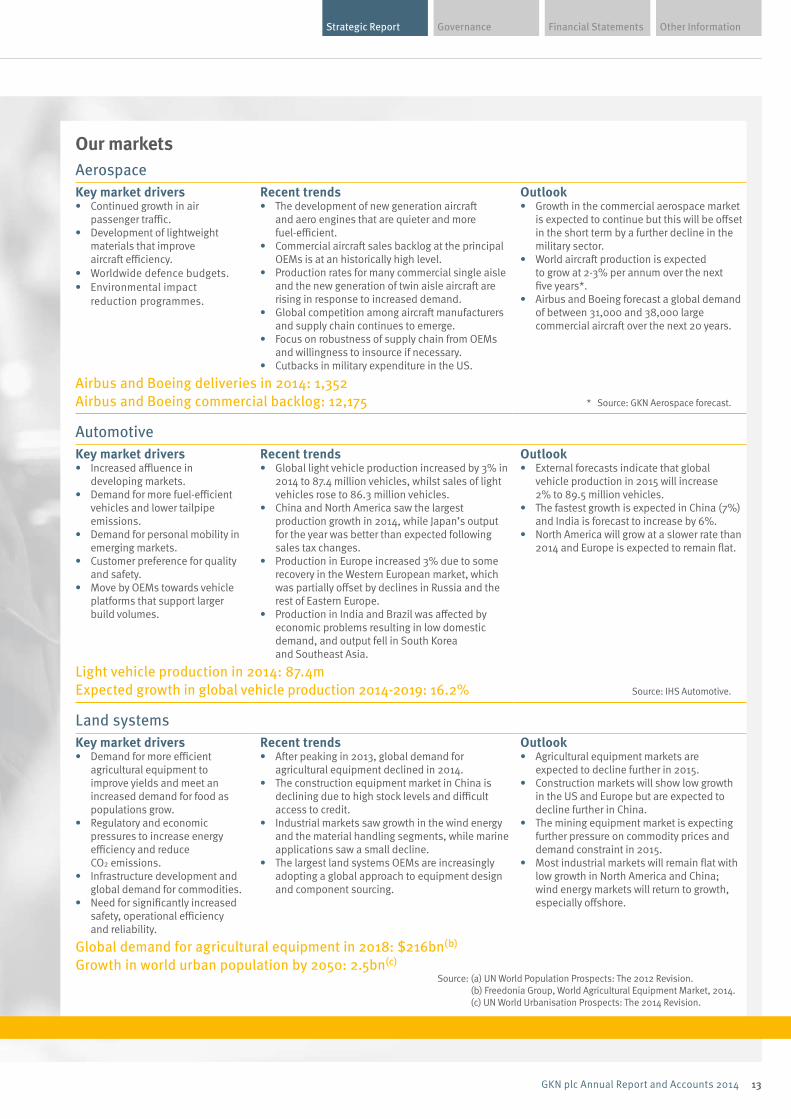
Our marketsAerospaceKey market drivers• Continued growth in air
passenger traffic.• Development of lightweight
materials that improve aircraft efficiency.
• Worldwide defence budgets.• Environmental impact
reduction programmes.
Recent trends• The development of new generation aircraft
and aero engines that are quieter and more fuel-efficient.
• Commercial aircraft sales backlog at the principal OEMs is at an historically high level.
• Production rates for many commercial single aisle and the new generation of twin aisle aircraft are rising in response to increased demand.
• Global competition among aircraft manufacturers and supply chain continues to emerge.
• Focus on robustness of supply chain from OEMs and willingness to insource if necessary.
• Cutbacks in military expenditure in the US.
Outlook• Growth in the commercial aerospace market
is expected to continue but this will be offset in the short term by a further decline in the military sector.
• World aircraft production is expected to grow at 2-3% per annum over the next five years*.
• Airbus and Boeing forecast a global demand of between 31,000 and 38,000 large commercial aircraft over the next 20 years.
Airbus and Boeing deliveries in 2014: 1,352 Airbus and Boeing commercial backlog: 12,175 * Source: GKN Aerospace forecast.
AutomotiveKey market drivers• Increased affluence in
developing markets.• Demand for more fuel-efficient
vehicles and lower tailpipe emissions.
• Demand for personal mobility in emerging markets.
• Customer preference for quality and safety.
• Move by OEMs towards vehicle platforms that support larger build volumes.
Recent trends• Global light vehicle production increased by 3% in
2014 to 87.4 million vehicles, whilst sales of light vehicles rose to 86.3 million vehicles.
• China and North America saw the largest production growth in 2014, while Japan’s output for the year was better than expected following sales tax changes.
• Production in Europe increased 3% due to some recovery in the Western European market, which was partially offset by declines in Russia and the rest of Eastern Europe.
• Production in India and Brazil was affected by economic problems resulting in low domestic demand, and output fell in South Korea and Southeast Asia.
Outlook• External forecasts indicate that global
vehicle production in 2015 will increase 2% to 89.5 million vehicles.
• The fastest growth is expected in China (7%) and India is forecast to increase by 6%.
• North America will grow at a slower rate than 2014 and Europe is expected to remain flat.
Light vehicle production in 2014: 87.4mExpected growth in global vehicle production 2014-2019: 16.2% Source: IHS Automotive.
Land systemsKey market drivers• Demand for more efficient
agricultural equipment to improve yields and meet an increased demand for food as populations grow.
• Regulatory and economic pressures to increase energy efficiency and reduce CO2 emissions.
• Infrastructure development and global demand for commodities.
• Need for significantly increased safety, operational efficiency and reliability.
Recent trends • After peaking in 2013, global demand for
agricultural equipment declined in 2014.• The construction equipment market in China is
declining due to high stock levels and difficult access to credit.
• Industrial markets saw growth in the wind energy and the material handling segments, while marine applications saw a small decline.
• The largest land systems OEMs are increasingly adopting a global approach to equipment design and component sourcing.
Outlook• Agricultural equipment markets are
expected to decline further in 2015.• Construction markets will show low growth
in the US and Europe but are expected to decline further in China.
• The mining equipment market is expecting further pressure on commodity prices and demand constraint in 2015.
• Most industrial markets will remain flat with low growth in North America and China; wind energy markets will return to growth, especially offshore.
Global demand for agricultural equipment in 2018: $216bn(b)
Growth in world urban population by 2050: 2.5bn(c)
Source: (a) UN World Population Prospects: The 2012 Revision. (b) Freedonia Group, World Agricultural Equipment Market, 2014. (c) UN World Urbanisation Prospects: The 2014 Revision.
14 GKN plc Annual Report and Accounts 2014
STRATEGIC REPORT
2014
2013
2012
2011
2010
£7,456m
£7,594m
£6,904m
£6,112m
£5,429m
2014
2013
2012
2011
2010
29.0p
28.7p
26.3p
22.6p
20.7p
8.4p
7.9p
7.2p
6.0p
5.0p
2014
2013
2012
2011
2010
9.2%
8.7%
8.0%
7.7%
7.6%
17.7%
17.3%
18.0%
18.3%
17.0%
2014
2013
2012
2011
2010
£234m
£346m
£225m
£147m
£188m
2014
2013
2012
2011
2010
2014
2013
2012
2011
2010
2014
2013
2012
[00]
3.2%
3.1%
DELIVERING STRONG
FINANCIAL RETURNS
TRADING MARGIN8-10%
GROWTHABOVE MARKET
INCREASING CASH FLOW,EPS AND DIVIDENDS
ROIC20%
→ See pages 20 – 41 for more information on our financial results
Key performance indicators
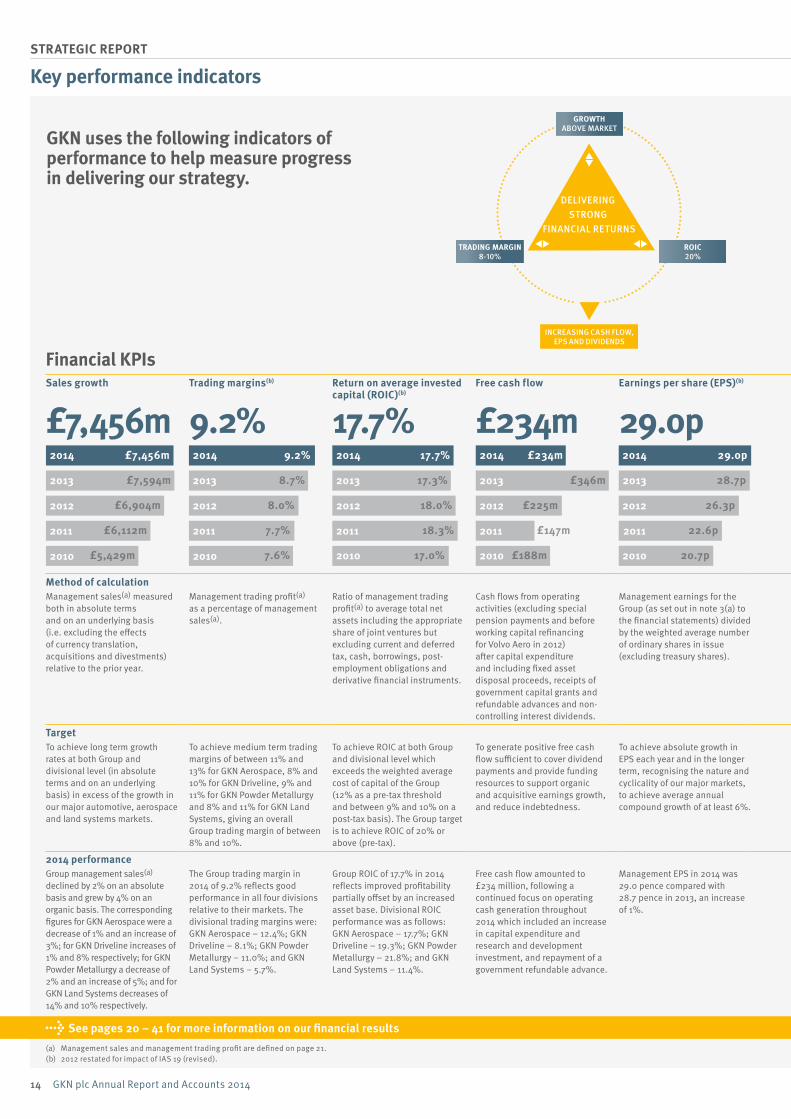
GKN uses the following indicators of performance to help measure progress in delivering our strategy.
Financial KPIsSales growth Trading margins(b) Return on average invested
capital (ROIC)(b) Free cash flow Earnings per share (EPS)(b) Dividend per share
£7,456m 9.2% 17.7% £234m 29.0p 8.4p
Method of calculation Management sales(a) measured both in absolute terms and on an underlying basis (i.e. excluding the effects of currency translation, acquisitions and divestments) relative to the prior year.
Management trading profit(a) as a percentage of management sales(a).
Ratio of management trading profit(a) to average total net assets including the appropriate share of joint ventures but excluding current and deferred tax, cash, borrowings, post-employment obligations and derivative financial instruments.
Cash flows from operating activities (excluding special pension payments and before working capital refinancing for Volvo Aero in 2012) after capital expenditure and including fixed asset disposal proceeds, receipts of government capital grants and refundable advances and non-controlling interest dividends.
Management earnings for the Group (as set out in note 3(a) to the financial statements) divided by the weighted average number of ordinary shares in issue (excluding treasury shares).
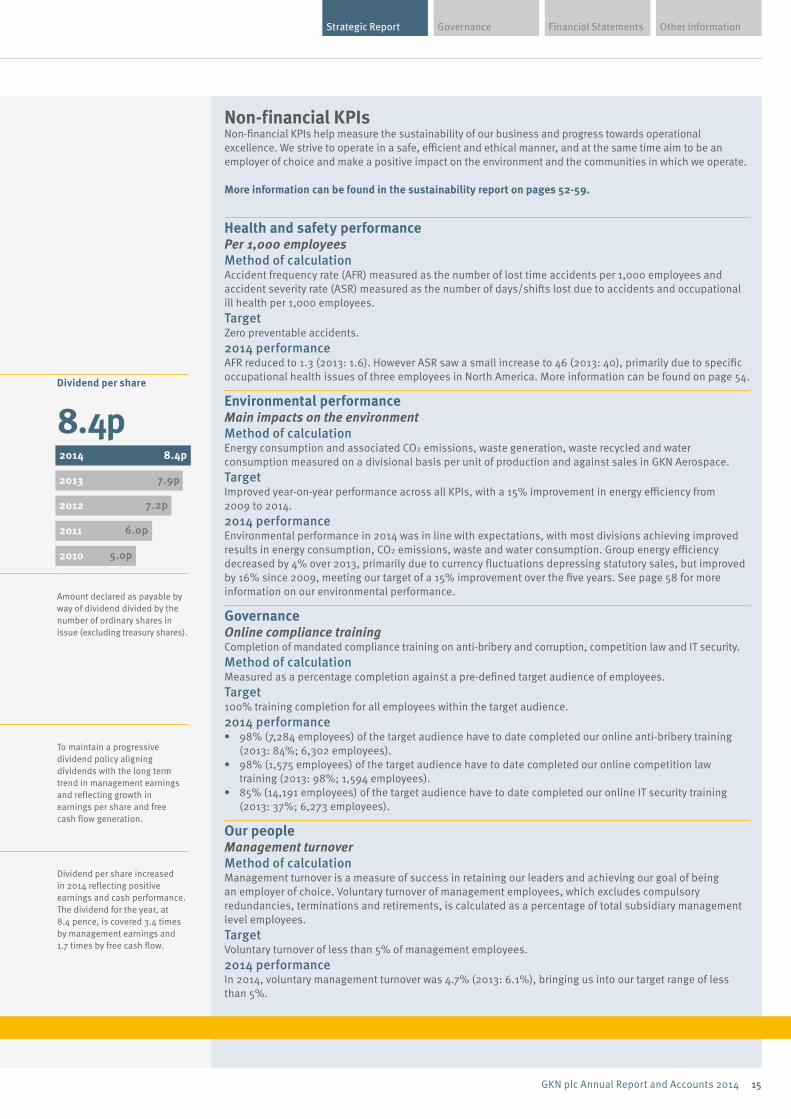
Amount declared as payable by way of dividend divided by the number of ordinary shares in issue (excluding treasury shares).
Target To achieve long term growth rates at both Group and divisional level (in absolute terms and on an underlying basis) in excess of the growth in our major automotive, aerospace and land systems markets.
To achieve medium term trading margins of between 11% and 13% for GKN Aerospace, 8% and 10% for GKN Driveline, 9% and 11% for GKN Powder Metallurgy and 8% and 11% for GKN Land Systems, giving an overall Group trading margin of between 8% and 10%.
To achieve ROIC at both Group and divisional level which exceeds the weighted average cost of capital of the Group (12% as a pre-tax threshold and between 9% and 10% on a post-tax basis). The Group target is to achieve ROIC of 20% or above (pre-tax).
To generate positive free cash flow sufficient to cover dividend payments and provide funding resources to support organic and acquisitive earnings growth, and reduce indebtedness.
To achieve absolute growth in EPS each year and in the longer term, recognising the nature and cyclicality of our major markets, to achieve average annual compound growth of at least 6%.
To maintain a progressive dividend policy aligning dividends with the long term trend in management earnings and reflecting growth in earnings per share and free cash flow generation.
2014 performance Group management sales(a) declined by 2% on an absolute basis and grew by 4% on an organic basis. The corresponding figures for GKN Aerospace were a decrease of 1% and an increase of 3%; for GKN Driveline increases of 1% and 8% respectively; for GKN Powder Metallurgy a decrease of 2% and an increase of 5%; and for GKN Land Systems decreases of 14% and 10% respectively.
The Group trading margin in 2014 of 9.2% reflects good performance in all four divisions relative to their markets. The divisional trading margins were: GKN Aerospace – 12.4%; GKN Driveline – 8.1%; GKN Powder Metallurgy – 11.0%; and GKN Land Systems – 5.7%.
Group ROIC of 17.7% in 2014 reflects improved profitability partially offset by an increased asset base. Divisional ROIC performance was as follows: GKN Aerospace – 17.7%; GKN Driveline – 19.3%; GKN Powder Metallurgy – 21.8%; and GKN Land Systems – 11.4%.
Free cash flow amounted to £234 million, following a continued focus on operating cash generation throughout 2014 which included an increase in capital expenditure and research and development investment, and repayment of a government refundable advance.
Management EPS in 2014 was 29.0 pence compared with 28.7 pence in 2013, an increase of 1%.
Dividend per share increased in 2014 reflecting positive earnings and cash performance. The dividend for the year, at 8.4 pence, is covered 3.4 times by management earnings and 1.7 times by free cash flow.
(a) Management sales and management trading profit are defined on page 21. (b) 2012 restated for impact of IAS 19 (revised).
Financial Statements Other InformationGovernanceStrategic Report
15GKN plc Annual Report and Accounts 2014
2014
2013
2012
2011
2010
£7,456m
£7,594m
£6,904m
£6,112m
£5,429m
2014
2013
2012
2011
2010
29.0p
28.7p
26.3p
22.6p
20.7p
8.4p
7.9p
7.2p
6.0p
5.0p
2014
2013
2012
2011
2010
9.2%
8.7%
8.0%
7.7%
7.6%
17.7%
17.3%
18.0%
18.3%
17.0%
2014
2013
2012
2011
2010
£234m
£346m
£225m
£147m
£188m
2014
2013
2012
2011
2010
2014
2013
2012
2011
2010
2014
2013
2012
[00]
3.2%
3.1%
Non-financial KPIsNon-financial KPIs help measure the sustainability of our business and progress towards operational excellence. We strive to operate in a safe, efficient and ethical manner, and at the same time aim to be an employer of choice and make a positive impact on the environment and the communities in which we operate.
More information can be found in the sustainability report on pages 52-59.
Health and safety performance Per 1,000 employees Method of calculation Accident frequency rate (AFR) measured as the number of lost time accidents per 1,000 employees and accident severity rate (ASR) measured as the number of days/shifts lost due to accidents and occupational ill health per 1,000 employees. TargetZero preventable accidents. 2014 performance AFR reduced to 1.3 (2013: 1.6). However ASR saw a small increase to 46 (2013: 40), primarily due to specific occupational health issues of three employees in North America. More information can be found on page 54.
Environmental performance Main impacts on the environment Method of calculation Energy consumption and associated CO2 emissions, waste generation, waste recycled and water consumption measured on a divisional basis per unit of production and against sales in GKN Aerospace. Target Improved year-on-year performance across all KPIs, with a 15% improvement in energy efficiency from 2009 to 2014. 2014 performance Environmental performance in 2014 was in line with expectations, with most divisions achieving improved results in energy consumption, CO2 emissions, waste and water consumption. Group energy efficiency decreased by 4% over 2013, primarily due to currency fluctuations depressing statutory sales, but improved by 16% since 2009, meeting our target of a 15% improvement over the five years. See page 58 for more information on our environmental performance.
Governance Online compliance trainingCompletion of mandated compliance training on anti-bribery and corruption, competition law and IT security.Method of calculation Measured as a percentage completion against a pre-defined target audience of employees.Target 100% training completion for all employees within the target audience. 2014 performance • 98% (7,284 employees) of the target audience have to date completed our online anti-bribery training
(2013: 84%; 6,302 employees).• 98% (1,575 employees) of the target audience have to date completed our online competition law
training (2013: 98%; 1,594 employees).• 85% (14,191 employees) of the target audience have to date completed our online IT security training
(2013: 37%; 6,273 employees).
Our people Management turnover Method of calculation Management turnover is a measure of success in retaining our leaders and achieving our goal of being an employer of choice. Voluntary turnover of management employees, which excludes compulsory redundancies, terminations and retirements, is calculated as a percentage of total subsidiary management level employees. TargetVoluntary turnover of less than 5% of management employees.2014 performanceIn 2014, voluntary management turnover was 4.7% (2013: 6.1%), bringing us into our target range of less than 5%.
Financial KPIsSales growth Trading margins(b) Return on average invested
capital (ROIC)(b) Free cash flow Earnings per share (EPS)(b) Dividend per share
£7,456m 9.2% 17.7% £234m 29.0p 8.4p
Method of calculation Management sales(a) measured both in absolute terms and on an underlying basis (i.e. excluding the effects of currency translation, acquisitions and divestments) relative to the prior year.
Management trading profit(a) as a percentage of management sales(a).
Ratio of management trading profit(a) to average total net assets including the appropriate share of joint ventures but excluding current and deferred tax, cash, borrowings, post-employment obligations and derivative financial instruments.
Cash flows from operating activities (excluding special pension payments and before working capital refinancing for Volvo Aero in 2012) after capital expenditure and including fixed asset disposal proceeds, receipts of government capital grants and refundable advances and non-controlling interest dividends.
Management earnings for the Group (as set out in note 3(a) to the financial statements) divided by the weighted average number of ordinary shares in issue (excluding treasury shares).
Amount declared as payable by way of dividend divided by the number of ordinary shares in issue (excluding treasury shares).
Target To achieve long term growth rates at both Group and divisional level (in absolute terms and on an underlying basis) in excess of the growth in our major automotive, aerospace and land systems markets.
To achieve medium term trading margins of between 11% and 13% for GKN Aerospace, 8% and 10% for GKN Driveline, 9% and 11% for GKN Powder Metallurgy and 8% and 11% for GKN Land Systems, giving an overall Group trading margin of between 8% and 10%.
To achieve ROIC at both Group and divisional level which exceeds the weighted average cost of capital of the Group (12% as a pre-tax threshold and between 9% and 10% on a post-tax basis). The Group target is to achieve ROIC of 20% or above (pre-tax).
To generate positive free cash flow sufficient to cover dividend payments and provide funding resources to support organic and acquisitive earnings growth, and reduce indebtedness.
To achieve absolute growth in EPS each year and in the longer term, recognising the nature and cyclicality of our major markets, to achieve average annual compound growth of at least 6%.
To maintain a progressive dividend policy aligning dividends with the long term trend in management earnings and reflecting growth in earnings per share and free cash flow generation.
2014 performance Group management sales(a) declined by 2% on an absolute basis and grew by 4% on an organic basis. The corresponding figures for GKN Aerospace were a decrease of 1% and an increase of 3%; for GKN Driveline increases of 1% and 8% respectively; for GKN Powder Metallurgy a decrease of 2% and an increase of 5%; and for GKN Land Systems decreases of 14% and 10% respectively.
The Group trading margin in 2014 of 9.2% reflects good performance in all four divisions relative to their markets. The divisional trading margins were: GKN Aerospace – 12.4%; GKN Driveline – 8.1%; GKN Powder Metallurgy – 11.0%; and GKN Land Systems – 5.7%.
Group ROIC of 17.7% in 2014 reflects improved profitability partially offset by an increased asset base. Divisional ROIC performance was as follows: GKN Aerospace – 17.7%; GKN Driveline – 19.3%; GKN Powder Metallurgy – 21.8%; and GKN Land Systems – 11.4%.
Free cash flow amounted to £234 million, following a continued focus on operating cash generation throughout 2014 which included an increase in capital expenditure and research and development investment, and repayment of a government refundable advance.
Management EPS in 2014 was 29.0 pence compared with 28.7 pence in 2013, an increase of 1%.
Dividend per share increased in 2014 reflecting positive earnings and cash performance. The dividend for the year, at 8.4 pence, is covered 3.4 times by management earnings and 1.7 times by free cash flow.
(a) Management sales and management trading profit are defined on page 21. (b) 2012 restated for impact of IAS 19 (revised).
16 GKN plc Annual Report and Accounts 2014
STRATEGIC REPORT
→ See pages 20 – 41 for more information on our financial results
Chief Executive’s review
The Group continued its progress in 2014 helped by good growth in our automotive and aerospace businesses which more than offset the headwinds of adverse currency translation and difficult land systems markets. Although management sales declined to £7,456 million, this represented underlying, organic growth of 4%. Earnings per share increased by 1% and the Board has recommended an increase to the dividend of 0.5 pence.
Our aim is to create long term and sustainable shareholder value through a balanced approach with three elements: growth, trading margin and return on invested capital.
We look to grow sales ahead of our markets, have targeted our Group margin to run in the 8-10% range and have a goal for return on invested capital (ROIC) of around 20%. I am pleased that in 2014 we made progress against all three of these objectives.
NIGEL STEINChief Executive
Moving forward
Our businessOver the course of the year we have seen the benefit of our business model. We are a global engineering business serving the world’s leading original equipment manufacturers in three large markets. But whichever the market, our approach and strategy are the same: using our knowledge of our customers and their needs, combined with our leading technology, excellent global footprint and broad operational excellence, to design, develop and deliver outstanding products. This requires a thorough understanding of market trends and a strong capability for product innovation. There are good examples of both throughout this report including the case studies featured on pages 25-37.
The table opposite summarises some strategic landmarks for the Group and in the business review (pages 22-37) we set out the most noteworthy divisional achievements.
Financial Statements Other InformationGovernanceStrategic Report
17GKN plc Annual Report and Accounts 2014
Leading in our chosen markets – excellent positions in their markets helped all four divisions prove successful in winning new business during 2014. GKN Aerospace won business for both aerostructures and engine systems, with the risk and revenue sharing partnership to supply components for the Pratt & Whitney PurePower PW100 Geared TurbofanTM engine. GKN Driveline won significant sideshaft business with Ford, General Motors, Volkswagen, BMW, Renault Nissan, Mazda and Hyundai whilst successfully designing and launching several all-wheel drive products with Fiat, BMW and Jaguar Land Rover. For GKN Powder Metallurgy, new business wins in the year totalled £165 million, higher than last year’s equivalent and including a good proportion of higher margin ‘Design for Powder Metallurgy’ components. For GKN Land Systems, the tough markets limited options, but its business in the industrial market continued to do well, successfully exploiting its leadership in clutches and brakes.
During the year we sold our stake in the emissions control business Emitec, a good business with sound prospects, but which did not give GKN a route to a leadership position in that market.
Leveraging a strong global presence – having manufacturing plants and design centres located around the world, close to our customers, is an important strategic advantage for GKN. We also use the regional presence of one division to help other divisions enter or expand in that market.
Mexico and Asia in general saw the greatest activity in this respect. Over the course of 2014, Group capital investment in Mexico and Asia was £37 million and £56 million respectively.
China continues to be an important market for GKN. Although the country’s economic growth has eased in recent years, growth of around 7% remains very attractive. We have continued to build our GKN Driveline joint venture company whilst at the same time expanding the activities of GKN Land Systems and GKN Powder Metallurgy in the country. We are also seeking to establish GKN Aerospace in China but this remains a work in progress.
Differentiating ourselves through technology – our excellent technology helped win significant business this year. This was clearly demonstrated through GKN Driveline’s critical role in the Fiat Chrysler small all-wheel drive platform, GKN Powder Metallurgy driving its margin through new ‘Design for Powder Metallurgy’ component wins and GKN Land Systems winning new business with Claas on the back of superior technical offering. GKN Aerospace continued building its position as a technology leader and was pleased to be awarded leadership of a challenging £30 million future wing research programme, backed by the UK’s Aerospace Technology Institute. They also delivered an innovative wing leading edge demonstrator to the Clean Sky programme, helping bring an ultra-high performance, natural laminar flow wing closer to reality.
Increasing investment was made into advanced engineering projects looking to the longer term, including development work on additive manufacturing (also known as 3D printing), the electrification of vehicle powertrains, future wing technologies and energy storage. All look likely to drive significant market changes in the future.
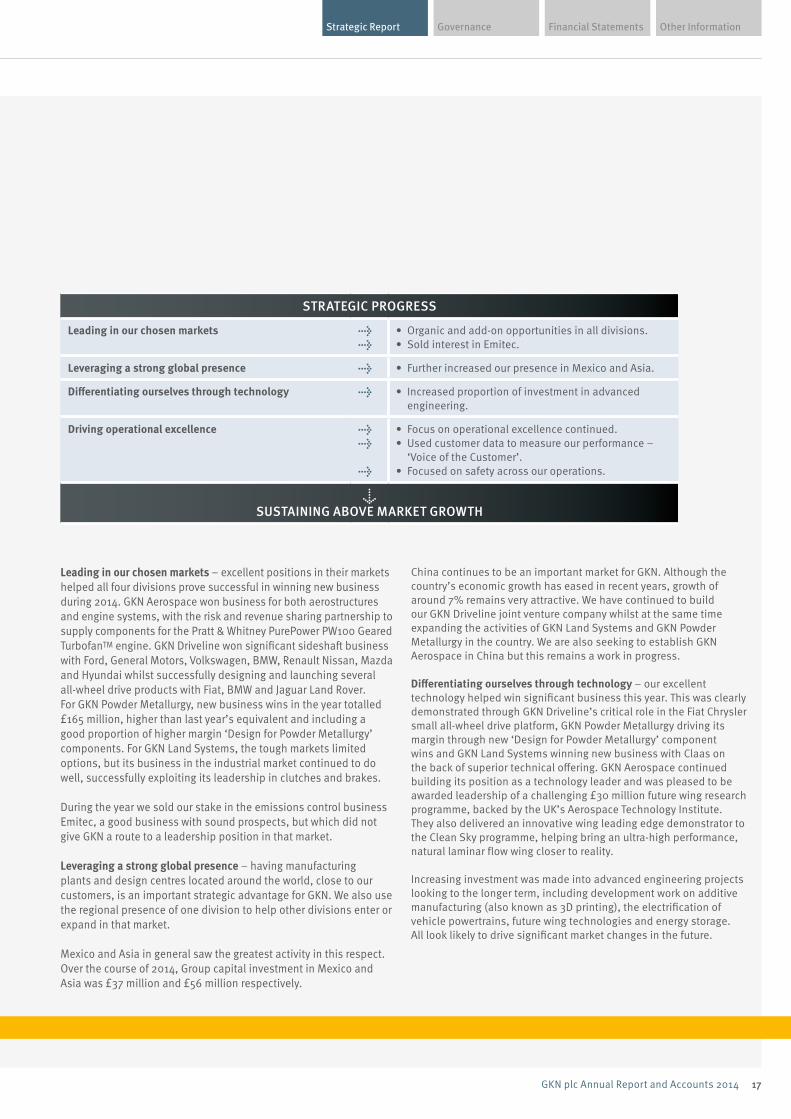
STRATEGIC PROGRESS
Leading in our chosen markets →→
• Organic and add-on opportunities in all divisions.• Sold interest in Emitec.
Leveraging a strong global presence → • Further increased our presence in Mexico and Asia.
Differentiating ourselves through technology → • Increased proportion of investment in advanced engineering.
Driving operational excellence →→ →
• Focus on operational excellence continued.• Used customer data to measure our performance –
‘Voice of the Customer’.• Focused on safety across our operations.
↓SUSTAINING ABOVE MARKET GROWTH

18 GKN plc Annual Report and Accounts 2014
STRATEGIC REPORT
→ See pages 52 – 59 for more information on ‘doing the right thing’
Operational excellence – is fundamental to what we do and provides the opportunity to differentiate ourselves in our customers’ eyes. Employee safety is our number one priority and our performance is set out on page 54. In general 2014 saw a good reduction in the number of accidents. However, in February 2014 an employee at GKN Aerospace Engine Systems’ El Cajon plant in the US suffered a fatal injury whilst operating a forklift truck. I deeply regret this loss of life and we have provided support to the employee’s family. Lessons have been learned from this and applied elsewhere in the Group.
Across the Group, the GKN Lean manufacturing programme enables us to continue to drive continuous improvement in manufacturing performance and back-office processes.
Listening to the ‘Voice of the Customer’ in a direct way is vital to our success. During 2014 we have implemented improved processes to ensure all employees keep their eyes focused on our customers’ own ratings of us, understand any concerns and work speedily and determinedly to resolve them. Although customers’ views have always been important in GKN, I am confident the positive effect of this direct feedback will prove an advantage in building our business.
Together the successful delivery of these four strategic objectives helped deliver the fifth strategic objective of sustaining above market growth. In 2014 overall Group sales showed an organic increase of 4%, better than average for our markets.
Chief Executive’s review
Doing the right thing Underpinning these results is a strong set of GKN Values. We call this ‘doing the right thing’ and the effects of this are set out in the sustainability report on pages 52-59. At our 2014 internal International Leadership Conference, considerable time was spent discussing how GKN’s most senior people should demonstrate our Group Values.
Supporting this we have introduced new processes for clarifying to managers what is expected of them and getting their acknowledgment they understand this. In the months ahead we will be running a process of re-communicating the GKN Code to every employee wherever they are and no matter which of the 27 Group-wide languages they speak.
SummaryThe continued implementation of our strategy in 2014 delivered organic growth, improved margins and increased ROIC, together bringing increased financial returns to our shareholders. This could not have been achieved without the expertise, focus and sheer hard work of the 51,400 committed GKN people around the world. In closing, I would like to thank everyone in the GKN team for their contribution this year. I would also like to thank my former colleagues Marcus Bryson CBE and Bill Seeger for their support and contribution as members of my Executive team and the Board.
“ The continued implementation of our strategy in 2014 delivered organic growth, improved margins and increased ROIC, together bringing increased financial returns to our shareholders.”
Financial Statements Other InformationGovernanceStrategic Report
19GKN plc Annual Report and Accounts 2014
Looking aheadCommercial aircraft production should continue to be strong whereas military markets are forecast to decline. GKN Aerospace’s 2015 organic sales are expected to be broadly flat, reflecting these differing trends and the phasing of our programmes. However, a strong commercial order book supports attractive growth for GKN Aerospace over the medium term.
In automotive, external forecasts predict growth in global light vehicle production of around 2% with increases in China and North America, and Europe flat. Against this background, GKN Driveline and GKN Powder Metallurgy are expected to continue to grow organically above the market.
Softer global agricultural equipment markets are likely to more than offset the slight improvement in industrial markets. As a result, GKN Land Systems 2015 sales are expected to be lower than 2014 and an £8 million restructuring charge is planned to further reduce the fixed cost base.
Although some markets remain challenging, 2015 is expected to be a year of further growth. Beyond 2015, we are well positioned to outperform in our large global markets.
Nigel SteinChief Executive
→ Visit us at www.gkn.com to see more case studies
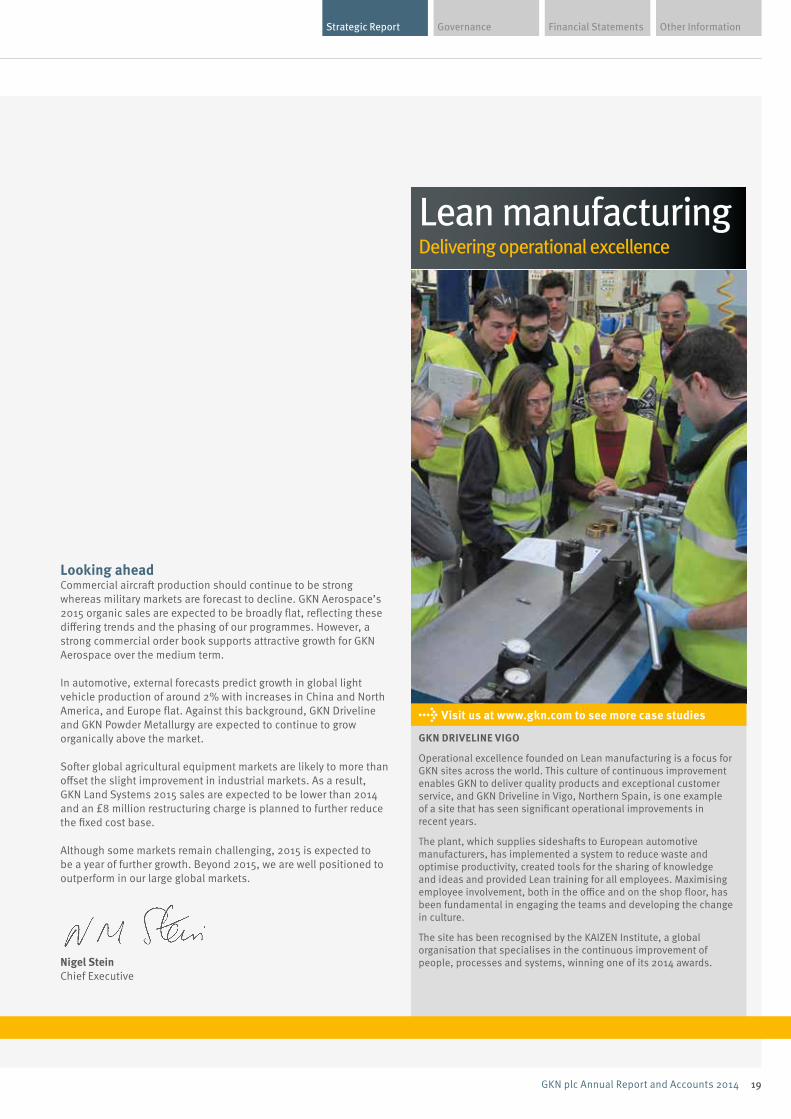
GKN DRIVELINE VIGO
Operational excellence founded on Lean manufacturing is a focus for GKN sites across the world. This culture of continuous improvement enables GKN to deliver quality products and exceptional customer service, and GKN Driveline in Vigo, Northern Spain, is one example of a site that has seen significant operational improvements in recent years.
The plant, which supplies sideshafts to European automotive manufacturers, has implemented a system to reduce waste and optimise productivity, created tools for the sharing of knowledge and ideas and provided Lean training for all employees. Maximising employee involvement, both in the office and on the shop floor, has been fundamental in engaging the teams and developing the change in culture.
The site has been recognised by the KAIZEN Institute, a global organisation that specialises in the continuous improvement of people, processes and systems, winning one of its 2014 awards.
Lean manufacturingDelivering operational excellence
20 GKN plc Annual Report and Accounts 2014
STRATEGIC REPORT
→ See pages 22 – 37 for more information on the financial performance of our divisions
Business review / Group performance
Financial progress
ADAM WALKERGroup Finance Director
Group performanceResults
Change (%)
2014 2013 Headline Organic
Sales (£m) 7,456 7,594 (2) 4
Trading profit (£m) 687 661 4 11
Trading margin 9.2% 8.7%
Return on average invested capital 17.7% 17.3%
The Group has made good progress on its financial targets during 2014 with growth in organic sales, an improved Group margin, and an increase in Group ROIC – all of which support an increase of 6% in the total dividend.
Financial Statements Other InformationGovernanceStrategic Report
21GKN plc Annual Report and Accounts 2014
Management trading profit GKN Aerospace £277m GKN Driveline £280m GKN Powder Metallurgy £101m GKN Land Systems £44m
* Including corporate costs and Other Businesses.
£687m*
Management sales GKN Aerospace £2,226m GKN Driveline £3,444m GKN Powder Metallurgy £916m GKN Land Systems £776m Other Businesses £94m
£7,456m
Management sales GKN Aero customer GKN Aero market
GKN Aero productGKN driveline customerGKN driveline productGKN driveline region
management pro�t
metallurgy 2 metallurgy product
landsystems market landsystems region
metallurgy customer landsystems customer
Management sales GKN Aero customer GKN Aero market
GKN Aero productGKN driveline customerGKN driveline productGKN driveline region
management pro�t
metallurgy 2 metallurgy product
landsystems market landsystems region
metallurgy customer landsystems customer
Organic sales increased by £303 million (4%). The adverse effect of currency translation on management sales was £403 million (5%) and there was a £7 million benefit from acquisitions which was more than offset by a £45 million reduction due to disposals.
Organic trading profit increased £66 million, due to the absence of restructuring costs (2013: £25 million), the strong performance of three of our divisions, lower profits from GKN Land Systems and £6 million net benefit from commercial settlements and provision releases. Adverse currency translation was £38 million and there was a £2 million reduction due to acquisitions and divestments.
Group trading margin increased to 9.2% (2013: 8.7% or 9.0% excluding restructuring charges). Return on average invested capital (ROIC) increased to 17.7% (2013: 17.3%).
Basis of reportingIn this report, financial information, unless otherwise stated, is presented on a management basis, the definition of which is below. The Group uses management measures, which are non-GAAP measures, to assess operating performance on a consistent basis, as we believe this gives a fairer assessment of the underlying performance of the business.
The use of management measures allows the Group to chart progress, make decisions and allocate resources based on the actions for which management is responsible or can influence, without volatility arising from significant one-time trading and portfolio change transactions or the mark to market valuation of currency hedges.
Definitions Financial information, unless otherwise stated, is presented on a management basis which aggregates the sales and trading profit of subsidiaries (excluding certain subsidiary businesses sold and closed) with the Group’s share of the sales and trading profit of joint ventures. References to trading margins are to trading profit expressed as a percentage of sales. Management profit or loss before tax is management trading profit less net subsidiary interest payable and receivable and the Group’s share of net interest payable and receivable and taxation of joint ventures. These figures better reflect performance of continuing businesses. Where appropriate,
reference is made to organic results which exclude the impact of acquisitions/divestments as well as currency translation on the results of overseas operations. Operating cash flow is cash generated from operations adjusted for capital expenditure, government capital grants, proceeds from disposal of fixed assets and government refundable advances. Free cash flow is operating cash flow including interest, tax, joint venture dividends, own shares purchased and amounts paid to non-controlling interests, but excluding dividends paid to GKN shareholders. Return on average invested capital (ROIC) is management trading profit as a percentage of average total net assets of continuing subsidiaries and joint ventures excluding current and deferred tax, net debt, post-employment obligations and derivative financial instruments.
Exchange rates Exchange rates used for currencies most relevant to the Group’s operations are:
Average Year end2014 2013 2014 2013
Euro 1.24 1.18 1.29 1.20US dollar 1.65 1.57 1.56 1.66
The approximate impact on 2014 trading profit of subsidiaries and joint ventures of a 1% movement in the average rate would be euro – £1 million, US dollar – £4 million.
22 GKN plc Annual Report and Accounts 2014
STRATEGIC REPORT
→ See pages 24 – 25 for more information on GKN Aerospace
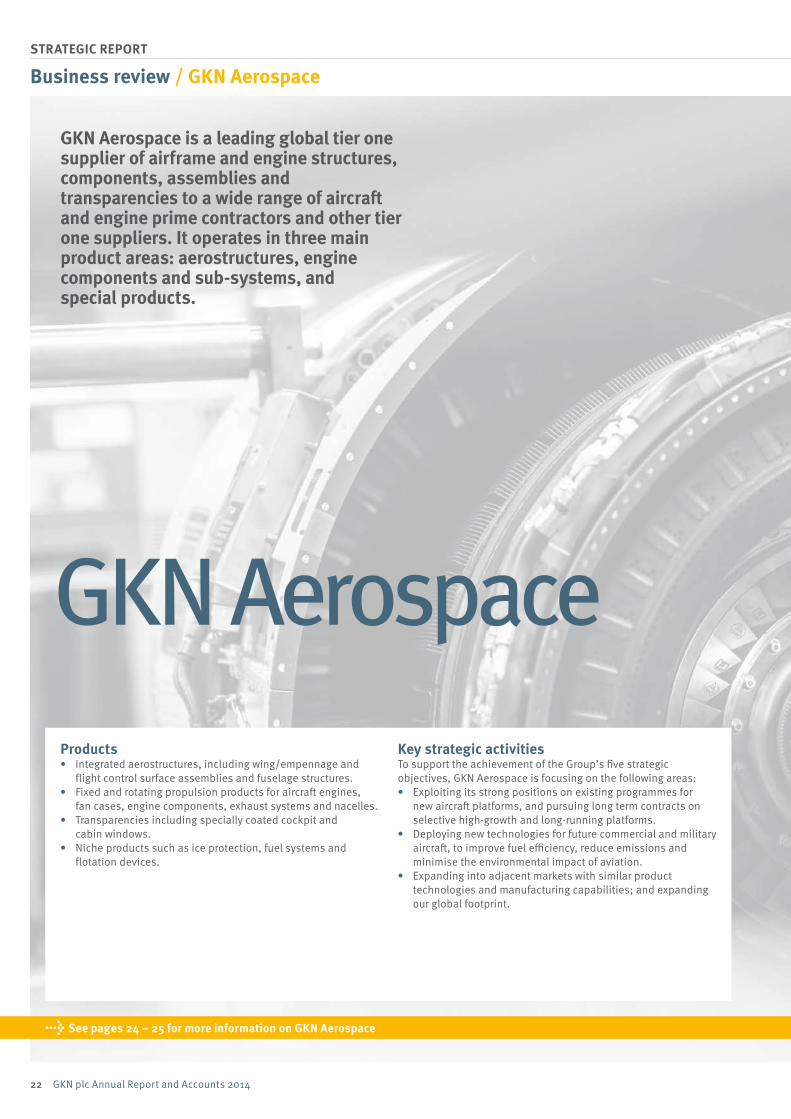
Products • Integrated aerostructures, including wing/empennage and
flight control surface assemblies and fuselage structures. • Fixed and rotating propulsion products for aircraft engines,
fan cases, engine components, exhaust systems and nacelles. • Transparencies including specially coated cockpit and
cabin windows. • Niche products such as ice protection, fuel systems and
flotation devices.
Key strategic activitiesTo support the achievement of the Group’s five strategic objectives, GKN Aerospace is focusing on the following areas:• Exploiting its strong positions on existing programmes for
new aircraft platforms, and pursuing long term contracts on selective high-growth and long-running platforms.
• Deploying new technologies for future commercial and military aircraft, to improve fuel efficiency, reduce emissions and minimise the environmental impact of aviation.
• Expanding into adjacent markets with similar product technologies and manufacturing capabilities; and expanding our global footprint.
Business review / GKN Aerospace
GKN Aerospace
GKN Aerospace is a leading global tier one supplier of airframe and engine structures, components, assemblies and transparencies to a wide range of aircraft and engine prime contractors and other tier one suppliers. It operates in three main product areas: aerostructures, engine components and sub-systems, and special products.
Financial Statements Other InformationGovernanceStrategic Report
23GKN plc Annual Report and Accounts 2014
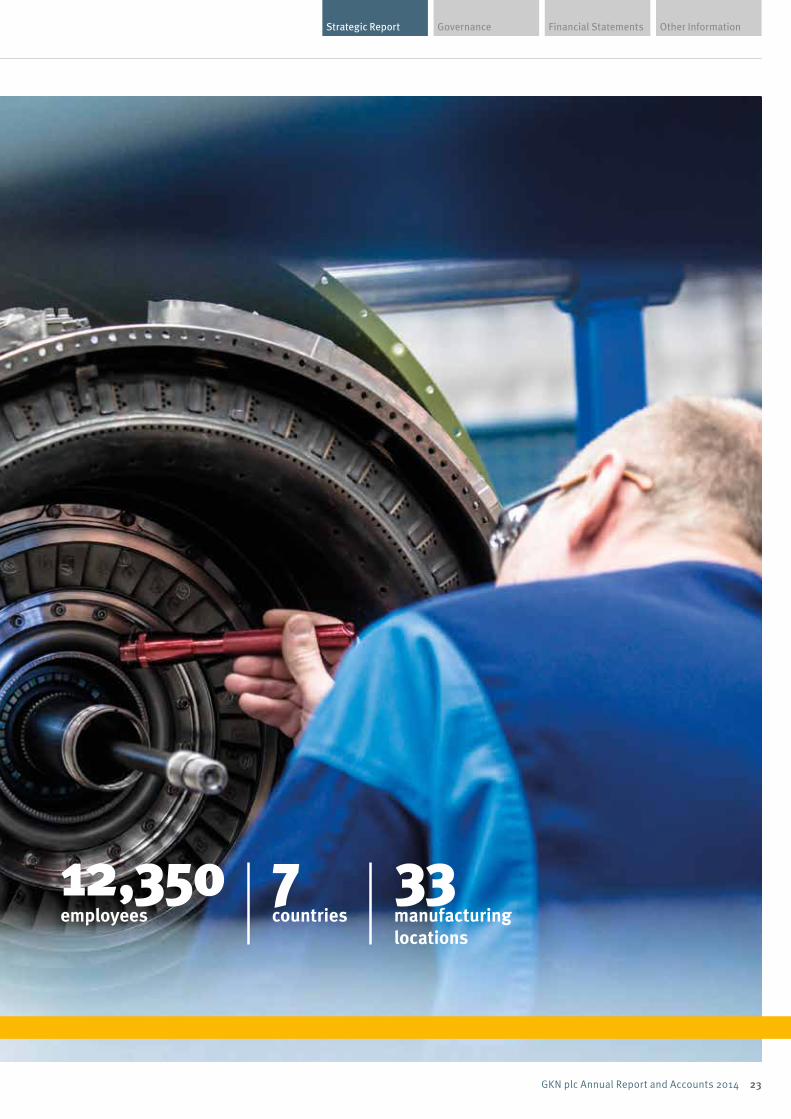
12,350employees
7countries
33manufacturing locations
24 GKN plc Annual Report and Accounts 2014
STRATEGIC REPORT
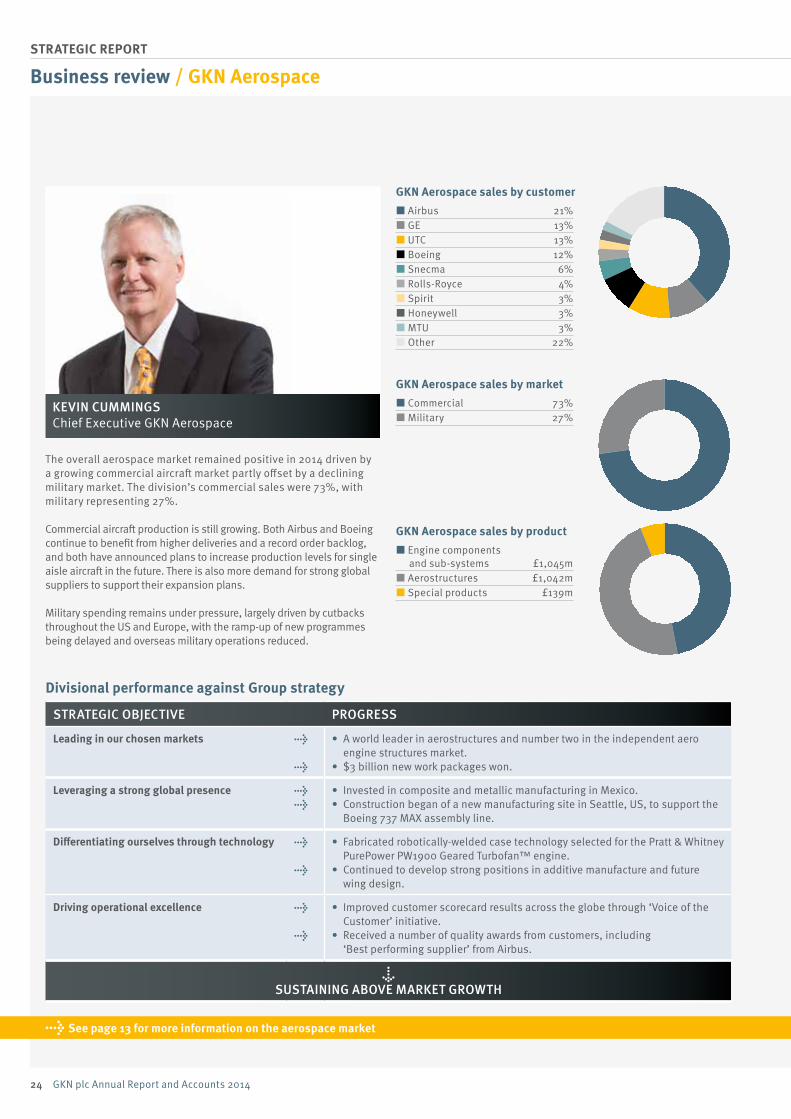
GKN Aerospace sales by customer Airbus 21% GE 13% UTC 13% Boeing 12% Snecma 6% Rolls-Royce 4% Spirit 3% Honeywell 3% MTU 3% Other 22%
GKN Aerospace sales by market Commercial 73% Military 27%
GKN Aerospace sales by product Engine components and sub-systems £1,045m Aerostructures £1,042m Special products £139m
Management sales GKN Aero customer GKN Aero market
GKN Aero productGKN driveline customerGKN driveline productGKN driveline region
management pro�t
metallurgy 2 metallurgy product
landsystems market landsystems region
metallurgy customer landsystems customer
Management sales GKN Aero customer GKN Aero market
GKN Aero productGKN driveline customerGKN driveline productGKN driveline region
management pro�t
metallurgy 2 metallurgy product
landsystems market landsystems region
metallurgy customer landsystems customer
Management sales GKN Aero customer GKN Aero market
GKN Aero productGKN driveline customerGKN driveline productGKN driveline region
management pro�t
metallurgy 2 metallurgy product
landsystems market landsystems region
metallurgy customer landsystems customer
Business review / GKN Aerospace
Divisional performance against Group strategy STRATEGIC OBJECTIVE PROGRESS
Leading in our chosen markets →
→
• A world leader in aerostructures and number two in the independent aero engine structures market.
• $3 billion new work packages won.
Leveraging a strong global presence →→
• Invested in composite and metallic manufacturing in Mexico.• Construction began of a new manufacturing site in Seattle, US, to support the
Boeing 737 MAX assembly line.
Differentiating ourselves through technology →
→
• Fabricated robotically-welded case technology selected for the Pratt & Whitney PurePower PW1900 Geared Turbofan™ engine.
• Continued to develop strong positions in additive manufacture and future wing design.
Driving operational excellence →
→
• Improved customer scorecard results across the globe through ‘Voice of the Customer’ initiative.
• Received a number of quality awards from customers, including ‘Best performing supplier’ from Airbus.
↓ SUSTAINING ABOVE MARKET GROWTH
KEVIN CUMMINGSChief Executive GKN Aerospace
The overall aerospace market remained positive in 2014 driven by a growing commercial aircraft market partly offset by a declining military market. The division’s commercial sales were 73%, with military representing 27%.
Commercial aircraft production is still growing. Both Airbus and Boeing continue to benefit from higher deliveries and a record order backlog, and both have announced plans to increase production levels for single aisle aircraft in the future. There is also more demand for strong global suppliers to support their expansion plans.
Military spending remains under pressure, largely driven by cutbacks throughout the US and Europe, with the ramp-up of new programmes being delayed and overseas military operations reduced.
→ See page 13 for more information on the aerospace market
Financial Statements Other InformationGovernanceStrategic Report
25GKN plc Annual Report and Accounts 2014
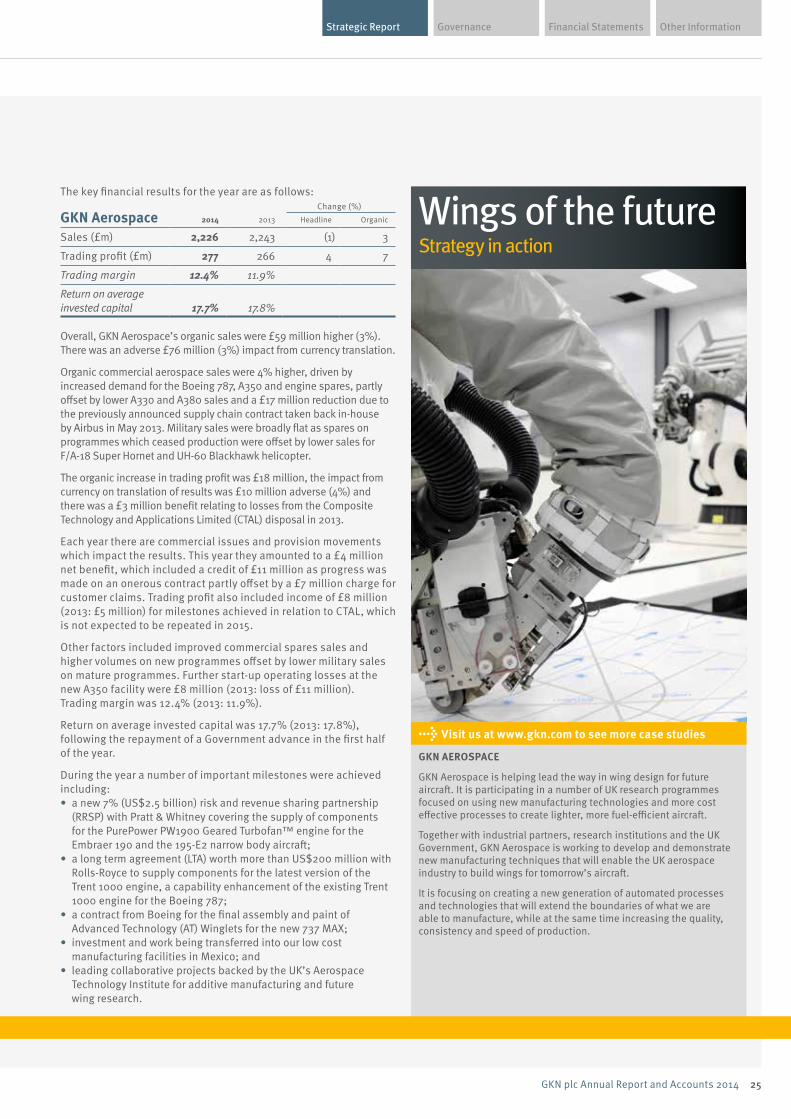
Wings of the futureStrategy in action
→ Visit us at www.gkn.com to see more case studies
GKN AEROSPACE
GKN Aerospace is helping lead the way in wing design for future aircraft. It is participating in a number of UK research programmes focused on using new manufacturing technologies and more cost effective processes to create lighter, more fuel-efficient aircraft.
Together with industrial partners, research institutions and the UK Government, GKN Aerospace is working to develop and demonstrate new manufacturing techniques that will enable the UK aerospace industry to build wings for tomorrow’s aircraft.
It is focusing on creating a new generation of automated processes and technologies that will extend the boundaries of what we are able to manufacture, while at the same time increasing the quality, consistency and speed of production.
The key financial results for the year are as follows:
GKN AerospaceChange (%)
2014 2013 Headline Organic
Sales (£m) 2,226 2,243 (1) 3
Trading profit (£m) 277 266 4 7
Trading margin 12.4% 11.9%
Return on average invested capital 17.7% 17.8%
Overall, GKN Aerospace’s organic sales were £59 million higher (3%). There was an adverse £76 million (3%) impact from currency translation.
Organic commercial aerospace sales were 4% higher, driven by increased demand for the Boeing 787, A350 and engine spares, partly offset by lower A330 and A380 sales and a £17 million reduction due to the previously announced supply chain contract taken back in-house by Airbus in May 2013. Military sales were broadly flat as spares on programmes which ceased production were offset by lower sales for F/A-18 Super Hornet and UH-60 Blackhawk helicopter.
The organic increase in trading profit was £18 million, the impact from currency on translation of results was £10 million adverse (4%) and there was a £3 million benefit relating to losses from the Composite Technology and Applications Limited (CTAL) disposal in 2013.
Each year there are commercial issues and provision movements which impact the results. This year they amounted to a £4 million net benefit, which included a credit of £11 million as progress was made on an onerous contract partly offset by a £7 million charge for customer claims. Trading profit also included income of £8 million (2013: £5 million) for milestones achieved in relation to CTAL, which is not expected to be repeated in 2015.
Other factors included improved commercial spares sales and higher volumes on new programmes offset by lower military sales on mature programmes. Further start-up operating losses at the new A350 facility were £8 million (2013: loss of £11 million). Trading margin was 12.4% (2013: 11.9%).
Return on average invested capital was 17.7% (2013: 17.8%), following the repayment of a Government advance in the first half of the year. During the year a number of important milestones were achieved including: • a new 7% (US$2.5 billion) risk and revenue sharing partnership
(RRSP) with Pratt & Whitney covering the supply of components for the PurePower PW1900 Geared Turbofan™ engine for the Embraer 190 and the 195-E2 narrow body aircraft;
• a long term agreement (LTA) worth more than US$200 million with Rolls-Royce to supply components for the latest version of the Trent 1000 engine, a capability enhancement of the existing Trent 1000 engine for the Boeing 787;
• a contract from Boeing for the final assembly and paint of Advanced Technology (AT) Winglets for the new 737 MAX;
• investment and work being transferred into our low cost manufacturing facilities in Mexico; and
• leading collaborative projects backed by the UK’s Aerospace Technology Institute for additive manufacturing and future wing research.
26 GKN plc Annual Report and Accounts 2014
STRATEGIC REPORT
→ See pages 28 – 29 for more information on GKN Driveline
GKN Driveline
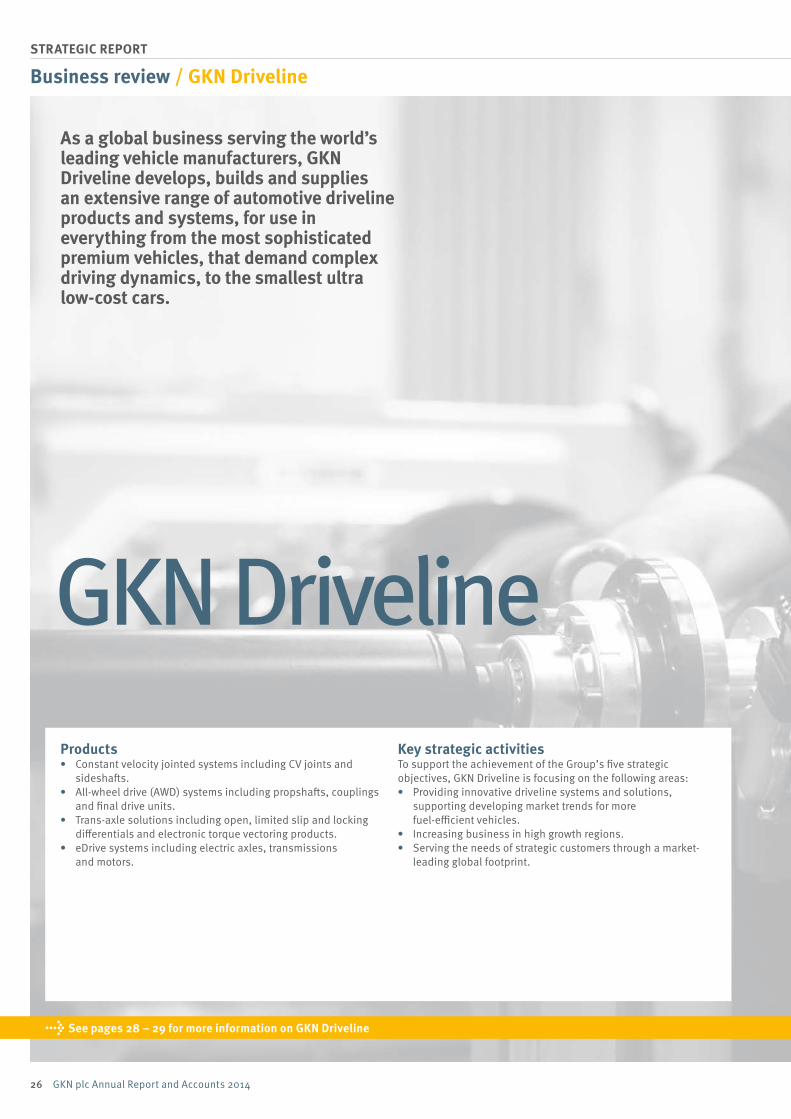
As a global business serving the world’s leading vehicle manufacturers, GKN Driveline develops, builds and supplies an extensive range of automotive driveline products and systems, for use in everything from the most sophisticated premium vehicles, that demand complex driving dynamics, to the smallest ultra low-cost cars.
Business review / GKN Driveline
Products • Constant velocity jointed systems including CV joints and
sideshafts. • All-wheel drive (AWD) systems including propshafts, couplings
and final drive units. • Trans-axle solutions including open, limited slip and locking
differentials and electronic torque vectoring products. • eDrive systems including electric axles, transmissions
and motors.
Key strategic activitiesTo support the achievement of the Group’s five strategic objectives, GKN Driveline is focusing on the following areas:• Providing innovative driveline systems and solutions,
supporting developing market trends for more fuel-efficient vehicles.
• Increasing business in high growth regions.• Serving the needs of strategic customers through a market-
leading global footprint.
Financial Statements Other InformationGovernanceStrategic Report
27GKN plc Annual Report and Accounts 2014
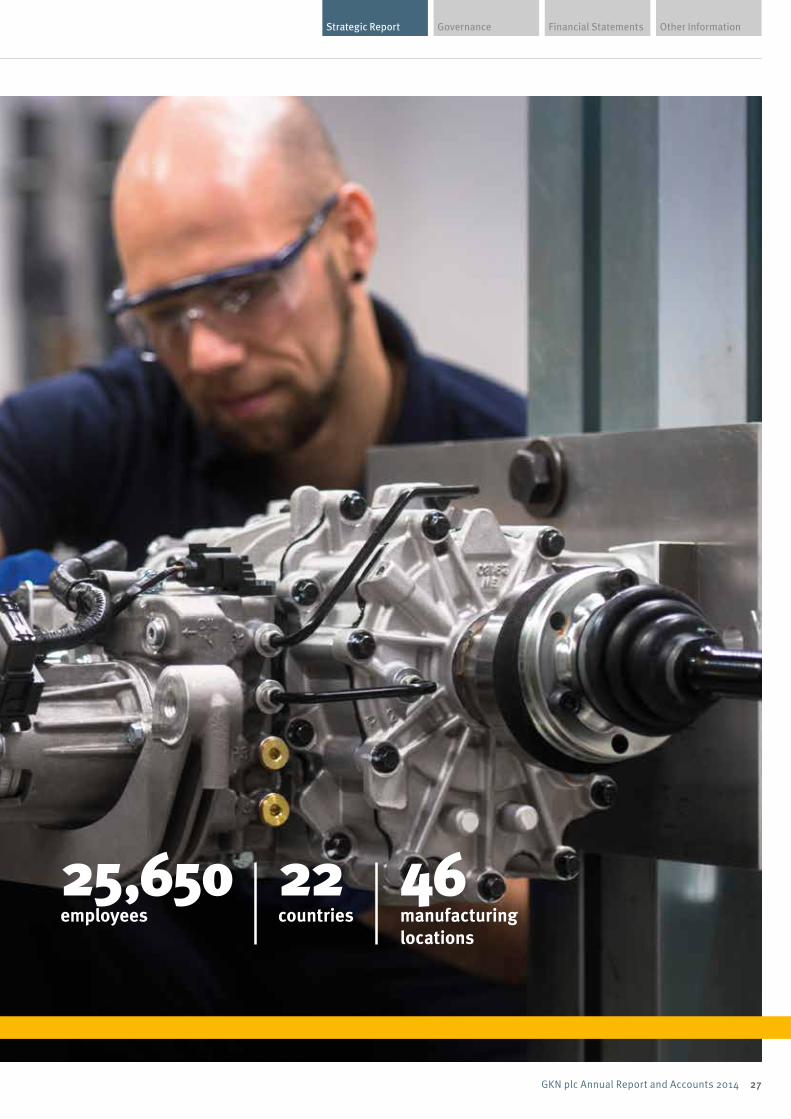
25,650 employees
22countries
46manufacturing locations
28 GKN plc Annual Report and Accounts 2014
STRATEGIC REPORT
Management sales GKN Aero customer GKN Aero market
GKN Aero productGKN driveline customerGKN driveline productGKN driveline region
management pro�t
metallurgy 2 metallurgy product
landsystems market landsystems region
metallurgy customer landsystems customer
Management sales GKN Aero customer GKN Aero market
GKN Aero productGKN driveline customerGKN driveline productGKN driveline region
management pro�t
metallurgy 2 metallurgy product
landsystems market landsystems region
metallurgy customer landsystems customer
Management sales GKN Aero customer GKN Aero market
GKN Aero productGKN driveline customerGKN driveline productGKN driveline region
management pro�t
metallurgy 2 metallurgy product
landsystems market landsystems region
metallurgy customer landsystems customer
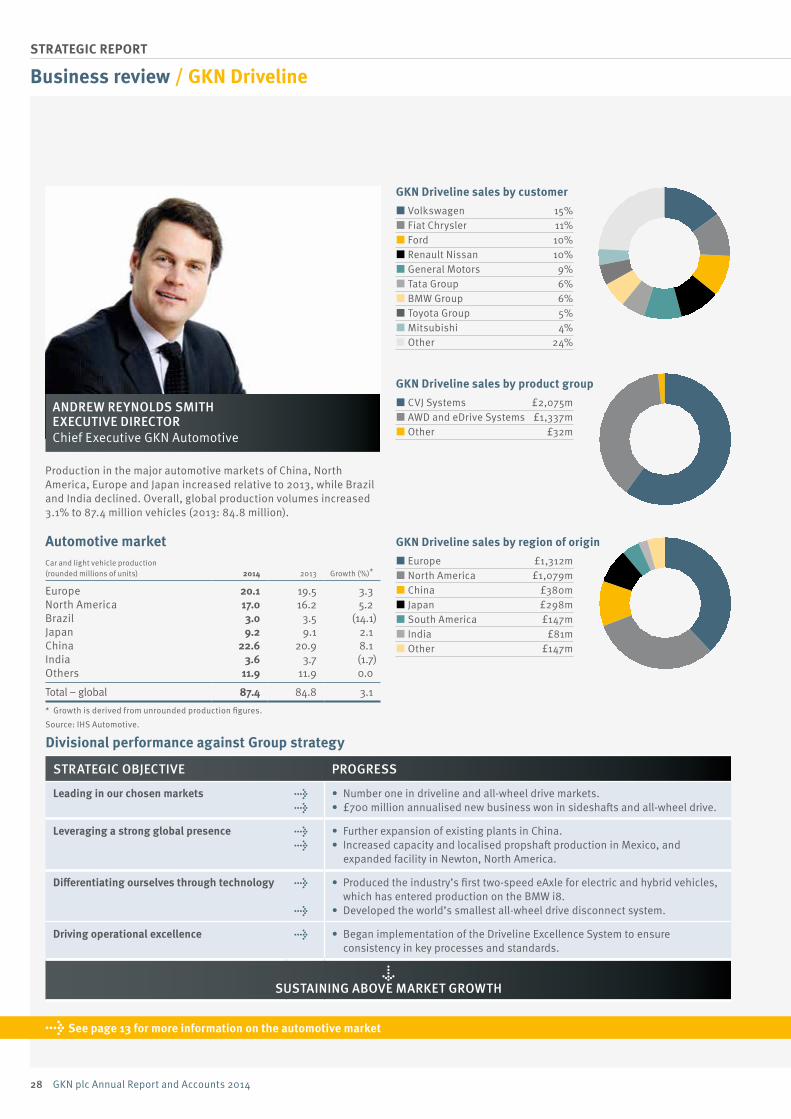
GKN Driveline sales by customer Volkswagen 15% Fiat Chrysler 11% Ford 10% Renault Nissan 10% General Motors 9% Tata Group 6% BMW Group 6% Toyota Group 5% Mitsubishi 4% Other 24%
GKN Driveline sales by product group CVJ Systems £2,075m AWD and eDrive Systems £1,337m Other £32m
GKN Driveline sales by region of origin Europe £1,312m North America £1,079m China £380m Japan £298m South America £147m India £81m Other £147m
Business review / GKN Driveline
ANDREW REYNOLDS SMITH EXECUTIVE DIRECTORChief Executive GKN Automotive
Divisional performance against Group strategy STRATEGIC OBJECTIVE PROGRESS
Leading in our chosen markets →→
• Number one in driveline and all-wheel drive markets.• £700 million annualised new business won in sideshafts and all-wheel drive.
Leveraging a strong global presence →→
• Further expansion of existing plants in China.• Increased capacity and localised propshaft production in Mexico, and
expanded facility in Newton, North America.
Differentiating ourselves through technology →
→
• Produced the industry’s first two-speed eAxle for electric and hybrid vehicles, which has entered production on the BMW i8.
• Developed the world’s smallest all-wheel drive disconnect system.
Driving operational excellence → • Began implementation of the Driveline Excellence System to ensure consistency in key processes and standards.
↓ SUSTAINING ABOVE MARKET GROWTH
Production in the major automotive markets of China, North America, Europe and Japan increased relative to 2013, while Brazil and India declined. Overall, global production volumes increased 3.1% to 87.4 million vehicles (2013: 84.8 million).
Automotive market
Car and light vehicle production (rounded millions of units) 2014 2013 Growth (%)*
Europe 20.1 19.5 3.3North America 17.0 16.2 5.2Brazil 3.0 3.5 (14.1)Japan 9.2 9.1 2.1China 22.6 20.9 8.1India 3.6 3.7 (1.7)Others 11.9 11.9 0.0
Total – global 87.4 84.8 3.1
* Growth is derived from unrounded production figures.
Source: IHS Automotive.
→ See page 13 for more information on the automotive market
Financial Statements Other InformationGovernanceStrategic Report
29GKN plc Annual Report and Accounts 2014
→ Visit us at www.gkn.com to see more case studies
GKN DRIVELINE
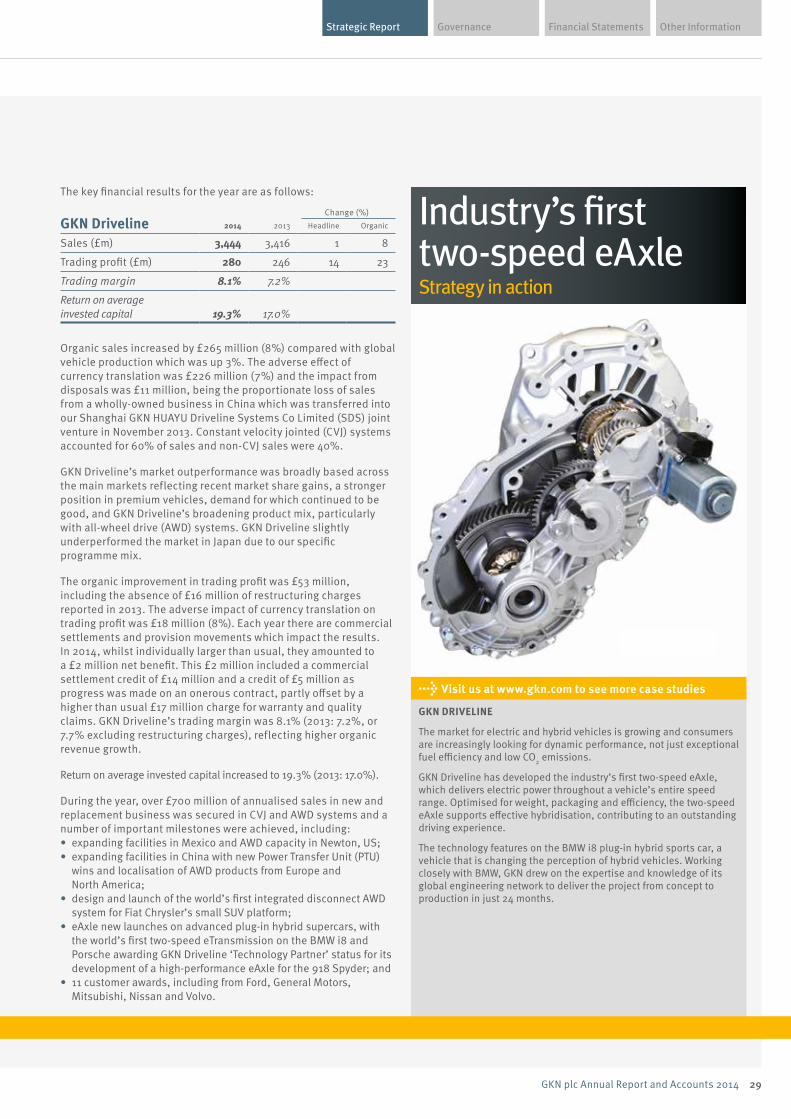
The market for electric and hybrid vehicles is growing and consumers are increasingly looking for dynamic performance, not just exceptional fuel efficiency and low CO2 emissions.
GKN Driveline has developed the industry’s first two-speed eAxle, which delivers electric power throughout a vehicle’s entire speed range. Optimised for weight, packaging and efficiency, the two-speed eAxle supports effective hybridisation, contributing to an outstanding driving experience.
The technology features on the BMW i8 plug-in hybrid sports car, a vehicle that is changing the perception of hybrid vehicles. Working closely with BMW, GKN drew on the expertise and knowledge of its global engineering network to deliver the project from concept to production in just 24 months.
Industry’s first two-speed eAxleStrategy in action
The key financial results for the year are as follows:
GKN DrivelineChange (%)
2014 2013 Headline Organic
Sales (£m) 3,444 3,416 1 8
Trading profit (£m) 280 246 14 23
Trading margin 8.1% 7.2%
Return on average invested capital 19.3% 17.0%
Organic sales increased by £265 million (8%) compared with global vehicle production which was up 3%. The adverse effect of currency translation was £226 million (7%) and the impact from disposals was £11 million, being the proportionate loss of sales from a wholly-owned business in China which was transferred into our Shanghai GKN HUAYU Driveline Systems Co Limited (SDS) joint venture in November 2013. Constant velocity jointed (CVJ) systems accounted for 60% of sales and non-CVJ sales were 40%.
GKN Driveline’s market outperformance was broadly based across the main markets reflecting recent market share gains, a stronger position in premium vehicles, demand for which continued to be good, and GKN Driveline’s broadening product mix, particularly with all-wheel drive (AWD) systems. GKN Driveline slightly underperformed the market in Japan due to our specific programme mix.
The organic improvement in trading profit was £53 million, including the absence of £16 million of restructuring charges reported in 2013. The adverse impact of currency translation on trading profit was £18 million (8%). Each year there are commercial settlements and provision movements which impact the results. In 2014, whilst individually larger than usual, they amounted to a £2 million net benefit. This £2 million included a commercial settlement credit of £14 million and a credit of £5 million as progress was made on an onerous contract, partly offset by a higher than usual £17 million charge for warranty and quality claims. GKN Driveline’s trading margin was 8.1% (2013: 7.2%, or 7.7% excluding restructuring charges), reflecting higher organic revenue growth.
Return on average invested capital increased to 19.3% (2013: 17.0%).
During the year, over £700 million of annualised sales in new and replacement business was secured in CVJ and AWD systems and a number of important milestones were achieved, including:• expanding facilities in Mexico and AWD capacity in Newton, US; • expanding facilities in China with new Power Transfer Unit (PTU)
wins and localisation of AWD products from Europe and North America;
• design and launch of the world’s first integrated disconnect AWD system for Fiat Chrysler’s small SUV platform;
• eAxle new launches on advanced plug-in hybrid supercars, with the world’s first two-speed eTransmission on the BMW i8 and Porsche awarding GKN Driveline ‘Technology Partner’ status for its development of a high-performance eAxle for the 918 Spyder; and
• 11 customer awards, including from Ford, General Motors, Mitsubishi, Nissan and Volvo.
30 GKN plc Annual Report and Accounts 2014
STRATEGIC REPORT
→ See pages 32 – 33 for more information on GKN Powder Metallurgy
Business review / GKN Powder Metallurgy
GKN Powder Metallurgy
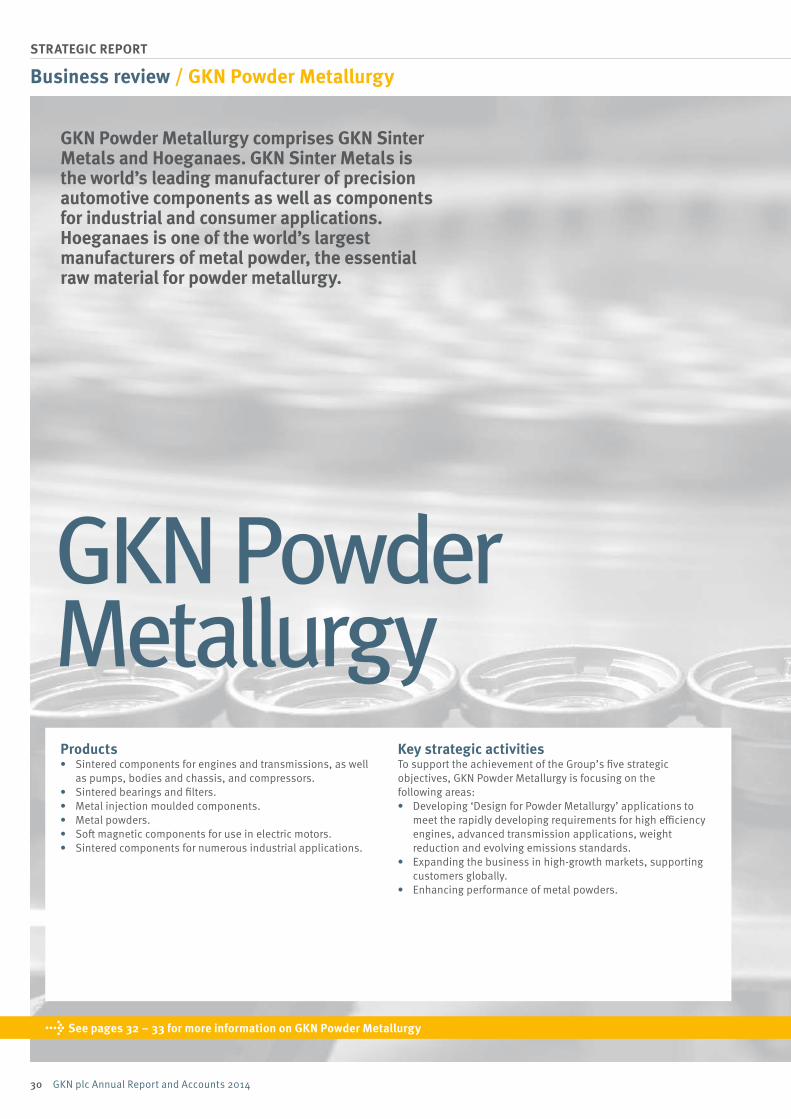
GKN Powder Metallurgy comprises GKN Sinter Metals and Hoeganaes. GKN Sinter Metals is the world’s leading manufacturer of precision automotive components as well as components for industrial and consumer applications. Hoeganaes is one of the world’s largest manufacturers of metal powder, the essential raw material for powder metallurgy.
Products• Sintered components for engines and transmissions, as well
as pumps, bodies and chassis, and compressors.• Sintered bearings and filters.• Metal injection moulded components.• Metal powders.• Soft magnetic components for use in electric motors.• Sintered components for numerous industrial applications.
Key strategic activitiesTo support the achievement of the Group’s five strategic objectives, GKN Powder Metallurgy is focusing on the following areas:• Developing ‘Design for Powder Metallurgy’ applications to
meet the rapidly developing requirements for high efficiency engines, advanced transmission applications, weight reduction and evolving emissions standards.
• Expanding the business in high-growth markets, supporting customers globally.
• Enhancing performance of metal powders.
Financial Statements Other InformationGovernanceStrategic Report
31GKN plc Annual Report and Accounts 2014
6,900 employees
10countries
34manufacturing locations
32 GKN plc Annual Report and Accounts 2014
STRATEGIC REPORT
Management sales GKN Aero customer GKN Aero market
GKN Aero productGKN driveline customerGKN driveline productGKN driveline region
management pro�t
metallurgy 2 metallurgy product
landsystems market landsystems region
metallurgy customer landsystems customer
Management sales GKN Aero customer GKN Aero market
GKN Aero productGKN driveline customerGKN driveline productGKN driveline region
management pro�t
metallurgy 2 metallurgy product
landsystems market landsystems region
metallurgy customer landsystems customer
Management sales GKN Aero customer GKN Aero market
GKN Aero productGKN driveline customerGKN driveline productGKN driveline region
management pro�t
metallurgy 2 metallurgy product
landsystems market landsystems region
metallurgy customer landsystems customer
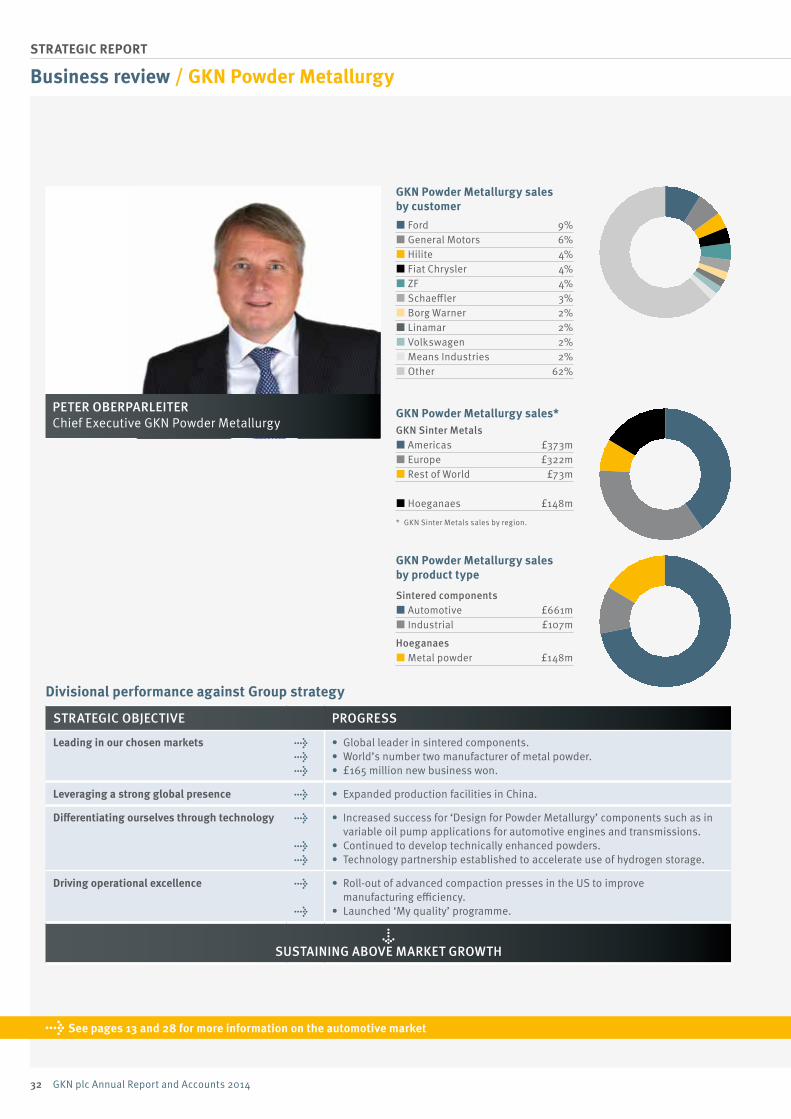
GKN Powder Metallurgy sales by customer Ford 9% General Motors 6% Hilite 4% Fiat Chrysler 4% ZF 4% Schaeffler 3% Borg Warner 2% Linamar 2% Volkswagen 2% Means Industries 2% Other 62%
GKN Powder Metallurgy sales* GKN Sinter Metals Americas £373m Europe £322m Rest of World £73m
Hoeganaes £148m
* GKN Sinter Metals sales by region.
GKN Powder Metallurgy sales by product type
Sintered components Automotive £661m Industrial £107m
Hoeganaes Metal powder £148m
Business review / GKN Powder Metallurgy
Divisional performance against Group strategy
STRATEGIC OBJECTIVE PROGRESS
Leading in our chosen markets →→→
• Global leader in sintered components.• World’s number two manufacturer of metal powder.• £165 million new business won.
Leveraging a strong global presence → • Expanded production facilities in China.
Differentiating ourselves through technology →
→→
• Increased success for ‘Design for Powder Metallurgy’ components such as in variable oil pump applications for automotive engines and transmissions.
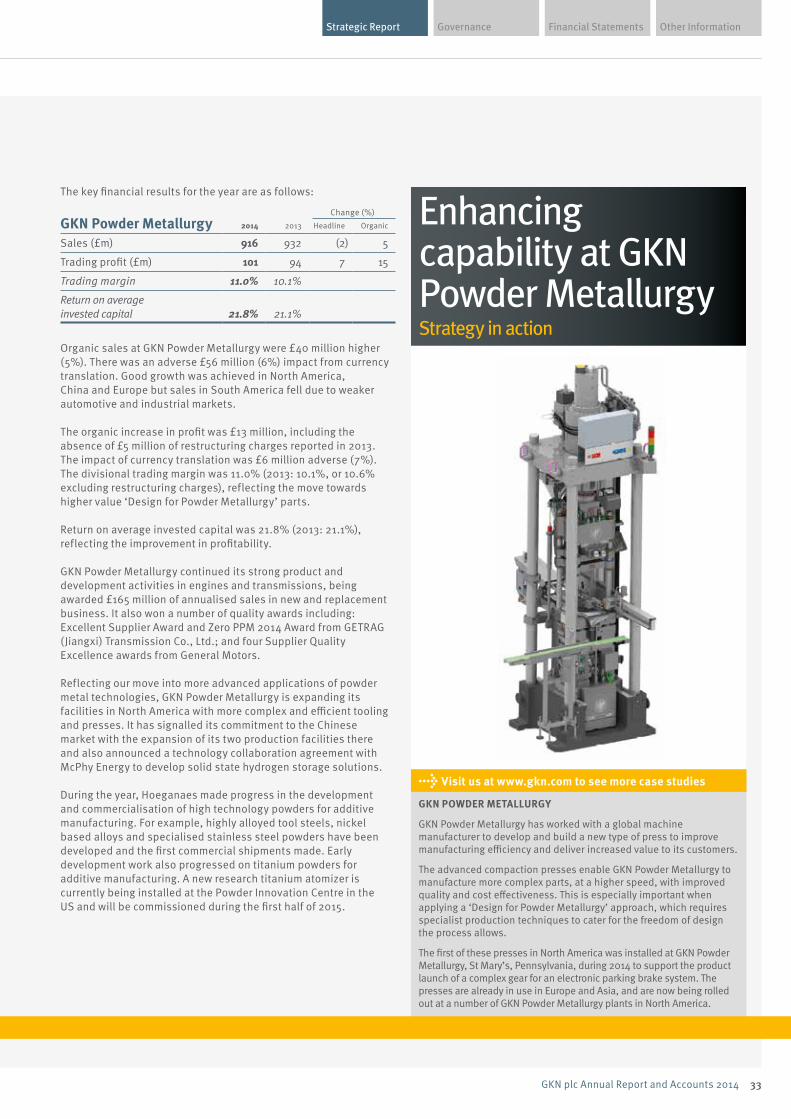
• Continued to develop technically enhanced powders.• Technology partnership established to accelerate use of hydrogen storage.
Driving operational excellence →
→
• Roll-out of advanced compaction presses in the US to improve manufacturing efficiency.
• Launched ‘My quality’ programme.
↓ SUSTAINING ABOVE MARKET GROWTH
PETER OBERPARLEITER Chief Executive GKN Powder Metallurgy
→ See pages 13 and 28 for more information on the automotive market
Financial Statements Other InformationGovernanceStrategic Report
33GKN plc Annual Report and Accounts 2014
The key financial results for the year are as follows:
GKN Powder MetallurgyChange (%)
2014 2013 Headline Organic
Sales (£m) 916 932 (2) 5
Trading profit (£m) 101 94 7 15
Trading margin 11.0% 10.1%
Return on average invested capital 21.8% 21.1%
Organic sales at GKN Powder Metallurgy were £40 million higher (5%). There was an adverse £56 million (6%) impact from currency translation. Good growth was achieved in North America, China and Europe but sales in South America fell due to weaker automotive and industrial markets.
The organic increase in profit was £13 million, including the absence of £5 million of restructuring charges reported in 2013. The impact of currency translation was £6 million adverse (7%). The divisional trading margin was 11.0% (2013: 10.1%, or 10.6% excluding restructuring charges), reflecting the move towards higher value ‘Design for Powder Metallurgy’ parts.
Return on average invested capital was 21.8% (2013: 21.1%), reflecting the improvement in profitability.
GKN Powder Metallurgy continued its strong product and development activities in engines and transmissions, being awarded £165 million of annualised sales in new and replacement business. It also won a number of quality awards including: Excellent Supplier Award and Zero PPM 2014 Award from GETRAG (Jiangxi) Transmission Co., Ltd.; and four Supplier Quality Excellence awards from General Motors.
Reflecting our move into more advanced applications of powder metal technologies, GKN Powder Metallurgy is expanding its facilities in North America with more complex and efficient tooling and presses. It has signalled its commitment to the Chinese market with the expansion of its two production facilities there and also announced a technology collaboration agreement with McPhy Energy to develop solid state hydrogen storage solutions.
During the year, Hoeganaes made progress in the development and commercialisation of high technology powders for additive manufacturing. For example, highly alloyed tool steels, nickel based alloys and specialised stainless steel powders have been developed and the first commercial shipments made. Early development work also progressed on titanium powders for additive manufacturing. A new research titanium atomizer is currently being installed at the Powder Innovation Centre in the US and will be commissioned during the first half of 2015.
→ Visit us at www.gkn.com to see more case studies
GKN POWDER METALLURGY
GKN Powder Metallurgy has worked with a global machine manufacturer to develop and build a new type of press to improve manufacturing efficiency and deliver increased value to its customers.
The advanced compaction presses enable GKN Powder Metallurgy to manufacture more complex parts, at a higher speed, with improved quality and cost effectiveness. This is especially important when applying a ‘Design for Powder Metallurgy’ approach, which requires specialist production techniques to cater for the freedom of design the process allows.
The first of these presses in North America was installed at GKN Powder Metallurgy, St Mary’s, Pennsylvania, during 2014 to support the product launch of a complex gear for an electronic parking brake system. The presses are already in use in Europe and Asia, and are now being rolled out at a number of GKN Powder Metallurgy plants in North America.
Enhancing capability at GKN Powder MetallurgyStrategy in action
34 GKN plc Annual Report and Accounts 2014
STRATEGIC REPORT
→ See pages 36 – 37 for more information on GKN Land Systems
GKN Land Systems is a leading supplier of power management products and services. It designs, manufactures and supplies products and services for the agricultural, construction, mining and utility vehicle markets and key industrial segments, offering integrated powertrain solutions and complete in-service support.
Business review / GKN Land Systems
Products • Electro-mechanical power management devices such
as electromagnetic brakes, flexible couplings, clutches, driveshafts and gear technology.
• Hybrid power systems for highly cost effective energy recovery, ideally suited to start-stop vehicles such as buses and trams.
• Sensors, actuators and controls. • Custom-designed wheels for arduous applications in
all terrains.• Advanced structures and chassis systems for a variety of
vehicle types. • Aftermarket parts and remanufacturing for passenger cars,
commercial trucks, agricultural and construction vehicles, and industry applications.
Key strategic activitiesTo support the achievement of the Group’s five strategic objectives, GKN Land Systems is focusing on the following areas:• Leading in high technology power management solutions to
the world’s original equipment manufacturers.• Deploying new technologies to advance the penetration of our
electro-mechanical products and systems.• Positioning our strong brands outside our traditional home
markets into new and emerging growth markets.• Providing better customer solutions based on a detailed
understanding of their needs and future strategies.
GKN Land Systems
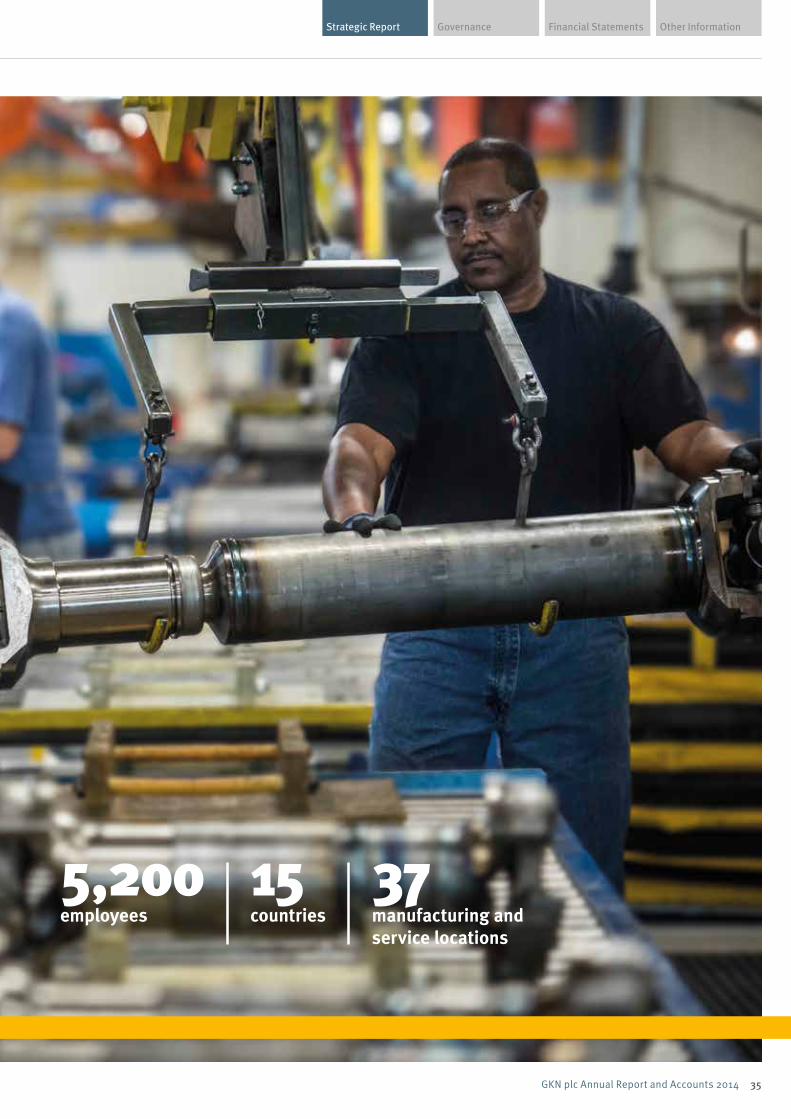
Financial Statements Other InformationGovernanceStrategic Report
35GKN plc Annual Report and Accounts 2014
5,200 employees
15countries
37manufacturing and service locations
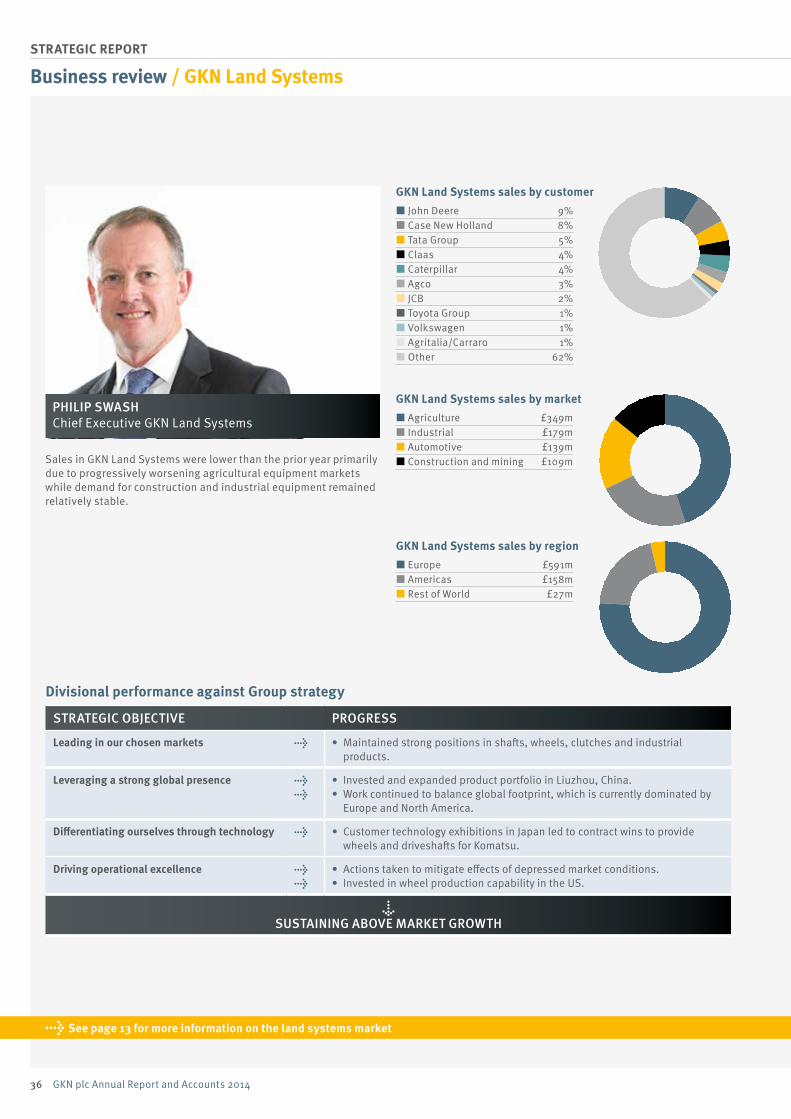
36 GKN plc Annual Report and Accounts 2014
STRATEGIC REPORT
GKN Land Systems sales by market Agriculture £349m Industrial £179m Automotive £139m Construction and mining £109m
GKN Land Systems sales by region Europe £591m Americas £158m Rest of World £27m
Management sales GKN Aero customer GKN Aero market
GKN Aero productGKN driveline customerGKN driveline productGKN driveline region
management pro�t
metallurgy 2 metallurgy product
landsystems market landsystems region
metallurgy customer landsystems customer
Management sales GKN Aero customer GKN Aero market
GKN Aero productGKN driveline customerGKN driveline productGKN driveline region
management pro�t
metallurgy 2 metallurgy product
landsystems market landsystems region
metallurgy customer landsystems customer
Management sales GKN Aero customer GKN Aero market
GKN Aero productGKN driveline customerGKN driveline productGKN driveline region
management pro�t
metallurgy 2 metallurgy product
landsystems market landsystems region
metallurgy customer landsystems customer
GKN Land Systems sales by customer John Deere 9% Case New Holland 8% Tata Group 5% Claas 4% Caterpillar 4% Agco 3% JCB 2% Toyota Group 1% Volkswagen 1% Agritalia/Carraro 1% Other 62%
Business review / GKN Land Systems
Divisional performance against Group strategy
STRATEGIC OBJECTIVE PROGRESS
Leading in our chosen markets → • Maintained strong positions in shafts, wheels, clutches and industrial products.
Leveraging a strong global presence →→
• Invested and expanded product portfolio in Liuzhou, China.• Work continued to balance global footprint, which is currently dominated by
Europe and North America.
Differentiating ourselves through technology → • Customer technology exhibitions in Japan led to contract wins to provide wheels and driveshafts for Komatsu.
Driving operational excellence →→
• Actions taken to mitigate effects of depressed market conditions.• Invested in wheel production capability in the US.
↓ SUSTAINING ABOVE MARKET GROWTH
PHILIP SWASH Chief Executive GKN Land Systems
Sales in GKN Land Systems were lower than the prior year primarily due to progressively worsening agricultural equipment markets while demand for construction and industrial equipment remained relatively stable.
→ See page 13 for more information on the land systems market
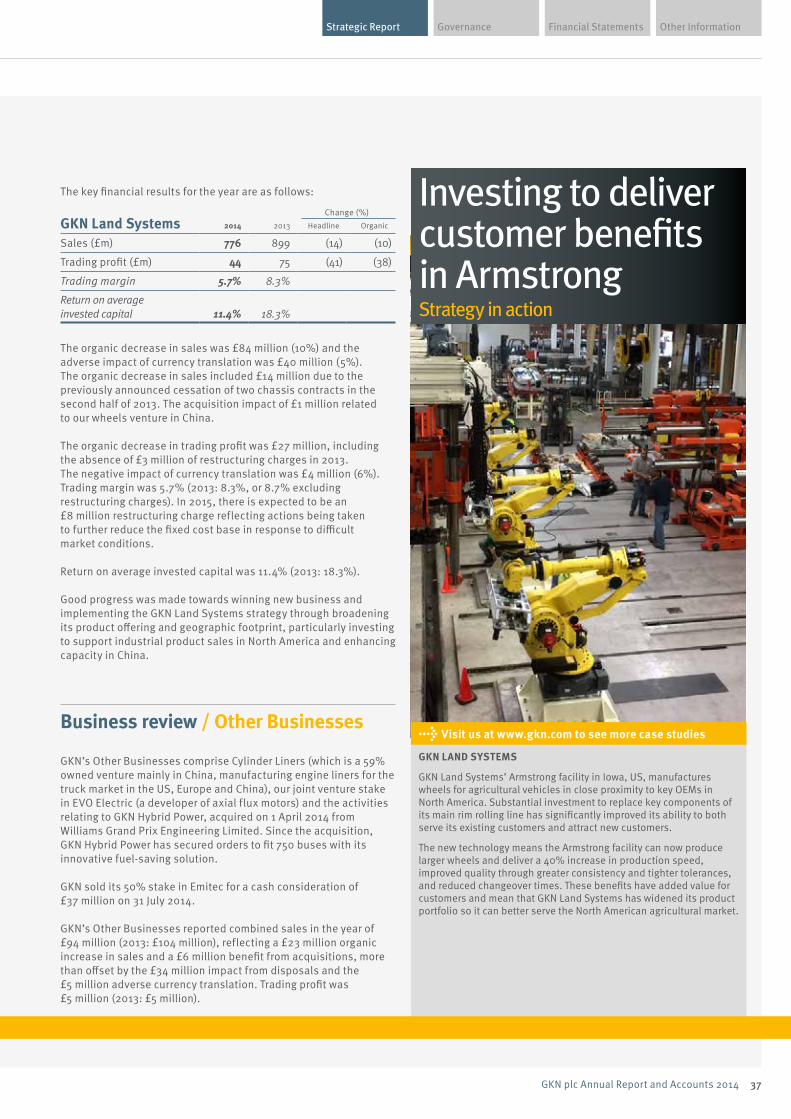
Financial Statements Other InformationGovernanceStrategic Report
37GKN plc Annual Report and Accounts 2014
The key financial results for the year are as follows:
GKN Land SystemsChange (%)
2014 2013 Headline Organic
Sales (£m) 776 899 (14) (10)
Trading profit (£m) 44 75 (41) (38)
Trading margin 5.7% 8.3%
Return on average invested capital 11.4% 18.3%
The organic decrease in sales was £84 million (10%) and the adverse impact of currency translation was £40 million (5%). The organic decrease in sales included £14 million due to the previously announced cessation of two chassis contracts in the second half of 2013. The acquisition impact of £1 million related to our wheels venture in China.
The organic decrease in trading profit was £27 million, including the absence of £3 million of restructuring charges in 2013. The negative impact of currency translation was £4 million (6%). Trading margin was 5.7% (2013: 8.3%, or 8.7% excluding restructuring charges). In 2015, there is expected to be an £8 million restructuring charge reflecting actions being taken to further reduce the fixed cost base in response to difficult market conditions.
Return on average invested capital was 11.4% (2013: 18.3%).
Good progress was made towards winning new business and implementing the GKN Land Systems strategy through broadening its product offering and geographic footprint, particularly investing to support industrial product sales in North America and enhancing capacity in China.
Investing to deliver customer benefits in ArmstrongStrategy in action
→ Visit us at www.gkn.com to see more case studies
GKN LAND SYSTEMS
GKN Land Systems’ Armstrong facility in Iowa, US, manufactures wheels for agricultural vehicles in close proximity to key OEMs in North America. Substantial investment to replace key components of its main rim rolling line has significantly improved its ability to both serve its existing customers and attract new customers.
The new technology means the Armstrong facility can now produce larger wheels and deliver a 40% increase in production speed, improved quality through greater consistency and tighter tolerances, and reduced changeover times. These benefits have added value for customers and mean that GKN Land Systems has widened its product portfolio so it can better serve the North American agricultural market.
Business review / Other Businesses
GKN’s Other Businesses comprise Cylinder Liners (which is a 59% owned venture mainly in China, manufacturing engine liners for the truck market in the US, Europe and China), our joint venture stake in EVO Electric (a developer of axial flux motors) and the activities relating to GKN Hybrid Power, acquired on 1 April 2014 from Williams Grand Prix Engineering Limited. Since the acquisition, GKN Hybrid Power has secured orders to fit 750 buses with its innovative fuel-saving solution.
GKN sold its 50% stake in Emitec for a cash consideration of £37 million on 31 July 2014.
GKN’s Other Businesses reported combined sales in the year of £94 million (2013: £104 million), reflecting a £23 million organic increase in sales and a £6 million benefit from acquisitions, more than offset by the £34 million impact from disposals and the £5 million adverse currency translation. Trading profit was £5 million (2013: £5 million).
38 GKN plc Annual Report and Accounts 2014
STRATEGIC REPORT
Business review / Other financial information
Corporate costsCorporate costs, which comprise the costs of stewardship of the Group and operating charges and credits associated with the Group’s legacy businesses, were £20 million (2013: £25 million), primarily due to a lower charge in relation to future incentive schemes.
Items excluded from management trading profitIn order to achieve consistency and comparability between reporting periods, the following items are excluded from management measures as they do not reflect trading activity:
Change in value of derivative and other financial instruments The change in value of derivative and other financial instruments during the year resulted in a loss of £209 million (2013: profit of £26 million).
When the business wins long term customer contracts that are in a foreign currency, the Group offsets the potential volatility of the future cash flows by hedging through forward foreign exchange contracts. At each period end, the Group is required to mark to market these contracts even though it has no intention of closing them out in advance of their maturity dates.
At 31 December 2014, the net fair value of such instruments was a liability of £180 million (2013: asset of £52 million) and the change in fair value during the year was a £232 million charge (2013: £19 million credit).
There was also a £4 million credit arising from the change in the fair value of embedded derivatives in the year (2013: £4 million charge) and a net gain of £19 million attributable to the currency impact on Group funding balances (2013: £11 million net gain).
Amortisation of non-operating intangible assets arising on business combinations The charge for the amortisation of non-operating intangible assets arising on business combinations (for example, customer contracts, order backlog, technology and intellectual property rights) was £69 million (2013: £75 million).
Gains and losses on changes in Group structureThe net gain on changes in Group structure was £24 million (2013: £12 million).
On 31 July 2014, the Group sold its 50% share in Emitec, a joint venture company, for a cash consideration of £37 million. The carrying value on the date of disposal was £14 million and £1 million of previous currency variations were reclassified from other reserves resulting in a profit on sale of £24 million.
Impairment chargesConsistent with previous years, goodwill was tested for impairment. As a result of difficult markets and reduced sales of certain products during the year, an impairment charge of £69 million (2013: nil) has been recorded in respect of three cash generating units; two in Aerospace and one in Land Systems. Additionally, an impairment charge has been recorded against the carrying value of an investment balance of £4 million in Other Businesses.
Post-tax earnings of joint venturesOn a management basis, the sales and trading profits of joint ventures are included pro rata in the individual divisions to which they relate, although shown separately post-tax in the statutory income statement.
The Group’s share of post-tax earnings on a management basis were £62 million (2013: £54 million), with trading profit of £75 million (2013: £64 million). The Group’s share of the tax and interest charges amounted to £13 million (2013: £10 million). Underlying trading profit increased by £13 million, reflecting a strong trading performance by our joint venture companies, primarily in China.
Net financing costsNet financing costs totalled £129 million (2013: £128 million) and comprise the net interest payable of £73 million (2013: £73 million), the non-cash charge on post-employment benefits of £50 million (2013: £45 million), fair value changes in net investment hedges of £3 million credit (2013: nil) and a charge for unwind of discounts of £9 million (2013: £10 million). The non-cash charge on post-employment benefits, fair value changes in net investment hedges and unwind of discounts are not included in management figures. Details of the assumptions used in calculating post-employment costs are provided in note 24.
Interest payable was £75 million (2013: £76 million), whilst interest receivable was £2 million (2013: £3 million) resulting in net interest payable of £73 million (2013: £73 million).
Interest charged on Government refundable advances was £7 million (2013: £6 million).
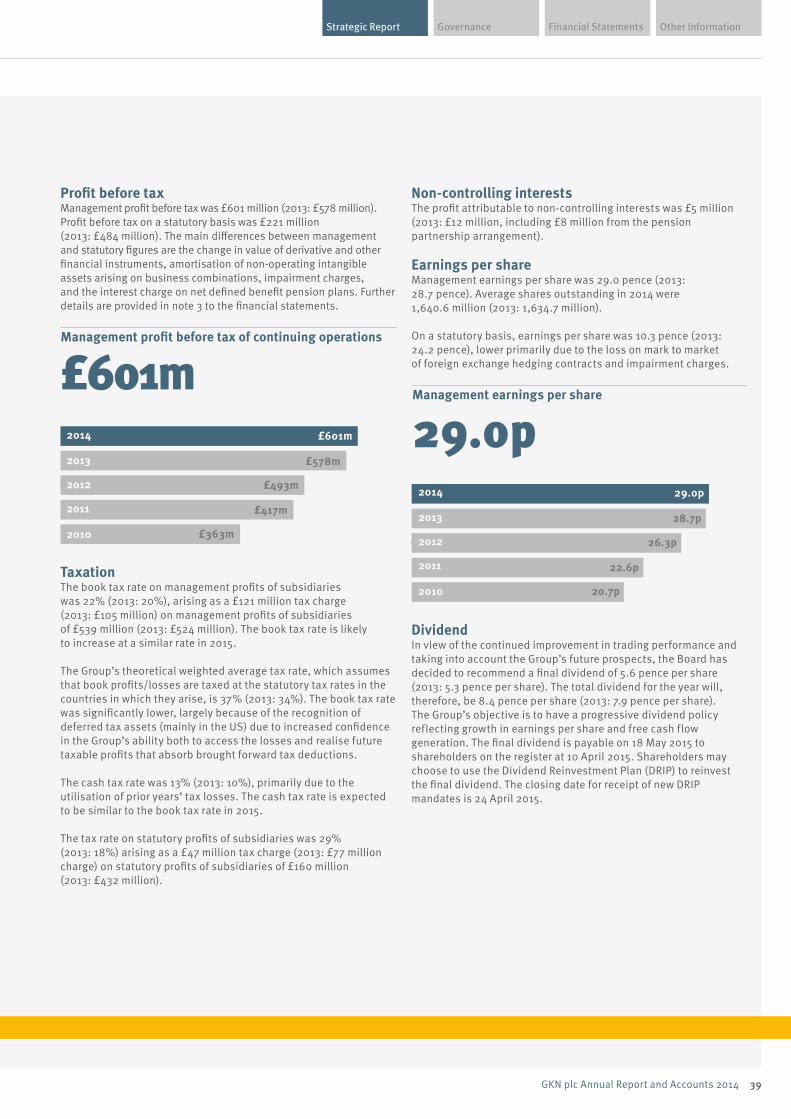
Financial Statements Other InformationGovernanceStrategic Report
39GKN plc Annual Report and Accounts 2014
Profit before tax Management profit before tax was £601 million (2013: £578 million). Profit before tax on a statutory basis was £221 million (2013: £484 million). The main differences between management and statutory figures are the change in value of derivative and other financial instruments, amortisation of non-operating intangible assets arising on business combinations, impairment charges, and the interest charge on net defined benefit pension plans. Further details are provided in note 3 to the financial statements.
Management pro�t before tax of continuing operations
£601mManagement earnings per share
29.0p2014
2013
2012
2011
2010
£601m 2014
2013
2012
2011
2010
29.0p
£578m
£493m
£417m
£363m
28.7p
26.3p
22.6p
20.7p
Operating cash flow
£343mNet debt
£624m2014
2013
2012
2011
2010
£343m £624m2014
2013
2012
2011
2010
£437m
£210m
£227m
£245m
£732m
£871m
£538m
£151m
TaxationThe book tax rate on management profits of subsidiaries was 22% (2013: 20%), arising as a £121 million tax charge (2013: £105 million) on management profits of subsidiaries of £539 million (2013: £524 million). The book tax rate is likely to increase at a similar rate in 2015.
The Group’s theoretical weighted average tax rate, which assumes that book profits/losses are taxed at the statutory tax rates in the countries in which they arise, is 37% (2013: 34%). The book tax rate was significantly lower, largely because of the recognition of deferred tax assets (mainly in the US) due to increased confidence in the Group’s ability both to access the losses and realise future taxable profits that absorb brought forward tax deductions.
The cash tax rate was 13% (2013: 10%), primarily due to the utilisation of prior years’ tax losses. The cash tax rate is expected to be similar to the book tax rate in 2015.
The tax rate on statutory profits of subsidiaries was 29% (2013: 18%) arising as a £47 million tax charge (2013: £77 million charge) on statutory profits of subsidiaries of £160 million (2013: £432 million).
Non-controlling interests The profit attributable to non-controlling interests was £5 million (2013: £12 million, including £8 million from the pension partnership arrangement).
Earnings per shareManagement earnings per share was 29.0 pence (2013: 28.7 pence). Average shares outstanding in 2014 were 1,640.6 million (2013: 1,634.7 million).
On a statutory basis, earnings per share was 10.3 pence (2013: 24.2 pence), lower primarily due to the loss on mark to market of foreign exchange hedging contracts and impairment charges.
Management pro�t before tax of continuing operations
£601mManagement earnings per share
29.0p2014
2013
2012
2011
2010
£601m 2014
2013
2012
2011
2010
29.0p
£578m
£493m
£417m
£363m
28.7p
26.3p
22.6p
20.7p
Operating cash flow
£343mNet debt
£624m2014
2013
2012
2011
2010
£343m £624m2014
2013
2012
2011
2010
£437m
£210m
£227m
£245m
£732m
£871m
£538m
£151m
DividendIn view of the continued improvement in trading performance and taking into account the Group’s future prospects, the Board has decided to recommend a final dividend of 5.6 pence per share (2013: 5.3 pence per share). The total dividend for the year will, therefore, be 8.4 pence per share (2013: 7.9 pence per share). The Group’s objective is to have a progressive dividend policy reflecting growth in earnings per share and free cash flow generation. The final dividend is payable on 18 May 2015 to shareholders on the register at 10 April 2015. Shareholders may choose to use the Dividend Reinvestment Plan (DRIP) to reinvest the final dividend. The closing date for receipt of new DRIP mandates is 24 April 2015.
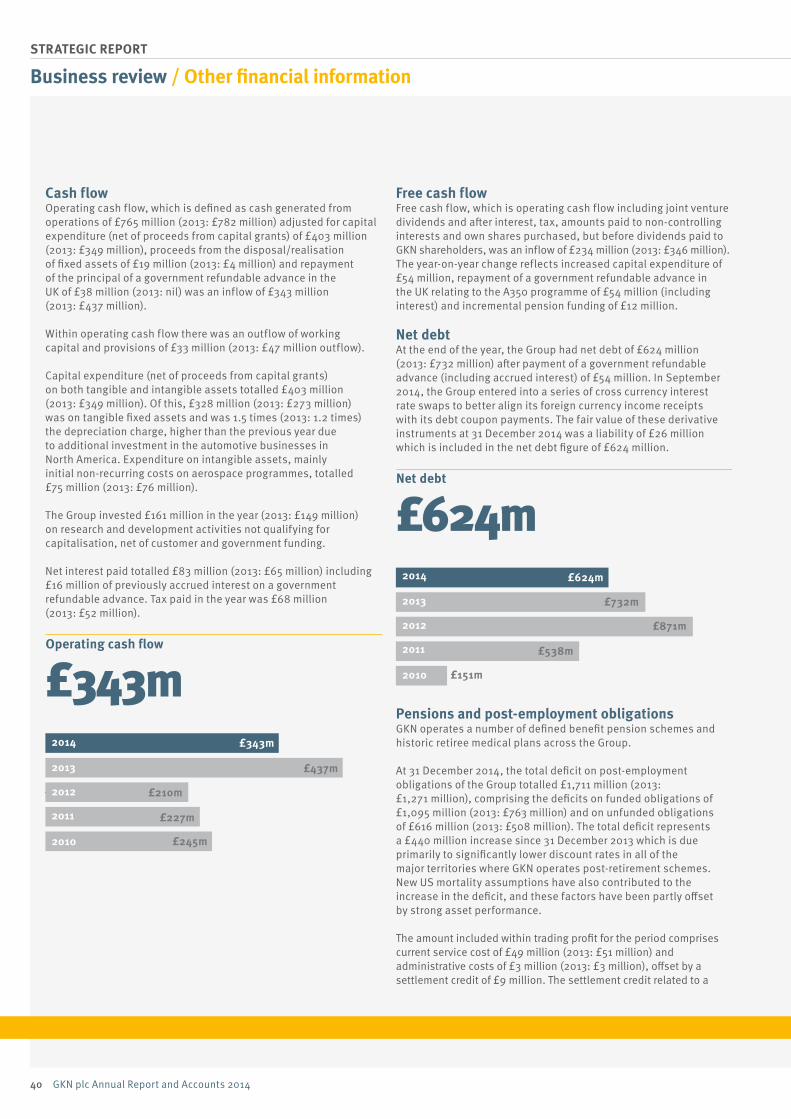
40 GKN plc Annual Report and Accounts 2014
STRATEGIC REPORT
Cash flowOperating cash flow, which is defined as cash generated from operations of £765 million (2013: £782 million) adjusted for capital expenditure (net of proceeds from capital grants) of £403 million (2013: £349 million), proceeds from the disposal/realisation of fixed assets of £19 million (2013: £4 million) and repayment of the principal of a government refundable advance in the UK of £38 million (2013: nil) was an inflow of £343 million (2013: £437 million).
Within operating cash flow there was an outflow of working capital and provisions of £33 million (2013: £47 million outflow).
Capital expenditure (net of proceeds from capital grants) on both tangible and intangible assets totalled £403 million (2013: £349 million). Of this, £328 million (2013: £273 million) was on tangible fixed assets and was 1.5 times (2013: 1.2 times) the depreciation charge, higher than the previous year due to additional investment in the automotive businesses in North America. Expenditure on intangible assets, mainly initial non-recurring costs on aerospace programmes, totalled £75 million (2013: £76 million).
The Group invested £161 million in the year (2013: £149 million) on research and development activities not qualifying for capitalisation, net of customer and government funding.
Net interest paid totalled £83 million (2013: £65 million) including £16 million of previously accrued interest on a government refundable advance. Tax paid in the year was £68 million (2013: £52 million).
Management pro�t before tax of continuing operations
£601mManagement earnings per share
29.0p2014
2013
2012
2011
2010
£601m 2014
2013
2012
2011
2010
29.0p
£578m
£493m
£417m
£363m
28.7p
26.3p
22.6p
20.7p
Operating cash flow
£343mNet debt
£624m2014
2013
2012
2011
2010
£343m £624m2014
2013
2012
2011
2010
£437m
£210m
£227m
£245m
£732m
£871m
£538m
£151m
Free cash flowFree cash flow, which is operating cash flow including joint venture dividends and after interest, tax, amounts paid to non-controlling interests and own shares purchased, but before dividends paid to GKN shareholders, was an inflow of £234 million (2013: £346 million). The year-on-year change reflects increased capital expenditure of £54 million, repayment of a government refundable advance in the UK relating to the A350 programme of £54 million (including interest) and incremental pension funding of £12 million.
Net debtAt the end of the year, the Group had net debt of £624 million (2013: £732 million) after payment of a government refundable advance (including accrued interest) of £54 million. In September 2014, the Group entered into a series of cross currency interest rate swaps to better align its foreign currency income receipts with its debt coupon payments. The fair value of these derivative instruments at 31 December 2014 was a liability of £26 million which is included in the net debt figure of £624 million.
Management pro�t before tax of continuing operations
£601mManagement earnings per share
29.0p2014
2013
2012
2011
2010
£601m 2014
2013
2012
2011
2010
29.0p
£578m
£493m
£417m
£363m
28.7p
26.3p
22.6p
20.7p
Operating cash flow
£343mNet debt
£624m2014
2013
2012
2011
2010
£343m £624m2014
2013
2012
2011
2010
£437m
£210m
£227m
£245m
£732m
£871m
£538m
£151m
Pensions and post-employment obligationsGKN operates a number of defined benefit pension schemes and historic retiree medical plans across the Group.
At 31 December 2014, the total deficit on post-employment obligations of the Group totalled £1,711 million (2013: £1,271 million), comprising the deficits on funded obligations of £1,095 million (2013: £763 million) and on unfunded obligations of £616 million (2013: £508 million). The total deficit represents a £440 million increase since 31 December 2013 which is due primarily to significantly lower discount rates in all of the major territories where GKN operates post-retirement schemes. New US mortality assumptions have also contributed to the increase in the deficit, and these factors have been partly offset by strong asset performance.
The amount included within trading profit for the period comprises current service cost of £49 million (2013: £51 million) and administrative costs of £3 million (2013: £3 million), offset by a settlement credit of £9 million. The settlement credit related to a
Business review / Other financial information
Financial Statements Other InformationGovernanceStrategic Report
41GKN plc Annual Report and Accounts 2014
voluntary programme run in the US which offered deferred members the opportunity to take a cash lump sum in lieu of a future pension. Interest on net defined benefit plans, which is excluded from management figures, was £50 million (2013: £45 million).
Cash contributions to the various defined benefit pension schemes and retiree medical arrangements totalled £108 million (2013: £112 million).
UK pensionsThe accounting deficit for UK schemes increased to £1,005 million (2013: £714 million), due to the application of lower discount rates.
Both UK pension schemes (GKN 1, a mature scheme, and GKN 2, with a larger active and deferred population) underwent funding valuations as at 5 April 2013 and final agreement was reached on the valuation and resulting deficit recovery plan for each scheme during the year. The agreed deficit recovery plan requires payments of £10 million per year and the potential for further additional payments commencing in 2016, contingent upon asset performance. The first payment of £10 million was made during the year. This is in addition to a £30 million (2013: £30 million) annual payment made under the Group’s pension partnership arrangement.
Early in the year, a bulk annuity pensioner 'buy-in' was completed in relation to the UK pension scheme, GKN 1, as a result of which a proportion (c.12%) of GKN 1 liabilities are now fully insured. The transaction involved a payment of £123 million, made from GKN 1’s assets. This gave rise to an additional scheme funding requirement of £8 million which the Group will pay to GKN 1 over a four-year period. The first payment of £2 million was made during the year.
Defined contribution pension schemesIn addition to defined benefit pension schemes, the Group also operates a number of defined contribution schemes for which the income statement charge was £35 million (2013: £34 million).
Net assetsNet assets of £1,501 million were £294 million lower than the December 2013 year end figure of £1,795 million. The decrease includes management profit after tax of £480 million more than offset by dividends paid to equity shareholders of £133 million, currency on translation of subsidiaries and joint ventures net of tax and the change in value of derivative and other financial instruments of £182 million and a loss on remeasurement of defined benefit plans of £485 million.
Treasury managementAll treasury activities are co-ordinated through a central function (Group Treasury), the purpose of which is to manage the financial risks of the Group and to secure short and long term funding at the minimum cost to the Group. It operates within a framework of clearly defined Board-approved policies and procedures, including permissible funding and hedging instruments, exposure limits and a system of authorities for the approval and execution of transactions. It operates on a cost centre basis and is not permitted to make use of financial instruments or other derivatives
other than to hedge identified exposures of the Group. Speculative use of such instruments or derivatives is not permitted. Group Treasury prepares reports at least annually to the Board, and on a monthly basis to the Finance Director and other senior executives of the Group. In addition, liquidity, interest rate, currency and other financial risk exposures are monitored weekly. The overall indebtedness of the Group is reported on a weekly basis to the Chief Executive and the Finance Director.
Funding, liquidity and going concernAt 31 December 2014, UK committed bank facilities were £880 million. Within this amount there are committed revolving credit facilities of £800 million (31 December 2013: £837 million) and an £80 million eight-year amortising facility from the European Investment Bank (EIB). The revolving credit facilities of £800 million, renegotiated during the year, mature in 2019, whilst the first of five equal, annual £16 million EIB repayments falls due in 2015. At 31 December 2014, the £80 million EIB facility was fully drawn (2013: £80 million fully drawn) and there were no drawings on any of the UK revolving credit facilities (2013: no drawings).
Capital market borrowings at 31 December 2014 comprised a £350 million 6.75% annual unsecured bond maturing in October 2019 and a £450 million 5.375% semi-annual unsecured bond maturing in September 2022.
As at 31 December 2014, the Group had net debt of £624 million (31 December 2013: £732 million).
All of the Group’s committed credit facilities have financial covenants requiring EBITDA of subsidiaries to be at least 3.5 times net interest payable and for net debt to be no greater than 3 times EBITDA of subsidiaries. The covenants are tested every six months using the previous 12 months’ results. For the 12 months to 31 December 2014, EBITDA was 11.8 times greater than net interest payable, whilst net debt was 0.7 times EBITDA.
The Group entered into a series of cross currency interest rate swaps during the year to better align its foreign currency income receipts in USD and EUR with its debt and had the effect of converting its Sterling bonds into US Dollars ($951 million) and Euros (€284 million). The cross currency interest rate swaps have been designated as a net investment hedge of the Group’s USD and EUR net assets. The fair value of the cross currency interest rate swaps at 31 December 2014 was a liability of £26 million (2013: nil).
The Directors have taken into account both divisional and Group forecasts for the 18 months from the balance sheet date to assess the future funding requirements of the Group and compared them to the level of committed available borrowing facilities, described above. The Directors have concluded that the Group will have a sufficient level of headroom in the foreseeable future and that the likelihood of breaching covenants in this period is remote, such that it is appropriate for the financial statements to be prepared on a going concern basis.
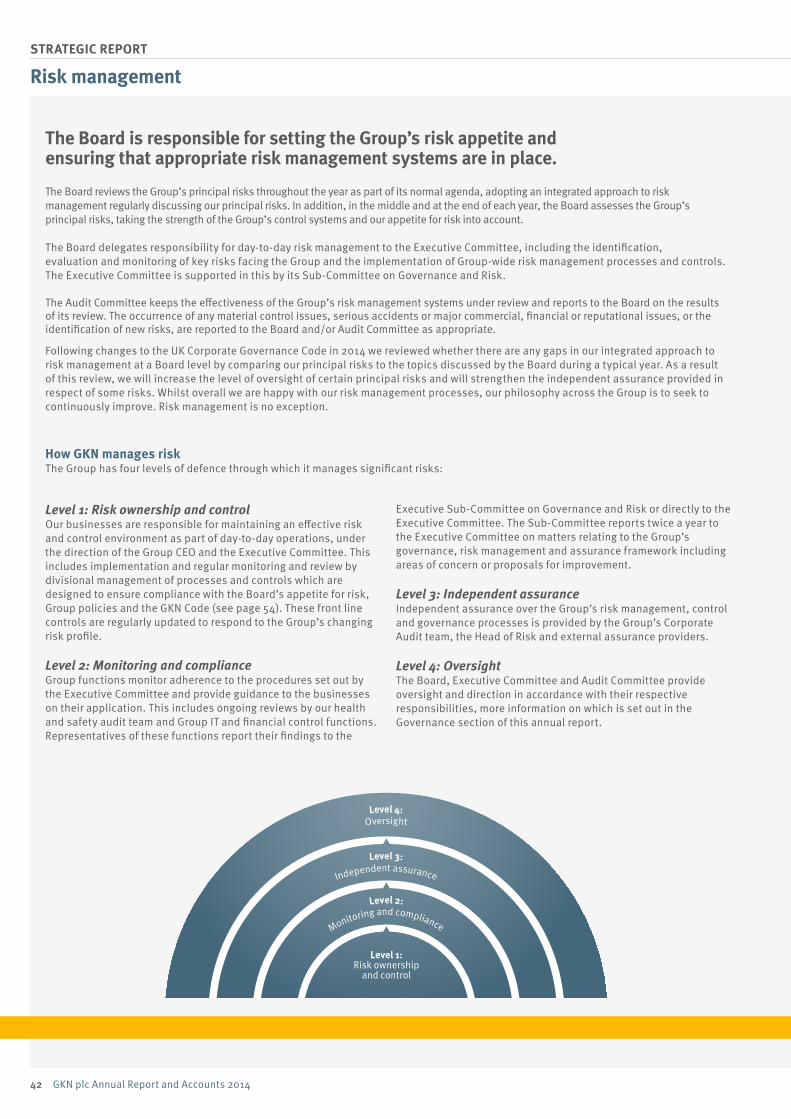
42 GKN plc Annual Report and Accounts 2014
STRATEGIC REPORT
Level 4:Oversight
Level 3:
Independent assurance
Monitoring and compliance
Level 1:Risk ownership
and control
Level 2:
The Board is responsible for setting the Group’s risk appetite and ensuring that appropriate risk management systems are in place.
The Board reviews the Group’s principal risks throughout the year as part of its normal agenda, adopting an integrated approach to risk management regularly discussing our principal risks. In addition, in the middle and at the end of each year, the Board assesses the Group’s principal risks, taking the strength of the Group’s control systems and our appetite for risk into account.
The Board delegates responsibility for day-to-day risk management to the Executive Committee, including the identification, evaluation and monitoring of key risks facing the Group and the implementation of Group-wide risk management processes and controls. The Executive Committee is supported in this by its Sub-Committee on Governance and Risk.
The Audit Committee keeps the effectiveness of the Group’s risk management systems under review and reports to the Board on the results of its review. The occurrence of any material control issues, serious accidents or major commercial, financial or reputational issues, or the identification of new risks, are reported to the Board and/or Audit Committee as appropriate.
Following changes to the UK Corporate Governance Code in 2014 we reviewed whether there are any gaps in our integrated approach to risk management at a Board level by comparing our principal risks to the topics discussed by the Board during a typical year. As a result of this review, we will increase the level of oversight of certain principal risks and will strengthen the independent assurance provided in respect of some risks. Whilst overall we are happy with our risk management processes, our philosophy across the Group is to seek to continuously improve. Risk management is no exception.
How GKN manages risk The Group has four levels of defence through which it manages significant risks:
Level 1: Risk ownership and control Our businesses are responsible for maintaining an effective risk and control environment as part of day-to-day operations, under the direction of the Group CEO and the Executive Committee. This includes implementation and regular monitoring and review by divisional management of processes and controls which are designed to ensure compliance with the Board’s appetite for risk, Group policies and the GKN Code (see page 54). These front line controls are regularly updated to respond to the Group’s changing risk profile.
Level 2: Monitoring and compliance Group functions monitor adherence to the procedures set out by the Executive Committee and provide guidance to the businesses on their application. This includes ongoing reviews by our health and safety audit team and Group IT and financial control functions. Representatives of these functions report their findings to the
Executive Sub-Committee on Governance and Risk or directly to the Executive Committee. The Sub-Committee reports twice a year to the Executive Committee on matters relating to the Group’s governance, risk management and assurance framework including areas of concern or proposals for improvement.
Level 3: Independent assurance Independent assurance over the Group’s risk management, control and governance processes is provided by the Group’s Corporate Audit team, the Head of Risk and external assurance providers.
Level 4: Oversight The Board, Executive Committee and Audit Committee provide oversight and direction in accordance with their respective responsibilities, more information on which is set out in the Governance section of this annual report.
Risk management
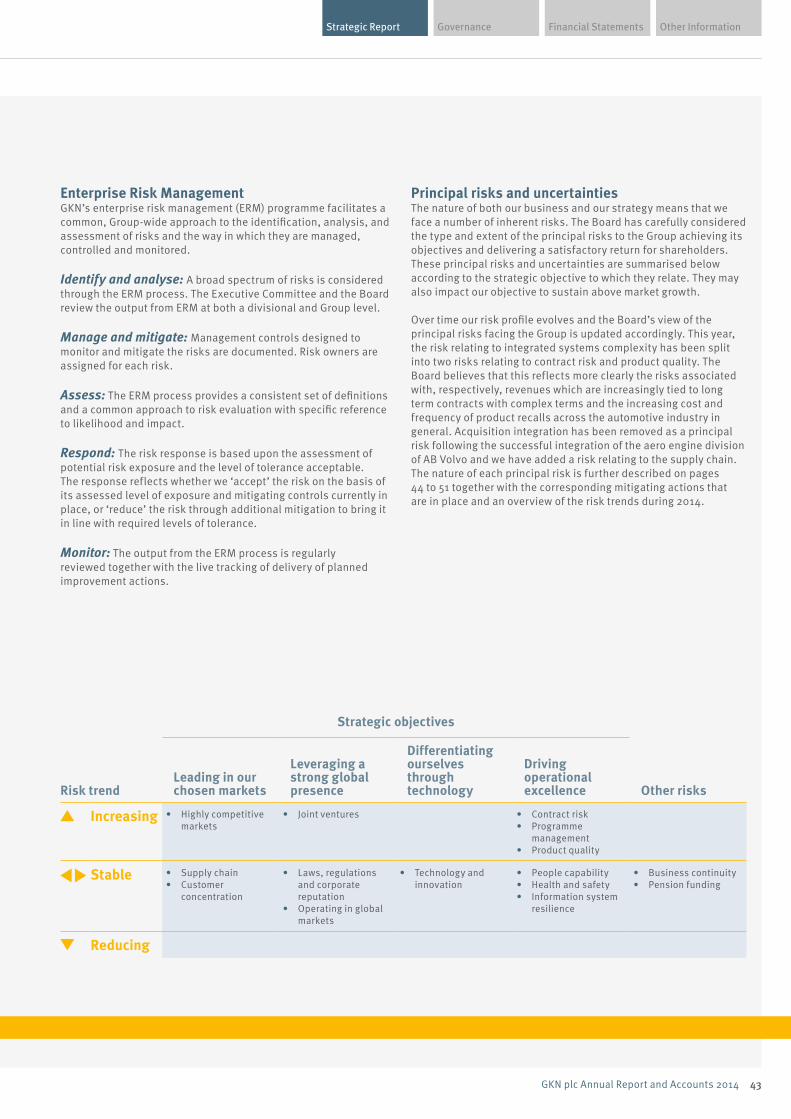
Financial Statements Other InformationGovernanceStrategic Report
43GKN plc Annual Report and Accounts 2014
Enterprise Risk ManagementGKN’s enterprise risk management (ERM) programme facilitates a common, Group-wide approach to the identification, analysis, and assessment of risks and the way in which they are managed, controlled and monitored.
Identify and analyse: A broad spectrum of risks is considered through the ERM process. The Executive Committee and the Board review the output from ERM at both a divisional and Group level.
Manage and mitigate: Management controls designed to monitor and mitigate the risks are documented. Risk owners are assigned for each risk.
Assess: The ERM process provides a consistent set of definitions and a common approach to risk evaluation with specific reference to likelihood and impact.
Respond: The risk response is based upon the assessment of potential risk exposure and the level of tolerance acceptable. The response reflects whether we ‘accept’ the risk on the basis of its assessed level of exposure and mitigating controls currently in place, or ‘reduce’ the risk through additional mitigation to bring it in line with required levels of tolerance.
Monitor: The output from the ERM process is regularly reviewed together with the live tracking of delivery of planned improvement actions.
Principal risks and uncertaintiesThe nature of both our business and our strategy means that we face a number of inherent risks. The Board has carefully considered the type and extent of the principal risks to the Group achieving its objectives and delivering a satisfactory return for shareholders. These principal risks and uncertainties are summarised below according to the strategic objective to which they relate. They may also impact our objective to sustain above market growth.
Over time our risk profile evolves and the Board’s view of the principal risks facing the Group is updated accordingly. This year, the risk relating to integrated systems complexity has been split into two risks relating to contract risk and product quality. The Board believes that this reflects more clearly the risks associated with, respectively, revenues which are increasingly tied to long term contracts with complex terms and the increasing cost and frequency of product recalls across the automotive industry in general. Acquisition integration has been removed as a principal risk following the successful integration of the aero engine division of AB Volvo and we have added a risk relating to the supply chain. The nature of each principal risk is further described on pages 44 to 51 together with the corresponding mitigating actions that are in place and an overview of the risk trends during 2014.
Strategic objectives
Risk trendLeading in our chosen markets
Leveraging a strong global presence
Differentiating ourselves through technology
Driving operational excellence Other risks
Increasing • Highly competitive markets
• Joint ventures • Contract risk• Programme
management • Product quality
Stable • Supply chain• Customer
concentration
• Laws, regulations and corporate reputation
• Operating in global markets
• Technology and innovation
• People capability• Health and safety• Information system
resilience
• Business continuity• Pension funding
Reducing
44 GKN plc Annual Report and Accounts 2014
STRATEGIC REPORT
Risk management / Principal risks and uncertainties
Highly competitive markets Leading in our chosen markets
Risk trend Description and potential impact Mitigation
Increasing
▴GKN operates in highly competitive markets with customer decisions typically based on price, quality, technology and service. Contracts for major programmes are subject to highly competitive bidding processes and the strength of our competitors and general market conditions continue to drive price pressure and more challenging contractual terms.
In those countries where we have strong margins, these margins may come under pressure as our competitors improve, particularly if the relevant markets slow. An inability or delay in developing or maintaining sufficient or appropriate engineering and manufacturing capabilities in high growth markets could further increase the risk.
Customer vertical integration (including OEMs taking production in-house), the entry of new competitors or consolidation of existing competitors also contribute to increased competition.
Potential impactCompetition, if not mitigated, could result in reduced sales and profit margins and potentially lost growth opportunities in high growth markets. An inability to secure new business awards on major programmes could significantly impact future growth, cash flow and profitability.
• Maintaining a balanced portfolio of businesses across our markets provides some protection against competition in individual markets or countries.
• Continual review of competition and market trends.• Targeted investment in engineering, Lean manufacturing
resources, quality and customer relationships.
Changes during 2014Strong competition and customer pricing pressures have continued throughout 2014. Pressure on margins is increasing in high growth markets such as China and competition is particularly strong in areas of new and emerging technologies. Despite these challenges, we continue to win new business and differentiate ourselves through our technology.
The strategic report on page 13 includes more information on the trends in each of our markets.
Supply chain Leading in our chosen markets
Risk trend Description and potential impact Mitigation
Stable
◂▸
Our suppliers are key to our success. It is essential that suppliers and subcontractors continue to meet our high standards of technical competence, innovation, product quality, reliability, delivery performance, cost, financial stability, safety, ethics and social responsibility.
Our supply chain network is exposed to potentially adverse events such as physical disruptions, environmental and industrial accidents, and scarcity of supply or bankruptcy of a key supplier which could impact our ability to deliver orders to our customers.
The cost of our products can be significantly affected by the cost of the underlying commodities and materials from which they are made. Fluctuations in these costs cannot always be passed on to the customer through pricing.
Potential impactA sustained supply chain disruption, or the delivery of defective product to us, could impact our ability to meet customer requirements, result in additional contractual liabilities and have a consequential impact on financial performance.
• Contract terms and conditions that require our suppliers to meet specified performance standards.
• Ongoing assessment of supplier technology and dependency. • Monitoring of the financial and operational viability of key
suppliers. • Ongoing monitoring of inventory levels to ensure availability in
times of production volatility. • Contingency plans designed to enable us to secure alternative
key material supplies at short notice, to transfer or share production between manufacturing sites and to use substitute materials where required.
• Dual sourcing where appropriate to reduce dependence on single suppliers.
• Supplier quality reviews and audits.
Changes during 2014We continue to carefully manage and monitor our supply chains and, where appropriate, build upon long term supplier relationships. In December we introduced a new Supplier Code of Conduct aimed at making it easier and clearer for suppliers to understand what we expect of them (see page 57 for more information).
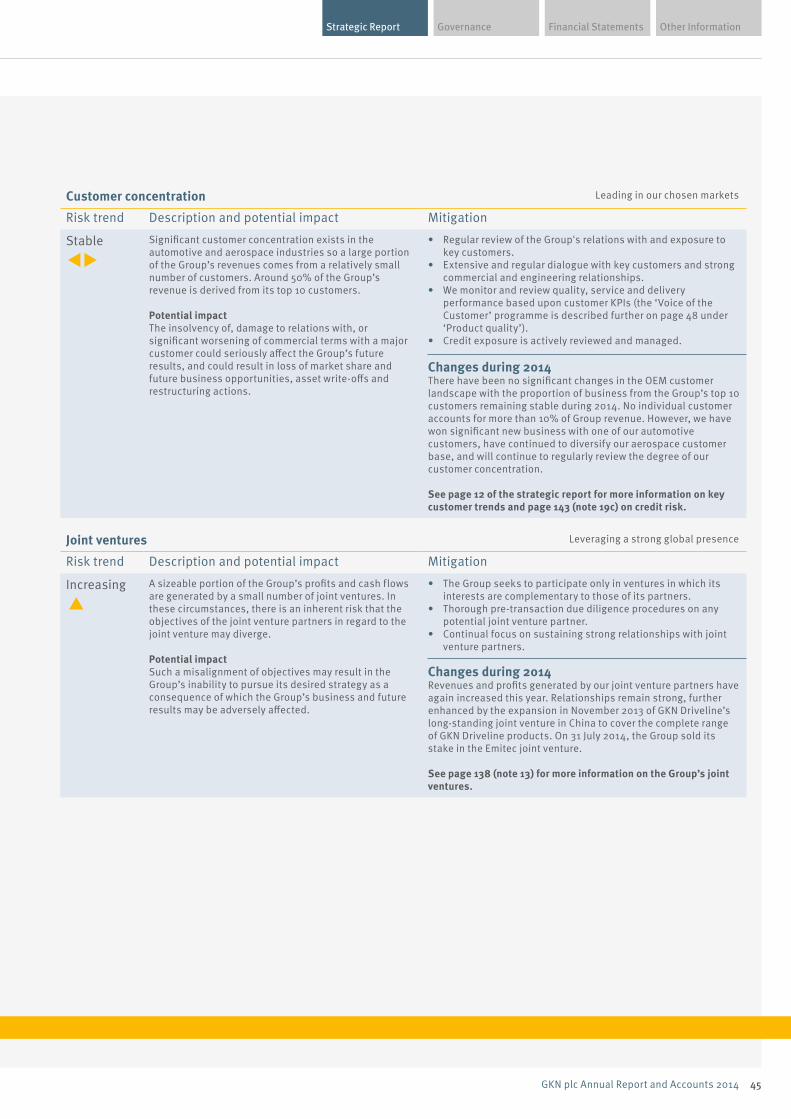
Financial Statements Other InformationGovernanceStrategic Report
45GKN plc Annual Report and Accounts 2014
Customer concentration Leading in our chosen markets
Risk trend Description and potential impact Mitigation
Stable
◂▸ Significant customer concentration exists in the automotive and aerospace industries so a large portion of the Group’s revenues comes from a relatively small number of customers. Around 50% of the Group’s revenue is derived from its top 10 customers.
Potential impactThe insolvency of, damage to relations with, or significant worsening of commercial terms with a major customer could seriously affect the Group’s future results, and could result in loss of market share and future business opportunities, asset write-offs and restructuring actions.
• Regular review of the Group's relations with and exposure to key customers.
• Extensive and regular dialogue with key customers and strong commercial and engineering relationships.
• We monitor and review quality, service and delivery performance based upon customer KPIs (the ‘Voice of the Customer’ programme is described further on page 48 under ‘Product quality’).
• Credit exposure is actively reviewed and managed.
Changes during 2014There have been no significant changes in the OEM customer landscape with the proportion of business from the Group’s top 10 customers remaining stable during 2014. No individual customer accounts for more than 10% of Group revenue. However, we have won significant new business with one of our automotive customers, have continued to diversify our aerospace customer base, and will continue to regularly review the degree of our customer concentration.
See page 12 of the strategic report for more information on key customer trends and page 143 (note 19c) on credit risk.
Joint ventures Leveraging a strong global presence
Risk trend Description and potential impact Mitigation
Increasing
▴A sizeable portion of the Group’s profits and cash flows are generated by a small number of joint ventures. In these circumstances, there is an inherent risk that the objectives of the joint venture partners in regard to the joint venture may diverge.
Potential impactSuch a misalignment of objectives may result in the Group’s inability to pursue its desired strategy as a consequence of which the Group’s business and future results may be adversely affected.
• The Group seeks to participate only in ventures in which its interests are complementary to those of its partners.
• Thorough pre-transaction due diligence procedures on any potential joint venture partner.
• Continual focus on sustaining strong relationships with joint venture partners.
Changes during 2014Revenues and profits generated by our joint venture partners have again increased this year. Relationships remain strong, further enhanced by the expansion in November 2013 of GKN Driveline’s long-standing joint venture in China to cover the complete range of GKN Driveline products. On 31 July 2014, the Group sold its stake in the Emitec joint venture.
See page 138 (note 13) for more information on the Group’s joint ventures.

46 GKN plc Annual Report and Accounts 2014
STRATEGIC REPORT
Risk management / Principal risks and uncertainties
Laws, regulations and corporate reputation Leveraging a strong global presence
Risk trend Description and potential impact Mitigation
Stable
◂▸The Group is subject to applicable laws and regulations in the global jurisdictions and industries in which it operates. This includes certain territories where strong ethical standards may not be well established or where parts of the markets in which we operate are highly regulated. Regulations include those related to export controls, environmental and safety requirements, product safety, tax laws, intellectual property rights, competition laws and ethical business practices.
Tax in particular is a complex area where laws and their interpretation are changing regularly, leading to potential uncertainty in tax exposures.
Potential impactNon-compliance could expose the Group to fines, penalties, damage to reputation, suspension or debarment from government contracting or suspension of export privileges.
• A strong culture of 'doing the right thing' which is regularly emphasised by senior management.
• Group-wide governance policies and procedures, ongoing compliance training and strong oversight.
• Ongoing monitoring of regulatory developments in major jurisdictions.
• Ongoing monitoring of employee concerns through our independent Employee Disclosure Hotline.
Changes during 2014There have been no significant new regulations impacting the Group during 2014, but our markets are subject to increased enforcement activities in relation to existing regulations, particularly in relation to vehicle safety.
In response, we have taken steps to reinforce our commitment across the Group to ‘doing the right thing’ in all activities. This includes emphasising the importance of ‘doing the right thing’ to all senior managers at the Group’s International Leadership Conference and re-launching the GKN Code to remind employees of the standard of behaviour we expect. We continue to strengthen our risk management systems.
See pages 52 to 54 for more information on 'doing the right thing' and 68 to 69 for more information on governance policies and procedures.
Operating in global markets Leveraging a strong global presence
Risk trend Description and potential impact Mitigation
Stable
◂▸We operate globally and as such results could be impacted by global or regional changes in the macroeconomic or political environment, changing consumer demand and preferences, and supply chain volatility.
Our businesses could be impacted by changing consumer preference and associated volatility in automotive demand; challenging credit conditions resulting in lack of access to finance by customers and end consumers; delay or cancellation of orders for civil aircraft and changes in the amount or timing of US military spending; volatility in agricultural, construction, mining and industrial markets; exchange rate fluctuations; and changing oil prices.
Potential impactMajor or prolonged economic or financial market deterioration, including movements in exchange rates of key currencies or political uncertainty in one of our key markets, may significantly impact the Group’s operational performance and financial condition. Sustained market weakness could lead to impairment of assets or site closures. It may also materially impact our customers, suppliers and other parties with whom we do business.
• The Group has a diversified portfolio of businesses across our markets providing some protection against individual market or country risks.
• Lead market indicators are regularly reviewed so that we can respond quickly to changing trading conditions.
• Our mitigation strategy also includes: — planning, budgeting and forecasting processes. — flexible management of variable and fixed cost base,
investment spending and working capital. — further diversification into other sectors which present new
opportunities. — focused restructuring activities, where necessary, to
respond to markets which have suppressed levels of economic activity.
— regular review of our financial risk management processes, including foreign currency hedging.
Changes during 2014During the year we have aligned our debt to the principal currencies in which our revenues and cash flows are generated through cross currency swaps.
We have further strengthened our presence in Asia and Mexico and are working hard to continue to diversify our aerospace customer base.
Further commentary on the recent trends and outlook for each of our markets is set out in the Chief Executive’s review on pages 16 to 19 and the global markets section on pages 12 to 13. For further details on the Group’s financial risk management processes regarding foreign currency exposures see page 142 (note 19).

Financial Statements Other InformationGovernanceStrategic Report
47GKN plc Annual Report and Accounts 2014
Technology and innovation Differentiating ourselves through technology
Risk trend Description and potential impact Mitigation
Stable
◂▸Developing innovative technologies for our customers is critical to maintaining our differentiation and competitive advantage. GKN may lose customers to competitors offering new technologies if we are unable to adapt to or take advantage of market developments such as changes in legislative, regulatory or industry requirements, competitive technologies or consumer preferences.
Potential impactThe failure to launch new products, new product applications or derivatives of existing products to meet customer requirements could have a significant impact on future profitable growth.
• Regular assessment of market and technology trends and drivers.
• Close relationships and technical partnerships with customers.• Divisional technology plans aligned to emerging and future
trends and business strategy.• Regular review of current and future technology plans by the
Group Technology Strategy Board.• Consideration of technology plans as part of the Board’s
annual strategy review.• Focused investment in research and development.
Changes during 2014We have continued to invest in technology as we aim to meet customers’ expectations for improving efficiency of aircraft, cars and other vehicles with solutions that are lighter and more fuel-efficient. We have further strengthened our Engineering Fellowship who support the Board in developing the Group’s technology plan and provide engineering leadership throughout the Group. The Group continues to establish cross-divisional projects aimed at delivering innovative solutions to meet our customer needs across all our markets.
Further commentary on how the Group continues to differentiate itself through technology is included in the business review section on pages 22-37.
Contract risk Driving operational excellence
Risk trend Description and potential impact Mitigation
Increasing
▴Across our businesses an increasing percentage of revenues are generated through contracts which are long term in nature and subject to complex terms and conditions. Contracts include commitments relating to pricing, quality and safety, and technical and customer requirements.
Specifically within the Aerospace business, the Group has risk and revenue sharing partnerships (RRSP) with key engine manufacturers. These contain formalised risk sharing arrangements relating to risks that are not always within GKN management control.
Both our aerospace and automotive businesses enter into design and build contracts. These are complex contracts that are often long term, so it is important that the contracted risk is carefully managed.
Potential impactA failure to fully understand contract risks or to anticipate technical challenges and estimate costs accurately at the outset of a contract can lead to unexpected liabilities, increased outturn costs and reduced profitability.
• Robust bid and contract management processes including thorough reviews of contract terms and conditions, contract-specific risk assessments and clear delegation of authority for approvals.
• Continuous review of contract performance.
Changes during 2014As the Group focuses on providing solutions to its customers, often including a design element, the risks associated with complex contracts increases. The Group regularly reviews ways to further strengthen its contract management processes and this will continue as an area of focus during 2015.
See pages 20 to 37 of the strategic report for more information.
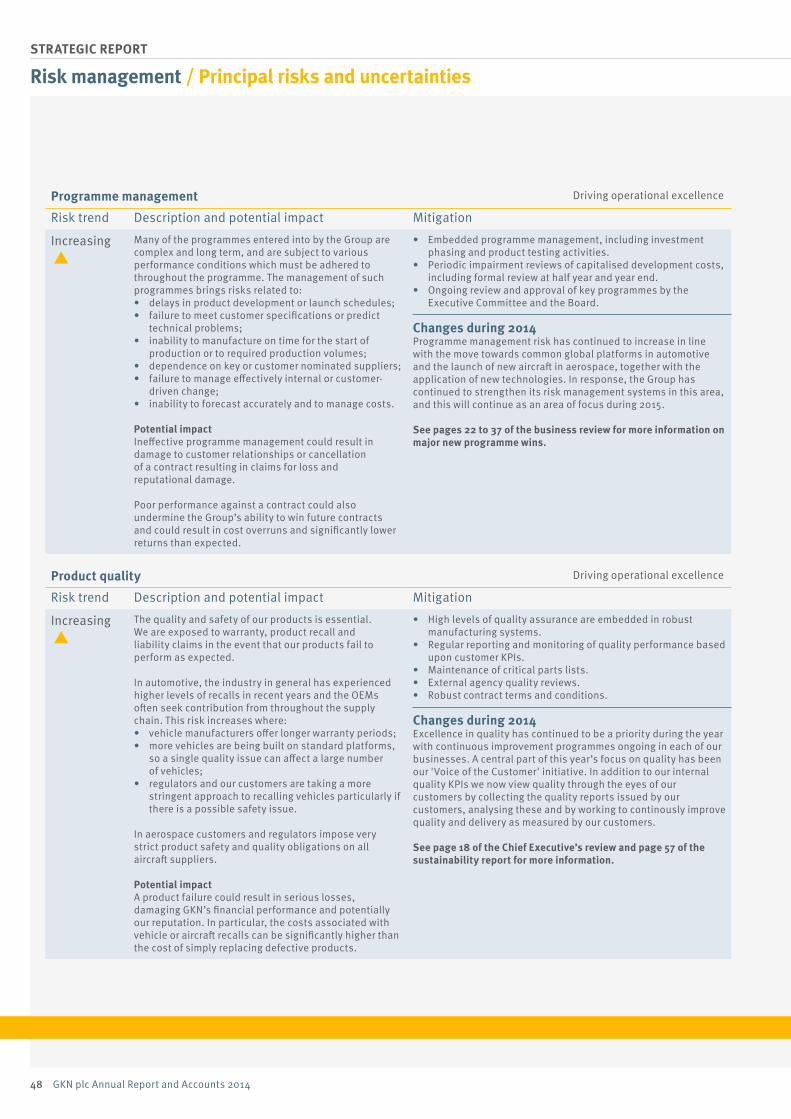
48 GKN plc Annual Report and Accounts 2014
STRATEGIC REPORT
Risk management / Principal risks and uncertainties
Programme management Driving operational excellence
Risk trend Description and potential impact Mitigation
Increasing
▴Many of the programmes entered into by the Group are complex and long term, and are subject to various performance conditions which must be adhered to throughout the programme. The management of such programmes brings risks related to:• delays in product development or launch schedules;• failure to meet customer specifications or predict
technical problems;• inability to manufacture on time for the start of
production or to required production volumes;• dependence on key or customer nominated suppliers;• failure to manage effectively internal or customer-
driven change;• inability to forecast accurately and to manage costs.
Potential impactIneffective programme management could result in damage to customer relationships or cancellation of a contract resulting in claims for loss and reputational damage.
Poor performance against a contract could also undermine the Group’s ability to win future contracts and could result in cost overruns and significantly lower returns than expected.
• Embedded programme management, including investment phasing and product testing activities.
• Periodic impairment reviews of capitalised development costs, including formal review at half year and year end.
• Ongoing review and approval of key programmes by the Executive Committee and the Board.
Changes during 2014Programme management risk has continued to increase in line with the move towards common global platforms in automotive and the launch of new aircraft in aerospace, together with the application of new technologies. In response, the Group has continued to strengthen its risk management systems in this area, and this will continue as an area of focus during 2015.
See pages 22 to 37 of the business review for more information on major new programme wins.
Product quality Driving operational excellence
Risk trend Description and potential impact Mitigation
Increasing
▴The quality and safety of our products is essential. We are exposed to warranty, product recall and liability claims in the event that our products fail to perform as expected.
In automotive, the industry in general has experienced higher levels of recalls in recent years and the OEMs often seek contribution from throughout the supply chain. This risk increases where:• vehicle manufacturers offer longer warranty periods;• more vehicles are being built on standard platforms,
so a single quality issue can affect a large number of vehicles;
• regulators and our customers are taking a more stringent approach to recalling vehicles particularly if there is a possible safety issue.
In aerospace customers and regulators impose very strict product safety and quality obligations on all aircraft suppliers.
Potential impactA product failure could result in serious losses, damaging GKN’s financial performance and potentially our reputation. In particular, the costs associated with vehicle or aircraft recalls can be significantly higher than the cost of simply replacing defective products.
• High levels of quality assurance are embedded in robust manufacturing systems.
• Regular reporting and monitoring of quality performance based upon customer KPIs.
• Maintenance of critical parts lists.• External agency quality reviews.• Robust contract terms and conditions.
Changes during 2014Excellence in quality has continued to be a priority during the year with continuous improvement programmes ongoing in each of our businesses. A central part of this year’s focus on quality has been our 'Voice of the Customer' initiative. In addition to our internal quality KPIs we now view quality through the eyes of our customers by collecting the quality reports issued by our customers, analysing these and by working to continously improve quality and delivery as measured by our customers.
See page 18 of the Chief Executive’s review and page 57 of the sustainability report for more information.
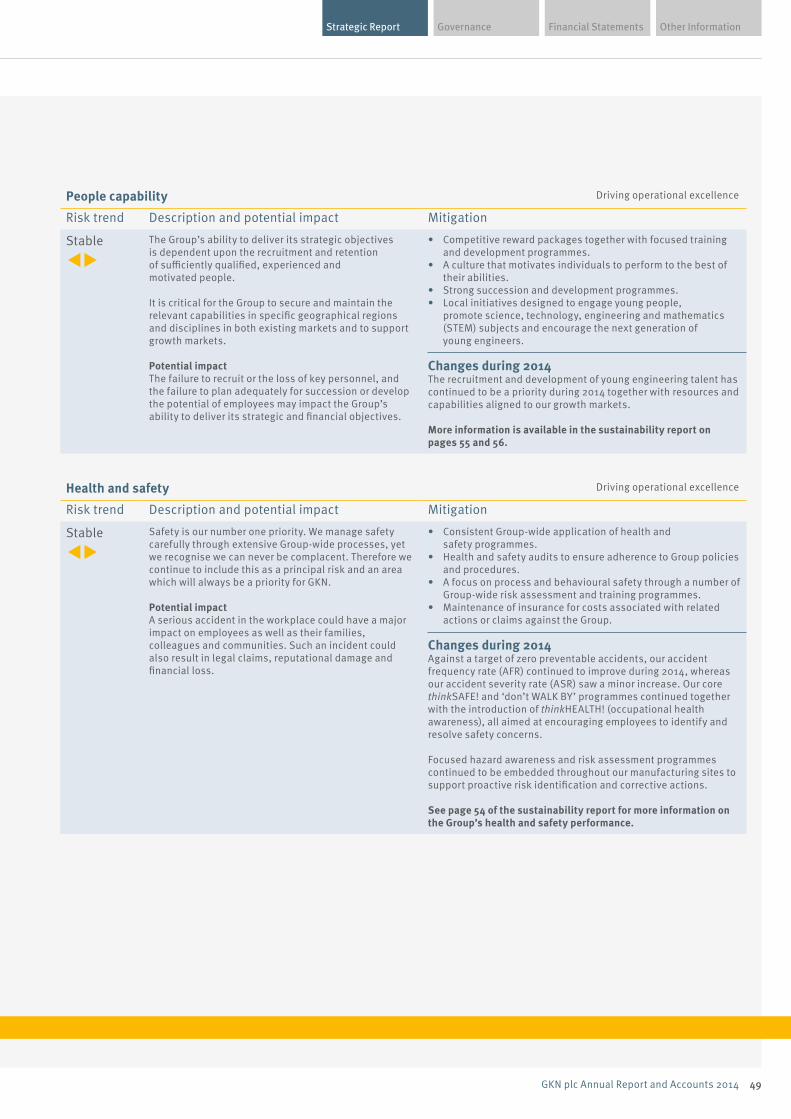
Financial Statements Other InformationGovernanceStrategic Report
49GKN plc Annual Report and Accounts 2014
People capability Driving operational excellence
Risk trend Description and potential impact Mitigation
Stable
◂▸The Group’s ability to deliver its strategic objectives is dependent upon the recruitment and retention of sufficiently qualified, experienced and motivated people.
It is critical for the Group to secure and maintain the relevant capabilities in specific geographical regions and disciplines in both existing markets and to support growth markets.
Potential impactThe failure to recruit or the loss of key personnel, and the failure to plan adequately for succession or develop the potential of employees may impact the Group’s ability to deliver its strategic and financial objectives.
• Competitive reward packages together with focused training and development programmes.
• A culture that motivates individuals to perform to the best of their abilities.
• Strong succession and development programmes.• Local initiatives designed to engage young people,
promote science, technology, engineering and mathematics (STEM) subjects and encourage the next generation of young engineers.
Changes during 2014The recruitment and development of young engineering talent has continued to be a priority during 2014 together with resources and capabilities aligned to our growth markets.
More information is available in the sustainability report on pages 55 and 56.
Health and safety Driving operational excellence
Risk trend Description and potential impact Mitigation
Stable
◂▸Safety is our number one priority. We manage safety carefully through extensive Group-wide processes, yet we recognise we can never be complacent. Therefore we continue to include this as a principal risk and an area which will always be a priority for GKN.
Potential impactA serious accident in the workplace could have a major impact on employees as well as their families, colleagues and communities. Such an incident could also result in legal claims, reputational damage and financial loss.
• Consistent Group-wide application of health and safety programmes.
• Health and safety audits to ensure adherence to Group policies and procedures.
• A focus on process and behavioural safety through a number of Group-wide risk assessment and training programmes.
• Maintenance of insurance for costs associated with related actions or claims against the Group.
Changes during 2014Against a target of zero preventable accidents, our accident frequency rate (AFR) continued to improve during 2014, whereas our accident severity rate (ASR) saw a minor increase. Our core thinkSAFE! and ‘don’t WALK BY’ programmes continued together with the introduction of thinkHEALTH! (occupational health awareness), all aimed at encouraging employees to identify and resolve safety concerns.
Focused hazard awareness and risk assessment programmes continued to be embedded throughout our manufacturing sites to support proactive risk identification and corrective actions.
See page 54 of the sustainability report for more information on the Group’s health and safety performance.
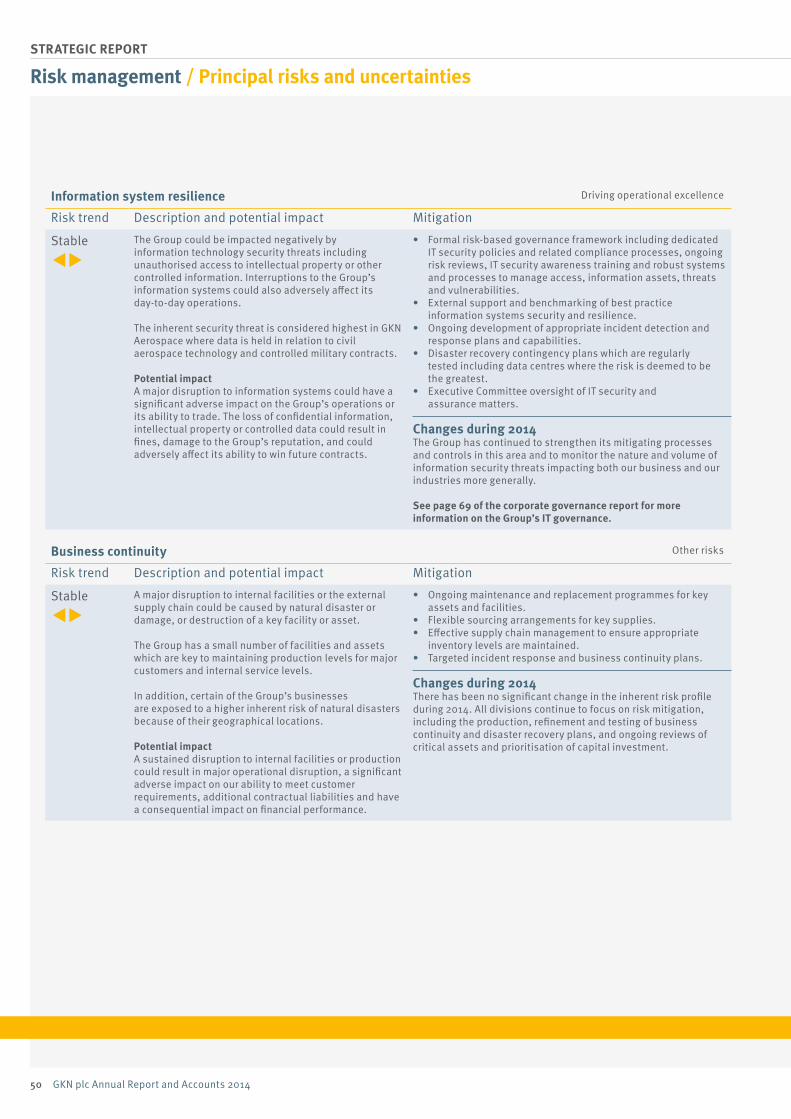
50 GKN plc Annual Report and Accounts 2014
STRATEGIC REPORT
Risk management / Principal risks and uncertainties
Information system resilience Driving operational excellence
Risk trend Description and potential impact Mitigation
Stable
◂▸The Group could be impacted negatively by information technology security threats including unauthorised access to intellectual property or other controlled information. Interruptions to the Group’s information systems could also adversely affect its day-to-day operations.
The inherent security threat is considered highest in GKN Aerospace where data is held in relation to civil aerospace technology and controlled military contracts.
Potential impactA major disruption to information systems could have a significant adverse impact on the Group’s operations or its ability to trade. The loss of confidential information, intellectual property or controlled data could result in fines, damage to the Group’s reputation, and could adversely affect its ability to win future contracts.
• Formal risk-based governance framework including dedicated IT security policies and related compliance processes, ongoing risk reviews, IT security awareness training and robust systems and processes to manage access, information assets, threats and vulnerabilities.
• External support and benchmarking of best practice information systems security and resilience.
• Ongoing development of appropriate incident detection and response plans and capabilities.
• Disaster recovery contingency plans which are regularly tested including data centres where the risk is deemed to be the greatest.
• Executive Committee oversight of IT security and assurance matters.
Changes during 2014The Group has continued to strengthen its mitigating processes and controls in this area and to monitor the nature and volume of information security threats impacting both our business and our industries more generally.
See page 69 of the corporate governance report for more information on the Group’s IT governance.
Business continuity Other risks
Risk trend Description and potential impact Mitigation
Stable
◂▸A major disruption to internal facilities or the external supply chain could be caused by natural disaster or damage, or destruction of a key facility or asset.
The Group has a small number of facilities and assets which are key to maintaining production levels for major customers and internal service levels.
In addition, certain of the Group’s businesses are exposed to a higher inherent risk of natural disasters because of their geographical locations.
Potential impactA sustained disruption to internal facilities or production could result in major operational disruption, a significant adverse impact on our ability to meet customer requirements, additional contractual liabilities and have a consequential impact on financial performance.
• Ongoing maintenance and replacement programmes for key assets and facilities.
• Flexible sourcing arrangements for key supplies.• Effective supply chain management to ensure appropriate
inventory levels are maintained.• Targeted incident response and business continuity plans.
Changes during 2014There has been no significant change in the inherent risk profile during 2014. All divisions continue to focus on risk mitigation, including the production, refinement and testing of business continuity and disaster recovery plans, and ongoing reviews of critical assets and prioritisation of capital investment.
Financial Statements Other InformationGovernanceStrategic Report
51GKN plc Annual Report and Accounts 2014
Pension funding Other risks
Risk trend Description and potential impact Mitigation
Stable
◂▸The Group operates a number of defined benefit pension post-retirement medical plans with aggregate net liabilities of £1,711 million at 31 December 2014. These plans are exposed to the risk of changes in asset values, discount rates, inflation and mortality assumptions.
Potential impactIncreases to the pension deficit could lead to a requirement for additional cash contributions to these plans, thereby reducing the amount of cash available to meet the Group’s other operating, investment and financing requirements.
• Close co-operation with scheme fiduciaries regarding management of pension scheme assets and liabilities, including asset selection and hedging actions.
• Alternative funding and risk mitigation actions are implemented where appropriate.
Changes during 2014During the year, against an economic backdrop which has seen pension liabilities remain at a high level versus historical norms, driven by the exceptionally low yields on long term bonds, we have continued to undertake pension risk reduction initiatives, including a partial buy-in transaction in the UK and an increase in hedging ratios. In addition, in the UK we commenced a ‘pension increase exchange’ exercise to further mitigate inflation risk, which will conclude in early 2015, and undertook a 'voluntary lump sums programme' in the US, whereby deferred members of the US pension plan were offered a cash lump sum in lieu of future pension rights. The Group continues to have a reasonable degree of visibility over the range of short to medium term funding cash flows.
See pages 40 to 41 and 150 to 155 for more information on the Group’s pension arrangements.
52 GKN plc Annual Report and Accounts 2014
STRATEGIC REPORT
6PROMISES
CLEAR VALUES
• By our people• As a business• In our world
Sustainability report
Our Values at the heart of a sustainable business
Doing the right thing
Our Values are at the heart of our business.They explain what GKN stands for and guide our day-to-day activities. By living these Values all GKN employees are contributing to the long term success of the Group. Our Values can be summed up in one simple phrase: doing the right thing.
Twelve promises, six from GKN to our employees and six from employees to GKN, help our employees live these Values every day.
Message from the Chief ExecutiveAt GKN, being a sustainable business means operating in an ethical, efficient and safe manner. The GKN Code, its related policies and our Values are all in place to make sure we do so. They describe how the Group and employees should conduct business in order to build a long term, sustainable future for GKN.
This section explains essential business processes from continuous improvement and how we work with suppliers, to ensuring we have the right people by recruiting talent, developing them and making sure they remain safe in our sites.
We also focus on our impact in our world and GKN’s positive role in the communities in which we operate.
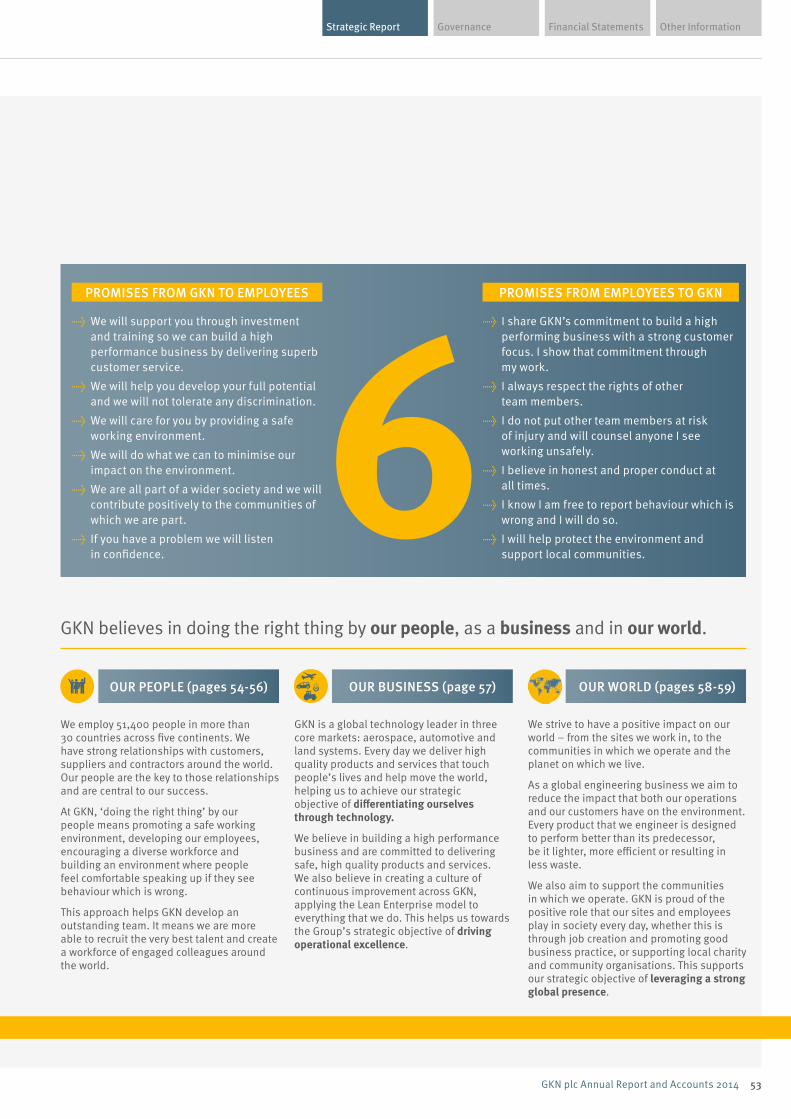
Financial Statements Other InformationGovernanceStrategic Report
53GKN plc Annual Report and Accounts 2014
Doing the right thing
We employ 51,400 people in more than 30 countries across five continents. We have strong relationships with customers, suppliers and contractors around the world. Our people are the key to those relationships and are central to our success.
At GKN, ‘doing the right thing’ by our people means promoting a safe working environment, developing our employees, encouraging a diverse workforce and building an environment where people feel comfortable speaking up if they see behaviour which is wrong.
This approach helps GKN develop an outstanding team. It means we are more able to recruit the very best talent and create a workforce of engaged colleagues around the world.
GKN is a global technology leader in three core markets: aerospace, automotive and land systems. Every day we deliver high quality products and services that touch people’s lives and help move the world, helping us to achieve our strategic objective of differentiating ourselves through technology.
We believe in building a high performance business and are committed to delivering safe, high quality products and services. We also believe in creating a culture of continuous improvement across GKN, applying the Lean Enterprise model to everything that we do. This helps us towards the Group’s strategic objective of driving operational excellence.
We strive to have a positive impact on our world – from the sites we work in, to the communities in which we operate and the planet on which we live.
As a global engineering business we aim to reduce the impact that both our operations and our customers have on the environment. Every product that we engineer is designed to perform better than its predecessor, be it lighter, more efficient or resulting in less waste.
We also aim to support the communities in which we operate. GKN is proud of the positive role that our sites and employees play in society every day, whether this is through job creation and promoting good business practice, or supporting local charity and community organisations. This supports our strategic objective of leveraging a strong global presence.
GKN believes in doing the right thing by our people, as a business and in our world.
PROMISES FROM GKN TO EMPLOYEES
→ We will support you through investment and training so we can build a high performance business by delivering superb customer service.
→ We will help you develop your full potential and we will not tolerate any discrimination.
→ We will care for you by providing a safe working environment.
→ We will do what we can to minimise our impact on the environment.
→ We are all part of a wider society and we will contribute positively to the communities of which we are part.
→ If you have a problem we will listen in confidence.
PROMISES FROM EMPLOYEES TO GKN
OUR PEOPLE (pages 54-56) OUR BUSINESS (page 57) OUR WORLD (pages 58-59)
→ I share GKN’s commitment to build a high performing business with a strong customer focus. I show that commitment through my work.
→ I always respect the rights of other team members.
→ I do not put other team members at risk of injury and will counsel anyone I see working unsafely.
→ I believe in honest and proper conduct at all times.
→ I know I am free to report behaviour which is wrong and I will do so.
→ I will help protect the environment and support local communities.
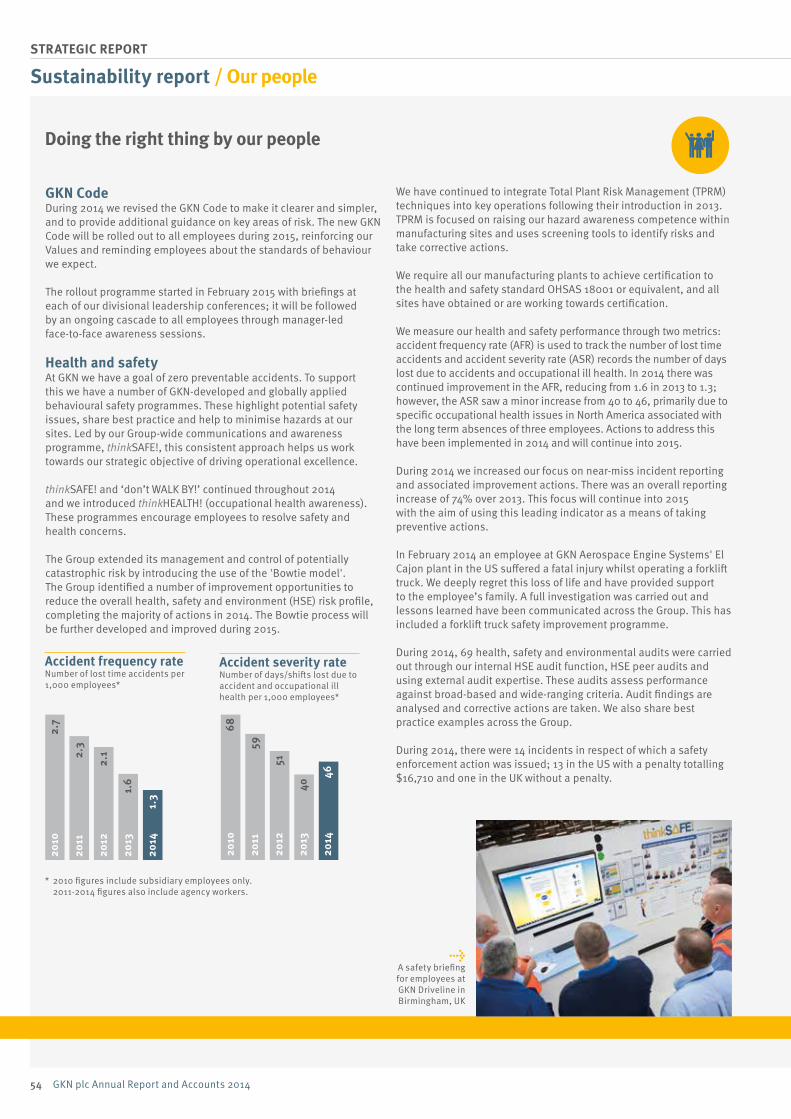
54 GKN plc Annual Report and Accounts 2014
STRATEGIC REPORT
2014
2014
2013
2013
2012
2012
2011
2011
2010
2010
1.3
46
1.6 40
2.1
51
2.3 59
2.7 68
* 2010 figures include subsidiary employees only. 2011-2014 figures also include agency workers.
Accident frequency rateNumber of lost time accidents per 1,000 employees*
Accident severity rateNumber of days/shifts lost due to accident and occupational ill health per 1,000 employees*
GKN Code During 2014 we revised the GKN Code to make it clearer and simpler, and to provide additional guidance on key areas of risk. The new GKN Code will be rolled out to all employees during 2015, reinforcing our Values and reminding employees about the standards of behaviour we expect.
The rollout programme started in February 2015 with briefings at each of our divisional leadership conferences; it will be followed by an ongoing cascade to all employees through manager-led face-to-face awareness sessions.
Health and safetyAt GKN we have a goal of zero preventable accidents. To support this we have a number of GKN-developed and globally applied behavioural safety programmes. These highlight potential safety issues, share best practice and help to minimise hazards at our sites. Led by our Group-wide communications and awareness programme, thinkSAFE!, this consistent approach helps us work towards our strategic objective of driving operational excellence.
thinkSAFE! and ‘don’t WALK BY!’ continued throughout 2014 and we introduced thinkHEALTH! (occupational health awareness). These programmes encourage employees to resolve safety and health concerns.
The Group extended its management and control of potentially catastrophic risk by introducing the use of the 'Bowtie model'. The Group identified a number of improvement opportunities to reduce the overall health, safety and environment (HSE) risk profile, completing the majority of actions in 2014. The Bowtie process will be further developed and improved during 2015.
Sustainability report / Our people
We have continued to integrate Total Plant Risk Management (TPRM) techniques into key operations following their introduction in 2013. TPRM is focused on raising our hazard awareness competence within manufacturing sites and uses screening tools to identify risks and take corrective actions.
We require all our manufacturing plants to achieve certification to the health and safety standard OHSAS 18001 or equivalent, and all sites have obtained or are working towards certification.
We measure our health and safety performance through two metrics: accident frequency rate (AFR) is used to track the number of lost time accidents and accident severity rate (ASR) records the number of days lost due to accidents and occupational ill health. In 2014 there was continued improvement in the AFR, reducing from 1.6 in 2013 to 1.3; however, the ASR saw a minor increase from 40 to 46, primarily due to specific occupational health issues in North America associated with the long term absences of three employees. Actions to address this have been implemented in 2014 and will continue into 2015.
During 2014 we increased our focus on near-miss incident reporting and associated improvement actions. There was an overall reporting increase of 74% over 2013. This focus will continue into 2015 with the aim of using this leading indicator as a means of taking preventive actions.
In February 2014 an employee at GKN Aerospace Engine Systems' El Cajon plant in the US suffered a fatal injury whilst operating a forklift truck. We deeply regret this loss of life and have provided support to the employee’s family. A full investigation was carried out and lessons learned have been communicated across the Group. This has included a forklift truck safety improvement programme.
During 2014, 69 health, safety and environmental audits were carried out through our internal HSE audit function, HSE peer audits and using external audit expertise. These audits assess performance against broad-based and wide-ranging criteria. Audit findings are analysed and corrective actions are taken. We also share best practice examples across the Group. During 2014, there were 14 incidents in respect of which a safety enforcement action was issued; 13 in the US with a penalty totalling $16,710 and one in the UK without a penalty.
→A safety briefing for employees at GKN Driveline in Birmingham, UK
Doing the right thing by our people
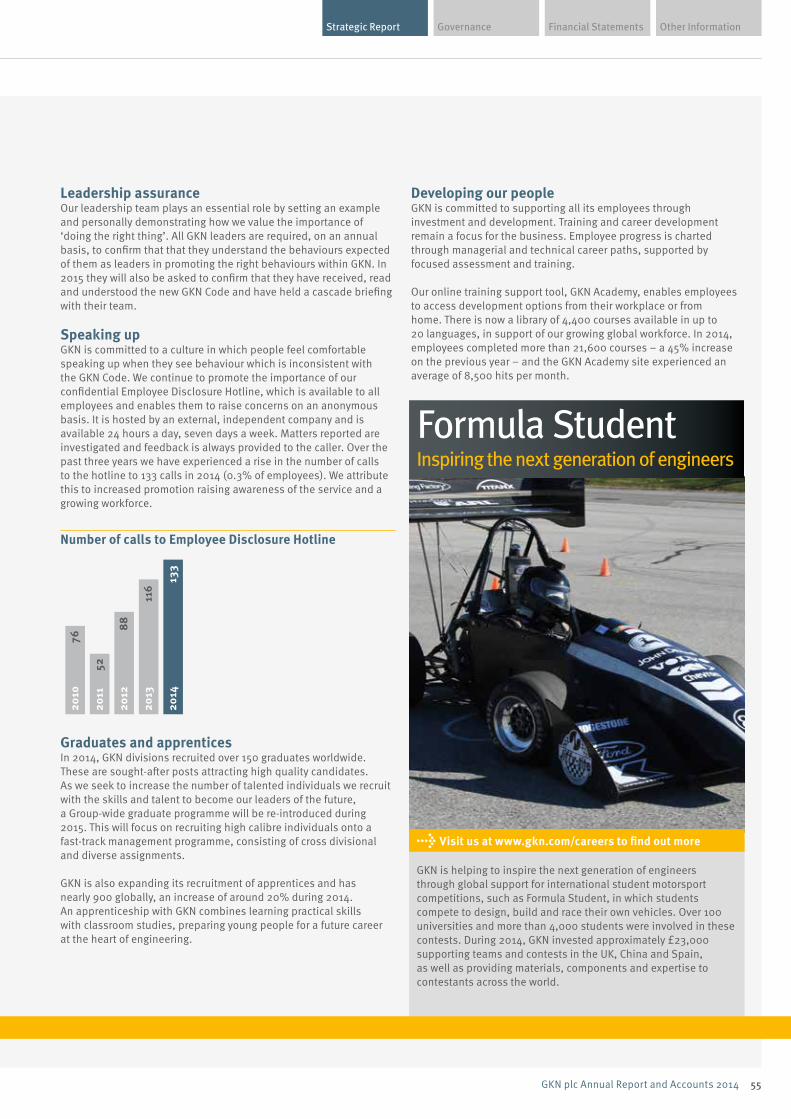
Financial Statements Other InformationGovernanceStrategic Report
55GKN plc Annual Report and Accounts 2014
Leadership assuranceOur leadership team plays an essential role by setting an example and personally demonstrating how we value the importance of ‘doing the right thing’. All GKN leaders are required, on an annual basis, to confirm that that they understand the behaviours expected of them as leaders in promoting the right behaviours within GKN. In 2015 they will also be asked to confirm that they have received, read and understood the new GKN Code and have held a cascade briefing with their team.
Speaking upGKN is committed to a culture in which people feel comfortable speaking up when they see behaviour which is inconsistent with the GKN Code. We continue to promote the importance of our confidential Employee Disclosure Hotline, which is available to all employees and enables them to raise concerns on an anonymous basis. It is hosted by an external, independent company and is available 24 hours a day, seven days a week. Matters reported are investigated and feedback is always provided to the caller. Over the past three years we have experienced a rise in the number of calls to the hotline to 133 calls in 2014 (0.3% of employees). We attribute this to increased promotion raising awareness of the service and a growing workforce.
Number of calls to Employee Disclosure Hotline
2014
2013
2012
2011
2010
133
116
88
52
76
Graduates and apprenticesIn 2014, GKN divisions recruited over 150 graduates worldwide. These are sought-after posts attracting high quality candidates. As we seek to increase the number of talented individuals we recruit with the skills and talent to become our leaders of the future, a Group-wide graduate programme will be re-introduced during 2015. This will focus on recruiting high calibre individuals onto a fast-track management programme, consisting of cross divisional and diverse assignments.
GKN is also expanding its recruitment of apprentices and has nearly 900 globally, an increase of around 20% during 2014. An apprenticeship with GKN combines learning practical skills with classroom studies, preparing young people for a future career at the heart of engineering.
Developing our peopleGKN is committed to supporting all its employees through investment and development. Training and career development remain a focus for the business. Employee progress is charted through managerial and technical career paths, supported by focused assessment and training.
Our online training support tool, GKN Academy, enables employees to access development options from their workplace or from home. There is now a library of 4,400 courses available in up to 20 languages, in support of our growing global workforce. In 2014, employees completed more than 21,600 courses – a 45% increase on the previous year – and the GKN Academy site experienced an average of 8,500 hits per month.
Formula StudentInspiring the next generation of engineers
→ Visit us at www.gkn.com/careers to find out more
GKN is helping to inspire the next generation of engineers through global support for international student motorsport competitions, such as Formula Student, in which students compete to design, build and race their own vehicles. Over 100 universities and more than 4,000 students were involved in these contests. During 2014, GKN invested approximately £23,000 supporting teams and contests in the UK, China and Spain, as well as providing materials, components and expertise to contestants across the world.
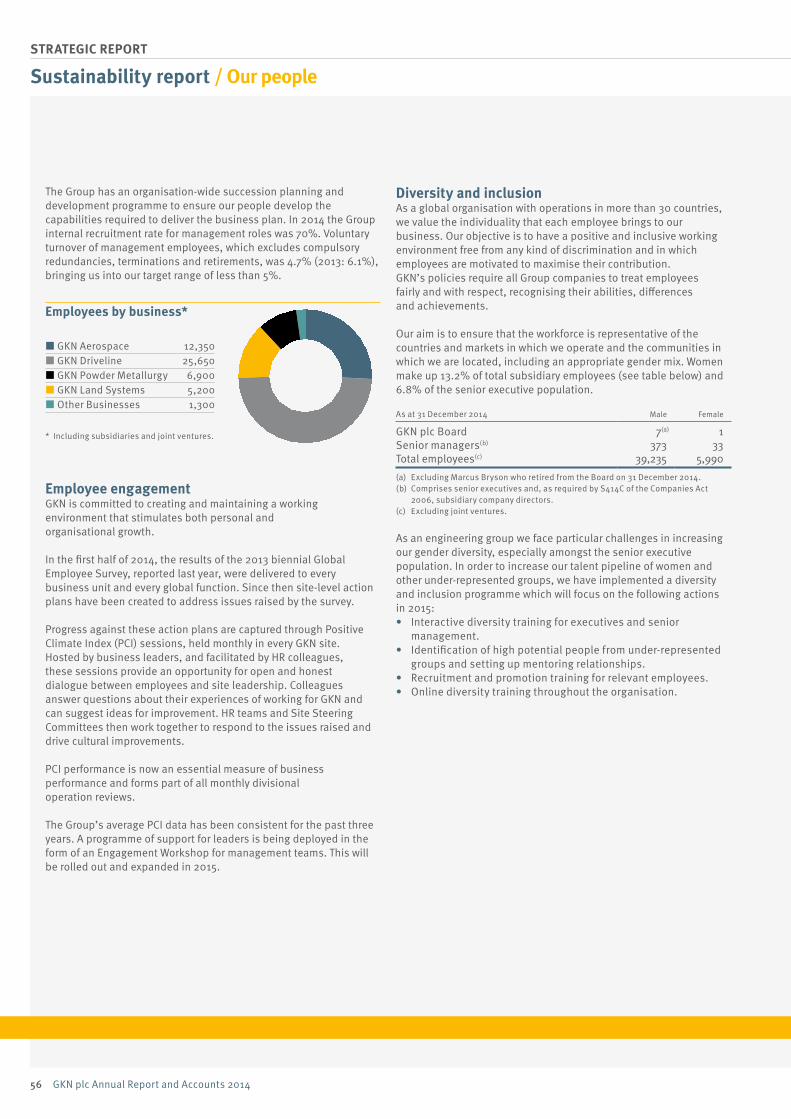
56 GKN plc Annual Report and Accounts 2014
STRATEGIC REPORT
GKN Aerospace 12,350 GKN Driveline 25,650 GKN Powder Metallurgy 6,900 GKN Land Systems 5,200 Other Businesses 1,300
The Group has an organisation-wide succession planning and development programme to ensure our people develop the capabilities required to deliver the business plan. In 2014 the Group internal recruitment rate for management roles was 70%. Voluntary turnover of management employees, which excludes compulsory redundancies, terminations and retirements, was 4.7% (2013: 6.1%), bringing us into our target range of less than 5%.
Employees by business*
* Including subsidiaries and joint ventures.
Employee engagementGKN is committed to creating and maintaining a working environment that stimulates both personal and organisational growth.
In the first half of 2014, the results of the 2013 biennial Global Employee Survey, reported last year, were delivered to every business unit and every global function. Since then site-level action plans have been created to address issues raised by the survey.
Progress against these action plans are captured through Positive Climate Index (PCI) sessions, held monthly in every GKN site. Hosted by business leaders, and facilitated by HR colleagues, these sessions provide an opportunity for open and honest dialogue between employees and site leadership. Colleagues answer questions about their experiences of working for GKN and can suggest ideas for improvement. HR teams and Site Steering Committees then work together to respond to the issues raised and drive cultural improvements.
PCI performance is now an essential measure of business performance and forms part of all monthly divisional operation reviews.
The Group’s average PCI data has been consistent for the past three years. A programme of support for leaders is being deployed in the form of an Engagement Workshop for management teams. This will be rolled out and expanded in 2015.
Sustainability report / Our people
Diversity and inclusionAs a global organisation with operations in more than 30 countries, we value the individuality that each employee brings to our business. Our objective is to have a positive and inclusive working environment free from any kind of discrimination and in which employees are motivated to maximise their contribution. GKN’s policies require all Group companies to treat employees fairly and with respect, recognising their abilities, differences and achievements.
Our aim is to ensure that the workforce is representative of the countries and markets in which we operate and the communities in which we are located, including an appropriate gender mix. Women make up 13.2% of total subsidiary employees (see table below) and 6.8% of the senior executive population.
As at 31 December 2014 Male Female
GKN plc Board 7(a) 1Senior managers(b) 373 33Total employees(c) 39,235 5,990
(a) Excluding Marcus Bryson who retired from the Board on 31 December 2014.(b) Comprises senior executives and, as required by S414C of the Companies Act
2006, subsidiary company directors. (c) Excluding joint ventures.
As an engineering group we face particular challenges in increasing our gender diversity, especially amongst the senior executive population. In order to increase our talent pipeline of women and other under-represented groups, we have implemented a diversity and inclusion programme which will focus on the following actions in 2015:• Interactive diversity training for executives and senior
management.• Identification of high potential people from under-represented
groups and setting up mentoring relationships.• Recruitment and promotion training for relevant employees.• Online diversity training throughout the organisation.
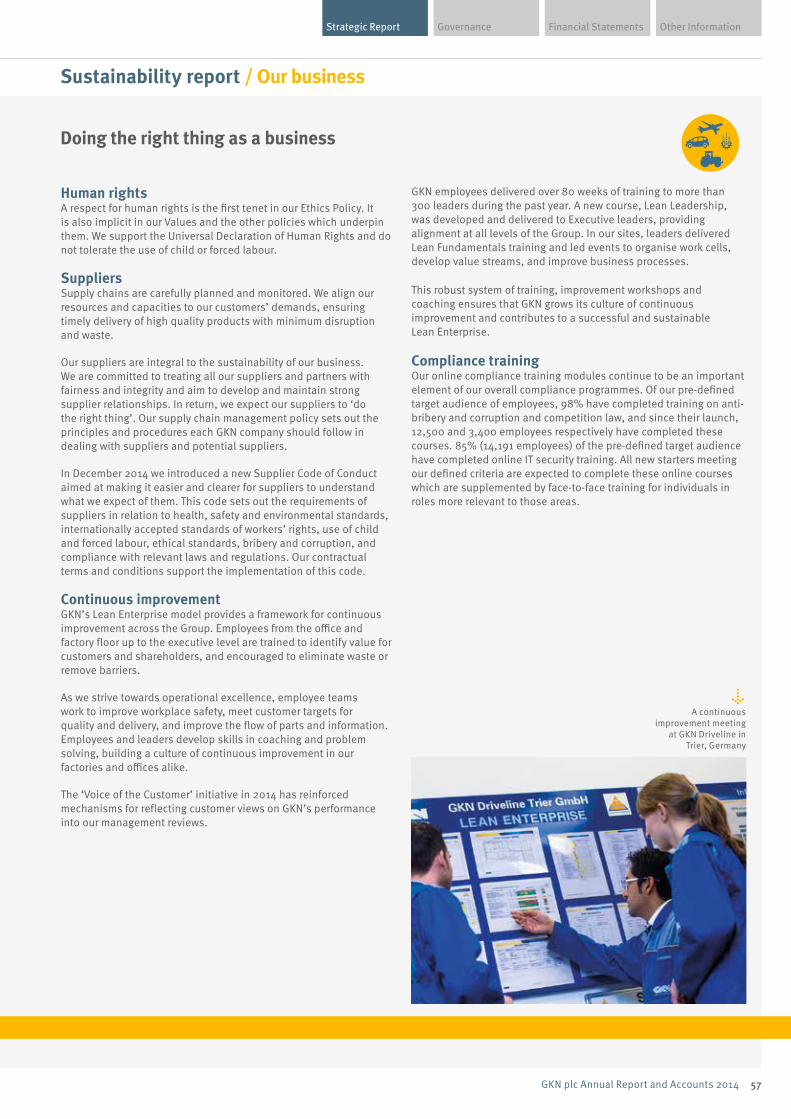
Financial Statements Other InformationGovernanceStrategic Report
57GKN plc Annual Report and Accounts 2014
Human rightsA respect for human rights is the first tenet in our Ethics Policy. It is also implicit in our Values and the other policies which underpin them. We support the Universal Declaration of Human Rights and do not tolerate the use of child or forced labour.
SuppliersSupply chains are carefully planned and monitored. We align our resources and capacities to our customers’ demands, ensuring timely delivery of high quality products with minimum disruption and waste.
Our suppliers are integral to the sustainability of our business. We are committed to treating all our suppliers and partners with fairness and integrity and aim to develop and maintain strong supplier relationships. In return, we expect our suppliers to ‘do the right thing’. Our supply chain management policy sets out the principles and procedures each GKN company should follow in dealing with suppliers and potential suppliers.
In December 2014 we introduced a new Supplier Code of Conduct aimed at making it easier and clearer for suppliers to understand what we expect of them. This code sets out the requirements of suppliers in relation to health, safety and environmental standards, internationally accepted standards of workers’ rights, use of child and forced labour, ethical standards, bribery and corruption, and compliance with relevant laws and regulations. Our contractual terms and conditions support the implementation of this code.
Continuous improvementGKN’s Lean Enterprise model provides a framework for continuous improvement across the Group. Employees from the office and factory floor up to the executive level are trained to identify value for customers and shareholders, and encouraged to eliminate waste or remove barriers.
As we strive towards operational excellence, employee teams work to improve workplace safety, meet customer targets for quality and delivery, and improve the flow of parts and information. Employees and leaders develop skills in coaching and problem solving, building a culture of continuous improvement in our factories and offices alike.
The ‘Voice of the Customer’ initiative in 2014 has reinforced mechanisms for reflecting customer views on GKN’s performance into our management reviews.
GKN employees delivered over 80 weeks of training to more than 300 leaders during the past year. A new course, Lean Leadership, was developed and delivered to Executive leaders, providing alignment at all levels of the Group. In our sites, leaders delivered Lean Fundamentals training and led events to organise work cells, develop value streams, and improve business processes.
This robust system of training, improvement workshops and coaching ensures that GKN grows its culture of continuous improvement and contributes to a successful and sustainable Lean Enterprise.
Compliance trainingOur online compliance training modules continue to be an important element of our overall compliance programmes. Of our pre-defined target audience of employees, 98% have completed training on anti-bribery and corruption and competition law, and since their launch, 12,500 and 3,400 employees respectively have completed these courses. 85% (14,191 employees) of the pre-defined target audience have completed online IT security training. All new starters meeting our defined criteria are expected to complete these online courses which are supplemented by face-to-face training for individuals in roles more relevant to those areas.
Sustainability report / Our business
↓A continuous
improvement meeting at GKN Driveline in
Trier, Germany
Doing the right thing as a business
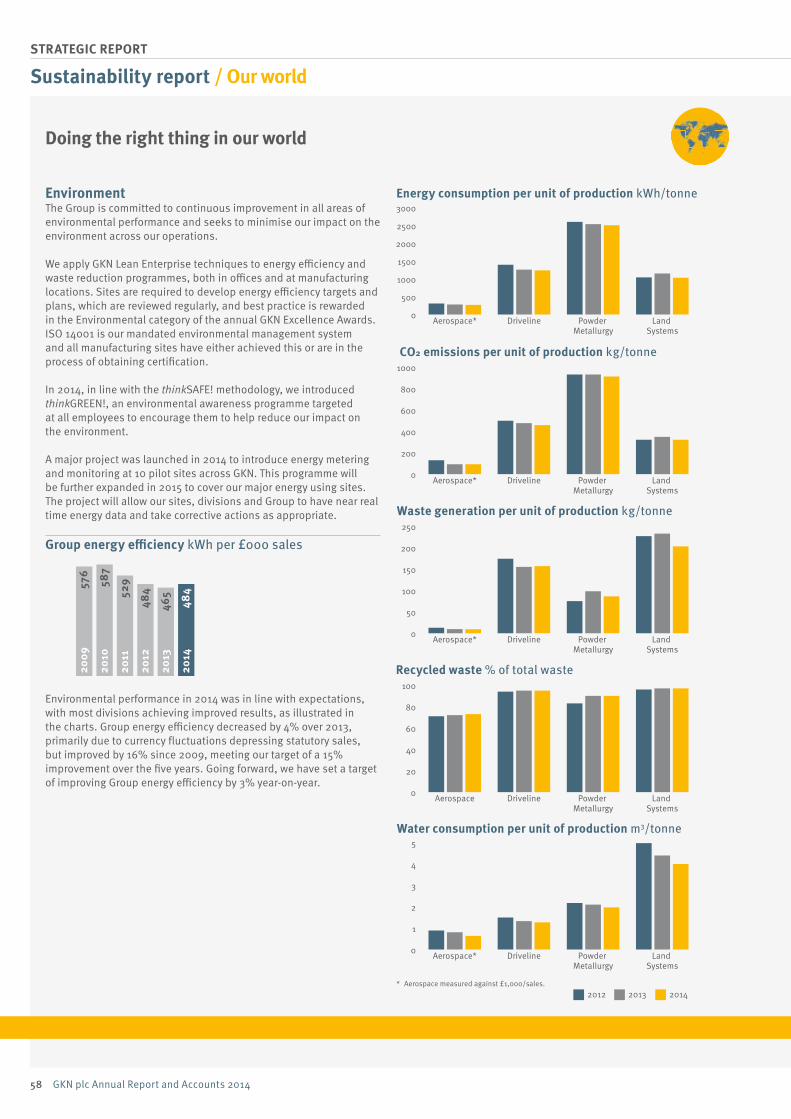
58 GKN plc Annual Report and Accounts 2014
STRATEGIC REPORT
0
500
1000
1500
2000
2500
3000
Land Systems
Powder Metallurgy
DrivelineAerospace*
0
200
400
600
800
1000
Land Systems
Powder Metallurgy
DrivelineAerospace*
0
50
100
150
200
250
Land Systems
Powder Metallurgy
DrivelineAerospace*
0
1
2
3
4
5
Land Systems
Powder Metallurgy
DrivelineAerospace*
0
20
40
60
80
100
Land Systems
Powder Metallurgy
DrivelineAerospace
2012 2013 2014* Aerospace measured against £1,000/sales.
Energy consumption per unit of production kWh/tonne
Waste generation per unit of production kg/tonne
Water consumption per unit of production m3/tonne
Recycled waste % of total waste
CO2 emissions per unit of production kg/tonne
Sustainability report / Our world
EnvironmentThe Group is committed to continuous improvement in all areas of environmental performance and seeks to minimise our impact on the environment across our operations.
We apply GKN Lean Enterprise techniques to energy efficiency and waste reduction programmes, both in offices and at manufacturing locations. Sites are required to develop energy efficiency targets and plans, which are reviewed regularly, and best practice is rewarded in the Environmental category of the annual GKN Excellence Awards. ISO 14001 is our mandated environmental management system and all manufacturing sites have either achieved this or are in the process of obtaining certification.
In 2014, in line with the thinkSAFE! methodology, we introduced thinkGREEN!, an environmental awareness programme targeted at all employees to encourage them to help reduce our impact on the environment.
A major project was launched in 2014 to introduce energy metering and monitoring at 10 pilot sites across GKN. This programme will be further expanded in 2015 to cover our major energy using sites. The project will allow our sites, divisions and Group to have near real time energy data and take corrective actions as appropriate.
Group energy efficiency kWh per £000 sales Group energy e�ciency kWh per £000 sales
2014
2013
2012
2011
2010
2009
484
484
46552
9587
576
Environmental performance in 2014 was in line with expectations, with most divisions achieving improved results, as illustrated in the charts. Group energy efficiency decreased by 4% over 2013, primarily due to currency fluctuations depressing statutory sales, but improved by 16% since 2009, meeting our target of a 15% improvement over the five years. Going forward, we have set a target of improving Group energy efficiency by 3% year-on-year.
Doing the right thing in our world

Financial Statements Other InformationGovernanceStrategic Report
59GKN plc Annual Report and Accounts 2014
GKN calculates greenhouse gas emissions using the Greenhouse Gas Protocol. The greenhouse gas intensity of the Group (i.e. operations included in the consolidated financial statements) increased by 8% in 2014. Expressed as tonnes of CO2 equivalent per £million sales, emissions intensity increased from 171 in 2013 to 186 in 2014. This increase was caused primarily by currency fluctuations depressing Group sales and partly by improved greenhouse gas collection processes (see note below). The absolute emissions of the Group increased by 6% from 1,228,000 tonnes of CO2 equivalent in 2013 to 1,300,000 tonnes of CO2 equivalent in 2014. This includes: Scope 1 (direct) emissions of 280,000 tonnes and Scope 2 (indirect) emissions of 1,020,000 tonnes (2013: 245,000 tonnes and 983,000 tonnes respectively). This increase was largely due to improved data collection and increased production in our more energy-intensive businesses. We have set a target of improving Group greenhouse gas intensity by 3% year-on-year going forward.
Note: Scope 1 emissions in 2014 include CO2 equivalent emissions resulting from transport, process and fugitive emissions, which were not included in 2013. Process emissions from arc furnaces at two GKN Powder Metallurgy plants were included in both years.
During 2014 there were 15 environmental enforcement actions, all in the US. Four resulted in financial penalties totalling $6,600. Environmental enforcement actions from 2013 in Brazil were finalised and resulted in a penalty of R$3,035.
CommunitiesThe majority of GKN sites are active in their communities. Sometimes the activity is management-led, but on many occasions it is the employees who instigate projects and initiatives. We focus these activities on two main areas: enhancing local communities through social projects and charitable donations; and working with young people to inspire the next generation of engineers.
We aim to support young people in our communities and also to inspire them to study science and mathematics and consider a career in engineering. Around the world, GKN led over 125 significant projects aimed at doing this; these projects touched the lives of more than 25,000 young people.
Hearts of GoldHeld annually, our internal Hearts of Gold awards allow us to recognise extraordinary GKN people who contribute to their communities. Hearts of Gold winners receive a trophy and a certificate to recognise their achievement.
We are also working on improved ways of recording and celebrating these remarkable stories. One example is a new Hearts of Gold microsite, which allows GKN employees to upload and share community activities that they and their colleagues have taken part in. This site is due to be launched in the first quarter of 2015.
→ Visit us at www.gkn.com to see more case studies
The Casa dos Sonhos – or House of Dreams – began as the vision of one GKN Porto Alegre employee, Maria Mercedes de Paula, in 1985. She wanted to help under-privileged children in her community and after almost 20 years of fundraising and meetings with businesses and local authorities, her school was built in the nearby town of Gravataí in 2003. Today, 70 children from the ages of 6 to 16 attend Casa dos Sonhos, learning reading, writing, sports and IT skills, and GKN continues to donate Christmas gifts and equipment to the school.
Casa dos SonhosHouse of Dreams, Gravataí, Brazil
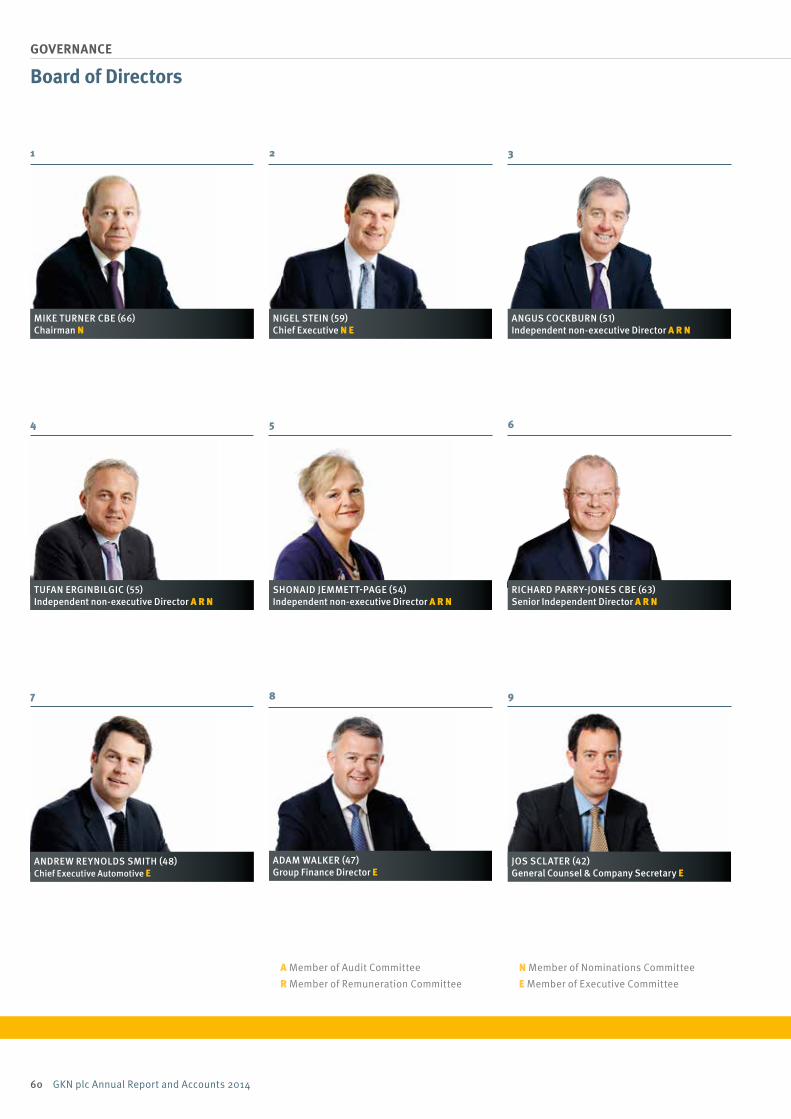
MIKE TURNER CBE (66)Chairman N
NIGEL STEIN (59)Chief Executive N E
ANGUS COCKBURN (51)Independent non-executive Director A R N
4 5 6
RICHARD PARRY-JONES CBE (63)Senior Independent Director A R N
TUFAN ERGINBILGIC (55) Independent non-executive Director A R N
SHONAID JEMMETT-PAGE (54)Independent non-executive Director A R N
1 2 3
JOS SCLATER (42)General Counsel & Company Secretary E
ADAM WALKER (47)Group Finance Director E
7 8 9
ANDREW REYNOLDS SMITH (48)Chief Executive Automotive E
60 GKN plc Annual Report and Accounts 2014
GOVERNANCE
Board of Directors
A Member of Audit Committee
R Member of Remuneration Committee
N Member of Nominations Committee
E Member of Executive Committee
Financial Statements Other InformationGovernanceStrategic Report
61GKN plc Annual Report and Accounts 2014
1. MIKE TURNER CBE Chairman
2. NIGEL STEIN Chief Executive
3. ANGUS COCKBURN Independent non-executive Director
Appointed to the Board in September 2009 and became Chairman in May 2012.
Experience Has extensive experience of the aerospace industry having worked for BAE Systems plc for over 40 years, and as its Chief Executive from 2002 to 2008. Former President of the Aerospace & Defence Industries Association of Europe. Fellow of the Royal Aeronautical Society.
External Appointments Chairman of Babcock International Group PLC and non-executive Director of Lazard Ltd. Member of the Government’s Apprenticeship Ambassadors Network.
Appointed to the Board in August 2001.
Experience Joined GKN in 1994 and held a range of commercial, general management and finance roles, including Group Finance Director and Chief Executive Automotive before becoming Chief Executive in January 2012. Prior to GKN, he gained experience in the commercial vehicle and manufacturing sector and held senior financial positions with Laird Group plc and Hestair Duple Ltd. Member of the Institute of Chartered Accountants of Scotland and former non-executive Director of Wolseley plc.
External Appointments Member of the Automotive Council.
Appointed to the Board in January 2013.
Experience Currently the Chief Financial Officer of Serco Group plc. He joined Serco in October 2014 from Aggreko plc where he held the role of Chief Financial Officer for 14 years and was latterly Interim Chief Executive. Prior to this he was Managing Director of Pringle Scotland, a division of Dawson International plc. Previously held a number of roles at PepsiCo Inc and was latterly Regional Finance Director for Central Europe. Former non-executive Director of Howden Joinery Group plc and former Chairman of the Group of Scottish Finance Directors. He is also an Honorary Professor at the University of Edinburgh.
4. TUFAN ERGINBILGIC Independent non-executive Director
5. SHONAID JEMMETT-PAGE Independent non-executive Director
6. RICHARD PARRY-JONES CBE Senior Independent Director
Appointed to the Board in May 2011.
Experience Currently Chief Executive, Downstream for BP plc with specific responsibility for the Fuels, Lubricants and Petrochemicals businesses. He joined BP in 1997 and has held a number of senior marketing and operational roles, including Chief of Staff to the Group Chief Executive, Chief Operating Officer of the Fuels business and Chief Executive of the Castrol Lubricants business. His early career was spent at Mobil Oil.
Appointed to the Board in June 2010.
Experience Former Chief Operating Officer of CDC Group plc, the UK Government’s development finance institution. Joined CDC from Unilever, where for eight years she was Senior Vice-President Finance and Information, Home and Personal Care, originally in Asia and later for the group as a whole. Her early career was spent at KPMG, latterly as a partner. Former non-executive Director of Havelock Europa plc and Close Brothers Group plc.
External Appointments Independent non-executive Director of Amlin plc, APR Energy plc and Greencoat UK Wind plc. Non-executive Director and Vice Chairman of Origo Partners plc.
Appointed to the Board in March 2008 and as Senior Independent Director in May 2012.
Experience Has extensive experience of the automotive industry having previously worked for the Ford Motor Company for 38 years, latterly as Group Vice-President Global Product Development and Group Chief Technical Officer. Fellow of the Royal Academy of Engineering, the Institution of Mechanical Engineers and the Royal Society of Statistical Science. Former non-executive Director of Cosworth Group Holdings Ltd. Former Chairman of the Welsh Assembly Government Ministerial Advisory Group and former Chairman of the Automotive Council.
External Appointments Non-executive Chairman of Network Rail Ltd. Non-executive Director of Kelda Eurobond Co Ltd and Yorkshire Water Services Ltd.
7. ANDREW REYNOLDS SMITH Chief Executive Automotive
8. ADAM WALKER Group Finance Director
9. JOS SCLATER General Counsel & Company Secretary
Appointed to the Board in June 2007.
Experience Joined GKN in 2002 and has held a number of senior positions across the Group’s automotive businesses. Joined the Executive Committee in January 2006 and became Chief Executive Automotive and Powder Metallurgy in October 2011. Prior to GKN, he held various general management and functional positions at Ingersoll Rand, Siebe plc (now Invensys plc) and Delphi Automotive Systems. Former Chairman of the CBI Manufacturing Council and former member of the Ministerial Advisory Group for Manufacturing.
External Appointments Non-executive Director of Morgan Advanced Materials plc and Vice President of CLEPA (the European Association of Automotive Suppliers).
Appointed to the Board in January 2014 and as Group Finance Director in February 2014.
Experience Former Finance Director of Informa plc from 2008 to 2013 and operationally responsible for the Events Division from 2012 until leaving the group. Prior to this he was Group Finance Director at National Express Group plc from 2003 to 2008, having joined in 2001 as Head of Corporate Development. His early career was spent at Touche Ross, NatWest Markets and, latterly, Arthur Andersen where he held a number of senior finance positions.
Appointed General Counsel in January 2012. Assumed the joint role of General Counsel & Company Secretary in June 2014.
Experience Joined GKN from AkzoNobel where he was Director of Legal Affairs South Asia and Pacific and Lead M&A Counsel for Asia Pacific. Prior to this, he spent eight years at Imperial Chemical Industries plc (ICI) and held a number of senior legal positions within its headquarters and Asia Pacific operations and ICI’s Quest International business.
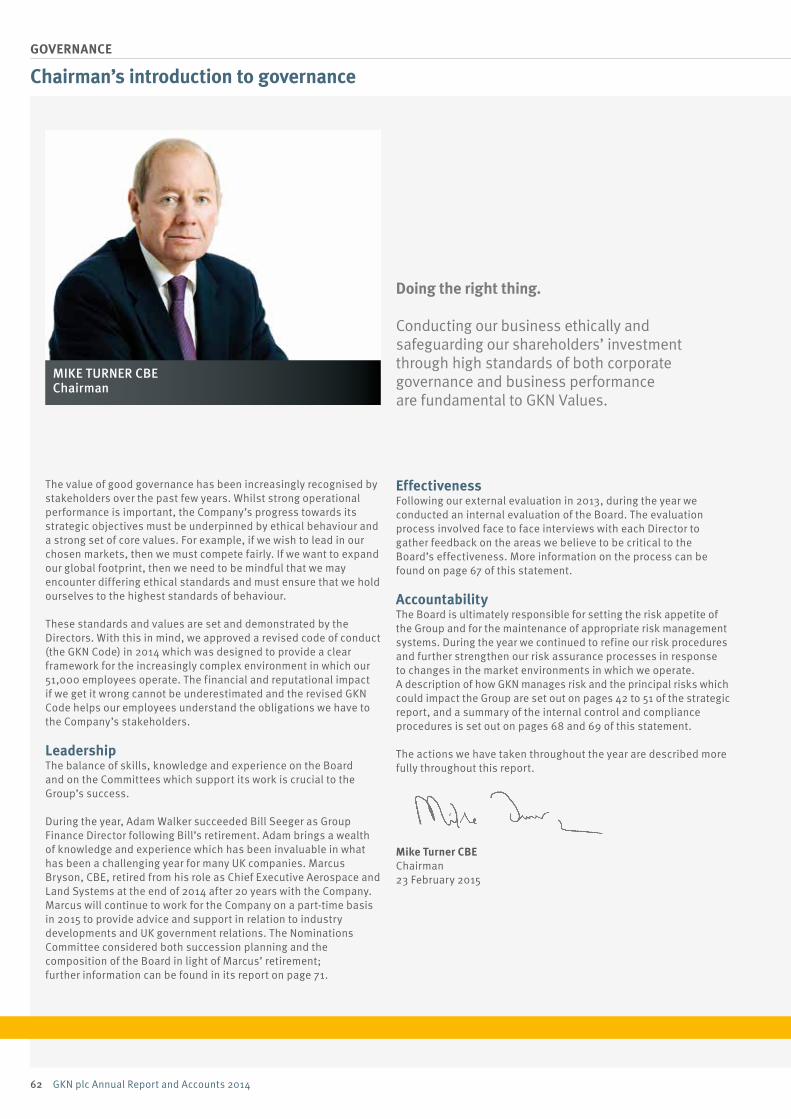
MIKE TURNER CBEChairman
62 GKN plc Annual Report and Accounts 2014
GOVERNANCE
Chairman’s introduction to governance
The value of good governance has been increasingly recognised by stakeholders over the past few years. Whilst strong operational performance is important, the Company’s progress towards its strategic objectives must be underpinned by ethical behaviour and a strong set of core values. For example, if we wish to lead in our chosen markets, then we must compete fairly. If we want to expand our global footprint, then we need to be mindful that we may encounter differing ethical standards and must ensure that we hold ourselves to the highest standards of behaviour.
These standards and values are set and demonstrated by the Directors. With this in mind, we approved a revised code of conduct (the GKN Code) in 2014 which was designed to provide a clear framework for the increasingly complex environment in which our 51,000 employees operate. The financial and reputational impact if we get it wrong cannot be underestimated and the revised GKN Code helps our employees understand the obligations we have to the Company’s stakeholders.
LeadershipThe balance of skills, knowledge and experience on the Board and on the Committees which support its work is crucial to the Group’s success.
During the year, Adam Walker succeeded Bill Seeger as Group Finance Director following Bill’s retirement. Adam brings a wealth of knowledge and experience which has been invaluable in what has been a challenging year for many UK companies. Marcus Bryson, CBE, retired from his role as Chief Executive Aerospace and Land Systems at the end of 2014 after 20 years with the Company. Marcus will continue to work for the Company on a part-time basis in 2015 to provide advice and support in relation to industry developments and UK government relations. The Nominations Committee considered both succession planning and the composition of the Board in light of Marcus’ retirement; further information can be found in its report on page 71.
EffectivenessFollowing our external evaluation in 2013, during the year we conducted an internal evaluation of the Board. The evaluation process involved face to face interviews with each Director to gather feedback on the areas we believe to be critical to the Board’s effectiveness. More information on the process can be found on page 67 of this statement.
AccountabilityThe Board is ultimately responsible for setting the risk appetite of the Group and for the maintenance of appropriate risk management systems. During the year we continued to refine our risk procedures and further strengthen our risk assurance processes in response to changes in the market environments in which we operate. A description of how GKN manages risk and the principal risks which could impact the Group are set out on pages 42 to 51 of the strategic report, and a summary of the internal control and compliance procedures is set out on pages 68 and 69 of this statement.
The actions we have taken throughout the year are described more fully throughout this report.
Mike Turner CBEChairman23 February 2015
Doing the right thing.
Conducting our business ethically and safeguarding our shareholders’ investment through high standards of both corporate governance and business performance are fundamental to GKN Values.
Financial Statements Other InformationGovernanceStrategic Report
63GKN plc Annual Report and Accounts 2014
Leadership
The role of the BoardWe are responsible for the long term success of GKN, with the overarching aim of safeguarding shareholders’ interests. Principally, we achieve this through:• setting the strategic objectives of the Group and ensuring the
necessary resources are in place to meet those aims; • providing entrepreneurial leadership within an effective risk
management framework; • setting the values and standards of the Group; and• reviewing management performance.
As Chairman, I am responsible for leading the Board and for its effectiveness. Nigel Stein leads the business as Chief Executive and is responsible for the execution of the Group’s strategy and the day-to-day running of the Group. He does so with the support of the Executive Committee.
A full description of our role, which includes a number of specific responsibilities reserved to us, is available on our website at www.gkn.com.
Board meetingsI set Board agendas following consultation with the Chief Executive and with the assistance of the Company Secretary. An annual programme of items for discussion is kept under review by the Company Secretary to ensure that all matters reserved to us and other key issues are considered at the appropriate time. Agendas are closely aligned to the key aspects of our role; below are examples of areas on which we focused in 2014.
STRATEGY
→ Reviewed and approved the Group’s strategic plans and annual budget
→ Approved the acquisition of Williams Hybrid Power Limited
→ Approved the disposal of the Group’s 50% shareholding in Emitec
→ Reviewed a number of potential acquisitions
→ Kept under review the technology plans for the Group following consideration of megatrends and emerging technologies
CAPABILITIES
→ Considered succession planning for the Board and for senior executive positions within the Group as well as the succession planning framework
→ Evaluated the effectiveness of the Board
RISK
→ Assessed the risks to the achievement of the Group strategy including risks in relation to future technology trends
→ Considered and debated the principal risks and uncertainties which could impact the Group
→ Approved the level of risk financing and insurance
PERFORMANCE
→ Reviewed divisional strategic and operational performance
→ Considered Group financial performance against budget and forecast
→ Considered health and safety performance throughout the Group
CONTROL
→ Considered and approved a revised employee code of conduct to reinforce the Company’s values and standards
→ Assessed, with the support of the Audit Committee, the effectiveness of internal control and audit processes
Board focus areas in 2014
Corporate governance
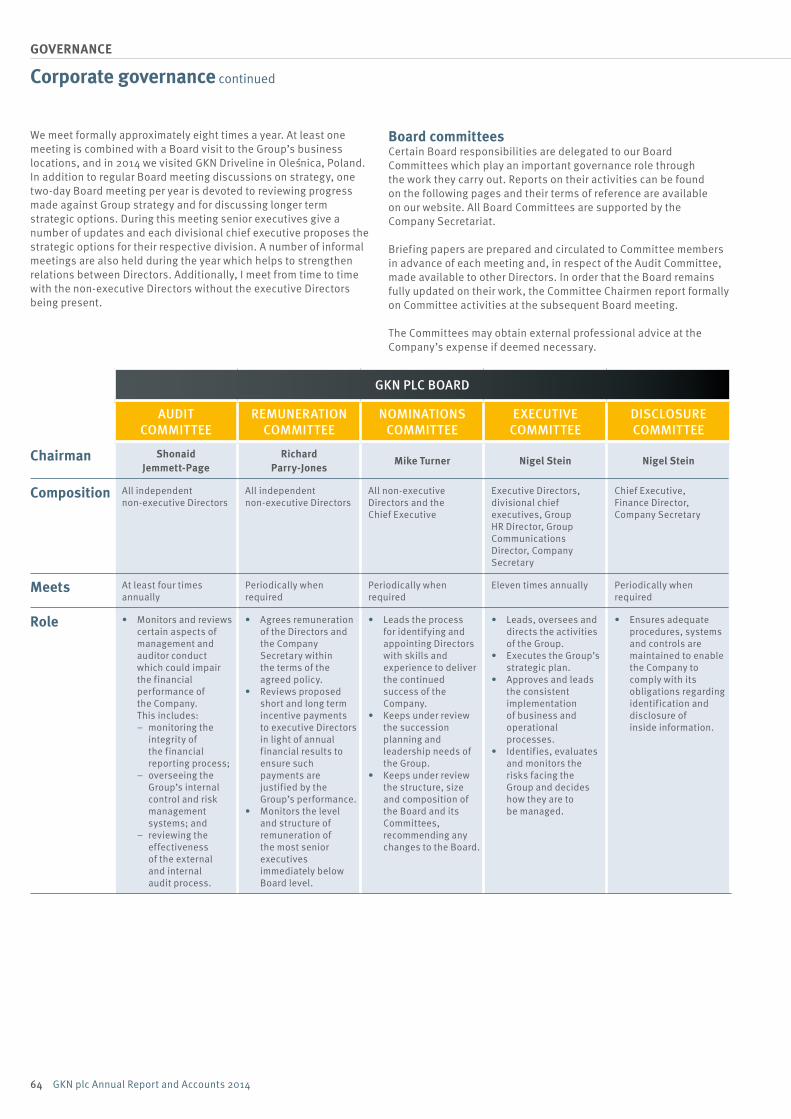
64 GKN plc Annual Report and Accounts 2014
GOVERNANCE
Corporate governance continued
We meet formally approximately eight times a year. At least one meeting is combined with a Board visit to the Group’s business locations, and in 2014 we visited GKN Driveline in Olesnica, Poland. In addition to regular Board meeting discussions on strategy, one two-day Board meeting per year is devoted to reviewing progress made against Group strategy and for discussing longer term strategic options. During this meeting senior executives give a number of updates and each divisional chief executive proposes the strategic options for their respective division. A number of informal meetings are also held during the year which helps to strengthen relations between Directors. Additionally, I meet from time to time with the non-executive Directors without the executive Directors being present.
Board committeesCertain Board responsibilities are delegated to our Board Committees which play an important governance role through the work they carry out. Reports on their activities can be found on the following pages and their terms of reference are available on our website. All Board Committees are supported by the Company Secretariat.
Briefing papers are prepared and circulated to Committee members in advance of each meeting and, in respect of the Audit Committee, made available to other Directors. In order that the Board remains fully updated on their work, the Committee Chairmen report formally on Committee activities at the subsequent Board meeting.
The Committees may obtain external professional advice at the Company’s expense if deemed necessary.
The accent on the s in Olesnica is a fudge of an s followed by an accent and then kerned in to make it fit. - This object won’t print!
GKN PLC BOARD
AUDIT COMMITTEE
REMUNERATION COMMITTEE
NOMINATIONS COMMITTEE
EXECUTIVE COMMITTEE
DISCLOSURE COMMITTEE
Chairman Shonaid Jemmett-Page
Richard Parry-Jones
Mike Turner Nigel Stein Nigel Stein
Composition All independent non-executive Directors
All independent non-executive Directors
All non-executive Directors and the Chief Executive
Executive Directors, divisional chief executives, Group HR Director, Group Communications Director, Company Secretary
Chief Executive, Finance Director, Company Secretary
Meets At least four times annually
Periodically when required
Periodically when required
Eleven times annually Periodically when required
Role • Monitors and reviews certain aspects of management and auditor conduct which could impair the financial performance of the Company. This includes:
– monitoring the integrity of the financial reporting process;
– overseeing the Group’s internal control and risk management systems; and
– reviewing the effectiveness of the external and internal audit process.
• Agrees remuneration of the Directors and the Company Secretary within the terms of the agreed policy.
• Reviews proposed short and long term incentive payments to executive Directors in light of annual financial results to ensure such payments are justified by the Group’s performance.
• Monitors the level and structure of remuneration of the most senior executives immediately below Board level.
• Leads the process for identifying and appointing Directors with skills and experience to deliver the continued success of the Company.
• Keeps under review the succession planning and leadership needs of the Group.
• Keeps under review the structure, size and composition of the Board and its Committees, recommending any changes to the Board.
• Leads, oversees and directs the activities of the Group.
• Executes the Group’s strategic plan.
• Approves and leads the consistent implementation of business and operational processes.
• Identifies, evaluates and monitors the risks facing the Group and decides how they are to be managed.
• Ensures adequate procedures, systems and controls are maintained to enable the Company to comply with its obligations regarding identification and disclosure of inside information.
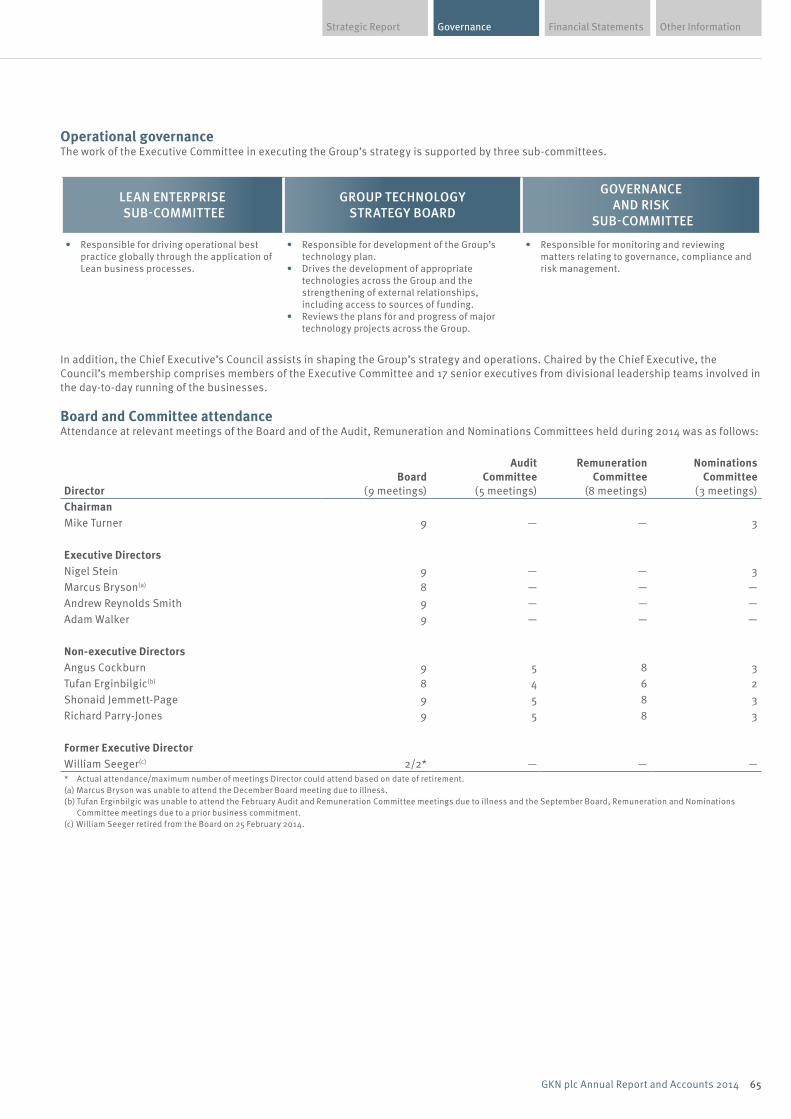
Financial Statements Other InformationGovernanceStrategic Report
65GKN plc Annual Report and Accounts 2014
Operational governanceThe work of the Executive Committee in executing the Group’s strategy is supported by three sub-committees.
LEAN ENTERPRISE SUB-COMMITTEE
GROUP TECHNOLOGY STRATEGY BOARD
GOVERNANCE AND RISK
SUB-COMMITTEE
• Responsible for driving operational best practice globally through the application of Lean business processes.
• Responsible for development of the Group’s technology plan.
• Drives the development of appropriate technologies across the Group and the strengthening of external relationships, including access to sources of funding.
• Reviews the plans for and progress of major technology projects across the Group.
• Responsible for monitoring and reviewing matters relating to governance, compliance and risk management.
In addition, the Chief Executive’s Council assists in shaping the Group’s strategy and operations. Chaired by the Chief Executive, the Council’s membership comprises members of the Executive Committee and 17 senior executives from divisional leadership teams involved in the day-to-day running of the businesses.
Board and Committee attendanceAttendance at relevant meetings of the Board and of the Audit, Remuneration and Nominations Committees held during 2014 was as follows:
DirectorBoard
(9 meetings)
AuditCommittee
(5 meetings)
Remuneration Committee
(8 meetings)
NominationsCommittee
(3 meetings)ChairmanMike Turner 9 — — 3
Executive DirectorsNigel Stein 9 — — 3Marcus Bryson(a) 8 — — —Andrew Reynolds Smith 9 — — —Adam Walker 9 — — —
Non-executive DirectorsAngus Cockburn 9 5 8 3Tufan Erginbilgic(b) 8 4 6 2Shonaid Jemmett-Page 9 5 8 3Richard Parry-Jones 9 5 8 3
Former Executive DirectorWilliam Seeger(c) 2/2* — — —* Actual attendance/maximum number of meetings Director could attend based on date of retirement.(a) Marcus Bryson was unable to attend the December Board meeting due to illness.(b) Tufan Erginbilgic was unable to attend the February Audit and Remuneration Committee meetings due to illness and the September Board, Remuneration and Nominations
Committee meetings due to a prior business commitment. (c) William Seeger retired from the Board on 25 February 2014.
66 GKN plc Annual Report and Accounts 2014
GOVERNANCE
Corporate governance continued
Effectiveness
Board composition The Board currently comprises three executive Directors and five non-executive Directors including the Chairman. It considers that all of the non-executive Directors, excluding the Chairman, are independent and it is not aware of any relationship or circumstance likely to affect the judgement of any Director.
The composition of our Board is kept under review by the Nominations Committee to ensure that it retains the necessary skill, knowledge and experience to meet the needs of the business. In 2014 it considered composition and succession planning in light of Marcus Bryson’s decision to retire from the Board; further details can be found on page 71.
Following the appointment of Adam Walker as Group Finance Director Designate on 1 January 2014 and until William Seeger’s retirement from the Board on 25 February 2014, our Board comprised five executive and four independent non-executive Directors (excluding me as Chairman). Although contrary to the UK Corporate Governance Code provision which states that at least half the board, excluding the chairman, should comprise non-executive directors, we considered that this arrangement was necessary to facilitate an orderly handover between William Seeger and his successor. As a Board, we are content that the independent judgement of the non-executive Directors was not adversely affected during this short period.
In accordance with the provisions of the Code, all Directors will seek re-election at the 2015 AGM. Our biographical details are given on page 61.
Recommendations for appointments to the Board are made by the Nominations Committee. The Committee follows Board-approved procedures (available on our website) which provide a framework for the different types of Board appointments. Appointments are made on merit against objective criteria with due regard to diversity of skills, experience and gender. Non-executive appointees must also demonstrate that they have sufficient time to devote to the role. The activities of the Nominations Committee during the year are set out on page 71.
DevelopmentDirectors are continually updated on the Group’s businesses, the markets in which they operate and changes to the competitive and regulatory environment through briefings to the Board and meetings with senior executives. Board visits to Group business locations enable us to meet local management and employees and to update our knowledge of the Group’s operations. Non-executive Directors are also encouraged to visit Group operations to increase their exposure to the business.
I discuss training and development needs with each Director as part of our annual individual performance evaluation process. The Company Secretary keeps under review the suitability of external courses so that any needs identified either through the evaluation process or on an ad hoc basis can be addressed. Directors attended external training courses on a number of matters during the year including ethics, technological updates and risk and compliance.
Information and supportI am responsible for ensuring that Directors receive accurate, timely and clear information. The provision of information to the Board was reviewed during the year as part of the performance evaluation exercise referred to on the following page.
To ensure that adequate time is available for Board discussion and to enable informed decision making, briefing papers are prepared and circulated to Directors one week prior to scheduled Board meetings. All Directors have direct access to the advice and services of the Company Secretary who ensures that the Board is fully briefed on legislative, regulatory and corporate governance developments. In addition, Directors may, in the furtherance of their duties, take independent professional advice at the Company’s expense.
The Company Secretary also supports the Committee Chairmen by ensuring that agendas are appropriate and address all matters for which the Committee has specific responsibility.
InductionOn joining the Board, a Director receives a tailored induction to suit the individual’s background and experience. This includes:• a comprehensive induction pack with background information
about GKN, details of Board meeting procedures, and Directors’ duties and responsibilities in addition to a number of other governance-related issues;
• a briefing with the Company Secretary who is tasked with facilitating the induction of new Directors both into the Group and as to their roles and responsibilities as Directors;
• meetings with the Chief Executive and with relevant senior executives to be briefed on the Group strategy and each individual business portfolio;
• plant visits; and• external training where appropriate, particularly on matters
relating to the role of a Director and the role and responsibilities of Board Committees.
This induction process was applied following the appointment of Adam Walker.
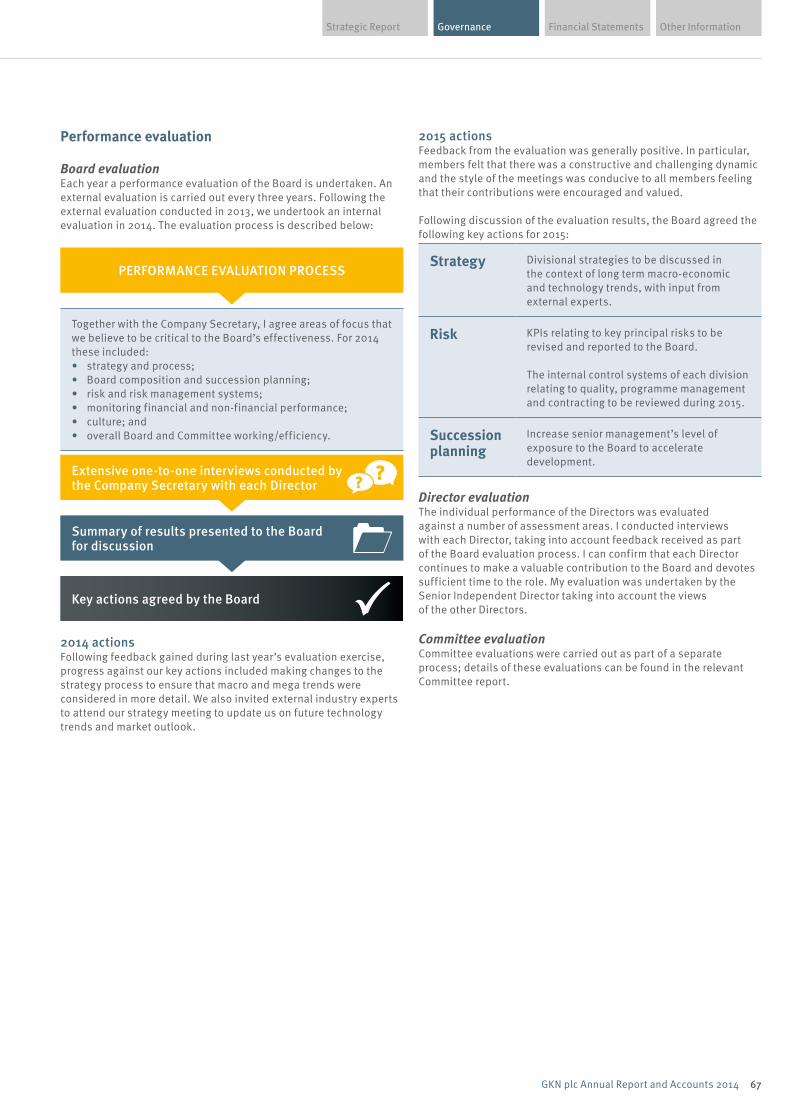
Financial Statements Other InformationGovernanceStrategic Report
67GKN plc Annual Report and Accounts 2014
Performance evaluation
Board evaluationEach year a performance evaluation of the Board is undertaken. An external evaluation is carried out every three years. Following the external evaluation conducted in 2013, we undertook an internal evaluation in 2014. The evaluation process is described below:
Together with the Company Secretary, I agree areas of focus that we believe to be critical to the Board’s effectiveness. For 2014 these included: • strategy and process; • Board composition and succession planning;• risk and risk management systems; • monitoring financial and non-financial performance;• culture; and • overall Board and Committee working/efficiency.
Key actions agreed by the Board
Summary of results presented to the Board for discussion
Extensive one-to-one interviews conducted by the Company Secretary with each Director
PERFORMANCE EVALUATION PROCESS
2014 actions Following feedback gained during last year’s evaluation exercise, progress against our key actions included making changes to the strategy process to ensure that macro and mega trends were considered in more detail. We also invited external industry experts to attend our strategy meeting to update us on future technology trends and market outlook.
2015 actions Feedback from the evaluation was generally positive. In particular, members felt that there was a constructive and challenging dynamic and the style of the meetings was conducive to all members feeling that their contributions were encouraged and valued.
Following discussion of the evaluation results, the Board agreed the following key actions for 2015:
Strategy Divisional strategies to be discussed in the context of long term macro-economic and technology trends, with input from external experts.
Risk KPIs relating to key principal risks to be revised and reported to the Board.
The internal control systems of each division relating to quality, programme management and contracting to be reviewed during 2015.
Succession planning
Increase senior management’s level of exposure to the Board to accelerate development.
Director evaluationThe individual performance of the Directors was evaluated against a number of assessment areas. I conducted interviews with each Director, taking into account feedback received as part of the Board evaluation process. I can confirm that each Director continues to make a valuable contribution to the Board and devotes sufficient time to the role. My evaluation was undertaken by the Senior Independent Director taking into account the views of the other Directors.
Committee evaluation Committee evaluations were carried out as part of a separate process; details of these evaluations can be found in the relevant Committee report.
68 GKN plc Annual Report and Accounts 2014
GOVERNANCE
Corporate governance continued
Accountability
Financial and business reporting
When reporting externally, the Board aims to present a fair, balanced and understandable assessment of the Group’s position and prospects. During the year, the Board satisfied itself that appropriate assurance processes are in place to enable it to state that this annual report, taken as a whole, is fair, balanced and understandable and provides the information necessary for users to assess the Company’s performance, business model and strategy. A statement of this responsibility, together with additional responsibilities of the Directors in respect of the preparation of the annual report, is set out on page 102. Page 109 of the auditors’ report includes a statement by PricewaterhouseCoopers LLP about their reporting responsibilities. As set out on page 41, the Directors are of the opinion that GKN’s business is a going concern.
Risk management and internal controlThe Board is responsible for setting the risk appetite of the Group and we also retain responsibility for maintaining sound risk management and internal control systems and undertaking an annual review of the effectiveness of these systems. Certain elements of this responsibility are overseen on our behalf by the Executive Committee and the Audit Committee.
Our risk management and internal control processes are regularly reviewed and revised to ensure that they remain relevant to changes in the Group’s internal and external risk profiles. Improvements during 2014 included:• the development and approval of a revised GKN Code for
Group employees;• the continued strengthening of the Group’s export control
compliance programme;• the introduction of an online tool for assessing external
anti-bribery and corruption risks; • the revision of our Supplier Code of Conduct; and• the enhancement of reviews of catastrophic health
and safety risk.
During the year, we considered changes to the revised UK Corporate Governance Code and related FRC guidance, particularly in respect of risk management and internal control. We are reviewing our processes in the context of these changes and will report against the revised provisions in the 2015 annual report.
Enterprise risk managementGKN’s enterprise risk management (ERM) programme facilitates a Group-wide approach to the identification and assessment of risk. A description of the process for managing enterprise risk, together with a summary of risks which could have a material impact on the Group and actions in place to mitigate those risks, is given on pages 42 to 51.
Internal control The Group has in place a number of controls to manage risk in respect of financial reporting and the preparation of consolidated accounts. These include:• the implementation of Group accounting policies and procedures,
supported by regular bulletins from the central and divisional finance teams on the application of accounting standards and reporting protocols;
• Group and divisional policies governing the maintenance of accounting records, transaction reporting and key financial control procedures;
• a proprietary internal control monitoring system, GKN Reporting and Integrity Procedures (GRiP), to assess compliance with key financial controls on monthly, quarterly and annual cycles;
• monthly operational review meetings which include, as necessary, reviews of internal financial reporting issues and financial control monitoring;
• divisional certifications in relation to internal financial controls, accounting judgements and representations of divisional financial results; and
• ongoing training and development of financial reporting personnel.
Other controls in place to minimise risk and ensure the efficient conduct of the Group’s business include:• the regular review of the GKN Code and policies to ensure that areas
of potential risk are adequately covered. The Code and policies define the behaviours expected of all GKN employees and are available on the Group intranet;
• the development and dissemination of training programmes to educate employees on relevant topics such as competition law or anti-bribery and to reinforce the behaviours expected of them;
• clearly defined approval limits and delegated authorities, particularly in relation to treasury transactions and capital expenditure submissions; and
• an employee disclosure hotline which employees can use to report any instances of suspected wrongdoing.
The areas of our risk assurance processes in which compliance monitoring is considered to be of the utmost importance currently include: financial reporting, IT controls, legal matters (including anti-bribery and corruption, competition law and export control), human resources issues (including employment practices and employee disclosure) and health, safety and the environment. The risk assurance framework therefore incorporates:• monthly monitoring of compliance with the GRiP financial reporting
processes through a self-certification process and peer reviews; • the quarterly completion of an IT controls checklist confirming
adherence to Group IT standards and policies;• monitoring the completion of mandated training on legal topics and
the compliance of divisional sales agents and consultants committees (implemented as part of the Group’s anti-bribery and corruption measures) with the relevant Group policy;
• the bi-annual completion of a human resources controls checklist confirming compliance with certain Group HR standards and procedures;
• monitoring the completion of internal health and safety audits against target and any themes arising from these audits;
• the annual completion of a questionnaire by senior managers in relation to awareness of the Group’s Code and policies; and
• the annual confirmation by senior managers that non-financial controls are in place and operating effectively in their businesses.
The Executive Sub-Committee on Governance and Risk (ESCGR) monitors the output from these processes and reports any areas of concern and proposals for improvement to the Executive Committee for consideration.
Financial Statements Other InformationGovernanceStrategic Report
69GKN plc Annual Report and Accounts 2014
In 2014, the ESCGR made recommendations to revise the Group’s Supplier Code of Conduct and recommunicate the Group’s Fraud Management policy, both of which were accepted by the Executive Committee.
Risk reviewEach year all Group businesses are required formally to review their business risks and to report on whether there has been any material breakdown in their internal controls. This formal review is supplemented by an interim review conducted at the half year. Businesses also have to confirm annually whether they have complied with statutory and regulatory obligations as well as with the policies which support the GKN Code.
The Group’s systems and procedures are designed to identify, manage and, where practicable, reduce and mitigate the effects of the risk of failure to achieve business objectives. They are not designed to eliminate such risk, recognising that any system can only provide reasonable and not absolute assurance against material misstatement or loss.
Process for review of effectivenessThe Audit Committee is responsible for reviewing the ongoing control processes, and the actions undertaken by the Committee to discharge this responsibility are described in the Audit Committee’s report on pages 72 to 77.
The Board receives an annual report from the Audit Committee concerning the operation of the key systems of internal control and risk management. This report is considered by the Board in forming its own view on the effectiveness of the systems.
The Board has reviewed the effectiveness of the Group’s systems of internal control and risk management during the period covered by this annual report. It confirms that the processes described above, which accord with the FRC guidance on internal control (the revised Turnbull Guidance), have been in place throughout that period and up to the date of approval of the annual report. The Board also confirms that no significant failings or weaknesses were identified in relation to the review.
Relations with investorsThe Board maintains a dialogue with investors with the objective of ensuring a mutual understanding of objectives.
Major shareholdersCommunication with major institutional shareholders is undertaken as part of GKN’s investor relations programme, in which non-executive Directors are encouraged to participate.
With support from the Company Secretary, I meet with institutional shareholders and investor representatives to discuss matters relating to governance and strategy and feed back any issues to the Board. The Senior Independent Director is also available to discuss issues with shareholders where concerns cannot be addressed through normal channels of communication.
Richard Parry-Jones, in his capacity as Remuneration Committee Chairman, also engages in discussion with shareholders on significant matters relating to executive remuneration.
The Chief Executive, Group Finance Director and Director of Investor Relations meet regularly with major shareholders to discuss strategy, financial and operating performance. Feedback is sought by the Company’s brokers after meetings and presentations to ensure that the Group’s strategy and performance is being communicated effectively and to develop further an understanding of shareholders’ views. This feedback is included in a twice-yearly report to the Board, which also provides an update on investor relations activity, highlights changes in holdings of substantial shareholders and reports on share price movements. In addition, external brokers’ reports on GKN are circulated to all Directors.
GKN hosted a number of events for institutional investors in 2014, which included site visits to its facilities in the UK, China and the US and divisional presentations on strategy, growth opportunities and technology innovations. A recording of the presentations and slide material shown is available on our website.
Communications with shareholdersWritten responses are given to letters or email received from shareholders and all shareholders receive, or can access electronically, copies of the annual and half year reports. The investor relations section of our website provides further detail about the Group, including share price information, webcasts and presentations of annual and half year results, other presentations made to the investment community, and copies of financial reports.
Annual general meetingInformation regarding the 2015 AGM is given on page 99. Shareholders who attend the AGM are invited to ask questions during the meeting and to meet with Directors after the formal AGM business has been completed. Resolutions for consideration at the AGM are voted on by way of a poll rather than by show of hands to allow the votes of all shareholders to be counted, including those cast by proxy. The results of the poll vote are announced to the London Stock Exchange and published on our website after the meeting.
Compliance statementThis corporate governance statement, together with the Nominations Committee report on pages 70 and 71, the Audit Committee report on pages 72 to 77 and the Directors’ remuneration report on pages 78 to 98, provide a description of how the main principles of the 2012 edition of the UK Corporate Governance Code (the Code) have been applied within GKN during 2014. The Code is published by the Financial Reporting Council and is available on its website at www.frc.org.uk.
As noted on page 66, from 1 January 2014 until 25 February 2014, GKN was not compliant with Code provision B.1.2 relating to the balance of executive and non-executive Directors. For the remainder of the year, it is the Board’s view that GKN was in compliance with all relevant Code provisions.
This statement complies with sub-sections 2.1, 2.2(1), 2.3(1), 2.5, 2.7 and 2.10 of Rule 7 of the Disclosure Rules and Transparency Rules of the Financial Conduct Authority. The information required to be disclosed by sub-section 2.6 of Rule 7 is shown on pages 99 to 101.
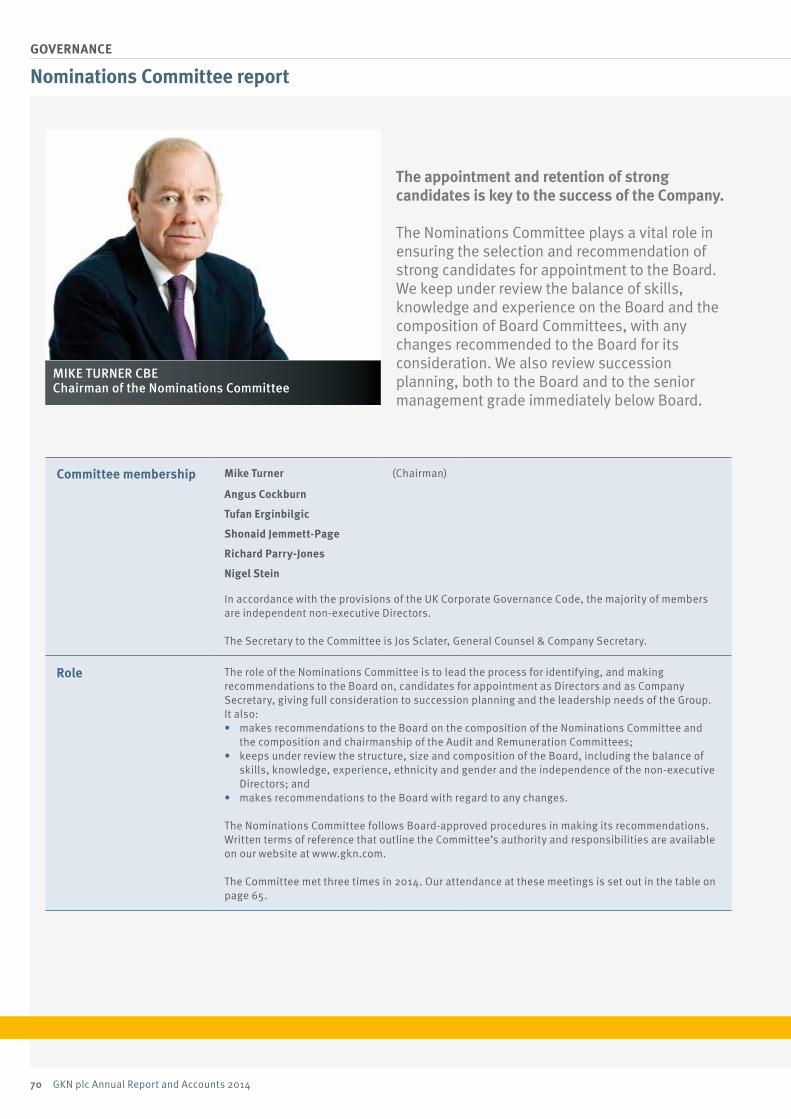
MIKE TURNER CBEChairman of the Nominations Committee
70 GKN plc Annual Report and Accounts 2014
GOVERNANCE
Nominations Committee report
The appointment and retention of strong candidates is key to the success of the Company.
The Nominations Committee plays a vital role in ensuring the selection and recommendation of strong candidates for appointment to the Board. We keep under review the balance of skills, knowledge and experience on the Board and the composition of Board Committees, with any changes recommended to the Board for its consideration. We also review succession planning, both to the Board and to the senior management grade immediately below Board.
Committee membership Mike Turner (Chairman)
Angus Cockburn
Tufan Erginbilgic
Shonaid Jemmett-Page
Richard Parry-Jones
Nigel Stein
In accordance with the provisions of the UK Corporate Governance Code, the majority of members are independent non-executive Directors.
The Secretary to the Committee is Jos Sclater, General Counsel & Company Secretary.
Role The role of the Nominations Committee is to lead the process for identifying, and making recommendations to the Board on, candidates for appointment as Directors and as Company Secretary, giving full consideration to succession planning and the leadership needs of the Group. It also: • makes recommendations to the Board on the composition of the Nominations Committee and
the composition and chairmanship of the Audit and Remuneration Committees; • keeps under review the structure, size and composition of the Board, including the balance of
skills, knowledge, experience, ethnicity and gender and the independence of the non-executive Directors; and
• makes recommendations to the Board with regard to any changes.
The Nominations Committee follows Board-approved procedures in making its recommendations. Written terms of reference that outline the Committee’s authority and responsibilities are available on our website at www.gkn.com.
The Committee met three times in 2014. Our attendance at these meetings is set out in the table on page 65.
Financial Statements Other InformationGovernanceStrategic Report
71GKN plc Annual Report and Accounts 2014
2014 activities During 2014 we: • considered the composition of the Board following Marcus
Bryson’s decision to retire;• considered and recommended new appointments to the
Executive Committee;• considered and recommended the appointment of Jos Sclater as
General Counsel & Company Secretary; and• recommended to the Board a three-year extension of terms of
office for Richard Parry-Jones and Tufan Erginbilgic.
Board and Committee compositionIn light of Marcus Bryson’s retirement at the end of 2014, we considered the subsequent composition of the Board and the Executive Committee and the balance of skills, knowledge and experience on each.
Following our review, we deemed the size of the Board and the balance of executive and non-executive Directors following Marcus Bryson’s retirement to be appropriate. We considered that the Board’s collective skills and experience and its knowledge of both GKN and the industries in which it operates would enable the Board to continue to discharge its responsibilities effectively. We did, however, support changes to the Executive Committee to ensure appropriate divisional representation. Accordingly, the Board approved our recommendation to appoint Kevin Cummings, CEO GKN Aerospace, Peter Oberparleiter, CEO GKN Powder Metallurgy, and Phil Swash, CEO GKN Land Systems, to the Committee. Each will attend Board meetings when there is a significant agenda item relating to their divisions, giving the Board direct access to their knowledge and expertise where appropriate.
Executive mattersFollowing the retirement of Judith Felton, Company Secretary, in June 2014, the Committee recommended the appointment of Jos Sclater as Company Secretary in addition to his role as General Counsel. The Board approved our recommendation.
Non-executive mattersDuring the year we considered the extension of the terms of appointment of Richard Parry-Jones and Tufan Erginbilgic. Taking into account the contribution that each makes to the Board and its Committees, the Committee recommended to the Board the extension of the terms of both non-executive Directors for a further three years. The Board approved these recommendations.
Diversity We acknowledge the importance of diversity, including gender, both on the Board and throughout the Group. Our aim is for the Board to consist of people with diverse experience who can add real value to Board debates, thereby supporting the achievement of our strategic objectives. This includes diversity of industry skills, knowledge and experience in addition to gender and ethnicity.
It is our aim to have at least 25 per cent female representation on the Board and we will continue to work towards this as and when positions arise. However, our overriding purpose in any new appointment must always be to select on merit, in fulfilment of our role of ensuring the continued success of the Company.
We are currently focusing on the development and support of our executive pipeline with regard to gender and ethnic diversity; further information can be found in the sustainability review on page 56.
Advice provided to the CommitteeFrom time to time the Committee appoints external search consultants to assist with the selection and recruitment of potential new Board members. During the year no such assistance was required.
Performance evaluation The Committee’s annual evaluation was carried out as part of a series of one-to-one interviews between the Company Secretary and each Director. No changes were considered necessary to the Committee’s terms of reference as a result, and the Committee was considered to be effective in fulfilling its role throughout 2014.
On behalf of the Committee
Mike Turner CBE Chairman of the Nominations Committee 23 February 2015
SHONAID JEMMETT-PAGEChairman of the Audit Committee
72 GKN plc Annual Report and Accounts 2014
GOVERNANCE
Audit Committee report
The Audit Committee plays a key role in monitoring and reviewing those aspects of management and auditor conduct which could financially impact shareholders.
This includes reviewing the integrity of the Group’s financial statements to determine whether the judgements and policies taken by management are appropriate, as well as monitoring the independence and effectiveness of the external auditors. It also includes oversight of the Group’s systems of internal control and risk management. This report details the activities we undertook during the year in fulfilling our responsibilities.
Committee membership Shonaid Jemmett-Page (Chairman)
Angus Cockburn
Tufan Erginbilgic
Richard Parry-Jones
All members are independent non-executive Directors and, in the Board’s view, have recent and relevant financial experience as required by the UK Corporate Governance Code. In particular, Shonaid Jemmett-Page has held a number of senior finance roles in Unilever and is a former partner at KPMG and former Chief Operating Officer at CDC Group plc, the UK Government’s development finance institution. Angus Cockburn is currently the Chief Financial Officer of Serco Group plc and previously held senior finance positions within international organisations.
The secretary to the Committee is Jos Sclater, General Counsel & Company Secretary.
Role The primary role of the Audit Committee is to ensure the integrity of the financial reporting and audit processes and the maintenance of sound internal control and risk management systems. This includes responsibility for monitoring and reviewing:
• the integrity of the Group’s financial statements and the significant reporting judgements contained in them;
• the appropriateness of the Group’s relationship with the external auditors, including auditor independence, fees and provision of non-audit services;
• the effectiveness of the external audit process, making recommendations to the Board on the appointment of the external auditors;
• the activities and effectiveness of the internal audit function (Corporate Audit); • the effectiveness of the Group’s internal control and risk management systems; and • the effectiveness of the Group’s whistleblowing policies.
Written terms of reference that outline the Committee’s authority and responsibilities are available on our website at www.gkn.com.
The Committee met five times in 2014, with meetings generally timed to coincide with the financial and reporting cycles of the Company. Our attendance at these meetings is set out in the table on page 65.

Financial Statements Other InformationGovernanceStrategic Report
73GKN plc Annual Report and Accounts 2014
In order to maintain effective communication between all relevant parties, we invited the Group Chairman, Chief Executive, Group Finance Director, Head of Corporate Audit, the external audit engagement partner and other members of senior management to attend Committee meetings as necessary.
Members of the Committee met separately at the start of each meeting to discuss matters in the absence of any invitees. At the conclusion of meetings, the Head of Corporate Audit and the audit engagement partner of PricewaterhouseCoopers LLP (PwC) were each given the opportunity to discuss matters without executive management being present. Both the Head of Corporate Audit and the external auditors have direct access to me should they wish to raise any concerns outside formal Committee meetings.
2014 activities Our activities in 2014 principally related to financial reporting, the external audit, internal control and risk management. In addition, we considered other specific matters such as treasury activities, updates from the divisional finance directors on relevant divisional matters and the Group’s approach to IT controls including cyber security.
Significant issues We identified the issues below as significant in the context of the 2014 financial statements. We consider these areas to be significant taking into account the level of materiality and the degree of judgement exercised by management. We debated the issues in detail to ensure that the approaches taken were appropriate.
Area of focus Committee action
Impairment testing(see Note 11 to the financial statements)
An impairment review is carried out annually by management to identify cash generating units in which the recoverable amount of the unit’s assets (including expected future cash flows generated by those assets) is less than the value of the assets carried in the Group’s accounts. Impairment results in a charge to the Group income statement.
Key judgements and assumptions need to be made when valuing the assets of the cash generating units and the quantum of potential future cash flows arising from those assets.
We considered the significant judgements, assumptions and estimates made by management in preparing the impairment review to ensure that they were appropriate.
We reviewed assumptions relating to:
• the discount rates, which reflect the risk inherent in each unit taking into account factors such as geography and sector, used to discount the expected future cash flows to their present value;
• the estimation of long term growth rates for the territories in which the units were based; and• the forecast of operating cash flows, based on the most recent budget and strategic reviews and taking
into account data such as sales profile and prices, market performance, volume, raw material costs and capital expenditure levels.
We also considered sensitivities that would affect the assumptions noted above.
We obtained the external auditors’ view in relation to the appropriateness of the approach and outcome of the review. Taking this into account, together with the documentation presented and the explanations given by management, we were satisfied with the thoroughness of the approach and judgements taken.
The review resulted in the impairment of four units and a charge to the income statement of £69 million.
Provisions for potential liabilities (see Note 21 to the financial statements)
The Group makes provisions where it is probable that settlement of liabilities will result in a cash outflow in respect of contractual obligations, warranties, litigation, customer and supplier claims and other matters. Key judgements are made in assessing an appropriate level of provisioning.
We increased our focus on this area in 2014 due to the evolving risk profile of the Group, particularly with regard to long term complex contracts in aerospace and increasing customer activity in relation to vehicle recalls in automotive. Both of these factors could have a significant impact on the Group’s liabilities. Further details on the nature of these risks can be found in our principal risks and uncertainties on pages 47 and 48.
In particular, we focused on the potential liabilities arising from contractual matters with customers. To determine whether the level of provisioning in the balance sheet was appropriate, we considered management’s view of a number of factors including the nature of the claim received, details of any costs incurred and potential recall or rectification costs. We also reviewed an assessment of the likelihood of future cash outflows arising and the historical accuracy of the level of Group provisions.
We invited PwC’s comments on this area and concluded that the approach taken in respect of provisioning continued to be appropriate.

74 GKN plc Annual Report and Accounts 2014
GOVERNANCE
Audit Committee report continued
We also reviewed the following areas due to their materiality and the application of judgement. However, we considered them to be stable in nature and therefore we did not classify them as significant issues in the context of the 2014 financial statements.
Development costs on aerospace programmes (see Note 11 to the financial statements) Development costs for large aerospace programmes can be significant and assessing the likelihood of future recoverability of costs involves various judgements and assumptions. These relate to factors such as anticipated volumes, method of amortisation, forecast cash flows and discount rates.
Impairment reviews of programme development costs against associated future cash flows are circulated to the Committee on a six-monthly basis. On each occasion we reviewed the valuation and the assumptions made, including programme risk factors, and the most recent external forecasts of aircraft programme demand. Actions and factors likely to influence levels of impairment were noted and the view of the external auditors was sought in relation to the appropriateness of the approach and outcome. Particular focus was placed on the A350 programme due to the value of its development costs, which totalled £210 million including capital expenditure and capitalised interest at 31 December 2014. Taking into account the documentation presented and the assessment of the external auditors, we were satisfied with the approach and judgements taken.
Post-employment obligations (see Note 24 to the financial statements) Determining the current value of the Group’s future pension obligations requires a number of assumptions. These assumptions relate principally to life expectancy, discount rates applied to future cash flows and rates of inflation and future salary increases.
Key matters reviewed this year included the appropriateness of valuation assumptions such as discount rates, mortality and inflation. The Committee also reviewed the impact of certain pension de-risking activities on the financial statements. In the US, cash lump sums were offered to deferred members on a voluntary basis in lieu of future pension obligations. In the UK, a bulk annuity ‘buy-in’ was completed whereby the Group insured a proportion of its pension liabilities.
Valuation assumptions, prepared by external actuaries and adopted by management, were considered in the light of prevailing economic indicators and the view of the external auditors. The adoption of a new US mortality table was reviewed and the approach adopted by management was accepted as appropriate.
Treasury hedging activities(see Notes 18 and 19 to the financial statements) In 2014, the Group entered into cross- currency interest rate swap instruments to convert its £350 million 6.75% bonds maturing in 2019 and £450 million 5.375% bonds maturing in 2022 into US Dollars and Euros. Although entering into such instruments is a relatively common activity for companies which operate globally, we considered this area due to the quantum of the amounts involved and the accounting implications.
The use of such instruments requires a number of decisions to be made which impact the financial statements. In some areas, management has discretion as to how to act, particularly with regard to:
• the way in which the instruments are accounted for;• the way in which the instruments are valued; and • the method by which the effectiveness of the instruments is measured.
We considered management’s adoption of net investment hedge accounting and reviewed the method and frequency by which it planned to perform the valuations of the swap instruments and effectiveness testing of the hedge relationship. We were content that the decisions taken by management were appropriate in all instances.
Given the significance of foreign currency movements on the financial statements, we debated the nature of the Group’s hedging activities and reviewed the financial and presentational impact on the 2014 financial statements. We were satisfied by the approach taken and disclosures given.
Financial reporting During the year, we: • considered information presented by management on
significant accounting judgements and policies adopted in respect of the Group’s half year and annual financial statements and agreed their appropriateness;
• examined key points of disclosure and presentation to ensure the adequacy, clarity and completeness of the financial statements;
• discussed with PwC its audit reports which highlighted key accounting matters and significant judgements in respect of each set of financial statements;
• reviewed documentation prepared to support the going concern judgement given on page 41; and
• received an update on the implications of a new accounting standard which will take effect in 2017.
External audit In 2014, we: • approved PwC’s audit plan and terms of engagement; • conducted our annual review of the independence and
objectivity of PwC; • noted the non-audit fees payable to PwC, having regard
to the policy on the provision of non-audit services; • approved for recommendation to the Board a revised
policy on non-audit services to take effect from 2015;• determined that PwC remained effective in their role
as external auditors; • recommended to the Board that PwC be appointed
as external auditors for a further year; and• agreed the timing of a tender exercise in relation to
the appointment of external auditors.
Financial Statements Other InformationGovernanceStrategic Report
75GKN plc Annual Report and Accounts 2014
The Committee is responsible for making recommendations to the Board in relation to the appointment of the external auditors. We also approve the terms of engagement and fees of the external auditors, ensuring that they have appropriate audit plans in place and that an appropriate relationship is maintained between the Group and the external auditors.
Audit planPwC’s presentation of their audit plan set out the scope and objectives of the audit together with an overview of the planned approach, an assessment of the Group’s risks and controls and proposed areas of audit focus. In my role as Chairman, I attended PwC’s audit planning meeting. Additionally, PwC worked with Corporate Audit and management to identify areas which indicated an increased risk of control breakdown. These areas were then targeted proactively to ensure they received the appropriate amount of attention during the audit.
IndependenceAs a Committee we are responsible for the development, implementation and monitoring of the Company’s policies on external audit which are designed to maintain the objectivity and independence of the external auditors. These policies regulate the appointment by the Group of former employees of PwC and set out the approach to be taken when using the external auditors for non-audit work.
Our annual review of the independence of the external auditors included: • receiving confirmation from PwC that they remained
independent and objective within the context of applicable professional standards;
• considering the tenure of the audit engagement partner, who is required to rotate every five years in line with ethical standards;
• ensuring that management confirmed compliance with the Group’s policies on the employment of former employees of PwC and the use of PwC for non-audit work; and
• considering Corporate Audit’s annual review of PwC’s objectivity, independence and effectiveness and of the audit process.
As a result of this review, we concluded that PwC remained appropriately independent in the role of external auditors.
Non-audit servicesIn order to safeguard independence further, we monitor compliance with the policy for the provision of non-audit services. The external auditors are generally excluded from consultancy work and are not engaged by GKN for other non-audit work unless there are compelling reasons to do so, for example where PwC can draw upon significant historic knowledge gained through the audit process.
Details of the fees paid to PwC in 2014 can be found in note 4(a) to the financial statements. Non-audit fees incurred during 2014 amounted to £0.9 million which related principally to tax compliance services (£0.5 million). Tax advisory services totalled £0.2 million and audit related assurance services and other services amounted to £0.1 million each. Non-audit fees as a percentage of audit fees totalled 20%. All such activities remained within the policy approved by the Board.
During the year, we approved a revised policy on the provision of non-audit services for recommendation to the Board. This takes effect from 2015 and was amended in anticipation of the implementation of EU legislation. In addition to limiting the permissible services, the authorisation levels were also reviewed and amended. Any proposal to use the external auditors for non-audit work with a value between £50,000 and £250,000 must be submitted to the Group Finance Director for approval prior to their appointment. All proposals above this amount must be submitted to me for approval. In addition, the Group Finance Director will seek my prior authorisation for certain aspects of non-audit services relating to acquisitions, disposals and investigative accounting services, regardless of the fee value. The use of contingent fees is strictly prohibited under the policy.
76 GKN plc Annual Report and Accounts 2014
GOVERNANCE
Audit Committee Report continued
Effectiveness and reappointmentOur review of the performance of PwC and the effectiveness of the external audit process included consideration of responses from questionnaires conducted with members of the Committee, executive Directors and senior management. All participants were asked to rate PwC’s effectiveness in a number of areas including independence and objectivity, audit planning and execution, conduct and communication, audit findings and feedback and expertise and resourcing. The results confirmed that both PwC and their audit process were considered to be effective and that a good working relationship was supplemented by a sufficient amount of robustness in challenging management judgements. Minor improvements relating to team member continuity and communications with site management were suggested to and accepted by PwC.
PwC have been the Company’s external auditors since their formation in 1998, although several predecessor organisations of PwC held office for some time prior to that date. Whilst the Company has not formally tendered the audit in recent years, the Committee did conduct a comprehensive review of the effectiveness and performance of the external auditors following the rotation of the audit partner in 2011. As part of this exercise, the new audit partner submitted a tender proposal for future audits covering matters such as independence, objectivity, resourcing and value for money. We also conducted a benchmarking exercise based on external data and a review of external documents on the four major audit firms issued by regulatory bodies.
In determining whether to recommend the auditors for reappointment in 2015, we took into consideration the tenure of the audit partner, the results of the effectiveness review detailed above, the FRC Audit Quality Inspection Report in respect of PwC and the firm’s internal quality control procedures. Taking these elements into account, we concluded that it was appropriate to recommend to the Board PwC’s reappointment as the Company’s auditors for a further year.
Mindful of the increasing regulatory focus on audit tendering in the UK and EU, we have been keeping under review the appropriate timing of conducting a formal tender exercise. During 2014, the Committee recommended, and the Board accepted, a proposal to put the audit contract out to competitive tender following the rotation of the current audit partner. It is therefore anticipated that any change in auditors would take effect for the audit of the 2016 financial statements.
There are no contractual obligations restricting our choice of external auditors.
Internal control and risk management In fulfilling our remit we: • reviewed the results of audits undertaken by Corporate Audit; • received reports on control issues of significance to the Group; • reviewed the status of the Group’s internal financial control
monitoring system; • reported to the Board on our evaluation of the operation of the
Group’s systems of internal control and risk management, informed by reports from Corporate Audit and PwC; and
• noted the implementation of additional risk processes.
The Committee is responsible for monitoring and reviewing the effectiveness of the Group’s internal control and risk management systems and the activities and effectiveness of Corporate Audit.
We reviewed Corporate Audit’s quarterly reports throughout the year which detail any internal control issues and identify any themes arising in relation to audit recommendations. We considered the adequacy of management’s response to matters raised and the implementation of recommendations made.
We received regular updates on progress in respect of the continued development of the Group’s risk management framework and the implementation of additional assurance processes in order to strengthen the framework. Further information on the Group’s systems of internal control and risk management is given on pages 68 and 69. Together with an internal control review undertaken by Corporate Audit and an informal review of our internal control environment carried out by PwC, we evaluated the systems of internal control and risk management and reported to the Board on our evaluation in order that it could form a view on the effectiveness of those systems. The Board’s statement on internal control can be found on pages 68 and 69.
Internal audit During the year we: • approved the appointment of a new Head of Corporate Audit;• approved the 2015 Corporate Audit programme, including the
proposed audit approach, coverage and allocation of resources; and
• reviewed the effectiveness of Corporate Audit.
In relation to consideration of the Corporate Audit programme for the forthcoming year, we reviewed the proposed audit approach, coverage and allocation of resource. We also received progress updates against the 2014 audit programme throughout the year.
We reviewed the terms of reference and effectiveness of Corporate Audit, taking into account the views of Directors and senior management on matters such as independence, proficiency, resourcing, and audit strategy, planning and methodology. The review confirmed that the Corporate Audit function was independent and objective and remained an effective element of the Group’s corporate governance framework.
Financial Statements Other InformationGovernanceStrategic Report
77GKN plc Annual Report and Accounts 2014
Employee disclosure To support the Group’s Employee Disclosure Procedures Policy (available on our website), GKN operates a Group-wide international employee disclosure hotline. Run by an external and independent third party, the hotline enables employees to make (anonymously if preferred) confidential disclosures about suspected impropriety and wrongdoing. Any matters reported are investigated and escalated to the Audit Committee as appropriate, and statistics on the volume and general nature of all disclosures made are reported to the Committee on an annual basis.
Other mattersDuring the year we:• received an update on treasury strategy, particularly in respect
of hedging activities;• reviewed progress against the Group’s IT security plan; and• received updates from divisional finance directors on matters
relevant to their divisions.
Recognising the financial impact that an IT security breach could have on the Company, we received an update on the Group’s approach to IT security controls in terms of prevention, detection and response. Further information can be found in our principal risks and uncertainties on page 50.
We also received updates from our divisional finance directors on matters relevant to their divisions. Principally these related to contractual matters, reviews of programme development costs and updates on a cross-divisional project to develop a bespoke software tool to track and improve the separation of duties in transactions, thereby reducing the risk of fraud or error.
Advice provided to the Committee The Committee has independent access to the services of Corporate Audit and to the external auditors, and may obtain outside professional advice as necessary in the performance of its duties.
Performance evaluation Our annual evaluation process was carried out by questionnaire in 2014. The questionnaire focused on areas such as Committee composition, quality and content of meetings, role and remit, and areas of focus for 2015. Feedback from the questionnaire, which was circulated to Committee attendees as well as members, showed that the Committee was considered to be effective in fulfilling its role throughout 2014.
Overview of Committee activities for 2015 Risk management will continue to be our priority for 2015. As part of the refinement and reinforcement of our internal control systems, the Board plans to review the control systems relating to the Group’s principal risks of product quality, programme management and contracting. We will consider the effectiveness of any additional internal control systems that may be implemented as a result of this review. Our other area of focus will be the oversight of the tender process for the external audit contract. On behalf of the Committee
Shonaid Jemmett-PageChairman of the Audit Committee23 February 2015
78 GKN plc Annual Report and Accounts 2014
GOVERNANCE
Directors’ remuneration report
PROFESSOR RICHARD PARRY-JONES CBEChairman of the Remuneration Committee
We note the emphasis in the 2014 UK Corporate Governance Code on designing pay schemes that promote the long term success of the Group. This is in line with our approach to reward. GKN is a long term business, with automotive platforms often lasting for seven years or more and aerospace platforms frequently lasting for more than twenty years. This is why in 2012 we were one of the first industrial companies to introduce a significant five year element into our long term incentive scheme. The other elements of our incentives arrangements are also carefully designed to align with our strategy and risks, as described below.
Incentive scheme Link to strategy and risk
Annual bonus scheme (STVRS)
Our Short Term Variable Remuneration Scheme (STVRS) is designed to incentivise the achievement of short term financial and strategic initiatives which are required to deliver the long term strategy.
As described on page 9, we aim to achieve a balanced approach between growth, margin and return on invested capital (ROIC), resulting in increased cash flow. The STVRS financial targets are designed to reward the achievement of these measures. We set challenging targets, whilst seeking to avoid excessive risk taking.
The STVRS strategic measures are designed to reward the achievement of key strategic goals that will help deliver the broader Group and divisional strategies and address key risks. The 2014 strategic measures were tailored to Group and divisional strategies but there were some common themes as set out below:
Strategic goal Link to strategic objective Link to principal risk
New business wins Leading in chosen markets Highly competitive markets
Development of technology Technology driving margin Technology and innovation
Implementation of our ‘Voice of the Customer’ initiative
Operational excellence Product quality
We ensure that the strategic goals are specific, measurable and fairly assessed.
Deferred bonus plan (DBP)
Any STVRS payment that exceeds 65% of salary is deferred into shares for a two year deferral period. Awards will generally lapse on resignation. This aids retention as well as aligning executives’ interests with those of our shareholders.
Long term incentive plan (SEP)
As described on page 9, our strategy aims to increase earnings per share (EPS) on a sustainable basis. The Sustainable Earnings Plan (SEP) incentivises executives to sustain EPS growth over the medium to long term. Performance is measured over three and five years. Whilst we want to encourage earnings growth, we do not want to drive the wrong behaviour. We therefore consider the quality of earnings before we approve the vesting of each SEP award.
As with the DBP, the structure of the SEP is designed to aid the retention of executives, recognising that the appointment and retention of key executives continues to be crucial to the Group’s achievement of its strategic objectives.
Dear Shareholder
I would like to take this opportunity to thank you for supporting our remuneration policy, which was approved by 98% of shareholder votes at last year’s AGM. Since then, we have not made any significant changes to our remuneration arrangements and continue to take a disciplined approach to execution to ensure that our remuneration framework rewards the right behaviours and supports the strategic goals of GKN.
Financial Statements Other InformationGovernanceStrategic Report
79GKN plc Annual Report and Accounts 2014
Performance and STVRS outcome for 2014As described in the strategic report, GKN made good progress in 2014 despite some difficult trading conditions. These included the effects of translational currency exchange rates, market volatility in Land Systems and certain automotive territories and some declining military programmes. These adverse factors were more than offset by some good performances.
STVRS payments to executive Directors were between 38% and 55% of salary, depending upon performance against their targets. The maximum annual bonus achievable was 110% of base salary. Given the Group’s good results, this outcome reflects the stretching targets we put in place at the start of 2014.
As a general principle, the Committee seeks to avoid exercising discretion unless there are good reasons to do so. During 2014 we exercised discretion to ensure that STVRS performance was measured on a consistent, like-for-like basis by excluding the impact of two small transactions: the acquisition of Williams Hybrid Power and the disposal of the Group’s 50% share in Emitec. These transactions were not included in the financial targets set at the start of the year and therefore we felt it was reasonable to exclude them. We also reviewed the circumstances surrounding the fatal accident at El Cajon and exercised our discretion to adjust some payouts in the chain of accountability downwards in line with our principle that safety is our top priority.
SEPThe first SEP award was granted in 2012 and the three year performance period for that award ended on 31 December 2014. The core element of the 2012 SEP award vested at 67.5% of maximum following annual compound growth in earnings per share of 9.4% over the performance period. The Committee carefully considered the quality of earnings, noting that performance across the Group’s KPIs was generally strong during the performance period. In particular, ROIC was good for each year of the performance period, ending at 17.7% for the Group in 2014. This is a particularly credible outcome given that we acquired Volvo Aerospace during the relevant performance period. The share price performed well during the performance period, increasing from 183p on 1 January 2012 to 344p on 31 December 2014 and the dividend per share increased from 7.2p in 2012 to 8.4p in 2014. The sustainability element of the 2012 SEP award will be measured at the end of 2017 after the five year performance period.
Other key decisions during 2014Marcus Bryson, CBE, retired from the Board at the end of 2014. Given Marcus’ contribution to GKN and his retirement after many years of exceptional performance, he was treated as a good leaver and, in line with our approved remuneration policy, his outstanding awards under the SEP will vest taking into account performance achieved and time served during the relevant performance periods.
We approved salary increases for the executive Directors of around 2.7% for 2014, after carefully considering their performance, market reference points, and salary increases awarded to both the senior management population and all UK employees. The salary increases approved for the executive Directors were broadly in line with those awarded to UK employees generally.
We approved an increase in the Chairman’s fee; this is explained in more detail on page 92. We concluded that this increase was appropriate in light of the scope of the role, time commitment and positioning against the market. We also considered the Chairman’s shareholding requirement of 30% of his fee and decided that it continued to be appropriate.
In the course of the year, the Committee considered the external environment for executive talent and changes to the UK Corporate Governance Code, consulted with shareholders, reviewed its effectiveness and agreed on actions for continuous improvement.
Our approach for 2015No major changes will be made to the structure of the STVRS for 2015 but we will continue to refine it to ensure that it incentivises the right behaviours. Having reviewed the STVRS payments over the last three years against Group performance and shareholder expectations, we consider that the targets have been challenging. Whilst we have not changed our approach to setting targets for 2015, we have revised the ranges above and below target to encourage executives to drive beyond the targets, whilst carefully managing risk. We have tailored the ranges for each division and our view of their markets in 2015. In addition, we have refined the cash targets to continue encouraging improvement in sustainable cash flow. The strategic measures for 2015 are aligned with our strategy and risks and include incentivising the continued development of our risk management systems, implementation of our diversity and inclusion programme, new business wins and operational excellence.
As a Committee, we keep the remuneration framework under review to ensure that it continues to be appropriate and effectively aligns executives with the long term sustainability of the business. Whilst we do not plan to make any significant changes for 2015, we will apply malus and clawback provisions to our STVRS and SEP schemes for our executive Directors and members of the Executive Committee. In addition, we will review the STVRS and SEP schemes and targets to ensure that they continue to be both appropriately stretching and an effective tool for the appointment and retention of top executives.
Overall, given GKN’s performance over the one and three year periods to the end of 2014, I am comfortable that the absolute amounts awarded to our executive Directors in respect of 2014 are appropriate. We will continue to take a rigorous, principled and fair approach to setting remuneration. The following pages describe in further detail how we have implemented our remuneration policy in respect of 2014, together with our plans for 2015.
Richard Parry-Jones CBE23 February 2015
80 GKN plc Annual Report and Accounts 2014
GOVERNANCE
Directors’ remuneration report continued
Committee membership
Richard Parry-Jones (Chairman)
Angus Cockburn
Tufan Erginbilgic
Shonaid Jemmett-Page
All members are independent non-executive Directors. The secretary to the Committee is Jos Sclater, General Counsel & Company Secretary.
Other attendees During the year, we consulted and invited Mike Turner (Group Chairman), Nigel Stein (Chief Executive), Douglas McIldowie (Group HR Director) and Deloitte LLP (advisors to the Committee) to attend meetings as appropriate. In consulting with senior management, we took care to ensure there were no conflicts of interest.
Committee members and other attendees were not present in any matter that directly concerned their own remuneration or terms of service.
We met as a Committee eight times during the year; attendance at Committee meetings is set out in the table on page 65.
Role The Board has delegated responsibility to the Committee for:• determining the Group’s policy on executive Directors’ remuneration and, within the terms of that
policy, setting the detailed remuneration and other terms of service of the executive Directors and determining the remuneration of the Company Secretary;
• determining the fees of the Chairman; and• recommending to the Chief Executive, and monitoring the level and structure of, remuneration of
the most senior executives below Board level.
The Committee’s terms of reference are available on the Company’s website.
2014 activitiesOur principal activities in respect of 2014 were as follows:
Salary and annual bonus plan
• We considered and approved salary proposals for the executive Directors and the General Counsel & Company Secretary.
• We monitored the level and structure of remuneration, benefits and pensions for the most senior executives below Board level.
• We reviewed the Chairman’s fee and shareholding requirement against market data and other factors.
• We considered and approved STVRS targets and payouts.
Long term incentive arrangements
• We assessed the satisfaction of performance conditions for the 2011 Executive Share Option Scheme (ESOS) and Long Term Incentive Plan (LTIP) awards.
• We considered and approved the 2014 SEP award levels for all participants across the Group.• We confirmed the value of long term incentive awards in relation to the appointment of Adam
Walker and determined the level of vesting of his first restricted share award.
Board and Executive Committee changes
• We considered and approved remuneration arrangements for Marcus Bryson’s retirement.• We reviewed and recommended appropriate remuneration arrangements for the new Executive
Committee members.
Governance matters • We undertook a performance evaluation of the Committee and its external advisers.• We reviewed and approved the remuneration report.• We considered remuneration trends and the corporate governance and regulatory landscape.• We conducted a review of risks in the context of remuneration policy and practice.• We considered the impact of the key changes to the UK Corporate Governance Code
regarding remuneration, including proposed changes on malus and clawback.• We approved the use of malus and clawback in relation to our long and short term
incentive schemes.

Financial Statements Other InformationGovernanceStrategic Report
81GKN plc Annual Report and Accounts 2014
Annual report on remuneration – executive DirectorsThe Committee presents the annual report on remuneration, which together with the Chairman’s letter, will be put to shareholders as an advisory vote at the 2015 AGM to be held on 7 May 2015.
Single total figure of remuneration (audited) Fixed pay Variable pay
Salary £000
Taxable benefits £000
Pension £000
STVRS – cash £000
STVRS – deferred shares
£000
Long term incentives
£000
Other remuneration
(joining awards) £000
Total remuneration
£000
2014 2013 2014 2013 2014 2013 2014 2013 2014 2013 2014 2013 2014 2013 2014 2013
Executive DirectorsNigel Stein 775 755 18 18 334 312 407 490 – 131 1,388 2,147 – – 2,922 3,853 Marcus Bryson 483 470 19 20 236 188 182 306 – 46 862 1,803 – – 1,782 2,833 Andrew Reynolds Smith 483 470 16 17 220 199 248 306 – 102 862 1,803 – – 1,829 2,897 Adam Walker(a) 492 – 15 – 123 – 270 – – – – – 45 – 945 –
Former executive DirectorWilliam Seeger(b) 69 442 4 29 18 177 – 364 – – – 1,760 – – 91 2,772
Total 2,302 2,137 72 84 931 876 1,107 1,466 – 279 3,112 7,513 45 – 7,569 12,355
(a) Appointed as a Director on 1 January 2014.(b) Figures reflect payments up to 25 February 2014 (date retired as a Director). Details of hypothetical tax withholdings are shown on page 92.
DefinitionsSalary: Base salaries receivable during the year taking account of the salary increases on 1 July 2014. Further details are shown on page 82.
Taxable benefits: Gross value of taxable benefits including US benefits that were received during the year and taxable in the UK.
Pension: Value of all cash allowances/contributions in respect of pension and, where appropriate, the value of defined benefit participation. Further details on pension entitlements and pension provisions are shown on pages 82 and 90 respectively.
STVRS – cash: Value of the cash element payable under the STVRS. Further details are shown on pages 83 and 84.
STVRS – deferred shares: Value of the deferred element of the STVRS awarded as shares under the DBP. Further details are shown on page 84.
Long term incentives: Value of vested shares under the 2012 SEP Core Award (including the element of shares deferred until 2017 and dividend equivalent shares accrued from the date of grant to 31 December 2014) using the GKN share price on 17 February 2015 (375.5p) (the date on which the Committee determined the performance outcome for the SEP Core Awards). Further details are shown on page 86. The prior year value relates to the 2011 ESOS and LTIP awards. Further details for these awards are shown on pages 89 and 90.
Other remuneration (joining awards): Value of vested joining awards granted to Adam Walker following his appointment in 2014 using the GKN share price of 366p on 29 July 2014 (release date). Further details are shown on page 87.
82 GKN plc Annual Report and Accounts 2014
GOVERNANCE
Directors’ remuneration report continued
SalariesDuring the yearIn June 2014, we undertook an annual review of salaries for executive Directors. We took into account a number of factors, including their performance, increases awarded to senior management and employees in the UK generally, the advice of our remuneration advisers and market data. We approved salary increases of 2.7% (rounded to the nearest thousand) for executive Directors as set out below. This increase was broadly in line with the average increase awarded to UK employees generally. Salary increases were effective from 1 July 2014.
1 July 2014 (£)
1 July 2013(a)(£)
Nigel Stein 785,000 764,000Marcus Bryson 490,000 477,000Andrew Reynolds Smith 490,000 477,000Adam Walker(b) 498,000 485,000
(a) Or date of appointment if later. (b) Appointed as a Director on 1 January 2014.
Implementation of policy for 2015Any salary increases in 2015 will be made in line with the approved remuneration policy as set out at the end of this report.
Taxable benefitsAll Directors received healthcare benefits and car and fuel allowances. In addition, William Seeger received US benefits (medical insurance, life insurance, long and short term disability benefit and fees for computation of annual tax return) that were taxable in the UK and converted into UK sterling using the average exchange rate for the first business day of each month.
Pension entitlementsDuring the yearPension benefits are provided to executive Directors through the GKN Group Pension Scheme (2012) (the Scheme). The Scheme has changed in recent years in line with pension regulations. Directors receive benefits either under the defined benefit section of the Scheme or the defined contribution section of the Scheme depending on when they joined.
Defined benefit section of the Scheme These are legacy arrangements which apply to Nigel Stein, Marcus Bryson and Andrew Reynolds Smith, under which they receive:• a pension of up to two-thirds of pensionable salary on their normal retirement date with a maximum annual accrual rate of 1/30th.
From 1 September 2007, benefits under the Scheme have been calculated on a career average basis; and• a supplementary cash allowance of up to 40% of the difference between their pensionable salary and base salary.
They may choose to opt out and receive a cash allowance on their full base salary. Nigel Stein opted out of the Scheme.
Defined contribution section of the Scheme Adam Walker receives retirement benefits by way of a cash allowance equivalent to 25% of base salary which may be delivered in cash or as a payment into the defined contribution section of the Scheme. He was automatically enrolled into the Scheme but chose to opt out and therefore receives the full allowance as cash.
No compensation is offered for any additional tax suffered by a Director in the event that the value of his or her pension exceeds the statutory lifetime allowance.
William Seeger did not participate in the Scheme during the period he was a Director but received an overall allowance of 40% of base salary, which included the Company’s contributions to qualified and non-qualified defined contribution pension arrangements consistent with US practice.
Details of the pension benefit provisions under the defined benefit and defined contribution sections of the Scheme can be found on page 90.
Implementation of policy for 2015There are no plans to change Directors’ pension entitlements in 2015.
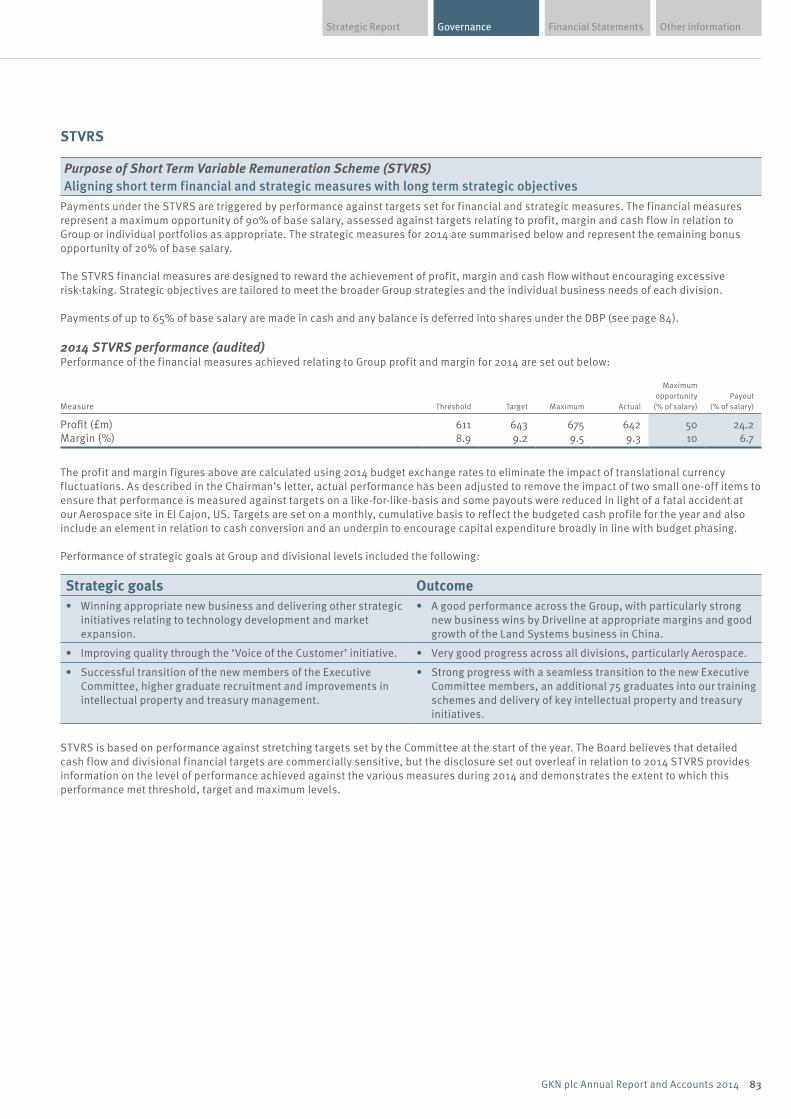
Financial Statements Other InformationGovernanceStrategic Report
83GKN plc Annual Report and Accounts 2014
STVRS
Purpose of Short Term Variable Remuneration Scheme (STVRS) Aligning short term financial and strategic measures with long term strategic objectives
Payments under the STVRS are triggered by performance against targets set for financial and strategic measures. The financial measures represent a maximum opportunity of 90% of base salary, assessed against targets relating to profit, margin and cash flow in relation to Group or individual portfolios as appropriate. The strategic measures for 2014 are summarised below and represent the remaining bonus opportunity of 20% of base salary.
The STVRS financial measures are designed to reward the achievement of profit, margin and cash flow without encouraging excessive risk-taking. Strategic objectives are tailored to meet the broader Group strategies and the individual business needs of each division.
Payments of up to 65% of base salary are made in cash and any balance is deferred into shares under the DBP (see page 84).
2014 STVRS performance (audited)Performance of the financial measures achieved relating to Group profit and margin for 2014 are set out below:
Measure Threshold Target Maximum Actual
Maximum opportunity
(% of salary)Payout
(% of salary)
Profit (£m) 611 643 675 642 50 24.2 Margin (%) 8.9 9.2 9.5 9.3 10 6.7
The profit and margin figures above are calculated using 2014 budget exchange rates to eliminate the impact of translational currency fluctuations. As described in the Chairman’s letter, actual performance has been adjusted to remove the impact of two small one-off items to ensure that performance is measured against targets on a like-for-like-basis and some payouts were reduced in light of a fatal accident at our Aerospace site in El Cajon, US. Targets are set on a monthly, cumulative basis to reflect the budgeted cash profile for the year and also include an element in relation to cash conversion and an underpin to encourage capital expenditure broadly in line with budget phasing.
Performance of strategic goals at Group and divisional levels included the following:
Strategic goals Outcome• Winning appropriate new business and delivering other strategic
initiatives relating to technology development and market expansion.
• A good performance across the Group, with particularly strong new business wins by Driveline at appropriate margins and good growth of the Land Systems business in China.
• Improving quality through the ‘Voice of the Customer’ initiative. • Very good progress across all divisions, particularly Aerospace.
• Successful transition of the new members of the Executive Committee, higher graduate recruitment and improvements in intellectual property and treasury management.
• Strong progress with a seamless transition to the new Executive Committee members, an additional 75 graduates into our training schemes and delivery of key intellectual property and treasury initiatives.
STVRS is based on performance against stretching targets set by the Committee at the start of the year. The Board believes that detailed cash flow and divisional financial targets are commercially sensitive, but the disclosure set out overleaf in relation to 2014 STVRS provides information on the level of performance achieved against the various measures during 2014 and demonstrates the extent to which this performance met threshold, target and maximum levels.
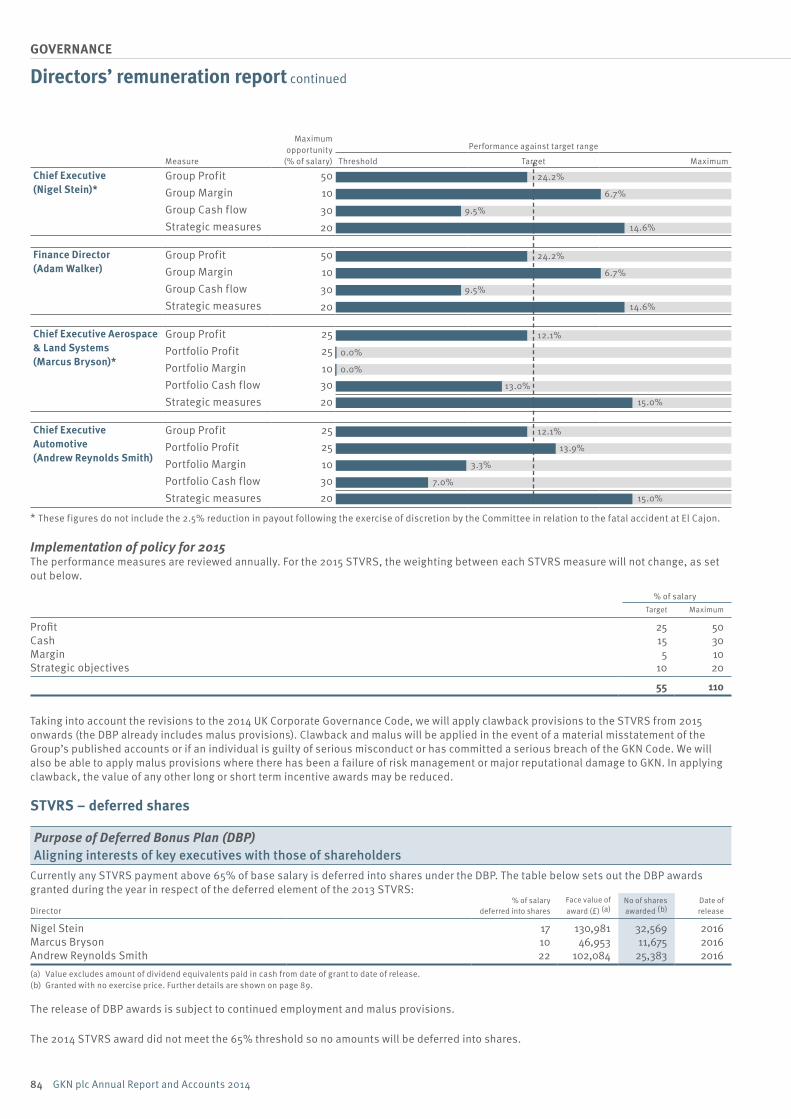
84 GKN plc Annual Report and Accounts 2014
GOVERNANCE
50 24.2%
10 6.7%
30 9.5%
20 14.6%
50 24.2%
10 6.7%
30 9.5%
20 14.6%
25 12.1%
25 0.0%
10 0.0%
30 13.0%
20 15.0%
12.1%
7.0%
15.0%
2525 13.9%
10 3.3%
3020
Directors’ remuneration report continued
Maximum opportunity
(% of salary)
Performance against target range
Measure Threshold Target Maximum
Chief Executive(Nigel Stein)*
Group ProfitGroup MarginGroup Cash flowStrategic measures
Finance Director(Adam Walker)
Group ProfitGroup MarginGroup Cash flowStrategic measures
Chief Executive Aerospace & Land Systems (Marcus Bryson)*
Group ProfitPortfolio ProfitPortfolio MarginPortfolio Cash flowStrategic measures
Chief Executive Automotive (Andrew Reynolds Smith)
Group ProfitPortfolio ProfitPortfolio MarginPortfolio Cash flowStrategic measures
* These figures do not include the 2.5% reduction in payout following the exercise of discretion by the Committee in relation to the fatal accident at El Cajon.
Implementation of policy for 2015The performance measures are reviewed annually. For the 2015 STVRS, the weighting between each STVRS measure will not change, as set out below.
% of salaryTarget Maximum
Profit 25 50 Cash 15 30 Margin 5 10 Strategic objectives 10 20
55 110
Taking into account the revisions to the 2014 UK Corporate Governance Code, we will apply clawback provisions to the STVRS from 2015 onwards (the DBP already includes malus provisions). Clawback and malus will be applied in the event of a material misstatement of the Group’s published accounts or if an individual is guilty of serious misconduct or has committed a serious breach of the GKN Code. We will also be able to apply malus provisions where there has been a failure of risk management or major reputational damage to GKN. In applying clawback, the value of any other long or short term incentive awards may be reduced.
STVRS – deferred shares
Purpose of Deferred Bonus Plan (DBP) Aligning interests of key executives with those of shareholders
Currently any STVRS payment above 65% of base salary is deferred into shares under the DBP. The table below sets out the DBP awards granted during the year in respect of the deferred element of the 2013 STVRS:
Director% of salary
deferred into sharesFace value of award (£) (a)
No of shares awarded (b)
Date of release
Nigel Stein 17 130,981 32,569 2016Marcus Bryson 10 46,953 11,675 2016Andrew Reynolds Smith 22 102,084 25,383 2016
(a) Value excludes amount of dividend equivalents paid in cash from date of grant to date of release. (b) Granted with no exercise price. Further details are shown on page 89.
The release of DBP awards is subject to continued employment and malus provisions.
The 2014 STVRS award did not meet the 65% threshold so no amounts will be deferred into shares.
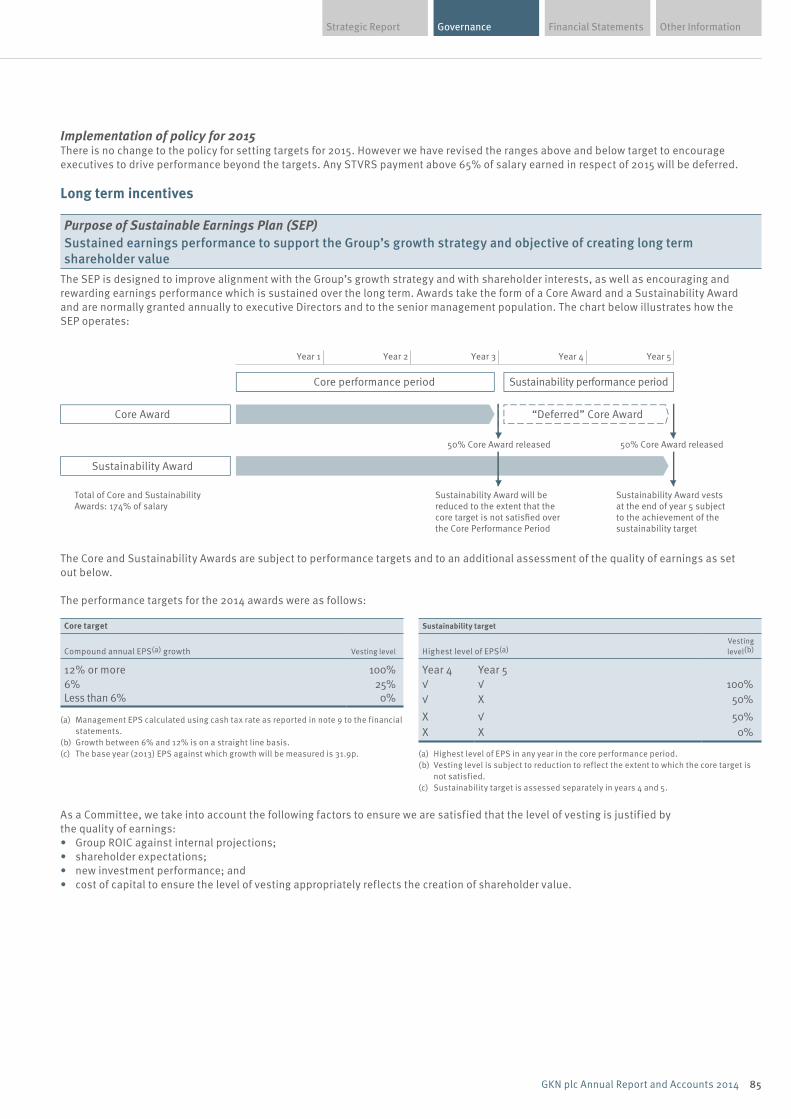
Financial Statements Other InformationGovernanceStrategic Report
85GKN plc Annual Report and Accounts 2014
Implementation of policy for 2015There is no change to the policy for setting targets for 2015. However we have revised the ranges above and below target to encourage executives to drive performance beyond the targets. Any STVRS payment above 65% of salary earned in respect of 2015 will be deferred.
Long term incentives
Purpose of Sustainable Earnings Plan (SEP)Sustained earnings performance to support the Group’s growth strategy and objective of creating long term shareholder value
The SEP is designed to improve alignment with the Group’s growth strategy and with shareholder interests, as well as encouraging and rewarding earnings performance which is sustained over the long term. Awards take the form of a Core Award and a Sustainability Award and are normally granted annually to executive Directors and to the senior management population. The chart below illustrates how the SEP operates:
Year 1
Core performance period
50% Core Award released 50% Core Award released
Sustainability Award will be reduced to the extent that the core target is not satis�ed overthe Core Performance Period
Total of Core and SustainabilityAwards: 174% of salary
Sustainability Award vests at the end of year 5 subject to the achievement of the sustainability target
Core Award
Sustainability Award
Sustainability performance period
“Deferred” Core Award
Year 2 Year 3 Year 4 Year 5
The Core and Sustainability Awards are subject to performance targets and to an additional assessment of the quality of earnings as set out below.
The performance targets for the 2014 awards were as follows:
Core target Sustainability target
Compound annual EPS(a) growth Vesting level Highest level of EPS(a)Vesting level(b)
12% or more 100% Year 4 Year 56% 25% √ √ 100% Less than 6% 0% √ X 50%
(a) Management EPS calculated using cash tax rate as reported in note 9 to the financial statements.
(b) Growth between 6% and 12% is on a straight line basis. (c) The base year (2013) EPS against which growth will be measured is 31.9p.
X √ 50%X X 0%
(a) Highest level of EPS in any year in the core performance period.(b) Vesting level is subject to reduction to reflect the extent to which the core target is
not satisfied.(c) Sustainability target is assessed separately in years 4 and 5.
As a Committee, we take into account the following factors to ensure we are satisfied that the level of vesting is justified by the quality of earnings:• Group ROIC against internal projections;• shareholder expectations;• new investment performance; and• cost of capital to ensure the level of vesting appropriately reflects the creation of shareholder value.
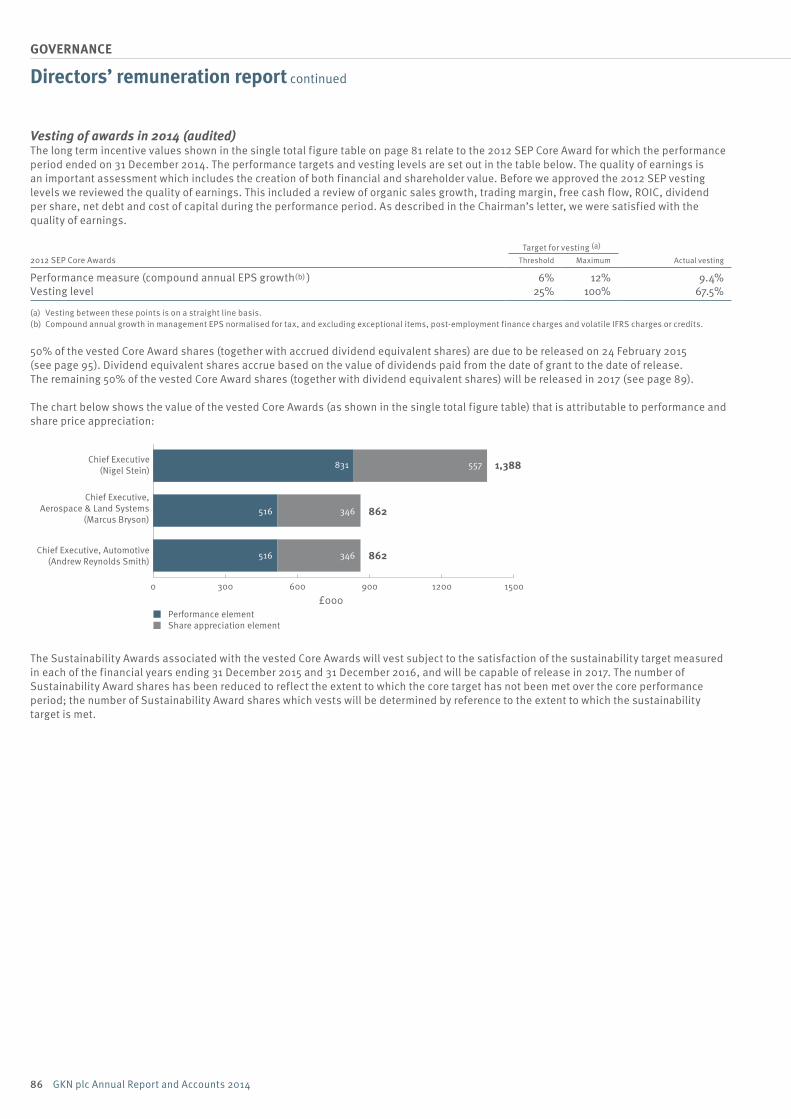
Directors’ remuneration report continued
86 GKN plc Annual Report and Accounts 2014
GOVERNANCE
Vesting of awards in 2014 (audited)The long term incentive values shown in the single total figure table on page 81 relate to the 2012 SEP Core Award for which the performance period ended on 31 December 2014. The performance targets and vesting levels are set out in the table below. The quality of earnings is an important assessment which includes the creation of both financial and shareholder value. Before we approved the 2012 SEP vesting levels we reviewed the quality of earnings. This included a review of organic sales growth, trading margin, free cash flow, ROIC, dividend per share, net debt and cost of capital during the performance period. As described in the Chairman’s letter, we were satisfied with the quality of earnings.
Target for vesting (a)
2012 SEP Core Awards Threshold Maximum Actual vesting
Performance measure (compound annual EPS growth(b) ) 6% 12% 9.4% Vesting level 25% 100% 67.5%
(a) Vesting between these points is on a straight line basis.(b) Compound annual growth in management EPS normalised for tax, and excluding exceptional items, post-employment finance charges and volatile IFRS charges or credits.
50% of the vested Core Award shares (together with accrued dividend equivalent shares) are due to be released on 24 February 2015 (see page 95). Dividend equivalent shares accrue based on the value of dividends paid from the date of grant to the date of release. The remaining 50% of the vested Core Award shares (together with dividend equivalent shares) will be released in 2017 (see page 89).
The chart below shows the value of the vested Core Awards (as shown in the single total figure table) that is attributable to performance and share price appreciation:
0 300 600 900 1200 1500
Chief Executive(Nigel Stein)
Performance elementShare appreciation element
Chief Executive, Aerospace & Land Systems
(Marcus Bryson)
Chief Executive, Automotive(Andrew Reynolds Smith)
831 557 1,388
862
£000
516 346
862 516 346
The Sustainability Awards associated with the vested Core Awards will vest subject to the satisfaction of the sustainability target measured in each of the financial years ending 31 December 2015 and 31 December 2016, and will be capable of release in 2017. The number of Sustainability Award shares has been reduced to reflect the extent to which the core target has not been met over the core performance period; the number of Sustainability Award shares which vests will be determined by reference to the extent to which the sustainability target is met.
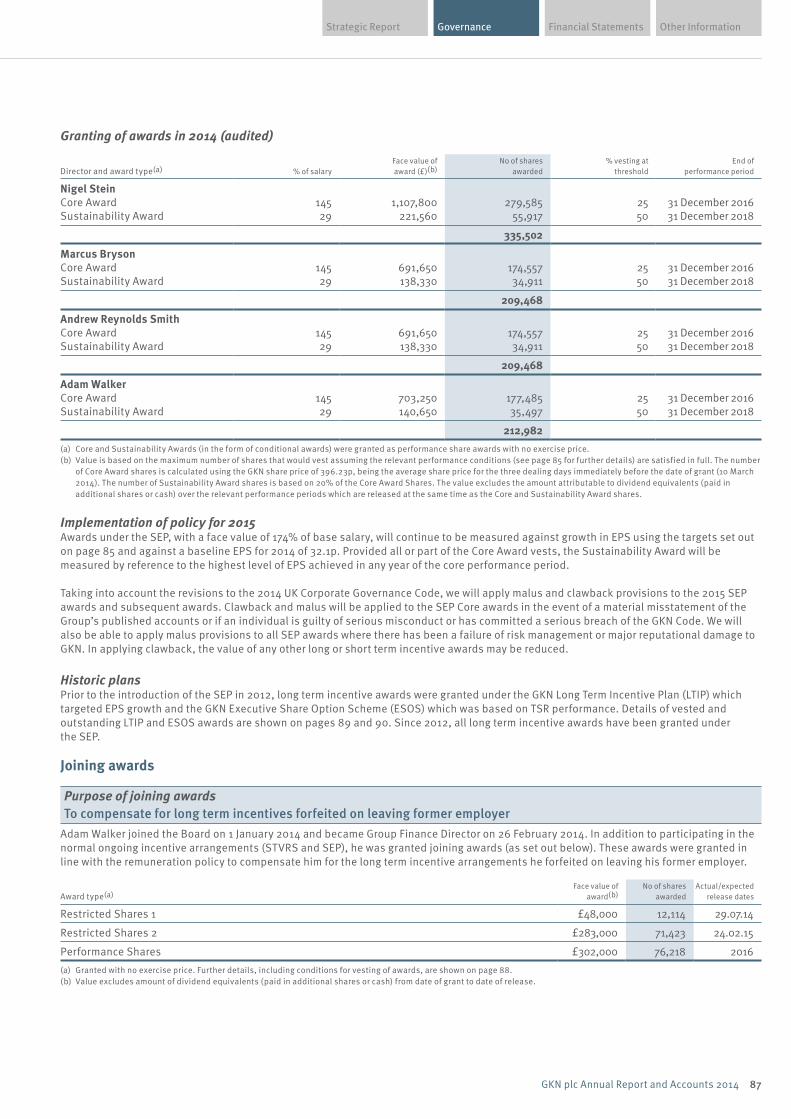
Financial Statements Other InformationGovernanceStrategic Report
87GKN plc Annual Report and Accounts 2014
Granting of awards in 2014 (audited)
Director and award type(a) % of salary Face value of award (£)(b)
No of shares awarded
% vesting at threshold
End of performance period
Nigel SteinCore Award 145 1,107,800 279,585 25 31 December 2016 Sustainability Award 29 221,560 55,917 50 31 December 2018
335,502
Marcus BrysonCore Award 145 691,650 174,557 25 31 December 2016 Sustainability Award 29 138,330 34,911 50 31 December 2018
209,468
Andrew Reynolds SmithCore Award 145 691,650 174,557 25 31 December 2016 Sustainability Award 29 138,330 34,911 50 31 December 2018
209,468
Adam WalkerCore Award 145 703,250 177,485 25 31 December 2016 Sustainability Award 29 140,650 35,497 50 31 December 2018
212,982(a) Core and Sustainability Awards (in the form of conditional awards) were granted as performance share awards with no exercise price.(b) Value is based on the maximum number of shares that would vest assuming the relevant performance conditions (see page 85 for further details) are satisfied in full. The number
of Core Award shares is calculated using the GKN share price of 396.23p, being the average share price for the three dealing days immediately before the date of grant (10 March 2014). The number of Sustainability Award shares is based on 20% of the Core Award Shares. The value excludes the amount attributable to dividend equivalents (paid in additional shares or cash) over the relevant performance periods which are released at the same time as the Core and Sustainability Award shares.
Implementation of policy for 2015Awards under the SEP, with a face value of 174% of base salary, will continue to be measured against growth in EPS using the targets set out on page 85 and against a baseline EPS for 2014 of 32.1p. Provided all or part of the Core Award vests, the Sustainability Award will be measured by reference to the highest level of EPS achieved in any year of the core performance period.
Taking into account the revisions to the 2014 UK Corporate Governance Code, we will apply malus and clawback provisions to the 2015 SEP awards and subsequent awards. Clawback and malus will be applied to the SEP Core awards in the event of a material misstatement of the Group’s published accounts or if an individual is guilty of serious misconduct or has committed a serious breach of the GKN Code. We will also be able to apply malus provisions to all SEP awards where there has been a failure of risk management or major reputational damage to GKN. In applying clawback, the value of any other long or short term incentive awards may be reduced.
Historic plansPrior to the introduction of the SEP in 2012, long term incentive awards were granted under the GKN Long Term Incentive Plan (LTIP) which targeted EPS growth and the GKN Executive Share Option Scheme (ESOS) which was based on TSR performance. Details of vested and outstanding LTIP and ESOS awards are shown on pages 89 and 90. Since 2012, all long term incentive awards have been granted under the SEP.
Joining awards
Purpose of joining awards To compensate for long term incentives forfeited on leaving former employer
Adam Walker joined the Board on 1 January 2014 and became Group Finance Director on 26 February 2014. In addition to participating in the normal ongoing incentive arrangements (STVRS and SEP), he was granted joining awards (as set out below). These awards were granted in line with the remuneration policy to compensate him for the long term incentive arrangements he forfeited on leaving his former employer.
Award type(a) Face value of
award(b)No of shares
awardedActual/expected
release dates
Restricted Shares 1 £48,000 12,114 29.07.14
Restricted Shares 2 £283,000 71,423 24.02.15
Performance Shares £302,000 76,218 2016
(a) Granted with no exercise price. Further details, including conditions for vesting of awards, are shown on page 88.(b) Value excludes amount of dividend equivalents (paid in additional shares or cash) from date of grant to date of release.
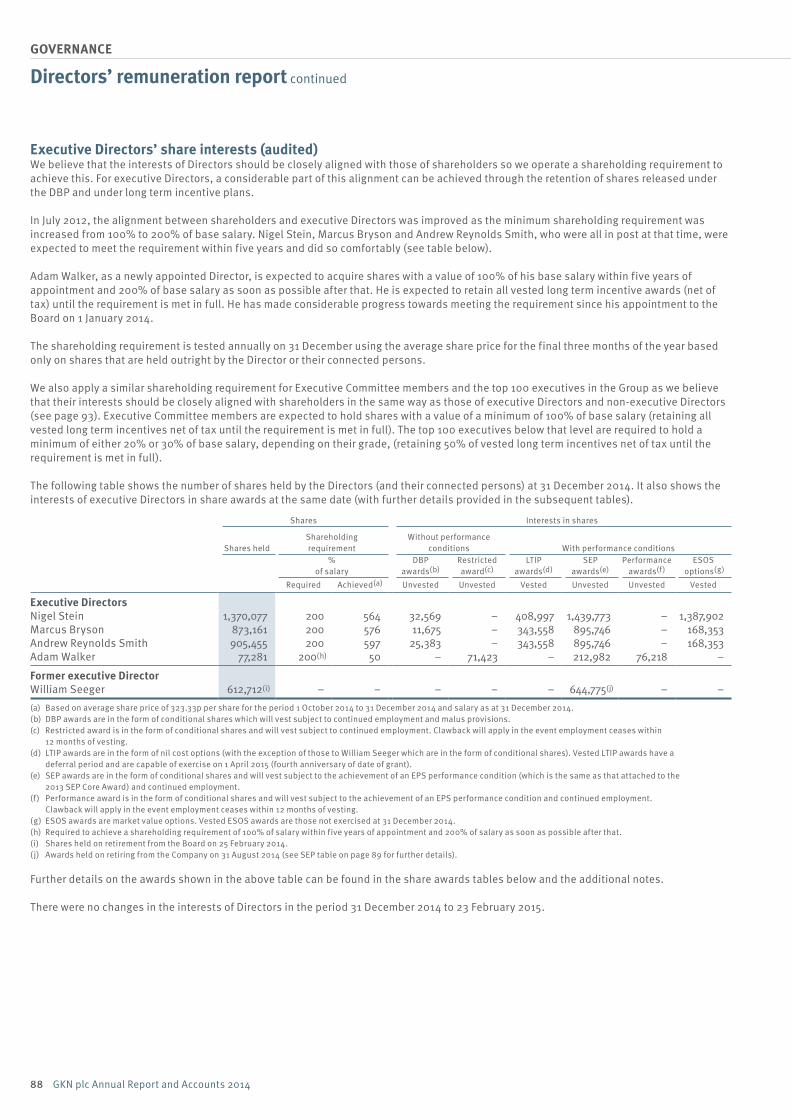
88 GKN plc Annual Report and Accounts 2014
GOVERNANCE
Directors’ remuneration report continued
Executive Directors’ share interests (audited) We believe that the interests of Directors should be closely aligned with those of shareholders so we operate a shareholding requirement to achieve this. For executive Directors, a considerable part of this alignment can be achieved through the retention of shares released under the DBP and under long term incentive plans.
In July 2012, the alignment between shareholders and executive Directors was improved as the minimum shareholding requirement was increased from 100% to 200% of base salary. Nigel Stein, Marcus Bryson and Andrew Reynolds Smith, who were all in post at that time, were expected to meet the requirement within five years and did so comfortably (see table below).
Adam Walker, as a newly appointed Director, is expected to acquire shares with a value of 100% of his base salary within five years of appointment and 200% of base salary as soon as possible after that. He is expected to retain all vested long term incentive awards (net of tax) until the requirement is met in full. He has made considerable progress towards meeting the requirement since his appointment to the Board on 1 January 2014.
The shareholding requirement is tested annually on 31 December using the average share price for the final three months of the year based only on shares that are held outright by the Director or their connected persons.
We also apply a similar shareholding requirement for Executive Committee members and the top 100 executives in the Group as we believe that their interests should be closely aligned with shareholders in the same way as those of executive Directors and non-executive Directors (see page 93). Executive Committee members are expected to hold shares with a value of a minimum of 100% of base salary (retaining all vested long term incentives net of tax until the requirement is met in full). The top 100 executives below that level are required to hold a minimum of either 20% or 30% of base salary, depending on their grade, (retaining 50% of vested long term incentives net of tax until the requirement is met in full).
The following table shows the number of shares held by the Directors (and their connected persons) at 31 December 2014. It also shows the interests of executive Directors in share awards at the same date (with further details provided in the subsequent tables).
Shares Interests in shares
Shares heldShareholding requirement
Without performance conditions With performance conditions
% of salary
DBP awards(b)
Restricted award(c)
LTIP awards(d)
SEP awards(e)
Performance awards(f )
ESOS options(g)
Required Achieved(a) Unvested Unvested Vested Unvested Unvested Vested
Executive DirectorsNigel Stein 1,370,077 200 564 32,569 – 408,997 1,439,773 – 1,387,902 Marcus Bryson 873,161 200 576 11,675 – 343,558 895,746 – 168,353 Andrew Reynolds Smith 905,455 200 597 25,383 – 343,558 895,746 – 168,353 Adam Walker 77,281 200(h) 50 – 71,423 – 212,982 76,218 –
Former executive DirectorWilliam Seeger 612,712(i) – – – – – 644,775(j) – –
(a) Based on average share price of 323.33p per share for the period 1 October 2014 to 31 December 2014 and salary as at 31 December 2014.(b) DBP awards are in the form of conditional shares which will vest subject to continued employment and malus provisions.(c) Restricted award is in the form of conditional shares and will vest subject to continued employment. Clawback will apply in the event employment ceases within
12 months of vesting.(d) LTIP awards are in the form of nil cost options (with the exception of those to William Seeger which are in the form of conditional shares). Vested LTIP awards have a
deferral period and are capable of exercise on 1 April 2015 (fourth anniversary of date of grant).(e) SEP awards are in the form of conditional shares and will vest subject to the achievement of an EPS performance condition (which is the same as that attached to the
2013 SEP Core Award) and continued employment. (f ) Performance award is in the form of conditional shares and will vest subject to the achievement of an EPS performance condition and continued employment.
Clawback will apply in the event employment ceases within 12 months of vesting.(g) ESOS awards are market value options. Vested ESOS awards are those not exercised at 31 December 2014.(h) Required to achieve a shareholding requirement of 100% of salary within five years of appointment and 200% of salary as soon as possible after that.(i) Shares held on retirement from the Board on 25 February 2014.(j) Awards held on retiring from the Company on 31 August 2014 (see SEP table on page 89 for further details).
Further details on the awards shown in the above table can be found in the share awards tables below and the additional notes.
There were no changes in the interests of Directors in the period 31 December 2014 to 23 February 2015.
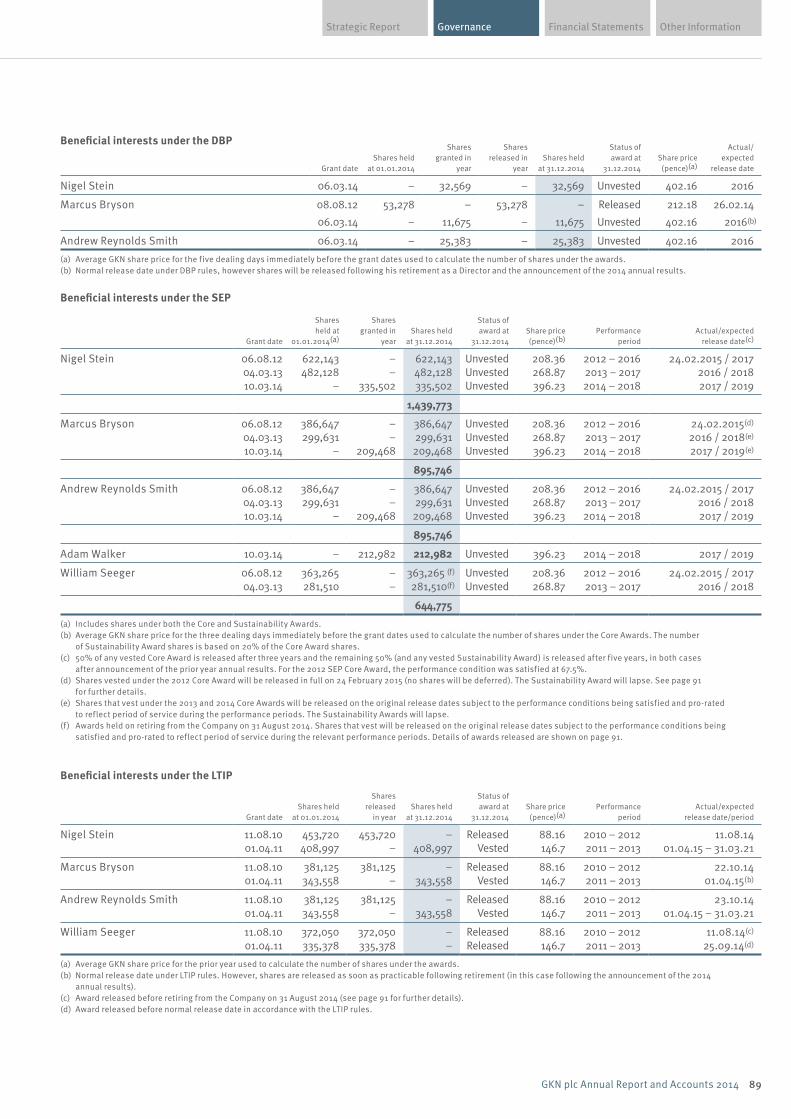
Financial Statements Other InformationGovernanceStrategic Report
89GKN plc Annual Report and Accounts 2014
Beneficial interests under the DBP
Grant dateShares held
at 01.01.2014
Shares granted in
year
Shares released in
yearShares held
at 31.12.2014
Status of award at
31.12.2014Share price (pence)(a)
Actual/expected
release date
Nigel Stein 06.03.14 – 32,569 – 32,569 Unvested 402.16 2016
Marcus Bryson 08.08.12 53,278 – 53,278 – Released 212.18 26.02.1406.03.14 – 11,675 – 11,675 Unvested 402.16 2016(b)
Andrew Reynolds Smith 06.03.14 – 25,383 – 25,383 Unvested 402.16 2016
(a) Average GKN share price for the five dealing days immediately before the grant dates used to calculate the number of shares under the awards.(b) Normal release date under DBP rules, however shares will be released following his retirement as a Director and the announcement of the 2014 annual results.
Beneficial interests under the SEP
Grant date
Shares held at
01.01.2014(a)
Shares granted in
yearShares held
at 31.12.2014
Status of award at
31.12.2014Share price (pence)(b)
Performance period
Actual/expected release date(c)
Nigel Stein 06.08.12 622,143 – 622,143 Unvested 208.36 2012 – 2016 24.02.2015 / 2017 04.03.13 482,128 – 482,128 Unvested 268.87 2013 – 2017 2016 / 2018 10.03.14 – 335,502 335,502 Unvested 396.23 2014 – 2018 2017 / 2019
1,439,773
Marcus Bryson 06.08.12 386,647 – 386,647 Unvested 208.36 2012 – 2016 24.02.2015(d) 04.03.13 299,631 – 299,631 Unvested 268.87 2013 – 2017 2016 / 2018(e)
10.03.14 – 209,468 209,468 Unvested 396.23 2014 – 2018 2017 / 2019(e)
895,746
Andrew Reynolds Smith 06.08.12 386,647 – 386,647 Unvested 208.36 2012 – 2016 24.02.2015 / 2017 04.03.13 299,631 – 299,631 Unvested 268.87 2013 – 2017 2016 / 201810.03.14 – 209,468 209,468 Unvested 396.23 2014 – 2018 2017 / 2019
895,746
Adam Walker 10.03.14 – 212,982 212,982 Unvested 396.23 2014 – 2018 2017 / 2019
William Seeger 06.08.12 363,265 – 363,265 (f) Unvested 208.36 2012 – 2016 24.02.2015 / 201704.03.13 281,510 – 281,510(f) Unvested 268.87 2013 – 2017 2016 / 2018
644,775(a) Includes shares under both the Core and Sustainability Awards. (b) Average GKN share price for the three dealing days immediately before the grant dates used to calculate the number of shares under the Core Awards. The number
of Sustainability Award shares is based on 20% of the Core Award shares. (c) 50% of any vested Core Award is released after three years and the remaining 50% (and any vested Sustainability Award) is released after five years, in both cases
after announcement of the prior year annual results. For the 2012 SEP Core Award, the performance condition was satisfied at 67.5%. (d) Shares vested under the 2012 Core Award will be released in full on 24 February 2015 (no shares will be deferred). The Sustainability Award will lapse. See page 91
for further details.(e) Shares that vest under the 2013 and 2014 Core Awards will be released on the original release dates subject to the performance conditions being satisfied and pro-rated
to reflect period of service during the performance periods. The Sustainability Awards will lapse.(f ) Awards held on retiring from the Company on 31 August 2014. Shares that vest will be released on the original release dates subject to the performance conditions being
satisfied and pro-rated to reflect period of service during the relevant performance periods. Details of awards released are shown on page 91.
Beneficial interests under the LTIP
Grant dateShares held
at 01.01.2014
Shares released
in yearShares held
at 31.12.2014
Status of award at
31.12.2014Share price (pence)(a)
Performance period
Actual/expected release date/period
Nigel Stein 11.08.10 453,720 453,720 – Released 88.16 2010 – 2012 11.08.1401.04.11 408,997 – 408,997 Vested 146.7 2011 – 2013 01.04.15 – 31.03.21
Marcus Bryson 11.08.10 381,125 381,125 – Released 88.16 2010 – 2012 22.10.1401.04.11 343,558 – 343,558 Vested 146.7 2011 – 2013 01.04.15(b)
Andrew Reynolds Smith 11.08.10 381,125 381,125 – Released 88.16 2010 – 2012 23.10.1401.04.11 343,558 – 343,558 Vested 146.7 2011 – 2013 01.04.15 – 31.03.21
William Seeger 11.08.10 372,050 372,050 – Released 88.16 2010 – 2012 11.08.14(c)
01.04.11 335,378 335,378 – Released 146.7 2011 – 2013 25.09.14(d)
(a) Average GKN share price for the prior year used to calculate the number of shares under the awards.(b) Normal release date under LTIP rules. However, shares are released as soon as practicable following retirement (in this case following the announcement of the 2014
annual results). (c) Award released before retiring from the Company on 31 August 2014 (see page 91 for further details).(d) Award released before normal release date in accordance with the LTIP rules.
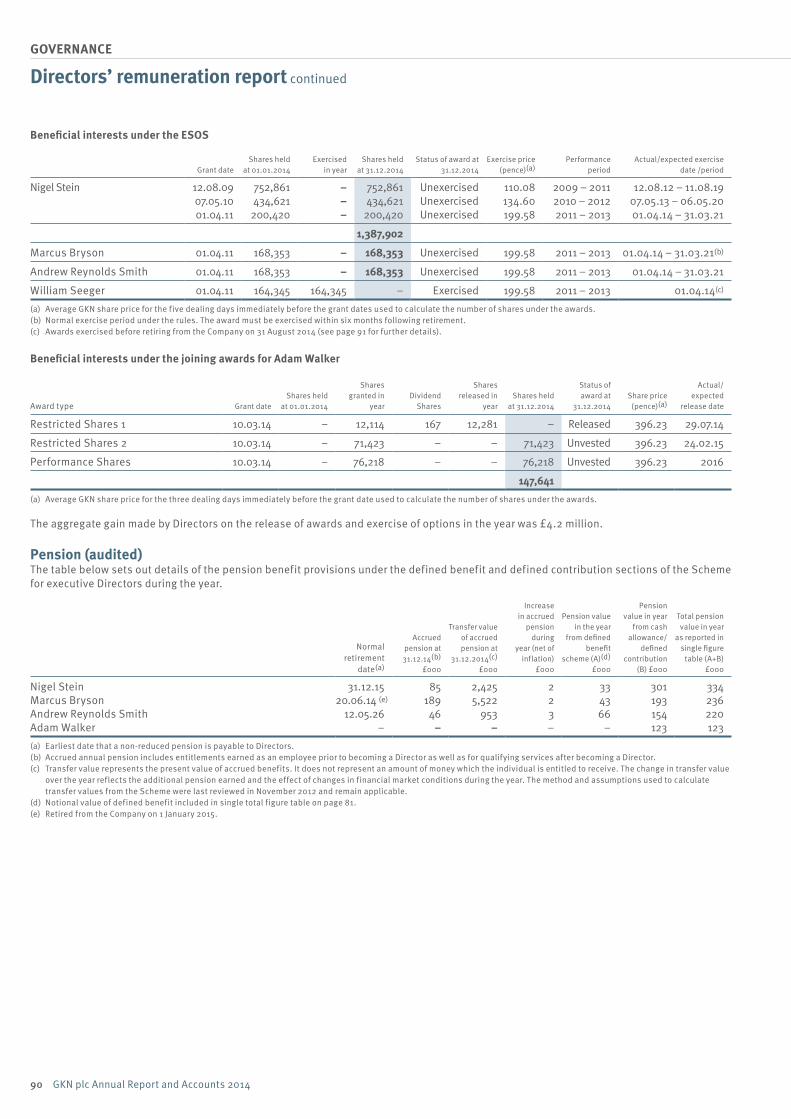
90 GKN plc Annual Report and Accounts 2014
GOVERNANCE
Directors’ remuneration report continued
Beneficial interests under the ESOS
Grant dateShares held
at 01.01.2014Exercised
in yearShares held
at 31.12.2014Status of award at
31.12.2014Exercise price
(pence)(a)Performance
periodActual/expected exercise
date /period
Nigel Stein 12.08.09 752,861 – 752,861 Unexercised 110.08 2009 – 2011 12.08.12 – 11.08.1907.05.10 434,621 – 434,621 Unexercised 134.60 2010 – 2012 07.05.13 – 06.05.2001.04.11 200,420 – 200,420 Unexercised 199.58 2011 – 2013 01.04.14 – 31.03.21
1,387,902
Marcus Bryson 01.04.11 168,353 – 168,353 Unexercised 199.58 2011 – 2013 01.04.14 – 31.03.21(b)
Andrew Reynolds Smith 01.04.11 168,353 – 168,353 Unexercised 199.58 2011 – 2013 01.04.14 – 31.03.21
William Seeger 01.04.11 164,345 164,345 – Exercised 199.58 2011 – 2013 01.04.14(c)
(a) Average GKN share price for the five dealing days immediately before the grant dates used to calculate the number of shares under the awards. (b) Normal exercise period under the rules. The award must be exercised within six months following retirement. (c) Awards exercised before retiring from the Company on 31 August 2014 (see page 91 for further details).
Beneficial interests under the joining awards for Adam Walker
Award type Grant dateShares held
at 01.01.2014
Shares granted in
yearDividend
Shares
Shares released in
yearShares held
at 31.12.2014
Status of award at
31.12.2014Share price (pence)(a)
Actual/expected
release date
Restricted Shares 1 10.03.14 – 12,114 167 12,281 – Released 396.23 29.07.14
Restricted Shares 2 10.03.14 – 71,423 – – 71,423 Unvested 396.23 24.02.15
Performance Shares 10.03.14 – 76,218 – – 76,218 Unvested 396.23 2016
147,641(a) Average GKN share price for the three dealing days immediately before the grant date used to calculate the number of shares under the awards.
The aggregate gain made by Directors on the release of awards and exercise of options in the year was £4.2 million.
Pension (audited)The table below sets out details of the pension benefit provisions under the defined benefit and defined contribution sections of the Scheme for executive Directors during the year.
Normal retirement
date(a)
Accrued pension at 31.12.14(b)
£000
Transfer value of accrued pension at
31.12.2014(c)
£000
Increase in accrued
pension during
year (net of inflation)
£000
Pension value in the year
from defined benefit
scheme (A)(d)
£000
Pension value in year
from cash allowance/
defined contribution
(B) £000
Total pension value in year
as reported in single figure
table (A+B) £000
Nigel Stein 31.12.15 85 2,425 2 33 301 334Marcus Bryson 20.06.14 (e) 189 5,522 2 43 193 236Andrew Reynolds Smith 12.05.26 46 953 3 66 154 220Adam Walker – – – – – 123 123
(a) Earliest date that a non-reduced pension is payable to Directors. (b) Accrued annual pension includes entitlements earned as an employee prior to becoming a Director as well as for qualifying services after becoming a Director. (c) Transfer value represents the present value of accrued benefits. It does not represent an amount of money which the individual is entitled to receive. The change in transfer value
over the year reflects the additional pension earned and the effect of changes in financial market conditions during the year. The method and assumptions used to calculate transfer values from the Scheme were last reviewed in November 2012 and remain applicable.
(d) Notional value of defined benefit included in single total figure table on page 81.(e) Retired from the Company on 1 January 2015.
Financial Statements Other InformationGovernanceStrategic Report
91GKN plc Annual Report and Accounts 2014
Payments in respect of retiring Directors (audited)Marcus BrysonMarcus Bryson stepped down from the Board at the close of business on 31 December 2014 and retired from the Company on 1 January 2015. He will be employed on a part-time basis until 31 December 2015. No STVRS or SEP awards will be made to him in respect of 2015.
Incentive awardsIn accordance with the rules of the relevant incentive plans and the remuneration policy, Marcus Bryson’s incentive awards will be treated as follows:• The 2011 ESOS award over 168,353 shares with an option price of 199.58p has vested in respect of performance to 31 December 2013 and
can be exercised until 1 July 2015 (six months after retirement).• The 2011 LTIP award of 343,558 shares has vested in respect of performance to 31 December 2013 and will be released (i.e. the award will
become capable of exercise) as soon as practicable following his retirement, in accordance with the rules of the plan. A cash amount equivalent to the dividends on the vested shares (from the beginning of the third year of the relevant performance period to the release date) will also be paid.
• The 2014 DBP award over 11,675 shares will be released as soon as practicable following his retirement in accordance with the rules of the plan. A cash amount equivalent to the dividends on the shares during the period from grant to release will also be paid.
• The 2014 STVRS award will be paid wholly in cash as it did not exceed the 65% threshold for any deferral into shares.
We considered Marcus Bryson to be a good leaver for the purposes of the SEP awards granted in 2012, 2013 and 2014; this was considered appropriate given his retirement from full time employment and his contribution to the Group. The number of shares under his unvested 2013 and 2014 SEP awards will be reduced on a pro rata basis to reflect his length of service during the relevant performance periods. These awards will remain subject to the original performance conditions and any core awards that vest will be released at the end of the relevant three year core performance period. The sustainability awards relating to all of his 2013 and 2014 SEP awards will lapse. The 2012 Core Award (which vested at 67.5% as shown on page 89) will be released in full (217,489 shares) on 24 February 2015 together with 12,152 dividend equivalent shares. The Sustainability Award will lapse.
William SeegerWilliam Seeger retired from the Board on 25 February 2014. The payments he received whilst he was a Director are shown in the single total figure table on page 81. This section provides details of remuneration and benefits received whilst he was an employee and following his retirement from the Company.
In the 2013 annual report on remuneration we disclosed estimated values of certain expatriate benefits that he was entitled to receive. Where these payments have been made whilst he was an employee and following his retirement from the Company, we have set out the actual amounts below.
Payments whilst an employeeWilliam Seeger continued to be employed within the Group until his retirement on 31 August 2014. During this time he received salary and normal benefits and pension entitlements. For the period 26 February 2014 to 31 August 2014, he received the following expatriate benefits: • Repatriation costs of £7,242 (estimated at £15,000). No further payment due.• Tax return support of £4,219 for the period 26 February 2014 to 31 December 2014 (estimated at £25,000 until vesting of all outstanding
awards). Payments ongoing until 2018.• Reasonable expenses for sale of his US property of $57,232 (payment capped at the lower of 7% of selling price or $100,000. No further
payment due.• Tax and social security equalisation was applied to his remuneration for the period so he was not disadvantaged by his global tax
position (details for the period 1 January 2014 to 31 December 2014 are shown in the hypothetical tax withholding section below). Tax equalisation will continue to be applied to any relevant payment made.
Payments following retirementFor the period 1 September 2014 to 31 December 2014, William Seeger received the following ongoing expatriate benefits:• US healthcare benefits of £5,214 (estimated at £15,000 for 18 months following his retirement from the Company). Payments ongoing until
March 2016.• Tax return support continued to be applied for the period following retirement (full details shown above). Payments ongoing until 2018.• Tax and social security equalisation continued to be applied for the period (full details for the period 1 January 2014 to 31 December 2014
are shown in the hypothetical tax withholding section below). Tax equalisation will continue to be applied to any relevant payment made.
As reported on page 89, the 2012 SEP Core Award vested at 67.5%. On 24 February 2015, 90,796 shares (50% of the vested Core Award shares) and 5,073 dividend equivalent shares will be released to him. The remaining 90,797 vested Core Award shares will be released in 2017. The Sustainability Award associated with the vested Core Award will vest subject to the satisfaction of the sustainability target measured over each of the financial years ending 31 December 2015 and 31 December 2016, and will be released in 2017. The number of Sustainability Award shares has been reduced to 40,867 shares to reflect the extent to which the core target has not been met over the core performance period; the number of Sustainability Award shares which vest will be determined by reference to the extent to which the sustainability target is met and pro-rated for time served over the award’s five year period.
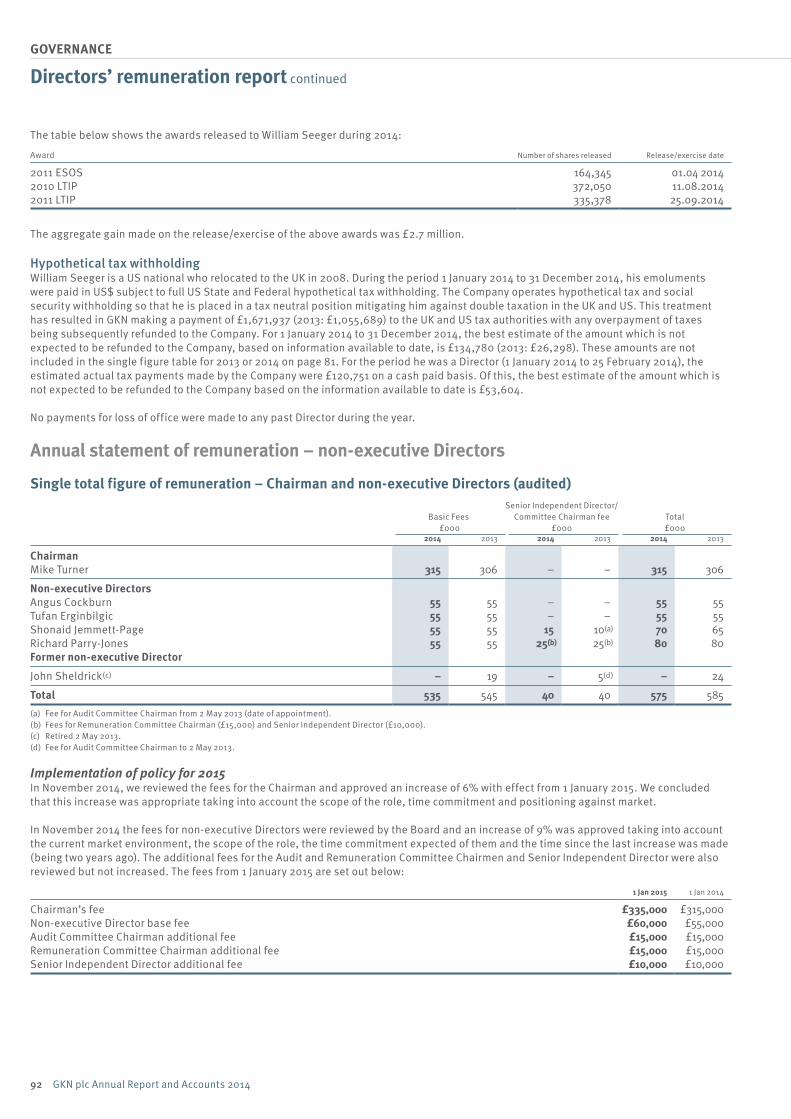
92 GKN plc Annual Report and Accounts 2014
GOVERNANCE
Directors’ remuneration report continued
The table below shows the awards released to William Seeger during 2014:
Award Number of shares released Release/exercise date
2011 ESOS 164,345 01.04 20142010 LTIP 372,050 11.08.20142011 LTIP 335,378 25.09.2014
The aggregate gain made on the release/exercise of the above awards was £2.7 million.
Hypothetical tax withholdingWilliam Seeger is a US national who relocated to the UK in 2008. During the period 1 January 2014 to 31 December 2014, his emoluments were paid in US$ subject to full US State and Federal hypothetical tax withholding. The Company operates hypothetical tax and social security withholding so that he is placed in a tax neutral position mitigating him against double taxation in the UK and US. This treatment has resulted in GKN making a payment of £1,671,937 (2013: £1,055,689) to the UK and US tax authorities with any overpayment of taxes being subsequently refunded to the Company. For 1 January 2014 to 31 December 2014, the best estimate of the amount which is not expected to be refunded to the Company, based on information available to date, is £134,780 (2013: £26,298). These amounts are not included in the single figure table for 2013 or 2014 on page 81. For the period he was a Director (1 January 2014 to 25 February 2014), the estimated actual tax payments made by the Company were £120,751 on a cash paid basis. Of this, the best estimate of the amount which is not expected to be refunded to the Company based on the information available to date is £53,604.
No payments for loss of office were made to any past Director during the year.
Annual statement of remuneration – non-executive Directors
Single total figure of remuneration – Chairman and non-executive Directors (audited)
Basic Fees £000
Senior Independent Director/Committee Chairman fee
£000Total £000
2014 2013 2014 2013 2014 2013
ChairmanMike Turner 315 306 – – 315 306
Non-executive DirectorsAngus Cockburn 55 55 – – 55 55Tufan Erginbilgic 55 55 – – 55 55Shonaid Jemmett-Page 55 55 15 10(a) 70 65Richard Parry-Jones 55 55 25(b) 25(b) 80 80Former non-executive Director
John Sheldrick(c) – 19 – 5(d) – 24
Total 535 545 40 40 575 585
(a) Fee for Audit Committee Chairman from 2 May 2013 (date of appointment).(b) Fees for Remuneration Committee Chairman (£15,000) and Senior Independent Director (£10,000).(c) Retired 2 May 2013.(d) Fee for Audit Committee Chairman to 2 May 2013.
Implementation of policy for 2015In November 2014, we reviewed the fees for the Chairman and approved an increase of 6% with effect from 1 January 2015. We concluded that this increase was appropriate taking into account the scope of the role, time commitment and positioning against market.
In November 2014 the fees for non-executive Directors were reviewed by the Board and an increase of 9% was approved taking into account the current market environment, the scope of the role, the time commitment expected of them and the time since the last increase was made (being two years ago). The additional fees for the Audit and Remuneration Committee Chairmen and Senior Independent Director were also reviewed but not increased. The fees from 1 January 2015 are set out below:
1 Jan 2015 1 Jan 2014
Chairman’s fee £335,000 £315,000 Non-executive Director base fee £60,000 £55,000 Audit Committee Chairman additional fee £15,000 £15,000 Remuneration Committee Chairman additional fee £15,000 £15,000 Senior Independent Director additional fee £10,000 £10,000
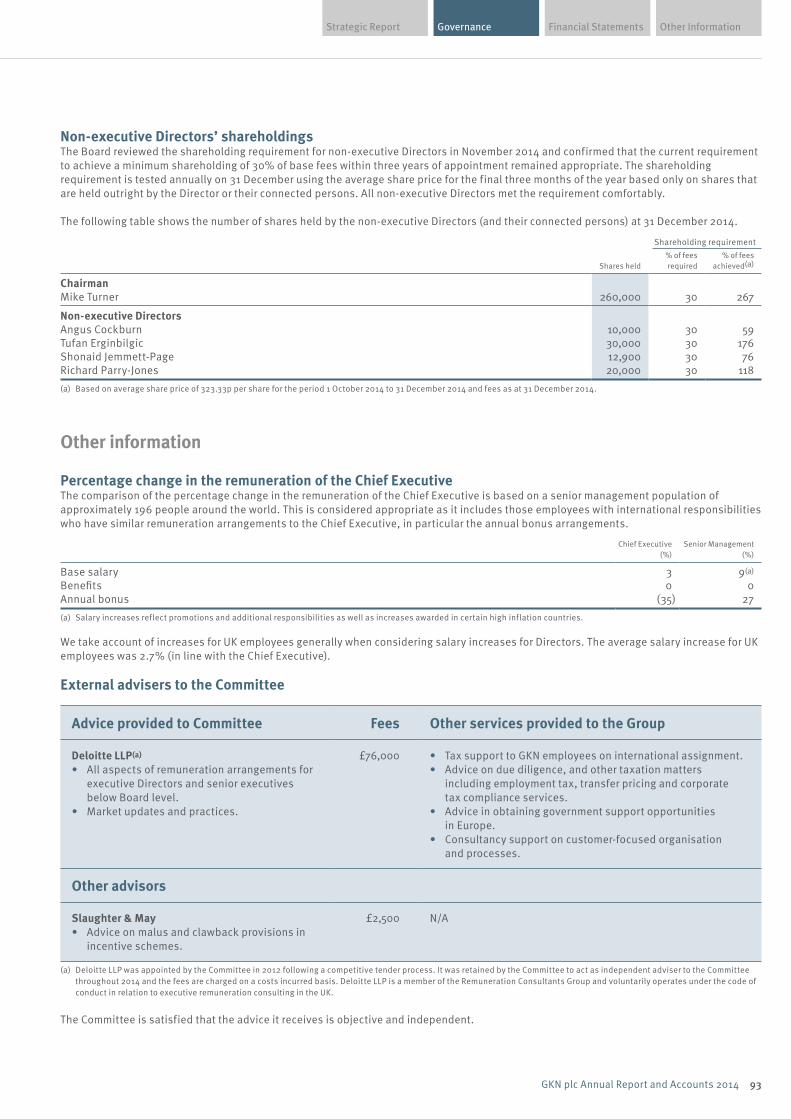
Financial Statements Other InformationGovernanceStrategic Report
93GKN plc Annual Report and Accounts 2014
Non-executive Directors’ shareholdingsThe Board reviewed the shareholding requirement for non-executive Directors in November 2014 and confirmed that the current requirement to achieve a minimum shareholding of 30% of base fees within three years of appointment remained appropriate. The shareholding requirement is tested annually on 31 December using the average share price for the final three months of the year based only on shares that are held outright by the Director or their connected persons. All non-executive Directors met the requirement comfortably.
The following table shows the number of shares held by the non-executive Directors (and their connected persons) at 31 December 2014.
Shares held
Shareholding requirement % of feesrequired
% of fees achieved(a)
ChairmanMike Turner 260,000 30 267
Non-executive DirectorsAngus Cockburn 10,000 30 59 Tufan Erginbilgic 30,000 30 176 Shonaid Jemmett-Page 12,900 30 76 Richard Parry-Jones 20,000 30 118
(a) Based on average share price of 323.33p per share for the period 1 October 2014 to 31 December 2014 and fees as at 31 December 2014.
Other information
Percentage change in the remuneration of the Chief Executive The comparison of the percentage change in the remuneration of the Chief Executive is based on a senior management population of approximately 196 people around the world. This is considered appropriate as it includes those employees with international responsibilities who have similar remuneration arrangements to the Chief Executive, in particular the annual bonus arrangements.
Chief Executive (%)
Senior Management (%)
Base salary 3 9(a)
Benefits 0 0Annual bonus (35) 27
(a) Salary increases reflect promotions and additional responsibilities as well as increases awarded in certain high inflation countries.
We take account of increases for UK employees generally when considering salary increases for Directors. The average salary increase for UK employees was 2.7% (in line with the Chief Executive).
External advisers to the Committee
Advice provided to Committee Fees Other services provided to the Group
Deloitte LLP(a)
• All aspects of remuneration arrangements for executive Directors and senior executives below Board level.
• Market updates and practices.
£76,000 • Tax support to GKN employees on international assignment. • Advice on due diligence, and other taxation matters
including employment tax, transfer pricing and corporate tax compliance services.
• Advice in obtaining government support opportunities in Europe.
• Consultancy support on customer-focused organisation and processes.
Other advisors
Slaughter & May• Advice on malus and clawback provisions in
incentive schemes.
£2,500 N/A
(a) Deloitte LLP was appointed by the Committee in 2012 following a competitive tender process. It was retained by the Committee to act as independent adviser to the Committee throughout 2014 and the fees are charged on a costs incurred basis. Deloitte LLP is a member of the Remuneration Consultants Group and voluntarily operates under the code of conduct in relation to executive remuneration consulting in the UK.
The Committee is satisfied that the advice it receives is objective and independent.
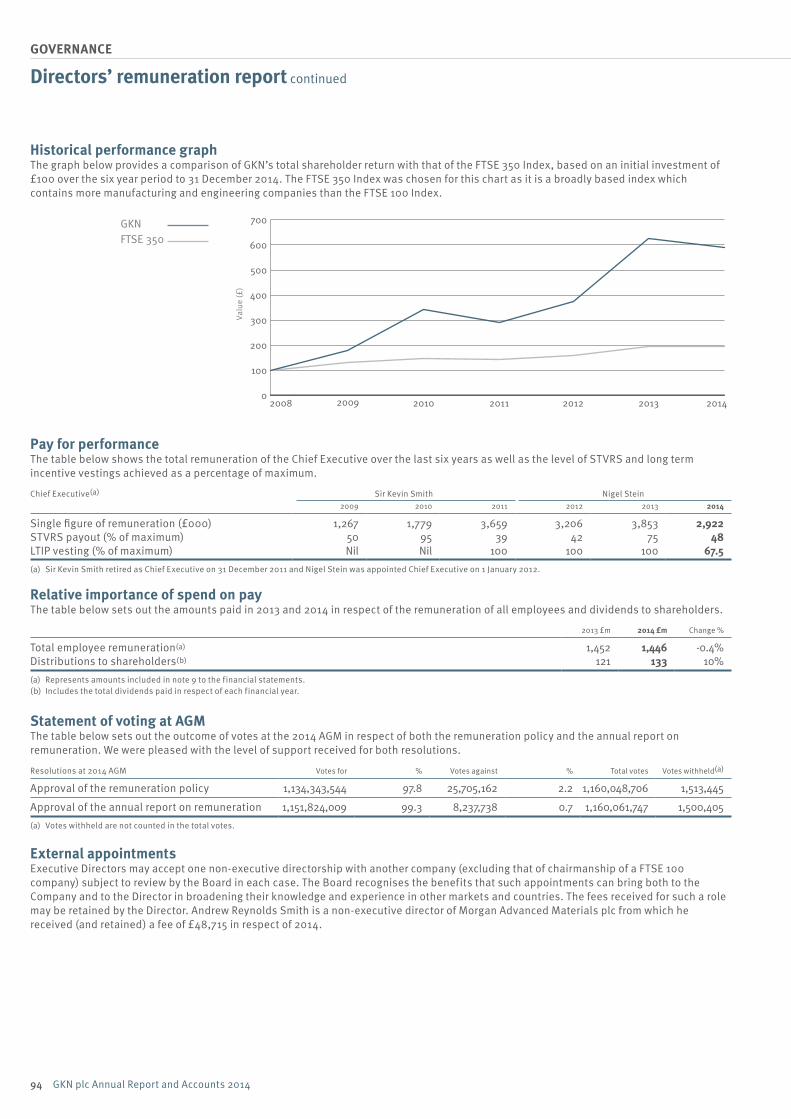
94 GKN plc Annual Report and Accounts 2014
GOVERNANCE
Directors’ remuneration report continued
Historical performance graphThe graph below provides a comparison of GKN’s total shareholder return with that of the FTSE 350 Index, based on an initial investment of £100 over the six year period to 31 December 2014. The FTSE 350 Index was chosen for this chart as it is a broadly based index which contains more manufacturing and engineering companies than the FTSE 100 Index.
0
100
200
300
400
500
600
700
2014201320122011201020092008
Valu
e (£
)
GKNFTSE 350
Pay for performanceThe table below shows the total remuneration of the Chief Executive over the last six years as well as the level of STVRS and long term incentive vestings achieved as a percentage of maximum.
Chief Executive(a) Sir Kevin Smith Nigel Stein2009 2010 2011 2012 2013 2014
Single figure of remuneration (£000) 1,267 1,779 3,659 3,206 3,853 2,922STVRS payout (% of maximum) 50 95 39 42 75 48 LTIP vesting (% of maximum) Nil Nil 100 100 100 67.5 (a) Sir Kevin Smith retired as Chief Executive on 31 December 2011 and Nigel Stein was appointed Chief Executive on 1 January 2012.
Relative importance of spend on payThe table below sets out the amounts paid in 2013 and 2014 in respect of the remuneration of all employees and dividends to shareholders.
2013 £m 2014 £m Change %
Total employee remuneration(a) 1,452 1,446 -0.4%Distributions to shareholders(b) 121 133 10%
(a) Represents amounts included in note 9 to the financial statements. (b) Includes the total dividends paid in respect of each financial year.
Statement of voting at AGMThe table below sets out the outcome of votes at the 2014 AGM in respect of both the remuneration policy and the annual report on remuneration. We were pleased with the level of support received for both resolutions.
Resolutions at 2014 AGM Votes for % Votes against % Total votes Votes withheld(a)
Approval of the remuneration policy 1,134,343,544 97.8 25,705,162 2.2 1,160,048,706 1,513,445
Approval of the annual report on remuneration 1,151,824,009 99.3 8,237,738 0.7 1,160,061,747 1,500,405
(a) Votes withheld are not counted in the total votes.
External appointmentsExecutive Directors may accept one non-executive directorship with another company (excluding that of chairmanship of a FTSE 100 company) subject to review by the Board in each case. The Board recognises the benefits that such appointments can bring both to the Company and to the Director in broadening their knowledge and experience in other markets and countries. The fees received for such a role may be retained by the Director. Andrew Reynolds Smith is a non-executive director of Morgan Advanced Materials plc from which he received (and retained) a fee of £48,715 in respect of 2014.
Financial Statements Other InformationGovernanceStrategic Report
95GKN plc Annual Report and Accounts 2014
Dilution limits The rules of the discretionary share plans (SEP, ESOS and LTIP) contain limits on the dilution of capital. These limits are monitored to ensure that the issue of new shares or transfer of shares from treasury does not exceed 5% of the issued share capital in any rolling 10 year period for discretionary plans or 10% of the issued share capital in any rolling 10 year period for all employee plans.
At 31 December 2014 the cumulative number of shares issued under discretionary plans for the previous 10 year period as a percentage of the issued share capital was 2.67%. The Company no longer operates an all employee share plan.
GKN’s policy is to satisfy awards under the SEP, ESOS and LTIP by the issue of shares, transfer of shares from treasury or from an employee share ownership plan trust (Trust) established for that purpose. DBP awards are satisfied by transfer of shares held in the Trust. A dividend waiver operates in respect of shares held in the Trust.
During the year, shares held in treasury were used to satisfy awards under the ESOS and LTIP and shares held in the Trust were used to satisfy awards under the DBP. Details of the Trust shares are set out below:
Balance at 31 December 2013 Shares acquired
Shares transferred toparticipants
Balance of shares at 31 December 2014
1,887,665 130,000 1,831,013 186,652
The Directors’ remuneration report, including the Chairman’s letter and annual report on remuneration, has been approved by the Board.
Signed on behalf of the Board
Professor Richard Parry-Jones CBEChairman of the Remuneration Committee 23 February 2015
Note: Changes to Directors’ interests on 24 February 2015:
2012 SEP Core Award: 50% of the vested core shares and additional dividend equivalent shares were released as follows: Nigel Stein 174,977 shares and 9,778 dividend equivalent shares.Andrew Reynolds Smith 108,744 shares and 6,076 dividend equivalent shares.
Restricted Shares 2: 71,423 shares and 1,572 dividend equivalent shares were released to Adam Walker.
As at 25 February 2015, there were no other changes in the interests of Directors.
This report has been prepared under The Large and Medium-sized Companies and Groups (Accounts and Reports) (Amendment) Regulations 2013 (‘the Regulations’), and in accordance with the requirements of the Listing Rules. The Board has applied the principles of good governance relating to directors’ remuneration contained within the 2012 UK Corporate Governance Code.
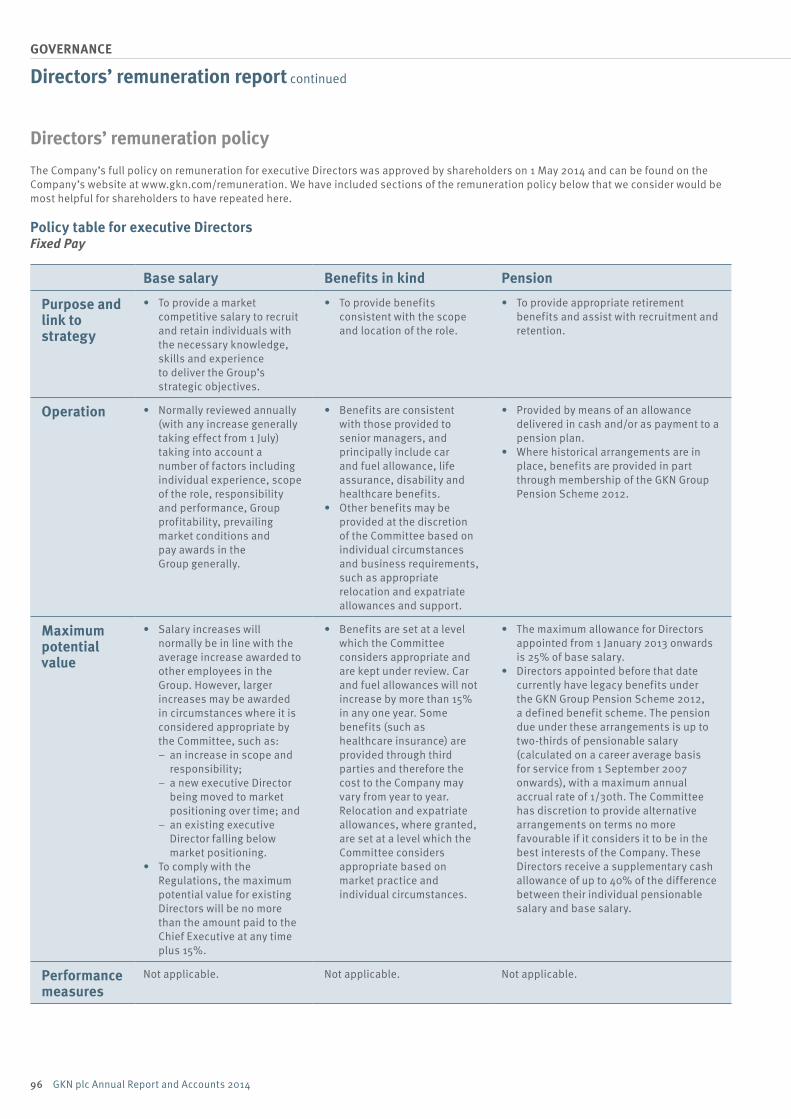
96 GKN plc Annual Report and Accounts 2014
GOVERNANCE
Directors’ remuneration report continued
Directors’ remuneration policyThe Company’s full policy on remuneration for executive Directors was approved by shareholders on 1 May 2014 and can be found on the Company’s website at www.gkn.com/remuneration. We have included sections of the remuneration policy below that we consider would be most helpful for shareholders to have repeated here.
Policy table for executive DirectorsFixed Pay
Base salary Benefits in kind Pension
Purpose and link to strategy
• To provide a market competitive salary to recruit and retain individuals with the necessary knowledge, skills and experience to deliver the Group’s strategic objectives.
• To provide benefits consistent with the scope and location of the role.
• To provide appropriate retirement benefits and assist with recruitment and retention.
Operation • Normally reviewed annually (with any increase generally taking effect from 1 July) taking into account a number of factors including individual experience, scope of the role, responsibility and performance, Group profitability, prevailing market conditions and pay awards in the Group generally.
• Benefits are consistent with those provided to senior managers, and principally include car and fuel allowance, life assurance, disability and healthcare benefits.
• Other benefits may be provided at the discretion of the Committee based on individual circumstances and business requirements, such as appropriate relocation and expatriate allowances and support.
• Provided by means of an allowance delivered in cash and/or as payment to a pension plan.
• Where historical arrangements are in place, benefits are provided in part through membership of the GKN Group Pension Scheme 2012.
Maximum potential value
• Salary increases will normally be in line with the average increase awarded to other employees in the Group. However, larger increases may be awarded in circumstances where it is considered appropriate by the Committee, such as:
– an increase in scope and responsibility;
– a new executive Director being moved to market positioning over time; and
– an existing executive Director falling below market positioning.
• To comply with the Regulations, the maximum potential value for existing Directors will be no more than the amount paid to the Chief Executive at any time plus 15%.
• Benefits are set at a level which the Committee considers appropriate and are kept under review. Car and fuel allowances will not increase by more than 15% in any one year. Some benefits (such as healthcare insurance) are provided through third parties and therefore the cost to the Company may vary from year to year. Relocation and expatriate allowances, where granted, are set at a level which the Committee considers appropriate based on market practice and individual circumstances.
• The maximum allowance for Directors appointed from 1 January 2013 onwards is 25% of base salary.
• Directors appointed before that date currently have legacy benefits under the GKN Group Pension Scheme 2012, a defined benefit scheme. The pension due under these arrangements is up to two-thirds of pensionable salary (calculated on a career average basis for service from 1 September 2007 onwards), with a maximum annual accrual rate of 1/30th. The Committee has discretion to provide alternative arrangements on terms no more favourable if it considers it to be in the best interests of the Company. These Directors receive a supplementary cash allowance of up to 40% of the difference between their individual pensionable salary and base salary.
Performance measures
Not applicable. Not applicable. Not applicable.
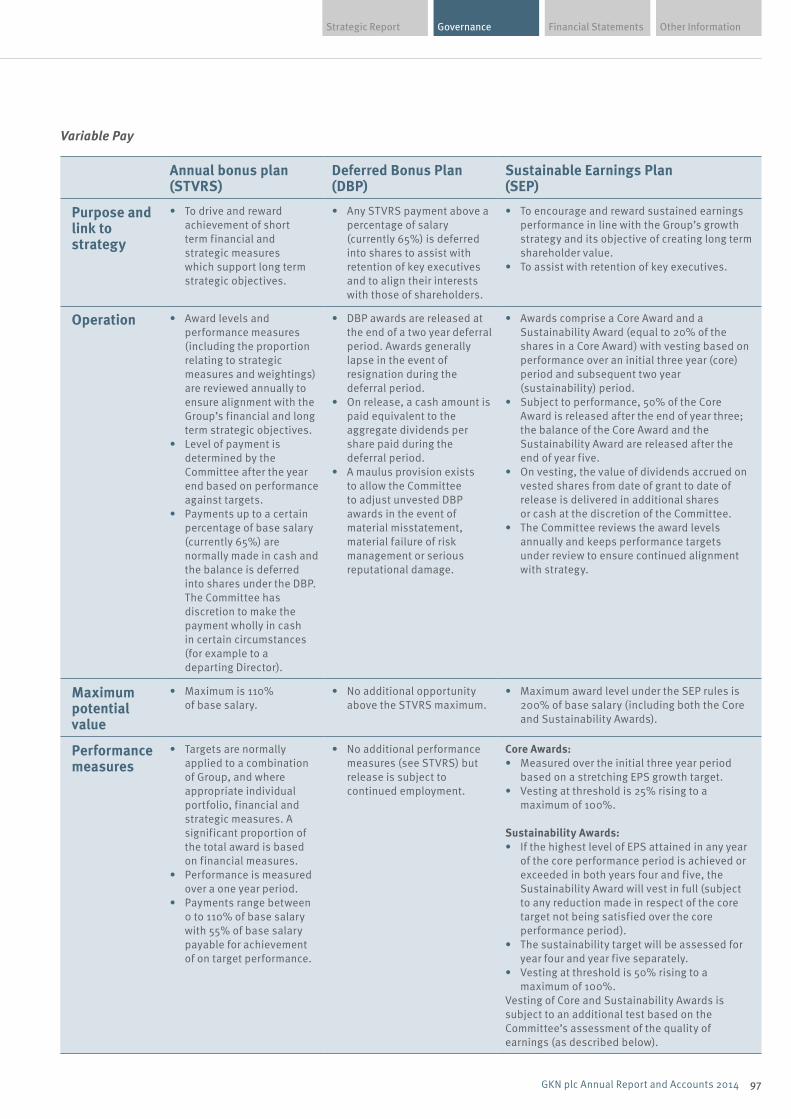
Financial Statements Other InformationGovernanceStrategic Report
97GKN plc Annual Report and Accounts 2014
Variable Pay
Annual bonus plan (STVRS)
Deferred Bonus Plan (DBP)
Sustainable Earnings Plan (SEP)
Purpose and link to strategy
• To drive and reward achievement of short term financial and strategic measures which support long term strategic objectives.
• Any STVRS payment above a percentage of salary (currently 65%) is deferred into shares to assist with retention of key executives and to align their interests with those of shareholders.
• To encourage and reward sustained earnings performance in line with the Group’s growth strategy and its objective of creating long term shareholder value.
• To assist with retention of key executives.
Operation • Award levels and performance measures (including the proportion relating to strategic measures and weightings) are reviewed annually to ensure alignment with the Group’s financial and long term strategic objectives.
• Level of payment is determined by the Committee after the year end based on performance against targets.
• Payments up to a certain percentage of base salary (currently 65%) are normally made in cash and the balance is deferred into shares under the DBP. The Committee has discretion to make the payment wholly in cash in certain circumstances (for example to a departing Director).
• DBP awards are released at the end of a two year deferral period. Awards generally lapse in the event of resignation during the deferral period.
• On release, a cash amount is paid equivalent to the aggregate dividends per share paid during the deferral period.
• A maulus provision exists to allow the Committee to adjust unvested DBP awards in the event of material misstatement, material failure of risk management or serious reputational damage.
• Awards comprise a Core Award and a Sustainability Award (equal to 20% of the shares in a Core Award) with vesting based on performance over an initial three year (core) period and subsequent two year (sustainability) period.
• Subject to performance, 50% of the Core Award is released after the end of year three; the balance of the Core Award and the Sustainability Award are released after the end of year five.
• On vesting, the value of dividends accrued on vested shares from date of grant to date of release is delivered in additional shares or cash at the discretion of the Committee.
• The Committee reviews the award levels annually and keeps performance targets under review to ensure continued alignment with strategy.
Maximum potential value
• Maximum is 110% of base salary.
• No additional opportunity above the STVRS maximum.
• Maximum award level under the SEP rules is 200% of base salary (including both the Core and Sustainability Awards).
Performance measures
• Targets are normally applied to a combination of Group, and where appropriate individual portfolio, financial and strategic measures. A significant proportion of the total award is based on financial measures.
• Performance is measured over a one year period.
• Payments range between 0 to 110% of base salary with 55% of base salary payable for achievement of on target performance.
• No additional performance measures (see STVRS) but release is subject to continued employment.
Core Awards: • Measured over the initial three year period
based on a stretching EPS growth target. • Vesting at threshold is 25% rising to a
maximum of 100%.
Sustainability Awards: • If the highest level of EPS attained in any year
of the core performance period is achieved or exceeded in both years four and five, the Sustainability Award will vest in full (subject to any reduction made in respect of the core target not being satisfied over the core performance period).
• The sustainability target will be assessed for year four and year five separately.
• Vesting at threshold is 50% rising to a maximum of 100%.
Vesting of Core and Sustainability Awards is subject to an additional test based on the Committee’s assessment of the quality of earnings (as described below).
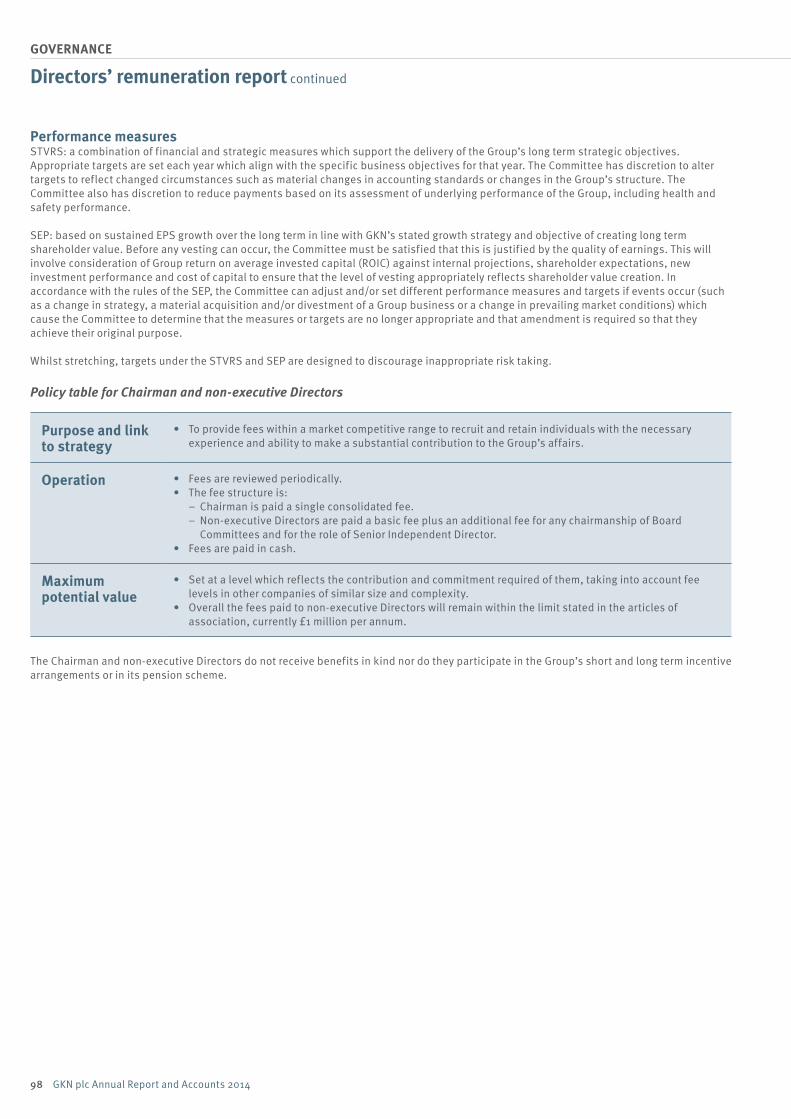
98 GKN plc Annual Report and Accounts 2014
GOVERNANCE
Performance measuresSTVRS: a combination of financial and strategic measures which support the delivery of the Group’s long term strategic objectives. Appropriate targets are set each year which align with the specific business objectives for that year. The Committee has discretion to alter targets to reflect changed circumstances such as material changes in accounting standards or changes in the Group’s structure. The Committee also has discretion to reduce payments based on its assessment of underlying performance of the Group, including health and safety performance.
SEP: based on sustained EPS growth over the long term in line with GKN’s stated growth strategy and objective of creating long term shareholder value. Before any vesting can occur, the Committee must be satisfied that this is justified by the quality of earnings. This will involve consideration of Group return on average invested capital (ROIC) against internal projections, shareholder expectations, new investment performance and cost of capital to ensure that the level of vesting appropriately reflects shareholder value creation. In accordance with the rules of the SEP, the Committee can adjust and/or set different performance measures and targets if events occur (such as a change in strategy, a material acquisition and/or divestment of a Group business or a change in prevailing market conditions) which cause the Committee to determine that the measures or targets are no longer appropriate and that amendment is required so that they achieve their original purpose. Whilst stretching, targets under the STVRS and SEP are designed to discourage inappropriate risk taking. Policy table for Chairman and non-executive Directors
Purpose and link to strategy
• To provide fees within a market competitive range to recruit and retain individuals with the necessary experience and ability to make a substantial contribution to the Group’s affairs.
Operation • Fees are reviewed periodically. • The fee structure is:
– Chairman is paid a single consolidated fee. – Non-executive Directors are paid a basic fee plus an additional fee for any chairmanship of Board Committees and for the role of Senior Independent Director.
• Fees are paid in cash.
Maximum potential value
• Set at a level which reflects the contribution and commitment required of them, taking into account fee levels in other companies of similar size and complexity.
• Overall the fees paid to non-executive Directors will remain within the limit stated in the articles of association, currently £1 million per annum.
The Chairman and non-executive Directors do not receive benefits in kind nor do they participate in the Group’s short and long term incentive arrangements or in its pension scheme.
Directors’ remuneration report continued
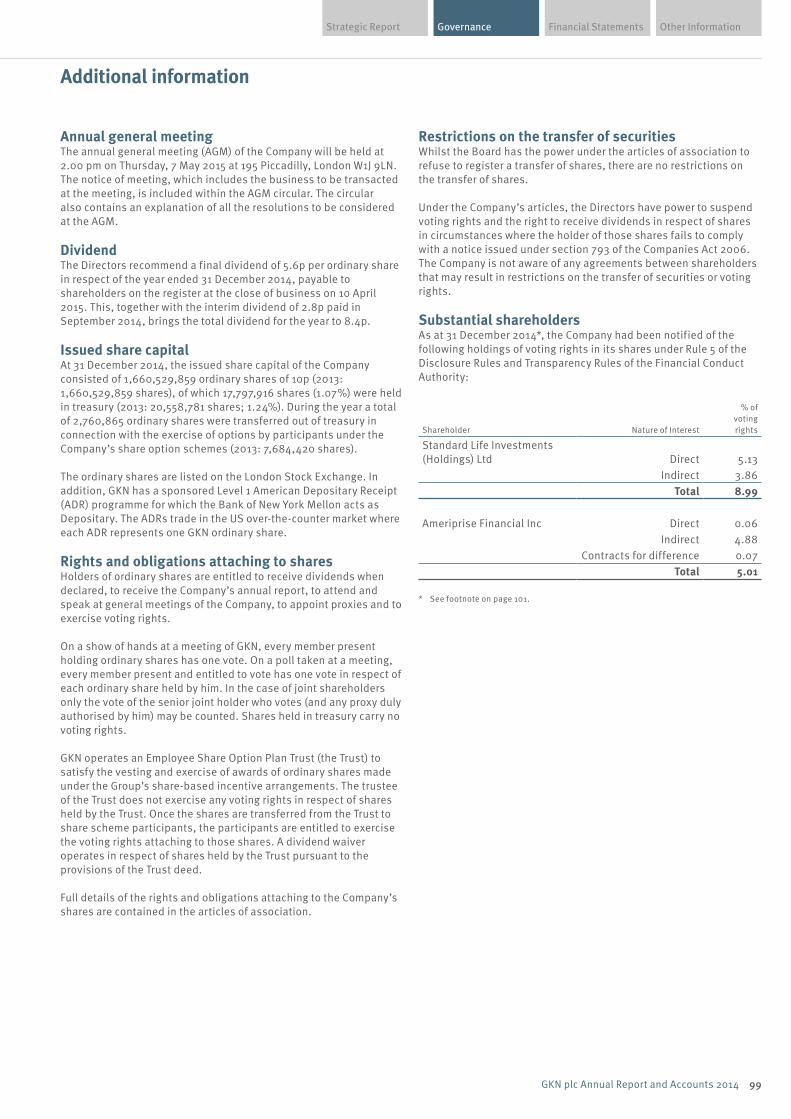
Financial Statements Other InformationGovernanceStrategic Report
99GKN plc Annual Report and Accounts 2014
Additional information
Annual general meeting The annual general meeting (AGM) of the Company will be held at 2.00 pm on Thursday, 7 May 2015 at 195 Piccadilly, London W1J 9LN. The notice of meeting, which includes the business to be transacted at the meeting, is included within the AGM circular. The circular also contains an explanation of all the resolutions to be considered at the AGM.
Dividend The Directors recommend a final dividend of 5.6p per ordinary share in respect of the year ended 31 December 2014, payable to shareholders on the register at the close of business on 10 April 2015. This, together with the interim dividend of 2.8p paid in September 2014, brings the total dividend for the year to 8.4p.
Issued share capital At 31 December 2014, the issued share capital of the Company consisted of 1,660,529,859 ordinary shares of 10p (2013: 1,660,529,859 shares), of which 17,797,916 shares (1.07%) were held in treasury (2013: 20,558,781 shares; 1.24%). During the year a total of 2,760,865 ordinary shares were transferred out of treasury in connection with the exercise of options by participants under the Company’s share option schemes (2013: 7,684,420 shares).
The ordinary shares are listed on the London Stock Exchange. In addition, GKN has a sponsored Level 1 American Depositary Receipt (ADR) programme for which the Bank of New York Mellon acts as Depositary. The ADRs trade in the US over-the-counter market where each ADR represents one GKN ordinary share.
Rights and obligations attaching to shares Holders of ordinary shares are entitled to receive dividends when declared, to receive the Company’s annual report, to attend and speak at general meetings of the Company, to appoint proxies and to exercise voting rights.
On a show of hands at a meeting of GKN, every member present holding ordinary shares has one vote. On a poll taken at a meeting, every member present and entitled to vote has one vote in respect of each ordinary share held by him. In the case of joint shareholders only the vote of the senior joint holder who votes (and any proxy duly authorised by him) may be counted. Shares held in treasury carry no voting rights.
GKN operates an Employee Share Option Plan Trust (the Trust) to satisfy the vesting and exercise of awards of ordinary shares made under the Group’s share-based incentive arrangements. The trustee of the Trust does not exercise any voting rights in respect of shares held by the Trust. Once the shares are transferred from the Trust to share scheme participants, the participants are entitled to exercise the voting rights attaching to those shares. A dividend waiver operates in respect of shares held by the Trust pursuant to the provisions of the Trust deed.
Full details of the rights and obligations attaching to the Company’s shares are contained in the articles of association.
Restrictions on the transfer of securities Whilst the Board has the power under the articles of association to refuse to register a transfer of shares, there are no restrictions on the transfer of shares.
Under the Company’s articles, the Directors have power to suspend voting rights and the right to receive dividends in respect of shares in circumstances where the holder of those shares fails to comply with a notice issued under section 793 of the Companies Act 2006. The Company is not aware of any agreements between shareholders that may result in restrictions on the transfer of securities or voting rights.
Substantial shareholders As at 31 December 2014*, the Company had been notified of the following holdings of voting rights in its shares under Rule 5 of the Disclosure Rules and Transparency Rules of the Financial Conduct Authority:
Shareholder Nature of Interest
% of voting rights
Standard Life Investments (Holdings) Ltd Direct 5.13
Indirect 3.86Total 8.99
Ameriprise Financial Inc Direct 0.06Indirect 4.88
Contracts for difference 0.07Total 5.01
* See footnote on page 101.
100 GKN plc Annual Report and Accounts 2014
GOVERNANCE
Directors The Directors who served during the financial year were as follows:
NamePosition as at 31 December 2014
Service in the year ended 31 December 2014
Mike Turner Chairman Served throughout the year Nigel Stein Chief Executive Served throughout the year Marcus Bryson Chief Executive Aerospace and Land Systems Retired from the Board on 31 December 2014 Angus Cockburn Independent non-executive Director Served throughout the year Tufan Erginbilgic Independent non-executive Director Served throughout the year Shonaid Jemmett-Page Independent non-executive Director Served throughout the year Richard Parry-Jones Senior Independent Director Served throughout the year Andrew Reynolds Smith Chief Executive Automotive and Powder Metallurgy Served throughout the year William Seeger N/A Retired from the Board on 25 February 2014 Adam Walker Finance Director Served throughout the year
Membership of the Board and biographical details of the Directors in office at the date of this report are shown on page 61. All Directors will retire and offer themselves for re-election at the 2015 AGM in accordance with the UK Corporate Governance Code. Further details relating to Board and Committee composition are disclosed in the corporate governance statement on pages 62 to 69.
The articles of association provide that a Director may be appointed by an ordinary resolution of shareholders or by the existing Directors, either to fill a vacancy or as an additional Director. Further information on GKN’s internal procedures for the appointment of Directors is given in the corporate governance statement.
The executive Directors serve under rolling contracts that are terminable with 12 months’ notice from the Company and 6 months’ notice from the executive Director. The non-executive Directors serve under letters of appointment and do not have service contracts with the Company.
Copies of the service contracts of the executive Directors and the letters of appointment of the non-executive Directors are available for inspection at the Company’s registered office during normal business hours and will be available for inspection at the Company’s AGM.
The Directors’ remuneration report, which includes the Directors’ interests in GKN shares, is set out on pages 78 to 98.
Directors’ powers The Board of Directors may exercise all the powers of the Company subject to the provisions of relevant legislation, the Company’s articles of association and any directions given by the Company in general meeting. The powers of the Directors include those in relation to the issue and buyback of shares.
At the 2014 AGM the Directors were authorised to exercise the powers of the Company to purchase up to 164,003,599 of its ordinary shares. No shares were purchased under this authority in 2014. The Directors were also authorised to allot shares in the Company up to an aggregate nominal amount of £54,667,866. These authorities will remain valid until the 2015 AGM or 1 July 2015, if earlier. Resolutions to renew these authorities will be proposed at the 2015 AGM.
Directors’ indemnities Pursuant to the articles of association, the Company has executed a deed poll of indemnity for the benefit of the Directors of the Company and persons who were Directors of the Company in respect of costs of defending claims against them and third party liabilities. These provisions, deemed to be qualifying third party indemnity provisions pursuant to section 234 of the Companies Act 2006, were in force during the year ended 31 December 2014 and remain in force. The indemnity provision in the Company’s articles of association also extends to provide a limited indemnity in respect of liabilities incurred as a director, secretary or officer of an associated company of the Company.
A copy of the deed poll of indemnity is available for inspection at the Company’s registered office during normal business hours and will be available for inspection at the Company’s AGM.
The Company has also arranged appropriate insurance cover for legal action taken against its Directors and officers.
Conflicts of interest Under the Companies Act 2006, Directors must avoid situations where they have, or could have, a direct or indirect interest that conflicts or possibly may conflict with the Company’s interests. As permitted by the Act, the Company’s articles of association enable Directors to authorise actual and potential conflicts of interest.
Formal procedures for the notification and authorisation of such conflicts are in place. These procedures enable non-conflicted Directors to impose limits or conditions when giving or reviewing authorisation and require the Board to review the register of Directors’ conflicts annually and on an ad hoc basis when necessary. Any potential conflicts of interest in relation to newly appointed Directors are considered by the Board prior to appointment.
Articles of association The Company’s articles of association can only be amended by special resolution of the shareholders. GKN’s current articles are available on our website at www.gkn.com.
Additional information continued
Financial Statements Other InformationGovernanceStrategic Report
101GKN plc Annual Report and Accounts 2014
Change of control As at 31 December 2014, the Company’s subsidiary, GKN Holdings plc, had agreements with 14 banks for 15 bilateral banking facilities totalling £800 million and an £80 million loan facility with the European Investment Bank. Each of these agreements provides that, on a change of control of GKN plc, the respective bank can give notice to GKN Holdings plc to repay all outstanding amounts under the relevant facility.
The Company has in issue £450 million fixed rate notes paying 5.375% semi-annual interest and maturing on 19 September 2022 under a euro medium term note programme established by GKN Holdings plc (the Notes). Pursuant to the terms attaching to the Notes, a holder of the Notes has the option to require GKN Holdings plc to redeem or (at GKN Holdings plc’s option) purchase the holder’s Notes at their principal amount if there is a change of control of the Company and either (i) the Notes are unrated or do not carry an investment grade credit rating from at least two ratings agencies; or (ii) if the Notes carry an investment grade credit rating from at least two ratings agencies, the Notes are downgraded to a non-investment grade rating or that rating is withdrawn within 90 days of the change of control and such downgrade or withdrawal is cited by the ratings agencies as being the result of the change of control.
Companies in the Group’s Aerospace division are party to long term supply contracts with customers which are original equipment manufacturers of aircraft and aero engines. Certain of these contracts contain provisions which would entitle the customer to terminate the contract in the event of a change of control of the Company, where such change of control conflicts with the interests to the customer.
Companies in the Group’s Driveline division are party to supply contracts with customers which are original equipment manufacturers of motor vehicles. Certain of these contracts contain provisions which would entitle the customer to terminate the contract in the event of a change of control of the Company.
All of the Company’s share schemes contain provisions relating to a change of control. Outstanding options and awards normally vest and become exercisable on a change of control subject to the satisfaction of any performance conditions at that time.
In line with best practice and the Company’s policy for future service contracts of executive Directors, the service contract entered into with Adam Walker does not include any provision for the payment of a predetermined amount on a change of control of the Company. The service contracts of the other executive Directors in office at the date of this report were amended on 19 February 2014 to remove the change of control provision.
Payments to suppliers It is Group policy to abide by the payment terms agreed with suppliers, provided that the supplier has performed its obligations under the contract. In support of this policy, the Company is a signatory to the UK Government’s Prompt Payment Code.
Branches GKN, through various subsidiaries, has established branches in a number of different countries in which the business operates.
Donations In 2014, charitable donations made by Group companies around the world totalled £739,000 of which £175,000 was to UK registered charities. In accordance with the Group’s policy, no political donations were made and no political expenditure was incurred during 2014.
The Group’s US Aerospace business has a Political Action Committee (PAC) which is funded entirely by employees and their spouses. No funds are provided to the PAC by GKN and any administrative services provided to the PAC by the US Aerospace business are fully charged to and paid for by the PAC, and the Company does not therefore consider these to be political donations. Employee contributions are entirely voluntary and no pressure is placed on employees to participate. Under US law, an employee-funded PAC must bear the name of the employing company.
Research and developmentGroup subsidiaries undertake research and development work in support of their principal manufacturing activities. Further details of the Group’s research and development activities can be found throughout the strategic report.
Financial instrumentsDetails of the Group’s use of financial instruments can be found in Note 19 to the financial statements.
Strategic reportPursuant to section 414C of the Companies Act 2006 the strategic report contains details in relation to the likely future developments of the business of the Group and the disclosure of greenhouse gas emissions for which the Company is responsible.
Auditors and disclosure of informationResolutions to reappoint PricewaterhouseCoopers LLP as auditors of the Company and to authorise the Directors to determine their remuneration will be proposed at the 2015 AGM.
Each of the Directors who held office at the date of approval of this Directors’ report confirms that, so far as he/she is aware, there is no relevant audit information of which the Company’s auditors are unaware. Each Director has taken all the steps that he/she ought to have taken as a Director in order to make himself/herself aware of any relevant audit information and to establish that the Company’s auditors are aware of that information.
The strategic report comprising the inside front cover and pages 1 to 59 and this Directors’ report comprising pages 60 to 102 have been approved by the Board and are signed on its behalf by
Jos SclaterGeneral Counsel & Company Secretary23 February 2015
* As at 25 February 2015, the Company had not been advised of any further changes or additions to the interests notified under Rule 5 of the Disclosure Rules and Transparency Rules of the Financial Conduct Authority as set out on page 99.
102 GKN plc Annual Report and Accounts 2014
GOVERNANCE
Statement of Directors’ responsibilities
The Directors are responsible for preparing the annual report, the Directors’ remuneration report and the Group and Company financial statements in accordance with applicable law and regulations.
Company law requires the Directors to prepare Group and Company financial statements for each financial year. Under that law, the Directors are required to prepare the Group financial statements in accordance with applicable law and International Financial Reporting Standards (IFRSs) as adopted by the European Union (EU) and have elected to prepare the Company financial statements in accordance with applicable law and United Kingdom (UK) Accounting Standards (UK Generally Accepted Accounting Practice).
Under company law, the Directors must not approve the financial statements unless they are satisfied that they give a true and fair view of the state of affairs of the Group and the Company and of their profit or loss for that period. In preparing each of the Group and Company financial statements the Directors are required to:• select appropriate accounting policies and apply them consistently;• make judgements and estimates that are reasonable and prudent;• for the Group financial statements, state whether they have been prepared in accordance with IFRSs as adopted by the EU;• for the Company financial statements, state whether applicable UK Accounting Standards have been followed, subject to any material
departures disclosed and explained in the Company financial statements; and• prepare the financial statements on a going concern basis unless it is inappropriate to presume that the Group and the Company will
continue in business.
The Directors are responsible for keeping adequate accounting records that are sufficient to show and explain the Group’s and the Company’s transactions, disclose with reasonable accuracy at any time the financial position of the Group and the Company, and enable them to ensure that the financial statements and the Directors’ remuneration report comply with the Companies Act 2006 and as regards the Group financial statements, Article 4 of the IAS Regulation. They are also responsible for safeguarding the assets of the Company and the Group and hence for taking reasonable steps for the prevention and detection of fraud and other irregularities.
The Directors are responsible for the maintenance and integrity of the corporate and financial information included on the Company’s website. Legislation in the UK governing the preparation and dissemination of financial statements may differ from legislation in other jurisdictions.
Each of the Directors as at the date of the annual report, whose names and functions are set out on pages 60 and 61, confirm that to the best of their knowledge:• the Group financial statements, prepared in accordance with IFRSs as adopted by the EU, give a true and fair view of the assets, liabilities,
financial position and profit or loss of the Company and the undertakings included in the consolidation taken as a whole; and• the strategic report includes a fair review of the development and performance of the business and the position of the Company and the
undertakings included in the consolidation taken as a whole, together with a description of the principal risks and uncertainties that they face.
In addition, the Directors consider that the annual report and accounts, taken as a whole, is fair, balanced and understandable and provides the information necessary for shareholders to assess the Company’s performance, business model and strategy.
Approved by the Board of GKN plc and signed on its behalf by
Mike Turner CBEChairman23 February 2015
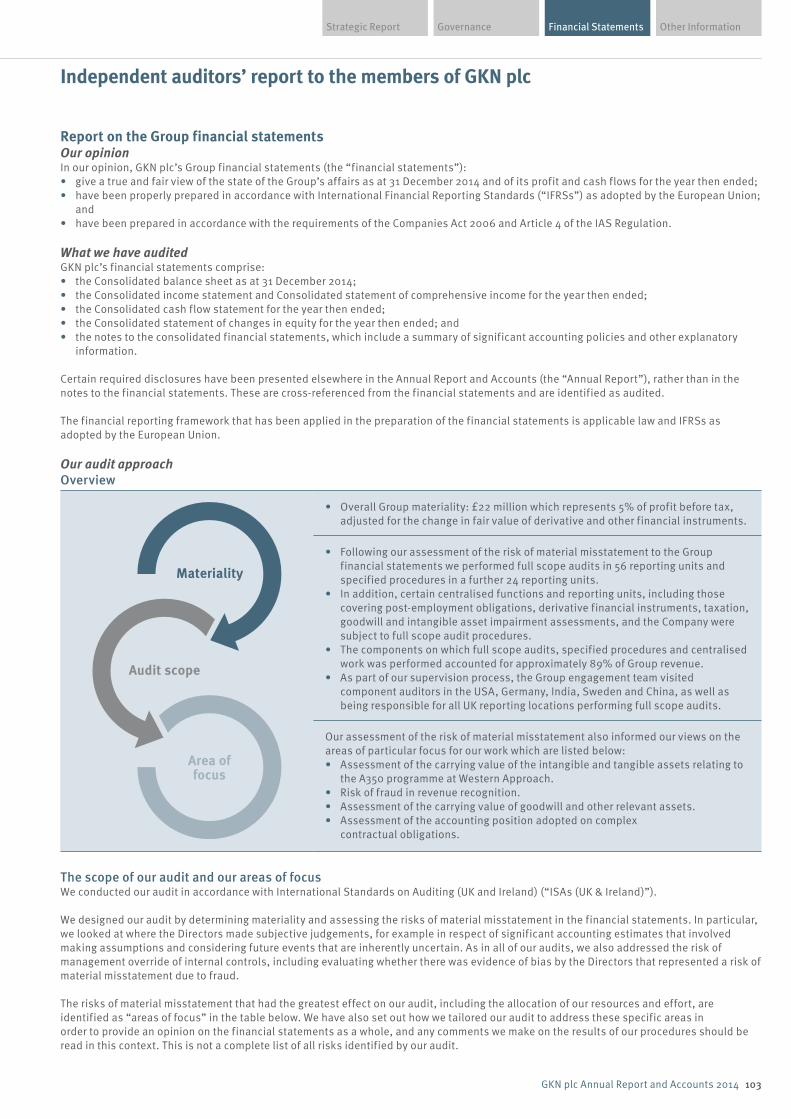
Other InformationStrategic Report
103GKN plc Annual Report and Accounts 2014
Governance Financial Statements
Report on the Group financial statementsOur opinionIn our opinion, GKN plc’s Group financial statements (the “financial statements”):• give a true and fair view of the state of the Group’s affairs as at 31 December 2014 and of its profit and cash flows for the year then ended;• have been properly prepared in accordance with International Financial Reporting Standards (“IFRSs”) as adopted by the European Union;
and• have been prepared in accordance with the requirements of the Companies Act 2006 and Article 4 of the IAS Regulation.
What we have auditedGKN plc’s financial statements comprise:• the Consolidated balance sheet as at 31 December 2014;• the Consolidated income statement and Consolidated statement of comprehensive income for the year then ended;• the Consolidated cash flow statement for the year then ended;• the Consolidated statement of changes in equity for the year then ended; and• the notes to the consolidated financial statements, which include a summary of significant accounting policies and other explanatory
information.
Certain required disclosures have been presented elsewhere in the Annual Report and Accounts (the “Annual Report”), rather than in the notes to the financial statements. These are cross-referenced from the financial statements and are identified as audited.
The financial reporting framework that has been applied in the preparation of the financial statements is applicable law and IFRSs as adopted by the European Union.
Our audit approachOverview
Audit scope
Area of focus
Materiality
• Overall Group materiality: £22 million which represents 5% of profit before tax, adjusted for the change in fair value of derivative and other financial instruments.
• Following our assessment of the risk of material misstatement to the Group financial statements we performed full scope audits in 56 reporting units and specified procedures in a further 24 reporting units.
• In addition, certain centralised functions and reporting units, including those covering post-employment obligations, derivative financial instruments, taxation, goodwill and intangible asset impairment assessments, and the Company were subject to full scope audit procedures.
• The components on which full scope audits, specified procedures and centralised work was performed accounted for approximately 89% of Group revenue.
• As part of our supervision process, the Group engagement team visited component auditors in the USA, Germany, India, Sweden and China, as well as being responsible for all UK reporting locations performing full scope audits.
Our assessment of the risk of material misstatement also informed our views on the areas of particular focus for our work which are listed below:• Assessment of the carrying value of the intangible and tangible assets relating to
the A350 programme at Western Approach.• Risk of fraud in revenue recognition.• Assessment of the carrying value of goodwill and other relevant assets.• Assessment of the accounting position adopted on complex
contractual obligations.
The scope of our audit and our areas of focusWe conducted our audit in accordance with International Standards on Auditing (UK and Ireland) (“ISAs (UK & Ireland)”).
We designed our audit by determining materiality and assessing the risks of material misstatement in the financial statements. In particular, we looked at where the Directors made subjective judgements, for example in respect of significant accounting estimates that involved making assumptions and considering future events that are inherently uncertain. As in all of our audits, we also addressed the risk of management override of internal controls, including evaluating whether there was evidence of bias by the Directors that represented a risk of material misstatement due to fraud.
The risks of material misstatement that had the greatest effect on our audit, including the allocation of our resources and effort, are identified as “areas of focus” in the table below. We have also set out how we tailored our audit to address these specific areas in order to provide an opinion on the financial statements as a whole, and any comments we make on the results of our procedures should be read in this context. This is not a complete list of all risks identified by our audit.
Independent auditors’ report to the members of GKN plc
104 GKN plc Annual Report and Accounts 2014
FINANCIAL STATEMENTS
Area of focus How our audit addressed the area of focus
Assessment of the carrying value of the intangible and tangible assets relating to the A350 programme at Western ApproachRefer to pages 44 to 51 (Principal risks and uncertainties), pages 73 to 74 (Audit committee report), note 1 (Accounting policies and presentation), note 11 (Goodwill and other intangible assets) and note 12 (Property, plant and equipment).
We focused on this area because the Directors’ assessment of the recoverability of this programme’s intangible assets of £120 million and tangible assets of £89 million, inclusive of £15 million of capitalised borrowing costs, involve complex and subjective judgements and assumptions about the progress and future results of this programme. The key judgements and assumptions made by the Directors included the discount rate and the key business drivers of the cash flow forecasts, being the number of aircraft sets to be produced, production and assembly hours, material costs, programme timings which include potential delays and the effects of foreign exchange rates.
We obtained and understood the Directors’ impairment model and tested it for mathematical accuracy, and found that it followed an acceptable methodology and was consistent with prior periods.
We challenged the Directors on the discount rate used by comparing this to the cost of capital for the Group and a selection of comparable organisations.
We also challenged the Directors’ impairment model around the key business drivers of the cash flow forecasts supporting their recoverability assessment. A range of sensitivities were performed across the different elements of the impairment model in order to understand which judgements and assumptions were most sensitive in achieving the Directors’ recoverability assessment. The most sensitive and judgemental elements are detailed below: • for production and assembly hours, we considered the
Directors’ expectations for achieving targeted learning curve improvements and hence reducing the total hours per aircraft set. We challenged the Directors on the historical achievement of learning curve improvement targets on the A350 programme. We also considered how this was balanced against the expected increase in production rates over future years and the implicit challenges that this will bring to achieving the required hours improvements.
• for the number of aircraft sets, we considered the Directors’ expectations for the number and timing of sets to be produced and compared this to current industry expectations, past schedules and the latest reported order book from Airbus.
Based on our audit work, the planned levels of production and assembly hour improvements appear achievable, although not without challenge, and the total number of aircraft sets expected to be produced is consistent with current market expectations and production schedules.
As a result of this, we found that the Directors’ assessment of the carrying value of intangible and tangible assets relating to the A350 programme at Western Approach to be supportable. However, we consider that a failure to meet target production and assembly hour rates as the supply to Airbus increases, or a significant change in the total number of aircraft sets to be produced could reasonably be expected to give rise to an impairment charge in the future.
Independent auditors’ report to the members of GKN plc continued
Other InformationStrategic Report
105GKN plc Annual Report and Accounts 2014
Governance Financial Statements
Area of focus How our audit addressed the area of focus
Risk of fraud in revenue recognitionRefer to pages 44 to 51 (Principal risks and uncertainties), pages 73 to 74 (Audit committee report), note 1 (Accounting policies and presentation) and note 2 (Segmental analysis).
We focused on this area because the Group has a number of complex revenue recognition policies, which require the Directors to exercise judgement and therefore revenue could be subject to misstatement, whether due to fraud or error. This specifically includes judgement over whether revenue has been earned, can be recognised and the subsequent value at which to recognise this revenue.
These complexities and judgements include, but are not limited to:• revenue risk sharing partnerships (RRSPs) in Aerospace where
GKN are entitled to a set percentage of revenue per completed aircraft as contractually agreed with the programme partner, which requires the Directors to exercise judgement as to how much revenue to recognise reflecting the differences in pricing of Original Engine Manufacturer parts and spare parts at the year-end;
• pricing of non-contractually agreed elements of revenue, including rebates and ongoing pricing discussions, which requires a level of judgement to be applied by the Directors over how much revenue to recognise; and
• bill and hold arrangements in Aerospace whereby the recognition of revenue is based on meeting specific criteria which can be subject to judgement by the Directors.
In addition, we also focused on this area because the GKN Short Term Variable Remuneration Scheme (STVRS) of the Directors and senior management is significantly driven by financial measures including revenue recognition, which we concluded gave a greater risk of manipulation of judgements around revenue recognition to ensure that STVRS targets are achieved.
For each area of complexity identified, we challenged the amount of revenue recognised by the Directors to ensure that it was in line with IAS 18 ‘Revenue’ and the contractual agreement, or latest formal correspondence with the customer. In particular:• For RRSPs we agreed the percentage of revenue entitlement
to the customer contract, agreed the revenue recognised to supporting correspondence from the customer and challenged the Directors on the level of revenue recognised where estimates were used at the year-end date. Specifically, ensuring the reasonableness of the estimate through agreement to post year-end confirmations received by the Directors from customers.
• When revenue was recognised based on non-contractually agreed terms, we challenged the Directors on the level of revenue recognised by taking into account the historical level of agreement reached with customers on similar programmes and agreed the revenue recognised to either post year-end cash settlements or communications with the customer.
• For bill and hold arrangements we challenged the Directors on the state of completion of the products that had been sold by inspecting the product and assessing the level of required labour hours needed to complete the product in line with the agreed specification. We agreed the acceptance of the risks and rewards of ownership and confirmed the overall bill and hold arrangement was at the request of the customer by verifying this to confirmations with the customer.
In addition to the specific items noted above, we also responded to the risk that manual adjustments could override standard controls and processes to misstate revenue by testing a sample of manual journals relating to revenue so as to identify unusual or irregular items. We agreed the manual journals tested to corroborative evidence and found no instances of manipulation of revenue occurring in this way.
Based on the results of our audit work, we found that the revenue recognised by the Directors agreed to the relevant contractual terms, was at an appropriate value and was consistent with the requirements of IAS 18. However we did note that contracts with customers are becoming ever more complex and unique and we have therefore recommended that the Directors continue to give sufficient consideration to the revenue being recognised.
106 GKN plc Annual Report and Accounts 2014
FINANCIAL STATEMENTS
Area of focus How our audit addressed the area of focus
Assessment of the carrying value of goodwill and other relevant assetsRefer to page 38 (Business review), pages 44 to 51 (Principal risks and uncertainties), pages 73 to 74 (Audit committee report), note 1 (Accounting policies and presentation) and note 11 (Goodwill and other intangible assets).
We focused on this area because the Directors’ assessment of whether or not certain elements of goodwill and other intangible assets were impaired, and the level of impairment to be booked if applicable, involved complex and subjective judgements and assumptions about the progress and future results of the Group’s Cash-Generating Units (CGUs).
In particular, we focused on the carrying values of material CGUs for Aerospace Engine Products in North America (£38 million of goodwill and £54 million of other assets) and Land Systems Wheels and Structures Europe (£18 million of goodwill and £24 million of other assets).
The Directors have recorded total impairment charges of £69 million relating to the Aerospace Engine Products CGU (£33 million), the Land Systems Wheels and Structures Europe CGU (£26 million) and other impairment charges totalling £10 million.
At 31 December 2014 the carrying value of goodwill and intangible assets in respect of the Group’s remaining CGUs totalled £498 million and £944 million respectively. No impairment triggers had been identified by the Directors in respect of the remaining CGUs and/or their impairment models determined that adequate headroom existed not to result in the need for an impairment charge in reasonably possible scenarios.
We understood and challenged the Directors’ impairment models around the key business drivers of the cash flow forecasts supporting their recoverability assessments, being pricing, market performance and expected growth, the level of new business wins, the margin growth capabilities and capital expenditure requirements. We also evaluated the appropriateness of the key assumptions including the discount rate and long term growth rate used.
For the Aerospace Engine Products CGU, where the Directors recognised an impairment charge of £33 million, we were able to evaluate the reasonableness of the Directors’ forecast by challenging their assumptions regarding the amount of future revenue by agreeing this to contractual terms and challenging the margin expected to be achieved by reference to historical margin and margin improvement programmes. We also challenged the level of maintenance capital expenditure required to deliver current programmes as well as to be able to deliver new business wins within the current capacity and challenged the margin to be achieved in respect of new programmes by reference to historic margins achieved.
In the Land Systems Wheels and Structures Europe CGU, where the Directors recognised an impairment charge of £26 million, the key assumption we focused on was the amount of growth expected to be achieved in both revenue and operating margin. Factors we considered were the forecast economic growth in the region compared to independent industry forecasts and customer data within Europe, combined with the capacity and operating capabilities within the CGU which we compared to historical levels.
We also challenged the Directors on the discount rate used by comparing this to the cost of capital for the Group and a selection of comparable organisations, agreeing any differences identified to supporting evidence. The Directors’ key assumptions for long term growth rates were also compared to economic and industry forecasts for reasonableness and were considered appropriate.
We performed sensitivity analysis around the key assumptions above to ascertain the extent of change in those assumptions that either individually or collectively would be required for the impairment charge to be significantly different to those amounts recognised. We also considered the likelihood of such changes occurring.
For both Aerospace Engine Products and Land Systems Wheels and Structures Europe we found that the planned level of future growth in revenue and operating margin reflected performance levels below those historically achieved.
As a result of our audit work, we determined that the impairment charges for the Aerospace Engine Products and Land Systems Wheels and Structures Europe CGUs were conservative although within a range of potential likely outcomes based on the current plans which reflect the Directors’ best estimate of the value in use of the CGUs.
Independent auditors’ report to the members of GKN plc continued
Other InformationStrategic Report
107GKN plc Annual Report and Accounts 2014
Governance Financial Statements
Area of focus How our audit addressed the area of focus
In addition, based on our audit work, in respect of the remaining CGUs, the Directors’ assessment that no impairment charge currently needed to be recognised was supportable. However, the models are sensitive to growth and margin improvement targets which, if not achieved, could reasonably be expected to give rise to further impairment charges in the future.
Assessment of the accounting position adopted on complex contractual obligationsRefer to pages 25 and 29 (Business review), pages 44 to 51 (Principal risks and uncertainties), pages 73 to 74 (Audit committee report), note 1 (Accounting policies and presentation), note 2 (Segmental analysis) and note 21 (Provisions).
The Group continues to work closely with its customers and suppliers to resolve contractual and other claims and disputes. These matters are principally in respect of warranty, delivery performance, pricing and contract variations.
We focused on this area because the Directors are required to perform an assessment in line with relevant accounting standards and consider each item individually. The determination of whether to recognise a liability or not, or make disclosure in the financial statements, for claims received, onerous contracts or recognise an asset for potential recoveries, requires the Directors to exercise considerable judgement.
In addition, given the wide ranging geographical and market spread of the Group, there is also complexity in ensuring the Directors have considered all known disputes, claims and potential recoveries.
We tested, on a sample basis, the valuation and calculation of individual liabilities or assets that made up the total, including in respect of onerous contracts, claims for contract breaches, late deliveries, product quality, warranty, non-contractually agreed pricing and cost recoveries. In particular:• for liabilities recognised, we challenged the Directors on
ensuring the assessment and calculation of any provision was consistent with the requirements of IAS 37 ‘Provisions, contingent liabilities and contingent assets’ and that all potential outcomes had been considered and appropriately disclosed in the financial statements;
• for assets recognised, we challenged the Directors on their assessment of the recognition criteria and that the assets were virtually certain to be recovered; and
• where liabilities and assets related to the same customer or supplier, we challenged the Directors to ensure that all items had been individually considered and were not presented on a net basis.
We assessed the completeness of the Directors’ list of claims, disputes, onerous contracts and potential recoveries using our knowledge of the business, enquiries of the Directors, examining post year-end correspondence with customers and suppliers and assessing the Directors’ material litigation process.
We found no material exceptions from the procedures noted above. We consider the Directors’ recognition of liabilities and assets to be reasonable and within an acceptable range of potentially likely outcomes and consistent with the requirements of IAS 37.
How we tailored the audit scopeWe tailored the scope of our audit to ensure that we performed enough work to be able to give an opinion on the financial statements as a whole, taking into account the geographic structure of the Group, the accounting processes and controls, and the industry in which the Group operates.
The Group is structured along four segments being Aerospace, Driveline, Powder Metallurgy and Land Systems with each division set up to manage operations on both a regional and functional basis and consisting of a number of reporting units.
The Group financial statements are a consolidation of 237 active reporting units, comprising the Group’s operating businesses and centralised functions. These reporting units maintain their own accounting records and controls and report to the head office finance team in the UK through an integrated consolidation system.
Aerospace reporting units are based predominantly in the UK, USA and Sweden. Driveline reporting units are based in 22 countries with Europe and North America being the largest regions. Powder Metallurgy reporting units are based predominantly in North America with other sites in Europe and Asia-Pacific. Land Systems reporting units are based predominantly in Europe and North America.
In establishing the overall approach to the Group audit, we determined the type of work that needed to be performed at each reporting unit and we used component auditors within PwC UK and from other PwC network firms operating under our instruction, who are familiar with the local laws and regulations in each of these territories to perform this audit work.
108 GKN plc Annual Report and Accounts 2014
FINANCIAL STATEMENTS
Accordingly, of the Group’s 237 active reporting units, we identified 56 which, in our view, required an audit of their complete financial information, whether due to their significance and/or risk characteristics. These reporting units accounted for 73% of Group revenue.
Specific audit procedures on certain balances and transactions were performed at a further 24 reporting units with due consideration paid to obtaining global coverage on a rotational basis. The reporting units on which these specific procedures were performed accounted for a further 16% of Group revenue.
Where the work was performed by component auditors, we determined the level of involvement we needed to have in the audit work at those reporting units to be able to conclude whether sufficient appropriate audit evidence had been obtained as a basis for our opinion on the Group financial statements as a whole.
The Group engagement team visits component auditors based on significance and/or risk characteristics, as well as on a rotational basis to ensure coverage across the Group. In the current year, the Group engagement team visited component auditors in the USA, Germany, India, Sweden and China, as well as being responsible for all UK reporting locations performing full scope audits. Additionally the Group audit team was in contact, at each stage of the audit, with a number of other component auditors, which included meeting local GKN management, attendance at audit planning meetings, attendance at audit close meetings and review of audit working papers.
The Group consolidation, financial statements disclosures and a number of centralised reporting units were audited by the Group engagement team at the head office. These included, but were not limited to, central procedures on post-employment obligations, derivative financial instruments, taxation, and goodwill and intangible asset impairment assessments. We also performed group level analytical procedures on all of the remaining out of scope active reporting units to identify whether any further audit evidence was needed, which resulted in no extra testing being required. The Company was also subject to a full scope audit.
Taken together, the reporting units and group functions where we performed audit procedures accounted for approximately 89% of Group revenue.
MaterialityThe scope of our audit was influenced by our application of materiality. We set certain quantitative thresholds for materiality. These, together with qualitative considerations, helped us to determine the scope of our audit and the nature, timing and extent of our audit procedures and to evaluate the effect of misstatements, both individually and on the financial statements as a whole.
Based on our professional judgement, and consistent with the prior year, we determined materiality for the financial statements as a whole as follows:
Overall Group materiality £22 million (2013: £23 million).
How we determined it 5% of profit before tax, adjusted for the change in fair value of derivative and other financial instruments and as disclosed on the face of the consolidated income statement.
Rationale for benchmark applied
We believe that profit before tax adjusted for the change in fair value of derivative and other financial instruments provides us with a consistent year on year basis for determining materiality as it eliminates the fluctuating nature of these items which can have a disproportionate impact on the Group’s consolidated income statement.
We agreed with the Audit Committee that we would report to them misstatements identified during our audit above £1 million (2013: £1 million) as well as misstatements below that amount that, in our view, warranted reporting for qualitative reasons.
Independent auditors’ report to the members of GKN plc continued
Other InformationStrategic Report
109GKN plc Annual Report and Accounts 2014
Governance Financial Statements
Going concernUnder the Listing Rules we are required to review the Directors’ statement, set out on page 41, in relation to going concern. We have nothing to report having performed our review.
As noted in the Directors’ statement, the Directors have concluded that it is appropriate to prepare the financial statements using the going concern basis of accounting. The going concern basis presumes that the Group has adequate resources to remain in operation, and that the Directors intend it to do so, for at least one year from the date the financial statements were signed. As part of our audit we have concluded that the Directors’ use of the going concern basis is appropriate.
However, because not all future events or conditions can be predicted, these statements are not a guarantee as to the Group’s ability to continue as a going concern.
Other required reportingConsistency of other informationCompanies Act 2006 opinionIn our opinion, the information given in the Strategic Report and the Directors’ Report for the financial year for which the financial statements are prepared is consistent with the financial statements.
ISAs (UK & Ireland) reporting
Under ISAs (UK & Ireland) we are required to report to you if, in our opinion:
• information in the Annual Report is: – materially inconsistent with the information in the audited financial statements; or – apparently materially incorrect based on, or materially inconsistent with, our knowledge of the Group acquired in the course of performing our audit; or
– otherwise misleading.
We have no exceptions to report arising from this responsibility.
• the statement given by the Directors on page 68, in accordance with provision C.1.1 of the UK Corporate Governance Code (“the Code”), that they consider the Annual Report taken as a whole to be fair, balanced and understandable and provides the information necessary for members to assess the Group’s performance, business model and strategy is materially inconsistent with our knowledge of the Group acquired in the course of performing our audit.
We have no exceptions to report arising from this responsibility.
• the section of the Annual Report on pages 73 to 77, as required by provision C.3.8 of the Code, describing the work of the Audit Committee does not appropriately address matters communicated by us to the Audit Committee.
We have no exceptions to report arising from this responsibility.
Adequacy of information and explanations receivedUnder the Companies Act 2006 we are required to report to you if, in our opinion, we have not received all the information and explanations we require for our audit. We have no exceptions to report arising from this responsibility.
Directors’ remunerationUnder the Companies Act 2006 we are required to report to you if, in our opinion, certain disclosures of Directors’ remuneration specified by law are not made. We have no exceptions to report arising from this responsibility.
Corporate governance statementUnder the Listing Rules we are required to review the part of the Corporate Governance Statement relating to the Company’s compliance with ten provisions of the UK Corporate Governance Code. We have nothing to report having performed our review.
110 GKN plc Annual Report and Accounts 2014
FINANCIAL STATEMENTS
Responsibilities for the financial statements and the auditOur responsibilities and those of the DirectorsAs explained more fully in the Statement of Directors’ responsibilities set out on page 102, the Directors are responsible for the preparation of the financial statements and for being satisfied that they give a true and fair view.
Our responsibility is to audit and express an opinion on the financial statements in accordance with applicable law and ISAs (UK & Ireland). Those standards require us to comply with the Auditing Practices Board’s Ethical Standards for Auditors.
This report, including the opinions, has been prepared for and only for the Company’s members as a body in accordance with Chapter 3 of Part 16 of the Companies Act 2006 and for no other purpose. We do not, in giving these opinions, accept or assume responsibility for any other purpose or to any other person to whom this report is shown or into whose hands it may come save where expressly agreed by our prior consent in writing.
What an audit of financial statements involvesAn audit involves obtaining evidence about the amounts and disclosures in the financial statements sufficient to give reasonable assurance that the financial statements are free from material misstatement, whether caused by fraud or error. This includes an assessment of: • whether the accounting policies are appropriate to the Group’s circumstances and have been consistently applied and
adequately disclosed; • the reasonableness of significant accounting estimates made by the Directors; and • the overall presentation of the financial statements.
We primarily focus our work in these areas by assessing the Directors’ judgements against available evidence, forming our own judgements, and evaluating the disclosures in the financial statements.
We test and examine information, using sampling and other auditing techniques, to the extent we consider necessary to provide a reasonable basis for us to draw conclusions. We obtain audit evidence through testing the effectiveness of controls, substantive procedures or a combination of both.
In addition, we read all the financial and non-financial information in the Annual Report to identify material inconsistencies with the audited financial statements and to identify any information that is apparently materially incorrect based on, or materially inconsistent with, the knowledge acquired by us in the course of performing the audit. If we become aware of any apparent material misstatements or inconsistencies we consider the implications for our report.
Other matterWe have reported separately on the Company financial statements of GKN plc for the year ended 31 December 2014 and on the information in the Directors’ remuneration report that is described as having been audited.
Ian Chambers (Senior Statutory Auditor)for and on behalf of PricewaterhouseCoopers LLPChartered Accountants and Statutory AuditorsBirmingham23 February 2015
a) The maintenance and integrity of the GKN plc website is the responsibility of the Directors; the work carried out by the auditors does not involve consideration of these matters and, accordingly, the auditors accept no responsibility for any changes that may have occurred to the financial statements since they were initially presented on the website.
b) Legislation in the United Kingdom governing the preparation and dissemination of financial statements may differ from legislation in other jurisdictions.
Independent auditors’ report to the members of GKN plc continued
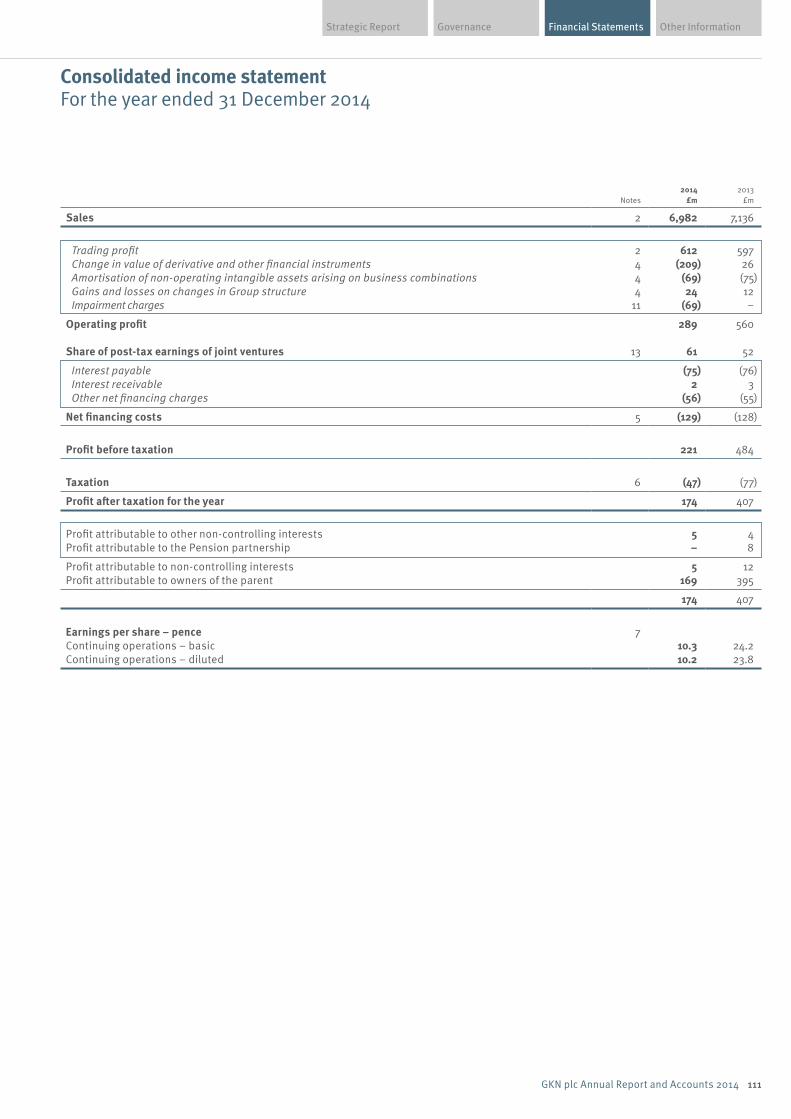
Financial Statements Other InformationGovernanceStrategic Report
111GKN plc Annual Report and Accounts 2014
Consolidated income statementFor the year ended 31 December 2014
Notes2014
£m 2013
£m
Sales 2 6,982 7,136
Trading profit 2 612 597 Change in value of derivative and other financial instruments 4 (209) 26 Amortisation of non-operating intangible assets arising on business combinations 4 (69) (75) Gains and losses on changes in Group structure 4 24 12 Impairment charges 11 (69) –
Operating profit 289 560
Share of post-tax earnings of joint ventures 13 61 52
Interest payable (75) (76) Interest receivable 2 3 Other net financing charges (56) (55)
Net financing costs 5 (129) (128)
Profit before taxation 221 484
Taxation 6 (47) (77)
Profit after taxation for the year 174 407
Profit attributable to other non-controlling interests 5 4 Profit attributable to the Pension partnership – 8
Profit attributable to non-controlling interests 5 12 Profit attributable to owners of the parent 169 395
174 407
Earnings per share – pence 7 Continuing operations – basic 10.3 24.2 Continuing operations – diluted 10.2 23.8
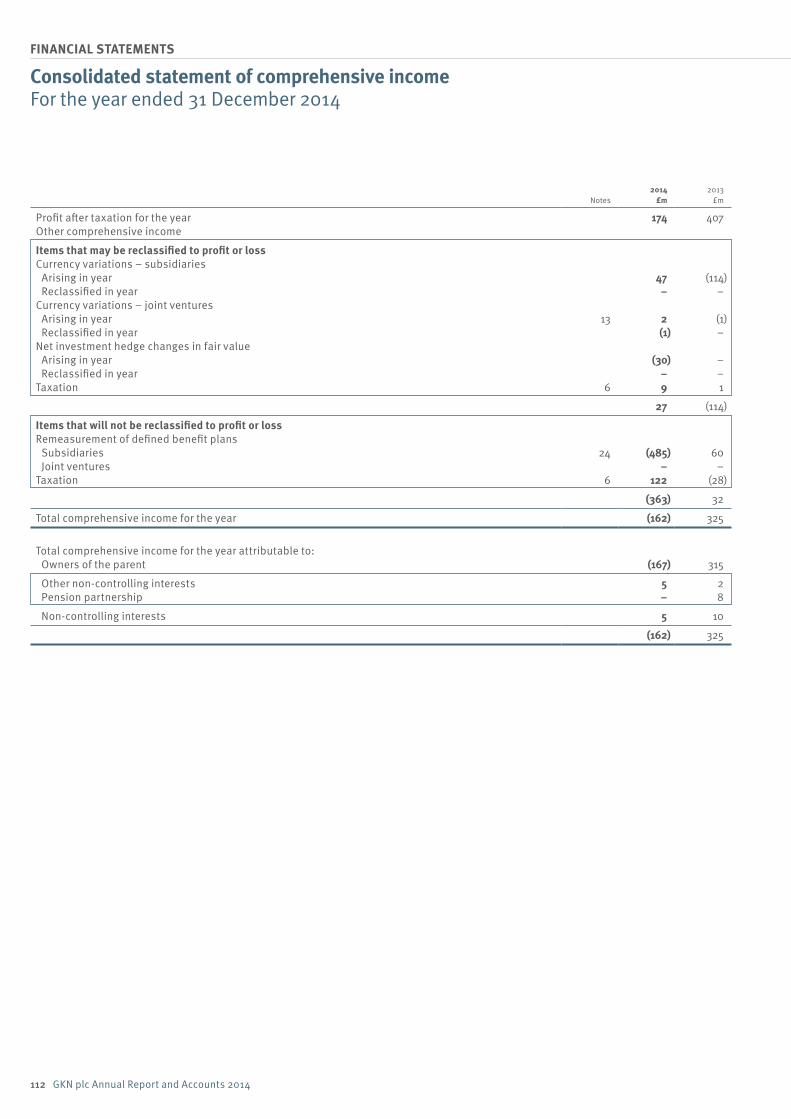
112 GKN plc Annual Report and Accounts 2014
FINANCIAL STATEMENTS
Notes2014
£m 2013
£m
Profit after taxation for the year 174 407 Other comprehensive income
Items that may be reclassified to profit or loss Currency variations – subsidiaries Arising in year 47 (114) Reclassified in year – – Currency variations – joint ventures Arising in year 13 2 (1) Reclassified in year (1) – Net investment hedge changes in fair value Arising in year (30) – Reclassified in year – – Taxation 6 9 1
27 (114)
Items that will not be reclassified to profit or loss Remeasurement of defined benefit plans Subsidiaries 24 (485) 60 Joint ventures – – Taxation 6 122 (28)
(363) 32
Total comprehensive income for the year (162) 325
Total comprehensive income for the year attributable to: Owners of the parent (167) 315
Other non-controlling interests 5 2 Pension partnership – 8
Non-controlling interests 5 10
(162) 325
Consolidated statement of comprehensive incomeFor the year ended 31 December 2014
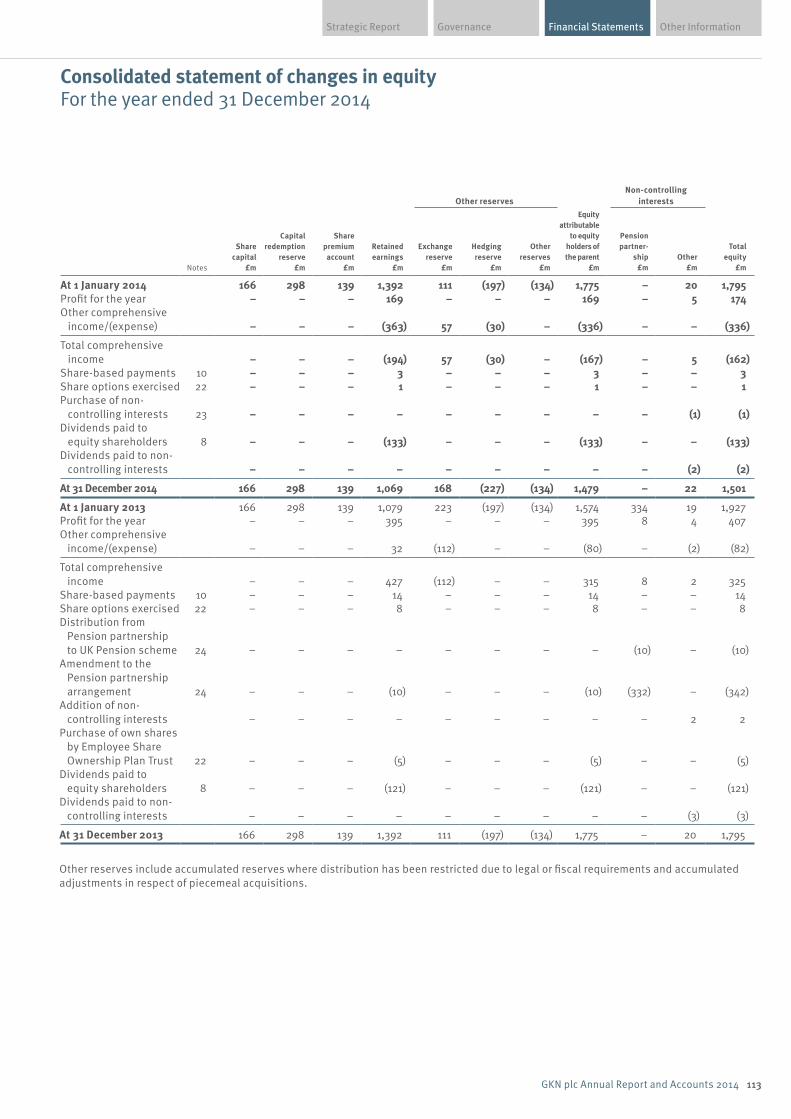
Financial Statements Other InformationGovernanceStrategic Report
113GKN plc Annual Report and Accounts 2014
Other reservesNon-controlling
interests
Notes
Share capital
£m
Capital redemption
reserve £m
Share premium account
£m
Retained earnings
£m
Exchange reserve
£m
Hedging reserve
£m
Other reserves
£m
Equity attributable
to equity holders of the parent
£m
Pension partner-
ship £m
Other £m
Total equity
£m
At 1 January 2014 166 298 139 1,392 111 (197) (134) 1,775 – 20 1,795 Profit for the year – – – 169 – – – 169 – 5 174 Other comprehensive
income/(expense) – – – (363) 57 (30) – (336) – – (336)
Total comprehensive income – – – (194) 57 (30) – (167) – 5 (162)
Share-based payments 10 – – – 3 – – – 3 – – 3 Share options exercised 22 – – – 1 – – – 1 – – 1 Purchase of non-
controlling interests 23 – – – – – – – – – (1) (1)Dividends paid to
equity shareholders 8 – – – (133) – – – (133) – – (133)Dividends paid to non-
controlling interests – – – – – – – – – (2) (2)
At 31 December 2014 166 298 139 1,069 168 (227) (134) 1,479 – 22 1,501
At 1 January 2013 166 298 139 1,079 223 (197) (134) 1,574 334 19 1,927 Profit for the year – – – 395 – – – 395 8 4 407 Other comprehensive
income/(expense) – – – 32 (112) – – (80) – (2) (82)
Total comprehensive income – – – 427 (112) – – 315 8 2 325
Share-based payments 10 – – – 14 – – – 14 – – 14 Share options exercised 22 – – – 8 – – – 8 – – 8 Distribution from
Pension partnership to UK Pension scheme 24 – – – – – – – – (10) – (10)
Amendment to the Pension partnership arrangement 24 – – – (10) – – – (10) (332) – (342)
Addition of non-controlling interests – – – – – – – – – 2 2
Purchase of own shares by Employee Share Ownership Plan Trust 22 – – – (5) – – – (5) – – (5)
Dividends paid to equity shareholders 8 – – – (121) – – – (121) – – (121)
Dividends paid to non-controlling interests – – – – – – – – – (3) (3)
At 31 December 2013 166 298 139 1,392 111 (197) (134) 1,775 – 20 1,795
Other reserves include accumulated reserves where distribution has been restricted due to legal or fiscal requirements and accumulated adjustments in respect of piecemeal acquisitions.
Consolidated statement of changes in equityFor the year ended 31 December 2014
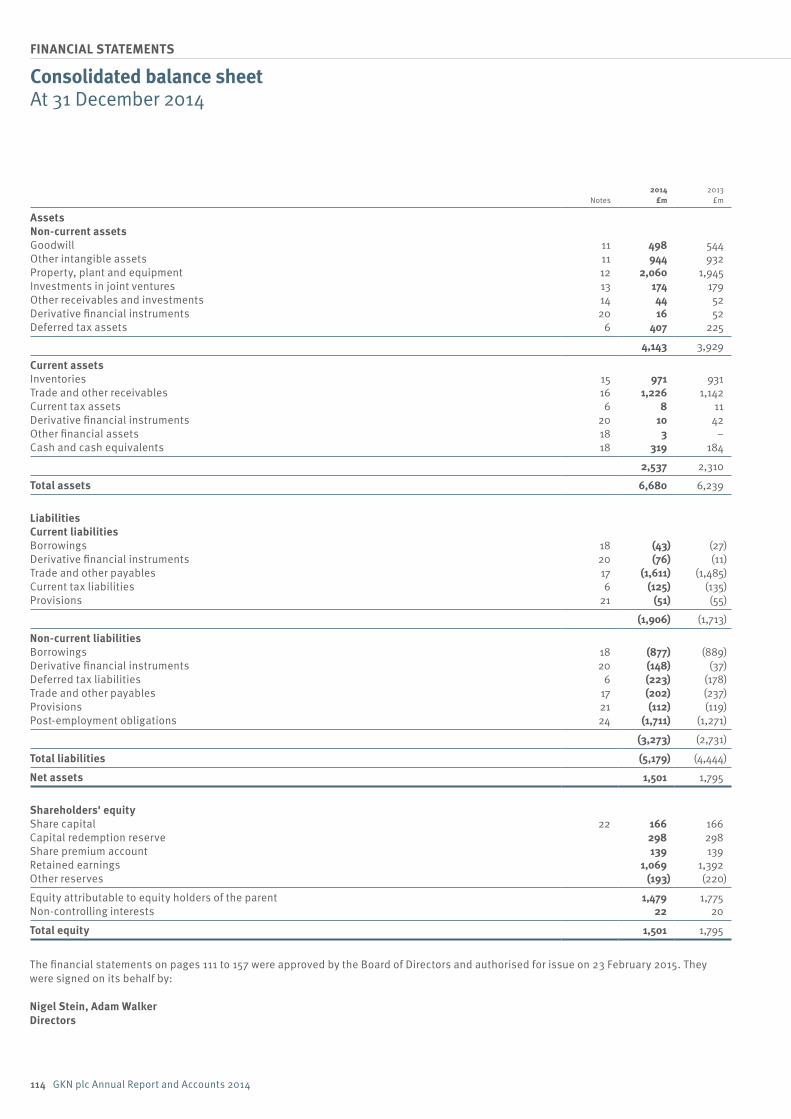
114 GKN plc Annual Report and Accounts 2014
FINANCIAL STATEMENTS
Notes2014
£m 2013
£m
AssetsNon-current assetsGoodwill 11 498 544 Other intangible assets 11 944 932 Property, plant and equipment 12 2,060 1,945 Investments in joint ventures 13 174 179 Other receivables and investments 14 44 52 Derivative financial instruments 20 16 52 Deferred tax assets 6 407 225
4,143 3,929
Current assetsInventories 15 971 931 Trade and other receivables 16 1,226 1,142 Current tax assets 6 8 11 Derivative financial instruments 20 10 42 Other financial assets 18 3 –Cash and cash equivalents 18 319 184
2,537 2,310
Total assets 6,680 6,239
LiabilitiesCurrent liabilitiesBorrowings 18 (43) (27)Derivative financial instruments 20 (76) (11)Trade and other payables 17 (1,611) (1,485)Current tax liabilities 6 (125) (135)Provisions 21 (51) (55)
(1,906) (1,713)
Non-current liabilitiesBorrowings 18 (877) (889)Derivative financial instruments 20 (148) (37)Deferred tax liabilities 6 (223) (178)Trade and other payables 17 (202) (237)Provisions 21 (112) (119)Post-employment obligations 24 (1,711) (1,271)
(3,273) (2,731)
Total liabilities (5,179) (4,444)
Net assets 1,501 1,795
Shareholders' equityShare capital 22 166 166 Capital redemption reserve 298 298 Share premium account 139 139 Retained earnings 1,069 1,392 Other reserves (193) (220)
Equity attributable to equity holders of the parent 1,479 1,775 Non-controlling interests 22 20
Total equity 1,501 1,795
The financial statements on pages 111 to 157 were approved by the Board of Directors and authorised for issue on 23 February 2015. They were signed on its behalf by:
Nigel Stein, Adam WalkerDirectors
Consolidated balance sheetAt 31 December 2014
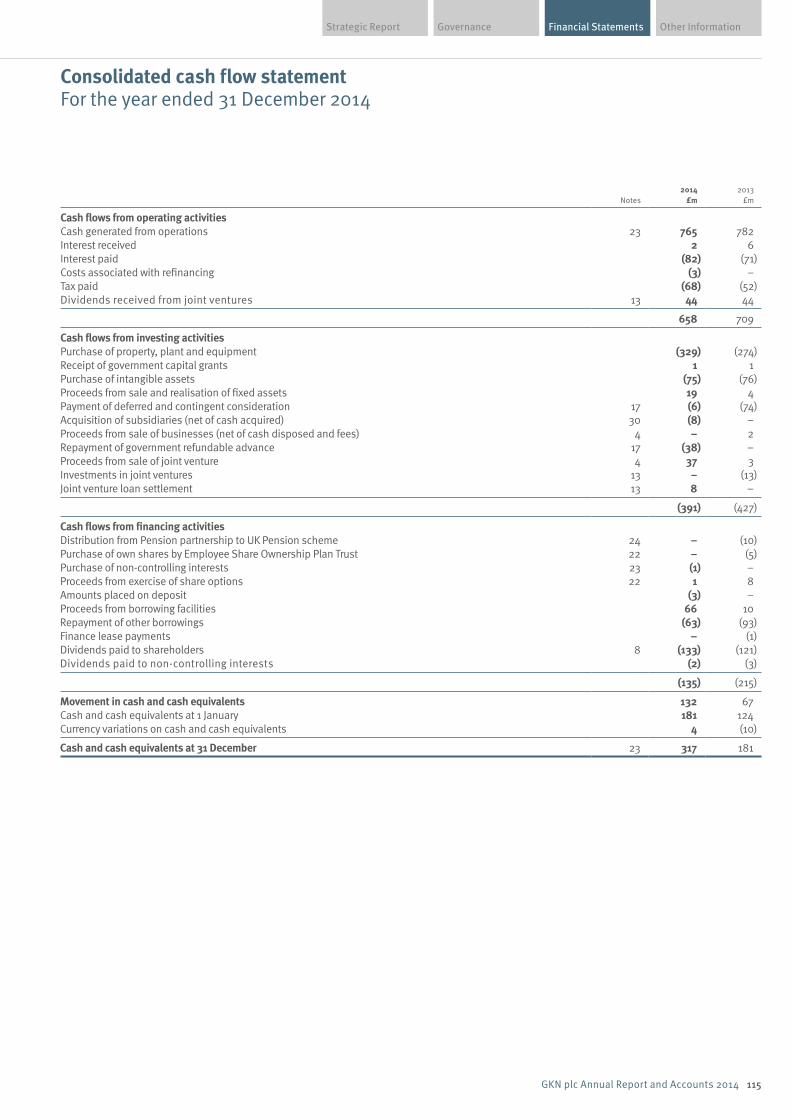
Financial Statements Other InformationGovernanceStrategic Report
115GKN plc Annual Report and Accounts 2014
Notes2014
£m 2013
£m
Cash flows from operating activitiesCash generated from operations 23 765 782 Interest received 2 6 Interest paid (82) (71)Costs associated with refinancing (3) –Tax paid (68) (52)Dividends received from joint ventures 13 44 44
658 709
Cash flows from investing activitiesPurchase of property, plant and equipment (329) (274)Receipt of government capital grants 1 1 Purchase of intangible assets (75) (76)Proceeds from sale and realisation of fixed assets 19 4 Payment of deferred and contingent consideration 17 (6) (74)Acquisition of subsidiaries (net of cash acquired) 30 (8) –Proceeds from sale of businesses (net of cash disposed and fees) 4 – 2 Repayment of government refundable advance 17 (38) –Proceeds from sale of joint venture 4 37 3 Investments in joint ventures 13 – (13)Joint venture loan settlement 13 8 –
(391) (427)
Cash flows from financing activitiesDistribution from Pension partnership to UK Pension scheme 24 – (10)Purchase of own shares by Employee Share Ownership Plan Trust 22 – (5)Purchase of non-controlling interests 23 (1) –Proceeds from exercise of share options 22 1 8 Amounts placed on deposit (3) –Proceeds from borrowing facilities 66 10 Repayment of other borrowings (63) (93)Finance lease payments – (1)Dividends paid to shareholders 8 (133) (121)Dividends paid to non-controlling interests (2) (3)
(135) (215)
Movement in cash and cash equivalents 132 67 Cash and cash equivalents at 1 January 181 124 Currency variations on cash and cash equivalents 4 (10)
Cash and cash equivalents at 31 December 23 317 181
Consolidated cash flow statementFor the year ended 31 December 2014
116 GKN plc Annual Report and Accounts 2014
FINANCIAL STATEMENTS
1 Accounting policies and presentationThe Group's significant accounting policies are summarised below.
Basis of preparationThe consolidated financial statements (the “statements”) have been prepared in accordance with International Financial Reporting Standards (IFRS) as endorsed and adopted for use by the European Union. These statements have been prepared under the historical cost method except where other measurement bases are required to be applied under IFRS as set out below.
These statements have been prepared using all standards and interpretations required for financial periods beginning 1 January 2014. No standards or interpretations have been adopted before the required implementation date.
Standards, revisions and amendments to standards and interpretationsThe Group adopted all applicable amendments to standards with an effective date in 2014, including IFRS 10, IFRS 11 and IFRS 12, with no material impact on its results, assets and liabilities. All other accounting policies have been applied consistently.
Basis of consolidationThe statements incorporate the financial statements of the Company and its subsidiaries (together “the Group”) and the Group's share of the results and equity of its joint ventures and associates.
Subsidiaries are entities over which, either directly or indirectly, the Company has control through the power to govern financial and operating policies so as to obtain benefit from their activities. This power is accompanied by a shareholding of more than 50% of the voting rights. The results of subsidiaries acquired or sold during the year are included in the Group’s results from the date of acquisition or up to the date of disposal. All business combinations are accounted for by the purchase method. Assets, liabilities and contingent liabilities acquired in a business combination are measured at fair value.
Intra-group balances, transactions, income and expenses are eliminated.
Other non-controlling interests represent the portion of shareholders’ earnings and equity attributable to third party shareholders.
Joint venturesJoint ventures are entities in which the Group has a long term interest and exercises joint control with its partners over their financial and operating policies. In all cases voting rights are 50% or lower. Investments in joint ventures are accounted for by the equity method. The Group’s share of equity includes goodwill arising on acquisition.
Foreign currenciesSubsidiaries and joint ventures account in the currency of their primary economic environment of operation, determined having regard to the currency which mainly influences sales and input costs. Transactions are translated at exchange rates approximating to the rate ruling on the date of the transaction except in the case of material transactions when actual spot rate may be used where it
more accurately reflects the underlying substance of the transaction. Where practicable, transactions involving foreign currencies are protected by forward contracts. Assets and liabilities denominated in foreign currencies are translated at the exchange rates ruling at the balance sheet date. Such transactional exchange differences are taken into account in determining profit before tax.
Material foreign currency movements arising on the translation of intra-group balances treated as part of the net investment in a subsidiary are recognised through equity. Movements on other intra-group balances are recognised through the income statement.
The Group’s presentational currency is sterling. On consolidation, results and cash flows of foreign subsidiaries and joint ventures are translated to sterling at average exchange rates except in the case of material transactions when the actual spot rate is used where it more accurately reflects the underlying substance of the transaction. Assets and liabilities are translated at the exchange rates ruling at the balance sheet date. Such translational exchange differences are taken to equity.
Profits and losses on the realisation of foreign currency net investments include the accumulated net exchange differences that have arisen on the retranslation of the foreign currency net investments since 1 January 2004 up to the date of realisation.
Presentation of the income statementIFRS is not fully prescriptive as to the format of the income statement. Line items and subtotals have been presented on the face of the income statement in addition to those required under IFRS.
Sales shown in the income statement are those of subsidiaries.
Operating profit is profit before discontinued operations, taxation, finance costs and the share of post-tax earnings of joint ventures accounted for using the equity method. In order to achieve consistency and comparability between reporting periods, operating profit is analysed to show separately the results of normal trading performance and individually significant charges and credits. Such items arise because of their size or nature and comprise:• the impact of the annual goodwill impairment review;• asset impairment and restructuring charges which arise from
events that are significant to any reportable segment;• amortisation of the fair value of non-operating intangible assets
arising on business combinations;• changes in the fair value of derivative financial instruments
and material currency translation movements arising on intra-group funding;
• gains or losses on changes in Group structure which do not meet the definition of discontinued operations or which the Group views as capital rather than revenue in nature;
• profits or losses arising from business combinations including fair value adjustments to pre-combination shareholdings, changes in estimates of contingent consideration made after the provisional fair value period and material expenses and charges incurred on a business combination; and
• significant pension scheme curtailments and settlements.
The Group’s post-tax share of joint venture earnings is shown as a separate component of profit before tax. The Group’s share of material restructuring and impairment charges, amortisation of the
Notes to the consolidated financial statementsFor the year ended 31 December 2014
Financial Statements Other InformationGovernanceStrategic Report
117GKN plc Annual Report and Accounts 2014
fair value of non-operating intangible assets arising on business combinations and other net financing charges and their related taxation are separately identified, in the related note.
Net financing costs are analysed to show separately interest payable, interest receivable and other net financing charges. Other net financing charges include the interest charge on net defined benefit plans, specific changes in fair value on cash flow hedges and unwind of discounts on fair value amounts established on business combinations.
Revenue recognitionSalesRevenue from the sale of goods is measured at the fair value of the consideration receivable which generally equates to the invoiced amount, excluding sales taxes and net of allowances for returns, early settlement discounts and rebates.
Invoices for goods are raised when the risks and rewards of ownership have passed which, dependent upon contractual terms, may be at the point of despatch, acceptance by the customer or, in Aerospace, certification by the customer. Sales of services under risk and revenue sharing partnerships are recognised by reference to the stage of completion based on services performed to date. The assessment of the stage of completion is dependent on the nature of the contract, but will generally be based on: costs incurred to the extent these relate to services performed up to the reporting date; achievement of contractual milestones where appropriate; or flying hours or equivalent for long term aftermarket arrangements.
Many businesses in Automotive and Land Systems recognise an element of revenue via a surcharge or similar raw material cost recovery mechanism. The surcharge invoiced or credited is generally based on prior period movement in raw material price indices applied to current period deliveries. Other cost recoveries are recorded according to the customer agreement. In those instances where recovery of such increases is guaranteed, irrespective of the level of future deliveries, revenue is recognised, or due allowance made, in the same period as the cost movement takes place.
Other incomeInterest income is recognised using the effective interest rate method.
Sales and other income is recognised in the income statement when it can be reliably measured and its collectability is reasonably assured.
Property, plant and equipmentProperty, plant and equipment is stated at cost less accumulated depreciation and impairment charges.
CostCost comprises the purchase price plus costs directly incurred in bringing the asset into use and borrowing costs on qualifying assets. Where freehold and long leasehold properties were carried at valuation on 23 March 2000, these values have been retained as book values and therefore deemed cost at the date of the IFRS transition.
Where assets are in the course of construction at the balance sheet date they are classified as capital work in progress. Transfers are made to other asset categories when they are available for use.
DepreciationDepreciation is not provided on freehold land or capital work in progress. In the case of all other categories of property, plant and equipment, depreciation is provided on a straight line basis over the course of the financial year from the date the asset is available for use.
Depreciation is applied to specific classes of asset so as to reduce them to their residual values over their estimated useful lives, which are reviewed annually.
The range of depreciation lives are:
Years
Freehold buildings Up to 50Steel powder production plant 18General plant, machinery, fixtures and fittings 6 to 15Computers 3 to 5Commercial vehicles and cars 4 to 5
Property, plant and equipment is reviewed at least annually for indications of impairment. Impairments are charged to the income statement. Similarly, where property, plant and equipment has been impaired and subsequent reviews demonstrate the recoverable value is in excess of the impaired value an impairment reversal is recorded. The amount of the reversal cannot exceed the theoretical net book amount at the date of the reversal had the item not been impaired. Impairment reversals are credited to the income statement against the same line item to which the impairment was previously charged.
Borrowing costsBorrowing costs are capitalised as cost on qualifying tangible and intangible fixed asset expenditure. A qualifying asset is an asset or programme where the period of capitalisation is more than 12 months and the capital value is more than £25 million. For general borrowings the capitalisation rate is the weighted average of the borrowing costs outstanding during the year. For specific funding and borrowings the amount capitalised is the actual borrowing cost incurred less any investment income on the temporary investment of those borrowings.
Financial assets and liabilitiesFinancial liabilities are recorded in arrangements where payments, or similar transfers of financial resources, are unavoidable or guaranteed.
Borrowings are measured initially at fair value which usually equates to proceeds received and includes transaction costs. Borrowings are subsequently measured at amortised cost.
Cash and cash equivalents comprise cash on hand and demand deposits, and overdrafts together with highly liquid investments of less than 90 days maturity. Other financial assets comprise investments with more than 90 days until maturity. Unless an enforceable right of set-off exists and there is an intention to net settle, the components of cash and cash equivalents are reflected on a gross basis in the balance sheet.
Other financial assets and liabilities, including short term receivables and payables, are initially recognised at fair value and subsequently measured at amortised cost less any impairment provision unless the impact of the time value of money is considered to be material.
118 GKN plc Annual Report and Accounts 2014
FINANCIAL STATEMENTS
1 Accounting policies and presentation continuedDerivative financial instrumentsThe Group does not trade in derivative financial instruments. Derivative financial instruments including forward foreign currency contracts and cross currency interest rate swaps are used by the Group to manage its exposure to risk associated with the variability in cash flows in relation to both recognised assets or liabilities or forecast transactions. All derivative financial instruments are measured at the balance sheet date at their fair value.
Where derivative financial instruments are not designated as or not determined to be effective hedges, any gain or loss on remeasurement is taken to the income statement. Where derivative financial instruments are designated as and are effective as cash flow hedges, any gain or loss on remeasurement is held in equity and recycled through the income statement when the designated item is transacted, unless related to the purchase of a business, when recycled against consideration.
Gains or losses on derivative financial instruments no longer designated as effective hedges are taken directly to the income statement.
Derivatives embedded in non-derivative host contracts are recognised at their fair value when the nature, characteristics and risks of the derivative are not closely related to the host contract. Gains and losses arising on the remeasurement of these embedded derivatives at each balance sheet date are taken to the income statement.
Financial guarantee contract liabilities are measured initially at fair value and subsequently at the amount of the obligation under the contract.
GoodwillGoodwill consists of the excess of the fair value of the consideration over the fair value of the identifiable intangible and tangible assets net of the fair value of the liabilities including contingencies of businesses acquired at the date of acquisition. Acquisition related expenses are charged to the income statement as incurred.
Goodwill in respect of business combinations of subsidiaries is recognised as an intangible asset. Goodwill arising on the acquisition of a joint venture is included in the carrying value of the investment.
Goodwill is not amortised but tested at least annually for impairment. Goodwill is carried at cost less any recognised impairment losses that arise from the annual assessment of its carrying value. To the extent that the carrying value exceeds the recoverable amount, determined as the higher of estimated discounted future net cash flows or recoverable amount on a fair value less cost of disposal basis, goodwill is written down to the recoverable amount and an impairment charge is recognised in the income statement.
Other intangible assetsOther intangible assets are stated at cost less accumulated amortisation and impairment charges.
Computer softwareWhere computer software is not integral to an item of property, plant or equipment its costs are capitalised and categorised as intangible assets. Cost comprises the purchase price plus costs directly incurred in bringing the asset into use. Amortisation is provided on a straight line basis over its useful economic life which is in the range of 3-5 years.
Development costs and participation feesWhere development expenditure results in a new or substantially improved product or process and it is probable that this expenditure will be recovered, it is capitalised. Cost comprises development expenditure and borrowing costs on qualifying assets or fair value on initial recognition when as a result of a business combination. In addition, payments made to engine manufacturers and original equipment manufacturers for participation fees relating to risk and revenue sharing partnerships and long term agreements, are carried forward in intangible assets to the extent that they can be recovered from future sales.
Amortisation is charged from the date the asset is available for use. In Aerospace, amortisation is charged over the asset’s life up to a maximum of 15 years for all programmes other than risk and revenue sharing partnerships where a maximum life of 25 years is assumed, either on a straight line basis or, where sufficient contractual terms exist, a unit of production method is applied. In Automotive, amortisation is charged on a straight line basis over the asset’s life up to a maximum of 7 years.
Capitalised development costs, including participation fees, are subject to annual impairment reviews with any resulting impairments charged to the income statement.
Research expenditure and development expenditure not qualifying for capitalisation is written off as incurred.
Assets acquired on business combinations – non-operating intangible assetsNon-operating intangible assets are intangible assets that are acquired as a result of a business combination, which arise from contractual or other legal rights and are not transferable or separable. On initial recognition they are measured at fair value. Amortisation is charged on a straight line basis to the income statement over their expected useful lives which are:
Years
Marketing related assets – brands and trademarks – agreements not to compete
20-50Life of agreement
Customer related assets – order backlog – other customer contracts and relationships
Length of backlog2-25
Technology based assets 5-25
Notes to the consolidated financial statements continued
For the year ended 31 December 2014
Financial Statements Other InformationGovernanceStrategic Report
119GKN plc Annual Report and Accounts 2014
Inventories Inventories are valued at the lower of cost and estimated net realisable value with due allowance being made for obsolete or slow-moving items. Cost is determined on a first in, first out or weighted average cost basis. Cost includes raw materials, direct labour, other direct costs and the relevant proportion of works overheads assuming normal levels of activity. Net realisable value is the estimated selling price less estimated selling costs and costs to complete.
TaxationCurrent tax and deferred tax are recognised in the income statement unless they relate to items recognised directly in other comprehensive income when the related tax is also recognised in other comprehensive income.
Full provision is made for deferred tax on all temporary differences resulting from the difference between the carrying value of an asset or liability in the consolidated financial statements and its tax base. The amount of deferred tax reflects the expected manner of realisation or settlement of the carrying amount of the assets and liabilities using tax rates enacted or substantively enacted at the balance sheet date.
Deferred tax assets are reviewed at each balance sheet date and are only recognised to the extent that it is probable that they will be recovered against future taxable profits.
Deferred tax is recognised on the unremitted profits of joint ventures. No deferred tax is recognised on the unremitted profits of overseas branches and subsidiaries except to the extent that it is probable that such earnings will be remitted to the parent in the foreseeable future.
Pensions and post-employment benefitsThe Group’s pension arrangements comprise various defined benefit and defined contribution schemes throughout the world. In the UK and in certain overseas companies pension arrangements are made through externally funded defined benefit schemes, the contributions to which are based on the advice of independent actuaries or in accordance with the rules of the schemes. In other overseas companies funds are retained within the business to provide for retirement obligations.
The Group also operates a number of defined contribution and defined benefit arrangements which provide certain employees with defined post-employment healthcare benefits.
The Group accounts for all post-employment defined benefit schemes through recognition of the schemes’ surpluses or deficits on the balance sheet at the end of each year. Remeasurement of defined benefit plans is included in other comprehensive income. Current and past service costs, curtailments and settlements are recognised within operating profit. Interest charges on net defined benefit plans are recognised in other net financing charges.
For defined contribution arrangements the cost charged to the income statement represents the Group’s contributions to the relevant schemes in the year in which they fall due.
Government refundable advancesGovernment refundable advances are reported in Trade and other payables in the balance sheet. Refundable advances include amounts advanced by Government, accrued interest and directly attributable costs. Refundable advances are provided to the Group to part-finance expenditures on specific development programmes. The advances are provided on a risk sharing basis, i.e. repayment levels are determined subject to the success of the related programme. Interest is calculated using the effective interest rate method.
Share-based paymentsShare options granted to employees and share-based arrangements put in place since 7 November 2002 are valued at the date of grant or award using an appropriate option pricing model and are charged to operating profit over the performance or vesting period of the scheme. The annual charge is modified to take account of shares forfeited by employees who leave during the performance or vesting period and, in the case of non-market related performance conditions, where it becomes unlikely the option will vest.
ProvisionsProvisions for onerous or loss making contracts, warranty exposures, environmental matters, restructuring, employee obligations and legal claims are recognised when: the Group has a present legal or constructive obligation as a result of past events; it is probable that an outflow of resources will be required to settle the obligation; and the amount can be reliably estimated. Restructuring provisions comprise lease termination penalties and employee termination payments. Provisions are not recognised for future operating losses.
Provisions are measured at the present value of the expenditures expected to be required to settle the obligation using a pre-tax discount rate that reflects current market assessments of the time value of money and the risks specific to the obligation. Any increase in provisions due to discounting, only recorded where material, is recognised as interest expense within other net financing charges.
Standards, revisions and amendments to standards and interpretations issued but not yet adoptedThe Group does not intend to adopt any standard, revision or amendment before the required implementation date. At the date of authorisation of these financial statements, the following standards which have not been applied in these financial statements were in issue but not yet effective (and in some cases had not yet been adopted by the EU):• IFRS 9 Financial Instruments (effective from 1 January 2018); and• IFRS 15 Revenue from contracts with customers (effective from
1 January 2017).
These standards and other revisions to standards and interpretations which have an implementation date in 2015 or thereafter are still being assessed.

120 GKN plc Annual Report and Accounts 2014
FINANCIAL STATEMENTS
1 Accounting policies and presentation continuedSignificant judgements, key assumptions and estimatesThe Group’s significant accounting policies are set out above. The preparation of financial statements, in conformity with IFRS, requires the use of estimates, subjective judgement and assumptions that may affect the amounts of assets and liabilities at the balance sheet date and reported profit and earnings for the year. The Directors base these estimates, judgements and assumptions on a combination of past experience, professional expert advice and other evidence that is relevant to the particular circumstance.
The accounting policies where the Directors consider the more complex estimates, judgements and assumptions have to be made are those in respect of post-employment obligations (note 24), derivative and other financial instruments (notes 4b and 20), taxation (note 6), provisions (note 21) and impairment of non-current assets (note 11). Details of the principal estimates, judgements and assumptions made are set out in the related notes as identified.
2 Segmental analysisThe Group’s reportable segments have been determined based on reports reviewed by the Executive Committee led by the Chief Executive. The operating activities of the Group are largely structured according to the markets served; aerospace, automotive and the land systems markets. Automotive is managed according to product groups; driveline and powder metallurgy. Reportable segments derive their sales from the manufacture of products and sale of service. Revenue from inter segment trading and royalties is not significant.
(a) Sales
Automotive
Aerospace £m
Driveline £m
Powder Metallurgy
£m
Land Systems
£m Total
£m
2014Subsidiaries 2,226 3,050 916 752 Joint ventures – 394 – 24
2,226 3,444 916 776 7,362
Other businesses 94
Management sales 7,456 Less: Joint venture sales (474)
Income statement – sales 6,982
2013Subsidiaries 2,243 3,062 932 870 Joint ventures – 354 – 29
2,243 3,416 932 899 7,490
Other businesses 104
Management sales 7,594 Less: Joint venture sales (458)
Income statement – sales 7,136
Subsidiary sales comprise £6,694 million (2013: £6,861 million) from the manufacture of product and £288 million (2013: £275 million) from the sale of service.
Notes to the consolidated financial statements continued
For the year ended 31 December 2014
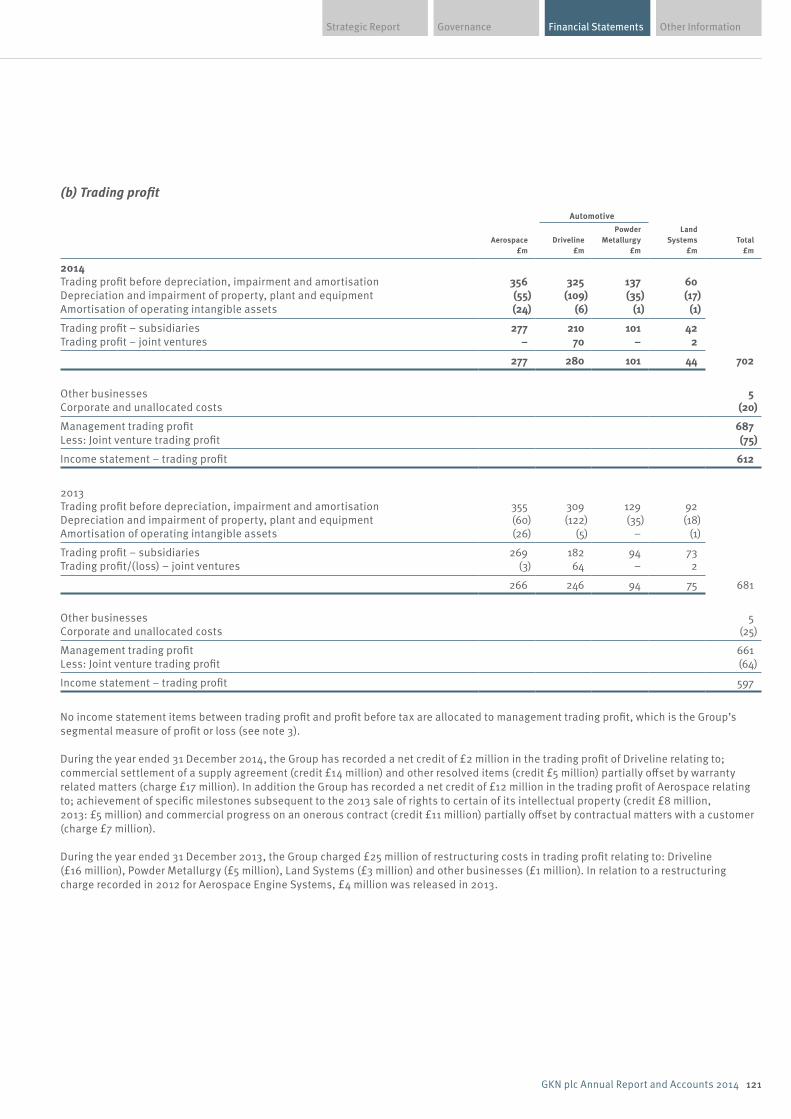
Financial Statements Other InformationGovernanceStrategic Report
121GKN plc Annual Report and Accounts 2014
(b) Trading profit
Automotive
Aerospace
£m Driveline
£m
Powder Metallurgy
£m
Land Systems
£m Total
£m
2014Trading profit before depreciation, impairment and amortisation 356 325 137 60Depreciation and impairment of property, plant and equipment (55) (109) (35) (17)Amortisation of operating intangible assets (24) (6) (1) (1)
Trading profit – subsidiaries 277 210 101 42 Trading profit – joint ventures – 70 – 2
277 280 101 44 702
Other businesses 5 Corporate and unallocated costs (20)
Management trading profit 687 Less: Joint venture trading profit (75)
Income statement – trading profit 612
2013Trading profit before depreciation, impairment and amortisation 355 309 129 92Depreciation and impairment of property, plant and equipment (60) (122) (35) (18)Amortisation of operating intangible assets (26) (5) – (1)
Trading profit – subsidiaries 269 182 94 73Trading profit/(loss) – joint ventures (3) 64 – 2
266 246 94 75 681
Other businesses 5 Corporate and unallocated costs (25)
Management trading profit 661 Less: Joint venture trading profit (64)
Income statement – trading profit 597
No income statement items between trading profit and profit before tax are allocated to management trading profit, which is the Group’s segmental measure of profit or loss (see note 3).
During the year ended 31 December 2014, the Group has recorded a net credit of £2 million in the trading profit of Driveline relating to; commercial settlement of a supply agreement (credit £14 million) and other resolved items (credit £5 million) partially offset by warranty related matters (charge £17 million). In addition the Group has recorded a net credit of £12 million in the trading profit of Aerospace relating to; achievement of specific milestones subsequent to the 2013 sale of rights to certain of its intellectual property (credit £8 million, 2013: £5 million) and commercial progress on an onerous contract (credit £11 million) partially offset by contractual matters with a customer (charge £7 million).
During the year ended 31 December 2013, the Group charged £25 million of restructuring costs in trading profit relating to: Driveline (£16 million), Powder Metallurgy (£5 million), Land Systems (£3 million) and other businesses (£1 million). In relation to a restructuring charge recorded in 2012 for Aerospace Engine Systems, £4 million was released in 2013.
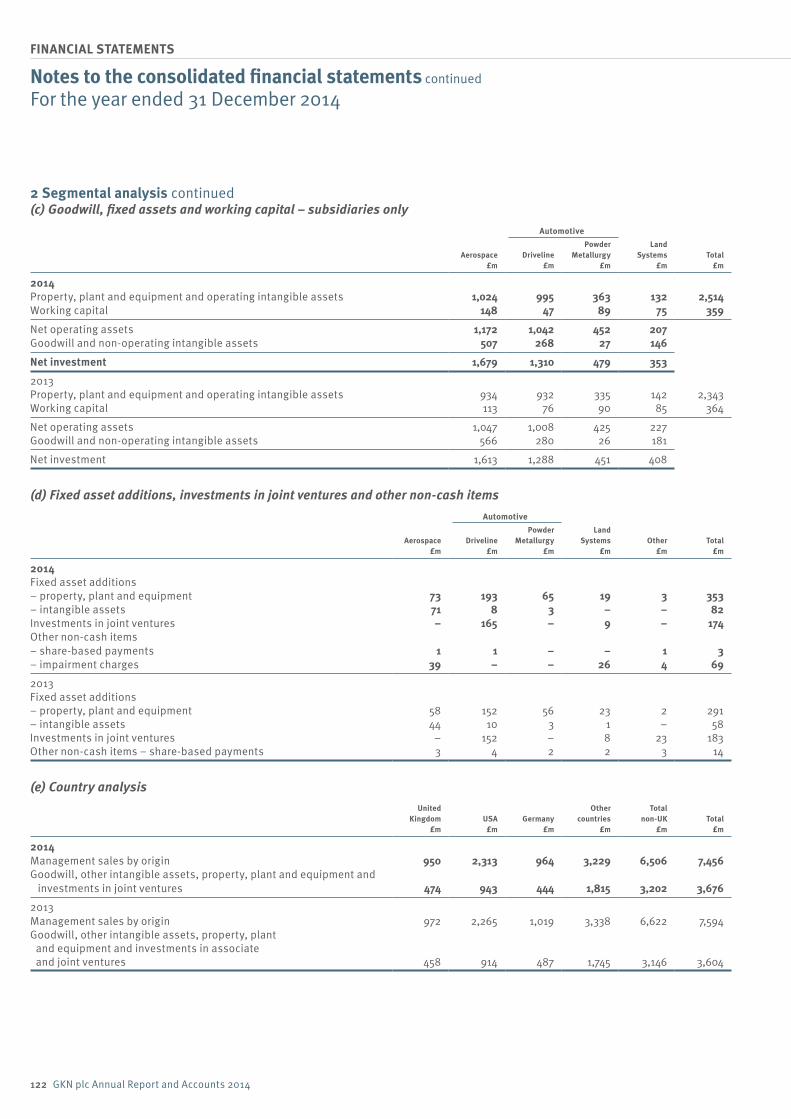
122 GKN plc Annual Report and Accounts 2014
FINANCIAL STATEMENTS
2 Segmental analysis continued(c) Goodwill, fixed assets and working capital – subsidiaries only
Automotive
Aerospace £m
Driveline £m
Powder Metallurgy
£m
Land Systems
£m Total
£m
2014Property, plant and equipment and operating intangible assets 1,024 995 363 132 2,514 Working capital 148 47 89 75 359
Net operating assets 1,172 1,042 452 207 Goodwill and non-operating intangible assets 507 268 27 146
Net investment 1,679 1,310 479 353
2013Property, plant and equipment and operating intangible assets 934 932 335 142 2,343 Working capital 113 76 90 85 364
Net operating assets 1,047 1,008 425 227 Goodwill and non-operating intangible assets 566 280 26 181
Net investment 1,613 1,288 451 408
(d) Fixed asset additions, investments in joint ventures and other non-cash itemsAutomotive
Aerospace £m
Driveline £m
Powder Metallurgy
£m
Land Systems
£m Other
£m Total
£m
2014Fixed asset additions – property, plant and equipment 73 193 65 19 3 353 – intangible assets 71 8 3 – – 82 Investments in joint ventures – 165 – 9 – 174 Other non-cash items – share-based payments 1 1 – – 1 3 – impairment charges 39 – – 26 4 69
2013Fixed asset additions – property, plant and equipment 58 152 56 23 2 291 – intangible assets 44 10 3 1 – 58 Investments in joint ventures – 152 – 8 23 183 Other non-cash items – share-based payments 3 4 2 2 3 14
(e) Country analysisUnited
Kingdom £m
USA £m
Germany £m
Other countries
£m
Total non-UK
£m Total
£m
2014Management sales by origin 950 2,313 964 3,229 6,506 7,456 Goodwill, other intangible assets, property, plant and equipment and
investments in joint ventures 474 943 444 1,815 3,202 3,676
2013Management sales by origin 972 2,265 1,019 3,338 6,622 7,594 Goodwill, other intangible assets, property, plant and equipment and investments in associate and joint ventures 458 914 487 1,745 3,146 3,604
Notes to the consolidated financial statements continued
For the year ended 31 December 2014
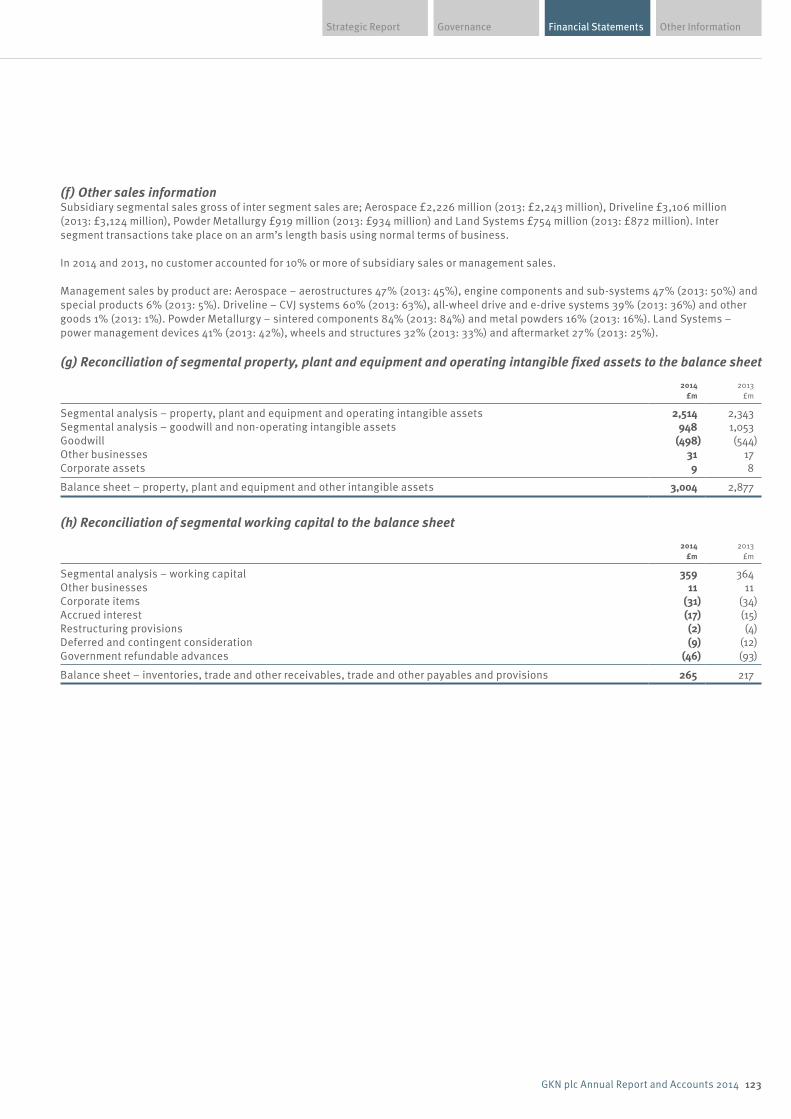
Financial Statements Other InformationGovernanceStrategic Report
123GKN plc Annual Report and Accounts 2014
(f) Other sales informationSubsidiary segmental sales gross of inter segment sales are; Aerospace £2,226 million (2013: £2,243 million), Driveline £3,106 million (2013: £3,124 million), Powder Metallurgy £919 million (2013: £934 million) and Land Systems £754 million (2013: £872 million). Inter segment transactions take place on an arm’s length basis using normal terms of business.
In 2014 and 2013, no customer accounted for 10% or more of subsidiary sales or management sales.
Management sales by product are: Aerospace – aerostructures 47% (2013: 45%), engine components and sub-systems 47% (2013: 50%) and special products 6% (2013: 5%). Driveline – CVJ systems 60% (2013: 63%), all-wheel drive and e-drive systems 39% (2013: 36%) and other goods 1% (2013: 1%). Powder Metallurgy – sintered components 84% (2013: 84%) and metal powders 16% (2013: 16%). Land Systems – power management devices 41% (2013: 42%), wheels and structures 32% (2013: 33%) and aftermarket 27% (2013: 25%).
(g) Reconciliation of segmental property, plant and equipment and operating intangible fixed assets to the balance sheet
2014 £m
2013 £m
Segmental analysis – property, plant and equipment and operating intangible assets 2,514 2,343 Segmental analysis – goodwill and non-operating intangible assets 948 1,053 Goodwill (498) (544)Other businesses 31 17 Corporate assets 9 8
Balance sheet – property, plant and equipment and other intangible assets 3,004 2,877
(h) Reconciliation of segmental working capital to the balance sheet
2014 £m
2013 £m
Segmental analysis – working capital 359 364 Other businesses 11 11 Corporate items (31) (34)Accrued interest (17) (15)Restructuring provisions (2) (4)Deferred and contingent consideration (9) (12)Government refundable advances (46) (93)
Balance sheet – inventories, trade and other receivables, trade and other payables and provisions 265 217

124 GKN plc Annual Report and Accounts 2014
FINANCIAL STATEMENTS
3 Adjusted performance measures(a) Reconciliation of reported and management performance measures
2014
As reported
£m
Joint ventures
£m
Exceptional and non-
trading items£m
Management basis
£m
Sales 6,982 474 – 7,456
Trading profit 612 75 – 687 Change in value of derivative and other financial instruments (209) – 209 –Amortisation of non-operating intangible assets arising on business combinations (69) – 69 –Gains and losses on changes in Group structure 24 – (24) –Impairment charges (69) – 69 –
Operating profit 289 75 323 687
Share of post-tax earnings of joint ventures 61 (75) 1 (13)
Interest payable (75) – – (75)Interest receivable 2 – – 2 Other net financing charges (56) – 56 –
Net financing costs (129) – 56 (73)
Profit before taxation 221 – 380 601
Taxation (47) – (74) (121)
Profit after tax for the year 174 – 306 480 Profit attributable to non-controlling interests (5) – – (5)
Profit attributable to owners of the parent 169 – 306 475
Earnings per share – pence 10.3 – 18.7 29.0
2013
As reported
£m
Joint ventures
£m
Exceptional and non-
trading items£m
Management basis
£m
Sales 7,136 458 – 7,594
Trading profit 597 64 – 661 Change in value of derivative and other financial instruments 26 – (26) –Amortisation of non-operating intangible assets arising on business combinations (75) – 75 –Gains and losses on changes in Group structure 12 – (12) –
Operating profit 560 64 37 661
Share of post-tax earnings of joint ventures 52 (64) 2 (10)
Interest payable (76) – – (76)Interest receivable 3 – – 3 Other net financing charges (55) – 55 –
Net financing costs (128) – 55 (73)
Profit before taxation 484 – 94 578
Taxation (77) – (28) (105)
Profit after tax for the year 407 – 66 473 Profit attributable to non-controlling interests (12) – 8 (4)
Profit attributable to owners of the parent 395 – 74 469
Earnings per share – pence 24.2 – 4.5 28.7
Basic and management earnings per share use a weighted average number of shares of 1,640.6 million (2013: 1,634.7 million). Also see note 7.
Notes to the consolidated financial statements continued
For the year ended 31 December 2014
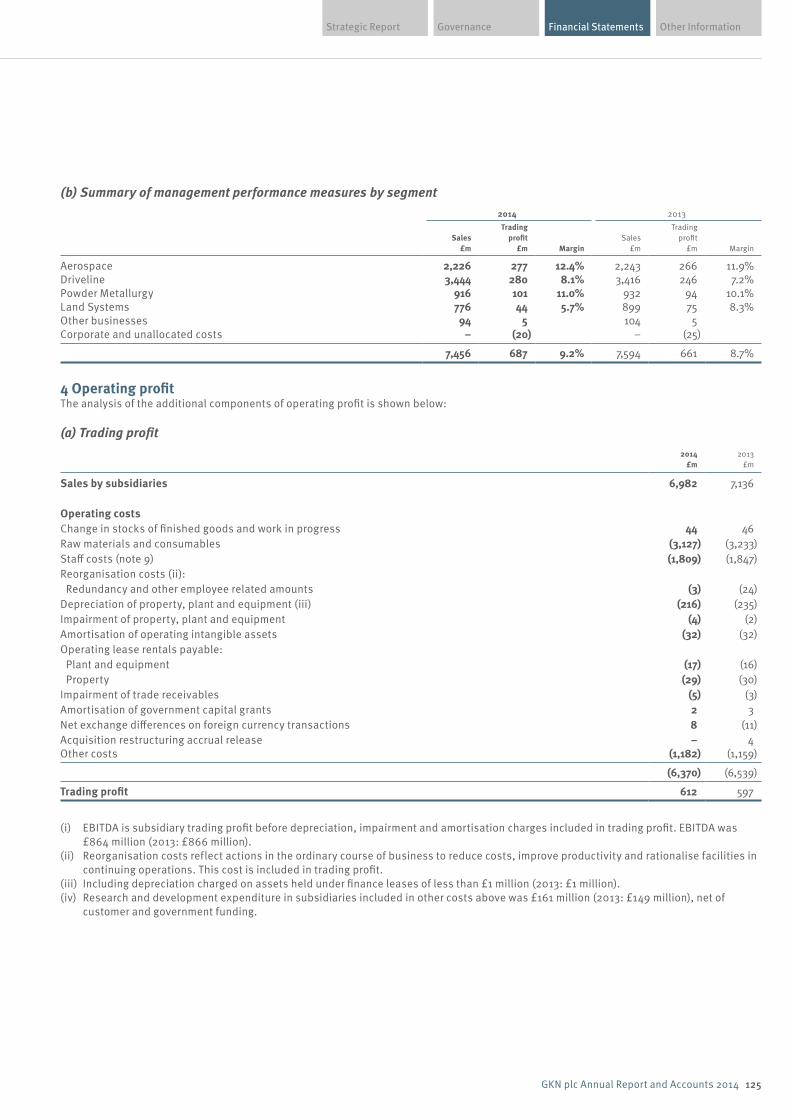
Financial Statements Other InformationGovernanceStrategic Report
125GKN plc Annual Report and Accounts 2014
(b) Summary of management performance measures by segment2014 2013
Sales £m
Trading profit
£m Margin Sales
£m
Trading profit
£m Margin
Aerospace 2,226 277 12.4% 2,243 266 11.9% Driveline 3,444 280 8.1% 3,416 246 7.2% Powder Metallurgy 916 101 11.0% 932 94 10.1% Land Systems 776 44 5.7% 899 75 8.3% Other businesses 94 5 104 5 Corporate and unallocated costs – (20) – (25)
7,456 687 9.2% 7,594 661 8.7%
4 Operating profitThe analysis of the additional components of operating profit is shown below:
(a) Trading profit2014
£m 2013
£m
Sales by subsidiaries 6,982 7,136
Operating costs Change in stocks of finished goods and work in progress 44 46 Raw materials and consumables (3,127) (3,233)Staff costs (note 9) (1,809) (1,847)Reorganisation costs (ii): Redundancy and other employee related amounts (3) (24)Depreciation of property, plant and equipment (iii) (216) (235)Impairment of property, plant and equipment (4) (2)Amortisation of operating intangible assets (32) (32)Operating lease rentals payable: Plant and equipment (17) (16) Property (29) (30)Impairment of trade receivables (5) (3)Amortisation of government capital grants 2 3 Net exchange differences on foreign currency transactions 8 (11)Acquisition restructuring accrual release – 4 Other costs (1,182) (1,159)
(6,370) (6,539)
Trading profit 612 597
(i) EBITDA is subsidiary trading profit before depreciation, impairment and amortisation charges included in trading profit. EBITDA was £864 million (2013: £866 million).
(ii) Reorganisation costs reflect actions in the ordinary course of business to reduce costs, improve productivity and rationalise facilities in continuing operations. This cost is included in trading profit.
(iii) Including depreciation charged on assets held under finance leases of less than £1 million (2013: £1 million).(iv) Research and development expenditure in subsidiaries included in other costs above was £161 million (2013: £149 million), net of
customer and government funding.
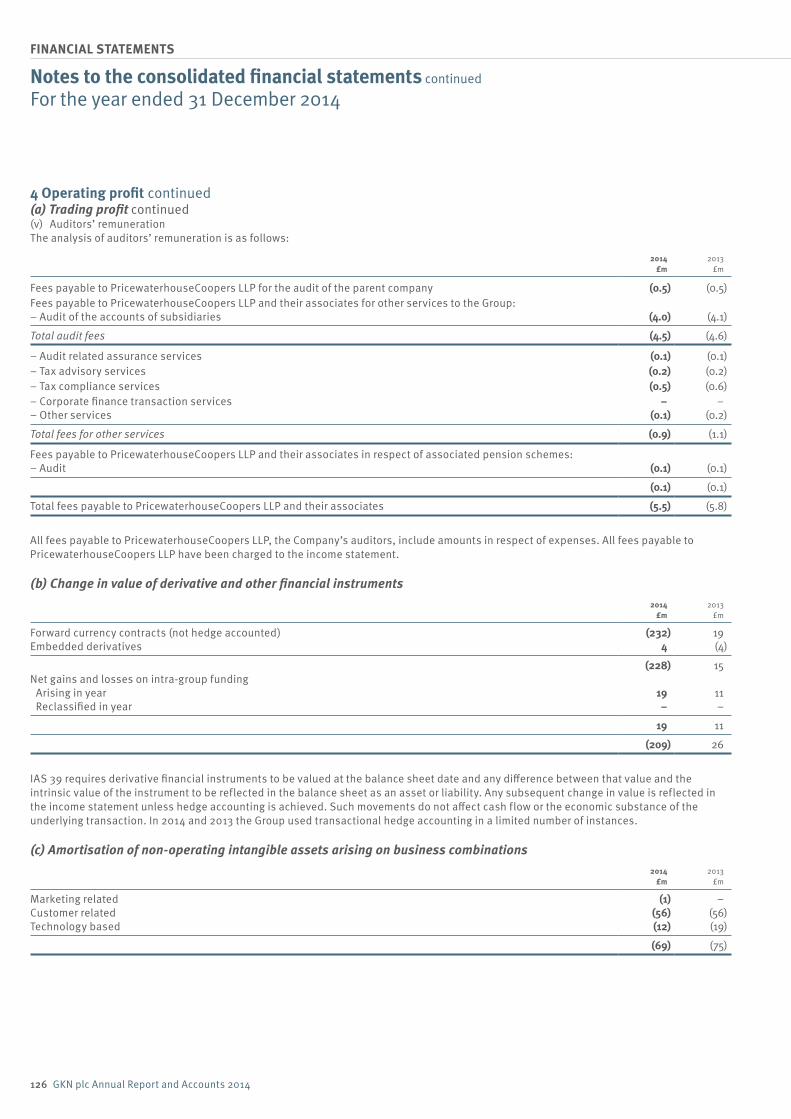
126 GKN plc Annual Report and Accounts 2014
FINANCIAL STATEMENTS
4 Operating profit continued(a) Trading profit continued(v) Auditors’ remunerationThe analysis of auditors’ remuneration is as follows:
2014 £m
2013 £m
Fees payable to PricewaterhouseCoopers LLP for the audit of the parent company (0.5) (0.5)Fees payable to PricewaterhouseCoopers LLP and their associates for other services to the Group:– Audit of the accounts of subsidiaries (4.0) (4.1)
Total audit fees (4.5) (4.6)
– Audit related assurance services (0.1) (0.1)– Tax advisory services (0.2) (0.2)– Tax compliance services (0.5) (0.6)– Corporate finance transaction services – –– Other services (0.1) (0.2)
Total fees for other services (0.9) (1.1)
Fees payable to PricewaterhouseCoopers LLP and their associates in respect of associated pension schemes:– Audit (0.1) (0.1)
(0.1) (0.1)
Total fees payable to PricewaterhouseCoopers LLP and their associates (5.5) (5.8)
All fees payable to PricewaterhouseCoopers LLP, the Company’s auditors, include amounts in respect of expenses. All fees payable to PricewaterhouseCoopers LLP have been charged to the income statement.
(b) Change in value of derivative and other financial instruments2014
£m 2013
£m
Forward currency contracts (not hedge accounted) (232) 19 Embedded derivatives 4 (4)
(228) 15 Net gains and losses on intra-group funding Arising in year 19 11 Reclassified in year – –
19 11
(209) 26
IAS 39 requires derivative financial instruments to be valued at the balance sheet date and any difference between that value and the intrinsic value of the instrument to be reflected in the balance sheet as an asset or liability. Any subsequent change in value is reflected in the income statement unless hedge accounting is achieved. Such movements do not affect cash flow or the economic substance of the underlying transaction. In 2014 and 2013 the Group used transactional hedge accounting in a limited number of instances.
(c) Amortisation of non-operating intangible assets arising on business combinations2014
£m 2013
£m
Marketing related (1) –Customer related (56) (56)Technology based (12) (19)
(69) (75)
Notes to the consolidated financial statements continued
For the year ended 31 December 2014
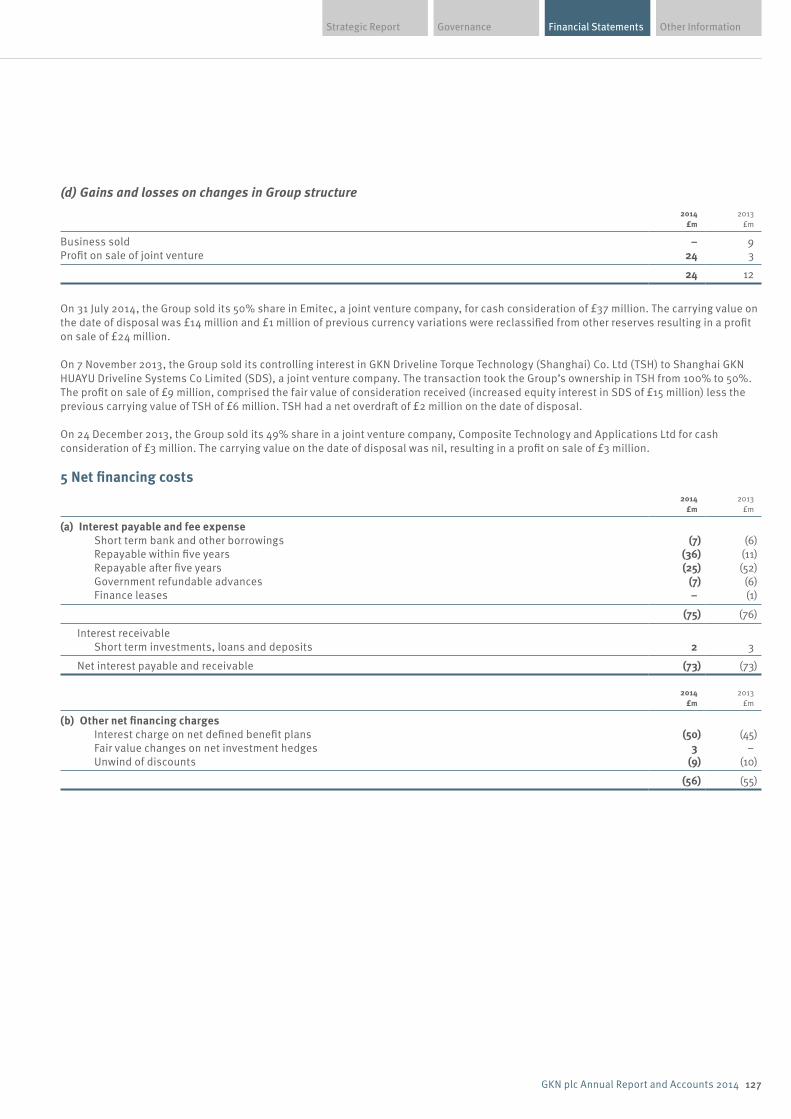
Financial Statements Other InformationGovernanceStrategic Report
127GKN plc Annual Report and Accounts 2014
(d) Gains and losses on changes in Group structure2014
£m 2013
£m
Business sold – 9 Profit on sale of joint venture 24 3
24 12
On 31 July 2014, the Group sold its 50% share in Emitec, a joint venture company, for cash consideration of £37 million. The carrying value on the date of disposal was £14 million and £1 million of previous currency variations were reclassified from other reserves resulting in a profit on sale of £24 million.
On 7 November 2013, the Group sold its controlling interest in GKN Driveline Torque Technology (Shanghai) Co. Ltd (TSH) to Shanghai GKN HUAYU Driveline Systems Co Limited (SDS), a joint venture company. The transaction took the Group’s ownership in TSH from 100% to 50%. The profit on sale of £9 million, comprised the fair value of consideration received (increased equity interest in SDS of £15 million) less the previous carrying value of TSH of £6 million. TSH had a net overdraft of £2 million on the date of disposal.
On 24 December 2013, the Group sold its 49% share in a joint venture company, Composite Technology and Applications Ltd for cash consideration of £3 million. The carrying value on the date of disposal was nil, resulting in a profit on sale of £3 million.
5 Net financing costs2014
£m 2013
£m
(a) Interest payable and fee expense Short term bank and other borrowings (7) (6) Repayable within five years (36) (11) Repayable after five years (25) (52) Government refundable advances (7) (6) Finance leases – (1)
(75) (76)
Interest receivable Short term investments, loans and deposits 2 3
Net interest payable and receivable (73) (73)
2014 £m
2013 £m
(b) Other net financing charges Interest charge on net defined benefit plans (50) (45) Fair value changes on net investment hedges 3 – Unwind of discounts (9) (10)
(56) (55)
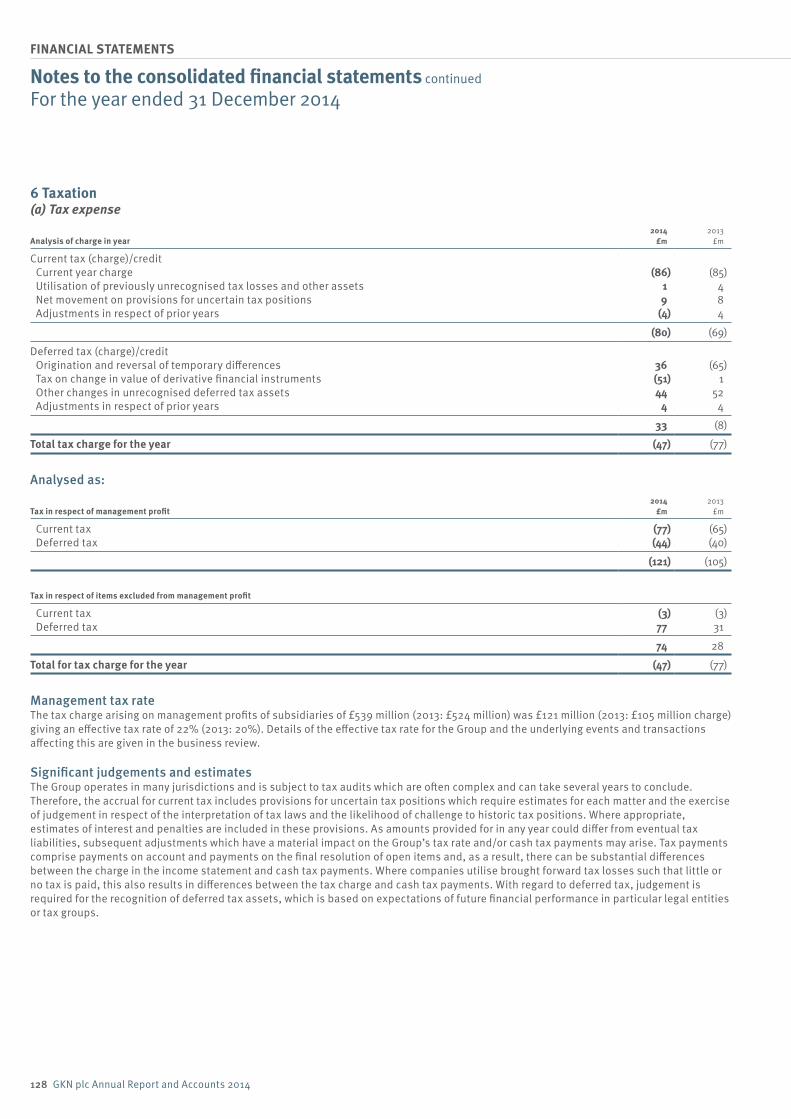
128 GKN plc Annual Report and Accounts 2014
FINANCIAL STATEMENTS
6 Taxation(a) Tax expense
Analysis of charge in year2014
£m 2013
£m
Current tax (charge)/credit Current year charge (86) (85) Utilisation of previously unrecognised tax losses and other assets 1 4 Net movement on provisions for uncertain tax positions 9 8 Adjustments in respect of prior years (4) 4
(80) (69)
Deferred tax (charge)/credit Origination and reversal of temporary differences 36 (65) Tax on change in value of derivative financial instruments (51) 1 Other changes in unrecognised deferred tax assets 44 52 Adjustments in respect of prior years 4 4
33 (8)
Total tax charge for the year (47) (77)
Analysed as:
Tax in respect of management profit2014
£m 2013
£m
Current tax (77) (65) Deferred tax (44) (40)
(121) (105)
Tax in respect of items excluded from management profit
Current tax (3) (3) Deferred tax 77 31
74 28
Total for tax charge for the year (47) (77)
Management tax rateThe tax charge arising on management profits of subsidiaries of £539 million (2013: £524 million) was £121 million (2013: £105 million charge) giving an effective tax rate of 22% (2013: 20%). Details of the effective tax rate for the Group and the underlying events and transactions affecting this are given in the business review.
Significant judgements and estimatesThe Group operates in many jurisdictions and is subject to tax audits which are often complex and can take several years to conclude. Therefore, the accrual for current tax includes provisions for uncertain tax positions which require estimates for each matter and the exercise of judgement in respect of the interpretation of tax laws and the likelihood of challenge to historic tax positions. Where appropriate, estimates of interest and penalties are included in these provisions. As amounts provided for in any year could differ from eventual tax liabilities, subsequent adjustments which have a material impact on the Group’s tax rate and/or cash tax payments may arise. Tax payments comprise payments on account and payments on the final resolution of open items and, as a result, there can be substantial differences between the charge in the income statement and cash tax payments. Where companies utilise brought forward tax losses such that little or no tax is paid, this also results in differences between the tax charge and cash tax payments. With regard to deferred tax, judgement is required for the recognition of deferred tax assets, which is based on expectations of future financial performance in particular legal entities or tax groups.
Notes to the consolidated financial statements continued
For the year ended 31 December 2014
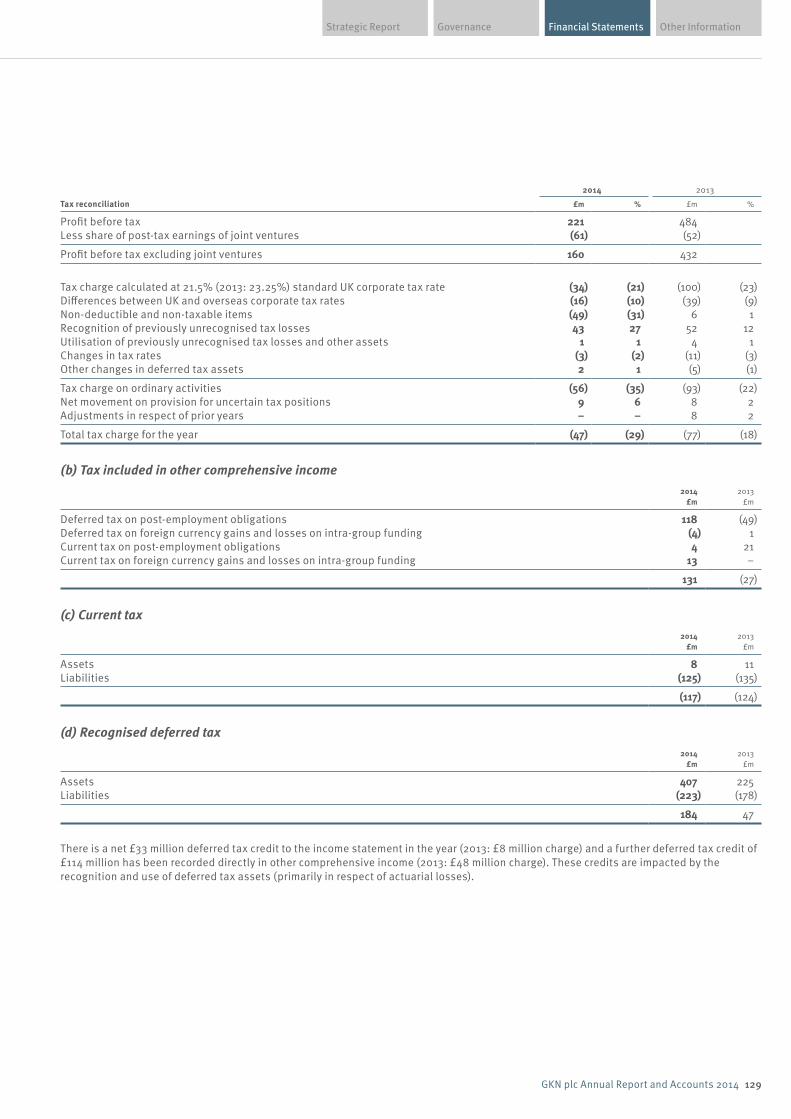
Financial Statements Other InformationGovernanceStrategic Report
129GKN plc Annual Report and Accounts 2014
Tax reconciliation
2014 2013
£m % £m %
Profit before tax 221 484 Less share of post-tax earnings of joint ventures (61) (52)
Profit before tax excluding joint ventures 160 432
Tax charge calculated at 21.5% (2013: 23.25%) standard UK corporate tax rate (34) (21) (100) (23)Differences between UK and overseas corporate tax rates (16) (10) (39) (9)Non-deductible and non-taxable items (49) (31) 6 1 Recognition of previously unrecognised tax losses 43 27 52 12 Utilisation of previously unrecognised tax losses and other assets 1 1 4 1 Changes in tax rates (3) (2) (11) (3)Other changes in deferred tax assets 2 1 (5) (1)
Tax charge on ordinary activities (56) (35) (93) (22)Net movement on provision for uncertain tax positions 9 6 8 2 Adjustments in respect of prior years – – 8 2
Total tax charge for the year (47) (29) (77) (18)
(b) Tax included in other comprehensive income2014
£m 2013
£m
Deferred tax on post-employment obligations 118 (49)Deferred tax on foreign currency gains and losses on intra-group funding (4) 1 Current tax on post-employment obligations 4 21 Current tax on foreign currency gains and losses on intra-group funding 13 –
131 (27)
(c) Current tax2014
£m 2013
£m
Assets 8 11Liabilities (125) (135)
(117) (124)
(d) Recognised deferred tax2014
£m 2013
£m
Assets 407 225 Liabilities (223) (178)
184 47
There is a net £33 million deferred tax credit to the income statement in the year (2013: £8 million charge) and a further deferred tax credit of £114 million has been recorded directly in other comprehensive income (2013: £48 million charge). These credits are impacted by the recognition and use of deferred tax assets (primarily in respect of actuarial losses).
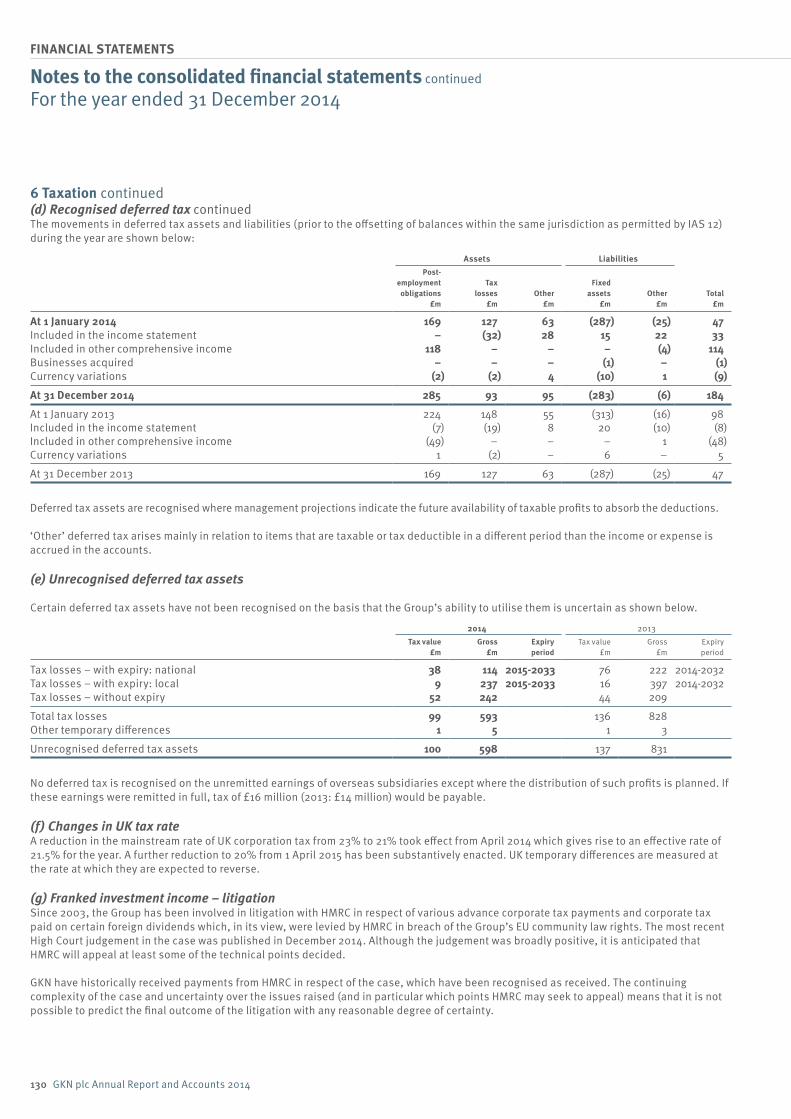
130 GKN plc Annual Report and Accounts 2014
FINANCIAL STATEMENTS
6 Taxation continued(d) Recognised deferred tax continuedThe movements in deferred tax assets and liabilities (prior to the offsetting of balances within the same jurisdiction as permitted by IAS 12) during the year are shown below:
Assets LiabilitiesPost-
employmentobligations
£m
Taxlosses
£m Other
£m
Fixed assets
£m Other
£m Total
£m
At 1 January 2014 169 127 63 (287) (25) 47 Included in the income statement – (32) 28 15 22 33 Included in other comprehensive income 118 – – – (4) 114 Businesses acquired – – – (1) – (1)Currency variations (2) (2) 4 (10) 1 (9)
At 31 December 2014 285 93 95 (283) (6) 184
At 1 January 2013 224 148 55 (313) (16) 98 Included in the income statement (7) (19) 8 20 (10) (8)Included in other comprehensive income (49) – – – 1 (48)Currency variations 1 (2) – 6 – 5
At 31 December 2013 169 127 63 (287) (25) 47
Deferred tax assets are recognised where management projections indicate the future availability of taxable profits to absorb the deductions.
‘Other’ deferred tax arises mainly in relation to items that are taxable or tax deductible in a different period than the income or expense is accrued in the accounts.
(e) Unrecognised deferred tax assets
Certain deferred tax assets have not been recognised on the basis that the Group’s ability to utilise them is uncertain as shown below.
2014 2013Tax value
£m Gross
£m Expiry period
Tax value£m
Gross £m
Expiry period
Tax losses – with expiry: national 38 114 2015-2033 76 222 2014-2032Tax losses – with expiry: local 9 237 2015-2033 16 397 2014-2032Tax losses – without expiry 52 242 44 209
Total tax losses 99 593 136 828 Other temporary differences 1 5 1 3
Unrecognised deferred tax assets 100 598 137 831
No deferred tax is recognised on the unremitted earnings of overseas subsidiaries except where the distribution of such profits is planned. If these earnings were remitted in full, tax of £16 million (2013: £14 million) would be payable.
(f) Changes in UK tax rateA reduction in the mainstream rate of UK corporation tax from 23% to 21% took effect from April 2014 which gives rise to an effective rate of 21.5% for the year. A further reduction to 20% from 1 April 2015 has been substantively enacted. UK temporary differences are measured at the rate at which they are expected to reverse.
(g) Franked investment income – litigationSince 2003, the Group has been involved in litigation with HMRC in respect of various advance corporate tax payments and corporate tax paid on certain foreign dividends which, in its view, were levied by HMRC in breach of the Group’s EU community law rights. The most recent High Court judgement in the case was published in December 2014. Although the judgement was broadly positive, it is anticipated that HMRC will appeal at least some of the technical points decided.
GKN have historically received payments from HMRC in respect of the case, which have been recognised as received. The continuing complexity of the case and uncertainty over the issues raised (and in particular which points HMRC may seek to appeal) means that it is not possible to predict the final outcome of the litigation with any reasonable degree of certainty.
Notes to the consolidated financial statements continued
For the year ended 31 December 2014
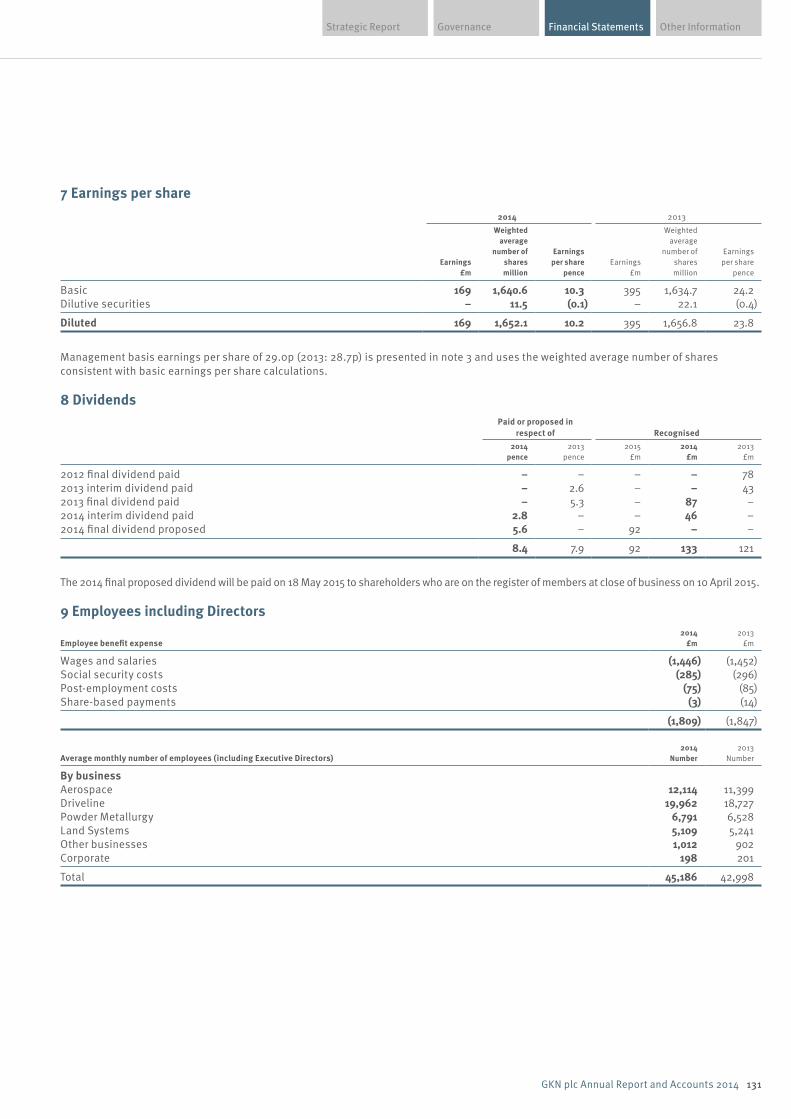
Financial Statements Other InformationGovernanceStrategic Report
131GKN plc Annual Report and Accounts 2014
7 Earnings per share2014 2013
Earnings £m
Weighted average
number of shares million
Earningsper share
pence Earnings
£m
Weightedaverage
number of shares million
Earningsper share
pence
Basic 169 1,640.6 10.3 395 1,634.7 24.2 Dilutive securities – 11.5 (0.1) – 22.1 (0.4)
Diluted 169 1,652.1 10.2 395 1,656.8 23.8
Management basis earnings per share of 29.0p (2013: 28.7p) is presented in note 3 and uses the weighted average number of shares consistent with basic earnings per share calculations.
8 DividendsPaid or proposed in
respect of Recognised2014
pence 2013
pence 2015
£m 2014
£m 2013
£m
2012 final dividend paid – – – – 78 2013 interim dividend paid – 2.6 – – 43 2013 final dividend paid – 5.3 – 87 –2014 interim dividend paid 2.8 – – 46 –2014 final dividend proposed 5.6 – 92 – –
8.4 7.9 92 133 121
The 2014 final proposed dividend will be paid on 18 May 2015 to shareholders who are on the register of members at close of business on 10 April 2015.
9 Employees including Directors
Employee benefit expense 2014
£m 2013
£m
Wages and salaries (1,446) (1,452)Social security costs (285) (296)Post-employment costs (75) (85)Share-based payments (3) (14)
(1,809) (1,847)
Average monthly number of employees (including Executive Directors)2014
Number 2013
Number
By business Aerospace 12,114 11,399 Driveline 19,962 18,727 Powder Metallurgy 6,791 6,528 Land Systems 5,109 5,241 Other businesses 1,012 902 Corporate 198 201
Total 45,186 42,998
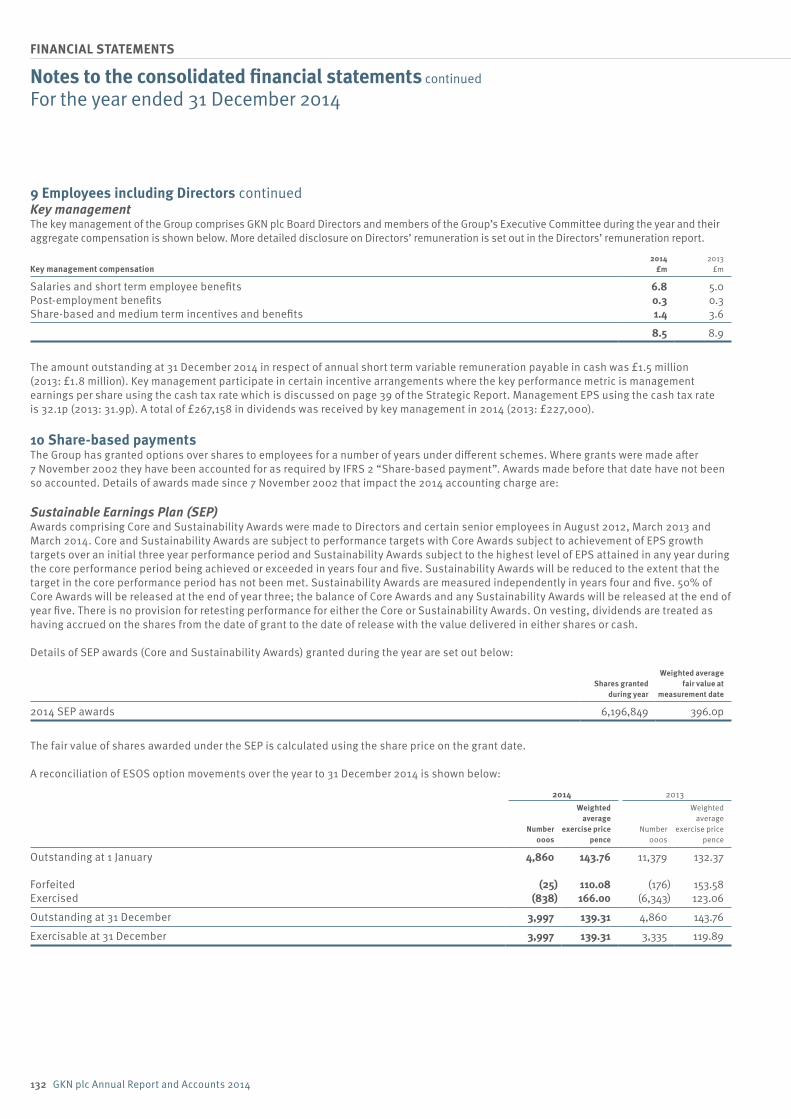
132 GKN plc Annual Report and Accounts 2014
FINANCIAL STATEMENTS
9 Employees including Directors continuedKey managementThe key management of the Group comprises GKN plc Board Directors and members of the Group’s Executive Committee during the year and their aggregate compensation is shown below. More detailed disclosure on Directors’ remuneration is set out in the Directors’ remuneration report.
Key management compensation2014
£m 2013
£m
Salaries and short term employee benefits 6.8 5.0 Post-employment benefits 0.3 0.3 Share-based and medium term incentives and benefits 1.4 3.6
8.5 8.9
The amount outstanding at 31 December 2014 in respect of annual short term variable remuneration payable in cash was £1.5 million (2013: £1.8 million). Key management participate in certain incentive arrangements where the key performance metric is management earnings per share using the cash tax rate which is discussed on page 39 of the Strategic Report. Management EPS using the cash tax rate is 32.1p (2013: 31.9p). A total of £267,158 in dividends was received by key management in 2014 (2013: £227,000).
10 Share-based payments The Group has granted options over shares to employees for a number of years under different schemes. Where grants were made after 7 November 2002 they have been accounted for as required by IFRS 2 “Share-based payment”. Awards made before that date have not been so accounted. Details of awards made since 7 November 2002 that impact the 2014 accounting charge are:
Sustainable Earnings Plan (SEP)Awards comprising Core and Sustainability Awards were made to Directors and certain senior employees in August 2012, March 2013 and March 2014. Core and Sustainability Awards are subject to performance targets with Core Awards subject to achievement of EPS growth targets over an initial three year performance period and Sustainability Awards subject to the highest level of EPS attained in any year during the core performance period being achieved or exceeded in years four and five. Sustainability Awards will be reduced to the extent that the target in the core performance period has not been met. Sustainability Awards are measured independently in years four and five. 50% of Core Awards will be released at the end of year three; the balance of Core Awards and any Sustainability Awards will be released at the end of year five. There is no provision for retesting performance for either the Core or Sustainability Awards. On vesting, dividends are treated as having accrued on the shares from the date of grant to the date of release with the value delivered in either shares or cash.
Details of SEP awards (Core and Sustainability Awards) granted during the year are set out below:
Shares granted during year
Weighted average fair value at
measurement date
2014 SEP awards 6,196,849 396.0p
The fair value of shares awarded under the SEP is calculated using the share price on the grant date.
A reconciliation of ESOS option movements over the year to 31 December 2014 is shown below:
2014 2013
Number 000s
Weighted average
exercise price pence
Number 000s
Weighted average
exercise pricepence
Outstanding at 1 January 4,860 143.76 11,379 132.37
Forfeited (25) 110.08 (176) 153.58 Exercised (838) 166.00 (6,343) 123.06
Outstanding at 31 December 3,997 139.31 4,860 143.76
Exercisable at 31 December 3,997 139.31 3,335 119.89
Notes to the consolidated financial statements continued
For the year ended 31 December 2014

Financial Statements Other InformationGovernanceStrategic Report
133GKN plc Annual Report and Accounts 2014
For options outstanding at 31 December the range of exercise prices and weighted average contractual life is shown in the following table:
2014 2013
Range of exercise price
Numberof shares
000s
Contractual weighted
average remaining
lifeyears
Number of shares
000s
Contractual weighted
average remaining
life years
110p-145p 3,054 4.92 3,429 5.92 195p-220p 943 6.25 1,431 7.25
The weighted average share price during the year for options exercised over the year was 373.8p (2013: 308.9p). The total charge for the year relating to share-based payment plans was £3 million (2013: £14 million) all of which related to equity-settled share-based payment transactions. After deferred tax, the total charge was £3 million (2013: £14 million).
Liabilities in respect of share-based payments were not material at either 31 December 2014 or 31 December 2013. There were no vested rights to cash or other assets at either 31 December 2014 or 31 December 2013.
11 Goodwill and other intangible assets(a) Goodwill
2014 £m
2013 £m
Cost At 1 January 698 720 Businesses acquired 2 – Currency variations 14 (22)
At 31 December 714 698
Accumulated impairmentAt 1 January 154 168 Charge for the year 57 – Currency variations 5 (14)
At 31 December 216 154
Net book amount at 31 December 498 544
The carrying value of goodwill at 31 December comprised:
Reportable segment Business Geographical location2014
£m 2013
£m
Driveline Driveline Americas 118 113 Driveline Europe 56 63
Powder Metallurgy Hoeganaes North America 22 21 Aerospace Aerostructures North America 32 30
Engine Systems North America & Europe 39 37 Engine Products – West North America 97 92 Engine Products – East North America 5 36
Land Systems Power Management Devices Europe 67 72 Wheels and Structures Europe – 20
436 484 Other businesses not individually significant to the carrying value of goodwill 62 60
498 544
Impairment charges have been recorded in the Income Statement as an exceptional item within the line item “impairment charges”.
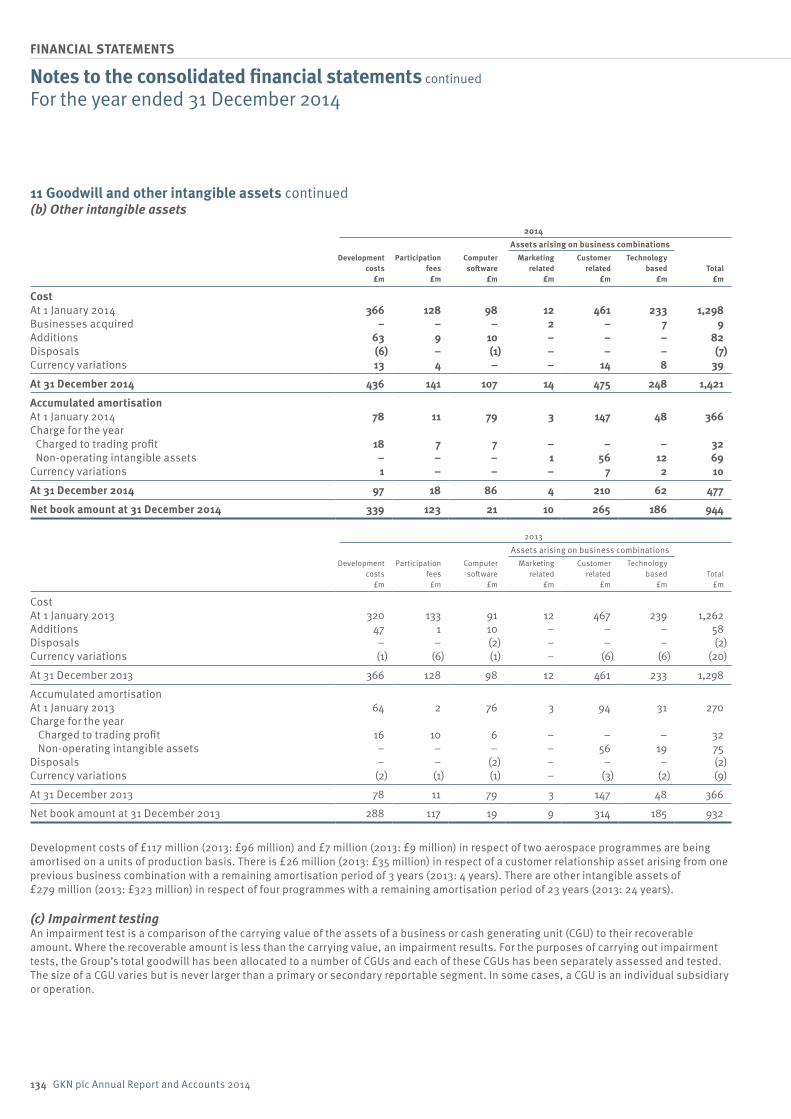
134 GKN plc Annual Report and Accounts 2014
FINANCIAL STATEMENTS
11 Goodwill and other intangible assets continued(b) Other intangible assets
2014
Development costs
£m
Participation fees
£m
Computer software
£m
Assets arising on business combinations
Total £m
Marketing related
£m
Customer related
£m
Technology based
£m
Cost At 1 January 2014 366 128 98 12 461 233 1,298 Businesses acquired – – – 2 – 7 9 Additions 63 9 10 – – – 82 Disposals (6) – (1) – – – (7)Currency variations 13 4 – – 14 8 39
At 31 December 2014 436 141 107 14 475 248 1,421
Accumulated amortisation At 1 January 2014 78 11 79 3 147 48 366 Charge for the year Charged to trading profit 18 7 7 – – – 32 Non-operating intangible assets – – – 1 56 12 69 Currency variations 1 – – – 7 2 10
At 31 December 2014 97 18 86 4 210 62 477
Net book amount at 31 December 2014 339 123 21 10 265 186 944
2013
Assets arising on business combinationsDevelopment
costs £m
Participation fees
£m
Computer software
£m
Marketing related
£m
Customer related
£m
Technology based
£m Total
£m
Cost At 1 January 2013 320 133 91 12 467 239 1,262 Additions 47 1 10 – – – 58 Disposals – – (2) – – – (2)Currency variations (1) (6) (1) – (6) (6) (20)
At 31 December 2013 366 128 98 12 461 233 1,298
Accumulated amortisation At 1 January 2013 64 2 76 3 94 31 270 Charge for the year
Charged to trading profit 16 10 6 – – – 32 Non-operating intangible assets – – – – 56 19 75
Disposals – – (2) – – – (2)Currency variations (2) (1) (1) – (3) (2) (9)
At 31 December 2013 78 11 79 3 147 48 366
Net book amount at 31 December 2013 288 117 19 9 314 185 932
Development costs of £117 million (2013: £96 million) and £7 million (2013: £9 million) in respect of two aerospace programmes are being amortised on a units of production basis. There is £26 million (2013: £35 million) in respect of a customer relationship asset arising from one previous business combination with a remaining amortisation period of 3 years (2013: 4 years). There are other intangible assets of £279 million (2013: £323 million) in respect of four programmes with a remaining amortisation period of 23 years (2013: 24 years).
(c) Impairment testingAn impairment test is a comparison of the carrying value of the assets of a business or cash generating unit (CGU) to their recoverable amount. Where the recoverable amount is less than the carrying value, an impairment results. For the purposes of carrying out impairment tests, the Group’s total goodwill has been allocated to a number of CGUs and each of these CGUs has been separately assessed and tested. The size of a CGU varies but is never larger than a primary or secondary reportable segment. In some cases, a CGU is an individual subsidiary or operation.
Notes to the consolidated financial statements continued
For the year ended 31 December 2014

Financial Statements Other InformationGovernanceStrategic Report
135GKN plc Annual Report and Accounts 2014
Consistent with previous years all goodwill was tested for impairment. An impairment charge of £69 million has been recorded in respect of 3 CGUs; 2 in Aerospace and 1 in Land Systems of £65 million and the carrying value of an investment balance of £4 million in Other Businesses.
An impairment charge in Engine Products – East, North America (Aerospace) of £33 million follows a downturn in the market and loss of business during the year. The charge only comprises goodwill. The remaining recoverable amount of £59 million represents its value in use, using a discount rate of 12% (2013: 12%). The impairment charge is most sensitive to operating cash flows and a 5% change in this assumption would have impacted the impairment charge by £3 million.
An impairment charge in Special Products Europe (Aerospace) of £6 million follows a reduction in sales for a key product. The charge only comprises goodwill. The remaining recoverable amount of £6 million represents its value in use, using a discount rate of 9% (2013: 11%). The impairment charge is most sensitive to operating cash flows but a 5% change in this assumption would not have impacted the impairment charge.
An impairment charge in Wheels and Structures Europe (Land Systems) of £26 million follows a significant downturn in the market during the year and loss of future orders. The charge comprises goodwill of £18 million and property, plant and equipment of £8 million. The remaining recoverable amount of £17 million represents its value in use, using a discount rate of 12% (2013: 13%). The impairment charge is most sensitive to operating cash flows and a 5% change in this assumption would have impacted the impairment charge by £2 million.
Significant judgements, assumptions and estimatesOne CGU within the Group, Power Management Devices (Land Systems), has been assessed for impairment using an estimation of fair value less costs of disposal based on a multiple of EBITDA and recent comparable market prices. Due to market conditions in the year value in use was not considered to be a representative assessment for impairment testing. The relevant assets of Power Management Devices have been assessed against fair value less costs of disposal. The assessment used an assumed EBITDA taking into account past performance, and a market based multiple following a review of comparable companies within a peer group. Sensitivity analysis on this CGU is provided below.
All other CGUs’ recoverable amounts were measured based on value in use. Detailed forecasts for the next five years have been used which are based on approved annual budgets and strategic projections representing the best estimate of future performance. In the case of certain CGUs within the Group’s Aerospace business, value in use was measured using operating cash flow projections covering the next ten years which incorporate the anticipated timing of volumes on current programmes. Management consider forecasting over this period to more appropriately reflect the length of business cycle of those CGU’s programmes.
In determining the value in use of CGUs it is necessary to make a series of assumptions to estimate the present value of future cash flows. In each case, these key assumptions have been made by management reflecting past experience and are consistent with relevant external sources of information.
Operating cash flowsThe main assumptions within forecast operating cash flow include the achievement of future sales prices and volumes (including reference to specific customer relationships, product lines and the use of industry relevant external forecasts of global vehicle production within Driveline businesses and consideration of specific volumes on certain military and civil programmes within Aerospace), raw material input costs, the cost structure of each CGU and the ability to realise benefits from annual productivity improvements, the impact of foreign currency rates upon selling price and cost relationships and the levels of maintaining capital expenditure required to support forecast production.
Pre-tax risk adjusted discount ratesPre-tax risk adjusted discount rates are derived from risk-free rates based upon long term government bonds in the territory, or territories, within which each CGU operates. A relative risk adjustment (or “beta”) has been applied to risk-free rates to reflect the risk inherent in each CGU relative to all other sectors on average, determined using an average of the betas of comparable listed companies.
The range of pre-tax risk adjusted discount rates set out below have been used for impairment testing. The range of rates reflects the mix of geographical territories within CGUs within the reportable segments.
Aerospace: UK 9% (2013: 11%), Europe 8% (2013: 11%) and North America 12% (2013: 12%)Driveline: North and South America 14%-25% (2013: 13%-24%), Europe 9%-12% (2013: 12%-14%) and Japan and Asia Pacific
region countries 10%-20% (2013: 10%-19%)Powder Metallurgy: Europe 10% (2013: 12%) and North America 14% (2013: 13%)Land Systems: Europe 9%-12% (2013: 11%-14%) and North America 14% (2013: 13%)
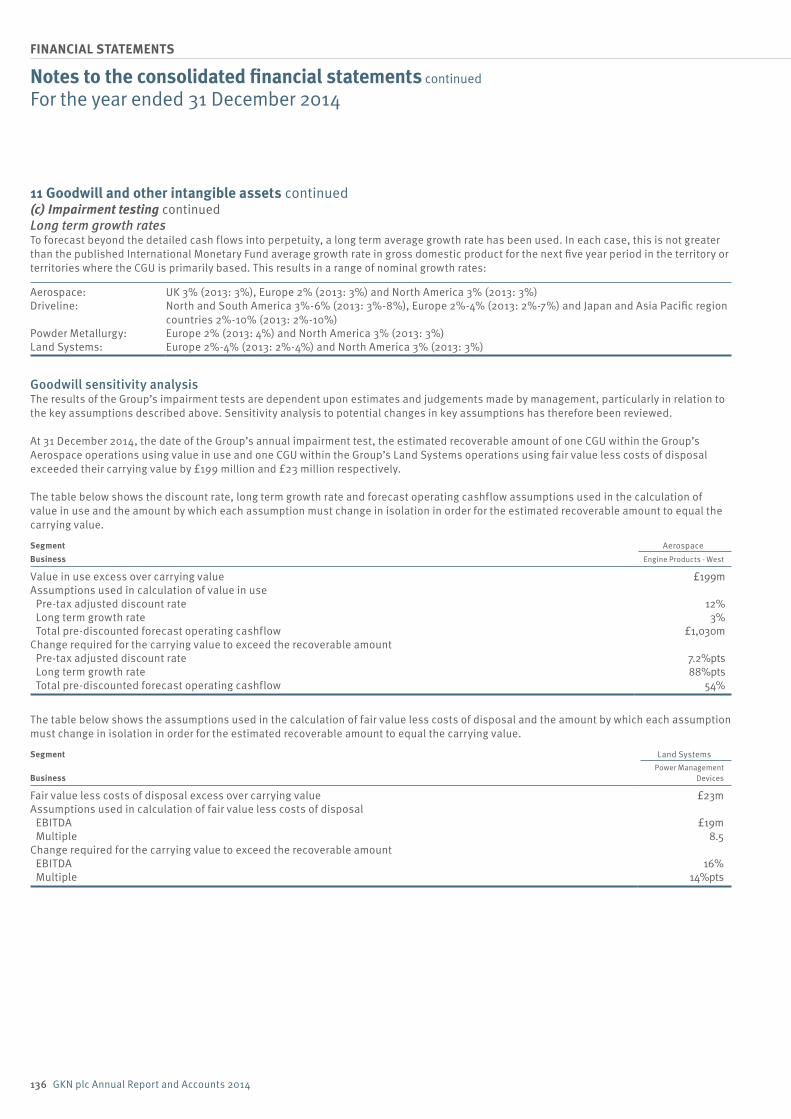
136 GKN plc Annual Report and Accounts 2014
FINANCIAL STATEMENTS
11 Goodwill and other intangible assets continued(c) Impairment testing continuedLong term growth ratesTo forecast beyond the detailed cash flows into perpetuity, a long term average growth rate has been used. In each case, this is not greater than the published International Monetary Fund average growth rate in gross domestic product for the next five year period in the territory or territories where the CGU is primarily based. This results in a range of nominal growth rates:
Aerospace: UK 3% (2013: 3%), Europe 2% (2013: 3%) and North America 3% (2013: 3%)Driveline: North and South America 3%-6% (2013: 3%-8%), Europe 2%-4% (2013: 2%-7%) and Japan and Asia Pacific region
countries 2%-10% (2013: 2%-10%)Powder Metallurgy: Europe 2% (2013: 4%) and North America 3% (2013: 3%)Land Systems: Europe 2%-4% (2013: 2%-4%) and North America 3% (2013: 3%)
Goodwill sensitivity analysisThe results of the Group’s impairment tests are dependent upon estimates and judgements made by management, particularly in relation to the key assumptions described above. Sensitivity analysis to potential changes in key assumptions has therefore been reviewed.
At 31 December 2014, the date of the Group’s annual impairment test, the estimated recoverable amount of one CGU within the Group’s Aerospace operations using value in use and one CGU within the Group’s Land Systems operations using fair value less costs of disposal exceeded their carrying value by £199 million and £23 million respectively.
The table below shows the discount rate, long term growth rate and forecast operating cashflow assumptions used in the calculation of value in use and the amount by which each assumption must change in isolation in order for the estimated recoverable amount to equal the carrying value.
Segment Aerospace
Business Engine Products - West
Value in use excess over carrying value £199m Assumptions used in calculation of value in use Pre-tax adjusted discount rate 12% Long term growth rate 3% Total pre-discounted forecast operating cashflow £1,030m Change required for the carrying value to exceed the recoverable amount Pre-tax adjusted discount rate 7.2%pts Long term growth rate 88%pts Total pre-discounted forecast operating cashflow 54%
The table below shows the assumptions used in the calculation of fair value less costs of disposal and the amount by which each assumption must change in isolation in order for the estimated recoverable amount to equal the carrying value.
Segment Land Systems
BusinessPower Management
Devices
Fair value less costs of disposal excess over carrying value £23m Assumptions used in calculation of fair value less costs of disposal EBITDA £19m Multiple 8.5 Change required for the carrying value to exceed the recoverable amount EBITDA 16% Multiple 14%pts
Notes to the consolidated financial statements continued
For the year ended 31 December 2014
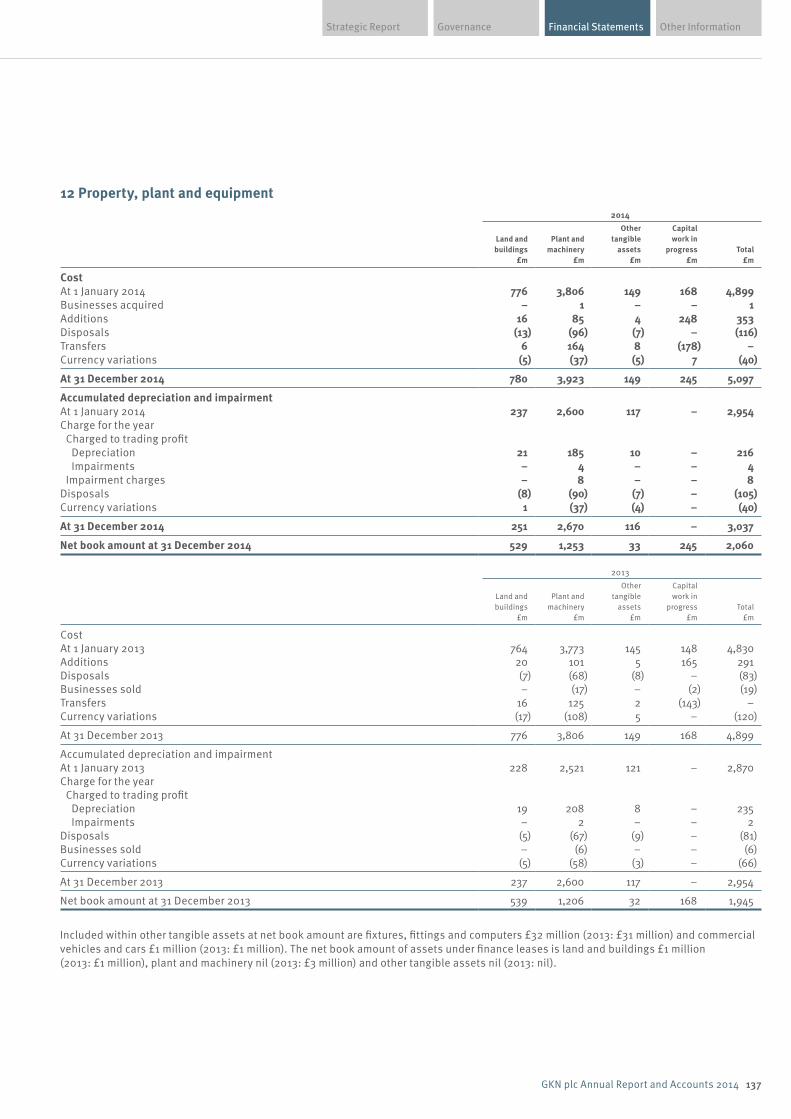
Financial Statements Other InformationGovernanceStrategic Report
137GKN plc Annual Report and Accounts 2014
12 Property, plant and equipment2014
Land and buildings
£m
Plant and machinery
£m
Other tangible
assets £m
Capital work in
progress £m
Total £m
Cost At 1 January 2014 776 3,806 149 168 4,899 Businesses acquired – 1 – – 1 Additions 16 85 4 248 353 Disposals (13) (96) (7) – (116)Transfers 6 164 8 (178) – Currency variations (5) (37) (5) 7 (40)
At 31 December 2014 780 3,923 149 245 5,097
Accumulated depreciation and impairmentAt 1 January 2014 237 2,600 117 – 2,954 Charge for the year Charged to trading profit Depreciation 21 185 10 – 216 Impairments – 4 – – 4 Impairment charges – 8 – – 8 Disposals (8) (90) (7) – (105)Currency variations 1 (37) (4) – (40)
At 31 December 2014 251 2,670 116 – 3,037
Net book amount at 31 December 2014 529 1,253 33 245 2,060
2013
Land and buildings
£m
Plant and machinery
£m
Other tangible
assets £m
Capital work in
progress £m
Total £m
Cost At 1 January 2013 764 3,773 145 148 4,830 Additions 20 101 5 165 291 Disposals (7) (68) (8) – (83)Businesses sold – (17) – (2) (19)Transfers 16 125 2 (143) – Currency variations (17) (108) 5 – (120)
At 31 December 2013 776 3,806 149 168 4,899
Accumulated depreciation and impairmentAt 1 January 2013 228 2,521 121 – 2,870 Charge for the year Charged to trading profit Depreciation 19 208 8 – 235 Impairments – 2 – – 2 Disposals (5) (67) (9) – (81)Businesses sold – (6) – – (6)Currency variations (5) (58) (3) – (66)
At 31 December 2013 237 2,600 117 – 2,954
Net book amount at 31 December 2013 539 1,206 32 168 1,945
Included within other tangible assets at net book amount are fixtures, fittings and computers £32 million (2013: £31 million) and commercial vehicles and cars £1 million (2013: £1 million). The net book amount of assets under finance leases is land and buildings £1 million (2013: £1 million), plant and machinery nil (2013: £3 million) and other tangible assets nil (2013: nil).
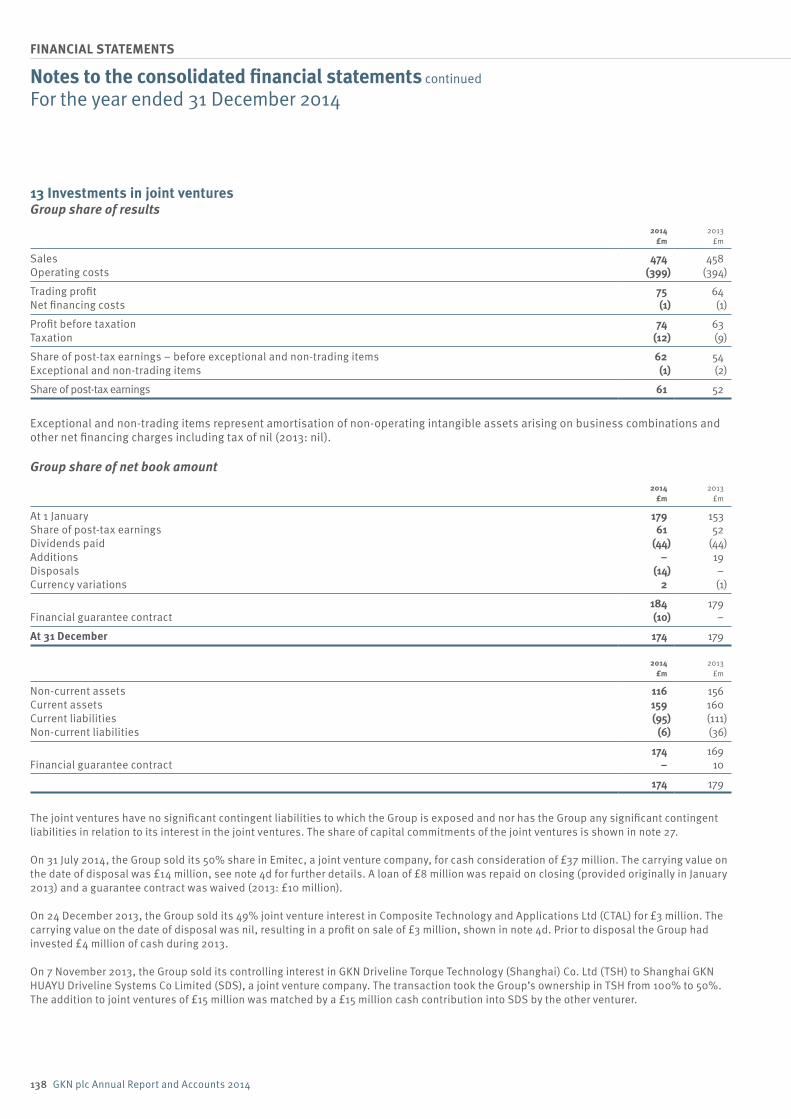
138 GKN plc Annual Report and Accounts 2014
FINANCIAL STATEMENTS
13 Investments in joint venturesGroup share of results
2014 £m
2013 £m
Sales 474 458 Operating costs (399) (394)
Trading profit 75 64 Net financing costs (1) (1)
Profit before taxation 74 63 Taxation (12) (9)
Share of post-tax earnings – before exceptional and non-trading items 62 54 Exceptional and non-trading items (1) (2)
Share of post-tax earnings 61 52
Exceptional and non-trading items represent amortisation of non-operating intangible assets arising on business combinations and other net financing charges including tax of nil (2013: nil).
Group share of net book amount2014
£m 2013
£m
At 1 January 179 153 Share of post-tax earnings 61 52 Dividends paid (44) (44)Additions – 19 Disposals (14) – Currency variations 2 (1)
184 179 Financial guarantee contract (10) –
At 31 December 174 179
2014 £m
2013 £m
Non-current assets 116 156 Current assets 159 160 Current liabilities (95) (111)Non-current liabilities (6) (36)
174 169 Financial guarantee contract – 10
174 179
The joint ventures have no significant contingent liabilities to which the Group is exposed and nor has the Group any significant contingent liabilities in relation to its interest in the joint ventures. The share of capital commitments of the joint ventures is shown in note 27.
On 31 July 2014, the Group sold its 50% share in Emitec, a joint venture company, for cash consideration of £37 million. The carrying value on the date of disposal was £14 million, see note 4d for further details. A loan of £8 million was repaid on closing (provided originally in January 2013) and a guarantee contract was waived (2013: £10 million).
On 24 December 2013, the Group sold its 49% joint venture interest in Composite Technology and Applications Ltd (CTAL) for £3 million. The carrying value on the date of disposal was nil, resulting in a profit on sale of £3 million, shown in note 4d. Prior to disposal the Group had invested £4 million of cash during 2013.
On 7 November 2013, the Group sold its controlling interest in GKN Driveline Torque Technology (Shanghai) Co. Ltd (TSH) to Shanghai GKN HUAYU Driveline Systems Co Limited (SDS), a joint venture company. The transaction took the Group’s ownership in TSH from 100% to 50%. The addition to joint ventures of £15 million was matched by a £15 million cash contribution into SDS by the other venturer.
Notes to the consolidated financial statements continued
For the year ended 31 December 2014
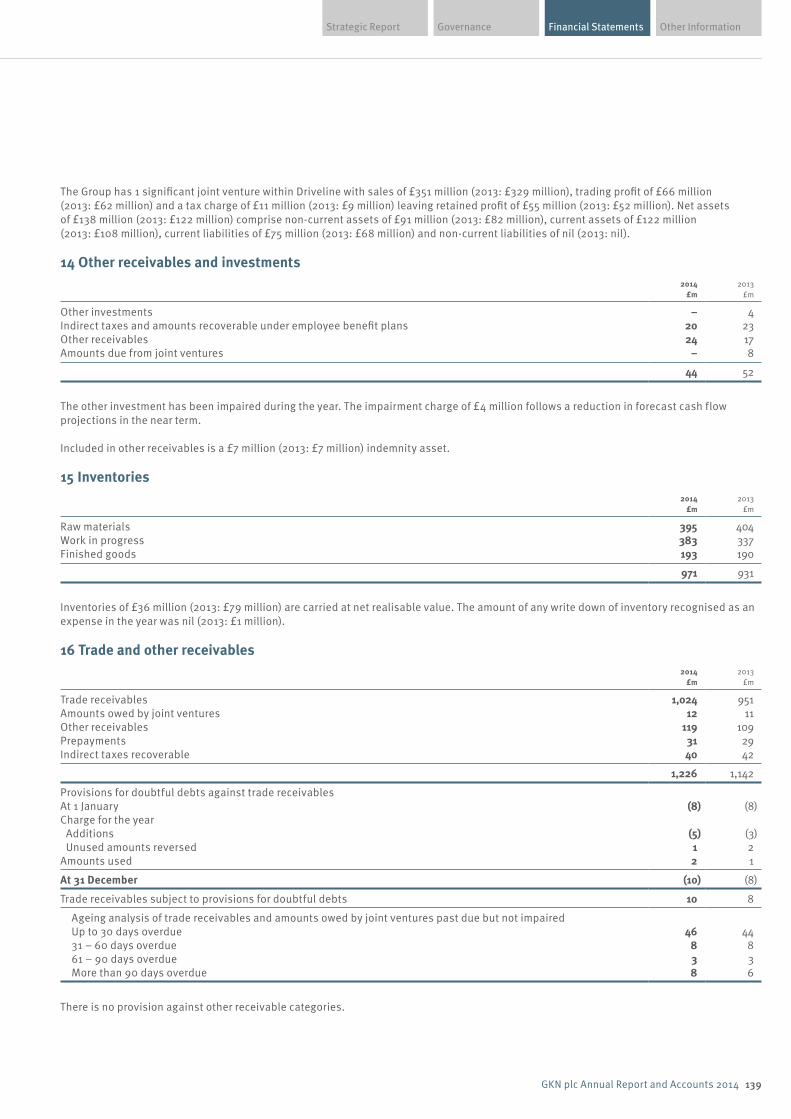
Financial Statements Other InformationGovernanceStrategic Report
139GKN plc Annual Report and Accounts 2014
The Group has 1 significant joint venture within Driveline with sales of £351 million (2013: £329 million), trading profit of £66 million (2013: £62 million) and a tax charge of £11 million (2013: £9 million) leaving retained profit of £55 million (2013: £52 million). Net assets of £138 million (2013: £122 million) comprise non-current assets of £91 million (2013: £82 million), current assets of £122 million (2013: £108 million), current liabilities of £75 million (2013: £68 million) and non-current liabilities of nil (2013: nil).
14 Other receivables and investments2014
£m 2013
£m
Other investments – 4 Indirect taxes and amounts recoverable under employee benefit plans 20 23 Other receivables 24 17 Amounts due from joint ventures – 8
44 52
The other investment has been impaired during the year. The impairment charge of £4 million follows a reduction in forecast cash flow projections in the near term.
Included in other receivables is a £7 million (2013: £7 million) indemnity asset.
15 Inventories2014
£m 2013
£m
Raw materials 395 404 Work in progress 383 337 Finished goods 193 190
971 931
Inventories of £36 million (2013: £79 million) are carried at net realisable value. The amount of any write down of inventory recognised as an expense in the year was nil (2013: £1 million).
16 Trade and other receivables
2014
£m 2013
£m
Trade receivables 1,024 951 Amounts owed by joint ventures 12 11 Other receivables 119 109 Prepayments 31 29 Indirect taxes recoverable 40 42
1,226 1,142
Provisions for doubtful debts against trade receivables At 1 January (8) (8)Charge for the year Additions (5) (3) Unused amounts reversed 1 2 Amounts used 2 1
At 31 December (10) (8)
Trade receivables subject to provisions for doubtful debts 10 8
Ageing analysis of trade receivables and amounts owed by joint ventures past due but not impaired Up to 30 days overdue 46 44 31 – 60 days overdue 8 8 61 – 90 days overdue 3 3 More than 90 days overdue 8 6
There is no provision against other receivable categories.
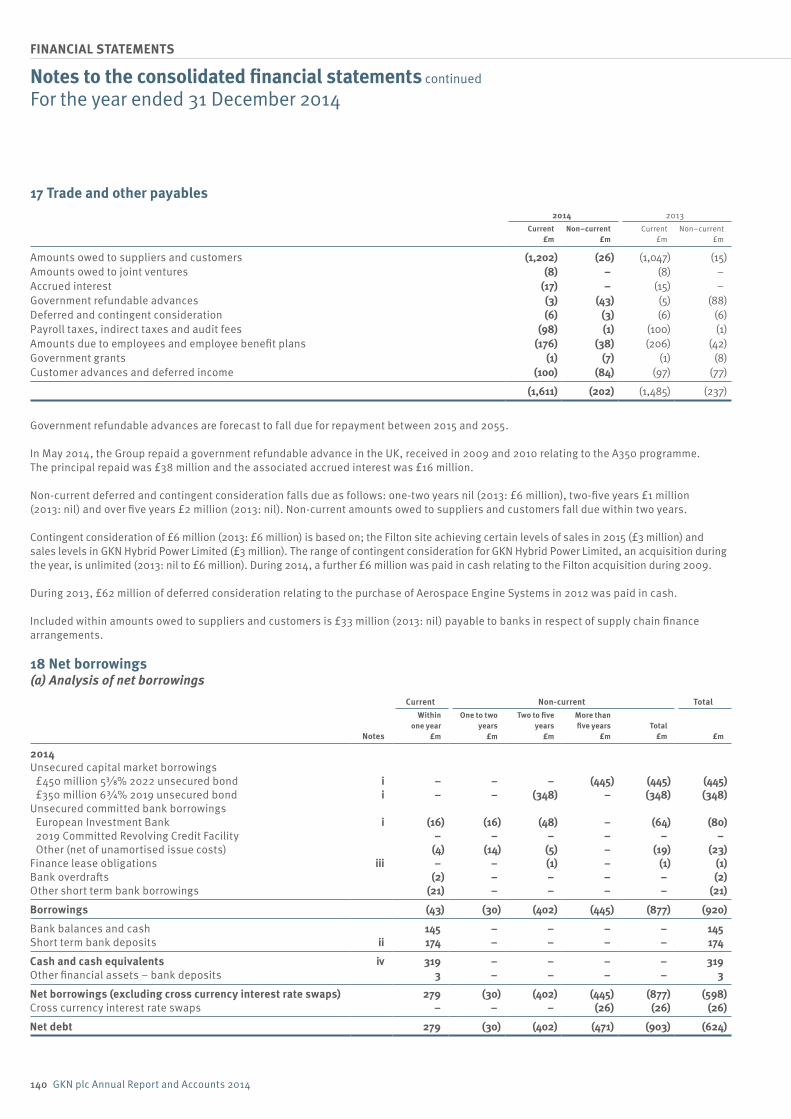
140 GKN plc Annual Report and Accounts 2014
FINANCIAL STATEMENTS
17 Trade and other payables2014 2013
Current
£m Non–current
£m Current
£m Non–current
£m
Amounts owed to suppliers and customers (1,202) (26) (1,047) (15)Amounts owed to joint ventures (8) – (8) – Accrued interest (17) – (15) – Government refundable advances (3) (43) (5) (88)Deferred and contingent consideration (6) (3) (6) (6)Payroll taxes, indirect taxes and audit fees (98) (1) (100) (1)Amounts due to employees and employee benefit plans (176) (38) (206) (42)Government grants (1) (7) (1) (8)Customer advances and deferred income (100) (84) (97) (77)
(1,611) (202) (1,485) (237)
Government refundable advances are forecast to fall due for repayment between 2015 and 2055.
In May 2014, the Group repaid a government refundable advance in the UK, received in 2009 and 2010 relating to the A350 programme. The principal repaid was £38 million and the associated accrued interest was £16 million.
Non-current deferred and contingent consideration falls due as follows: one-two years nil (2013: £6 million), two-five years £1 million (2013: nil) and over five years £2 million (2013: nil). Non-current amounts owed to suppliers and customers fall due within two years.
Contingent consideration of £6 million (2013: £6 million) is based on; the Filton site achieving certain levels of sales in 2015 (£3 million) and sales levels in GKN Hybrid Power Limited (£3 million). The range of contingent consideration for GKN Hybrid Power Limited, an acquisition during the year, is unlimited (2013: nil to £6 million). During 2014, a further £6 million was paid in cash relating to the Filton acquisition during 2009.
During 2013, £62 million of deferred consideration relating to the purchase of Aerospace Engine Systems in 2012 was paid in cash.
Included within amounts owed to suppliers and customers is £33 million (2013: nil) payable to banks in respect of supply chain finance arrangements.
18 Net borrowings(a) Analysis of net borrowings
Current Non-current Total
Notes
Within one year
£m
One to two years
£m
Two to five years
£m
More than five years
£m Total
£m £m
2014Unsecured capital market borrowings £450 million 5⅜% 2022 unsecured bond i – – – (445) (445) (445) £350 million 6¾% 2019 unsecured bond i – – (348) – (348) (348)Unsecured committed bank borrowings European Investment Bank i (16) (16) (48) – (64) (80) 2019 Committed Revolving Credit Facility – – – – – – Other (net of unamortised issue costs) (4) (14) (5) – (19) (23)Finance lease obligations iii – – (1) – (1) (1)Bank overdrafts (2) – – – – (2)Other short term bank borrowings (21) – – – – (21)
Borrowings (43) (30) (402) (445) (877) (920)
Bank balances and cash 145 – – – – 145 Short term bank deposits ii 174 – – – – 174
Cash and cash equivalents iv 319 – – – – 319 Other financial assets – bank deposits 3 – – – – 3
Net borrowings (excluding cross currency interest rate swaps) 279 (30) (402) (445) (877) (598)Cross currency interest rate swaps – – – (26) (26) (26)
Net debt 279 (30) (402) (471) (903) (624)
Notes to the consolidated financial statements continued
For the year ended 31 December 2014
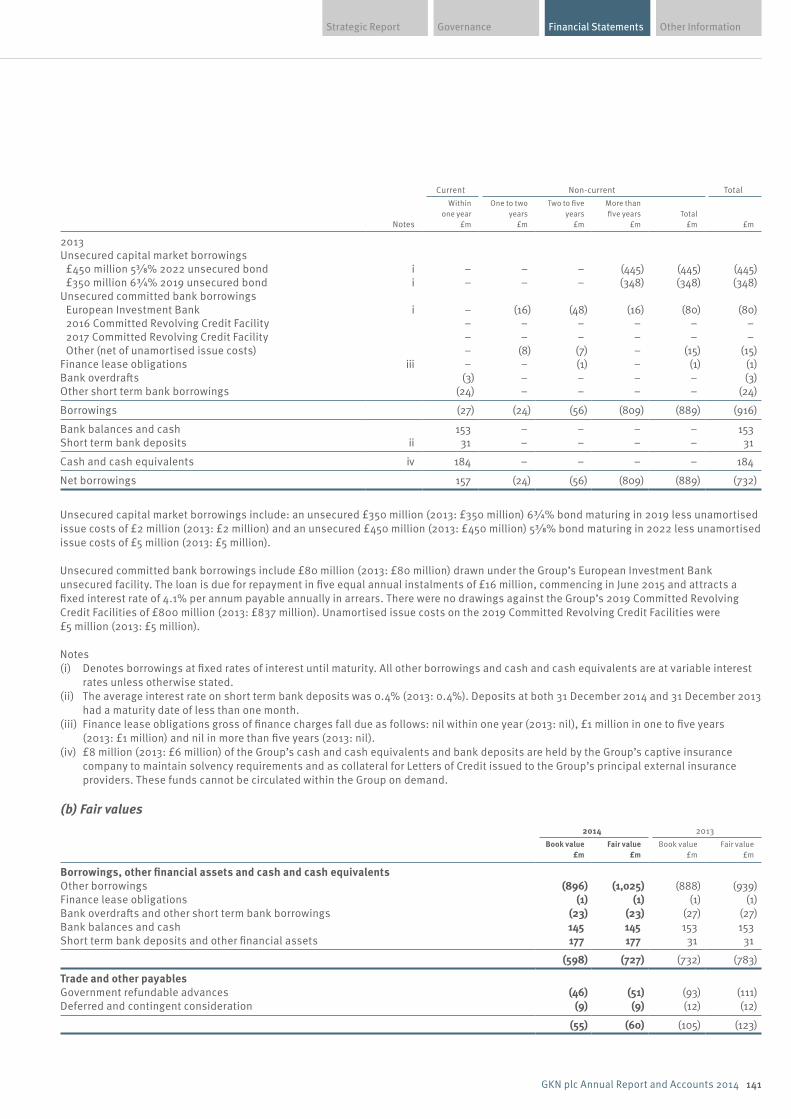
Financial Statements Other InformationGovernanceStrategic Report
141GKN plc Annual Report and Accounts 2014
Current Non-current Total
Notes
Within one year
£m
One to two years
£m
Two to five years
£m
More than five years
£m Total
£m £m
2013Unsecured capital market borrowings £450 million 5⅜% 2022 unsecured bond i – – – (445) (445) (445) £350 million 6¾% 2019 unsecured bond i – – – (348) (348) (348)Unsecured committed bank borrowings European Investment Bank i – (16) (48) (16) (80) (80) 2016 Committed Revolving Credit Facility – – – – – – 2017 Committed Revolving Credit Facility – – – – – – Other (net of unamortised issue costs) – (8) (7) – (15) (15)Finance lease obligations iii – – (1) – (1) (1)Bank overdrafts (3) – – – – (3)Other short term bank borrowings (24) – – – – (24)
Borrowings (27) (24) (56) (809) (889) (916)
Bank balances and cash 153 – – – – 153 Short term bank deposits ii 31 – – – – 31
Cash and cash equivalents iv 184 – – – – 184
Net borrowings 157 (24) (56) (809) (889) (732)
Unsecured capital market borrowings include: an unsecured £350 million (2013: £350 million) 6¾% bond maturing in 2019 less unamortised issue costs of £2 million (2013: £2 million) and an unsecured £450 million (2013: £450 million) 5⅜% bond maturing in 2022 less unamortised issue costs of £5 million (2013: £5 million).
Unsecured committed bank borrowings include £80 million (2013: £80 million) drawn under the Group’s European Investment Bank unsecured facility. The loan is due for repayment in five equal annual instalments of £16 million, commencing in June 2015 and attracts a fixed interest rate of 4.1% per annum payable annually in arrears. There were no drawings against the Group’s 2019 Committed Revolving Credit Facilities of £800 million (2013: £837 million). Unamortised issue costs on the 2019 Committed Revolving Credit Facilities were £5 million (2013: £5 million).
Notes (i) Denotes borrowings at fixed rates of interest until maturity. All other borrowings and cash and cash equivalents are at variable interest
rates unless otherwise stated.(ii) The average interest rate on short term bank deposits was 0.4% (2013: 0.4%). Deposits at both 31 December 2014 and 31 December 2013
had a maturity date of less than one month.(iii) Finance lease obligations gross of finance charges fall due as follows: nil within one year (2013: nil), £1 million in one to five years
(2013: £1 million) and nil in more than five years (2013: nil).(iv) £8 million (2013: £6 million) of the Group’s cash and cash equivalents and bank deposits are held by the Group’s captive insurance
company to maintain solvency requirements and as collateral for Letters of Credit issued to the Group’s principal external insurance providers. These funds cannot be circulated within the Group on demand.
(b) Fair values2014 2013
Book value £m
Fair value £m
Book value £m
Fair value £m
Borrowings, other financial assets and cash and cash equivalents Other borrowings (896) (1,025) (888) (939)Finance lease obligations (1) (1) (1) (1)Bank overdrafts and other short term bank borrowings (23) (23) (27) (27)Bank balances and cash 145 145 153 153 Short term bank deposits and other financial assets 177 177 31 31
(598) (727) (732) (783)
Trade and other payablesGovernment refundable advances (46) (51) (93) (111)Deferred and contingent consideration (9) (9) (12) (12)
(55) (60) (105) (123)
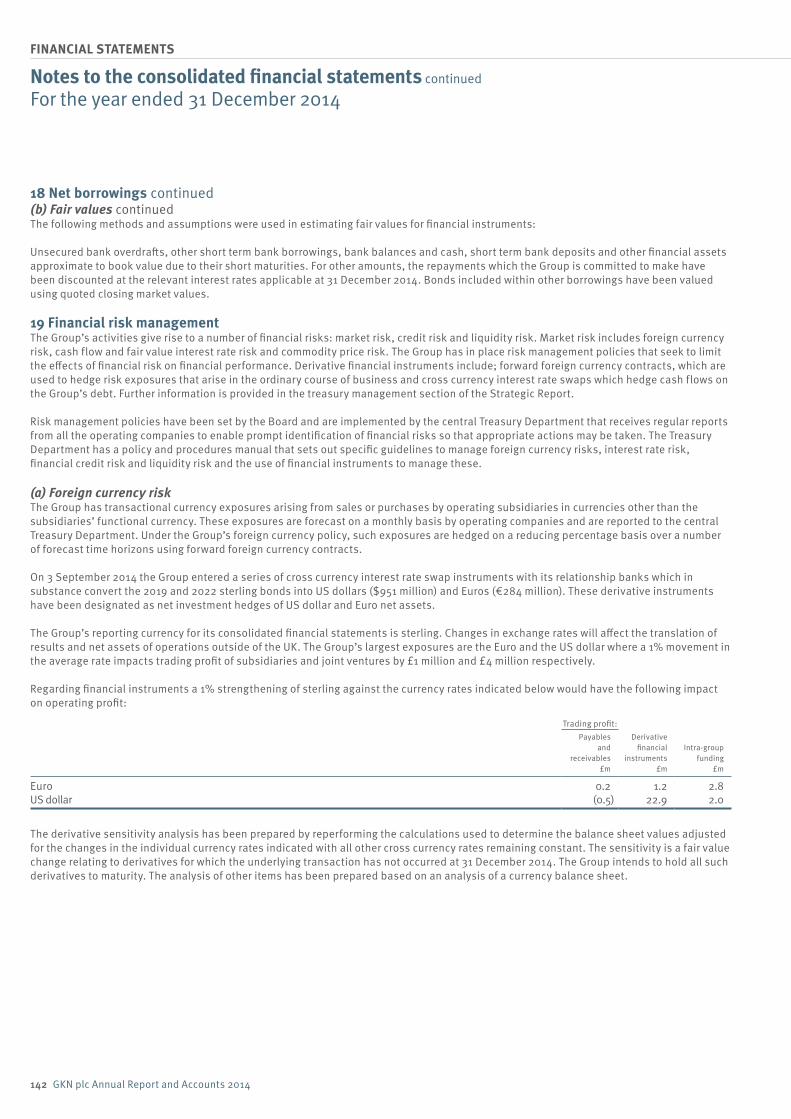
142 GKN plc Annual Report and Accounts 2014
FINANCIAL STATEMENTS
18 Net borrowings continued(b) Fair values continuedThe following methods and assumptions were used in estimating fair values for financial instruments:
Unsecured bank overdrafts, other short term bank borrowings, bank balances and cash, short term bank deposits and other financial assets approximate to book value due to their short maturities. For other amounts, the repayments which the Group is committed to make have been discounted at the relevant interest rates applicable at 31 December 2014. Bonds included within other borrowings have been valued using quoted closing market values.
19 Financial risk managementThe Group’s activities give rise to a number of financial risks: market risk, credit risk and liquidity risk. Market risk includes foreign currency risk, cash flow and fair value interest rate risk and commodity price risk. The Group has in place risk management policies that seek to limit the effects of financial risk on financial performance. Derivative financial instruments include; forward foreign currency contracts, which are used to hedge risk exposures that arise in the ordinary course of business and cross currency interest rate swaps which hedge cash flows on the Group’s debt. Further information is provided in the treasury management section of the Strategic Report.
Risk management policies have been set by the Board and are implemented by the central Treasury Department that receives regular reports from all the operating companies to enable prompt identification of financial risks so that appropriate actions may be taken. The Treasury Department has a policy and procedures manual that sets out specific guidelines to manage foreign currency risks, interest rate risk, financial credit risk and liquidity risk and the use of financial instruments to manage these.
(a) Foreign currency riskThe Group has transactional currency exposures arising from sales or purchases by operating subsidiaries in currencies other than the subsidiaries’ functional currency. These exposures are forecast on a monthly basis by operating companies and are reported to the central Treasury Department. Under the Group’s foreign currency policy, such exposures are hedged on a reducing percentage basis over a number of forecast time horizons using forward foreign currency contracts.
On 3 September 2014 the Group entered a series of cross currency interest rate swap instruments with its relationship banks which in substance convert the 2019 and 2022 sterling bonds into US dollars ($951 million) and Euros (€284 million). These derivative instruments have been designated as net investment hedges of US dollar and Euro net assets.
The Group’s reporting currency for its consolidated financial statements is sterling. Changes in exchange rates will affect the translation of results and net assets of operations outside of the UK. The Group’s largest exposures are the Euro and the US dollar where a 1% movement in the average rate impacts trading profit of subsidiaries and joint ventures by £1 million and £4 million respectively.
Regarding financial instruments a 1% strengthening of sterling against the currency rates indicated below would have the following impact on operating profit:
Trading profit:Payables
and receivables
£m
Derivative financial
instruments £m
Intra-group funding
£m
Euro 0.2 1.2 2.8US dollar (0.5) 22.9 2.0
The derivative sensitivity analysis has been prepared by reperforming the calculations used to determine the balance sheet values adjusted for the changes in the individual currency rates indicated with all other cross currency rates remaining constant. The sensitivity is a fair value change relating to derivatives for which the underlying transaction has not occurred at 31 December 2014. The Group intends to hold all such derivatives to maturity. The analysis of other items has been prepared based on an analysis of a currency balance sheet.
Notes to the consolidated financial statements continued
For the year ended 31 December 2014
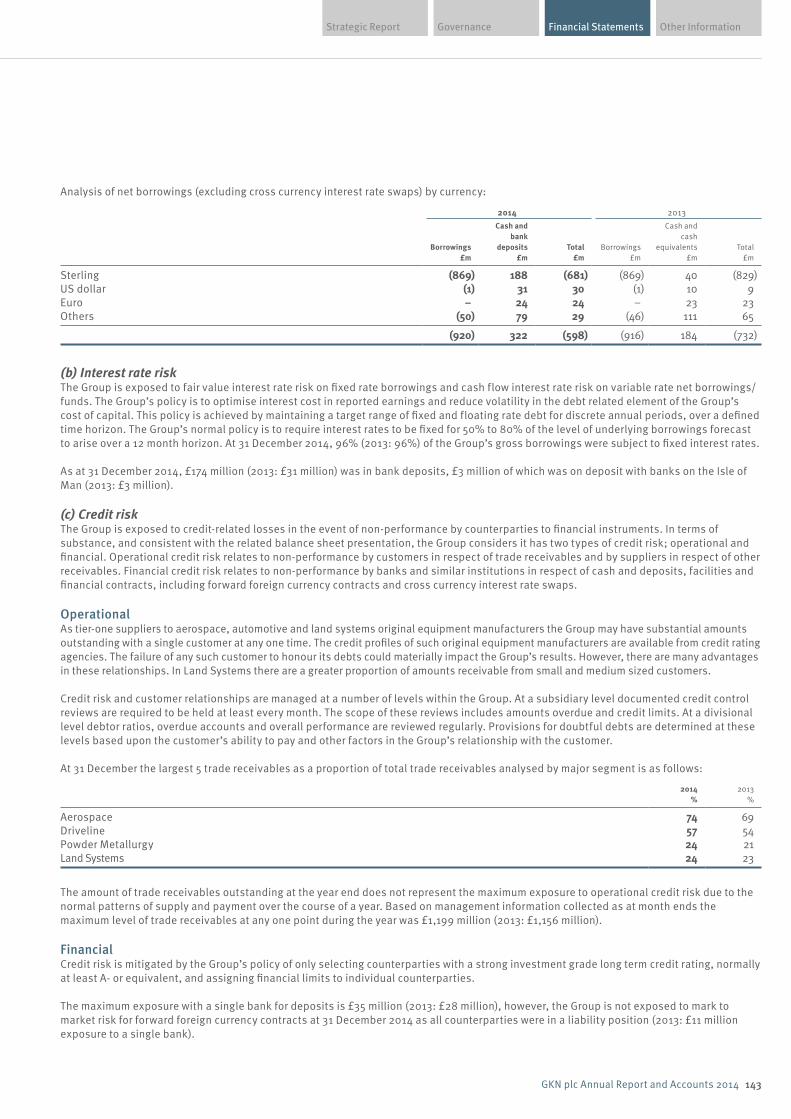
Financial Statements Other InformationGovernanceStrategic Report
143GKN plc Annual Report and Accounts 2014
Analysis of net borrowings (excluding cross currency interest rate swaps) by currency:
2014 2013
Borrowings £m
Cash and bank
deposits £m
Total £m
Borrowings £m
Cash and cash
equivalents £m
Total £m
Sterling (869) 188 (681) (869) 40 (829)US dollar (1) 31 30 (1) 10 9 Euro – 24 24 – 23 23 Others (50) 79 29 (46) 111 65
(920) 322 (598) (916) 184 (732)
(b) Interest rate riskThe Group is exposed to fair value interest rate risk on fixed rate borrowings and cash flow interest rate risk on variable rate net borrowings/funds. The Group’s policy is to optimise interest cost in reported earnings and reduce volatility in the debt related element of the Group’s cost of capital. This policy is achieved by maintaining a target range of fixed and floating rate debt for discrete annual periods, over a defined time horizon. The Group’s normal policy is to require interest rates to be fixed for 50% to 80% of the level of underlying borrowings forecast to arise over a 12 month horizon. At 31 December 2014, 96% (2013: 96%) of the Group’s gross borrowings were subject to fixed interest rates.
As at 31 December 2014, £174 million (2013: £31 million) was in bank deposits, £3 million of which was on deposit with banks on the Isle of Man (2013: £3 million).
(c) Credit riskThe Group is exposed to credit-related losses in the event of non-performance by counterparties to financial instruments. In terms of substance, and consistent with the related balance sheet presentation, the Group considers it has two types of credit risk; operational and financial. Operational credit risk relates to non-performance by customers in respect of trade receivables and by suppliers in respect of other receivables. Financial credit risk relates to non-performance by banks and similar institutions in respect of cash and deposits, facilities and financial contracts, including forward foreign currency contracts and cross currency interest rate swaps.
OperationalAs tier-one suppliers to aerospace, automotive and land systems original equipment manufacturers the Group may have substantial amounts outstanding with a single customer at any one time. The credit profiles of such original equipment manufacturers are available from credit rating agencies. The failure of any such customer to honour its debts could materially impact the Group’s results. However, there are many advantages in these relationships. In Land Systems there are a greater proportion of amounts receivable from small and medium sized customers.
Credit risk and customer relationships are managed at a number of levels within the Group. At a subsidiary level documented credit control reviews are required to be held at least every month. The scope of these reviews includes amounts overdue and credit limits. At a divisional level debtor ratios, overdue accounts and overall performance are reviewed regularly. Provisions for doubtful debts are determined at these levels based upon the customer’s ability to pay and other factors in the Group’s relationship with the customer.
At 31 December the largest 5 trade receivables as a proportion of total trade receivables analysed by major segment is as follows:
2014 %
2013 %
Aerospace 74 69 Driveline 57 54 Powder Metallurgy 24 21 Land Systems 24 23
The amount of trade receivables outstanding at the year end does not represent the maximum exposure to operational credit risk due to the normal patterns of supply and payment over the course of a year. Based on management information collected as at month ends the maximum level of trade receivables at any one point during the year was £1,199 million (2013: £1,156 million).
FinancialCredit risk is mitigated by the Group’s policy of only selecting counterparties with a strong investment grade long term credit rating, normally at least A- or equivalent, and assigning financial limits to individual counterparties.
The maximum exposure with a single bank for deposits is £35 million (2013: £28 million), however, the Group is not exposed to mark to market risk for forward foreign currency contracts at 31 December 2014 as all counterparties were in a liability position (2013: £11 million exposure to a single bank).
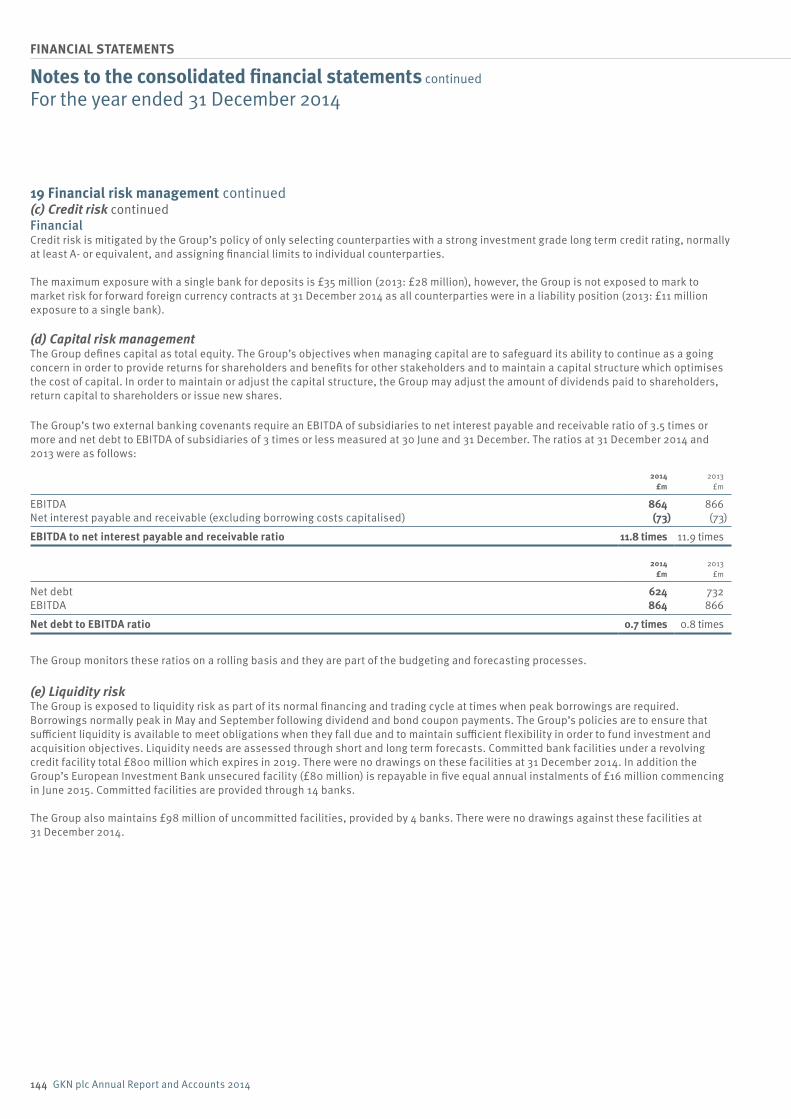
144 GKN plc Annual Report and Accounts 2014
FINANCIAL STATEMENTS
19 Financial risk management continued(c) Credit risk continuedFinancialCredit risk is mitigated by the Group’s policy of only selecting counterparties with a strong investment grade long term credit rating, normally at least A- or equivalent, and assigning financial limits to individual counterparties.
The maximum exposure with a single bank for deposits is £35 million (2013: £28 million), however, the Group is not exposed to mark to market risk for forward foreign currency contracts at 31 December 2014 as all counterparties were in a liability position (2013: £11 million exposure to a single bank).
(d) Capital risk managementThe Group defines capital as total equity. The Group’s objectives when managing capital are to safeguard its ability to continue as a going concern in order to provide returns for shareholders and benefits for other stakeholders and to maintain a capital structure which optimises the cost of capital. In order to maintain or adjust the capital structure, the Group may adjust the amount of dividends paid to shareholders, return capital to shareholders or issue new shares.
The Group’s two external banking covenants require an EBITDA of subsidiaries to net interest payable and receivable ratio of 3.5 times or more and net debt to EBITDA of subsidiaries of 3 times or less measured at 30 June and 31 December. The ratios at 31 December 2014 and 2013 were as follows:
2014 £m
2013 £m
EBITDA 864 866 Net interest payable and receivable (excluding borrowing costs capitalised) (73) (73)
EBITDA to net interest payable and receivable ratio 11.8 times 11.9 times
2014 £m
2013 £m
Net debt 624 732 EBITDA 864 866
Net debt to EBITDA ratio 0.7 times 0.8 times
The Group monitors these ratios on a rolling basis and they are part of the budgeting and forecasting processes.
(e) Liquidity riskThe Group is exposed to liquidity risk as part of its normal financing and trading cycle at times when peak borrowings are required. Borrowings normally peak in May and September following dividend and bond coupon payments. The Group’s policies are to ensure that sufficient liquidity is available to meet obligations when they fall due and to maintain sufficient flexibility in order to fund investment and acquisition objectives. Liquidity needs are assessed through short and long term forecasts. Committed bank facilities under a revolving credit facility total £800 million which expires in 2019. There were no drawings on these facilities at 31 December 2014. In addition the Group’s European Investment Bank unsecured facility (£80 million) is repayable in five equal annual instalments of £16 million commencing in June 2015. Committed facilities are provided through 14 banks.
The Group also maintains £98 million of uncommitted facilities, provided by 4 banks. There were no drawings against these facilities at 31 December 2014.
Notes to the consolidated financial statements continued
For the year ended 31 December 2014
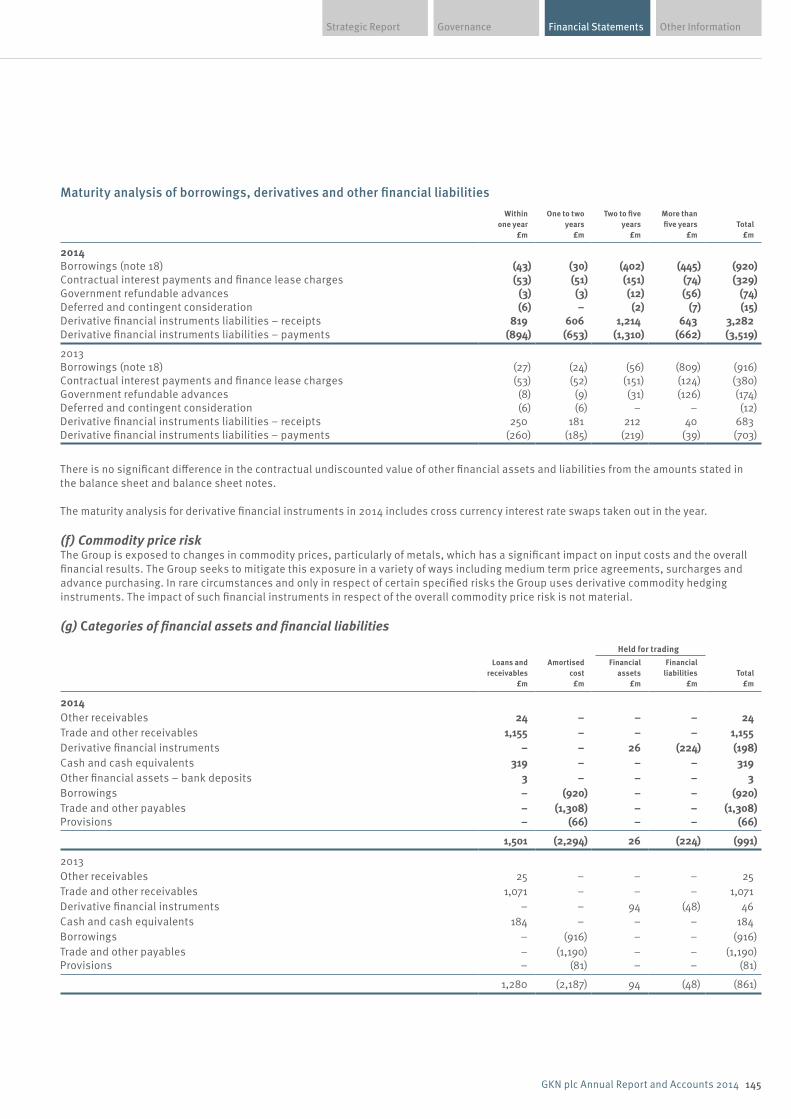
Financial Statements Other InformationGovernanceStrategic Report
145GKN plc Annual Report and Accounts 2014
Maturity analysis of borrowings, derivatives and other financial liabilitiesWithin
one year £m
One to two years
£m
Two to five years
£m
More than five years
£m Total
£m
2014 Borrowings (note 18) (43) (30) (402) (445) (920)Contractual interest payments and finance lease charges (53) (51) (151) (74) (329)Government refundable advances (3) (3) (12) (56) (74)Deferred and contingent consideration (6) – (2) (7) (15)Derivative financial instruments liabilities – receipts 819 606 1,214 643 3,282 Derivative financial instruments liabilities – payments (894) (653) (1,310) (662) (3,519)
2013 Borrowings (note 18) (27) (24) (56) (809) (916)Contractual interest payments and finance lease charges (53) (52) (151) (124) (380)Government refundable advances (8) (9) (31) (126) (174)Deferred and contingent consideration (6) (6) – – (12)Derivative financial instruments liabilities – receipts 250 181 212 40 683 Derivative financial instruments liabilities – payments (260) (185) (219) (39) (703)
There is no significant difference in the contractual undiscounted value of other financial assets and liabilities from the amounts stated in the balance sheet and balance sheet notes.
The maturity analysis for derivative financial instruments in 2014 includes cross currency interest rate swaps taken out in the year.
(f) Commodity price riskThe Group is exposed to changes in commodity prices, particularly of metals, which has a significant impact on input costs and the overall financial results. The Group seeks to mitigate this exposure in a variety of ways including medium term price agreements, surcharges and advance purchasing. In rare circumstances and only in respect of certain specified risks the Group uses derivative commodity hedging instruments. The impact of such financial instruments in respect of the overall commodity price risk is not material.
(g) Categories of financial assets and financial liabilities
Held for trading
Loans and receivables
£m
Amortised cost
£m
Financial assets
£m
Financial liabilities
£m Total
£m
2014 Other receivables 24 – – – 24 Trade and other receivables 1,155 – – – 1,155Derivative financial instruments – – 26 (224) (198)Cash and cash equivalents 319 – – – 319 Other financial assets – bank deposits 3 – – – 3 Borrowings – (920) – – (920)Trade and other payables – (1,308) – – (1,308)Provisions – (66) – – (66)
1,501 (2,294) 26 (224) (991)
2013 Other receivables 25 – – – 25 Trade and other receivables 1,071 – – – 1,071 Derivative financial instruments – – 94 (48) 46 Cash and cash equivalents 184 – – – 184 Borrowings – (916) – – (916)Trade and other payables – (1,190) – – (1,190)Provisions – (81) – – (81)
1,280 (2,187) 94 (48) (861)
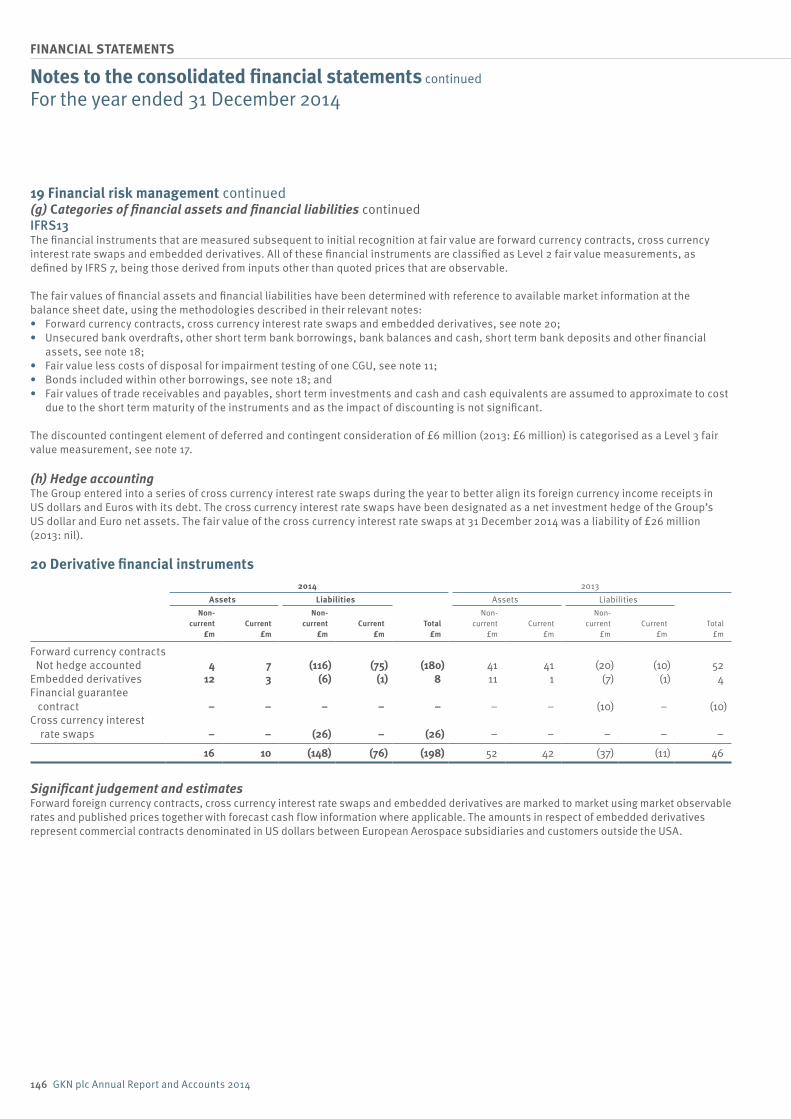
146 GKN plc Annual Report and Accounts 2014
FINANCIAL STATEMENTS
19 Financial risk management continued(g) Categories of financial assets and financial liabilities continuedIFRS13The financial instruments that are measured subsequent to initial recognition at fair value are forward currency contracts, cross currency interest rate swaps and embedded derivatives. All of these financial instruments are classified as Level 2 fair value measurements, as defined by IFRS 7, being those derived from inputs other than quoted prices that are observable.
The fair values of financial assets and financial liabilities have been determined with reference to available market information at the balance sheet date, using the methodologies described in their relevant notes:• Forward currency contracts, cross currency interest rate swaps and embedded derivatives, see note 20;• Unsecured bank overdrafts, other short term bank borrowings, bank balances and cash, short term bank deposits and other financial
assets, see note 18;• Fair value less costs of disposal for impairment testing of one CGU, see note 11;• Bonds included within other borrowings, see note 18; and• Fair values of trade receivables and payables, short term investments and cash and cash equivalents are assumed to approximate to cost
due to the short term maturity of the instruments and as the impact of discounting is not significant.
The discounted contingent element of deferred and contingent consideration of £6 million (2013: £6 million) is categorised as a Level 3 fair value measurement, see note 17.
(h) Hedge accountingThe Group entered into a series of cross currency interest rate swaps during the year to better align its foreign currency income receipts in US dollars and Euros with its debt. The cross currency interest rate swaps have been designated as a net investment hedge of the Group’s US dollar and Euro net assets. The fair value of the cross currency interest rate swaps at 31 December 2014 was a liability of £26 million (2013: nil).
20 Derivative financial instruments2014 2013
Assets Liabilities Assets LiabilitiesNon-
current£m
Current £m
Non- current
£m Current
£m Total
£m
Non- current
£m Current
£m
Non- current
£m Current
£m Total
£m
Forward currency contracts Not hedge accounted 4 7 (116) (75) (180) 41 41 (20) (10) 52 Embedded derivatives 12 3 (6) (1) 8 11 1 (7) (1) 4 Financial guarantee
contract – – – – – – – (10) – (10)Cross currency interest
rate swaps – – (26) – (26) – – – – –
16 10 (148) (76) (198) 52 42 (37) (11) 46
Significant judgement and estimatesForward foreign currency contracts, cross currency interest rate swaps and embedded derivatives are marked to market using market observable rates and published prices together with forecast cash flow information where applicable. The amounts in respect of embedded derivatives represent commercial contracts denominated in US dollars between European Aerospace subsidiaries and customers outside the USA.
Notes to the consolidated financial statements continued
For the year ended 31 December 2014
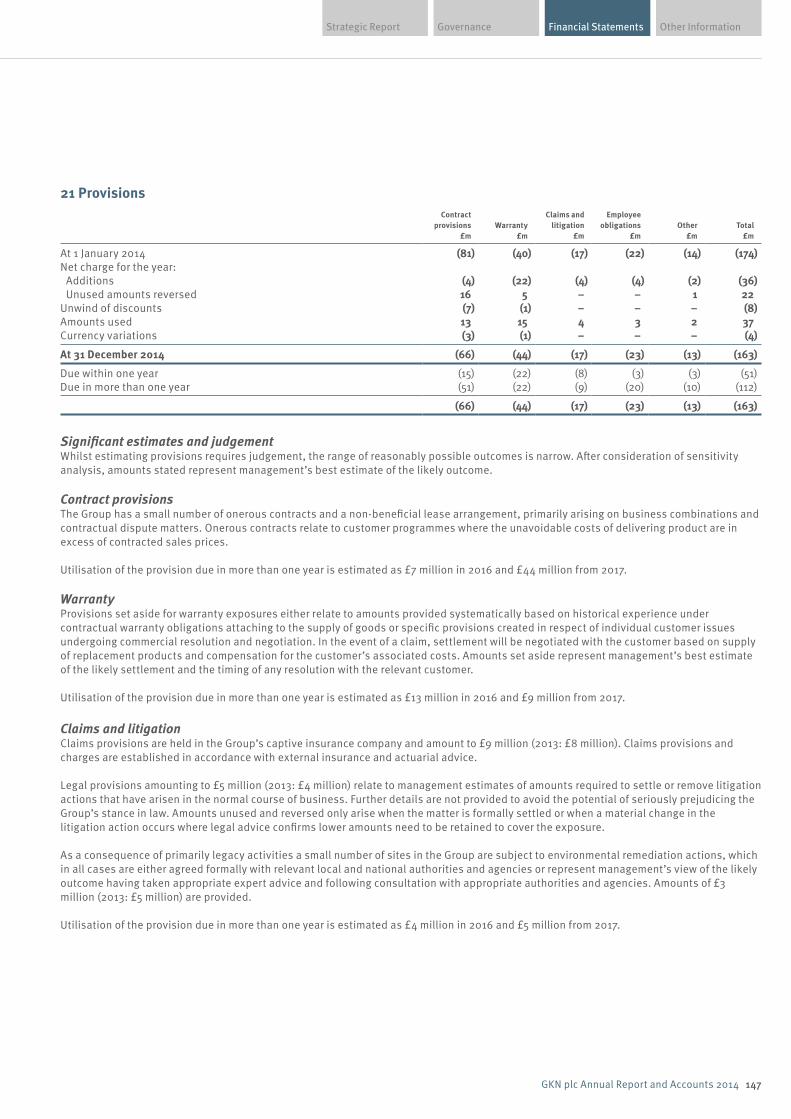
Financial Statements Other InformationGovernanceStrategic Report
147GKN plc Annual Report and Accounts 2014
21 Provisions
Contract provisions
£m Warranty
£m
Claims and litigation
£m
Employee obligations
£m Other
£m Total
£m
At 1 January 2014 (81) (40) (17) (22) (14) (174)Net charge for the year: Additions (4) (22) (4) (4) (2) (36) Unused amounts reversed 16 5 – – 1 22 Unwind of discounts (7) (1) – – – (8)Amounts used 13 15 4 3 2 37 Currency variations (3) (1) – – – (4)
At 31 December 2014 (66) (44) (17) (23) (13) (163)
Due within one year (15) (22) (8) (3) (3) (51)Due in more than one year (51) (22) (9) (20) (10) (112)
(66) (44) (17) (23) (13) (163)
Significant estimates and judgementWhilst estimating provisions requires judgement, the range of reasonably possible outcomes is narrow. After consideration of sensitivity analysis, amounts stated represent management’s best estimate of the likely outcome.
Contract provisionsThe Group has a small number of onerous contracts and a non-beneficial lease arrangement, primarily arising on business combinations and contractual dispute matters. Onerous contracts relate to customer programmes where the unavoidable costs of delivering product are in excess of contracted sales prices.
Utilisation of the provision due in more than one year is estimated as £7 million in 2016 and £44 million from 2017.
WarrantyProvisions set aside for warranty exposures either relate to amounts provided systematically based on historical experience under contractual warranty obligations attaching to the supply of goods or specific provisions created in respect of individual customer issues undergoing commercial resolution and negotiation. In the event of a claim, settlement will be negotiated with the customer based on supply of replacement products and compensation for the customer’s associated costs. Amounts set aside represent management’s best estimate of the likely settlement and the timing of any resolution with the relevant customer.
Utilisation of the provision due in more than one year is estimated as £13 million in 2016 and £9 million from 2017.
Claims and litigationClaims provisions are held in the Group’s captive insurance company and amount to £9 million (2013: £8 million). Claims provisions and charges are established in accordance with external insurance and actuarial advice.
Legal provisions amounting to £5 million (2013: £4 million) relate to management estimates of amounts required to settle or remove litigation actions that have arisen in the normal course of business. Further details are not provided to avoid the potential of seriously prejudicing the Group’s stance in law. Amounts unused and reversed only arise when the matter is formally settled or when a material change in the litigation action occurs where legal advice confirms lower amounts need to be retained to cover the exposure.
As a consequence of primarily legacy activities a small number of sites in the Group are subject to environmental remediation actions, which in all cases are either agreed formally with relevant local and national authorities and agencies or represent management’s view of the likely outcome having taken appropriate expert advice and following consultation with appropriate authorities and agencies. Amounts of £3 million (2013: £5 million) are provided.
Utilisation of the provision due in more than one year is estimated as £4 million in 2016 and £5 million from 2017.
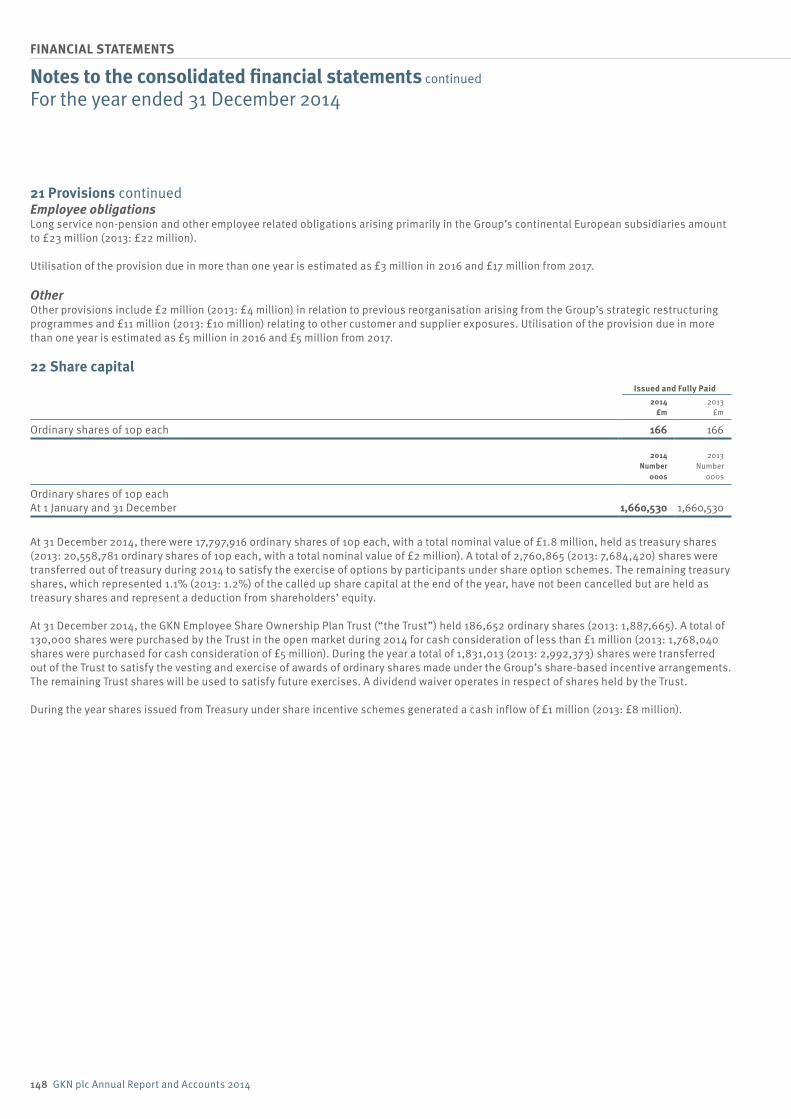
148 GKN plc Annual Report and Accounts 2014
FINANCIAL STATEMENTS
21 Provisions continuedEmployee obligationsLong service non-pension and other employee related obligations arising primarily in the Group’s continental European subsidiaries amount to £23 million (2013: £22 million).
Utilisation of the provision due in more than one year is estimated as £3 million in 2016 and £17 million from 2017.
OtherOther provisions include £2 million (2013: £4 million) in relation to previous reorganisation arising from the Group’s strategic restructuring programmes and £11 million (2013: £10 million) relating to other customer and supplier exposures. Utilisation of the provision due in more than one year is estimated as £5 million in 2016 and £5 million from 2017.
22 Share capitalIssued and Fully Paid
2014 £m
2013 £m
Ordinary shares of 10p each 166 166
2014 Number
000s
2013 Number
000s
Ordinary shares of 10p eachAt 1 January and 31 December 1,660,530 1,660,530
At 31 December 2014, there were 17,797,916 ordinary shares of 10p each, with a total nominal value of £1.8 million, held as treasury shares (2013: 20,558,781 ordinary shares of 10p each, with a total nominal value of £2 million). A total of 2,760,865 (2013: 7,684,420) shares were transferred out of treasury during 2014 to satisfy the exercise of options by participants under share option schemes. The remaining treasury shares, which represented 1.1% (2013: 1.2%) of the called up share capital at the end of the year, have not been cancelled but are held as treasury shares and represent a deduction from shareholders’ equity.
At 31 December 2014, the GKN Employee Share Ownership Plan Trust (“the Trust”) held 186,652 ordinary shares (2013: 1,887,665). A total of 130,000 shares were purchased by the Trust in the open market during 2014 for cash consideration of less than £1 million (2013: 1,768,040 shares were purchased for cash consideration of £5 million). During the year a total of 1,831,013 (2013: 2,992,373) shares were transferred out of the Trust to satisfy the vesting and exercise of awards of ordinary shares made under the Group’s share-based incentive arrangements. The remaining Trust shares will be used to satisfy future exercises. A dividend waiver operates in respect of shares held by the Trust.
During the year shares issued from Treasury under share incentive schemes generated a cash inflow of £1 million (2013: £8 million).
Notes to the consolidated financial statements continued
For the year ended 31 December 2014
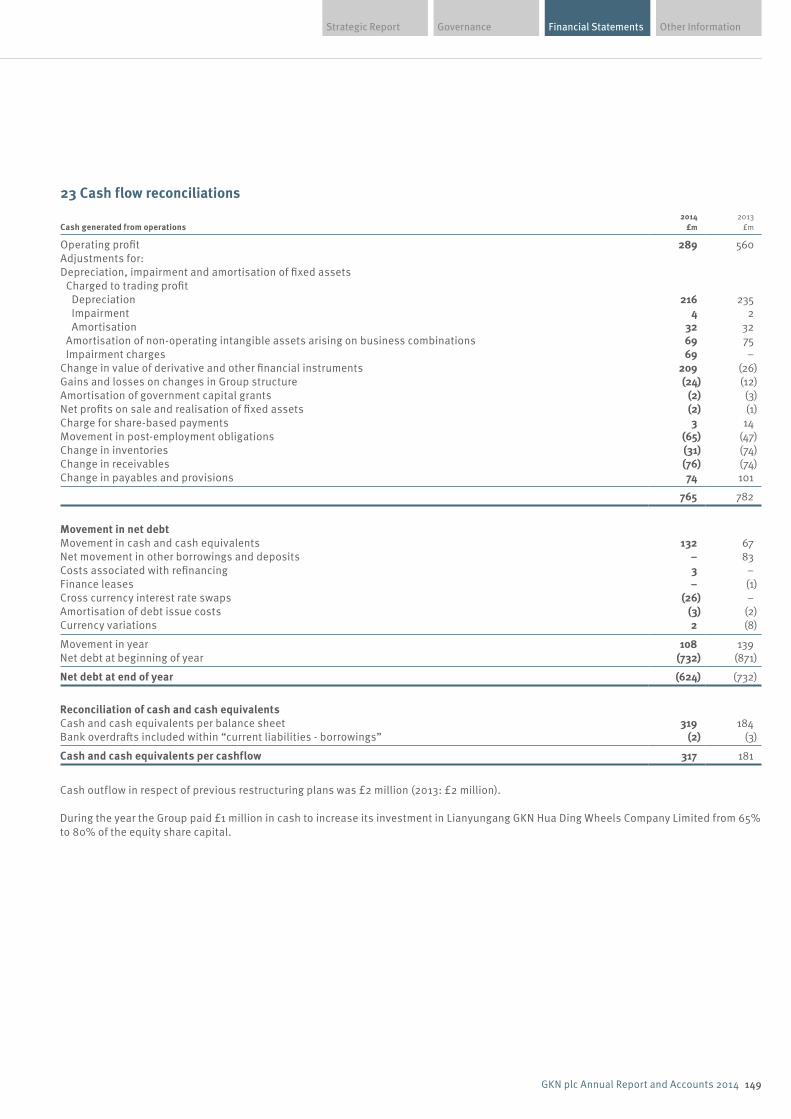
Financial Statements Other InformationGovernanceStrategic Report
149GKN plc Annual Report and Accounts 2014
23 Cash flow reconciliations
Cash generated from operations 2014
£m 2013
£m
Operating profit 289 560 Adjustments for:Depreciation, impairment and amortisation of fixed assets Charged to trading profit Depreciation 216 235 Impairment 4 2 Amortisation 32 32 Amortisation of non-operating intangible assets arising on business combinations 69 75 Impairment charges 69 – Change in value of derivative and other financial instruments 209 (26)Gains and losses on changes in Group structure (24) (12)Amortisation of government capital grants (2) (3)Net profits on sale and realisation of fixed assets (2) (1)Charge for share-based payments 3 14 Movement in post-employment obligations (65) (47)Change in inventories (31) (74)Change in receivables (76) (74)Change in payables and provisions 74 101
765 782
Movement in net debtMovement in cash and cash equivalents 132 67 Net movement in other borrowings and deposits – 83 Costs associated with refinancing 3 – Finance leases – (1)Cross currency interest rate swaps (26) – Amortisation of debt issue costs (3) (2)Currency variations 2 (8)
Movement in year 108 139 Net debt at beginning of year (732) (871)
Net debt at end of year (624) (732)
Reconciliation of cash and cash equivalentsCash and cash equivalents per balance sheet 319 184 Bank overdrafts included within “current liabilities - borrowings” (2) (3)
Cash and cash equivalents per cashflow 317 181
Cash outflow in respect of previous restructuring plans was £2 million (2013: £2 million).
During the year the Group paid £1 million in cash to increase its investment in Lianyungang GKN Hua Ding Wheels Company Limited from 65% to 80% of the equity share capital.
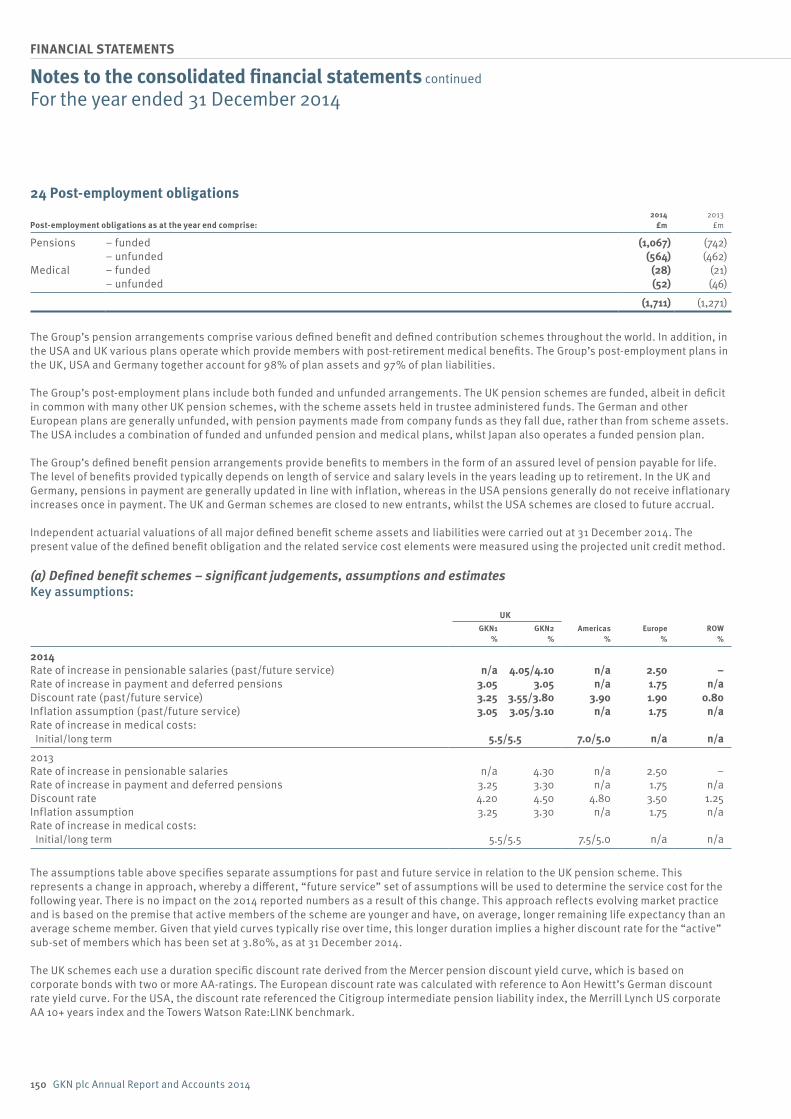
150 GKN plc Annual Report and Accounts 2014
FINANCIAL STATEMENTS
24 Post-employment obligations
Post-employment obligations as at the year end comprise:2014
£m 2013
£m
Pensions – funded (1,067) (742)– unfunded (564) (462)
Medical – funded (28) (21)– unfunded (52) (46)
(1,711) (1,271)
The Group’s pension arrangements comprise various defined benefit and defined contribution schemes throughout the world. In addition, in the USA and UK various plans operate which provide members with post-retirement medical benefits. The Group’s post-employment plans in the UK, USA and Germany together account for 98% of plan assets and 97% of plan liabilities.
The Group’s post-employment plans include both funded and unfunded arrangements. The UK pension schemes are funded, albeit in deficit in common with many other UK pension schemes, with the scheme assets held in trustee administered funds. The German and other European plans are generally unfunded, with pension payments made from company funds as they fall due, rather than from scheme assets. The USA includes a combination of funded and unfunded pension and medical plans, whilst Japan also operates a funded pension plan.
The Group’s defined benefit pension arrangements provide benefits to members in the form of an assured level of pension payable for life. The level of benefits provided typically depends on length of service and salary levels in the years leading up to retirement. In the UK and Germany, pensions in payment are generally updated in line with inflation, whereas in the USA pensions generally do not receive inflationary increases once in payment. The UK and German schemes are closed to new entrants, whilst the USA schemes are closed to future accrual.
Independent actuarial valuations of all major defined benefit scheme assets and liabilities were carried out at 31 December 2014. The present value of the defined benefit obligation and the related service cost elements were measured using the projected unit credit method.
(a) Defined benefit schemes – significant judgements, assumptions and estimatesKey assumptions:
UK
GKN1%
GKN2%
Americas%
Europe%
ROW%
2014Rate of increase in pensionable salaries (past/future service) n/a 4.05/4.10 n/a 2.50 –Rate of increase in payment and deferred pensions 3.05 3.05 n/a 1.75 n/aDiscount rate (past/future service) 3.25 3.55/3.80 3.90 1.90 0.80Inflation assumption (past/future service) 3.05 3.05/3.10 n/a 1.75 n/aRate of increase in medical costs: Initial/long term 5.5/5.5 7.0/5.0 n/a n/a
2013 Rate of increase in pensionable salaries n/a 4.30 n/a 2.50 –Rate of increase in payment and deferred pensions 3.25 3.30 n/a 1.75 n/aDiscount rate 4.20 4.50 4.80 3.50 1.25Inflation assumption 3.25 3.30 n/a 1.75 n/aRate of increase in medical costs: Initial/long term 5.5/5.5 7.5/5.0 n/a n/a
The assumptions table above specifies separate assumptions for past and future service in relation to the UK pension scheme. This represents a change in approach, whereby a different, “future service” set of assumptions will be used to determine the service cost for the following year. There is no impact on the 2014 reported numbers as a result of this change. This approach reflects evolving market practice and is based on the premise that active members of the scheme are younger and have, on average, longer remaining life expectancy than an average scheme member. Given that yield curves typically rise over time, this longer duration implies a higher discount rate for the “active” sub-set of members which has been set at 3.80%, as at 31 December 2014.
The UK schemes each use a duration specific discount rate derived from the Mercer pension discount yield curve, which is based on corporate bonds with two or more AA-ratings. The European discount rate was calculated with reference to Aon Hewitt’s German discount rate yield curve. For the USA, the discount rate referenced the Citigroup intermediate pension liability index, the Merrill Lynch US corporate AA 10+ years index and the Towers Watson Rate:LINK benchmark.
Notes to the consolidated financial statements continued
For the year ended 31 December 2014
Financial Statements Other InformationGovernanceStrategic Report
151GKN plc Annual Report and Accounts 2014
The underlying mortality assumptions for the major schemes, are as follows:
United KingdomThe key current year mortality assumptions for both GKN1 and GKN2 use S1NA year of birth mortality tables with CMI 2013 improvements and a 1.25% p.a. long term improvement trend. These assumptions give the following expectations for each scheme: for GKN1 a male aged 65 lives for a further 21.8 years and a female aged 65 lives for a further 23.8 years whilst a male aged 45 is expected to live a further 23.5 years from age 65 and a female aged 45 is expected to live a further 25.7 years from age 65. For GKN2 a male aged 65 lives for a further 22.8 years and a female aged 65 lives for a further 25.1 years whilst a male aged 45 is expected to live a further 24.6 years from age 65 and a female aged 45 is expected to live a further 27.1 years from age 65.
OverseasIn the USA, RP-2014 tables have been used whilst in Germany the RT2005-G tables have been used. In the USA, the longevity assumption for a male aged 65 is that he lives a further 21.6 years (female 23.8 years) whilst in Germany a male aged 65 lives for a further 18.6 years (female 22.8 years). The longevity assumption for a USA male currently aged 45 is that he also lives for a further 23.2 years once attaining 65 years (female 25.7 years), with the German equivalent assumption for a male being 21.5 years (female 25.5 years). These assumptions are based on the prescribed tables, rather than GKN experience.
Assumption sensitivity analysisThe impact of a one percentage point movement in the primary assumptions (longevity: 1 year) on the defined benefit obligations as at 31 December 2014 is set out below:
UK Americas Europe ROW Liabilities
£m Liabilities
£mLiabilities
£m Liabilities
£m
Discount rate +1% 472 39 89 3 Discount rate -1% (601) (48) (115) (2)Rate of inflation +1% (523) – (75) – Rate of inflation -1% 408 – 63 – Life expectancy +1 year (110) (8) (21) – Life expectancy -1 year 109 8 19 – Health cost trend +1% (2) (2) – – Health cost trend -1% 2 1 – –
The above sensitivity analyses are based on isolated changes in each assumption, whilst holding all other assumptions constant. In practice, this is unlikely to occur, and there is likely to be some level of correlation between movements in different assumptions. In addition, these sensitivities relate only to potential movement in the defined benefit obligations. The assets, including derivatives held by the schemes, have been designed to mitigate the impact of these movements to some extent, such that the movements in the defined benefit obligations shown above would, in practice be partly offset by movements in asset valuations. However, the above sensitivities are shown to illustrate at a high level the scale of sensitivity of the defined benefit obligations to key actuarial assumptions.
The same actuarial methods have been used to calculate these sensitivities as are used to calculate the relevant balance sheet values, and have not changed compared to the previous period.
Judgements and estimatesUSA Lump Sum settlementsDuring 2014 the Group undertook a voluntary lump sum programme in the USA, whereby deferred members of its USA pension schemes were offered the no-obligation opportunity to exchange their future pension rights for a cash lump sum. A settlement credit (£8 million) has been recognised in relation to this programme which is based on the differential between the actuarial valuations used for accounting purposes (£32 million) and the cash lump sum amounts (£24 million). The £8 million has been recorded within trading profit of Aerospace (£3 million), Driveline (£3 million) and Powder Metallurgy (£2 million).
Buy InDuring the year, a bulk annuity pensioner “buy-in” was transacted in relation to the UK pension scheme, GKN 1, as a result of which a proportion of GKN 1 liabilities are now fully insured. The transaction involved a payment to Rothesay Life of £123 million, made from GKN 1’s assets. The bulk annuity covers £110 million of pensioner liabilities valued on an IAS 19 accounting basis, as at 31 December 2014.
152 GKN plc Annual Report and Accounts 2014
FINANCIAL STATEMENTS
24 Post-employment obligations continued(a) Defined benefit schemes – significant judgements, assumptions and estimates continuedPension partnership interestOn 31 March 2010, the Group entered into a pension partnership arrangement with the Trustee of the UK pension scheme, which entitled the UK pension scheme to a distribution of £30 million per annum for 20 years, subject to discretion exercisable by the Group in certain circumstances.
The accounting and disclosure for this arrangement changed during 2013 following amendments to the pension partnership agreement which resulted in the income interest no longer meeting the criteria for recognition as an IAS 19 plan asset. This increased the Group’s reported post-employment obligation deficit by an amount of £342 million and eliminated the non-controlling interest of £332 million which was previously recognised in equity. The remaining difference of £10 million was recognised in equity within retained earnings, as it represented a transaction with equity holders.
During the year the Group has paid £30 million (2013: combined amount of £30 million) to the two UK pension schemes through the pension partnership and this is included within the amount of contributions/benefits paid. In 2013 £10 million was paid before the partnership agreement was amended and was treated as a distribution from the pension partnership, whilst £20 million was treated as a contribution/benefit paid.
(b) Defined benefit schemes – reportingThe amounts included in operating profit are:
Total £m
2014Current service cost and administrative expenses (52)Settlements/curtailment 9
(43)
2013Current service cost and administrative expenses (54)Settlements/curtailment –
(54)
The amounts recognised in the balance sheet are:
2014UK £m
Americas £m
Europe £m
ROW £m
Total £m
2013 £m
Present value of unfunded obligations (18) (43) (553) (2) (616) (508)Present value of funded obligations (3,364) (288) (40) (30) (3,722) (3,295)Fair value of plan assets 2,377 195 37 18 2,627 2,532
Net obligations recognised in the balance sheet (1,005) (136) (556) (14) (1,711) (1,271)
In the UK, the Group is required to complete a statutory valuation of its pension schemes at least every three years and to agree a recovery plan to eliminate any resulting deficit. Both UK pension schemes had a funding valuation as at 5 April 2013 and during the year final agreement on recovery plans with the scheme trustees was reached. The Group’s UK pension funding deficit is lower than the equivalent UK accounting deficit.
This has resulted in additional UK deficit recovery payments of £10 million per year which commenced in 2014 and the potential for further additional payments commencing in 2016, contingent upon asset performance. In addition the Group also agreed, during the year, to pay £2 million per year for 4 years to UK scheme, GKN1, to cover a funding requirement arising from a £123 million bulk annuity purchase.
The combined contribution for deficit funding and future accrual expected to be paid by the Group during 2015 to the UK schemes is £47 million. In addition, a distribution of £30 million is expected to be made from the UK pension partnership to the UK schemes in the first half of 2015, which brings the total expected UK cash requirement for 2015 to £77 million. The expected 2015 contribution to overseas schemes is £28 million.
Notes to the consolidated financial statements continued
For the year ended 31 December 2014
Financial Statements Other InformationGovernanceStrategic Report
153GKN plc Annual Report and Accounts 2014
Cumulative remeasurement of defined benefit plan differences recognised in equity are as follows:
2014 £m
2013 £m
At 1 January (727) (787)Remeasurement of defined benefit plans (485) 60
At 31 December (1,212) (727)
Movement in schemes’ obligations (funded and unfunded) during the year
UK £m
Americas £m
Europe £m
ROW £m
Total £m
At 1 January 2014 (2,989) (290) (491) (33) (3,803)Current service cost (37) (1) (9) (2) (49)Settlements and curtailments – 9 – – 9 Administrative expenses (2) (1) – – (3)Interest (130) (14) (16) – (160)Remeasurement of defined benefit plans (367) (54) (139) (1) (561)Benefits and administrative expenses paid 143 39 22 2 206 Currency variations – (19) 40 2 23
At 31 December 2014 (3,382) (331) (593) (32) (4,338)
At 1 January 2013 (2,863) (344) (490) (40) (3,737)Current service cost (39) (2) (8) (2) (51)Administrative expenses (3) – – – (3)Interest (116) (15) (16) (1) (148)Remeasurement of defined benefit plans (106) 30 17 (1) (60)Benefits and administrative expenses paid 138 37 21 4 200 Currency variations – 4 (15) 7 (4)
At 31 December 2013 (2,989) (290) (491) (33) (3,803)
Movement in schemes’ assets during the year
UK £m
Americas £m
Europe £m
ROW £m
Total £m
At 1 January 2014 2,275 203 36 18 2,532 Interest 99 10 1 – 110 Remeasurement of defined benefit plans 70 1 4 1 76 Contributions by Group 75 7 1 2 85 Benefits paid (142) (37) (2) (2) (183)Currency variations – 11 (3) (1) 7
At 31 December 2014 2,377 195 37 18 2,627
At 1 January 2013 2,522 181 36 20 2,759 Interest 95 7 1 – 103 Remeasurement of defined benefit plans 86 30 – 4 120 Contributions by Group 49 4 – 2 55 Benefits paid (135) (13) (1) (4) (153)Removal of pension partnership plan asset (342) – – – (342)Currency variations – (6) – (4) (10)
At 31 December 2013 2,275 203 36 18 2,532
154 GKN plc Annual Report and Accounts 2014
FINANCIAL STATEMENTS
24 Post-employment obligations continued(b) Defined benefit schemes – reporting continuedRemeasurement gains and losses in relation to schemes’ obligations are as follows
UK£m
Americas£m
Europe£m
ROW£m
Total £m
2014Experience gains and losses – (5) – – (5)Changes in financial assumptions (367) (31) (139) (1) (538)Change in demographic assumptions – (18) – – (18)
(367) (54) (139) (1) (561)
2013Experience gains and losses (5) 3 (5) – (7)Changes in financial assumptions (30) 28 22 (1) 19 Change in demographic assumptions (71) (1) – – (72)
(106) 30 17 (1) (60)
The fair values of the assets in the schemes were:
UK£m
Americas£m
Europe£m
ROW£m
Total £m
At 31 December 2014Equities (inc. hedge funds) 936 93 – 8 1,037 Diversified growth funds 250 – – – 250 Bonds – government 349 27 – 6 382 Bonds – corporate 567 70 – 1 638 Property 121 – – – 121 Cash, derivatives and net current assets 9 5 – – 14 Other assets 145 – 37 3 185
2,377 195 37 18 2,627
At 31 December 2013Equities (inc. hedge funds) 882 123 – 9 1,014 Bonds – government 443 33 – 5 481 Bonds – corporate 736 37 – 1 774 Property 104 – – – 104 Cash, derivatives and net current assets 78 10 – – 88 Other assets 32 – 36 3 71
2,275 203 36 18 2,532
As at 31 December 2014, the equities in the UK asset portfolio were split 26% domestic (2013: 26%); 74% foreign (2013: 74%), whilst bond holdings were 91% domestic (2013: 89%) and 9% foreign (2013: 11%). The equivalent proportions for the USA plans were: equities 41%/59% (2013: 75%/25%); bonds 91%/9% (2013: 97%/3%).
(c) Defined benefit scheme – risk factorsThrough its various post-employment pension and medical plans, the Group is exposed to a number of risks, the most significant of which are detailed below. The Group’s focus is on managing the cash demands which the various pension plans place on the Group, rather than balance sheet volatility in its own right. For funded schemes cash requirements are generally determined by funding valuations which are performed on a different basis from accounting valuations.
Asset volatility: Plan liabilities are calculated using discount rates set with reference to bond yields (although the discount rate methodology differs for accounting and funding purposes). If plan assets deliver a return which is lower than the discount rate, this will create or increase a plan deficit. GKN’s various pension plans hold a significant proportion of equities and similar ‘growth assets’, which are expected to out-perform bonds in the long term, albeit at the risk of short term volatility.
As the plans mature, with a shorter time horizon to cope with volatility, the Group will gradually reduce holdings of growth assets in favour of increased matching assets (bonds and similar). In the meantime, the Group considers that equities and similar assets are an appropriate means of managing pension funding requirements, given the long term nature of the liabilities and the strength of the Group to withstand volatility.
Notes to the consolidated financial statements continued
For the year ended 31 December 2014

Financial Statements Other InformationGovernanceStrategic Report
155GKN plc Annual Report and Accounts 2014
Changes in bond yields: A decrease in bond yields will typically increase plan liabilities (and vice-versa), although this will be offset partially by an increase in the value of bonds held in the asset portfolios of the various plans. The effect of changes in bond yields is more pronounced in unfunded schemes where there is no potential for an offsetting movement in asset values.
Inflation risk: As UK and some European pension obligations are linked to inflation, higher inflation expectations will lead to higher liabilities, although caps are in place to protect against unusually high levels of inflation. The UK asset portfolio includes some inflation linked bonds to provide an element of protection against this risk, whilst additional protection is provided by inflation derivatives.
Member longevity: As the Group’s post-employment obligations are generally to provide benefits for the life of the member, increases in life expectancy will generally result in an increase in plan liabilities (and vice versa).
(d) Defined benefit schemes – demographic factorsWeighted average duration is a measurement technique designed to represent the estimated average time to payment of all cash-flows arising as a result of defined benefit obligations (i.e. pension payments and similar). The weighted average duration (years) of the defined benefit obligations in the UK, USA and Germany are as follows:
2014 2013
UK GKN 1 11 11 GKN 2 17 17
USA 13 13 Germany 16 16
Defined benefit obligations are classified into those representing “active” members of a scheme or plan (i.e. those who are currently employed by the Group), “deferred” members (i.e. those who have accrued benefit entitlements, but who are no longer employed by the Group and are not yet drawing a pension) and “pensioner” members who are currently in receipt of a pension. Additional information regarding the average age, number of members and value of the defined benefit obligation in each of these categories for the UK, USA and Germany are given below:
Active Deferred Pensioner
Age Number Value (£m) Age Number
Value (£m) Age Number
Value (£m)
UK GKN 1 – – – 53 7,094 109 78 19,814 808 GKN 2 46 5,757 730 52 7,090 745 72 6,805 971
USA 53 2,685 110 56 1,396 39 74 4,417 168 Germany 51 2,571 247 56 883 44 71 2,966 252
Within the UK, there are two pension schemes referred to as GKN1 and GKN2. GKN1 is a mature scheme, comprised primarily of pensioner members, which is already at peak annual cash outflow (benefit payments); whilst GKN2 is less mature, with a larger active and deferred population. Benefit payments from GKN2 are forecast to continue to rise until the mid 2030s, when they will peak, before beginning to decline.
(e) Defined contribution schemesThe Group operates a number of defined contribution schemes outside the United Kingdom. The charge to the income statement in the year was £35 million (2013: £34 million).
25 Contingent assets and liabilitiesAside from the unrecognised contingent asset referred to in note 6 in respect of Franked Investment Income, there were no other material contingent assets at 31 December 2014 or 31 December 2013.
In the case of certain businesses, performance bonds and customer finance obligations have been entered into in the normal course of business.
156 GKN plc Annual Report and Accounts 2014
FINANCIAL STATEMENTS
26 Operating lease commitments – minimum lease payments The minimum lease payments which the Group is committed to make at 31 December are:
2014 2013
Property £m
Vehicles, plant and
equipment £m
Property £m
Vehicles, plant and
equipment £m
Payments under non-cancellable operating leases: Within one year 30 13 26 13 Later than one year and less than five years 106 22 86 24 After five years 158 2 119 3
294 37 231 40
27 Capital expenditureContracts placed against capital expenditure sanctioned at 31 December 2014 which are not provided by subsidiaries amounted to £126 million property, plant and equipment, £19 million intangible assets (2013: £91 million property, plant and equipment, £17 million intangible assets) and the Group’s share not provided by joint ventures amounted to £9 million property, plant and equipment, nil intangible assets (2013: £5 million property, plant and equipment, nil intangible assets).
28 Related party transactionsIn the ordinary course of business, sales and purchases of goods take place between subsidiaries and joint venture companies priced on an arm’s length basis. Sales by subsidiaries to joint ventures in 2014 totalled £45 million (2013: £44 million). The amount due at the year end in respect of such sales was £12 million (2013: £11 million). Purchases by subsidiaries from joint ventures in 2014 totalled £5 million (2013: £2 million). The amount due at the year end in respect of such purchases was £1 million (2013: nil).
At 31 December 2014, a Group subsidiary had £7 million payable to joint venture companies in respect of unsecured financing facilities bearing interest at 1 month LIBOR plus ⅛% (2013: £8 million).
There was no loan receivable from a joint venture at 31 December 2014 (2013: £8 million interest bearing at 4.5%).
During the year, a child of a member of key management was employed by a subsidiary company. The remuneration expense during the period of employment on an arm’s length basis amounted to £6,815.
29 Principal SubsidiariesThe following represent the principal subsidiary undertakings of the GKN Group at 31 December 2014. These subsidiaries were included in the consolidation and are held indirectly by GKN plc through intermediate holding companies. The undertakings located overseas operate principally in the country of incorporation. The equity share capital of these undertakings is wholly owned by the GKN Group.
A full list of subsidiaries and joint ventures will be attached to the next annual return of GKN plc.
Subsidiary Country of incorporation Interest
GKN Aerospace Chem-tronics Inc USA Common stockGKN Aerospace North America Inc USA Common stockGKN Aerospace Services Ltd England Ordinary sharesGKN Aerospace Sweden AB Sweden Ordinary sharesGKN do Brasil Ltda Brazil Quota capitalGKN Driveline Celaya SA de CV Mexico Ordinary sharesGKN Driveline Deutschland GmbH Germany Ordinary sharesGKN Driveline Japan Ltd Japan Ordinary sharesGKN Driveline Köping AB Sweden Ordinary sharesGKN Driveline Newton LLC* USA Membership interest (no share capital)GKN Driveline North America Inc USA Common stockGKN Driveline Polska Sp. Zo.o Poland Ordinary sharesGKN Sinter Metals LLC** USA Membership interest (no share capital)GKN Sinter Metals SpA Italy Ordinary sharesGKN Westland Aerospace Inc USA Common stockHoeganaes Corporation USA Common stockGKN Driveline Bowling Green Inc USA Common stockGKN Aerospace Norway AS Norway Ordinary shares* The principal place of business of GKN Driveline Newton LLC is 1848 GKN Way, Newton, North Carolina, USA.** The principal place of business of GKN Sinter Metals LLC is 2200 North Opdyke Road, Auburn Hills, Michigan, USA.
Notes to the consolidated financial statements continued
For the year ended 31 December 2014
Financial Statements Other InformationGovernanceStrategic Report
157GKN plc Annual Report and Accounts 2014
30 Business CombinationOn 1 April 2014 the Group acquired 100% of the equity share capital of Williams Hybrid Power Limited, now renamed GKN Hybrid Power Limited, from Williams Grand Prix Engineering Limited. GKN Hybrid Power Limited specialises in the design and manufacture of composite flywheel-based energy storage systems, initially exploring options for the bus, truck and tram markets.
The fair value consideration of £11 million comprises an initial cash investment of £8 million, plus contingent consideration estimated at £3 million. The range of the contingent consideration payment, based on specific sales from GKN Hybrid Power Limited at a contractual royalty rate is unlimited. The fair value of net assets acquired of £11 million, comprises; property, plant and equipment of £1 million, a technology based non-operating intangible asset of £7 million, a marketing related non-operating intangible asset of £2 million, a deferred tax liability of £1 million and goodwill of £2 million. GKN Hybrid Power Limited has been included in Other businesses for segmental reporting.
From the date of acquisition to the balance sheet date, GKN Hybrid Power Limited contributed £6 million to sales and a trading loss of £2 million. If the acquisition had been completed on 1 January 2014 the Group’s statutory sales and trading profit for the year ended 31 December 2014 are estimated at £6,983 million and £611 million respectively.
Goodwill (which is not tax deductible) is attributable to the value of the assembled workforce and expected future sales synergies from combination with the Group’s existing business.
158 GKN plc Annual Report and Accounts 2014
FINANCIAL STATEMENTS
Report on the Company financial statementsOur opinionIn our opinion, GKN plc’s Company financial statements (the “financial statements”):• give a true and fair view of the state of the Company’s affairs
as at 31 December 2014;• have been properly prepared in accordance with United Kingdom
Generally Accepted Accounting Practice; and• have been prepared in accordance with the requirements of the
Companies Act 2006.
What we have auditedGKN plc’s financial statements comprise:• the Balance sheet of GKN plc as at 31 December 2014; and• the notes to the financial statements, which include a
summary of significant accounting policies and other explanatory information.
Certain required disclosures have been presented elsewhere in the Annual Report and Accounts (the “Annual Report”), rather than in the notes to the financial statements. These are cross-referenced from the financial statements and are identified as audited.
The financial reporting framework that has been applied in the preparation of the financial statements is applicable law and United Kingdom Accounting Standards (United Kingdom Generally Accepted Accounting Practice).
Other required reportingConsistency of other informationCompanies Act 2006 opinionIn our opinion, the information given in the Strategic Report and the Directors’ report for the financial year for which the financial statements are prepared is consistent with the financial statements.
ISAs (UK & Ireland) reportingUnder International Standards on Auditing (UK and Ireland) (“ISAs (UK & Ireland)”) we are required to report to you if, in our opinion, information in the Annual Report is:• materially inconsistent with the information in the audited
financial statements; or• apparently materially incorrect based on, or materially
inconsistent with, our knowledge of the company acquired in the course of performing our audit; or
• otherwise misleading.
We have no exceptions to report arising from this responsibility.
Adequacy of accounting records and information and explanations receivedUnder the Companies Act 2006 we are required to report to you if, in our opinion:• we have not received all the information and explanations we
require for our audit; or• adequate accounting records have not been kept by the Company,
or returns adequate for our audit have not been received from branches not visited by us; or
• the financial statements and the part of the Directors’ remuneration report to be audited are not in agreement with the accounting records and returns.
We have no exceptions to report arising from this responsibility.
Directors’ remunerationDirectors’ remuneration report – Companies Act 2006 opinionIn our opinion, the part of the Directors’ remuneration report to be audited has been properly prepared in accordance with the Companies Act 2006.
Other Companies Act 2006 reportingUnder the Companies Act 2006 we are required to report to you if, in our opinion, certain disclosures of Directors’ remuneration specified by law are not made. We have no exceptions to report arising from this responsibility.
Responsibilities for the financial statements and the auditOur responsibilities and those of the DirectorsAs explained more fully in the Statement of Directors’ responsibilities set out on page 102, the Directors are responsible for the preparation of the financial statements and for being satisfied that they give a true and fair view.
Our responsibility is to audit and express an opinion on the financial statements in accordance with applicable law and ISAs (UK & Ireland). Those standards require us to comply with the Auditing Practices Board’s Ethical Standards for Auditors.
This report, including the opinions, has been prepared for and only for the Company’s members as a body in accordance with Chapter 3 of Part 16 of the Companies Act 2006 and for no other purpose. We do not, in giving these opinions, accept or assume responsibility for any other purpose or to any other person to whom this report is shown or into whose hands it may come save where expressly agreed by our prior consent in writing.
Independent auditors’ report to the members of GKN plc
Financial Statements Other InformationGovernanceStrategic Report
159GKN plc Annual Report and Accounts 2014
What an audit of financial statements involvesWe conducted our audit in accordance with ISAs (UK & Ireland). An audit involves obtaining evidence about the amounts and disclosures in the financial statements sufficient to give reasonable assurance that the financial statements are free from material misstatement, whether caused by fraud or error. This includes an assessment of: • whether the accounting policies are appropriate to the Company’s
circumstances and have been consistently applied and adequately disclosed;
• the reasonableness of significant accounting estimates made by the Directors; and
• the overall presentation of the financial statements.
We primarily focus our work in these areas by assessing the Directors’ judgements against available evidence, forming our own judgements, and evaluating the disclosures in the financial statements.
We test and examine information, using sampling and other auditing techniques, to the extent we consider necessary to provide a reasonable basis for us to draw conclusions. We obtain audit evidence through testing the effectiveness of controls, substantive procedures or a combination of both.
In addition, we read all the financial and non-financial information in the Annual Report to identify material inconsistencies with the audited financial statements and to identify any information that is apparently materially incorrect based on, or materially inconsistent with, the knowledge acquired by us in the course of performing the audit. If we become aware of any apparent material misstatements or inconsistencies we consider the implications for our report.
Other matterWe have reported separately on the Group financial statements of GKN plc for the year ended 31 December 2014.
Ian Chambers (Senior Statutory Auditor)for and on behalf of PricewaterhouseCoopers LLPChartered Accountants and Statutory AuditorsBirmingham23 February 2015
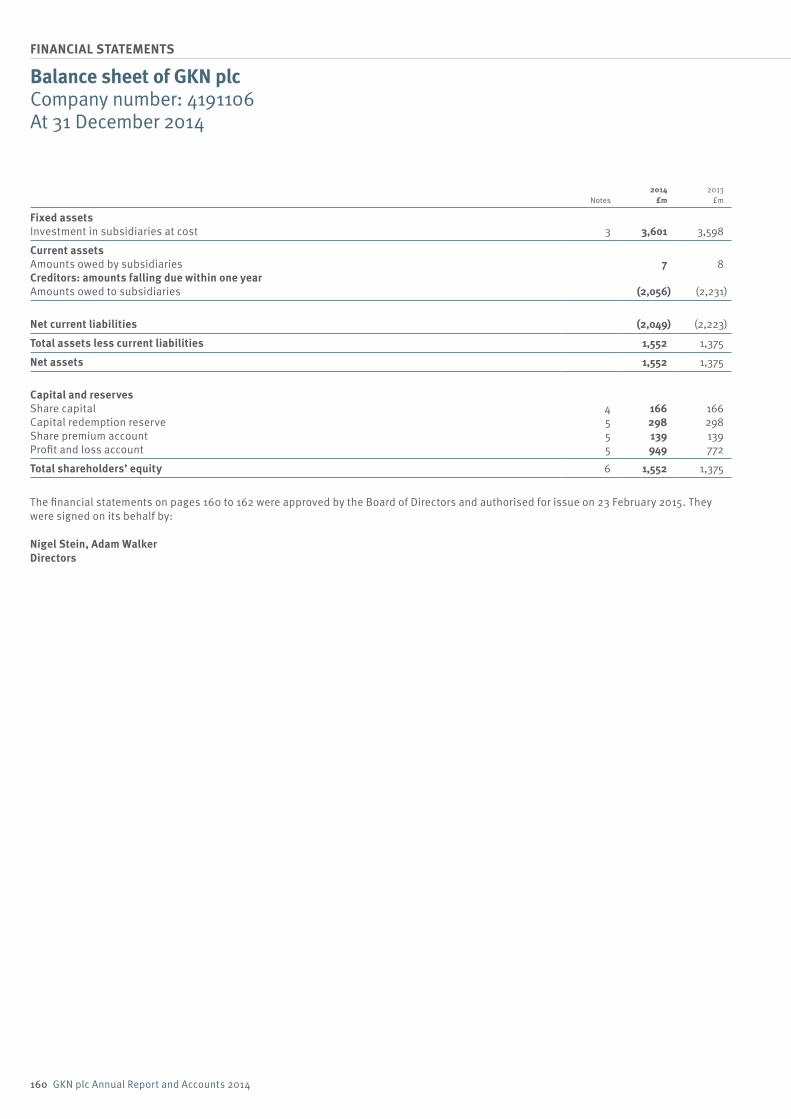
160 GKN plc Annual Report and Accounts 2014
FINANCIAL STATEMENTS
Notes2014
£m2013
£m
Fixed assetsInvestment in subsidiaries at cost 3 3,601 3,598
Current assetsAmounts owed by subsidiaries 7 8 Creditors: amounts falling due within one yearAmounts owed to subsidiaries (2,056) (2,231)
Net current liabilities (2,049) (2,223)
Total assets less current liabilities 1,552 1,375
Net assets 1,552 1,375
Capital and reservesShare capital 4 166 166 Capital redemption reserve 5 298 298 Share premium account 5 139 139 Profit and loss account 5 949 772
Total shareholders’ equity 6 1,552 1,375
The financial statements on pages 160 to 162 were approved by the Board of Directors and authorised for issue on 23 February 2015. They were signed on its behalf by:
Nigel Stein, Adam WalkerDirectors
Balance sheet of GKN plcCompany number: 4191106At 31 December 2014
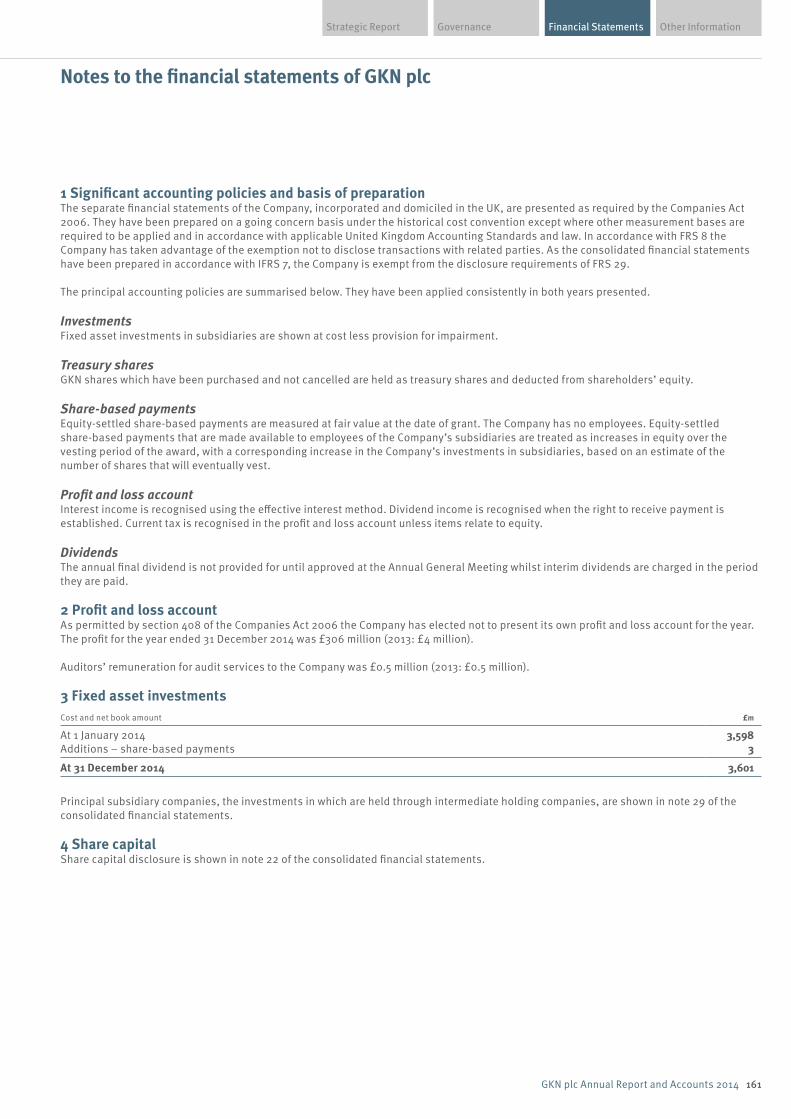
Financial Statements Other InformationGovernanceStrategic Report
161GKN plc Annual Report and Accounts 2014
1 Significant accounting policies and basis of preparationThe separate financial statements of the Company, incorporated and domiciled in the UK, are presented as required by the Companies Act 2006. They have been prepared on a going concern basis under the historical cost convention except where other measurement bases are required to be applied and in accordance with applicable United Kingdom Accounting Standards and law. In accordance with FRS 8 the Company has taken advantage of the exemption not to disclose transactions with related parties. As the consolidated financial statements have been prepared in accordance with IFRS 7, the Company is exempt from the disclosure requirements of FRS 29.
The principal accounting policies are summarised below. They have been applied consistently in both years presented.
InvestmentsFixed asset investments in subsidiaries are shown at cost less provision for impairment.
Treasury shares GKN shares which have been purchased and not cancelled are held as treasury shares and deducted from shareholders’ equity.
Share-based payments Equity-settled share-based payments are measured at fair value at the date of grant. The Company has no employees. Equity-settled share-based payments that are made available to employees of the Company’s subsidiaries are treated as increases in equity over the vesting period of the award, with a corresponding increase in the Company’s investments in subsidiaries, based on an estimate of the number of shares that will eventually vest.
Profit and loss accountInterest income is recognised using the effective interest method. Dividend income is recognised when the right to receive payment is established. Current tax is recognised in the profit and loss account unless items relate to equity.
DividendsThe annual final dividend is not provided for until approved at the Annual General Meeting whilst interim dividends are charged in the period they are paid.
2 Profit and loss accountAs permitted by section 408 of the Companies Act 2006 the Company has elected not to present its own profit and loss account for the year. The profit for the year ended 31 December 2014 was £306 million (2013: £4 million).
Auditors’ remuneration for audit services to the Company was £0.5 million (2013: £0.5 million).
3 Fixed asset investmentsCost and net book amount £m
At 1 January 2014 3,598 Additions – share-based payments 3
At 31 December 2014 3,601
Principal subsidiary companies, the investments in which are held through intermediate holding companies, are shown in note 29 of the consolidated financial statements.
4 Share capital Share capital disclosure is shown in note 22 of the consolidated financial statements.
Notes to the financial statements of GKN plc
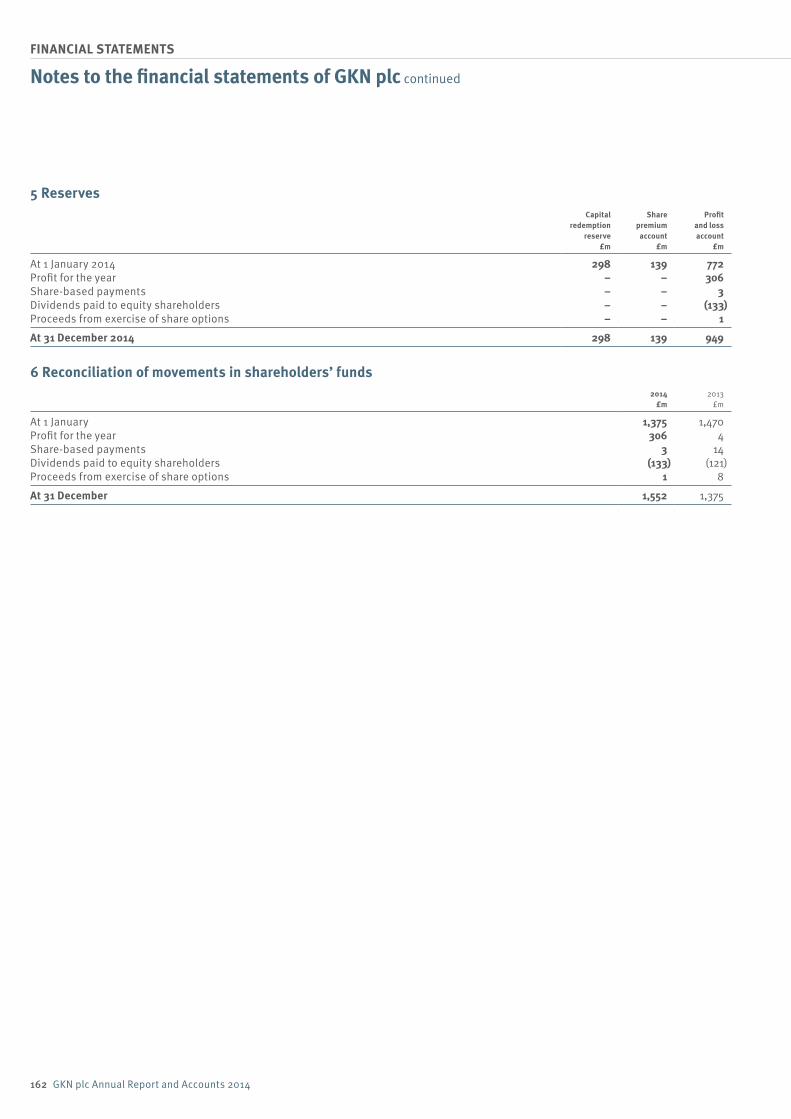
162 GKN plc Annual Report and Accounts 2014
FINANCIAL STATEMENTS
5 Reserves
Capital redemption
reserve £m
Share premium account
£m
Profit and loss account
£m
At 1 January 2014 298 139 772 Profit for the year – – 306 Share-based payments – – 3 Dividends paid to equity shareholders – – (133)Proceeds from exercise of share options – – 1
At 31 December 2014 298 139 949
6 Reconciliation of movements in shareholders’ funds
2014
£m 2013
£m
At 1 January 1,375 1,470 Profit for the year 306 4 Share-based payments 3 14 Dividends paid to equity shareholders (133) (121)Proceeds from exercise of share options 1 8
At 31 December 1,552 1,375
Notes to the financial statements of GKN plc continued
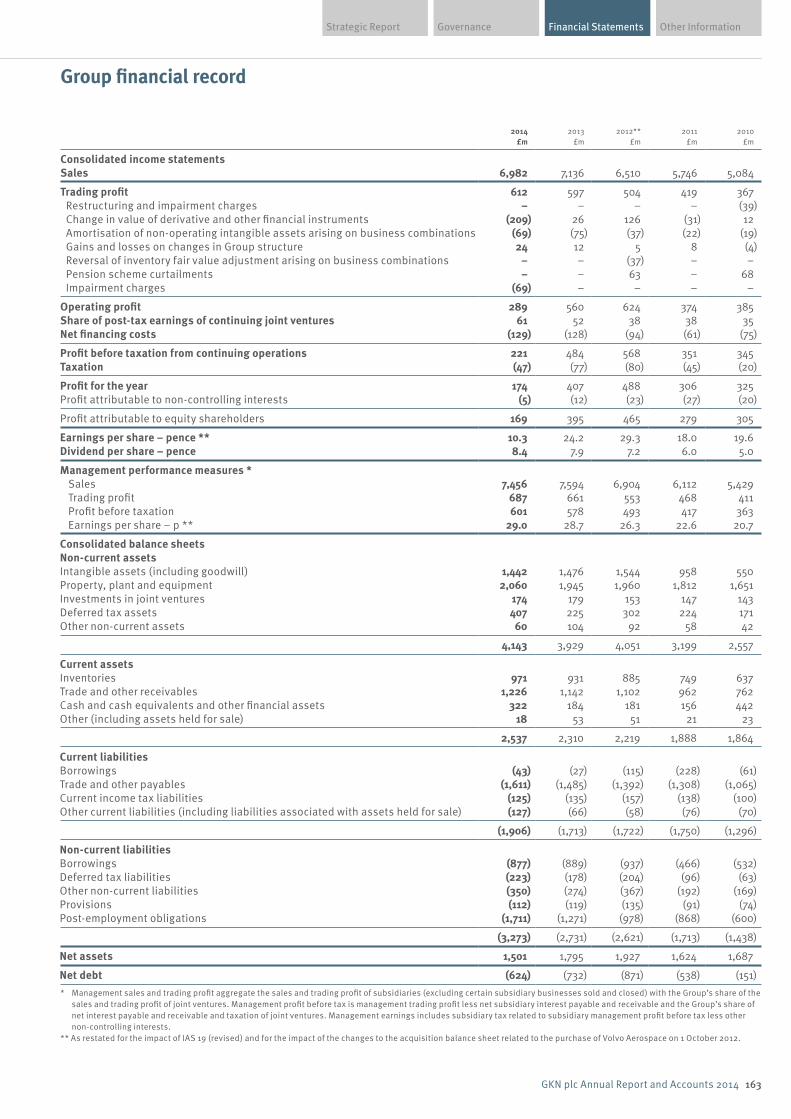
Financial Statements Other InformationGovernanceStrategic Report
163GKN plc Annual Report and Accounts 2014
2014 £m
2013 £m
2012** £m
2011 £m
2010 £m
Consolidated income statementsSales 6,982 7,136 6,510 5,746 5,084
Trading profit 612 597 504 419 367 Restructuring and impairment charges – – – – (39) Change in value of derivative and other financial instruments (209) 26 126 (31) 12 Amortisation of non-operating intangible assets arising on business combinations (69) (75) (37) (22) (19) Gains and losses on changes in Group structure 24 12 5 8 (4) Reversal of inventory fair value adjustment arising on business combinations – – (37) – – Pension scheme curtailments – – 63 – 68 Impairment charges (69) – – – –
Operating profit 289 560 624 374 385 Share of post-tax earnings of continuing joint ventures 61 52 38 38 35 Net financing costs (129) (128) (94) (61) (75)
Profit before taxation from continuing operations 221 484 568 351 345 Taxation (47) (77) (80) (45) (20)
Profit for the year 174 407 488 306 325 Profit attributable to non-controlling interests (5) (12) (23) (27) (20)
Profit attributable to equity shareholders 169 395 465 279 305
Earnings per share – pence ** 10.3 24.2 29.3 18.0 19.6 Dividend per share – pence 8.4 7.9 7.2 6.0 5.0
Management performance measures * Sales 7,456 7,594 6,904 6,112 5,429 Trading profit 687 661 553 468 411 Profit before taxation 601 578 493 417 363 Earnings per share – p ** 29.0 28.7 26.3 22.6 20.7
Consolidated balance sheetsNon-current assetsIntangible assets (including goodwill) 1,442 1,476 1,544 958 550 Property, plant and equipment 2,060 1,945 1,960 1,812 1,651 Investments in joint ventures 174 179 153 147 143 Deferred tax assets 407 225 302 224 171 Other non-current assets 60 104 92 58 42
4,143 3,929 4,051 3,199 2,557
Current assetsInventories 971 931 885 749 637 Trade and other receivables 1,226 1,142 1,102 962 762 Cash and cash equivalents and other financial assets 322 184 181 156 442 Other (including assets held for sale) 18 53 51 21 23
2,537 2,310 2,219 1,888 1,864
Current liabilitiesBorrowings (43) (27) (115) (228) (61)Trade and other payables (1,611) (1,485) (1,392) (1,308) (1,065)Current income tax liabilities (125) (135) (157) (138) (100)Other current liabilities (including liabilities associated with assets held for sale) (127) (66) (58) (76) (70)
(1,906) (1,713) (1,722) (1,750) (1,296)
Non-current liabilitiesBorrowings (877) (889) (937) (466) (532)Deferred tax liabilities (223) (178) (204) (96) (63)Other non-current liabilities (350) (274) (367) (192) (169)Provisions (112) (119) (135) (91) (74)Post-employment obligations (1,711) (1,271) (978) (868) (600)
(3,273) (2,731) (2,621) (1,713) (1,438)
Net assets 1,501 1,795 1,927 1,624 1,687
Net debt (624) (732) (871) (538) (151)* Management sales and trading profit aggregate the sales and trading profit of subsidiaries (excluding certain subsidiary businesses sold and closed) with the Group’s share of the
sales and trading profit of joint ventures. Management profit before tax is management trading profit less net subsidiary interest payable and receivable and the Group’s share of net interest payable and receivable and taxation of joint ventures. Management earnings includes subsidiary tax related to subsidiary management profit before tax less other non-controlling interests.
** As restated for the impact of IAS 19 (revised) and for the impact of the changes to the acquisition balance sheet related to the purchase of Volvo Aerospace on 1 October 2012.
Group financial record
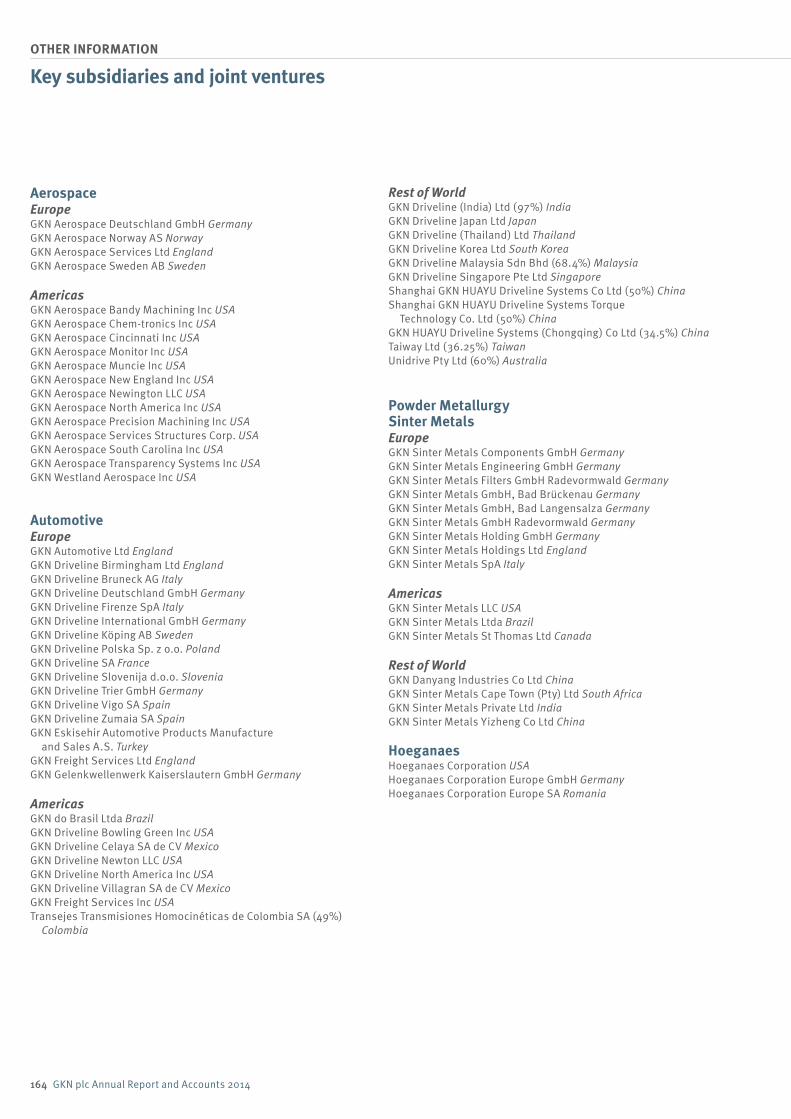
164 GKN plc Annual Report and Accounts 2014
OTHER INFORMATION
Key subsidiaries and joint ventures
AerospaceEuropeGKN Aerospace Deutschland GmbH GermanyGKN Aerospace Norway AS NorwayGKN Aerospace Services Ltd EnglandGKN Aerospace Sweden AB Sweden
AmericasGKN Aerospace Bandy Machining Inc USAGKN Aerospace Chem-tronics Inc USAGKN Aerospace Cincinnati Inc USAGKN Aerospace Monitor Inc USAGKN Aerospace Muncie Inc USAGKN Aerospace New England Inc USAGKN Aerospace Newington LLC USAGKN Aerospace North America Inc USAGKN Aerospace Precision Machining Inc USAGKN Aerospace Services Structures Corp. USAGKN Aerospace South Carolina Inc USAGKN Aerospace Transparency Systems Inc USAGKN Westland Aerospace Inc USA
AutomotiveEuropeGKN Automotive Ltd EnglandGKN Driveline Birmingham Ltd EnglandGKN Driveline Bruneck AG ItalyGKN Driveline Deutschland GmbH GermanyGKN Driveline Firenze SpA ItalyGKN Driveline International GmbH GermanyGKN Driveline Köping AB SwedenGKN Driveline Polska Sp. z o.o. PolandGKN Driveline SA FranceGKN Driveline Slovenija d.o.o. SloveniaGKN Driveline Trier GmbH GermanyGKN Driveline Vigo SA SpainGKN Driveline Zumaia SA SpainGKN Eskisehir Automotive Products Manufacture
and Sales A.S. TurkeyGKN Freight Services Ltd EnglandGKN Gelenkwellenwerk Kaiserslautern GmbH Germany
AmericasGKN do Brasil Ltda BrazilGKN Driveline Bowling Green Inc USAGKN Driveline Celaya SA de CV MexicoGKN Driveline Newton LLC USAGKN Driveline North America Inc USAGKN Driveline Villagran SA de CV MexicoGKN Freight Services Inc USATransejes Transmisiones Homocinéticas de Colombia SA (49%)
Colombia
Rest of WorldGKN Driveline (India) Ltd (97%) IndiaGKN Driveline Japan Ltd JapanGKN Driveline (Thailand) Ltd ThailandGKN Driveline Korea Ltd South KoreaGKN Driveline Malaysia Sdn Bhd (68.4%) MalaysiaGKN Driveline Singapore Pte Ltd SingaporeShanghai GKN HUAYU Driveline Systems Co Ltd (50%) ChinaShanghai GKN HUAYU Driveline Systems Torque
Technology Co. Ltd (50%) ChinaGKN HUAYU Driveline Systems (Chongqing) Co Ltd (34.5%) ChinaTaiway Ltd (36.25%) Taiwan Unidrive Pty Ltd (60%) Australia
Powder MetallurgySinter MetalsEuropeGKN Sinter Metals Components GmbH GermanyGKN Sinter Metals Engineering GmbH GermanyGKN Sinter Metals Filters GmbH Radevormwald GermanyGKN Sinter Metals GmbH, Bad Brückenau GermanyGKN Sinter Metals GmbH, Bad Langensalza GermanyGKN Sinter Metals GmbH Radevormwald GermanyGKN Sinter Metals Holding GmbH GermanyGKN Sinter Metals Holdings Ltd EnglandGKN Sinter Metals SpA Italy
AmericasGKN Sinter Metals LLC USAGKN Sinter Metals Ltda BrazilGKN Sinter Metals St Thomas Ltd Canada
Rest of WorldGKN Danyang Industries Co Ltd ChinaGKN Sinter Metals Cape Town (Pty) Ltd South AfricaGKN Sinter Metals Private Ltd IndiaGKN Sinter Metals Yizheng Co Ltd China
HoeganaesHoeganaes Corporation USAHoeganaes Corporation Europe GmbH GermanyHoeganaes Corporation Europe SA Romania
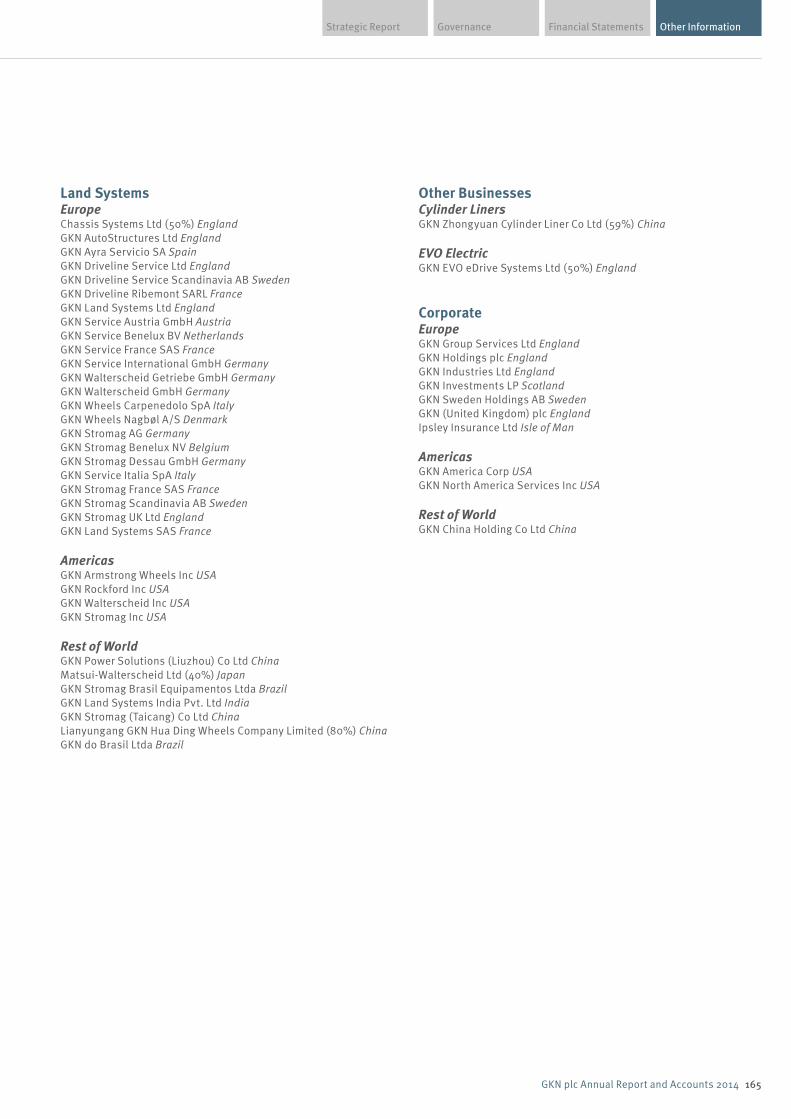
GovernanceStrategic Report
165GKN plc Annual Report and Accounts 2014
Other InformationFinancial Statements
Land SystemsEuropeChassis Systems Ltd (50%) EnglandGKN AutoStructures Ltd EnglandGKN Ayra Servicio SA SpainGKN Driveline Service Ltd EnglandGKN Driveline Service Scandinavia AB SwedenGKN Driveline Ribemont SARL FranceGKN Land Systems Ltd EnglandGKN Service Austria GmbH AustriaGKN Service Benelux BV NetherlandsGKN Service France SAS FranceGKN Service International GmbH GermanyGKN Walterscheid Getriebe GmbH GermanyGKN Walterscheid GmbH GermanyGKN Wheels Carpenedolo SpA ItalyGKN Wheels Nagbøl A/S DenmarkGKN Stromag AG GermanyGKN Stromag Benelux NV BelgiumGKN Stromag Dessau GmbH GermanyGKN Service Italia SpA ItalyGKN Stromag France SAS FranceGKN Stromag Scandinavia AB SwedenGKN Stromag UK Ltd EnglandGKN Land Systems SAS France
AmericasGKN Armstrong Wheels Inc USAGKN Rockford Inc USAGKN Walterscheid Inc USAGKN Stromag Inc USA
Rest of WorldGKN Power Solutions (Liuzhou) Co Ltd ChinaMatsui-Walterscheid Ltd (40%) JapanGKN Stromag Brasil Equipamentos Ltda BrazilGKN Land Systems India Pvt. Ltd IndiaGKN Stromag (Taicang) Co Ltd ChinaLianyungang GKN Hua Ding Wheels Company Limited (80%) ChinaGKN do Brasil Ltda Brazil
Other BusinessesCylinder LinersGKN Zhongyuan Cylinder Liner Co Ltd (59%) China
EVO ElectricGKN EVO eDrive Systems Ltd (50%) England
CorporateEuropeGKN Group Services Ltd EnglandGKN Holdings plc EnglandGKN Industries Ltd EnglandGKN Investments LP ScotlandGKN Sweden Holdings AB SwedenGKN (United Kingdom) plc EnglandIpsley Insurance Ltd Isle of Man
AmericasGKN America Corp USAGKN North America Services Inc USA
Rest of WorldGKN China Holding Co Ltd China
166 GKN plc Annual Report and Accounts 2014
OTHER INFORMATION
Shareholder information
Financial calendar 2015Ex-dividend date for 2014 final dividend 9 April 20152014 final dividend record date 10 April 2015Final date for receipt of DRIP mandates 24 April 2015Annual general meeting 7 May 20152014 final dividend payable 18 May 2015Ex- dividend date for 2015 interim dividend* 13 August 20152015 interim dividend record date* 14 August 20152015 interim dividend payable* 21 September 2015
* please note that these dates are provisional and may be subject to change.
Annual general meetingThe annual general meeting (AGM) will be held on Thursday 7 May 2015 at 195 Piccadilly, London W1J 9LN, commencing at 2.00 pm. The notice of meeting, together with an explanation of the resolutions to be considered at the meeting, is contained within the AGM circular.
GKN website and share price informationInformation on GKN, including this and prior years’ annual reports, results announcements and presentations together with the GKN share price, is available on our website at www.gkn.com.
Shareholding enquiries and informationGKN’s register of members is maintained by Equiniti who act as our registrar. If you have any questions about your shareholding or you require any other guidance you can contact Equiniti as follows:
Equiniti Aspect House Spencer Road Lancing West Sussex BN99 6DA
Tel: 0871 384 2962** (+44 121 415 7039 from outside the UK)
Correspondence should refer to GKN and include your full name, address and, if available, the 8 or 11 digit reference number which can be found on your GKN share certificate, dividend stationery or proxy card.
A range of shareholder information is available online at Equiniti’s website www.shareview.co.uk. Here you can also view information on your shareholding and obtain forms that you may need to manage your shareholding, such as a change of address form or a stock transfer form.
Share dealing serviceGKN shares can be traded via the internet or by phone through Shareview Dealing, a service provided by Equiniti Financial Services Ltd. For further details, visit www.shareview.co.uk/dealing or call Equiniti on 08456 037 037. Equiniti Financial Services Ltd is authorised and regulated by the UK Financial Conduct Authority. The registered details of the provider are available from the above number.
A telephone dealing service is also available through Stocktrade. For further details telephone 0845 601 0995 (+44 131 240 0414 from outside the UK) and quote reference Low Co139.
GKN does not endorse or recommend any particular share dealing service. The value of shares can fall and you may get back less than you invest; if you are unsure as to the suitability of an investment you should seek professional advice.
Dividend reinvestment plan (DRIP)GKN offers a DRIP which enables shareholders to reinvest their cash dividends to buy additional GKN shares. If you would like more information about the DRIP or would like to apply online, please go to Equiniti’s website www.shareview.co.uk or call the shareholder helpline on 0871 384 2962**.
American Depositary ReceiptsGKN has a sponsored Level 1 American Depositary Receipt (ADR) facility in the US, with each ADR representing one GKN ordinary share. GKN’s ADRs are traded on the US over-the-counter (OTC) market under the symbol ‘GKNLY’. The ADR facility is managed by The Bank of New York Mellon.
Dividend payments are generally taxable and will be distributed to ADR holders in US Dollars by The Bank of New York Mellon.
Any queries relating to GKN’s ADR facility should be directed to The Bank of New York Mellon:
BNY Mellon Shareowner ServicesP.O. Box 30170College Station, TX 77842-3170
Tel. +1 888-269-2377 (toll-free number in the U.S.)
Tel. +1 201 680 6825 (international) Website: www.mybnymdr.comE-Mail: [email protected]
Electronic communicationsAs an alternative to receiving documents in hard copy, shareholders can elect to be notified by email as soon as shareholder documents such as our annual report and notice of meeting are published. This notification includes details of where you can view or download the documents on our website. Shareholders who wish to register for email notification can do so via Equiniti’s website www.shareview.co.uk.
Capital gains taxA capital gains tax (CGT) liability may arise when you dispose of an asset (e.g. shares) which is worth more when you sell it than when you acquired it.
Over the years the capital structure of GKN plc has changed. Events that may need to be considered when calculating any CGT liability in relation to our shares are set out in the following paragraphs.
** Calls to this number cost 8p per minute plus network extras. Lines are open 8.30 am to 5.30 pm, Monday to Friday excluding UK bank holidays.
GovernanceStrategic Report
167GKN plc Annual Report and Accounts 2014
Other InformationFinancial Statements
2001 demerger of the industrial services businessesThe market values of a GKN ordinary share and a Brambles Industries plc (Brambles) ordinary share on 7 August 2001 (the first day of trading of Brambles shares) to be used to allocate the base cost of GKN ordinary shares acquired since 31 March 1982 are: GKN ordinary shares – 282.5p (43.943224%) and Brambles ordinary shares – 360.375p (56.056776%).
2000 ‘B’ share issueThe market values of a GKN ordinary share and a GKN ‘B’ share on 30 May 2000 (the first day of trading of ‘B’ shares) to be used to allocate the base cost of GKN ordinary shares acquired since 31 March 1982 are: GKN ordinary shares – 914.5p (98.736774%) and GKN ‘B’ shares – 11.7p (1.263226%).
1982 base valuesThe adjusted 31 March 1982 base value of one GKN ordinary share held immediately before the 2009 capital reorganisation and rights issue was 45.501p. The adjusted base value immediately after the capital reorganisation and rights issue was 47.955p.
This information is provided primarily for the purpose of individual shareholders resident in the UK when calculating their personal tax liability. Shareholders who are in any doubt as to their tax position or who may be subject to tax in a jurisdiction other than the UK should seek professional advice. Neither GKN plc nor our registrar can advise on CGT matters.
Shareholder analysis Holdings of ordinary shares at 31 December 2014.
Shareholders Shares
Holdings Number %Number (million) %
Holdings1–500 6,427 26.6 1.4 0.1501–1,000 3,954 16.4 3.0 0.21,001–5,000 9,817 40.6 23.2 1.45,001–50,000 3,178 13.2 37.2 2.350,001–100,000 170 0.7 12.1 0.7100,001–500,000 302 1.2 72.1 4.4500,001–1,000,000 84 0.4 60.0 3.6above 1,000,000 219 0.9 1,434 87.3
24,151 100 1,643 100
Shareholder type
Individuals 18,591 77.0 49.4 3.0Institutions 1,592 6.6 1,432.0 87.2Other corporates 3,968 16.4 161.6 9.8
24,151 100 1,643 100
In addition, GKN held 17,797,916 ordinary shares in treasury as at 31 December 2014.
168 GKN plc Annual Report and Accounts 2014
OTHER INFORMATION
Shareholder security We are aware that a small number of shareholders have received unsolicited telephone calls concerning their investment in GKN. These calls are from overseas based organisations who offer to buy GKN shares for considerably more than the current market price. In some cases the caller has suggested that there is currently a takeover offer for GKN. There is no such offer and we suspect that the calls are bogus.
Shareholders are advised to be very wary of any unsolicited investment advice, offers to buy shares or offers of free company reports. Operations, commonly known as ‘boiler rooms’, are targeting UK shareholders and callers can be very persistent and extremely persuasive. We are aware that they attempt to persuade individuals to provide email addresses or other personal information; shareholders are strongly advised not to provide any such details.
The Financial Conduct Authority (FCA) provides the following guidance should you be contacted in this manner:• obtain the name of the person calling and the organisation they represent;• check that they are properly authorised by the Financial Conduct Authority by checking the FCA register of regulated firms at
www.fca.org.uk/firms/systems-reporting/register/search;• call the organisation back to verify their identity using the telephone number listed for them on the FCA register; • search the FCA list of unauthorised firms and individuals to avoid doing business with at www.fca.org.uk/consumers/protect-
yourself/unauthorised-firms/unauthorised-firms-to-avoid. If you deal with an unauthorised firm you will not be eligible to receive payment under the Financial Services Compensation Scheme;
• report any suspicions to the FCA either by calling 0800 111 6768 or completing the online form at www.fca.org.uk/consumers/scams/report-scam/share-fraud-form; and
• if the calls persist, hang up.
To reduce the risk of becoming a victim of fraud you should: • Ensure all your certificates are stored in a safe place, or hold your shares electronically in CREST (electronic settlement system for UK
and Irish securities) via a nominee. • Reduce the number of cold calls you receive by registering with the Telephone Preference Service on 0845 070 0707 or by
visiting www.tpsonline.org.uk. Alternatively you can also register by writing to Telephone Preference Service, DMA House, 70 Margaret Street, London, W1W 8SS.
• Keep all correspondence containing your shareholder reference number in a safe place. • Shred all unwanted correspondence. • Inform Equiniti as soon as possible if you change your address. If you receive a letter from Equiniti regarding a change of address and
have not recently moved house, please contact them immediately. You may be a victim of identity theft. • Know when dividends will be paid. You can request that dividends be paid direct to your bank, reducing the risk of cheques being
intercepted or lost in the post. If you change your bank account, inform Equiniti of the details of your new account.• Consider getting independent professional advice before making any investment decision, particularly if the type of investment is
unfamiliar to you.
Shareholder information continued
Engineering that moves the world
Visit our website for more information www.gkn.com
GKN is a global engineering business. Every day we drive the wheels of hundreds of millions of cars, we help thousands of aircraft to fly, we deliver the power to move earth and harvest crops, and we make essential components for industries that touch lives across the globe.
GKN plc PO Box 55 Ipsley House Ipsley Church Lane Redditch Worcestershire B98 0TL Tel +44 (0)1527 517715 Fax +44 (0)1527 517700
London Office 50 Pall Mall London SW1Y 5JH Tel +44 (0)20 7930 2424Fax +44 (0)20 7930 3255
[email protected] www.gkn.com Registered in England No. 4191106
This annual report is available on our website.
Registrar Equiniti Aspect HouseSpencer RoadLancingWest SussexBN99 6DA
Tel 0871 384 2962* (+44 121 415 7039 from outside UK)
Fax 0871 384 2100 (+44 1903 833113 from outside UK)
www.equiniti.com www.shareview.co.uk
* Calls to this number cost 8p per minute plus network extras. Lines are open 8.30 am to 5.30 pm, Monday to Friday, excluding bank holidays.
Cautionary statement This annual report and accounts has been prepared for the members of GKN plc and should not be relied upon by any other party or for any other purpose. It contains forward looking statements which are made in good faith based on the information available at the time of its approval. It is believed that the expectations reflected in these statements are reasonable but they may be affected by a number of risks and uncertainties that are inherent in any forward looking statement which could cause actual results to differ materially from those currently anticipated. Nothing in this document should be regarded as a profits forecast.
Contact information
ENGINEERING THAT MOVES THE WORLD
ENGINEERING THAT MOVES THE WORLD
ENGINEERING THAT MOVES THE WORLD
ENGINEERING THAT MOVES THE WORLD
Annual Report and Accounts 2014
ENGINEERING THAT MOVES THE WORLD
ENGINEERING THAT MOVES THE WORLD
→ Visit our website for more information www.gkn.com
GKN
plc Annual Report and Accounts 2014