annual report and accounts 2014 - howden joinery · pdf file · 2015-04-01annual...
TRANSCRIPT

Annual Report and Accounts 2014
No problem, Steve, we’ve got the whole lot here
Great, Bill, that means I can finish the job this weekOk, Dave, we’ll sort
it out for you right away
They want the blue back-board now instead of the grey, Joe
Annual Report and Accounts 2014

bThe strategic report, directors’ report and governance statements
The strategic reportBusiness overview 01 Chairman’s statement 08 Chief Executive’s statement 10 Review of operations and finance 14 Principal risks and uncertainties 20 Corporate social responsibility (CSR) report 22
Directors’ reportBoard of directors 28 Directors’ report 30
Governance statementsDirectors’ remuneration report 32 Corporate governance report 49Report of the Audit Committee 55 Report of the Nominations Committee 61Statements of the directors in connection with this Annual Report and Accounts 66
The financial statements
Consolidated income statement 68 Consolidated statement of comprehensive income 69 Consolidated balance sheet 70 Consolidated statement of changes in equity 71 Consolidated cash flow statement 72 Notes to the consolidated financial statements 73 Company balance sheet 115 Notes to the Company balance sheet 116 Independent auditor’s report to the members of Howden Joinery Group Plc 120 Parent company and principal subsidiary undertakings 124 Five year record 125 Shareholder ranges 126 Advisors and committees 127Corporate timetable 128

Howden Joinery Group Plc Annual Report & Accounts 2014
01
REVENUE (UK)
£1,075.5M
(2013: £940.7m)
OPERATING PROFIT(before exceptional items)
£189.8M
(2013: £140.7m)
YEAR END CASH
£217.7M
(2013: £140.5m)
FULL YEAR DIVIDEND 8.4P PER SHARE
(2013: 5.5p)
Gross margin further improved to 63.7% (2013: 61.7%)
Strong cash flow enabling substantial increase in dividend and £70m share purchase programme
Basic earnings per share increased from 15.3p to 24.6p
30 new depots opened in 2014, bringing total to 589
18 new kitchens introduced, further enhancing our product offering
Significant increase in capital expenditure announced (c.£60m p.a. over the next three years) to support future growth
Further progress with our 11 trade depots in France
01

02
What we do
We supply from local stock nationwide the small builder’s ever-changing routine, integrated kitchen and joinery requirements, assuring best local price, no-call-back quality and confidential trade terms.

Howden Joinery Group Plc Annual Report & Accounts 2014
03 We sold 3.8 million cabinets, 2.3 million joinery doors, over 2 million
square feet of flooring, 870,000 worktops and breakfast bars.
We opened 30 depots in the UK, bringing the total number of depots in operation to 589.
We operated over 330,000 active credit accounts for our builder customers, an increase of over 40,000 compared to 2013.
We employed over 1,100 experienced kitchen designers who carried out over 290,000 kitchen surveys.
We occupied 1 million square feet of factory space in two factories and 1.5 million square feet of warehousing in our main distribution centre.
We launched 18 new kitchen designs together with new products in every category including appliances, worktops, sinks, doors, flooring and accessories.
We made significant progress with our 11 trade depots in France and started testing new depot formats in France and Belgium.
We had 7.5 million visits to our website and the number of movie views on our YouTube channel rose to over 700,000.
Howdens was founded in 1995. ln its first year of operation it had just 14 depots and sales of £1m. Today, Howden Joinery Group is the UK’s leading trade supplier of kitchens, with sales of over £1bn.

04
Howdens employs over 7,000 people in full-time jobs. 5,300 of them work in our local depots across the country. A further 490 people work in our manufacturing sites in the North of England, in which we have invested over £24m in the last three years.
What Howdens means

Howden Joinery Group Plc Annual Report & Accounts 2014
05 Howdens employed 280 modern apprentices (145 of whom were
subsequently offered full-time employment) and 40 trainee designers. In partnership with the CITB (the training body for the construction industry) we funded the Howden Joinery Bursary for 40 apprentice joiners, helping young people to learn valuable joinery skills.
We ranked No.12 in the Sunday Times Best Big Companies To Work For list, and No.3 in the Fair Deal category, in which employees rate the business according to whether they feel fairly compensated for what they do.
Howdens was responsible for the pensions of over 15,800 people.
We celebrated our 10th year of partnership with Leonard Cheshire Disability, to whom we have donated 50 inclusive kitchens that can be used by people of all abilities. We help to fund LCD’s flagship volunteering programme and our staff regularly take part in fundraising challenges to support LCD’s work.
During one week in October, we raised over £60,000 (with donations from staff, customers and the company) for 45 homeless charities across the UK.
Our employees were responsible for over 3,000 donations to local activities and associations amounting to a total of nearly £1.5 million. As well as cash donations and fundraising initiatives, joinery and kitchen equipment was given and installed in local schools, village halls, care homes, youth groups and sports clubs.

06
Life in the kitchen
Easy to fit, looks good, doesn’t break
Yeah, going to look good
Three more boxes to come
Stop teasing him and give me a hand, will you?
Seen the finish on this?
Soup bowls in here, everyone
That’s like, so random

Howden Joinery Group Plc Annual Report & Accounts 2014
07
The kitchen has to work, every day
Howdens is about the lives we lead, the encounters we have and the kitchens we all use
You won’t be on anything unless you clear up this
mess!
Hey, looks like we’re on…
When’s your train?
Just give it to me, Mum, that’ll do
Happy birthday, Katie
I hope they leave some cake
for me…

08OVERVIEW2014 was a notable year for Howdens, and one in which we made significant progress on a number of fronts. A milestone was reached with sales of over £1 billion. Gross margin continued to improve and strong cash generation resulted in the further strengthening of our balance sheet. We have identified more opportunities to take Howdens’ business further forward, and we are well placed so to do. Over the course of the year we took important steps to develop the organisation, and its talent, that will allow us to make the most of these significant opportunities.
STRATEGIC PROGRESSDuring 2014 we increased our focus on improving the performance of our depots and of our supply operations through mobilising our managers and their teams and engaging them in our shared objective – to build a business that we can all be proud of that will continue to deliver value to all concerned for many years to come.
Howdens is now operating on a very large scale in a world that grows more complex every day. Managing this combination of scale and complexity successfully is our primary task.
We have developed a strategic plan for Howdens to 2020 and beyond. This plan envisages the further development of our UK operations through continuing improvements in the performance of existing depots and significant further expansion of our depot network to take advantage of new opportunities beyond those originally envisaged.
It follows that it is a priority to make sure that nothing interrupts the continuing availability of stock to our depots. We are therefore stepping up our investment in manufacturing, distribution and infrastructure as the business grows. In particular, we plan to invest in new warehousing facilities and in the resilience of our operations to support future growth. We expect capital expenditure across the business to be in the
order of £60m per annum over the next three years. Mark Robson discusses our investment programme in more detail on page 17.
For some years we have also been exploring the prospects for Howdens beyond the UK. We have effected a step change in the profitability of our French depots and we believe the time is right to build on the nucleus of our French business. We are also drawing on our experience to test our way forward in Belgium and Holland.
ORGANISATIONAL DEVELOPMENTIn May, following a review of our structure and capabilities, we announced a number of organisational changes designed to support the continuing growth and development of Howdens.
Mark Robson was appointed Deputy Chief Executive, and is now responsible for the day-to-day management of the business. Matthew Ingle continues in his role as Chief Executive, focusing on the further development and implementation of our strategy, and in particular on the culture and the values of the business that have served Howdens so well and will underpin our future success.
This powerful combination of Matthew and Mark is supported by Rob Fenwick, who spearheaded the restructuring of Howdens' supply operations from 2005 and leads the supply division, and Andy Witts, a co-founder of the business and leader of the depot management team. Together, our senior executives are leading the work of organisational and talent development and recruitment that is essential to the long-term sustainability of the business.
SHAREHOLDER RETURNSOur stated intention is an earnings per share based dividend cover of between 2.5 and 3.0 times, with one-third of the previous year’s dividend being paid as an interim dividend for the following year.
Given the operational performance of the business and the level of cash generation in 2014, the Board is proposing a final dividend
Chairman’s statement

Howden Joinery Group Plc Annual Report & Accounts 2014
09
in respect of the year of 6.5p per share, giving a total dividend of 8.4p per share for 2014 (2013: 5.5p).
We have said that we are targeting a capital structure that is both prudent and recognises the inherent leverage in the business and, after considering our capital requirements, will return surplus capital to shareholders as appropriate. The Group has significant property leases for the depot network, and continues to have a material defecit in the Group pension fund and a small number of legacy liabilities related to the Group’s former ownership of MFI. Taking into account this underlying level of gearing, the Board continues to believe that it is appropriate for the Group to be able to operate throughout the working capital cycle without incurring bank debt.
Against this background, the Board has reviewed the Group’s cash balances in light of our future investment opportunities, anticipated peak working capital requirements and the trading outlook. As a result it has decided to return £70m of cash to shareholders by way of a share repurchase programme. This will commence shortly and will be implemented over the course of the next two years.
BOARD COMPOSITIONThe Board functions as a small but effective team and I am indebted to my fellow directors for their hard work and commitment to the Group. In particular I would like to thank Michael Wemms, our Senior Independent Director, for his work as Chair of the Remuneration Committee, a role which has now been taken on by Tiffany Hall. Michael and I have both served on the Board for eight years and the Board is therefore giving consideration to the appointment of our successors. In my case, the transition to my replacement will be overseen by Michael. The Board is also considering the merits of appointing a further non-executive director.
A RESPONSIBLE BUSINESSI firmly believe that Howdens’ commitment to growth and development must be matched by a continued focus on being a responsible company. Our business model emphasises the
importance of our values, of fair dealing and of personal, local accountability.
We work to make sure these values are reflected in the way we treat individuals, in our interactions with the wider community and in the work we do to reduce our environmental impact. In all of these areas, we aim to implement standards that will deliver lasting benefits. A detailed report on our corporate responsibilities can be found on pages 22 to 27.
2014 was an extremely busy year for Howdens and one which placed considerable demands on our people and, in turn, on their families. I am sure that you would wish me to place on record our great appreciation of their considerable efforts and achievements.
LOOKING AHEADHowdens has undergone a major transition in the last five years. Since 2009, profits have more than doubled, as have earnings per share, and the balance sheet has been transformed. Legacy pressures have been overcome, our strategic flexibility has considerably increased and we see good prospects for the further development of the business.
Looking ahead, we expect that the strong cash generation that is a feature of Howdens’ business model will enable us both to pay attractive dividends to shareholders and to make the substantial capital investments necessary to make the most of the many opportunities we have identified within and beyond the UK.
The environment in which we operate is constantly changing. We remain confident in the resilience and flexibility of the Howdens model, and it goes without saying that we will continue to adapt rapidly to suit economic and market conditions and to manage the business in the fashion that has served us so well over the years.
Will Samuel Chairman25 February 2015

10STRATEGIC OVERVIEWHowdens supplies kitchens and joinery to trade professionals.
That is what we do, but it is not the idea of the business.
The idea of the business is about building worthwhile, personal relationships so that we can deliver value to all concerned – which means small builders, kitchen users, employees (including past and future employees and their families), business partners, shareholders, local communities and in fact everyone whose life is touched by Howdens.
To make the business work properly, we have to do things in an uncompromising way.
We have to build relationships of trust with our suppliers, both of raw materials and of finished products, so that we can offer the right design, quality and price in every category.
We also have to recruit and retain highly motivated staff who consistently do what they say and are prepared to take personal responsibility for their actions.
We have to design, manufacture and source products expertly and at lowest cost, and distribute them in such a way that our depots are always in stock locally and never let the builder down.
We have to have low central overheads, because builders only want to pay for things they need.
Finally, we have to earn the confidence and trust of builders, who rely on us to support their reputation with products of the right type and quality that their customers are proud to own.
We supply these products to builders when they want them, i.e. from stock, on confidential trade terms.
So Howdens is a direct, person-to-person business. This is its core strength and its difference. This is the source of its ability to deliver value in more ways to more people.
The business functions because individuals rely on each other to deal promptly, effectively and fairly with everyone, whether they are in a factory, depot, warehouse, design studio or office.
This sounds straightforward, but it is hard work. Everything is finely balanced, because everyone depends on everyone else. Personal relationships are individual, dynamic and unpredictable. Businesses find talking about them, and managing them, uncomfortable, but Howdens is built on them.
Howdens’ competitive advantage is rooted in our ability to manage the complexity that is involved in doing what it takes to sustain these relationships and to offer direct, practical help, every day, to hundreds of thousands of customers and thousands of different homes around the country.
This is the basis on which Howdens was founded in 1995, and these are the principles which have driven its growth and survival and created opportunities for further expansion. They have been resilient enough to help it withstand restructuring, recession and the collapse of MFI, and strong enough to underpin a business that employs over 7,000 people, operating out of two factories, a national distribution centre and nearly 600 depots, and generating operating profit of £190 million on sales of over £1 billion. The same principles continue to drive our strategic objective of delivering better and better service, person to person, wherever it is required.
Chief Executive’s statement

Howden Joinery Group Plc Annual Report & Accounts 2014
11
BUSINESS MODELThe kitchenKitchens are one of the few things we all use every day, no matter where or how we live. Something as important as a kitchen really has to work, and keep working.
The kitchen transcends whatever we might be doing in it at any particular moment. It has to cope with people of all ages using it for many purposes: cooking, eating, drinking, washing, ironing, reading, writing, studying, talking, celebrating, commiserating and making plans. Not to mention the baby bashing the table, the dog licking the cabinets and a teenager trying out a new invention on the worktop.
We place enormous and ever-increasing demands on the kitchen, and we expect it to take them. We also expect that the kitchen will make our lives easier and more enjoyable.
This is not a new idea. The functionality of the kitchen has been becoming increasingly complex since the Middle Ages. Most of us now understand that a kitchen that looks good and works properly must be installed by a professional fitter, which is why Howdens sells only to builders.
The depotWe sell locally, from trade-only depots staffed by local people who know their area and know what their customers want.
A newly opened Howdens depot grows business by talking to local builders and opening credit accounts for them.
Our depots are typically around 10,000 square feet in size, in industrial locations rather than retail parks, and employ between six and ten staff. They are low-cost, both in terms of rent and fit-out, and become profitable when they reach annual sales of £650,000, which they usually do by their second year of operation.
The builder’s working day is unpredictable, so we keep all our products in stock locally.
Anything, from a tube of glue to a complete kitchen, can be collected by the builder as soon as he needs it. Service is more than initial availability, so all Howdens’ products are designed from scratch to be quick and easy to install as well as fit for purpose and robust in daily use. We undertake to swap anything, locally, right away, if it is no longer needed or something is not quite right.
We offer builders, and hence end-users, a free kitchen planning service that we believe is second to none, not only because it uses the latest technology but because it is delivered by expert planners on a personal basis.
Every Howdens kitchen is the result of a series of critical conversations between the people who plan it, buy it, install it and use it. And before that, between the people who design it, source it, make it, test it, photograph it, write about it, pack it and take it to the depot.
Howdens offers the builder a personal, confidential discount so that he can determine his margin for each job, and a nett monthly credit account, which means the builder can get paid by his customer before he has to pay us.
The builder’s account is held at his local depot, and his discount is agreed between him and the depot manager. Credit control is managed centrally, which has proved to be a highly efficient way of minimising bad debt and supporting personal relationships.
Depot managers, and their staff, are incentivised on a share of their own depot’s profit, less stock loss. There is virtually no stock loss. Depot staff are entrepreneurial and accountable.
Incentives are very important to every part of Howdens’ business, not only to depots. They may relate to specific targets or to outperformance against a range of indicators compared to the previous year’s results. Individuals and teams who deliver outstanding service receive significant, sometimes life-changing, rewards.

12Supplying the depotThe depot depends directly on Howdens’ supply operation, which encompasses the sourcing of raw materials and of bought-in product, product development, manufacturing, logistics, warehousing and timely distribution to every Howdens depot.
This is all owned and controlled by Howdens.
We design and manufacture kitchen cabinets and worktops in our own factories in Howden in East Yorkshire and Runcorn in Cheshire.
Large volumes, long runs, modern production equipment and efficient working practices mean that Howdens can achieve lowest cost of production.
The same principles apply to bought-in product. When we put in a purchase order, it is for large volumes, to our own specifications and, critically, to our own availability requirements. An order from Howdens allows our suppliers to operate more efficiently and plan ahead more easily. It allows us to guarantee availability, quality and price – and thereby service – to our customers.
This level of service could not be delivered without logistics and systems that work, and do not fail.
First, Howdens depot managers interpret their own sales patterns and local knowledge to choose how much product they require.
Then, they rely on our truck fleet to deliver it nationwide without delay so that all our depots are always in stock.
All of this activity, whether in manufacturing, distribution or sales, is underpinned by a well-invested, robust, stable and scalable systems infrastructure that has plenty of scope to handle significant further growth.
OPERATING ENVIRONMENTThe builder’s marketFrom the outset, Howdens has been designed around the needs of the small builder.
The small builder is an entrepreneur who migrates from one sector of the market to another by recommendation. His customers may be owner-occupiers, private landlords or local developers. Equally, they may be housing associations or local authorities. Sometimes the small builder will fit out a shop, or a studio, or an office, as well as a private home. The pattern of his work will vary from season to season and from year to year.
Howdens benefits directly from this flexibility. It is the builder who regulates the mix of end-users, allowing us immediate access, at no extra cost, to all sectors of the market.
Today, Howdens serves a significant share of the retail market in the UK without any of the costs, such as showrooms, fitters or home delivery, that are normally associated with retail.
What is changing?Our expectations of what is “normal” continue to change.
We are less and less prepared to wait for anything. We don’t want to queue for a till or at a helpdesk. We haven’t got time to waste waiting for quotations, plans, deliveries, installation, repairs and someone to answer the phone. We expect service right away.
We are also less tolerant of mistakes or things that go wrong. We don’t just want someone to answer the phone, we want a helpful, informed person who can deal with whatever we need, now. We want every product, big or small, to look good, work well and not break. We want clear instructions and correct information.
Chief Executive’s statement continued

Howden Joinery Group Plc Annual Report & Accounts 2014
13
We also expect product to make our lives easier and easier. This means that product innovation at all price points is an ongoing priority for Howdens.
For most of us, there is also less space. In the home, this means more kitchen designs that make the best use of every available inch. On the roads, this means more builders getting stuck in traffic more often, which means that ideally the nearest Howdens depot is on their doorstep. In our cities, and across the UK, increasing demand for space means we have to have strong property skills and the reflex to think further ahead about our requirements.
Howdens sells more kitchens than any other player in the UK market. In 2014 we sold around 3.8 million cabinets to nearly 330,000 credit account holders. Since 2008 the number of SKUs, or stock-keeping units, in our business has risen by 100%.
So we want to go on delivering constantly improving service to an increasing number of customers, and we will continue to invest in space, systems and resources to manage scale and complexity, service, people and our future.
PROSPECTS CREATE OPPORTUNITIESHowdens works because the idea of the business – to deliver a service of value, person to person, in the one place that is central to our daily lives – is strong enough to appeal to a large and growing number of people, and because we have stuck to our values from the outset in implementing this idea.
When we started Howdens we did not know how many depots we would be able to open.
We have continued to open local depots in response to demand, as more and more people become engaged with what Howdens stands for and what this business can do. It is now clear that we have a huge opportunity to deliver Howdens service on an even larger scale, so we plan to go on opening local depots wherever we see good prospects for them.
This will include more depots in France, where we have achieved significant improvements in profitability. We continue to test depot formats in France and Belgium (and will shortly start a test in Holland) in order to understand more about operating successfully in markets beyond the UK.
We have the opportunity to transform our warehousing and distribution operations in order to meet our need for increased capacity. We plan to invest significantly in this area to ensure that all our depots continue to be always in stock.
As kitchens become ever more complex, and the digitally connected lifestyle more widespread, we will invest in product innovation, but also in every aspect of product – choice, design, usability, materials technology and manufacturing excellence.
We will be increasing our capital expenditure to reflect these strategic priorities.
All of this will also, of course, mean further investment in people. Howdens is an idea that recruits people who want to be part of it – a world in which proper value is placed on personal relationships and where they can do a thorough job.
We are working to build an organization that is capable of supporting this vision, and of sustaining a business that is worthwhile for all concerned.
Matthew Ingle Chief Executive25 February 2015

14FINANCIAL RESULTS FOR 2014The information presented here relates to the 52 weeks to 27 December 2014 and the 52 weeks to 28 December 2013, (continuing operations before exceptional items), unless otherwise stated1.
The financial performance of the Group during 2014 benefited from the Group’s competitive position and the continuing focus on improving operational performance. We also benefited from the continuation of improved market conditions seen since the summer of 2013.
Total Group revenue increased by £134.3m to £1,090.8m.
Revenue £m 2014 2013
Group 1,090.8 956.5
comprising:
Howden Joinery UK depots 1,075.5 940.7
Howden Joinery French depots 15.3 15.8
Howden Joinery UK depot revenue rose by 14.3% to £1,075.5m, increasing by 10.8% on a same depot basis.
This growth was achieved through a number of factors and is a testament to the strength of the Howdens business model. We have continued to open new depots and increased the number of customer accounts. As well as driving an increase in revenue, the business continued to focus on price discipline and margin.
Sales by our French depots of £15.3m increased by 2% on a same depot basis in constant currency terms, whilst falling slightly on a reported basis. Profitability has improved following changes to the commercial strategy in our French depots.
Gross profit rose by £104.3m to £694.5m. The gross profit margin for the year increased to 63.7% (2013: 61.7%). This reflected the continuing focus on efforts within supply to reduce the cost of manufactured and bought-in products, and price discipline and margin achievement across all depots. It also
included a benefit from the strengthening of the pound against both the euro and US dollar.
Selling and distribution costs, and administrative expenses increased by £55.2m to £504.7m. The increase reflects the costs of new depots, investment in growth and the impact of inflation, including on payroll costs.
Operating profit increased by £49.1m to £189.8m.
The net interest charge fell by £4.7m to £1.0m, due to a lower finance expense in respect of pensions. The net result was profit before tax rose by £53.8m to £188.8m.
The tax charge on profit before tax was £40.1m, an effective rate of tax of 21.2%.
Basic earnings per share were 23.2p (2013: 15.9p).
In 2014, there was an exceptional profit after tax from discontinued operations of £9.1m. This mainly comprised income of £11.1m arising from the release of a tax creditor (following partial resolution of a dispute with HMRC regarding the tax treatment of certain expenses relating to our legacy properties), partially offset by a charge of £2.2m relating to an increase in the provision for our remaining legacy properties.
At 27 December 2014, the pension deficit shown on the balance sheet was £142.6m (28 December 2013: £54.3m). The increase in the deficit was due to higher liabilities arising primarily from a decrease in the discount rate, which more than offset the Group’s contribution to fund the deficit and better than expected asset returns.
We saw strong cash flow in 2014.
There was a net cash inflow from operating activities of £147.8m. This was after a cash contribution to the Group’s pension schemes, in excess of the operating charge, of £32.8m2
and payments relating to legacy properties totalling £5.3m.
Review of operations and finance
1 There were no exceptional items from continuing operations in 2014. In 2013, there was an exceptional operating cost before tax of £4.5m from continuing operations. In 2014, there was an exceptional profit after tax on discontinued operations of £9.1m. There were no discontinued operations in 2013.
2 As previously announced, an additional one-off payment for the pension year ending April 2015 of £10m will be paid in 2015.
320
13
135.
0
Gro
ss P
rofit
10
4.3
Ope
rati
ng c
osts
(55.
2)
Inte
rest
, etc
.4.
7
2014
18
8.8
Change +£53.8m
Profit before tax £m
2013
59
0.2
Pric
e(re
venu
e)32
Volu
me
& M
ix(re
venu
e)10
2
Volu
me
& M
ix(C
OG
S)(3
9)
Cos
t avi
ngs,
etc
.(n
et) 1
Cur
renc
y 8
2014
69
4.5
Change +£104.3m
Gross profit £m

15
Howden Joinery Group Plc Annual Report & Accounts 2014
Excluding the legacy property payments, underlying working capital was broadly unchanged. Increases in stock and debtors were offset by an increase in trade creditors.
Also included within net cash flows from operating activities was tax paid totalling £30.3m.
Payments to acquire fixed and intangible assets totalled £32.8m (2013: £24.7m).
Reflecting the above, there was a net cash inflow of £77.2m in 2014, the Group having net cash of £217.7m at the end of the year (28 December 2013: £140.5m net cash).
DIVIDEND AND RETURN OF SURPLUS CASH TO SHAREHOLDERSThe Group’s dividend policy is to target dividend cover of between 2.5x and 3x, with one third of the previous year’s dividend being paid as an interim dividend each year. Given the operational performance of the business and the cash generation in 2014, in light of this policy, the Board has decided to recommend to shareholders a final dividend of 6.5p, giving a total dividend for the year of 8.4p (2013: 5.5p). This equates to a dividend cover of 2.75x, the Board intending to pursue a progressive dividend policy in future years.
As previously stated, the Board intends to target a capital structure that is both prudent and recognises the benefits of operational and financial leverage, and, after considering our capital requirements, to return surplus cash to shareholders as appropriate. The Group has significant property leases for the depot network, and continues to have a material deficit in the Group pension fund and a small number of remaining legacy liabilities related to the Group’s former ownership of MFI. Taking into account this underlying level of gearing, the Board believes it is appropriate for the Group to be able to operate through the annual working capital cycle without incurring bank debt.
The Board has reviewed the cash balances in light of the Group’s future investment opportunities, expected peak working capital requirements and trading outlook. As a result, it has decided to return £70m of cash to shareholders by way of a share repurchase programme. This will commence shortly and will be implemented over the course of the next two years.
Shares that are bought in the market by our brokers will either be held in treasury, to use for future obligations for company share schemes, or cancelled.
OPERATIONAL REVIEWThe business model of Howden Joinery is “To supply from local stock nationwide the small builder’s ever-changing, routine, integrated kitchen and joinery requirements, assuring best local price, no-call-back quality and confidential trade terms”.
Since it started in autumn 1995, the business has opened new depots and increased turnover continuously, except for a 12-month period in 2008-9.
Even today, with nearly 600 depots across the UK, we continue to see the opportunity to transform the scale of the business, seeing scope for at least 700 depots. We continue to invest in all aspects of the growth and performance of the business, including new depots and depot operations, existing and new employees, product development, and manufacturing and distribution.
UK depot network and operationsDuring the course of 2014, 30 new depots were opened, bringing the total number of depots trading at the end of the year to 589. In addition, two depots were relocated and three were extended.
In the summer of 2012, we began trials of a 'virtual showroom' that is designed to support our 1,000 depot-based kitchen designers. When working with our account holders' clients in our depots, this allows kitchen designs to be shown on a large HD television screen or projected on to a wall in the depot in a large high-definition format, along with other material designed to support product sales. Often, this will be accompanied by a refurbishment of the office in which the designers work. This project to roll-out 'virtual showrooms' across all of our depots has been completed. To support our account holders and improve our service to their clients, we undertook a project to install A3 printers in all of our depots. These provide builders with a technical drawing of each kitchen design that is much more usable on-site. They also allow more impressive visualisations of the kitchen to be provided to the builder's client. This project has also been completed.
Our account base continues to grow, having increased by over 40,000 net new accounts in 2014. Initiatives to stimulate account openings meant this was double the number seen in previous years. While there has been a significant increase in accounts in recent years, our debt collection performance continues to be robust.

16Product and marketingWe continue to enhance our product offering, having introduced a number of new products during 2014 across all our product categories.
Notable amongst these were eighteen new kitchens, which included: six gloss options and two matt options in our Greenwich family; three options in a new, lower-priced, gloss integrated handle range, Clerkenwell; and three options in a new, premium, Tewkesbury framed family.
To ensure we cater for all budgets and price points, we have introduced a number of new products, including: a premium touch control Lamona pyrolytic oven, combination microwave and warming drawer; a collection of premium handles and a range of competitively priced rose handles; and a new ‘entry priced’ rigid cabinet.
In addition, we continue to enhance our other product offerings, including new products in our worktops and backboards, sinks, doors and flooring ranges. We also started a trial of selling affordable granite worktops from stock, beginning in a small number of depots. Initial results from this have been encouraging and the trial has recently been extended to an additional 40 depots.
We continue to invest in our marketing communications and brand advertising. As well as updating our range of marketing literature and the Howdens website (www.howdens.com), we embarked on a partnership with pottery designer and manufacturer Emma Bridgewater. Emma designed for us a pair of Howdens mugs and fluted bowls that were given away with every kitchen plan for limited periods, the partnership being featured in our adverts and on the Howdens website. To further raise awareness of the Howdens brand, we attended 13 county shows and agriculture fairs throughout the UK during the summer.
Manufacturing and logistics operations Our UK-based manufacturing and logistics operations play a vital role in ensuring that we are able to supply our small builder customers from local stock nationwide at all times, having the flexibility to respond to each depot’s individual needs. We continue to invest in these operations so as to ensure that this aspect of the Howdens model is never compromised, even during our critical ‘Period 11’, when sales are more than double the level seen in other periods.
We are close to completing a two-year project to replace obsolete boilers and the associated heating infrastructure at our site in Howden with a state-of-the-art biomass heating system. This will ensure that we continue to be compliant with environmental emissions legislation and will reduce manufacturing costs, as the heat generated attracts payments provided by the Renewable Heat Incentives programme.
We have completed the replacement of the 100 'tractor units' for our fleet of lorries. These are Euro 6 compliant and are fitted with the latest technology for environmental compliance. In addition, they have enhanced safety features, including:• crash avoidance technology that assists the driver when it
detects the risk of a collision; and
• forward facing cameras for incident recording, to help with accident investigation and insurance claims.
Replacement of 400 ‘trailer units’ for our fleet of lorries will begin in the spring.
Continental EuropeAs we set out at the interim results in July, we have amended the pricing strategy in our French depots. As a result, we have seen an improvement in the financial performance of the depots, notwithstanding the widely reported economic headwinds in the country.
This has given us the confidence to add a second phase of depots to our operations in northern France, our plan being to open seven new depots during the second half of 2015.
It has also given us the confidence to extend the trial, both in France and in other countries in continental Europe. First, we have opened two depots in Belgium that are the same format as our existing French depots and will allow us to learn about a slightly different market. Second, we have opened an outlet with a new format and branding further south in France, with another planned to be opened late in 2015. This is larger than existing depots, and will be used to test a number of new initiatives. We also intend to begin a trial in Holland, where we plan to open a similar larger format depot towards the end of this year.
Review of operations and finance continued

17
Howden Joinery Group Plc Annual Report & Accounts 2014
GROUP DEVELOPMENTSLegacy propertiesThe Group continues to reduce its legacy property portfolio.
One lease was terminated in 2014, at a cost of just over £3m, and one lease, with less than six months remaining, was released early. In addition, the leases of two properties expired during the year.
This means that there are now five legacy properties remaining, with net annual rent and rates of less than £1m.
INVESTMENT PROGRAMMEWe have undertaken a review of the medium and longer-term growth prospects for the business and have identified more significant opportunities than previously foreseen. Kitchens continue to grow in complexity as kitchen users expect increasing functionality as well as a constant flow of new designs. At the same time, our account base continues to grow, and we are focused on delivering better and better local service to more and more builders.
Following on from this review, we have been considering how to ensure that we are best placed to deal with and take advantage of what the future might bring.
In respect of our supply operations, a number of areas have been identified for investment in the coming years. These include preparing for future growth and improved resilience of our cabinet manufacturing operations, a new national distribution centre (NDC) for bought-in products, increased manufacturing capacity in non-cabinet products and replacing aged manufacturing assets. As a result, we expect capital expenditure across the business to average around £60m per annum over the next three years. The exact phasing of this will depend on the timing of the building and fitting-out of the new NDC.
CURRENT TRADING AND OUTLOOK FOR 2015Howden Joinery UK depot sales in the first two periods of 2015 (to 21 February) were up 9.9% on the same period last year (this excludes the first week, which had one less trading day in 2015 than in 2014), in line with our expectations. Along with the evidence we have of trading prospects, this would suggest that market conditions remain unchanged.
The Group remains committed to its view that the number of depots in the UK can be increased from its current level of 589 to at least 700. During the course of 2015, we are currently planning to open up to 30 depots in the UK.
We are well positioned and look forward to continued growth. As in recent years, we will act quickly and appropriately adapt our business model to the market and economic conditions we encounter.
KEY FINANCIAL PERFORMANCE INDICATORSThe Group uses a number of financial performance indicators to measure operational and financial activity in the business. Non-financial indicators are discussed further in the corporate social responsibility report on pages 22 to 27.
Total sales growthGrowth in sales of the UK Howden Joinery depots is key to enhancing shareholder value. This measure, along with monitoring our programme of depot openings, tracks the ability of the Group to grow the business.
Operating profitThe Group targets steady growth in operating profit before exceptional items over the medium-term.
Earnings per share (EPS)We believe that EPS, while not perfect, is an accessible measure of the returns we are generating as a Group for our shareholders, and also has the merit of being auditable and well understood. The key measure of short-term financial performance is basic earnings per share before exceptional items.
Depot openingsThe business model is based on individual depots providing kitchens to small builders within a local community. The continuing drive to open new depots in new localities is therefore key to the Group’s growth prospects. Howden Joinery currently intends to open 30 depots in 2015, although it should be noted that we have the ability to adjust the rhythm of the opening programme in line with economic conditions.

18USE AND MANAGEMENT OF FINANCIAL INSTRUMENTS, AND EXPOSURE TO FINANCIAL RISKThe Group holds financial instruments for one principal purpose: to finance its operations. The Group does not currently use derivative financial instruments to reduce its exposure to interest or exchange rate movements. The Group finances its operations by using cash flows from operations, and it also has access to longer-term loan facilities from banks if additional financing is required. Treasury operations are managed within policies and procedures approved by the Board.
The main risks arising from the Group’s financial instruments are funding and liquidity risk, interest rate risk, counterparty risk and foreign currency risk, which are discussed below. No speculative use of derivatives, currency or other instruments is permitted. The Treasury function does not operate as a profit centre and transacts only in relation to the underlying business requirements.
Funding and liquidityThe Group’s objective with respect to managing capital is to maintain a balance sheet structure that is both efficient in terms of providing long-term returns to shareholders and safeguards the Group’s ability to continue as a going concern. As appropriate, the Group can choose to adjust its capital structure by varying the amount of dividends paid to shareholders, returns of capital to shareholders, issuing new shares or the level of capital expenditure.
The Group began 2014 with an asset-backed bank facility which allowed borrowing of up to a maximum of £160m, dependent on the actual levels of stock and trade debtors held at any time. This maximum amount reduced to £140m in May 2014 in line with the terms agreed at the inception of the facility. The facility is due to expire in July 2016. The facility was not used at any point during 2014.
The Group’s committed borrowing facility contains certain financial covenants which have been met throughout 2014. The covenants are tested every four weeks and are based around: (i) fixed charges; (ii) tangible net worth; and (iii) earnings before interest, tax, depreciation and amortisation (EBITDA) for Howden Joinery Limited.
In addition, our pension trustees, who carry a charge over the share capital of Howden Joinery Limited, have a separate covenant test around the EBITDA of Howden Joinery Limited.
The Group’s latest forecasts and projections have been stress-tested for reasonably possible adverse variations in trading performance and show that the Group will operate within the terms of its borrowing facility and covenants for the foreseeable future.
At the 2014 year end, the Group had £131.9m of cash, £85.0m of short-term investments, and £112.0m of funds available to borrow under the committed borrowing facility (in line with the levels of stock and trade debtors at the year-end).
Interest rate riskThe Group has not had any borrowings during 2014 and does not consider interest rate risk to be significant at present.
Counterparty riskGroup Treasury policy on investment restricts counterparties to those with a minimum Standard and Poor’s/Moody’s short-term credit rating of A-2/P-1. It also places limits on the maximum amount which can be invested with a single counterparty. Investments mainly consist of bank deposits, UK Treasury bills and liquidity funds. The Group continuously reviews the credit quality of counterparties, the limits placed on individual credit exposures and categories of investments.
Foreign currency riskThe most significant currencies for the Group are the US dollar and the Euro. It is the Group’s current policy that routine transactional conversion between currencies is completed at the relevant spot exchange rate. This policy is reviewed on a regular basis.
The net impact of exchange rates on currency transactions in the year was £8.0m. The Group does not have many overseas assets/liabilities, so the impact of currency translation on these items is not material.
Set out in the table below are the principal exchange rates versus the UK pound affecting the profits of the Group:
Review of operations and finance continued
Principal exchange rates versus UK pound (£)2014
Average2014
Year-end2013
Average2013
Year-end
United States dollar (US$) 1.65 1.56 1.56 1.64
Euro (€) 1.24 1.27 1.18 1.19

19
Howden Joinery Group Plc Annual Report & Accounts 2014
NEW ACCOUNTING STANDARDSThe Group implemented IAS 19 (revised) “Employee Benefits” during the year. This has had the effect of decreasing the profit for the period, and of increasing other comprehensive income for the period by equal and opposite amounts. It has had no net effect on total income or net assets. Details of the adoption of this IFRS are given in note 2 to the financial statements, and details of the amounts and line items affected is given in note 21.
CAUTIONARY STATEMENTCertain statements in this Annual Report are forward-looking. Although the Group believes that the expectations reflected in these forward-looking statements are reasonable, we can give no assurance that these expectations will prove to have been correct. Because these statements contain risks and uncertainties, actual results may differ materially from those expressed or implied by these forward-looking statements. We undertake no obligation to update any forward-looking statements whether as a result of new information, future events or otherwise.
By order of the Board
Mark RobsonDeputy Chief Executive and Chief Financial Officer25 February 2015

20
Principal risks and uncertainties
The Board has carried out a robust assessment of the principal risks facing the company and considers that the Group’s principal risks and uncertainties, together with an indication of actions taken to manage and mitigate them, are as detailed below. They do not comprise all risks associated with the Group and are not set out in any order of priority. Additional risks not presently known to management or currently deemed to be less material may also have an adverse effect on the Group’s business in the future.
Risk Description and Impact Mitigating Factors
Market conditions The Group’s products are predominantly sold to small local builders for installation in public and private housing, mainly in the repair, maintenance and improvement markets.
The Group’s results are consequently dependent on levels of activity in these markets, which are impacted by many factors including general economic conditions, consumer confidence, interest rates and credit availability, unemployment, demographic trends and, in the short-term, weather.
A severe downturn in market conditions could impact on our ability to achieve our sales and profit forecasts. This could in turn put pressure on our cash availability and banking covenants.
We monitor the market closely and can take swift management action as necessary in response to adverse changes, with the aim that the business is aligned to market conditions and, consequently, that we should have sufficient cash and borrowing facilities for business needs and adequate covenant headroom.
Failure to implement the Group’s business model and culture
The future success of the business depends on the successful implementation of the Group’s business model and locally-enabled, entrepreneurial culture.
In particular, if the Group fails to implement its business model in the locally-enabled, decentralised manner envisaged, there may be an adverse effect on the Group’s future financial condition and profitability.
Led by the actions of the Board and Executive Committee, the business model and the Howdens culture are at the centre of the activities and the decision-making processes of the Group, and are continually emphasised. The Executive and senior management regularly visit our depots and factories, and hold regular events during which they reinforce the importance of the Group’s business model and culture. Throughout the business, successful implementation of the Group’s business model and culture forms the basis of the incentive structure.
Failure to maximise exploiting the growth potential of the business
The Group considers that there is significant potential for growth, and has identified this as a strategic opportunity and aim.
If the growth opportunities are not understood and exploited in line with our business model, or if current structures and skills within the Group are not aligned to meet the challenges of growth, there may be an adverse effect on the Group’s ability to obtain maximum benefit from this growth potential.
The Group places continuing focus on the opportunities, challenges and additional requirements related to growth. The potential for growth is incorporated into group strategic plans and budgets, and existing structures and skills are reviewed in the context of growth, and adjusted where necessary.
Continuity of supply The Group’s business model requires that every depot can supply product from local stock.
Any disruption to the relationship with key suppliers or interruption to manufacturing operations could adversely affect the Group’s ability to implement the business model.
With suppliers, the Group tries to maintain dual supply wherever possible to mitigate the effects if a key supplier was unable to deliver goods or services. We also enter into long-term contracts to secure supply of our key materials. Good supplier relations are maintained by prompt settlement of invoices, regular communication and an annual supplier conference. Within our manufacturing operations, we adopt best practice health & safety and fire prevention procedures. Business continuity plans are in place for key production processes. The Group continues to make significant investment in its manufacturing facilities, to enable manufacturing capacity to match our expected growth as well as providing further cabinet production capacity which now provides additional cover in the event of an interruption to manufacturing operations.
Loss of key personnel
The skills, experience and performance of key members of the Group’s management team make a large contribution to the Group’s success.
The loss of a key member of the Group’s management team could adversely affect the Group’s operations.
The Group uses the Remuneration Committee to ensure that key team members are appropriately compensated for their contributions and incentivised to continue their careers with the Group.

21
Howden Joinery Group Plc Annual Report & Accounts 2014
The Board has carried out a robust assessment of the principal risks facing the company and considers that the Group’s principal risks and uncertainties, together with an indication of actions taken to manage and mitigate them, are as detailed below. They do not comprise all risks associated with the Group and are not set out in any order of priority. Additional risks not presently known to management or currently deemed to be less material may also have an adverse effect on the Group’s business in the future.
Risk Description and Impact Mitigating Factors
Market conditions The Group’s products are predominantly sold to small local builders for installation in public and private housing, mainly in the repair, maintenance and improvement markets.
The Group’s results are consequently dependent on levels of activity in these markets, which are impacted by many factors including general economic conditions, consumer confidence, interest rates and credit availability, unemployment, demographic trends and, in the short-term, weather.
A severe downturn in market conditions could impact on our ability to achieve our sales and profit forecasts. This could in turn put pressure on our cash availability and banking covenants.
We monitor the market closely and can take swift management action as necessary in response to adverse changes, with the aim that the business is aligned to market conditions and, consequently, that we should have sufficient cash and borrowing facilities for business needs and adequate covenant headroom.
Failure to implement the Group’s business model and culture
The future success of the business depends on the successful implementation of the Group’s business model and locally-enabled, entrepreneurial culture.
In particular, if the Group fails to implement its business model in the locally-enabled, decentralised manner envisaged, there may be an adverse effect on the Group’s future financial condition and profitability.
Led by the actions of the Board and Executive Committee, the business model and the Howdens culture are at the centre of the activities and the decision-making processes of the Group, and are continually emphasised. The Executive and senior management regularly visit our depots and factories, and hold regular events during which they reinforce the importance of the Group’s business model and culture. Throughout the business, successful implementation of the Group’s business model and culture forms the basis of the incentive structure.
Failure to maximise exploiting the growth potential of the business
The Group considers that there is significant potential for growth, and has identified this as a strategic opportunity and aim.
If the growth opportunities are not understood and exploited in line with our business model, or if current structures and skills within the Group are not aligned to meet the challenges of growth, there may be an adverse effect on the Group’s ability to obtain maximum benefit from this growth potential.
The Group places continuing focus on the opportunities, challenges and additional requirements related to growth. The potential for growth is incorporated into group strategic plans and budgets, and existing structures and skills are reviewed in the context of growth, and adjusted where necessary.
Continuity of supply The Group’s business model requires that every depot can supply product from local stock.
Any disruption to the relationship with key suppliers or interruption to manufacturing operations could adversely affect the Group’s ability to implement the business model.
With suppliers, the Group tries to maintain dual supply wherever possible to mitigate the effects if a key supplier was unable to deliver goods or services. We also enter into long-term contracts to secure supply of our key materials. Good supplier relations are maintained by prompt settlement of invoices, regular communication and an annual supplier conference. Within our manufacturing operations, we adopt best practice health & safety and fire prevention procedures. Business continuity plans are in place for key production processes. The Group continues to make significant investment in its manufacturing facilities, to enable manufacturing capacity to match our expected growth as well as providing further cabinet production capacity which now provides additional cover in the event of an interruption to manufacturing operations.
Loss of key personnel
The skills, experience and performance of key members of the Group’s management team make a large contribution to the Group’s success.
The loss of a key member of the Group’s management team could adversely affect the Group’s operations.
The Group uses the Remuneration Committee to ensure that key team members are appropriately compensated for their contributions and incentivised to continue their careers with the Group.

22
Corporate social responsibility (CSR) Report
Through the setting of rolling and extended key performance indicators (KPIs), it demonstrates our long-term commitments in these areas.
RESPONSIBLE MANUFACTURING AND SOURCINGDuring 2014, our UK-based manufacturing teams produced approximately:
3.8 million cabinets
870,000 kitchen worktops and breakfast bars
1.6 million kitchen frontals
2.0 million painted skirting boards
We remain committed to UK manufacturing and continued to invest in our Supply division during 2014.
In response to the Financial Reporting Council’s guidance to companies to reduce the overall length of their annual reports, an abridged version of the 2014 CSR report is set out below which contains the headline information in relation to the year and disclosures that are required by law. A full version of the 2014 CSR report can be accessed at www.howdenjoinerygroupplc.com
INTRODUCTIONHowden Joinery Group’s business is centred on the manufacture and sale of kitchens and joinery to trade customers. With 589 depots throughout the UK, we are a local business with national scale and therefore have unique responsibilities to all of the communities in which we operate. As such, we continue to focus on our five key responsibilities:
1. Responsibility to manufacture safe and sustainable
product
5. Responsibility to future generations
2. Responsibility to our staff
3. Responsibility to customers and suppliers
4. Responsibility to local communities
23
Howden Joinery Group Plc Annual Report & Accounts 2014
MANAGING OUR IMPACT ON THE ENVIRONMENTWoodManufactured productOur approach: Given that wood-based products are central to our business, we continue to set challenging targets for the responsible use of these products and paper products. Our rolling KPI to monitor the provenance of our wood-based product is to ensure that 100% of our wood-based product used in our manufacturing processes comes from certified sources.
In 2014, we used 213,000 cubic metres of chipboard and 29,000 cubic metres of MDF in our manufacturing process. As has been the case every year since 2006, all of this came from certified sources.
All of the kitchen ranges which are manufactured at our factories are certified by the UK Forest Stewardship Council (UK FSC) and over 99% of all products we manufacture in-house are FSC compliant (2013: 99%).
Our KPI for the use of cardboard packaging is that all packaging should be sourced from recycled or certified sources. In 2014 we used 2,300 tonnes of cardboard packaging all of which came from recycled sources. This was less than 2013, which itself was a reduction of circa 20% from 2012. We continue to look for design improvements and to achieve a similarly high standard in the future.
WasteOur approach: Our employees are encouraged to consider how we can improve our environmental performance in all areas by reducing consumption, reusing materials and recycling wherever possible.
In 2014, our Supply division continued to recycle waste in line with their rolling KPI which is to recycle more than 95% of all manufacturing waste produced.
• Of the 29,900 tonnes of waste produced (2013: 28,100), 97% was recycled (2013: 98%).
• Despite increased volume through-put, ‘out-of-gate’ waste decreased from 23,967 tonnes in 2013 to 21,514 tonnes in 2014. Similarly, the volume of waste sent to landfill decreased by 86 tonnes in 2014 to 644 tonnes.
• In 2014, we converted 5,825 tonnes of sawdust into energy at our Howden and Runcorn sites (2013: 4,853 tonnes) to heat our factories. This equates to approximately 31k MWh of energy generated from sawdust in 2014. 6,426 tonnes of milled sawdust went to a local manufacturer of animal
bedding where the sawdust is recycled for use in bedding for horses, cattle and other livestock (2013: 11,823 tonnes). The reduction in this amount from the previous year was a result of 3,624 tonnes of milled sawdust being used for additional biomass during 2014.
• We continue with the initiative started in 2007 to recover and repair pallets which would otherwise have been scrapped. Last year we recovered or repaired more than 143,000 pallets (2013: 130,000).
• Our recycling programme in our Trade division, introduced in 2012, continues to be introduced to new depots as they open. Recycling volumes in 2014 were consistent with those achieved in 2013 and we will continue to work with our waste contractor to identify further recycling opportunities in the depots.
Bought-in productOur approach: Ethical and environmental sourcing continues to be an important factor when we determine which suppliers we use. In order to ensure consistency with our manufactured product, we aim to source from suppliers who have similarly high standards and international accreditation.
• Development of our international supply base continues to improve with suppliers performing better year on year, in areas such as Quality, Environmental, Health & Safety and Ethical performance. Continuous monitoring, regular assessments and audits take place to ensure that suppliers maintain our strict standards. There have been no reported instances where our suppliers have failed to satisfy the Howden Joinery requirements.
• Following the introduction of the EU Timber Regulations in March 2013 we have continued our certification with the Timber Trade Federation under their Responsible Purchasing Policy. To that end we undertake due diligence on all timber we source to determine the risk that illegal timber may enter our supply chain. Our due diligence system has been assessed by the Timber Trade Federation as meeting the Core Criteria for Procurement Due Diligence.
• Howden Joinery has been certified by the FSC and the European Programme for the Endorsement of Forest Certification (PEFC) since February 2008. At the end of 2014, 39 of our 57 kitchen ranges (68% of our kitchens) were fully compliant with FSC requirements (compared to 64% in 2013 and 55% in 2012). We aim to improve on this percentage for a fifth consecutive year in 2015.
24
Corporate social responsibility (CSR) Report continued
EnergyOur approach: Our efforts to reduce energy use across the business are recognised by our accreditation under the Carbon Trust Standard. During 2014, the Company was re-assessed and re-certified under the Carbon Trust Standard. As well as assessing the Group’s overall reduction in energy usage over a three-year period, the Standard also looks at general energy management systems across the business and the ways in which energy reduction is encouraged across all sites.
kWh per cabinet One of our key metrics for energy usage in the factories is the electricity we consume per cabinet produced. During 2014, we continued to make significant improvements in our energy management through the efforts of our employees and the application of new technology. Our achievements in 2014 resulted in the figure dropping from 2.65kWh per cabinet in 2013 to 2.49kWh per cabinet in 2014, a 6% reduction from the previous year. We managed to achieve this reduction in our consumption per cabinet by production process efficiency improvement, HEAT Team energy saving campaigns, LED lighting conversions, plus numerous small engineering improvements.
Given the progress made in 2014, our target for 2015 is to maintain the consumption per cabinet level achieved in 2014.
ISO 14001All our Supply division sites – manufacturing, distribution or warehouse related – have maintained compliance with their ISO 14001 standard for Environmental Management as well as helping the Group retain its certification under the Carbon Trust Standard.
Biomass factory heating systemIn 2011, the EU introduced a Directive aimed at improving global air quality standards and, as a result, DEFRA published new standards and targets to significantly improve emission levels from wood combustion plants within the UK.
The previous boiler system on the Howden site was in excess of 20 years old and at the end of its economic useful life. By investing in state of the art biomass boiler and heating systems in 2014, at a cost of £5m, we have reduced our future emissions and are now capable of ensuring our continued compliance in an environment of increasingly stringent legislative targets.
The system utilises the waste produced from our manufacturing processes on site and therefore has a positive effect on our waste management impacts. As previously noted, in 2014, we converted 5,825 tonnes of sawdust into
energy at our Howden and Runcorn sites which equates to approx 31k MWh of energy generated from sawdust during the year. It is also interesting to note that our CO2 equivalent emissions are 16 times lower than if natural gas were used to heat the factories.
The system is fully compliant with the UK Government’s Renewable Heat Incentive.
TransportTruck FleetDuring 2014, despite delivering 5% more volume, we reduced the number of kilometres driven by our trucks by 150,000km, a reduction of 0.7% on 2013. We have maintained the gains in miles per gallon (mpg) that we achieved in 2013 following the implementation of a new tracking system across the truck fleet in 2012.
In November 2014, an exercise commenced to replace the existing tractor fleet. By end of January 2015 all core fleet was Euro 6 compliant. We anticipate further improvements to mpg in 2015 with the new fleet.
Car FleetIn our Trade division, delivery of manager and sales representatives’ vehicles with more eco-friendly models has continued as planned. During 2015, 75% of our core fleet will have CO2 emissions of 99g/km or less.
AppliancesAs part of our ongoing programme of energy and water reducing KPIs, in last year’s report we introduced a KPI in relation to our bestselling cooling products:
“ To reduce the energy consumption on our bestselling Lamona fridge freezers by 5% over the next three years (on a kWh basis).”
I am pleased to report good progress against this KPI with a 2% reduction in energy consumption being achieved in the first year. We will continue to work towards achieving the 5% target over three years.
In relation to our other appliances, over the last three years we have reduced energy consumption by 5% and water consumption by 7% in our Lamona dishwashers. This has resulted in the amount of water needed per cycle by up to five litres. Over the same period, we have improved our own-branded washer-dryer, reducing energy consumption by 19% and 16% on water usage.

25
Howden Joinery Group Plc Annual Report & Accounts 2014
In previous years, we have also stated our commitment to gaining Energy Savings Trust (EST) certification for some of our appliances. Unfortunately this scheme came to an end in 2013, at which point we had 19 certified appliances. Despite the withdrawal of the scheme, we remain committed to improving the design and efficiency of our products.
Greenhouse Gas (GHG) emissions dataOur Greenhouse Gas emissions data is set out below. We are pleased to report that our Scope 2 emissions reduced year-on-year, as did our turnover ratio (total CO2 emissions/tCO2e per £m) which continued its downward trend. We will continue to adopt measures aimed at reducing both total CO2 outputs and as a percentage of turnover.
Total CO2 emissions (tonnes) 2014
Total CO2 emissions (tonnes) 2013
Scope 1 – Direct: Gas 1,836 2,110
Scope 1 – Direct: Diesel 25,522 23,790
Scope 1 – Direct: Other fuels 1,158 1,250
SCOPE 1 – DIRECT: TOTAL 28,516 27,150
Scope 2 – Indirect: Electricity 26,999 27,357
SCOPE 2 – INDIRECT: TOTAL 26,999 27,357
TOTAL (Scope 1 and 2) 55,515 54,507
Turnover (£m) 1,090.8 956.5
Turnover ratio (tCO2e per £m) 50.9 57.0
Scope 1 relates to direct emissions released into the atmosphere from activities owned or controlled by the Company. This includes the consumption of gas and vehicle fuel. Scope 2 relates to indirect emissions associated with the consumption of purchased electricity. These emissions are a consequence of the Company’s activities but occur at sources which the Company does not own or control.
The methodology used follows the principles of the GHG Protocol and/or ISO14064.
80.0 Total Carbon usage (000’s tCO2e) Turnover ratio (tCO2e per £m) Turnover ratio inflation adjusted (tCO2e per £m)
40.02009 20112010 2012 20142013
50.0
60.0
70.0

26PEOPLE:SUPPORTING OUR WORKFORCEEmployee responsibilityOur approach: We aim to provide a positive work environment for all our staff, whether they work in factories, warehouses, depots or offices. Our culture emphasises the importance of individual accountability, which means the personal responsibility of each of us towards those we work with every day. We are proud of this culture, which encourages openness and transparency within the business and has been vital to its growth and development since 1995.
Health & SafetyThere has been a significant reduction in the number of RIDDOR (Reporting of Injuries, Diseases, and Dangerous Occurrences Regulations 2013) reportable accidents experienced across the Company this year to 24 compared to 36 in 2013, despite increasing throughput. This is as a result of increased focus on accident awareness through training, better information and feedback to all levels on trends and accident causes which have occurred.
All three manufacturing and distribution sites have once again been awarded the prestigious “International Safety Award” given by the British Safety Council. All three sites achieved Distinctions. It is worth noting that world-wide there were 43 Distinctions awarded (from 550 applicants), with Howdens receiving three of them.
Additionally, the British Safety Council Audits of our Supply division demonstrated our continuous improvement and all sites were recertified to OHSAS 18001 and “5-star” best practice. We also maintained certification to the ISO 14001 Standard for Environmental Management.
Sadly, a fatality occurred in November at a depot, where an LGV driver died while unloading a lorry. Investigations into the incident are in progress at the time of writing this report and therefore it is inappropriate to comment further.
TrainingHowden Joinery’s heritage and culture means we place a high value on the whole range of skills – technical, commercial and interpersonal – that are practised by local tradespeople. We are keen to promote the use of these skills in the workplace and interest in them in the wider community.
Employee training at HowdensOur staff have also benefited from our investment in internal courses, with over 181,649 training hours completed during the year. Courses are offered in subjects ranging from HR skills to manual handling, from diversity and inclusion to health and safety, from environmental awareness to LGV and fork-lift truck driving. We plan to continue to invest in training and development in 2015 as well as maintain a strong in-house delivery capability as we continue to encourage staff to achieve training qualifications themselves.
Developing apprenticeships in-houseDuring 2014, the Group employed 10 modern apprentices in our Supply division, all of which are apprenticed in engineering. We introduced a Manufacturing Operations apprenticeship programme in order to develop multi-skilled machine operators with the potential of promotion into future leadership roles. We also employed 270 modern apprentices within the depot network practising a broad range of skills.
Pioneering bursary scheme for apprentice joinersAs well as helping promote the value of apprenticeships in-house, we also continue to help the next generation of builders and joiners by supporting apprentices in the wider community. In partnership with CITB (the Sector Skills Council and Industry Training Board for the construction industry), we continue to offer the Howden Joinery Bursary for new apprentice joiners and, during 2014, we agreed to extend the funding to accommodate a further 20 places. The scheme was the first of its kind in the country and, other than stipulating that the money be used specifically to fund apprentice joiners, Howdens has no involvement in choosing either the apprentices or the companies involved.
Corporate social responsibility (CSR) Report continued

27
Howden Joinery Group Plc Annual Report & Accounts 2014
Human Rights PolicyHowden Joinery promotes the observance of internationally recognised labour standards, in particular human rights. Our employment contracts and CSR policy provide that the Company will promote these standards and all our employees must adhere to a code of ethics in order to achieve the highest possible standard of integrity in our business relationships.
Given the number of international suppliers with which we do business, the Group also considers the impact of its activities on human rights throughout its supply chain. All suppliers are subject to rigorous audits prior to commencing business with us.
The Howdens Board will keep the need for a specific human rights policy under review.
PEOPLE: PLAYING AN ACTIVE ROLE IN OUR LOCAL COMMUNITIESEach depot, manufacturing site, distribution and support centre fulfils an important role in the life of the area it serves. So as a locally driven business it is our policy to encourage staff at each of our sites to support and engage with local community activities. Cash and stock donations, together with employee fund raising initiatives, support a broad cross section of local causes including: schools, colleges, sports clubs, care homes, hospices, scouts/guides, youth groups, village halls and many other community activities.
In line with the growth of our business we have significantly increased our support for corporate projects and the capacity for each cost centre to support local good causes. This year our staff were responsible for 3,166 donations to local good causes (2013: 1,990) amounting to £1.459m across the Group (2013: £704k).
Leonard Cheshire Disability: Just over ten years ago we formed a corporate/charity partnership with Leonard Cheshire Disability (LCD). Like Howdens, they put local communities at the heart of their work. Founded in 1948 with over 150 services across the UK, this outstanding and inspirational charity supports thousands of disabled people every year, both in the UK and through an international network covering over 50 countries worldwide. To celebrate our 10 year partnership we have produced a commemorative booklet that profiles our work together over the years. This is available online at www.howdens.com/about-us/leonard-cheshire-disability/.
More of detail about our charitable activities can be found in our ‘Truly Local’ books, which are available online at www.howdens.com/about-us/atruly-local-business/. These provide a snapshot of just some of the activities in which we are involved but are not necessarily documented in this report.
Matthew IngleChief Executive25 February 2015

28
Board of directors
WILL SAMUEL Non-executive ChairmanAppointed non-executive director July 2006
Appointed Chairman October 2006
MATTHEW INGLEChief ExecutiveAppointed director April 1998
Appointed CEO October 2005
MARK ROBSONDeputy Chief Executive and Chief Financial OfficerAppointed director and CFO April 2005
Appointed DCEO May 2014
Committees: Nominations (Chairman)
Current Appointments:• Chairman of TSB Bank Group Plc• Chairman of Ecclesiastical Insurance
Group plc
Current Appointments:• None
Current Appointments:• None
Previous experience:• Senior Advisor to Lazard & Co• Senior advisor to the Prudential
Regulation Authority (PRA, formerly the Financial Services Authority)
• Director, Schroders plc• Co-Chief Executive Officer at Schroder
Salomon Smith Barney (a division of Citigroup Inc)
• Vice Chairman, European Investment Bank of Citigroup Inc
• Chairman of H P Bulmer plc• D eputy Chairman of Inchcape plc• Non-executive director of the Edinburgh
Investment Trust plc• Trustee and Honorary Treasurer of
International Alert• Qualified chartered accountant
Previous experience:• MD Magnet Trade• Set up Howden Joinery in 1995
Previous experience:• Group FD Delta plc• Qualified chartered accountant
with Price Waterhouse

Howden Joinery Group Plc Annual Report & Accounts 2014
29
The terms and conditions of appointment of all directors are available upon request at the Company’s registered office during normal business hours and at the AGM for fifteen minutes prior to and at the end of the meeting.
MARK ALLENNon-executive directorAppointed May 2011
RICHARD PENNYCOOKNon-executive directorAppointed September 2013
TIFFANY HALLNon-executive directorAppointed May 2010
MICHAEL WEMMSSenior Independent (non-executive) directorAppointed November 2006
Committees: Audit Nominations Remuneration
Committees: Audit (Chairman) Nominations Remuneration
Committees:Audit Nominations Remuneration (Chairman from May 2014)
Committees:Audit Nominations Remuneration (Chairman until May 2014)
Current Appointments:• CEO of Dairy Crest Group plc• Trustee for The Prince’s
Countryside Fund• Non-executive dIrector
of Dairy UK• Director for the GLF
Schools Board
Current Appointments:• CEO of The
Co-operative Group• Senior Independent Director
and Chairman of the Audit Committee of Persimmon plc
• Non-executive Chairman of The Hut Group Limited
Current Appointments:• Managing Director at BUPA
Home Healthcare
Current Appointments:• Non-executive director of
Moneysupermarket.com plc
Previous experience:• Sales & Operations Director
and divisional Managing Director roles (Dairy Crest Group plc)
Previous experience:• Group Finance Director at
WM Morrison Supermarkets plc, RAC Group plc, JD Wetherspoon plc, HP Bulmer Holdings plc and Laura Ashley Holdings plc
• Chief Executive Officer at Welcome Break Holdings Ltd
• President of Allders International North America
• Non-executive director of Richer Sounds plc
• Qualified chartered accountant
Previous experience:• UK Marketing Director BUPA• Head of Marketing at
British Airways• Chairman of Airmiles and
BA Holidays• Head of Global Sales and
Distribution and Head of UK Sales and Marketing (BA)
• Non-executive director of Think London
Previous experience:• Executive director of Tesco plc• Chairman of House of
Fraser plc • Chairman of the British
Retail Consortium • Non-executive director
of Majid al Futtaim, A&D Pharma and Coles Myer Ltd.

30The directors have pleasure in submitting their report and the audited financial statements for the 52 week period ended 27 December 2014. Comparative figures relate to the 52 weeks ended 28 December 2013.
In order to make our annual report and accounts more accessible, and in keeping with the restructured directors’ report adopted for the period ended 28 December 2013, a number of the sections traditionally found in this report can now be found in other sections of this annual report and accounts where it was deemed that the information would be presented in a more connected and accessible way. The directors’ report is comprised of the sections detailed below and the Business Review and statement on political contributions on page 31.
Any sections that have been moved have been cross-referenced below for ease of reference:
Located in the Strategic Report: Principal Group activities, business review and results: The principal activities of Howden Joinery Group plc and its subsidiaries can be found on pages 1 to 27.
Dividend: Information about the final dividend can be found in the Chairman’s statement on pages 8 and 9 and the Review of operations and finance on page 15.
Located in the Corporate Social Responsibility Report:
Greenhouse Gas Emissions: Details of the Group’s greenhouse gas emissions, as required by Schedule 7 of the Large and Medium-Sized Companies and Groups (Accounts and Reports) Regulation 2008 (SI 2008/410) as amended by the Companies Act 2006 (Strategic Report and Directors’ Report) Regulations 2013 (SI 2013/1970), are set out on page 25.
Located in the Corporate Governance Report:
Share capital, substantial shareholdings and acquisition of the Company’s own shares: Information in this regard can be found on pages 51 and 52.
Employees: Information about the Group’s employees is located on page 52.
Directors: Details of directors and their interests are on page 52.
Annual General Meeting: Information about the Annual General Meeting, including reappointment of the Group’s Auditors, can be found on page 52.
A copy of the UK Corporate Governance Code can be accessed at https://www.frc.org.uk/Our-Work/Codes-Standards/Corporate-governance.aspx
Located in the Nominations Committee Report:
Directors: Information with regard to the appointment and replacement of directors is located on page 65.
Employees: Information about the total number of employees and gender diversity statistics are located on page 64. The average number of employees and their remuneration are shown in note 8 to the financial statements.
The statements of the directors in connection with the Annual Report and Accounts can be found on pages 66 and 67. These statements include the Going Concern statement, the Statement of Directors’ Responsibilities, the statements in relation to Audit Information and Auditors and the Directors’ Responsibility Statement.
Directors’ report

Howden Joinery Group Plc Annual Report & Accounts 2014
31BUSINESS REVIEWThe Company is required by the Companies Act 2006 to include a business review in this report.
The information that fulfils the requirements of the business review can be found in the following sections which are incorporated in this report by reference:
• Chairman’s statement on pages 8 to 9.
• Chief Executive’s statement on pages 10 to 13.
• Review of operations and finance and Review of principal risks and uncertainties on pages 14 to 21 (which includes key performance indicators) and the illustrated business model on pages 2 to 7.
• Corporate governance report on pages 49 to 54 and Going Concern statement on page 66.
• Audit Committee report on pages 55 to 60.
• Corporate social responsibility report on pages to 22 to 27 containing environmental matters, social & community issues and additional information on employees.
The full results for the period are shown in the financial statements on pages 68 to 119.
Information about the use of financial instruments by the Company and its subsidiaries is given in note 28 to the financial statements.
The subsidiary and associated undertakings principally affecting the profits or net assets of the Group in the year are listed in the table of parent company and principal subsidiary undertakings on page 124. There have been no significant events since the balance sheet date.
POLITICAL CONTRIBUTIONSThe Group made no political donations during the current and previous period.
By order of the Board
Forbes McNaughtonSecretary25 February 2015

32STATEMENT TO SHAREHOLDERS FROM THE CHAIR OF THE REMUNERATION COMMITTEE Dear Shareholder
On behalf of the Board, I am pleased to present the Directors’ Remuneration Report for 2014 in my new role as Chairman of the Howdens Remuneration Committee. Michael Wemms stepped down as Chairman of the Committee on 8 May 2014, and I and the other members of the Committee would like to thank him for his extensive contribution and for the insightful input and experience he brought to our discussions as Chairman.
At the 2014 AGM, we received approval for our remuneration policy with a vote in favour of 98.4%. We believe that this clearly demonstrates the high level of confidence our investors have in the alignment of our remuneration framework with shareholders and with the continued growth and development of our Company. In my new role as Chair of the Remuneration Committee I have been out to meet a number of our largest shareholders, and their comments and feedback support this view.
As we are not seeking approval for a new policy this year, we include a summary of our approved policy in this report to support our investors in considering the information set out in our annual report on remuneration. Our full policy is available to review on our website at www.howdenjoinerygroupplc.com
It is intended that our approved remuneration policy will continue to apply for this year. The Committee continues to believe that the structures set out in this policy are the most appropriate for the business, although we will continue to monitor these arrangements and will consider whether changes to the structure are appropriate as part of the remuneration review planned for later in the year. If it is determined that policy changes are appropriate, the Committee will seek to amend the policy and put this to a shareholder vote at the appropriate time.
Context to reward outcomesOver the past year we have continued to deliver strong growth across the business. We have achieved sales of over £1 billion and our gross margin continues to improve. The strength of our business model has driven strong cash generation, supporting return of capital to our shareholders and allowing us to consider a number of investment opportunities both in the UK and further afield.
Profit growth and cash management (which are within management’s control and influence) are considered to be the key drivers of shareholder value at Howdens. As such, our incentive arrangements are designed to reward participants only if strong performance is achieved against these drivers. The Committee carefully considered appropriate targets for our incentive schemes based on internal budget figures, prior year PBT and brokers’ forecasts.
We believe our remuneration policy has played a key role in helping to achieve our goals and ensuring existing shareholders benefit from Howdens’ success.
Following an in depth review, we announced a number of organisational changes in May designed to support the continued growth and development of our company. As part of these changes, Mark Robson was appointed to the position of Deputy CEO and CFO and is now responsible for the day to day management of the business in addition to his responsibilities as CFO.
Decisions made in 2014The Committee met four times in the year, once more than in our ordinary cycle. The additional meeting was in view of the organisational changes discussed above, with the Committee believing it necessary to thoroughly consider and discuss the remuneration of those executives whose roles have changed. In particular, the Committee considered an appropriate salary level for Mark Robson in his new role. Given his significant increase in remit and his past performance in delivering our strong recent growth, the Committee awarded him a 5% salary increase effective from the date he took on his new responsibilities.
This year, payouts for our executive directors under the bonus were at 127% of salary, reflecting the strong profit growth (37%) and cash generation (cash flow of £218m) achieved over the year. Co-Investment plan shares have vested at their maximum potential, reflecting a PBT growth over the last three years averaging 20% per annum, and an exceptionally strong share price increase, from £1.31 (at the date of grant) to £3.64.
The key decisions made by the Committee included:
• Approval of 2014 annual bonus payouts at 127% of salary following exceptionally strong profit and cash flow performance in the year.
• Approval of the vesting in full of the 2012 Co-Investment plan reflecting the strong profit and share price performance achieved over the last three years.
• Approval for Mark Robson’s revised salary in view of his new role.
Directors’ remuneration report – Summary of directors’ remuneration policy

Howden Joinery Group Plc Annual Report & Accounts 2014
33Implementation of policy in 2015The revised 2014 UK Corporate Governance Code includes a requirement that clawback and malus provisions apply to incentive scheme awards. Although our policy does not include formal clawback provisions, the Committee believe that it is in the interests of our shareholders to include provisions allowing the Company to recover amounts paid or reduce vesting outcomes in certain scenarios. As such, clawback and malus provisions will apply to awards made under the annual bonus (for the bonus corresponding to FY15 onwards) and the Co-Investment Plan (for grants made in 2015 and onwards). Further details on these provisions are set out in our Annual Report on Remuneration on pages 39 to 48.
In light of the overall opportunity of the package, executive directors will not receive a salary increase for 2015. We will continue to keep these salaries under review.
The PBT and cash flow targets for the annual bonus have been increased to reflect the improved prospects for our Company over the coming year, considered in the context of internal budget and brokers forecasts.
The Co-Investment Plan will continue to be used as our long-term incentive vehicle for executive directors in 2015. The PBT target range applying to the plan for 2015 will be 8% to 20% p.a. growth, in line with the targets for awards made in 2014. The Committee believes that this range continues to represent a stretching level of long-term growth for the business.
Finally, I would like to thank my fellow Committee members as well as those other individuals who supported the Committee during the year for their hard work and commitment. As a Committee, we remain committed to open and transparent dialogue with our shareholders. If you would like to discuss any part of our remuneration policy, I would welcome your views.
On behalf of the Board
Tiffany HallRemuneration Committee Chairman25 February 2015

34Howdens Remuneration Policy, as set out in our 2013 Annual Report and Accounts, was approved by shareholders at the 2014 AGM with the intention that it apply for three years from that date. Our Remuneration Policy is also available in full on our website, at www.howdenjoinerygroupplc.com. No changes are proposed to this policy and so for clarity for shareholders we set out in this report a summary of its key elements, together with information on our approach to implementing policy in 2014 and 2015.
Future policy table – executive directorsRemuneration is benchmarked against rewards available for equivalent roles in a suitable comparator group. In addition to benchmarking, the Committee considers general pay and employment conditions of all employees within the Group and is sensitive to these, to prevailing market conditions, and to governance requirements.
The table below sets out the key components of executive directors’ pay packages, including why they are used and how they are operated in practice.
Element and how it supports our strategy Operation Opportunity Performance Measures
Base salary
Recognises the market value of the executive’s role, skill, responsibilities, performance and experience.
Salaries are reviewed annually, and are effective from 1 January each year. Salaries will not be changed outside of the annual review, except for in exceptional circumstances, such as a mid-year change in role.
Increases will normally be only for inflation and/or in line with the wider employee population.Salaries are set within a range defined by a market benchmark derived from companies of a comparable size operating in a similar sector (policy is to pay median). The peer group used is reviewed whenever benchmarking is performed, and the Committee applies judgement in identifying appropriate peer group constituent companies. The individual’s level of total remuneration against the market is considered at the same time.Reviews will also take into account the performance of the individuals, any changes in their responsibilities, pay increases for the wider workforce and internal relativities.2014 and 2015 salary levels are detailed in the ‘Statement of implementation of remuneration policy in 2015’ section on page 46.
None
Benefits
Provides a competitive level of benefits.
Howdens pays the cost of providing the benefits on a monthly basis or as required for one-off events.
Benefits are based upon market rates and include receipt of a car allowance; non-exclusive use of a driver; health insurance and death-in-service insurance payable by the Company.
None
Annual bonus
Incentivises annual profit and cash flow performance over the financial year. Deferral links bonus payout to share price performance over the medium-term.
Performance is assessed annually against cash flow and PBT targets. Any bonus earned in excess of 100% of salary is deferred into shares. Shares are paid out in equal tranches on the first and second anniversary of deferral date. Payment is subject to continued employment.No dividend equivalents accrue on matching awards.The Company has the ability to withhold payment of part or all of the bonus if it does not believe the vesting outcome is a fair reflection of individual or Company performance.
Threshold performance under both PBT and cash flow components will result in a payout of 18% of salary for 2015. The Committee may change the threshold payout levels over the life of the policy.The cash flow element can result in a payout of up to 20% of salary. Achievement against PBT targets can result in a payout of up to 200% of salary. However as the total bonus receivable by executives cannot exceed 200% of salary, the maximum payout under PBT is limited by the achievement against cash flow targets.The maximum bonus potential of 200% of salary represents a notional cap on the profit share component and the Committee does not envisage this level of payout being attained.
Performance is measured over the financial year.If an event occurs which causes the Committee to consider that the performance targets are no longer appropriate, the Committee may substitute or vary the targets in such manner as is reasonable in the circumstances and produces a fairer measure of performance and is not materially more or less challenging to satisfy.The Committee may change the weightings of the performance measures over the life of the policy.
Remuneration policy
Directors’ remuneration report – Summary of directors’ remuneration policy continued

Howden Joinery Group Plc Annual Report & Accounts 2014
35Element and how it supports our strategy Operation Opportunity Performance Measures
Co-Investment Plan (CIP)
Focuses management on longer-term PBT growth than addressed by the annual bonus. Long-term PBT growth is key to the generation of shareholder value.
Executives have the opportunity to participate in the CIP on an annual basis. The CIP operates over a three year cycle. The investment is funded by executive directors themselves from their personal shareholding (deferred annual bonus shares are not allowable for investment purposes).The matching shares vest after a three year vesting period subject to performance against PBT growth targets.The Company has the ability to vary the performance conditions if events happen which cause the Committee to consider that they have ceased to be a fair measure of individual or Company performance.No dividend equivalents accrue on matching shares.
The CEO can invest up to the lesser of 650,000 shares or 150% of salary.The Deputy CEO and CFO* is able to invest an equivalent proportion of salary.Each invested share is matched by the Group with up to two shares, subject to performance. For threshold performance, 0.3 matching shares vest per invested share.Note that the maximum matching opportunity allowable under this policy is set below the limit allowable under the scheme rules of five matching shares per invested share. The Company does not intend to make awards above the policy maximum of two shares per invested share.
PBT performance is measured over a three year period. The targets are set at the start of each three year performance period.
Long-Term Incentive Plan (LTIP)
An alternative to the CIP.
Awards of restricted shares or share options may be made under the LTIP.Awards are not currently being granted under the plan but the Committee retains the flexibility to use it in future years as an alternative to the CIP.The shares or options would vest after a three year vesting period subject to performance against PBT growth targets.The Company has the ability to vary the performance conditions if events happen which cause the Committee to consider that they have ceased to be a fair measure of individual or Company performance.
The plan allows for awards to be granted to participants of up to 100% of salary in restricted shares or 200% of salary in market value options, with threshold performance delivering 15 percent of maximum.Awards under this plan have not been granted to executive directors since 2010 and will not be granted in years when executive directors also receive CIP awards.
PBT performance would be measured over a three year period. The targets would be set at the start of the three year performance period.
* On 30 May 2014, Mark Robson was promoted from his role of CFO to Deputy CEO and CFO. His remuneration package remains in line with the policy previously applicable to him as CFO. Further details are laid out in the ‘approach to implementation of policy’ section of the annual report on remuneration on page 39.

36Element and how it supports our strategy Operation Opportunity Performance Measures
Pension
Provides competitive long-term savings opportunities.
The Howden Joinery Group Pension Plan is a hybrid defined benefit, occupational pension plan. The defined benefit pension accrues on a Career Average Revalued Earnings (CARE) basis at the rate of 1/50th of actual pensionable pay in each year (currently capped at £142,200; the cap increases annually in line with CPI). In addition the Company will match any voluntary member contribution made to the defined contribution top-up section to a maximum of 8% of pensionable pay. Alternatively, a participant may receive a salary supplement of 8% of salary in lieu of this defined contribution opportunity.A pension supplement system operates concurrently with the Plan which recognises that pension entitlement in respect of the CARE part of the Plan is capped. This supplement is 30% of basic salary above the Plan Cap to reflect competitive market practice.The CEO has chosen to opt out of membership of the Plan and consequently receives a salary supplement of 30% of salary in lieu of pension.This plan is now closed to new entrants. If an executive director joins who is not already a member of the plan, they will be able to participate in the new auto-enrolment defined contribution scheme or to receive a supplement payment of 30% of total base salary.
None
Shareholding requirement
Strengthens alignment of interests between participants and shareholders.
Executive directors are expected to retain vested shares from deferred bonus and long-term incentive awards (net of income tax and national insurance contributions) until they reach the minimum requirements.Unvested deferred bonus and long-term incentive shares are not taken into account.
The CEO is expected to build up a holding of 200% of base salary.Other executive directors are required to hold 100% of base salary.
None
Fees for non-executive directors
To attract NEDs who have a broad range of experience and skills to oversee the implementation of our strategy.
The fees for the non-executives are determined by the Chairman and Chief Executive. The fee for the Chairman is determined by the Remuneration Committee while the Chairman is absent.No other services are provided to the Group by non-executive directors.
Fees for non-executive directors are set out in the “statement of implementation of remuneration policy in 2015” section on page 46.The fees reflect the time commitment and responsibilities of the roles. Accordingly committee chairmanship and Senior Independent Director (SID) fees are paid in addition to the NEDs’ basic fee. Committee chairmanship fees apply only to the Audit and Remuneration Committees. The Chairman receives no fees in addition to the Chairman’s fee.Fees may be reviewed every year, and are set within a range defined by a market benchmark of FTSE 250 companies. Benchmarking is typically undertaken every three years.
NEDs are not eligible to participate in any performance related arrangements.
Directors’ remuneration report – Summary of directors’ remuneration policy continued

Howden Joinery Group Plc Annual Report & Accounts 2014
37Approach to recruitment remunerationThe treatment and design of the various elements of remuneration paid to new recruits is set out in the table below. The Committee’s policy is to pay no more than is necessary to attract appropriate candidates to the role. However, in unusual circumstances, an arrangement may be established specifically to facilitate recruitment of a particular individual. Any such arrangement would be made only where critical to the recruitment of an exceptional candidate, and within the context of minimising the cost to the Company.
Component Policy
General The Committee’s approach to recruitment remuneration is to pay no more than is necessary to attract appropriate candidates to the role.
Any new executive director’s ongoing package would be consistent with our remuneration policy as set out in this report.
Base salary and benefits
The salary level will be set taking into account the responsibilities of the individual and the salaries paid to similar roles in comparable companies (policy is to pay median). In certain circumstances the Committee may initially position the executive director’s salary below the market level and increase it to market levels through exceptional increases over an appropriate period of time.
The executive director will be eligible to receive benefits in line with Howdens’ benefits policy as set out in the remuneration policy table.
Should relocation of a newly recruited executive director be required, reasonable costs associated with this relocation will be met by the Company. Such relocation support could include but not be limited to payment of legal fees, removal costs, temporary accommodation/hotel cost, a contribution to stamp duty, replacement of non-transferrable household items and related taxes incurred. In addition, and in appropriate circumstances, the Committee may grant additional support in relation to the payment of school fees and provision of tax advice.
Pension The executive director will be able to participate in the auto-enrolment defined contribution scheme or to receive a supplement payment of up to a maximum of 30% of base salary.
Annual bonus The executive director will be eligible to participate in the annual bonus scheme as set out in the remuneration policy table.
The maximum potential opportunity under this scheme is 200% of salary.
Long-term incentives
The executive director will be eligible to participate in the long-term incentive schemes set out in the remuneration policy table. This allows for awards to be made under either the CIP or the LTIP (but not both).
Accordingly the executive director may be offered a maximum investment opportunity under the CIP of the lesser of 650,000 shares and 150% of salary, with each invested share being matched by up to two matching shares. Alternatively awards may be made under the LTIP to a maximum of 100% of salary in restricted shares or 200% of salary in options.
Replacement awards
The Committee may grant the executive director awards to replace awards from a previous employment that are forfeited. Should replacement awards be made, any awards granted would be no more generous overall in terms of quantum or vesting period than the awards due to be forfeited. In determining the quantum and structure of these commitments, the Committee will take into account the fair value and, as far as practicable, the timing and performance requirements of remuneration foregone.

38Policy on payment for loss of officeThe treatment of the various elements of remuneration payable to executive directors in a loss of office scenario is set out in the table below. In exceptional circumstances an arrangement may be established specifically to facilitate the exit of a particular individual, however any such arrangement would be made within the context of minimising the cost to the Company. The Committee will only take such a course of action where it considers it to be in the best interests of shareholders. Full disclosure of any payments will be made in accordance with the new Remuneration Reporting regulations.
Component Policy
General When determining any loss of office payment for a departing individual the Committee will always seek to minimise cost to the Company whilst seeking to reflect the circumstances in place at the time. As an overriding principle there should be no element of reward for failure.
Base salary and benefits
In the event of termination by the Company, there will be no compensation for loss of office due to misconduct or normal resignation. In other circumstances, executive directors may be entitled to receive compensation for loss of office which will be paid monthly for a maximum of twelve months. Such payments will be equivalent to the monthly salary that the executive would have received if still in employment with the Company.
Pension An enhanced pension is payable in the event of retirement through ill health. There is no scope for enhancements to individuals’ accrued pension entitlements for other loss of office scenarios.
Annual bonus Where an executive director’s employment is terminated after the end of a performance year but before the payment is made, the executive may be eligible for an annual bonus award for that performance year subject to an assessment based on performance achieved over the period. No award will be made in the event of gross misconduct.
Where an executive director’s employment is terminated during a performance year, a pro-rata annual incentive award for the period worked in that performance year may be payable subject to an assessment based on performance achieved over the period.
Long-term incentives and deferred annual bonus
The treatment of outstanding deferred annual bonus is governed by written agreements with individuals and the treatment of long-term incentive awards by the rules of the relevant plan. Individuals are defined as either a good or bad leaver for the purposes of outstanding incentive awards. Good leavers are those leaving under pre-specified circumstances (such as retirement, ill health or disability) or those deemed by the Committee at its absolute discretion as a good leaver given the circumstances surrounding the loss of office. All other leavers are bad leavers.
If an individual is a good leaver or dies then they will either continue to hold the award which will vest on the normal vesting date based on Howdens performance (where applicable), or the Committee may exercise discretion to accelerate vesting of the award, pro-rated to reflect the extent to which the performance targets have been met (allowing for the curtailed performance period). In both scenarios the amount vesting is pro-rated for the proportion of the period elapsed when the individual leaves.
If an individual is a bad leaver then all awards to which they are conditionally entitled will lapse in full.
Directors’ remuneration report – Summary of directors’ remuneration policy continued

Howden Joinery Group Plc Annual Report & Accounts 2014
39This annual report on remuneration outlines remuneration related activities and outcomes over the past year. The report represents the implementation of the Company’s remuneration policy, which was approved by shareholders at the 2014 AGM and is set out in full in the 2013 Annual Report and Accounts and on the Group’s website.
Those sections of this report which have been audited are indicated in the title to the section.
Approach to implementation of policyAll remuneration paid to our executive directors in 2014 has been in line with our approved policy. Although this policy applies specifically to executive directors of the Group, Executive Committee members participate in the same incentive schemes as the executive directors at a reduced level to ensure alignment between the leadership team with each other and with our shareholders.
Mark Robson change in roleOn 30 May 2014, Mark Robson was appointed to the role of Deputy CEO and CFO of the Group. In his new role, Mr Robson is responsible for the day to day management of the business in addition to his responsibilities as CFO, representing a significant increase in Mr Robson’s remit. Accordingly, the Committee carefully considered market benchmarking information in line with our policy and determined that an increase of 5%, to £421,000, was appropriate. This increase reflects the extent of Mr Robson’s new responsibilities, together with his exceptional performance in role and his contribution to our strong profitable growth.
There are no other changes to Mr Robson’s package, which remains in line with policy. As such, areas of our approved policy applying to the CFO role continue to apply to Mr Robson as Deputy CEO and CFO.
Clawback and malusIn response to the release of the 2014 Corporate Governance Code, the Committee has determined that clawback and malus provisions should apply to awards made under the Annual Bonus (for the bonus corresponding to the 2015 financial year onwards), and the Co-Investment Plan and Long-term Incentive Plan (for grants made in 2015 onwards).
Although our remuneration policy does not include a formal clawback policy, the Committee believes that it is in the interests of our shareholders to implement provisions entitling the Company to recover amounts paid or reduce vesting outcomes in certain scenarios. It is the Committee’s intention that formal clawback and malus provisions be incorporated into our approved policy when this is next reviewed.
Further details around the provisions to be implemented for 2015 are set out in the ‘statement of implementation of remuneration policy’ section on page 47.
Directors’ remuneration report – Annual report on remuneration

40Single total figure of remuneration (subject to audit)The table below sets out the aggregate remuneration received by directors for 2013 and 2014. Further details on the pension, annual bonus and Co-Investment Plan figures are contained in following sections.
£000’sBase
salary/fees Taxable benefits1 BonusLong-term
Incentive awards Pension Total
Year 2014 2013 2014 2013 2014 20132014 (CIP)
2013 (CIP) 2014 2013 2014 2013
Chairman
Will Samuel 190 180 – – – – – – – – 190 180
Executive directors
Matthew Ingle 572 572 19 18 728 723 4,732 3,685 172 170 6,223 5,168
Mark Robson2 413 401 493 33 513 509 3,319 2,589 171 166 4,465 3,698
Sub-total 1,175 1,153 68 51 1,241 1,232 8,051 6,274 343 336 10,878 9,046
Non-executive directors
Mark Allen 45 43 – – – – – – – – 45 43
Angus Cockburn – 36 – – – – – – – – – 36
Tiffany Hall 50 43 – – – – – – – – 50 43
Richard Pennycook 53 15 – – – – – – – – 53 15
Michael Wemms 51 54 – – – – – – – – 51 54
Total 1,374 1,344 68 51 1,241 1,232 8,051 6,274 343 336 11,077 9,237
Note
1 The benefits figure comprises receipt of a car allowance; non-exclusive use of a driver; health insurance and death in service insurance payable by the Company.
2 Mark Robson received a salary increase of 5% effective as of 30 May 2014 (from £401,000 to £421,000), reflecting his additional responsibilities in his new role as Deputy CEO and CFO. The figure shown above therefore represents 5 months at his original salary and 7 months at the revised figure.
3 Due to a clerical payroll error, Mr. Robson was not paid a component of his benefits package in 2012 or 2013. The amounts not paid to Mr. Robson in 2012 or 2013 will be paid to him as part of his 2015 benefits package to ensure that his overall remuneration position is up to date.
The aggregate Directors’ remuneration, including salary, bonus, benefits and cash pension allowances is £3,025k.
Additional requirements in respect of single figure table (subject to audit)Annual bonus targets and outcomesThe table on the following page sets out the 2014 annual bonus targets and performance outcomes which underlie the bonus figures shown in the single total figure of remuneration table for 2014.
These targets were set by the Remuneration Committee in February 2014 in line with the approach detailed in our approved policy. As incentive targets they are designed to be stretching for participants in light of Howdens’ budget, prior year PBT and brokers’ forecasts. They do not represent the Group’s budget figures for last year.
Directors’ remuneration report – Annual report on remuneration continued

Howden Joinery Group Plc Annual Report & Accounts 2014
41The Remuneration Committee was satisfied that the payments fairly reflected Group performance for 2014.
PBT Cash flow Overall
Threshold TargetAbove target Achieved Threshold Target Maximum Achieved Total Cash Deferred
Performance £138m £161m £185m £189m £148m £170m £189m £218m
Payment (% of salary unless otherwise stated) 10% 85% 105% 107% 8% 15% 20% 20% 127% 100% 27%
Outcomes for executive directors (£000)
Matthew Ingle 726 572 154
Mark Robson 524 413 111
Co-Investment PlanThe table below sets out the details of the 2012 Co-Investment Plan targets and performance outcomes which underlie the Co-Investment Plan figures shown in the single total figure of remuneration table for 2014. These awards will vest on 26 March 2015.
The 2012 CIP is based on three year growth in PBT from that achieved in 2011. In our 2011 Annual Report and Accounts the PBT figure for the year was disclosed as £110.0m. This was updated in the FY 2012 Annual Report and Accounts to £111.0m in view of the closure in 2012 of the Asia Supply Division and subsequent recategorisation of £1.0m of 2011’s “Cost of sales” as a “Discontinued operations: Loss before tax – exceptional item”.
In such scenarios the Committee believes that it should determine on a case by case basis whether an adjustment should be made through consideration of a range of factors including materiality, the extent to which the circumstances are within management’s control and the impact on the overall vesting outcome.
Consideration of 2014 PBT indicated that the base PBT figure used was not material for the purpose of calculating the 2012 Co-Investment Plan vesting outcome, with full vesting being projected in either scenario. As such, the Committee determined that the restated figure of £111m should be used in this case.
Three year PBT growth
Threshold Maximum Achieved
Performance 6% p.a. 12% p.a. 20% p.a.
Vesting (matching shares per invested share) 0.3 2.0 2.0
Given the performance achieved as set out above, the table below sets out the value of this award for participants. This is based on a share price of £3.64, being the three-month average share price to 27 December 2014.
Number of awards vesting
(‘000)
Total value at £3.64 per share
(£000’s)
Outcomes for executive directorsMatthew Ingle 1,300 4,732
Mark Robson 912 3,319

42Total pension entitlements (subject to audit)Executive directors are eligible to participate in the Howden Joinery Group Pension Plan (the Plan), details of which are provided in the policy table on page 36. The plan is not open to new joiners.
The table below sets out the accrued pension for both executive directors, with pension values calculated using the HMRC method. No additional benefits become receivable if executive directors retire early. Matthew Ingle had a fully funded pension position in 2006 and hence has chosen to opt out of membership of the Plan. Mr Ingle therefore receives a salary supplement of 30% of salary in lieu of pension (£171,510 in 2014).
Although Mr Ingle has now reached his normal retirement date under the Plan, he did not draw any pension in the year.
Name
Accrued pension at
27 Dec 2014 £000’s
Normal retirement
date
Pension value in the year from defined
benefit component £000’s
Pension value in the year from defined
contribution component £000’s
Pension value in year from cash
allowance £000’s
Total £000’s
Matthew Ingle 50 28/09/2014 – – 172 172
Mark Robson 29 16/01/2019 57 33 81 171
Loss of office payment or payments to past directors (subject to audit)No loss of office payments or payments to past directors were made in the year under review.
Scheme interests awarded during the financial year (subject to audit)During 2014 the executive directors were invited to participate in the Co-Investment Plan. The plan operated in line with our approved policy, and as such was in line with awards granted in 2013, as follows:
• The CEO was able to invest up to the lesser of 650,000 shares and 150% salary of his own shares into the plan for three years. At the time of award, 150% of salary equated to 226,566 shares (based on a closing share price of £3.79 on the day prior to grant).
• The Deputy CEO and CFO was able to invest up to the same proportion of salary as the CEO.
• Both the CEO and Deputy CEO and CFO invested the full amount.
• Under the Plan, each invested share is matched by up to two additional shares which vest subject to the achievement of stretching PBT growth targets.
• In setting the performance targets, the Remuneration Committee aims to align management’s reward with longer-term PBT growth which is central to the achievement of the Group’s strategy. Targets for the 2014 CIP were set in line with policy and as such provide a range which represents long-term success for Howdens.
• This award is not subject to a clawback provision, however the Company does retain the right to vary the performance conditions if events happen which cause the Committee to consider that they have ceased to be a fair measure of individual or Company performance. Future awards under the CIP will be subject to a clawback provision, as set out in the “implementation of remuneration policy in 2015” section of the report on page 47.
Directors’ remuneration report – Annual report on remuneration continued
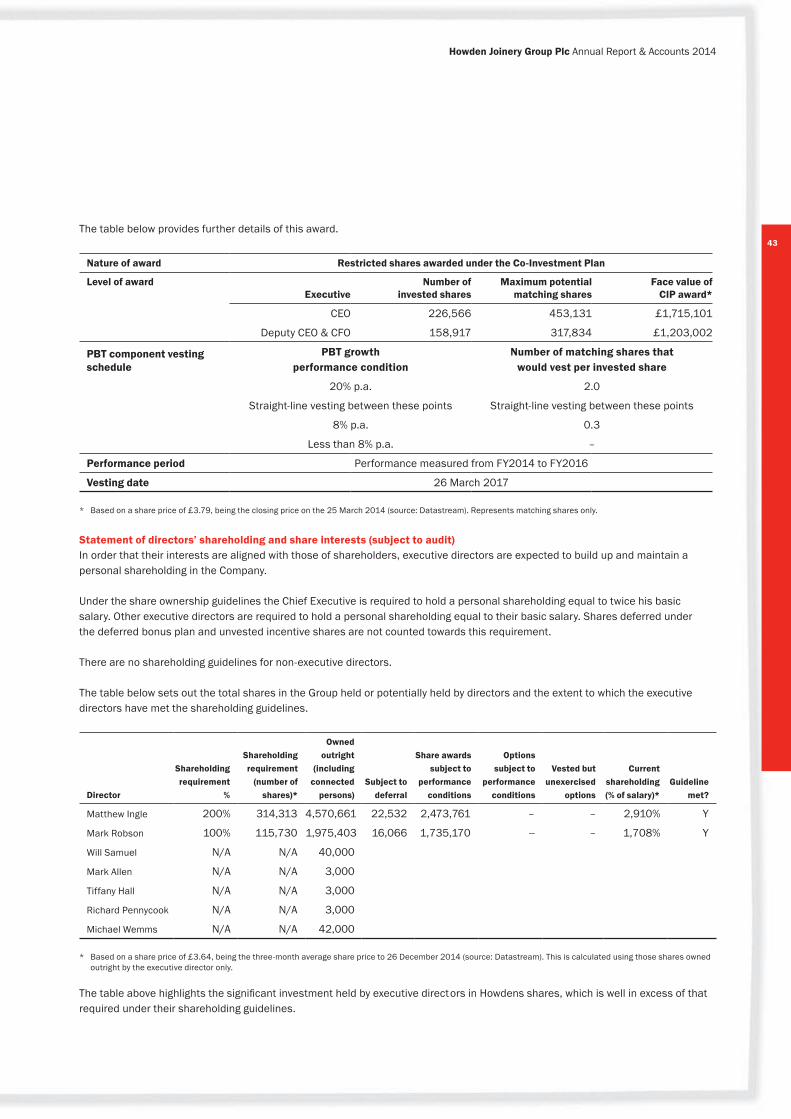
Howden Joinery Group Plc Annual Report & Accounts 2014
43The table below provides further details of this award.
Nature of award Restricted shares awarded under the Co-Investment Plan
Level of awardExecutive
Number of invested shares
Maximum potential matching shares
Face value of CIP award*
CEO 226,566 453,131 £1,715,101
Deputy CEO & CFO 158,917 317,834 £1,203,002
PBT component vesting schedule
PBT growth performance condition
Number of matching shares that would vest per invested share
20% p.a. 2.0
Straight-line vesting between these points Straight-line vesting between these points
8% p.a. 0.3
Less than 8% p.a. –
Performance period Performance measured from FY2014 to FY2016
Vesting date 26 March 2017
* Based on a share price of £3.79, being the closing price on the 25 March 2014 (source: Datastream). Represents matching shares only.
Statement of directors’ shareholding and share interests (subject to audit)In order that their interests are aligned with those of shareholders, executive directors are expected to build up and maintain a personal shareholding in the Company.
Under the share ownership guidelines the Chief Executive is required to hold a personal shareholding equal to twice his basic salary. Other executive directors are required to hold a personal shareholding equal to their basic salary. Shares deferred under the deferred bonus plan and unvested incentive shares are not counted towards this requirement.
There are no shareholding guidelines for non-executive directors.
The table below sets out the total shares in the Group held or potentially held by directors and the extent to which the executive directors have met the shareholding guidelines.
Director
Shareholding requirement
%
Shareholding requirement
(number of shares)*
Owned outright
(including connected
persons)Subject to
deferral
Share awards subject to
performance conditions
Options subject to
performance conditions
Vested but unexercised
options
Current shareholding (% of salary)*
Guideline met?
Matthew Ingle 200% 314,313 4,570,661 22,532 2,473,761 – – 2,910% Y
Mark Robson 100% 115,730 1,975,403 16,066 1,735,170 -- – 1,708% Y
Will Samuel N/A N/A 40,000
Mark Allen N/A N/A 3,000
Tiffany Hall N/A N/A 3,000
Richard Pennycook N/A N/A 3,000
Michael Wemms N/A N/A 42,000
* Based on a share price of £3.64, being the three-month average share price to 26 December 2014 (source: Datastream). This is calculated using those shares owned outright by the executive director only.
The table above highlights the significant investment held by executive directors in Howdens shares, which is well in excess of that required under their shareholding guidelines.

44
Year 20092 20102 20113 20124 20135 20146
CEO single figure1 (£000’s) 1,399 1,458 6,083 3,401 5,168 6,221
Annual bonus – % of maximum 63% 69% 66% 51% 63% 64%
LTI vest – % of maximum – – 100% 100% 89% 100%
The graph above illustrates the Company’s TSR performance relative to the constituents of the FTSE 250 index (excluding investment companies) of which the Company is a constituent. It shows that over the past six years Howden Joinery Group has generated significantly higher returns than the FTSE 250 (excluding Investment Trusts).
Beneath the graph is a history of the CEO single figure and incentive payout levels. It shows that the bonus has recognised consistently strong annual performance, and that long-term incentives (LTI) have reflected the challenges that faced the Company after 2008 and recognised the turnaround delivered by the Group since then. These figures are buoyed by significant share price increases over the periods, as illustrated by the graph.
Notes
1. Each CEO single figure has been prepared as per the prescribed methodology, and includes base salary, benefits, pension and annual bonus payments. The figures also include long-term incentive vests where relevant.
2. No long-term incentives vested which relate to the 2009 and 2010 CEO single figures.
3. The 2011 CEO single figure includes the vesting of the 2009 premium priced option awards. This comprised two equal tranches of options, one with a premium exercise price of 25p and the other with a premium exercise price of 50p (share price at grant was 18.75p). The awards vested in full as cumulative PBT in the three financial years ending in 2009, 2010 and 2011 exceeded the target set of £90 million. The value shown in the single figure reflects the significant increase in share price over the period to £1.188 at the date of vest (a growth of 81% p.a.).
4. The 2012 CEO single figure includes the vesting of the 2010 market priced option award, which had an exercise price of 87p. The share options vested in full as the Group’s 2012 PBT exceeded the maximum growth target of RPI + 8% p.a. on 2009 PBT. The value shown in the single figure reflects the significant increase in share price over the period to £2.38 at the date of vest (a growth of 43% p.a.).
5. The 2013 CEO single figure includes the partial vesting of the 2011 CIP award. 89% of the matching shares vested as the Group’s 2013 PBT had grown at 11% p.a. on 2010 PBT. The value shown in the single figure reflects the significant increase in share price growth over the period to £3.19 (the three-month average to 28 December 2013, source: Datastream) from £1.10 (at the date of grant), a growth of 43% p.a.
6. The 2014 CEO single figure includes the full vesting of the 2012 CIP award. 100% of the matching shares vested as the Group’s 2014 PBT had grown at 20% p.a. on 2011 PBT. As with the CIP award vesting in 2013, the value shown in the single figure reflects the significant share price growth over the period to £3.64 (the three-month average to 26 December 2014, source: Datastream) from £1.31 (at the data of grant), a growth of 41% p.a.
The table below sets out options exercised by the executive directors in the year, following the full vesting of option awards in 2008, 2012 and 2013.
DirectorNo of options
exercisedAverage
exercise Price
Average market value at exercise
date
Average gain on exercise of share
options
Matthew Ingle 3,756,045 £0.65 £3.70 £3.05
Mark Robson – – – –
Performance graph and table
Directors’ remuneration report – Annual report on remuneration continued
500
450
400
350
300
250
200
150
100
50
0Dec 09 Dec 10 Dec 11 Dec 12 Dec 13 Dec 14
HowdensFTSE 250 (excluding Investment Trusts)

Howden Joinery Group Plc Annual Report & Accounts 2014
45Percentage change in remuneration of director undertaking the role of chief executiveThe table below sets out the change in short-term pay from 2013 to 2014 of the CEO compared to all employees (on a per capita basis).
Salary Taxable benefits Bonus
£000’s £000’s % increase £000’s £000’s % increase £000’s £000’s % increase
2014 2013 2014 2013 2014 2013
CEO 572 572 – 19 18 2.0% 726 723 0.4%
All full time employees (per capita) 23 23 (0.2)% 1 1 (4.2)% 8 7 10.1%
The slight decrease in the average per capita salary for our wider workforce reflects a significant number of new recruitments in the year (from an average monthly number of full time equivalent employees of 6,499 in 2013 to 7,210 in 2014). These recruitments were typically at a more junior level, positioned below the average salary of the wider workforce.
The average salary increase awarded to our existing employees in the year was 3%, in recognition of the continuing strong performance of our business. The increase in bonus payouts to our workforce further reflects the significant growth achieved in the year and the Company’s intention that our employees are rewarded for driving this success.
For 2015 the CEO will receive no salary increase, compared to an anticipated typical wider workforce increase of c. 3% of salary.
Relative importance of spend on payThe table below sets out the change in total remuneration spend of the Group from 2013 to 2014 compared to: the total dividend paid by the Group; the total remuneration spend of the Group as a percentage of revenue; and the two incentive performance measures PBT and cash flow. The figures are shown in £m, unless otherwise specified.
Year
Total remuneration spend
£mTotal dividend
£m
Total remuneration spend as a %
of revenuePBT £m
Cash flow* £m
2013 256.2 23.3 27% 138 158
2014 286.5 40.3 26% 189 218
% increase 12% 173% (3)% 37% 38%
* Net cash flow from operating activities, being the definition used for the annual bonus scheme.
The figures above reflect our continuing growth in terms of financial performance, progression of Howdens’ dividend policy, and a significant increase in our workforce (as detailed above). We note that as new recruits have typically been at more junior roles in the business, the total remuneration spend as a percentage of our revenues has reduced.
External appointmentsIt is recognised that executive directors may be invited to become non-executive directors of other companies and that exposure to such duties can broaden their experience and skills, which will benefit the Company. Howden Joinery Group allows executive directors and other appropriate senior employees to accept a maximum of one non-executive appointment outside the Company, subject to permission from the Committee, provided this is not with a competing company nor likely to lead to conflicts of interest. No such appointments are currently in place. Executive directors may retain the fees paid to them in respect of their non-executive duties.

46Statement of implementation of remuneration policy in 2015Remuneration policy will be implemented from 2015 as follows:
Base salaries and feesBase salary increases for 2015 are set out in the table below:
2014 2015Salary
£000’sPercentage Increase
from 2013Salary
£000’sPercentage increase
from 2014Matthew Ingle 572 – 572 –Mark Robson 421 5%* 421 –
* In July 2014, Mark Robson received a salary increase of 5% (from £401,000 to £421,000) applied retrospectively from 30 May 2014, which was the date on which Mr Robson took on his new responsibilities as the Group’s Deputy CEO and CFO. No other changes were made to Mr Robson’s remuneration package.
NED fee increases for 2015 are set out in the table below. NED fees have not been increased since 2013.
2014 2015Fee
£000’sPercentage increase
from 2013Fee
£000’sPercentage increase
from 2014Chairman fee 190 – 190 –Basic NED fee 45 – 45 –Additional SID fee 3 – 3 –Committee Chair fee 8 – 8 –
Annual bonus measuresThe table below sets out annual bonus measures for 2015. This is the same structure as used in 2014 and is in line with our approved policy. Targets for these measures are considered commercially sensitive by the Committee and so are not disclosed here. The profit share percentages for CEO and Deputy CEO and CFO have been reduced from 0.325% and 0.228% respectively to reflect increased performance expectations for 2015. Performance targets, together with achievement against them, will be set out in full in the 2015 Annual Report on Remuneration.
Definition Performance level Payout levelPBT Pre-exceptional profit before tax from
continuing operationsThreshold 10% of salaryTarget 85% of salaryAbove target Profit share for the CEO: 0.246% of PBT.
Profit share for the Deputy CFO: 0.181% of PBT.Subject to aggregate bonus payout cap of 200% of salary
Cash flow Net cash flow from operating activities, taking into account the efficiency with which working capital is used, and adjusted for exceptional items
Threshold 8% of salaryTarget 15% of salaryMaximum 20% of salary
Any bonus earned in excess of 100% of salary will be deferred into shares. Deferred shares will be paid out in equal tranches on the first and second anniversary of deferral date.
Co-Investment Plan measure and targetsThe table below sets out CIP performance measures and targets for awards to be made in 2015:
PBT component vesting schedule PBT growth performance condition
Number of matching shares that would vest per invested share
20% p.a. 2.0Straight-line vesting between these points
8% p.a. 0.3Less than 8% p.a. –
Directors’ remuneration report – Annual report on remuneration continued

Howden Joinery Group Plc Annual Report & Accounts 2014
47Clawback and malus provisionsThe 2015 annual bonus and Co-Investment Plan grants will be subject to provisions that allow the Committee to reduce amounts vesting (malus) or reclaim awards paid (clawback) as follows:
Cash bonus (up to 100% of salary) Clawback provisions will apply for a period of two years following payment.
Deferred bonus (50% of deferred amount – one year deferral period)
Malus provisions will apply for the deferral period (one year) with clawback applying for a further year following vesting.
Deferred bonus (50% of deferred amount – two year deferral period)
Malus provisions will apply for the deferral period (two years).
Co-Investment Plan Clawback provisions will apply to amounts vesting under the CIP for two years following the vesting date.
Clawback provisions will apply in the event of material misstatement of accounts, erroneous assessment of a performance target, where the number of plan shares under an award was incorrectly determined, or gross misconduct by a director.
Consideration by the directors of matters relating to directors’ remunerationMembership of the CommitteeThe Remuneration Committee comprises of four independent non-executive directors who have no personal financial interest, other than as shareholders, in the matters to be decided. During the year, the members of the Committee were:
• Tiffany Hall (Chairman of the Committee from 8 May 2014)
• Mark Allen
• Richard Pennycook
• Michael Wemms (Chairman of the Committee until 8 May 2014)
Under its terms of reference (published in the Governance section of Howden Joinery Group Plc website at www.howdenjoinerygroupplc.com and reviewed on an annual basis) the Committee is responsible for determining the broad policy and specific remuneration packages for executive directors, the Company Secretary and other members of the Executive Committee, including pension rights and, where applicable, any compensation payments. The Committee is also regularly updated on pay and conditions applying to other employees in the Company.
The Committee met four times during 2014 and attendance of the Committee is shown in the table below. The meetings covered the following key areas:
• Approve salaries for the Executive Board members and Executive Committee, including the increase for Mark Robson resulting from his change in role.
• Review the developments in corporate governance best practice and competitive market practice trends during the course of the year, including the provisions of the revised Corporate Governance Code.
• Review and approve the remuneration report to shareholders.
• Review and approve the Chairman’s fees.
• Review and approve the terms and conditions of the annual bonus and long-term incentives awarded in 2014, including determining the appropriate performance targets.
• Review and approval of annual bonus payouts and share-based awards vesting in 2014.
• Review and approve the terms of reference of the Committee.
• Consider and approve clawback and malus provisions for the Company’s incentive schemes.
• Initial review of incentives for 2015.
• Review of the balance between risk and reward to ensure that the incentives are compatible with the Company’s risk policies and systems. The Committee concluded that the incentives did not expose the Company to any excessive risk and were appropriately managed.

48Attendance at Remuneration Committee meetings is set out in the table below:
Committee member AttendanceNumber of meetings
Mark Allen 2 4
Tiffany Hall* 4 4
Richard Pennycook 4 4
Michael Wemms* 4 4
* Denotes Chairman. Michael Wemms was Remuneration Committee Chairman for the February Remuneration Committee meeting and until 8 May 2014. Tiffany Hall was Remuneration Committee Chairman thereafter and was Chairman of the June, July and November Remuneration Committee meetings.
Advice to the CommitteeThe Committee regularly consults with the Chief Executive on matters concerning remuneration, although he is never present when his own reward is under discussion. The Company Chairman attends the Remuneration Committee by invitation except when his own remuneration is determined. The Company Secretary acts as secretary to the Committee but is never present when his own reward is determined.
The Committee also has access to detailed external information and research on market data and trends from independent consultants. PricewaterhouseCoopers LLP (PwC) is the Committee’s retained independent advisor and provided advice to the Committee during the year. PwC has been independent advisor to the Committee since 2007, and was appointed by the Committee as the result of a tender process. Work undertaken by PwC for the Committee included updating the Committee on trends in compensation and governance matters and advising the Committee in connection with benchmarking of the total reward packages for the executive directors and other senior members of staff. A representative from PwC attends each meeting of the Remuneration Committee. Fees paid to PwC in relation to remuneration services provided to the Committee in 2014 totaled £137,450, with fee levels based on the quantity and complexity of work undertaken. PwC also provided risk assurance and tax advice to the Company during 2014.
The Committee reviews the objectivity and independence of the advice it receives from PwC at a private meeting each year. It is satisfied that PwC is providing robust and professional advice. PwC is a member of the Remuneration Consultants’ Group which operates a code of conduct in relation to executive remuneration consulting in the UK.
Statement of voting at general meeting The table below shows the voting outcome at the May 2014 AGM for the approval of the 2014 Remuneration Report and Remuneration Policy.
Remuneration Policy1 Remuneration Report2
For Against For Against
Votes 98.41% 1.59% 98.83% 1.17%
1 10,319,810 votes (2% of all votes) were withheld.
2 438,496 votes (0% of all votes) were withheld.
The Committee was pleased with the strong vote in favour received from shareholders for both our remuneration policy and annual report on remuneration.
Tiffany HallRemuneration Committee Chairman25 February 2015
Directors’ remuneration report – Annual report on remuneration continued

Howden Joinery Group Plc Annual Report & Accounts 2014
49STATEMENT OF COMPLIANCEThe Company remains committed to the principles of corporate governance contained in the UK Corporate Governance Code (the “Code”) for which the Board is accountable to shareholders.
Throughout the 52 weeks ended 27 December 2014, the Company has been in compliance with the provisions, including the main and supporting principles as set out in the Code, applicable to accounting periods commencing on or after 1 October 2012.
Examples of how the main and supporting principles have been applied are set out below and in the Remuneration report and Committee reports. The Board received a formal update in September 2014 on the amendments made to the Code by the FRC during the year and continue to apply the Code in the spirit in which it was adopted.
INTRODUCTION FROM THE CHAIRMANThe financial, strategic and organisational progress made during 2014 was facilitated by a stable and effective Board with clearly defined responsibilities. Our priority is to ensure the long-term sustainability of the Company has absolute primacy and we have therefore invested time and effort during the year on strategic and organisational development. As a Board we are acutely aware that we must remain vigilant in ensuring that the requisite structural safeguards are in place to protect the interests of our key stakeholders and realise the full potential of the business.
I have stated previously that, as a locally empowered, entrepreneurial business, Howden Joinery is dependent on a strong, effective and consistent governance culture throughout the business, and this remains the case. Howdens has a distinctive and clearly defined culture which has been a principal cause of its success. Our core values are based around personal accountability, fair dealing, respect for others and recognition of effort. We insist on the importance of keeping our promises and we put direct, personal relationships at the heart of our business. Safeguarding and sharing the culture and values of the business is a primary function of the Board.
The Board is responsible for leading the corporate governance agenda and the purpose of this report is to set out in detail the structure of the Board, the Group’s approach to risk and internal control, and to provide some detail on our shareholder base and share capital structure.
Each of the Board’s principal Committees has a dedicated report and therefore any information relating to Audit, Remuneration or Nominations Committee matters can be found therein.
THE BOARDRoleThe business of the Group is managed by the Board who may exercise all the powers of the Company subject to the provisions of the Articles of Association, the Companies Act and any ordinary resolution of the Company.
The Board has responsibility for the overall management and performance of the Group. They are collectively responsible for challenging and assisting in the development of strategy and ensuring that there are sufficient resources in place to meet the strategic objectives which have been set.
The directors are also responsible for determining the nature and extent of significant risks and maintaining sound risk management and internal control procedures throughout the Group.
The Board reviews the performance of and provides counsel to the senior management in their day to day running of the business, and is ultimately responsible for the safeguarding of shareholders’ interests and ensuring its own effectiveness. The Board is also responsible for protecting the culture and values of the business, a role particularly pertinent to Howdens where integrity, respect and recognition are fundamental tenets of the business.
Decisions reserved for consideration by the Board are detailed in a schedule which is reviewed annually and was last reviewed and approved in January 2015. These key matters include decisions about strategy, acquisition and disposals, risk management and internal control, capital projects over a defined level, annual budgets, Group borrowing facilities and consideration of significant financial and operational matters. The Board also considers legislative, environmental, health & safety, governance and employment issues.
Board compositionThe Board is structured to ensure that there is a clear distinction between the strategic functions of the Board and the operational management of the Company. The Board currently comprises two executive directors, the Chairman and four non-executive directors. Details of the individual directors can be found on page 28 to 29.
Will Samuel was the non-executive Chairman during the whole period.
Corporate governance report

50
Corporate governance report continued
Executive directorsMatthew Ingle continued in his role as Chief Executive during the period. In addition to his role as Chief Financial Officer, Mark Robson was promoted to Deputy Chief Executive in May 2014 and as such assumed responsibility for the day-to-day management of the business. Mr Ingle was appointed to the Board in 1998; Mr Robson in 2005.
Non-executive directorsThe non-executive directors have been selected for the diversity of their backgrounds as well as their personal attributes and experience. The current board members bring a wide range of skills and experience to the Board and all actively contribute in discussion.
The Board considered that the following directors were deemed to be independent during the period:
• Mark Allen
• Tiffany Hall
• Richard Pennycook
• Michael Wemms (Senior Independent Director)
The Chairman, Will Samuel, was considered to be independent on appointment as outlined in the Code. At all times during the period the Company adhered to provision B.1.2 of the Code which provides that at least half of the Board excluding the Chairman must be independent and to the provisions of the Code relating to the composition of the Audit, Remuneration and Nominations Committees.
The Board is proposing that all of the directors will be subject to re-election at the 2015 AGM.
AttendanceThe Board holds regular meetings and receives accurate and timely information. During 2014, the Board held seven formal Board meetings and a number of other meetings and teleconferences to discuss and review progress on issues affecting the Group during the year.
Attendance No. of meetings
Will Samuel* 7 7Matthew Ingle 7 7Mark Robson 7 7Mark Allen 7 7Tiffany Hall 7 7Richard Pennycook 7 7Michael Wemms 7 7
* denotes Chairman
This table above shows the number of meetings individual directors could have attended (taking account of eligibility, appointment and retirement dates during the year) and their actual attendance.
Attendance at the Committee meetings of the Board are set out in the individual committee reports.
If a director is unable to attend a meeting, they are nevertheless provided with all the papers and information relating to the meeting and are encouraged to discuss the issues arising directly with the Chairman and executive directors. The non-executive directors also met twice during the year without the executive directors present.
Division of responsibilitiesThe roles of Chairman and Chief Executive are separate and clearly defined. The Chairman is primarily responsible for leadership of the Board and has a pivotal role in creating the conditions for individual director and board effectiveness including ensuring a culture of openness and debate in the boardroom. The Chairman is responsible for setting the Board’s agenda and works closely with the Company Secretary in this regard. He ensures that adequate time for discussion is afforded to all agenda items at meetings. It is also the responsibility of the Chairman to ensure effective communication with the shareholders. The executive directors are responsible for satisfactory execution of the policies and strategy agreed by the Board.
In accordance with the Code, the Board has established Audit, Remuneration and Nominations Committees, each with defined terms of reference. The membership of the Committees and their terms of reference are reviewed annually and are available on the Group’s website, www.howdenjoinerygroupplc.com. The work of each of the Committees is considered in individual reports in this Annual Report and Accounts.
The Group has an Executive Committee comprising those members detailed on page 127. The principal purpose of the Committee, which meets at least twice a month, or more frequently if required, is the implementation of the Group’s strategy and operational plans. The Committee monitors the operational and financial performance of the business, as well as being responsible for the optimisation of resources and the identification and control of operational risk within the Group.
Pensions Committee and Disclosure CommitteeThe Board has also established a Pensions Committee dealing with matters associated with the Group’s pension scheme (the work of this Committee can be found in its annual report on the Group’s website at www.howdenjoinerygroupplc.com) and a Disclosure Committee which considers matters which could give rise to an obligation to make a market announcement under the FCA Listing Rules.
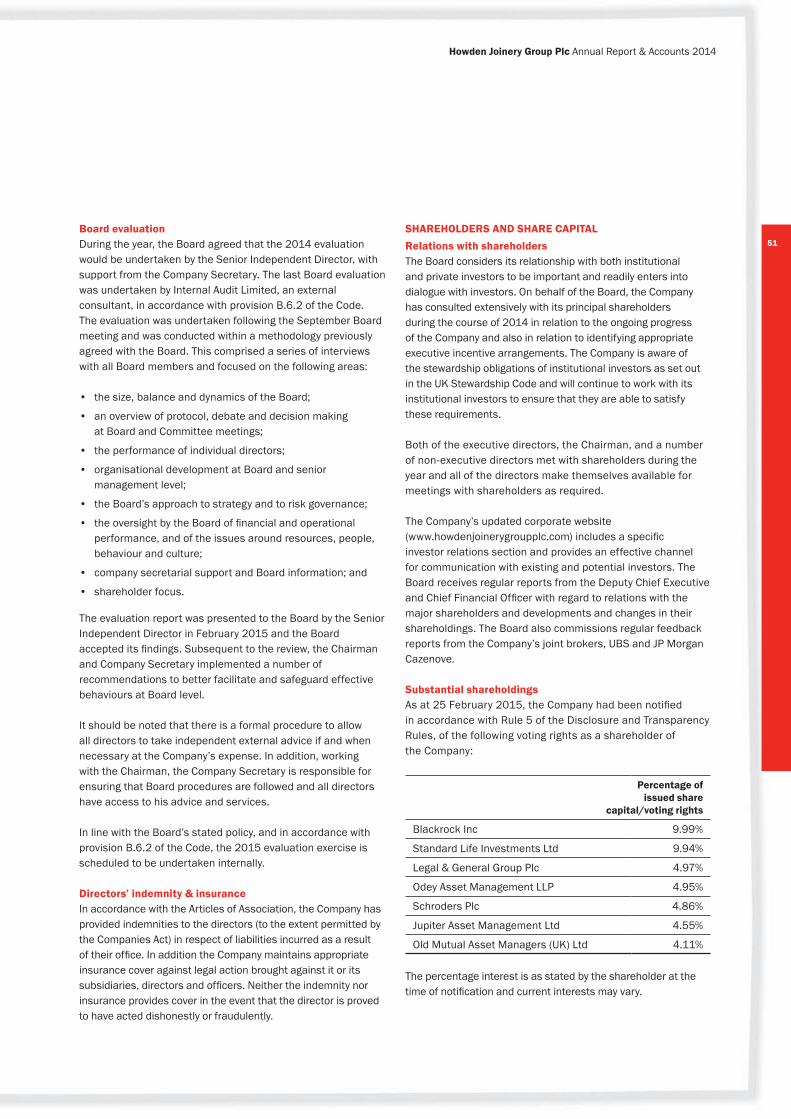
Howden Joinery Group Plc Annual Report & Accounts 2014
51Board evaluationDuring the year, the Board agreed that the 2014 evaluation would be undertaken by the Senior Independent Director, with support from the Company Secretary. The last Board evaluation was undertaken by Internal Audit Limited, an external consultant, in accordance with provision B.6.2 of the Code. The evaluation was undertaken following the September Board meeting and was conducted within a methodology previously agreed with the Board. This comprised a series of interviews with all Board members and focused on the following areas:
• the size, balance and dynamics of the Board;
• an overview of protocol, debate and decision making at Board and Committee meetings;
• the performance of individual directors;
• organisational development at Board and senior management level;
• the Board’s approach to strategy and to risk governance;
• the oversight by the Board of financial and operational performance, and of the issues around resources, people, behaviour and culture;
• company secretarial support and Board information; and
• shareholder focus.
The evaluation report was presented to the Board by the Senior Independent Director in February 2015 and the Board accepted its findings. Subsequent to the review, the Chairman and Company Secretary implemented a number of recommendations to better facilitate and safeguard effective behaviours at Board level.
It should be noted that there is a formal procedure to allow all directors to take independent external advice if and when necessary at the Company’s expense. In addition, working with the Chairman, the Company Secretary is responsible for ensuring that Board procedures are followed and all directors have access to his advice and services.
In line with the Board’s stated policy, and in accordance with provision B.6.2 of the Code, the 2015 evaluation exercise is scheduled to be undertaken internally.
Directors’ indemnity & insuranceIn accordance with the Articles of Association, the Company has provided indemnities to the directors (to the extent permitted by the Companies Act) in respect of liabilities incurred as a result of their office. In addition the Company maintains appropriate insurance cover against legal action brought against it or its subsidiaries, directors and officers. Neither the indemnity nor insurance provides cover in the event that the director is proved to have acted dishonestly or fraudulently.
SHAREHOLDERS AND SHARE CAPITALRelations with shareholdersThe Board considers its relationship with both institutional and private investors to be important and readily enters into dialogue with investors. On behalf of the Board, the Company has consulted extensively with its principal shareholders during the course of 2014 in relation to the ongoing progress of the Company and also in relation to identifying appropriate executive incentive arrangements. The Company is aware of the stewardship obligations of institutional investors as set out in the UK Stewardship Code and will continue to work with its institutional investors to ensure that they are able to satisfy these requirements.
Both of the executive directors, the Chairman, and a number of non-executive directors met with shareholders during the year and all of the directors make themselves available for meetings with shareholders as required.
The Company’s updated corporate website (www.howdenjoinerygroupplc.com) includes a specific investor relations section and provides an effective channel for communication with existing and potential investors. The Board receives regular reports from the Deputy Chief Executive and Chief Financial Officer with regard to relations with the major shareholders and developments and changes in their shareholdings. The Board also commissions regular feedback reports from the Company’s joint brokers, UBS and JP Morgan Cazenove.
Substantial shareholdingsAs at 25 February 2015, the Company had been notified in accordance with Rule 5 of the Disclosure and Transparency Rules, of the following voting rights as a shareholder of the Company:
Percentage of issued share
capital/voting rights
Blackrock Inc 9.99%
Standard Life Investments Ltd 9.94%
Legal & General Group Plc 4.97%
Odey Asset Management LLP 4.95%
Schroders Plc 4.86%
Jupiter Asset Management Ltd 4.55%
Old Mutual Asset Managers (UK) Ltd 4.11%
The percentage interest is as stated by the shareholder at the time of notification and current interests may vary.

52
Corporate governance report continued
Annual General MeetingThe 2015 Annual General Meeting (AGM) is to be held at UBS Investment Bank, 1 Finsbury Avenue, London, EC2M 2PP on 6 May 2015 at 11:00am.
The AGM provides shareholders with an opportunity to discuss the Group’s progress and operations directly with the Board. At the AGM, the Company proposes separate resolutions on each substantially separate issue and the numbers of proxy votes cast for and against each resolution are made available to shareholders when voting has been completed. The notice of the AGM is sent to shareholders at least twenty one clear days before the meeting.
Deloitte LLP have expressed their willingness to continue in office as auditors and a resolution to reappoint them will be proposed at the forthcoming AGM.
Share capitalDetails of the issued share capital, together with details of the movements in the Company’s issued share capital during the year are shown in note 23. The Company has one class of ordinary shares which carry no right to fixed income. Each share carries the right to one vote at general meetings of the Company.
There are no specific restrictions on the size of a holding nor on the transfer of shares which are both governed by the general provisions of the Articles of Association and prevailing legislation. The Articles may be amended by special resolution of the shareholders.
The directors are not aware of any agreements between holders of the Company’s shares that may result in restrictions on the transfer of securities or on voting rights.
Details of employee share schemes are set out in note 26. Shares held by the Howden Joinery Group Plc Employee Share Trust abstain from voting. No person has any special rights of control over the Company’s share capital and all issued shares are fully paid.
There are a number of agreements that take effect, alter or terminate upon a change of control such as commercial contracts, bank loan agreements and employee share plans. The only one of these which is considered to be significant in terms of likely impact on the business of the Group as a whole, is the bank facility (as described in note 20) which requires majority lender consent for any change of control.
Should such consent not be forthcoming, a change of control would trigger a mandatory repayment of the entire facility. The directors are not aware of any agreements between the Company and its directors or employees that provide for compensation for loss of office or employment that occurs because of a takeover bid.
Acquisition of the Company’s own sharesAs at 27 December 2014, the directors had authority under the shareholders’ resolutions of 8 May 2014 to purchase through the market 64,644,470 of the Company’s ordinary shares at prices ranging between 10p and the higher of (a) 105% of the average middle market quotation for an ordinary share as derived from the London Stock Exchange Daily Official List for the five business days immediately preceding the day on which the ordinary share is purchased and (b) an amount equal to the higher of the price of the last independent trade of an ordinary share and the highest current independent bid for an ordinary share as derived from the London Stock Exchange Trading System. The authority expires at the conclusion of the next AGM or within 18 months from the date of passing.
Directors and their interestsDetails of the directors in office on 27 December 2014 are shown on pages 28 to 29 and their share interests on page 43.
EMPLOYEESThe average number of employees and their remuneration are shown in note 8 to the financial statements.
At the year end, the Group had 7,506 employees (2013: 6,601) throughout the United Kingdom and overseas and strives to engage its employees wherever possible in its business goals by means of regular regional and local staff meetings.
The Board remains committed to linking reward to business budgets and targets thereby giving employees the opportunity to share in the financial success of the Group. In keeping with the structure of the business, the Company is committed to applying this policy locally, and as a result, staff of all levels regularly benefit from achieving local targets throughout the year. The Board also recognises employees for their contribution through the use of employee incentive plans and share plans within overall remuneration.

Howden Joinery Group Plc Annual Report & Accounts 2014
53RISK AND INTERNAL CONTROLThe Board is responsible for the Group’s system of internal control and for reviewing its effectiveness, whilst the role of management is to implement Board policies on risk and control. Such a system is, however, designed to manage rather than eliminate the risks of failure to achieve business objectives. In pursuing these objectives, internal controls can only provide reasonable assurance against misstatement or loss. The UK Corporate Governance Code recommends that the Board at least annually reviews the effectiveness of the Group’s system of internal controls, including financial, operational and compliance controls and risk management.
The Board has conducted reviews of the effectiveness of the system of internal controls through the processes described below and is satisfied that it accords both with the Code and with the Turnbull Guidance. The Board has not identified or been advised of any failings or weaknesses which it has determined to be significant; therefore a confirmation in respect of necessary actions has not been considered appropriate.
A description of the Group’s principal risk and uncertainties can be found on pages 20 to 21 of the Strategic Report.
Risk managementThe Board can confirm that, for the 2014 financial year, and up to the date of approval of the Annual Report and Accounts, there has been an ongoing process for identifying, evaluating and managing the significant risks faced by the Group which is reviewed regularly by the Board and accords with the Turnbull Guidance. Under the guidance of the Deputy Chief Executive and Chief Financial Officer, it is the responsibility of the Executive Committee to review the effectiveness of the risk management process and internal controls on behalf of the Board. The Executive Committee regularly reports to the Board on how risks are being managed. In addition, there is a mechanism in place to report significant control breakdowns or risk occurrences to the Executive Committee.
An ongoing process for the effective management of risk has been defined by the Board and is embedded throughout the various tiers of the organisation. It is operated in the following stages:
• Each operating division and central function identifies key risks through the adoption of both a “bottom-up” and “top-down” process. These key risks are regularly reviewed by the senior management team in each division. The key risks to each business area’s objectives are identified and scored for probability and impact. The key controls to manage the risks to the desired level are identified.
• A local database of risks and controls is maintained within each operating division and central service function. This is consolidated into a central register which becomes the key risk register for the Group. The Group Risk department facilitates the identification of these risks and provides an independent appraisal of the interpretation of the scoring mechanism, to ensure that the key risks are brought forward to the Executive Committee. The Executive Committee then reviews the key risks to assess the effectiveness of the risk management strategies.
• The senior management team within each operating division and within the central functions are responsible for the ongoing review of their functions’ risk registers.
• Regular reporting on internal and external changes that affect the risks or their importance to the business, and any risk occurrences, are reported upwards through their register to the Executive Committee.
• Key risks and their management and any areas for improvement are regularly reported to and discussed at the Executive Committee.
• A review of the risk process and risk management systems is undertaken by the Audit Committee annually.
• Overall risk is a matter reserved for the Board as a whole and as such key risks arising within the business are formally discussed by the Group Board every six months.
• In order to gain assurance that the Group’s risk process is effective a periodic review of both the Audit and Risk Process is conducted by an appropriately qualified and experienced external assurance service provider. This is conducted every five years and was last undertaken during 2012 by PricewaterhouseCoopers. In 2014, PricewaterhouseCoopers were engaged by the Company to provide assurance that existing risk management process and framework remained appropriate not only on a contemporary basis but also for a future business, taking into account long-term strategic goals and growth plans. The review included consideration of the changing risk environment and key risks to growth.

54Internal controlThe Group has an established framework of internal controls, which includes the following key elements:
• The Board reviews Group strategy and the executive management are accountable for performance within the agreed strategy.
• The Group and its subsidiaries operate control procedures designed to ensure complete and accurate accounting of financial transactions, and to limit exposure to loss of assets or fraud. Measures taken include physical controls, segregation of duties in key areas and periodic Internal Audit reviews.
• The Audit Committee meets regularly and its responsibilities are set out in the Audit Committee Report. It receives reports from the Internal Audit function on the results of work carried out under an annually agreed audit programme. The Audit Committee has full and independent access to the internal and external auditors.
• The Internal Audit function facilitates a process whereby operating entities provide certified statements of compliance with specified and appropriate key financial controls. These controls are then cyclically tested by Internal Audit to ensure they remain effective, and are being consistently applied.
• The Audit Committee will annually assess the effectiveness of the assurance provided by the internal and external auditors. Every five years, an external assessment is undertaken with regard to the assurance provided by the Internal Audit department. An external review was last undertaken by PricewaterhouseCoopers in 2012.
By order of the Board
Will SamuelChairman25 February 2015
Corporate governance report continued

Howden Joinery Group Plc Annual Report & Accounts 2014
55
Report of the Audit Committee
COMPOSITION OF THE COMMITTEEIn compliance with the Code and the Committee’s terms of reference, during the year the Audit Committee comprised wholly of independent non-executive directors. Subject to successful annual re-election to the Board, and as provided by the UK Corporate Governance Code, appointments to the Audit Committee are for a period of three years and are extendable by two additional three-year periods.
Committee membership is reviewed as part of the annual review of Board effectiveness. This year’s review concluded that the current mix of financial and commercial experience of the Audit Committee, and that of its advisors, is such that the Committee can effectively exercise its responsibilities to the Group in relation to risk and controls.
The Committee is permitted by its terms of reference to obtain independent external advice at the Group’s expense.
FUNCTIONThe Board is dependent on the Audit Committee to review the Group’s internal financial controls, to assess the work and independence of the external auditor, the effectiveness of the internal audit function and risk management processes, and to ensure the integrity of financial reporting. As such it is crucial that the Committee conducts itself in an informed and efficient way.
The Audit Committee is responsible for ensuring that the Group’s financial systems provide accurate and up-to-date information, that the Group’s published financial statements represent a true and fair reflection of this position and for ensuring the effectiveness and rigorousness of the internal control framework on behalf of the Board.
More detail on the specific responsibilities of the Audit Committee is set out within this report.
CHAIRMANRichard PennycookMEMBERSMark Allen Tiffany Hall Michael Wemms
AUDIT COMMITTEE MEETINGS
Attendance No. of meetings
Richard Pennycook * 4 4
Mark Allen 4 4
Tiffany Hall 4 4
Michael Wemms 4 4
* Denotes Chairman
Only the attendance of members of this committee is shown, although other directors, where appropriate, have often also attended at the invitation of the chairman of the committee.
The Chairman of the Board along with the Chief Executive, Deputy Chief Executive and Chief Financial Officer, Group Finance Director, Head of Risk and Internal Audit, representatives from the Finance function and senior representatives of the external auditors are regularly invited to attend all or part of our meetings as and when appropriate. The Audit Committee reserves the right to request any non-members to withdraw from any meeting.

56COMMITTEE CHAIRMANThe Chairman of the Audit Committee is responsible for determining the Committee’s agenda and for maintaining the key relationships between the Group’s senior management, Head of Risk and Internal Audit, the Company Secretary and senior representatives of the external auditor. To that end, he is also responsible for ensuring that key audit issues are reported to the Board in an effective and timely manner and that they are reported to shareholders via this report.
Richard Pennycook was Chairman of the Committee throughout the year. Richard is a Fellow of the Institute of Chartered Accountants in England and Wales. He is currently the Group CEO of The Co-operative Group and was a Finance Director for over 20 years, most of that time as a Public Company Finance Director. Richard is also Chairman of the Audit Committee at Persimmon PLC, the FTSE 100 house builder. As such the Board considers that he had the requisite recent and relevant financial experience during the year to satisfy Provision C.3.1 of the UK Corporate Governance Code.
PRIMARY RESPONSIBILITIES OF THE AUDIT COMMITTEEThe Committee is responsible for reporting to the Board, identifying any matters in respect of which action or improvement is needed, making recommendations as to the steps to be taken and monitoring the effectiveness of any resulting activity. It is also responsible for:
• monitoring the integrity of the financial statements of the Group and any formal announcements relating to the Group’s financial performance and reviewing significant financial reporting judgements contained therein (although the Board as a whole remains responsible for determining whether the Annual Reports and Accounts as a whole are fair, balanced and understandable);
• reviewing the Group’s internal financial controls and internal control systems;
• reviewing the Group’s risk management processes, systems and reports (although the Board as a whole remains responsible for overseeing the overall risk profile of the business);
• reviewing the Going Concern report, in the context of the longer-term viability of the business, prior to consideration by the Board;
• ensuring that information flows from the senior management and external auditors are such that the information received by the Committee is complete, accurate, timely and robust;
• monitoring and reviewing the effectiveness of the Group’s internal audit function;
• making recommendations to the Board in relation to the appointment of the external auditor and approving the remuneration and terms of engagement of the external auditor;
• reviewing and monitoring the external auditor’s independence and objectivity and the effectiveness of the audit process, taking into consideration relevant UK professional and regulatory requirements;
• reviewing the external auditor’s audit risks and Audit Committee reports; and
• developing and implementing a policy on the engagement of the external auditor to supply non-audit services, taking into account relevant ethical guidance regarding the provision of non-audit services by the external audit firm.
As a result of its work during the year, the Audit Committee has concluded that it has acted in accordance with its terms of reference during the period and has ensured the independence and objectivity of the external auditors.
Report of the Audit Committee continued

Howden Joinery Group Plc Annual Report & Accounts 2014
57OVERVIEW OF ACTIONS TAKEN BY THE AUDIT COMMITTEE DURING THE YEAR TO DISCHARGE ITS DUTIES
Financial Reporting and External Audit
• Reviewing the Group’s annual report and accounts, the half-yearly financial report published in July 2014 and the interim management statements. As part of this review the Committee received a report from Deloitte on their audit of the annual report and accounts and review of the half-yearly financial report which took into account the Group’s key risks and going concern considerations;
• conducting a separate review of the audit of the French business;
• reviewing the processes necessary to ensure that the Board is able to confirm that the annual report and accounts are “fair, balanced and understandable”;
• considering the processes in place to generate forecasts of cash flow and accounting valuation information, including the choice and consistent use of key assumptions. A description of the Group’s significant accounting policies can be found in note 2 of the consolidated financial statements on pages 73 to 77;
• reviewing the effectiveness of the Group’s internal financial controls (with specific reference to controls in place on a divisional basis) and reviewing the disclosures made in the annual report and accounts on this matter;
• receiving reports from the external auditors on the conduct of their audit, their review of accounting policies, areas of judgement and their comments on risk and the effectiveness of internal controls;
• reviewing the proposed plan of work presented by the external auditors, including audit risks, terms of engagement and fees;
• undertaking an assessment of the qualification, expertise and resources, and independence of the external auditor and the effectiveness of the audit process. This included consideration of a report on the audit firm’s own quality control procedures and the audit firm’s annual transparency report;
• assessing the risk of a possible withdrawal of the external auditors from the market; and
• holding confidential sessions with the independent auditors and the head of internal audit in the absence of executive directors and Company executives.
Internal Audit and Control
• Reviewing the processes used by the Group for identifying, evaluating and mitigating risks;
• receiving reports from the Internal Audit function on its work and monitoring the status of actions taken in response to its findings;
• receiving reports from the Internal Audit function on the controls in place to mitigate fraud risk;
• receiving reports from our divisional Finance Directors in respect of the control environment within their divisions, including an information systems control update from PricewaterhouseCoopers;
• consideration of business continuity management and impact assessment on mission critical activities;
• receiving a presentation from the Head of Risk on the risk environment;
• assessing the coverage of independent assurance by reviewing the Group assurance map;
• reviewing business continuity management provisions; and
• reviewing activity reported under the Group’s whistleblowing policy.
Governance
• External review of effectiveness as an Audit Committee as part of the Board’s evaluation process;
• consideration of the results of the BIS Cyber Governance Health Check Tracker Report;
• receiving updates from the external auditor on latest governance practices for Audit Committees and changes in statutory reporting requirements;
• considering information in relation to audit tendering;
• reviewing directors’ conflicts of interest; and
• reviewing the Committee’s terms of reference and recommending that they be approved by the Board.

58
Report of the Audit Committee continued
We invite senior management from the business to come and talk about the financial controls in their business areas. During 2014, the Director of Commercial Finance and Head of Compliance of the Trade division presented on the control environments in their area.
As in previous years, experts from Deloitte were invited to update the Committee on recent developments in the areas of governance, accounting and reporting. All members of the Committee are members of the Deloitte Academy which provides in depth updates on financial and reporting matters.
AREAS OF SIGNIFICANT FINANCIAL JUDGEMENT CONSIDERED BY THE AUDIT COMMITTEE DURING THE YEARThe Committee recognises that some areas of accounting require judgements to be exercised. In relation to the Group, the principle areas of judgement relate to recoverability of trade debtors, inventory obsolescence, and actuarial assumptions. It is the policy of the Board that a conservative approach be taken in all areas requiring judgement.
The Audit Committee considered the following key areas of significant financial judgement during the year:
Recoverability of trade debtors
Given the make-up of the receivables ledger being a high number of relatively small accounts, the recoverability of trade debtors and the level of provisioning for bad and doubtful debts were regularly reviewed by the Board.
Mitigating actions:• The Committee received updates from and challenged management on the
debtor ageing profile, provisioning levels and the level of bad-debt write-off.• The Committee received reports from the Head of Internal Audit and Risk in
relation to management’s treatment of credit control and the collection of outstanding debts.
• The Committee also reviewed the work done by the external auditor on trade receivables to confirm both existence and recoverability and considered the need to continue to review the rate of provisioning in light of the reduction in the level of bad-debt write-offs.
Valuation of Inventory
The valuation of inventory, including the existence of obsolete and excess stock and the appropriateness of the judgements applied within the obsolescence provision were regularly considered by the Board.
Mitigating actions:• The Committee reviewed and challenged the management reports used to value
and confirm the existence of inventory.
• They also received reports from the external auditor on inventory in considering the appropriateness of provisions held against the carrying value of inventory, having regard to the age of discontinued lines and volumes of continuing lines relative to the expected usage.
• The Committee invited divisional management to attend one meeting in order to provide more in depth analysis on specific trends identified in the presentation received from the Head of Internal Audit.
Actuarial assumptions
The Committee considered and approved the appropriateness of the actuarial valuations for the defined benefit pension scheme prepared for compliance with the relevant accounting and disclosure requirements and the assessment of the appropriateness of the assumptions used.
Mitigating actions:• The Committee reviewed reports from the Pensions Sub-Committee and
external auditor which considered the appropriateness of the assumptions.• In addition to receiving reports, the Chairman of the Audit Committee is a
member of the Pensions Sub-Committee and he attended all meetings of the Sub-Committee during the year. All members of the Audit Committee have a standing invitation to the Pensions Sub-Committee where the actuarial valuations are assessed.
All of the matters considered above were discussed with the Deputy Chief Executive and Chief Financial Officer, Group Finance Director and the external auditor. The Committee was satisfied that each of the matters set out above have been fully and adequately addressed by the Executive Committee, appropriately tested and reviewed by the external auditor and the disclosures made in the annual report and accounts were appropriate.

Howden Joinery Group Plc Annual Report & Accounts 2014
59EXTERNAL AUDITORThe Committee is responsible for the development, implementation and monitoring of the Group’s policy on external audit in line with relevant ethical standards and guidance. The current policy sets out the categories of non-audit services which the external auditors will and will not be allowed to provide to the Group, subject to de minimis levels. All relevant fees proposed by the external auditors must be reported to and approved by the Audit Committee.
During the year, the external auditors continued to provide tax advice relating to the Group’s obligations in respect of former MFI properties and its overseas subsidiaries. The Committee reviewed the ongoing nature and cost of this work during the year and approved the continued involvement of Deloitte LLP in this regard as it was concluded they were best placed to supply such tax services in a cost effective manner due to the experience and qualifications of the individuals providing such services, their knowledge of the Group and its tax affairs and the best interests of the Group were served by engaging them.
Auditor independence and feesThe Committee recognise that auditor independence is an essential part of the audit framework and the assurance it provides. To fulfil our responsibilities regarding the independence of the external auditors, the Committee undertook a comprehensive review during 2014 encompassing the following:
• review of the independence of the external auditors and the arrangements which Deloitte LLP have in place to identify, report and manage conflicts of interest;
• review of the changes in key external audit staff for the current year and the arrangements for the day to day management of the audit relationship. The lead statutory audit partner last changed in March 2012 at the end of the 2011 year-end audit in accordance with the ethical standards;
• consideration of the effectiveness of the external auditors through a review of their plan of work and the outputs arising from the audit;
• consideration of the overall extent of non-audit services provided by the external auditors, in addition to case by case approval of the provision of non-audit services as appropriate; and
• consideration of the likelihood of a withdrawal of the auditor from the market and note taken of the fact that there are no contractual obligations to restrict the choice of external auditors.
To assess the effectiveness of the external auditor, we reviewed:
• the arrangements for ensuring the external auditor’s independence and objectivity;
• the external auditor’s fulfilment of the agreed audit plan and any variations from the plan;
• the perceptions of the auditor and audit process from key management personnel in the finance function;
• the robustness and perceptiveness of the auditor in their handling of the key accounting and audit judgements; and
• the content of the external auditor’s report on internal control.
Details of Deloitte LLP’s fees for audit and non-audit work during 2014 are included in note 7 to the financial statements on page 80. No services were provided by the external auditor pursuant to contingent fee arrangements. Given the specific nature of the fees incurred, and having reviewed the safeguards Deloitte LLP has in place to protect their independence as auditors, we are satisfied the non-audit work has not impaired their independence.
The Audit Committee also has a policy in relation to the employment of former members of the external audit team. This policy states that, whilst the Group would not normally employ a former member of the external audit team, if appropriate, individual cases may be considered by the Chairman of the Committee and Chief Financial Officer.
Audit tenderThe external audit was last tendered in 2002. This resulted in a change to the Group’s external auditor, with Deloitte LLP replacing the previous incumbent audit firm. The Audit Committee is mindful of the provisions relating to audit tendering in the UK Corporate Governance Code and the FRC’s Guidance on Audit Committees to put the external audit contract out to tender at least every ten years.
The FRC guidelines provide that audit tendering should normally fit the five year cycle of lead audit partner rotation. Our current lead audit partner has now completed three years of a five year cycle. Taking this into account, and on the basis of our work above, we concluded that the independence criteria under the relative standards continued to be met and accordingly it was not necessary to tender for the audit work at this time. The Committee has therefore unanimously recommended to the Board that a proposal be put to the shareholders at the Annual General Meeting that Deloitte LLP be reappointed as external auditor and that the directors be authorised to fix their remuneration. At the year end the external auditor formally confirmed their independence and objectivity had been maintained.

60INTERNAL AUDITThe Committee also facilitates the Board in its fulfilment of its responsibilities relating to the adequacy of the resourcing and plans of the Internal Audit department. During the year, we reviewed:
• Internal Audit’s programme of work and progress made against planned activity;
• results of key audits and other significant findings including the adequacy and timeliness of management’s response;
• the level and nature of assurance activity performed by Internal Audit; and
• staffing, reporting and effectiveness of divisional audits.
During the year, the Committee considered the effectiveness of the Internal Audit function and the Internal Audit three-year plan. The Committee concluded that the function remained effective, well-led and had a well-defined remit. An independent review of the Internal Audit function was last undertaken by PricewaterhouseCoopers in 2012. An external review of this function is conducted every five years.
The Group’s whistleblowing policy contains arrangements for the Head of Internal Audit to receive, in confidence, complaints on accounting, risk issues, internal controls, auditing issues and related matters for reporting to the Audit Committee as appropriate. Issues raised and investigated under this policy were formally reviewed during the year. The Committee reviewed and approved the Group’s whistleblowing policy during the year.
THE YEAR AHEADIt is anticipated that the Committee will meet three times in 2015 in conjunction with the annual reporting cycle. I will be available at the Annual General Meeting on 6 May 2015 to answer any questions about the work of the Audit Committee.
By order of the Board
Richard PennycookAudit Committee Chairman25 February 2015
The Audit Committee’s terms of reference include all matters indicated by Disclosure and Transparency Rule 7.1 and the UK Corporate Governance Code. The Committee’s terms of reference were approved at the meeting of the Committee in November 2014.
To view the Audit Committee’s full terms of reference please refer to the Company’s website: www.howdenjoinerygroupplc.com
Report of the Audit Committee continued

Howden Joinery Group Plc Annual Report & Accounts 2014
61
COMPOSITION OF THE COMMITTEEIn accordance with its terms of reference, the Nominations Committee consists of five members: the Chairman of the Board, who (in accordance with provision B.2.1 of the Code) also chairs the Committee, and all of the independent non-executive directors.
Only members of the Committee have the right to attend Committee meetings. However, other individuals such as the Chief Executive and external advisors may be invited to attend for all or part of any meeting, as and when appropriate. Appointments to the Committee are for a period of up to three years, which can be extended for two further three-year periods, provided the director remains independent.
FUNCTIONThe Committee keeps under review the size, composition and structure of the Board and makes recommendations to the Board for all new appointments and reappointments.
In recent years, the Board as a whole has chosen to consider executive succession planning rather than delegate it to the Nominations Committee.
Report of the Nominations Committee
CHAIRMANWill SamuelMEMBERS:Mark Allen Tiffany Hall Richard Pennycook Michael Wemms
NOMINATIONS COMMITTEE MEETINGS
Attendance No. of meetings
Will Samuel* 5 5
Mark Allen 5 5
Tiffany Hall 5 5
Richard Pennycook 5 5
Michael Wemms 5 5
* Denotes Chairman
Only the attendance of members of this committee is shown, although other directors, where appropriate, have often also attended at the invitation of the chairman of the committee.

62The Nominations Committee played an active role during 2014. During the year the Committee met five times to consider:
• non-executive succession planning and management;
• the renewal of Mark Allen’s non-executive director contract;
• the Board’s policy on diversity;
• the format and scope of the 2014 Board evaluation process;
• the reappointment of directors at the 2014 AGM; and
• the performance of the Committee and the appropriateness of the Committee’s terms of reference.
In addition, the Committee played a central role in determining the organisational changes announced on 30 May 2014. The appointment of Mark Robson as Deputy Chief Executive, in addition to his role as Chief Financial Officer, was the result of the extensive work undertaken by both the Board and Nominations Committee on organisational development. Recognising the additional operational responsibilities taken on by Mr Robson, the Committee was also instrumental in increasing the finance responsibilities of Theresa Keating, already a member of the Executive Committee, and her appointment as Group Finance Director. These changes were made as part of the continuing development of the Company to enable future growth.
During the year the Board continued to work with leadership consulting firm Heidrick and Struggles to undertake a detailed talent management evaluation programme on both the members of the Executive Committee and the next tier of Senior Managers. The Board remain committed to ensuring there are no skills gaps at Executive or Senior Manager level and that there is a robust talent pipeline in support of the Executive. Heidrick and Struggles has no other connection with the Company.
NON-EXECUTIVE TENURE (STATED FIGURES ARE TO 27 DECEMBER 2014)
0 1
Michael Wemms
Richard Pennycook
Years on Board
Mark Allen
Tiffany Hall
3 52 4 6 7 8 9
Report of the Nominations Committee continued

Howden Joinery Group Plc Annual Report & Accounts 2014
63The Nominations Committee remains committed to a programme of reviewing and refreshing the non-executive membership of the Board to ensure that there is sufficient balance between the introduction of fresh perspective and ensuring continuity and stability. Where possible, the Board will ensure a phased transition of non-executives in order to avoid wholesale changes to the make-up of the Board to the possible detriment of the Company.
DIVERSITYBoardroom diversityThe Board recognises the importance of ensuring that there is diversity of perspective, background and approach in its management team and on its Board. Since the business was established in 1995 it has sought to enable individuals to progress within the organisation regardless of age, gender, background or formal qualifications.
We have appointed one female director and two male directors to our Board since May 2010, which means that currently 14% of Board members are women.
We believe that it is in the interests of the business and of its shareholders for us to build a stable, cohesive and representative Board. Whilst the setting of targets on particular aspects of diversity may be relevant in many cases, we feel that this could be given inappropriate focus within the context of a smaller board resulting in the possible overlooking of certain well-qualified candidates. The Nominations Committee will continue to seek diversity of mindset as well as of gender and background when considering new appointments in the period to 2016.
More widely, we are committed to developing a long-term pipeline of executive talent that reflects the diversity of Howdens’ business and its stakeholders.
Employee diversity policyThe Group promotes the importance of diversity and adopts an Equal Opportunities Policy under which training and career development opportunities are available to all employees, regardless of gender, religion or race. The Group is committed to meeting the code of practice on the employment of disabled people and full and fair consideration is given to disabled applicants for employment. It aims to do all that is practicable to meet its responsibility towards the employment and training of disabled people and welcomes, and considers fully, applications by disabled persons, having regard to their particular aptitudes and abilities.It is also the Group’s policy to retain employees who may become disabled while in service and to provide appropriate training.

64
The Nominations Committee reviews these gender statistics against Office for National Statistics (ONS) averages each year and, in relation to gender diversity in the Board, against other FTSE250 company averages. Similarly, where other data is available, this is presented to the Committee in order to determine whether there are any implicit diversity issues.
Gender statisticsA Group-wide breakdown of gender statistics for all employees at 27 December 2014 is as follows:
Female employees
Male employees Total
% of Female employees
Board 1 6 7 14.3% (2013: 14.3%)
Executive Committee members (including directors of the main Board) 2 5 7 28.6% (2013: 37.5%)
Executive Committee members (excluding directors of the main Board) 2 3 5 40.0% (2013: 50.0%)
Senior Management group* 19 85 104 18.3% (2013: 20.2%)
Group (Total) 1,983 5,523 7,506 26.4% (2013: 25.8%)
* The Senior Management Group includes employee Grades 1–3 (on the Hays evaluation basis) and divisional, regional and area sales managers. It does not include members of the Board or the Executive Committee.)
Male Female
Group (Total)
BoardExecutive Committee members (including directors of the main Board)
Executive Committee members (excluding directors of the main Board)
Senior Management group*
Report of the Nominations Committee continued

Howden Joinery Group Plc Annual Report & Accounts 2014
65APPOINTMENT PROCESSWith regard to the appointment and replacement of directors, the Company is governed by its Articles of Association, the UK Corporate Governance Code, the Companies Act and related legislation.
DIRECTOR INDUCTIONWorking with the Company Secretary, new directors undertake an induction programme tailored to the needs of the individual. However, they will generally include a number of site visits and meetings with members of the Executive Committee, key employees and advisors. Site visits include our manufacturing sites, our distribution centre and depots. New directors will also be provided with a mixture of documentation including company publications, Board materials and some formal information on the role and responsibilities of UK listed company directors.
The Group’s induction programme for newly appointed directors will continue to be centred on familiarisation with the Group’s operations, key individuals and external advisors.
ONGOING TRAININGThe Chairman meets with individual directors annually to discuss, amongst other things, individual training and development needs. Ongoing training and development for the directors includes attendance at formal conferences and internal events as well as briefings from external advisors.
Directors are also encouraged to attend external seminars and briefings as part of their continuous professional development. The non-executive directors are also encouraged to meet with Howdens’ employees at all levels in order to maintain a broad purview of the business.
RE-ELECTION OF DIRECTORSAs stated in the Corporate Governance report, all of the directors will retire at the Annual General Meeting (AGM) in accordance with the UK Corporate Governance Code and each will offer themself for re-election in accordance with Article 118 of the Articles of Association.
In proposing their re-election, the Chairman confirms that the Nominations Committee has considered the formal performance evaluation in respect of those directors seeking re-election and the contribution and commitment of the directors that are required to offer themselves for re-election. He has confirmed to the Board that their performance and commitment is such that the Company should support their re-election.
In relation to Michael Wemms’ re-election at the 2015 AGM, the Board is aware that during November 2015 Mr Wemms’ tenure as non-executive director of the Company will exceed nine years. As a result of this, the Nominations Committee undertook a rigorous review of Mr Wemms’ position and concluded in its recommendations to the Board that Mr Wemms remained independent in both character and judgement, and that he continued to provide invaluable experience and insight in his capacity both as non-executive director and Senior Independent Director.
No director was able to vote in respect of their own re-election when consideration was given to director re-election at the AGM.
Information on the directors’ service agreements, options and interests of the directors and their families in the share capital of the Company is set out in the separate Directors’ remuneration report on pages 32 to 48. Details of indemnity provisions made for the benefit of directors are given in the Corporate Governance report on page 51.
By order of the Board
Will SamuelNominations Committee Chairman25 February 2015
To view the Nominations Committee full terms of reference please refer to the Company’s website: www.howdenjoinerygroupplc.com

66GOING CONCERNThe Group’s business activities, together with the factors likely to affect its future development, performance and position are set out in the Chairman’s statement on pages 8 to 9, the Chief Executive’s statement on pages 10 to 13 and the Review of operations and finance on pages 14 to 19. The Review of operations and finance describes the financial position of the Group, its cash flows, liquidity position, borrowing facilities, and the Group’s objectives, policies and processes for managing its commercial and financial risks. The Group’s financial risk management objectives and its exposures to credit risk and liquidity risk in relation to financial instruments are described in note 28 to the financial statements.
The Group meets its day to day working capital requirements through cash generated from operations, and, if required, by utilising an asset-backed lending facility of £140m. The current facility expires in July 2016.
The Group’s forecasts and projections have been stress-tested for reasonably possible adverse variations in economic conditions and trading performance. The results of this testing show that the Group should be able to operate within the level of its current facility and covenants.
After making due enquiries the directors have a reasonable expectation that the Company and the Group have adequate resources to continue in operational existence for the foreseeable future. Accordingly, they continue to adopt the going concern basis in preparing the Annual Report and Accounts.
STATEMENT OF DIRECTORS’ RESPONSIBILITIESThe directors are responsible for preparing the Annual Report, directors’ remuneration report and the financial statements in accordance with applicable law and regulations.
Company law requires the directors to prepare financial statements for each financial year. Under that law the directors are required to prepare Group financial statements in accordance with International Financial Reporting Standards (IFRSs) as adopted by the European Union and Article 4 of the IAS Regulation and have chosen to prepare the parent company financial statements in accordance with United Kingdom Generally Accepted Accounting Practice (United Kingdom Accounting Standards and applicable law). Under company law the directors must not approve the accounts unless they are satisfied that they give a true and fair view of the state of affairs of the Company and of the profit or loss of the Company for that period.
In preparing the parent company financial statements, the directors are required to:
• select suitable accounting policies and then apply them consistently;
• make judgements and accounting estimates that are reasonable and prudent;
• state whether applicable UK Accounting Standards have been followed subject to any material departures disclosed and explained in the financial statements; and
• prepare the financial statements on the going concern basis unless it is inappropriate to presume that the Company will continue in business.
In preparing the Group financial statements, International Accounting Standard 1 requires that directors:
• properly select and apply accounting policies;
• present information, including accounting policies, in a manner that provides relevant, reliable, comparable and understandable information;
• provide additional disclosures when compliance with the specific requirements in IFRSs is insufficient to enable users to understand the impact of particular transactions, other events and conditions on the entity’s financial position and financial performance; and
• make an assessment of the Company’s ability to continue as a going concern.
The directors are responsible for keeping adequate accounting records that are sufficient to show and explain the Company’s transactions and disclose with reasonable accuracy at any time the financial position of the Company and enable them to ensure that the financial statements comply with the Companies Act 2006. They are also responsible for safeguarding the assets of the Company and hence for taking reasonable steps for the prevention and detection of fraud and other irregularities.
The directors are responsible for the maintenance and integrity of the corporate and financial information included on the Company’s website. Legislation in the United Kingdom governing the preparation and dissemination of financial statements may differ from legislation in other jurisdictions.
Statements of the directors in connection with this Annual Report and Accounts

Howden Joinery Group Plc Annual Report & Accounts 2014
67AUDIT INFORMATION AND AUDITORSEach of the persons who is a director at the date of approval of this Annual Report and Accounts confirm that:
• so far as each of the directors is aware, there is no relevant audit information of which the Company’s auditors are unaware; and
• the director has taken all the steps that he ought to have taken as a director in order to make himself aware of any relevant audit information and to establish that the Company’s auditors are aware of that information.
The confirmation is given and should be interpreted in accordance with the provisions of s418 of the Companies Act 2006.
DIRECTORS’ RESPONSIBILITY STATEMENTWe confirm to the best of our knowledge:
• the financial statements, prepared in accordance with the relevant financial reporting framework, give a true and fair view of the assets, liabilities, financial position and profit or loss of the Group and Company, and the undertakings including the consolidation taken as a whole;
• the Annual Report and Accounts includes a fair review of the development and performance of the business and the position of the Group and Company and the undertakings including the consolidation taken as a whole, together with a description of the principal risks and uncertainties they face; and
• the Annual Report and Accounts, taken as a whole, is fair, balanced and understandable and provides the information necessary for shareholders to assess the Group’s and Company’s performance, business model and strategy.
This responsibility statement was approved by the Board of Directors on 25 February 2015 and is signed on its behalf by:
Matthew IngleChief Executive
Mark RobsonDeputy Chief Executive and Chief Financial Officer
25 February 2015
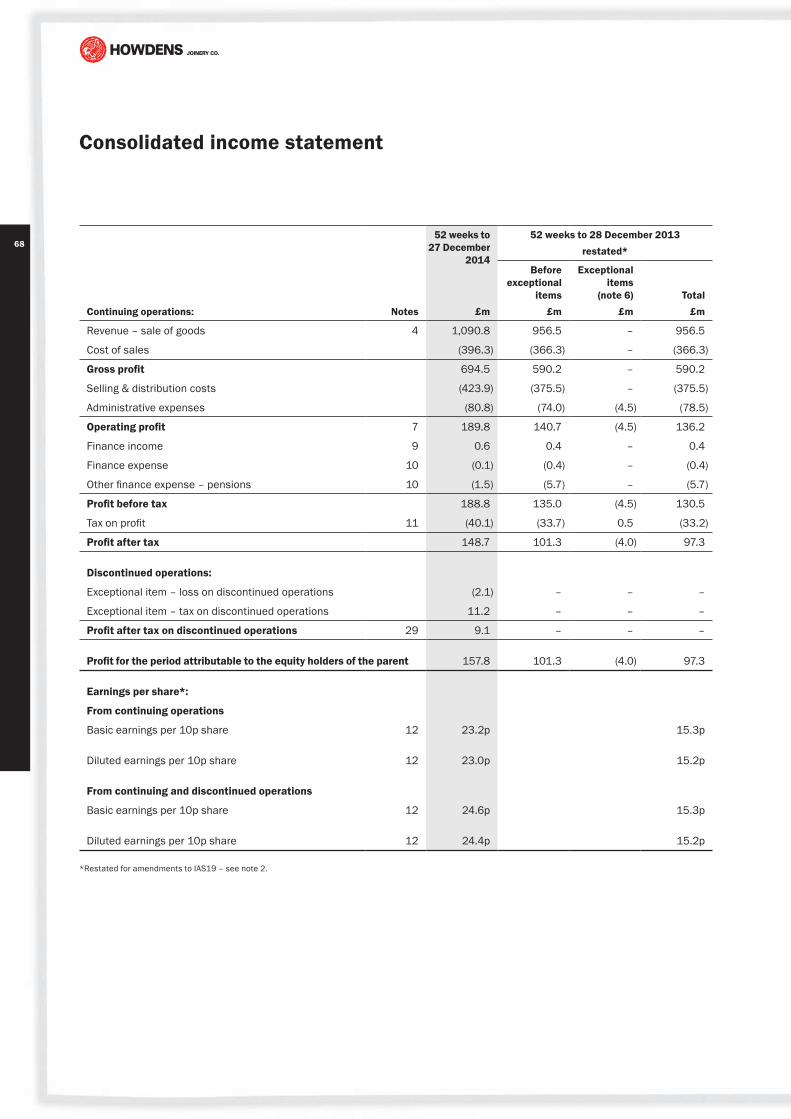
68
Consolidated income statement
Continuing operations: Notes
52 weeks to 27 December
2014
52 weeks to 28 December 2013 restated*
Before exceptional
items£m
Exceptional items
(note 6)£m
Total£m£m
Revenue – sale of goods 4 1,090.8 956.5 – 956.5
Cost of sales (396.3) (366.3) – (366.3)
Gross profit 694.5 590.2 – 590.2
Selling & distribution costs (423.9) (375.5) – (375.5)
Administrative expenses (80.8) (74.0) (4.5) (78.5)
Operating profit 7 189.8 140.7 (4.5) 136.2
Finance income 9 0.6 0.4 – 0.4
Finance expense 10 (0.1) (0.4) – (0.4)
Other finance expense – pensions 10 (1.5) (5.7) – (5.7)
Profit before tax 188.8 135.0 (4.5) 130.5
Tax on profit 11 (40.1) (33.7) 0.5 (33.2)
Profit after tax 148.7 101.3 (4.0) 97.3
Discontinued operations:
Exceptional item – loss on discontinued operations (2.1) – – –
Exceptional item – tax on discontinued operations 11.2 – – –
Profit after tax on discontinued operations 29 9.1 – – –
Profit for the period attributable to the equity holders of the parent 157.8 101.3 (4.0) 97.3
Earnings per share*:
From continuing operations
Basic earnings per 10p share 12 23.2p 15.3p
Diluted earnings per 10p share 12 23.0p 15.2p
From continuing and discontinued operations
Basic earnings per 10p share 12 24.6p 15.3p
Diluted earnings per 10p share 12 24.4p 15.2p
*Restated for amendments to IAS19 – see note 2.

69
Howden Joinery Group Plc Annual Report & Accounts 2014
Consolidated statement of comprehensive income
52 weeks to 27 December 2014
£m
52 weeks to 28 December 2013
restated*£m
Profit for the period 157.8 97.3
Items of other comprehensive income:
Items that will not be reclassified subsequently to profit or loss:
Actuarial (losses)/gains on defined benefit pension scheme (119.6) 73.0
Deferred tax on actuarial losses/(gains) on defined benefit pension scheme 23.9 (16.8)
Effect of change in UK tax rate on deferred tax on cumulative actuarial loss – (1.6)
Deferred tax on pension contributions (6.3) –
Current tax on pension contributions 6.8 –
Items that may be reclassified subsequently to profit or loss:
Currency translation differences (0.2) 0.5
Other comprehensive income for the period (95.4) 55.1
Total comprehensive income for the period attributable to equity holders of the parent 62.4 152.4
*Restated for amendments to IAS19 – see note 2.
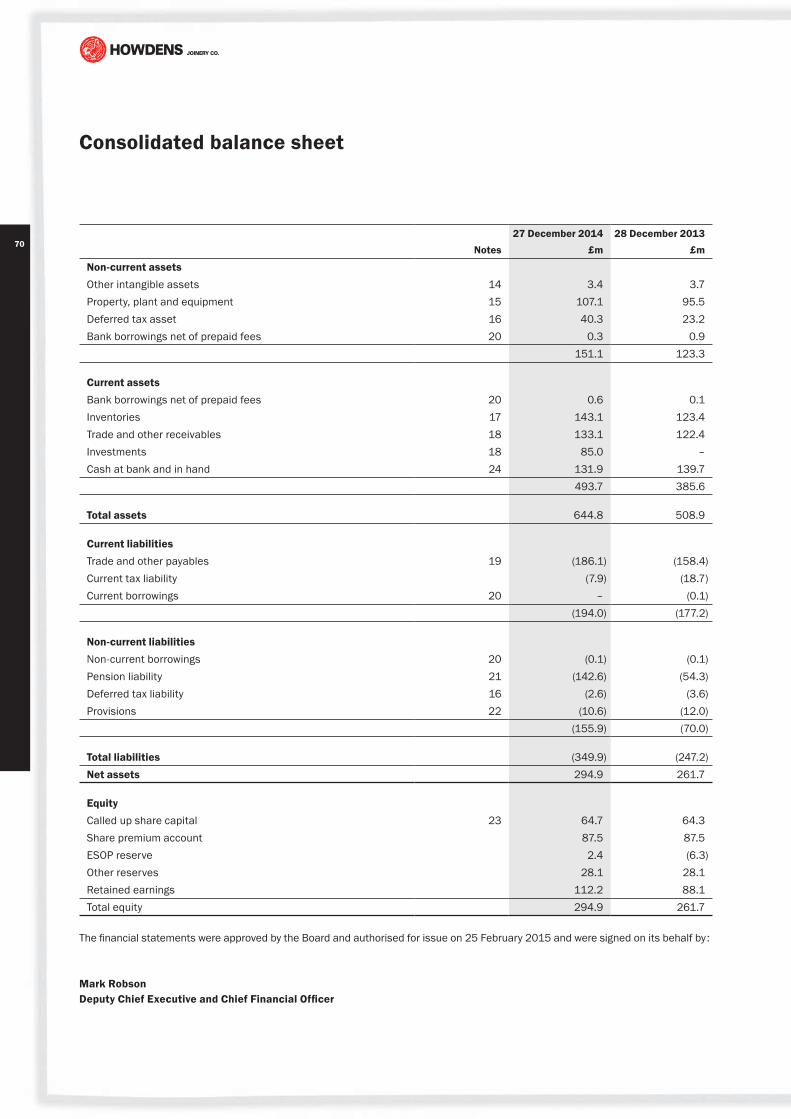
70
Consolidated balance sheet
Notes27 December 2014
£m28 December 2013
£m
Non-current assetsOther intangible assets 14 3.4 3.7 Property, plant and equipment 15 107.1 95.5 Deferred tax asset 16 40.3 23.2 Bank borrowings net of prepaid fees 20 0.3 0.9
151.1 123.3
Current assetsBank borrowings net of prepaid fees 20 0.6 0.1 Inventories 17 143.1 123.4 Trade and other receivables 18 133.1 122.4 Investments 18 85.0 –Cash at bank and in hand 24 131.9 139.7
493.7 385.6
Total assets 644.8 508.9
Current liabilitiesTrade and other payables 19 (186.1) (158.4)Current tax liability (7.9) (18.7)Current borrowings 20 – (0.1)
(194.0) (177.2)
Non-current liabilitiesNon-current borrowings 20 (0.1) (0.1)Pension liability 21 (142.6) (54.3)Deferred tax liability 16 (2.6) (3.6)Provisions 22 (10.6) (12.0)
(155.9) (70.0)
Total liabilities (349.9) (247.2)Net assets 294.9 261.7
EquityCalled up share capital 23 64.7 64.3 Share premium account 87.5 87.5 ESOP reserve 2.4 (6.3)Other reserves 28.1 28.1 Retained earnings 112.2 88.1 Total equity 294.9 261.7
The financial statements were approved by the Board and authorised for issue on 25 February 2015 and were signed on its behalf by :
Mark RobsonDeputy Chief Executive and Chief Financial Officer

71
Howden Joinery Group Plc Annual Report & Accounts 2014
Consolidated statement of changes in equity
Called up share
capital£m
Share premium account
£m
ESOP reserve
£m
Other reserve
£m
Retained profit
£mTotal
£m
At 29 December 2012 64.2 87.2 (19.0) 28.1 (47.7) 112.8
Accumulated profit for the period* – – – – 97.3 97.3
Net actuarial gain on defined benefit scheme* – – – – 56.2 56.2
Effect of change in UK tax rate on deferred tax on cumulative actuarial loss – – – – (1.6) (1.6)
Current tax on share schemes – – – – 4.6 4.6
Deferred tax on share schemes – – – – 3.1 3.1
Effect of change in UK tax rate on deferred tax on cumulative balance on share schemes – – – – (1.0) (1.0)
Currency translation differences – – – – 0.5 0.5
Net movement in ESOP – – 12.7 – – 12.7
Issue of new shares 0.1 0.3 – – – 0.4
Dividends declared and paid – – – – (23.3) (23.3)
At 28 December 2013 64.3 87.5 (6.3) 28.1 88.1 261.7
Accumulated profit for the period – – – – 157.8 157.8
Net actuarial loss on defined benefit scheme – – – – (95.7) (95.7)
Deferred tax on pension contributions – – – – (6.3) (6.3)
Current tax on pension contributions – – – – 6.8 6.8
Current tax on share schemes – – – – 5.0 5.0
Deferred tax on share schemes – – – – (1.9) (1.9)
Currency translation differences – – – – (0.2) (0.2)
Net movement in ESOP – – 8.7 – – 8.7
Issue of new shares 0.4 – – – (0.4) –
Dividends declared and paid – – – – (41.0) (41.0)
At 27 December 2014 64.7 87.5 2.4 28.1 112.2 294.9
The ESOP reserve includes shares in Howden Joinery Group Plc with a market value on the balance sheet date of £23.8m (2013: £36.2m), which have been purchased in the open market and which are held by the Group’s Employee Share Trusts in order to satisfy share options and awards made under the Group’s various share-based payment schemes.
The Other reserve was created in the year to 30 April 1994, following a Group reconstruction.
*Restated for amendments to IAS19 – see note 2.
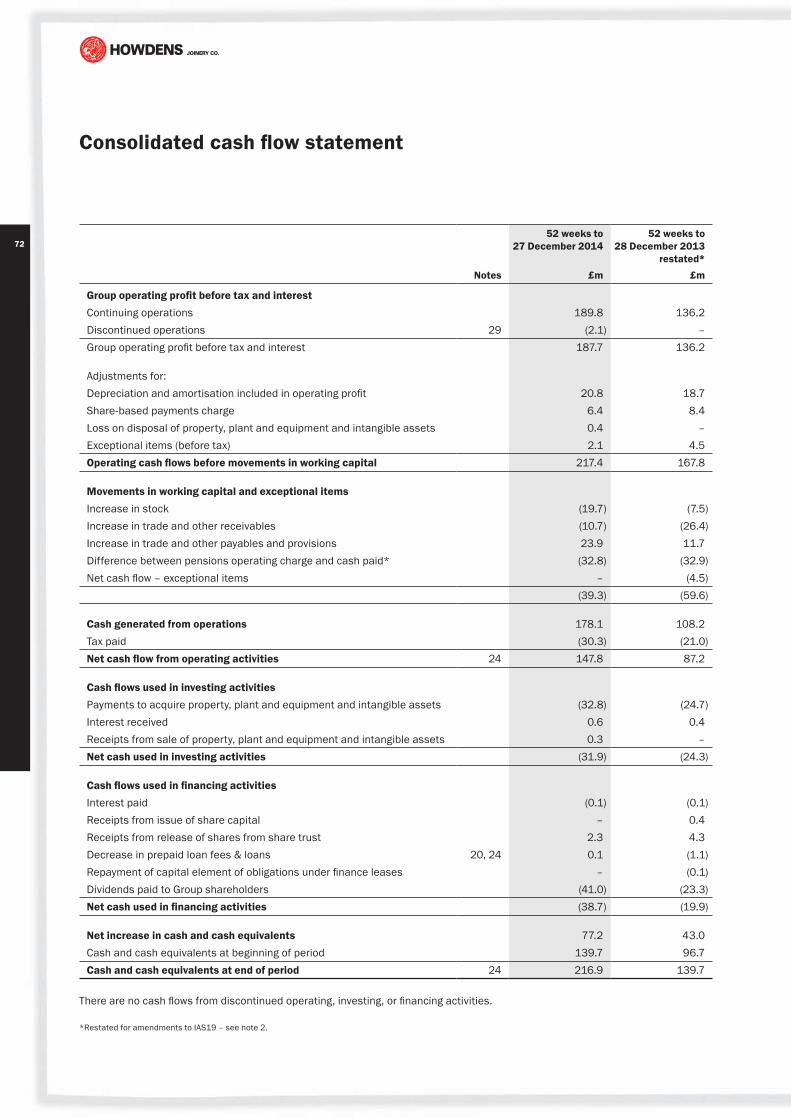
72
Consolidated cash flow statement
Notes
52 weeks to 27 December 2014
£m
52 weeks to 28 December 2013
restated*£m
Group operating profit before tax and interestContinuing operations 189.8 136.2 Discontinued operations 29 (2.1) –Group operating profit before tax and interest 187.7 136.2
Adjustments for:Depreciation and amortisation included in operating profit 20.8 18.7 Share-based payments charge 6.4 8.4 Loss on disposal of property, plant and equipment and intangible assets 0.4 –Exceptional items (before tax) 2.1 4.5 Operating cash flows before movements in working capital 217.4 167.8
Movements in working capital and exceptional itemsIncrease in stock (19.7) (7.5)Increase in trade and other receivables (10.7) (26.4)Increase in trade and other payables and provisions 23.9 11.7 Difference between pensions operating charge and cash paid* (32.8) (32.9)Net cash flow – exceptional items – (4.5)
(39.3) (59.6)
Cash generated from operations 178.1 108.2 Tax paid (30.3) (21.0)Net cash flow from operating activities 24 147.8 87.2
Cash flows used in investing activitiesPayments to acquire property, plant and equipment and intangible assets (32.8) (24.7)Interest received 0.6 0.4 Receipts from sale of property, plant and equipment and intangible assets 0.3 –Net cash used in investing activities (31.9) (24.3)
Cash flows used in financing activitiesInterest paid (0.1) (0.1)Receipts from issue of share capital – 0.4 Receipts from release of shares from share trust 2.3 4.3 Decrease in prepaid loan fees & loans 20, 24 0.1 (1.1)Repayment of capital element of obligations under finance leases – (0.1)Dividends paid to Group shareholders (41.0) (23.3)Net cash used in financing activities (38.7) (19.9)
Net increase in cash and cash equivalents 77.2 43.0 Cash and cash equivalents at beginning of period 139.7 96.7 Cash and cash equivalents at end of period 24 216.9 139.7
There are no cash flows from discontinued operating, investing, or financing activities.
*Restated for amendments to IAS19 – see note 2.

73
Howden Joinery Group Plc Annual Report & Accounts 2014
Notes to the consolidated financial statements
1 GENERAL INFORMATIONHowden Joinery Group Plc is a company incorporated in the United Kingdom under the Companies Act 2006. The registered office address is 40 Portman Square, London W1H 6LT. The nature of the Group’s operations are set out in the Strategic Report, and the Group’s principal activity is the sale of kitchens and joinery products, along with the associated manufacture, sourcing, and distribution of these products.
These financial statements are presented in UK pounds sterling, being the currency of the primary economic environment in which the Group operates.
Foreign operations are included in accordance with the policies set out in note 2.
2 SIGNIFICANT ACCOUNTING POLICIESBasis of presentationThe Group’s accounting period covers the 52 weeks to 27 December 2014. The comparative period covered the 52 weeks to 28 December 2013.
Statement of compliance and basis of preparationThe Group’s financial statements have been prepared in accordance with the IFRSs adopted for use in the European Union and International Financial Reporting Interpretations Committee (“IFRIC”) interpretations and with those parts of the Companies Act 2006 applicable to companies reporting under IFRS. They therefore comply with Article 4 of the EU IAS Regulation.
The financial statements have been prepared on the historical cost basis, and on the going concern basis, as described in the going concern statement in the Statement of the directors on page 66. The principal accounting policies are set out below.
Adoption of new accounting standard in the periodThe Group has implemented IAS 19 (revised) for the first time in the current period. The revised standard has been adopted retrospectively, and in accordance with the transitional provisions set out in IAS 19.173. The comparative period has been restated where relevant. The main effects of adopting this standard are outlined below:
– The administration costs of the defined benefit pension scheme, which were previously deducted from returns on assets, are now added to the pension expense and thus form part of administrative expenses.
– The interest income on plan assets, which forms part of the net pensions finance charge, is now calculated at the same rate used to calculate the interest expense on the pension
liability. The rate was previously based on the expected returns on the various asset types held in the investment portfolio, but it is now based on the discount rate and derived from high-quality corporate bond yields.
– As the Group has always recognised actuarial gains and losses in full and immediately, there is no effect on the prior period defined benefit obligation.
The result of the restatement was to give a decrease in the profit for the period for each of the periods presented, and an equal and opposite increase in other comprehensive income for each period. This resulted in no change to total comprehensive income or to net assets. As the profit for the period decreased, so did the restated EPS for each period. Further details of the amounts of these changes, and the line items affected, are given in note 21.
Standards in issue but not yet effectiveAt the date of authorisation of these financial statements, the following standards, amendments to standards, and interpretations, were in issue but not yet effective for the Group in these financial statements:
Annual Improvements to IFRSs: 2011 – 2013 Cycle (Dec 2013)
Annual Improvements to IFRSs: 2010 – 2012 Cycle (Dec 2013)
Amendments to IAS 19 (Nov 2013): Defined Benefit Plans Employee Contributions
Amendments to IAS 36 (May 2013): Recoverable Amount Disclosures for Non-Financial Assets
Amendments to IAS 39 (Jun 2013): Novation of Derivatives and Continuation of Hedge Accounting
Amendments to IFRS 10, IFRS 11, IFRS 12, IAS 27 and IAS 28: Investment Entities
Amendments to IAS 32 (Dec 2011): Offsetting Financial Assets and Financial Liabilities
IFRIC 21: Levies
IFRS 9: Financial Instruments
IFRS 14: Regulatory Deferral Accounts
IFRS 15: Revenue from Contracts with Customers
The directors anticipate that the adoption of the other standards and interpretations mentioned above will have no material impact on the Group’s financial statements when the relevant standards come into effect.

74
Notes to the consolidated financial statements continued
Basis of consolidationSubsidiaries are all entities over which the Group has control. “Control” is defined in this case as the power to govern financial and operating policies so as to obtain benefits from the subsidiaries’ activities. Subsidiaries are fully consolidated from the date on which control is established until the date that control ceases. Control is achieved where the Group has the power to govern the financial and operating policies of an investee entity so as to obtain benefits from its activities.
Revenue recognitionRevenue is measured at the fair value of the consideration received or receivable and represents amounts receivable for goods and services, based on despatch of goods or services provided to customers outside the Group, excluding sales taxes and discounts. Interest income is recognised in the income statement as it accrues, using the effective interest method.
InventoriesInventories are stated at the lower of cost and net realisable value. Cost includes an attributable proportion of manufacturing overheads based on budgeted levels of activity. Cost is calculated using a standard cost which is regularly updated to reflect average actual costs. Provision is made for obsolete, slow-moving, or defective items where appropriate.
Property, plant and equipment On adopting IFRS, the Group adopted the transitional provisions of IFRS 1 to use previous revaluations of freehold properties as the new deemed cost at the date of transition to IFRSs.
All property, plant and equipment is stated at cost (or deemed cost, as applicable) less accumulated depreciation, and less any provision for impairment.
Depreciation of property, plant and equipment is provided to write off the difference between their cost and their residual value over their estimated lives on a straight-line basis. The current range of useful lives is as follows:
Freehold property 50 years
Short leasehold property the period of the lease, or the individual asset’s life if shorter
Plant, machinery & vehicles 3–20 years
Fixtures & fittings 2–15 years
Capital work in progress and freehold land are not depreciated.
Residual values, remaining useful economic lives and depreciation periods and methods are reviewed annually and adjusted if appropriate.
Gains and losses on disposals are determined by comparing proceeds with carrying amount. These are included in the income statement.
Intangible assets – softwareWhere computer software is not an integral part of a related item of computer hardware, the software is classified as an intangible asset. The capitalised costs of software for internal use include external direct costs of materials and services consumed in developing or obtaining the software and payroll and payroll-related costs for employees who are directly associated with and who devote substantial time to the project. Capitalisation of these costs ceases no later than the point at which the software is substantially complete and ready for its intended internal use. These costs are amortised over their expected useful lives, which are reviewed annually. The expected useful life is four years.
Impairment of assets The carrying amount of the Group’s assets is reviewed at each balance sheet date to determine whether there is any indication of impairment. If such an indication exists, the asset’s recoverable amount is estimated.
Apart from in the case of trade and other receivables, and inventories, an impairment loss is recognised for the amount by which the asset’s carrying amount exceeds its recoverable amount. Impairment losses are recognised in the income statement.
For trade and other receivables and inventories which are considered to be impaired, the carrying amount is reduced through the use of an allowance for estimated irrecoverable amounts. Changes in the carrying value of this allowance are recognised in the income statement.
Current taxThe tax expense represents the sum of the tax currently payable and deferred tax.
The tax currently payable is based on taxable profit for the financial period. Taxable profit differs from net profit as reported in the income statement because it excludes items of income or expense that are taxable or deductible in other financial years and it further excludes items that are never taxable or deductible. The Group’s liability for current tax is calculated using tax rates that have been enacted or substantively enacted by the balance sheet date.
Additional income taxes that arise from the distribution of dividends are recognised at the same time as the liability to pay the related dividend.

75
Howden Joinery Group Plc Annual Report & Accounts 2014
Deferred taxDeferred tax is provided in full using the balance sheet liability method. It is the tax expected to be payable or recoverable on the temporary difference between the carrying amounts of assets and liabilities for financial reporting purposes and the amounts used for taxation purposes. The following temporary differences are not provided for: goodwill not deductible for tax purposes; the initial recognition of assets and liabilities other than in a business combination that affect neither accounting nor taxable profit; and differences relating to investments in subsidiaries to the extent that they will not reverse in the foreseeable future. The amount of deferred tax provided is based on the expected manner of realisation or settlement of the carrying amount of assets and liabilities, using tax rates enacted or substantively enacted at the balance sheet date.
A deferred tax asset is recognised only to the extent that it is probable that future taxable profits will be available against which the asset can be utilised. The carrying amounts of deferred tax assets are reviewed at each balance sheet date and reduced to the extent that it is no longer probable that sufficient taxable profit will be available to allow all or part of the asset to be recovered.
Deferred tax is charged or credited to the income statement except when it relates to items charged or credited directly to equity, in which case the deferred tax is also recognised in equity.
Foreign currenciesForeign currency transactionsTransactions in foreign currency are translated at the foreign exchange rate ruling at the date of the transaction. Monetary assets and liabilities denominated in foreign currencies at the balance sheet date are translated at the exchange rate ruling at the date. Foreign exchange gains and losses are recognised in the income statement.
Foreign operationsThe assets and liabilities of foreign operations, including goodwill and fair value adjustments arising on consolidation, where applicable, are translated into sterling at foreign exchange rates ruling at the balance sheet date. The results and cash flows of overseas subsidiaries and the results of joint ventures are translated into sterling on an average exchange rate basis, weighted by the actual results of each month.
Exchange differences arising from the translation of the results and net assets of overseas subsidiaries are taken to equity via the statement of comprehensive income.
ProvisionsProvisions are recognised when the Group has a present obligation as a result of a past event, it is probable that the Group will be required to settle that obligation, and a reliable estimate can be made of the amount required to settle the obligation.
Provisions are measured at the directors’ best estimate of the expenditure required to settle the obligation at the balance sheet date, taking into account the risks and uncertainties surrounding the obligation, and are discounted to present value where the effect is material.
PensionsPayments to defined contribution retirement benefit schemes are charged to the income statement as they fall due.
The Group operates a defined benefit pension scheme. The Group’s net obligation in respect of the defined benefit pension scheme is calculated by estimating the amount of future benefit that employees have earned in return for their service in the current and prior periods. That benefit is then discounted to determine its present value, and the fair value of any scheme assets is deducted. The discount rate used is selected so as to closely approximate the yield at the balance sheet date on AA-rated bonds that have maturity dates approximating to the terms of the Group’s obligations. Because there are no AA-rated bonds with maturity dates which are as long as those of the Group’s retirement benefit obligations, the discount rate is derived using the rate of return of zero-coupon Gilts which have the same maturity as the Group’s obligations, to which is added a premium which is calculated to account for the difference in risk between Gilts and AA-rated bonds. The calculation is performed by a qualified actuary using the projected unit method. Scheme assets are valued at bid price.
Current and past service costs are recognised in operating profit and net financing costs include interest on pension scheme liabilities and assets.
All actuarial gains and losses as at 25 December 2004, the date of transition to IFRSs, were recognised. Actuarial gains and losses that arise subsequent to 25 December 2004 in calculating the Group’s obligation in respect of a scheme are recognised immediately in reserves and reported in the statement of comprehensive income.
Leased assetsLeases are classified as finance leases when the terms of the lease transfer substantially all the risks and rewards of ownership to the Group. All other leases are classified as operating leases. For property leases, the land and building elements are treated separately to determine the appropriate lease classification.

76
Notes to the consolidated financial statements continued
Finance leasesAssets funded through finance leases are capitalised as property, plant and equipment, and depreciated over their estimated useful lives or the lease term, whichever is shorter. The amount capitalised is the lower of the fair value of the asset or the present value of the minimum lease payments during the lease term at the inception of the lease. The resulting lease obligations are included in liabilities net of finance charges. Finance costs on finance leases are charged directly to the income statement.
Operating leasesAssets leased under operating leases are not recorded on the balance sheet. Rental payments are charged directly to the income statement.
Lease incentivesLease incentives primarily include up-front cash payments or rent-free periods. Lease incentives are capitalised and spread over the period of the lease term.
Leases with predetermined fixed rental increases The Group has some leases with predetermined fixed rental increases. These rental increases are accounted for on a straight-line basis over the period of the lease term.
Borrowing costsBorrowing costs are recognised in profit or loss in the period in which they are incurred. In the case of prepaid loan facility fees, they are capitalised and set against the related borrowings, and then amortised over the life of the related loan facility.
Other payablesOther payables are stated at their fair value.
Share-based paymentsThe Group has applied the requirements of IFRS 2 Share-based payments. In accordance with the transitional provisions, IFRS 2 has been applied to all grants of equity instruments after 7 November 2002 that were unvested at the date of the Group’s transition to IFRS.
The Group issues equity-settled share-based payments to certain employees. Equity-settled share-based payments are measured at fair value at the date of grant. The fair value determined at the grant date of the equity-settled share-based payments is expensed on a straight-line basis over the vesting period, based on the Group’s estimate of shares that will eventually vest.
Financial instrumentsFinancial assets and financial liabilities are recognised on the Group’s balance sheet when the Group becomes a party to the contractual provisions of the instrument.
Trade receivablesTrade receivables do not carry any interest and are stated at their nominal value, as reduced by appropriate allowances for estimated irrecoverable amounts. Such allowances are raised based on an assessment of debtor ageing, past experience, or known customer circumstances.
Cash at bank and in hand and Cash and cash equivalentsCash at bank and in hand, which is the term used in the balance sheet, comprises cash on hand together with demand deposits, and other short-term highly liquid investments that are readily convertible to a known amount of cash and are subject to an insignificant risk of changes in value.
Cash and cash equivalents, which is the term used in the cash flow statement, comprises cash at bank and in hand, as defined immediately above, together with any overdrafts repayable on demand, and any current asset investments with a maturity date of less than three months from the balance sheet date.
Net cashNet cash, as shown in note 24, comprises cash and cash equivalents plus any bank borrowings/prepaid loan fees, and any finance leases.
Current asset investmentsFrom time to time, the Group uses short-term investments in UK Gilts as part of its cash management activities. The Group reviews these investments before entering into them, and, after establishing that the Group has both the intention and the ability to hold these investments to maturity, they are classified as held-to-maturity and are initially recognised at cost, including any transaction fees.
Subsequent to initial recognition, these investments are carried at amortised cost using the effective interest method. Income from these investments is recognised in the income statement on an effective yield basis.
Financial liabilities and equityFinancial liabilities and equity instruments are classified according to the substance of the contractual arrangements entered into. An equity instrument is any contract that evidences a residual interest in the assets of the Group after deducting all of its liabilities.
77
Howden Joinery Group Plc Annual Report & Accounts 2014
Bank borrowingsInterest-bearing bank loans and overdrafts are recorded at the proceeds received, net of direct issue costs. Finance charges, including premiums payable on settlement or redemption and direct issue costs, are accounted for on an accrual basis to the income statement using the effective interest rate method and are added to the carrying amount of the instrument to the extent that they are not settled in the period in which they arise.
Trade payablesTrade payables are not interest bearing and are stated at their nominal value.
Exceptional itemsCertain items do not reflect the Group’s underlying trading performance. If such items are significant in terms of size or nature, they would be classified as exceptional. Gains and losses on these discrete items, such as profits on disposal of assets, operations, and property interests, restructuring costs, and other non-operating items can have a material impact on the absolute amount of and trend in profit from operations and the result for the period. Therefore, any material gains and losses on such items are analysed as exceptional. Where there are any net immaterial amounts arising from such items during a period, they are not presented as exceptional items.
Discontinued operationsCash flows, income and expenses that relate to a major component of the business or geographical region that has been sold or is classified as held for sale are shown separately from continuing operations, together with any related tax.
3 CRITICAL ACCOUNTING JUDGEMENTS AND KEY SOURCES OF ESTIMATION UNCERTAINTYThe Group makes judgements and assumptions concerning the future that impact the application of policies and reported amounts. The resulting accounting estimates calculated using these judgements and assumptions will, by definition, seldom equal the related actual results but are based on historical experience and expectations of future events. The judgements and key sources of estimation uncertainty that have a significant effect on the amounts recognised in the financial statements are discussed below.
Post-employment benefitsThe Group operates a defined benefit scheme for its employees. The present value of the scheme’s liabilities recognised at the balance sheet date is dependent on interest rates of high quality corporate bonds. The net financing charge recognised in the income statement is dependent on the interest rate of high quality corporate bonds. Other key assumptions within this calculation are based on market conditions or estimates of future events, including mortality rates, as set out in the relevant note to these financial statements.
Income taxesThe Group recognises expected liabilities for tax based on an estimation of the likely taxes due, which requires significant judgement as to the ultimate tax determination of certain items. Where the actual liability arising from these issues differs from these estimates, such differences will have an impact on income tax and deferred tax provisions in the period when such determination is made.
Allowances against the carrying value of inventoriesThe Group reviews the market value of and demand for its inventories on a periodic basis to ensure that recorded inventory is stated at the lower of cost and net realisable value. In assessing the ultimate realisation of inventories, the Group is required to make judgements as to future demand requirements and to compare these with the current or committed inventory levels. Factors that could impact estimated demand and selling prices are the product lifecycles of different ranges, and the extent to which they meet builder’s and end user’s requirements.
Allowances against the carrying value of trade receivablesUsing information available at the balance sheet date, the Group reviews its accounts receivable balances and makes judgements based on an assessment of debt ageing, past experience, or known customer circumstances in order to determine the appropriate level of allowance required to account for potential uncollectable trade receivables.
ProvisionsDescriptions of the provisions held at period end are given in the provisions note. These provisions are estimates and the actual costs and timing of future cash flows are dependent on future events. Any difference between expectations and the actual future liability is accounted for in the period when such determination is made.
The property provisions require judgement and estimation in determining management’s best estimate of the following main areas: the costs of future dilapidations; the length of time it might take to find a tenant for a vacant property; the likely rent which could be achieved from letting a vacant property; the amount which the landlord of a property may accept as a lump sum in order to release the Group from its future obligations; the amount and timing of likely future increases in rent and other property costs; the extent, and hence the likely cost, of any associated legal and professional advice which will be required; and future maintenance costs.

78
Notes to the consolidated financial statements continued
4 REVENUE An analysis of the Group’s revenue is as follows:
52 weeks to 27 December 2014
£m
52 weeks to 28 December 2013
£m
Continuing operations
Sales of goods 1,090.8 956.5
Finance income 0.6 0.4
Total revenue 1,091.4 956.9
There was no revenue from discontinued operations.
5 SEGMENTAL REPORTING(a) Basis of segmentation and other general informationInformation reported to the Group’s Executive Committee is focused on one operating segment, Howden Joinery. Thus, the information required in respect of profit or loss, assets and liabilities, can all be found in the relevant primary statements and notes to these consolidated financial statements.
The Howden Joinery business derives its revenue from the sale of kitchens and joinery products.
(b) Other information
52 weeks to 27 December 2014
£m
52 weeks to 28 December 2013
£m
Capital additions 32.9 24.7
Depreciation and amortisation (20.8) (18.7)
(c) Geographical informationThe Group’s operations are mainly located in the UK, with a small presence in France and Belgium. The Group has depots located in the UK, France and Belgium. The number of depots in each location at the current and prior period ends is shown in the five year record which is located towards the back of this Annual Report. The Group’s manufacturing and sourcing operations are located in the UK.
The following table analyses the Group’s revenues from external customers by geographical market, irrespective of the origin of the goods:
52 weeks to 27 December 2014
£m
52 weeks to 28 December 2013
£m
Revenues from external customers
UK 1,075.5 940.7
France and Belgium 15.3 15.8
1,090.8 956.5

79
Howden Joinery Group Plc Annual Report & Accounts 2014
The following is an analysis of the carrying amount of segment assets, and additions to property, plant and equipment and intangible assets, analysed by the geographical area in which the assets are located:
27 December 2014 £m
28 December 2013 £m
Carrying amount of segment assets
UK 634.2 498.1
France and Belgium 10.6 10.8
644.8 508.9
27 December 2014 £m
28 December 2013 £m
Non-current assets (excluding deferred tax assets)
UK 109.5 99.4
France and Belgium 1.3 0.7
110.8 100.1
52 weeks to 27 December 2014
£m
52 weeks to 28 December 2013
£m
Additions to property, plant and equipment and intangible assets
UK 32.1 24.5
France and Belgium 0.8 0.2
32.9 24.7
6 CONTINUING OPERATIONS – EXCEPTIONAL ITEMSExceptional items for the 52 weeks to 27 December 2014There were no continuing exceptional items in the period. However, there were discontinued exceptional items and these are analysed in note 29.
Exceptional items for the 52 weeks to 28 December 2013During the period, the Group reconfigured its transport operations to better reflect the geographical mix of its sales in the UK, and to improve service to depots. This restructuring involved closure, relocation and reorganisation costs.
The costs are shown below, together with the associated tax credit.
The restructuring was completed by the end of the period. £4.5m of the expenses were paid in the period, and are shown in the consolidated cash flow statement.
52 weeks to 28 December 2013
£m
Exceptional costs before tax (4.5)
Tax on exceptional costs 0.5
Exceptional costs after tax (4.0)

80
Notes to the consolidated financial statements continued
7 OPERATING PROFITOperating profit has been arrived at after (charging)/crediting:
52 weeks to 27 December 2014
£m
52 weeks to 28 December 2013
£m
Net foreign exchange gain/(loss) 8.0 (5.2)
Depreciation of property, plant and equipment:
– on owned assets (19.1) (17.2)
– on assets held under finance lease (0.1) (0.1)
Amortisation of intangible assets (included in administrative expenses):
– on owned assets (1.6) (1.4)
Cost of inventories recognised as an expense (399.8) (357.9)
Write down of inventories (4.5) (3.2)
Loss on disposal of fixed assets (0.4) –
(Increase)/decrease in allowance for doubtful debts (note 18) (0.5) 1.3
Staff costs (note 8) (286.5) (258.0)
Minimum lease payments under operating leases (55.7) (55.0)
Auditor’s remuneration for audit services (see below) (0.4) (0.3)
All of the items above relate to continuing operations.
A more detailed analysis of auditor’s total remuneration is given below:
52 weeks to 27 December 2014
£m
52 weeks to 28 December 2013
£m
Audit services
Fees paid to the Company’s auditor for the audit of the Company’s annual financial statements (0.1) (0.1)
Fees paid to the Company’s auditor and their associates for other services to the Group:
– the audit of the subsidiary companies pursuant to legislation (0.3) (0.2)
Total audit fees (0.4) (0.3)
Other services
Audit-related assurance services (0.1) (0.1)
Tax compliance services (0.1) (0.1)
Tax advisory services (0.1) (0.2)
Total non-audit fees (0.3) (0.4)
Fees payable to Deloitte LLP and their associates for non-audit services to the Company are not required to be disclosed because the consolidated financial statements are required to disclose such fees on a consolidated basis.
Details of the Group’s policy on the use of auditors for non-audit services, the reasons why the auditor was used rather than another supplier and how the auditor’s independence and objectivity were safeguarded are set out in the Audit Committee Report. No services were provided pursuant to contingent fee arrangements.
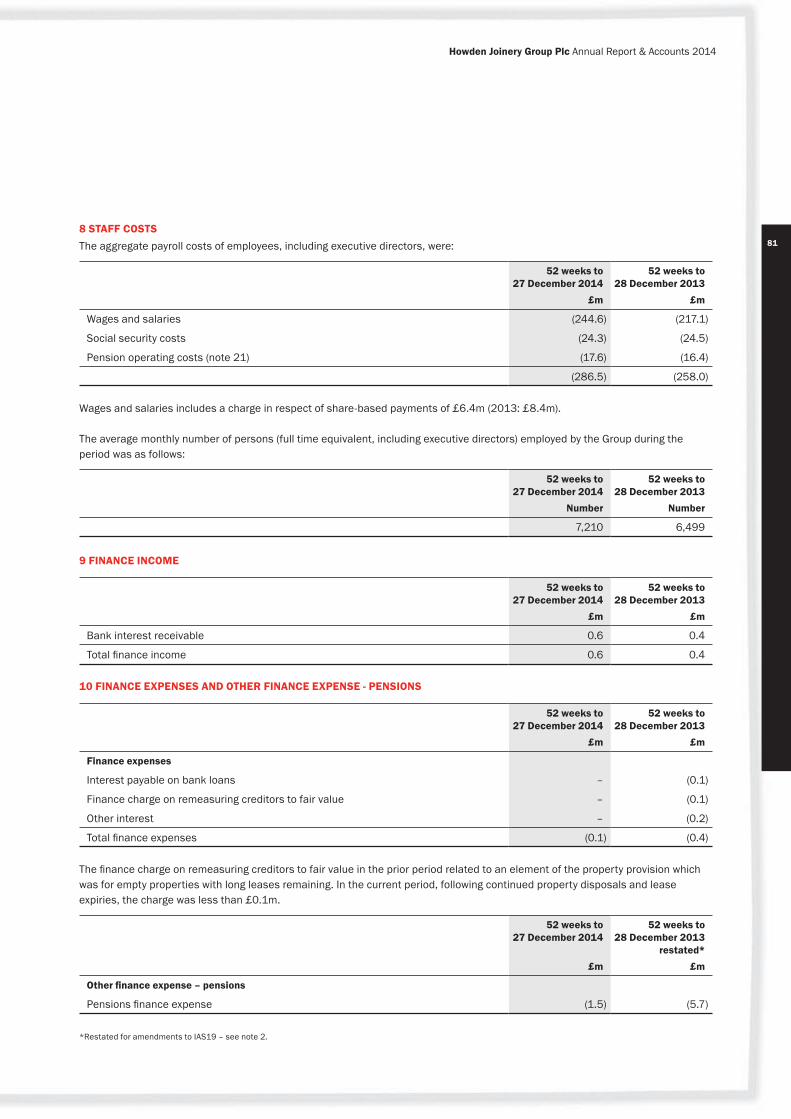
81
Howden Joinery Group Plc Annual Report & Accounts 2014
8 STAFF COSTSThe aggregate payroll costs of employees, including executive directors, were:
52 weeks to 27 December 2014
£m
52 weeks to 28 December 2013
£m
Wages and salaries (244.6) (217.1)
Social security costs (24.3) (24.5)
Pension operating costs (note 21) (17.6) (16.4)
(286.5) (258.0)
Wages and salaries includes a charge in respect of share-based payments of £6.4m (2013: £8.4m).
The average monthly number of persons (full time equivalent, including executive directors) employed by the Group during the period was as follows:
52 weeks to 27 December 2014
Number
52 weeks to 28 December 2013
Number
7,210 6,499
9 FINANCE INCOME
52 weeks to 27 December 2014
£m
52 weeks to 28 December 2013
£m
Bank interest receivable 0.6 0.4
Total finance income 0.6 0.4 10 FINANCE EXPENSES AND OTHER FINANCE EXPENSE - PENSIONS
52 weeks to 27 December 2014
£m
52 weeks to 28 December 2013
£m
Finance expenses
Interest payable on bank loans – (0.1)
Finance charge on remeasuring creditors to fair value – (0.1)
Other interest – (0.2)
Total finance expenses (0.1) (0.4)
The finance charge on remeasuring creditors to fair value in the prior period related to an element of the property provision which was for empty properties with long leases remaining. In the current period, following continued property disposals and lease expiries, the charge was less than £0.1m.
52 weeks to 27 December 2014
£m
52 weeks to 28 December 2013
restated* £m
Other finance expense – pensions
Pensions finance expense (1.5) (5.7)
*Restated for amendments to IAS19 – see note 2.

82
Notes to the consolidated financial statements continued
11 TAX(a) Tax in the income statement
Continuing operations Discontinued operations Total
52 weeks to 27 December
2014
£m
52 weeks to 28 December
2013 restated*
£m
52 weeks to 27 December
2014
£m
52 weeks to 28 December
2013 restated*
£m
52 weeks to 27 December
2014
£m
52 weeks to 28 December
2013 restated*
£m
Current taxCurrent year 44.1 28.1 – – 44.1 28.1Adjustments in respect of previous periods (1.7) (0.8) (11.2) – (12.9) (0.8)Total current tax 42.4 27.3 (11.2) – 31.2 27.3
Deferred taxCurrent year (0.6) 5.5 – – (0.6) 5.5Adjustments in respect of previous periods (1.7) 0.4 – – (1.7) 0.4Total deferred tax (2.3) 5.9 – – (2.3) 5.9
Total tax charged/(credited) in the income statement 40.1 33.2 (11.2) – 28.9 33.2
UK Corporation tax is calculated at 21.5% (2013: 23.25%) of the estimated assessable profit for the period. Tax for other countries is calculated at the rates prevailing in the respective jurisdictions.
(b) Tax relating to items credited to equity
52 weeks to 27 December 2014
£m
52 weeks to 28 December 2013
restated* £m
Deferred tax (credit)/charge to other comprehensive income on actuarial loss/gain on pension scheme (23.9) 16.8Deferred tax charge to other comprehensive income on pension contributions 6.3 –Current tax credit to other comprehensive income on pension contributions (6.8) –Deferred tax charge/(credit) to equity on share schemes 1.9 (3.1)Current tax credit to equity on share schemes (5.0) (4.6)Charge to equity re tax rate change** – 2.6
(27.5) 11.7
The tax relating to items credited to equity all relates to continuing operations.
(c) Reconciliation of the total tax chargeThe total tax charge for the period can be reconciled to the result per the income statement as follows:
52 weeks to 27 December 2014
£m
52 weeks to 28 December 2013
restated*£m
Profit before taxContinuing operations 188.8 130.5Discontinued operations (2.1) –
186.7 130.5

83
Howden Joinery Group Plc Annual Report & Accounts 2014
52 weeks to 27 December 2014
£m
52 weeks to 28 December 2013
restated* £m
Tax at the UK corporation tax rate of 21.5% (2013: 23.25%) 40.1 30.3
IFRS 2 share scheme charge 0.2 –
Expenses not deductible for tax purposes 2.1 2.2
Overseas losses not utilised 0.2 –
Change of tax rate** 0.1 0.4
Non-qualifying depreciation 0.7 0.7
Tax adjustments in respect of previous years in relation to legacy properties*** (11.1) –
Other tax adjustments in respect of previous years (3.4) (0.4)
Total tax charged in the income statement 28.9 33.2
* Restated for amendments to ISA19 – see note 2.
** In July 2013, Parliament approved the Finance Bill which reduces the UK Standard rate of corporation tax from 23% to 21% with effect from 1 April 2014 and 21% to 20% from 1 April 2015. All deferred tax assets and liabilities have been recognised at 20% (2013: 20%). Current and deferred taxes are therefore calculated at different rates for the period.
*** See note 29(c).
12 EARNINGS PER SHARE
52 weeks to 27 December 2014 52 weeks to 28 December 2013 – restated*
Earnings£m
Weighted average
number of shares
m
Earnings per share
pEarnings
£m
Weighted average
number of shares
m
Earnings per share
p
From continuing operations
Basic earnings per share 148.7 640.7 23.2 97.3 636.6 15.3
Effect of dilutive share options – 6.2 (0.2) – 5.6 (0.1)
Diluted earnings per share 148.7 646.9 23.0 97.3 642.2 15.2
From discontinued operations
Basic earnings per share 9.1 640.7 1.4
Effect of dilutive share options – 6.2 –
Diluted earnings per share 9.1 646.9 1.4
From continuing and discontinued operations
Basic earnings per share 157.8 640.7 24.6 97.3 636.6 15.3
Effect of dilutive share options – 6.2 (0.2) – 5.6 (0.1)
Diluted earnings per share 157.8 646.9 24.4 97.3 642.2 15.2 *Restated for amendments to IAS19 – see note 2.

84
Notes to the consolidated financial statements continued
13 DIVIDENDS
52 weeks to 27 December 2014
£m
52 weeks to 28 December 2013
£m
Amounts recognised as distributions to equity holders in the period
Interim dividend for the 52 weeks to 27 December 2014 – 1.9p per share 12.2 –
Final dividend for the 52 weeks to 28 December 2013 – 4.5p per share 28.8 –
Interim dividend for the 52 weeks to 28 December 2013 – 1.0p per share – 6.3
Final dividend for the 53 weeks to 29 December 2012 – 2.7p per share – 17.0
41.0 23.3
52 weeks to 27 December 2014
£m
52 weeks to 28 December 2013
£m
Dividends proposed at the end of the period (but not recognised in the period)
Proposed final dividend for the 52 weeks to 27 December 2014 – (6.5p per share) 41.6
Proposed final dividend for the 52 weeks to 28 December 2013 – (4.5p per share) 28.4
The directors propose a final dividend in respect of the 52 weeks to 27 December 2014 of 6.5p per share, payable to ordinary shareholders who are on the register of shareholders at 22 May 2015, and payable on 19 June 2015.
Dividends have been waived indefinitely on all shares held by the Group’s employee share trusts, which have not yet been awarded to employees.
The proposed final dividend for the current period is subject to the approval of the shareholders at the 2015 Annual General Meeting, and has not been included as a liability in these financial statements.
14 OTHER INTANGIBLE ASSETS The other intangible assets shown below all relate to software, as detailed further in the accounting policies note.
£m
CostAt 29 December 2012 16.1 Additions 1.1 At 28 December 2013 17.2 Exchange adjustments (0.1)Additions 1.3 Disposals (6.1)At 27 December 2014 12.3
AmortisationAt 29 December 2012 12.1 Charge for the period 1.4 At 28 December 2013 13.5 Exchange adjustments (0.1)Charge for the period 1.6 Disposals (6.1)At 27 December 2014 8.9
Net book value at 27 December 2014 3.4 Net book value at 28 December 2013 3.7

85
Howden Joinery Group Plc Annual Report & Accounts 2014
15 PROPERTY, PLANT AND EQUIPMENT
Freehold property
£m
Short-term leasehold
property£m
Plant, machinery & vehicles
£m
Fixtures & fittings
£m
Capital WIP£m
TOTAL£m
Cost
At 29 December 2012 21.6 35.2 168.5 78.8 11.6 315.7
Additions 0.1 4.3 8.4 6.5 4.3 23.6
Disposals – – (1.5) (0.3) – (1.8)
Reclassifications – 0.2 11.2 – (11.4) –
At 28 December 2013 21.7 39.7 186.6 85.0 4.5 337.5
Exchange adjustments – – – (0.1) – (0.1)
Additions 0.3 4.4 10.5 8.3 8.1 31.6
Disposals – (3.1) (61.1) (6.2) – (70.4)
Reclassifications 0.1 0.9 3.5 – (4.5) –
At 27 December 2014 22.1 41.9 139.5 87.0 8.1 298.6
Accumulated depreciation
At 29 December 2012 2.2 12.8 145.9 65.5 – 226.4
Charge for the period 0.3 2.8 9.2 5.0 – 17.3
Disposals – – (1.4) (0.3) – (1.7)
At 28 December 2013 2.5 15.6 153.7 70.2 – 242.0
Exchange adjustments – – – (0.1) – (0.1)
Charge for the period 0.3 2.9 10.7 5.3 – 19.2
Disposals – (2.9) (60.6) (6.1) – (69.6)
At 27 December 2014 2.8 15.6 103.8 69.3 – 191.5
Net book value at 27 December 2014 19.3 26.3 35.7 17.7 8.1 107.1
Net book value at 28 December 2013 19.2 24.1 32.9 14.8 4.5 95.5
The Group has pledged its property, plant and equipment to secure bank borrowings. More details are given in note 20.
At 27 December 2014, the Group had entered into contractual commitments to acquire property, plant and equipment amounting to £4.3m (2013: £3.6m).
Analysis of assets held under finance leases
27 December 2014 28 December 2013
Plant, machinery & vehicles
£mTotal
£m
Plant, machinery & vehicles
£mTotal
£m
Cost 0.5 0.5 0.5 0.5
Accumulated depreciation (0.3) (0.3) (0.2) (0.2)
Net book value 0.2 0.2 0.3 0.3
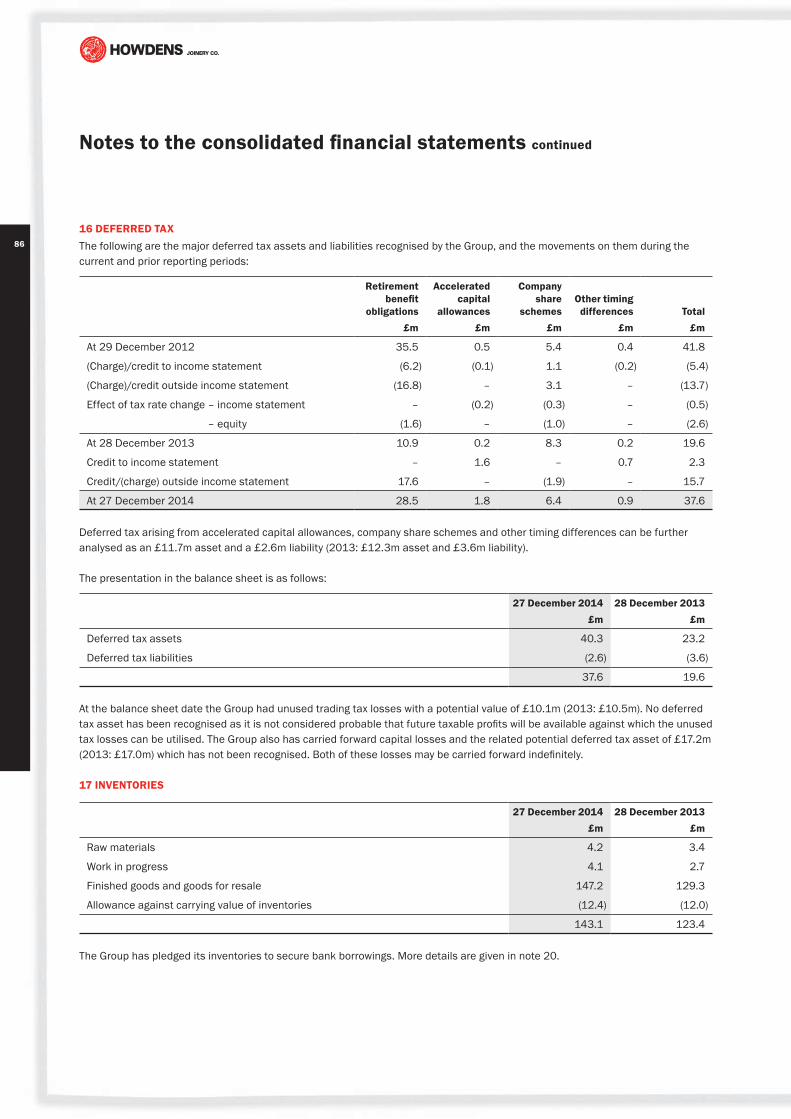
86
Notes to the consolidated financial statements continued
16 DEFERRED TAX The following are the major deferred tax assets and liabilities recognised by the Group, and the movements on them during the current and prior reporting periods:
Retirement benefit
obligations£m
Accelerated capital
allowances£m
Company share
schemes£m
Other timing differences
£mTotal
£m
At 29 December 2012 35.5 0.5 5.4 0.4 41.8
(Charge)/credit to income statement (6.2) (0.1) 1.1 (0.2) (5.4)
(Charge)/credit outside income statement (16.8) – 3.1 – (13.7)
Effect of tax rate change – income statement – (0.2) (0.3) – (0.5)
– equity (1.6) – (1.0) – (2.6)
At 28 December 2013 10.9 0.2 8.3 0.2 19.6
Credit to income statement – 1.6 – 0.7 2.3
Credit/(charge) outside income statement 17.6 – (1.9) – 15.7
At 27 December 2014 28.5 1.8 6.4 0.9 37.6
Deferred tax arising from accelerated capital allowances, company share schemes and other timing differences can be further analysed as an £11.7m asset and a £2.6m liability (2013: £12.3m asset and £3.6m liability).
The presentation in the balance sheet is as follows:
27 December 2014£m
28 December 2013£m
Deferred tax assets 40.3 23.2
Deferred tax liabilities (2.6) (3.6)
37.6 19.6
At the balance sheet date the Group had unused trading tax losses with a potential value of £10.1m (2013: £10.5m). No deferred tax asset has been recognised as it is not considered probable that future taxable profits will be available against which the unused tax losses can be utilised. The Group also has carried forward capital losses and the related potential deferred tax asset of £17.2m (2013: £17.0m) which has not been recognised. Both of these losses may be carried forward indefinitely.
17 INVENTORIES
27 December 2014£m
28 December 2013 £m
Raw materials 4.2 3.4
Work in progress 4.1 2.7
Finished goods and goods for resale 147.2 129.3
Allowance against carrying value of inventories (12.4) (12.0)
143.1 123.4
The Group has pledged its inventories to secure bank borrowings. More details are given in note 20.

87
Howden Joinery Group Plc Annual Report & Accounts 2014
18 OTHER FINANCIAL ASSETSTrade and other receivables
27 December 2014 £m
28 December 2013 £m
Trade receivables (net of allowance) 102.9 96.3
Prepayments and accrued income 28.7 24.6
Other receivables 1.5 1.5
133.1 122.4
Trade and other receivables are not interest-bearing, and are on commercial terms. Their carrying value approximates to their fair value.
An analysis of the Group’s allowance for doubtful receivables is as follows:
27 December 2014 £m
28 December 2013 £m
Balance at start of period 6.8 8.1
Increase/(decrease) in allowance recognised in the income statement 0.5 (1.3)
Balance at end of period 7.3 6.8
The Group’s exposure to the credit risk inherent in its trade receivables is discussed in note 28. The Group has no significant concentration of credit risk, with exposure spread over a large number of customers. Interest is charged at appropriate market rates on balances which are in litigation. Before accepting any new credit customer, the Group obtains a credit check from an external agency to assess the potential customer’s credit quality, and then sets credit limits on a customer-by-customer basis. These credit limits are reviewed regularly. In the case of one-off customers, the Group’s policy is to require immediate payment at the point of sale, and not to offer credit terms. The historical level of customer default is low, and as a result the “credit quality” of period end trade receivables is considered to be high. The Group reviews trade receivables past due but not impaired on a regular basis and considers, based on past experience, whether the credit quality of these amounts at the balance sheet date has deteriorated since the transaction was entered into and therefore whether the amounts are recoverable or require provision. Regular contact is maintained with all such customers and, where necessary, legal action is taken to recover the receivable. An allowance for impairment is made for any specific amounts which are considered irrecoverable or only partly recoverable. There is also a separate allowance, which is calculated as a percentage of sales. At the period end, the total bad debt provision of £7.3m (2013: £6.8m) consists of a specific provision of £2.9m (2013: £3.3m) which has been made against specific debts with a gross carrying value of £3.7m (2013: £4.1m), and a provision of £4.4m (2013: £3.5m) based on sales and on the historic default rate. To the extent that recoverable amounts are estimated to be less than their associated carrying values, impairment charges have been recorded in the consolidated income statement and the carrying values have been written down to their recoverable amounts. £4.6m of debts were written off in the period (2013: £5.0m). Included within the Group’s aggregate trade receivables balance are specific debtor balances with customers totalling £16.5m before bad debt provision (2013: £13.0m before provision) which are past due as at the reporting date. The Group has assessed these balances for recoverability and believes that their credit quality remains intact.

88
Notes to the consolidated financial statements continued
An ageing analysis of these past due trade receivables is provided as follows:
27 December 2014£m
28 December 2013£m
1–30 days past due 8.9 6.1
31–60 days past due 1.7 1.4
61–90 days past due 1.0 1.0
90+ days past due 4.9 4.5
Total overdue amounts, excluding allowance for doubtful receivables 16.5 13.0
There were no trade receivables which would have been impaired at either period end were it not for the fact that their credit terms were renegotiated. The Group does not renegotiate credit terms.
Cash at bank and in handCash at bank and in hand, which is the term used in the balance sheet, comprises cash on hand together with demand deposits, and other short-term highly liquid investments that are readily convertible to a known amount of cash and are subject to an insignificant risk of changes in value. Cash at bank is either in current accounts, or is placed on short-term deposit, and is available on demand. Interest on short-term deposits is paid at prevailing money market rates. The carrying amount of these assets approximates to their fair value.
Current asset investmentsCurrent asset investments comprise investments in short-term UK Gilts. They have maturity dates ranging between 1 and 3 months from the balance sheet date. They return a fixed rate of interest. The weighted average effective interest rate on the Gilts held at the balance sheet date is 0.3% pa.
These investments are classified as held-to-maturity, and are held at amortised cost. There were no such investments at the prior period end.
The directors estimate that the fair value of these investments at the current period end is equal to their carrying value.
Assets pledged as securityThe Group has pledged its other financial assets to secure its bank facility. More details are given in note 20.
19 OTHER FINANCIAL LIABILITIESTrade and other payables
Current liabilities27 December 2014
£m28 December 2013
£m
Trade payables 80.1 70.4
Other tax and social security 51.7 40.4
Other payables 6.9 5.5
Accruals and deferred income 47.4 42.1
186.1 158.4
Trade payables, other payables, and accruals principally comprise amounts due in respect of trade purchases and ongoing costs. Their carrying value in both periods approximates to their fair value.
The average credit taken for trade purchases during the period, based on total operations, was 46 days (2013: 44 days).
The Group’s policy on payment of creditors is to agree terms of payment prior to commencing trade with a supplier, and to abide by those terms on the timely submission of satisfactory invoices.

89
Howden Joinery Group Plc Annual Report & Accounts 2014
20 BORROWINGS
Total borrowings27 December 2014
£m28 December 2013
£m
Current assetsBank borrowings (net of prepaid fees) (0.6) (0.1)
Current borrowingsCurrent portion of finance lease obligations – 0.1
Non-current assetsBank borrowings (net of prepaid fees) (0.3) (0.9)
Non-current borrowingsNon-current portion of finance lease obligations 0.1 0.1
Total net borrowings (0.8) (0.8)
Bank borrowingsThe bank borrowings are repayable as follows:
27 December 2014£m
28 December 2013£m
Disclosed under current assetsOn demand or within one year – 0.4 Less: prepaid issue fees set against borrowings (0.6) (0.5)
(0.6) (0.1)Disclosed under non-current assetsPrepaid issue fees (0.3) (0.9)
Total bank borrowings, net of prepaid fees (0.9) (1.0)
The Group’s accounting policy is to capitalise prepaid loan facility issue fees and to set them against the related borrowings. The fees are then amortised over the life of the facility. The Group’s current facility expires in July 2016. At the current and prior period ends, the amount of fees relating to the period in excess of one year from the balance sheet date were greater than the corresponding amounts drawn down under the facility, thereby creating a net debit balance as shown above. At the current period and prior ends, the amount of fees relating to the period less than one year from the balance sheet date was also greater than the corresponding amount drawn down.
All bank borrowings shown above are in sterling, and are drawn under the £140m (2013: £160m) committed bank facility. The terms of this facility are explained further in the final paragraph of note 28(a).
This facility is secured on the property and other assets of the Group. The carrying values of each of these classes of assets is as presented in the balance sheet and notes to these consolidated financial statements.
The available facility limit is calculated every week, based on the asset backing at the time and can never exceed £140m. In accordance with the terms of the facility agreement this limit reduced from £160m to £140m in May 2014. As at 27 December 2014, the Group had available £112m of undrawn committed borrowing facilities, in respect of which all conditions precedent had been met (28 December 2013: £123m), in addition to the Group’s cash and short-term investments as shown on the Balance Sheet.
If the Group were to use the facility, it would carry interest at a rate of LIBOR plus a margin. The margin would vary between 200 and 250 basis points and would be determined by the Group’s rolling Adjusted Profit Before Tax.

90
Notes to the consolidated financial statements continued
Finance lease obligations The finance lease obligations are repayable as follows:
27 December 2014£m
28 December 2013£m
Current liabilities
Within one year – 0.1
Non-current liabilities
In the second year 0.1 –
In the third to fifth years inclusive – 0.1
Total finance lease obligations 0.1 0.2
All of the finance lease obligations are in sterling. Each lease contract is at a fixed interest rate. The finance lease obligations were unsecured, and the average remaining lease term at the period end was 2 years and 6 months (2013: 2 years and 3 months).
The reconciliation items between the total future minimum lease payments and their present value is as follows:
Minimum lease payments Present value of minimum lease payments
27 December 2014£m
28 December 2013£m
27 December 2014£m
28 December 2013£m
Amounts payable under finance leases
Within one year – 0.1 – 0.1
In the second year 0.1 – 0.1 –
In the third to fifth years inclusive – 0.1 – 0.1
0.1 0.2 0.1 0.2
Less: future finance charges – –
Present value of lease obligations 0.1 0.2
Disclosed as:
Current – 0.1
Non-current 0.1 0.1
0.1 0.2 Interest rate and fair value information for bank borrowings and finance lease obligations The weighted average interest rates paid were as follows:
52 weeks to 27 December 2014
%
52 weeks to 28 December 2013
%
Finance lease obligations 6.0 5.0
Bank borrowings N/A* 2.5
The directors estimate the fair value of the Group’s borrowings is as follows:
27 December 2014£m
28 December 2013£m
Finance lease obligations 0.1 0.2
Bank borrowings (0.9) (1.0)
*The Group did not incur any interest on borrowings in the current period.

91
Howden Joinery Group Plc Annual Report & Accounts 2014
21 RETIREMENT BENEFIT OBLIGATIONS(a) Overview of all retirement benefit arrangementsDefined contribution: auto-enrolment planThe Group operates an auto-enrolment defined contribution plan for employees, in line with recent UK Government legislation. Under the terms of this scheme, employees make pension contributions out of their salaries, and the Group also makes additional contributions. The Group decided to give employees the option to enter this plan earlier than the mandatory start date, and so the auto-enrolment plan was open to employees from November 2012 on a voluntary, opt-in, basis, although it was not mandatory to enrol employees into this plan until July 2013.
The total cost charged to income in respect of this plan in the current period of £2.7m (2013: £1.4m) represents the Group’s contributions due and payable in respect of the period. Due to the timing of payments, £0.3m (2013: £0.2m) of this amount was unpaid at the period end, but was paid shortly afterwards.
Defined contribution: other planThe Group operates a defined contribution plan for its employees. The assets of this plan are held separately from those of the Group, and are under the control of the scheme trustees. This plan began operation during 2006.
The total cost charged to income in respect of this plan in the current period of £0.8m (2013: £0.8m) represents the Group’s contributions due and paid in respect of the period.
Defined benefit planCharacteristics and risks of the planThe Group operates a funded pension plan which provides benefits based on the career average pensionable pay of participating employees. This plan was closed to new entrants from April 2013. The assets of the plan are held separately from those of the Group, being held in a trustee-administered pension plan and invested with independent fund managers. The trustee directors of the plan comprise three member-elected trustees, two independent trustees, and three Group-appointed trustees. All trustees are required to act in the best interests of the plan beneficiaries. The plan exposes the Group to actuarial risks, such as longevity risk, interest rate risk, and market (investment) risk. Accounting and actuarial valuationContributions are charged to the consolidated income statement so as to spread the cost of pensions over the employees’ working lives with the Group. The present value of the defined benefit obligation, the related current service cost, and past service cost are determined by a qualified actuary using the projected unit method. The most recent completed actuarial valuation was carried out at 5 April 2011 by the plan actuary. The actuary advising the Group has subsequently rolled forward the results of the 5 April 2011 valuation to 27 December 2014, and has restated the results onto a basis consistent with market conditions at that date.
Funding and estimated contributionsThe Group has an agreement with the pension plan trustees to make additional deficit contributions to the plan over and above the normal level of contributions as follows: £25m per year until 31 March 2015, and £35m per year from 1 April 2015 until 30 June 2017. This annual contribution may be increased by a one-off £10m per year, if profits are above pre-agreed levels until 31 March 2015. An additional payment was triggered by the Group’s 2014 profit being in excess of the pre-agreed level, and accordingly an additional one-off payment of £10m will be paid in 2015. More details of the one-off payment and the funding arrangements are given in our Interim Management Statement of 5 November 2014 and in our RNS news announcement of 12 June 2012.
The funding agreement is subject to review as part of the 2014 triennial valuations and will be agreed with the Scheme trustees during 2015. The trustees and the Group agree the contributions to be paid into the Plan.
The Group’s estimated contributions to the defined benefit plan in the 52 weeks ending 26 December 2015 are £57m. This figure has been arrived at by assuming that our funding arrangement with the trustees and our payment to the Pension Protection Fund remain at the same level as in 2014. It also includes a one-off additional payment to the plan of £10m, which is mentioned above and which will be paid in 2015.

92
Notes to the consolidated financial statements continued
Differences between the defined benefit pension deficit on an IAS 19 basis and on a funding basisAs is mandatory under International Financial Reporting Standards, the Group values its pension deficit in these accounts on an IAS 19 basis. As shown below, the IAS 19 deficit at the current period end is £142.6m. On a funding basis (also know as a “Technical Provisions basis”, being the basis on which the triennial actuarial valuations are carried out), the funding deficit at the current period end is estimated at £249m, this estimate being based on an approximate roll-forward of the 2011 triennial funding valuation, updated for market conditions.
French post-employment benefitsAs explained in more detail in note 22, we have recognised a provision for a post-employment benefit which is payable to employees in our French subsidiaries under French law on retirement. It is a lump sum payable on retirement, not a recurring pension. As such, there is no underlying pension plan.
(b) Adoption of revisions to IAS 19 in the current periodThe revised IAS 19 was adopted in the current period. As required, prior periods have been restated as if the revised standard had been in force in those periods.
Further detail of the nature of the revisions is given at note 2. Their financial effect is shown below:
52 weeks to 27 December 2014
£m
52 weeks to 28 December 2013
£m
Income statement
Admin expenses – increase to defined benefit pensions current service cost 2.0 1.8
Other finance charge – pensions. Increase to charge 6.3 1.6
Tax charge – deferred tax element of current tax charge (1.7) (0.9)
Net decrease in profit for the period 6.6 2.5
Other comprehensive income (“OCI”)
Change in gross actuarial gain – increase in OCI (8.3) (3.4)
Change in deferred tax on actuarial gain – decrease in OCI 1.7 0.9
Net increase in OCI for the period (6.6) (2.5)
Net effect on total income (and net assets) – –
Earnings per share
Reduction in basic EPS (pence/share) (1.0) (0.4)
Reduction in diluted EPS (pence/share) (1.0) (0.3)

93
Howden Joinery Group Plc Annual Report & Accounts 2014
(c) Total amounts charged/(credited) in respect of pensions in the period
52 weeks to 27 December 2014
£m
52 weeks to 28 December 2013
restated* £m
Charged to the income statement
Defined benefit plan – current service cost 12.4 12.5
Defined benefit plan – administration costs 1.7 1.5
Defined benefit plan – total operating charge 14.1 14.0
Defined benefit plan – net finance charge 1.5 5.7
Defined contribution plans – total operating charge 3.5 2.4
French post–employment benefits – charge in period 0.2 –
Total net amount charged to profit before tax 19.3 22.1
Charged to equity
Defined benefit plan – net actuarial losses/(gains) net of deferred tax 95.7 (56.2)
Total charge/(credit) 115.0 (34.1) *Restated for amendments for IAS19 – see note 2.
(d) Other information – defined benefit pension plan Key assumptions used in the valuation of the plan
52 weeks to 27 December 2014
52 weeks to 28 December 2013
restated*
Rate of increase of pensions in deferment capped at lower of CPI and 5% 2.15% 2.60%
Rate of CARE revaluation capped at lower of RPI and 3% 2.45% 2.60%
Rate of increase of pensions in payment:
– pensions with increases capped at lower of CPI and 5% 2.45% 2.70%
– pensions with increases capped at lower of CPI and 5%, with a 3% minimum 3.55% 3.65%
– pensions with increases capped at the lower of LPI and 2.5% 2.25% 2.30%
Rate of increase in salaries 4.45% 4.70%
Inflation assumption – RPI 3.45% 3.70%
Inflation assumption – CPI 2.45% 2.70%
Discount rate 3.50% 4.80%
The following mortality tables were used:
Mortality before retirement – 2013 and 2014: Males AM00 UltimateFemales AF00 Ultimate
Mortality in retirement for current and future pensioners – 2013 and 2014:
Males S1PMA, CMI 2010 core projections with a long-term improvement rate of 1.5% paFemales S1PFA, CMI 2010 core projections with a long-term improvement rate of 1.5% pa
* The underlying S1PMA and S1PFA tables are also adjusted by scaling factors. Separate scaling factors apply to males and females and to the different categories of members.

94
Notes to the consolidated financial statements continued
The mortality assumption adopted by the Group in 2013 and 2014 is equivalent to the following life expectancies:
2014 2013
Male (years) Female (years) Male (years) Female (years)
Non-pensioner (age 45) 89.5 91.8 89.3 91.7
Pensioner (age 65) 88.6 89.6 88.5 89.5
SensitivitiesIf there was an increase/decrease in the discount rate of 0.25%, there would be a corresponding decrease/increase in the scheme liabilities of around 5%, or £54m, and a decrease/increase in the total service cost of around 4.4% or £0.8m.
An increase of 0.25% to the inflation rate would increase scheme liabilities by around £35m, or 3.2%, and would increase total service cost by around £0.5m or 2.8%. A decrease of 0.25% to the inflation rate would decrease scheme liabilities by around £31m, or 2.8%, and would decrease total service cost by around £0.4m or 2.2%. The effect of an increase in inflation is not the exact equal and opposite of the effect of a decrease in inflation because of the effect of various caps and collars on various tranches of pension benefits (for instance, some pension increases are capped at the lower of LPI and 2.5%, as noted above).
The effect of increasing the assumption regarding life expectancy by one year longer than shown above would be to increase the assessed value of liabilities by around 2% or £22m, and would increase total service cost by around £0.3m or 1.6%.
The sensitivities above are applied to the defined benefit obligation at the end of the reporting period. Whilst the analysis does not take account of the full distribution of cash flows expected under the scheme, it does provide an approximation to the sensitivity of the assumptions shown.
Analysis of plan assets
27 December 2014 28 December 2013
Quoted market price in an
active market£m
No quoted market price in an
active market£m
Quoted market price in an
active market£m
No quoted market price in an
active market£m
Government bonds 335.2 – 226.9 –
Equities
– passive equities 85.2 – 108.9 –
– low volatility equities 176.9 – 144.5 –
Private equity – 58.7 63.6
Alternative growth assets
– fund of hedge funds 78.3 – 57.7 –
– absolute return fund 59.3 – 56.1 –
Corporate bonds 92.7 – 86.2 –
Commerical property fund 45.5 – 35.7 –
Cash and cash equivalents 11.7 – 23.5 –
Total 884.8 58.7 739.5 63.6
The plan assets do not include any of the Group’s own financial instruments nor any property occupied by, or other assets used by, the Group.

95
Howden Joinery Group Plc Annual Report & Accounts 2014
Asset allocationThe trustees’ current chosen long-term asset allocation strategy for the plan, as noted in the plan’s most recent audited accounts (for the year to 5 April 2014), is to target an allocation of 55% in return-seeking assets (such as equities, alternative growth assets, and the commercial property fund), and 45% in risk-reducing assets (such as government bonds, corporate bonds, and cash and cash equivalents).
Analysis of plan liabilities
27 December 20141 28 December 20132
No. of members Duration (yrs) No. of members Duration (yrs)
Active members 2,021 31 2,182 30
Deferred members 6,561 24 6,698 25
Pensioners 2,890 14 2,714 15
Total no./average duration 11,472 21 11,594 21 1 The number of members is as per the 5 April 2014 trustees’ report, and the duration is as at 5 April 2014 (being the date of the triennial valuation
which is in progress).
2 The number of members is as per the 5 April 2013 trustees’ report, and the duration is as at 5 April 2011 (being the date of the last triennial valuation).
Balance sheetThe amount included in the Balance Sheet arising from the Group’s obligations in respect of defined benefit retirement benefit plan is as follows:
27 December 2014 £m
28 December 2013 £m
Present value of defined benefit obligations (1,086.1) (857.4)
Fair value of scheme assets 943.5 803.1
Deficit in the scheme, recognised in the Balance Sheet (142.6) (54.3)
Movements in the present value of defined benefit obligations were as follows:
52 weeks to 27 December 2014
£m
52 weeks to 28 December 2013
restated*£m
Present value at start of period 857.4 874.9
Current service cost 12.4 12.5
Administration cost 1.7 1.5
Interest on obligation 40.6 38.4
Contributions from scheme members 0.2 0.2
Actuarial losses/(gains):
– changes in financial assumptions 212.5 (47.3)
– experience (12.0) –
Benefits paid, including expenses (26.7) (22.8)
Present value at end of period 1,086.1 857.4
*Restated for amendments to IAS 19 – see note 2.
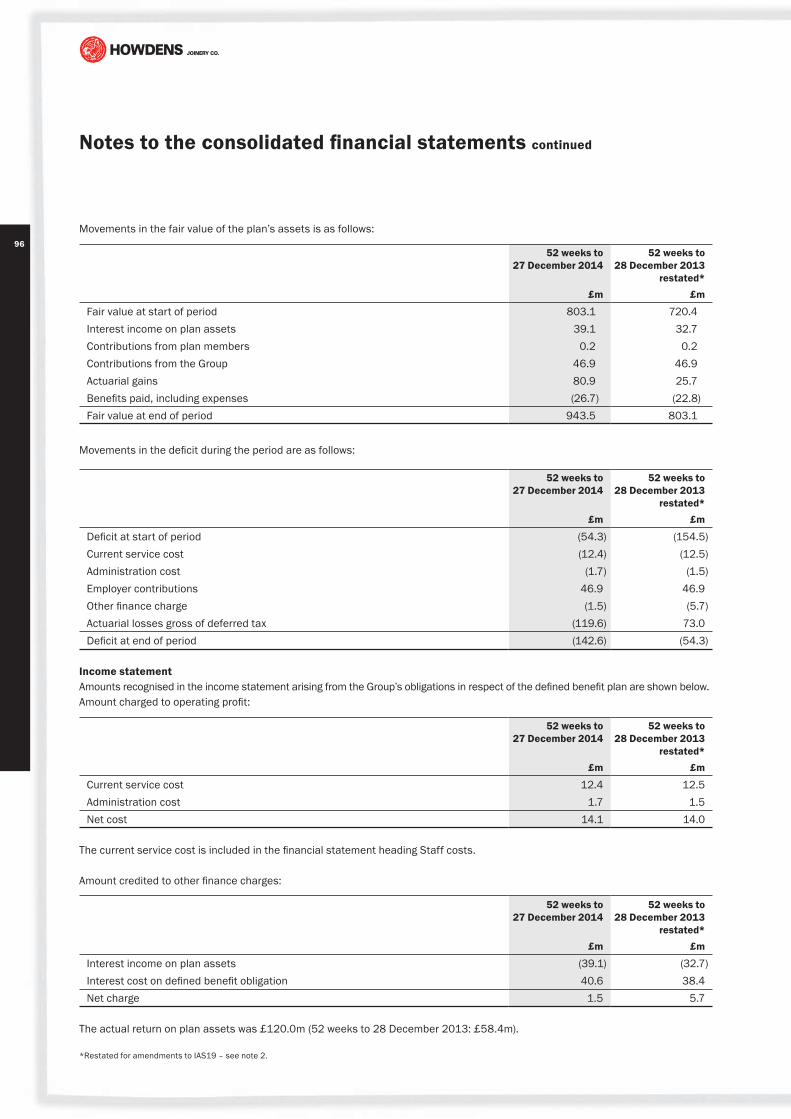
96
Notes to the consolidated financial statements continued
Movements in the fair value of the plan’s assets is as follows:
52 weeks to 27 December 2014
£m
52 weeks to 28 December 2013
restated* £m
Fair value at start of period 803.1 720.4 Interest income on plan assets 39.1 32.7 Contributions from plan members 0.2 0.2 Contributions from the Group 46.9 46.9 Actuarial gains 80.9 25.7 Benefits paid, including expenses (26.7) (22.8)Fair value at end of period 943.5 803.1
Movements in the deficit during the period are as follows:
52 weeks to 27 December 2014
£m
52 weeks to 28 December 2013
restated* £m
Deficit at start of period (54.3) (154.5)Current service cost (12.4) (12.5)Administration cost (1.7) (1.5)Employer contributions 46.9 46.9 Other finance charge (1.5) (5.7)Actuarial losses gross of deferred tax (119.6) 73.0 Deficit at end of period (142.6) (54.3)
Income statement Amounts recognised in the income statement arising from the Group’s obligations in respect of the defined benefit plan are shown below.Amount charged to operating profit:
52 weeks to 27 December 2014
£m
52 weeks to 28 December 2013
restated* £m
Current service cost 12.4 12.5 Administration cost 1.7 1.5 Net cost 14.1 14.0
The current service cost is included in the financial statement heading Staff costs.
Amount credited to other finance charges:
52 weeks to 27 December 2014
£m
52 weeks to 28 December 2013
restated* £m
Interest income on plan assets (39.1) (32.7)Interest cost on defined benefit obligation 40.6 38.4 Net charge 1.5 5.7
The actual return on plan assets was £120.0m (52 weeks to 28 December 2013: £58.4m).
*Restated for amendments to IAS19 – see note 2.

97
Howden Joinery Group Plc Annual Report & Accounts 2014
Statement of comprehensive incomeAmounts taken to equity via the statement of comprehensive income in respect of the Group’s defined benefit plan are shown below:
52 weeks to 27 December 2014
£m
52 weeks to 28 December 2013
restated* £m
Actuarial gain on plan assets 80.9 25.7
Actuarial (loss)/gain on plan liabilities (200.5) 47.3
Net actuarial (loss)/gain, before associated deferred tax (119.6) 73.0
*Restated for amendments to IAS19 - see note 2.
22 PROVISIONS
Property£m
Warranty£m
Business closure
£m
French post-retirement
benefits£m
Total£m
At 29 December 2012 17.8 3.4 0.9 – 22.1
Additional provision in the period 1.8 2.8 – – 4.6
Provision released in the period (0.2) (0.3) – – (0.5)
Utilisation of provision in the period (10.4) (3.0) (0.8) – (14.2)
At 28 December 2013 9.0 2.9 0.1 – 12.0
Additional provision in the period 3.3 3.6 – 0.2 7.1
Provision released in the period (0.2) – (0.1) – (0.3)
Utilisation of provision in the period (5.3) (2.9) – – (8.2)
At 27 December 2014 6.8 3.6 – 0.2 10.6
Property provisionThe property provision covers two main areas: (i) onerous leases on any non-trading leased properties, and (ii) obligations to make dilapidations payments to landlords of leased properties.
There is a discussion of the main sources of estimation and uncertainty which apply to this provision at note 3. The amount of the expected future cash flows has been adjusted to reflect the expected range of possibilities. The timing of outflows from the provision is variable, and is dependent on property lease expiry dates, on opportunities to surrender leases, and on the timing of dilapidations assessments and works.
In the prior period there was an increase of £0.1m to one element of the property provision which was for empty properties with long leases remaining, and which related to the unwinding of the discount rate over time. In the current year, following continued property disposals and lease expiries, the comparable charge was less than £0.1m.

98
Notes to the consolidated financial statements continued
Warranty provisionThe warranty provision relates to amounts due in respect of product warranties. As products are sold, the Group makes provision for claims under warranties. As claims are made, the Group utilises the provision and then uses this historical data to periodically revise the basis on which it makes further provision.
Business closure provisionThe provision for business closure relates to the costs of closure of the former Group subsidiary company Howden Joinery Supply Division (Asia) Ltd. This closure was almost entirely completed at the end of 2013, but the final small cash outflows were paid in 2014 and the small unutilised remaining provision was released.
French post-employment benefitsThis provision relates to a benefit which is payable to employees in our French subsidiaries under French law on retirement. It is a lump sum payable on retirement, not a recurring pension. It will only be payable if any of the eligible employees are employed by our French subsidiaries immediately before their retirement. The provision represents our best estimate of the potential liability and it is calculated based on several factors, mainly the age profile and salary details of the current workforce in France, and the current rate of staff turnover.
23 SHARE CAPITAL
Ordinary shares of 10p each
52 weeks to 27 December 2014
Number
52 weeks to 28 December 2013
Number
52 weeks to 27 December 2014
£m
52 weeks to 28 December 2013
£m
Allotted, called up and fully paid
Balance at the beginning of the period 642,782,361 642,016,063 64.3 64.2
Issued during the period 3,759,135 766,298 0.4 0.1
Balance at the end of the period 646,541,496 642,782,361 64.7 64.3
24 NOTES TO THE CASH FLOW STATEMENT(a) Net cash flows from operating activities
52 weeks to 27 December 2014
£m
52 weeks to 28 December 2013
£m
Net cash flow from operating activities comprises:
Continuing operating activities 147.8 87.2
Discontinued operating activities – –
Discontinued operations – exceptional items – –
147.8 87.2

99
Howden Joinery Group Plc Annual Report & Accounts 2014
(b) Reconciliation of net cash
52 weeks to 27 December 2014
£m
52 weeks to 28 December 2013
£m
Net cash at start of period 140.5 96.4
(Decrease)/increase in cash (7.8) 43.0
Increase in short-term investments 85.0 –
Decrease in bank loans/prepaid loan fees (0.1) 1.1
Decrease in finance leases 0.1 –
Net cash at end of the period 217.7 140.5
Represented by:
Cash 131.9 139.7
Short-term investments 85.0 –
Bank loans/prepaid loan fees 0.9 1.0
Finance leases (0.1) (0.2)
217.7 140.5
(c) Analysis of net cash
Cash at bank and in hand
£m
Short-term investments
£m
SUBTOTAL Cash and cash
equivalents£m
Bank loans/prepaid loan
fees (note 20)£m
Finance leases£m
TOTAL Net cash
£m
At 28 December 2013 139.7 – 139.7 1.0 (0.2) 140.5
Cash flow (7.8) 85.0 77.2 (0.1) 0.1 77.2
At 27 December 2014 131.9 85.0 216.9 0.9 (0.1) 217.7
The short-term investments have a maturity of less than three months, and as such are considered to be cash equivalents for the purposes of the cash flow statement.

100
Notes to the consolidated financial statements continued
25 FINANCIAL COMMITMENTSCapital commitments
27 December 2014
£m
28 December 2013
£m
Contracted for, but not provided for in the financial statements 4.3 3.6
Operating lease commitmentsThe Group as lesseePayments under operating leases during the period are shown at note 7. At the balance sheet date, the Group had outstanding lease commitments for future minimum lease payments under non-cancellable operating leases which fall due as shown below:
Properties Other leases Total
27 December 2014
£m
28 December 2013
£m
27 December 2014
£m
28 December 2013
£m
27 December 2014
£m
28 December 2013
£m
Payments falling due
Within one year 46.3 46.0 11.7 10.5 58.0 56.5
In the second to fifth year inclusive 140.1 146.0 27.8 12.2 167.9 158.2
After five years 75.1 75.4 10.9 2.4 86.0 77.8
261.5 267.4 50.4 25.1 311.9 292.5
The Group as lessorThe Group sublets certain leased properties to third parties. At the balance sheet date, the Group had contracted with tenants for the following future minimum lease payments:
27 December 2014
£m
28 December 2013
£m
Payments receivable
Within one year 0.7 0.8
In the second to fifth year inclusive 2.5 2.3
After five years 1.3 0.5
4.5 3.6
Finance lease commitments are analysed in note 20.

101
Howden Joinery Group Plc Annual Report & Accounts 2014
26 SHARE-BASED PAYMENTS1) Details of each schemeThe Group recognised a charge of £6.4m (2013: charge of £8.4m) in respect of share-based payments during the period. The Group has various share-based payment schemes, which are all equity-settled. The main details of all schemes which existed during the period are given below.
a) Co-Investment PlanThis is a co-investment plan where each participant is permitted to invest a limited amount of shares on an annual basis for the purposes of the Plan. 2011 award: 25% of the award will vest if PBT growth at the end of the 2013 financial year is at a rate of 6% p.a., based on the December 2010 accounts. 100% of the award will vest if PBT growth on the same basis is 12% p.a. or above.
2012 award: 25% of the award will vest if PBT growth at the end of the 2014 financial year is at a rate of 6% p.a., based on the December 2011 accounts. 100% of the award will vest if PBT growth on the same basis is 12% or above.
2013 award: 25% of the award will vest if PBT growth at the end of the 2015 financial year is at a rate of 6% p.a., based on the December 2012 accounts. 100% of the award will vest if PBT growth on the same basis is 12% or above.
2014 award: 15% of the award will vest if PBT growth at the end of the 2016 financial year is at a rate of 8% p.a., based on the December 2013 accounts. 100% of the award will vest if PBT growth on the same basis is 20% or above.
b) Executive Share OptionsThis is a discretionary share option plan. These options are granted with an exercise price equal to market value. The vesting period is three years from the date of grant with an exercise period of seven years (i.e. a total life of ten years). In the information below, these options have been further subdivided according to their different performance conditions, in order to give more meaningful information. The different subdivisions and performance conditions are as follows: (i) 40% vesting if EPS growth equals RPI + 40%, rising to 100% vesting for EPS growth of RPI + 100%. (ii) EPS growth must equal RPI + 9%. If this is achieved there will be full vesting. If this is not achieved there will be no vesting. (iii) Full vesting will occur if the Group’s cumulative profit before tax is at least £90m over the three financial years ending
December 2009, 2010, and 2011. If this is not achieved there will be no vesting.
c) Howden Joinery Group Long-term Incentive PlanThis is a discretionary plan under which the Group may grant different types of share award including market value and nil cost options, conditional awards of shares and restricted shares (where the employee is the owner of the shares from the date of award but subject to forfeiture). Unless otherwise specified all awards have substantially the same terms. (i) Market value options, the vesting period for which is three years from the date of grant with an exercise period of seven years
(i.e. a total life of ten years). Options will vest if cumulative PBT of £90m is achieved over the three financial years ending 2009, 2010 and 2011.
(ii) Market value options which vest after a three year period from the date of grant. 15% of the options will vest if the Group achieves growth in pre-exceptional PBT equivalent to RPI over the performance period; 100% will vest if pre-exceptional PBT growth is equivalent to RPI + 8% is achieved.
(iii) Conditional Share Award - shares will vest at the end of a three year period commencing on the date of grant subject to continuing employment.
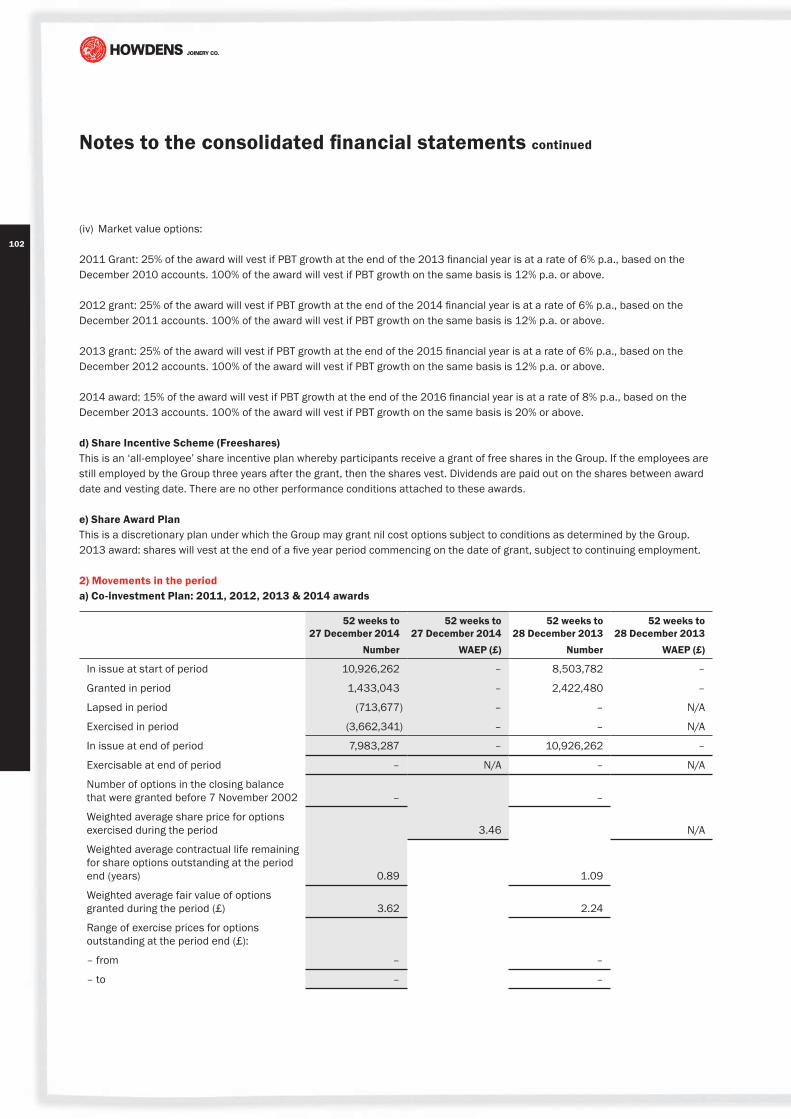
102
Notes to the consolidated financial statements continued
(iv) Market value options:
2011 Grant: 25% of the award will vest if PBT growth at the end of the 2013 financial year is at a rate of 6% p.a., based on the December 2010 accounts. 100% of the award will vest if PBT growth on the same basis is 12% p.a. or above.
2012 grant: 25% of the award will vest if PBT growth at the end of the 2014 financial year is at a rate of 6% p.a., based on the December 2011 accounts. 100% of the award will vest if PBT growth on the same basis is 12% p.a. or above.
2013 grant: 25% of the award will vest if PBT growth at the end of the 2015 financial year is at a rate of 6% p.a., based on the December 2012 accounts. 100% of the award will vest if PBT growth on the same basis is 12% p.a. or above.
2014 award: 15% of the award will vest if PBT growth at the end of the 2016 financial year is at a rate of 8% p.a., based on the December 2013 accounts. 100% of the award will vest if PBT growth on the same basis is 20% or above.
d) Share Incentive Scheme (Freeshares)This is an ‘all-employee’ share incentive plan whereby participants receive a grant of free shares in the Group. If the employees are still employed by the Group three years after the grant, then the shares vest. Dividends are paid out on the shares between award date and vesting date. There are no other performance conditions attached to these awards.
e) Share Award PlanThis is a discretionary plan under which the Group may grant nil cost options subject to conditions as determined by the Group.2013 award: shares will vest at the end of a five year period commencing on the date of grant, subject to continuing employment.
2) Movements in the perioda) Co-investment Plan: 2011, 2012, 2013 & 2014 awards
52 weeks to 27 December 2014
Number
52 weeks to 27 December 2014
WAEP (£)
52 weeks to 28 December 2013
Number
52 weeks to 28 December 2013
WAEP (£)
In issue at start of period 10,926,262 – 8,503,782 –
Granted in period 1,433,043 – 2,422,480 –
Lapsed in period (713,677) – – N/A
Exercised in period (3,662,341) – – N/A
In issue at end of period 7,983,287 – 10,926,262 –
Exercisable at end of period – N/A – N/A
Number of options in the closing balance that were granted before 7 November 2002 – –
Weighted average share price for options exercised during the period 3.46 N/A
Weighted average contractual life remaining for share options outstanding at the period end (years) 0.89 1.09
Weighted average fair value of options granted during the period (£) 3.62 2.24
Range of exercise prices for options outstanding at the period end (£):
– from – –
– to – –

103
Howden Joinery Group Plc Annual Report & Accounts 2014
b) Executive Share Options i) 40% vesting if EPS growth = RPI + 40% rising to 100% vesting if EPS growth = RPI + 100%
52 weeks to 27 December 2014
Number
52 weeks to 27 December 2014
WAEP (£)
52 weeks to 28 December 2013
Number
52 weeks to 28 December 2013
WAEP (£)
In issue at beginning of period 275,483 1.07 683,952 1.07
Granted in period – N/A – N/A
Lapsed in period – N/A – N/A
Exercised in period (275,483) 1.07 (408,469) 1.07
In issue at end of period – N/A 275,483 1.07
Exercisable at end of period – N/A 275,483 1.07
Number of options in the closing balance that were granted before 7 November 2002 – –
Weighted average share price for options exercised during the period 3.70 2.32
Weighted average contractual life remaining for share options outstanding at the period end (years) N/A –
Weighted average fair value of options granted during the period (£) N/A N/A
Range of exercise prices for options outstanding at the period end (£):
– from N/A 1.07
– to N/A 1.07
ii) Full vesting if EPS increases by RPI + 9%
52 weeks to 27 December 2014
Number
52 weeks to 27 December 2014
WAEP (£)
52 weeks to 28 December 2013
Number
52 weeks to 28 December 2013
WAEP (£)
In issue at beginning of period 148,383 1.00 601,693 1.00
Granted in period – N/A – N/A
Lapsed in period (5,000) 1.00 (11,000) 1.00
Exercised in period (42,383) 1.00 (442,310) 1.00
In issue at end of period 101,000 1.00 148,383 1.00
Exercisable at end of period 101,000 1.00 148,383 1.00
Number of options in the closing balance that were granted before 7 November 2002 – –
Weighted average share price for options exercised during the period 3.48 2.30
Weighted average contractual life remaining for share options outstanding at the period end (years) – –
Weighted average fair value of options granted during the period (£) N/A N/A
Range of exercise prices for options outstanding at the period end (£):
– from 1.00 1.00
– to 1.00 1.00

104
Notes to the consolidated financial statements continued
iii) Cumulative PBT of £90m over three financial years ending 2009, 2010 and 2011
52 weeks to 27 December 2014
Number
52 weeks to 27 December 2014
WAEP (£)
52 weeks to 28 December 2013
Number
52 weeks to 28 December 2013
WAEP (£)
In issue at beginning of period 2,147,229 0.50 8,125,944 0.38
Granted in period – N/A – N/A
Lapsed in period – N/A – N/A
Exercised in period (2,147,229) 0.50 (5,978,715) 0.33
In issue at end of period – N/A 2,147,229 0.50
Exercisable at end of period – N/A 2,147,229 0.50
Number of options in the closing balance that were granted before 7 November 2002 – –
Weighted average share price for options exercised during the period 3.71 2.31
Weighted average contractual life remaining for share options outstanding at the period end (years) N/A –
Weighted average fair value of options granted during the period (£) N/A N/A
Range of exercise prices for options outstanding at the period end (£):
– from N/A 0.50
– to N/A 0.50
c) Howden Joinery Group Long-term Incentive Plani) Cumulative PBT of £90m over three financial years ending 2009, 2010 and 2011
52 weeks to 27 December 2014
Number
52 weeks to 27 December 2014
WAEP (£)
52 weeks to 28 December 2013
Number
52 weeks to 28 December 2013
WAEP (£)
In issue at beginning of period 469,263 0.36 1,831,965 0.42
Granted in period – N/A – N/A
Lapsed in period – N/A – N/A
Exercised in period (258,200) 0.36 (1,362,702) 0.44
In issue at end of period 211,063 0.36 469,263 0.36
Exercisable at end of period 211,063 0.36 469,263 0.36
Number of options in the closing balance that were granted before 7 November 2002 – –
Weighted average share price for options exercised during the period 3.79 2.32
Weighted average contractual life remaining for share options outstanding at the period end (years) – –
Weighted average fair value of options granted during the period (£) N/A N/A
Range of exercise prices for options outstanding at the period end (£):
– from 0.36 0.36
– to 0.36 0.36
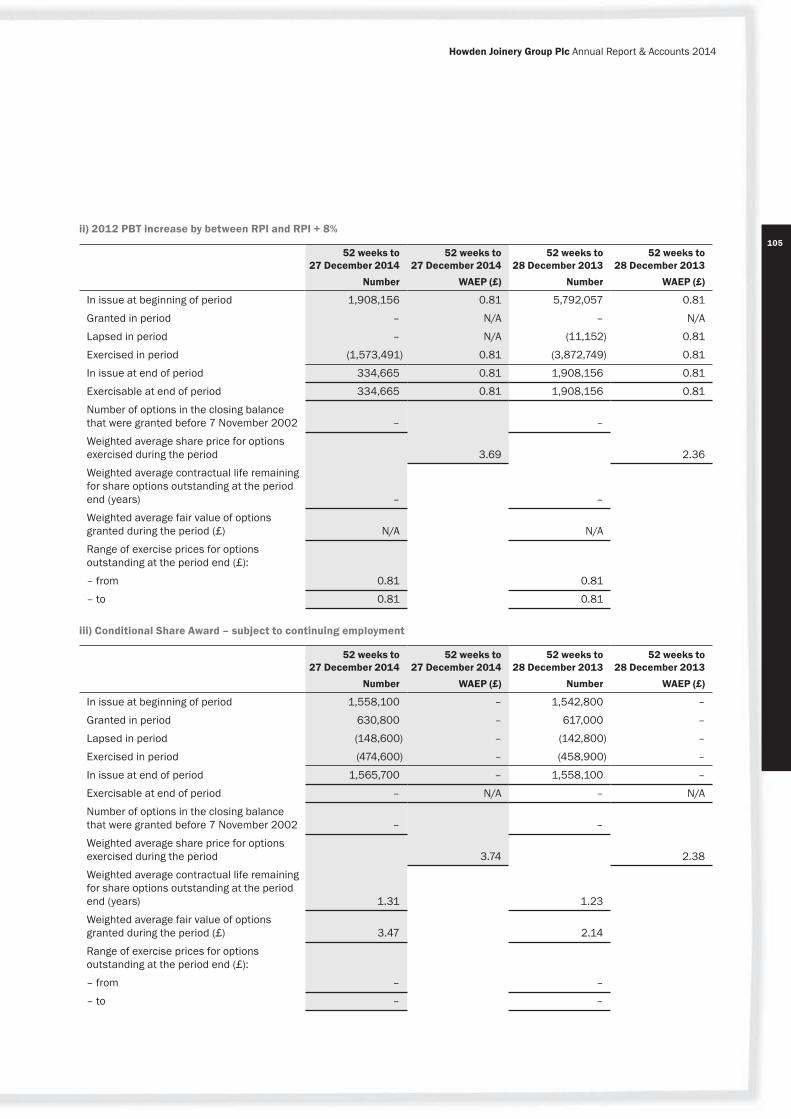
105
Howden Joinery Group Plc Annual Report & Accounts 2014
ii) 2012 PBT increase by between RPI and RPI + 8%
52 weeks to 27 December 2014
Number
52 weeks to 27 December 2014
WAEP (£)
52 weeks to 28 December 2013
Number
52 weeks to 28 December 2013
WAEP (£)
In issue at beginning of period 1,908,156 0.81 5,792,057 0.81
Granted in period – N/A – N/A
Lapsed in period – N/A (11,152) 0.81
Exercised in period (1,573,491) 0.81 (3,872,749) 0.81
In issue at end of period 334,665 0.81 1,908,156 0.81
Exercisable at end of period 334,665 0.81 1,908,156 0.81
Number of options in the closing balance that were granted before 7 November 2002 – –
Weighted average share price for options exercised during the period 3.69 2.36
Weighted average contractual life remaining for share options outstanding at the period end (years) – –
Weighted average fair value of options granted during the period (£) N/A N/A
Range of exercise prices for options outstanding at the period end (£):
– from 0.81 0.81
– to 0.81 0.81
iii) Conditional Share Award – subject to continuing employment
52 weeks to 27 December 2014
Number
52 weeks to 27 December 2014
WAEP (£)
52 weeks to 28 December 2013
Number
52 weeks to 28 December 2013
WAEP (£)
In issue at beginning of period 1,558,100 – 1,542,800 –
Granted in period 630,800 – 617,000 –
Lapsed in period (148,600) – (142,800) –
Exercised in period (474,600) – (458,900) –
In issue at end of period 1,565,700 – 1,558,100 –
Exercisable at end of period – N/A – N/A
Number of options in the closing balance that were granted before 7 November 2002 – –
Weighted average share price for options exercised during the period 3.74 2.38
Weighted average contractual life remaining for share options outstanding at the period end (years) 1.31 1.23
Weighted average fair value of options granted during the period (£) 3.47 2.14
Range of exercise prices for options outstanding at the period end (£):
– from – –
– to – –

106
Notes to the consolidated financial statements continued
(iv) 2011, 2012, 2013 & 2014 grants – PBT to increase by between 6% – 12%
52 weeks to 27 December 2014
Number
52 weeks to 27 December 2014
WAEP (£)
52 weeks to 28 December 2013
Number
52 weeks to 28 December 2013
WAEP (£)
In issue at beginning of period 2,728,400 1.55 1,972,342 1.18
Granted in period 1,199,454 3.79 867,602 2.38
Lapsed in period (206,704) 1.62 (97,363) 1.40
Exercised in period (573,897) 1.13 (14,181) 1.58
In issue at end of period 3,147,253 2.47 2,728,400 1.55
Exercisable at end of period 347,821 1.09 – N/A
Number of options in the closing balance that were granted before 7 November 2002 – –
Weighted average share price for options exercised during the period 3.60 2.81
Weighted average contractual life remaining for share options outstanding at the period end (years) 1.38 1.21
Weighted average fair value of options granted during the period (£) 1.70 1.00
Range of exercise prices for options outstanding at the period end (£):
– from 1.08 1.09
– to 3.78 2.38 d) Share Incentive Scheme (Freeshares)
52 weeks to 27 December 2014
Number
52 weeks to 27 December 2014
WAEP (£)
52 weeks to 28 December 2013
Number
52 weeks to 28 December 2013
WAEP (£)
In issue at beginning of period 152,515 – 194,639 –
Granted in period – N/A – N/A
Lapsed in period – N/A – N/A
Exercised in period (32,066) – (42,124) –
In issue at end of period 120,449 – 152,515 –
Exercisable at end of period 120,449 – 152,515 –
Number of options in the closing balance that were granted before 7 November 2002 120,449 152,515
Weighted average share price for options exercised during the period 3.43 2.61
Weighted average contractual life remaining for share options outstanding at the period end (years) – –
Weighted average fair value of options granted during the period (£) N/A N/A
Range of exercise prices for options outstanding at the period end (£):
– from – –
– to – –
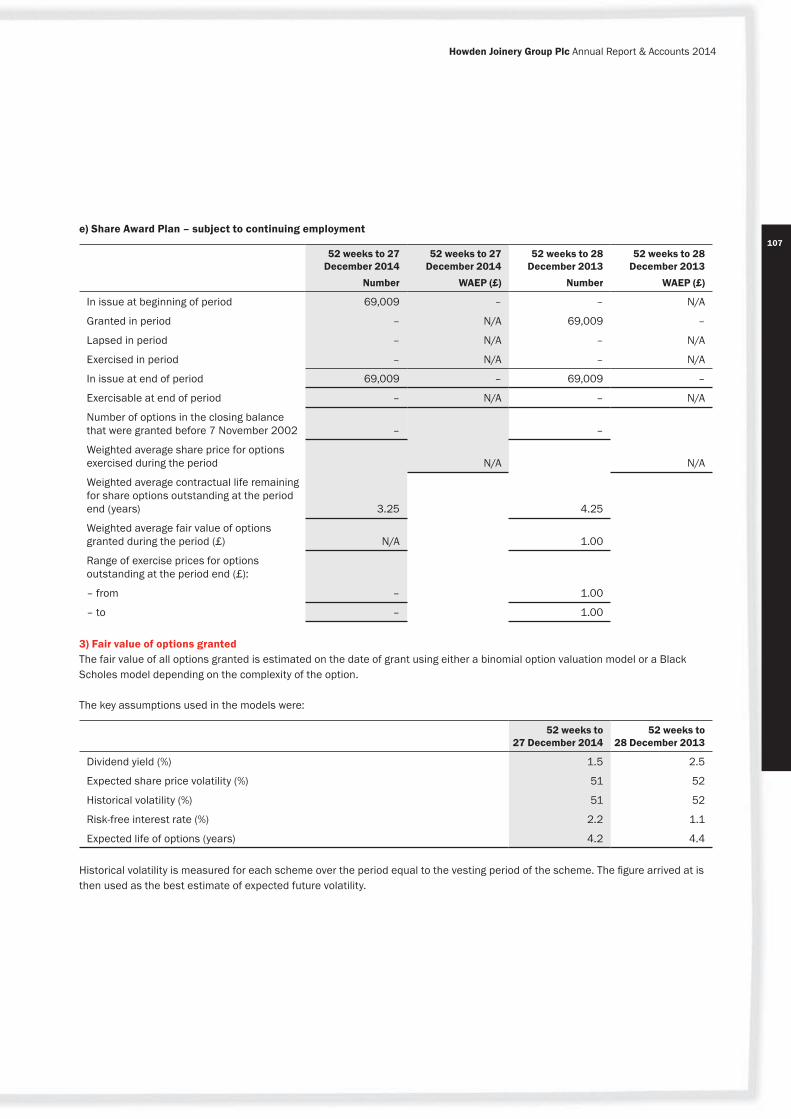
107
Howden Joinery Group Plc Annual Report & Accounts 2014
e) Share Award Plan – subject to continuing employment
52 weeks to 27 December 2014
Number
52 weeks to 27 December 2014
WAEP (£)
52 weeks to 28 December 2013
Number
52 weeks to 28 December 2013
WAEP (£)
In issue at beginning of period 69,009 – – N/A
Granted in period – N/A 69,009 –
Lapsed in period – N/A – N/A
Exercised in period – N/A – N/A
In issue at end of period 69,009 – 69,009 –
Exercisable at end of period – N/A – N/A
Number of options in the closing balance that were granted before 7 November 2002 – –
Weighted average share price for options exercised during the period N/A N/A
Weighted average contractual life remaining for share options outstanding at the period end (years) 3.25 4.25
Weighted average fair value of options granted during the period (£) N/A 1.00
Range of exercise prices for options outstanding at the period end (£):
– from – 1.00
– to – 1.00
3) Fair value of options grantedThe fair value of all options granted is estimated on the date of grant using either a binomial option valuation model or a Black Scholes model depending on the complexity of the option.
The key assumptions used in the models were:
52 weeks to 27 December 2014
52 weeks to 28 December 2013
Dividend yield (%) 1.5 2.5
Expected share price volatility (%) 51 52
Historical volatility (%) 51 52
Risk-free interest rate (%) 2.2 1.1
Expected life of options (years) 4.2 4.4
Historical volatility is measured for each scheme over the period equal to the vesting period of the scheme. The figure arrived at is then used as the best estimate of expected future volatility.

108
Notes to the consolidated financial statements continued
27 RELATED PARTY TRANSACTIONSCompanies which are related partiesTransactions between Group companies, which are related parties, have been eliminated on consolidation and are not disclosed in this note. All transactions between the Group and the Group’s pension schemes have been disclosed in note 21.
Remuneration of key management personnelKey management personnel comprise the Board of Directors (including non-executive directors) and the Executive Committee. Details of the aggregate remuneration to these personnel is set out below. The figure disclosed for share-based payments represents the gain realised on the exercise of share options in the year, albeit that those options will have been granted in previous periods. All figures include any related employer’s National Insurance.
52 weeks to 27 December 2014
52 weeks to 28 December 2013
£m £m
Short-term employment benefits 6.6 6.7
Share-based payments 26.9 21.1
33.5 27.8
Other transactions with key management personnelThere were no other transactions with key management personnel.
28 FINANCIAL RISK MANAGEMENT(a) Capital risk managementThe Group manages its capital structure to maximise the return to shareholders through the optimisation of its debt and equity balance, trading-off the benefits of financial leverage with the expected future costs of financial distress.
The capital structure of the Group consists of debt (including the borrowings disclosed in note 20 offset by cash and short-term investments) and equity attributable to equity holders of the parent (including issued share capital and reserves as disclosed in the Consolidated Statement of Changes in Equity, and in note 23).
The Board of Directors reviews the capital structure regularly, including, but not limited to, at the time of preparing annual budgets, preparing three-year corporate plans, and considering corporate transactions. As part of this review, the Board reviews the cost of capital and the risks associated with each class of capital. The Group will balance its overall capital structure through the payment of dividends, new share issues and share buy-backs, taking on or issuing new debt or repaying any existing debt.
At the period end, the Group had a £140m committed bank facility secured against the assets of the Group and based on three sub-facilities (stock, trade receivables, and a cash flow facility). The facility limit is the lower of £140m and the sum of the sub-facilities. Under the terms of the facility, none of the Group’s principal subsidiary companies can sign up to additional secured borrowings, other than those expressly permitted within the terms of the facility. The facility (i) permits normal trade credit granted to it in the ordinary course of business; (ii) allows up to £10m of additional secured borrowings, and (iii) allows up to £20m of finance lease borrowing. The facility expires in July 2016.

109
Howden Joinery Group Plc Annual Report & Accounts 2014
(b) Significant accounting policiesDetails of the significant accounting policies and methods adopted, including the criteria for recognition, the basis of measurement and the basis on which income and expenses are recognised, in respect of each class of financial asset, financial liability and equity instrument are disclosed in note 2 to the financial statements.
(c) Categories of financial instruments
27 December 2014 £m
28 December 2013 £m
Financial assets (current and non-current)Trade receivables 102.9 96.3 Cash and cash equivalents 131.9 139.7 Current asset investments 85.0 –
Financial liabilities (current and non-current)Trade payables 80.1 70.4 Borrowings (0.8) (0.8)
(d) Financial risk managementGeneral The Group is exposed in varying degrees to a variety of financial instrument related risks. The Board has approved and monitors the risk management processes, including documented treasury policies, counterparty limits, controlling and reporting structures. The types of risk exposure, the way in which such exposure is managed, and the quantification of the level of exposure in the balance sheet is shown below (subcategorised into credit risk, liquidity risk and market risk). The Group is actively engaged in the management of all of these financial risks in order to minimise their potential adverse impact on the Group’s financial performance. The principles, practices and procedures governing the Group-wide financial risk management process have been approved by the Board and are overseen by the Executive Committee. In turn, the Executive Committee delegates authority to a central treasury function (‘Group Treasury’) for the practical implementation of the financial risk management process across the Group and for ensuring that the Group’s entities adhere to specified financial risk management policies. Group Treasury regularly reassesses and reports on the financial risk environment, identifying and evaluating financial risks. The Group does not take positions on derivative contracts and only enters into contractual bank deposit or lending arrangements with counterparties that have investment grade credit ratings.

110
Notes to the consolidated financial statements continued
Cash and cash equivalentsCash at bank and in hand, which is the term used in the balance sheet, comprises cash on hand together with demand deposits, and other short-term highly liquid investments that are readily convertible to a known amount of cash and are subject to an insignificant risk of changes in value. Cash and cash equivalents, which is the term used in the cash flow statement, comprises cash at bank and in hand, as defined immediately above, together with any overdrafts repayable on demand and current asset investments.
Arrangements are in place to ensure that cash is utilised most efficiently for the ongoing working capital needs of the Group’s operating units and to ensure that the Group earns the most advantageous rates of interest available. The prime consideration in the investment of cash balances is the security of the asset, followed by liquidity and then yield. Current asset investments consist of UK Government Treasury Bills with an initial term to maturity of up to three months. Theseinvestments are held to maturity and, whilst of lower liquidity than cash, will ensure that the primary Group policy objective of asset security is met.
Management of trade receivables is discussed in note 18.
(e) Credit riskThe Group’s principal financial assets are cash, investments, and trade and other receivables. The Group’s credit risk is mainly confined to the risk of customers defaulting on sales invoices raised. The Group has adopted a policy of only dealing with creditworthy counterparties as a way of mitigating the risk of financial loss from defaults. The Group’s policy on dealing with trade customers is described in the accounting policies and in note 18. Trade receivables consist of a large number of customers. Ongoing credit evaluation is performed on the financial condition of accounts receivable. The Group does not have any significant credit risk exposure to any single counterparty. The Group limits exposure to credit risk on liquid funds and investments through adherence to a policy of minimum short-term counterparty credit ratings assigned by international credit-rating agencies (Standard & Poor’s A-2 and Moody’s P-1). Full disclosure of the Group’s maximum exposure to credit risk is presented in the following table:
27 December 2014£m
28 December 2013£m
Trade receivables (net of allowance) 102.9 96.3
Cash 131.9 139.7
Current asset investments 85.0 –
Total credit risk exposure 319.8 236.0

111
Howden Joinery Group Plc Annual Report & Accounts 2014
(f) Liquidity riskLiquidity risk is the risk that the Group could experience difficulties in meeting its commitments to creditors as financial liabilities fall due for payment. The Group manages its liquidity risk by using reasonable and retrospectively-assessed assumptions to forecast the future cash-generative capabilities and working capital requirements of the businesses it operates and by maintaining sufficient cash and investment reserves, committed borrowing facilities and other credit lines as appropriate. Ultimate responsibility for liquidity risk management rests with the Board of Directors, which has agreed an appropriate liquidity risk management framework for the management of the Group’s short, medium and long-term funding and liquidity management requirements. The Group manages liquidity risk by maintaining adequate reserves, banking facilities and reserve borrowing facilities by continuously monitoring forecast and actual cash flows and matching the maturity profiles of financial assets and liabilities as far as is possible. Included in note 20 is a description of additional undrawn facilities that the Group has at its disposal to further reduce liquidity risk. In addition, the Financial Review contains a section describing the interaction of liquidity risk and the going concern review. Maturity profile of outstanding financial liabilities The following tables detail the Group’s remaining contractual maturity for its non-derivative financial liabilities. The Group has no derivative financial liabilities. The tables have been drawn up on the undiscounted cash flows of financial liabilities based on the earliest date on which the Group can be required to pay. The table includes both interest and principal cash flows.
At 27 December 2014
Within 1 year 2–3 years
Total£m
Capital£m
Floating interest
£m
Fixed interest
£mCapital
£m
Floating interest
£m
Fixed interest
£m
Trade payables 80.1 – – – – – 80.1
Finance leases – – – 0.1 – – 0.1
80.1 – – 0.1 – – 80.2
At 28 December 2013
Within 1 year 2–3 years
Total£m
Capital£m
Floating interest
£m
Fixed interest
£mCapital
£m
Floating interest
£m
Fixed interest
£m
Trade payables 70.4 – – – – – 70.4
Finance leases 0.1 – – 0.1 – – 0.2
Bank loan 0.4 – – – – – 0.4
70.9 – – 0.1 – – 71.0
Note: it has been assumed that, where applicable, interest and foreign currency exchange rates prevailing at the reporting balance sheet date will not vary over the time periods remaining for future cash flows.

112
Notes to the consolidated financial statements continued
(g) Market riskThis is the risk that financial instrument fair values will fluctuate owing to changes in market prices. The significant market risks to which the Group is exposed are foreign exchange risk, and interest rate risk. These are discussed further below: Foreign exchange risk The Group is exposed to foreign exchange risk, principally as a result of operating costs incurred in foreign currencies, and to a lesser extent, from non-Sterling revenues. The Group’s policy is generally not to hedge such exposures. The exposure of the Group’s financial assets and liabilities to currency risk is as follows:
27 December 2014£m
28 December 2013£m
Euro
Trade receivables 1.6 1.7
Other receivables 0.8 0.6
Cash and cash equivalents 4.4 5.5
Trade payables (16.5) (16.4)
Other payables (0.8) (0.7)
(10.5) (9.3)
US Dollar
Cash and cash equivalents – 3.9
Trade payables (0.8) (3.8)
(0.8) 0.1
Hong Kong Dollar
Cash and cash equivalents – 0.3
– 0.3
TOTAL (11.3) (8.9)
Interest rate risk The Group does not have any significant exposure to interest rate risk.
Payments on the Group’s finance leases are fixed on inception of the lease contract, and as such are regarded as fixed rate borrowings.

113
Howden Joinery Group Plc Annual Report & Accounts 2014
(h) Financial instrument sensitivitiesFinancial instruments affected by market risk include borrowings, deposits, trade receivables and trade payables. The following analysis, required by IFRS 7, is intended to illustrate the sensitivity of the Group’s financial instruments as at its year end to changes in market variables, being exchange rates and interest rates. The sensitivity analysis has been prepared on the basis that the components of net debt and the proportion of financial instruments in foreign currencies are all constant. For floating rate liabilities, the analysis is prepared assuming that the amount of liability outstanding at the year end date was outstanding for the whole year. As a consequence, this sensitivity analysis relates to the position as at the balance sheet date. The following assumptions were made in calculating the sensitivity analysis:
• Debt and other deposits are carried at amortised cost and therefore carrying value does not change as interest rates move.
• No sensitivity is provided for accrued interest as accruals are based on pre-agreed interest rates and therefore are not susceptible to further rate movements.
• Finance lease interest payments are fixed at the inception of the contract and are not subject to repricing. They have therefore been excluded from this analysis.
• Translation of foreign subsidiaries and operations into the Group’s presentation currency have been excluded from the sensitivity.
Using the above assumptions, the following analyses show the illustrative effect on the income statement and equity that would result from reasonably possible changes in the relevant foreign currency or interest rates:
Interest rate sensitivityThe sensitivity analysis below has been determined based on the exposure to interest rates for floating rate non-derivative instruments at the balance sheet date. The Group holds no derivative financial instruments. Fixed rate liabilities are not susceptible to changes in interest rates, and are omitted from the analysis below. For floating rate liabilities, the analysis is prepared assuming the amount of the liability outstanding at the balance sheet date was outstanding for the whole year. A 50 basis points increase is used as this represents management’s assessment of the possible change in interest rates. At the reporting date, if interest rates had been 50 basis points higher and all other variables were held constant, the Group’s net profit and profit and loss reserve would remain the same (2013: remain the same). For a decrease of 50 basis points, the current year figures would remain the same (2013: remain the same).
Foreign exchange sensitivityAs noted above, the Group is mainly exposed to movements in Euro, and US dollar exchange rates. The following information details the Group’s sensitivity to a 10% weakening or strengthening in pounds Sterling against the Euro, and the US Dollar. These percentages are the rates used by management when assessing sensitivities internally and represent management’s assessment of the possible change in foreign currency rates. The sensitivity analysis of the Group’s exposure to foreign currency risk at the reporting date has been determined based on the change taking place at the end of the financial period, and based on the outstanding foreign currency balances at the period end.
27 December 2014£m
28 December 2013£m
10% weakening of Sterling to Euro (1.2) (1.0)
10% strengthening of Sterling to Euro 1.0 0.8
10% weakening of Sterling to US dollar (0.1) –
10% strengthening of Sterling to US dollar 0.1 –
The Group’s sensitivity, on the basis above, to a strengthening or weakening of Sterling to the Hong Kong Dollar was less than £0.1m at both the current and prior period ends.

114
Notes to the consolidated financial statements continued
29 DISCONTINUED OPERATIONS There were no discontinued operations in the prior period.All discontinued operations in the current period are discontinued exceptional items, and are analysed as follows:
Note
52 weeks to 27 December 2014
£m
Increase to discontinued operations property provision (a) (2.2)
Release of discontinued interest accrual (b) 0.1
Exceptional item – loss on discontinued operations (2.1)
Release of tax creditor for discontinued operations (c) 11.1
Tax credit on increase to discontinued operations property provision (a) 0.1
Exceptional profit after tax 9.1
(a) Increase to discontinued property provisionsDuring the current period, we have increased the provision for our remaining legacy properties.
(b) Release of discontinued interest accrualIn prior periods, the Group had been accruing for possible interest which would be due in relation to overdue tax in the event that we were unsuccessful in our dispute with HMRC relating to discontinued operations (see (c) below). Following the partial resolution of this dispute in the current period, we now have certainty that some of this accrual will no longer be needed. We have therefore released this amount in the current period.
(c) Release of tax creditor for discontinued operationsDuring the current period, we received a First Tier Tribunal judgement which gave a partial resolution of a dispute with HMRC, regarding the tax treatment of certain expenses relating to our legacy properties which had been incurred in prior periods.
In prior years, we had prepared our tax computations for accounts purposes on the basis that the disputed expense items would not be deductible for tax, and we provided for tax on that basis. Now that the judgement has given us certainty that particular expenses may be treated as deductible for tax, we are recognising a credit of £11.1m of tax in the current period.
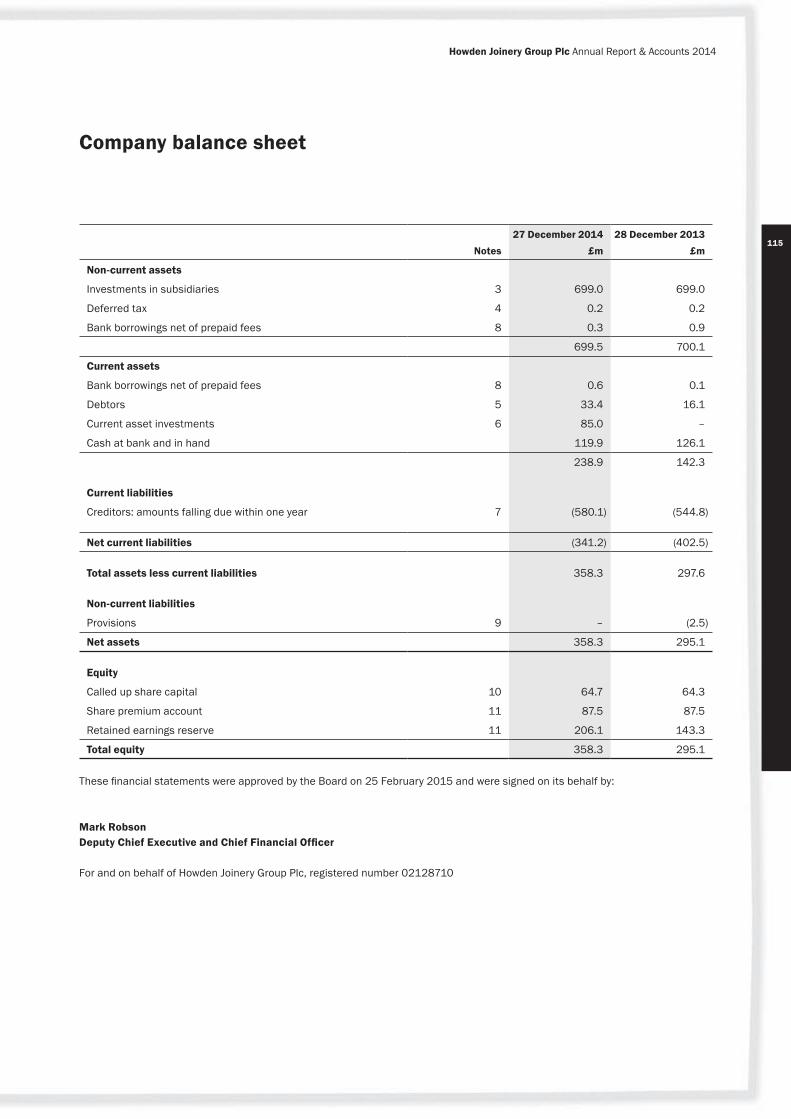
115
Howden Joinery Group Plc Annual Report & Accounts 2014
Notes27 December 2014
£m28 December 2013
£m
Non-current assets
Investments in subsidiaries 3 699.0 699.0
Deferred tax 4 0.2 0.2
Bank borrowings net of prepaid fees 8 0.3 0.9
699.5 700.1
Current assets
Bank borrowings net of prepaid fees 8 0.6 0.1
Debtors 5 33.4 16.1
Current asset investments 6 85.0 –
Cash at bank and in hand 119.9 126.1
238.9 142.3
Current liabilities
Creditors: amounts falling due within one year 7 (580.1) (544.8)
Net current liabilities (341.2) (402.5)
Total assets less current liabilities 358.3 297.6
Non-current liabilities
Provisions 9 – (2.5)
Net assets 358.3 295.1
Equity
Called up share capital 10 64.7 64.3
Share premium account 11 87.5 87.5
Retained earnings reserve 11 206.1 143.3
Total equity 358.3 295.1
These financial statements were approved by the Board on 25 February 2015 and were signed on its behalf by:
Mark RobsonDeputy Chief Executive and Chief Financial Officer
For and on behalf of Howden Joinery Group Plc, registered number 02128710
Company balance sheet

116
Notes to the Company balance sheet
1 SIGNIFICANT COMPANY ACCOUNTING POLICIESGeneral informationHowden Joinery Group Plc is a company incorporated in the United Kingdom under the Companies Act 2006.
Basis of presentationThe Company’s accounting period covers the 52 weeks to 27 December 2014. The comparative period covered the 52 weeks to 28 December 2013.
Basis of accountingThe separate financial statements of the Company are presented as required by the Companies Act 2006. They have been prepared under the historical cost convention and in accordance with applicable United Kingdom law and United Kingdom Generally Accepted Accounting Standards. The principal accounting policies are presented below and have been applied consistently throughout the current and prior periods. They have also been prepared on the going concern basis as described in the going concern statement in the Statement of the directors in connection with this Annual Report and Accounts on page 66.
Investments in subsidiariesThese investments are shown at cost less provision for impairment.
Current asset investmentsFrom time to time, the Company uses short-term investments in UK Gilts as part of its cash management activities. The Company reviews these investments before entering into them, and, after establishing that the Company has both the intention and the ability to hold these investments to maturity, they are classified as held-to-maturity and are initially recognised at cost, including any transaction fees.
Subsequent to initial recognition, these investments are carried at amortised cost using the effective interest method. Income from these investments is recognised in the income statement on an effective yield basis.
TaxationCurrent tax, including UK corporation tax and foreign tax, is provided at amounts expected to be paid (or recovered) using the tax rates and laws that have been enacted or substantively enacted by the balance sheet date.
Cash flow statementThe Company is exempt from the requirement of FRS 1 (revised) to include a cash flow statement as part of its Company financial statements because it prepares a consolidated cash flow statement which is shown as part of the consolidated Group accounts.
Related partiesThe Company has taken advantage of paragraph 3(c) of FRS 8 (“Related Party Disclosures”) not to disclose transactions with Group entities or investees of the Group qualifying as related parties.
2 PROFIT AND LOSS ACCOUNTAs permitted by section 408 of the Companies Act 2006, no separate profit and loss account is presented for the Company. The Company result after tax for the 52 weeks to 27 December 2014 was a profit of £104.2m (52 weeks to 28 December 2013: profit after tax for the period of £101.8m).
The Company has no employees (2013: none), did not pay directors’ emoluments (2013: £nil), and the fees payable to the Company’s auditor for the audit of the Company’s annual accounts (£10,000 in both current and prior periods) were borne by a fellow Group undertaking.
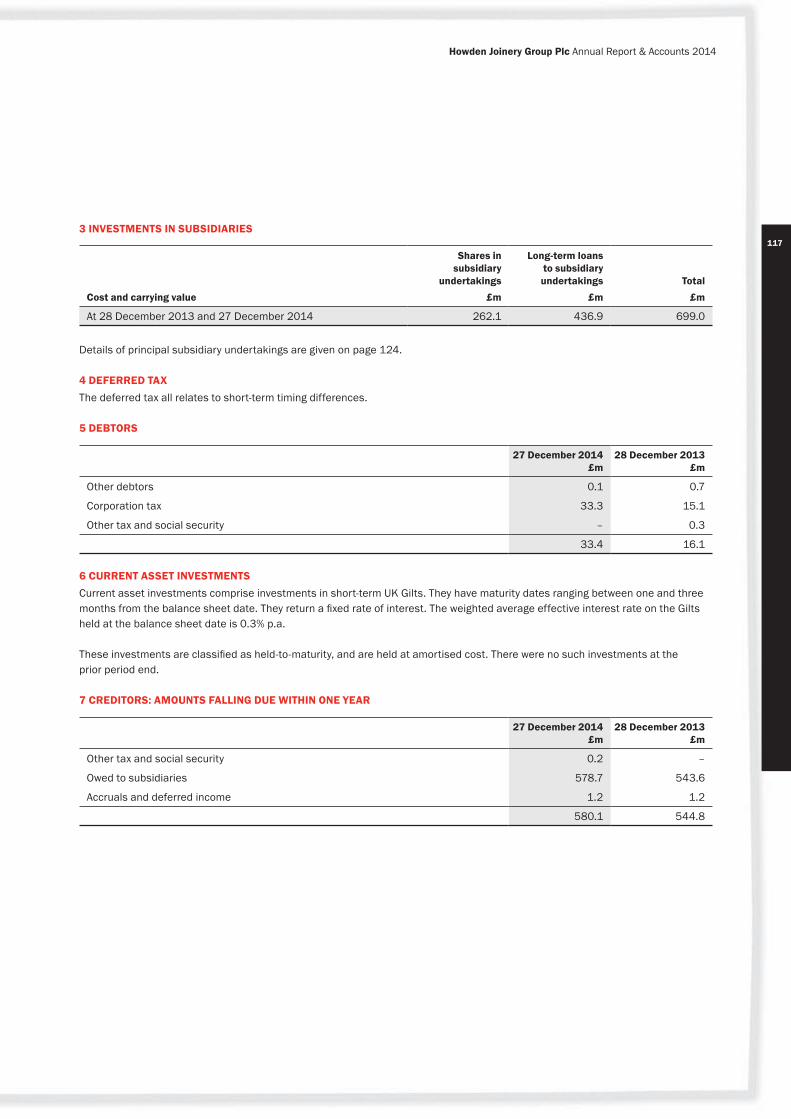
117
Howden Joinery Group Plc Annual Report & Accounts 2014
3 INVESTMENTS IN SUBSIDIARIES
Cost and carrying value
Shares in subsidiary
undertakings£m
Long-term loans to subsidiary undertakings
£mTotal
£m
At 28 December 2013 and 27 December 2014 262.1 436.9 699.0
Details of principal subsidiary undertakings are given on page 124.
4 DEFERRED TAX The deferred tax all relates to short-term timing differences.
5 DEBTORS
27 December 2014 £m
28 December 2013 £m
Other debtors 0.1 0.7
Corporation tax 33.3 15.1
Other tax and social security – 0.3
33.4 16.1
6 CURRENT ASSET INVESTMENTSCurrent asset investments comprise investments in short-term UK Gilts. They have maturity dates ranging between one and three months from the balance sheet date. They return a fixed rate of interest. The weighted average effective interest rate on the Gilts held at the balance sheet date is 0.3% p.a.
These investments are classified as held-to-maturity, and are held at amortised cost. There were no such investments at the prior period end.
7 CREDITORS: AMOUNTS FALLING DUE WITHIN ONE YEAR
27 December 2014 £m
28 December 2013 £m
Other tax and social security 0.2 –
Owed to subsidiaries 578.7 543.6
Accruals and deferred income 1.2 1.2
580.1 544.8
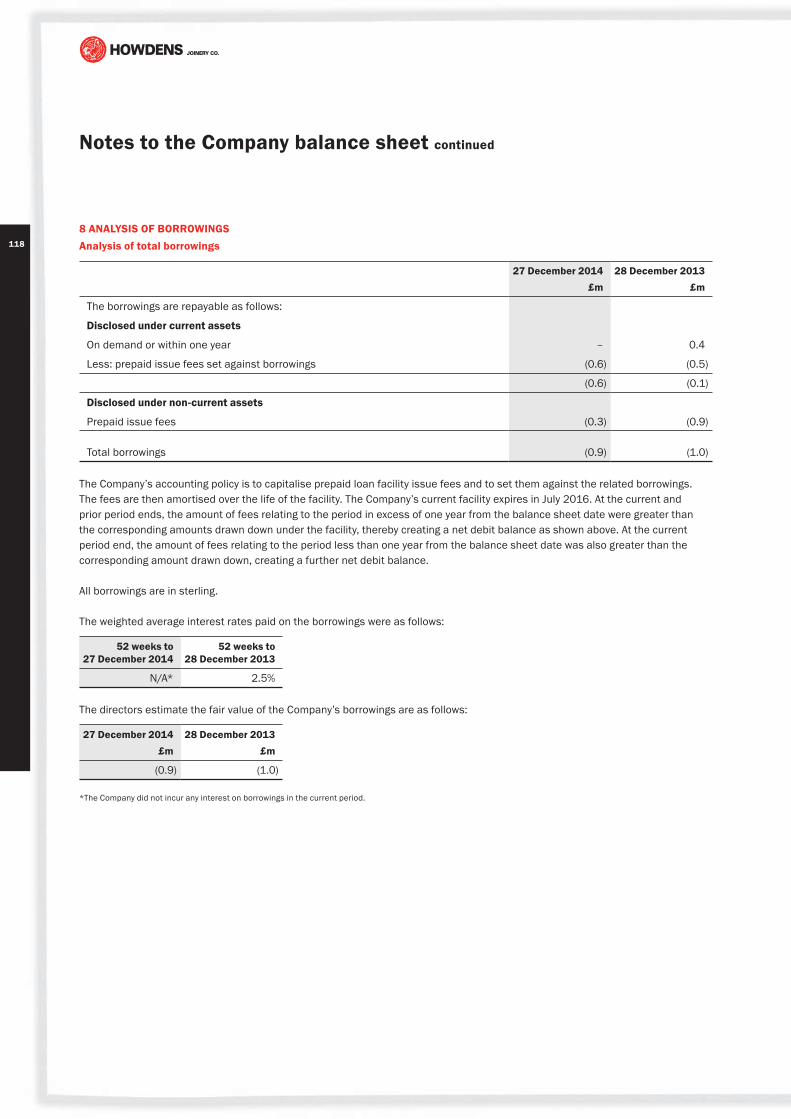
118
Notes to the Company balance sheet continued
8 ANALYSIS OF BORROWINGSAnalysis of total borrowings
27 December 2014£m
28 December 2013£m
The borrowings are repayable as follows:
Disclosed under current assets
On demand or within one year – 0.4
Less: prepaid issue fees set against borrowings (0.6) (0.5)
(0.6) (0.1)
Disclosed under non-current assets
Prepaid issue fees (0.3) (0.9)
Total borrowings (0.9) (1.0)
The Company’s accounting policy is to capitalise prepaid loan facility issue fees and to set them against the related borrowings. The fees are then amortised over the life of the facility. The Company’s current facility expires in July 2016. At the current and prior period ends, the amount of fees relating to the period in excess of one year from the balance sheet date were greater than the corresponding amounts drawn down under the facility, thereby creating a net debit balance as shown above. At the current period end, the amount of fees relating to the period less than one year from the balance sheet date was also greater than the corresponding amount drawn down, creating a further net debit balance.
All borrowings are in sterling.
The weighted average interest rates paid on the borrowings were as follows:
52 weeks to 27 December 2014
52 weeks to 28 December 2013
N/A* 2.5%
The directors estimate the fair value of the Company’s borrowings are as follows:
27 December 2014 £m
28 December 2013 £m
(0.9) (1.0)
*The Company did not incur any interest on borrowings in the current period.

119
Howden Joinery Group Plc Annual Report & Accounts 2014
9 PROVISIONS
Property provision£m
Total £m
At 28 December 2013 2.5 2.5
Additional provision in the period 1.3 1.3
Utilisation of provision in the period (3.7) (3.7)
Release of provision in the period (0.1) (0.1)
At 27 December 2014 – –
The property provision covers two main areas: (i) onerous leases on any non-trading leased properties, and (ii) obligations to make dilapidations payments to landlords of leased properties.
The amount of the expected future cash flows has been adjusted to reflect the expected range of possibilities. The timing of outflows from the provision is variable, and is dependent on property lease expiry dates, on opportunities to surrender leases, and on the timing of dilapidations assessments and works.
10 SHARE CAPITAL
ORDINARY SHARES OF 10p EACH
52 weeks to 27 December 2014
Number
52 weeks to 28 December 2013
Number
52 weeks to 27 December 2014
£m
52 weeks to 28 December 2013
£m
Allotted, called up and fully paid
Balance at the beginning of the period 642,782,361 642,016,063 64.3 64.2
Issued during the period 3,759,135 766,298 0.4 0.1
Balance at the beginning and end of the period 646,541,496 642,782,361 64.7 64.3
11 RECONCILIATION OF MOVEMENTS IN EQUITY SHAREHOLDERS’ FUNDS
Called up share capital
£m
Share premium account
£m
Retained earnings
£mTotal
£m
At 28 December 2013 64.3 87.5 143.3 295.1
Retained profit for the period – – 104.2 104.2
Dividend paid – – (41.0) (41.0)
Shares issued 0.4 – (0.4) –
At 27 December 2014 64.7 87.5 206.1 358.3
120Opinion on financial statements of Howden Joinery Group Plc
In our opinion:
• the financial statements give a true and fair view of the state of the Group’s and of the parent company’s affairs as at 27 December 2014 and of the Group’s profit for the 52 weeks then ended;
• the Group financial statements have been properly prepared in accordance with International Financial Reporting Standards (IFRSs) as adopted by the European Union;
• the parent company financial statements have been properly prepared in accordance with United Kingdom Generally Accepted Accounting Practice; and
• the financial statements have been prepared in accordance with the requirements of the Companies Act 2006 and, as regards the Group financial statements, Article 4 of the IAS Regulation.
The financial statements comprise the Consolidated Income Statement, the Consolidated Statement of Comprehensive Income, the Consolidated Balance Sheet, the Consolidated Statement of Changes in Equity, the Consolidated Cash Flow Statement and the related notes 1 to 29. This also comprises the Parent Company Balance Sheet and related notes 1 to 11. The financial reporting framework that has been applied in the preparation of the Group financial statements is applicable law and IFRSs as adopted by the European Union. The financial reporting framework that has been applied in the preparation of the Parent Company financial statements is applicable law and United Kingdom Accounting Standards (United Kingdom Generally Accepted Accounting Practice).
Going concern As required by the Listing Rules we have reviewed the directors’ statement on page 66 that the Group is a going concern. We confirm that:
• we have concluded that the directors’ use of the going concern basis of accounting in the preparation of the financial statements is appropriate; and
• we have not identified any material uncertainties that may cast significant doubt on the Group’s ability to continue as a going concern.
However, because not all future events or conditions can be predicted, this statement is not a guarantee as to the Group’s ability to continue as a going concern.
Independent auditor’s report to the members of Howden Joinery Group Plc
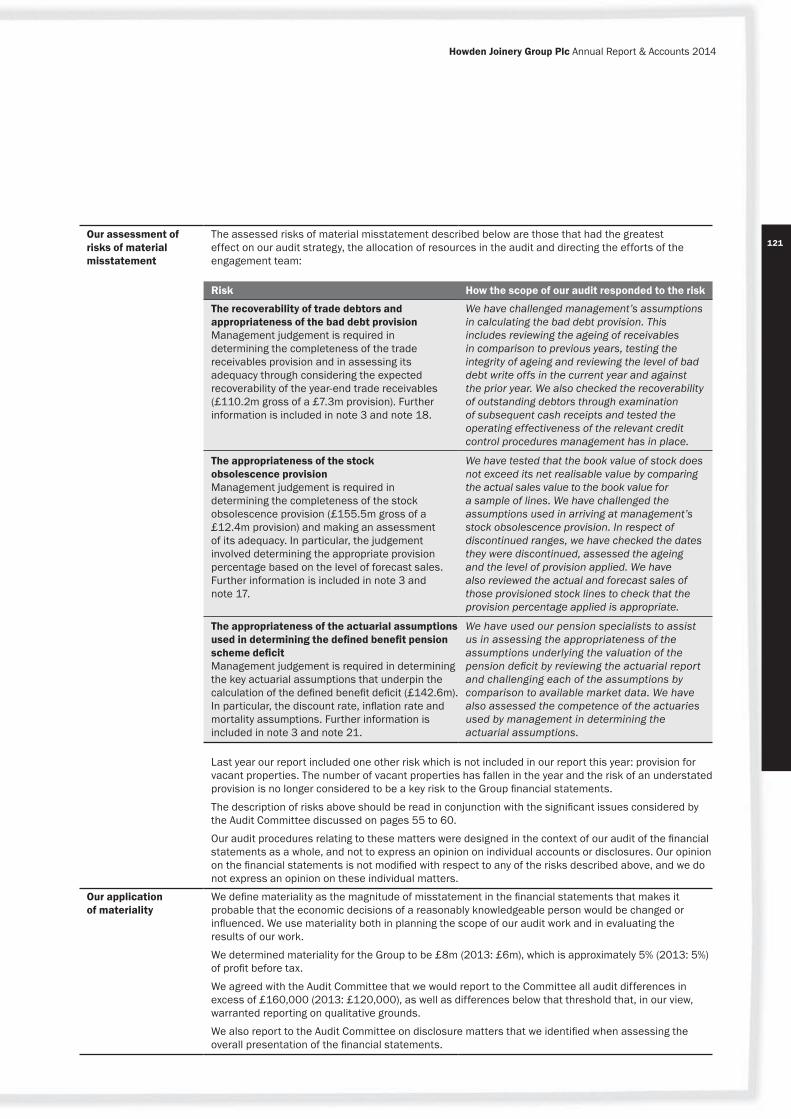
121
Howden Joinery Group Plc Annual Report & Accounts 2014
Our assessment of risks of material misstatement
The assessed risks of material misstatement described below are those that had the greatest effect on our audit strategy, the allocation of resources in the audit and directing the efforts of the engagement team:
Risk How the scope of our audit responded to the risk
The recoverability of trade debtors and appropriateness of the bad debt provisionManagement judgement is required in determining the completeness of the trade receivables provision and in assessing its adequacy through considering the expected recoverability of the year-end trade receivables (£110.2m gross of a £7.3m provision). Further information is included in note 3 and note 18.
We have challenged management’s assumptions in calculating the bad debt provision. This includes reviewing the ageing of receivables in comparison to previous years, testing the integrity of ageing and reviewing the level of bad debt write offs in the current year and against the prior year. We also checked the recoverability of outstanding debtors through examination of subsequent cash receipts and tested the operating effectiveness of the relevant credit control procedures management has in place.
The appropriateness of the stock obsolescence provision Management judgement is required in determining the completeness of the stock obsolescence provision (£155.5m gross of a £12.4m provision) and making an assessment of its adequacy. In particular, the judgement involved determining the appropriate provision percentage based on the level of forecast sales. Further information is included in note 3 and note 17.
We have tested that the book value of stock does not exceed its net realisable value by comparing the actual sales value to the book value for a sample of lines. We have challenged the assumptions used in arriving at management’s stock obsolescence provision. In respect of discontinued ranges, we have checked the dates they were discontinued, assessed the ageing and the level of provision applied. We have also reviewed the actual and forecast sales of those provisioned stock lines to check that the provision percentage applied is appropriate.
The appropriateness of the actuarial assumptions used in determining the defined benefit pension scheme deficit Management judgement is required in determining the key actuarial assumptions that underpin the calculation of the defined benefit deficit (£142.6m). In particular, the discount rate, inflation rate and mortality assumptions. Further information is included in note 3 and note 21.
We have used our pension specialists to assist us in assessing the appropriateness of the assumptions underlying the valuation of the pension deficit by reviewing the actuarial report and challenging each of the assumptions by comparison to available market data. We have also assessed the competence of the actuaries used by management in determining the actuarial assumptions.
Last year our report included one other risk which is not included in our report this year: provision for vacant properties. The number of vacant properties has fallen in the year and the risk of an understated provision is no longer considered to be a key risk to the Group financial statements.
The description of risks above should be read in conjunction with the significant issues considered by the Audit Committee discussed on pages 55 to 60.
Our audit procedures relating to these matters were designed in the context of our audit of the financial statements as a whole, and not to express an opinion on individual accounts or disclosures. Our opinion on the financial statements is not modified with respect to any of the risks described above, and we do not express an opinion on these individual matters.
Our application of materiality
We define materiality as the magnitude of misstatement in the financial statements that makes it probable that the economic decisions of a reasonably knowledgeable person would be changed or influenced. We use materiality both in planning the scope of our audit work and in evaluating the results of our work.
We determined materiality for the Group to be £8m (2013: £6m), which is approximately 5% (2013: 5%) of profit before tax.
We agreed with the Audit Committee that we would report to the Committee all audit differences in excess of £160,000 (2013: £120,000), as well as differences below that threshold that, in our view, warranted reporting on qualitative grounds.
We also report to the Audit Committee on disclosure matters that we identified when assessing the overall presentation of the financial statements.

122
Independent auditor’s report to the members of Howden Joinery Group Plc continued
An overview of the scope of our audit
Our Group audit was scoped by obtaining an understanding of the Group and its environment, including Group-wide controls, and assessing the risks of material misstatement at the Group level. Based on that assessment, our Group audit scope focused on the UK, French and Belgian trading entities and each of the Head Office companies which was consistent with the prior year. All of these entities were subject to a full scope audit and this gave us coverage of 100% of the Group’s net assets, revenues and profit before tax for the 52 weeks ended 27 December 2014. Audits of all locations are performed at a materiality level determined by reference to a proportion of Group materiality appropriate to the relative scale of the business concerned. The materiality levels used ranged between 50% and 95% of Group materiality.
Opinion on other matters prescribed by the Companies Act 2006
In our opinion:
• the part of the Directors’ Remuneration Report to be audited has been properly prepared in accordance with the Companies Act 2006; and
• the information given in the Strategic Report and the Directors’ Report for the financial year for which the financial statements are prepared is consistent with the financial statements.
Matters on which we are required to report by exception
Adequacy of explanations received and accounting records
Under the Companies Act 2006 we are required to report to you if, in our opinion:
• we have not received all the information and explanations we require for our audit; or
• adequate accounting records have not been kept by the parent company, or returns adequate for our audit have not been received from branches not visited by us; or
• the parent company financial statements are not in agreement with the accounting records and returns.
We have nothing to report in respect of these matters.
Directors’ remuneration
Under the Companies Act 2006 we are also required to report if in our opinion certain disclosures of directors’ remuneration have not been made or the part of the Directors’ Remuneration Report to be audited is not in agreement with the accounting records and returns. We have nothing to report arising from these matters.
Corporate Governance Statement
Under the Listing Rules we are also required to review the part of the Corporate Governance Statement relating to the Company’s compliance with ten provisions of the UK Corporate Governance Code. We have nothing to report arising from our review.
Our duty to read other information in the Annual Report
Under International Standards on Auditing (UK and Ireland), we are required to report to you if, in our opinion, information in the Annual Report is:
• materially inconsistent with the information in the audited financial statements; or
• apparently materially incorrect based on, or materially inconsistent with, our knowledge of the Group acquired in the course of performing our audit; or
• otherwise misleading.
In particular, we are required to consider whether we have identified any inconsistencies between our knowledge acquired during the audit and the directors’ statement that they consider the Annual Report is fair, balanced and understandable and whether the Annual Report appropriately discloses those matters that we communicated to the Audit Committee which we consider should have been disclosed. We confirm that we have not identified any such inconsistencies or misleading statements.

123
Howden Joinery Group Plc Annual Report & Accounts 2014
Respective responsibilities of directors and auditor
As explained more fully in the Directors’ Responsibilities Statement, the directors are responsible for the preparation of the financial statements and for being satisfied that they give a true and fair view. Our responsibility is to audit and express an opinion on the financial statements in accordance with applicable law and International Standards on Auditing (UK and Ireland). Those standards require us to comply with the Auditing Practices Board’s Ethical Standards for Auditors.
We also comply with International Standard on Quality Control 1 (UK and Ireland). Our audit methodology and tools aim to ensure that our quality control procedures are effective, understood and applied. Our quality controls and systems include our dedicated professional standards review team and independent partner reviews.
This report is made solely to the Company’s members, as a body, in accordance with Chapter 3 of Part 16 of the Companies Act 2006. Our audit work has been undertaken so that we might state to the Company’s members those matters we are required to state to them in an auditor’s report and for no other purpose. To the fullest extent permitted by law, we do not accept or assume responsibility to anyone other than the Company and the Company’s members as a body, for our audit work, for this report, or for the opinions we have formed.
Scope of the audit of the financial statements
An audit involves obtaining evidence about the amounts and disclosures in the financial statements sufficient to give reasonable assurance that the financial statements are free from material misstatement, whether caused by fraud or error. This includes an assessment of: whether the accounting policies are appropriate to the Group’s and the parent company’s circumstances and have been consistently applied and adequately disclosed; the reasonableness of significant accounting estimates made by the directors; and the overall presentation of the financial statements. In addition, we read all the financial and non-financial information in the Annual Report to identify material inconsistencies with the audited financial statements and to identify any information that is apparently materially incorrect based on, or materially inconsistent with, the knowledge acquired by us in the course of performing the audit. If we become aware of any apparent material misstatements or inconsistencies we consider the implications for our report.
Edward Hanson (Senior Statutory Auditor)for and on behalf of Deloitte LLPChartered Accountants and Statutory AuditorLondonUnited Kingdom 25 February 2015
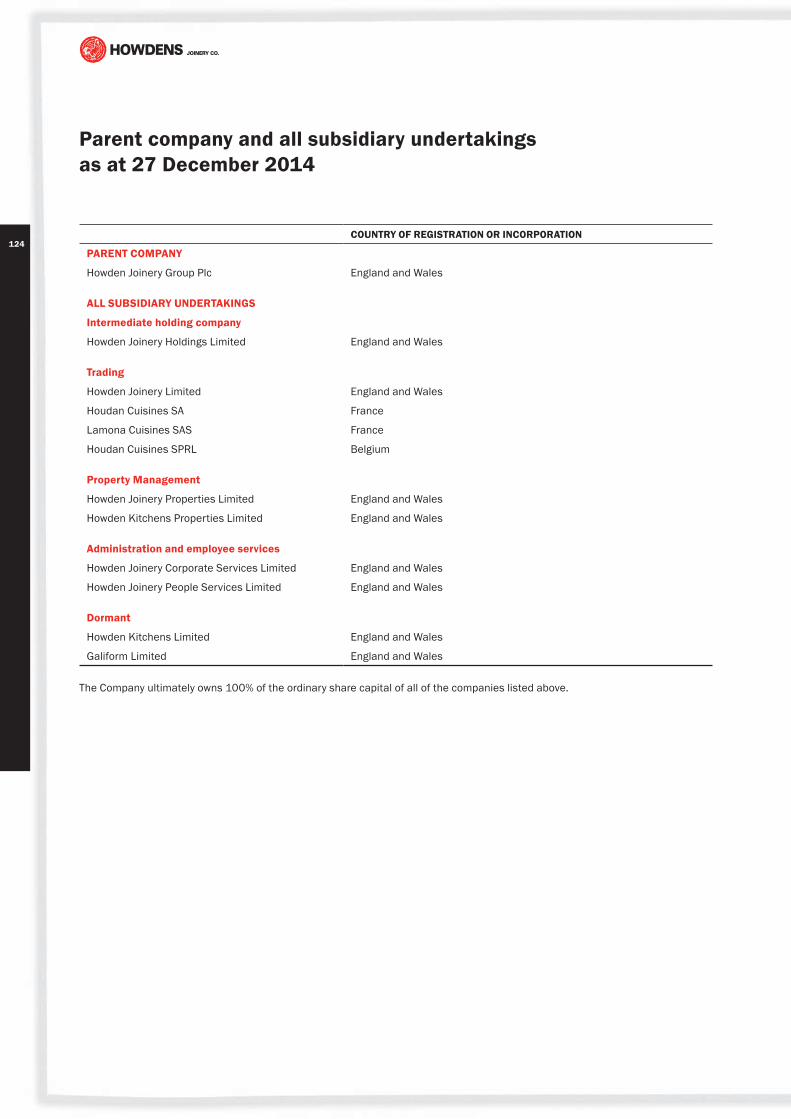
124
Parent company and all subsidiary undertakings as at 27 December 2014
COUNTRY OF REGISTRATION OR INCORPORATION
PARENT COMPANY
Howden Joinery Group Plc England and Wales
ALL SUBSIDIARY UNDERTAKINGS
Intermediate holding company
Howden Joinery Holdings Limited England and Wales
Trading
Howden Joinery Limited England and Wales
Houdan Cuisines SA France
Lamona Cuisines SAS France
Houdan Cuisines SPRL Belgium
Property Management
Howden Joinery Properties Limited England and Wales
Howden Kitchens Properties Limited England and Wales
Administration and employee services
Howden Joinery Corporate Services Limited England and Wales
Howden Joinery People Services Limited England and Wales
Dormant
Howden Kitchens Limited England and Wales
Galiform Limited England and Wales
The Company ultimately owns 100% of the ordinary share capital of all of the companies listed above.

125
Howden Joinery Group Plc Annual Report & Accounts 2014
Five year record
Dec 2014 52 weeks
£m
Dec 2013 52 weeks
£m
Dec 2012 53 weeks
£m
Dec 2011 52 weeks
£m
Dec 2010 52 weeks
£m
Summarised income statement
Revenue – continuing operations 1,090.8 956.5 887.1 853.8 807.9
Operating profit – continuing operations 189.8 138.0 119.8 115.3 107.4
Loss from discontinued operations (2.1) – (4.4) (9.3) –
187.7 138.0 115.4 106.0 107.4
Profit on continuing ordinary activities before tax 188.8 133.9 112.1 111.0 100.9
Full year dividend per share (pence) 8.4 5.5 3.0 0.5 –
Basic EPS – continuing operations (pence) 23.2 15.7 15.3 13.5 11.1
Summarised balance sheet
Total non-current assets 151.1 123.3 140.4 132.3 140.2
Inventories 143.1 123.4 115.9 118.5 105.5
Receivables 133.1 122.4 96.0 95.3 95.0
Payables and provisions (207.2) (192.6) (180.4) (196.1) (216.9)
Pension liability (142.6) (54.3) (154.5) (136.9) (135.7)
(73.6) (1.1) (123.0) (119.2) (152.1)
Net cash, short-term investments and borrowings 217.4 139.5 95.4 57.1 35.0
Total net assets 294.9 261.7 112.8 70.2 23.1
Number of depots at end of year
UK 589 559 529 509 489
France 12 11 11 10 10
Belgium 2 – – – –
Capital expenditure 33 25 24 20 18

126
Shareholder ranges as at 27 December 2014
Number of holders
Percentage of holders
Number of shares
Percentage of shares
Corporate holders
0 to 1,000 147 1.6 64,440 –
1,001 to 5,000 241 2.7 607,579 0.1
5,001 to 10,000 66 0.7 479,091 0.1
10,001 to 50,000 121 1.4 3,260,519 0.5
50,001 to 100,000 67 0.8 4,601,279 0.7
100,001 to 250,000 82 0.9 13,226,855 2.1
250,001 to max 237 2.6 611,081,926 94.5
961 10.7 633,321,689 98.0
Individual holders
0 to 1,000 6,321 70.4 2,522,255 0.4
1,001 to 5,000 1,407 15.7 3,350,817 0.5
5,001 to 10,000 178 2.0 1,310,714 0.2
10,001 to 50,000 90 1.0 1,861,643 0.3
50,001 to 100,000 7 0.1 492,363 0.1
100,001 to 250,000 4 – 732,906 0.1
250,001 to max 5 0.1 2,949,109 0.4
8,012 89.3 13,219,807 2.0
Total 8,973 100.0 646,541,496 100.0

127
Howden Joinery Group Plc Annual Report & Accounts 2014
Advisors and committees
PRINCIPAL BANKERLloyds10 Gresham StreetLondonEC2V 7AE
JOINT FINANCIAL ADVISORS AND STOCKBROKERSJP Morgan Cazenove20 MoorgateLondonEC2R 6DA
UBS1 Finsbury AvenueLondonEC2M 2PP
SOLICITORSFreshfields Bruckhaus Deringer65 Fleet SreetLondon EC4Y 1HS
AUDITORDeloitte LLP2 New St SquareLondonEC4A 3BZ
REGISTRARComputershare Investor ServicesThe PavilionsBridgwater RoadBristolBS13 8AE
REGISTERED OFFICE40 Portman SquareLondonW1H 6LT
REMUNERATION COMMITTEETiffany Hall (Chair)Mark AllenRichard PennycookMichael Wemms
NOMINATIONS COMMITTEEWill Samuel (Chair)Mark AllenTiffany HallRichard PennycookMichael Wemms
AUDIT COMMITTEERichard Pennycook (Chair)Mark AllenTiffany HallMichael Wemms
EXECUTIVE COMMITTEEMatthew IngleMark RobsonRob FenwickJulie FrenchDavid HallettTheresa KeatingAndy Witts

1282015
Interim Management Statement 30 April
Half-Yearly Report 23 July
Interim Management Statement 12 November
End of financial year 26 December
Corporate timetable

129
Howden Joinery Group Plc Annual Report & Accounts 2014
This document is printed on Arcoprint, which is an FSC® Certified Paper. Pulps used are chlorine-free and acid-free.
FSC® – Forest Stewardship Council®. This ensures there is an audited chain of custody from the tree in the well-managed forest through to the finished document in the printing factory.
This report is a CarbonNeutral® certified publication.
10311 HWDN – AR14 5 Financials AW13.indd 129 24/03/2015 16:40

Annual Report and Accounts 2014
No problem, Steve, we’ve got the whole lot here
Great, Bill, that means I can finish the job this weekOk, Dave, we’ll sort
it out for you right away
They want the blue back-board now instead of the grey, Joe
Annual Report and Accounts 2014