annual report and accounts 2015 - vesuvius · vesuvius is a global leader in molten metal flow...
TRANSCRIPT

Investing in innovation Annual Report and Accounts 2015
VESUVIUS: black 85%PLC: black 60%
VESUVIUS: whitePLC: black 20%
Vesuviu
s plc A
nnual Report and Accounts 2015

Introduction to Vesuvius
Forward-looking statements This Annual Report contains certain forward-looking statements with respect to the operations, strategy, performance, financial condition, and growth opportunities of the Vesuvius Group. By their nature, these statements involve uncertainty and are based on assumptions and involve risks, uncertainties and other factors that could cause actual results and developments to differ materially from those anticipated. The forward-looking statements reflect knowledge and information available at the date of preparation of this Annual Report and, other than in accordance with its legal and regulatory obligations, the Company undertakes no obligation to update these forward-looking statements. Nothing in this Annual Report should be construed as a profit forecast.
Vesuvius is a global leader in molten metal flow engineering, principally serving the steel and foundry industries.
We develop innovative and customised solutions, to be used in extremely demanding industrial environments, which enable our customers to improve their manufacturing processes, enhance product quality and reduce energy consumption.
Our ultimate goal is to create value for our customers in order to deliver sustainable, profitable growth and provide our shareholders with a superior return on their investment, whilst providing each of our employees with a safe workplace where he or she is recognised, developed and properly rewarded.
Find out more about Vesuvius at www.vesuvius.com
See Chief Executive’s Strategic Review on p12-23
See Business Model on p10 and 11
See KPIs on p40 and 41
See Risk on p24-27

Ou
r Perform
ance
Govern
ance
Ou
r Resp
on
sibility
1
Finan
cial Statements
Ou
r Bu
siness
Strategic Report
2 Chairman’s Statement
Our Business6 Vesuvius at a Glance10 Business Model12 Chief Executive’s Strategic Review24 Risk 28 Board of Directors30 Group Executive Committee
Our Performance34 Financial Review40 Key Performance Indicators42 Operating Review: Steel Division50 Operating Review: Foundry Division
Our Responsibility56 Principles58 Safety60 Sustainability62 People and Community
Governance
66 Chairman’s Governance Letter67 Governance Report74 Audit Committee80 Nomination Committee82 Remuneration Overview83 Directors’ Remuneration Report94 Remuneration Policy103 Directors’ Report107 Statement of Directors’ Responsibilities
Financial Statements
110 Independent Auditor’s Report113 Group Income Statement114 Group Statement of
Comprehensive Income115 Group Statement of Cash Flows116 Group Balance Sheet117 Group Statement of Changes
in Equity118 Notes to the Consolidated
Financial Statements158 Company Balance Sheet159 Notes to the Company
Financial Statements165 Five-Year Summary:
Divisional Results166 Shareholder Information168 Glossary
Financial Performance 2015
Contents
Revenue of £1,322m down 8.5% on a reported basis, down 7.7% on an underlying basis1 (2014: £1,444m)
Trading profit2 of £124.0m, down 13.1% on a reported basis, and down 14.0% on an underlying basis1 (2014: £142.8m)
Return on sales2 declined by 50 basis points to 9.4% (2014: 9.9%); 70 basis points decline on an underlying basis1
Headline earnings per share3 of 28.1 pence, down 16.0% (2014: 33.4 pence)
Recommended final dividend of 11.125 pence per share, Group full year dividend of 16.275 pence (2014: 16.125 pence)
Year-end net debt2 of £291.6m, with net debt to EBITDA ratio of 1.8x
2013
2014
2015
Trading profit £m
124.0
142.8
140.0 2013
2014
2015
EBITDA £m
161.1
181.3
179.32013
2014
2015
Revenue £m
1,322
1,444
1,511
2013
2014
2015
Headline earnings £m
75.7
90.3
87.7 2013
2014
2015
Headline EPS pence
28.1
33.4
31.9 2013
2014
2015
Free cash flow £m
65.3
59.2
94.9
1. Underlying basis is at constant currency and excludes separately reported items and the impact of acquisitions and disposals.2. For definitions of non-GAAP financial measures, refer to Note 4 of the Consolidated Financial Statements.3. Headline results refer to continuing operations and exclude separately reported items.

2 Vesuvius plcAnnual Report and Accounts 2015
Chairman’s Statement
Overview
In 2015 we continued to make important progress against our strategic priorities, but also saw our key end-markets facing major challenges. In our steel business we experienced a slowdown in global production, lower domestic demand in China leading to a huge increase in their exports of cheaper steel, coupled with the strengthening of the US dollar and sterling. Conditions in the global foundry industry were equally difficult, with a reduction in investment in capital equipment in all markets.
The current challenges validate our strategy – in both Steel and Foundry – of steadily increasing the value-added and more highly differentiated element of our products and services. This strengthens our relationship with our customers and improves their efficiency. Throughout the Company and at Board level, there has been considerable focus on innovation and targeted R&D this year, and this is a theme that features prominently in this Annual Report.
This year we report separately on our Technical Services business for the first time, illustrating our continuing journey up the value chain. During the year we acquired Sidermes, a leading supplier of temperature and chemical measurement solutions for the steel and foundry industries. We see an important medium-term growth opportunity from this initiative, and will continue to focus on innovation and acquire businesses that add to our Technical Services offering.
As we see no near-term change to the prevailing market climate, our executive management team has taken prompt and effective action internally to adapt our business and cost base. Such restructuring requires discipline and fine judgement, and I believe that this proactive approach to self-help is a hallmark of our executive management team and a significant factor in our resilience and competitiveness.
Performance and Dividend
The substantial headwinds in our end-markets inevitably reduced revenues. However, as a result of the restructuring programme we initiated and our ongoing Lean programme, we restricted the decline in our margins. Cash generation has remained strong, and our balance sheet is robust, reflecting our focus on financial discipline.
Our dividend policy aims to deliver long-term dividend growth provided that this is both supported by cash flow and underlying earnings, and is justified in the context of the Company’s capital expenditure requirements and the prevailing market outlook. Against this background, the Board has recommended a final dividend of 11.125 pence per share for the year ended 31 December 2015 (2014: 11.125 pence), which would result in a total dividend for the year of 16.275 pence per share (2014: 16.125 pence), an increase of 0.9%. If approved at the Annual General Meeting, this final dividend will be paid on 20 May 2016 to shareholders on the register at 8 April 2016.
Board and Governance
Douglas Hurt and Hock Goh joined the Board as Non-executive Directors in April 2015. Both have devoted considerable time and energy to getting to know Vesuvius, its markets and strategic considerations.
“ Our proactive approach to self-help is a significant factor in our resilience in the current climate.”John McDonough CBE Chairman
Building an increasingly comprehensive technical services business
Improving cost leadership and our margins
Capturing growth in developing markets
Increasing penetration of value-creating solutions
Reinforcing our technology leadership
Strategy Since 2013, your Board has pursued a consistent strategy for profitable growth, focused on five strategic priorities:

3
Ou
r Bu
siness
More recently, on 1 November, Guy Young joined the Board as Chief Financial Officer. Guy was previously Chief Financial Officer of Tarmac, the British building materials company, prior to which he held a number of senior financial and business development positions at Anglo American plc. He brings a wealth of financial and operational insight and extensive international experience to the Board. Guy replaced Chris O’Shea who made a major contribution to the establishment of Vesuvius as a strong and successful independent public company.
As part of the Board’s ongoing remit to set the right tone from the top and build its understanding of the Vesuvius business, during the year the Board visited the new dedicated Foundry R&D centre in Enschede (NL), as well as conducting visits to our manufacturing facilities in Hengelo (NL) and Borken (Germany). A Strategy Day was held in conjunction with the Board’s visit in June to GIFA/METEC in Germany, the world’s largest trade shows for the steel and foundry industries. As Chairman, I also continued to deepen my knowledge of the Group with a visit to our Flow Control, Advanced Refractories and Foundry facilities in Monterrey, Mexico.
I am confident that we have a well-balanced Board that, in terms of good governance, is functioning very effectively – setting Vesuvius’ strategic direction, and ensuring that the appropriate culture is embedded throughout the Company. Fundamentally, our role as a Board is to act as custodians of shareholder value for the long term, and I am confident that our approach and activities during 2015 have been consistent with this role.
Our People
The Board is responsible for setting the culture and values of the Group, determining the behaviour expected from all our people. Our Code of Conduct, which sets out these requirements, is discussed further on pages 56 and 57. In return, we recognise that our people’s diversity, health and safety, and their opportunity to develop and deploy their talents, is key to our long-term success. The sections on Safety and People and Community within the Strategic Report set out how we put this commitment into action.
At any time, we ask a lot of our people. However difficult market conditions create additional pressures. My Board colleagues and I are very impressed by the manner in which, across the Group, the leadership and all of our people have risen to this challenge, and have continued to deliver more than is expected of them. The fact that we have delivered a resilient performance in tough circumstances is in no small part down to this commitment and professionalism, and all our people deserve our thanks and recognition.
Annual General Meeting
The Annual General Meeting will be held on 12 May 2016. The Notice of Meeting and explanatory notes containing the detail of the AGM resolutions accompany this Annual Report and are available on our website. All members of the Board plan to attend the AGM and look forward to the opportunity to meet with shareholders.
John McDonough CBE Chairman3 March 2016
See Governance on p66-107

The Strategic Report set out on pages 2 to 63 contains a fair review of our businesses, strategy, and business model and the associated principal risks and uncertainties. We also deliver a review of our 2015 performance and set out an overview of our markets. Details of our principles, our people and community engagement, together with our focus on safety, are also contained in the Strategic Report.
Approved by the Board and signed on its behalf by
François Wanecq Guy Young Chief Executive Chief Financial Officer
In this section
6 Vesuvius at a Glance
10 Business Model
12 Chief Executive’s Strategic Review
24 Risk
28 Board of Directors
30 Group Executive Committee
Section One
Our Business
Ou
r Bu
siness
54 Section OneOur Business
Vesuvius plcAnnual Report and Accounts 2015

6 Section OneOur Business
Vesuvius plcAnnual Report and Accounts 2015
38Countries
6Continents
69Production sites
10,912Employees
92Sales offices
17R&D centres
Production and sales sites
R&D centres
Key to map
Americas
We are a global Group with a business model based on offering customised products, solutions and services from production facilities in close proximity to our customers.
See our Business Model on p10-11
See more about our Steel and Foundry divisions on p42-53
18Production sites
3,219Employees
5R&D centres
21Sales offices
Vesuvius at a Glance
North America
South America
Americas
£408.4m 2014: £454.0m
Steel Foundry22%
78%
Revenue

7
Ou
r Bu
siness
EMEA
China and North Asia
India and SE Asia
Australasia
EMEA Asia-Pacific
32Production sites
4,592Employees
10R&D centres
36Sales offices
19Production sites
3,101Employees
2R&D centres
35Sales offices
EMEA
£555.7m 2014: £638.8m
Steel Foundry35%
65%
RevenueAsia-Pacific
£357.9m 2014: £351.6m
Steel Foundry39%
61%
Revenue

88 Section OneOur Business
Vesuvius plcAnnual Report and Accounts 2015
Vesuvius at a Glance
See Steel division operating review on p42-49
4
Steel slab or bloom ready for sale
3
Ladle Tundish Mould
2
Converter and refining ladles
1
Blast FurnaceIron TroughTilter Torpedo ladle
3
Steel DivisionRevenue
£897.6mThe continuous casting of steel is a highly demanding process that is critically dependent upon consistent product quality and optimised production. Vesuvius provides systems, products and services that allow steel mills to contain the molten metal they produce, protect it from oxidation and chemical contamination, and regulate its flow. Vesuvius enables its customers to increase efficiency and productivity, enhance quality, and improve the safety and reduce the environmental footprint of the casting process.
Steel Flow Control
supplies products used to channel and control the flow of molten steel from ladle to tundish and from tundish to mould; slide gate refractories for ladles and tundishes; slide gate systems; tundish and mould fluxes; and control devices to monitor and regulate steel flow into the mould. These products have been designed to resist extreme thermomechanical stress and corrosive environments. The majority of these products are consumed during the process of making steel and, consequently, demand is primarily linked to steel production volumes. Continuing innovation allows us to offer enriched solutions that create additional value in our customers’ processes.
Advanced Refractories
produce specialised refractory materials for lining steelmaking vessels such as blast furnaces, ladles and tundishes, which are subject to extreme temperatures, corrosion and abrasion. These materials are in the form of powder mixes, which are spray-applied or cast onto the vessel to be lined (‘monolithics’) and refractory shapes (e.g. bricks, pads and dams). Vesuvius is one of the world’s largest manufacturers of monolithic refractory linings. Advanced Refractories delivers installation technologies, products adapted to fit customers’ specific processes and plants, and effective and efficient logistics services. These factors are combined with significant R&D, a deep knowledge of customers’ processes and project management capability to deliver market-leading solutions for our customers.
Technical Services
focuses on the capture of key manufacturing data, complementing Vesuvius’ strong presence and expertise in molten metal engineering to create new technologies and integrate them into expert process management systems. Applications focus on: furnace data acquisition using sensors and laser scanner services; ladle data acquisition employing laser scanners and slag prevention technology; and caster data acquisition in the tundish and mould, which uses sensors to obtain temperature measurement, metallurgical data, and other mould information.

9
Ou
r Bu
siness
Ou
r Bu
siness
9
Foundry DivisionRevenue
£424.4m Vesuvius’ Foundry division, trading as Foseco, is a world leader in the supply of consumable products, solutions and associated services related to the foundry industry. The foundry process is highly sequential and is critically dependent on consistency of product quality and productivity optimisation. The Foundry division’s products, solutions and use of advanced computer simulation techniques allow foundries to reduce defects
and hence reduce labour-intensive fettling and machining, minimise metal usage requirements, influence the metal solidification process and automate moulding and casting, thus reducing cost, energy usage and mould size.
The conditioning of molten metal, the nature of the mould used and, especially, the design of the way metal flows into the mould are key parameters in a foundry, determining both the quality of the finished castings and the labour, energy and metal usage efficiency of the foundry. Vesuvius’ products and associated services to foundries improve these parameters.
See Foundry division operating review on p50-53
3
Mould
Riser sleeve
1
Furnace & melt shop refractories
2
Pouring ladle Melt shop refractoriesMetal treatment
Direct Pour Unit, including filtration
Fettling (removal of gating and riser systems)
Finished casting
Sand core made with binder and refractory coating
Mould and core assembled
3 Mould detail
1010 Section OneOur Business
Vesuvius plcAnnual Report and Accounts 2015
Business Model
Global Presence
Vesuvius is present on six continents, supporting the development of global steel and foundry manufacturing processes with new technologies. We have manufacturing capability in all the main steel and foundry markets and hire and train local engineers, who are progressively integrated within the Vesuvius network of experts, and offered international careers. Local manufacturing, local expertise and leveraging a global knowledge of our customers’ processes give Vesuvius a special relationship with our customers, helping them optimise their process and product performance. All over the world, new plants use Vesuvius and Foseco products to create the best possible conditions for success.
See more about our global presence on p6-7
Optimised Manufacturing Footprint
Our successfully tested products can be manufactured at a short distance from our customers’ plants, guaranteeing cost competitive and time efficient delivery. We optimise our cost competitiveness by investing in the lowest cost production site in the area and have established manufacturing facilities in emerging markets from the beginning of their industrialisation. This, together with the high volume of pieces we are able to produce, provides our customers with the best balance between value, cost and service for our high-technology solutions.
See more about customer proximity on p6-7
Advanced Technology Knowledge
Our continuing investment in the Company’s R&D centres is reflected in all areas of our offering. We have knowledge of the most advanced ceramic and metallurgical techniques using state-of-the-art equipment and the most advanced technologies of flow simulation and finite element analysis. We are therefore able to provide our customers with sophisticated, innovative, custom-designed solutions, with the highest level of confidence in their suitability, creating value, and helping them differentiate from their competition. We enhance this expertise with our growing capabilities in data monitoring and analysis to deliver expert process management improvements to our customers.
Read more about Innovation on p15-23
Service and Consistency
Alongside developing our global presence, we ensure a local service to our customers, from inventory management to high-quality technical support at their sites and the ability to swiftly modify production and supply to reflect changes in customer requirements. Our knowledge of end-market processes, specifications and techniques around the world gives our experts an unparalleled ability to support our customers. This unique level of service relies on our technicians’ permanent presence at our customers’ sites, and their ability to leverage the worldwide expertise accumulated across the Vesuvius network.
Read more about Quality and Reliability on p18
We develop and manufacture high-technology products and solutions for supply to the steel and casting industries, operating a profitable, flexible, cash generative and growth-building business model. Over many years we have built the brand equity of our Vesuvius and Foseco products through reliability, technology and service.
The foundation of our business model is our global presence. Our industry experts are embedded at many customer locations and are therefore ideally placed to identify potential service and process improvements in collaboration with customers.
Creating sustainable value
Resilient to end-market volatility due to flexibility of diversified manufacturing footprint and adjustable variable cost base
Profitable, as it allows value pricing for bespoke products and services
Generates growth, as we can enlarge our market with additional innovative products and solutions
Advantages of our Business Model

11
Ou
r Bu
siness
Ou
r Bu
siness
11
A profitable, flexible, cash generative model focused on growth
Service and Consistency
Serving our customers reliably, competitively and consistently with consumables critical for their manufacturing processes
Global Presence
Using our global spread of expertise to identify and create market opportunities
Optimised Manufacturing Footprint
Industrialised, low cost, dispersed, Lean manufacturing, close to customers provides reliable, ‘just-in-time’ products
Advanced Technology Knowledge
Our technology centres develop value-adding solutions involving engineered systems and high value consumables
Global Presence
Optim
ised Manufacturing
Advanced Technology
Across six continents
>15
-yea
r ave
rage
cus
tom
er re
latio
nshi
p
55% of m
anufacturing sites in developing countries
Over 100 PhDs and engineers
Over 200 technical experts
17 R&D facilities
A growth generating model
with our Customer at the centre
Serv
ice
and
Con
sist
ency

12 Section OneOur Business
Vesuvius plcAnnual Report and Accounts 2015
Chief Executive’s Strategic Review
Introduction
2015 has been a year of progress despite the deterioration we experienced in the global steel and foundry markets. The sequence of events and the causes have been well documented. Global steel production slowed and lower domestic demand in China increased the export of cheaper Chinese steel, putting further pressure on other producers. US and UK producers have been hit particularly hard by the strengthening of the US dollar and sterling and the weakening demand from the oil and gas industries. The global foundry industry has also endured difficult trading conditions due to a reduction in investment in equipment for the agriculture, construction and mining sectors.
Despite this, we have grown substantially in China, India and South America, our three strategic areas of focus. In China where the decrease in steel production principally affected the lower-quality long steel segment, we have outperformed the market trend in general but also the specific flat steel segment, confirming our increased penetration. However, the decline in the West has been more pronounced. Our resilience in the face of these adverse trading conditions reflects our strategic progress, the market positions we have created over the years, our ability to directly assist our customers improve their own efficiency and the quality and innovation at the heart of our product and service offerings. It is also a consequence of the continued self-help measures and mitigating actions implemented during the year.
In the second quarter, anticipating a more sustained weakness of our markets, we initiated a Group-wide restructuring plan to adapt our cost base, and reduced our overhead structure in the mature markets where we believe the production decline to be structural and permanent. By the end of 2015 we had incurred restructuring costs of £14.6m and recorded £8.8m of recurring savings with further actions identified and being implemented in 2016.
We reduced our capital expenditure by a third versus 2014 and have suspended further planned capacity expansion. However, we maintained our focus on R&D and continued to invest in innovation. With the ongoing development of innovative solutions that create value for our customers, we are confident that we can continue to grow and deliver increasing value to our shareholders.
In line with our strategy, the Group continues to invest in solutions that will enable further automation of customers’ production processes. Our solutions capabilities have been significantly enhanced by the acquisitions of AVEMIS, ECIL Met Tec, Process Metrix and, in 2015, Sidermes which are being integrated into our developing Technical Services business.
Our Markets
According to the World Steel Association, global steel production decreased by approximately 2.8% in 2015 compared with the previous year. The overall market decline was driven mainly by decreased production in North America of 8.6%, in China of 2.3%, and in the European Union of 1.8%. These decreases were partially offset by an increase in production of 2.6% in India.
The foundry market continued to be affected by difficulties within the agriculture, construction and mining industries, which resulted from the general decline in commodity and precious metal prices reducing investment and activity worldwide. Light vehicle (i.e. passenger cars and light trucks) production was up year-on-year 1.5% globally in 2015, but worldwide heavy truck output declined 6.2%.
“ Despite our key end-markets facing substantial headwinds in 2015, we continued to deliver innovation to our customers, penetrate key markets and develop our new Technical Services business.” François Wanecq Chief Executive
Revenue
£1,322m
Trading profit
£124.0m

13
Ou
r Bu
siness
The engineering sector was affected by industrial investment remaining at a low level as a result of the general under-utilisation of production capacity and the slowdown of Chinese industrial growth. We also continued to experience political and economic instability in some markets where we traditionally experienced good volumes and margins such as Ukraine, Thailand and Brazil.
Performance Overview
Vesuvius reported global sales in 2015 of £1,322m, a reduction of 8.5% (2014: £1,444m) on a reported basis driven by the ongoing decline in global steel and foundry markets and currency fluctuations. At constant exchange rates and adjusted for the effects of acquisitions and disposals, underlying revenue was down 7.7% compared to 2014. Reported trading profit in 2015 was £124.0m (2014: £142.8m), a decrease of 14.0% over the previous year on an underlying basis. The decline in revenues in our Steel division was higher than the worldwide contraction in Steel production due to several inter-linked issues. Firstly, the market weakness mainly affected North America and Europe where we currently have higher penetration expressed in sales per ton of steel. This was accentuated by the strengthening of the US dollar and sterling against the currencies of most competing steel producing countries. In addition, and consistent with our business model we decided to hold prices with some major customers despite strong downward pressure. Finally, the steep decline in oil and gas investment drastically reduced the market for high performance steel tubes and pipes, a traditionally important end-market for us. The Foundry division revenue was similarly challenged by a reduction in demand for high specification steel castings for the mining and energy markets where the expertise and technology of Foseco is critical to end-product quality.
Our Strategy
The strategy we developed since launching Vesuvius on the market is articulated around five pillars designed to ensure long-term revenue growth, improved profitability and sustained cash generation.
Reinforce our technology leadership
Vesuvius was built and grew on technology breakthroughs that enabled the steel continuous casting and foundry industries substantially to improve their efficiency. Our technology leadership drives our unique value proposition and underpins our ability to deliver value enhancement to our customers. We invest nearly twice as much in R&D, as a percentage of revenue, as our main competitors.
Increase penetration of value-creating solutions
Our technology has been widely adopted by the most sophisticated producers in the most developed markets. However, there are still substantial differences in the penetration of our solutions within the industry and consequently there is a wider audience of customers who we believe can benefit from them.
Foundry and steel businesses are experiencing an increased level of competition throughout the world from both producers and alternative materials. As steel and foundry businesses grow in new areas, they will require higher levels of quality and performance as well as lower costs. We will dedicate our technical marketing efforts to help these customers develop.

1414 Section OneOur Business
Vesuvius plcAnnual Report and Accounts 2015
Capture growth in developing markets
Building on our long-lasting presence in all markets, we can leverage the high growth enjoyed by our customers’ industries in the emerging countries, which are large consumers of steel goods and foundry castings.
Improve cost leadership and margins
Our supply chain efficiency ensures that we deliver products and services to our customers at the right price while maintaining our margins. We apply the principles of Lean manufacturing across all our sites to continuously improve our quality and productivity. In addition, our global presence and leadership allow us to benefit from a high volume effect, and deliver excellent service from local sites.
Build a Technical Services business
Our customers’ processes require increasing levels of engineering services to reach the demanding levels of safety, accuracy and consistency required by their end-customers’ quality specifications. We have created Technical Services as a new business line for the Group to address this growing market demand. It will complement existing product lines with new services to our customers. Technical Services focuses on the continuous capture of key process data that will take advantage of Vesuvius’ strong presence and expertise in metal casting to create new technologies and integrate them into expert process management systems.
Our Businesses
Steel Flow Control
Revenue in Steel Flow Control was down 7.4% on an underlying basis with revenue decline in the Americas and EMEA only partially offset by increased revenue in Asia-Pacific. This reduction exceeded the overall weakening in steel production. This reflects significant contraction in demand for high performance steel tubes from the oil and gas industry, combined with greater declines in countries in which Vesuvius has a high penetration of value-added product, exacerbated by foreign exchange challenges to US and UK producers driven by the high dollar and sterling. This, coupled with a reduction in inventory, amplified the effects of the end-market decline through the supply chain. The significant slowdown in China is a signal of the transformation of the Chinese economy from an investment-driven growth economy to one that is consumer-driven. This ‘consumerisation’ induces a shift in steel quality demand, from the less sophisticated long products used for construction – where Vesuvius has little presence – towards the high-quality flat products used in consumer goods and the car industry. This flat steel segment is the largest customer for our high-technology products and solutions and this development should support a growing demand for our Flow Control products and our developing Technical Services offering.
Advanced Refractories
Revenue in Advanced Refractories decreased by 12.7% compared to 2014 on an underlying basis, due to extremely challenging global market conditions. In the mature markets of NAFTA and EMEA, this decline in revenue was driven by the reduction in crude steel production, reflecting increased imports into the region, the declining price of oil and strong downward price pressure in the more commoditised end of the market where, in line with our business model, we resolved not to participate. In the expanding markets of North Asia and India, growth strengthened in line with expectations. Low cost steel imports also affected the progress of new steel capacity expansion in South East Asia, which also impacted our performance.
Chief Executive’s Strategic Review continued

15
Ou
r Bu
siness
Investing in innovation Flow Control case study
Robotic solution for improved safety and consistency
The Challenge
As a premium supplier for consumables and equipment for the continuous casting of steel, Vesuvius understands the demanding working conditions to which operators are traditionally exposed – close to liquid steel at 1,600°C, and handling hot and heavy materials in a very precise way.
Consequently, Vesuvius is always seeking ways to help customers work more safely and consistently.
Our Solution
In 2013 Vesuvius installed four tailor-made robotic cells at one of the world’s leading steelmakers to free operators from handling hot refractory pieces.
Recognising the significant benefits of the initial installation, in 2015 the customer asked Vesuvius to expand use of those cells to other areas of the plant and Vesuvius introduced specifically designed robotic cells on the ladle platform, which is a particularly exposed working area.
Our latest technology allows robots to handle a variety of tasks, such as manipulating steel samplers and temperature or hydrogen sensors, and to distribute powder into the tundish. All these tasks are linked to specific consumables and other equipment developed and supplied by Vesuvius.
The Benefits
Installing robotic cells has both drastically reduced human exposure and improved operational reliability.
Innovating and refining the solutions has enabled us to support our customers’ safety and consistency targets and to strengthen our position as a global solution provider in the steel industry.

16 Section OneOur Business
Vesuvius plcAnnual Report and Accounts 2015
Chief Executive’s Strategic Review continued
Technical Services
Technical Services is a new business line for the Group which complements existing product lines with new services to our existing customers. In 2015, Technical Services generated revenues of £26.5m. As a new business line, the key challenge for Technical Services was to establish its presence independently from our other businesses, and to integrate new acquisitions, while continuing to develop new and complementary solutions for our customers. This reflects our customers’ demand for the delivery of solutions that will enable further integration and automation of their production processes.
Foundry Division
Our Foundry Division continues to suffer from the decline in our traditional end-markets, including a reduction in demand in the valuable steel casting market for the extractive industries. Some jurisdictions have also faced challenges from political and economic instability. Underlying revenue in the Foundry Division decreased by 3.3% year-on-year. However, underlying trading profit improved by 2.7% and return on sales increased by 62 basis points as a result of a series of self-help measures implemented by new management.
Innovation as Our Foundation
Vesuvius has a proud heritage of bringing innovation to the markets we serve. Our developments in VISO™ isostatic pressing technology and in slide gate systems were key enablers of the continuous casting process now deployed throughout the whole of the steel industry. Our innovations in molten metal filtration and casting feeding systems have been used extensively to improve the quality of cast product in the foundry market. Maintaining this technology leadership is a central objective of our strategy, and the spirit of innovation is at the core of all our activities.
Turning innovation into results
Innovation is all about translating an idea into a commercial reality. In 2015, we maintained our level of R&D expenditure at £25.8m, representing 2.0% of sales. We currently have over 160 patent families, and 1,750 patents granted worldwide, with 550 patent applications pending. In 2014 we set ourselves the goal of doubling our revenues from products launched within the previous five years. In 2015, we estimate that 12% of our revenue came from such products. We have also launched a new gating process to speed up new product introduction.
Delivering solutions
The innovation process at Vesuvius begins with an intimate knowledge of our customers’ processes and needs. Vesuvius solutions and products greatly improve the quality of our customers’ products and the efficiency of their processes. All our new products and solutions are developed with value creation for our customers in mind. We have more than 200 technical experts supported by local development teams around the world to ensure we meet our customers’ needs. These local development laboratories play a lead role in customising products for customers, and qualifying new sources of key raw materials.

17
Ou
r Bu
siness
Investing in innovation Technical Services/Flow Control case study
XMAT Concept – An expert eye in the mould
The Challenge
Controlling the flow pattern of molten steel as it enters the mould is critical to achieving the highest quality standards in steelmaking.
The complexity of accurately monitoring these flows makes the development of efficient solutions to problems of product quality and of productivity particularly challenging.
Our Solution
AVEMIS, a company in the Technical Services business of our Steel division, has developed the XMAT concept.
The XMAT device is an ‘expert eye’ in the mould. It includes advanced instrumentation for capturing data and, for the first time in continuous casting, it is now possible to measure and record the slightest deviation in flow pattern, sub-meniscus velocity, molten steel temperature and mould level on either side of the entry nozzle.
The data captured from these measurements, combined with the analysis performed by our technical experts, enables us to identify issues and optimise the steel casting process.
The Benefits
By delivering this combination, the XMAT device helps to monitor production, influencing the process of solidification and the quality of the final steel slab. Over the longer term the data from the XMAT device measurements will provide customers with a deep and accurate source of knowledge about their process, enabling them to anticipate future requirements and develop solutions.

18 Section OneOur Business
Vesuvius plcAnnual Report and Accounts 2015
Chief Executive’s Strategic Review continued
We have six facilities equipped for physical and computational fluid dynamic modelling. We also place experienced scientists and engineers at our local development laboratories to enable us to analyse the complex interactions between refractory materials and molten metals existing in our customers’ operations. These modelling facilities and local development laboratories work hand-in-hand with our five global research centres to stay constantly updated with information on the latest technological developments. We regularly conduct customer seminars and training sessions, to ensure that the full range of Vesuvius products and solutions are known, properly used and informed by our customers’ experience.
Next generation product development
Our five centres of research excellence focus on development of the next generation of products and technologies in partnership with strategic customers and leading universities. These laboratories are staffed with scientists and engineers possessing advanced degrees in various disciplines and are equipped with highly specialised equipment.
Innovation hub and global centres of excellence
In December 2014, we opened our new Global Foundry R&D Centre in Enschede, Netherlands. This was its first year serving as the hub in a centre of excellence model for Foundry R&D, coordinating the research and development activities in our two other Foundry R&D centres. We also made substantial progress on our planning for global centres of excellence for steelmaking and foundry refractories in Pittsburgh (US) and for Advanced Refractories in Visakhapatnam (Vizag), India.
Portfolio Management and Capital Allocation
Our capital investment in 2015 amounted to £61.9m. Of this, £23.8m was used for the acquisition of Sidermes in the newly formed Technical Services business, and £38.1m cash was invested in plant and equipment, a 28% reduction on 2014.
Trade working capital was reduced by £20.2m with a reduction in inventory days and despite a general trend of extending payment terms from our customers, predominantly in China, passing on the financial constraints encountered in the steel and foundry industries. Overall our net debt increased by £23.3m, driven by our acquisition and an £11.3m impact of the strengthening of the US dollar on the revaluation of our dollar denominated US private placement loans.
Quality and Reliability
Reliability in quality and delivery is vital to our customers as they use Vesuvius’ products in critical areas of their own processes. The level of risk attached to a catastrophic failure is often such that, for people and equipment, no compromise can be accepted. Reliability therefore is a primary commitment of Vesuvius. We deliver this through best-in-class quality management in our 69 production sites and 107 customer locations.

19
Ou
r Bu
siness
Investing in innovation Foundry case study
SMARTT™ degassing of aluminium alloys
The Challenge
Two major factors outside the control of a foundry are air temperature and humidity, both of which often fluctuate markedly between summer and winter. The new generation of aluminium alloys that meet the safety-critical crash test requirements in the automotive industry require an efficient and effective melt treatment process with a controlled level of dissolved hydrogen.
Our Solution
For several decades Foseco has been the market leader in the efficient control of hydrogen in molten aluminium. Using bespoke software developed at Foseco, our degassing unit takes into account the foundry’s ambient conditions and modifies the molten aluminium treatment parameters accordingly. This enables the foundry to meet tight tolerances of hydrogen content at the push of a single button.
The Benefits
Foseco’s SMARTT™ degassing unit can clean, grain refine and control the hydrogen content of the molten aluminium in a swift, easy and cost effective manner while also offering full traceability to the casting purchaser of the metallurgical composition of its products.

20 Section OneOur Business
Vesuvius plcAnnual Report and Accounts 2015
Our Quality Policy clearly defines the commitment we make to secure the reliability of our products. Across the Group we drive learning from the problems we face, place strong controls on detecting defects, seek to understand the root cause of any quality issue (taking immediate action to remediate) and apply Lean principles to improve quality, productivity and manufacturing flexibility. In 2015, we continued to focus on understanding the causes of repeat customer complaints, conducting full investigations using the 8D methodology to resolve, and then permanently eliminate, these issues. As a result, the number of quality issues where we were unable to define the root cause declined by more than 50%.
Our supplier assessment process has been refined to ensure the conformity and consistency of incoming raw materials. In parallel we have reinforced incoming inspections at all our manufacturing sites. We intend to expand this programme to encompass a wider accreditation process in 2016 and beyond.
Training remains a fundamental part of our quality story. Turbo.Q, our in-house quality training module, continues to deliver results and has been expanded to cover specific areas in more detail such as sales and product development. In 2015, over 300 staff were trained in elements of our quality programme.
Lean and Industrial Excellence
Cost leadership and margin improvement are two of our strategic priorities. In a business where we need to manage the challenges presented by the volatility in our end-markets, a focus on process efficiency and quality is fundamental.
Our Lean Programme started with the belief that:
> Standardisation of tasks and processes is the cornerstone of safety, quality, productivity, and continuous improvement
> Employee motivation and customer satisfaction are critical foundations for the long-term success of the Group
> Improving information flow is instrumental to guarantee fast and effective cross-functional processes.
Work on Lean initiatives has intensified in 2015 with a specific focus on 5S and standardised work programmes. These programmes help improve workspace efficiency, reinforce the importance of operating in a safe environment, increase standardisation and smooth production flow – all being key elements to delivering manufacturing consistency and quality products. In 2016 we will continue to apply the Lean principles as we deploy Excellence roadmaps to increase further the competitiveness of our manufacturing footprint.
To support all these initiatives management will rely on the Excellence platform we have launched. This will involve the entire population of our employees around six key areas: customers, innovation, strategy, business support, supply chain agility and talent management. Precise roadmaps in each of these areas have been established, and we will accelerate the implementation of this process in 2016, to deliver our goal of reaching the status of a truly best-in-class company.
Chief Executive’s Strategic Review continued

21
Ou
r Bu
siness
Investing in innovation Foundry case study
Coatings for high performance cylinder liners
The Challenge
Cast iron cylinder liners are required in lighter-weight aluminium engine blocks to provide a hard wearing surface for pistons. To ensure there is no movement of the liner during engine use and to provide good heat transfer away from the combustion zone, the aluminium block is cast around a cast iron cylinder liner that has a textured external surface. However machining grooves into the liner’s surface to achieve this texture is an expensive process.
Our Solution
Foseco has developed a process using proprietary coating technology and centrifugal casting to produce liners with a textured surface that allows molten aluminium to flow easily around it – even when using low pressure or gravity die casting – whilst providing a secure interface with the solidified aluminium.
The Benefits
This solution creates value for the customer by eliminating costly cylinder liner machining. Additionally these liners can be used for both low pressure and gravity die casting, enabling manufacturers to maintain the cost benefits associated with as-cast liners whilst moving to rigid closed-deck engine designs. This can lead to an overall weight reduction and allow increased combustion temperatures and pressures which improve vehicle fuel efficiency and reduce emissions.

22 Section OneOur Business
Vesuvius plcAnnual Report and Accounts 2015
Health and Safety
In 2015 Vesuvius has remained strongly committed to working towards our ultimate safety goal: no lost time injuries, no repeat injuries and no harm to our people or contractors. Our Safety Breakthrough programme has assisted in reducing the Lost Time Injury Frequency Rate (LTIFR) from 9.8 (in 2008) to 1.5 in 2015. The effectiveness of safety audits and executive safety tours has supported a reduced LTIFR in our customer locations, despite the challenging work environment. More than 75% of our working population have been involved every month in safety audits resulting in improvement priorities being highlighted and acted upon.
Read more about Safety on p58-59
Sustainability
We are committed to contributing proactively to the protection of the environment and to the positive integration of our site activities into local communities. During 2015, due to reduced output our overall global consumption of energy and our emissions of CO2 declined, though our energy intensity increased marginally as a result of changes to product mix. As well as focusing on our own consumption, we continue to develop solutions for our customers to help them to reduce substantially their waste, their energy consumption and their CO2 emissions.
Read more about Sustainability on p60-61
Management
In the early part of the year, we further strengthened our senior management team through internal promotion. Alan Charnock, previously Vice President, Marketing & Technology Flow Control, was appointed Chief Technology Officer, responsible for worldwide R&D. In his new role, Alan joins our Group Executive Committee.
Outlook
Global economic prospects remain uncertain in our main markets, and we expect the underlying trading environment in 2016 to be broadly similar to that experienced in the second half of 2015. Given the current environment, a return to overall growth in steel production is not to be expected before 2017.
Our response to these challenging conditions has been to continue to adapt our cost structure to the new geographic realities of our markets and to reinforce our focus on quality.
We will also continue to focus on identifying acquisitions to reinforce our growth opportunities, whilst retaining a strong balance sheet in order to maintain financial flexibility. We remain confident in our ability to improve trading margins and working capital performance and to capitalise where there is further growth in our addressable markets in the medium-term.
François Wanecq Chief Executive3 March 2016
Chief Executive’s Strategic Review continued

23
Ou
r Bu
siness
Investing in innovation Advanced Refractories case study
Robotic tundish spray
The Challenge
Our customer maintains two fleets of tundishes, one for their Basic Oxygen Furnace (BOF) process route and one for their Electric Arc Furnace (EAF) process route, using an old multi-station robotic system for spraying hot tundishes. In order to meet stringent regulatory requirements concerning the elimination of operators from the work zone they have to isolate the entire work area, preventing work on other tundishes and limiting productivity. The customer expressed a desire for an automatic system allowing access to the entire tundish setting bay, without restricting the ability to work on individual tundish setting stands, next to a tundish being sprayed.
Our Solution
Vesuvius’ solution is a fully integrated robotic spray application system with a coupled mixing and laser setting system for the accurate location of the tundish furniture and mix preparation. The automatic robotic mixing and application system is fully contained and shielded with automatic shutdown if someone enters the working zone inside the tundish stand.
The Benefits
This moveable system allows for safe work in an environmentally protected and shielded zone for one tundish while the steel plant operators can simultaneously prepare adjacent tundishes for future maintenance in the same bay.

24 Section OneOur Business
Vesuvius plcAnnual Report and Accounts 2015
Risk The Board continually monitors the risks, both internal and external, which could significantly impact the long-term performance of the Group.
Principal Risks
The risks identified on pages 26 and 27 are those the Board considers to be the most relevant to the Group in relation to their potential impact on achievement of its strategic objectives. All of the risks set out on pages 26 and 27 could materially affect the Group, its businesses, future operations and financial condition and could cause actual results to differ materially from expected or historical results. These risks are not the only ones that the Group will face. Some risks are not yet known and some currently not deemed to be material could become so.
Risk Management
Risks are actively managed in order to mitigate exposure and, where cost effective, the risk is transferred to insurers. The process for risk identification includes both top down and bottom up processes, which allow operational, functional, senior executive and Board members’ views on risk to be independently gathered to identify principal risks. Once identified, the senior management ‘owners’ for each principal risk update the mitigations of that specific risk and contribute to the analysis of likelihood and materiality. This is reported to the Board. We have also built a business structure that gives protection against the principal risks we face with diversified currencies, a widespread customer base, local production matching the diversity of our markets and intensive training of our employees. During the year, the Group further developed its processes for business continuity planning, conducting workshops across the Group’s major sites and business lines. The Group’s risks were also analysed in the context of viability, examining both financial and economic trend risks and significant event risks.
Board Monitoring
Vesuvius operates a continuous process for identifying and evaluating significant risks, with regular reports made to the Board on the processes by which these are managed and mitigated. Thus, the Board exercises its ultimate responsibility for the Group’s risk management, by analysing major issues that have arisen during the year, considering how risks have changed over time, and assessing whether they are being effectively managed.
See more in Governance on p66-79

25
Ou
r Bu
siness
Viability
In accordance with the UK Corporate Governance Code, the Directors have assessed the viability of the Group over a three year period to 31 December 2018, taking into account the Group’s current position and the potential impact of the principal risks and uncertainties set out in pages 26 and 27.
The Directors have determined that a three year period is an appropriate period over which to provide the viability statement because this is the period that the strategic business plan focuses on and is sufficiently funded by financing facilities’ with average maturity terms of 4.8 years.
In making this statement, the Directors have carried out a robust assessment of the principal risks that may threaten the business model, future performance, solvency and liquidity of the Group. This is embodied in the annual review of a three year bottom-up business plan process which includes a review of sensitivity to ‘business as usual’ risks, such as profit growth and working capital variances, severe but plausible events and the impact on the central debt and headroom profile analysis. The results take account of the availability and likely effectiveness of the mitigating actions that could be taken to avoid or reduce the impact or occurrence of the underlying risks.
Having considered all the principal risks identified by the Group, the following were selected for enhanced stress testing: an unplanned drop in customer demand, debt recovery risk due to customer default, reduction in earnings from increased interest charges and impact of volatility in foreign currency earnings.
Based on the results of these tests and considering the mitigating actions available to management, the Directors confirm that they have a reasonable expectation that the Group will be able to continue in operation and meet its liabilities as they fall due over the three year period to 31 December 2018.
ModelViability against risk scenarios, examining probabilities and impacts
Report See Viability below
Assess Principal risks and stress scenarios
Identify Viability time horizon and risk analysis framework
Viability process

26 Section OneOur Business
Vesuvius plcAnnual Report and Accounts 2015
Principal Risks and Uncertainties
Demand volatility
Protectionism
Unplanned drop in demand and revenue
Failure of one or more customers leading to debtor bankruptcy
Loss of business from enforced preference of local suppliers
Imposition of increased import duties
Increased tax burden or changes to rules and enforcement
Local competitors promoted overseas by government-to-government action
Claims from third parties resulting from use of potentially hazardous materials
Customer claims and loss of business from product quality issues
Product or application failures not promptly addressed create an adverse financial impact and damage our reputation as a technological leader
Incident at customer plant resulting in significant health and safety breach and/or customer downtime
Financial loss from failure to comply with appropriate regulations
Business disruption from investigations
Reputational damage
Prudent balance sheet management to maintain robust financial position
Strong internal reporting and monitoring of external data to identify economic trends
Flexible cost base to react quickly to end-market conditions
No single customer exceeds 10% of revenue
Robust credit control processes
Local manufacturing operations in 26 countries
Robust internal tax policies and strict transfer pricing rules
Strong internal control of inter-Company trading
Maintenance of quality and innovation leadership differentiating Vesuvius and mitigating government intervention on supplier selection
Active monitoring of HSE issues
Stringent quality control standards systematically implemented in manufacturing
Experienced legal team used to negotiating appropriate contractual protections
Active quality management programme in place with full root cause analysis for customer complaints and follow-up
Robust product qualification process in place for raw materials
Active monitoring of customers’ improvement requests
Appropriate insurance cover obtained
Widely disseminated Code of Conduct and supporting policies which highlight the Group’s ethical approach to business
Speak-up procedure implemented across the Group
Ongoing training and review of policy effectiveness
Risk Potential Impact Mitigation/Management
Product liability and loss of business reputation
Regulatory compliance
Risk continued
Changes to Risk in 2015
In 2015, the principal risks identified by the Group remained similar to those identified in 2014, though our ongoing review enabled us to refine some concerns, and recognise that two risks previously identified as being separate should be amalgamated. Thus in 2015, as part of our review we combined product liability and loss of business reputation (a risk added in 2014) into one risk area. In addition in 2015 we identified more clearly the challenges posed by our Technical Services strategy and, as a consequence, successful delivery of this medium-term strategic aim is now characterised as one of our principal risks and uncertainties. Having identified cyber security as a key risk in 2013, our ongoing assessment of Vesuvius’ exposure in this area led us to remove this from our principal risks in 2014 – whilst noting that it remains, as for all companies, an area for our ongoing attention.
See Viability on p25

27
Ou
r Bu
siness
Loss of business through new technology developed by others
Failure to adapt solutions to meet changing customer needs
Revenue lost through ineffective protection of intellectual property
Loss of revenue resulting from inability to supply customers on loss of production facilities
Manufacturing interruption from failure of a key supplier, or the loss of availability of a source of critical raw materials
Insufficient high-quality staff to run base business and generate growth through innovation
Availability of suitable talent in the pipeline to offer internal succession options for senior positions including the Group Executive Committee and Executive Directors
Inability to leverage the benefits of newly acquired entities
Financial control and reporting risk of newly acquired entities
Market-leading research and development team with significant investment in R&D, and use of structured development methodologies
Patent protection sought when new developments are made
Stringent defence of patents and other intellectual property
Control of access to intellectual property through IT controls and physical security
Geographically diversified manufacturing footprint
Maintenance of excess capacity to allow plants to meet peak demands
Enhanced Business Continuity planning undertaken
Appropriate business interruption insurance cover maintained
Strategic stocks of certain materials are retained
Number of single-sourced materials reduced through expanding supplier base
Development of new products and research on substitution of raw materials
Contacts with universities to identify and develop talent
Internal programme to attract and develop high potential staff from emerging markets through cross-border exchange programmes
Extensive internal courses run by experienced staff to transfer knowledge in a structured manner
Building career trajectories for technical staff to show potential and reduce attrition
Group Talent Management Director driving assessment of internal talent at the middle and senior management levels, identifying gaps and implementing development programmes to provide suitable succession options
Proactive approach to identify potential targets in line with the business strategy
Central structure in place to support the integration and active collaboration between the business units
Risk Potential Impact Mitigation/Management
Protection of leading technologies
Financial uncertainty
Loss of a major site
Ability to source critical raw materials
Retention of staff
Technical Services strategy implementation
Inability to raise sufficient capital to fund growth of business
Reduction in earnings from increased interest charges
Weakness in foreign currencies leading to reduced profitability
Long-term capital structure planning to secure availability of capital at acceptable costs
Substantial proportion of debt capital secured at fixed rates of interest
International presence reduces the Group’s reliance on any one currency
Hedging of transactional foreign exchange exposure when necessary
Alignment of cost structure with revenue where possible
The Group adopts appropriate functional currencies for its operations in some countries to reduce translational foreign exchange risks

28 Section OneOur Business
Vesuvius plcAnnual Report and Accounts 2015
28
1. John McDonough CBE Chairman Appointed: 31 October 2012 Committees: Nomination (Chairman)
2. François Wanecq Chief Executive Appointed: 31 October 2012
3. Guy Young Chief Financial Officer Appointed: 1 November 2015
4. Nelda Connors Independent Non-executive Director Appointed: 1 March 2013 Committees: Audit, Nomination, Remuneration
1.
2.
3.
4.
Board of Directors

29
Ou
r Bu
siness
29
5. Christer Gardell Non-executive Director Appointed: 31 October 2012 Committees: Nomination
6. Hock Goh Independent Non-executive Director Appointed: 2 April 2015 Committees: Audit, Nomination, Remuneration
7. Douglas Hurt Senior Independent Director Appointed: 2 April 2015 Committees: Audit (Chairman), Nomination, Remuneration
8. Jane Hinkley Independent Non-executive Director Appointed: 3 December 2012 Committees: Remuneration (Chairman), Audit, Nomination
5.
6.
7.
8.
For full biographies see Board of Directors on p68
30
1
2
4
5 6
3
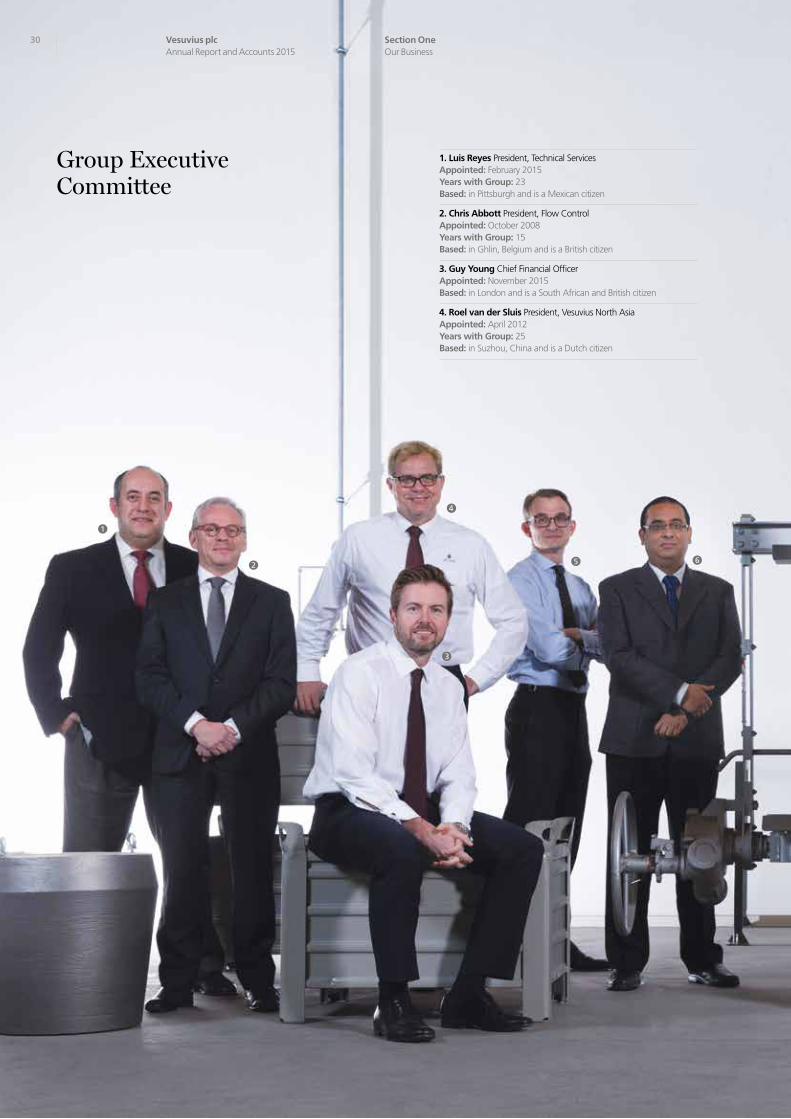
1. Luis Reyes President, Technical Services Appointed: February 2015 Years with Group: 23 Based: in Pittsburgh and is a Mexican citizen
2. Chris Abbott President, Flow Control Appointed: October 2008 Years with Group: 15 Based: in Ghlin, Belgium and is a British citizen
3. Guy Young Chief Financial Officer Appointed: November 2015 Based: in London and is a South African and British citizen
4. Roel van der Sluis President, Vesuvius North Asia Appointed: April 2012 Years with Group: 25 Based: in Suzhou, China and is a Dutch citizen
Group Executive Committee
Section OneOur Business
Vesuvius plcAnnual Report and Accounts 2015
30

Ou
r Bu
siness
31
8
7
9
10
11
5. Henry Knowles General Counsel & Company Secretary Appointed: September 2013 Years with Group: 2 Based: in London and is a British citizen
6. Tanmay Ganguly President, Advanced Refractories Appointed: November 2014 Years with Group: 8 Based: in Barlborough, UK and is an Indian citizen
7. François Wanecq Chief Executive Appointed: October 2012 Years with Group: 10 Based: in London and is a French citizen
8. Alan Charnock Vice President and Chief Technology Officer Appointed: April 2015 Years with Group: 31 Based: in Ghlin, Belgium and is a British citizen
9. Glenn Cowie President, Foundry Appointed: November 2014 Years with Group: 34 Based: in Cleveland and is a South African and British citizen
10. Patrick Bikard President, Operations Appointed: January 2014 Years with Group: 7 Based: in Ghlin, Belgium and is a French citizen
11. Ryan van der Aa Vice President, Human Resources Appointed: May 2013 Years with Group: 16 Based: in London and is a Dutch citizen
Ou
r Bu
siness
31

Ou
r Perform
ance
33
In this section
34 Financial Review
40 Key Performance Indicators
42 Operating Review: Steel Division
50 Operating Review: Foundry Division
Section Two
Our Performance
32 Section TwoOur Performance
Vesuvius plcAnnual Report and Accounts 2015

34 Section TwoOur Performance
Vesuvius plcAnnual Report and Accounts 2015
Basis of Preparation
All references in this financial review are to Headline performance unless stated otherwise. See Note 2 to the Consolidated Financial Statements on page 118.
Introduction
Our financial strategy remains focused on supporting the delivery of the corporate strategy. We do so by ensuring the Group has access to sufficient capital to take advantage in times of growth as well as to cope during market downturns, and by monitoring business performance and taking appropriate action. Following a successful renegotiation of the revolving credit facility during the year, we have a stable and competitive capital base, which has been beneficial during what was a difficult trading period, particularly in the second half of 2015. Our performance suffered as a result of the difficult markets and anticipating this we moved swiftly to address our costs to protect returns, as discussed further below.
2015 Performance Overview
After a reasonable start to the year the market started to deteriorate during the second quarter and continued to decline into the second half. As noted in prior years, end-market demand volatility has long been one of the principal risks faced by the Group and one which we seek to mitigate through maintaining a balanced geographic and product portfolio, along with cost base flexibility. We made progress in both areas: the portfolio balance was enhanced through the acquisition of Sidermes and growth in India and North Asia, partially compensating for the deterioration in the European and NAFTA markets. A variety of restructuring programmes were proactively launched during the year to reduce our cost base, the benefits of which will continue to be felt going forward as we position ourselves for an eventual improvement in the market. Until then we will continue to focus on our business performance, pursue all opportunities to improve our efficiency, maintain our asset and capital bases and remain vigilant for potential market opportunities.
Against a backdrop of a 2.8% contraction in global steel production and very weak investment demand from the commodity sector, Group revenue fell, on an underlying basis, by 7.7% to £1,322m, with underlying trading profit falling by 14.0% to £124.0m. Reductions to operating expenses, due in part to the restructuring programmes, helped limit margin erosion to 70bps and we recorded a return on sales of 9.4% for the year. Earnings per share of 28.1 pence (33.4 pence in 2014) represents an underlying decrease of 17.9%.
The 2015 revenues were below our expectations, but the timing and speed of the market decline means that the year is best understood when split into two halves: the first half where we improved margins and the second half where we reacted quickly to cut costs and try to minimise margin erosion. Sales, trading profit and return on sales, at constant exchange rates, are shown below:
£m 2015 H1 % v H1 2014 2015 H2 % v H2 2014 2015
Sales 689 -2.6% 633 -9.5% 1,322
Trading profit 69.0 -0.4% 55.0 -24.6% 124.0
Return on Sales % 10.0% +20bps 8.7% -170bps 9.4%
Financial Review
Reported
-8.5%Underlying
-7.7%
Revenue
£1,322m
Reported
-13.1%Underlying
-14.0%
Trading profit
£124.0m
Reported
-16.0%Underlying
-17.9%
Headline EPS
28.1p
Reported
-50bpsUnderlying
-70bps
Return on sales
9.4%
“ The market decline means that 2015 is best understood when split into two halves: the first half where we improved margins and the second half where we reacted quickly to cut costs to maintain margin.”Guy Young Chief Financial Officer

Ou
r Perform
ance
35
Dividend
In line with the dividend policy in place since 2012, the Board has recommended a final dividend of 11.125 pence per share to be paid on 20 May 2016 to shareholders on the register at 8 April 2016. When added to the 2015 interim dividend of 5.15 pence per share paid on 25 September 2015, this represents a full year dividend of 16.275 pence per share.
It remains the Board’s intention to deliver long-term dividend growth, provided this is supported by underlying earnings, cash flows, capital expenditure requirements and the prevailing market outlook.
Key Performance Indicators
The following key performance indicators were set and have been reported against consistently since 2013. Details of the indicators are provided on pages 40 and 41. As with prior years, the way in which we measure our results is on an underlying basis, where we adjust to ensure appropriate comparability between periods, irrespective of currency fluctuations and any corporate activity.
This is done by:
> Restating the previous period’s results at the same foreign exchange (FX) rates used in the current period
> Removing the results of disposed businesses in both the current and prior years > Removing the results of businesses acquired in both the current year and prior years
Therefore, for 2015 we have:
> Retranslated 2014 results at the FX rates used in calculating the 2015 results > Removed the results of Sidermes, which was acquired in 2015 > Removed the results of ECIL Met Tec and Process Metrix which were acquired in 2014
Objective: Deliver growth over the long term
KPI: Research & Development spend
We believe that our market-leading product technology and services deliver fundamental value to our customers and that the only way we can continue to deliver that value is to invest significantly in research and development. In 2015 we spent £25.8m (2014: £26.1m) on R&D activities, which represents 2.0% of our revenue (2014: 1.8%).
KPI: Underlying revenue growth
Reported revenue for 2014 was £1,444m, which after FX translation effects of £37m and removing the impact of acquired businesses, was £1,404m on an underlying basis. The reported revenue in 2015 of £1,322m, when adjusted for acquisitions made, was £1,296m – which equates to an overall reduction of 7.7% year-on-year. The reduction of 7.7% is made up of a 9.7% decline in underlying revenue in the Steel division and a more moderate 3.3% decline in the Foundry division. This reflects the different end-markets of the two businesses and, to a lesser degree, the different regional components of each.

36 Section TwoOur Performance
Vesuvius plcAnnual Report and Accounts 2015
Financial Review continued
Regional underlying growth was strongest in India, which saw a 10% improvement over last year in Group sales and was positive across all businesses. Group sales growth was also positive in North Asia, although this was due to Steel alone with Foundry recording a marginal decline. NAFTA was the region with the largest decline (18%) and was predominantly driven by Steel on the back of regional steel production weakness and the adverse impact of cheap imports on local production, made worse by the strengthening US dollar. Europe too fared badly with a 7% drop in sales, again driven mainly by Steel and for the same macro reasons as NAFTA.
The reasons for the market decline and sales shortfalls in the short term are well understood and protectionist measures being put in place may improve the situation temporarily. Beyond 2016, however, our strategy to continue to diversify geographically is how we aim to compensate for what is likely a longer-term trend of decline in more mature markets.
Objective: Deliver attractive profitability
KPI: Trading profit and return on sales
We continue to measure both the absolute trading profit of the Group as well as taking profit as a percentage of sales, which we refer to as the return on sales or RoS.
Trading profit of £124.0m was a decrease of £18.8m on 2014, which, on an underlying basis, is a decline of 14%. RoS was 9.4% in 2015 which represents a return to 2013 levels of profitability, albeit in arguably more difficult trading circumstances. RoS in 2014 was 10.1% on an underlying basis.
Similar to the sales results discussed above, the trading profit and RoS in the businesses show a reasonably broad range. Steel recorded a RoS of 8.9% this year, a decline from the 9.8% in 2014. Foundry on the other hand reported a 10.5% RoS, which was a hard fought improvement over the 10.0% reported in 2014. Key to the margins enjoyed in both businesses was the reduction in operating expenses, largely as a result of restructuring programmes, launched throughout the year. These are discussed in more detail below.
KPI: Headline PBT and EPS
Headline profit before tax (PBT) and earnings per share (EPS) are used to measure the underlying financial performance of the Group. The main difference between trading profit and PBT is net finance costs.
Net finance costs in 2015 of £15.4m were £1.0m below 2014. Net finance costs include interest payable on our borrowings, part of which were renegotiated this year at more favourable rates, as well as interest on pension obligations and unwinding of provisions. The key changes in 2015 were lower arrangement fees and lower interest on pension obligations.
Our Headline PBT was £108.6m, 15.0% behind last year. Including amortisation and the exceptional restructuring charges of £14.6m, our PBT fell to £77.4m which was 30.4% less than 2014. Headline EPS at 28.1p is 16.0% lower than 2014.
2013
2014
2015
Regular dividend growth pence
16.275p +0.9%
16.275
16.125
15.000 2013
2014
2015
* At constant 2015 currency
R&D spend* £m
£25.8m -1.2%
25.8
26.1
25.3 2013
2014
2015
Underlying revenue growth %
-7.7% -7.7
3.5
-0.8

Ou
r Perform
ance
37
Objective: Ensure capital is deployed efficiently
KPI: Free cash flow and working capital
Key to ensuring we have adequate capital to execute our corporate strategy is converting our profits into cash, partly through strict management of our working capital. Free cash flow from continuing operations was £65.3m for the year, 10.3% ahead of 2014. There are two key drivers of this: lower capital expenditure and high cash conversion of profits. Capital expenditure was curtailed from the second quarter of 2015 as soon as the degree of market weakness became evident. Our cash conversion in 2015 was 100.3%, an improvement over last year, due to a combination of working capital management and the decline in sales. As sales reduce, so too do our debtors, and as long as stock levels are tightly managed, over time this generates cash.
We measure working capital both in terms of actual cash flow movements, and as a percentage of sales revenue. Trade working capital as a percentage of sales in 2015 was 26.3% (2014: 24.8%), measured on a 12-month moving average basis. Absolute values of working capital reduced, but not to the same extent as the contraction in sales. A significant contributor to that was difficulty in getting prompt payment from some bigger customers at year-end.
KPI: Return on net assets (RONA)
RONA is our principal measure of capital efficiency. We do not exclude the results of businesses acquired and disposed from this calculation as capital efficiency is an important consideration in our portfolio decisions. It is calculated by dividing trading profit plus our share of profits from joint ventures by our average operating assets (property, plant and equipment, and trade working capital).
As with most of our KPIs, we measure this on a 12-month moving average basis at constant currency to ensure we focus on sustainable underlying improvements. Our RONA for 2015 was 21.1% (2014: 25.5%), driven by a greater decline in profits than the decrease in asset base.
Objective: Maintain a strong financial position
KPI: Interest cover and net debt
As at 31 December 2015, the Group had committed borrowing facilities of £532.4m (2014: £647.4m), of which £181.1m were undrawn (2014: £343.5m). The changes reflect a successful replacement of the previous £425m multi-currency revolving credit facility, which was due to expire in April 2016, with a new multi-currency credit facility of £300m repayable in June 2020. Under the arrangements of the new revolving credit facility (taken out in June 2015) the Group has the option until the end of 2016 to increase the amount of committed funds by up to £200m either from the existing bank group or by introducing additional banks on the same lending terms. This provides us with sufficient debt capacity for the short term.
Net debt as at 31 December 2015 was £291.6m, a £23.3m increase over 2014. The main driver of the increase was the acquisition of Sidermes during the year.
2013
2014
2015
Return on sales* %
9.4% -70bps
9.4
10.1
9.4
* At constant 2015 currency
2013
2014
2015
Headline earnings per share pence
28.1p -16.0%
28.1
33.4
31.9 2013
2014
2015
RONA moving average %
21.1% 21.1
25.5
24.4

38 Section TwoOur Performance
Vesuvius plcAnnual Report and Accounts 2015
Financial Review continued
The Group’s debt facilities have two financial covenants: the ratios of net debt to EBITDA (maximum three times limit) and EBITDA to interest (minimum four times limit). These ratios are monitored regularly to ensure the Group has sufficient financing available to run the business and fund future growth. At the end of 2015, the net debt to EBITDA ratio was 1.8x, an increase on the prior year’s 1.5x and EBITDA to interest was 11.7x, versus the 13.1x last year. Although more geared than 2014, the Group remains well within its covenants.
Further information on our finance costs can be found in note 10 to the Consolidated Financial Statements on page 125.
Financial Risk Factors
The Group undertakes regular risk reviews and at a minimum a full risk assessment process twice a year. In 2015 this included input from the Board in both the assessment of risk and the proposed mitigation. Having recently completed the assessment and as referred to in the Viability section on page 25, we continue to consider the main financial risks faced by the Group as being end-market demand volatility and foreign exchange. Important but lesser risk exists also in interest rate movements and cost inflation but neither is expected to have a material impact on the business after considering the controls we have in place. The financial risks we associate with end-market demand volatility include: reduced revenue; potential customer failures; and declines in general market demand. As discussed in the introduction above, and elsewhere in this report, our key mitigation of end-market demand volatility is to manage the Group’s exposure through balancing our portfolio of business geographically and by end-market. We do so through targeted capital investment in new and growing businesses and a combination of capital and human resource in emerging markets. The second main financial risk is foreign exchange, which is inherent in the international business we have. We operate in many countries, the results of which are recorded in local currency and then translated into sterling. As sterling strengthens against the local currency, so the reported Group results for that country will reduce. The stronger pound resulted in reported sales being £42m lower in 2015. Where possible we align the cost structure with revenue as best we can in order to mitigate foreign exchange exposure.
Other Relevant Financial Information
Restructuring
As noted previously, we undertook a broad range of restructuring programmes during the year in response to the significant declines in the majority of our end-markets. Unlike last year, where the amount and extent of restructuring charges were immaterial, this year’s programmes covered all Business Units and involved a material number of redundancies across the Group. Costs incurred were predominantly on redundancy and outplacement and largely paid by December. We are carrying a restructuring provision forward into 2016 of £6.5m along with a historic onerous lease provision of £3.3m.
2013
2014
2015
Nebt debt £m
£291.6m 291.6
268.3
256.4 2013
2014
2015
Unutilised committed debt facilities £m
£181.1m 181.1
343.5
328.6

Ou
r Perform
ance
39
Taxation
The Group’s effective tax rate, based on the income tax costs associated with headline performance of £27.7m (2014: £32.9m), was 25.5% in 2015 (2014: 26.0%)
The income tax credit on separately reported items of £2.9m (2014: £25.8m) comprises non-cash deferred tax movements relating to the amortisation of a deferred tax liability arising from the 2008 acquisition of Foseco plc (£4.7m; 2014: £4.0m) and tax credits relating to restructuring charges (£1.5m; 2014: £nil) and a reduction in the deferred tax asset previously recognised in respect of US tax losses and certain other temporary differences (£3.3m; 2014: £21.8m credit).
The net income tax credit recognised directly in the Group statement of comprehensive income of £1.6m (2014: £0.5m) comprises £0.9m (2014: £0.5m) in respect of deferred tax on pension obligations and £0.7m (2014: nil) in respect of exchange differences.
Capital expenditure
Capital expenditure in 2015 of £35.0m (2014: £53.5m) comprised £24.4m in the Steel division (2014: £28.6m) and £10.6m in the Foundry division (2014: £24.9m). The reduction in 2015 was in recognition of weaker end-markets and in order to preserve cash as profits reduced. Capital expenditure on revenue generating customer installation assets has been maintained at £6.2m (2014: £6.2m).
Pensions
The Group has a limited number of historical defined benefit plans mainly in the UK, US, Germany and Belgium. The main plans in the UK and US are largely closed to further benefit accruals and 57% of the liabilities in the UK have already been insured. The total net deficit attributed to these defined benefit obligations at the end of December 2015 was £35.3m (2014: £51.1m), representing an improvement of £15.8m. This is mainly due to: an increase of £9.0m in the surplus of the UK defined benefit plan due to decreasing long-term inflation expectations and more deferred pensioners transferring out of the defined benefit scheme; the additional voluntary contributions of £3.7m into the UK and US plan; and the completion of a triennial valuation of the defined benefit obligations in Belgium confirmed £3.0m of experience gains attributed to benefits paid out over the last three years.
The higher discount rates assumed for all the plans led to a lower defined benefit liability valuation of £25.0m, but this was offset by a £25.2m reduction in the value of the pension plans’ asset values, mainly in the UK and USA.
The majority of the ongoing pension plans are defined contribution plans, where our only obligation is to make contributions, with no further commitments on the level of post-retirement benefits. During 2015 £10.7m (2014: £9.2m) of contributions were made into the plans and charged to trading profit.
Corporate activity
In the first half of the year we acquired Sidermes in Italy for £23.8m, as a continuation of our strategy to build our technical services business. We continue to focus on acquisitions to reinforce our growth opportunities whilst maintaining a balance in the portfolio of the Group.
Guy Young Chief Financial Officer3 March 2016
2013
2014
2015
Net defined benefit pension deficit £m
£35.3m -30.9%
35.3
51.1
47.9
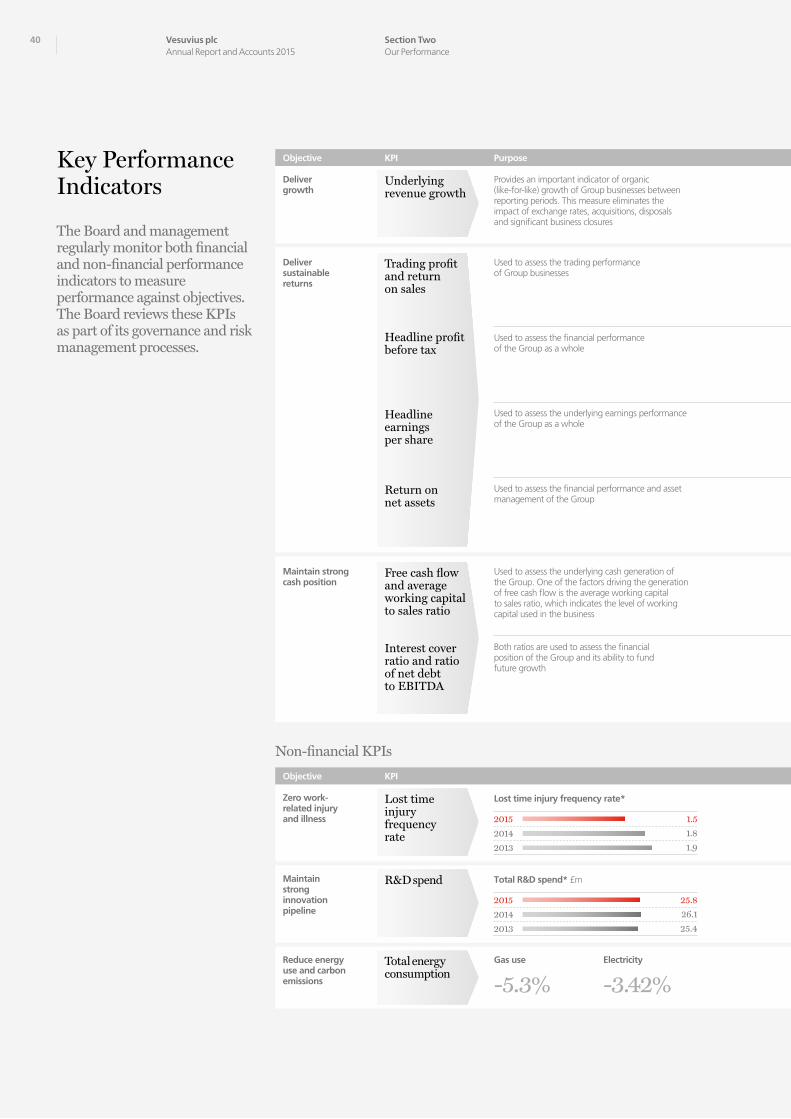
40
Deliver sustainable returns
Maintain strong cash position
Trading profit and return on sales
Free cash flow and average working capital to sales ratio
Interest cover ratio and ratio of net debt to EBITDA
Headline profit before tax
Used to assess the trading performance of Group businesses
Used to assess the underlying cash generation of the Group. One of the factors driving the generation of free cash flow is the average working capital to sales ratio, which indicates the level of working capital used in the business
Both ratios are used to assess the financial position of the Group and its ability to fund future growth
Used to assess the financial performance of the Group as a whole
Non-financial KPIs
Deliver growth
Provides an important indicator of organic (like-for-like) growth of Group businesses between reporting periods. This measure eliminates the impact of exchange rates, acquisitions, disposals and significant business closures
Objective KPI Purpose
Gas use
-5.3%Electricity
-3.42%
Return on net assets
Used to assess the financial performance and asset management of the Group
Zero work- related injury and illness
Maintain strong innovation pipeline
Reduce energy use and carbon emissions
Lost time injury frequency rate
R&D spend
Total energy consumption
Headline earnings per share
Used to assess the underlying earnings performance of the Group as a whole
Key Performance Indicators
The Board and management regularly monitor both financial and non-financial performance indicators to measure performance against objectives. The Board reviews these KPIs as part of its governance and risk management processes.
Underlying revenue growth
40 Section TwoOur Performance
Vesuvius plcAnnual Report and Accounts 2015
2013
2014
2015
Lost time injury frequency rate*
1.5
1.8
1.9
2013
2014
2015
Total R&D spend* £m
25.8
26.1
25.4
Objective KPI

Ou
r Perform
ance
41
Delivery of value to shareholders is linked to remuneration through the Vesuvius Share Plan, which links the vesting of 50% of each award to total shareholder return
Read more about Remuneration on p82-102
EPS is linked to remuneration as a measure used in annual incentive awards and the Vesuvius Share Plan
Read more about Remuneration on p82-102
Working capital performance is linked to remuneration through the working capital ‘kicker’ applied to annual incentive awards
Read more about Remuneration on p82-102
Performance Link to remuneration
Interest cover
11.7xNet debt to EBITDA
1.8x
* Work-related illness or injuries which resulted in an employee being absent for at least one day – measured per million hours worked.
Read more about Safety on p58-59
* Constant 2015 currency.
Read more about Sustainability on p60-61
41
Ou
r Perform
ance
2013
2014
2015
Trading profit £m
124.0
142.8
140.0
2013
2014
2015
Underlying revenue growth %
-7.7
3.5
-0.8
2013
2014
2015
Profit before tax £m
77.4
111.2
104.1
2013
2014
2015
Headline EPS pence
28.1
33.4
31.9
2013
2014
2015
Return on net assets %
21.1
25.5
24.4
2013
2014
2015
Free cash flow £m
65.3
59.2
94.9 2013
2014
2015
Average working capital to sales %
26.3
24.8
24.7
2013
2014
2015
Return on sales %
9.4
9.9
9.3

42 Section TwoOur Performance
Vesuvius plcAnnual Report and Accounts 2015
Operating Review Steel Division
Providing Flow Control, Advanced Refractories and Technical Services solutions for the global steel industry.
The Steel Division
Vesuvius is a global leader in molten metal flow engineering. We achieve this by working closely with our customers to develop customised refractories, systems, services and technologies that enable them to improve their performance. The three businesses that comprise the Steel division are Steel Flow Control, Advanced Refractories and Technical Services.
Our Flow Control products and systems are used extensively in the continuous casting process, enabling steel to be cast without interruption, while protecting it from the atmosphere when passing through the production process. Avoiding atmospheric contact significantly reduces contamination levels in the steel. Thus the quality, reliability and consistency of our products are critical in the quality of the finished metal being produced and the productivity, profitability and safety of our customers’ process.
Vesuvius’ Advanced Refractories business supplies the steel industry and other process industries with high performance refractory materials used for lining vessels such as blast furnaces, ladles and tundishes to enable them to withstand high temperatures and/or corrosive attack. These refractory lining materials are supplied in the form of powder mixes, which are spray-applied or cast onto the vessels to be lined (‘monolithics’), or in pre-cast shapes and bricks.
Our newly established Technical Services business complements existing product lines by bringing new services to our existing customers. Technical Services focuses on the capture of key manufacturing data, combining this with Vesuvius’ strong presence and refractory expertise in metal casting to create new technologies and develop integrated expert process management systems.
The Steel Production Process and Vesuvius
Our products can have a short service life (often a matter of a few hours) due to the significant wear caused by the high temperature, high thermal cycling and the erosive and corrosive attacks they suffer. Due to the specialised nature of our products and the high volume in which these products are consumed, Vesuvius has developed close, collaborative relationships with customers together with an extended global manufacturing network aligned with customer locations. Vesuvius focuses on gaining
2013
2014
2015
Steel revenue £m
£897.6m -8.5%
897.6
981.4
1,017.3 2013
2014
2015
Steel trading profit £m
£79.5m -17.5%
79.5
96.4
88.7 2013
2014
2015
Steel return on sales %
8.9% -100bps
8.9
9.8
8.7

Ou
r Perform
ance
43
a fundamental understanding of customer processes and delivering systems and products that are mission-critical for the demanding applications in which they are used.
Market Dynamics
Customers of the Steel division are principally steel producers and manufacturers of steel production equipment. In addition, the Advanced Refractories business supplies other high-temperature industries such as petrochemicals and cement, and therefore around 7% of revenues in the Steel division arise from non-steel-related process industries.
For our consumable products, steel production volumes are the critical driver of demand, particularly in the production of higher-quality steels where our highly technical products deliver the most value. Steel producers are continually striving to enhance their processes – reducing downtime and labour, increasing steel quality, reducing energy usage, and enhancing metallurgical accuracy – parameters in which our existing consumables and solutions can be combined with our developing technical services offering to deliver value through better productivity, quality and safety.
The Global Steel Market in 2015
According to the World Steel Association, global steel production decreased by approximately 2.8% in 2015 compared with the previous year. The overall market decline was driven mainly by decreased production in North America of 8.6%, in China of 2.3%, and in the European Union of 1.8%. These decreases were partially offset by an increase in production of 2.6% in India.
Steel Flow Control
Financial performance in 2015
Steel Flow Control reported revenues of £492.5m for 2015 representing a 9.1% decrease on the previous year. On an underlying basis, revenue was down by 7.4% on 2014 levels. In challenging market conditions, China, India, North Asia and South America all made a positive contribution to revenue growth whilst revenues in EMEA and NAFTA, which together account for 70% of underlying revenue, were adversely impacted by a significant decline in steel production. In particular, production declined in the US and the UK, aggravated by the strong US dollar and sterling.
“ In a challenging year we maintained our investment in innovation and high technology solutions for customers.” Chris Abbott President, Flow Control

44 Section TwoOur Performance
Vesuvius plcAnnual Report and Accounts 2015
Whilst continuing to deliver high-quality products to our customers, we maintained tight control of costs to ensure that our prices remained competitive. In addition, given the adverse trading conditions, a restructuring programme was implemented, predominantly in Europe and NAFTA, to align the business with market changes, making permanent adjustments to our manufacturing and overhead structure. We also focused upon optimising cost within our supply chain and enlarging multiple sourcing of materials, whilst maintaining consistent quality. This remains an active ongoing initiative.
Our Lean manufacturing process model continues to help protect margins. During the year we gave particular focus to improved process yields, energy efficiency and productivity. We remain committed to driving efficiencies within our supply chain using our network of Lean engineers. In addition, we also realised cost benefits from optimising our logistics – particularly in Europe and NAFTA – with further opportunities for improvement in 2016.
Customised innovative refractory technologies continue to drive value for our customers
We believe that our programme of research and development is unparalleled within our industry, as it leverages our industry-wide experience and global reach. Focusing research in a small number of centres of excellence allows us to concentrate knowledge for maximum effectiveness, with customisation undertaken in parallel at regional development centres established in all major markets. This geographical coverage allows our development teams to remain close to our customers and respond to their immediate requirements.
Our Flow Control products create value for our customers by improving the efficiency of their manufacturing processes and the quality of their end products. New products and solutions continue to underline this philosophy, notably our innovative, technical solutions around the continuous caster. As a leader in refractory technology we made progress in 2015 with a number of innovations in line with our Group strategy including:
> Cold Start Technology – allowing operational flexibility and cost saving for our customer > Swirling Sub-entry Nozzle – improving steel quality and microstructure in bloom casters > Edge Port Sub-entry Nozzle – improving steel quality by reducing longitudinal face cracking and slivers in slab applications
Solutions through technology
Our continued investment in leading-edge modelling and simulation capabilities, combined with our intimate understanding of customer processes, means we remain ideally placed to create tailor-made systems and refractories to optimise the flow of molten metal within the tundish and mould. Our Solutions group champions ‘Solutions Through Technology’, an approach fundamental to the Flow Control business model.
Operating Review – Steel Division continued

Ou
r Perform
ance
45
Utilising state of the art modelling we determine the design and shape of the product, combining this with our deep technical expertise in material selection. These customised refractories are then increasingly combined with instrumentation to facilitate data capture. With the increase in size and weight of refractories, and the inherent safety risk associated with installation, our solutions also consider the handling and manipulation requirements. We then support our solutions with superior service, from proximate manufacturing facilities and application specialists present in the majority of steel plants. This approach, integrating systems, instrumentation, refractories and handling, delivers a value proposition to customers, which no other refractory or equipment manufacturer can match.
We continue to develop new capabilities to monitor and control the process around the mould and tundish combined with data capture technology from our Technical Services business. A number of solutions incorporating these capabilities successfully completed alpha testing with customers and were launched in 2015, including:
> A new mould flux feeder, which regulates flux application to optimise the thickness in the mould and measure the quantity consumed. This delivers significant cost savings and application consistency, and is in use in a number of our customers in NAFTA
> Our robotic casting technology range, which has been further extended with the introduction of six robotic installations in Korea during 2015 on the ladle operating platform, integrating oxygen lancing, temperature and gas measurement, and tundish powder feeding. This solution delivers operational consistency, reduced operator exposure and improved safety
> An integrated solution in a new bloom caster in Asia, where we offer a fully integrated solution including LTC13 Ladle Gate System™, IPV Purging Plug Mechanism, Stopper Rigging, C52 Tundish Gate System™, XLEV Mould Level Sensor, Accuoptix™ Continuous Temperature Measurement, robotics and all associated refractory products.
Strategies to maintain future growth
Momentum for future business growth is expected to come from continuing to market our innovative, high value, process enhancing products and services, and increasing the penetration of these products into developing markets. In 2015 we strengthened our industrial marketing capabilities with the further development of our bespoke customer management tool, to support marketing our innovations to the wider audience of customers we believe can benefit from them.
Investment in manufacturing capability to support growth and improve responsiveness
The emerging markets are large producers and consumers of steel. To support our growth in these markets we maintain a strong regional manufacturing capability which, combined with local product development centres, places us within easy reach of our developing market customers.
In 2015 we increased our manufacturing capability in both China and India with the latest processing equipment, which supports rapid prototyping of our innovative systems and shortens the lead time to complete alpha and beta product testing. We also further enhanced our manufacturing facility in Brazil, to improve the processing of our products, which combined with the investment in 2014, enables us to improve production flexibility and quality consistency.

4646 Section TwoOur Performance
Vesuvius plcAnnual Report and Accounts 2015
Operating Review – Steel Division continued
Advanced Refractories
Financial performance in 2015
Advanced Refractories reported revenues of £378.7m for 2015, representing a reduction of 13.1% compared with 2014. On an underlying basis the year-on-year revenue decrease was 12.7% on 2014 levels, with performance down globally, due to the challenging conditions in our mature markets.
Our trading environment remains extremely competitive with steel production decreasing in all major regions of the world. In our mature markets, NAFTA performance was impacted by lower-cost steel imports and the declining price of oil, particularly in the sheet and tubular production segments. Currency fluctuations impacting the Euro had a measurable effect on raw material costs. The continued political instability in Eastern Europe and weak demand from the Middle East impacted profitability in our EMEA operations. Low-cost steel imports also impacted South America and South East Asia, reducing expected progress on new steel capacity expansion. In the growth markets of North Asia and India our position strengthened in line with expectations and we also benefited from the improved performance in Australia owing to the past investment in our manufacturing capabilities in Bulli.
Raw materials, restructuring, improved customer relationships
Our immediate response to the challenging economic conditions was an expanded focus on optimising cost and quality within our supply chain through efficiencies in raw material sourcing and substitutions to take advantage of the commodity cycles. Simultaneously, we took advantage of available raw material substitutions and optimised our product formulations to increase purchasing leverage and drive down our cost base.
In addition to our raw material initiatives, we implemented a detailed restructuring programme to align our assets to the level of activity in our mature markets focusing critical resources closer to our customers. This restructuring has also provided the opportunity to reorganise in other geographies to be more effectively positioned in future growth areas.
Central to Advanced Refractories’ success is our sustained engagement with customers. In the current economic background our customers rely on our solutions to help optimise their processes and we continue to benefit from our strong customer relationships in our core areas of expertise.
“ Under difficult trading conditions in 2015, Advanced Refractories maintained focus on safety, innovation, quality and cost efficiency to ensure that the mid and longer-term strategic vision is delivered.”Tanmay Ganguly President, Advanced Refractories

Ou
r Perform
ance
47
Ou
r Perform
ance
47
New product developments
Despite our challenging end-markets, we continued our focus on product and process innovation. In 2015 we made progress with a number of technological developments responding to diverse customer demands, such as health and safety and efficiency and productivity gains, with innovative solutions. We developed and installed three state-of-the-art robotic tundish spray lining application systems in the NAFTA region – a system which meets the latest HSE automated safety guidelines and delivers consistent quantities of our advanced refractories in the tundish. Plans are already in place to deliver this technology to other regions within the global market. We also developed and expanded the use of semi-automatic dry vibratable installation equipment which allows for rapid relining of multiple tundishes and also complies with new safety requirements.
We continued our focus on the growing aluminium melting and holding furnace segment, with the supply of Alugard* pump-cast and precast solutions, which are able to extend furnace life by reducing refractory wear owing to improved abrasion and corrosion resistance. By reducing the need for mid-campaign repairs we have been able to deliver to our customer a significant improvement in furnace productivity.
We have developed two improved products for reheat furnaces capitalising on our existing offering, enhancing throughput and temperature efficiency. By combining state-of-the-art equipment with a novel approach to the application process and improved insulation characteristics, it has been possible to reduce the energy burden of the furnace and significantly reduce the carbon footprint of our customers. An added benefit is the exclusion of potentially environmentally hazardous fibre commonly used in these applications.
Finally, our trials of low carbon brick and low carbon/hydrogen tundish lining systems together with inert tundish barrier products are showing that these solutions enhance the thermal behaviour of the refractory, reduce the potential for carbon and hydrogen pick-up in the molten metal, and improve overall refractory life – all of which positively impact steel quality.
Operational improvements
We continue to expand our focus on world class safety practices and our continuing efforts in the future will focus on delivering improvements within our customer-facing service and support teams.
Our ability to service and capture market share in the ironmaking segment were enhanced by expanded taphole clay manufacturing capabilities in NAFTA and India.
In 2015 Advanced Refractories continued the implementation of advanced quality planning techniques in our production facilities as part of the wider Lean initiative. The positive effects of these process changes continue to enhance product consistency and reliability with the added benefit of improving margins.
* Trademark(s) of the Vesuvius Group registered in certain countries
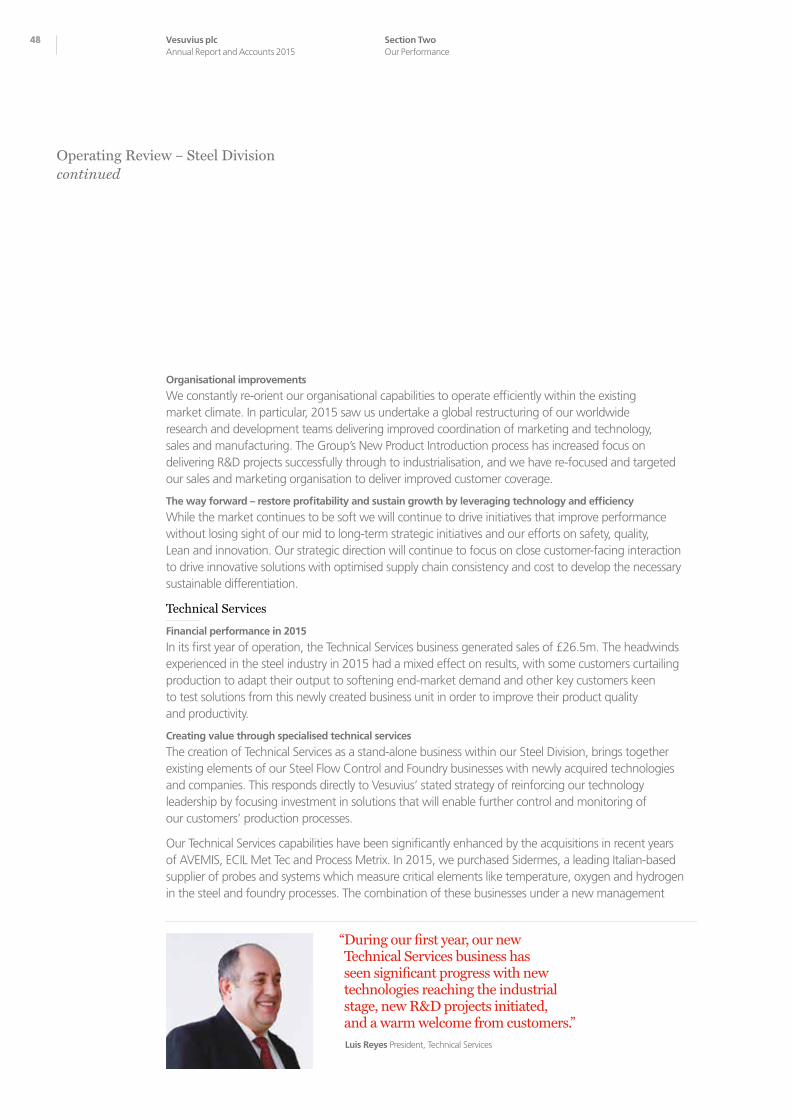
48
Organisational improvements
We constantly re-orient our organisational capabilities to operate efficiently within the existing market climate. In particular, 2015 saw us undertake a global restructuring of our worldwide research and development teams delivering improved coordination of marketing and technology, sales and manufacturing. The Group’s New Product Introduction process has increased focus on delivering R&D projects successfully through to industrialisation, and we have re-focused and targeted our sales and marketing organisation to deliver improved customer coverage.
The way forward – restore profitability and sustain growth by leveraging technology and efficiency
While the market continues to be soft we will continue to drive initiatives that improve performance without losing sight of our mid to long-term strategic initiatives and our efforts on safety, quality, Lean and innovation. Our strategic direction will continue to focus on close customer-facing interaction to drive innovative solutions with optimised supply chain consistency and cost to develop the necessary sustainable differentiation.
Technical Services
Financial performance in 2015
In its first year of operation, the Technical Services business generated sales of £26.5m. The headwinds experienced in the steel industry in 2015 had a mixed effect on results, with some customers curtailing production to adapt their output to softening end-market demand and other key customers keen to test solutions from this newly created business unit in order to improve their product quality and productivity.
Creating value through specialised technical services
The creation of Technical Services as a stand-alone business within our Steel Division, brings together existing elements of our Steel Flow Control and Foundry businesses with newly acquired technologies and companies. This responds directly to Vesuvius’ stated strategy of reinforcing our technology leadership by focusing investment in solutions that will enable further control and monitoring of our customers’ production processes.
Our Technical Services capabilities have been significantly enhanced by the acquisitions in recent years of AVEMIS, ECIL Met Tec and Process Metrix. In 2015, we purchased Sidermes, a leading Italian-based supplier of probes and systems which measure critical elements like temperature, oxygen and hydrogen in the steel and foundry processes. The combination of these businesses under a new management
48 Section TwoOur Performance
Vesuvius plcAnnual Report and Accounts 2015
“ During our first year, our new Technical Services business has seen significant progress with new technologies reaching the industrial stage, new R&D projects initiated, and a warm welcome from customers.” Luis Reyes President, Technical Services
Operating Review – Steel Division continued
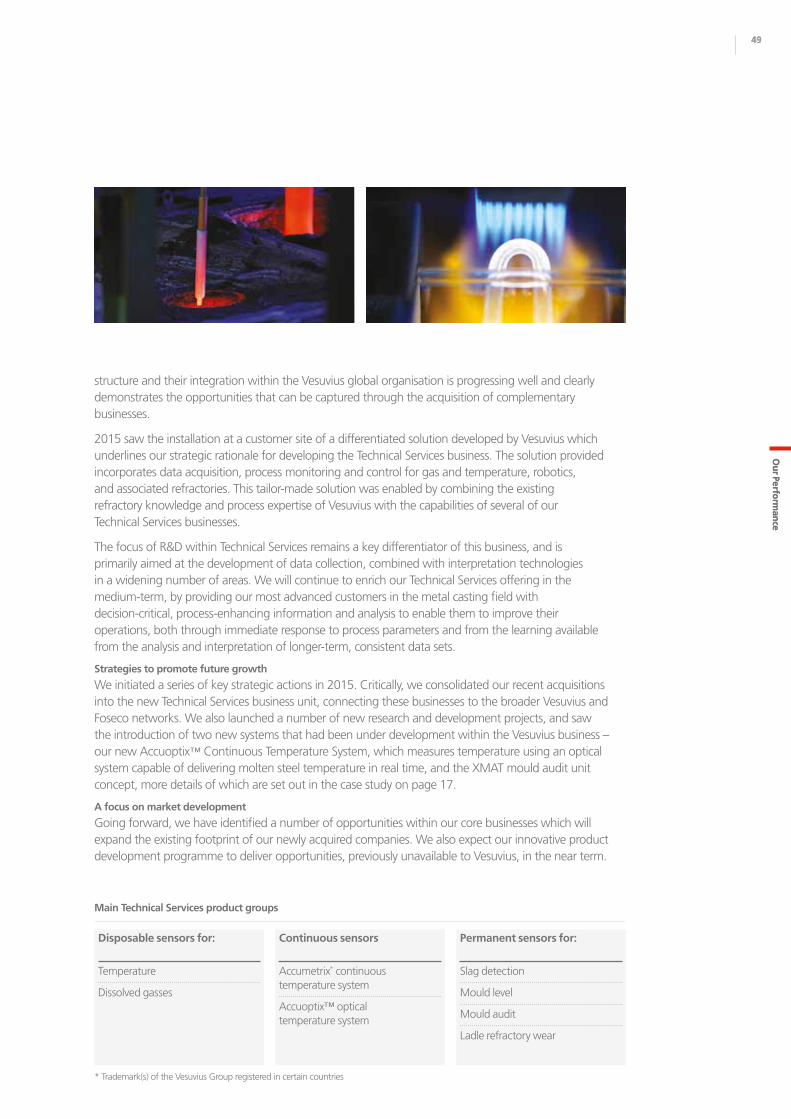
Ou
r Perform
ance
49
structure and their integration within the Vesuvius global organisation is progressing well and clearly demonstrates the opportunities that can be captured through the acquisition of complementary businesses.
2015 saw the installation at a customer site of a differentiated solution developed by Vesuvius which underlines our strategic rationale for developing the Technical Services business. The solution provided incorporates data acquisition, process monitoring and control for gas and temperature, robotics, and associated refractories. This tailor-made solution was enabled by combining the existing refractory knowledge and process expertise of Vesuvius with the capabilities of several of our Technical Services businesses.
The focus of R&D within Technical Services remains a key differentiator of this business, and is primarily aimed at the development of data collection, combined with interpretation technologies in a widening number of areas. We will continue to enrich our Technical Services offering in the medium-term, by providing our most advanced customers in the metal casting field with decision-critical, process-enhancing information and analysis to enable them to improve their operations, both through immediate response to process parameters and from the learning available from the analysis and interpretation of longer-term, consistent data sets.
Strategies to promote future growth
We initiated a series of key strategic actions in 2015. Critically, we consolidated our recent acquisitions into the new Technical Services business unit, connecting these businesses to the broader Vesuvius and Foseco networks. We also launched a number of new research and development projects, and saw the introduction of two new systems that had been under development within the Vesuvius business – our new Accuoptix™ Continuous Temperature System, which measures temperature using an optical system capable of delivering molten steel temperature in real time, and the XMAT mould audit unit concept, more details of which are set out in the case study on page 17.
A focus on market development
Going forward, we have identified a number of opportunities within our core businesses which will expand the existing footprint of our newly acquired companies. We also expect our innovative product development programme to deliver opportunities, previously unavailable to Vesuvius, in the near term.
Ou
r Perform
ance
49
Disposable sensors for:
Temperature
Dissolved gasses
Continuous sensors
Accumetrix* continuous temperature system
Accuoptix™ optical temperature system
Permanent sensors for:
Slag detection
Mould level
Mould audit
Ladle refractory wear
Main Technical Services product groups
* Trademark(s) of the Vesuvius Group registered in certain countries

50 Section TwoOur Performance
50 Vesuvius plcAnnual Report and Accounts 2015
Operating Review Foundry Division
The Foundry Division
Our Foundry division trades under the Foseco brand, and generates about 30% of total Group revenue. Foseco is a world-renowned name that has become a by-word for reliability, technology and service in the supply of consumable products and associated services to the foundry industry.
Vesuvius in the Foundry Industry
The vehicle sector, comprising light vehicles (passenger cars and light trucks) and heavy trucks generates approximately 40% of worldwide castings, and a similar percentage of the revenue for the Foundry division. Other end-markets for foundry castings include machinery for the agriculture, construction and mining industries, power generation equipment, railroad and general engineering sectors. Our customers include the world’s major automotive OEMs, truck producers and equipment manufacturers. Whilst Foseco products typically represent less than 5% of a foundry’s production cost, they contribute significantly to improving product quality and manufacturing efficiency, while reducing the environmental impact of the casting process. Combined with our computer modelling, flow simulation and methoding capabilities, significant process efficiencies can be generated by Foseco.
The Global Foundry Industry in 2015
The worldwide foundry market continued to be affected by difficulties within the agriculture, construction and mining industries, resulting from the general decline in commodity and precious metal prices. We saw reduced investment worldwide with the largest impacts in the US, China, Brazil, Indonesia and Australia, and delays to new projects resulting in reduced demand for foundry castings for the extractive industries as well as those used for related equipment and vehicles.
Light vehicle (i.e. passenger cars and light trucks) production globally was up year-on-year (1.5%) in 2015, but global heavy truck output declined 6.2%. Light vehicle production increases in India (+4.8%), China (+4.2%) and NAFTA (+3.4%) were partially offset by declines in South America (-18.5%) and Asia (-3.3%). Significant heavy truck output decreases in South America (-40.1%) and China (-28.2%) were partially offset by increases in NAFTA (+8.3%) and Europe (+7.6%).
“ In a year of weak end-markets, we continued our strategic focus on marketing and technology, investment in R&D, development of high-quality production facilities and very strict cost control.”Glenn Cowie President, Foundry

Ou
r Perform
ance
5151
Financial Performance in 2015
The Foundry division reported revenues of £424.4m in 2015, representing a decrease of 8.4% compared with 2014. On an underlying basis revenue was down by 3.3%. However profitability improved by 2.7% as a result of a series of self-help measures designed to offset the marked impact of reduced activity in our traditionally higher-margin emerging markets.
In emerging markets such as Ukraine, Thailand and Brazil, where we have traditionally experienced good volumes and margins, we continued to suffer from political and economic instability. We also saw reduced revenues in Australia, South Africa and Indonesia, as production declines in the auto sectors and extractive industries affected demand for foundry castings. We achieved a solid performance in India with sales up 13%, benefiting from increased light vehicle and truck production, up 5% and 28%, respectively.
Revenue in Europe was flat, as increases in light vehicle production of 4.3% and heavy truck production of 7.6% were offset by reductions in mining, construction, railroad and windmill castings. Central Europe and the Middle East were most impacted by the reduced activity levels. In addition, Russia’s weak rouble made the import of foundry consumables cost-prohibitive.
Underlying revenue in NAFTA decreased by 9.2% due to weakness in the agriculture, construction and mining industries. Several foundries announced closures of their US operations, moving production overseas. Partially offsetting this was good growth in our Mexico operations. In South America, underlying revenue dropped 13.1%, with Brazil experiencing a 18.5% drop in light vehicle production and a 40.1% reduction in heavy vehicle output, and considerably reduced mining activity. To combat this drop off, we increased our focus in Chile and Argentina.
In Asia-Pacific, Chinese underlying revenue dropped 7.4% due to reduced heavy truck and mining activity. Sales in Thailand were impacted by reduced light vehicle production and mining activity. In Australia and Indonesia continued deterioration of casting demand in mining reduced Foundry sales in both countries.
As with the other businesses in Vesuvius, we initiated a global cost reduction and restructuring programme to respond to the challenging end-market conditions, and shape the division for the future. This was undertaken predominantly in our more mature markets of Europe and NAFTA, and was aligned with our ongoing Lean initiatives, which continued to focus on manufacturing efficiency and controls and logistics.
2013
2014
2015
Foundry revenue £m
£424.4m -8.4%
424.4
463.0
493.0 2013
2014
2015
Foundry trading profit £m
£44.5m -4.2%
44.5
46.4
51.3 2013
2014
2015
Foundry return on sales %
10.5% 50bps
10.5
10.0
10.4

5252 Section TwoOur Performance
Vesuvius plcAnnual Report and Accounts 2015
Operating Review – Foundry Division continued
Partners in Value Creation
Our business strategy and the Vesuvius business model promote high-value generation for our customers, helping them deliver better quality castings and enhancing their processes and efficiency. As the global foundry industry evolves, this approach enables Foseco to capitalise on our deep understanding of customers’ priorities for growth and process improvement, leveraging our excellence in product innovation.
Our Global Reach
Our worldwide presence forms the foundation of our business model. We embed technical experts at customer premises, which enables them to identify potential process improvements in cooperation with their customers. We have established a network of technology centres, in which we have amassed huge expertise in developing solutions that incorporate engineered systems and high-value consumables. These solutions are industrialised in our geographically dispersed manufacturing base, which leverages our global expertise whilst being deliberately located as close as possible to our customers.
This combination of product expertise and service delivery ensures that all our customers receive solutions that are tailor-made to their specific needs and opportunities, supplied on a reliable, just-in-time and competitively priced basis. From the Foundry division’s perspective, this model is:
> Resilient to end-market cycles, due to the flexibility of our diversified manufacturing footprint and adjustable cost base
> Profitable, as it allows value pricing for bespoke products > Growth generating, as markets can be expanded by creating additional innovative products and solutions
As customer requirements increase we also see a growing demand to supply technological solutions such as those being championed by our Technical Services business.

Ou
r Perform
ance
5353
Foundry R&D
The investment in our new, world class research and development facility in the Netherlands has been extremely successful with close to 30 transferred experts and new hires now located there. The facility has already played a part in the development of new products that were launched in 2015.
Strategies to Maintain Our Future Growth
We commenced and/or completed several key strategic actions in 2015. Organisationally, we restructured our Global Management and Marketing & Technology teams, to support our focus on market segmentation and the investments we have made in research capability. From a manufacturing perspective, we fully implemented our state-of-the-art sleeves and coatings plant in Changshu, China and expanded sleeve manufacturing capabilities in our India plant. A new, more efficient sleeve production line was commissioned in Brazil. Operationally, Vesuvius’ New Product Innovation (NPI) process was also implemented to accelerate innovation efforts and maximise efficiency of the existing resources, and we showcased our expertise at the GIFA trade show in Germany.
Business development initiatives included growth plans for NAFTA, focusing on clean steel and new market penetration, expanded metal treatment sales, and an increased focus and growth in the low and high-pressure die-casting sector for non-ferrous foundry business.
Focus on Developing Markets
Potential revenue per customer and per tonne of castings produced is strongly influenced by the technical sophistication of the customer, the end-market for the casting and the processes used in its production. These factors tend to correlate with the level of industrial development within each market, plus the corresponding capital investment in the foundry. Therefore, we see significant growth potential in markets where industrial development continues to gather momentum, particularly certain parts of Eastern Europe and Asia. We are expanding our network of technical sales staff and application engineers within developing markets, ensuring that customers there have local access to our high levels of expertise and technical support.
Feeder sleeves
Aluminium metallurgical control
Ceramic foam filters
Process for the production of ductile iron
Refractory coatings for moulds and cores
Crucibles for the melting and holding of non-ferrous alloys
Foundry product groups

Ou
r Resp
on
sibility
55
In this section
56 Principles
58 Safety
60 Sustainability
62 People and Community
Section Three
Our Responsibility
54 Section ThreeOur Responsibility
Vesuvius plcAnnual Report and Accounts 2015

56 Section ThreeOur Responsibility
Vesuvius plcAnnual Report and Accounts 2015
Principles
We focus our attention on the fulfilment of our ethical responsibilities, supporting the creation of long-term value for all our stakeholders.
Vesuvius employs nearly 11,000 people, with 69 production sites in 38 countries, serving customers all over the globe. Our employees’ engagement with our values and culture is not simply a matter of compliance – it is vital to our success and the sustainable delivery of the Group’s strategy.
A Framework for Business Integrity
Vesuvius has established a simple framework for explaining and delivering the principles we consider to be fundamental to our sustained success:
3. Policies & Procedures
4. Training
2. Code of Conduct
1. Vesuvius Values
Values
The behaviours we champion in our employees are encapsulated in the five Vesuvius values:
Creativity
Our commitment to technology and quality is the basis for our competitive advantage. Creativity allows us to develop innovative products and solutions and continuous improvements that generate value through performance enhancement.
Cooperation
Encouraging internal and external cooperation enables us to create unique solutions with our partners. Through cooperation, each Vesuvius employee is committed to the success of their community of colleagues and customers and that of the wider Group.
Reliability
Our solutions involve us in critical aspects of our customers’ manufacturing processes. Our commitment to deliver consistent products and service gives them the level of confidence they require.
Integrity
At the heart of our promise lies the trustworthiness of all Vesuvius employees in their acts and words. Integrity, honesty and transparency are essential in all our exchanges.
Embracing Diversity
Vesuvius is a global company built upon a true respect for local customs and experience. We recognise and embrace the potential for creativity that comes from the coexistence of so many different cultures.
The best examples of how our employees demonstrate our values are celebrated by the Group’s Living The Values Awards. These awards – nominated by fellow employees – bring together employees from around the globe to an annual ceremony celebrating their outstanding individual contribution to the implementation of Vesuvius’ values.
Code of Conduct
Maintaining a reputation for integrity in all dealings with our stakeholders is fundamental to Vesuvius’ business.
During the second half of 2015, we reviewed and updated our Code of Conduct – building on the Code already in place – ensuring that it remains relevant across all our jurisdictions and cultures and encapsulates the fundamental principles and behaviours we expect from those working for, and on behalf of, Vesuvius.

Ou
r Resp
on
sibility
57
During 2016 this updated Code will be re-launched throughout the Group – being published in all 29 of our major functional languages. The updated Code will also be communicated to business partners to emphasise the standards of conduct we expect from those who work on our behalf. The Code of Conduct confirms that the pursuit of the highest possible ethical standards is as much a part of Vesuvius’ culture as any other facet of our operation.
The Code of Conduct is available on the Company’s website www.vesuvius.com.
Policies & Procedures
The principles set out in the Code of Conduct are supported by policies to assist employees to comply with our ethical standards and the legal requirements of the jurisdictions in which we conduct our business. They also give practical guidance as to how this can be achieved. Amongst these policies are:
Speaking Up: Understanding the ethical or other concerns of our employees is a fundamental principle of good governance. The Company continues to operate a helpline where individuals can raise concerns, anonymously if they wish, knowing that these will be investigated and acted upon. The availability and importance of the helpline will be re-communicated across the Group in 2016. No individual will ever be penalised or disadvantaged for reporting a legitimate concern.
Human Rights: The Group has a Human Rights policy, which reflects principles contained within the United Nations Universal Declaration of Human Rights, the International Labour Organisation’s Fundamental Conventions on Labour Standards and the United Nations Global Compact. The policy applies to all Group employees, sets out the principles for our actions and behaviour in conducting our business and provides guidance to those working for us on how we approach human rights issues. The policy sets out the Group’s commitment not to discriminate in any of our employment practices and to offer equal opportunities to all. The Group respects the principles of freedom of association and the effective recognition of the right to collective bargaining and opposes the use of, and will not use, forced, compulsory or child labour.
Supply Chain: Over the course of recent years Vesuvius has continued to develop its supplier assessment programme – engaging with suppliers on their business practices to ensure security of supply to Vesuvius. This process will evolve, and will be integrated with the work we are doing to address the requirements of the Modern Slavery Act – in compliance with which we plan to make and publish a statement on our website later this year.
Training
During the year we continued to operate our training programme on the Code of Conduct and associated anti-bribery and corruption policies. At the year-end, more than 2,750 employees had been trained on anti-bribery and corruption issues, focusing particularly on those who work with customers, suppliers and public officials. We continue to develop our training processes to help our staff and counterparties understand that bribery and corruption will not be tolerated in the performance of our business.
The Code of Conduct sets out clear and simple principles
Code of Conduct
Health, Safety and the Environment
Code of Conduct
Trading, Customers, Products and Services
Code of Conduct
Anti-Bribery and Corruption
Code of Conduct
Employees and Human Rights
Code of Conduct
Disclosure and Investors
Code of Conduct
Government, Society and Local Communities
Code of Conduct
Conflicts of Interest
Code of Conduct
Competitors
Code of Conduct
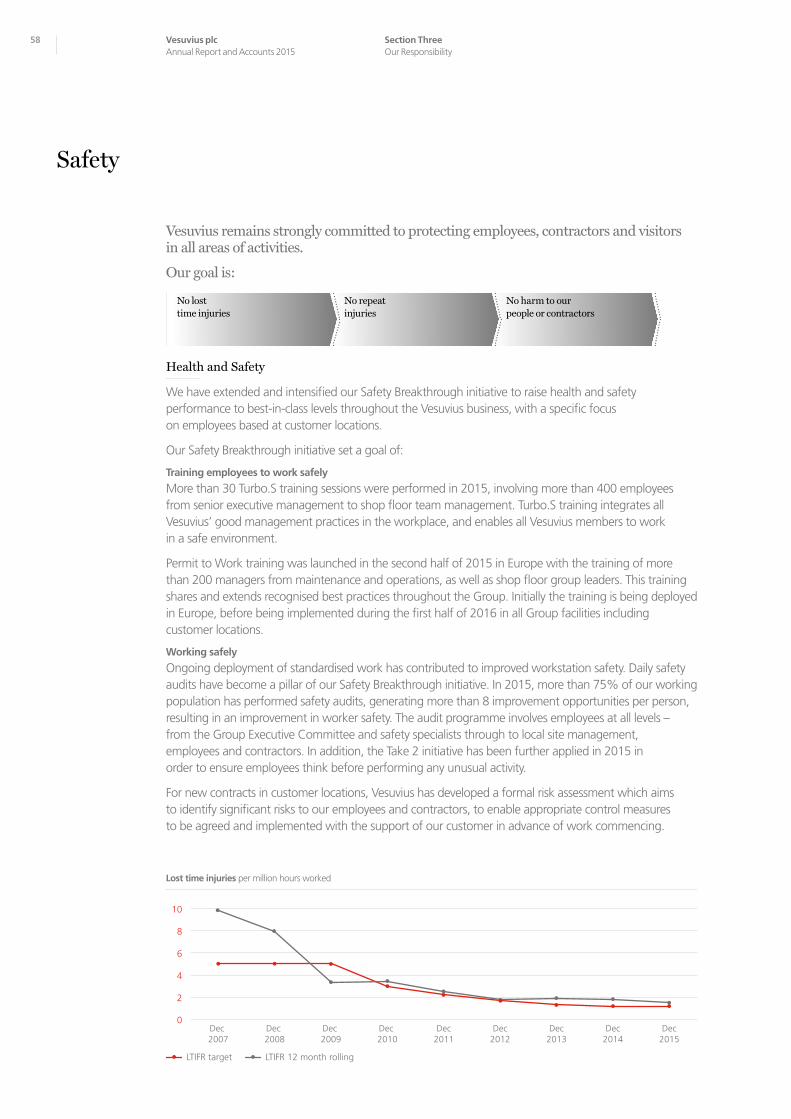
58 Section ThreeOur Responsibility
Vesuvius plcAnnual Report and Accounts 2015
Vesuvius remains strongly committed to protecting employees, contractors and visitors in all areas of activities.
Our goal is:
No harm to our people or contractors
No repeat injuries
No lost time injuries
Health and Safety
We have extended and intensified our Safety Breakthrough initiative to raise health and safety performance to best-in-class levels throughout the Vesuvius business, with a specific focus on employees based at customer locations.
Our Safety Breakthrough initiative set a goal of:
Training employees to work safely
More than 30 Turbo.S training sessions were performed in 2015, involving more than 400 employees from senior executive management to shop floor team management. Turbo.S training integrates all Vesuvius’ good management practices in the workplace, and enables all Vesuvius members to work in a safe environment.
Permit to Work training was launched in the second half of 2015 in Europe with the training of more than 200 managers from maintenance and operations, as well as shop floor group leaders. This training shares and extends recognised best practices throughout the Group. Initially the training is being deployed in Europe, before being implemented during the first half of 2016 in all Group facilities including customer locations.
Working safely
Ongoing deployment of standardised work has contributed to improved workstation safety. Daily safety audits have become a pillar of our Safety Breakthrough initiative. In 2015, more than 75% of our working population has performed safety audits, generating more than 8 improvement opportunities per person, resulting in an improvement in worker safety. The audit programme involves employees at all levels – from the Group Executive Committee and safety specialists through to local site management, employees and contractors. In addition, the Take 2 initiative has been further applied in 2015 in order to ensure employees think before performing any unusual activity.
For new contracts in customer locations, Vesuvius has developed a formal risk assessment which aims to identify significant risks to our employees and contractors, to enable appropriate control measures to be agreed and implemented with the support of our customer in advance of work commencing.
Safety
LTIFR 12 month rollingLTIFR target
0
2
4
6
8
10
Dec2015
Dec2014
Dec2013
Dec2012
Dec2011
Dec 2010
Dec 2009
Dec 2008
Dec 2007
Lost time injuries per million hours worked

Ou
r Resp
on
sibility
59
Working in tidy plants
Extended 5S implementation and activities are a major contributor to workplace improvement. The added support of Vesuvius Lean specialists has been key to improving plant safety by removing hazards for employees and offering a clear, bright and safe working environment. The daily 5S audit led by team leaders ensures continuous improvement of working conditions and promotes a safer workplace.
Involving accountable management for safety performance
Site Safety Improvement Plans have been developed for all production sites with deployment being the direct responsibility of local managers. Poorly performing sites are expected to share their incident investigation and action plans and formally present their improvement plans to the Group Executive Committee. Such an approach has proved highly successful in 2015 with the worst performing sites seeing their safety records improving through the year.
All injuries and dangerous occurrences continue to be analysed locally, with a formal presentation of findings, root causes and improvement actions cascaded through management. In addition, executive safety tours at customer locations have been a new focus during 2015.
Accident and incident reporting and analysis
A significant investment in time and resources has been made over recent years to develop robust, comprehensive and timely reporting of incidents (including all fires, explosions and any major spill or other chemical releases). Vesuvius is using more stringent definitions for Lost Time Injuries and ‘severe accidents’ than the definitions used by the US regulator, the Occupational Health and Safety Administration. For all Lost Time Injuries and Recordable Incidents Vesuvius has implemented a full investigation based on the 8D problem solving tool to identify the true root causes in order to prevent repeat incidents. As part of management reporting, the Board receives a monthly update on all Lost Time Injuries and Recordable Incidents.
Safety Performance in 2015
Sadly, in October one of our employees was killed as a result of a road traffic collision when returning to the site of our recently acquired company ECIL, in Brazil. Our local management and his work colleagues are providing support to his family and colleagues and our sympathies remain with them through these difficult times. As a consequence we are reviewing our approach to road vehicle safety as driving, particularly in developing countries, is a major risk area.
We continue to work hard at reducing incident severity and develop robust standards and practices aimed at improving the safety and health of our people in all that they do.
External recognition in 2015 of our continued safety focus includes: MASE Certification (Manuel d’Amélioration Sécurité Santé Environnement des Entreprises, a French accreditation for health and safety improvement systems) for the Fos sur Mer customer location; Tata Steel Award – an award measured against multiple safety parameters and given to the ‘Best Contract Partner’ in 2015 at Tata Steel’s iron-making plant at Jamshedpur, India; and OHSAS 18001 recertification for 11 sites.
60 Section ThreeOur Responsibility
Vesuvius plcAnnual Report and Accounts 2015
Vesuvius remains committed to improving its environmental impact by reducing, reusing and recycling waste and improving energy efficiency wherever economically viable.
Vesuvius and its Processes
The Board recognises that good environmental management is aligned with our focus on cost optimisation and operational excellence. The majority of our manufacturing processes are not energy intensive and do not produce large quantities of waste and emissions. Total energy costs are less than 3% of revenue, with only 2% of the total energy requirements across the Group consumed in the UK.
Greenhouse Gas Reporting
In reporting GHG emissions, we have used the GHG Protocol Corporate Accounting and Reporting Standard (revised edition) methodology to identify our greenhouse gas inventory of Scope 1 (direct) and Scope 2 (indirect) CO2e. Notably, through the development and implementation of innovative improved combustion systems in South Africa, normalised coal consumption was reduced, leading to a reduction of 26.6m kg of CO2. However, while total emissions have reduced in 2015, as has production, due to some elements of energy consumption being fixed, our normalised emissions figure has increased. We report in kg of CO2 equivalent (‘CO2e’).
Global GHG emissions 2015 2014
Emissions source
Combustion of fuel and operation of facilities 362m 386m
Electricity, heat, steam and cooling purchased for own use 99m 109m
Total GHG emissions 461m
-6.8%
494m
Vesuvius’ chosen intensity measurement: Emissions reported above, normalised to per tonne of product output
529.8 520.1
Methodology We have reported to the extent reasonably practicable on all the emission sources required under Part 7 of the Accounting Regulations which fall within our Consolidated Financial Statements.
Scope 1 covers emissions from fuels used in our factories and offices.
Scope 2 relates to the indirect emissions resulting from the generation of electricity, heat, steam and hot water we purchase to supply our offices and factories. We have
used data gathered to fulfil our requirements under the CRC Energy Efficiency scheme and emission factors from UK Government’s GHG Conversion Factors for Company Reporting 2015 in the calculation of our GHG.
Environmental Monitoring
All our factory emissions are proactively managed in accordance with local regulations. Regular analysis of our operations enables us to take appropriate action to reduce our emissions and operate more efficiently. The Group monitors its energy consumption, worldwide CO2e emissions and usage of water.
The Group also meets all of its obligations in relation to the Carbon Reduction Commitment Energy Efficiency Scheme, the Producer Responsibility Packaging Waste regulations and the Energy Saving Opportunity Scheme by which the UK has implemented the EU Energy Efficiency Directive.
Energy Conservation Plan
The Vesuvius Energy Conservation Plan was launched in 2011 with the objective of reducing our normalised energy consumption by 10% over the following three years. We did not fully achieve this target, and in June 2015 we reset our focus and set the objective of a 10% improvement (using 2014 as our base year) by 2018. Managing our energy intensity is part of enhancing our cost competitiveness. It also contributes to improving the total environmental impact of our customers.
Sustainability

Ou
r Resp
on
sibility
61
Our Customers and their Processes
Under the Vesuvius and Foseco brands, we deliver a large range of solutions that help our customers improve the productivity of their operations. These solutions also improve the quality of our customers’ products and reduce the environmental footprint of their processes.
Thermal optimisation and reject reduction are key factors in the processes for which we supply solutions. Vesuvius contributes to the reduction of its customers’ energy usage and subsequent carbon dioxide (CO2) emissions through insulating materials, flow management, facilitating extended manufacturing sequences and reduced downtime.
The iron and steel industry accounts for approximately 6.7% of total world CO2 emissions and 18% of industrial CO2 emissions, with, on average, 1.8 tonnes of CO2 being emitted for every tonne of steel produced. With around 10 kg of refractory material required per tonne of steel produced, careful selection of energy saving refractories can beneficially impact on the net emission of CO2.
In the foundry process, the average quantity of molten metal employed is, as a worldwide average, 2.5 kg per 1.0 kg of finished castings. The solutions offered by Foseco can reduce this ratio significantly below 2.0 kg of molten metal per 1.0 kg of finished castings, driving a considerable saving of CO2 emissions.
How does Vesuvius contribute?
Since 2011 we have used a CO2 impact stamp to highlight the most energy efficient solutions in our portfolio of products and services and to support the deployment of energy efficient and sustainable solutions engineered by our technology departments.
Benefits are realised by:
> Enabling lighter, thinner and stronger components, leading to lighter vehicles and less energy consumption
> Improving customer processes through the supply of innovative consumables to reduce energy intensity and the CO2e intensity ratio
> Reducing customer’s refractory usage per tonne of steel produced through higher quality, longer service life products
> Increasing the level of sound castings produced per tonne of metal melted through improved mould design and the application of molten metal filtration and feeding systems.
The Challenge
One of our customers was experiencing a severe reduction in iron carrying capacity and refractory service life in their blast furnace torpedo ladle fleet, causing pressure on ladle availability and increasing refractory consumption per tonne of hot metal, driving up operational costs.
Our Solution
Vesuvius’ field installation technicians developed an improved ladle preparation practice, drafted standardised work procedures to support that and designed a specialised monolithic refractory material and delivery equipment.
The Benefits
Not only did our solution reduce refractory consumption per ton of hot metal by 20%; it also resulted in improved ladle availability, with 12 fewer repairs a year and a 50% improvement in ladle service life.
Our Solutions in Practice

62 Section ThreeOur Responsibility
Vesuvius plcAnnual Report and Accounts 2015
People and Community
The dedication and professionalism of our people is the most significant contributor to Vesuvius’ success.
Talent Management
Ensuring management bench-strength and succession is a key requirement in Vesuvius and one for which senior management takes personal responsibility. Following the appointment of a Talent Management Director in 2014, talent management at Vesuvius has received considerable emphasis. The talent available in our organisation is our key differentiator – it has a unique DNA which clearly separates us from our competitors. Talent generates our solutions, our products and our service offerings; it serves our customers and the communities in which they are located. It is therefore critical to the sustainability and growth of our organisation that talent at every level within our organisation is continuously developed.
Vesuvius recognises the value of accurately identifying and developing the most talented people to be our future leaders. Those individuals identified as having ‘high-potential’ undergo assessment to enable the Company to pin-point their specific development needs. A suite of professional assessment tools is used to support this process, removing as far as possible the subjectivity often found in high-potential identification processes. These tools fit into a Group-wide competency framework, which focuses on Overall Learning Agility. This examines five specific areas of agility: mental, people, results, change and self-awareness and differentiates between those with a clear preference for ‘depth’ – experts and individual contributors – and those with a clear preference for the breadth of broader management roles. This is supplemented with a multi-rater assessment tool which is used by management for development purposes. Combining all of this provides an integrated approach to talent identification, development and support within Vesuvius.
Vesuvius Global Mobility
The success of Vesuvius is significantly influenced by how effectively we can deploy and integrate individuals into high-functioning teams to support our overall business goals and objectives. Thus global mobility plays a key role in supporting the Company’s growth. It ensures we can maintain consistency in strategic markets and enables future leaders to gain vital international experience and exposure. We currently have 73 expatriates working outside their home countries, 32 of whom are designated as long-term assignees.
Vesuvius started the Columbus Programme in 2011, the objective of which was to recruit a number of graduates each year to build technical capability within Vesuvius. During 2015, five employees from Mexico and Poland, (the fourth cohort of Columbus graduates), completed their assignments. For 2016, graduates will be recruited from South Africa and South Korea.
By recruiting and giving graduates the opportunity to work on projects outside their home country, we meet our objectives of establishing a pipeline of talent, embracing diversity and developing our potential leaders for the future.

Ou
r Resp
on
sibility
63
Training and Development
During 2015, more than 1,200 employees from around the world attended one of 73 internal training courses offered. Training is an invaluable part of the Company’s activity as it develops the skills of our people at all levels within the organisation helping to ensure they remain ‘current’ and Vesuvius maintains its competitive edge.
‘HeaTt’, the Vesuvius Technical University, successfully trained 395 employees across 20 events during 2015. HeaTt delivers tiered courses from in-house experts, that are available to all employees across all Business Units.
Vesuvius also runs a middle-management development programme called Wings, held at Vlerick University in Belgium. In 2015, 25 employees successfully completed the programme.
Vesuvius in the Local Community
One of our values in Vesuvius is cooperation, by which we commit not only to the success of our community of colleagues and customers, but also to our interactions and support of the wider communities in which our plants, offices and facilities are located.
Throughout 2015 a range of locally-generated activities supporting our communities were undertaken, where our people have chosen to show our value of cooperation and the importance we place on understanding Vesuvius’ role in society. Such activities have included a sponsored bike ride for the Heart and Stroke Foundation in Canada; Vesuvius Mexico’s support of a campaign helping young cancer patients; Vesuvius Bloom Societies in Suzhou China that provide support for disadvantaged primary school children, building their teamwork and confidence; and activities in Brazil to raise awareness in school children of social and environmental issues.
Employee Diversity
In order to assist in addressing the issue of gender balance and other areas of bias, during 2015, four unconscious bias awareness courses were held in the UK. Eight employees were trained as trainers and a further eight employees attended as delegates. This training will continue into 2016.
Female Male Total Female Male
GEC member 0 11 11 0% 100%
Senior management 8 91 99 8% 92%
Middle management 37 307 344 11% 89%
Directors of subsidiaries included in consolidation1 38 386 424 8% 92%
All other employees 1,364 9,094 10,458 13% 87%
Grand total 1,409 9,503 10,912 13% 87%
1. This disclosure is to comply with regulatory requirements. It includes directors of dormant companies and those with multiple directorships.
A
BC
D
FE
G
A
B
C
Employees by employment type Employees by region
A. China 1,738 E. North Asia 320B. Europe 4,592 F. South America 1,021C. India 739 G. South Asia 304D. NAFTA 2,198
A. Salaried 4,043B. Hourly 6,069C. Temps 800
A
B
C
D
E
F
Employees by business unit
A. Flow Control 4,204 D. Shared Services 826B. Foundry 2,881 E. Head Office 40C. Advanced Ref 2,345 F. Tech Services 616

In this section
66 Chairman’s Governance Letter
67 Governance Report
74 Audit Committee
80 Nomination Committee
82 Remuneration Overview
83 Directors’ Remuneration Report
94 Remuneration Policy
103 Directors’ Report
107 Statement of Directors’ Responsibilities
Section Four
Governance
6564 Section FourGovernance
Vesuvius plcAnnual Report and Accounts 2015
Govern
ance

66 Section FourGovernance
Vesuvius plcAnnual Report and Accounts 2015
Dear shareholder, It has been a challenging year for the Company. The Board has continued to focus on the long-term success of Vesuvius, navigating the changes impacting our markets whilst ensuring that our culture remains intact.
In September 2014 the UK Corporate Governance Code was revised with changes made in respect of remuneration, risk and the reporting of the longer-term viability of companies. These changes came into effect for Vesuvius for the financial year under review. As a Board we embraced the revised principles, and I can report that the Company is fully compliant with the 2014 UK Corporate Governance Code. Your Board continues to monitor and evaluate best practice developments in corporate governance.
Board Composition
During the year the Board was augmented by the appointment of Douglas Hurt, who assumed the role of Senior Independent Director and Chairman of the Audit Committee, and by the appointment of Hock Goh as an additional Independent Non-executive Director who brings extensive knowledge of Asian markets and technical services to the Board, supporting major areas for growth. In November 2015 we welcomed Guy Young to the Board as Chief Financial Officer and Executive Director, replacing Chris O’Shea. In May, we also said goodbye to Jeff Hewitt, our previous Senior Independent Director and Audit Committee Chairman, who we thank for his contribution to the stewardship and governance of the Company during his tenure. Each new Director has made an immediate and effective contribution to the leadership and governance of the Company, and I am confident that your Board continues to be strong and effective. I believe that the Board’s composition continues to fulfil our requirements for expertise, experience and diversity, and is well equipped to set and manage the strategic direction of the business. Consequently, I encourage all shareholders to support the election and re-election of our incumbent Directors at the 2016 AGM.
Evaluation
In accordance with our established practice, in 2015 the Board commissioned an externally moderated evaluation of Board, Committee, and Director performance. The results were satisfyingly positive, showing developments in the Board’s dynamics, effectiveness and efficiency, and reinforcing the quality of the support we gain from the business and externally. The Board continues to deliver an open forum for debate and considered decision making. The 2015 evaluation highlighted the unanimity of purpose of the Board on its key objectives of strategy, succession, talent development and risk, and reiterated the continuing need to manage the Board’s agenda efficiently in the face of the ever-increasing regulatory burden.
Chairman’s Governance Letter
Succession
To ensure that the Company remains prepared for the future, 2015 saw an increased focus on succession planning for executive and senior management roles. We considered and set further benchmarks and updated strategies for senior management development. Succession continues to form a fundamental part of the Board’s overall review of strategy and its successful implementation.
Training
As part of our ongoing training and development remit, the Board visited R&D and manufacturing facilities during the year, as well as GIFA/METEC the world’s largest steel and foundry trade show. The Board was provided with a training schedule at each Board meeting and heard from external advisers on current topics at the Board. The Board also engaged directly with senior management, through business presentations at the Board, informal discussions outside the Board and through Board and individual Director visits to operations. We will continue to do this on an ongoing basis.
Risk
The methods by which we manage our risks and assess their impact are constantly reviewed and tested as part of our ongoing risk management approach. During 2015 these processes were enhanced again, supporting our work on viability and providing a well-developed approach that allows for regular Board input and attention.
Looking Ahead
Your Board remains committed to the highest standards of governance for Vesuvius. We operate with a robust and healthy culture, receive the right support and follow appropriate processes to set and communicate the proper tone, values and culture for the business, whatever the condition of our end-markets. We look forward to contributing towards and overseeing the development of Vesuvius over the next year and beyond.
Yours sincerely
John McDonough CBE Chairman3 March 2016
In this section:
Board effectiveness on p70
Board accountability on p72
Audit Committee report on p74
Nomination Committee report on p80
Directors’ Remuneration Report on p83
Also see:
Risk on p24
Principles on p56
“ During challenging times it is essential that the Board retains a clear vision for the future, displays an unwavering adherence to the Company’s principles and values, and steers the Company towards future success.” John McDonough CBE Chairman

Govern
ance
67
The Board of Vesuvius plc (the ‘Company’) is responsible for the Group’s system of corporate governance and is committed to maintaining high standards and to developing governance arrangements to comply with best practice. This report describes the Company’s corporate governance structure and explains how, during the year ended 31 December 2015, Vesuvius has applied the Main Principles of the September 2014 edition of the UK Corporate Governance Code issued by the Financial Reporting Council (the ‘Code’). Throughout the year and up until the date of this report Vesuvius was in full compliance with the requirements of the Code. A copy of the Code can be found on the FRC website at https://www.frc.org.uk/Our-Work/Codes-Standards/ Corporate-governance/UK-Corporate-Governance-Code.aspx.
Roles and Responsibilities of the Board
Ultimate responsibility for the management of the Group rests with the Board of Directors.
The Board focuses primarily upon strategic and policy issues and is responsible for the Group’s long-term success. It sets the Group’s strategy, oversees the allocation of resources and monitors the performance of the Group. It is responsible for effective risk assessment and management.
The Board
The Board has a formal schedule of matters reserved to it and delegates certain matters to its Committees. It is anticipated that the Board will convene on seven scheduled occasions during 2016 as well as holding ad hoc meetings to consider non-routine business if required.
The Chairman and Chief Executive
The division of responsibilities between the Chairman and the Chief Executive is set out in writing and was reviewed during the year as part of the Company’s annual corporate governance review. No amendments were required. The interactions in the governance process are shown in the schematic below.
Board Committees
The principal governance Committees of the Board are the Audit, Remuneration and Nomination Committees. Each Committee has written terms of reference, which were reviewed and updated where appropriate during the year. These are available to view on the Company’s website www.vesuvius.com.
For biographical details see Board of Directors overleaf
Governance Report
Audit CommitteeTo monitor the integrity of financial reporting and to assist the Board in its review of the effectiveness of the Group’s internal controls and risk management systems
Chairman:Douglas Hurt
Membership:All independent Non-executive Directors
Remuneration CommitteeTo determine the appropriate remuneration packages for the Group’s Chairman, Executive Directors, and Company Secretary, and to recommend and monitor the level and structure of remuneration for other senior management
Chairman:Jane Hinkley
Membership:All independent Non-executive Directors
Nomination CommitteeTo advise the Board on appointments, retirements and resignations from the Board and its Committees and review succession planning and talent development for the Board
Chairman:John McDonough, the Chairman (except when considering his own succession, in which case the Committee is chaired by an appropriate Non-executive Director)
Membership:Chairman and any three Non-executive Directors
Finance CommitteeTo approve specific funding and treasury-related matters in accordance with the Group’s delegated authorities or as delegated by the Board
Chairman:John McDonough, the Chairman
Membership:Chairman, Chief Executive, Chief Financial Officer and Group Head of Corporate Finance
Share Scheme CommitteeTo facilitate the administration of the Company’s share schemes
Chairman:Any Board member
Membership:Any two Directors or a Director and the Company Secretary
Governance Committees
Group Executive Committee
Board
Administrative Committees
In addition, the Board delegates certain responsibilities on an ad hoc basis to a Finance Committee and Share Scheme Committee, which operate in accordance with the delegated authority agreed by the Board.
The Group also operates the Group Executive Committee (‘GEC’), which is convened and chaired by the Chief Executive, and assists him in discharging his responsibilities. The GEC comprises the Chief Executive, Chief Financial Officer, the four business unit Presidents, the President Vesuvius North Asia, the Vice President Human Resources, the Chief Technology Officer, the President Operations and the General Counsel & Company Secretary. The GEC met eight times during 2015 and is scheduled to meet five times during 2016. Its meetings are held between the London head office and major operational sites.
A
N
R

68 Section FourGovernance
Vesuvius plcAnnual Report and Accounts 2015
Board of Directors
John McDonough CBE Chairman N Appointed: 31 October 2012 Career experience: John was appointed as a Director and Chairman of the Company on 31 October 2012. John was group Chief Executive Officer of Carillion plc, the support services and construction firm, for 11 years until he retired in 2011. Prior to joining Carillion plc he spent nine years at Johnson Controls Inc. working for the automotive systems division, initially in the UK, before moving to become Vice President of the division’s European operations and ultimately to Singapore to develop the business in Asia-Pacific. He then returned to the UK as Vice President of the integrated facilities management division for EMEA. John served as Chairman of the Remuneration Committee of Tomkins plc from 2007 to 2010 and as a Non-executive Director of Exel plc from 2004 to 2005. John was awarded a CBE in 2011 for services to industry and is a British citizen.
Other appointments: He joined The Vitec Group plc in March 2012, and has served as its Chairman since June 2012. He is also a Director of Cornerstone Property Assets Ltd, Sunbird Business Services Ltd and a Trustee of Team Rubicon UK.
François Wanecq Chief Executive Appointed: 31 October 2012Career experience: François was appointed as a Director of the Company on 31 October 2012. He previously joined the Cookson Group plc board in February 2010. François has been the Chief Executive of Cookson’s Engineered Ceramics division, now Vesuvius, since October 2005. Prior to joining Cookson he held a series of senior management roles at Arjo Wiggins Group and served as an Executive Director of Arjo Wiggins Appleton plc from 1999 until it was delisted. From 1985 to 1995 he was Managing Director of the technical ceramics division of the Saint-Gobain Group. François graduated from the École Polytechnique and École des Mines de Paris and is a French citizen.
Guy Young Chief Financial Officer Appointed: 1 November 2015 Career experience: Guy was appointed as Chief Financial Officer of Vesuvius plc on 1 November 2015. Prior to joining Vesuvius plc, from January 2011 to November 2015, he served as Chief Financial Officer of Tarmac and latterly Lafarge Tarmac, the British building materials company. Prior to his role at Tarmac, from 2007 Guy held a number of senior financial and business development positions at Anglo American plc, having joined that company from Scaw Metals Group, the South African steel products manufacturer, where he held the position of Chief Financial Officer from 2004 to 2007. Guy is a British and South African citizen, and he qualified with the South African Institute of Chartered Accountants.
Nelda Connors Independent Non-executive Director A N R Appointed: 1 March 2013Career experience: Nelda was appointed as a Director of the Company on 1 March 2013. She served as President and Chief Executive of Tyco International, Electrical & Metal Products division (renamed Atkore International in 2010) from 2008 to 2011, prior to which she spent six years at Eaton Corporation in a number of international management roles, which included nearly four years based in Shanghai. Nelda spent much of her early career in the automotive industry working for Ford, Chrysler and Mogami Denki, a Toyota supplier. During this period she undertook roles in general management, engineering, quality, customer service and strategic planning and worked in the US, Europe and Asia Pacific. She was a member of the Independent Takata Quality Assurance Panel focused on the US airbag investigations. Nelda is a US citizen.
Other appointments: Nelda is a Non-executive Director of Blount International, Inc., Echo Global Logistics, Inc and Boston Scientific Corporation and sits on the board of the Federal Reserve Bank of Chicago. She is Chairwoman and Founder of Pine Grove Holdings, LLC.
Christer Gardell Non-executive Director N Appointed: 31 October 2012Career experience: Christer was appointed as a Director of the Company on 31 October 2012 having previously joined the board of Cookson Group plc in June 2012. Christer co-founded Cevian Capital in 2002, and continues to serve as Managing Partner. On 3 March 2016, Cevian Capital held 21.11% of Vesuvius’ issued share capital. From 1996 to 2001, he was the Chief Executive Officer of AB Custos, the Swedish investment company. Prior to joining AB Custos he had been a partner of Nordic Capital and McKinsey & Company. He served as a Non-executive Director of AB Lindex until December 2007 and of Tieto Corporation until March 2012. Christer is a Swedish citizen.
Other appointments: Christer is Managing Partner of Cevian Capital, and Vice Chairman of the global Finnish technology and services company Metso Corporation.
Hock Goh Independent Non-executive Director A N R Appointed: 2 April 2015 Career experience: Hock was appointed a Director on 2 April 2015. Hock has more than 30 years’ experience in the oil and gas industry, having spent 25 years with Schlumberger, the leading global oilfield services provider. His roles included President of Network and Infrastructure Solutions in London, President of Asia Pacific, and Vice President and General Manager of China. From 2005 to 2012, Hock was a Partner of Baird Capital Partners Asia, the private equity arm of the US investment bank Robert W Baird & Co. Based in China, he focused on the industrial, business services and healthcare sectors. He is a graduate of Monash University, Australia, and is a Singaporean citizen.
Other appointments: Hock is Chairman of MEC Resources Ltd and Advent Energy Ltd, and is a Non-executive Director of AB SKF, Santos Ltd, Stora Enso Oyj, and KS Distribution Pte.
Douglas Hurt Senior Independent Director A N R Appointed: 2 April 2015Career experience: Douglas was appointed as a Director of Vesuvius plc on 2 April 2015, and assumed the roles of Senior Independent Director and Chairman of the Audit Committee at the close of the Vesuvius plc 2015 Annual General Meeting held on 14 May 2015. Douglas has significant financial experience, having served as Finance Director of IMI plc, the global engineering group, from 2006 to 2015. Prior to this he held a number of senior finance and general management positions at GlaxoSmithKline plc, which he joined in 1983, previously having worked at Price Waterhouse. His career has included several years working in the USA and significant experience in European businesses including periods as a Chief Financial Officer and as an Operational Managing Director. Douglas is a Chartered Accountant and a British citizen.
Other appointments: Douglas is a Non-executive Director and Chairman of the Audit Committee of Tate & Lyle PLC and a Non-executive Director of the British Standards Institution.
Jane Hinkley Independent Non-executive Director R A N Appointed: 3 December 2012Career experience: Jane was appointed as a Director of the Company on 3 December 2012. Jane became Chairman of the Remuneration Committee in June 2013. Jane spent a large part of her career working at Gotaas-Larsen Shipping Corporation, the LNG shipping specialist which was listed on both the London Stock Exchange and NASDAQ. She served as CFO from 1988 to 1992, and as Managing Director until 1997. In 1998 Jane was appointed Managing Director of Navion Shipping AS, a company majority owned by Statoil, the oil and gas company, a position she held until 2001. She previously held the position of Non-executive Director of Revus Energy ASA, a Norwegian exploration and production company. Jane is a Chartered Accountant and a British citizen.
Other appointments: Jane is Chairman of Teekay GP L.L.C and Non-executive Director and Chairman of the Remuneration Committee of Premier Oil plc.
Governance Report continued
Committee membership
N Nomination Committee A Audit Committee R Remuneration Committee Committee Chairman

Govern
ance
69
Board and Committee Attendance
The attendance of Directors at the Board meetings and at meetings of the principal Committees of which they are members held during 2015 is shown in the table below. The maximum number of meetings in the period during which the individual was a Board or Committee member is shown in brackets.
BoardAudit
CommitteeRemuneration
CommitteeNomination Committee
ChairmanJohn McDonough CBE 7 (7) – – 6 (6)
Executive DirectorsFrançois Wanecq 7 (7)
Guy Young (Appointed 1 November 2015) 1 (1)
Chris O’Shea (Resigned 17 September 2015) 5 (5)
Non-executive DirectorsNelda Connors 6 (7) 5 (5) 4 (5) 5 (6)
Christer Gardell 7 (7) – – 6 (6)
Hock Goh (Appointed 2 April 2015) 4 (6) 2 (4) 2 (4) 3 (5)
Jeff Hewitt (Retired 14 May 2015) 2 (2) 2 (2) 1 (1) 2 (2)
Jane Hinkley 7 (7) 5 (5) 5 (5) 6 (6)
Douglas Hurt (Appointed 2 April 2015) 6 (6) 4 (4) 4 (4) 5 (5)
Nelda Connors was absent from the Board and Remuneration and Nomination Committee meetings held in December for personal reasons. Hock Goh was absent from Board, Audit, Remuneration and Nomination Committee meetings held in October and December whilst recuperating from a surgery.
To the extent that Directors are unable to attend scheduled meetings, or additional meetings called on short notice, they receive the papers in advance and relay their comments to the Chairman for communication at the meeting. The Chairman follows up after the meeting in relation to the decisions taken. In 2015 for both absences of Hock Goh and of Nelda Connors, the Chairman pursued this process for feedback, conducting conversations on the Board topics, the outcome of discussions, and seeking feedback from each Director.
Governance Structure
The Board
Responsible for Group strategy, risk management, succession and policy issues. Sets the tone, values and culture for the Group. Monitors the Group’s progress against the targets set
Non-executive Directors
Exercise a strong, independent voice, challenging and supporting Executive Directors. Scrutinise performance against objectives and monitor financial reporting. Monitor and oversee risks and controls, determine Executive Director remuneration and manage Board succession through their Committee responsibilities
Chairman
Provides leadership and guidance for the Board, promoting a high standard of corporate governance. Sets the Board agenda and manages meetings. Independent on appointment, he is the link between the Executive and Non-executive Directors
Chief Executive
Develops strategy for review and approval of the Board. Directs, monitors and maintains the operational performance of the Company. Responsible for the application of Group policies, implementation of Group strategy and the resources for their delivery. Accountable to the Board for Group performance
Senior Independent Director
Acts as a sounding board for the Chairman, an alternative contact for shareholders and an intermediary for other Non-executive Directors. Leads the annual evaluation of the Chairman and recruitment process for his/her replacement, when required
Company Secretary
Advises the Chairman on governance, together with updates on regulatory and compliance matters. Supports the Board agenda with clear information flow. Acts as a link between the Board and its Committees and between Non-executive Directors and senior management

70 Section FourGovernance
Vesuvius plcAnnual Report and Accounts 2015
Board Effectiveness
Board Composition
The Board comprises eight Directors: the Non-executive Chairman, John McDonough CBE; the Chief Executive, François Wanecq; the Chief Financial Officer, Guy Young; and five Non-executive Directors. Douglas Hurt is the Senior Independent Director. Henry Knowles is the Company Secretary. During the year, Hock Goh and Douglas Hurt joined the Board as Independent Non-executive Directors of Vesuvius plc with effect from 2 April 2015. Douglas Hurt assumed the roles of Chairman of the Audit Committee and Senior Independent Director previously held by Jeff Hewitt who retired immediately following the 2015 AGM held on 14 May 2015. Guy Young was appointed as Chief Financial Officer and joined the Board of Vesuvius plc as an Executive Director on 1 November 2015, replacing Chris O’Shea, who resigned from the Board on 17 September 2015.
The Board focuses on ensuring that both it, and its Committees, have the appropriate range of diversity, skills, experience, independence and knowledge of the Company to enable them to discharge their duties and responsibilities effectively. The Board continues to look at diversity in its broadest sense; reflected in the range of backgrounds and experience of our Board members who are drawn from different nationalities and have significant experience of managing a variety of complex global businesses. We believe that it is important to get the right balance of independence, skills and knowledge, both on the Board and across our businesses.
The Board’s overall skills and experience, as well as Non-executive Director independence, were reviewed during the year as part of the annual corporate governance review. The Board’s composition also formed part of the Board evaluation process. The Board considers its diversity, size and composition to be appropriate for the requirements of the business. Two of the eight Directors (25%) are women and four (50%) are non-UK citizens. The Board will continue to review its structure regularly to ensure that it continues to benefit from the appropriate balance of skills, experience and diversity.
Committee composition is set out in the relevant Committee reports. No-one, other than the Committee Chairman and members of the Committees, is entitled to participate in meetings of the Audit, Nomination and Remuneration Committees. However, as detailed in the Committee reports, each of the Committees operates in an open and consensual manner, and therefore where the agenda permits, other Directors and senior management attend by invitation.
The Board considers that, for the purposes of the UK Corporate Governance Code, half the Board, (excluding the Non-executive Chairman) namely Nelda Connors, Hock Goh, Jane Hinkley and Douglas Hurt are independent of management and free from any business or other relationship which could affect the exercise of their independent judgement. Christer Gardell is Managing Partner of Cevian Capital which holds 21.11% of Vesuvius’ issued ordinary share capital and is not considered to be independent. He brings a wealth of commercial acumen to the Board. The Chairman satisfied the independence criteria on his appointment to the Board. Biographical details of the Directors are set out on page 68.
Appointments to the Board
Recommendations for appointments to the Board are made by the Nomination Committee. Further information is set out in the Nomination Committee report on pages 80 and 81, including more details about the three appointments made to the Board in 2015.
Time Commitment of the Chairman and the Non‑executive Directors
The Chairman and Non-executive Directors each have a letter of appointment which sets out the terms and conditions of their directorship. An indication of the anticipated time commitment is provided in any recruitment role specification, and each Director’s letter of appointment provides details of the meetings that they are expected to attend, along with the need to accommodate travelling time. Non-executive Directors are required to set aside sufficient time to prepare for meetings, and regularly to refresh and update their skills and knowledge. All Non-executive Directors have agreed to commit sufficient time for the proper performance of their responsibilities, acknowledging that this will vary from year to year depending on the Group’s activities. Directors are expected to attend all scheduled Board and Committee meetings and any additional meetings as required. Each Director’s other significant commitments are disclosed to the Board during the process for their appointment and they are required to notify the Board of any subsequent changes. The Company has reviewed the availability of the Non-executive Directors and considers that each of them is able to, and in practice does, devote the necessary amount of time to the Company’s business. The Board notes that the Chairman dedicates a significant amount of time to Vesuvius in discharging his duties. In assessing any changes in his directorships, the Chairman checks with the Board to ensure that, should he take further outside responsibilities, these outside interests are appropriately balanced with those of Vesuvius. During the year, having confirmed that his time commitment to Vesuvius would remain unaffected, the Chairman was appointed as a Trustee of Team Rubicon UK, a registered charity which mobilises retired military veterans to disaster zones to provide aid.
Information and Support
The Board ensures that it receives, in a timely manner, information of an appropriate quality to enable it adequately to discharge its responsibilities. Papers are provided to the Directors in advance of the relevant Board or Committee meeting to enable them to make further enquiries about any matters prior to the meeting should they so wish. This also allows Directors who are unable to attend to submit views in advance of the meeting.
In addition to the formal processes, the Chief Executive provides written updates on important Company business issues and the Board is provided with a monthly report of key financial and management information. Regular updates on shareholder issues are provided to the Directors, who also receive copies of analysts’ notes issued on the Company. For the distribution of all information, Directors have access to a secure online portal, which contains a reference section containing background information on the Company.
Governance Report continued

Govern
ance
71
All Directors have access to the advice and services of the Company Secretary. There is also an agreed procedure in place for Non-executive Directors, in the furtherance of their duties, to take independent legal advice at the Company’s expense.
Induction and Training
A comprehensive induction programme is available to new Directors and was provided to Douglas Hurt, Hock Goh and Guy Young during 2015. The core of the induction programme is designed in compliance with the UK Corporate Governance Code, and is tailored to meet the requirements of the individual appointee.
1. In each case, the induction programme addressed training requirements appropriate to the Director’s specific role. Reference materials were provided, including information about the Board, its Committees, procedures for dealing in the Company’s shares and other regulatory and governance matters. All aspects of risk and its management through insurance, compliance and relevant corporate policies and procedures were covered. Directors were advised of their legal and other duties and obligations as Directors of a listed company.
2. For Douglas Hurt and Hock Goh the induction also covered one-to-one meetings with other Board members, meetings with key Group executives and visits to Vesuvius’ R&D and manufacturing facilities.
3. Guy Young’s induction also included introductions to principal advisers, the Company’s brokers and investor community, and scheduled visits to major administrative centres.
4. The Company Secretary monitored the induction processes to ensure that if, after a certain period of appointment, the new Directors felt there was an area in which they required further clarity, then support for this and any subsequent requirements was supplied.
Governance in Action – Director Inductions
The Chairman, through the Company Secretary, continues to ensure that there is an ongoing process to review training and development needs. Directors are provided with details of seminars and training courses relevant to their role, and are encouraged and supported by the Company in attending them. In 2015, in-house training was provided to the Board on the share dealing code, and regulatory updates were provided as a standing item at each Board meeting in a Secretary’s Report. External input on legal, regulatory and best practice developments impacting the Board or the Company was also gained with specialist advisers invited to the Board and its Committees to provide briefings on overall market and economic developments, regulatory enforcement, share dealing, viability statements and other general governance issues.
Performance Evaluation
The Board adopted an ‘in-year’ approach to its performance evaluation tackling three distinct themes identified during the 2014 evaluation of year-end governance, strategy and succession. Each topic was addressed in a specific review conducted in February, June and October respectively. The focus on specific elements of review during the year allowed the Board to conduct a detailed examination of each issue and produce immediate feedback as well as valuable, contemporaneous data for the overall performance evaluation. This approach proved extremely effective and will be used again in 2016.
The October evaluation also addressed the Board’s overall performance, the performance of the Board’s Committees and an individual review of each Board member. In addition, the Senior Independent Director led an evaluation of the performance of the Chairman. Lintstock Ltd, an independent governance advisory firm, which also provides limited governance software services to the Company, facilitated each of the reviews. The reviews examined the individual skills, experience, and knowledge of the Company amongst the Directors, together with Board interaction and effectiveness. The 2015 evaluation also built on the themes identified from the 2014 review.
1. Lintstock consulted with the Chairman, Company Secretary and the Chairmen of each of the Audit and Remuneration Committees in the formulation of the content and focus for the 2015 evaluation.
2. Lintstock designed and circulated detailed questionnaires and collated responses from participants containing both scored responses and soliciting free text comment. The results were presented to and discussed with the Chairman and Company Secretary.
3. Lintstock subsequently presented the results to the Board, using this to give valuable context to the output of the evaluation gained from their broader experience in this area.
4. The output formed the basis of one-on-one discussions conducted by the Chairman with each member of the Board and the Company Secretary, also covering the results of the individual Director reviews.
5. The Senior Independent Director met with the Chairman to discuss the results of his review by the other Non-executive Directors.
6. The specific action points generated from the prior year’s Board evaluation were reviewed at the December Board meeting and action points from the 2015 review were set for 2016.
Governance in Action – 2015 Board Evaluation
It was reported that all matters raised during the 2014 evaluation had been addressed during the year or, where they represented longer-term goals, considerable progress had been made. The only exception was the invitation of staff members considered to be of ‘High Potential’ to attend Board meetings which was fulfilled with a more flexible approach with a number of ‘High Potentials’ informally meeting the Directors during the course of the year.
The overall outcome of the 2015 evaluation showed positive momentum from year to year with clear engagement from the Board on continuous improvement. The evaluation concluded that the Board continues to promote open debate and is well-supported in terms of information flow and also showed a unanimity on key focus areas for the Board – being strategy delivery, succession planning, talent development, and the clear identification and management of risks including risk appetite. The Board continues to focus on the need to develop ‘High Potential’ staff members below the senior cadre of management and give them exposure at Board level.
Appointment and Replacement of Directors
The Board membership should not be fewer than five nor more than 15, save that the Company may, by ordinary resolution, from time to time vary this minimum and/or maximum number of Directors.

72 Section FourGovernance
Vesuvius plcAnnual Report and Accounts 2015
Governance Report continued
Directors may be appointed by ordinary resolution or by the Board. A Director appointed by the Board must retire from office at the first Annual General Meeting (‘AGM’) after his/her appointment. A Director who retires in this way is then eligible for reappointment. The Board may appoint one or more Directors to any executive office, on such terms and for such period as it thinks fit and it can also terminate or vary such an appointment at any time. The Articles specify that at every AGM, any Director who has been appointed by the Vesuvius Board since the last AGM and any Director who held office at the time of the two preceding AGMs and who did not retire at either of them, shall retire from office. However, in accordance with the requirements of the Code, all the Directors will offer themselves for election or re-election at this year’s AGM. The biographical details of each of the Directors who are offering themselves for election or re-election, including details of their other directorships and relevant skills and experience, will be set out in the 2016 Notice of AGM. The biographical details of the current Directors are set out on page 68. The Board believes that each of the current Directors is effective and demonstrates commitment to his or her respective role. Accordingly, the Board recommends that shareholders approve the resolutions to be proposed at the 2016 AGM relating to the election or re-election of all the Directors then standing.
Directors’ Conflicts of Interest
The Board has established a formal system to authorise situations where a Director has an interest that conflicts, or may possibly conflict, with the interests of the Company (Situational Conflicts). Directors declare Situational Conflicts so that they can be considered
for authorisation by the non-conflicted Directors. In considering a Situational Conflict these Directors act in the way they consider would be most likely to promote the success of the Company, and may impose limits or conditions when giving authorisation or subsequently if they think this is appropriate. The Company Secretary records the consideration of any conflict and records any authorisations granted. The Board believes that the system it has in place for reporting Situational Conflicts continues to operate effectively. No Situational Conflicts were brought to the Board for authorisation during the year under review.
Board Accountability
Risk Management and Internal Control
The Board has overall responsibility for establishing and maintaining a system of risk management and internal control, and for reviewing its effectiveness. This system is designed to manage, rather than eliminate, the risks facing the Group and safeguard its assets. No system of internal control can provide absolute assurance against material misstatement or loss. The Group’s system is designed to provide the Directors with reasonable assurance that problems are identified on a timely basis and are dealt with appropriately. The Audit Committee assists the Board in reviewing the effectiveness of the Group’s system of internal control, including financial, operational and compliance controls, and risk management systems. The key features of the Group’s system of internal control are set out on the table below.
Strategy and financial reporting
> Comprehensive strategic planning and forecasting process
> Annual budget approved by the Board
> Monthly operating financial information reported against budget
> Key trends and variances analysed and action taken as appropriate
Vesuvius GAAP > Accounting policies and procedures formulated and disseminated to all Group operations
> Covers the application of accounting standards, the maintenance of accounting records and key financial control procedures
Operational controls > Operating companies and corporate offices maintain internal controls and procedures appropriate to their structure and business environment
> Compliance with Group policies on items such as authorisation of capital expenditure, treasury transactions, the management of intellectual property and regulatory issues
> Use of common accounting policies and procedures and financial reporting software used in financial reporting and consolidation
> Significant financing and investment decisions reserved to the Board
> Monitoring of policy and control mechanisms for managing treasury risk by the Board
Risk assessment and management
> Continuous process for identifying, evaluating and managing any significant risks
> Risk management process designed to identify the key risks facing each business
> Reports made to the Board on how those risks are managed
> Each major Group business unit produces a risk map to identify key risks, assess the likelihood of risks occurring, their impact and mitigating actions
> Top down risk identification undertaken at Group Executive Committee and Board meetings
> Board review of insurance and other measures used in managing risks across the Group
> The Board is notified of major issues and makes an annual assessment of how risks have changed
Risk Management and Internal Control – Key Features

Govern
ance
73
Reviewing the effectiveness of Risk Management and Internal Control
The internal control system covers the Group as a whole, and is monitored and supported by the Group’s internal audit function, which conducts reviews of Vesuvius’ businesses and reports objectively both on the adequacy and effectiveness of the system of internal control and on those businesses’ compliance with Group policies and procedures. The Audit Committee receives reports from the Group Head of Internal Audit and reports to the Board on the results of its review.
As part of the Board’s process for reviewing the effectiveness of the system of internal control, it delegates certain matters to the Audit Committee.
Following the Audit Committee’s review of internal financial controls and of the processes covering other controls, the Board annually evaluates the results of the internal control and risk management procedures conducted by senior management. This includes a self-certification exercise by which senior financial, operational and functional management throughout the Group certify the compliance throughout the year of the areas under their responsibility with the Group’s policies and procedures. Since the date of this review there have been no significant changes in internal controls or other matters which could significantly affect them.
In accordance with the provisions of the Code, the Directors confirm that they have carried out a robust assessment of the principal risks facing the Company, including those that threaten its business model, future performance, solvency or liquidity, and that they have reviewed the effectiveness of the Group’s system of internal control and confirm that the necessary actions have been taken to remedy any control weaknesses identified during the year. The Group’s principal risks and how they are being managed or mitigated is detailed on pages 26 and 27, and the viability statement which considers the Group’s future prospects is detailed on page 25. Risk management and internal control is discussed in greater detail in the Audit Committee report on pages 74 to 79.
The Audit Committee
The members of the Audit Committee are set out on page 74. The Audit Committee report which describes the Audit Committee’s work in discharging its responsibilities, is set out on pages 74 to 79.
Executive Compensation and Risk
All of the independent Non-executive Directors serve on both the Audit and Remuneration Committees. They therefore bring their experience and knowledge of the activities of each Committee to bear when considering critical areas of judgement. This means that for example the Directors are in a position to consider carefully the impact of incentive arrangements on the Group’s risk profile and to ensure the Group’s Remuneration Policy and programme are structured to accord with the long-term objectives and risk appetite of the Company.
Share Capital and Voting
Disclosure of the information regarding share capital, the authorisation received by Directors at the AGM regarding the issue of shares and the authority to purchase own shares, is contained on page 104 within the Directors’ Report. There are no restrictions on voting contained in the Company’s Articles of Association. Further details are set out in the Directors’ Report on page 105.
Relations with Shareholders
The Board is committed to communicating with shareholders and stakeholders in a clear and open manner, and seeks to ensure effective engagement through the Company’s regular communications, the AGM and other investor relations activities. The Company undertakes an ongoing programme of meetings with investors, which is managed by the Chief Executive and Chief Financial Officer. The majority of meetings with investors are led by them. In 2015, the Company conducted a capital markets day in conjunction with the GIFA/METEC trade show in Dusseldorf, that was attended by 31 analysts, investors and financial professionals. Feedback on remuneration matters was specifically solicited prior to the 2015 AGM, with the Remuneration Committee Chairman available to meet shareholders to discuss these matters. The Chairman, Senior Independent Director and Committee Chairmen also remain open for discussion with shareholders throughout the year on matters under their areas of responsibility, either through contacting the Company Secretary or directly at the AGM.
The Company reports its financial results to shareholders twice a year, with the publication of its annual and half-year financial reports. As the requirement to issue Interim Management Statements has now fallen away, during 2015 in order to maintain transparency in performance the Company also issued two scheduled trading updates. One published immediately prior to the 2015 AGM on 14 May 2015 and the second published on 19 November 2015. In conjunction with these announcements, presentations or teleconference calls were held with institutional investors and analysts. Recordings of these are available on the Group’s website www.vesuvius.com together with copies of any presentation materials issued.
All Directors are expected to attend the Company’s AGM, providing shareholders with the opportunity to question them about issues relating to the Group, either during the meeting or informally afterwards.

74 Section FourGovernance
Vesuvius plcAnnual Report and Accounts 2015
Audit Committee
Committee Members
Douglas Hurt (Committee Chairman) Nelda Connors Hock Goh Jane Hinkley
The Audit Committee
The Audit Committee comprises all of the independent Non-executive Directors of the Company, who bring a wide range of financial and commercial expertise to the Committee’s decision making. I succeeded Jeff Hewitt, a Chartered Accountant and experienced finance professional, as Chairman of the Audit Committee following the 2015 AGM. I would like to thank Jeff for his diligent leadership of the Committee and the well established framework for Committee deliberations that I have inherited from him. Prior to joining the Board of Vesuvius plc as the Senior Independent Director and Chairman of the Audit Committee, I was the Finance Director of IMI plc for nine years, and have worked in various financial roles throughout my career. I am also Chairman of the Audit Committee of Tate & Lyle PLC and a Chartered Accountant. This background provides me with the ‘recent and relevant financial experience’ required under the 2014 UK Corporate Governance Code (the ‘Code’). The Company Secretary is Secretary to the Committee.
Meetings
The Committee met five times during the year, continuing with the inclusive approach of previous years, inviting the Board Chairman, the non-independent Non-executive Director, Chief Executive, Chief Financial Officer, Group Financial Controller, Head of Internal Audit and KPMG, the external auditor, to each meeting. Other management staff were also invited to attend as appropriate. Audit Committee meetings are conducted to promote an open dialogue, to constructively challenge significant accounting judgements, to provide guidance and oversight to ensure the business maintains an appropriately robust control environment, and seek to provide a pragmatic approach to advising the Board. The Committee has met twice since the end of the financial year prior to the signing of this Annual Report.
During the year, the Committee met privately on two separate occasions with KPMG and the Head of Internal Audit, without any executives being present. In my role as Audit Committee Chairman, I have encouraged open communications with KPMG and the Head of Internal Audit between Audit Committee meetings to discuss any emerging issues. Additionally, the Audit Committee members met and discussed business and control matters with senior management during site visits, informal meetings and Board presentations.
The outcomes of Audit Committee meetings were reported to the Board and all members of the Board received the agenda, papers and minutes.
Role and Responsibilities
The main responsibilities of the Committee continue to be:
> Monitor the integrity of the financial statements of the Company and any formal announcements relating to the Company’s financial performance
> Review the Company’s internal financial controls and internal control and risk management systems
> Establish and review procedures for detecting fraud, and systems and controls for the prevention of bribery, along with overseeing the Company’s arrangements for employees to raise concerns about possible wrongdoing in financial reporting or other matters
> Monitor and review the effectiveness of the Company’s internal audit function
> Make recommendations to the Board on the re-appointment and removal of the external auditor and to approve the remuneration and terms of engagement of the external auditor
> Monitor and review the external auditor’s independence, objectivity and effectiveness, taking into consideration relevant UK professional and regulatory requirements.
The Committee operates under formal Terms of Reference approved by the Board, which were updated during the year and now reflect changes introduced by the September 2014 revision to the Code. The revisions to the Code introduced changes to the assessment and reporting of principal risks and the publication of a new forward-looking viability statement. The Committee has embraced these changes. In light of the Competition and Markets Authority Order published in 2014 the Audit Committee also further developed its approach to the appointment and rotation of the external auditor.
The Audit Committee’s Terms of Reference are available on the Investor Relations/Corporate Governance section of the Company’s website, www.vesuvius.com. Within these Terms the Committee and its individual members are empowered to obtain outside legal or other independent professional advice at the cost of the Company. These powers were not required during the year. The Committee may also secure the attendance at its meetings of any employee or other parties with relevant experience and expertise should it be considered necessary.
Activities in 2015
The 2015 financial year proved challenging in respect of market conditions and the business environment, and the Committee devoted time to ensuring that initiatives to mitigate potential risks and financial exposure remained robust and appropriate. Discussions were held to review the adequacy of provisions and the potential impairment of assets in light of changes in the short to medium-term outlook for the business, as well as other implications of the Group- wide restructuring programme undertaken in response to prevailing conditions within Vesuvius’ end-markets.

Govern
ance
75
The Committee also focused a proportion of its time on understanding the outputs from improvements in the internal audit function and ensuring that these gained traction within the business. The Committee considered the Company’s going concern statement and reviewed a range of financial modelling scenarios undertaken to support the viability statement made by the Company for the first time. The viability statement is contained within the Strategic Report and can be found on page 25. As part of this process, rigorous stress testing was undertaken by the business in assessing the principal risks that may threaten the business model, future performance, solvency and liquidity of Group.
I and the other members of the Committee believe that we received sufficient, relevant and reliable information from management and the external auditor, to enable us to discharge fully our responsibilities in assisting the business to navigate through this challenging year.
I have elaborated on the work of the Audit Committee in line with its various responsibilities in the paragraphs below.
Financial Reporting
We fulfilled our primary responsibility to review the integrity of the half-year and annual financial statements and recommend their approval to the Board. We also considered the two trading updates released during the year in place of the previously required Interim Management Statements.
In forming our views, we assessed:
> The quality, acceptability and consistency of the accounting policies and practices
> The clarity and consistency of the disclosures, including compliance with relevant financial reporting standards and other reporting requirements
> Significant issues where management judgements and/or estimates have been made that are material to the reporting or where discussions have taken place with the external auditor in arriving at the judgement or estimate
> In relation to the overall Annual Report, we considered whether the Annual Report and Accounts taken as a whole is fair, balanced and understandable, taking into consideration all the information available to the Committee
> Reviewed the application of the FRC’s guidance on clear and concise reporting.
The Committee actively deliberated on reports from the Chief Financial Officer and Group Financial Controller. These were well prepared and analysed various alternatives, as appropriate, relating to areas of judgement and/or estimation. KPMG also delivered memoranda for the half-year and year-end, stating their views on significant issues. KPMG provided a summary for each issue, including their assessment of the prudence of management’s judgements or estimates. The Committee considered the overall degree of prudence applied this year and in comparison with the prior year. Importantly, and consistently with previous years, the Committee agreed with KPMG that the judgements made were
cautious, but not overly prudent. I support the approach previously adopted by the Committee in that consistency of judgement over time remains a critical consideration, so that the trend in reported performance is not distorted by differing judgements by management on issues that span more than one reporting period.
KPMG proposed no material audit adjustments arising from their year-end audit, which provided additional comfort to the Committee.
The Committee considered and recommended that adopting FRS101 ‘Reduced Disclosure Framework’ would be most appropriate for Vesuvius plc single company accounts for the year ending 31 December 2015. This was communicated to shareholders as part of the 2015 interim dividend mailing made on 25 September 2015. The Company has received no objections from shareholders.
Management is assessing the impact of IFRS 15 – Revenue from Contracts with Customers, and IFRS 9 – Financial Instruments, both being effective from 1 January 2018, and IFRS16 Leases effective from 1 January 2019, on its Consolidated Financial Statements.
Significant Issues and Material Judgements
In discussing the significant issues and areas for material judgement, I have distinguished between issues that were specific to the year and ongoing topics that persist from year to year.
Significant issues arising from developments in the year:
> Exceptional items The Group has commenced a restructuring programme in response to the structural changes in the end-markets it serves. Accordingly, the Committee has reviewed the treatment of the restructuring costs reported as exceptional items in 2015, and believes that this has been treated consistently with the accounting policy. This ensures that only exceptional restructuring charges are reported separately, which enables the reader more clearly to understand the underlying profitability trend of the Company.
Significant repeating topics considered were:
> Working capital provisions Given the challenging trading environment that the Group’s customers faced in 2015, the Committee assessed the adequacy of provisions held against receivables and inventories (Notes 19 and 20) to ensure that appropriate levels in the current trading context have been established. The Committee was assured that the provisioning reflected reasonable estimates of recoverability of the outstanding working capital
> Provisions The Committee has been made aware of a number of potential exposures and claims arising from ongoing litigation, product quality issues, employee disputes, restructuring, environmental matters, onerous leases, indirect tax disputes and indemnities or warranties outstanding for disposed businesses. Due to the long gestation period before settlement can be reached, provisioning for these items requires careful judgement in order to establish a reasonable estimate of future liabilities. After consideration and with expert advice sought in certain areas, the Committee is

76 Section FourGovernance
Vesuvius plcAnnual Report and Accounts 2015
satisfied that there are appropriate levels of provisions set aside to settle third party claims and settlement of disputes (Note 33). Where the outcome of an existing issue is uncertain, or where no reliable estimate of the potential liability can be made, no provision has been made and appropriate disclosure is included under contingent liabilities (Note 35)
> Impairment of intangible assets The carrying value of goodwill, £561.2m, and other intangible assets, £122.5m, at year-end, were tested against the recently approved planned performance of the Steel and Foundry cash-generating units (CGUs) and a robust set of assumptions. The detailed assumptions, provided in Note 18, show a higher equity risk premium reflecting the steel industry’s current downturn and a volatility factor that better represents the wider foundry industry’s end user markets the Group serves. The changes were evaluated by the Committee in light of Board-agreed medium-term business plans, longer-term projections and expert views on discount rates. The models indicated that there is significant headroom between the value in use and the carrying value, consequently the Committee is satisfied that no impairment charge is required
> Pensions The complexities of pension accounting and appropriateness of assumptions used (described in Note 29) were considered carefully by the Committee, as small changes in the assumptions could have material effects and bond yields in particular have been volatile. The assumptions made by management for each of the major schemes were compared by KPMG with other similar schemes. The Committee agreed the reasonableness of the assumptions
> Income tax payable and provisions Provisioning for income tax remains a complex area where judgements are made, for example, on provisions relating to taxes that might arise from challenges to transfer pricing policies. The Committee agreed the basis of the provision of £44.2m for income tax payable and provisions as set out in Note 11. Though the Group’s policy on tax planning is not aggressive, the Committee is aware that all corporate tax affairs are under increased scrutiny. Discussions with internal tax experts were held and the results of recent tax audits considered in forming the Committee’s decision to concur with management’s view
> Deferred tax assets At the end of 2014, the Group had recognised £54.0m of deferred tax as an asset in the US after extensive modelling. As noted last year and detailed on pages 126 -127, the Group has significant additional tax losses and other temporary differences in the US and elsewhere which were not recognised, though it was agreed they would be kept under review. The future prospects for US profitability were carefully reviewed with management and, whilst tempered by current difficult trading conditions, were considered sufficient to sustain a deferred tax asset in the US at the end of 2015 at the same US dollar level as at the end of 2014. The recognition of deferred tax assets for tax losses and other temporary differences is a highly technical area where the Committee has drawn on internal experts to understand the treatment. We reviewed the modelling and the implications for the reported tax rate and concluded that the sustained recognition of this asset was consistent with the estimation applied last year.
In forming our view we also considered the implications for the effective tax rate used in the accounts. Taking all the inputs into account the Committee concurred with the views of management, but emphasised that this issue would remain an important judgement area for some time
In summary, the Committee resolved that the judgements and estimates made on each of the significant issues it considered were appropriate and acceptable.
Fair, Balanced and Understandable Reporting
The Committee assessed all information available to it in considering the overall drafting of the Annual Report and Accounts and the process by which it was compiled and reviewed, to enable it to provide advice to the Board that the Annual Report is fair, balanced and understandable. To facilitate the Audit Committee’s oversight of the finalisation of the financial statements an extra committee meeting was scheduled in February 2016 for the Committee to review early drafts of the Annual Report and Accounts, and provide constructive challenge, advice and guidance where necessary. In doing so the Committee ensured that time was again dedicated to the drafting process so that linkages and consistencies could be worked through and tested. Drafts of the Annual Report and Accounts were also reviewed by a knowledgeable executive not directly involved in the year-end process who reported to the Committee on his impressions of clarity, comprehensiveness, balance and disclosure. On completion of the process, the Committee was satisfied to recommend to the Board that the Annual Report was fair, balanced and understandable, and advised the Board accordingly.
Internal Controls
The Committee considered the process by which management evaluated internal controls across the Group. The Head of Internal Audit provided the Committee with a summary overview of the assurance provided by internal controls and the testing of these controls. Additionally, KPMG reviewed controls in the businesses within the scope of its audit and this also indicated a positive control environment, showing an overall further improvement on last year.
The Group is made up of several large operating units, but also many small ones in geographically diverse locations. Consequently, segregation of duties, overlapping access controls on systems and remote management oversight can give rise to control vulnerabilities and fraud opportunities.
The Group has not adopted a single ERP system as a Group-wide standard. Over time, management intends to move to more sharing of services, enabled by process and systems standardisation between businesses. This is likely to improve the overall internal controls in the smaller operating units.
A series of risk assessments of the Group’s Bribery and Corruption exposure were conducted during the year in conjunction with external advisors. The output of these assessments will be used to refresh the Group’s established existing policies and procedures in this area and forms part of the Group’s ongoing assessment of compliance risks.
Audit Committee continued

Govern
ance
77
Each year the senior financial, operational and functional management of the businesses self-certify compliance with Group policies and procedures for the areas of the business under their responsibility, which provides another safeguard. In 2015, the process of self-certification was reviewed and refined in consultation with the Audit Committee. Consequently, updated internal control questionnaires were introduced which provide a greater assurance that the signatories have performed a review of the internal control systems in relation to their responsibilities. This was carried out without material exception at the end of 2015.
After considering these various inputs, the Committee was able to provide assurance to the Board on the effectiveness of internal financial control within the Group, and on the adequacy of the Group’s broader control systems. In the 2014 Annual Report, we reported on control deficiencies in Vesuvius Brazil’s steel business that had been exacerbated as result of the implementation of a new ERP system and management changes. The Internal Audit reviews combined with the KPMG interim control review showed that the level of control had noticeably improved in Brazil during the year. This was due to the continued focus of new financial management supported by experienced managers in place since 2014, on stabilising and maximising the use of the new ERP, thereby ensuring increased reliability in financial reporting and strengthened internal controls and account reconciliations.
The Committee also continued its monitoring and oversight of the procedures for the receipt and treatment of complaints by employees. The Group’s ‘Speak Up’ facility provides an independent and confidential service worldwide where employees may register any concerns about any incorrect or irregular practices they perceive in the workplace. A limited number of issues were raised during the year, which were appropriately investigated. The effectiveness of the internal Speak Up facility is primarily dependent on the business’ familiarity with it, and its ease of use. In 2016 the Group will undertake a re-communication of our procedures on speaking up and the availability of management and, as a last resort, the helpline, to receive such concerns.
Internal Audit
The Group’s Internal Audit function operates on a global basis through professionally qualified and experienced individual members located in major centres, who report to the Head of Internal Audit, based in London. She in turn reports directly to me.
The Committee received, considered and approved the 2015 Internal Audit plan, which was constructed using a risk-based approach to coverage of the Group’s control environment. During 2015, the Committee also considered and approved changes to the Internal Audit plan as required. The Committee also received confirmation that the majority of actions identified by the PwC review of Internal Audit effectiveness conducted in 2014 had been completed, with a final action on peer work review processes being addressed.
Internal audit coverage has been intensified with an increased coverage of smaller operating units. All operating units are internally audited at least once in every three-year period. A third of operating units are now subject to audit twice in every three-year period, and
Internal Audit annually audits each of the large operating entities located in Germany, the US, China, Mexico and Brazil.
In 2015, 53 audit assignments were undertaken covering 75% of the Group’s revenue and 60% of the Group’s profit before tax. The Committee reviewed progress against the agreed plan and discussed recent reports with the Head of Internal Audit at each of its meetings. The internal audit coverage is greater than in previous years and audits are carried out with more in-depth analysis across legal entities and operating units. In addition, many project-based reviews have been introduced and will continue over the coming years.
In 2015, 96% of the agreed audit plan was completed, with PwC and Grant Thornton retained as external outsourced auditors to supplement the internal audit team. The outsourcing process provided valuable learning and we expect to use more outsourcing in specialist areas or geographies in the future. Where control issues or other problems are flagged by the fieldwork, they are recorded in a live web-based database into which management and operational entities are required to report progress against audit exceptions. In this way, Internal Audit can monitor the progress and adequacy of the remediation steps taken. Consequently, the Committee was assured that appropriate and timely actions were taken by the responsible management. The Audit Committee also involved senior management as necessary to provide an update against actions and Internal Audit provided follow-up reviews as required to ensure there was clarity on the responsibility for delivery of solutions to the audit findings. In situations where audit findings required longer-term solutions, the Committee oversaw the process for ensuring that interim measures were established to mitigate risks while permanent solutions are pursued.
An internal perceptions survey of the quality and effectiveness of Internal Audit was again undertaken in 2015, and the team scored highly on their approach. The high standing with which Internal Audit is held within the Group is being further enhanced by its ongoing development programme.
Risk Management
As highlighted in the reviews of strategy and principal risks in the Strategic Report, risk management is inherent in management’s thinking and is embedded in the business planning processes of the Group. The Board is responsible for identifying and monitoring the principal risks facing the business and with the Group Executive Committee ensures implementation of mitigating actions. The Audit Committee has continued its monitoring role. This framework for identifying and dealing with the principal risks is consistent with the 2014 UK Corporate Governance Code.
As in previous years, bottom-up risk registers were constructed and reviewed in each major business. The Head of Internal Audit coordinated the accumulation of these operational risks for consideration by the Group Executive Committee and then by the Board. The Directors also added their individual views of top-down strategic risks into the process, including the broader economic, environmental and organisational issues facing the Group. In monitoring the overall process, Committee members also fully participated in the Board review of risks and mitigating actions. In

78 Section FourGovernance
Vesuvius plcAnnual Report and Accounts 2015
particular, the Committee determined that the process for identifying principal risks and uncertainties as set out on pages 26 and 27 was robust and appropriate.
External Audit
The Committee and the Board are committed to maintaining the excellence of the external audit process. The effectiveness of the external audit process was again tested by considering the quality of issues and challenges raised by KPMG to the Committee and to management across the Group and by the responsiveness of management to these challenges in generating financial reporting that is of the high standard expected by our shareholders. An internal quality and perceptions review of KPMG was carried out across the Group by the Group Financial Controller. Overall feedback indicated that KPMG performed in line with expectations, delivering consistently high quality work as in previous years. There continued to be a good professional relationship and open communication between the business and KPMG that facilitated proper audit planning, risk assessment and execution.
The KPMG audit fee was constructed bottom-up, and was considered in light of the audit work required by the agreed materiality level and scope. Following some further negotiation the fee was agreed by the Committee for recommendation to the Board. The Board approved the fee of £1.8m, which is the same as 2014.
Within the external audit process, communications between the Committee and KPMG were extensive. KPMG provided updates to the Committee at the half-year and running up to the year-end, including regular commentaries on significant issues and their assessment of prudence in the judgements and estimates made by management. In February 2016 the Audit Committee also held a preliminary meeting on year-end issues in advance of the finalisation of the financial statements in early March. Private sessions were held with KPMG without management being present, covering reporting and control issues in the context of the resourcing of the Group Finance team. I met on a number of occasions with KPMG to monitor the progress of the audit and discuss questions as they arose. The strength of the finance teams across the Group was also considered. In these sessions KPMG confirmed that their work had not been constrained in any way and that they were able to exercise their appropriate professional scepticism and challenge throughout the audit process.
In September 2015 the Audit Committee met the KPMG team for Germany. The Committee reviewed the KPMG team’s proposed audit plan, how the audit was being approached in respect of risks and uncertainties and sought insight into the controls in place. This meeting gave the Committee additional evidence of the effectiveness of the Group’s external audit.
The independent auditor’s report provided by KPMG on pages 110 to 112 includes KPMG’s assessment of the risks of material misstatement in the accounts. The Committee and management concur with their assessment. These items are included in significant issues and material judgements comments noted above. The report also summarises the scope, coverage and materiality levels applied by KPMG in their audit. As part of the audit planning process and based
on a detailed risk assessment, the Committee agreed a materiality figure of £4.6m for Group financial reporting purposes which is lower than last year (£5.7m) and, in line with similar groups, is set at about 5% of profit before tax, adjusted for restructuring costs of £14.6m that are considered specific and non-recurring. Importantly much lower levels of materiality are used in the audit fieldwork on the individual businesses across the Group and these lower figures drive the scope and depth of audit work. Small operations were subject to statutory audit as required under local regulations, and, subject to risk assessment, were also reviewed by Internal Audit. Any misstatements at or above £0.23m were reported to the Committee.
The coverage of the audit at 71% of the Group’s revenue, 78% of profits and losses that made up profit before tax and 84% of assets was considered by the Committee. The audit coverage is reflective of the long tail of smaller businesses within the Group that individually are not ‘material’ to the Group result.
External Auditor Independence
The safeguards to protect the independence and objectivity of the auditor that continued during the year include:
> Regular confirmation that the external auditor is independent of the Company in its own professional judgement
> Evaluating all the relationships between the external auditor and the Group, including those relating to the provision of non-audit services to determine whether these impair, or appear to impair, the auditor’s independence.
The external auditor is prohibited from performing services where it:
> May be required to audit its own work > Would participate in activities that would normally be undertaken by management
> Is remunerated through a ‘success fee’ structure > Acts in an advocacy role for the Group.
The Group’s Non-audit Services policy was reviewed by the Committee and updated during the year, and is available on the ‘Investor Relations/Corporate Governance’ section of the Company’s website, www.vesuvius.com. The policy details the pre-approval process for, and monitoring of, approved non-audit services provided by the external auditor, in addition to the list of services of which the external auditor is specifically excluded from providing. In keeping with ensuring the independence of the external auditor, the policy also addresses the employment of former members of the external audit team specifying the strict controls imposed by the Company.
An annual budget for non-audit services where management proposes to engage the external auditor is presented for pre-approval to the Committee as part of the overall budgeting process. Where a specific non-audit fee is likely to be in excess of £50,000, it must be pre-approved by the Committee and where appropriate, services are tendered competitively prior to the awarding of work. In practice, the Group does not seek to engage KPMG for non-audit services unless there are compelling advantages to doing so.
During 2015, the fees for non-audit services amounted to £0.2m, similar to last year. The fees comprised assurance services related
Audit Committee continued
Govern
ance
79
to the review of the Company’s half-year financial statements and limited taxation advice, as detailed in Note 6 on page 123, for which it was concluded that KPMG was best-placed to support the Group. The Committee also monitored fees paid to other large accounting firms as part of the non-audit services fees review so as to determine
where there might be any current or future conflicts of interest.
Under its Regulation on statutory audit services, the EU framework for a more restrictive regime for non-audit services will come into force in June 2016. The restrictions will broadly prohibit external auditors’ involvement in tax services, any services that involve playing a part in management decision making, preparing accounting records, designing or implementing internal control/risk management services or financial systems, certain HR services and other legal, investment and share dealing services. There will also be a 70% cap on the fees for all non-audit services relative to the audit fee. The Non-audit Services policy will be reviewed over the coming year and amended as appropriate in order to comply with the new rules.
External Auditor Reappointment
Given the performance of KPMG and the likely tendering framework, the Committee has recommended, and the Board has agreed, that, subject to shareholder approval at the 2016 AGM, KPMG should be reappointed as auditor for the financial year ending 31 December 2016.
KPMG has been the Company’s statutory external auditor since its listing on the London Stock Exchange on 19 December 2012, and prior to the listing of Vesuvius plc, was Cookson Group plc’s external auditor for over 20 years. The current lead audit partner, Paul Korolkiewicz, has been in place since the audit for the year ended December 2012. Accordingly, he is due to rotate off at the conclusion of the audit for the year ending 31 December 2016. The Audit Committee recognises the professional work of KPMG as auditors; however, in view of the rotation of the lead audit partner and the development of legislation in respect of auditor retendering, the Audit Committee believes that conducting a competitive tender process during 2016 for the appointment of a new statutory auditor for the financial year ending December 2017 is appropriate, and in the best interests of the shareholders.
The Code states that FTSE 350 companies should tender the provision of audit services at least every ten years or explain their approach, if different. The EU Directive and Regulation on statutory audit services, which will come into force in June 2016, includes the requirement that audit firms of all EU companies listed on a regulated market are subject to retender after ten years and rotate off after 20 years. Due to the length of tenure of KPMG as auditor, transitional provisions under the EU Regulations will require that the Company appoint a new external auditor no later than from 17 June 2020.
Additionally, under the Statutory Audit Services for Large Companies Market Investigation (Mandatory Use of Competitive Tender Processes and Audit Committee Responsibilities) Order published by the Competition and Markets Authority, which came into effect for financial years beginning on or after 1 January 2015, the Audit Committee is required to report in which year the Company proposes to complete a competitive tender process in respect of the statutory
external auditor, and the reasons why the proposed year for the competitive tender process is in the best interests of the shareholders. In compliance with the Order, the Audit Committee confirms that a competitive tender process for the appointment of a statutory auditor will be conducted during 2016 with a view to recommending the appointment of a new statutory auditor for the financial year ending December 2017.
The Committee Evaluation
The Audit Committee’s performance was evaluated as part of the overall externally facilitated Board and Committee performance evaluation, and rated highly overall against performance criteria. The changes in both the Audit Committee Chairman and Chief Financial Officer were recognised as bringing fresh perspectives to deliberations and also providing new challenges in respect of establishing new and improved ways of working. Initiatives for performance improvement and areas for focus over 2016 included strengthening the framework of the risk management programme by increasing oversight and controls within those regions considered higher risk, and the Committee ‘deep dives’, by which the executives will present a detailed examination of the issues related to specific topics or business operations. During 2016 the Committee will continue to seek improvements in its performance and deliberations by implementing the actions identified by the review. Further details of the evaluation of the Board and its Committees are given on page 71.
On behalf of the Audit Committee
Douglas Hurt Chairman, Audit Committee 3 March 2016

80 Section FourGovernance
Vesuvius plcAnnual Report and Accounts 2015
Nomination Committee
The primary responsibility of the Nomination Committee is to focus on Board succession planning. In 2015 the Committee presided over the appointment of two Independent Non-executive Directors and a new Chief Financial Officer. These appointments were made to strengthen the Board in terms of its knowledge, skills and experience, and to replace outgoing Directors who stepped down or retired from the Board during the year. The Committee continues to have a responsibility to ensure that the Board is made up of individuals with the appropriate drive, abilities and experience to lead the Company in the delivery of its strategy.
Committee Members
John McDonough CBE (Committee Chairman) Nelda Connors Christer Gardell Hock Goh Jane Hinkley Douglas Hurt
The Nomination Committee
The Nomination Committee is made up of myself as Chairman of the Company and any three of the Non-executive Directors. During the year I continued as Chairman of the Committee, though I would not act as Chairman if the Committee was considering the appointment of my successor. In that case, the Chairman would be an appropriate Non-executive Director. The Company Secretary is Secretary to the Committee. Members’ biographies are set out on page 68.
Meetings
In early 2015, the Committee updated its agenda in response to the output of the 2014 Board evaluation, showing the Board’s clear focus on succession planning. Consequently, the Committee met six times during 2015 to consider both standing items and wider succession-related issues. The Committee’s agenda was also augmented by the recruitment exercises that took place during the year. The Committee will maintain the updated succession agenda in 2016, though with fewer meetings. As during 2015, succession planning will form an integral part of the Board’s strategy deliberations. In light of the year’s activities, there was also a significant level of ad hoc discussion between members of the Committee.
Role and Responsibilities
The Nomination Committee’s foremost priorities are to ensure that the Company has the best possible leadership, maintains a clear plan for orderly Executive and Non-executive Director succession and cultivates the correct skills, experience and diversity in the Board’s overall composition. Its prime focus is therefore on the strength of the Board, for which appointments are made on merit, against objective criteria, selecting the best candidate for the post. The Nomination Committee advises the Board on appointments, retirements and resignations from the Board and its Committees.
The Committee operates under formal terms of reference which were reviewed and confirmed during the year. The terms of reference are available on the Group’s website www.vesuvius.com.
The Committee and its members are empowered to obtain outside legal or other independent professional advice at the cost of the Company in relation to its deliberations. These rights were not exercised during the year. The Committee may also secure the attendance at its meetings of any employee or other parties it considers necessary.
Process for Board Appointments
The Committee follows formal, rigorous and transparent procedures for the appointment of new Directors. When considering a Board appointment, the Nomination Committee draws up a specification for the role taking into consideration the balance of skills, knowledge and experience of its existing members, the diversity of the Board, the independence of continuing Board members, and the ongoing requirements and anticipated strategic developments of the Group. The search process is then able to focus on appointing a candidate with the necessary attributes to enhance the Board’s performance.
The Committee uses the services of search firms to identify appropriate candidates, ensuring that any selected firm is not in any way conflicted in the delivery of its role. In addition, the Committee will only use those firms that have adopted the Voluntary Code of Conduct addressing gender diversity and best practice in search assignments. A ‘long list’ of potential appointees is reviewed followed by the shortlisting of candidates for interview based upon the objective criteria identified at inception. Non-executive appointees must be able to demonstrate that they have sufficient time available to devote to the role and all prospective Directors must identify whether they have any potential conflicts of interest as part of the process. The Committee recommends a preferred candidate who will meet all Board members. Finally, detailed external references are taken and following this the Committee makes a formal recommendation to the Board on the appointment. Preferred candidates are supported in undertaking their own due diligence on the Company and meeting with its advisers.
Activity in 2015
During the year, the Committee had both Executive and Non- executive appointments to consider.
The process of appointing a new Audit Committee Chairman to succeed Jeff Hewitt began in 2014. This recruitment process, which was detailed in last year’s Annual Report, continued in 2015 and resulted in the appointment of Douglas Hurt. In addition the process to identify an additional Non-executive Director culminated in the appointment of Hock Goh. Both Directors were elected by shareholder resolution at the 2015 AGM. Douglas Hurt is now the Senior Independent Director and Chairman of the Audit Committee and Hock Goh is an Independent Non-executive Director.

Govern
ance
81
Specialist recruitment agencies Odgers Berndtson and Spencer Stuart respectively, neither having any other connection to the Company, were used to identify suitable candidates for each appointment.
In 2015 the Committee also conducted a recruitment process for a new Chief Financial Officer to replace Chris O’Shea. To recruit an individual of the required calibre, the Committee again retained Odgers Berndtson to conduct the search. The Committee compiled a detailed role profile and Odgers Berndtson was instructed to source candidates with relevant qualifications, abilities and career histories to provide a ‘long list’ of individuals for the Committee to consider. The Committee required that Odgers identify an appropriate mix of male and female candidates for the role.
As a result of the process, and subsequent to interviews with Board members, senior managers and due diligence review by the Company, which included the solicitation of external references, Guy Young was identified as the preferred candidate. Following the recommendation of the Committee, the Board approved Mr Young’s appointment as Chief Financial Officer and an Executive Director of Vesuvius plc on 16 September 2015.
The Nomination Committee ensured that all Directors appointed during the year received a comprehensive induction, designed in compliance with the UK Corporate Governance Code. More information on the induction process can be found on page 71.
Board Composition
Notwithstanding the three appointments made in 2015, the Committee will continue regularly and proactively to examine succession planning to ensure an appropriate balance of skills, experience and diversity is retained on the Board in the coming years.
1. As part of the annual corporate governance review, the Committee examined the independence of the Board and the lengths of tenure of each of the independent Non-executive Directors.
2. The Committee also conducted an examination of skills and experience deemed necessary at the Board for the next three to five years. The exercise focused the Board’s attention on the following areas:
> General business experience > Specific market sector or functional experience > Listed company experience > Personal experience and attributes.
Governance in Action – Board Composition
The Committee was pleased to report to the Board that it believes that the Board satisfies the independence requirement set down by the UK Corporate Governance Code. The results of the annual corporate governance review also showed that the skill sets available to the Company from the Directors matched the current and near-term strategic requirements of the Group.
All Directors have served at a very senior level in global organisations, have international experience across a variety of industries, and most have spent a considerable amount of time resident outside the UK. The Nomination Committee continues to believe that diversity underpins the successful operation of an effective Board and will continue with its policy to review the requirements in respect of skills, experience, background and gender in respect of the Board’s composition. The Board supports the recommendations of Lord Davies on gender diversity and meets the Davies Review’s 2015 objective set for FTSE 100 companies of 25% representation of female Directors on boards. The Committee will continue to promote gender diversity on the Board and throughout the business.
Senior Management Succession
Succession planning does not exclusively relate to the Board. It also encompasses senior management, and aims to support and encourage the growth of a consistent pool of talent able to step up to the top roles in future years. During the year, the Committee reviewed the development plans for the Group Executive Committee, and as part of the overall Group strategic review, each of the Vesuvius business units and head office functions submitted their succession plans in respect of senior executives to the Board for review. The Board also met key executives throughout the Group in order to gain a greater understanding of the breadth and depth of management talent. This process included a series of presentations to the Board by business unit, functional and geographical heads, in some cases with senior managers that work in their teams, to ensure that the Board was exposed to key senior management. This process provides the basis for the Board’s ability to adopt a more informed approach to executive succession planning and talent development across the Group.
Committee Evaluation
The Committee’s activities were part of the externally facilitated evaluation of Board effectiveness during the year. The results showed that the Committee performed effectively against all the evaluation criteria, rating highly overall with strong support for the Committee’s role in the Board appointment processes conducted throughout the year. Over the coming year the Committee will continue to focus on Board succession planning and talent development to refresh senior management as required.
On behalf of the Nomination Committee
John McDonough CBE Chairman, Nomination Committee 3 March 2016

82 Section FourGovernance
Vesuvius plcAnnual Report and Accounts 2015
Remuneration Overview
Dear shareholder, On behalf of the Remuneration Committee I am pleased to present our Remuneration Report for 2015, set out on pages 82 to 93. This report will be subject to an advisory shareholder vote at the 2016 AGM and sets out details of the pay received by Directors in 2015 and how we intend to apply our Remuneration Policy in 2016. Our Remuneration Policy will next be put to a vote at the AGM in 2017, which will be three years on from when it was approved at our 2014 AGM. All payments received by Directors in 2015 were in line with our Remuneration Policy. I have set out below the key decisions reached by the Committee during 2015. More detail about these is included in the report.
Performance in 2015
As described in the Strategic Report, in 2015 the Company has faced significant headwinds in our end-markets and whilst cash generation has remained strong and our balance sheet is robust, revenues have declined. The Committee’s discussions have taken place against this market background.
In 2015 Annual Incentive awards for Executive Directors were based primarily on Group Headline earnings per share performance. As our Headline EPS of 28.1 pence was below the threshold set of 35.0 pence, no bonus payment will be made in respect of 2015 to any Executive Director.
The performance period for the share awards made under the Vesuvius Share Plan in 2013 – the first year that Vesuvius was an independently listed company – matured at the end of December 2015. Performance for those incentives was measured equally by reference to TSR relative to the FTSE 250 (excluding Investment Trusts) and Headline EPS growth compared with compound annual GDP growth over the three-year period. Relative TSR performance was below median and therefore the TSR target was not met. The EPS growth target over the three-year period of 2013, 2014 and 2015 was also not met. Therefore these awards lapse.
Key Decisions made since 1 January 2015
An important matter for discussion and decision by the Committee during 2015 was the appropriate remuneration package for Guy Young, our new Chief Financial Officer. The principal features of his remuneration package were announced at the time of his appointment and they are included in the applicable sections of this year’s Remuneration Report.
Other key decisions made in 2015 by the Committee included Directors’ salaries for 2016 and the structure of performance measures for incentives in 2016.
> As highlighted in our Remuneration Report in 2013, we have adopted a longer-term horizon (of two to three years) for base salary increases for Executive Directors and senior executives. In 2015, the Chief Executive, François Wanecq’s base salary was reviewed in line with this philosophy for the first time since 2012 and was increased by 7.2%, up to £590,000 from 1 January 2016. This is in recognition of his leadership of the Group over the three years since demerger and during the current tough trading environment being experienced. It is intended that Mr Wanecq’s salary will not be reviewed again until at least 2018
> The Committee intends to use the same financial performance measures in 2016 that were used in 2015 for Executive Directors’ incentive awards. These measures reward growth (through the EPS measure used in the Annual Incentive and the Vesuvius Share Plan), effective balance sheet management (through the working capital adjuster used in the Annual Incentive) and delivery of shareholder value (through the TSR measure used in the Vesuvius Share Plan).
> The Committee decided to align the Executive Directors’ Annual Incentive Plan with the structure used elsewhere in the Group. Thus 20% of the total maximum potential Annual Incentive will, in 2016, be based on personal objectives. The Committee believes that this, combined with the financial performance measures, provides appropriate alignment with Vesuvius’ current strategic priorities.
In addition, in 2015 the Committee also took decisions about the grant and vesting of share plan awards in 2015 and the Annual Incentive plan payments made in 2015 in respect of 2014.
In February 2016 the Committee also resolved to simplify and amend the EPS performance measure for the Performance Share awards to be granted in 2016 under the Vesuvius Share Plan – see page 88 for further details.
Interactions with Shareholders
The Committee encourages dialogue with its major shareholders and we will consult with shareholders regarding any significant changes to the Remuneration Policy for 2017. The Committee is satisfied that the current Remuneration Policy is designed to promote the long-term success of the Company, and that the performance-related elements of remuneration are transparent, stretching and rigorously applied. I remain keen to hear shareholders’ views on remuneration matters and look forward to a continued dialogue with shareholders and their continued support for our Directors’ Remuneration Report resolution at the AGM.
Yours sincerely
Jane Hinkley Chairman, Remuneration Committee 3 March 2016

Govern
ance
83
Remuneration Committee Structure
The current members of the Remuneration Committee (the ‘Committee’) are all the independent Non-executive Directors of the Company. Jane Hinkley (who also serves as the Committee Chairman) and Nelda Connors served on the Committee throughout 2015 and in 2016 to date. Jeff Hewitt served on the Committee until his retirement from the Board at the 2015 AGM and Hock Goh and Douglas Hurt joined the Committee on their appointment to the Board on 2 April 2015. The Committee complies with the obligations of the UK Corporate Governance Code for the composition of Remuneration Committees. Each of the members brings a broad experience of international businesses and an understanding of their challenges to the work of the Committee. The Company Secretary is Secretary to the Committee. Members’ biographies are on page 68.
Meetings
The Committee met five times during the year with full attendance, other than in respect of one meeting when Nelda Connors was prevented from attending for personal reasons and two meetings when Hock Goh was unable to attend whilst recuperating from a surgery. The Group Chairman, Chief Executive, and Vice President Human Resources were invited to each meeting, together with Christer Gardell, our non-independent Non-executive Director, though none of them participated in discussions regarding their own remuneration. In addition the Chief Financial Officer attended where the agenda of the Committee required it. This attendance supported the work of the Committee, giving critical insight into the operational demands of the business and their application to the overall strategy of remuneration within the Group. In receiving views on remuneration matters from the Executive Directors and senior management, the Committee recognised the potential for conflicts of interest to arise and considered the advice accordingly. The Chairman of the Committee reported the outcomes of all meetings to the Board.
The Committee operates under formal terms of reference which were reviewed and updated during the year and approved by the Board. The terms of reference are available on the Group website www.vesuvius.com. The Committee members are also empowered to obtain outside legal advice at the cost of the Company in relation to their deliberations. These powers were not exercised during the year. The Committee may also secure the attendance at its meetings of any employee or other parties it considers necessary.
Role and Responsibilities
The Committee is responsible for:
> Setting the appropriate remuneration for the Chairman, the Executive Directors and the Company Secretary > Recommending and monitoring the level and structure of remuneration for senior management, being the first layer of management below Board level and their direct reports
> Overseeing the operation of any executive share incentive plan.
Advice provided to the Remuneration Committee
As a result of the tender process undertaken in 2014, Deloitte was appointed as the new external adviser to the Committee in December 2014. They were appointed directly by the Remuneration Committee to provide advice on executive remuneration matters, including remuneration structure and policy, updates on market practice and trends, and guidance on the implementation and operation of long-term incentive plans. Deloitte is a signatory to the Remuneration Consultants Group Code of Conduct in relation to Executive Remuneration Consulting in the UK. Deloitte also provides the Remuneration Committee with ongoing calculations of Total Shareholder Return to enable the Committee to be updated on the performance of long-term share incentive plans and in addition in 2015, within the wider Group, Deloitte was procured locally to provide limited accounting and tax advisory work. During 2015 Deloitte’s fees for advice to the Remuneration Committee, charged on a time spent basis, amounted to £50,000. The Committee has, after consideration, concluded that it is satisfied that the advice provided to it on executive remuneration matters is objective and independent and that no conflict of interest arises as a result of other services provided to the Group.
Directors’ Remuneration Report

84 Section FourGovernance
Vesuvius plcAnnual Report and Accounts 2015
Activities of the Remuneration Committee
The key matters the Remuneration Committee considered during its five meetings in 2015 included:
> Considering and setting an appropriate remuneration package for Guy Young, the new Chief Financial Officer (details of the appointment process and members of the Nomination Committee are set out on pages 80 and 81)
> The salary review proposals for François Wanecq, the Chief Executive, and an overview of the proposals for senior management > Reviewing achievement against performance targets, and approving pay-outs, in respect of 2014 annual cash bonus incentive arrangements > Setting performance targets and approving the structure of the 2015 annual cash bonus incentive arrangements > Reviewing the structure of the 2016 Annual Incentive arrangements for the Executive Directors which will now include an element linked to the achievement of personal objectives
> Considering the Company’s attainment of performance conditions applicable to the awards made in 2012 under the Cookson Long Term Incentive Plan and authorising the vesting of these awards where relevant
> Setting the performance conditions and authorising the grant of awards under the Vesuvius Share Plan and Medium Term Incentive Plan > Introducing a regular cycle of updating for the participants in the Vesuvius Share Plan on progress against applicable performance conditions > In the light of advice received from the external advisers regarding trends in remuneration practice and governance, and any feedback from institutional shareholders, discussing the Company’s overall approach to executive remuneration and reviewing whether any changes should be made
> Reviewing the Executive Directors’ shareholding policy > Reviewing the Remuneration Committee’s terms of reference, and recommending amendments to the Board for approval > Reviewing and approving the 2014 Directors’ Remuneration Report.
During 2015 the Committee has also established an effective working relationship with its new advisers, Deloitte, who have also supported the Vice President Human Resources in the work he does to assist the Committee.
As in previous years, the Committee was the subject of an externally moderated performance evaluation, which showed strongly positive results for the processes and deliberations of the Committee and for its agenda. The support given by Deloitte, as external adviser, was also
highly rated in the evaluation.
Regulatory Compliance
The Remuneration Policy set out on pages 94 to 102 was prepared in accordance with the Companies Act 2006 and The Large and Medium-sized Companies and Groups (Accounts and Reports) (Amendment) Regulations 2013. It also meets the requirements of the UK Listing Authority’s Listing Rules and the Disclosure and Transparency Rules. This Remuneration Report sets out how the provisions of the September 2014 UK Corporate Governance Code are applied by the Company in relation to matters of remuneration. We have complied for the year under review with these provisions.
Share Usage
Under the rules of the Vesuvius Share Plan, the Company has the discretion to satisfy awards either by the transfer of Treasury shares or other existing shares, or by the allotment of newly issued shares. Awards made to senior managers by the Company over shares pursuant to the Medium Term Incentive Plan must be satisfied out of shares held for this purpose by the Company’s employees’ share ownership plan trust (‘ESOP’). The decision on how to satisfy awards is taken by the Remuneration Committee which considers the most prudent and appropriate sourcing arrangement for the Company.
At 31 December 2015 the Company held 7,271,174 ordinary shares in Treasury and 1,730,288 Vesuvius shares were held in the ESOP. The Trustee of the ESOP can be gifted Treasury shares by the Company, can purchase shares in the open market or can subscribe for newly issued shares as required, to meet obligations for the provision of shares to satisfy options and awards that vest.
The Vesuvius Share Plan complies with the current Investment Association guidelines on headroom which provide that overall dilution under all plans should not exceed 10% over a ten-year period in relation to the Company’s issued share capital, with a further limitation of 5% in any ten-year period on discretionary schemes. (More than 9.9% of the 10% limit and more than 4.9% of the 5% limit is available as headroom for the Company.) No Treasury shares have been transferred or newly issued shares allotted under the Vesuvius Share Plan during the year under review.
Directors’ Remuneration Report continued

Govern
ance
85
Policy Implementation
The following section provides details of how the Company’s Remuneration Policy was implemented during the financial year 2015 and how it will be implemented in the financial year 2016.
Directors’ Remuneration – audited
The table below sets out the total remuneration received by Executive Directors in the financial year under review:
François Wanecq Chris O’Shea Guy Young
2015 (£000)
2014 (£000)
2015 (£000)
2014 (£000)
2015 (£000)
2014 (£000)
Total salary1 550 550 256 340 54 –
Taxable benefits2 37 42 14 17 3 –
Pension3 165 165 76 102 14 –
Total fixed pay4 752 757 346 459 71 –
Annual bonus5 – 442 – 219 – –
Long-term incentives – 3206 – 2417 638 –
Total variable pay9 – 762 – 460 63 –
Total10 752 1,519 346 919 134 –
The table below sets out the fees and taxable benefits received by Non-executive Directors in the financial year under review and the total remuneration received by both Executive and Non-executive Directors during the year under review:
2015 2014
Total fees (£000)1
Taxable benefits
(£000)2Total
(£000)Total fees
(£000)1
Taxable benefits (£000)2
Total (£000)
John McDonough CBE 185 12 197 185 – 185
Nelda Connors 45 5 50 45 – 45
Christer Gardell 45 10 55 45 – 45
Hock Goh11 34 1 35 – – –
Jeff Hewitt12 27 1 28 65 – 65
Jane Hinkley 60 2 62 60 – 60
Douglas Hurt13 46 1 47 – – –
Total 2015 Non-executive Director remuneration 474Total 2015 Executive Director remuneration 1,232Total 2015 Director remuneration 1,706
Notes:1. Base salary (or fees, as appropriate) earned during the financial year ended 31 December 2015.2. Benefits for Executive Directors comprise car allowance, private medical care and tax advice and a de-minimis amount for Directors’ spouses travel. The UK regulations
require the inclusion of benefits for Directors where these would be taxable in the UK on the assumption that the Director is tax resident in the UK. The figures in the table therefore include expense reimbursement and associated tax relating to travel, accommodation and subsistence in connection with attendance at Board meetings and other Board business during the year, which are considered by HMRC to be taxable in the United Kingdom.
3. François Wanecq receives a pension allowance of 30% of base salary and Guy Young receives a pension allowance of 25% of base salary.4. The sum of base salary, benefits and pension.5. This figure would include any annual cash bonus incentive payments made to the Executive Directors for their performance in the year under review. See page 86 and 87
for more details.6. This figure has been updated to represent the actual value on the date of vesting of the Performance and Matching Share awards, that François Wanecq received under
the Cookson Group LTIP award made in 2012 that vested on 7 April 2015, together with the cash payment in respect of accrued dividends. See Note 1 of the Cookson LTIP Allocations table on page 90.
7. This figure relates to the Restricted Share award that vested on 20 October 2014 (full details of which were set out in the 2014 Annual Report). 8. This represents the value of the Restricted Share award to Guy Young on joining Vesuvius. Full details are set out on page 90 of the report in the Restricted Share
award section. 9. The sum of annual bonus, any applicable Restricted Share award and the value of long-term incentives where the performance period ended during the financial year.10. The sum of base salary, benefits, pension, annual bonus, any applicable Restricted Share award and long-term incentives where the performance period ended
during the financial year.11. Hock Goh joined the Board on 2 April 2015.12. Jeff Hewitt retired from the Board on 14 May 2015. 13. Douglas Hurt joined the Board on 2 April 2015.

86 Section FourGovernance
Vesuvius plcAnnual Report and Accounts 2015
Payments to Past Directors – audited
There were no payments made to a past Director of the Company during the year ended 31 December 2015.
Loss of Office Payments – audited
There were no payments made to any Director for loss of office during the year ended 31 December 2015.
Base Salary and Fees
In the year under review, the Chief Executive received a base salary of £550,000 per annum and, while employed by the Company, Chris O’Shea received a base salary of £357,000 per annum and Guy Young received a base salary of £325,000 per annum. Non-executive Directors’ fees were set at £45,000 per annum. Supplementary fees of £15,000 p.a. were paid to the Chairmen of the Audit and Remuneration Committees respectively. A supplementary annual fee of £5,000 was also paid to the Senior Independent Director. The Chairman was paid an annual fee of £185,000. Neither the Chairman, nor the other Non-executive Directors are members of the Group’s pension plans, nor do they participate in the Group’s incentive schemes.
As reported in our 2014 Remuneration Report, there was an increase to the base salary of Chris O’Shea from 1 January 2015, but there were no other increases to the Directors’ base salary or fees in 2015. François Wanecq’s base salary was reviewed in late 2015 in line with the Group’s longer-term approach of reviewing the salaries of Executive Directors and senior executives every two to three years. This was the first time his base salary had been reviewed since demerger and, following this review, it was resolved that his salary in 2016 should be increased by 7.2%, up to £590,000 per annum, in recognition of his leadership of the Group over the three years since demerger and during the current tough trading environment being experienced. In considering this increase the Committee also took into account the fact that over the past three years the salary increase for the UK salaried employee workforce has been 7.6%. There is no change to Guy Young’s base salary.
Pension Arrangements – audited
In accordance with his service agreement, François Wanecq is entitled to a pension allowance of 30% of base salary (as was Chris O’Shea). Guy Young is entitled to a pension allowance of 25% of base salary. This amount can be used to participate in Vesuvius’ pension arrangements, be invested in their own pension arrangements or be taken as a cash supplement (or any combination of these alternatives).
Pension allowance
Director2015
(£000)2014
(£000)
François Wanecq 165 165
Chris O’Shea1 76 102
Guy Young2 14 –
Notes:1. Chris O’Shea left the Company’s employment on 17 September 2015.2. Guy Young joined the Company’s employment on 1 November 2015.
Annual Bonus
The Executive Directors are eligible to receive an annual incentive calculated as a percentage of base salary, based on achievement against specified targets. There is no deferral of annual bonuses for Executive Directors. Each year the Remuneration Committee establishes the financial performance criteria for the forthcoming year. These criteria are set by reference to the Company’s financial budget. The target range is set to ensure that maximum bonuses are only paid for significantly exceeding performance expectations. The Remuneration Committee considers that the setting and attainment of these targets is important in the context of achievement of the Company’s longer-term strategic goals.
The annual incentive has a threshold level of performance below which no award is paid, a target level and a maximum performance level at which a maximum award is earned. François Wanecq’s maximum annual incentive potential is 125% of base salary and his target annual incentive potential is 62.5% of base salary. Chris O’Shea’s maximum annual incentive potential was 100% of base salary and his target annual incentive proposal was 50% of base salary. This is the same for Guy Young.
Directors’ Remuneration Report continued

Govern
ance
87
For the financial year 2015, as in previous years, the Executive Directors’ annual incentives were based on Vesuvius’ Group Headline earnings per share, with an adjustment based on Vesuvius’ working capital performance to focus greater attention on cash flow. As set out in the Remuneration Policy, the effect of this is to reduce the level of pay-out that could be achieved by up to 10% if specified working capital targets are not attained. This ‘kicker’ can also increase the level of pay-out by up to 10%, but not above the stated plan maximum. The 2015 Vesuvius Group Headline earnings per share performance targets set out below were set at the December 2014 full year average foreign exchange rates, being the rates used for the 2015 budget process:
Threshold: 35.0 pence On target: 37.4 pence Maximum: 39.7 pence
In order to achieve the working capital target, the Group’s working capital as a percentage of sales had to be between 22.7% to 23.7% of sales.
In assessing the Group’s performance against these targets, the Committee uses a constant currency approach. Thus, the 2015 full year EPS performance was retranslated at December 2014 full year average foreign exchange rates to establish performance. This is consistent with practice in previous years.
In 2015 Vesuvius’ retranslated EPS performance was 28.6 pence, and working capital was 26.3%. Consequently, no payment was made under the Annual Incentive Plan to any Executive Director.
The Remuneration Committee has determined that for 2016 François Wanecq and Guy Young’s annual incentives will again be principally focused on Group Headline earnings per share, with the same adjustment based on the Group’s working capital performance. However the Committee resolved that in 2016, 80% of the bonus will be based on this financial target and 20% of the bonus will be based on the achievement of personal objectives. This structure is consistent with that applicable to senior executive management. In 2016 there will be four measures set by the Committee for François Wanecq and five for Guy Young, that comprise each Executive Director’s personal objectives. François Wanecq’s and Guy Young’s maximum annual incentive bonus potential for 2016 remain unchanged at 125% and 100% respectively. The Company will not be disclosing the objectives set until after the relevant performance period has ended because of commercial sensitivities. The personal objectives are all non-financial or job-specific in nature and track performance against key strategic, organisational and operational goals.
Malus/Clawback Arrangements in 2016
Vesuvius has had clawback arrangements in respect of Executive Directors’ variable remuneration since 2012. The existing structure of those arrangements is outlined in our Remuneration Policy.
As reported in our 2014 Remuneration Report, the Committee decided to strengthen these clawback arrangements by adding, in 2015, malus provisions, which provide the Committee with the flexibility, if required, to withhold or recover payments made to Executive Directors under the Annual Incentive Plan and/or to withhold or recover share awards granted to Executive Directors under the Vesuvius Share Plan. The circumstances in which the Committee could potentially elect to apply malus and clawback provisions include a material misstatement in the Company’s financial statements; an error in the calculation of the extent of payment or vesting of an incentive; gross misconduct by an individual; or significant financial loss or serious reputational damage to Vesuvius plc resulting from an individual’s conduct, a material failure of risk management or a serious breach of health and safety. These malus and clawback provisions apply for a period of up to three years after the end of a performance period.

88 Section FourGovernance
Vesuvius plcAnnual Report and Accounts 2015
Outstanding Longer-term pay – audited
Performance Share awards are allocated to the Executive Directors under the Vesuvius Share Plan. In accordance with the Remuneration Policy and the rules of the Plan, they are eligible to receive, on an annual basis, a Performance Share award with a face value of up to 200% of salary. Vesting of 50% of shares awarded is based upon the Company’s three-year TSR performance relative to that of the constituent companies of the FTSE 250 (excluding Investment Trusts), and 50% on Headline EPS growth, as compared with the compound annual growth in global GDP over a three-year period. The level of compound Headline EPS growth specified in the targets is set by the Remuneration Committee each year, taking into account the Group’s prospects and the broader global economic environment. The two measures operate independently. The use of these performance measures is intended to align executive remuneration with shareholders’ interests.
Targets for the 2013 Performance Share awards – audited
Vesuvius Share Plan – performance targets
TSR ranking relative to FTSE 250 excluding investment trusts Vesting percentage
Annual compound Headline EPS growth above global GDP Vesting percentage
Below median 0% Below 7% 0%
Median 12.50% 7% 12.50%
Between median and upper quintile
Pro rata between 12.5% and 50%
Between 7% and 15% Pro rata between 12.5% and 50%
Upper quintile 50% At or above 15% 50%
Targets for the 2014 and 2015 Performance Share awards – audited
Vesuvius Share Plan – performance targets
TSR ranking relative to FTSE 250 excluding investment trusts Vesting percentage
Annual compound Headline EPS growth above global GDP Vesting percentage
Below median 0% Below 3% 0%
Median 12.50% 3% 12.50%
Between median and upper quintile
Pro rata between 12.5% and 50%
Between 3% and 15% Pro rata between 12.5% and 50%
Upper quintile 50% At or above 15% 50%
Targets for the 2016 Performance Share awards – audited
The Remuneration Committee has determined that François Wanecq will receive a Performance Share award in 2016 equivalent in value to 200% of his base salary and Guy Young an award equivalent in value to 125% of his base salary. In February 2016, the Committee reviewed the performance conditions proposed for the award of Performance Shares in 2016 and resolved to simplify and amend the EPS performance measure by removing the reference to global GDP. Removing the reference to global GDP ensures that the arrangements are simplified and are more understandable for all participants. The Committee has set a schedule of EPS targets that is designed at the maximum to be highly challenging, whilst remaining an effective incentive for the management team in the current difficult market conditions.
Vesuvius Share Plan – performance targets
TSR ranking relative to FTSE 250 excluding investment trusts Vesting percentage
Annual compound Headline EPS growth Vesting percentage
Below median 0% Below 3% 0%
Median 12.50% 3% 12.50%
Between median and upper quintile
Pro rata between 12.5% and 50%
Between 3% and 6% Pro rata between 12.50% and 25%
Upper quintile 50% 6% 25%
Between 6% and 15% Pro rata between 25% and 50%
At or above 15% 50%
Directors’ Remuneration Report continued
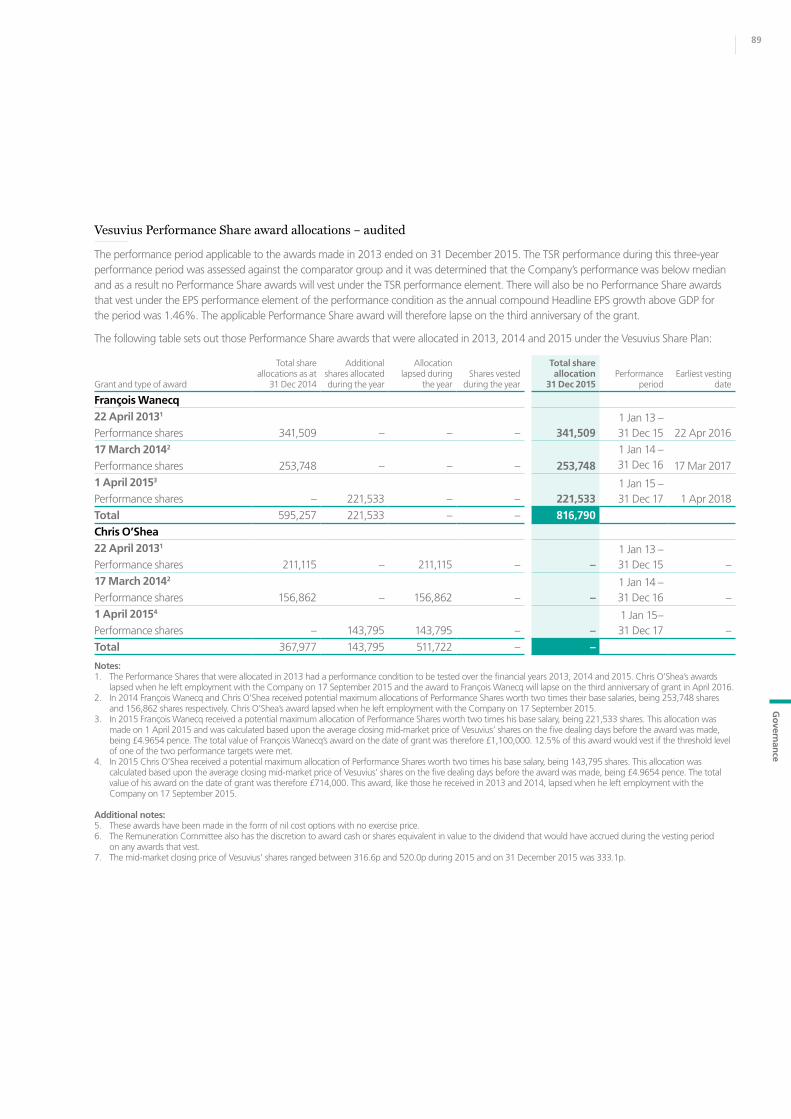
Govern
ance
89
Vesuvius Performance Share award allocations – audited
The performance period applicable to the awards made in 2013 ended on 31 December 2015. The TSR performance during this three-year performance period was assessed against the comparator group and it was determined that the Company’s performance was below median and as a result no Performance Share awards will vest under the TSR performance element. There will also be no Performance Share awards that vest under the EPS performance element of the performance condition as the annual compound Headline EPS growth above GDP for the period was 1.46%. The applicable Performance Share award will therefore lapse on the third anniversary of the grant.
The following table sets out those Performance Share awards that were allocated in 2013, 2014 and 2015 under the Vesuvius Share Plan:
Grant and type of award
Total share allocations as at
31 Dec 2014
Additional shares allocated during the year
Allocation lapsed during
the yearShares vested
during the year
Total share allocation
31 Dec 2015Performance
periodEarliest vesting
date
François Wanecq22 April 20131 1 Jan 13 –
31 Dec 15Performance shares 341,509 – – – 341,509 22 Apr 2016
17 March 20142 1 Jan 14 – 31 Dec 16Performance shares 253,748 – – – 253,748 17 Mar 2017
1 April 20153 1 Jan 15 – 31 Dec 17 Performance shares – 221,533 – – 221,533 1 Apr 2018
Total 595,257 221,533 – – 816,790Chris O’Shea22 April 20131 1 Jan 13 –
31 Dec 15Performance shares 211,115 – 211,115 – – –
17 March 20142 1 Jan 14 – 31 Dec 16Performance shares 156,862 – 156,862 – – –
1 April 20154 1 Jan 15– 31 Dec 17 Performance shares – 143,795 143,795 – – –
Total 367,977 143,795 511,722 – –
Notes: 1. The Performance Shares that were allocated in 2013 had a performance condition to be tested over the financial years 2013, 2014 and 2015. Chris O’Shea’s awards
lapsed when he left employment with the Company on 17 September 2015 and the award to François Wanecq will lapse on the third anniversary of grant in April 2016.2. In 2014 François Wanecq and Chris O’Shea received potential maximum allocations of Performance Shares worth two times their base salaries, being 253,748 shares
and 156,862 shares respectively. Chris O’Shea’s award lapsed when he left employment with the Company on 17 September 2015.3. In 2015 François Wanecq received a potential maximum allocation of Performance Shares worth two times his base salary, being 221,533 shares. This allocation was
made on 1 April 2015 and was calculated based upon the average closing mid-market price of Vesuvius’ shares on the five dealing days before the award was made, being £4.9654 pence. The total value of François Wanecq’s award on the date of grant was therefore £1,100,000. 12.5% of this award would vest if the threshold level of one of the two performance targets were met.
4. In 2015 Chris O’Shea received a potential maximum allocation of Performance Shares worth two times his base salary, being 143,795 shares. This allocation was calculated based upon the average closing mid-market price of Vesuvius’ shares on the five dealing days before the award was made, being £4.9654 pence. The total value of his award on the date of grant was therefore £714,000. This award, like those he received in 2013 and 2014, lapsed when he left employment with the Company on 17 September 2015.
Additional notes: 5. These awards have been made in the form of nil cost options with no exercise price.6. The Remuneration Committee also has the discretion to award cash or shares equivalent in value to the dividend that would have accrued during the vesting period
on any awards that vest.7. The mid-market closing price of Vesuvius’ shares ranged between 316.6p and 520.0p during 2015 and on 31 December 2015 was 333.1p.

90 Section FourGovernance
Vesuvius plcAnnual Report and Accounts 2015
Cookson LTIP allocations
Following the demerger of Cookson Group plc, François Wanecq retained an entitlement to allocations of Performance and Matching Shares made under the Cookson Long Term Incentive Plan. His entitlement to shares in Cookson Group plc was rolled over into Vesuvius plc shares. The vesting of these awards was based 50% upon relative TSR performance and 50% on headline EPS performance. Performance was measured by reference to Cookson performance up to the demerger effective date (19 December 2012) and Vesuvius’ performance thereafter.
The performance period applicable to the awards made in 2012 ended on 31 December 2014. The details of the testing and achievement in part of the performance conditions for that performance period were set out in our 2014 Remuneration Report and the vesting of the applicable Performance Share award and Matching Shares took place on 7 April 2015, the first trading day after the third anniversary of the grant of the award.
2012 LTIP Awards (as adjusted for the demerger from awards over shares in Cookson Group plc into awards over shares in Vesuvius plc)
Grant and type of award
Total share allocations as at
31 Dec 2014
Additional shares allocated during the year
Shares vested during the year
Shares lapsed during the year
Total share allocation
31 Dec 2015
Market price of the shares
on the day before award (as adjusted for the
demerger (p))Performance
period
François Wanecq5 April 20121 1 Jan 12 –
31 Dec 14 Performance shares 150,075 – 40,370 109,705 – 365.80
5 April 20121 1 Jan 12 – 31 Dec 14 Matching shares 61,212 – 15,939 45,273 – 365.80
Total 211,287 – 56,309 154,978 –
Note: 1. The performance period for the LTIP awards made in 2012 ended on 31 December 2014. In accordance with the Company’s achievement of the specified performance
conditions, 26.9% of François Wanecq’s Performance Share awards vested on 7 April 2015, and his Matching Shares vested at a ratio of 0.586:1. In addition the Remuneration Committee determined that Mr Wanecq receive a cash payment of £29,000 which is equivalent to the value of the dividends that would have been paid on the number of shares that vested in respect of dividend record dates occurring during the period between the award date and the date of vesting. The mid-market closing price of the Company’s shares on the date of vesting was 517.0p and the total value of the 56,309 shares that François Wanecq received on the date of vesting was therefore £291,117.
Additional note: 2. The mid-market closing price of Vesuvius’ shares ranged between 316.6p and 520.0p during 2015 and on 31 December 2015 was 333.1p.
Restricted Share award
On Guy Young’s appointment as Chief Financial Officer, the Committee resolved, in compliance with the Group’s Remuneration Policy on recruitment, that it would partially compensate him for the long-term incentives awarded by his previous employer that he forfeited as a result of joining Vesuvius. Those awards were subject to no further performance conditions and would have vested at 1 February 2016 dependent only on Guy Young’s continued employment until that date. As partial compensation, the Committee resolved that Guy would receive a one-off Restricted Share award under the Vesuvius plc Share Plan over Vesuvius plc shares to a maximum value of £150,000 with the number of shares under the Restricted Share award being calculated with reference to the closing market price on 2 November 2015 (the first trading day after Guy began employment at Vesuvius) which was £3.659 pence.
Shortly after his appointment Guy Young received a proportion of his long-term incentives from his former employer and thus, in line with the agreement made at the time of his appointment, his Restricted Share award was reduced pro rata for this receipt to an amount of £62,625. Based on the above share price this amounts to a Restricted Share award over 17,115 shares. The Restricted Share award will vest in equal instalments on the date falling six months following his date of commencement of employment and the second anniversary of the date of his commencement of employment. In order to be consistent with the terms of the forfeited long-term awards, vesting of the Restricted Share award will be subject to him remaining employed by the Company and not being under notice of termination on the vesting dates set out above.
Directors’ Remuneration Report continued

Govern
ance
91
Statement of Directors’ shareholdings – audited
The interests of Directors and their connected persons in ordinary shares as at 31 December 2015, including any interests in share options and shares provisionally awarded under the Vesuvius Share Plan are set out below:
Beneficial holding
Outstanding incentive awards
Executive DirectorsFrançois Wanecq 1,319,964 816,790
Guy Young – 17,115
Non-executive DirectorsJohn McDonough CBE (Chairman) 100,000 –
Nelda Connors 693 –
Christer Gardell1 – –
Hock Goh – –
Jane Hinkley 12,000 –
Douglas Hurt – –
Note:1. Christer Gardell is Managing Partner of, and has a financial interest in, Cevian Capital which held 21.11% of Vesuvius’ issued share capital as at 31 December 2015
and at the date of this report.
Additional notes:2. There were no changes in the interests of the Directors in the ordinary shares of the Company in the period from 1 January 2016 to 3 March 2016.3. All awards under the Vesuvius Share Plan are subject to continued employment until the relevant vesting date as set out on 89 and 90. François Wanecq’s awards
are additionally subject to performance conditions as set out on page 88.4. Full details of Directors’ shareholdings, share allocations and share options are given in the Company’s Register of Directors’ Interests, which is open to inspection
at the Company’s registered office during business hours.5. None of the other Directors, nor their spouses nor their minor children, held non-beneficial interests in the ordinary shares of the Company during the year.
Executive Directors’ shareholdings – audited
As at 31 December 2015, the Executive Directors’ shareholdings against the current shareholding guidelines (using the Company’s share price averaged over the trading days of the period 1 December to 31 December 2015 of 332.99p) were as follows:
Director
Actual share ownership as a percentage of salary
at 31 December 2015Policy share ownership
as a percentage of salary Policy met?
François Wanecq 800% 200% Yes
Guy Young 0% 100% Yes (in the build-up period)
Having enhanced the application of the Executive Directors’ shareholding policy during 2014, by increasing the required holding of the Chief Executive to 2x salary, in 2015 the Committee further clarified its interpretation of the policy, whilst remaining in line with the policy overall. This change was to clarify that, not only are Executive Directors required, not just encouraged, to retain at least 50% (measured as the value after tax) of any shares received through the operation of share schemes, but also permission to sell shares held – whether acquired through the operation of share schemes or otherwise – will not be given, other than in exceptional circumstances, if, following the disposal, the shareholding policy is not still met. It was also clarified that (as set out above) compliance with the policy will be tested at the end of each year for application in the following year using the average of the closing prices of a Vesuvius ordinary share for the trading days in that December.

92 Section FourGovernance
Vesuvius plcAnnual Report and Accounts 2015
Annual changes in Chief Executive pay vs. Employee pay
The table below shows the percentage change in the remuneration of the Chief Executive – comprising salary, taxable benefits and annual bonus – and comparable data of UK salaried employees. The UK salaried employee workforce was chosen as a fair representation of a suitable comparator group as François Wanecq, the Chief Executive, is based in the UK (albeit with a global role and responsibilities) and levels of pay vary widely across the Group depending on geography and local market conditions.
Chief Executive
UK salaried employee workforce
(average per capita)
2015 (£000)
2014 (£000) % change % change
Salary 550 550 0 2.08
Taxable benefits 37 42 (12) 3.91
Annual bonus – 442 (100) (61.5)
Annual spend on Employee pay vs. Other distribution
The charts below show the annual spend on all employees (including Executive Directors) compared to distributions made to shareholders for 2014 and 2015:
RemunerationDividends
£345.7m
£43.5m
89%
11%
Relative importance of spend on pay (2015) £m
RemunerationDividends
£358.0m
£43.6m
89%
11%
Relative importance of spend on pay (2014) £m
Spend on pay elements
Expenditure (£m) 2015
Expenditure (£m) 2014
Difference in expenditure
Group remuneration of continuing operations (see Note 8) 345.7 358.0 -3.4%
Dividends (based on final proposed dividend) 43.5 43.6 -2.3%
Directors’ Remuneration Report continued

Govern
ance
93
TSR Performance and Chief Executive pay
The graph entitled TSR performance graph compares Vesuvius TSR performance to that of the same investment in the FTSE 250 Index (excluding Investment Trusts). This index has been chosen as the comparator index to reflect the size, international scope and diversity of the Company. TSR is the measure of the returns that a company has provided for its shareholders, reflecting share price movements and assuming reinvestment of dividends. A spot rate has been used for this graph. The demerger of Vesuvius plc was effective on 19 December 2012 and therefore the graph shows the period from 19 December 2012 to 31 December 2015.
Chief Executive pay – financial year ending 31/12/12 31/12/13 31/12/14 31/12/15
Total remuneration (single figure, (£000)) £1,227 £2,447 £1,519 £752
Annual variable pay (% of maximum) 0% 100% 64% 0%
Long-term variable pay (% of maximum) 67% 28% 27% 0%
Statement on Shareholder voting
At the last AGM (which was held on 14 May 2015) the resolution concerning the advisory vote on the Remuneration Report for 2014 received 223,975,520 votes (98.38%) in favour and 3,681,757 votes against (1.62%). 4,249,388 votes were withheld. At the AGM to be held on 12 May 2016, shareholders will again be invited to participate in an advisory vote on the Remuneration Report.
The Remuneration Policy will next be put to a vote at the AGM in 2017, as that is three years on from 2014, when the policy was approved with 215,577,683 votes (98%) in favour and 4,684,029 votes (2%) against. 213,747 votes were withheld.
The Directors’ Remuneration Report has been approved by the Board and is signed on its behalf by
Jane Hinkley Chairman, Remuneration Committee 3 March 2016
50
100
150
200
19/12/12
TSR performance graph
FTSE 250 Index (excluding Investment Trusts)Vesuvius plc

94 Section FourGovernance
Vesuvius plcAnnual Report and Accounts 2015
The Remuneration Policy was approved at the AGM held on 15 May 2014. The full policy report, as approved by shareholders, can be found in the 2013 Directors’ Remuneration Report (a copy of which can be found in the 2013 Annual Report, available under the Reports tab in the ‘Investors’ section of the Group website www.vesuvius.com).
For the benefit of shareholders, we have reprinted the Policy below. The ‘Restricted Share award’ section in the table below setting out Remuneration Policy for Executive Directors is now historic and relates to the former Chief Financial Officer. Any ongoing Restricted Share awards are now made under the Vesuvius Share Plan. The ‘Legacy Cookson Group Share Scheme’ section is also no longer relevant in 2016. The ‘Selection of Performance Measures’ section sets out our policy and the way it was implemented into 2015. For details of its proposed implementation in 2016 see page 88. The clawback arrangements set out in the Policy have since been expanded to include the malus provisions as set out on page 87 and the shareholding policy set out on page 101 has since been enhanced and clarified as set out on page 91. To ensure that the Policy is relevant to the 2016 financial year, we have made minor textual changes to refer to the applicable financial year in the following sections: Illustration of the Application of the Remuneration Policy for 2016 (which also contains, as described, 2016 data); and Consideration of Shareholder Views. We have amended the ‘Service contracts’ section to refer to the terms of the current Executive Directors and the ‘Terms of service’ section to refer to the dates of appointment of the current non-executive directors.
Directors’ Remuneration Policy
As reported on in 2014 and 2015, the overarching philosophy for remuneration within Vesuvius is to attract, retain and motivate individuals of the calibre necessary to successfully implement our business strategy. In particular, we ensure that incentives are appropriate to encourage enhanced performance and to avoid underperformance being rewarded. In reviewing and setting Vesuvius’ Remuneration Policy, the Committee seeks to balance the interests of our employees and those of our long-term shareholders, to support Company strategy and foster a high-performance culture, where a meaningful portion of remuneration is performance-linked and subject to clawback.
In setting our policy for Executive Directors and senior managers the Committee seeks to emphasise pay for performance and to account for the broad international scale and nature of the Company’s operations. We also consider the approach taken to the pay and employment conditions of other Company employees, together with UK governance requirements and developments in governance practice issued by leading shareholders and shareholder advisory bodies.
The Committee reviews information on the remuneration of comparable roles at similar companies to provide a point of reference for determining remuneration levels. Given that there is not a clear comparator group of companies for Vesuvius, this is judged in the context of other FTSE 250 companies and other relevant international sector-specific companies to reach a rounded judgement and deliver remuneration that is competitive.
Although Vesuvius is in its early stages as an independent company, the Committee is satisfied that the flexibility within the policy, and the ability to exercise discretion and judgement, will allow the Committee to ensure that an appropriate balance between the interests of employees and shareholders is maintained.
Remuneration Policy for Executive Directors
Alignment/purpose Operation Opportunity Performance
Base salaryHelps to recruit and retain key employees. Reflects the individual’s experience, role and contribution within the Company.
The individual’s performance is reviewed annually, with changes to base salary appraised over a two to three-year period.
Any change will be effective from 1 January in the year of the increase.
Base salary is positioned to be market competitive when considered against relevant international and FTSE 250 companies (excluding Investment Trusts).
Paid in cash, subject to local tax and social security regulations.
In considering any increase in base salary, the Committee will consider: (1) the role and value of the individual, (2) changes in job scope or responsibility, (3) progression in the role (e.g. for a new appointee), (4) a significant increase in the scale of role and/or size, value or complexity of the Group, (5) the need to maintain market competitiveness, and (6) increases paid to the wider global employee population in the Company’s most significant locations.
In line with the two to three-year period for base salary appraisal, individual increases when paid are likely to be in excess of those for the wider population of employees for that year.
Any increase will take into account the individual’s performance, contribution and increasing experience.
Remuneration Policy

Govern
ance
95
Alignment/purpose Operation Opportunity Performance
Other benefitsProvides normal market practice benefits.
A range of standard benefits including, but not limited to: car allowance, private medical care (including spouse and dependent children), life assurance, disability, health insurance together with relocation allowance and expatriate benefits.
The Committee retains the discretion to adjust the value of benefits where:
(1) there is a significant change in the individual’s circumstances, (2) there is an increase in existing cost beyond the Company’s control, (3) there is a change in benefit provider(s), or (4) there is a change in an individual’s location; and to amend the type of benefits to reflect the above and market practice.
Standard benefits remain a small percentage of total remuneration.
None.
PensionHelps to recruit and retain key employees. Ensures income in retirement.
An allowance is given as a percentage of base salary. This may be used to participate in Vesuvius’ pension arrangements, invested in own pension arrangements or taken as a cash supplement (or any combination of the above options).
30% of base salary. None.
Annual IncentiveIncentivises Executive Directors to achieve key short-term financial and strategic targets of the Group.
Entire bonus amount payable in cash with no deferral.
The Committee has the discretion to determine that actual incentive payments should be lower than levels calculated by reference to achievement against targets if it considers this to be appropriate. Subject to clawback.
Below threshold: 0%.
On-target: 62.5% of base salary for the Chief Executive and 50% of base salary for other Executive Directors.
Maximum: 125% of base salary for the Chief Executive and 100% of base salary for other Executive Directors.
Payments made between threshold and on-target and between on-target and maximum are pro rated.
Annual Incentive is measured on targets set at the beginning of each year. Currently, it is based on Group Headline earnings per share which accounts for 100% of the performance measure, with an adjustment based on the Group’s working capital performance. The effect of this is to reduce payments by 10% if specified working capital targets are not met. The adjuster also increases pay-out by 10% if targets are exceeded, but not above the plan maximum. Going forward the plan may include other financial or non-financial measures comprising KPIs, corporate objectives and personal performance.
The Committee establishes threshold and maximum performance targets for each financial year, set by reference to the Group budget and other objectives for that year. Actual performance targets will be disclosed after the performance period has ended. They are not disclosed in this policy due to their commercial sensitivity.

96 Section FourGovernance
Vesuvius plcAnnual Report and Accounts 2015
Alignment/purpose Operation Opportunity Performance
Vesuvius Share PlanFlexible ‘umbrella’ Plan.
Aligns Executive Directors’ interests with those of shareholders through the delivery of shares. Rewards Executive Directors for achieving the strategic objectives of growth in shareholder value and earnings.
Assists retention of Executive Directors over a three-year performance period.
Awards may be granted as:
> Performance share awards
> Deferred share bonus awards
> Restricted Share awards
> Market-price options.
Individuals are entitled to an aggregate annual maximum amount of awards. If more than one type of award is granted, the individual limit for all awards is reduced to remain within the maximum.
Awards vest three years after their award date subject to the achievement of specified conditions.
The Committee has the discretion to award participants the equivalent value of dividends accrued during the vesting period on any shares that vest. Subject to clawback.
The Committee will only make awards of Performance Shares to Executive Directors under the Plan, and will consult with shareholders prior to granting other types of awards, excluding restricted share awards authorised under the recruitment policy.
Executive Directors are eligible to receive an annual award with a face value of up to 200% of base salary in performance share awards.
Vesting of 50% of performance share awards is subject to the Company’s TSR performance vs. the FTSE 250 (excluding Investment Trusts), with:
> 0% vesting for below median performance
> 12.5% of the total award vesting at median performance
> 50% of the total award vesting at upper quintile performance
> Pro rata vesting between median and upper quintile.
Vesting of the remaining 50% of performance share awards is subject to the growth in the Company’s EPS. The Committee decides on the appropriate EPS growth targets each year, taking into account the Group’s prospects and the broader global economic environment.
The Company reserves the right only to disclose EPS performance targets after the performance period has ended due to their commercial sensitivity.
Prior to any vesting, the Remuneration Committee also reviews the underlying financial performance of the Company over the performance period to justify the vesting.
Legacy Cookson Group share schemesUsed to align Executive Directors’ interests with those of shareholders through share ownership.
Awards granted prior to the demerger remain outstanding. No further awards will be made under these plans.
Subject to achieving the relevant vesting criteria, the Company will satisfy awards as they arise.
Performance and other conditions set at the time of award continue to operate.
Restricted Share awardA one-off award to compensate for prior employer long-term incentive awards forfeited on appointment at Vesuvius.
Dated 5 November 2012 to the then Chief Financial Officer. Half of the award vested on first anniversary of joining, the remainder vested on 20 October 2014.
Shares to the face value of 1x base salary (108,805 Vesuvius shares), together with shares or cash to the value of dividends that would have accrued on the shares between date of award and vesting.
None. Holder must remain employed and not be under notice of termination.
Remuneration Policy continued

97
Govern
ance
Selection of Performance Measures
Measures for the Annual Incentive are selected to reflect key strategic aims and the need for a rigorous focus on working capital management. Each year the Committee will agree challenging targets to ensure that underperformance is not rewarded.
For the Vesuvius Share Plan, at the demerger, Vesuvius stated that the performance measures would be similar to those for the Cookson LTIP, to focus Executive Directors on the execution of long-term strategy and also align their rewards with value created for shareholders. On this basis, the performance conditions for the Vesuvius performance share awards are based half on TSR performance and half on EPS performance. The comparator for the TSR performance condition will be reviewed annually to ensure its continuing relevance for the Group. In 2016 the Committee agreed the continuation of comparison to the FTSE 250 (excluding Investment Trusts). In respect of the EPS measure, the Committee wished to align the target with the Company’s ambitions to grow ahead of end-markets. As an international company, a global metric was deemed important by the Committee, and in 2013 an EPS target, based upon out-performing global Gross Domestic Product (‘GDP’) growth was adopted. This was continued into 2015 with the EPS performance metric being simplified and amended for 2016, as set out on page 88. Within the policy period, the Committee will continually review the performance conditions used, including EPS and other financial measures, to ensure that awards are made on the basis of challenging targets that clearly support the achievement of the Group’s strategic aims.
Illustration of the Application of the Remuneration Policy for 2016
The charts below show the total remuneration for Executive Directors for minimum, on-target and maximum performance. The fixed elements of remuneration comprise base salary, pension and other benefits, using 2016 salary data. The assumptions on which they are calculated are as follows:
Minimum: Fixed remuneration only.
On-target: Fixed remuneration plus on-target Annual Incentive and threshold vesting (i.e. median performance for TSR and threshold for EPS) for performance share awards (made at 200% of base salary for François Wanecq and 125% of base salary for Guy Young) under the Vesuvius Share Plan.
Maximum: Fixed remuneration plus maximum Annual Incentive (being full achievement of financial and personal targets) and 100% vesting for performance share awards (made at 200% of base salary for François Wanecq and 125% of base salary for Guy Young) under the Vesuvius Share Plan.
0 500 1,000 1,500 2,000 2,500 3,000 0 500 1,000 1,500 2,000 2,500 3,000
François Wanecq, Chief Executive
Minimum
100% £803
55%
30% 27% 43% £2,720
25% 20% £1,466
On-target
Maximum
Guy Young, CFO
Minimum
100% £423
61%
37% 28% 35% £1,155
24%
15%£687
On-target
Maximum
Fixed elements Annual variable elements Long-term variable elements
Remuneration Illustrations £000

98 Section FourGovernance
Vesuvius plcAnnual Report and Accounts 2015
Recruitment Policy
On appointment or promotion of a new Executive Director, the Committee will typically use the above policy to determine ongoing remuneration. However, the Committee retains the discretion to make appropriate remuneration decisions outside the standard policy to meet specific circumstances.
Base salary levels will generally be set in accordance with the policy taking into account the experience and calibre of the appointee. If it is appropriate to appoint an individual on a base salary initially below what is adjudged to be market positioning, contingent on individual performance, the Committee retains the discretion to realign base salary over the one to three years following appointment, which may result in a higher rate of annualised increase than might otherwise be awarded under the policy. If the Committee intends to rely on this discretion, it will be noted in the first Annual Directors’ Remuneration Report following an individual’s appointment. Other than in exceptional circumstances, other elements of annual remuneration will, typically, be set in line with this policy. The Committee retains the discretion to make the following exceptions:
> In the event that an internal appointment is made, the Committee may continue with existing remuneration provisions where appropriate > If necessary and appropriate to secure an appointment from an international pool of candidates, the Committee may make additional payments linked to relocation, above those outlined in the policy table and would authorise the payment of a relocation allowance and repatriation, as well as other associated international mobility terms. Such benefits would be set at a level which the Committee considers appropriate for the role and the individual’s circumstances; and
> In order to provide an immediate interest in the Company’s performance, the Committee may grant, on recruitment, an award of Performance Shares (with a market value of up to 200% of salary) under the Vesuvius Share Plan and/or an individual award agreement (under Listing Rule 9.4.2 (2)) on similar terms. Performance conditions for any such award will be set in line with the policy and the Committee will determine the vesting period that will apply to such awards at the time of award, taking into account the strategy and business circumstances of Vesuvius.
Service contracts will be entered into on terms similar to those for the existing Executive Directors, summarised in the ‘Service contract’ section below.
In addition to the annual remuneration elements noted above, the Committee may consider buying out incentive awards that an individual forfeits in accepting an appointment with Vesuvius. The Committee will have the authority to rely on Listing Rule 9.4.2 (2) or to apply the existing limits within the Vesuvius Share Plan to make Restricted Share awards on recruitment. In making any such awards, the Committee will review the terms of any forfeited awards, including, but not limited to, vesting periods, the expected value of such awards on vesting and the likelihood of the performance targets applicable to such awards being met, while retaining the discretion to make any buyout award the Committee determines is necessary and appropriate. The Committee may also require the appointee to purchase shares in Vesuvius to a pre-agreed level prior to vesting of any such awards. The value of any buyout award will be capped, to ensure its maximum value is no higher than the value of the awards that the individual forfeited on joining Vesuvius. Any such awards will be subject to clawback.
With respect to the appointment of a new Chairman or Non-executive Director, appointment terms will be consistent with those currently adopted. Variable pay will not be considered. With respect to Non-executive Directors, fees will be consistent with the policy at the time of appointment.
Remuneration Policy continued

Govern
ance
99
Exit Payment Policy
Vesuvius has the option to make a payment in lieu of part or all of the required notice period for Executive Directors. Any such payment in lieu will consist of the base salary, pension contributions and value of benefits to which the Director would have been entitled for the duration of the remaining notice period, net of statutory deductions in each case. Half of any payments in lieu of notice would be made in a lump sum, the remainder in equal monthly instalments commencing in the month in which the midpoint of their forgone notice period falls (and are reduced or extinguished by salary from any role undertaken by the departing Executive in this time). Executive Directors are subject to certain non-compete covenants for a period of nine months, and non-solicitation covenants for a period of 12 months, following the termination of their employment. Their service agreements are governed by English law.
Neither of the Executive Directors’ contracts contains any change of control provisions and they both contain a duty to mitigate should the Director find an alternative paid occupation in any period during which the Company must otherwise pay compensation on early termination.
The table below summarises how the awards under the annual bonus and Vesuvius Share Plan are typically treated in different leaver scenarios and on a change of control. Whilst the Committee retains overall discretion on determining ‘good leaver’ status, it typically defines a ‘good leaver’ in circumstances such as retirement with agreement of the Company, ill health, disability, death, redundancy, or part of the business in which the individual is employed or engaged ceasing to be part of the Group. Final treatment is subject to the Committee’s discretion.
Event Timing Calculation of vesting/payment
Annual Incentive PlanGood leaver Paid at the same time as to
continuing employeesAnnual bonus is paid only to the extent that any performance conditions have been satisfied and is pro rated for the proportion of the financial year worked before cessation of employment
Bad leaver Not applicable Individuals lose the right to their annual bonus
Change of control Paid on the effective date of change of control
Annual bonus is paid only to the extent that any performance conditions have been satisfied and is pro rated for the proportion of the financial year worked
Vesuvius Share PlanGood leaver On normal vesting date (or earlier
at the Committee’s discretion)Unvested awards vest to the extent that any performance conditions have been satisfied and a pro rata reduction applies to the value of the awards to take into account the proportion of vesting period not served
Bad leaver Unvested awards lapse Unvested awards lapse on cessation of employment
Change of control1 On the date of the event Unvested awards vest to the extent that any performance conditions have been satisfied and a pro rata reduction applies for the proportion of the vesting period not served
Note:1. In certain circumstances, the Committee may determine that unvested awards under the Vesuvius Share Plan will not vest on a change of control but will instead be
replaced by an equivalent grant of a new award, as determined by the Committee, in the new company.
If employment is terminated by the Company, the Committee retains discretion to settle amounts reasonably due to the Executive Director, for example to meet the legal fees incurred by the Executive Director in connection with the termination of employment, where the Company wishes to enter into a settlement agreement (as provided for below) and where the individual must seek independent legal advice. The Company would pay any amounts to which the departing Director was legally entitled. In certain circumstances, the Committee may approve new contractual arrangements with departing Executive Directors including (but not limited to) settlement, confidentiality, restrictive covenants and/or consultancy arrangements. This would only be used where the Committee believed it was in the best interests of the Company to do so.

100 Section FourGovernance
Vesuvius plcAnnual Report and Accounts 2015
Service Contracts
The Committee will periodically review the contractual terms for new Executive Directors to ensure these reflect best practice. Service contracts currently operate on a rolling basis and are limited to a 12-month notice period.
François Wanecq is employed as Chief Executive of Vesuvius pursuant to the terms of a service agreement made with Cookson Group plc dated 17 October 2012, which was assigned to Vesuvius upon completion of the demerger on 19 December 2012. Guy Young is employed as Chief Financial Officer pursuant to the terms of a service agreement with Vesuvius plc dated 16 September 2015. Each Executive Director’s appointment is terminable by Vesuvius on not less than 12 months’ written notice, and by each Executive Director on not less than six months’ written notice.
Considerations of Conditions elsewhere in the Group in developing policy
The Company does not consult directly with employees on Executive Directors’ remuneration arrangements. However, the Remuneration Committee will take into account the pay and employment conditions of other Group employees when determining Executive Directors’ remuneration, particularly when determining base salary increases. The Remuneration Committee will also obtain information on the remuneration paid for comparable roles at other relevant companies to provide a point of reference for determining Remuneration Policy.
Remuneration Policy for Executive Directors compared to other employees
The Remuneration Policy for Executive Directors is designed in line with the remuneration philosophy set out at the beginning of this report – which also underpins remuneration for the wider Group. Remuneration arrangements for Executive Directors draw on the same elements as those for other employees – base salary, fixed benefits, and retirement benefits – with performance-related pay extending down into the management cadres and beyond. However, given that remuneration structures for other employees need to reflect both seniority and local market practice, they differ from the policy for Executive Directors. In particular, Executive Directors receive a higher proportion of their remuneration in performance-related pay and share-based payments and individual percentages of fixed versus variable remuneration and participation in share-based structures decline with seniority.
The process for delivering salary increases on a two to three-year cycle for Executive Directors is also applied to members of the Group Executive Committee and their direct managerial reports. While all employees receive an annual performance appraisal, other employees continue to receive salary reviews on an annual basis.
As with Executive Directors, middle and senior managers participate in the Annual Incentive Plan. For operational employees, any potential award is based upon achieving three measures relating to Group performance, business unit performance, and individual achievement of personal objectives. For functional employees, the award is predominantly based on Group performance, with the remainder awarded against achievement of personal objectives. The awards for middle and senior managers are also adjusted to reflect the level of performance by the business with regard to its working capital management.
For certain senior and middle managers awards are made under the Vesuvius Medium Term Plan (‘MTP’). Awards under the MTP are based on the same measures and targets as the Annual Incentive Plan for those managers. Middle managers participate in the MTP at varying percentage levels, with awards being made in cash. Senior managers have their MTP awards made over Vesuvius shares. In each case, awards are granted following the end of the relevant financial year. The MTP share awards vest on the second anniversary of the date of grant, subject to continuing employment. From 2014 onwards members of the Group Executive Committee (who in 2013 were included in the above MTP in shares) will instead participate in the Vesuvius Share Plan and receive awards of Performance Shares, which will vest in accordance with the same measures and targets as those for Executive Directors. Levels of awards will differ from those of Executive Directors.
Consideration of Shareholder Views
Vesuvius is committed to open and transparent dialogue with its shareholders on remuneration as well as other governance matters. As Chairman of the Committee, Jane Hinkley welcomes shareholder engagement and is available for any discussions investors wish to have on remuneration matters. During 2015, remuneration matters were discussed at a number of meetings with investors. The feedback from such meetings is always shared with the Committee and taken into consideration when decisions are made about future remuneration strategy and arrangements.
Remuneration Policy continued

Govern
ance
101
Shareholding Policy
The Remuneration Committee encourages Executive Directors to build and hold a shareholding in the Company equivalent in value to at least 1x salary. To this end, Executive Directors will normally be expected to retain at least 50% (measured as the value after tax) of any Performance Share awards vesting under the Vesuvius Share Plan, until this criterion has been met. New Executive Directors will be allowed four years in which to acquire this shareholding.
Clawback Arrangements
The Executive Directors are subject to clawback arrangements. In the event that a misstatement is identified in the Company’s Consolidated Financial Statements which requires the restatement of a prior year’s accounts in order to ensure compliance with the requirements of International Financial Reporting Standards or any applicable law, then such portion as the Remuneration Committee deems appropriate of any variable executive remuneration – being all Annual Incentive and Performance Share awards made under the Vesuvius Share Plan – resulting from a measure of financial performance affected by the misstatement will be subject to clawback provisions. The misstatement must be identified and notified to the individual in writing within three years after the end of the relevant performance period.
External Appointments
Whilst neither of the Executive Directors serves as a Non-executive Director of any other quoted company, subject always to consent being granted by the Company for them to take up such an appointment, were they to so serve, the Company would allow them to retain any fees they received for the performance of their duties.
Policy for Non-executive Directors
The Company seeks to appoint Non-executive Directors who have relevant professional knowledge, and have gained experience in a relevant industry and geographical sectors, to support diversity of expertise at the Board and match the wide geographic spread of the Company’s activities.
Non-executive Directors attend Board, Committee and other meetings, held mainly in the UK, together with an annual strategy review to debate the Company’s strategic direction. All Non-executive Directors are expected to familiarise themselves with the scale and scope of the Company’s business and to maintain their specific technical skills and knowledge.
The Board sets the level of fees paid to the Non-executive Directors after considering the role and responsibilities of each Director and the practice of other companies of a similar size and international complexity. The Non-executive Directors do not participate in Board discussions on their own remuneration. No variable remuneration is available to Non-executive Directors. Non-executive Directors receive reimbursement of reasonable expenses incurred in attending the Board, Committee and other ad hoc meetings.
Alignment/Purpose Operation Opportunity Performance
FeesTo attract and retain Non-executive Directors of the necessary skill and experience by offering market competitive fees.
No eligibility for participation in incentive schemes, bonus schemes or retirement plans.
Fees are reviewed bi-annually by the Board.
Non-executive Directors are paid a base fee for the performance of their role, payable in cash, plus additional fees for Committee chairmanship or acting as the Senior Independent Director.
The Chairman is paid a single fee and receives administrative support from the Company.
Non-executive Directors and the Chairman will be paid market appropriate fees, with any increase reflecting changes in the market or adjustments to a specific Non-executive Director’s role.
No eligibility for bonuses, retirement benefits or to participate in the Group’s employee share plans.
Overall fees paid to Non-executive Directors will remain within the aggregate limit stated in our Articles, currently £500,000.
None.

102 Section FourGovernance
Vesuvius plcAnnual Report and Accounts 2015
Terms of Service
The terms of service of the Chairman and the Non-executive Directors are contained in letters of appointment. Each Non-executive Director is appointed subject to their election at the Company’s first Annual General Meeting following their appointment and re-election at subsequent Annual General Meetings. None of the Non-executive Directors are entitled to receive compensation for loss of office at any time. During the first year of his/her appointment the Chairman is entitled to 12 months’ notice from the Company; thereafter, he/she is entitled to six months’ notice from the Company. All Non-executive Directors are subject to retirement, and election or re-election, in accordance with the Company’s Articles of Association. The current policy is for Non-executive Directors to serve on the Board for a maximum of nine years, with review at the end of the three and six years, subject always to mutual agreement and annual performance evaluation. The Board retains discretion to extend the tenure of Non-executive Directors beyond this time, subject to the requirements of Board balance and independence being satisfied.
The table below shows the date of appointment for each of the Non-executive Directors:
Non-executive Director Date of appointment
John McDonough CBE 31 October 2012
Nelda Connors 1 March 2013
Christer Gardell 31 October 2012
Hock Goh 2 April 2015
Jane Hinkley 3 December 2012
Douglas Hurt 2 April 2015
Remuneration Policy continued

Govern
ance
103
Directors’ Report
The Directors submit their Annual Report together with the audited accounts of the Group and of the Company, Vesuvius plc, registered in England and Wales No. 8217766, for the year ended 31 December 2015.
The Companies Act 2006 requires the Company to provide a Directors’ Report for Vesuvius plc for the year ended 31 December 2015. The information that fulfils this requirement and which is incorporated by reference into, and forms part of, this report is included in the following sections of the Annual Report:
> the ‘Our Responsibility’ section > the ‘Governance’ section > Financial Instruments: the information on financial risk management objectives and policies contained in Notes 21 and 28 to the Consolidated Financial Statements
This Directors’ Report and the Strategic Report contained in pages 2 to 63 together represent the management report for the purpose of compliance with DTR 4.1.8R of the UK Listing Authority’s Disclosure and Transparency Rules. The Company does not have any overseas branches within the meaning of the Companies Act 2006.
Going Concern
Information on the business environment in which the Group operates, including the factors that are likely to impact the future prospects of the Group, is included in the Strategic Report. The principal risks and uncertainties that the Group faces throughout its global operations are shown on pages 26 and 27. The financial position of the Group, its cash flows, liquidity position and debt facilities are also described in the Strategic Report. In addition, the Group’s viability statement is set out within the Strategic Report on page 25. Notes 21 and 28 to the Consolidated Financial Statements set out the Group’s objectives, policies and processes for managing its capital; financial risks; financial instruments and hedging activities; and its exposures to credit, market (both currency and interest rate-related) and liquidity risk. Further details of the Group’s cash balances and borrowings are included in Notes 14, 15 and 28 to the Consolidated Financial Statements.
The Directors have prepared cash flow forecasts for the Group for a period in excess of 12 months from the date of approval of the 2015 financial statements. These forecasts reflect an assessment of current and future end-market conditions and their impact on the Group’s future trading performance. The forecasts show that the Group will be able to operate within the current committed debt facilities and show continued compliance with the Company’s financial covenants. On the basis of the exercise described above and the Group’s available committed debt facilities, the Directors consider that the Group and Company have adequate resources to continue in operational existence for a period of 12 months from the date of signing these accounts. Accordingly, they continue to adopt a going concern basis in preparing the financial statements of the Group and the Company.
Research and Development
The Group’s investment in research and development (‘R&D’) during the year under review amounted to £25.8m (representing 2.0% of Group revenue (2014: 1.8%). Further details of the Group’s R&D activities can be found throughout the Strategic Report.
Dividends
An interim dividend of 5.15 pence (2014: 5.0 pence) per Vesuvius ordinary share was paid on 25 September 2015 to Vesuvius shareholders. The Board is recommending a final dividend in respect of 2015 of 11.125 pence (2014: 11.125 pence) per ordinary share which, if approved, will be paid on 20 May 2016 to shareholders on the register at 8 April 2016.
Accountability and Audit
A responsibility statement of the Directors and a statement by the auditor about its reporting responsibilities can be found on pages 107 and 110 to 112 respectively. The Directors fulfil the responsibilities set out in their statement within the context of an overall control environment of central strategic direction and delegated operating responsibility. As at the date of this report, so far as each Director of the Company is aware, there is no relevant audit information of which the Company’s auditor is unaware and each Director hereby confirms that they have taken all the steps that they ought to have taken as a Director in order to make themselves aware of any relevant audit information and to establish that the Company’s auditor is aware of that information.
Auditor Reappointment
KPMG LLP has expressed its willingness to continue in office as auditor of the Company, and consequently, resolutions for the reappointment of KPMG as auditor of the Company and to authorise the Directors to determine its remuneration are to be proposed at the AGM.
Directors
The Directors of the Company are Nelda Connors, Christer Gardell, Hock Goh, Jane Hinkley, Douglas Hurt, John McDonough CBE, François Wanecq and Guy Young. Jeff Hewitt retired and Chris O’Shea resigned as Directors of the Company during the year. All the Directors will retire at the AGM and offer themselves for re-election with the exception of Guy Young, who will stand for election as a Director for the first time at the AGM. Biographical information for the current Directors is given on page 68. Further information on the remuneration of, and contractual arrangements for, the current Executive and Non-executive Directors is given on pages 82 to 102 in the Directors’ Remuneration Report. The Non-executive Directors do not have service agreements.
Directors’ Indemnities
The Directors have been granted Qualifying Third Party Indemnity Provisions by the Company and the Directors of the Group’s UK Pension Plan Trustee Board (none of whom are Directors of Vesuvius plc) have been granted Qualifying Pension Scheme Indemnity
Directors’ Report
104 Section FourGovernance
Vesuvius plcAnnual Report and Accounts 2015
Provisions by Vesuvius Pension Plans Trustees Ltd. The indemnities for Directors of Vesuvius plc have been in force since the date of their appointment. The Pension Trustee indemnities were in force throughout the last financial year and remain in force.
Annual General Meeting
The Annual General Meeting of the Company will be held at The Lincoln Centre, 18 Lincoln’s Inn Fields, London WC2A 3ED on Thursday 12 May 2016 at 11.00 am.
Amendment of Articles of Association
The Company may make amendments to the Articles by way of special resolution in accordance with the Companies Act.
Greenhouse Gas Emissions
Information on our reporting of greenhouse gas emissions, and the methodology used to record these, is set out on page 60 of the Strategic Report.
Donations
In accordance with Company policy, no political donations were made in 2015 (2014: nil).
Change of Control Provisions
The terms of the Group’s committed bank facility and US Private Placement Loan Notes contain provisions entitling the counterparties to exercise termination or other rights in the event of a change of control on takeover of the Company. A number of the arrangements to which the Company and its subsidiaries are party, such as other debt arrangements and share incentive plans, may also alter or terminate on a change of control in the event of a takeover. In the context of the Group as a whole, these other arrangements are not considered to be significant.
Share Capital
As at the date of this report, the Company had an issued share capital of 278,485,071 ordinary shares of 10 pence each. 7,271,174 of these ordinary shares are held in Treasury. Therefore, the total number of Vesuvius plc shares with voting rights is 271,213,897.
Further information relating to the Company’s issued share capital can be found in Note 7 to the Company financial statements.
The Company’s Articles specify that, subject to the authorisation of an appropriate resolution passed at a General Meeting of the Company, Directors can allot relevant securities under Section 551 of the Companies Act up to the aggregate nominal amount specified by the relevant resolution. In addition, the Articles state that the Directors can seek the authority of shareholders in General Meeting to allot equity securities for cash, without first being required to offer such shares to existing ordinary shareholders in proportion to their existing holdings under Section 561 of the Companies Act, in connection with a rights issue and in other circumstances up to the aggregate nominal amount specified by the relevant resolution.
At the Annual General Meeting on 14 May 2015, the Directors were authorised to issue relevant securities up to an aggregate nominal amount of £18,080,926 and empowered to allot equity securities for cash on a non pre-emptive basis up to an aggregate nominal amount of £2,712,138, at any time up to the earlier of the date of the 2016 Annual General Meeting or 30 June 2016. The Directors propose to renew these authorities at the 2016 Annual General Meeting for a further year. In the year ahead, other than in respect of Vesuvius’ ability to satisfy rights granted to employees under its various share-based incentive arrangements, the Directors have no present intention of issuing any share capital of Vesuvius plc.
Authority for Purchase of Own Shares
Subject to the provisions of Company law and any other applicable regulations, the Company may purchase its own shares. At the Annual General Meeting of the Company held on 14 May 2015 Vesuvius shareholders gave authority to the Company to make market purchases of up to 27,121,389 Vesuvius ordinary shares, representing 10% of the Company’s issued ordinary share capital as at the latest practicable day prior to the publication of the Notice of AGM. This authority expires on 30 June 2016 or the date of the AGM to be held in 2016, whichever is the earlier. The Directors will seek renewal of this authority at the forthcoming AGM.
In 2013 the Company acquired 7,271,174 ordinary shares, representing a nominal value of £727,117 and 2.6% of the entire called-up share capital of the Company prior to the purchase. These shares were purchased pursuant to the Board’s commitment to return the majority of the net proceeds of the disposal of the Precious Metals Processing division to shareholders. These shares are currently held as Treasury shares. The Company has not subsequently disposed of any of the repurchased shares. During the year, the Company did not make any further acquisitions of shares, any acquisitions by nominee, nor did it dispose of any shares previously acquired. The Company does not have a lien over any of its shares.
Share Plans
Vesuvius operates a number of share-based incentive plans. For the majority of these plans the Group can satisfy entitlements by the acquisition of existing shares, the transfer of Treasury shares or by the issue of new shares. Existing shares are held in an employee share ownership trust (‘ESOP’). The trustee of the ESOP purchases shares in the open market as required to enable the Group to meet liabilities for the issue of shares to satisfy awards that vest. The trustee does not register votes in respect of these shares and has waived the right to receive any dividends.
In 2015 the trustee of the ESOP purchased 1,170,115 ordinary shares of 10 pence each in Vesuvius plc with a nominal value of £117,011 at an average price, including transaction costs of 447.4 pence per share. See Note 25 to the Consolidated Financial Statements for further information.
Directors’ Report continued

Govern
ance
105
Restrictions on Transfer of Shares and Voting
The Company’s Articles of Association (‘Articles’) do not contain any specific restrictions on the size of a holding or on the transfer of shares. The Directors are not aware of any agreements between holders of the Company’s shares that may result in restrictions on the transfer of securities or voting rights.
No person has any special rights with regard to the control of the Company’s share capital and all issued shares are fully paid. This is a summary only and the relevant provisions of the Articles should be consulted if further information is required.
Interests in the Company’s shares
The Company has been notified in accordance with DTR 5 of the Disclosure and Transparency Rules of the following interests of 3%, or more, of its issued ordinary shares:
31 Dec 2015
3 Mar 2016
Cevian Capital 21.11 21.11
Artisan Partners 13.04 14.05
Franklin Templeton 12.4 12.4
Deutsche Bank – 6.01
Pelham Capital Management CfD 5.9 5.9
Phoenix Asset Management – 3.1
The interests of Directors and their connected persons in the ordinary shares of the Company as disclosed in accordance with the Listing Rules of the UK Listing Authority are as set out on page 91 of the Directors’ Remuneration Report and details of the Directors’ long-term incentive awards are set out on pages 89 and 90.
Equal opportunities employment
Vesuvius plc is an equal opportunities employer and decisions on recruitment, development, training and promotion and other employment related issues are made solely on the grounds of individual ability, achievement, expertise and conduct. These principles are operated on a non-discriminatory basis, without regard to race, colour, nationality, culture, ethnic origin, religion, belief, gender, sexual orientation, age, disability or any other reason not related to job performance or prohibited by applicable law. In cases where employees are injured or disabled during employment with the Group, support is provided to those employees and workplace adjustments are made as appropriate in respect of their duties and working environment, supporting recovery and continued employment.
Employee communication
Vesuvius adopts an open and honest approach to employee communications, supported by regular updates from senior management across all businesses and operations within the Group. Regular communications include email updates on the financial performance of the Company and the industry environment in which Vesuvius operates, an employee intranet which distributes company news and events, as well as local initiatives for employee engagement on a site-by-site basis. The HR department is the primary
point of contact for employees on employment and workplace matters, operating with an open door policy and advising employees of any local legal, tax, pension or other employment changes. There are numerous employee sponsored and led representative bodies within Vesuvius which differ with respect to jurisdiction and geography. Senior management, supported and facilitated by the HR department, encourages open dialogue and seeks opportunities to consult with employee representative bodies as appropriate.
Pensions
In each country in which the Group operates, the pension arrangements in place are considered to be consistent with good employment practice in that particular area. Independent advisers are used to ensure that the plans are operated in accordance with local legislation and the rules of each plan. Group policy prohibits direct investment of pension fund assets in the Company’s shares. Outside the UK, the US, Germany and Belgium, the majority of pension plans in the Group are of a defined contribution nature.
The Group’s UK defined benefits plan (the ‘UK Plan’) and the main US defined benefits plan are closed to new entrants and have ceased providing future benefits accrual, with all eligible employees instead being provided with benefits through defined contribution arrangements. A German defined benefit plan was closed to new entrants on 31 December 2015 and replaced by a defined contribution plan for new joiners.
For the Group’s closed UK Plan a Trustee Board exists comprising employees, former employees and an independent trustee. The Board currently comprises six trustee Directors, of whom two are member-nominated. The administration of the plan is outsourced. The Company is mindful of its obligations under the Pensions Act 2004 and of the need to comply with the guidance issued by the Pensions Regulator. Regular dialogue is maintained between the Company and the Trustee Board of the UK Plan to ensure that both Company and Trustee are apprised of the same financial and other information about the Group and the UK Plan. This is pertinent to each being able to contribute to the effective functioning of the UK Plan.
The latest full valuation of the UK Plan showed a funding surplus, as a result of which Company contributions ceased in July 2013. However, the Company has agreed to make voluntary contributions of £2.0m per annum at least until the next valuation date in recognition of the potential funding strain resulting from the ongoing derisking initiatives likely to be undertaken in the short-term.
The Group’s worldwide net pension deficit at 31 December 2015 was £35.3m (31 December 2014: £51.1m). The increase in discount rates across the UK, US and Germany reduced pension liabilities by £25m. However, this was offset by actuarial losses on plan assets also totalling £25m, largely occurring in the UK and US. The reduction in the net deficit of £15.8m was driven by decreasing long-term inflation expectations in the UK, greater numbers of deferred pensioners transferring out of the UK scheme and continued voluntary Company contributions to fund the UK and US pension plans. Further details of pension arrangements are given in Note 29 to the Consolidated Financial Statements.

106 Section FourGovernance
Vesuvius plcAnnual Report and Accounts 2015
Directors’ Report continued
The following disclosures are made in compliance with the Financial Conduct Authority’s Listing Rule 9.8.4:
Disclosure requirement under LR 9.8.4 Reference/Location
(1) Interest capitalised by the Group during the year See Note 10.1 on page 125
(2) Publication of unaudited financial information Not applicable
(4) Details of any long-term incentive schemes Pages 96 and 97
(5) Director waiver of emoluments Not applicable
(6) Director waiver of future emoluments Not applicable
(7) Allotment for cash of equity securities made during the year Not applicable
(8) Allotment for cash of equity securities made by a major unlisted subsidiary during the year
Not applicable
(9) Details of participation of parent undertaking in any placing made during the year
Not applicable
(10) Details of relevant contracts in which a Director or controlling shareholder was interested during the year
Not applicable
(11) Contracts for the provision of services by a controlling shareholder during the year
Not applicable
(12) Details of any arrangement under which a shareholder has waived or agreed to waive any dividends
Vesuvius plc holds 7,271,174 of its £0.10 ordinary shares as Treasury shares. No dividends are payable on these shares. Cookson Investments (Jersey) Limited, the Trustee of the Company’s ESOP, has agreed to waive on an ongoing basis any dividends payable on shares it holds under the Company’s Employee Share Plans, details of which can be found on page 104
(13) Details of where a shareholder has agreed to waive future dividends
See above
(14) Statements relating to controlling shareholders and ensuring company independence
Not applicable
The Directors’ Report has been approved by the Board and is signed on its behalf by
Henry Knowles Company Secretary 3 March 2016

Govern
ance
107
The Directors of Vesuvius plc are responsible for preparing the Annual Report and the Group and parent company (the ‘Company’) financial statements in accordance with applicable law and regulations.
Company law requires the Directors to prepare Group and Company financial statements for each financial year. Under that law they are required to prepare the Group financial statements in accordance with IFRSs as adopted by the European Union and applicable law and have elected to prepare the Company financial statements in accordance with UK Accounting Standards, including FRS101 ‘Reduced Disclosure Framework’.
Under company law the Directors must not approve the financial statements unless they are satisfied that they give a true and fair view of the state of affairs of the Group and Company and of their profit or loss for that period. In preparing each of the Group and Company financial statements, the Directors are required to:
> Select suitable accounting policies and then apply them consistently
> Make judgements and estimates that are reasonable and prudent > For the Group financial statements, state whether they have been prepared in accordance with IFRSs as adopted by the European Union
> For the Company financial statements, state whether applicable UK Accounting Standards have been followed, subject to any material departures disclosed and explained in the Company financial statements
> Prepare the financial statements on the going concern basis unless it is inappropriate to presume that the Group and the Company will continue in business.
The Directors are responsible for keeping adequate accounting records that are sufficient to show and explain the Company’s transactions and disclose with reasonable accuracy at any time the financial position of the Company and enable them to ensure that its financial statements comply with the Companies Act 2006. They have general responsibility for taking such steps as are reasonably open to them to safeguard the assets of the Group and to prevent and detect fraud and other irregularities.
Under applicable law and regulations, the Directors are also responsible for preparing a Strategic Report, Directors’ Report, Directors’ Remuneration Report and Corporate Governance Report that comply with that law and those regulations.
The Directors are responsible for the maintenance and integrity of the corporate and financial information included on the Company’s website. Legislation in the UK governing the preparation and dissemination of financial statements may differ from legislation in other jurisdictions.
Responsibility Statement of the Directors in respect of the Annual Financial Report
Each of the Directors confirms that to the best of their knowledge:
> The financial statements, prepared in accordance with the applicable set of accounting standards, give a true and fair view of the assets, liabilities, financial position and profit or loss of the Company and the undertakings included in the consolidation taken as a whole
> The Directors’ Report and Strategic Report include a fair review of the development and performance of the business and the position of the Company and the undertakings included in the consolidation taken as a whole, together with a description of the principal risks and uncertainties that they face.
In addition, the Directors consider that the Annual Report, taken as a whole, is fair, balanced and understandable and provides the information necessary for shareholders to assess the Group’s position and performance, business model and strategy.
The names and functions of the Directors of Vesuvius plc are as follows:
John McDonough CBE Chairman François Wanecq Chief Executive Guy Young Chief Financial Officer Nelda Connors Non-executive Director Christer Gardell Non-executive Director Hock Goh Non-executive Director Jane Hinkley Non-executive Director and Chairman
of the Remuneration CommitteeDouglas Hurt Non-executive Director, Senior
Independent Director and Chairman of the Audit Committee
On behalf of the Board
Guy Young Chief Financial Officer 3 March 2016
Statement of Directors’ Responsibilities in respect of the Annual Report and Financial Statements

In this section
110 Independent Auditor’s Report
113 Group Income Statement
114 Group Statement of Comprehensive Income
115 Group Statement of Cash Flows
116 Group Balance Sheet
117 Group Statement of Changes in Equity
118 Notes to the Consolidated Financial Statements
158 Company Balance Sheet
159 Notes to the Company Financial Statements
165 Five-Year Summary: Divisional Results
166 Shareholder Information
168 Glossary
Section Five
Financial Statements
109108 Section FiveFinancial Statements
Vesuvius plcAnnual Report and Accounts 2015
Finan
cial Statements

Section Five Financial Statements
Vesuvius plc Annual Report and Accounts 2015
110
Independent Auditor’s Report to the Members of Vesuvius plc Only
Opinions and conclusions arising from our audit
1 Our opinion on the financial statements is unmodified We have audited the financial statements of Vesuvius plc for the year ended 31 December 2015 which comprise the Group income statement, the Group statement of comprehensive income, the Group statement of cash flows, the Group and Company balance sheets, the Group statement of changes in equity, and the related notes. In our opinion:
> the financial statements give a true and fair view of the state of the Group’s and of the parent company’s affairs as at 31 December 2015 and of the Group’s and the parent company’s profit for the year then ended;
> the Group financial statements have been properly prepared in accordance with International Financial Reporting Standards as adopted by the European Union;
> the parent company financial statements have been properly prepared in accordance with UK Accounting Standards, including FRS 101 Reduced Disclosure Framework; and
> the financial statements have been prepared in accordance with the requirements of the Companies Act 2006; and, as regards the Group financial statements, Article 4 of the IAS Regulation.
2 Our assessment of risks of material misstatementIn arriving at our audit opinion above on the financial statements the risks of material misstatement that had the greatest effect on our audit were as follows (unchanged from 2014):
Recognition of deferred tax assets £57.1 million (2014: £54.0 million): Refer to page 74 (Audit Committee Report), page 125 (accounting policy) and page 127 (financial disclosures).
The risk: The Group has recognised a significant deferred tax asset in respect of unutilised losses and other temporary differences arising in the US. The Group also has losses and other temporary differences for which no deferred tax asset has been recognised in these financial statements. The recognition or otherwise of a deferred tax asset in respect of these losses and other temporary differences is based on judgement in respect of the timing and quantum of expected future profits and the ability of the Group to offset any of its accumulated losses against these expected profits.
Our response: We compared the assumptions used in respect of future taxable profit forecasts to the Group’s long-term forecasts. We considered, amongst other things, historical levels of US tax profits, the historical accuracy of forecasts, the growth forecasts used by the Group, and the period over which those forecasts were applied. This included critically assessing the assumptions and judgements made by the Directors in those growth forecasts, by using our knowledge of the Group and the industry in which it operates, and by comparing growth assumptions to externally derived data. We also assessed the adequacy of the Group’s disclosures setting out the basis of the deferred tax balance and the level of estimation involved.
Income tax payable and provisions £44.2 million (2014: £44.9 million): Refer to page 74 (Audit Committee Report), page 125 (accounting policy) and page 129 (financial disclosures).
The risk: Accounting for income tax positions requires the Directors to make judgements and estimates in relation to income tax issues and exposures. This is one of the key judgemental areas that our audit concentrated on due to the Group operating in a number of tax jurisdictions, the complexities of transfer pricing and other international tax legislation, and the time taken for tax matters to be agreed with the tax authorities.
Our response: Our audit procedures included the use of our own tax specialists to assess the Group’s tax positions, and its correspondence with the relevant tax authorities, to analyse and challenge the assumptions, such as the likelihood of settlement, used to determine tax provisions based on our knowledge and experience of the application of international and local legislation by the relevant authorities and courts. We also considered the adequacy of the Group’s disclosures in respect of net income tax payable and provisions.
Provisions £47.1 million (2014: £52.7 million): Refer to page 74 (Audit Committee Report), page 156 (accounting policy) and page 156 (financial disclosures).
The risk: In providing for known or probable costs, in particular to those resulting from indirect tax, regulatory, legal, environmental requirements or restructuring commitments, the Directors use their judgement, experience, and where appropriate receive external advice, in order to make provisions in the financial statements for such matters. The inherent uncertainty and risk could have material impact on the Group’s financial position and result for the year.
Our response: Our audit procedures included obtaining an understanding from the Directors of the basis for their best estimates, and then challenging the basis used with reference to the latest available corroborative information, in light of our understanding of the business, and by obtaining third party confirmations where appropriate. We assessed the completeness of provisions by considering whether additional provisions were required at the balance sheet date, assessed the timing of obligations with particular respect to the restructuring commitments, as well as considered the reasonableness of provisions in light of historical claims. We met with the Group’s in-house legal counsel to discuss the nature of ongoing claims and in addition assessed whether the Group’s disclosures about provisions, contingent liabilities, and the movements in the year were appropriate.

Finan
cial Statements
111
3 Our application of materiality and an overview of the scope of our auditMateriality for the Group financial statements as a whole was set at £4.6 million (2014: £5.7 million), determined with reference to a benchmark of Group profit before taxation, normalised to exclude non-recurring restructuring costs, of £92.0 million, of which it represents 5% (2014: 5% of Group profit before taxation).
We reported to the Audit Committee any corrected or uncorrected identified misstatements exceeding £230,000 (2014: £300,000), in addition to other identified misstatements that warranted reporting on qualitative grounds.
The Group operates through over 50 reporting components. Of the 20 (2014: 20) components in scope, we subjected 19 (2014: 17) to audits for Group reporting purposes and one (2014: three) to specified risk-focused audit procedures. The latter was not individually financially significant enough to require an audit for Group reporting purposes, but did present specific individual risks that needed to be addressed. The work on 18 (2014: 18) components was performed by component auditors and the rest by the Group audit team. For coverage achieved by Group reporting please refer to the chart below.
The remaining 29% of total Group revenue, 22% of profits and losses that made up total Group profit before tax and 16% of total Group assets is represented by a significant number of reporting components, none of which individually represented more than 2% of any of total Group revenue, profits and losses that made up total Group profit before tax or total Group assets. For these remaining components, we performed analysis at an aggregated Group level to re-examine our assessment that there were no significant risks of material misstatement within these.
The Group audit team instructed component auditors as to the significant areas to be covered, including the relevant risks detailed above and the information to be reported back. The Group audit team approved the component materialities, which ranged from £0.1 million to £3.8 million, having regard to the mix of size and risk profile of the Group across the components.
The Group audit team visited 4 component locations (2014: six) in Brazil, the US, Germany and China (2014: Brazil, the US, Germany, China, the UK, and Poland). Telephone conference meetings were also held with all component auditors. During these visits and meetings, the findings reported to the Group audit team were discussed in more detail, and any further work required by the Group audit team was then performed by the component auditor.
Covered by components in scope for Group reporting Not in-scope for Group reporting purposes
Group’s profits and losses that made up profit
before tax%
78
22
Group’stotal assets
%
84
16
Group’srevenue
%
71
29
Coverage
£4.6mGroup �nancialstatements materiality
£230,000Misstatements reportedto the Audit Committee 75
Normalised profit before tax
£m
Materiality92.0
Materiality to the Group financial statements

Section Five Financial Statements
Vesuvius plc Annual Report and Accounts 2015
112
Independent Auditor’s Report to the Members of Vesuvius plc Onlycontinued
4 Our opinion on other matters prescribed by the Companies Act 2006 is unmodifiedIn our opinion:
> the part of the Directors’ Remuneration Report to be audited has been properly prepared in accordance with the Companies Act 2006; and
> the information given in the Strategic Report and the Directors’ Report for the financial year for which the financial statements are prepared is consistent with the financial statements.
5 We have nothing to report on the disclosures of principal risksBased on the knowledge we acquired during our audit, we have nothing material to add or draw attention to in relation to:
> the directors’ statement on pages 24 to 27, concerning the principal risks, their management, and, based on that, the directors’ assessment and expectations of the group’s continuing in operation over the three years to 31 December 2018; or
> the disclosures in note 2 of the financial statements concerning the use of the going concern basis of accounting.
6 We have nothing to report in respect of the matters on which we are required to report by exception Under ISAs (UK and Ireland) we are required to report to you if, based on the knowledge we acquired during our audit, we have identified other information in the annual report that contains a material inconsistency with either that knowledge or the financial statements, a material misstatement of fact, or that is otherwise misleading.
In particular, we are required to report to you if:
> we have identified material inconsistencies between the knowledge we acquired during our audit and the directors’ statement that they consider that the annual report and financial statements taken as a whole is fair, balanced and understandable and provides the information necessary for shareholders to assess the group’s position and performance, business model and strategy; or
> the Audit Committee Report does not appropriately address matters communicated by us to the audit committee.
Under the Companies Act 2006 we are required to report to you if, in our opinion:
> adequate accounting records have not been kept by the parent company, or returns adequate for our audit have not been received from branches not visited by us; or
> the parent company financial statements and the part of the Directors’ Remuneration Report to be audited are not in agreement with the accounting records and returns; or
> certain disclosures of directors’ remuneration specified by law are not made; or
> we have not received all the information and explanations we require for our audit.
Under the Listing Rules we are required to review:
> the Directors’ statements, set out on pages 25 and 103, in relation to longer-term viability and going concern; and
> the part of the Corporate Governance Statement on page 67 relating to the company’s compliance with the eleven provisions of the 2014 UK Corporate Governance Code specified for our review.
We have nothing to report in respect of the above responsibilities.
Scope and responsibilities As explained more fully in the Directors’ Responsibilities Statement set out on page 107, the directors are responsible for the preparation of the financial statements and for being satisfied that they give a true and fair view. A description of the scope of an audit of financial statements is provided on the Financial Reporting Council’s website at www.frc.org.uk/auditscopeukprivate. This report is made solely to the company’s members as a body and is subject to important explanations and disclaimers regarding our responsibilities, published on our website at www.kpmg.com/uk/auditscopeukco2014a, which are incorporated into this report as if set out in full and should be read to provide an understanding of the purpose of this report, the work we have undertaken and the basis of our opinions.
Paul Korolkiewicz (Senior Statutory Auditor) for and on behalf of KPMG LLP, Statutory Auditor Chartered Accountants 15 Canada Square, London, E14 5GL3 March 2016

113
Finan
cial Statements
Notes
2015 2014
Headline performance
£m
Separately reported
items £m
Total £m
Headline performance
£m
Separately reported
items £m
Total £m
Continuing operationsRevenue 5 1,322.0 — 1,322.0 1,444.4 — 1,444.4
Manufacturing costs (968.9) — (968.9) (1,048.3) — (1,048.3)
Administration, selling and distribution costs (229.1) — (229.1) (253.3) — (253.3)
Trading profit 5 124.0 — 124.0 142.8 — 142.8
Amortisation of acquired intangible assets 17 — (16.6) (16.6) — (17.0) (17.0)
Restructuring charges 7 — (14.6) (14.6) — — —
Operating profit/(loss) 124.0 (31.2) 92.8 142.8 (17.0) 125.8
Net finance costs 10 (15.4) — (15.4) (16.4) — (16.4)
Share of post-tax profit of joint ventures — — — 1.4 — 1.4
Profit on disposal of continuing operations 9 — — — — 0.4 0.4
Profit/(loss) before tax 108.6 (31.2) 77.4 127.8 (16.6) 111.2
Income tax (charge)/credits 11 (27.7) 2.9 (24.8) (32.9) 25.8 (7.1)
Profit/(loss) from:Continuing operations 80.9 (28.3) 52.6 94.9 9.2 104.1
Discontinued operations 23 — 1.4 1.4 — (3.6) (3.6)
Profit/(loss) 80.9 (26.9) 54.0 94.9 5.6 100.5
Profit attributable to:Owners of the parent 75.7 (26.9) 48.8 90.3 5.6 95.9
Non-controlling interests 5.2 — 5.2 4.6 — 4.6
Profit/(loss) 80.9 (26.9) 54.0 94.9 5.6 100.5
Earnings per share — pence 12
Continuing operations — basic 17.6 36.8
— diluted 17.5 36.7
Total operations — basic 18.1 35.5
— diluted 18.1 35.4
Group Income StatementFor the year ended 31 December 2015

Section Five Financial Statements
Vesuvius plc Annual Report and Accounts 2015
114
Notes2015
£m2014
£m
Profit 54.0 100.5
Other comprehensive income/(loss), net of income taxItems that will not be subsequently reclassified to income statementRemeasurement of defined benefit liabilities/assets 29.6 13.0 (9.9)
Income tax relating to items not reclassified 11 1.6 0.5
Items that may be subsequently reclassified to income statementExchange differences on translation of the net assets of foreign operations (29.3) (9.6)
Exchange translation differences arising on net investment hedges 26 (6.1) (0.3)
Change in fair value of cash flow hedges 26 — (0.2)
Change in fair value of available-for-sale investments 26 — (0.2)
Other comprehensive loss, net of income tax (20.8) (19.7)
Total comprehensive income 33.2 80.8
Total comprehensive income attributable to:Owners of the parent 28.2 75.7
Non-controlling interests 5.0 5.1
Total comprehensive income 33.2 80.8
Group Statement of Comprehensive IncomeFor the year ended 31 December 2015

115
Finan
cial Statements
Group Statement of Cash FlowsFor the year ended 31 December 2015
Notes2015
£m2014
£m
Cash flows from operating activitiesCash generated from operations 13 140.0 145.0
Net interest paid (13.6) (12.0)
Income taxes paid (31.8) (24.4)
Net cash inflow from operating activities 94.6 108.6
Cash flows from investing activitiesCapital expenditure (38.1) (53.1)
Proceeds from the sale of property, plant and equipment 1.1 2.0
Proceeds from the sale of investments 0.3 0.6
Acquisition of subsidiaries and joint ventures, net of cash acquired 22 (25.1) (23.4)
Dividends received from joint ventures — 0.6
Other investing outflows (1.6) (2.3)
Net cash outflow from investing activities (63.4) (75.6)
Net cash inflow before financing activities 31.2 33.0
Cash flows from financing activitiesProceeds from/(repayment of) borrowings 15 44.7 (9.8)
Settlement of forward foreign exchange contracts 3.9 4.8
Purchase of own shares (5.2) (0.5)
Borrowing facility arrangement costs (1.4) —
Dividends paid to equity shareholders 27 (43.9) (41.2)
Dividends paid to non-controlling shareholders (2.2) (2.6)
Net cash outflow from financing activities (4.1) (49.3)
Net increase/(decrease) in cash and cash equivalents 15 27.1 (16.3)
Cash and cash equivalents at 1 January 38.5 52.8
Effect of exchange rate fluctuations on cash and cash equivalents 15 1.4 2.0
Cash and cash equivalents at 31 December 14 67.0 38.5
Continuing operations
£m
Discontinued operations
£m
2015 total
£m
Continuing operations
£m
Discontinued operations
£m
2014 total £m
Free cash flowNet cash inflow/(outflow) from operating activities 100.8 (6.2) 94.6 109.1 (0.5) 108.6
Additional funding contributions into Group pension plans 3.7 — 3.7 3.2 — 3.2
Capital expenditure (38.1) — (38.1) (53.1) — (53.1)
Proceeds from the sale of property, plant and equipment 1.1 — 1.1 2.0 — 2.0
Dividends received from joint ventures — — — 0.6 — 0.6
Dividends paid to non-controlling shareholders (2.2) — (2.2) (2.6) — (2.6)
Free cash flow 65.3 (6.2) 59.1 59.2 (0.5) 58.7

Section Five Financial Statements
Vesuvius plc Annual Report and Accounts 2015
116
Group Balance SheetAs at 31 December 2015
Notes2015
£m2014
£m
AssetsProperty, plant and equipment 16 285.3 291.8
Intangible assets 17 683.7 703.9
Employee benefits – net surpluses 29 59.9 49.8
Interests in joint ventures 16.1 16.9
Investments 3.0 3.3
Income tax recoverable 11 1.3 2.9
Deferred tax assets 11 70.7 71.4
Other receivables 19.0 16.5
Total non-current assets 1,139.0 1,156.5
Cash and short-term deposits 14 101.5 76.9
Inventories 20 168.0 191.9
Trade and other receivables 19 316.6 334.1
Income tax recoverable 11 2.8 4.0
Derivative financial instruments 21 0.5 —
Total current assets 589.4 606.9
Total assets 1,728.4 1,763.4
EquityIssued share capital 24 27.8 27.8
Retained earnings 25 2,346.5 2,332.1
Other reserves 26 (1,501.9) (1,466.7)
Equity attributable to the owners of the parent 872.4 893.2
Non-controlling interests 32.7 29.9
Total equity 905.1 923.1
LiabilitiesInterest-bearing borrowings 28 351.7 304.9
Employee benefits – net liabilities 29 95.2 100.9
Other payables 31 17.0 18.2
Provisions 33 29.5 31.9
Deferred tax liabilities 11 44.6 50.3
Total non-current liabilities 538.0 506.2
Interest-bearing borrowings 28 41.4 40.3
Trade and other payables 31 178.0 221.0
Income tax payable 11 48.3 51.8
Provisions 33 17.6 20.8
Derivative financial instruments 21 — 0.2
Total current liabilities 285.3 334.1
Total liabilities 823.3 840.3
Total equity and liabilities 1,728.4 1,763.4
The financial statements were approved and authorised for issue by the Directors on 3 March 2016 and signed on their behalf by:
François Wanecq Guy Young Chief Executive Chief Financial Officer

117
Finan
cial Statements
Issued share capital
£m
Other reserves
£m
Retained earnings
£m
Owners of the parent
£m
Non- controlling
interests £m
Total equity
£m
As at 1 January 2014 27.8 (1,455.8) 2,284.6 856.6 27.3 883.9
Profit — — 95.9 95.9 4.6 100.5
Other comprehensive income/(loss), net of income taxes:
Remeasurement of defined benefit liabilities/assets — — (9.9) (9.9) — (9.9)
Income tax relating to items not reclassified — — 0.5 0.5 — 0.5
Exchange differences on translation of the net assets of foreign operations — (10.2) — (10.2) 0.6 (9.6)
Exchange differences on translation of net investment hedges — (0.3) — (0.3) — (0.3)
Change in fair value of cash flow hedges — (0.2) — (0.2) — (0.2)
Change in fair value of available-for-sale investments — (0.2) — (0.2) — (0.2)
Other comprehensive (loss)/income, net of income tax — (10.9) (9.4) (20.3) 0.6 (19.7)
Total comprehensive (loss)/income — (10.9) 86.5 75.6 5.2 80.8
Purchase of own shares — — (0.5) (0.5) — (0.5)
Recognition of share-based payments — — 2.7 2.7 — 2.7
Dividends paid (Note 27) — — (41.2) (41.2) (2.6) (43.8)
Total transactions with owners — — (39.0) (39.0) (2.6) (41.6)
As at 1 January 2015 27.8 (1,466.7) 2,332.1 893.2 29.9 923.1Profit — — 48.8 48.8 5.2 54.0Other comprehensive income/(loss), net of income taxes:Remeasurement of defined benefit liabilities/assets — — 13.0 13.0 — 13.0Income tax relating to items not reclassified — — 1.6 1.6 — 1.6Exchange differences on translation of the net assets of foreign operations — (29.1) — (29.1) (0.2) (29.3)Exchange differences on translation of net investment hedges — (6.1) — (6.1) — (6.1)Other comprehensive (loss)/income, net of income tax — (35.2) 14.6 (20.6) (0.2) (20.8)Total comprehensive (loss)/income — (35.2) 63.4 28.2 5.0 33.2Purchase of own shares — — (5.2) (5.2) — (5.2)Recognition of share-based payments — — 0.1 0.1 — 0.1
Dividends paid (Note 27) — — (43.9) (43.9) (2.2) (46.1)Total transactions with owners — — (49.0) (49.0) (2.2) (51.2)As at 31 December 2015 27.8 (1,501.9) 2,346.5 872.4 32.7 905.1
Group Statement of Changes in EquityFor the year ended 31 December 2015

Section Five Financial Statements
Vesuvius plc Annual Report and Accounts 2015
118
1. General Information
Vesuvius plc (‘Vesuvius’ or ‘the Company’) is a public limited company registered in England and Wales and listed on the London Stock Exchange. The nature of the operations and principal activities of the Company and its subsidiary and joint venture companies (‘the Group’) is set out in the Strategic Report on pages 2 to 63 and its registered address is shown on page 166.
2. Basis of Preparation
2.1 Basis of accounting
The Consolidated Financial Statements have been prepared in accordance with International Financial Reporting Standards (‘IFRS’) as adopted by the European Union and, with the exception of defined benefit pension plans, certain provisions, available-for-sale investments and derivative financial instruments, under the historical cost convention.
2.2 Basis of consolidation
The Consolidated Financial Statements of the Group incorporate the financial statements of the Company and entities controlled by the Company (its ‘subsidiaries’). Control exists when the Company has the power to direct the relevant activities of an entity that significantly affect the entity’s return so as to have rights to the variable return from its activities. In assessing whether control exists, potential voting rights that are currently exercisable are taken into account. The results of subsidiaries acquired or disposed of during the year are included in the Group income statement from the effective date of acquisition or up to the effective date of disposal, as appropriate.
Where necessary, adjustments are made to the financial statements of subsidiaries to bring their accounting policies into line with those detailed herein to ensure that the Group financial statements are prepared on a consistent basis. All intra-Group transactions, balances, income and expenses are eliminated on consolidation.
Non-controlling interests in the net assets of consolidated subsidiaries are identified separately from the Group’s interest therein. Non-controlling interests consist of the amount of those interests at the date of the original business combination together with the non-controlling interests’ share of profit or loss, each component of other comprehensive income, and dividends paid since the date of the combination. Total comprehensive income is attributed to the non-controlling interests even if this results in the non-controlling interests having a deficit balance.
2.3 Going concern
The Directors have prepared cash flow forecasts for the Group for a period in excess of 12 months from the date of approval of the 2015 financial statements. These forecasts reflect an assessment of current and future end-market conditions and their impact on the Group’s future trading performance. The forecasts show that the Group will be able to operate within the current committed debt facilities and show continued compliance with the Company’s financial covenants. On the basis of the exercise described above and the Group’s available committed debt facilities, the Directors consider that the Group and Company have adequate resources to continue in operational existence for 12 months from the date of signing these accounts. Accordingly, they continue to adopt a going concern basis in preparing the financial statements of the Group and the Company.
2.4 Functional and presentation currency
The financial statements are presented in millions of pound sterling, which is the functional currency of the Company, and rounded to one decimal place. Foreign operations are included in accordance with the policies set out in Note 28.1.
2.5 Disclosure of ‘separately reported items’
IAS 1 Presentation of Financial Statements, provides no definitive guidance as to the format of the income statement, but states key lines which should be disclosed. It also encourages the disclosure of additional line items and the reordering of items presented on the face of the income statement when appropriate for a proper understanding of the entity’s financial performance. In accordance with IAS 1, the Company has adopted a columnar presentation for its Group income statement, to separately identify Headline Performance results, as the Directors consider that this gives a better view of the underlying results of the ongoing business. As part of this presentation format, the Company has adopted a policy of disclosing separately on the face of its Group income statement, within the column entitled ‘Separately reported items’, the effect of any components of financial performance for which the Directors consider separate disclosure would assist both in a better understanding of the financial performance achieved and in making projections of future results. In its adoption of this policy, the Company applies an even-handed approach to both gains and losses and aims to be both consistent and clear in its accounting and disclosure of such items.
Notes to the Consolidated Financial Statements

Finan
cial Statements
119
2. Basis of Preparation (continued)
2.5 Disclosure of ‘separately reported items’ (continued)
Both materiality and the nature and function of the components of income and expense are considered in deciding upon such presentation. Such items may include, inter alia, the financial effect of exceptional items which occur infrequently, such as major restructuring activity, initial recognition and subsequent increase, decrease and amortisation of US deferred tax assets, together with items always reported separately, such as amortisation charges relating to acquired intangible assets, profits or losses arising on the disposal of continuing or discontinued operations and the taxation impact of the aforementioned exceptional items and items reported separately.
2.6 New and revised IFRS
IFRS 9 Financial Instruments (effective after 1 January 2018, for the year-end 2018), replaces the existing guidance in IAS 39 Financial Instruments Recognition and Measurement. IFRS 9 includes revised guidance on the classification and measurement of financial instruments, including a new expected credit loss model for calculating impairment on financial assets, and new general hedge accounting requirements. It also carries forward the guidance on recognition and derecognition of financial instruments from IAS 39. The Group is currently assessing the potential impact on its Consolidated Financial Statements resulting from the application of IFRS 9.
IFRS 15 Revenue from Contracts with Customers (effective after 1 January 2018, for the year-end 2018), establishes a comprehensive framework for determining whether, how much and when revenue is recognised. It replaces existing revenue recognition guidance, including IAS 18 Revenue, IAS 11 Construction Contracts and IFRIC 13 Customer Loyalty Programmes. Based on a preliminary assessment of the adoption of IFRS 15, the Group currently does not believe there will be a significant impact on its Consolidated Financial Statements.
IFRS 16 Leases (effective after 1 January 2019, for the year-end 2019), replaces the existing guidance in IAS 17 Leases. IFRS 16 provides a single lessee accounting model, requiring lessees to recognise assets and liabilities for all leases unless the lease term is 12 months or less or the underlying asset has a low value. The Group is currently assessing the potential impact on its Consolidated Financial Statements resulting from the application of IFRS 16.
Other new or amended standards are not expected to have a significant impact on the Group’s financial statements.
3. Accounting Policies and Critical Judgements
Determining the carrying amount of some assets and liabilities requires estimation of the effect of uncertain future events. The major sources of estimation uncertainty that have a significant risk of resulting in a material adjustment to the carrying amounts of assets or liabilities are noted below.
3.1 Goodwill and other intangible assets
The Directors use their judgement to determine the extent to which goodwill and other capitalised intangible assets have a value that will benefit the performance of the Group over future periods. To assist in making this judgement, the Directors undertake an assessment, at least annually, of the carrying value of the Group’s capitalised goodwill and other intangible assets. In the assessment undertaken as at 31 December 2015, further details of which are given in Note 18, value in use was derived from discounted three-year cash flow projections and terminal value based on a growth rate of 2.5% in the years beyond the projection period. The projection period is, in the opinion of the Directors, an appropriate period over which to view the future results of the Group’s businesses for this purpose. Changes to the assumptions used in making these forecasts could significantly alter the Directors’ assessment of the carrying value of goodwill and other intangible assets.
3.2 Employee benefits
The Group’s financial statements include the costs and obligations associated with the provision of pension and other post-retirement benefits to current and former employees. It is the Directors’ responsibility to set the assumptions used in determining the key elements of the costs of meeting such future obligations. These assumptions are set after consultation with the Group’s actuaries and include those used to determine regular service costs and the financing elements related to the plans’ assets and liabilities. Whilst the Directors believe that the assumptions used are appropriate, a change in the assumptions used could affect the Group’s profit and financial position.

Section Five Financial Statements
Vesuvius plc Annual Report and Accounts 2015
120
Notes to the Consolidated Financial Statementscontinued
3. Accounting Policies and Critical Judgements (continued)
3.3 Provisions
Vesuvius has extensive international operations and is subject to various legal and regulatory regimes, including those covering taxation and environmental matters. Several of the Group’s subsidiaries are parties to legal proceedings, certain of which are insured claims arising in the ordinary course of the operations of the company involved, and are aware of a number of issues which are, or may be, the subject of dispute with tax authorities. Provisions are made for the expected amounts payable in respect of known or probable costs resulting both from legal or other regulatory requirements, or from third-party claims. As the settlement of many of the obligations for which provision is made is subject to legal or other regulatory process, the timing and amount of the associated outflows is subject to some uncertainty. The Directors use their judgement and experience to make provisions in the financial statements for an appropriate amount relating to such matters.
3.4 Taxation(a) Current tax
Tax benefits are not recognised unless it is probable that they will result in future economic benefits to the Group. In assessing the amount of the benefit to be recognised in the financial statements, the Directors exercise their judgement in considering the effect of negotiations, litigation and any other matters that they consider may impact upon the potential settlement. Any interest and penalties on tax liabilities are provided for in the tax charge. The Group operates internationally and is subject to tax in many different jurisdictions. As a consequence, the Group is routinely subject to tax audits and local enquiries which, by their very nature, can take a considerable period of time to conclude. Provisions are made for known issues based upon the Directors’ interpretation of country-specific tax law and their assessment of the likely outcome.
(b) Deferred tax
The Group has recognised deferred tax assets in respect of unutilised losses and other timing differences arising in a number of the Group’s businesses, further details of which are given in Note 11.4. Account has been taken of future forecasts of taxable profit in arriving at the values at which these assets are recognised. If these forecast profits do not materialise or change, or there are changes in tax rates or to the period over which the losses or timing differences might be recognised, then the value of deferred tax assets will need to be revised in a future period.
The Group also has losses and other timing differences, analysed in Note 11.4, for which no deferred tax assets have been recognised in these financial statements, relating either to loss-making subsidiaries where the future economic benefit of the timing difference is not probable or to where the timing difference is of such a nature that its value is dependent on certain types of profit being earned, such as capital profits. If trading or other appropriate profits are earned in future in these companies, these losses and other timing differences may yield benefit to the Group in the form of a reduced tax charge.
4. Non-GAAP Financial Measures
The Company uses a number of non-Generally Accepted Accounting Practice (‘non-GAAP’) financial measures in addition to those reported in accordance with IFRS. The Directors believe that these non-GAAP measures, listed below, are important when assessing the underlying financial and operating performance of the Group and its divisions.
4.1 Headline
Headline performance is from continuing operations and before items reported separately on the face of the income statement.
4.2 Underlying
Underlying performance is adjusted to exclude the effects of changes in exchange rates, business acquisitions and disposals.
4.3 Return on sales
Return on sales is calculated as trading profit divided by revenue.
4.4 Trading profit
Trading profit is defined as operating profit before separately reported items. The Directors believe that trading profit is an important measure of the underlying trading performance of the Group.
4.5 Headline profit before tax
Headline profit before tax is calculated as the net total of trading profit, plus the Group’s share of post-tax profit of joint ventures and total net finance costs associated with headline performance.
4.6 Effective tax rate
The Group’s effective tax rate is calculated on the income tax costs associated with headline performance, divided by headline profit before tax and before the Group’s share of post-tax profit of joint ventures.
Finan
cial Statements
121
4. Non-GAAP Financial Measures (continued)
4.7 Headline earnings per share
Headline earnings per share is calculated by dividing headline profit before tax less associated income tax costs, attributable to owners of the parent by the weighted average number of ordinary shares in issue during the year.
4.8 Operating Cash flow
Operating cash flow is cash generated from continuing operations before restructuring and additional pension funding contributions but after deducting capital expenditure net of asset disposals.
4.9 Free cash flow
Free cash flow is defined as net cash flow from operating activities after net outlays for the purchase and sale of property, plant and equipment, dividends from joint ventures and dividends paid to non-controlling shareholders, but before additional funding contributions to Group pension plans.
4.10 Average working capital to sales ratio
The average working capital to sales ratio is calculated as the percentage of average working capital balances to the total revenue for the year, using constant foreign exchange rates. Average working capital (comprising inventories, trade receivables and trade payables) is calculated as the average of the 12 previous month-end balances.
4.11 Earnings before interest, tax, depreciation and amortisation (‘EBITDA’)
EBITDA is calculated as the total of trading profit before depreciation and amortisation of non-acquired intangibles charges.
4.12 Net interest
Net interest is calculated as interest payable on borrowings less interest receivable, excluding any item separately reported.
4.13 Interest cover
Interest cover is the ratio of EBITDA to net interest.
4.14 Net debt
Net debt comprises the net total of current and non-current interest-bearing borrowings and cash and short-term deposits.
4.15 Net debt to EBITDA
Net debt to EBITDA is the ratio of net debt at the year-end to EBITDA for that year.
4.16 Return on net assets (‘RONA’)
RONA is calculated as trading profit plus share of post-tax profit of joint ventures, divided by average net operating assets, at constant foreign exchange rates (being the average over the previous 12 months of property, plant and equipment, trade working capital and other operating receivables and payables).
4.17 Constant rates
Figures presented at constant rates represent December 2014 numbers retranslated to December 2015 exchange rates.
5. Segment Information
The segment information contained in this Note makes reference to several non-GAAP financial measures, definitions of which can be found in Note 4.
5.1 Business segments Operating segments for continuing operations
Operating segments are reported in a manner consistent with the internal reporting provided to the Executive Directors of the Board, who make the key operating decisions and is responsible for allocating resources and assessing performance of the operating segments. Reflecting the Group’s management and internal reporting structure, segmental information is presented in respect of the two main business segments: Steel and Foundry. The principal activities of each of these segments are described in the Strategic Report on pages 42 to 53.
Segment revenue represents revenue from external customers (inter-segment revenue is not material). Trading profit includes items directly attributable to a segment as well as those items that can be allocated on a reasonable basis.

Section Five Financial Statements
Vesuvius plc Annual Report and Accounts 2015
122
Notes to the Consolidated Financial Statementscontinued
5. Segment Information (continued)
5.2 Revenue recognition
Revenue comprises the fair value of the consideration received or receivable for goods supplied and services rendered to customers after deducting rebates, discounts and value-added taxes, and after eliminating sales within the Group. Revenue from the sale of goods is recognised when persuasive evidence exists that the significant risks and rewards of ownership have been transferred to the customer, recovery of the consideration is probable, there is no continuing management involvement with the goods, and the amount of revenue can be measured reliably. A provision for anticipated returns is made based primarily on historical return rates. Where a contractual arrangement consists of two or more separate elements that can be provided to customers either on a stand-alone basis or as an extra, such as the provision of supplementary materials with equipment, revenue is recognised for each element as if it were an individual contractual arrangement.
5.3 Research & development costs
Expenditure on research activities is recognised in the income statement as an expense in the year in which it is incurred. Expenditure on development activities is capitalised if the product or process is technically and commercially feasible and the Group has sufficient resources to complete development. All other development expenditure is recognised in the income statement as an expense in the year in which it is incurred. Capitalised development expenditure is stated at cost less accumulated amortisation and impairment losses. Capitalised development expenditure in 2015 was nil (2014: nil).
5.4 Income statement
The operating segment results from continuing operations for 2015 and 2014 are presented below.
2015
Steel £m
Foundry £m
Continuing operations
£m
Segment revenue 897.6 424.4 1,322.0
Segment EBITDA 103.8 57.3 161.1Segment depreciation (24.3) (12.8) (37.1)Segment trading profit 79.5 44.5 124.0Amortisation of acquired intangible assets (16.6)Restructuring charges (14.6)Operating profit 92.8
Net finance costs (15.4)Profit before tax 77.4Return on sales margin (%) 8.9 10.5 9.4Capital expenditure additions (£m) 24.4 10.6 35.0
2014
Steel £m
Foundry £m
Continuing operations
£m
Segment revenue 981.4 463.0 1,444.4
Segment EBITDA 121.9 59.4 181.3
Segment depreciation (25.5) (13.0) (38.5)
Segment trading profit 96.4 46.4 142.8
Amortisation of acquired intangible assets (17.0)
Operating profit 125.8
Net finance costs (16.4)
Share of post-tax profit of joint ventures 1.4
Profit on disposal of continuing operations 0.4
Profit before tax 111.2
Return on sales margin (%) 9.8 10.0 9.9
Capital expenditure additions (£m) 28.6 24.9 53.5

Finan
cial Statements
123
5. Segment Information (continued)
5.5 Geographic analysisExternal revenue Non-current assets
2015 £m
2014 £m
2015 £m
2014 £m
USA 247.2 291.0 260.8 243.9
Germany 174.8 202.1 103.5 108.5
China 107.2 103.5 85.4 86.7
UK 71.9 78.2 131.9 143.4
Brazil 69.2 71.9 44.7 62.9
India 96.9 85.9 37.8 37.0
France 44.9 52.6 17.5 14.5
Spain 41.7 45.2 33.9 36.0
Rest of the World 468.2 514.0 292.9 302.4
Continuing operations 1,322.0 1,444.4 1,008.4 1,035.3
External revenue disclosed in the table above is based upon the geographical location of the operation. Non-current assets exclude employee benefits net surpluses and deferred tax assets. Information relating to the Group’s products and services is given in the Strategic Report on pages 2 to 63. The Group is not dependent upon any single customer for its revenue and no single customer, for either of the years presented in the tables above, accounts for more than 10% of the Group’s total external revenue.
6. Amounts payable to KPMG LLP and its Associates2015
£m2014
£m
Fees payable to the Company’s auditor and its associates for the audit of the parent Company and Consolidated Financial Statements 0.4 0.4
Fees payable to the Company’s auditor and its associates for other services:
Audit of the Company’s subsidiaries 1.4 1.4
Audit-related assurance services 0.1 0.1
Tax compliance and advisory 0.1 0.1
Total auditor’s remuneration 2.0 2.0
Total auditor’s remuneration of £2.0m in 2015, all related to continuing operations, of which £1.8m related to audit fees and £0.2m of non-audit fees, the latter comprising of £0.1m in respect of the interim review fee and £0.1m for taxation advice (2014: £2.0m, including £1.8m of audit fees and £0.2m of non-audit fees, the latter comprising £0.1m in respect of the interim review fee and £0.1m for taxation advice). It is the Group’s policy not to use the Group’s auditor for non-audit services other than in very limited circumstances and where they are best placed to do so.
7. Restructuring Charges
The 2015 restructuring charges were £14.6m (2014: nil). During the year a Group-wide restructuring programme was initiated resulting in charges of £15.5m (2014: nil) reflecting redundancy costs of £13.6m, plant closure costs of £1.3m, and consultancy fees of £0.6m. This was partially offset by a release of onerous lease provisions of £0.5m (2014: nil) and a £0.4m (2014: nil) release of provisions for potential claims that have now expired relating to the termination of agents.
The net tax credit attributable to the total restructuring charges was £1.5m (2014: nil).
Cash costs of £11.5m (2014: £5.8m) (Note 13) were incurred in the year in respect of the restructuring programme leaving provisions made but unspent of £9.8m (Note 33) as at 31 December 2015 (2014: £8.0m), of which £3.3m relates to future costs in respect of leases expiring between one and seven years.

Section Five Financial Statements
Vesuvius plc Annual Report and Accounts 2015
124
8. Employees
8.1 Employee benefits expense2015
£m2014
£m
Wages and salaries 271.5 296.9
Social security costs 42.5 45.5
Redundancy costs 13.6 —
Share-based payments (Note 30) 0.1 2.3
Pension costs — defined contribution pension plans (Note 29) 10.7 9.2
— defined benefit pension plans (Note 29) 6.9 3.8
Other post-retirement benefits (Note 29) 0.4 0.3
Total employee benefits expense 345.7 358.0
Of the total employee benefits expense of £345.7m (2014: £358.0m), £331.2m (2014: £356.2m) was charged in arriving at trading profit, within which £nil (2014: £3.6m) was credited from settlement gains relating to employee benefits plans, £0.9m (2014: £1.8m) was charged within ordinary net finance costs, and £13.6m was charged to restructuring costs.
At constant rates the total employee benefits expense for 2014 was £346.5m.
8.2 Average number of employees2015
no.2014
no.
Steel 8,133 7,716
Foundry 3,293 3,387
Continuing operations 11,426 11,103
Discontinued operations — —
Total average number of employees 11,426 11,103
As at 31 December 2015 the Group had 10,912 employees (2014: 11,786).
In May 2015 the Group acquired Sidermes with 135 employees. Had we acquired Sidermes on 1 January, the average headcount would have been 11,470.
8.3 Remuneration of key management personnel
The remuneration of the Directors, who are the key management personnel of the Group, is set out below in aggregate for each of the categories specified in IAS 24 Related Party Disclosures. Further information about the remuneration of individual Directors is provided in the audited part of the Directors’ Remuneration Report on pages 82 to 102.
2015 £m
2014 £m
Short-term employee benefits 0.9 0.9
Post-employment benefits 0.3 0.3
Share-based payments (0.6) 1.0
Total remuneration of key management personnel 0.6 2.2
9. Profit on Disposal of Continuing Operations
The net profit on disposal of continuing operations in 2015 is £nil (2014: £0.4m). In 2014, profit on disposal of continuing operations comprised £0.8m profit on the sale of non-current assets in the USA and Czech Republic, and a £0.4m loss on the dilution of interests in an investment holding in Italy.
Notes to the Consolidated Financial Statementscontinued

Finan
cial Statements
125
10. Net Finance Costs
10.1 Accounting policy
Borrowing costs that are directly attributable to the acquisition, construction or production of an asset that necessarily takes a substantial period of time to get ready for its intended use or sale are capitalised as part of the cost of that asset. Capitalised borrowing costs for 2015 were nil (2014: nil). All other borrowing costs are recognised as an expense in the income statement using the effective interest rate method.
10.2 Total net finance costs2015
£m2014
£m
Interest payable on borrowingsLoans, overdrafts and factoring arrangements 14.9 14.2
Obligations under finance leases 0.1 0.1
Amortisation of capitalised arrangement fees 0.4 1.8
Total interest payable on borrowings 15.4 16.1
Interest on net retirement benefits obligations 0.9 1.8
Unwinding of discounted provisions 1.0 1.1
Finance income (1.9) (2.6)
Total net finance costs 15.4 16.4
11. Income Tax
11.1 Accounting policy
Tax expense represents the sum of current tax and deferred tax. Current and deferred tax are recognised in profit or loss except to the extent that they relate to items charged or credited in other comprehensive income or directly to equity, in which case the associated tax is also dealt with in other comprehensive income or directly in equity.
Current tax is based on taxable profit for the year. Taxable profit differs from profit before tax as reported in the income statement because it excludes items of income or expense that are taxable or deductible in other years and it further excludes items that are never taxable or deductible. The Group’s liability for current tax is calculated using tax rates and laws that have been enacted, or substantively enacted, by the balance sheet date.
Deferred tax is recognised on differences between the carrying amounts of assets and liabilities in the financial statements and the corresponding tax bases used in the computation of taxable profit and is accounted for using the balance sheet liability method. Deferred tax liabilities are generally recognised for all taxable temporary differences and deferred tax assets are recognised to the extent that it is probable that taxable profits will be available against which deductible temporary differences can be utilised. Such assets and liabilities are not recognised if the temporary difference arises from the initial recognition of goodwill or from the initial recognition (other than in a business combination) of other assets and liabilities in a transaction that affects neither the taxable profit nor the accounting profit. Deferred tax is calculated at the tax rates that are expected to apply in the period when the liability is settled or the asset is realised, based on tax rates and laws that have been enacted, or substantively enacted, by the balance sheet date.
Deferred tax liabilities are recognised for taxable temporary differences arising on investments in subsidiaries and interests in joint ventures, except where the Group is able to control the reversal of the temporary difference and it is probable that the temporary difference will not reverse in the foreseeable future. The carrying amount of deferred tax assets is reviewed at each balance sheet date and reduced to the extent that it is no longer probable that sufficient taxable profits will be available to allow all or part of the asset to be recovered. Deferred tax assets and liabilities are offset when there is a legally enforceable right to set off current tax assets against current tax liabilities and when they relate to income taxes levied by the same taxation authority and the Group intends to settle its current tax assets and liabilities on a net basis.

Section Five Financial Statements
Vesuvius plc Annual Report and Accounts 2015
126
11. Income Tax (continued)
11.2 Income tax charge2015
£m2014
£m
Current taxOverseas taxation 28.3 31.8
Adjustments in respect of prior years (0.6) 0.4
Total current tax, continuing operations 27.7 32.2
Deferred taxOrigination and reversal of temporary taxable differences (3.7) (25.7)
Adjustments in respect of prior years 0.8 0.6
Total deferred tax, continuing operations (2.9) (25.1)
Total income tax charge 24.8 7.1
Total income tax charge attributable to:Continuing operations — headline performance 27.7 32.9
— separately reported items (2.9) (25.8)
Total income tax charge 24.8 7.1
The Group’s total income tax charge relating to separately reported items are analysed in the following table:
Separately reported items2015
£m2014
£m
US deferred tax asset (utilisation)/recognition (Note 11.4) (3.3) 21.8
Restructuring charges 1.5 —
Amortisation of acquired intangibles 4.7 4.0
Total tax credit on separately reported items 2.9 25.8
The net tax credit in the Group statement of comprehensive income in the year amounted to £1.6m (2014: £0.5m), £0.9m (2014: £0.5m credit) of which related to net actuarial gains and losses on employee benefits plans and £0.7m (2014: nil) in respect of exchange differences.
The Group operates in a number of countries that have differing tax rates, laws and practices. Changes in any of these areas could, adversely or positively, impact the Group’s tax charge in the future. Continuing losses, or insufficiency of taxable profit to absorb all expenses, in any subsidiary could have the effect of increasing tax charges in the future as effective tax relief may not be available for those losses or expenses. Other significant factors affecting the tax charge are described in Notes 3.4 and 11.1.
11.3 Reconciliation of income tax charge to profit before tax2015
£m2014
£m
Profit before tax 77.4 111.2
Tax at the UK corporation tax rate of 20.25% (2014: 21.5%) 15.7 23.9
Overseas tax rate differences 5.7 6.9
Withholding taxes 3.9 3.9
Amortisation of intangibles (1.2) (0.3)
Expenses not deductible for tax purposes 2.1 2.5
US deferred tax asset not previously recognised (6.4) (34.4)
Deferred tax assets not recognised 5.0 3.9
Utilisation of previously unrecognised tax losses (0.2) (0.3)
Adjustments in respect of prior years 0.2 1.0
Total income tax charge 24.8 7.1
Notes to the Consolidated Financial Statementscontinued

Finan
cial Statements
127
11. Income Tax (continued)
11.4 Deferred tax
Interest £m
Other operating
losses £m
Pension costs
£m
Intangible assets
£m
Other temporary differences
£mTotal
£m
As at 1 January 2014 14.5 13.5 1.7 (41.3) 4.3 (7.3)
Exchange adjustments 1.7 1.0 0.1 0.9 0.4 4.1
Acquisition — — — — (1.3) (1.3)
Credit to Group Statement of Comprehensive Income — — 0.5 — — 0.5
(Charge)/credit to Group Income Statement — (1.0) (1.0) 4.0 1.3 3.3
Credit /(charge) to Group Income Statement US 14.2 9.6 — — (2.0) 21.8
As at 1 January 2015 30.4 23.1 1.3 (36.4) 2.7 21.1
Exchange adjustments 1.4 0.4 (1.1) 1.3 (0.3) 1.7Acquisition — — — — (1.2) (1.2)Credit to Group statement of Comprehensive Income — 0.7 0.9 — — 1.6Credit to Group Income Statement — 0.5 0.2 4.7 0.8 6.2(Charge)/credit to Group Income Statement US (7.7) (0.9) — — 5.3 (3.3)
As at 31 December 2015 24.1 23.8 1.3 (30.4) 7.3 26.1
2015 £m
2014 £m
Recognised in the Group balance sheet as:Non-current deferred tax assets 70.7 71.4
Non-current deferred tax liabilities (44.6) (50.3)
Net total deferred tax liabilities 26.1 21.1
Included in non-current deferred tax assets is £57.1m (2014: £54.0m) in respect of the partial recognition of temporary differences arising in the US computed in accordance with the principles set out in Note 11.1 above. The substantial increase (£21.8m) in the total deferred tax asset recognised in respect of those US attributes in 2014 reflected our increased confidence in their future realisation. We remain confident of the recovery of this asset.
It is now expected that part of the US deferred tax asset will be realised in respect of US pension costs which are reflected directly in the Statement of Other Comprehensive Income. That tax credit has therefore also been reflected in the Statement of Other Comprehensive Income in 2015. There is a consequent £3.3m net reduction of that asset recognised in the Group income statement.
In view of its material size and nature, any tax credit reflected in the Group income statement arising from the recognition of this asset is presented separately from the tax charge on headline performance, in accordance with the principles outlined in Note 2.5 above. Subsequent increase, decrease and amortisation of the resultant deferred tax asset would similarly be expected to be presented in this manner, as the Directors consider that the separate identification of deferred tax for material temporary differences would assist both in a better understanding of the financial performance achieved, and in making projections of future results of the Group.
Tax loss carry-forwards and other temporary differences of £1.3m (2014: £2.1m) were recognised by subsidiaries reporting a loss. On the basis of approved business plans of these subsidiaries, the Directors consider it probable that the tax loss carry-forwards and temporary differences can be offset against future taxable profits.
The total deferred tax assets not recognised as at 31 December 2015 were £256.7m (2014: £259.3m), as analysed below. In accordance with the accounting policy in Note 11.1, these items have not been recognised as deferred tax assets on the basis that their future economic benefit is not probable. In total, there was a decrease of £2.6m (2014: £20.7m) in net unrecognised deferred tax assets during the year.

Section Five Financial Statements
Vesuvius plc Annual Report and Accounts 2015
128
11. Income Tax (continued)
11.4 Deferred tax (continued)2015
£m2014
£m
Operating losses 118.2 117.5
Unrelieved US interest (may be carried forward indefinitely) 61.3 52.3
Capital losses available to offset future UK capital gains (may be carried forward indefinitely) 33.0 33.0
UK ACT credits (may be carried forward indefinitely) 13.1 13.1
US tax credits 2.4 2.0
Other temporary differences 28.7 41.4
Total deferred tax assets not recognised 256.7 259.3
As at 31 December 2015, the Group had total operating losses carried forward with a tax value of £142.0m (2014: £140.6m).
2015 £m
2014 £m
Losses available to set against future US taxable income, due to expire 2024 to 2031 25.8 28.7
Losses available to set against future UK taxable income (may be carried forward indefinitely) 84.6 79.8
Losses available to set against future taxable income in Rest of World (‘RoW’):Due to expire within five years 13.9 14.7
Carried forward indefinitely 17.7 17.4
ROW operating losses 31.6 32.1
Total net operating losses 142.0 140.6
Total net operating losses of £142.0m (2014: £140.6m) comprised unrecognised losses of £118.2m (2014: £117.5m) and recognised losses of £23.8m (2014: £23.1m).
The above losses available relating to the Rest of the World arise in a number of countries, each of which is not individually significant, reflecting the spread of the Group’s operations.
As at 31 December 2015, the Group had US tax credits carried forward with a tax value of £2.4m (2014: £2.0m) as follows:
2015 £m
2014 £m
US research and experimentation credits (due to expire 2018 to 2033) 1.3 1.1
US foreign tax credits (due to expire 2022 to 2024) 1.1 0.9
US tax credits 2.4 2.0
There are no temporary differences associated with investments in subsidiaries and interests in joint ventures for which deferred tax liabilities have not been recognised.
Further UK corporation tax rate reductions to 19% from 1 April 2017 and 18% from 1 April 2020, were substantively enacted on 26 October 2015. Accordingly, the Group’s closing UK deferred tax liability has been provided using a tax rate of 18% except where the reversals are expected to arise prior to 1 April 2020. The impact of using this lower tax rate was included in 2015 and increased the exceptional tax credit relating to the amortisation of intangible assets by £0.8m.
Notes to the Consolidated Financial Statementscontinued
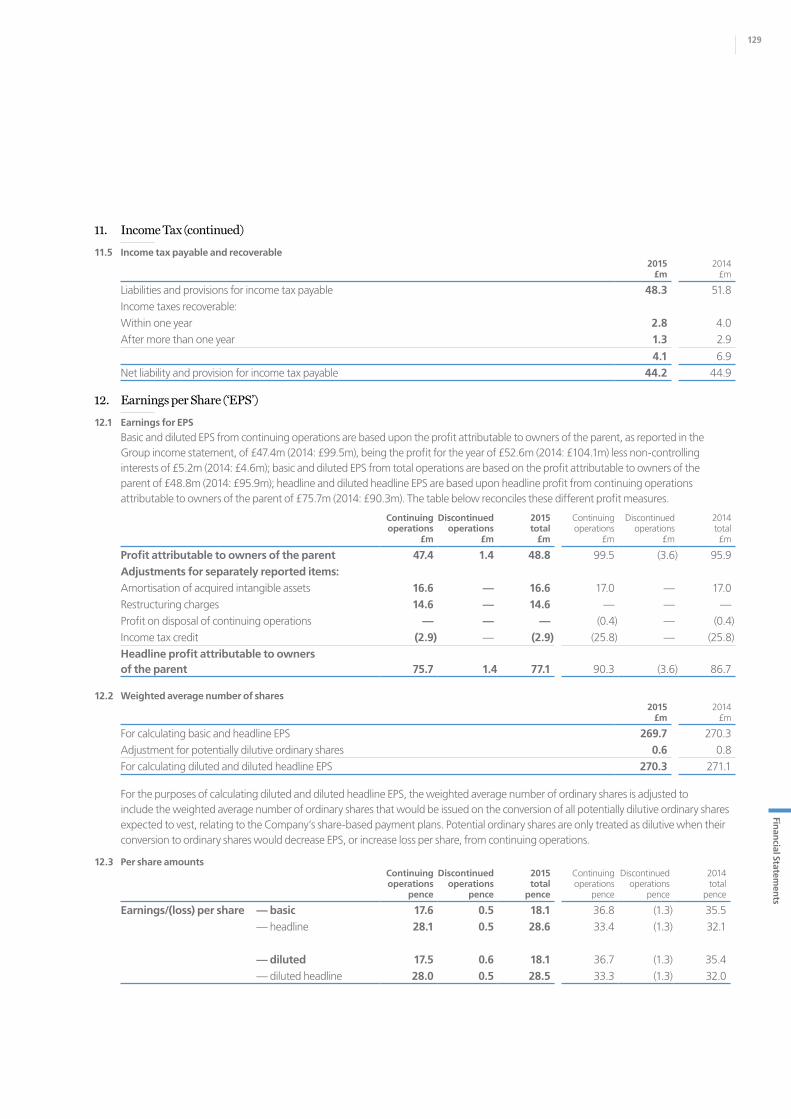
Finan
cial Statements
129
11. Income Tax (continued)
11.5 Income tax payable and recoverable2015
£m2014
£m
Liabilities and provisions for income tax payable 48.3 51.8
Income taxes recoverable:
Within one year 2.8 4.0
After more than one year 1.3 2.9
4.1 6.9
Net liability and provision for income tax payable 44.2 44.9
12. Earnings per Share (‘EPS’)
12.1 Earnings for EPS
Basic and diluted EPS from continuing operations are based upon the profit attributable to owners of the parent, as reported in the Group income statement, of £47.4m (2014: £99.5m), being the profit for the year of £52.6m (2014: £104.1m) less non-controlling interests of £5.2m (2014: £4.6m); basic and diluted EPS from total operations are based on the profit attributable to owners of the parent of £48.8m (2014: £95.9m); headline and diluted headline EPS are based upon headline profit from continuing operations attributable to owners of the parent of £75.7m (2014: £90.3m). The table below reconciles these different profit measures.
Continuing operations
£m
Discontinued operations
£m
2015 total
£m
Continuing operations
£m
Discontinued operations
£m
2014 total £m
Profit attributable to owners of the parent 47.4 1.4 48.8 99.5 (3.6) 95.9
Adjustments for separately reported items:Amortisation of acquired intangible assets 16.6 — 16.6 17.0 — 17.0
Restructuring charges 14.6 — 14.6 — — —
Profit on disposal of continuing operations — — — (0.4) — (0.4)
Income tax credit (2.9) — (2.9) (25.8) — (25.8)
Headline profit attributable to owners of the parent 75.7 1.4 77.1 90.3 (3.6) 86.7
12.2 Weighted average number of shares2015
£m2014
£m
For calculating basic and headline EPS 269.7 270.3
Adjustment for potentially dilutive ordinary shares 0.6 0.8
For calculating diluted and diluted headline EPS 270.3 271.1
For the purposes of calculating diluted and diluted headline EPS, the weighted average number of ordinary shares is adjusted to include the weighted average number of ordinary shares that would be issued on the conversion of all potentially dilutive ordinary shares expected to vest, relating to the Company’s share-based payment plans. Potential ordinary shares are only treated as dilutive when their conversion to ordinary shares would decrease EPS, or increase loss per share, from continuing operations.
12.3 Per share amountsContinuing operations
pence
Discontinued operations
pence
2015 total
pence
Continuing operations
pence
Discontinued operations
pence
2014 total
pence
Earnings/(loss) per share — basic 17.6 0.5 18.1 36.8 (1.3) 35.5
— headline 28.1 0.5 28.6 33.4 (1.3) 32.1
— diluted 17.5 0.6 18.1 36.7 (1.3) 35.4
— diluted headline 28.0 0.5 28.5 33.3 (1.3) 32.0
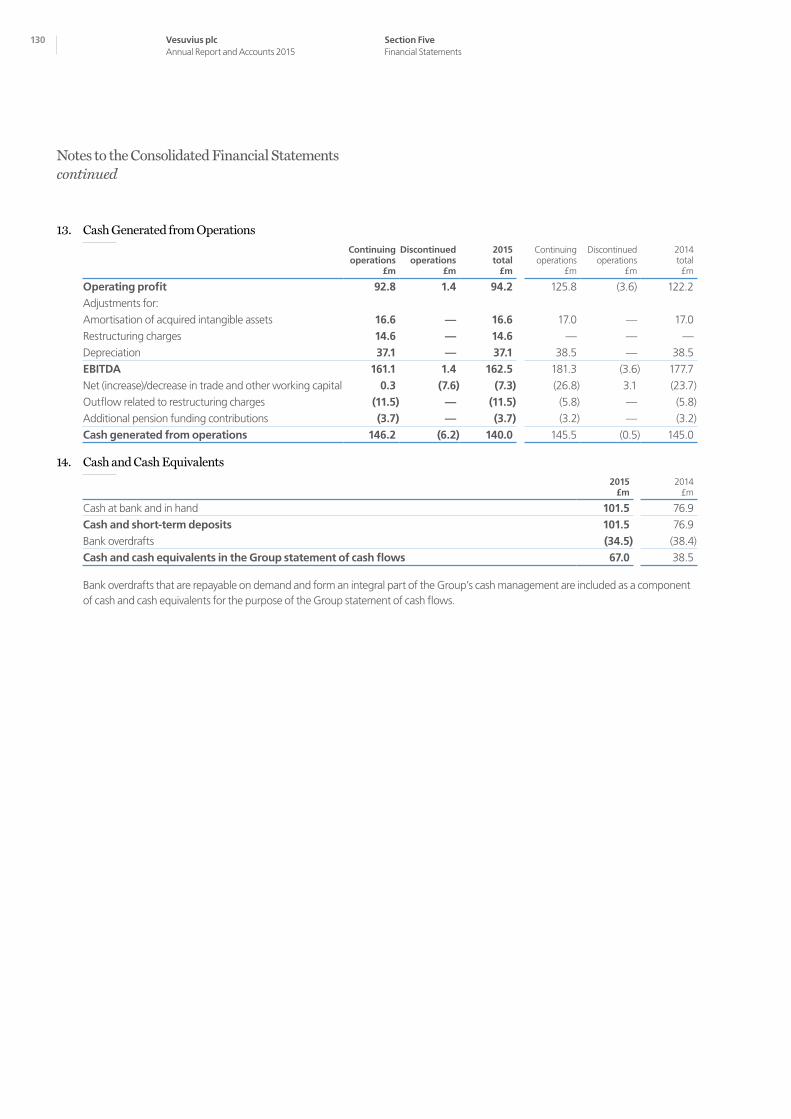
Section Five Financial Statements
Vesuvius plc Annual Report and Accounts 2015
130
Notes to the Consolidated Financial Statementscontinued
13. Cash Generated from OperationsContinuing operations
£m
Discontinued operations
£m
2015 total
£m
Continuing operations
£m
Discontinued operations
£m
2014 total £m
Operating profit 92.8 1.4 94.2 125.8 (3.6) 122.2
Adjustments for:
Amortisation of acquired intangible assets 16.6 — 16.6 17.0 — 17.0
Restructuring charges 14.6 — 14.6 — — —
Depreciation 37.1 — 37.1 38.5 — 38.5
EBITDA 161.1 1.4 162.5 181.3 (3.6) 177.7
Net (increase)/decrease in trade and other working capital 0.3 (7.6) (7.3) (26.8) 3.1 (23.7)
Outflow related to restructuring charges (11.5) — (11.5) (5.8) — (5.8)
Additional pension funding contributions (3.7) — (3.7) (3.2) — (3.2)
Cash generated from operations 146.2 (6.2) 140.0 145.5 (0.5) 145.0
14. Cash and Cash Equivalents2015
£m2014
£m
Cash at bank and in hand 101.5 76.9
Cash and short-term deposits 101.5 76.9
Bank overdrafts (34.5) (38.4)
Cash and cash equivalents in the Group statement of cash flows 67.0 38.5
Bank overdrafts that are repayable on demand and form an integral part of the Group’s cash management are included as a component of cash and cash equivalents for the purpose of the Group statement of cash flows.

Finan
cial Statements
131
15. Reconciliation of Movement in Net Debt
Balance as at 1 Jan 2015
£m
Foreign exchange
adjustments £m
Non-cash movements
£mCash flow
£m
Balance as at 31 Dec 2015
£m
Cash and cash equivalentsCash at bank and in hand 76.9 (0.2) — 24.8 101.5
Bank overdrafts (38.4) 1.6 — 2.3 (34.5)38.5 1.4 — 27.1 67.0
Borrowings, excluding bank overdraftsCurrent (2.2) (0.1) — (5.2) (7.5)Non-current (305.8) (8.0) — (39.5) (353.3)
(308.0) (8.1) — (44.7) (360.8)Capitalised arrangement fees 1.2 — (0.4) 1.4 2.2
Net debt (268.3) (6.7) (0.4) (16.2) (291.6)
Net debt is a measure of the Group’s net indebtedness to banks and other external financial institutions and comprises the total of cash and short-term deposits and current and non-current interest-bearing borrowings.
16. Property, Plant and Equipment
16.1 Accounting policy
Freehold land is carried at cost less accumulated impairment losses. Other items of property, plant and equipment are carried at cost less accumulated depreciation and accumulated impairment losses. Costs are capitalised only when it is probable that they will result in future economic benefits flowing to the Group and when they can be measured reliably. All other repairs and maintenance expenditure are charged to the Group income statement in the period in which they are incurred.
Freehold land is not depreciated as it has an infinite life. Depreciation on other items of property, plant and equipment begins when the asset is available for use and is charged to the Group income statement on a straight-line basis so as to write off the cost less residual value of the asset over its estimated useful life as follows:
Asset category Estimated useful life
Freehold property between ten and 50 years
Leasehold property the term of the lease
Plant and equipment — motor vehicles and information technology equipment between one and five years
— other between three and 15 years
The depreciation method used, residual values and estimated useful lives are reviewed annually and changed, if appropriate. As described in Note 18.1, an asset’s carrying amount is immediately written down to its recoverable amount if its carrying amount is greater than its estimated recoverable amount. Gains and losses arising on disposals are determined by comparing sales proceeds with carrying amount and are recognised in the Group income statement.

Section Five Financial Statements
Vesuvius plc Annual Report and Accounts 2015
132
16. Property, Plant and Equipment (continued)
16.2 Movement in net book valueFreehold property
£m
Leasehold property
£m
Plant and equipment
£m
Construction in progress
£mTotal
£m
CostAs at 1 January 2014 146.2 3.7 452.3 31.5 633.7
Exchange adjustments (2.0) — (3.0) — (5.0)
Capital expenditure additions 6.7 0.5 22.1 24.2 53.5
Acquisitions through business combinations 2.3 — 5.9 — 8.2
Disposals (1.4) (0.5) (8.4) — (10.3)
Reclassifications 5.2 — 10.6 (15.8) —
As at 1 January 2015 157.0 3.7 479.5 39.9 680.1Exchange adjustments (2.3) — (12.8) (1.6) (16.7)
Capital expenditure additions 5.5 — 21.1 8.4 35.0Acquisitions through business combinations 3.8 — 1.9 — 5.7Disposals — — (26.0) (0.1) (26.1)Reclassifications 5.7 (1.4) 13.5 (17.8) —
As at 31 December 2015 169.7 2.3 477.2 28.8 678.0
Accumulated depreciation and impairment lossesAs at 1 January 2014 54.5 2.3 302.2 — 359.0
Exchange adjustments (0.4) — 0.2 — (0.2)
Depreciation charge 4.8 0.3 33.4 — 38.5
Disposals (0.9) (0.5) (7.7) — (9.1)
Reclassifications (0.1) (0.1) 0.3 — 0.1
As at 1 January 2015 57.9 2.0 328.4 — 388.3Exchange adjustments (0.4) — (7.2) — (7.6)Depreciation charge 5.1 0.2 31.8 — 37.1Impairment charge — — 0.6 — 0.6Disposals — — (25.7) — (25.7)Reclassifications 2.1 (0.8) (1.3) — —
As at 31 December 2015 64.7 1.4 326.6 — 392.7
Net book value as at 31 December 2015 105.0 0.9 150.6 28.8 285.3
Net book value as at 31 December 2014 99.1 1.7 151.1 39.9 291.8
Net book value as at 1 January 2014 91.7 1.4 150.1 31.5 274.7
The net book value of assets held under finance leases as at 31 December 2015, 31 December 2014 and 1 January 2014 was not material.
Notes to the Consolidated Financial Statementscontinued

Finan
cial Statements
133
17. Intangible Assets
Intangible assets comprise goodwill and other intangible assets that have been acquired through business combinations.
17.1 Accounting policy (a) Goodwill
Goodwill arising in a business combination is initially recognised as an asset at cost, measured as the excess of the aggregate of the acquisition-date fair value of the consideration transferred and the amount of any non-controlling interest acquired over the net of the acquisition-date fair value amounts of the identifiable assets acquired and liabilities assumed. When the excess is negative, a bargain purchase gain is recognised immediately in profit or loss. Goodwill is subsequently measured at cost less accumulated impairment losses, with impairment testing carried out annually, or more frequently when there is an indication that the cash-generating unit to which the goodwill has been allocated may be impaired. On disposal of a business, the attributable amount of goodwill is included in the calculation of the profit or loss on disposal.
(b) Other intangible assets
Intangible assets other than goodwill are recognised on business combinations if they are separable, or if they arise from contractual or other legal rights, and their value can be measured reliably. They are initially measured at cost, which is equal to the acquisition-date fair value, and subsequently measured at cost less accumulated amortisation charges and accumulated impairment losses. Other intangible assets are subject to impairment testing when there is an indication that an impairment loss may have been incurred and are amortised over their estimated useful lives.
17.2 Movement in net book value
Goodwill £m
Other intangible
assets £m
2015 total
£mGoodwill
£m
Other intangible
assets £m
2014 total £m
CostAs at 1 January 561.4 255.9 817.3 555.3 260.3 815.6
Exchange adjustments (12.1) (5.2) (17.3) (5.5) (4.4) (9.9)
Business combinations (Note 22) 11.9 — 11.9 11.6 — 11.6
As at 31 December 561.2 250.7 811.9 561.4 255.9 817.3
Accumulated amortisation and impairment lossesAs at 1 January — 113.4 113.4 — 97.9 97.9
Exchange adjustments — (1.8) (1.8) — (1.5) (1.5)
Amortisation charge for the year — 16.6 16.6 — 17.0 17.0
As at 31 December — 128.2 128.2 — 113.4 113.4
Net book value as at 31 December 561.2 122.5 683.7 561.4 142.5 703.9

Section Five Financial Statements
Vesuvius plc Annual Report and Accounts 2015
134
17. Intangible Assets (continued)
17.3 Analysis of goodwill by cash-generating unit (‘CGU’)
Goodwill acquired in a business combination is allocated to each of the Group’s CGUs expected to benefit from the synergies of the combination. For the purposes of impairment testing, the Directors consider that the Group has two CGUs: the Steel division and the Foundry division. These CGUs represent the lowest level within the Group at which goodwill is monitored.
2015 £m
2014 £m
Steel 370.8 363.2
Foundry 190.4 198.2
Total goodwill 561.2 561.4
17.4 Analysis of other intangible assets
Other intangible assets arose in 2008 on the acquisition of Foseco plc and are being amortised on a straight-line basis over their estimated useful lives. The assets acquired and their remaining useful lives are shown below.
Remaining useful life
years
Net book value as at
31 Dec 2015 £m
Foseco — customer relationships (useful life: 20 years) 12.3 60.1 — trade name (useful life: 20 years) 12.3 44.3 — intellectual property rights (useful life: ten years) 2.3 18.1Total 122.5
18. Impairment of Tangible and Intangible Assets
18.1 Accounting policy
The Directors regularly review the performance of the business and the external business environment to determine whether there is any indication that those assets have suffered an impairment loss. If such indication exists, the higher of the value in use and the recoverable amount of the asset is estimated and compared to the carrying value in order to determine the extent, if any, of the impairment loss. Where it is not feasible to estimate the recoverable amount of an individual asset, the Directors estimate the recoverable amount of the CGU to which the asset belongs. In addition, goodwill is tested for impairment on an annual basis. Goodwill acquired in a business combination is allocated to each of the Group’s CGUs expected to benefit from the synergies of the combination and the Directors carry out annual impairment testing of the carrying value of each CGU, to assess the need for any impairment of the carrying value of the associated goodwill and other intangible and tangible assets.
For the purpose of impairment testing, the recoverable amount of an asset or CGU is the higher of (i) its fair value less costs to sell and (ii) its value in use. If the recoverable amount of a CGU is less than its carrying amount, the resulting impairment loss is allocated first to reduce the carrying amount of any goodwill allocated to the CGU and then to the other assets of the CGU pro rata on the basis of the carrying amount of each asset in the CGU. An impairment loss recognised for goodwill is not reversed in a subsequent period. An impairment loss recognised in a prior year for an asset other than goodwill may be reversed where there has been a change in the estimates used to measure the asset’s recoverable amount since the impairment loss was recognised.
Notes to the Consolidated Financial Statementscontinued

Finan
cial Statements
135
18. Impairment of Tangible and Intangible Assets (continued)
18.2 Key assumptions
The key assumptions used in determining value in use are return on sales, growth rates and discount rates. Return on sales assumptions are based on historical financial information, adjusted to factor in the anticipated impact of restructuring and rationalisation plans already announced at the balance sheet date.
The value in use calculations of the Group’s CGUs are based on three-year business plans and a terminal value at 2.5% growth rate. The cash flows are discounted to their current value using pre-tax discount rates, which represent each CGU’s weighted average cost of capital (‘WACC’). Growth rates are determined with reference to: current market conditions; external forecasts and historical trends for the Group’s key end-markets of Steel and Foundry; and expected growth in output within the industries in which each major Group business unit operates. A perpetuity growth rate of 2.5% (2014: 2.5%) has been applied. The pre-tax discount rate is the WACC calculated for each CGU as at 31 December 2015 based on industry-specific beta coefficients for the industries in which the CGUs operate, risk-free rates, and equity risk premia related to the major countries in which the CGUs are located, selecting countries which contribute at least 80% of total CGU revenue. The pre-tax discount rate used for the Steel CGU was 11.1% (2014: 10.3%) and for the Foundry CGU was 13.0% (2014: 15.0%). The increase in Steel’s pre-tax discount rate is driven by increasing contributions from emerging markets, which carry higher risk free rates and equity risk premium assumptions. The decrease in Foundry’s pre-tax discount rate is due to the inclusion of a wider range of end-market industries used in the volatility assumption beyond just machinery and automotive industries to ensure the systematic risk coverage reflects the portfolio of the Foundry business globally. Under a sensitivity analysis undertaken on the 2015 impairment testing, a 1.0% increase in each of the CGU discount rates and a 1.0% perpetuity growth rate still left each CGU with headroom of recoverable amount over its carrying value. A pre-tax WACC of 15.9% would result in an impairment of Foundry intangible assets and 14.1% for Steel.
18.3 Goodwill impairment
In assessing goodwill for potential impairment as at 31 December 2015, the Directors made use of detailed calculations of the recoverable amount of the Group’s CGUs as at 31 December 2015. Those calculations resulted in recoverable amounts significantly higher than the carrying values of each of the Group’s CGUs and consequently no impairment charges were recognised.

Section Five Financial Statements
Vesuvius plc Annual Report and Accounts 2015
136
19. Trade and other Receivables
19.1 Accounting policy
Trade and other receivables are initially recognised at fair value and subsequently measured at amortised cost, using the effective interest method, less impairment losses.
19.2 Analysis of trade and other receivables2015 2014
Gross £m
Impairment £m
Net £m
Gross £m
Impairment £m
Net £m
Trade receivables — current 189.3 (0.7) 188.6 212.5 (0.8) 211.7
— one to 30 days past due 42.1 (0.8) 41.3 48.7 (0.7) 48.0
— 31 to 60 days past due 15.9 (0.1) 15.8 14.7 (0.2) 14.5
— 61 to 90 days past due 9.0 (0.7) 8.3 7.1 (0.2) 6.9
— over 90 days past due 42.9 (24.8) 18.1 30.5 (23.5) 7.0
Trade receivables 299.2 (27.1) 272.1 313.5 (25.4) 288.1
Other receivables 20.5 19.9
Prepayments and accrued income 24.0 26.1
Total trade and other receivables 316.6 334.1
All of the Group’s operating companies have policies and procedures in place to assess the creditworthiness of the customers with whom they do business. Where objective evidence exists that a trade receivable balance may be impaired, provision is made for the difference between its carrying amount and the present value of the estimated cash that will be recovered. Evidence of impairment may include such factors as the customer being in breach of contract, or entering bankruptcy or financial reorganisation proceedings. Impairment provisions are assessed on an individual customer basis for all significant outstanding balances and collectively for all remaining balances, based upon historical loss experience. Historical experience has shown that the Group’s trade receivable provisions are maintained at levels that are sufficient to absorb actual bad debt write-offs, without being excessive.
Under its non-recourse factoring arrangements, the Group sells trade receivables balances to a third-party factoring company in exchange for a cash payment from the factoring company, net of fees. All the risks and rewards of the trade receivables subject to these arrangements are transferred to the factoring company and, accordingly, the trade receivables are derecognised in the Group balance sheet. Such arrangements are used from time to time by the Group to manage the recovery of cash from its trade receivables. As at 31 December 2015, the Group balance sheet included £4.7m (2014: £5.9m) of cash that would otherwise have been reported as trade receivables if these arrangements were not in place. The movement since the prior year of £1.2m is due to the ongoing retirement of the debt factoring programme. Factoring fees incurred during the year ended 31 December 2015, which are charged to the Group income statement within ordinary finance costs, amounted to £0.2m (2014: £0.6m).
19.3 Movements on impairment provisions2015
£m2014
£m
As at 1 January 25.4 23.8
Charge for the year 5.0 3.0
Receivables written off during the year as uncollectable (3.3) (1.4)
As at 31 December 27.1 25.4
The charge for the year shown in the table above is recorded within administration, selling and distribution costs or discontinued activities in the Group income statement.
Notes to the Consolidated Financial Statementscontinued

Finan
cial Statements
137
20. Inventories
20.1 Accounting policy
Inventories are stated at the lower of cost (using the first in, first out method) and net realisable value. Cost comprises expenditure incurred in purchasing or manufacturing inventories together with all other costs directly incurred in bringing the inventory to its present location and condition and, where appropriate, attributable production overheads based on normal activity levels. Net realisable value represents the estimated selling price less all estimated costs of completion and costs to be incurred in marketing, selling and distribution. The amount of any write-down of inventories to net realisable value is recognised as an expense in the year in which the write-down occurs.
20.2 Analysis of inventories2015
£m2014
£m
Raw materials 63.2 72.5
Work-in-progress 13.4 16.5
Finished goods 91.4 102.9
Total inventories 168.0 191.9
The cost of inventories recognised as an expense and included in manufacturing costs of continuing operations in the income statement during the year was £596.4m (2014: £670.4m). An expense of £nil (2014: £nil) was included within discontinued operations.
The net inventories of £168.0m includes a provision for obsolete stock of £11.0m (2014: £12.8m).
21. Derivative Financial Instruments
21.1 Accounting policy
The Group uses derivative financial instruments (‘derivatives’) in the form of forward foreign currency contracts, and interest rate swaps to manage the effects of its exposure to foreign exchange risk, and interest rate risk. The way in which derivatives are used to manage the Group’s financial risk is detailed in Note 28.
Derivatives are measured at fair value. The fair value of forward foreign currency contracts is calculated using market prices at the balance sheet date. The fair value of an interest rate swap is the estimated amount that the Group would receive or pay to terminate the swap at the balance sheet date, taking into account current interest rates and the creditworthiness of the swap counterparty.
The method of recognising the gain or loss on remeasurement to fair value depends on whether the derivative is designated as a hedging instrument for hedge accounting purposes and, if so, the nature of the item being hedged. Strict conditions have to be satisfied in order to qualify for hedge accounting, including a determination both at inception of the hedge and on an ongoing basis that the hedge is expected to be highly effective in achieving offsetting changes in fair values or cash flows attributable to the hedged risk. The change in fair value of a derivative that is not designated as a hedging instrument for hedge accounting purposes is recognised immediately in the Group income statement. No derivatives are held for speculative purposes.
Cash flow hedges
The effective part of any gain or loss on a derivative that is designated as a cash flow hedge is recognised in other comprehensive income and presented in the hedging reserve in equity. The ineffective part of any gain or loss is recognised immediately within trading profit, or within finance costs in the case of interest rate swaps designated as cash flow hedges. When the transaction that was being hedged is realised and affects profit or loss, the cumulative gain or loss on the derivative is removed from the hedging reserve and recognised in the income statement in the same period.
Fair value hedges
The change in fair value of a derivative that is designated as a fair value hedge is recognised within trading profit in the Group income statement. The carrying amount of the hedged item is adjusted by the change in its fair value that is attributable to the hedged risk and this adjustment is recognised within trading profit in the Group income statement.
Net investment hedges
The effective part of any gain or loss on a derivative that is designated as a hedge of a net investment in a foreign operation is recognised in other comprehensive income and presented in the translation reserve in equity, and is subsequently recognised in the Group income statement as part of the profit or loss on disposal of the net investment. The ineffective portion of the gain or loss is recognised immediately within trading profit in the Group income statement.

Section Five Financial Statements
Vesuvius plc Annual Report and Accounts 2015
138
21. Derivative Financial Instruments (continued)
21.2 Analysis of derivative financial instruments2015 2014
Assets £m
Liabilities £m
Assets £m
Liabilities £m
Other derivatives — not designated for hedge accounting purposes 0.5 — — 0.2
Total derivative financial instruments 0.5 — — 0.2
All of the fair values shown in the table above are classified under IFRS 13 as Level 2 measurements which have been calculated using quoted prices from active markets, where similar contracts are traded and the quotes reflect actual transactions in similar instruments. All of the derivative assets and liabilities reported in the table above will mature within a year of the balance sheet date.
22. Acquisition of Subsidiaries and Joint Ventures, Net of Cash acquired
On the 15 May, the Group acquired a 100% ownership interest in the Sidermes Group (‘Sidermes’), a leading supplier of temperature and chemical measurement solutions.
Consideration transferred2015
£m
Cash 24.4
Total consideration transferred 24.4
Identifiable assets acquired and liabilities assumed at fair valueInventories 6.7Trade and other receivables 6.4Property, plant and equipment 5.7Cash 0.6Trade and other payables (3.7)Deferred tax liability (1.2)Employee benefits net liabilities (0.9)Interest bearing borrowings (0.8)Provisions (0.3)Total identifiable net assets at fair value 12.5Goodwill 11.9
Fair values are provisional and may be revised.
The £25.1m disclosed in the Group statement of cash flows in respect of the acquisition of subsidiaries, net of cash acquired, comprised £24.4m paid for current year acquisitions, less £0.6m of cash acquired with current year acquisitions and a release of contingent consideration payment for ECIL Met Tec and Process Metrix (£0.8m and £0.5m respectively).
These acquisitions contributed £7.5m of revenue, and a £0.6m trading loss to the Group’s results. Had the acquisition occurred on 1 January 2015, the contribution would have been £12.9m of revenue, and a trading loss of £0.6m. The Group incurred acquisition related costs of £0.1m relating to external legal fees and due diligence costs which have been included within administration costs in the Group income statement.
The goodwill arising from the acquisition is attributable to the synergies which are expected from combining Sidermes, a complementary business, with the operations of the Group.
Notes to the Consolidated Financial Statementscontinued

Finan
cial Statements
139
23. Discontinued Operations
The net cash outflow from discontinued operations of £6.2m during 2015 represented the net payment of £5.5m to MacDermid following the settlement agreement in 2014, £0.4m VAT recovered, and £0.3m other payments. Discontinued operations income of £1.4m related to a partial reimbursement of costs charged in 2014 for the MacDermid claim.
Discontinued operations in 2014 comprise of a release of £1.1m of provision relating to a VAT case which was resolved in Vesuvius’ favour and a charge of £4.7m in relation to settlement of actions brought by MacDermid (incorporated in the United States) against Vesuvius and Alent plc that arose out of corporate activity between the parties in 2006.
23.1 Results of discontinued operations2015
£m2014
£m
Other income 1.4 —
Expenses — (3.6)
Profit/(loss) before tax 1.4 (3.6)
Profit on disposal of discontinued operations — —
Profit/(loss) for the year attributable to owners of the parent 1.4 (3.6)
Earnings per share — penceBasic 0.5 (1.3)
Diluted 0.5 (1.3)
23.2 Cash flows from discontinued operations2015
£m2014
£m
Net cash outflow from:
— operating activities (6.2) (0.5)
Net cash outflow for the year (6.2) (0.5)
24. Issued Share Capital
24.1 Accounting policy
Equity instruments issued by the Company are recorded at the proceeds received, net of direct issue costs.
24.2 Analysis of issued share capital
The issued ordinary share capital of the Company as at 31 December 2015 was 278.5 million shares of £0.10 each. Of this, 7.3 million shares were held in Treasury and 1.7 million were held by the Vesuvius Group ESOP. Further information relating to the Company’s share capital is given in Note 7 attached to the Company’s financial statements.

Section Five Financial Statements
Vesuvius plc Annual Report and Accounts 2015
140
25. Retained EarningsReserve for own
shares £m
Share option reserve
£m
Other retained earnings
£m
Total retained earnings
£m
As at 1 January 2014 (35.4) 3.6 2,316.4 2,284.6
Profit for the year — — 95.9 95.9
Remeasurement of defined benefit liabilities/assets — — (9.9) (9.9)
Purchase of own shares (0.5) — — (0.5)
Disposal of own shares 2.3 — (2.3) —
Recognition of share-based payments — 2.7 — 2.7
Release of share option reserve on exercised and lapsed options — (2.3) 2.3 —
Income tax on items recognised in other comprehensive income — — 0.5 0.5
Dividends paid (Note 27) — — (41.2) (41.2)
As at 1 January 2015 (33.6) 4.0 2,361.7 2,332.1Profit for the year — — 48.8 48.8Remeasurement of defined benefit liabilities/assets — — 13.0 13.0Purchase of own shares (5.2) — — (5.2)Disposal of own shares 0.8 — (0.8) —
Recognition of share-based payments — 0.1 — 0.1Release of share option reserve on exercised and lapsed options (0.5) 0.5 —
Income tax on items recognised in other comprehensive income — — 1.6 1.6Dividends paid (Note 27) — — (43.9) (43.9)As at 31 December 2015 (38.0) 3.6 2,380.9 2,346.5
During the year to 31 December 2015, 1,170,115 Vesuvius plc ordinary shares were purchased into the Vesuvius Group ESOP, via Cookson Investments (Jersey) Limited as Trustee of the ESOP, for £5.2m.
Notes to the Consolidated Financial Statementscontinued

Finan
cial Statements
141
26. Other ReservesOther
reserves £m
Translation reserve
£m
Total other reserves
£m
As at 1 January 2014 (1,498.9) 43.1 (1,455.8)
Exchange differences on translation of the net assets of foreign operations — (10.2) (10.2)
Exchange translation differences arising on net investment hedges — (0.3) (0.3)
Change in fair value of cash flow hedges (0.2) — (0.2)
Change in fair value of available-for-sale investments (0.2) — (0.2)
As at 1 January 2015 (1,499.3) 32.6 (1,466.7)Exchange differences on translation of the net assets of foreign operations — (29.1) (29.1)Exchange translation differences arising on net investment hedges — (6.1) (6.1)As at 31 December 2015 (1,499.3) (2.6) (1,501.9)
Within Other reserves as at 31 December 2015 is £1,499.0m (2014: £1,499.0m) arising from the demerger of Cookson Group plc, being the excess of the Vesuvius plc share capital of £1,777.9m over the total share capital and share premium of Cookson Group plc as at 14 December 2012 of £278.9m.
The translation reserve in the table above comprises all foreign exchange differences attributable to the owners of the parent. These exchange differences arise from the translation of the financial statements of foreign operations and from the translation of financial instruments that hedge the Group’s net investment in foreign operations. In addition to foreign exchange differences attributable to the owners of the parent, the Group statement of comprehensive income includes foreign exchange differences attributable to non-controlling interests.
27. Dividends
A final dividend for the year ended 31 December 2014 of £30.1m (2013: £27.7m), equivalent to 11.125 pence (2013: 10.25 pence) per ordinary share, was paid in May 2015 (May 2014) and an interim dividend for the year ended 31 December 2015 of £13.8m (2014: £13.5m), equivalent to 5.15 pence (2014: 5.00 pence) per ordinary share, was paid in September 2015 (September 2014 ).
A proposed final dividend for the year ended 31 December 2015 of £30.0m, equivalent to 11.125 pence per ordinary share, is subject to approval by shareholders at the Company’s Annual General Meeting and has not been included as a liability in these financial statements. If approved by shareholders, the dividend will be paid on 20 May 2016 to ordinary shareholders on the register at 8 April 2016.

Section Five Financial Statements
Vesuvius plc Annual Report and Accounts 2015
142
Notes to the Consolidated Financial Statementscontinued
28. Financial risk management
28.1 Accounting policy (a) Non-derivative financial instruments
Loans and borrowings are initially recognised at fair value plus directly attributable transaction costs. After initial recognition they are measured at amortised cost, using the effective interest method.
(b) Foreign currencies
The individual financial statements of each Group entity are prepared in their functional currency, which is the currency of the primary economic environment in which that entity operates. For the purpose of the Consolidated Financial Statements, the results and financial position of each entity are translated into pound sterling, which is the presentational currency of the Group.
Reporting foreign currency transactions in functional currency
Transactions in currencies other than the entity’s functional currency (foreign currencies) are initially recorded at the rates of exchange prevailing on the dates of the transactions. At each subsequent balance sheet date:
(i) Foreign currency monetary items are retranslated at the rates prevailing at the balance sheet date. Exchange differences arising on the settlement or retranslation of monetary items are recognised in the Group income statement
(ii) Non-monetary items measured at historical cost in a foreign currency are not retranslated.
Translation from functional currency to presentational currency
When the functional currency of a Group entity is different from the Group’s presentational currency (pound sterling), its results and financial position are translated into the presentational currency as follows:
(i) Assets and liabilities are translated using exchange rates prevailing at the balance sheet date
(ii) Income and expense items are translated at average exchange rates for the year, except where the use of such average rates does not approximate the exchange rate at the date of a specific transaction, in which case the transaction rate is used
(iii) All resulting exchange differences are recognised in other comprehensive income and presented in the translation reserve in equity and are reclassified to profit or loss in the period in which the foreign operation is disposed of.
Net investment in foreign operations
Exchange differences arising on a monetary item that forms part of a reporting entity’s net investment in a foreign operation are initially recognised in other comprehensive income and presented in the translation reserve in equity and reclassified to profit or loss on disposal of the net investment.
28.2 Financial risk factors
The Group’s treasury department, acting in accordance with policies approved by the Board, is principally responsible for managing the financial risks faced by the Group. The Group’s activities expose it to a variety of financial risks, the most significant of which are market risk and liquidity risk.
(a) Market risk
Market risk is the risk that either the fair values or the cash flows of the Group’s financial instruments may fluctuate because of changes in market prices. The Group is principally exposed to market risk through fluctuations in exchange rates (‘currency risk’) and interest rates (‘interest rate risk’).
Currency risk
The Group is exposed to currency risk on its borrowings and financial assets (being cash and short-term deposits) that are denominated in currencies other than pound sterling. The Group’s general policy is proportionally to match the currency profile of its core borrowings with the currency profile of its earnings and net assets. This is achieved, where necessary, by the use of forward foreign exchange contracts (‘FX swaps’). The currency profile of the Group’s borrowings and financial assets, reflecting the effect of the FX swaps, is shown in the table overleaf.

Finan
cial Statements
143
28. Financial risk management (continued)
28.2 Financial risk factors (continued) (a) Market risk (continued)
2015 2014
Borrowings before
FX swaps £m
FX swaps
£m
Borrowings after
FX swaps£m
Financial assets
£m
Net debt
£m
Borrowings before
FX swaps £m
FX swaps
£m
Borrowings after
FX swaps £m
Financial assets
£m
Net debt £m
Sterling 21.3 97.0 118.3 (9.9) 108.4 17.1 91.8 108.9 (7.6) 101.3
United States dollar 232.1 (97.0) 135.1 (15.4) 119.7 212.0 (91.8) 120.2 (16.3) 103.9
Euro 134.2 — 134.2 (32.6) 101.6 108.4 — 108.4 (9.5) 98.9
Chinese renminbi — — — (5.6) (5.6) — — — (7.4) (7.4)
Other 7.7 — 7.7 (38.0) (30.3) 8.9 — 8.9 (36.1) (27.2)
Capitalised arrangement fees (2.2) — (2.2) — (2.2) (1.2) — (1.2) — (1.2)
As at 31 December 393.1 — 393.1 (101.5) 291.6 345.2 — 345.2 (76.9) 268.3
Based upon the currency profile shown in the table above, while not impacting reported profit, the change in net debt arising from a 10% strengthening of sterling would increase reported equity by £25.7m (2014: £23.6m) and a corresponding 10% weakening of sterling would reduce equity by £31.4m (2014: £28.9m).
The tables below show the net unhedged monetary assets and liabilities of Group companies that are not denominated in their functional currency and which could give rise to exchange gains and losses in the Group income statement.
Net unhedged monetary assets/(liabilities)
Sterling £m
US dollar £m
Euro £m
Renminbi£m
Other £m
Total £m
Functional currencySterling — 1.2 2.8 0.7 2.8 7.5United States dollar 0.1 — 1.8 — 2.1 4.0Euro (0.3) (1.3) — — 0.2 (1.4)Chinese renminbi (0.1) 1.8 (0.8) — (0.7) 0.2Other (0.4) 8.4 7.2 (0.6) 5.8 20.4As at 31 December 2015 (0.7) 10.1 11.0 0.1 10.2 30.7
Net unhedged monetary assets/(liabilities)
Sterling £m
US dollar £m
Euro £m
Renminbi£m
Other £m
Total £m
Functional currencySterling — 2.1 1.1 — 1.2 4.4
United States dollar — — 0.4 — (2.1) (1.7)
Euro 0.2 (0.9) — — 0.1 (0.6)
Chinese renminbi (0.5) 3.7 (1.5) — (0.1) 1.6
Other (0.7) 8.7 9.7 0.1 5.7 23.5
As at 31 December 2014 (1.0) 13.6 9.7 0.1 4.8 27.2

Section Five Financial Statements
Vesuvius plc Annual Report and Accounts 2015
144
Notes to the Consolidated Financial Statementscontinued
28. Financial risk management (continued)
28.2 Financial risk factors (continued)(a) Market risk (continued) Interest rate risk
The Group’s interest rate risk principally arises in relation to its borrowings. Where borrowings are held at floating rates of interest, fluctuations in interest rates expose the Group to variability in the cash flows associated with its interest payments and where borrowings are held at fixed rates of interest, fluctuations in interest rates expose the Group to changes in the fair value of its borrowings. The Group’s policy is to maintain a mix of fixed and floating rate borrowings, within certain parameters agreed from time to time by the Board, in order to optimise interest cost and reduce volatility in reported earnings.
As at 31 December 2015, the Group had $310m and €30m (£232.4m in total) of US Private Placement Loan Notes outstanding, which carry a fixed rate of interest, representing two-thirds of the Group’s total borrowings outstanding at that date. The interest rate profile of the Group’s borrowings and net debt is detailed in the tables below.
Financial liabilities (gross borrowings)
Financial assets
£m
Net debt
£m
Fixed rate £m
Floating rate £m
Total £m
Sterling — 21.3 21.3 (9.9) 11.4US dollar 210.3 21.8 232.1 (15.4) 216.7Euro 22.1 112.1 134.2 (32.6) 101.6Chinese renminbi — — — (5.6) (5.6)Other — 7.7 7.7 (38.0) (30.3)Capitalised arrangement fees (2.2) — (2.2) — (2.2)As at 31 December 2015 230.2 162.9 393.1 (101.5) 291.6
Financial liabilities (gross borrowings)
Financial assets
£m
Net debt £m
Fixed rate £m
Floating rate £m
Total £m
Sterling — 17.1 17.1 (7.6) 9.5
US dollar 199.1 12.9 212.0 (16.3) 195.7
Euro 23.3 85.1 108.4 (9.5) 98.9
Chinese renminbi — — — (7.4) (7.4)
Other — 8.9 8.9 (36.1) (27.2)
Capitalised arrangement fees (1.2) — (1.2) — (1.2)
As at 31 December 2014 221.2 124.0 345.2 (76.9) 268.3
The floating rate financial liabilities shown in the tables above bear interest at the inter-bank offered rate of the appropriate currency, plus a margin. The fixed rate financial liabilities of £230.2m (2014: £221.2m) have a weighted average interest rate of 4.6% (2014: 4.6%) and a weighted average period for which the rate is fixed of 5.2 years (2014: 6.3 years). The financial assets attract floating rate interest at the inter-bank offered rate of the appropriate currency, less a margin.
Based upon the interest rate profile of the Group’s financial assets and liabilities shown in the tables above, a 1% increase in market interest rates would increase both the net finance costs charged in the Group income statement and the net interest paid in the Group statement of cash flows by £0.6m (2014: £0.5m) and a 1% reduction in market interest rates would decrease both the net finance costs charged in the Group income statement and the net interest paid in the Group statement of cash flows by £0.6m (2014: £0.5m). Similarly, a 1% increase in market interest rates would result in a decrease of £11.0m (2014: £14.1m) in the fair value of the Group’s net debt and a 1% decrease in market interest rates would result in an increase of £11.8m (2014: £11.6m) in the fair value of the Group’s net debt.

Finan
cial Statements
145
28. Financial risk management (continued)
28.2 Financial risk factors (continued) (b) Liquidity risk
Liquidity risk is the risk that the Group might have difficulties in meeting its financial obligations. The Group manages this risk by ensuring that it maintains sufficient levels of committed borrowing facilities and cash and cash equivalents to ensure that it can meet its operational cash flow requirements and any maturing financial liabilities, while at all times operating within its financial covenants. The level of operational headroom provided by the Group’s committed borrowing facilities is reviewed at least annually as part of the Group’s three-year planning process. Where this process indicates a need for additional finance, this is normally addressed 12 to 18 months in advance by means of either additional committed bank facilities or raising finance in the capital markets.
As at 31 December 2015, the Group had committed borrowing facilities of £532.4m (2014: £647.4m), of which £181.1m (2014: £343.5m) were undrawn. These undrawn facilities are due to expire in June 2020. The Group’s borrowing requirements are met by US Private Placement Loan Notes (‘USPP’) and a multi-currency committed syndicated bank facility of £300m (2014: £425m). The USPP facility was fully drawn as at 31 December 2015 and amounted to £232.4m ($310m and €30m), of which $110m is repayable in 2017, $140m in 2020, €15m in 2021, $30m in 2023, €15m in 2025 and $30m in 2028. The syndicated bank facility is repayable in June 2020.
The maturity analysis of the Group’s gross borrowings is shown in the tables below.
Non-current Current Total
2015 £m
2014 £m
2015 £m
2014 £m
2015 £m
2014 £m
Loans and overdrafts 351.3 303.9 40.6 39.1 391.9 343.0
Obligations under finance leases 2.1 2.0 1.3 1.4 3.4 3.4
Capitalised arrangement fees (1.7) (1.0) (0.5) (0.2) (2.2) (1.2)
Total interest-bearing borrowings 351.7 304.9 41.4 40.3 393.1 345.2
2015 £m
2014 £m
Interest-bearing borrowings repayableOn demand or within one year 41.9 40.5
In the second year 75.7 82.7
In the third year 0.7 71.3
In the fourth year 0.2 0.3
In the fifth year 213.9 —
After five years 62.9 151.6
Capitalised arrangement fees (2.2) (1.2)
Total interest-bearing borrowings 393.1 345.2
Capitalised arrangement fees shown in the tables above, which have been recognised as a reduction in borrowings in the financial statements, amounted to £2.2m as at 31 December 2015 (31 December 2014: £1.2m), of which £1.0m (2014: £1.2m) related to the USPP and £1.2m (2014: £nil) related to the syndicated bank facility.

Section Five Financial Statements
Vesuvius plc Annual Report and Accounts 2015
146
Notes to the Consolidated Financial Statementscontinued
28. Financial risk management (continued)
28.3 Capital management
The Company considers its capital to be equal to the sum of its total equity and net debt. It monitors its capital using a number of key performance indicators, including free cash flow, average working capital to sales ratios, net debt to EBITDA ratios and RONA (Note 4). The Group’s objectives when managing its capital are:
> To ensure that the Group and all of its businesses are able to operate as going concerns and ensure that the Group operates within the financial covenants contained within its debt facilities
> To have available the necessary financial resources to allow the Group to invest in areas that may deliver acceptable future returns to investors
> To maintain sufficient financial resources to mitigate against risks and unforeseen events
> To maximise shareholder value through maintaining an appropriate balance between the Group’s equity and net debt.
The Group operated within the requirements of its debt covenants throughout the year and has sufficient liquidity headroom within its committed debt facilities. Details of the Group’s covenant compliance and committed debt facilities can be found in the Strategic Report on page 37 to 38.
28.4 Cash pooling arrangements
The Group enters into notional cash pooling arrangements as part of its ongoing treasury management activities. Certain cash pooling arrangements meet the criteria for offsetting as clarified in Amendments to IAS 32 Financial Instruments, as regards a legally enforceable right of set off both in the ordinary course of business and in the event of default. The following tables set out the amounts of recognised financial assets and liabilities shown as cash and cash borrowings and those amounts which are subject to these agreements.
Gross amounts of recognised
financial assets/
liabilities £m
Gross amounts of recognised
financial assets/
liabilities offset in the
statement of financial
position £m
Net amounts of
financial assets/
liabilities presented
in the statement
of financial position
£m
Related amounts of
financial assets/
liabilities not offset
in the statements of financial
position £m
Net amount
£m
Financial assets/liabilitiesCash deposits 120.5 (19.0) 101.5 (18.9) 82.6Cash borrowings (53.5) 19.0 (34.5) 18.9 (15.6)As at 31 December 2015 67.0 — 67.0 — 67.0
Financial assets/liabilitiesCash deposits 145.9 (69.0) 76.9 (20.2) 56.7
Cash borrowings (107.4) 69.0 (38.4) 20.2 (18.2)
As at 31 December 2014 38.5 — 38.5 — 38.5

Finan
cial Statements
147
29. Employee benefits
29.1 Accounting policy
The net surplus or net liability recognised in the Group balance sheet for the Group’s defined benefit plans is the present value of the defined benefit obligation at the balance sheet date, less the fair value of the plan assets. The defined benefit obligation is calculated by independent actuaries using the projected unit credit method and by discounting the estimated future cash flows using interest rates on high-quality corporate bonds that have terms to maturity approximating the terms of the related pension liability. Any asset recognised in respect of a surplus arising from this calculation is limited to the asset ceiling, where this is the present value of any economic benefits available in the form of refunds or reductions in future contributions in respect of the plans.
The expense for the Group’s defined benefit plans is recognised in the Group income statement as shown in Note 29.8. Actuarial gains and losses arising on the assets and liabilities of the plans are reported within the Group statement of comprehensive income; and gains and losses arising on settlements and curtailments are recognised in the Group income statement in the same line as the item that gave rise to the settlement or curtailment or, if material, separately reported as a component of operating profit.
29.2 Group post-retirement plans
The Group operates a number of pension plans around the world, both of the defined benefit and defined contribution type, and accounts for them in accordance with IAS 19.
The Group’s principal defined benefit pension plans are in the UK and the US, the benefits of which are based upon the final pensionable salaries of plan members. The assets of these plans are held separately from the Group in trustee-administered funds. The trustees are required to act in the best interests of the plans’ beneficiaries. The principal risks faced by these plans comprise: (i) the risk that the value of the plan assets is not sufficient to meet all plan liabilities as they fall due; (ii) the risk that plan beneficiaries live longer than envisaged, causing liabilities to exceed the available plan assets; and (iii) the risk that the market-based factors used to value plan liabilities change materially adversely to increase plan liabilities over the value of available plan assets. The Group also has defined benefit pension plans in other territories but, with the exception of those in Germany, these are not individually material in relation to the Group as a whole.
(a) Defined benefit pension plans – UK
The Group’s main defined benefit pension plan in the UK (‘the UK Plan’) is closed to new members and to future benefit accrual.
A full actuarial valuation of the UK Plan is carried out every three years by an independent actuary for the UK Plan Trustee and the last full valuation was carried out as at 31 December 2012. At that date, the market value of plan assets was £501.9m and this represented a funding level of 102% of the accrued plan benefits at the time of £490.4m. Calculated on a ‘buyout’ basis (using an estimation of the cost of buying out the UK Plan benefits with an insurance company), the liabilities at that date were £610.1m, representing a funding level of 82%. Under the rules of the UK Plan, the Trustee has the power to set the funding contributions, having consulted with the Company. Under a schedule of contributions agreed by the Company and Trustee, the Company made ‘top-up’ payments of £7.0m per annum up to July 2013, after which they ceased as a result of the funding surplus evidenced by the 2012 funding valuation. The level of ‘top-up’ payments will be reviewed based on the UK Plan’s next triennial valuation as at 31 December 2015, which should be available in mid-2016.
Notwithstanding the latest funding valuation surplus, the Company has agreed to make voluntary contributions of £2.0m per annum until the next valuation date.
In July 2012, the UK Plan Trustee entered into a pension insurance buy-in agreement with Pension Insurance Corporation (‘PIC’), whereby the UK Plan Trustee paid an insurance premium of £318.8m to PIC to insure a significant portion of the UK Plan’s liabilities. In December 2012, the PIC buy-in agreement was extended, under which the UK Plan Trustee agrees to transfer to PIC all new pensioner liabilities arising from July 2012 to December 2015 (limited to £30m) in exchange for a premium payment from the assets of the UK Plan based on the pricing terms of the original buy-in agreement, but reflecting changes in market conditions and differences in the duration of the liabilities transferred. As part of this extension to the buy-in agreement, in May 2014 and April 2015 the UK Plan Trustee paid an additional £12.4m and £7.4m of insurance premium respectively to PIC from the assets of the UK plan to cover new retirees between inception and 31 December 2014. Under this arrangement, the value of the PIC insurance contract matches the value of the liabilities because the inflation, interest rate, investment and longevity risk for Vesuvius in respect of these liabilities are eliminated. As at end December 2015, the IAS 19 valuation of the PIC insurance contract value associated with the bought-in liabilities was £265.3m (2014: £281.3m). The IAS 19 valuation of the pension liabilities uses a higher discount rate than that used for funding valuation purposes and hence generates a lower value for the bought-in liabilities which implies a lower accounting valuation of the PIC insurance contract compared to the actual premium paid to PIC. Consequently the reduction in asset portfolio valuation is reported in the Group statement of comprehensive income, not the income statement based on IAS 19 requirements. The buy-in agreement ensures that 57% of UK pension plan obligations are insured, removing all financial risks associated with this tranche of the liability.

Section Five Financial Statements
Vesuvius plc Annual Report and Accounts 2015
148
Notes to the Consolidated Financial Statementscontinued
29. Employee benefits (continued)
29.2 Group post-retirement plans (continued) (a) Defined benefit pension plans – UK (continued)
The value of the UK Plan liabilities decreased to £464.3m (2014: £506.3m). The decrease in the liabilities is driven mainly by the change in financial assumptions including a decrease in the long-term inflation expectations in the UK and an increase in discount rates to 3.75% in 2015 (2014: 3.5%). Correspondingly, the UK Plan assets decreased to £522.0m (2014: £555.1m) mainly driven by the loss on plan assets excluding interest income of £21.7m.
Proposed amendments to IFRIC 14 The Limit on a Defined Benefit Asset, Minimum Funding Requirements and their Interaction, address how the powers of other parties, such as the Trustees of the plan, affect an entity’s right to a refund of a surplus from the plan. The Group has assessed the likely impact of the application of this interpretation and concluded that it would not impact its ability to continue to recognise a pension surplus in the UK.
(b) Defined benefit pension plans – US
The Group has a number of defined benefit pension plans in the US, providing retirement benefits based on final salary or a fixed benefit. The Group’s principal US defined benefit pension plans are closed to new members and also to future benefit accrual for existing members. Actuarial valuations of the US defined benefit pension plans are carried out every year and the last full valuation was carried out as at 31 December 2015. At that date the market value of the plan assets was £74.4m, representing a funding level of 73% of funded accrued plan benefits at that date (using the projected unit method of valuation) of £101.6m. Funding levels for the Group’s US defined benefit pension plans are normally based upon annual valuations carried out by independent qualified actuaries and are governed by US Government regulations. The value of US plan liabilities increased to £112.1m (2014: £111.8m), which was mainly driven by exchange losses partially offset by increases in discount rates to 3.9% (2014: 3.7%) and changes to demographic assumptions, which had a net impact of increasing the liability by £1.3m.
(c) Defined benefit pension plans – Germany
The Group has a number of defined benefit pension arrangements in Germany which are unfunded, as is common practice in that country. The net liability of the German plans at 31 December 2015 was £36.3m (2014: £39.9m). The decrease was mainly driven by increases in the discount rate assumption, which decreased the liability by £2.6m. Part of the main plan was closed to new entrants on 31 December 2015 and replaced by a defined contribution plan for new joiners.
(d) Defined benefit pension plans – ROW
The Group has a number of defined benefit pension arrangements across the rest of the world, the majority of which are located in Belgium. The net liability of the ROW plans at 31 December 2015 was £13.3m (2014: £19.0m). The decrease was mainly influenced by the completion of a triennial valuation of the Belgian plans, which led to experience gains of £3.0m attributed to benefits paid out over the last three years.
(e) Defined contribution pension plans
The total expense for the Group’s defined contribution plans in the Group income statement amounted to £10.7m (2014: £9.2m continuing operations) and represents the contributions payable for the year by the Group to the plans.
(f) Multi-employer plans
Due to collective agreements, Vesuvius in the US participates together with other enterprises in union run multi-employer pension plans for temporary workers hired on sites. Some of these plans are underfunded and all participating employers are ultimately liable for any deficit. If a participating employer stops contributing to a plan it is required to make a withdrawal payment to the plan to cover its share of the total deficit in the plan. No reliable basis exists for allocation of the plans’ obligations and plan assets to individual employer participants. Deficits in the plans may necessitate increased contributions in the future. These are currently accounted for as defined contribution plans. In 2015 Vesuvius contributed £1.1m (2014: £1.7m) to these plans.

Finan
cial Statements
149
29. Employee benefits (continued)
29.3 Post-retirement liability valuation
The main assumptions used in calculating the costs and obligations of the Group’s defined benefit pension plans, as detailed below, are set by the Directors after consultation with independent professionally qualified actuaries.
(a) Mortality assumptions
The mortality assumptions used in the actuarial valuations of the Group’s UK, US and German defined benefit pension liabilities are summarised in the table below and have been selected to reflect the characteristics and experience of the membership of those plans.
For the UK Plan, the assumptions used have been derived from the Self-Administered Pension Schemes (‘SAPS’) All table, with future longevity improvements in line with the ‘core’ mortality improvement tables published in 2014 by the Continuous Mortality Investigation (‘CMI’), with a long-term rate of improvement of 1.5% per annum. For the Group’s US plans, the assumptions used have been based on the standard RP-2015 fully generational tables with projection scale BB, and the MP-2015 mortality improvement scale. The Group’s major plans in Germany have been valued using the Heubeck-Richttafein 2005G mortality tables.
Life expectancy of pension plan members
2015 2014
UK years
US years
Germany years
UK years
US years
Germany years
Age to which current pensioners are expected to live — Men 87.7 86.2 84.0 87.6 86.6 84.9
— Women 90.0 88.2 88.1 89.9 88.8 88.9
Age to which future pensioners are expected to live — Men 89.0 87.9 86.6 89.0 88.3 87.5
— Women 92.3 89.9 90.6 92.2 90.5 91.5
(b) Other main actuarial valuation assumptions2015 2014
UK % p.a.
US % p.a.
Germany % p.a.
UK % p.a.
US % p.a.
Germany % p.a.
Discount rate 3.75 3.90 2.60 3.50 3.70 2.20
Price inflation — using RPI for UK 3.35 2.25 1.75 3.40 2.25 1.75
— using CPI for UK 2.25 n/a n/a 2.40 n/a n/a
Rate of increase in pensionable salaries n/a n/a 2.50 n/a n/a 2.50
Rate of increase to pensions in payment 3.20 n/a 1.60 3.10 n/a 1.60
The discount rate used to determine the liabilities of the UK Plan for IAS 19 accounting purposes is required to be determined by reference to market yields on high-quality corporate bonds. The UK discount rate in the above table is based on the Aon Hewitt AA-rated corporate bond yield in conjunction with the most recent projected cash flow data relating to the UK Plan liabilities; the US discount rate is based on the Citigroup pension discount curve; and the Germany discount rate is based on the yield on the iBoxx over ten-year euro corporates AA index.
The assumptions for UK price inflation are set by reference to the difference between yields on longer-term conventional government bonds and index-linked bonds, except for CPI, for which no appropriate bonds exist, which is assumed to be 1.1 points lower (2014: 1.0 point lower) than RPI-based inflation.
(c) Sensitivity analysis of the impact of changes in significant IAS 19 actuarial assumptions
The following table analyses, for the Group’s main UK, US and Germany pension plans, the theoretical estimated impact on plan liabilities resulting from changes to the most significant actuarial assumptions used for IAS 19 valuation purposes, whilst holding all other assumptions constant.
Following the arrangement of buy-in agreements for the UK plan pensioner liabilities in 2012, as noted above, and the fact that US pensions are not inflation linked, the rate of increase in pensionable salaries and of pensions in payment is not significant to the valuation of the Group’s overall pension liabilities.

Section Five Financial Statements
Vesuvius plc Annual Report and Accounts 2015
150
Notes to the Consolidated Financial Statementscontinued
29. Employee benefits (continued)
29.3 Post-retirement liability valuation (continued) (c) Sensitivity analysis of the impact of changes in significant IAS 19 actuarial assumptions (continued)
As stated above, during 2012 the UK Plan entered into pension insurance buy-in agreements which eliminate the inflation, interest rate, investment and longevity risk in respect of the pensioner liabilities covered by the agreements. Therefore, for the liabilities so covered, which represent some 57% of the total liabilities of the UK Plan, any changes in the valuation assumptions which impact the value of those liabilities, also impact on the associated annuity assets in an equal and opposite way, thereby fully mitigating the valuation risk. This is also reflected in the following table.
Assumption Change in assumption
Impact on plan liabilities
UK US Germany
Discount rate Increase/decrease by 0.1%
— impact on plan liabilities Decrease/increase by £7.6m Decrease/increase by £1.3m Decrease/increase by £0.7m
— impact on plan assets Decrease/increase by £3.0m n/a n/a
Price inflation Increase/decrease by 0.1%
— impact on plan liabilities Increase/decrease by £5.0m n/a Increase/decrease by £0.2m
— impact on plan assets Increase/decrease by £2.2m n/a n/a
Mortality Increase by one year
— impact on plan liabilities Increase by £21.4m Increase by £3.9m Increase by £1.2m
— impact on plan assets Increase by £13.6m n/a n/a
29.4 Defined benefit obligation
The liabilities of the Group’s defined benefit pension and other post-retirement plans for IAS 19 accounting purposes are measured by discounting the best estimate of the future cash flows to be paid out by the plans using the projected unit method, in which the calculation of plan liabilities makes allowance, where appropriate, for projected increases in benefit-related earnings.
The average duration of the obligations to which the liabilities of the Group’s principal pension plans relate is 19 years for the UK, 19 years for Germany and 12 years for the US.
Defined benefit pension plans Other post-retirement
benefit plans
£mUK £m
US £m
Germany £m
ROW £m
Total £m
Total £m
Present value as at 1 January 2015 506.3 111.8 39.9 40.7 698.7 5.4 704.1Exchange differences — 6.1 (2.1) (1.3) 2.7 (0.1) 2.6
Current service cost — 0.5 1.3 3.1 4.9 0.2 5.1
Past service cost 0.8 — — — 0.8 — 0.8
Interest cost 17.4 4.1 0.8 0.7 23.0 0.2 23.2
Settlements — — — — — (0.2) (0.2)Acquisitions — — — 0.5 0.5 0.9 1.4Remeasurement of liabilities:
— demographic changes 0.1 (2.2) — 0.1 (2.0) — (2.0)— financial assumptions (19.1) (2.6) (2.6) (0.6) (24.9) (0.1) (25.0)— experience (gains)/losses (9.0) 0.4 — (2.8) (11.4) 0.2 (11.2)Contributions from members — — — — — — —
Benefits paid (32.2) (6.0) (1.0) (4.3) (43.5) (0.8) (44.3)Present value as at 31 December 2015 464.3 112.1 36.3 36.1 648.8 5.7 654.5

Finan
cial Statements
151
29. Employee benefits (continued)
29.4 Defined benefit obligation (continued)Defined benefit pension plans Other post-
retirement benefit
plans £m
UK £m
US £m
Germany £m
ROW £m
Total £m
Total £m
Present value as at 1 January 2014 458.1 91.4 32.6 38.3 620.4 8.1 628.5
Exchange differences — 6.6 (2.5) (1.6) 2.5 0.1 2.6
Current service cost — 0.4 0.9 3.3 4.6 0.1 4.7
Interest cost 19.7 4.1 1.2 1.5 26.5 0.2 26.7
Settlements — — — (14.1) (14.1) — (14.1)
Transfer — — — 3.0 3.0 (3.0) —
Remeasurement of liabilities:
— demographic changes — 5.4 — 0.1 5.5 — 5.5
— financial assumptions 52.0 9.1 9.0 8.1 78.2 0.2 78.4
— experience (gains)/losses (4.8) 0.3 (0.1) 6.7 2.1 0.7 2.8
Contributions from members — — — 0.1 0.1 — 0.1
Benefits paid (18.7) (5.5) (1.2) (4.7) (30.1) (1.0) (31.1)
Present value as at 31 December 2014 506.3 111.8 39.9 40.7 698.7 5.4 704.1
29.5 Fair value of plan assets2015 2014
UK £m
US £m
ROW £m
Total £m
UK £m
US £m
ROW £m
Total £m
As at 1 January 555.1 76.2 21.7 653.0 485.5 68.1 27.0 580.6
Exchange differences — 4.1 (0.5) 3.6 — 4.5 (0.6) 3.9
Return on plan assets 19.1 2.8 0.4 22.3 20.9 3.0 1.0 24.9
Settlements — — (0.2) (0.2) — — (10.5) (10.5)
Acquisitions — — 0.5 0.5 — — — —
Remeasurement of assets (21.7) (4.2) 0.7 (25.2) 66.0 4.4 6.4 76.8
Contributions from employer 2.4 1.3 3.2 6.9 2.0 1.2 2.9 6.1
Contributions from members — — — — — — 0.1 0.1
Administration expenses paid (0.7) (0.6) — (1.3) (0.7) (0.3) (0.2) (1.2)
Benefits paid (32.2) (5.2) (3.0) (40.4) (18.6) (4.7) (4.4) (27.7)
As at 31 December 522.0 74.4 22.8 619.2 555.1 76.2 21.7 653.0
The Group’s pension plans in Germany are unfunded, as is common practice in that country, and accordingly there are no assets associated with these plans.
29.6 Remeasurement of defined benefit liabilities/assets2015 total
£m
2014 total £m
Remeasurement of liabilities:
— demographic changes 2.0 (5.5)
— financial assumptions 25.0 (78.4)
— experience gains/(losses) 11.2 (2.8)
Remeasurement of assets (25.2) 76.8
Total movement 13.0 (9.9)

Section Five Financial Statements
Vesuvius plc Annual Report and Accounts 2015
152
Notes to the Consolidated Financial Statementscontinued
29. Employee benefits (continued)
29.7 Balance sheet recognition
The amount recognised in the Group balance sheet in respect of the Group’s defined benefit pension plans and other post-retirement benefit plans is analysed in the following tables, which all relate to continuing operations. All equity securities and bonds have quoted prices in active markets.
Defined benefit pension plans Other post-retirement
benefit plans
£mUK £m
US £m
Germany £m
ROW £m
Total £m
2015 total
£m
Equities 67.0 14.5 — 2.2 83.7 — 83.7Bonds 162.0 52.7 — 1.4 216.1 — 216.1Insurance contracts 265.3 — — 15.8 281.1 — 281.1Other assets 27.7 7.2 — 3.4 38.3 — 38.3Fair value of plan assets 522.0 74.4 — 22.8 619.2 — 619.2Present value of funded obligations (462.5) (101.6) — (33.2) (597.3) — (597.3)
59.5 (27.2) — (10.4) 21.9 — 21.9Present value of unfunded obligations (1.8) (10.5) (36.3) (2.9) (51.5) (5.7) (57.2)Total net surpluses/(liabilities) 57.7 (37.7) (36.3) (13.3) (29.6) (5.7) (35.3)Recognised in the Group Balance Sheet as:Net surpluses 59.5 — — 0.4 59.9 — 59.9Net liabilities (1.8) (37.7) (36.3) (13.7) (89.5) (5.7) (95.2)Total net surpluses/(liabilities) 57.7 (37.7) (36.3) (13.3) (29.6) (5.7) (35.3)
Defined benefit pension plans Other post-retirement
benefit plans
£mUK £m
US £m
Germany £m
ROW £m
Total £m
2014 total £m
Equities 68.2 15.7 — 2.2 86.1 — 86.1
Bonds 181.4 53.6 — 1.2 236.2 — 236.2
Insurance contracts 281.3 — — 14.6 295.9 — 295.9
Other assets 24.2 6.9 — 3.7 34.8 — 34.8
Fair value of plan assets 555.1 76.2 — 21.7 653.0 — 653.0
Present value of funded obligations (505.3) (101.1) — (36.9) (643.3) — (643.3)
49.8 (24.9) — (15.2) 9.7 — 9.7
Present value of unfunded obligations (1.0) (10.7) (39.9) (3.8) (55.4) (5.4) (60.8)
Total net surpluses/(liabilities) 48.8 (35.6) (39.9) (19.0) (45.7) (5.4) (51.1)
Recognised in the Group Balance Sheet as:
Net surpluses 49.8 — — — 49.8 — 49.8
Net liabilities (1.0) (35.6) (39.9) (19.0) (95.5) (5.4) (100.9)
Total net surpluses/(liabilities) 48.8 (35.6) (39.9) (19.0) (45.7) (5.4) (51.1)
(a) UK Plan asset allocation
As at 31 December 2015, of the UK Plan’s total assets, 51% were represented by the bulk annuity insurance contracts covering the UK Plan’s pension liabilities; 13% were allocated to equities; 31% to fixed income securities; 3% to cash; and 2% to other assets. In addition, the UK Plan holds a liability driven investment portfolio of financial derivative contracts which reduces the risk that the UK Plan’s assets would fall materially, relative to the value of its economic liabilities.
(b) Defined benefit contributions in 2016
In 2016, the Group is expected to make contributions into its defined benefit pension and other post-retirement benefits plans of around £8.7m. This is subject to triennial valuations to be carried out during 2016, which may result in reduced contributions to the UK plan.

Finan
cial Statements
153
29. Employee benefits (continued)
29.8 Income statement recognition
The expense recognised in the Group income statement in respect of the Group’s defined benefit retirement plans and other post-retirement benefit plans is shown below.
2015 2014
Defined benefit
pension plans
£m
Other post-
retirement benefit
plans £m
Total £m
Defined benefit
pension plans
£m
Other post-
retirement benefit
plans £m
Total £m
Current service cost 4.9 0.2 5.1 4.6 0.1 4.7
Past service cost 0.8 — 0.8 — — —
Settlements — — — (3.6) — (3.6)
Administration expenses 1.3 — 1.3 1.2 — 1.2
Net interest cost 0.7 0.2 0.9 1.6 0.2 1.8
Total net charge 7.7 0.4 8.1 3.8 0.3 4.1
The total net charge of £8.1m (2014: £4.1m) recognised in the Group income statement in respect of the Group’s defined benefit pension plans and other post-retirement benefits plans is recognised in the following lines:
2015 £m
2014 £m
In arriving at trading profit — within other manufacturing costs 2.1 2.0
— within administration, selling and distribution costs 4.3 0.3
In arriving at profit before tax — within restructuring charges 0.8 —
— within net finance costs 0.9 1.8
Continuing operations — charge 8.1 4.1
Discontinued operations — —
Total net charge 8.1 4.1
As at 31 December 2014, the defined benefit pension plan in the Netherlands was converted to a defined contribution plan, eliminating the net obligation of the defined benefit plan, resulting in a settlement gain of £3.6m from the conversion of the plan, recognised within trading profit.
30. Share-based payments
30.1 Income statement recognition
The total expense recognised in the Group income statement is shown below.
2015 £m
2014 £m
Long Term Incentive Plan (0.6) 0.8
Other plans 0.7 1.5
Total expense 0.1 2.3
The Group operates a number of different share-based payment plans, the most significant of which is the Long Term Incentive Plan (‘LTIP’), details of which can be found between pages 88 to 90 of the Directors’ Remuneration Report. The Group’s other share-based payment plans are not considered significant in the context of the Group’s results or financial position. The decrease in the share based payment expense in 2015 is due to the departure of Chris O’Shea as CFO in September 2015 resulting in his share options being forfeited, the vesting assumptions for share options being lowered and fewer shares being granted in 2015 in comparison to 2014.

Section Five Financial Statements
Vesuvius plc Annual Report and Accounts 2015
154
Notes to the Consolidated Financial Statementscontinued
30. Share-based payments (continued)
30.2 Details of outstanding optionsOutstanding awards
As at 1 Jan 2015
no.Granted
no.Exercised
no.
Forfeited/ lapsed
no.
As at 31 Dec 2015
no.
LTIP 1,882,498 773,096 (137,340) (932,416) 1,585,838Weighted average exercise price nil nil nil nil nil
Other plans 604,847 188,654 (18,221) (31,614) 743,666Weighted average exercise price nil nil nil nil nil
For the options exercised during 2015, the share price at the date of exercise was 517 pence for LTIP schemes and 333 or 354 pence for other plans.
Outstanding awards
As at 1 Jan 2014
no.Granted
no.Exercised
no.
Forfeited/ lapsed
no.
As at 31 Dec 2014
no.
LTIP 2,276,510 881,270 (325,289) (949,993) 1,882,498
Weighted average exercise price nil nil nil nil nil
Other plans 120,102 705,273 (155,724) (64,804) 604,847
Weighted average exercise price nil nil nil nil nil
For options exercised during 2014, the share price at the date of exercise was 436 pence for LTIP schemes and 410 or 420 pence for other plans.
2015 2014
Awards exercisable
as at 31 Dec 2015
no.
Weighted average
outstanding contractual
life of awards
years
Range of exercise
prices pence
Awards exercisable
as at 31 Dec 2014
no.
Weighted average
outstanding contractual
life of awards
years
Range of exercise
prices pence
LTIP — 5.9 — 4.2
Weighted average exercise price — n/a — n/a
Other plans 33,220 0.5 — 1.3
Weighted average exercise price — n/a — n/a

Finan
cial Statements
155
30. Share-based payments (continued)
30.3 Options granted under the LTIP during the year2015 2014
EPS element
TSR element
EPS element
TSR element
Fair value of options granted (per share) 491p 275p 429p 154p
Share price on date of grant (per share) 491p 491p 429p 429p
Expected volatility n/a 24% n/a 26%
Risk-free interest rate n/a 0.62% n/a 1.03%
Exercise price (per share) nil nil nil nil
Expected term (years) 4 4 4 4
Expected dividend yield n/a n/a n/a n/a
The fair value of share options with non-market performance conditions has been calculated using the Black-Scholes option pricing model. The fair value of options with market-related performance conditions are measured using the Monte Carlo model. Expected volatility was determined by calculating the historical volatility of the group’s share price over the period from the date of listing to grant date of 2.25 years (2014: 1.25 years). The risk free rate of return was assumed to be the yield to maturity on a UK fixed gilt with the term to maturity equal to the expected life of the option. At the discretion of the Remuneration Committee award holders receive the value of dividends that would have been paid on their vested shares in the period between grant and vesting. Accordingly, there is no discount to the valuation for dividends forgone during the vesting period.
31. Trade and other payables
31.1 Accounting policy
Trade and other payables are initially recognised at fair value and subsequently measured at amortised cost, using the effective interest method.
31.2 Analysis of trade and other payables2015
£m2014
£m
Non-currentAccruals and other payables 14.4 15.0
Deferred purchase and contingent consideration 2.6 3.2
Total non-current other payables 17.0 18.2
CurrentTrade payables 104.1 123.8
Other taxes and social security 27.4 32.5
Deferred purchase and contingent consideration 0.5 1.9
Accruals and other payables 46.0 62.8
Total current trade and other payables 178.0 221.0
There is no significant difference between the fair value of the Group’s trade and other payables balances and the amount at which they are reported in the Group balance sheet.

Section Five Financial Statements
Vesuvius plc Annual Report and Accounts 2015
156
Notes to the Consolidated Financial Statementscontinued
32. Leases
32.1 Accounting policy
Leases are classified as finance leases whenever the terms of the lease transfer substantially all the risks and rewards of ownership to the lessee. All other leases are classified as operating leases. Rentals payable under operating leases are charged to the income statement on a straight-line basis over the term of the lease. Benefits received and receivable as an incentive to enter into an operating lease are also spread on a straight-line basis over the lease term.
32.2 Operating lease commitments
The future aggregate minimum lease payments under non-cancellable operating leases are payable as follows:
2015 £m
2014 £m
Not later than one year 8.2 7.5
Later than one year and not later than five years 13.7 15.3
Later than five years 2.3 4.7
Total operating lease commitments 24.2 27.5
The Group’s property, plant and equipment assets are either purchased outright or held under lease contracts. Where the terms of the lease transfer substantially all the risks and rewards of ownership of the asset to the Group, the asset is capitalised in the Group balance sheet and the corresponding liability to the lessor is recognised as a finance lease obligation. Where all the risks and rewards of ownership are not transferred to the Group, the lease is classified as an operating lease and neither the asset nor the corresponding liability to the lessor is recognised in the Group balance sheet. The net book value of the Group’s property, plant and equipment assets held under finance lease contracts at 31 December 2015 was £3.8m (2014: £4.0m).
The cost incurred by the Group in the year in respect of assets held under operating leases, all of which was charged within trading profit, amounted to £11.8m (2014: £12.7m).
33. Provisions
33.1 Accounting policy
Provisions are recognised when the Group has a present obligation as a result of a past event and it is probable that the Group will be required to settle that obligation. Provisions are measured at the Directors’ best estimate of the expenditure required to settle the obligation at the balance sheet date. Where the effect of the time value of money is material, provisions are discounted using a pre-tax discount rate that reflects both the current market assessment of the time value of money and the specific risks associated with the obligation. Where discounting is used, the increase in the provision due to the passage of time is recognised as a finance cost.
33.2 Analysis of provisionsDisposal
and closure
costs £m
Restructuring charges
£mOther
£mTotal
£m
As at 1 January 2015 30.4 8.0 14.3 52.7Exchange adjustments 1.4 — 0.1 1.5Net charge to Group income statement — 14.6 9.2 23.8Unwind of discount 0.9 0.1 — 1.0Cash spend (2.0) (11.5) (18.6) (32.1)Transferred (to)/from other balance sheet accounts — (1.4) 1.6 0.2
As at 31 December 2015 30.7 9.8 6.6 47.1
Of the total provision balance as at 31 December 2015 of £47.1m (2014: £52.7m), £29.5m (2014: £31.9m) is recognised in the Group balance sheet within non-current liabilities and £17.6m (2014: £20.8m) within current liabilities.
The provision for disposal and closure costs includes the Directors’ current best estimate of the costs to be incurred both in the fulfilment of obligations incurred in connection with former Group businesses, resulting from either disposal or closure, together with those related to the demolition and clean-up of closed sites. The provision comprises amounts payable in respect of known or probable costs resulting both from legal or other regulatory requirements, or from third-party claims, including claims relating to product liability. As the settlement of many of the obligations for which provision is made is subject to legal or other regulatory process, the timing of the associated cash outflows is subject to some uncertainty, but the majority of the amounts provided are expected to be utilised over the next ten years and the underlying estimates of costs are regularly updated to reflect changed circumstances with regard to individual matters.

Finan
cial Statements
157
33. Provisions (continued)
33.2 Analysis of provisions (continued)
The provision for restructuring charges includes the costs of all of the Group’s initiatives to rationalise its operating activities. The balance of £9.8m as at 31 December 2015 comprises £3.3m in relation to onerous lease provisions in respect of leases terminating between one and seven years, and £6.5m in relation to expenditure on restructuring initiatives that have been announced which is expected to be paid out over the next year.
Other provisions comprise amounts payable in respect of known or probable costs resulting both from legal or other regulatory requirements, or from third-party claims. As the settlement of many of the obligations for which provision is made is subject to legal or other regulatory process, the timing of the associated outflows is subject to some uncertainty, but the majority of amounts provided are expected to be utilised over the next five years and the underlying estimates of costs are regularly updated to reflect changed circumstances with regard to individual matters. During 2015 the Group recognised net charges of £9.2m (2014: £5.8m) in the income statement to provide for various litigation settlements and other claims.
Where insurance cover exists for any of these known or probable costs, a related asset is recognised in the Group balance sheet only when its realisation is virtually certain. As at 31 December 2015, £12.3m (2014: £11.4m) was recorded in receivables in respect of associated insurance reimbursements, of which £9.7m (2014: £9.0m) is non-current.
34. Off-balance sheet arrangements
In compliance with current reporting requirements, certain arrangements entered into by the Group in its normal course of business are not reported in the Group balance sheet. Of such arrangements, those considered material by the Directors are: future lease payments in relation to assets used by the Group under non-cancellable operating leases (Note 32).
35. Contingent liabilities
Guarantees given by the Group under property leases of operations disposed of amounted to £1.7m (2014: £2.3m). Details of guarantees given by the Company, on behalf of the Group, are given in Note 10 to the Company financial statements.
Vesuvius has extensive international operations and is subject to various legal and regulatory regimes, including those covering taxation and environmental matters. Several of Vesuvius’ subsidiaries are parties to legal proceedings, certain of which are insured claims arising in the ordinary course of the operations of the company involved, and the Directors are aware of a number of issues which are, or may be, the subject of dispute with tax authorities. Reserves are made for the expected amounts payable in respect of known or probable costs resulting both from legal or other regulatory requirements, or from third-party claims. As the settlement of many of the obligations for which reserve is made is subject to legal or other regulatory process, the timing and amount of the associated outflows is subject to some uncertainty (see Note 33 for further information).
Certain of Vesuvius’ subsidiaries are subject to lawsuits, predominantly in the US, relating to a small number of products containing asbestos manufactured prior to the acquisition of those subsidiaries by Vesuvius. These suits usually also name many other product manufacturers. To date, Vesuvius is not aware of there being any liability verdicts against any of these subsidiaries. A number of lawsuits have been withdrawn, dismissed or settled and the amount paid, including costs, in relation to this litigation has not had a material adverse effect on Vesuvius’ financial position or results of operations.
36. Principal subsidiaries and joint ventures
Details of the principal subsidiaries and joint ventures of Vesuvius plc and the countries in which they are incorporated are given in Note 5 to the Company financial statements, together with details of subsidiaries exempt from audit of their individual financial statements by virtue of section 479A Companies Act 2006.
37. Related parties
All transactions with related parties are conducted on an arm’s length basis and in accordance with normal business terms. Transactions between related parties that are Group subsidiaries are eliminated on consolidation.

Section Five Financial Statements
Vesuvius plc Annual Report and Accounts 2015
158
Notes2015
£m2014
£m
Fixed assetsInvestment in subsidiaries 5 1,778.0 1,780.3
Total fixed assets 1,778.0 1,780.3
Current assetsDebtors — amounts falling due within one year 2.5 10.5
Cash at bank and in hand 0.6 —
Total current assets 3.1 10.5
Creditors — amounts falling due within one yearBank Overdraft (0.2) —
Other creditors 6 (1,030.4) (991.7)
Net current liabilities (1,027.5) (981.2)
Total assets less current liabilities 750.5 799.1
Net assets 750.5 799.1
Equity capital and reservesIssued share capital 7 27.8 27.8
Retained earnings 722.7 771.3
Shareholders’ funds — equity 8 750.5 799.1
Company number 8217766
The financial statements were approved and authorised for issue by the Directors on 3 March 2016 and signed on their behalf by:
François Wanecq Guy Young Chief Executive Chief Financial Officer
Company Balance SheetAs at 31 December 2015

Finan
cial Statements
159
1. Basis of Preparation
1.1 Basis of accounting
These financial statements were prepared in accordance with Financial Reporting Standard 101 Reduced Disclosure Framework ‘FRS 101’. The amendments to FRS 101 (2014/15 Cycle) issued in July 2015 and effective immediately have been applied.
In preparing these financial statements, the Company applies the recognition, measurement and disclosure requirements of International Financial Reporting Standards as adopted by the EU (‘Adopted IFRSs’), but makes amendments where necessary in order to comply with Companies Act 2006 and has set out below where advantage of the FRS 101 disclosure exemptions has been taken.
Under section s408 of the Companies Act 2006 the Company is exempt from the requirement to present its own profit and loss account.
In the transition to FRS 101, the Company has applied IFRS 1 whilst ensuring that its assets and liabilities are measured in compliance with FRS 101. The transition to FRS 101 had no effect on the reported financial position, financial performance and cash flows of the Company.
In these financial statements, the Company has applied the exemptions available under FRS 101 in respect of the following disclosures:
> A Cash Flow Statement and related notes; > Disclosures in respect of transactions with wholly owned subsidiaries; > Disclosures in respect of capital management; > The effects of new but not yet effective IFRSs; and > Disclosures in respect of the compensation of Key Management Personnel.
The accounting policies set out below have, unless otherwise stated, been applied consistently to all periods presented in these financial statements.
1.2 Going concern
The Directors have a reasonable expectation that the Group and the Company have adequate resources to continue in operational existence for a period of 12 months from the date of approval of the 2015 financial statements. Accordingly, they continue to adopt a going concern basis in preparing the financial statements of the Group and the Company.
2. Employee Benefits Expense
Details of the Directors’ remuneration are disclosed in the Directors’ Remuneration Report on pages 82 to 102.
3. Audit and Non-Audit Fees
Amounts payable to KPMG LLP in relation to audit and non-audit fees are disclosed within Note 6 to the Consolidated Financial Statements.
4. Dividends
A proposed final dividend for the year ended 31 December 2015 of £30.0m (2014: £30.1m), equivalent to 11.125 pence per ordinary share (2014: 11.125 pence), is subject to approval by shareholders at the Company’s Annual General Meeting and has not been included as a liability in these financial statements. If approved by shareholders, the dividend will be paid on 20 May 2016 to ordinary shareholders on the register at 8 April 2016.
Notes to the Company Financial Statements

Section Five Financial Statements
Vesuvius plc Annual Report and Accounts 2015
160
Notes to the Company Financial Statementscontinued
5. Investment in Subsidiaries, Associates and Joint Ventures
5.1 Accounting policy
Shares in subsidiaries, associates and joint ventures are stated at cost less any impairment in value.
5.2 Analysis of investment in subsidiaries, associates and joint venturesShares in
subsidiaries £m
As at 1 January 2014 1,778.9
Additions 1.4
As at 1 January 2015 1,780.3Reduction due to intercompany recharge of capital contributions (2.3)Total amounts falling due within one year 1,778.0
The subsidiaries and joint ventures of Vesuvius plc and the countries in which they are incorporated are as follows. With the exception of Vesuvius Holding Limited, whose ordinary share capital was directly held by Vesuvius plc, the ordinary capital of the companies listed below was owned by a Vesuvius plc subsidiary as at 31 December 2015.
Company Country of incorporation
Advent Processing Engineering Inc. Canada
Andreco-Hurll Refractory Services Pty Limited Australia
Avemis SAS France
BMI Refractory Services Inc US (Pennsylvania)
Brazil 1 Limited England & Wales
Cookson Dominicana, SRL Dominican Republic
Cookson Investments (Jersey) Ltd. Jersey
Cookson Jersey Limited Jersey
Cookson Precious Metals Limited Ireland
East Moon Investment (HK Holding) Company Limited
Hong Kong
ECIL MET TEC LTDA. Brazil
Fi.Fa. S.r.l Italy
Flo-Con Holding, Inc. US (Delaware)
Flo-Con Systems, LLC US (Illinois)
Foseco (FS) Limited England & Wales
Foseco (GB) Limited England & Wales
Foseco (Jersey) Limited Jersey
Foseco (MRL) Limited England & Wales
Foseco (RUL) Limited England & Wales
Foseco (UK) Limited England & Wales
Foseco Canada Limited Canada
Foseco Española SA Spain
Foseco Foundry (China) Limited China
Foseco Fundición Holding (Española), S.L. Spain
Foseco Holding (Europe) Limited England & Wales
Foseco Holding (South Africa) (Pty) Limited South Africa
Foseco Holding BV Netherlands
Foseco Holding International Limited England & Wales
Foseco Holding Limited England & Wales
Foseco Industrial e Comercial Ltda. Brazil
Foseco International Holding (Thailand) Limited Thailand
Foseco International Limited England & Wales
Foseco Japan Ltd. Japan
Foseco Korea Limited Korea
Foseco Limited England & Wales
Foseco Metallurgical Inc. US (Delaware)
Foseco Nederland BV Netherlands
Foseco Overseas Limited England & Wales
Foseco Pension Fund Trustee Limited England & Wales
Foseco Philippines Inc Philippines
Company Country of incorporation
Foseco Portugal Produtos para Fundiçâo Ltda. Portugal
Foseco Pty Limited Australia
Foseco SAS France
Foseco Steel (Holdings) China Limited England & Wales
Foseco Steel (UK) Limited England & Wales
Foseco Technology Limited England & Wales
Foseco Transnational Limited England & Wales
Foseco Vietnam Limited Vietnam
HGAC Participações Limitada Brazil
ISID Limited England & Wales
J.H. France Refractories Company (US Delaware)
John G. Stein & Company Limited England & Wales
KVARTEC Inc Japan
Mainsail Insurance Company Limited Bermuda
Mascinco Empreendimentos e Participações Ltda. Brazil
Mercajoya, S.A. Spain
Metal Way Equipamentos Metalurgicos Ltda Brazil
Micro Jewels Limited Mauritius
Minerals Separation Limited England & Wales
New Foseco (UK) Limited England & Wales
Premier Refractories (Belgium) S.A. Belgium
Process Metrix, LLC US (California)
PROLAN S.r.l. a Socio Unico Italy
PT Foseco Indonesia Indonesia
PT Foseco Trading Indonesia Indonesia
Realisations 789, LLC US (Delaware)
Reliacheck Manufacturing, Inc US (Ohio)
Reliacheck North America LLC US (Ohio)
S G Blair & Company Limited England & Wales
S.G.E.A. S.r.l. a Socio Unico Italy
SERT-Metal SAS France
Sidermes Inc. Canada
Sidermes Latinoamericana CA Venezuela
Sidermes S.A. Argentina
Sidermes S.p.A. Italy
Sidermes Sensores Termicos do Brasil ltda Brazil
SIR Feuerfestprodukte GmbH Germany
Soled SAS France
Son.Te.Co. Gmbh Germany
Sunway Thermal Ceramics (Anshan) Co., Ltd China

Finan
cial Statements
161
Company Country of incorporation
Tamworth UK Limited England & Wales
Thomas Marshall (Loxley) Limited England & Wales
U.S. Lake Effect Properties, L.L.C. US (Ohio)
Unicorn Industries Limited England & Wales
Veservice LTDA Brazil
Vesuvius (Thailand) Co., Ltd Thailand
Vesuvius (V.E.A.R.) S.A. Argentina
Vesuvius Advanced Ceramics (China) Co., Ltd
China
Vesuvius America, Inc. US (Delaware)
Vesuvius Americas Holding, Inc. US (Delaware)
Vesuvius Australia (Holding) Pty Limited Australia
Vesuvius Australia Pty Ltd Australia
Vesuvius Belgium N.V. Belgium
Vesuvius Canada Inc. Canada
Vesuvius Ceramics Limited England & Wales
Vesuvius China Holdings Co. Limited Hong Kong
Vesuvius China Limited England & Wales
Vesuvius Colombia SAS Colombia
Vesuvius Corporation S.A. Switzerland
Vesuvius Crucible Company US (Delaware)
Vesuvius Holding Deutschland GmbH Germany
Vesuvius Emirates FZE United Arab Emirates
Vesuvius Financial 1 Limited England & Wales
Vesuvius Finland Oy Finland
Vesuvius Foundry Products (Suzhou) Co., Ltd. China
Vesuvius Foundry Technologies (Jiangsu) Co. Ltd China
Vesuvius France S.A. France
Vesuvius GmbH Germany
Vesuvius Group Limited England & Wales
Vesuvius Group SA Belgium
Vesuvius Holding Deutschland Gmbh Germany
Vesuvius Holding France S.A. France
Vesuvius Holding Italia – Società a Responsabilità Limitata
Italy
Vesuvius Holdings Limited England & Wales
Vesuvius Ibérica Refractarios, S.A. Spain
Vesuvius International Corporation US (Delaware)
Vesuvius Investments Limited England & Wales
Vesuvius Istanbul Refrakter Sanayi ve Ticaret A.S. Turkey
Company Country of incorporation
Vesuvius Italia S.p.A Italy
Vesuvius Japan Inc. Japan
Vesuvius K.S.R. Limited England & Wales
Vesuvius Life Plan Trustee Limited England & Wales
Vesuvius LLC Russian Federation
Vesuvius Malaysia Sdn Bhd Malaysia
Vesuvius Management Limited England & Wales
Vesuvius Mexico S.A. de C.V. Mexico
Vesuvius Mid-East Limited Egypt
Vesuvius Minerals Limited England & Wales
Vesuvius New Zealand Limited New Zealand
Vesuvius OOO Russian Federation
Vesuvius Overseas Investments Limited England & Wales
Vesuvius Overseas Limited England & Wales
Vesuvius Pension Plans Trustees Limited England & Wales
Vesuvius Pigments (Holdings) Limited England & Wales
Vesuvius Poland Spólka z.o.o Poland
Vesuvius Ras Al Khaimah FZ-LLC United Arab Emirates
Vesuvius Refractarios de Chile SA Chile
Vesuvius Refractarios de Venezuela C.A. Venezuela
Vesuvius Refractories (Tianjin) Co Ltd China
Vesuvius Refractories SRL Romania
Vesuvius Refratarios Ltda Brazil
Vesuvius Scandinavia AB Sweden
Vesuvius Scotland Limited Scotland
Vesuvius Slavia a.s. Czech Republic
Vesuvius Solar Crucible (Suzhou) Co., Ltd China
Vesuvius Solar Crucible s.r.o Czech Republic
Vesuvius South Africa (Pty) Ltd South Africa
Vesuvius UK (2002) Limited Scotland
Vesuvius UK Limited England & Wales
Vesuvius Ukraine LLC Ukraine
Vesuvius USA Corporation US (Illinois)
Vesuvius Volga OOO Russian Federation
Vesuvius Zyalons Holdings Limited Scotland
Vesuvius Zyarock Ceramics (Suzhou) Co., Ltd China
Vesuvius-Premier Refractories (Holdings) Limited England & Wales
Wilkes-Lucas Limited England & Wales
Yingkou Bayuquan Refractories Co., Ltd China
Those companies and joint ventures which are not wholly owned by Vesuvius plc or one of its subsidiary companies are listed below.
Company % Interest held Country of incorporation
Angang Vesuvius Refractory Company Limited 50 China
Beauvac Participações S/A 50 Brazil
Foseco (Thailand) Ltd. 74 Thailand
Foseco Golden Gate Company Limited 51 Taiwan
Foseco India Limited 74.98 India
INTAHSA S.A. 25 Brazil
Newshelf 480 Proprietary Limited 45 South Africa
Vesuvius Ceská Republika, a.s 60 Czech Republic
Vesuvius India Limited 55.57 India
Wuhan Wugang-Vesuvius Advanced CCR Co., Ltd. 50 China
Wuhan Wugang-Vesuvius Advanced Ceramics Co., Ltd 50 China
As with Vesuvius plc, all of the above companies have a 31 December year end except Fi.Fa. S.r.l, which was acquired during the current year as part of the Sidermes Group, which has a 30 June year-end. All subsidiaries, investments and joint ventures are included in the Consolidated Financial Statements of the Company.

Section Five Financial Statements
Vesuvius plc Annual Report and Accounts 2015
162
Notes to the Company Financial Statementscontinued
5. Investment in Subsidiaries (continued)
5.3 Audit exempt subsidiaries
The following UK subsidiaries are exempt from audit of their individual financial statements by virtue of section 479A Companies Act 2006.
Brazil 1 Limited Vesuvius China Limited
Foseco Technology Limited Vesuvius Group Limited
Foseco Transnational Limited Vesuvius Minerals Limited
Foseco (UK) Limited Vesuvius Pigments (Holdings) Limited
S G Blair & Company Limited
6. Other Creditors2015
£m2014
£m
Amounts owed to subsidiary undertakings 1,029.2 990.3
Accruals and other creditors 1.2 1.4
Total amounts falling due within one year 1,030.4 991.7
7. Issued Share Capital
7.1 Accounting policy
Equity instruments issued by the Company are recorded at the proceeds received, net of direct issue costs.
7.2 Analysis of issued share capital
The issued ordinary share capital of the Company as at 31 December 2015 was 278.5 million shares of £0.10 each (31 December 2014: 278.5 million shares of £0.10 each).
During the year to 31 December 2015, 1,170,115 Vesuvius plc ordinary shares were purchased into the Vesuvius Group ESOP, via Cookson Investments (Jersey) Limited as Trustee of the ESOP, for £5.2m.
8. Shareholders’ Funds
8.1 Accounting policy Taxation
Both current and deferred tax are calculated using tax rates and laws that have been enacted, or substantively enacted, by the balance sheet date.
Current tax payable is based on the taxable result for the year. Deferred taxation is recognised, without discounting, in respect of all timing differences that have originated, but not reversed, at the balance sheet date, with the exception that deferred taxation assets are only recognised if it is considered more likely than not that there will be suitable future profits from which the reversal of the underlying timing differences can be deducted. Provision is made for the tax that would arise on remittance of the retained earnings of overseas subsidiaries only to the extent that, at the balance sheet date, dividends have been accrued as receivable.
8.2 Reconciliation of movements in shareholders’ fundsShare
capital £m
Retainedearnings
£mTotal
£m
As at 1 January 2014 27.8 812.1 839.9
Loss recognised for the year — (1.6) (1.6)
Purchase of own shares — (0.5) (0.5)
Disposal of own shares — 1.0 1.0
Recognition of share-based payments — 1.5 1.5
Dividend paid — (41.2) (41.2)
As at 1 January 2015 27.8 771.3 799.1Profit recognised for the year — 0.4 0.4Purchase of own shares — (5.2) (5.2)Recognition of share-based payments — 0.1 0.1Dividend paid — (43.9) (43.9)As at 31 December 2015 27.8 722.7 750.5
The Company had distributable reserves of £722.7m as at 31 December 2015 (2014: £771.3m).

Finan
cial Statements
163
9. Share-based Payments
9.1 Accounting policy
The Company operates equity-settled share-based payment arrangements for its employees. Equity-settled share-based payments are measured at fair value at the date of grant. The fair value determined at the grant date takes account of the effect of market-based conditions, such as the Total Shareholder Return target upon which vesting for some of the awards is conditional, and is expensed on a straight-line basis over the vesting period with a corresponding increase in equity. The cumulative expense recognised is adjusted for the best estimate of the shares that will eventually vest and for the effect of other non market-based vesting conditions, such as growth in headline earnings per share, which are not included in the fair value determined at the date of grant. For grants with market-based conditions attaching to them, fair value is measured using a form of stochastic option pricing model. For all other grants, fair value is measured using the Black-Scholes model.
9.2 Profit and loss account recognition
The Company operates a number of different share-based payment schemes, the main features of which are detailed between pages 88 to 90 of the Directors’ Remuneration Report. £0.5m was credited to the profit and loss account in the year with regard to share-based payments (2014: £1.3m charge).
9.3 Details of outstanding options
The information in the tables below has been restated to take into account the demerger of the Alent business from the Cookson Group. The number of share options, and other related disclosures, were adjusted with reference to the Vesuvius share price at the date of demerger.
Outstanding awardsAwards
exercisable as at
31 Dec 2015
no.
Weighted average
outstanding contractual
life of awards
years
Range of exercise
prices pence
As at 1 Jan 2015
no.Granted
no.Exercised
no.
Forfeited/ lapsed
no.
As at 31 Dec
2015 no.
LTIP 1,227,577 411,652 (56,309) (666,757) 916,163 — 8.2 n/aWeighted average exercise price nil nil nil nil nil — n/aOther plans 43,301 38,960 — — 82,261 33,220 0.5 n/aWeighted average exercise price nil nil nil nil nil — n/a
For options exercised during 2015, the share price at the date of exercise was 517 pence for LTIP schemes.
Outstanding awardsAwards
exercisable as at
31 Dec 2014
no.
Weighted average
outstanding contractual
life of awards
years
Range of exercise
prices pence
As at 1 Jan 2014
no.Granted
no.Exercised
no.
Forfeited/ lapsed
no.
As at 31 Dec
2014 no.
LTIP 1,244,609 463,667 (133,857) (346,842) 1,227,577 — 5.0
Weighted average exercise price nil nil nil nil nil — n/a
Other plans 54,403 76,522 (87,624) — 43,301 — 2.1
Weighted average exercise price nil nil nil nil nil — n/a
For options exercised during 2014, the share price at the date of exercise was 435 pence for LTIP schemes and 410 or 420 pence for other plans.

Section Five Financial Statements
Vesuvius plc Annual Report and Accounts 2015
164
Notes to the Consolidated Financial Statementscontinued
9. Share-based Payments (continued)
As at 31 December 2015, the total options exercisable by all Group employees over the £0.10 ordinary shares and capable of being satisfied through new allotments of shares or through shares held by the Company’s ESOP were as follows:
Years of award/grant
Option prices (£)
Latest year of exercise/
vesting
Number of options/ allocations
outstanding
Long Term Incentive Plan 2013-2015 nil 2015/2025 1,585,838
Deferred Share Bonus Plan 2013-2014 nil 2016/2017 13,819
Restricted rights 2014-2015 nil 2016/2017 72,180
Fair value of options granted under the LTIP during the year:
2015 2014
EPS element
TSR element
EPS element
TSR element
Fair value of options granted (per share) 491p 275p 429p 154p
Share price on date of grant (per share) 491p 491p 429p 429p
Expected volatility n/a 24.0% n/a 26.0%
Risk-free interest rate n/a 0.62% n/a 1.03%
Exercise price (per share) nil nil nil nil
Expected term (years) 4 4 4 4
Expected dividend yield n/a n/a n/a n/a
The fair value of share options with non-market performance conditions has been calculated using the Black-Scholes option pricing model. The fair value of options with market-related performance conditions are measured using the Monte Carlo model. Expected volatility was determined by calculating the historical volatility of the group’s share price over the period from the date of listing to grant date of 2.25 years (2014: 1.25 years). The risk free rate of return was assumed to be the yield to maturity on a UK fixed gilt with the term to maturity equal to the expected life of the option. At the discretion of the Remuneration Committee award holders receive the value of dividends that would have been paid on their vested shares in the period between grant and vesting. Accordingly, there is no discount to the valuation for dividends forgone during the vesting period.
10. Contingent Liabilities
Where the Company enters into financial guarantee contracts to guarantee the indebtedness of other companies within its Group, the Company considers these to be insurance arrangements and accounts for them as such. In this respect, the Company treats the guarantee contract as a contingent liability until such time as it becomes probable that the Company will be required to make a payment under the guarantee. Guarantees provided by the Company as at 31 December 2015 in respect of the liabilities of its subsidiary companies amounted to £486.0m (2014: £457.7m), which includes guarantees of $310m and €30m (2014: $310m and €30m) in respect of US Private Placement Loan Notes and £118.9m (2014: £81.5m) in respect of drawings under the syndicated bank facility; together with £108.2m (2014: £108.2m) in relation to a guarantee provided to the Company’s UK subsidiary which acts as Trustee for the Group’s UK pension plan. The guarantee is over all present and future pension liabilities of the plan and the contingent liability amount represents the net deficit on a solvency valuation basis as shown in the most recent triennial valuation.
Vesuvius has extensive international operations and is subject to various legal and regulatory regimes, including those covering taxation and environmental matters. Several of the Company’s subsidiaries are parties to legal proceedings, certain of which are insured claims arising in the ordinary course of the operations of the company involved, and are aware of a number of issues which are, or may be, the subject of dispute with tax authorities. While the outcome of litigation and other disputes can never be predicted with certainty, having regard to legal advice received and the insurance arrangements of the Company and its subsidiaries, the Directors believe that none of these matters will, either individually or in the aggregate, have a materially adverse effect on the Company’s financial condition or results of operations.
11. Related Parties
All transactions with related parties are conducted on an arm’s length basis and in accordance with normal business terms. Transactions between related parties that are wholly owned Group subsidiaries are not disclosed in this Note.

165
Finan
cial Statements
2015 2014 2013 2012 2011
Steel divisionRevenue £m 898 981 1,018 1,018 1,078
Trading profit1 £m 79.5 96.4 88.7 83.1 105.8
Return on sales1 % 8.9 9.8 8.7 8.2 9.8
Employees: year-end no. 7,783 8,349 7,524 7,601 7,783
Foundry divisionRevenue £m 424 463 493 530 608
Trading profit1 £m 44.5 46.4 51.3 48.2 75.5
Return on sales1 % 10.5 10.0 10.4 9.1 12.4
Employees: year-end no. 3,129 3,443 3,330 3,585 3,889
Note:1. The unaudited trading profit numbers reported above for the years before 2013 are restated for the impact of IAS 19(R), which was adopted by the
Company during 2013.
Five-Year Summary: Divisional Results from Continuing Operations
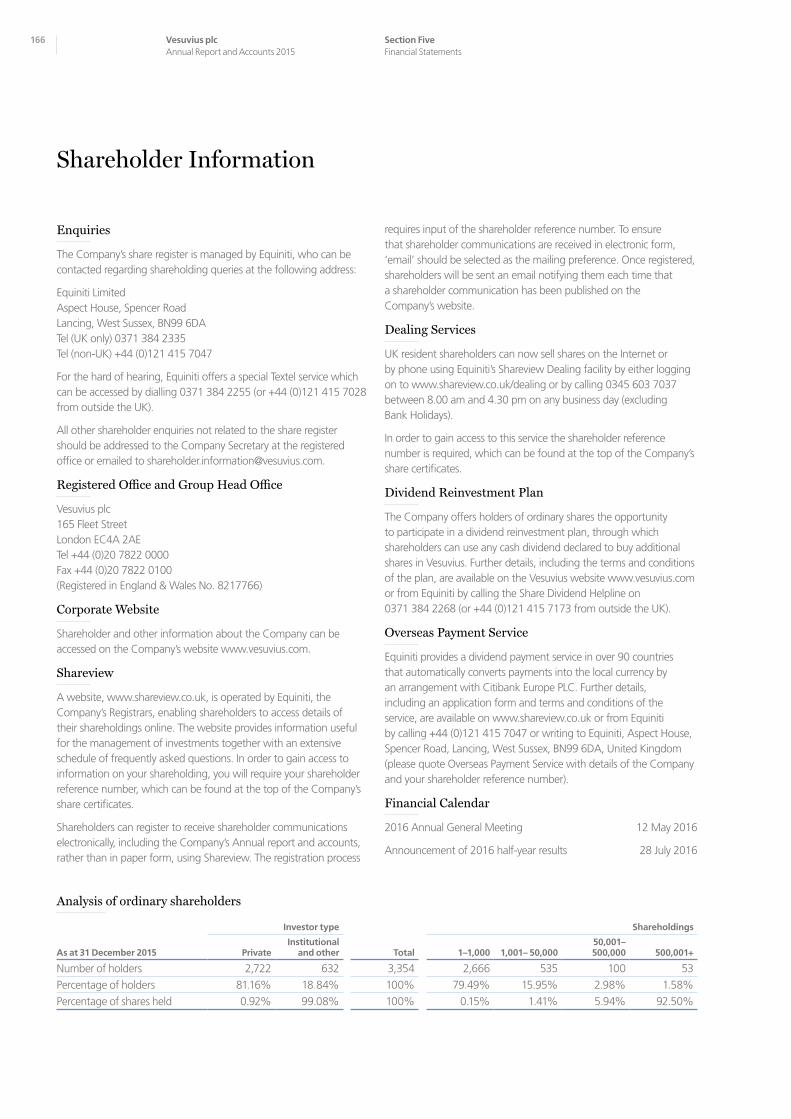
166 Section FiveFinancial Statements
Vesuvius plcAnnual Report and Accounts 2015
Enquiries
The Company’s share register is managed by Equiniti, who can be contacted regarding shareholding queries at the following address:
Equiniti Limited Aspect House, Spencer Road Lancing, West Sussex, BN99 6DA Tel (UK only) 0371 384 2335 Tel (non-UK) +44 (0)121 415 7047
For the hard of hearing, Equiniti offers a special Textel service which can be accessed by dialling 0371 384 2255 (or +44 (0)121 415 7028 from outside the UK).
All other shareholder enquiries not related to the share register should be addressed to the Company Secretary at the registered office or emailed to [email protected].
Registered Office and Group Head Office
Vesuvius plc 165 Fleet Street London EC4A 2AE Tel +44 (0)20 7822 0000 Fax +44 (0)20 7822 0100 (Registered in England & Wales No. 8217766)
Corporate Website
Shareholder and other information about the Company can be accessed on the Company’s website www.vesuvius.com.
Shareview
A website, www.shareview.co.uk, is operated by Equiniti, the Company’s Registrars, enabling shareholders to access details of their shareholdings online. The website provides information useful for the management of investments together with an extensive schedule of frequently asked questions. In order to gain access to information on your shareholding, you will require your shareholder reference number, which can be found at the top of the Company’s share certificates.
Shareholders can register to receive shareholder communications electronically, including the Company’s Annual report and accounts, rather than in paper form, using Shareview. The registration process
requires input of the shareholder reference number. To ensure that shareholder communications are received in electronic form, ‘email’ should be selected as the mailing preference. Once registered, shareholders will be sent an email notifying them each time that a shareholder communication has been published on the Company’s website.
Dealing Services
UK resident shareholders can now sell shares on the Internet or by phone using Equiniti’s Shareview Dealing facility by either logging on to www.shareview.co.uk/dealing or by calling 0345 603 7037 between 8.00 am and 4.30 pm on any business day (excluding Bank Holidays).
In order to gain access to this service the shareholder reference number is required, which can be found at the top of the Company’s share certificates.
Dividend Reinvestment Plan
The Company offers holders of ordinary shares the opportunity to participate in a dividend reinvestment plan, through which shareholders can use any cash dividend declared to buy additional shares in Vesuvius. Further details, including the terms and conditions of the plan, are available on the Vesuvius website www.vesuvius.com or from Equiniti by calling the Share Dividend Helpline on 0371 384 2268 (or +44 (0)121 415 7173 from outside the UK).
Overseas Payment Service
Equiniti provides a dividend payment service in over 90 countries that automatically converts payments into the local currency by an arrangement with Citibank Europe PLC. Further details, including an application form and terms and conditions of the service, are available on www.shareview.co.uk or from Equiniti by calling +44 (0)121 415 7047 or writing to Equiniti, Aspect House, Spencer Road, Lancing, West Sussex, BN99 6DA, United Kingdom (please quote Overseas Payment Service with details of the Company and your shareholder reference number).
Financial Calendar
2016 Annual General Meeting 12 May 2016
Announcement of 2016 half-year results 28 July 2016
Shareholder Information
Analysis of ordinary shareholders
As at 31 December 2015
Investor type
Total
Shareholdings
PrivateInstitutional
and other 1–1,000 1,001– 50,00050,001– 500,000 500,001+
Number of holders 2,722 632 3,354 2,666 535 100 53
Percentage of holders 81.16% 18.84% 100% 79.49% 15.95% 2.98% 1.58%
Percentage of shares held 0.92% 99.08% 100% 0.15% 1.41% 5.94% 92.50%

Finan
cial Statements
167
Share Fraud – Spot the Warning Signs
Investment scams are designed to look like genuine investments.
Have you been…
> Contacted out of the blue > Promised tempting returns and told the investment is safe > Called repeatedly, or > Told the offer is only available for a limited time?
If so, you might have been contacted by fraudsters.
How to avoid Share Fraud
1. Reject cold calls If you’ve been cold called with an offer to buy or sell shares, chances are it’s a high-risk investment or a scam. You should treat the call with extreme caution. The safest thing to do is to hang up.
2. Check the firm on the FS register at www.fca.org.uk/register The Financial Services Register is a public record of all the firms and individuals in the financial services industry that are regulated by the FCA.
3. Get impartial advice Think about getting impartial financial advice before you hand over any money. Seek advice from someone unconnected to the firm that has approached you.
Reporting a Scam
If you suspect that you have been approached by fraudsters please tell the FCA using the share fraud reporting form at www.fca.org.uk/scams, where you can find out more about investment scams. You can also call the FCA Consumer Helpline on 0800 111 6768 (or +44 (0)20 7066 1000 from outside the UK).
If you have lost money to investment fraud, you should report it to Action Fraud on 0300 123 2040 or online at www.actionfraud.police.uk.
Find out more at www.fca.org.uk/scamsmart

168 Section FiveFinancial Statements
Vesuvius plcAnnual Report and Accounts 2015
5S Five steps to improve housekeeping and therefore workplace safety and efficiency: separate, sort, shine, standardise and sustain
8D An eight-step methodology to resolve customer, supplier and internal quality issues
AGM Annual General MeetingCapex Capital expenditureCO2 Carbon dioxideCO2e Carbon dioxide equivalentCompany Vesuvius plcDTR The Disclosure and Transparency Rules
of the UK Financial Conduct AuthorityEBITDA Earnings before interest, tax, depreciation
and amortisationEMEA Europe, Middle East and AfricaEPS Earnings per shareEU European UnionFRC Financial Reporting CouncilFRS Financial Reporting StandardsFTSE 250 Equity index whose constituents are the
101st to 350th largest companies listed on the London Stock Exchange in terms of their market capitalisation
GHG Greenhouse gasGroup Vesuvius plc and its subsidiary companiesHSE Health, Safety and the EnvironmentIAS International Accounting StandardIFRS International Financial Reporting StandardsKPI Key performance indicatorLTI Lost time injuryLTIFR Lost time injury frequency rate, a KPI
which calculates the number of LTIs per million hours worked
Median The middle number in a sorted list of numbersNAFTA The area to which the North American Free
Trade Agreement applies OEM Original Equipment ManufacturerOHAS 18001 Occupational Health and Safety Advisory Services
requirements for an OHS management systemOrdinary share An ordinary share of 10p in the capital of
the CompanyR&D Research and developmentTSR Total shareholder returnTurbo.S The Vesuvius safety training programme Turbo.Q The Vesuvius quality training programmeUK GAAP UK Generally Accepted Accounting Principles
Glossary

Printed by CPI Colour – who are ISO14001 certified, CarbonNeutral®, Alcohol Free and FSC® and PEFC Chain of Custody certified.
This report is produced on Claro Bulk – an FSC Certified material, which is manufactured using totally chlorine free process, and from a sustainable supply FSC chain. The inks used are vegetable oil based.
Designed and produced by Friend. www.friendstudio.com
In 2015, we commissioned renowned photographer Samuel Dhote to capture the many different aspects of Vesuvius innovation around the world. Samuel’s images feature throughout this annual report.
Additional images: Vesuvius Image Library and Nichols Company.

VESUVIUS: black 85%PLC: black 60%
VESUVIUS: whitePLC: black 20%
Vesuviu
s plc A
nnual Report and Accounts 2015
Vesuvius plc 165 Fleet Street London EC4A 2AE
T +44 (0)20 7822 0000 www.vesuvius.com