annual report and accounts 2017 -...
TRANSCRIPT

Hornby PLC3rd Floor, The Gateway, Innovation WayDiscovery Park, SandwichKentCT13 9FFwww.hornby.com
ANNUAL REPORT AND ACCOUNTS 2017
5213HH-Hornby_PLC_Annual_Report_2017.Indd 1 05/06/2017 14:18
Ho
rnb
y PLC A
nn
ua
l Rep
ort a
nd
Ac
co
un
ts 2017

Hornby PLC Annual Report and Accounts 2017
Hornby PLC
Overview01 Highlights 201702 At a Glance04 Product Journey06 Strategy
Strategic report08 Chairman’s statement10 Chief Executive’s report14 Operating and financial review
of the year17 Our Key Performance Indicators (‘KPIs’)
Governance19 Directors and Corporate Information20 Directors’ Report25 Independent Auditors’ Report to the
Members of Hornby PLC
Financial statements27 Group and Company Statements
of Comprehensive Income28 Group and Company Statements
of Financial Position29 Group and Company statements
of Changes in Equity30 Group and Company Cash Flow
Statement31 Notes to the Financial Statements61 Notice of Annual General Meeting
(Unaudited)64 Shareholders’ Information Service
The Group’s principal business is the development, production and supply of toy and hobby products for a global market, through a series of heritage brands. The Group distributes its products through a network of hobby specialists, multiple retailers and through its own website in the UK and overseas.

OV
ERVIEW
STRATEG
IC REPO
RTG
OV
ERNA
NCE
FINA
NCIA
L STA
TEMEN
TS
01Hornby PLC Annual Report and Accounts 2017
Highlights 2017
“ I am pleased with the progress we have made over the past year to deliver on the Turnaround Plan, the first stage of which has now been completed. We have delivered on the commitments we made a year ago and have made the necessary structural changes to the business. Having returned the Group to a sound financial footing, we are now in a position to focus on the next stage of the Turnaround Plan, which will see Hornby progress back to profitability and positive cash generation.”
Steve Cooke, Chief Executive
1 Underlying figures are before amortisation of intangibles (brand names and customer lists) and net unrealised foreign exchange movements on intercompany loans and exceptional items.
Revenue (2016: £55.8m)
£47.4mOperating loss (2016: £(13.1)m loss)
£(9.2)mReported loss before taxation (2016: £(13.5)m loss)
£(9.5)mUnderlying1 loss before taxation (2016: £(5.7)m loss)
£(6.3)mReported loss after taxation (2016: £(13.7)m loss)
£(9.7)mReported loss per share (2016: (27.87)p loss)
(12.65)pUnderlying basic loss per share (2016: (13.02)p basic earnings)
(9.26)pNet cash (2016: £7.2m net debt)
£1.5m

02 Hornby PLC Annual Report and Accounts 2017
At a Glance
The Group operates across five product categories in the toy and hobby market for scale models. Our products are distributed through the following channels: UK Independent specialists, UK National retailers, our European businesses in Spain, France, Germany and Italy, via export with our international distributors and through Hornby Inc. in the USA. Other channels include Hornby’s internet and retail operations.
High-quality scale locomotives, coaches and wagons for the model rail enthusiast. Hornby is the main UK model rail brand, with Hornby Railroad as an affordable entry level range. Hornby Skaledale is a range of 1:76 scale buildings. Hornby train sets also provide the perfect introduction to the world of model railways.
International model rail brands produce locomotives, coaches, wagons and accessories and include the Rivarossi, Jouef and Electrotren brands in HO scale and Arnold in N scale.
Scalextric is the classic model slot car racing system. The range includes 1:32 scale cars as well as 1:64 scale Micro-Scalextric for the younger enthusiast. The Sets are supported by a range of accessories allowing the layout to be expanded and the racing experience is enhanced through App Race Control (ARC), which uses a mobile app to simulate real racing conditions. A range of solo cars allows the enthusiast to collect their favourite slot car models.
Model rail Slot carRevenue
£22mRevenue
£12mKey channels
Key channels
UK Independents 38%
UK Nationals 7%
Export 7%
Europe 29%
Other 19%
UK Independents 11%
UK Nationals 39%
Export 14%
Europe 5%
USA 14%
Other 17%

OV
ERVIEW
STRATEG
IC REPO
RTG
OV
ERNA
NCE
FINA
NCIA
L STA
TEMEN
TS
03Hornby PLC Annual Report and Accounts 2017
Injection plastic moulded kits in various scales from 1:24 to 1:72. The Airfix range includes models of varying levels of difficulty, from starter kits for those new to the hobby to classic kits for the more experienced modeller. Gift Sets make the perfect present. Airfix Quickbuild are scale models made from moulded, lock-together blocks.
Strongly associated with model-making, the Humbrol range encompasses enamel and acrylic paints as well as thinners, solvents, weathering products and accessories to provide the modeller with everything they need to complete a model.
Corgi produce die-cast scale model vehicles including 1:43 scale cars in the Vanguard range, 1:72 scale military aircraft in the Aviation Archive range, a range of 1:50 scale ‘Hauliers of Renown’ as well as famous cars from TV and film.
Plastic modelling Specialist paints
Collectable models
Revenue
£2mRevenue
£6m
Revenue
£4mKey channels
Key channels
Key channels
UK Independents 36%
UK Nationals 18%
Export 27%
Other 19%
UK Independents 38%
UK Nationals 9%
Export 7%
Premiums 10%
USA 7%
Other 29%
UK Independents 21%
UK Nationals 23%
Export 22%
Europe 9%
USA 11%
Other 14%

04 Hornby PLC Annual Report and Accounts 2017
Product Journey
01. Research 02. Selection
06. Consumer
The product journey starts at least two years in advance of a product being released. Our researchers gather customer and consumer feedback on products and they also review competitor releases to identify gaps in the product range. They use their depth of knowledge, intuition and trends in the market to develop a balanced, highly-desirable proposed range covering different eras, subject matters and items of interest.
Product ideas are then filtered to assess their feasibility, which may be influenced by the availability of design and source information and whether a product licence is required and available. A financial assessment is then undertaken to evaluate the investment in new tooling, which will be underpinned by sales forecasts based on historic knowledge and experience.
We also have dedicated brand websites, which as well as listing the product ranges they list a significant amount of help and advice in the form of manuals, services sheets and guidance on spares and servicing. The website resource is supported by the Customer Service team, who are available to provide advice by phone and email.
Finally, the Hornby Visitor Centre in Margate displays the rich history of the Company and its brands, and is a fun day out for all the family with large train layouts and a chance to experience the fun of Scalextric.
We engage with our consumers through the major hobby shows held throughout the year. This is an important and key time to receive feedback from our consumers on new products and the service Hornby provides. Our social media team also provide insight into new product developments via our blogs; The Engine Shed, Test Track, Aerodrome and Die-Cast Diaries. We also work closely with the key hobby magazines, providing test products and development insights to help consumers keep abreast of new and exciting developments.

OV
ERVIEW
STRATEG
IC REPO
RTG
OV
ERNA
NCE
FINA
NCIA
L STA
TEMEN
TS
05Hornby PLC Annual Report and Accounts 2017
03. Design
04. Manufacture05. Distribution
Once selected, the new product will be designed using our in-house CAD capabilities. The CAD drawings are developed from manufacturers’ original drawings or from a laser scan and survey. This allows a detailed and accurate CAD design to be developed. Product variants of models are developed, which help to maximise the return on new tooling investment.
Once the design is finalised, the product is produced by our network of specialist vendors in China, India and the UK. The tooling to produce the models is developed from the CAD drawings. Once the tooling is manufactured, pre-production samples are produced in small volumes to test the accuracy of the tooling and to check the fit and function of the components. Following pre-production, a fully decorated sample is produced, which is used for licensor approval if relevant and is then used to ensure the production meets the required standard. Our quality control team will then inspect products at source on the production line to ensure they are to the requisite quality.
Once completed, the product is shipped to the UK, spending around six weeks in transit, before being held at the Group’s outsourced warehouse in Hersden, Kent. Some products are delivered direct to the customer from Hong Kong. The finished products are distributed via a network of Independent retailers, by National and International customers as well as direct to consumers through the Hornby internet. A team of sales executives support our customers with regular meetings and visits.

06 Hornby PLC Annual Report and Accounts 2017
Strategy
In June 2016 we outlined the Turnaround Plan with the stated aim of returning the business to sustainable profit and positive cash generation. We are pleased with the progress made over the past year with improving the focus on our customers and consumers, with the organisational changes made and with the actions to strengthen the balance sheet.
Strategic priority2016–2018
Turnaround plan
• Focused product ranges• Maintain key brands• Refine channel strategy
and exit concessions
• Reduce business scale and cost• Streamline European operating model• Establish leadership team
• Careful management of stock• Realise property assets
Customer focus
Organisational change
Strengthen balance sheet

OV
ERVIEW
STRATEG
IC REPO
RTG
OV
ERNA
NCE
FINA
NCIA
L STA
TEMEN
TS
07Hornby PLC Annual Report and Accounts 2017
2016–2017
Progress2016–2018
Priorities
• Product lines reduced to c.1,400 (from 2,400 in 2015)
• Brands supported by £1.8 million of capital investment in new tooling
• Concessions substantially exited• Improved relationships with UK Independent
and National retailers
• Building on the strong profitability of the Hornby and Airfix brands
• Improving Scalextric performance• Growing our European and US businesses• Further improving our customer service• Maximise the return from our brands
through selective licensing agreements
• Reduce business scale and cost• European operations and product
development centralised in the UK
• Deliver further efficiencies from ongoing cost reduction
• Stock reduced to £9.7 million at 31 March 2017 (2016: £13.6 million)
• Spanish and Margate properties sold realising £3.3 million in cash
• Group delivered in line with Plan and Board’s expectations for 2016–17
• Continued careful management of stock and working capital

08 Hornby PLC Annual Report and Accounts 2017
Chairman’s Statement
The Strategic Report comprises the Chairman’s Statement, the Chief Executive’s Report, the Operating and Financial Review of the Year and Our Key Performance Indicators (‘KPIs’).
Delivering the Turnaround PlanThe last 12 months was a period of significant change for Hornby. Following the trading challenges of 2015–16, we embarked upon a two-year Turnaround Plan to transform the business, supported by our shareholders through £8 million of new equity and by our bankers with a £10 million refinancing of the bank facilities in July 2016. The objective of the Turnaround Plan is to return the Group to a position of operational cash generation for the 2017–18 financial year. 2016–17 was expected to be a year of transition, executing the main elements of structural change envisaged by the Turnaround Plan.
I am pleased with the considerable progress made against the Plan over the past year and, as such, we believe that we have completed the first stage. We have returned the business to a sound financial footing and have laid the foundations for the business to progress to profitability and positive cash generation on a sustainable basis.
Getting closer to our customers and consumersWe have established stronger relationships with our customers and consumers. We have resumed attendance at consumer shows to raise the profile of our brands whilst getting closer to consumers to receive their feedback on our progress. We have engaged more closely with our network of Independent customers, which is essential to the success of the business, including roadshows launching our product range for 2017. We have also begun to increase the quantity and quality of interaction with our National multiple retailers.

OV
ERVIEW
STRATEG
IC REPO
RTG
OV
ERNA
NCE
FINA
NCIA
L STA
TEMEN
TS
09Hornby PLC Annual Report and Accounts 2017
• Revenue of £47.4 million (2016: £55.8 million)• Underlying loss before taxation1 of £6.3 million (2016: £5.7 million loss) • Reported loss before tax of £9.5 million (2016: £13.5 million loss)• Reported loss after tax of £9.7 million (2016: £13.7 million loss)• Exceptional items of £3.3 million (2016: £7.9 million), including costs
relating to the restructuring of the business, refinancing and a profit on the sale of the Margate and Spanish properties
• Net cash at 31 March 2017: £1.5 million (2016: £7.2 million net debt)1 Stated before amortisation of intangibles (brand names and customer lists) and net unrealised foreign exchange movements on intercompany loans and exceptional
items. See Operating and Financial Review on page 15 for details.
Financial stabilityStrengthening the Group’s financial position was a key strategic priority of the Turnaround Plan. Good progress has been achieved through the sale of properties in Spain and Margate, which raised £3.3 million. Stock management was critical and we have achieved a year-on-year reduction of £4.0 million to £9.7 million.
PeopleI would like to take the opportunity to thank our employees for their hard work and commitment during a difficult time for the business. They have continued to develop and deliver great products for our customers and consumers during a period of significant change.
Board changesOn 17 October 2016, we announced that David Mulligan had been appointed Group Finance Director on a permanent basis.
On 22 December 2016, we announced that Martin George was appointed as a Non-Executive Director. Martin has extensive experience in marketing and commercial roles. He was recently Chief Commercial Officer of The Post Office Limited, as well as Chairman of Grays International Limited. He was previously Non-Executive Director at Thorntons plc, Group Development Director and Group Marketing Director at BUPA and Commercial Director at British Airways.
Charlie Caminada stepped down from the Board on 22 December 2016. Charlie was on the Board for three years, during which time he helped to steer the business through a period of major change, including two successful refinancings. Charlie also acted as Interim Executive Sales Director for six months earlier this year. I would like to thank Charlie once again for the significant contribution he has made to Hornby.
Shareholder engagementWe will hold our AGM in September 2017, providing shareholders with an excellent opportunity to hear more about our progress with the Turnaround Plan.
With the first stage of our Turnaround Plan complete, the Board is now focusing on the delivery of the second stage in 2017–18, further details of which are detailed in the Chief Executive’s Report. As a Board, we are confident that we have established a firm platform for growing shareholder value and returning Hornby to a more stable and sustainable trading performance.
On behalf of the Board
Roger CanhamExecutive Chairman21 June 2017

10 Hornby PLC Annual Report and Accounts 2017
Chief Executive’s Report
2016–17 was a year of transition for the Hornby Group. In June 2016, we set out the Turnaround Plan with the stated aim of returning the business to sustainable profit and positive cash generation over a two-year period. I am pleased with the progress we have made over the past year in delivering the changes that we committed to as part of the Plan.
To recap, the key elements of the first phase of the Turnaround Plan were as follows:• Reduce business scale and costs• Maintain key UK brands• Streamline European operating model
and brands• Focused product ranges• Refine sales channels strategy and
substantially exit concessions• Careful management of stock down to
an appropriate level
In addition, we have put significant effort into improving our relationships with our customers and consumers. Now the first stage of the Turnaround Plan is completed, the focus for the current year turns to moving the business to sustainable profit and cash generation by:• Building on the strong profitability of the
Hornby, Airfix and Humbrol brands• Improving Scalextric’s performance• Growing our European and US
businesses• Further improving our customer service• Delivering further efficiencies from
ongoing cost reduction• Maximising the return from our brands
through selective licensing agreements
The financial performance for last year was in line with the Board’s expectations and those of the Turnaround Plan. Revenue of £47.4 million (2016: £55.8 million) reduced by 15%. However, this was expected as we rationalised the business. The operating loss before exceptionals of £5.9 million (2016: £5.3 million loss) reflected the transition and significant organisational changes delivered over the past year.

OV
ERVIEW
STRATEG
IC REPO
RTG
OV
ERNA
NCE
FINA
NCIA
L STA
TEMEN
TS
11Hornby PLC Annual Report and Accounts 2017
Net cash at 31 March 2017 was £1.5 million (2016: net debt of £7.2 million). This reflects the steps we have taken to strengthen the financial position of the Group by raising £8.0 million additional equity (£7.5 million net proceeds), reducing stock levels to a more normal level (£4.0 million cash inflow), the sale of the Margate and Spanish properties (raised £3.3 million) and other improvements to working capital (excluding stock) of £2.5 million. These cash inflows have been offset by the cash impact of underlying operating losses and exceptional items incurred during the year.
First stage of Turnaround Plan completedThe first stage of Hornby’s turnaround is now completed and the results of this series of initiatives are in line with the Board’s plan and expectations. The Group has restructured its UK and European operations, resulting in structural improvements to the cost base of around £4 million, and has re-engaged with its core independent retailer base as part of a repositioned sales channel strategy. The product range has been rationalised and refocused, which has allowed Hornby to reduce capital expenditure and improve working capital.
Reduce business scale and costsOur aim was to reduce activity levels in order to secure a return to profitability by focusing on the most profitable and cash-generative product lines and activities. We have made significant structural changes to the UK and European businesses over the past year, resulting in the planned reduction in the scale of the business.
Maintain key UK brandsBrand strength is at the heart of Hornby and our plan for the Group. As a result, we have retained our iconic UK brands (Hornby, Scalextric, Airfix, Humbrol and Corgi) by continuing to invest and develop new product lines. This was supported by around £2.0 million of capital investment this financial year (2016: £4.6 million) into new product tooling (£1.7 million) and enhancing our operational IT systems (£0.2 million).
Central to the strength of our brands was an increased focus on improving customer service to Hornby’s core hobby customers through the Independent sales channel. We spent considerable time visiting and listening to our customers. We believe that we have gone some way to addressing their concerns and we have committed to improving the relationships we have with them. As part of this commitment Hornby reduced the level of promotional activity direct to consumers via the internet and its own retail operations, with the aim of helping our independent retailers improve their businesses.
Streamlined European operating model and brandsThe European business is focusing on its most profitable International model rail brands and this resulted in full-year revenue from our international operations falling by £3.9 million, or 39% over the course of this financial year, in line with our plans as we transferred management functions to the UK. The process to centralise the European operations and product development in the UK was completed as planned.

12 Hornby PLC Annual Report and Accounts 2017
Chief Executive’s Report continued
Focused product rangeThe number of individual product lines was reduced by approximately 40% during 2016–17, resulting in the active management of approximately 1,400 profitable product lines in the 2017–18 financial year. We remain on track to deliver this streamlined product range over the coming year.
Refine channel strategy and exit concessionsWe have exited from most of the Group’s concession arrangements because of the poor historical returns from trading through this channel.
Careful management of stockWe reduced the level of stock progressively over the course of 2016–17 whilst being very careful to avoid disruption to underlying sales through existing channels. Stock at March 2017 was £9.7 million (2016: £13.6 million), with the reduction resulting from addressing historical stock issues and the exit from concessions.
Other developmentsAs well as delivering the Turnaround Plan, we have made progress across several important areas of the business over the last year.
Impact of exchange ratesThe Group purchases goods in US Dollars and sells in Pounds Sterling, Euros and US Dollars and is therefore exposed to exchange rate fluctuations. Significant fluctuations in exchange rates, particularly following the Brexit vote in June, could have a material effect on the Group’s future results. The Group continues to hedge its currency exposures through forward currency purchases using fixed rate and participating forward contracts up to twelve months ahead. This provided some price protection for the short-term impacts of Sterling revaluation, but we have needed to raise prices to cover increased product costs over the longer term.
Process improvementDuring the past year, we reviewed our core business processes and sought to strengthen them in several areas, including decision-making around new product development, product scheduling and sales forecasting. We have continued to enhance our ERP system, which is driving improvements in the quality of data provision in the business.
People and performanceWe have worked to ensure that Company objectives and newly created values have been cascaded down to teams and individuals to provide the necessary framework to ensure that all colleagues are aligned to deliver the Turnaround Plan.
Property updateOn 13 June 2016, the Group disposed of its building in Spain for consideration of £1.0 million. On 28 February 2017, the Group completed the sale of its site at Margate for a consideration of £2.25 million. The gain on disposal from the sale of these properties of £1.5 million was treated as an exceptional item, and £2.25 million of the proceeds was used to repay bank borrowings, in accordance with our banking agreement.
Immediate strategic prioritiesThe key priority for the immediate future is to move the business to sustainable profit and cash generation by the following key steps.
Building on the strong profitability of the Hornby, Airfix and Humbrol BrandsHornby, Airfix and Humbrol are three of our most profitable brands, which are particularly strong in serving our important hobby customers. There are significant opportunities to further improve the performance of these brands by continuing to improve execution, recovering lost market share, increasing margin and improving the brands’ appeal to new customers.
Improving Scalextric’s performanceThe Scalextric brand primarily delivers slot car sets to consumers through multiple retailers and as such is a relatively low margin business. There are significant opportunities to improve Scalextric margins and to carefully grow volumes through improved innovation and marketing support.
Growing our European and US businessesNow that fixed costs have been reduced by streamlining our European operations we are in a position to invest capital expenditure in new product tooling in order to deliver profitable growth in our high-margin model train business across the Jouef, Arnold and Rivarossi brands.
The US business has up to now not featured in the Turnaround Plan as it was not loss making. This business mostly distributes Scalextric, Airfix and Humbrol products, and is now embarking on a delivery of a profitable growth strategy under the leadership of a newly recruited Managing Director.

OV
ERVIEW
STRATEG
IC REPO
RTG
OV
ERNA
NCE
FINA
NCIA
L STA
TEMEN
TS
13Hornby PLC Annual Report and Accounts 2017
Further improving our customer serviceDuring stage one of the turnaround we re-engaged with our Independent retailers, improved relationships with National multiple retailers and increased our level of contact with hobby consumers through consumer shows. Continuing to prioritise improved customer service is a core part of our strategy.
We have also stopped using our brand websites to compete with our important retail customers and will increasingly use the brand websites to provide information, support and advice to both retail customers and consumers.
Further efficiencies from ongoing cost reductionWe will continue to build on the cost reductions delivered through structural changes made in the Group last year. A key area of strategic focus is reducing product costs in constant purchasing currency terms. We will achieve this by giving our suppliers greater visibility on our future production plans and thereby helping them plan more effectively and reduce costs. In addition, we are introducing a programme of continuous improvement to drive further reduction in operating costs.
Airfix added to its range of military aircraft, including the long-awaited Handley Page Victor B.2 in 1:72 scale, which was manufactured in the UK. Airfix QUICK BUILD also expanded, with the newly moulded VW Campervan, which has proven popular with VW enthusiasts and children alike.
Across our International train brands, we paid tribute to one of the biggest and most popular express passenger steam locomotives in France, Jouef’s version of the ‘241P’. Other notable releases included the ‘Class ‘95’ steamer in TT scale in Germany, Arnold’s ‘277’ Spanish electric locomotive in N scale and Rivarossi’s Grand Comfort coaches in Italy.
Outlook for 2017–18 and current tradingThe outlook for the medium term has improved now the first stage of the Turnaround Plan has been completed. Much remains to be done to return the business to sustainable profit and positive cash generation but we are confident that the changes delivered last year will underpin the progress we plan to make.
At this early stage in the year we remain on track to achieve the Board’s expectations for the year and we are confident we have the right plans in place to deliver shareholder value in the medium term.
Steve CookeChief Executive21 June 2017
Maximising return from iconic brandsWe will build the profile of our iconic brands by the use of selective licensing agreements into new product categories and markets.
Brand performanceOver the last year we have continued to release new products across all our brands. Hornby saw the release of a limited-edition Anniversary Pack of the Class 43 British Rail Intercity 125 High Speed Train celebrating 40 years of the iconic train.
Corgi released a range of classic James Bond models, whilst a newly tooled Electric Lightning in 1:48 scale has been well received by enthusiasts making it the first addition of a cold war jet in this size. Other notable releases included the Ride with Pride bus and a large selection of classic cars, including a stunning Sunbeam, which was launched at the Classic Motor Show in Birmingham alongside the full-size car.
Scalextric introduced a number of new sets to its range including, the popular supercars set Total Speed and Track Day ARC Air set with supercars McLaren P1 and Jaguar C-X75, as well as the Le Mans prototype set ahead of the world-famous endurance race in 2017. My First Scalextric set continued to be a key product for recruiting young racers. This year also marks Scalextric’s 60th Anniversary, celebrated by the release of seven special edition cars.

14 Hornby PLC Annual Report and Accounts 2017
Operating and Financial Review of the Year
PerformanceConsolidated revenue for the year ended 31 March 2017 was £47.4 million, a decrease of 15% compared to the previous year’s £55.8 million, as we reduced the scale of the business in line with the Turnaround Plan. Gross profit margin was slightly lower, as expected, at 38% (2016: 39%) from the planned stock reduction of discontinued product lines and the closure of concessions as a distribution channel.
Overheads reduced year-on-year by 11% as a result of the measures taken in the Turnaround Plan. UK distribution costs reduced slightly despite the larger volume of products being handled through Hersden, following the European logistics reorganisation, offset by lower R&D costs reflecting the lower level of new product development going forwards as the number of products is reduced. Sales and marketing costs reduced by £2.2 million year-on-year due to lower spend on TV advertising, the substantial exit from concessions leading to a reduction in concession commissions and an overall fall in activity due to the reduced scale of the business. Admin costs were £1.1 million lower, reflecting the structural changes made as part of the Turnaround Plan. Other operating expenses in the year of £0.4 million (2016: £0.7 million) include foreign exchange gains and losses and the amortisation of certain intangible assets (brand names and customer lists). Foreign exchange gains on trading transactions in the year totalled £0.3 million compared with gains of £0.8 million in the previous year.
The underlying loss before taxation is shown to present a clearer view of the trading performance of the business. Management identified the following non-trivial adjustments, whose inclusion in earnings could distort underlying trading performance: net foreign exchange (gains)/losses on intercompany loans which are dependent on exchange rates from time to time and can be volatile and amortisation of intangibles which result from historical acquisitions. Additionally, exceptional items including restructuring costs and impairments to goodwill add volatility and these are one-off items and therefore have also been added back in calculating underlying loss before taxation.
Financial Review2017 2016
Revenue £47.4m £55.8mGross profit £18.2m £21.8mGross profit margin 38% 39%Reported loss before tax £(9.5)m £(13.5)mUnderlying loss before tax1 £(6.3)m £(5.7)mReported loss after tax £(9.7)m £(13.7)mBasic loss per share (12.65)p (27.87)pUnderlying basic loss per share1 (9.26)p (13.02)pNet cash/(debt) £1.5m £(7.2)m
1 Stated before amortisation of intangibles (brands and customer lists), net unrealised foreign exchange movements on intercompany loans and exceptional items.

OV
ERVIEW
STRATEG
IC REPO
RTG
OV
ERNA
NCE
FINA
NCIA
L STA
TEMEN
TS
15Hornby PLC Annual Report and Accounts 2017
Group2017
£’0002016
£’000
Loss before taxation (9,509) (13,532)Net foreign exchange impact on intercompany loans (410) (389)Amortisation of intangibles 344 384Exceptional items:Restructuring costs 3,889 993Implementation of new ERP system – 1,174Refinancing costs 944 762Profit on disposal of property (1,530) (223)Impairment of property, plant and equipment – tooling – 1,158Impairment of goodwill – 3,990
Underlying loss before taxation (6,272) (5,683)
Pre-tax loss before net foreign exchange movements on intercompany loans, amortisation of intangible brands, restructuring costs, implementation of the new ERP system, refinancing costs, profit on disposal of property, impairment of tooling and impairment of goodwill (hereafter referred to as underlying loss before taxation) was £6.3 million (2016: loss of £5.7 million). The basic loss per share calculated on underlying loss before taxation (hereafter referred to as underlying basic loss per share) was (9.26)p (2016: (13.02)p).
A total of £3.2 million (2016: £7.8 million) of costs shown in the table above have been identified as outside our definition of the measure of underlying profit. These costs in the year included the net foreign exchange impact on intercompany loans (gain of £0.4 million), amortisation of
intangibles (£0.3 million) and exceptional items totalling £3.3 million. Of this total £0.1 million gain (2016: £5.1 million cost including impairment of goodwill and impairment of tooling) was the amortisation of intangible assets and the revaluation of intercompany loans, all of which are non-cash costs.
The exceptional items totalling £3.3 million (2016: £7.9 million) include restructuring costs (£3.9 million) relating to the streamlining of the European operations, reorganisation in the UK and the costs of running the Margate site during the period it was held for sale, costs relating to the 2016 equity issue and bank refinancing (£0.9 million) less the profit on the sale of the Margate and Spanish properties (£1.5 million).
Reported pre-tax loss was £9.5 million (2016: loss of £13.5 million) and reported basic loss per share was (12.61)p (2016: (27.87)p loss per share). The income tax charge for the year £0.2 million (2016: £0.2 million charge) arises mainly due to tax charge arising in Hornby Italy.
Segmental analysisDomestic third-party sales by the UK business fell by 11% in the year as business scale and costs were reduced.The underlying loss of £4.8 million, compared to £2.1 million underlying loss last year, reflects the transition of the UK business with the major structural changes undertaken over the past year impacting upon underlying trading. Sales by the European businesses fell by 39% in the year and generated an underlying loss of £1.1 million as the business was streamlined and many functions and activity were transferred to the UK. The US business’ sales grew by 14% on translation but were flat on a constant currency basis. The underlying trading loss of £0.3 million in the US was impacted by stock reduction and addressing ageing stock issues. Statement of Financial PositionProperty plant and equipment reduced year-on-year to £5.7 million from £7.2 million as depreciation of £3.0 million outweighed capital additions of £1.8 million, with disposals having a net impact of £0.4 million. Group inventories reduced significantly during the year due to the focus on stock reduction as part of the Turnaround Plan from £13.6 million to £9.7 million. Trade and other receivables reduced by 30% due to improved working

16 Hornby PLC Annual Report and Accounts 2017
Operating and Financial Review of the Year continued
capital management and due to the settlement of some large sales orders which were fulfilled just before the previous year end. Trade and other payables reduced by £0.7 million largely due to the reduced size of the business. The net effect of these factors was a reduction in working capital requirements of £7.0 million (a reduction of 37%). Overall investment in new tooling, new intangible computer software and other capital expenditure was £2.0 million (2016: £4.6 million).
DividendAs the Company continues to deliver on its Turnaround Plan the decision has again been taken not to pay a dividend (2016: nil). The Board continues to keep the dividend policy under review.
Financing and capital structureA Placing and Open Offer of 29,629,630 new ordinary shares at a price of 27p each, raising £7.5 million net of costs, was completed on 8 July 2016 with the funds being used to allow the business to pay down existing debt and to invest in the Turnaround Plan.
Borrowings in the year ended 31 March 2017 peaked towards the start of the year under the previous bank facility at £8.6 million. Since July 2016 the Company has operated within its new facility limit of £10 million, which stepped down to £7.75 million on 1 March 2017 following the sale of the Margate property.
The revolving credit facility of £7.75 million is in place until 31 December 2019 and is available for trading working capital and capital expenditure needs through to such date. The new facility has a margin of 3.5% over LIBOR and is subject to commitment and utilisation fees dependent on the level of drawings under the facility.
As is customary, the facility is subject to financial covenants, which the Group must comply with and which are to be tested quarterly. For the duration of the transition period of the Group’s new business plan through to December 2017, such financial covenants comprise a minimum EBITDA test and a current asset (stock and receivables) to net debt test. Thereafter, the financial covenants comprise customary leverage and interest cover financial covenants.
Net cash at 31 March 2017 was £1.5 million compared with net debt of £7.2 million at 31 March 2016 giving undrawn facilities and available cash of £9.2 million at 31 March 2017.
Property updateOn 13 June 2016, the Group disposed of its building in Spain for consideration of £1.0 million. The gain on disposal of £0.6 million was treated as an exceptional item.
On 28 February 2017, the Group completed the sale of its site at Margate for a consideration of £2.25 million. The gain on disposal from the sale of £0.9 million was treated as an exceptional item. The Group signed a leaseback of part of the site for the Hornby Visitors Centre and retail outlet.
Going concernThe Group has in place a £7.75 million banking facility with the Group’s bankers through to December 2019 and available net cash of £1.5 million at 31 March 2017.
The Group has prepared trading, and cash flow forecasts for a period of two years, which have been reviewed and approved by the Board. On the basis of these forecasts, its existing bank facility and after detailed review of trading, financial position and cash flow models, the Directors have a reasonable expectation that the Group has adequate resources to continue in operational existence for the foreseeable future. For these reasons, they continue to adopt the going concern basis of accounting in preparing the annual financial statements.

OV
ERVIEW
STRATEG
IC REPO
RTG
OV
ERNA
NCE
FINA
NCIA
L STA
TEMEN
TS
17Hornby PLC Annual Report and Accounts 2017
Our Key Performance Indicators (‘KPIs’)
The Directors are of the opinion that the financial KPIs are revenues, gross margins, underlying (loss)/profit before tax, (loss)/earnings per share and cash generation, the information for which is available in these financial statements and summarised on the financial highlights section earlier in this report. In monitoring the progress of delivery of the Turnaround Plan, management has put in place additional KPIs, such as the level of overhead savings and the amount of stock
reduction achieved, to monitor progress on the key elements of the plan, which are considered fundamental to performance during the transition period. The Board monitors progress against plan on a regular basis, adjusting future objectives annually in line with current circumstances.
Identification of principal risks and uncertaintiesThe Board has the primary responsibility for
Principal risks and uncertainties
identifying the major risks facing the Group and developing appropriate policies to manage those risks. The Board completes an annual risk assessment programme in order to identify the major risks and has reviewed and determined any mitigating actions required as set out below. The risk assessment has been completed in the context of the overall strategic objectives and the Turnaround Plan of the Group which has been set out on pages 10 to 13.
Risk Description Impact/sensitivity Mitigation/comment
Market conditions
The Group has competition in the model railway, slot racing, model kits, die cast and paint markets. Failure to recruit new customers, loss of market share to increased competitor activity or alternative hobbies would have a negative impact on the Group’s results. Failure to evolve and innovate products may lead to brands becoming less relevant in the marketplace.
The Group performance is impacted by the actions of competitors and changes in the wider retail landscape.
In many of our markets the Group enjoys a strong market position due to the continued development of our brands. Production of high-quality products which customers want is a key mitigating factor.
New business plan
New business plan may not fully achieve the aims of returning the Group to positive cash generation in 2017–18.
The reduction in business scale and costs, the reduction of the product lines, the requisite level of stock reduction, headcount reductions and/or the conversion of concession sales currently anticipated is not achieved and the Group does not achieve sustainable profit and cash generation.
The Group has developed clear targets and has cost-saving contingencies in the plan being actioned to put the necessary resources in place to deliver the aims of the plan.
Hobby market Overall decline in the hobby market could lead to greater levels of competition in the medium term, which could have a negative impact on the Group’s results.
Failing interest in traditional hobbies may impact our core Independent and National retailers and have a consequent impact upon the Group’s performance.
In many of our markets the Group enjoys a strong market position due to the continued development of our brands. Brands are extremely important in the model sector with market entry costs being prohibitive. In the short-term there is an opportunity to regain market share lost through previous underperformance.
Exchange rates The Group purchases goods in US Dollars and sells in Pounds Sterling, Euros and US Dollars and is therefore exposed to exchange rate fluctuations.
Significant fluctuations in exchange rates to which the Group is exposed could have a material adverse effect on the Group’s future results. In particular, the negative impact on Sterling of Brexit and the continuing uncertainties will make the US Dollar purchase of its goods more expensive.
The Group continues to hedge short-term exposures by establishing forward currency purchases using fixed rate and participating forward contracts up to twelve months ahead. It is deemed impractical to hedge exchange rate movements beyond that period. The Group has also sought to pass on the impact of exchange rate movements to customers through increased prices.

18 Hornby PLC Annual Report and Accounts 2017
Risk Description Impact/sensitivity Mitigation/comment
Supply chain The Group's products are manufactured by specialist labour in China and India.
The Group does not have exclusive arrangements with its suppliers and there is a risk that competition for manufacturing capacity could lead to delays in introducing new products or servicing existing demand.
The Group is continuing to develop and review its vendor portfolio. A 26-step critical path analysis tool has been developed to monitor the whole manufacturing process in order to identify and deal with issues as they arise.
Capital allocation
New tooling is important to support the manufacturing of new products.
The risk is that the Group has insufficient capital to fund new tooling or invests ineffectively in the wrong products.
The new business plan significantly reduced the number of product lines and refocused the business on profitable lines which generate higher gross margins. This process will be underpinned by a robust capital allocation process aligned to brand strategies and brand delivery targets.
Product compliance
The Group’s products are subject to compliance with toy safety legislation around the world.
Failure to comply could lead to a product recall, resulting in damage to Company and brand reputation, along with an adverse impact on the Group’s results.
Robust internal processes and procedures, active monitoring of proposed legislation and involvement in policy debate and lobbying of the relevant authorities.
Liquidity Insufficient financing to meet the needs of the business.
Without the appropriate level of financing it would be increasingly difficult to execute the Group’s business plans.
The Group has an undrawn revolving credit facility of £7.75 million expiring December 2019. The Group’s policy on liquidity risk is to maintain adequate facilities to meet the future needs of the business.
System and cyber risk
The Group continues to invest in the development of its website and implemented a new ERP system in 2015.
This exposes the business to greater risk of financial loss, disruption or damage to the reputation of an organisation from a failure of its information technology systems.
The Group has invested significant time and cost in the new website and ERP system in the last three years. The Group has dedicated web and ERP teams to monitor and maintain the Group’s systems and holds appropriate insurance policies to minimise material risk.
Talent and skills Recruitment, development and retention of talented people are key to the success of any business.
The Group fails to retain the necessary skills and talent to deliver the Group's plans.
Implementation of a new performance appraisal process to identify and manage skills and talent requirements. Competitive remuneration and training help with retention of employees.
Our Key Performance Indicators (‘KPIs’) continued
Main control proceduresManagement establishes control policies and procedures in response to each of the key risks identified. Control procedures operate to ensure the integrity of the Group’s financial statements, and are designed to meet the Group’s requirements and manage both financial and operational risks identified in each area of the business. Control procedures are documented where
appropriate and reviewed by management and the Board on an ongoing basis to ensure control weaknesses are mitigated.
The Group operates a comprehensive annual planning and budgeting system. The annual plans and budgets are approved by the Board. The Board reviews the management accounts at its monthly meetings and financial forecasts
are updated monthly and quarterly. Performance against budget is monitored and where any significant deviations are identified appropriate action is taken.
David MulliganGroup Finance Director21 June 2017

19Hornby PLC Annual Report and Accounts 2017
OV
ERVIEW
STRATEG
IC REPO
RTG
OV
ERNA
NCE
FINA
NCIA
L STA
TEMEN
TS
Directors and Corporate Information
Directors Roger CanhamExecutive Chairman
Steve CookeChief Executive
David MulliganGroup Finance Director
David AdamsNon-Executive Director
Martin GeorgeNon-Executive Director
Company SecretaryDavid Mulligan
Registered office3rd Floor The GatewayInnovation WayDiscovery ParkSandwich Kent CT13 9FF
Company Registered NumberRegistered in England Number: 01547390
Independent AuditorsPricewaterhouseCoopers LLPChartered Accountants and Statutory AuditorsThe Portland Building25 High StreetCrawleyWest Sussex RH10 1BG
SolicitorsBerwin Leighton Paisner LLPAdelaide HouseLondon BridgeLondon EC4R 9HA
Principal BankersBarclays Bank PLC9 St George’s StreetCanterburyKent CT1 2JX
Financial Advisers and BrokersNumis Securities LimitedThe London Stock Exchange Building10 Paternoster SquareLondon EC4M 7LT
Registrars and Transfer AgentsCapita Registrars LimitedThe Registry34 Beckenham RoadBeckenhamKent BR3 4TU
Left to right: David Adams, Martin George, Roger Canham, Steve Cooke and David Mulligan
20 Hornby PLC Annual Report and Accounts 2017
Director’s Report
The Directors present their Annual Report together with the audited consolidated and Company financial statements for the year ended 31 March 2017.
The Group’s business review, along with future developments and the principal risks and uncertainties facing the Group, is included in the Strategic Report.
PRINCIPAL ACTIVITIESThe Company is a holding company registered (and domiciled) in England Reg. No. 01547390 with a Spanish branch and has six operating subsidiaries: Hornby Hobbies Limited in the UK with a branch in Hong Kong, Hornby America Inc. in the US, Hornby Espana S.A. in Spain, Hornby Italia s.r.l in Italy, Hornby France S.A.S in France and Hornby Deutschland GmbH in Germany. Hornby PLC is a public limited company which is listed on the Alternative Investment Market (‘AIM’), and incorporated and operating in the UK. Its registered office is set out on 19.
The Group is principally engaged in the development, design, sourcing and distribution of hobby and interactive products.
RESULTS AND DIVIDENDSThe results for the year ended 31 March 2017 are set out in the Group Statement of Comprehensive Income on page 27. Revenue for the year was £47.4 million compared to £55.8 million last year. The loss for the year attributable to equity holders amounted to £9.8 million (2016: £13.7 million loss). The position of the Group and Company is set out in the Group and Company Statements of Financial Position on page 28. Future developments are set out within the Chief Executive Officer’s Report within the outlook paragraph on page 13.
No interim dividend was declared in the year (2016: £nil) and the Directors do not recommend a final dividend (2016: £nil).
Going concernThe Group has in place a £7.75 million banking facility with the Group’s bankers through to December 2019 and available net cash of £1.5 million at 31 March 2017.
The Group has prepared trading and cash flow forecasts for a period of two years, which have been reviewed and approved by the Board. On the basis of these forecasts, its existing bank facility and after detailed review of trading, financial position and cash flow models, the Directors have a reasonable expectation that the Group has adequate resources to continue in operational existence for the foreseeable future. For these reasons, they continue to adopt the going concern basis of accounting in preparing the annual financial statements.
RESEARCH AND DEVELOPMENTThe Board considers that research and development into products continues to play an important role in the Group’s success. R&D costs of £1.2 million (see note 4) incurred in the year have been charged to the Statement of Comprehensive Income and all of these costs relate to research costs.
DIRECTORSThe persons who were Directors during the year and up to the date of signing the financial statements are listed below:
Steve Cooke, aged 51, joined the Board on 13 July 2015 as Finance Director and on 26 April 2016 was appointed Chief Executive. Steve has significant financial and general management experience in both PLC and private environments. Previously, he was Finance Director at LSL Property Services PLC, COO at Bestinvest, CFO at Mapeley and CFO at Energis, where he was part of the successful turnaround team. Having qualified with Coopers & Lybrand, Steve was a strategy consultant with OC&C before spending time in senior financial and general management roles at Sainsbury’s, Homebase and B&Q.
David Mulligan, aged 47, was appointed to the Board on 25 May 2016. David was formerly Group Finance Director at construction and regeneration company Morgan Sindall Group plc. More recently he was Municipal FD at Renewi plc. Prior to this he worked at Smiths Group plc and trained as a chartered accountant at Ernst & Young.
Roger Canham, aged 51, was appointed to the board on 7 November 2012 and became Chairman on 1 February 2013. Roger has been Chairman of Phoenix Asset Management Partners Limited (‘Phoenix’) since 2009 and also owns and manages a number of property development companies. Roger was recently Chairman of CPP Group until May 2016. Prior to that, he was a Non-Executive Director of Goshawk Insurance Holdings PLC from 2007 until the business was acquired in 2008, and a Director of Brake Bros Limited for a year following its acquisition of W. Pauley & Co Limited in 2002. Mr Canham joined W. Pauley & Co Limited in 1990 and became Managing Director in 1996.
David Adams, aged 62, was appointed a Non-Executive Director on 9 January 2014. David’s current Plc appointments are; Chairman of Conviviality Plc, Non-Executive Director at Halfords Plc, Fever Tree Drinks Plc, Elegant Hotels Plc and Thinksmart Plc. David chairs the Audit Committees at Halfords, Fever Tree Drinks and Thinksmart, and the Remuneration Committee at Elegant Hotels. Prior to this David was CFO and Deputy CEO at House of Fraser and Executive Chairman at Jessops and has held a number of Non-Executive roles in retail and consumer businesses. In addition, he is a Trustee of Walk the Walk, a breast cancer charity.
21Hornby PLC Annual Report and Accounts 2017
OV
ERVIEW
STRATEG
IC REPO
RTG
OV
ERNA
NCE
FINA
NCIA
L STA
TEMEN
TS
Martin George, aged 54, was appointed as a Non-Executive Director on 22 December 2016. Martin has extensive experience in marketing and commercial roles and is currently Chairman of Grays International Limited. He was previously Chief Commercial Officer of The Post Office Limited, Non-Executive Director at Thorntons plc, Group Development Director and Group Marketing Director at BUPA and Commercial Director at British Airways.
Charlie Caminada, aged 57, was appointed to the Board on 9 January 2014. Charlie resigned on 22 December 2016.
The interests of the Directors in the shares of the Company and in options granted over such shares are disclosed on pages 23 and 24 of this Report.
DIRECTORS’ INDEMNITIESThe Company maintained liability insurance for its Directors and officers during the financial year and up to the date of approval of the Annual Report and Accounts. The Company has also provided an indemnity for its Directors and the secretary, which is a qualifying third-party indemnity provision for the purposes of the Companies Act 2006.
SUBSTANTIAL SHAREHOLDINGSThe Company has been notified that at close of business on 16 June 2017 the following parties were interested in 3% or more of the Company’s ordinary share capital.
ShareholderNumber of
ordinary sharesPercentage
held
Phoenix Asset Management Partners Limited 29,022,877 34.31
New Pistoia Income Limited 17,641,141 20.86Ruffer LLP 11,158,989 13.19Downing LLP 5,529,714 6.54Artemis Fund Managers Limited 3,000,000 3.55Hargreave Hale 2,840,595 3.36
STATEMENT OF DIRECTORS’ RESPONSIBILITIESThe Directors are responsible for preparing the Annual Report and the financial statements in accordance with applicable law and regulation.
Company law requires the Directors to prepare financial statements for each financial year. Under that law the Directors have prepared the Group and Company financial statements in accordance with International Financial Reporting Standards (‘IFRSs’) as adopted by the European Union. Under Company law the Directors must not approve the financial statements unless they are satisfied that they give a true and fair view of the state of affairs of the Group and Company and of the profit or loss of the Group and Company for that period.
In preparing the financial statements, the Directors are required to:• select suitable accounting policies and then apply them
consistently;• state whether applicable IFRSs as adopted by the European
Union have been followed, subject to any material departures disclosed and explained in the financial statements;
• make judgements and accounting estimates that are reasonable and prudent; and
• prepare the financial statements on the going concern basis unless it is inappropriate to presume that the Group and Company will continue in business.
The Directors are responsible for keeping adequate accounting records that are sufficient to show and explain the Group’s and Company’s transactions and disclose with reasonable accuracy at any time the financial position of the Group and Company and enable them to ensure that the financial statements comply with the Companies Act 2006 and, as regards the Group financial statements, Article 4 of the IAS Regulation.
The Directors are also responsible for safeguarding the assets of the Group and Company and hence for taking reasonable steps for the prevention and detection of fraud and other irregularities.
The Directors are responsible for the maintenance and integrity of the Company’s website. Legislation in the UK governing the preparation and dissemination of financial statements may differ from legislation in other jurisdictions.
The Directors consider that the annual report and accounts, taken as a whole, is fair, balanced and understandable and provides the information necessary for shareholders to assess the Group’s and Company’s performance, business model and strategy.
Each of the Directors, whose names and functions are listed in the Directors’ Report, confirm that, to the best of their knowledge:• the Group and Company financial statements, which have been
prepared in accordance with IFRSs as adopted by the European Union, give a true and fair view of the assets, liabilities, financial position and loss of the Group and loss of the Company; and
• the Chief Executive’s Report includes a fair review of the development and performance of the business and the position of the Group and Company, together with a description of the principal risks and uncertainties that it faces.
In the case of each Director in office at the date the Directors’ Report is approved:• so far as the Director is aware, there is no relevant audit
information of which the Group’s and Company’s auditors are unaware; and
• they have taken all the steps that they ought to have taken as a Director in order to make themselves aware of any relevant audit information and to establish that the Group’s and Company’s auditors are aware of that information.

22 Hornby PLC Annual Report and Accounts 2017
Director’s Report continued
FINANCIAL INSTRUMENTSThe Group’s financial instruments, other than derivatives, comprise borrowings, cash and liquid resources, and various items, such as trade receivables, trade payables etc. that arise directly from its operations. The Group’s financial liabilities comprise borrowings, trade payables, other payables and finance leases. The main purpose of the Group’s borrowings is to provide finance for the Group’s operations. The Group has financial assets comprising cash and trade and other receivables.
The Group also enters into derivatives transactions (principally forward foreign currency contracts). The purpose of such transactions is to manage the currency risks arising from the Group’s operations. It is, and has been throughout the period under review, the Group’s policy that no speculative trading in financial instruments shall be undertaken.
FINANCIAL RISK MANAGEMENTThe financial risk is managed by the Group and more information on this can be found within the Notes to the Financial Statements on page 36.
PERSONNEL POLICIESHornby is committed to eliminating discrimination and encouraging diversity amongst our workforce. Our aim is that our workforce will be truly representative of all sections of society and each employee feels respected and able to give of their best.
To that end the purpose of personnel policies are to provide equality and fairness for all in our employment and not to discriminate on grounds of gender, marital status, race, ethnic origin, colour, nationality, national origin, disability, sexual orientation, religion or age. We oppose all forms of unlawful and unfair discrimination.
All employees, whether part-time, full-time or temporary, are treated fairly and with respect. Selection for employment, promotion, training or any other benefit is on the basis of aptitude and ability. All employees are helped and encouraged to develop their full potential and the talents and resources of the workforce are fully utilised to maximise the efficiency of the organisation.
Our commitments are:• To create an environment in which individual differences and the
contributions of all our staff are recognised and valued;• Every employee is entitled to a working environment that
promotes dignity and respect to all. No form of intimidation, bullying or harassment is tolerated;
• Training, development and progression opportunities are available to all staff;
• Equality in the workplace is good management practice and makes sound business sense;
• To regularly review all our employment practices and procedures to ensure fairness;
• Breaches of our equality policy are regarded as misconduct and may lead to disciplinary proceedings; and
• These policies will be monitored and reviewed on a regular basis.
The Group places importance on the contributions made by all employees to the progress of the Group and aims to keep them informed via formal and informal meetings. One of the Company’s incentive schemes includes share scheme options for Directors and senior management, further details of which are covered on page 23.
SHARE CAPITALThe share capital of the Company comprises ordinary shares of 1p each. Each share carries the right to one vote at general meetings of the Company. The issued share capital of the Company, together with movements in the Company’s issued share capital, is shown in note 21.
INDEPENDENT AUDITORSDuring the year the Board retendered the audit engagement following the retirement by rotation of the Senior Statutory Auditor. Following a market review and presentations from three audit firms, PricewaterhouseCoopers LLP were reappointed as the Company’s auditors. A resolution to reappoint the auditors, PricewaterhouseCoopers LLP, will be proposed at the forthcoming Annual General Meeting.
ANNUAL GENERAL MEETING The Annual General Meeting is to be scheduled for early September 2017. A notice of the Annual General Meeting will be sent out to shareholders separately to this Annual Report and Accounts.
DIRECTORS’ REMUNERATIONExecutive Directors’ base salaries are reviewed annually by the Committee taking into account the responsibilities, skills and experience of each individual, pay and employment conditions within the Company and salary levels within listed companies of a similar size.
OV
ERVIEW
STRATEG
IC REPO
RTG
OV
ERNA
NCE
FINA
NCIA
L STA
TEMEN
TS
23Hornby PLC Annual Report and Accounts 2017
The following table summarises the total salary and pension contributions received by Directors for 2016–17 and 2015–16 in line with the Companies Act 2006 requirement:
AUDITED
Year ended 31 March 2017 Year ended 31 March 2016Basic salary, allowances
and fees £’000
Pension contributions
£’000Bonus £’000
Total salary and pension contributions
£’000
Basic salary, allowances
and fees £’000
Pension contributions
£’000
Total salary and pension contributions
£’000
S Cooke (Appointed 10 June 2015) 283 51 148 482 170 32 202D Mulligan (Appointed 26 May 2016) 184 18 65 267 – – –R Canham 100 – – 100 100 – 100D Adams 40 – – 40 40 – 40M George (Joined 22 December 2016) 11 – – 11 – – –C Caminada (Resigned 22 December 2016) 1061 – – 106 40 – 40R Ames (Resigned 12 February 2016) – – – – 3732 53 426N Stone (Resigned 10 June 2015) – – – – 1483 21 169
Total 724 69 213 1,006 871 106 977
1 From 1 April 2016 C Caminada received a salary of £144,000 per annum until 30 September 2016 when he returned to his non-executive role and associated salary of £40,000 per annum until his resignation. Additionally, included within the basic salary and fees is compensation for loss of office totalling £20,000.
2 Included within the basic salary and fees is compensation for loss of office totalling £96,0003 Included within the basic salary and fees is compensation for loss of office totalling £36,000
Performance Share Plan (‘PSP’) awards outstandingAt 31 March 2017, outstanding awards to Directors under the PSP were as follows:
Director Award date Vesting dateMarket price at
award date At 1 April 2016Awarded during
year Lapsed
during yearVested
during yearAt 31 March
2017
S Cooke Aug 2015 Aug 2018 105.0p 190,476 – – – 190,476Dec 2016 Mar 2019 29.0p – 2,136,752 – – 2,136,752
R Canham July 2013 July 2016 81.5p 122,699 – 122,699 – –
Dec 2016 Mar 2019 29.0p – 170,940 – – 170,940D Mulligan Dec 2016 Mar 2019 29.0p – 598,290 – – 598,290
For the 2013 awards the outstanding awards lapsed during the year.
For the 2015 awards, 40% of an award is subject to a TSR condition and 60% is subject to an EPS performance condition, both of which are measured over a period of three financial years. For the TSR condition, 25% of this part of the award will vest if Hornby’s TSR is equal to the TSR of the median company of the constituents of the FTSE Small Cap (struck at the date of grant), with full vesting for top quartile performance, with a sliding scale operating between these points. For the EPS part of the award, 25% vests for average annual underlying EPS growth of RPI+3% per annum, with full vesting for average annual EPS growth of RPI+12% per annum. A sliding scale operates between these points.
For the 2016 awards, the award is subject to a TSR condition which are measured over a period of three financial years from 1 April 2016 to 31 March 2019. For the TSR condition, 25% of the award will vest if Hornby’s TSR is equal to 15% compound annual growth each year, 75% vesting for 25% compound annual growth each year, with full vesting for 35% compound annual growth each year, with a sliding scale operating between these points. Additionally, for the award to vest, in the year ending 31 March 2019 operating cash flow has to be positive and profit before tax has to equal or exceed £1.5 million.

24 Hornby PLC Annual Report and Accounts 2017
Director’s Report continued
Benefits and pensionPolicies concerning benefits, including the Group’s company car policy, are reviewed periodically. Currently, benefits in kind comprise motor cars or a travel allowance and private health cover, both of which are non-performance-related. The Executive Directors and senior managers are members of defined contribution pension schemes and annual contributions are calculated by reference to base salaries, with neither annual bonuses nor awards under the share incentive schemes taken into account in calculating the amounts due. The contribution level continues to be 20% of base salary for Executive Directors, which can be taken as a cash allowance as an alternative.
Executive Directors’ service contracts The Executive Directors do not have fixed-period contracts.
Payments to past Directors, policy on payment of loss of office and termination paymentsPayments totalling £287,540 were made to Richard Ames under his settlement agreement during the year up until August 2017. There were no other payments to past Directors made during the year. Notice periods are set under individual service contracts but the Company has a policy for Executive Director of a notice period of nine months to be given by the Company and of six months to be given by the individual. The compensation for loss of office is based upon the respective service contracts and the components are based on the base salary of the Director. Any outstanding awards under the Company’s PSP share scheme are subject to good leaver provisions under the scheme’s rules. Under certain circumstances and subject to certain criteria the Remuneration Committee has the power to determine the vesting of any outstanding awards.
DIRECTORS’ INTERESTSInterests in sharesIn addition to their interests in shares in the Performance Share Plan, the interests of the Directors in the shares of the Company at 31 March 2017 were:
At 31 March 2017
number
At 31 March 2016
number
Executive DirectorsS Cooke 97,000 –D Mulligan – N/A
Non-Executive DirectorsR Canham 40,000 40,000D Adams 22,500 10,000M George – N/A
All the interests detailed above are beneficial. Apart from the interests disclosed above no Directors were interested at any time in the year in the share capital of any other Group company. Roger Canham is also the chairman of Phoenix Asset Management Partners Limited, who hold a substantial shareholding in Hornby PLC.
On behalf of the Board
David MulliganGroup Finance Director3rd Floor The GatewayInnovation WayDiscovery ParkSandwich Kent CT13 9FF21 June 2017

25Hornby PLC Annual Report and Accounts 2017
OV
ERVIEW
STRATEG
IC REPO
RTG
OV
ERNA
NCE
FINA
NCIA
L STA
TEMEN
TS
Independent Auditors’ Report to the Members of Hornby PLC
REPORT ON THE FINANCIAL STATEMENTS Our opinionIn our opinion, Hornby PLC’s Group financial statements and Company financial statements (the ‘financial statements‘):• give a true and fair view of the state of the Group’s and of the
Company’s affairs as at 31 March 2017 and of the Group’s and the Company’s loss and cash flows for the year then ended;
• have been properly prepared in accordance with International Financial Reporting Standards (‘IFRSs’) as adopted by the European Union; and
• have been prepared in accordance with the requirements of the Companies Act 2006.
What we have auditedThe financial statements, included within the Annual Report (the ‘Annual Report’), comprise:• the Group and Company Statements of Financial Position as at
31 March 2017;• the Group and Company Statements of Comprehensive Income
for the year then ended;• the Group and Company Cash Flow Statements for the year then
ended;• the Group and Company Statements of Changes in Equity for the
year then ended; and• the Notes to the Financial Statements, which include a summary
of significant accounting policies and other explanatory information.
Certain required disclosures have been presented elsewhere in the Annual Report, rather than in the Notes to the Financial Statements. These are cross-referenced from the financial statements and are identified as audited.
The financial reporting framework that has been applied in the preparation of the financial statements is IFRSs as adopted by the European Union, and applicable law.
In applying the financial reporting framework, the Directors have made a number of subjective judgements, for example in respect of significant accounting estimates. In making such estimates, they have made assumptions and considered future events.
Opinions on other matters prescribed by the Companies Act 2006In our opinion, based on the work undertaken in the course of the audit:• the information given in the Strategic Report and the Directors’
Report for the financial year for which the financial statements are prepared is consistent with the financial statements; and
• the Strategic Report and the Directors’ Report have been prepared in accordance with applicable legal requirements.
In addition, in light of the knowledge and understanding of the Group, the Company and their environment obtained in the course of the audit, we are required to report if we have identified any material misstatements in the Strategic Report and the Directors’ Report. We have nothing to report in this respect.
Other matters on which we are required to report by exceptionAdequacy of accounting records and information and explanations received Under the Companies Act 2006 we are required to report to you if, in our opinion:• we have not received all the information and explanations we
require for our audit; or• adequate accounting records have not been kept by the
Company, or returns adequate for our audit have not been received from branches not visited by us; or
• the Company financial statements are not in agreement with the accounting records and returns.
We have no exceptions to report arising from this responsibility.
Directors’ remunerationUnder the Companies Act 2006 we are required to report to you if, in our opinion, certain disclosures of Directors’ remuneration specified by law are not made. We have no exceptions to report arising from this responsibility.
Responsibilities for the financial statements and the auditOur responsibilities and those of the DirectorsAs explained more fully in the Statement of Directors’ Responsibilities, the Directors are responsible for the preparation of the financial statements and for being satisfied that they give a true and fair view.
Our responsibility is to audit and express an opinion on the financial statements in accordance with applicable law and International Standards on Auditing (UK and Ireland) (‘ISAs (UK and Ireland)’). Those standards require us to comply with the Auditing Practices Board’s Ethical Standards for Auditors.
This report, including the opinions, has been prepared for and only for the Company’s members as a body in accordance with Chapter 3 of Part 16 of the Companies Act 2006 and for no other purpose. We do not, in giving these opinions, accept or assume responsibility for any other purpose or to any other person to whom this report is shown or into whose hands it may come save where expressly agreed by our prior consent in writing.

26 Hornby PLC Annual Report and Accounts 2017
What an audit of financial statements involvesWe conducted our audit in accordance with ISAs (UK and Ireland). An audit involves obtaining evidence about the amounts and disclosures in the financial statements sufficient to give reasonable assurance that the financial statements are free from material misstatement, whether caused by fraud or error. This includes an assessment of: • whether the accounting policies are appropriate to the Group’s
and the Company’s circumstances and have been consistently applied and adequately disclosed;
• the reasonableness of significant accounting estimates made by the Directors; and
• the overall presentation of the financial statements.
We primarily focus our work in these areas by assessing the Directors’ judgements against available evidence, forming our own judgements, and evaluating the disclosures in the financial statements.
We test and examine information, using sampling and other auditing techniques, to the extent we consider necessary to provide a reasonable basis for us to draw conclusions. We obtain audit evidence through testing the effectiveness of controls, substantive procedures or a combination of both.
In addition, we read all the financial and non-financial information in the Annual Report to identify material inconsistencies with the audited financial statements and to identify any information that is apparently materially incorrect based on, or materially inconsistent with, the knowledge acquired by us in the course of performing the audit. If we become aware of any apparent material misstatements or inconsistencies we consider the implications for our report. With respect to the Strategic Report and Directors’ Report, we consider whether those reports include the disclosures required by applicable legal requirements.
Graham Lambert (Senior Statutory Auditor)for and on behalf of PricewaterhouseCoopers LLPChartered Accountants and Statutory AuditorsGatwick21 June 2017
Independent Auditors’ Report to the Members of Hornby PLC continued

OV
ERVIEW
STRATEG
IC REPO
RTG
OV
ERNA
NCE
FINA
NCIA
L STA
TEMEN
TS
27Hornby PLC Annual Report and Accounts 2017
Group and Company Statements of Comprehensive Income for the Year Ended 31 March 2017
Group Company
Note2017
£’0002016
£’0002017
£’0002016
£’000
Revenue 2 47,420 55,757 1,370 1,453Cost of sales (29,270) (33,992) – –Gross profit 18,150 21,765 1,370 1,453Distribution costs (8,419) (8,441) – –Selling and marketing costs (10,294) (12,472) – –Administrative expenses (5,680) (6,814) (1,264) (1,001)Other operating expenses 358 692 – 49Operating Loss before exceptional items (5,885) (5,270) 106 501Exceptional items (3,303) (7,854) (5,801) (9,511)Operating loss 2 (9,188) (13,124) (5,695) (9,010)Finance income 3 5 21 175 174Finance costs 3 (326) (429) (205) (181)Net finance expense 3 (321) (408) (30) (7)Loss before taxation 4 (9,509) (13,532) (5,725) (9,017)Income tax (charge)/credit 5 (157) (182) 100 (68)Loss for the year after taxation (9,666) (13,714) (5,625) (9,085)Other comprehensive incomeItems that may be subsequently reclassified to profit or loss:Cash flow hedges, net of tax (452) 20 – –Currency translation differences 15 (127) (390) (401)Other comprehensive expense for the year, net of tax (437) (107) (390) (401)Total comprehensive loss for the year (10,103) (13,821) (6,015) (9,486)Loss per ordinary shareBasic 7 (12.65)p (27.87)pDiluted 7 (12.65)p (27.87)p
All results relate to continuing operations.
The notes on pages 31 to 60 form part of these accounts.
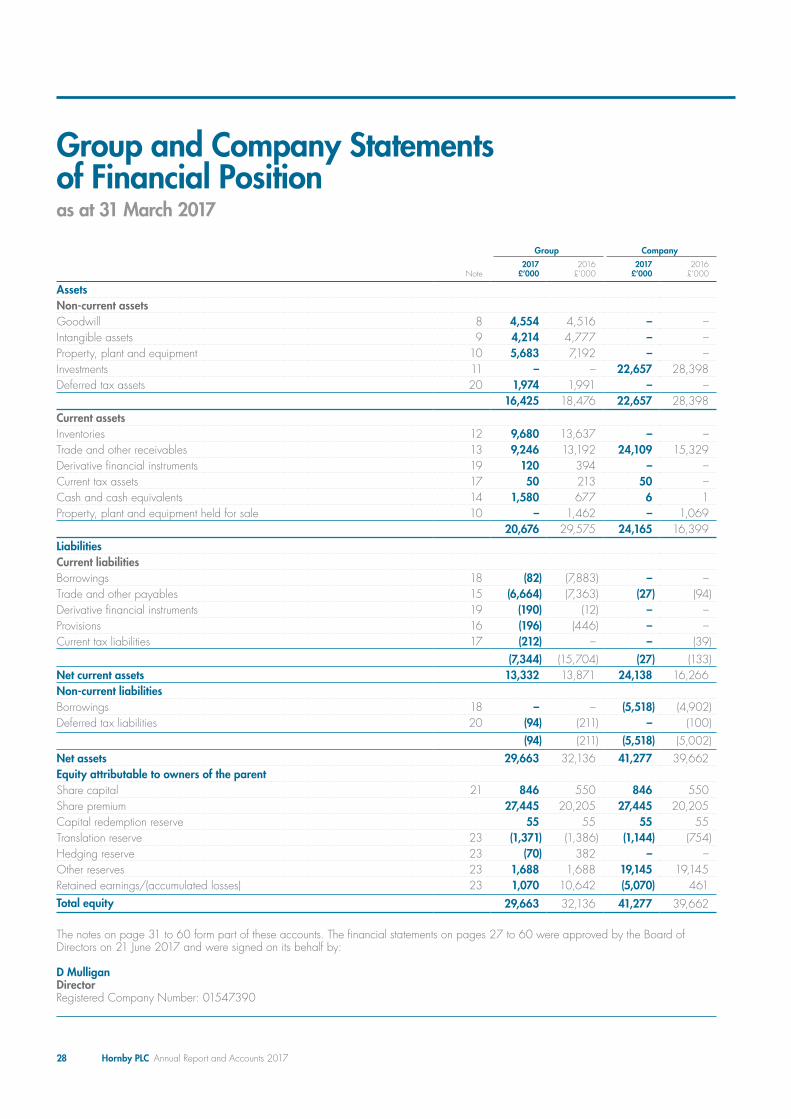
28 Hornby PLC Annual Report and Accounts 2017
Group and Company Statements of Financial Position as at 31 March 2017
Group Company
Note2017
£’0002016
£’0002017
£’0002016
£’000
AssetsNon-current assetsGoodwill 8 4,554 4,516 – –Intangible assets 9 4,214 4,777 – –Property, plant and equipment 10 5,683 7,192 – –Investments 11 – – 22,657 28,398Deferred tax assets 20 1,974 1,991 – –
16,425 18,476 22,657 28,398Current assetsInventories 12 9,680 13,637 – –Trade and other receivables 13 9,246 13,192 24,109 15,329Derivative financial instruments 19 120 394 – –Current tax assets 17 50 213 50 –Cash and cash equivalents 14 1,580 677 6 1Property, plant and equipment held for sale 10 – 1,462 – 1,069
20,676 29,575 24,165 16,399Liabilities Current liabilitiesBorrowings 18 (82) (7,883) – –Trade and other payables 15 (6,664) (7,363) (27) (94)Derivative financial instruments 19 (190) (12) – –Provisions 16 (196) (446) – –Current tax liabilities 17 (212) – – (39)
(7,344) (15,704) (27) (133)Net current assets 13,332 13,871 24,138 16,266Non-current liabilities Borrowings 18 – – (5,518) (4,902)Deferred tax liabilities 20 (94) (211) – (100)
(94) (211) (5,518) (5,002)Net assets 29,663 32,136 41,277 39,662Equity attributable to owners of the parentShare capital 21 846 550 846 550Share premium 27,445 20,205 27,445 20,205Capital redemption reserve 55 55 55 55Translation reserve 23 (1,371) (1,386) (1,144) (754)Hedging reserve 23 (70) 382 – –Other reserves 23 1,688 1,688 19,145 19,145Retained earnings/(accumulated losses) 23 1,070 10,642 (5,070) 461Total equity 29,663 32,136 41,277 39,662
The notes on page 31 to 60 form part of these accounts. The financial statements on pages 27 to 60 were approved by the Board of Directors on 21 June 2017 and were signed on its behalf by:
D MulliganDirectorRegistered Company Number: 01547390
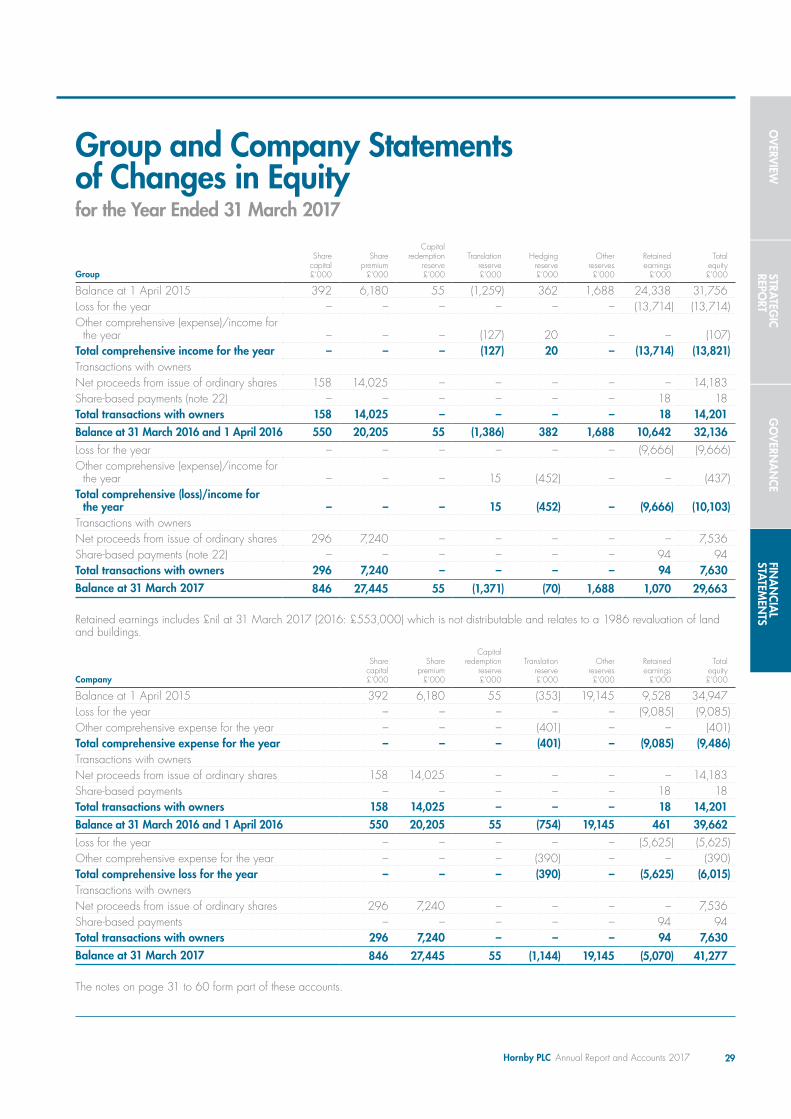
OV
ERVIEW
STRATEG
IC REPO
RTG
OV
ERNA
NCE
FINA
NCIA
L STA
TEMEN
TS
29Hornby PLC Annual Report and Accounts 2017
Group and Company Statements of Changes in Equityfor the Year Ended 31 March 2017
Group
Share capital £’000
Share premium
£’000
Capital redemption
reserve £’000
Translation reserve £’000
Hedging reserve £’000
Other reserves £’000
Retained earnings
£’000
Total equity £’000
Balance at 1 April 2015 392 6,180 55 (1,259) 362 1,688 24,338 31,756Loss for the year – – – – – – (13,714) (13,714)Other comprehensive (expense)/income for
the year – – – (127) 20 – – (107)Total comprehensive income for the year – – – (127) 20 – (13,714) (13,821)Transactions with ownersNet proceeds from issue of ordinary shares 158 14,025 – – – – – 14,183Share-based payments (note 22) – – – – – – 18 18Total transactions with owners 158 14,025 – – – – 18 14,201Balance at 31 March 2016 and 1 April 2016 550 20,205 55 (1,386) 382 1,688 10,642 32,136Loss for the year – – – – – – (9,666) (9,666)Other comprehensive (expense)/income for
the year – – – 15 (452) – – (437)Total comprehensive (loss)/income for
the year – – – 15 (452) – (9,666) (10,103)Transactions with ownersNet proceeds from issue of ordinary shares 296 7,240 – – – – – 7,536Share-based payments (note 22) – – – – – – 94 94Total transactions with owners 296 7,240 – – – – 94 7,630Balance at 31 March 2017 846 27,445 55 (1,371) (70) 1,688 1,070 29,663
Retained earnings includes £nil at 31 March 2017 (2016: £553,000) which is not distributable and relates to a 1986 revaluation of land and buildings.
Company
Share capital £’000
Share premium
£’000
Capital redemption
reserve £’000
Translation reserve £’000
Other reserves £’000
Retained earnings
£’000
Total equity £’000
Balance at 1 April 2015 392 6,180 55 (353) 19,145 9,528 34,947 Loss for the year – – – – – (9,085) (9,085)Other comprehensive expense for the year – – – (401) – – (401)Total comprehensive expense for the year – – – (401) – (9,085) (9,486)Transactions with owners Net proceeds from issue of ordinary shares 158 14,025 – – – – 14,183 Share-based payments – – – – – 18 18 Total transactions with owners 158 14,025 – – – 18 14,201 Balance at 31 March 2016 and 1 April 2016 550 20,205 55 (754) 19,145 461 39,662 Loss for the year – – – – – (5,625) (5,625)Other comprehensive expense for the year – – – (390) – – (390)Total comprehensive loss for the year – – – (390) – (5,625) (6,015)Transactions with owners Net proceeds from issue of ordinary shares 296 7,240 – – – – 7,536 Share-based payments – – – – – 94 94 Total transactions with owners 296 7,240 – – – 94 7,630 Balance at 31 March 2017 846 27,445 55 (1,144) 19,145 (5,070) 41,277
The notes on page 31 to 60 form part of these accounts.

30 Hornby PLC Annual Report and Accounts 2017
Group and Company Cash Flow Statementfor the Year Ended 31 March 2017
Group Company
Note2017
£’0002016
£’0002017
£’0002016
£’000
Cash flows from operating activitiesCash generated from/(used in) operations 28 91 (9,632) (1,080) 294Interest paid (326) (429) (205) (181)Tax received/(paid) 118 204 (89) 31Net cash (used in)/generated from operating activities (117) (9,857) (1,374) 144Cash flows from investing activitiesProceeds from sale of property, plant and equipment 3,338 349 2,248 342Purchase of property, plant and equipment 10 (1,756) (3,221) – –Purchase of intangible assets 9 (226) (1,341) – –Interest received 5 21 175 174Net cash generated from/(used in) investing activities 1,361 (4,192) 2,423 516Cash flows from financing activitiesProceeds from issuance of ordinary shares 8,000 15,000 8,000 15,000Repayments of loans (188) (35) – –Share issue costs (464) (817) (464) (817)Advances to subsidiary undertakings – – (8,580) (14,843)Repayments to subsidiary undertakings – – – –Net cash generated from/(used in) financing activities 7,348 14,148 (1,044) (660)
Net increase in cash and cash equivalents 8,592 99 5 –Cash, cash equivalents and bank overdrafts at beginning of the year (7,029) (7,247) 1 1Effect of exchange rate movements (65) 119 – –Cash, cash equivalents and bank overdrafts at end of year 1,498 (7,029) 6 1Cash, cash equivalents and bank overdrafts consist of:Cash and cash equivalents 14 1,580 677 6 1Bank overdrafts 18 (82) (7,706) – –Cash, cash equivalents and bank overdrafts at end of year 1,498 (7,029) 6 1

OV
ERVIEW
STRATEG
IC REPO
RTG
OV
ERNA
NCE
FINA
NCIA
L STA
TEMEN
TS
31Hornby PLC Annual Report and Accounts 2017
Notes to the Financial Statements
1. SIGNIFICANT ACCOUNTING POLICIESAccounting policies for the year ended 31 March 2017The principal accounting policies adopted in the preparation of these financial statements are set out below. These policies have been consistently applied to all the years presented, unless otherwise stated.
Basis of preparationThe financial information for the year ended 31 March 2017 has been prepared in accordance with International Financial Reporting Standards (‘IFRS’) as adopted by the European Union (‘EU’), IFRS Interpretations Committee (‘IFRS-IC’) interpretations and with those parts of the Companies Act 2006 applicable to companies reporting under IFRS. The consolidated Group and Parent Company financial statements have been prepared on a going concern basis and under the historical cost convention, as modified by the revaluation of certain financial assets and liabilities (including derivative instruments) at fair value through profit or loss. However, with regards to the Group, see below for details of material uncertainty.
The preparation of financial statements in conformity with IFRS requires the use of estimates and assumptions that affect the reported amounts of assets and liabilities at the date of the financial statements and the reported amounts of revenues and expenses during the reporting period. Although these estimates are based on management’s best knowledge of the amount, event or actions, actual results ultimately may differ from those estimates.
Going concernThe Group has in place a £7.75 million banking facility with the Group’s bankers through to December 2019 and available net cash of £1.5 million at 31 March 2017.
The Group has prepared trading and cash flow forecasts for a period of two years, which have been reviewed and approved by the Board. On the basis of these forecasts, its existing bank facility and after detailed review of trading, financial position and cash flow models, the Directors have a reasonable expectation that the Group has adequate resources to continue in operational existence for the foreseeable future. For these reasons, they continue to adopt the going concern basis of accounting in preparing the annual financial statements.
Basis of consolidationSubsidiaries are all entities over which the Group has the power to govern the financial and operating policies generally accompanying a shareholding of more than one-half of the voting rights. Subsidiaries are fully consolidated from the date on which control is transferred to the Group. They are deconsolidated from the date that control ceases.
The purchase method of accounting is used to account for the acquisition of subsidiaries by the Group. The cost of an acquisition is measured as the fair value of the assets given, equity instruments issued and liabilities incurred or assumed at the date of exchange, plus costs directly attributable to the acquisition. Identifiable assets acquired and liabilities and contingent liabilities assumed in a business combination are measured initially at their fair values at the acquisition date, irrespective of the extent of any non-controlling interest. The excess of the cost of acquisition over the fair value of the Group’s share of the identifiable net assets acquired is recorded as goodwill.
Intercompany transactions, balances and unrealised gains on transactions between Group companies are eliminated. Unrealised losses are also eliminated but considered an impairment indicator of the asset concerned. Accounting policies of subsidiaries have been changed where necessary to ensure consistency with the policies adopted by the Group.
Adoption of new and revised standards There are no standards, amendments to standards or interpretations that are both mandatory for the first time for the financial year ended 31 March 2017 and that have a material impact on the Group’s results.
The Group did not early adopt any standard, interpretation, or amendments published by the IASB and endorsed by the EU for which the mandatory application date is on or after 1 January 2016.
32 Hornby PLC Annual Report and Accounts 2017
Notes to the Financial Statements continued
The following new standards, interpretations, and amendments to standards and interpretations have been issued, subject to the EU endorsement, but are not effective for the financial year beginning on or after 1 January 2014 and have not yet been early adopted by the Group:
Effective date for periods beginning on or after
IFRS 9 ‘Financial Instruments’ 1 January 2018IFRS 15 ‘Revenue from Contracts with Customers’ 1 January 2018IFRS 16 ‘Leases’ 1 January 2019IAS 7 ‘Statement of cash flows’ 1 January 2017IAS 12 ‘Income Tax’ 1 January 2017Amendments to IFRS 10 and IAS 28 ‘Sale or Contribution of Assets between an Investor and its Associate
or Joint Venture’ 1 January 2016Amendments to IAS 1 ‘Presentation of Financial Statements’ 1 January 2016Amendments to IAS 27 ‘Equity Method in Separate Financial Statements’ 1 January 2016
IFRS 16 will replace the current guidance under IAS 17 and will have a significant impact on the accounting by lessees in particular. Under IAS 17, lessees were required to make a distinction between a finance lease (on balance sheet) and an operating lease (off balance sheet). IFRS 16 will require lessees to recognise a lease liability reflecting future lease payments and a ‘right-of-use asset’ for virtually all lease contracts. The adoption of IFRS 16 will have a material effect on the Hornby PLC financial statements by grossing up assets and liabilities by approximately £1 million; this will have an immaterial impact on the Statement of Comprehensive Income and no impact on the Group’s cash flow.
Revenue recognition Revenue is measured at the fair value of the sale of goods net of value added tax, rebates and discounts, royalty income and after eliminating sales within the Group.
Revenue is recognised as follows: (a) Sale of goods
Sales of goods are recognised when a Group entity has delivered products to the customer. The customer is either a trade customer or the consumer when sold through Hornby concessions in various retail outlets, or via the internet.
(b) Royalty income Royalty income is recognised on an accruals basis in accordance with the substance of the relevant agreements.
(c) Sales returns The Group establishes a sales returns provision at the period end that reduces revenue in anticipation of customer returns of goods sold in the period.
(d) Hornby Visitor Centre Revenue is generated from the ticket and product sales at our Visitor Centre in Margate and recognised at the point of sale.
Dividend income in the Company is recognised upon receipt. Management fees are recognised in the Company on an accruals basis in relation to costs incurred on behalf of subsidiary companies.
Exceptional items Where items of income and expense included in the statement of comprehensive income are considered to be material and exceptional in nature, separate disclosure of their nature and amount is provided in the financial statements. These items are classified as exceptional items. The Group considers the size and nature of an item both individually and when aggregated with similar items when considering whether it is material, for example impairment of intangible assets or restructuring costs.
Operating segmentsOperating segments are reported in a manner consistent with the internal reporting provided to the chief operating decision-maker. The chief operating decision-maker, who is responsible for allocating resources and assessing performance of the operating segments, has been identified as the Board of the Company that makes strategic decisions.
Operating profit of each reporting segment includes revenue and expenses directly attributable to or able to be allocated on a reasonable basis. Segment assets and liabilities are those operating assets and liabilities directly attributable to or that can be allocated on a reasonable basis.
Business combinationsGoodwill arising on a business combination before and after 1 April 2004, the date of transition to IFRS, is not subject to amortisation but tested for impairment on an annual basis. Intangible assets, excluding goodwill, arising on a business combination subsequent to 1 April 2004, are separately identified and valued, and subject to amortisation over their estimated economic lives.
1. SIGNIFICANT ACCOUNTING POLICIES continued
OV
ERVIEW
STRATEG
IC REPO
RTG
OV
ERNA
NCE
FINA
NCIA
L STA
TEMEN
TS
33Hornby PLC Annual Report and Accounts 2017
GoodwillGoodwill represents the excess of the cost of an acquisition over the fair value of the Group’s share of the net identifiable assets of the acquired subsidiary at the date of acquisition. Goodwill is tested annually for impairment and carried at cost less accumulated impairment losses. Impairment losses on goodwill are not reversed. Gains and losses on the disposal of an entity include the carrying amount of goodwill relating to the entity sold. Goodwill is allocated to cash-generating units for the purpose of impairment testing. The allocation is made to those cash-generating units or groups of cash-generating units that are expected to benefit from the business combination in which the goodwill arose identified according to operating segment. Goodwill is recorded in the currency of the cash generating unit to which it is allocated.
Intangibles(a) Brand names
Brand names, acquired as part of a business combination, are capitalised at fair value as at the date of acquisition. They are carried at their fair value less accumulated amortisation and any accumulated impairment losses. Amortisation is calculated using the straight-line method to allocate the fair value of brand names over their estimated economic life of 15–20 years. Brand names have been valued on a ‘relief from royalty’ basis.
(b) Customer lists Customer lists, acquired as part of a business combination, are capitalised at fair value as at the date of acquisition. They are carried at their fair value less accumulated amortisation and any accumulated impairment losses. Amortisation is calculated using the straight-line method to allocate the fair value of customer relationships over their estimated economic life of ten years. Customer lists have been valued according to discounted incremental operating profit expected to be generated from each of them over their useful lives.
(c) Computer software Computer software expenditure is capitalised at the value at the date of acquisition and depreciated over a useful economic life of 4–6 years.
Property, plant and equipmentLand and buildings are shown at cost less accumulated depreciation. Assets revalued prior to the transition to IFRS use this valuation as deemed cost at this date. Other property, plant and equipment are shown at historical cost less accumulated depreciation. Cost includes the original purchase price of the asset and the costs attributable to bringing the asset to its working condition for its intended use.
Depreciation is provided at rates calculated to write off the cost or valuation of each asset, on a straight-line basis (with the exception of tools and moulds) over its expected useful life to its residual value, as follows:
Freehold buildings – 30 to 50 yearsPlant and equipment – 5 to 10 yearsMotor vehicles – 4 years
Freehold land is not depreciated.
Tools and moulds are depreciated at varying rates in line with the related estimated product sales on an item-by-item basis up to a maximum of four years.
Impairment of non-current assetsAssets that have an indefinite useful life, for example goodwill, are not subject to amortisation and are tested annually for impairment. Assets that are subject to amortisation are reviewed for impairment when events or changes in circumstances indicate that the carrying value may not be recoverable. An impairment loss is recognised for the amount by which the asset’s carrying value exceeds its recoverable amount, which is considered to be the higher of its value in use and fair value less costs to sell. In order to assess impairment, assets are grouped into the lowest levels for which there are separately identifiable cash flows (cash-generating units). Cash flows used to assess impairment are discounted using appropriate rates taking into account the cost of equity and any risks relevant to those assets.
InvestmentsIn the Company’s financial statements, investments in subsidiary undertakings are stated at cost less any impairment. Investments revalued using the equity method of valuation prior to the transition to IFRS use this valuation as deemed cost at this date. Dividend income is shown separately in the Statement of Comprehensive Income.
InventoriesInventories are stated at the lower of cost and net realisable value. Cost is predominantly determined using the first-in, first-out (‘FIFO’) method. Alternative methods may be used when proven to generate no material difference. The cost of finished goods and work in progress comprises raw materials, direct labour, other direct costs and related production overheads (based on normal operating capacity).
Net realisable value is based on anticipated selling price less further costs expected to be incurred to completion and disposal. Provisions are made against those stocks considered to be obsolete or excess to requirements on an item-by-item basis.

34 Hornby PLC Annual Report and Accounts 2017
The replacement cost, based upon latest invoice prices before the balance sheet date, is considered to be higher than the balance sheet value of inventories at the year end due to price rises and exchange fluctuations. It is not considered practicable to provide an accurate estimate of the difference at the year end date.
Assets held for saleIndividual, formerly non-current assets, which are expected to be sold within the next twelve months, are measured at the lower of their carrying amount at the time they are reclassified and selling price less further costs expected to be incurred to disposal.
Trade receivablesTrade receivables are recognised initially at fair value and subsequently measured at amortised cost less provision for impairment. A provision for impairment is established when there is objective evidence that the Group will not be able to collect all amounts due according to the original terms of receivables. The amount of the provision is recognised in the Statement of Comprehensive Income.
Financial instrumentsFinancial assets and financial liabilities are recognised in the Group and Company Statements of Financial Position when the Group or Company becomes a party to the contractual provisions of the instrument.
Financial liabilities and equityFinancial liabilities and equity instruments are classified according to the substance of the contractual arrangements entered into.
An equity instrument is any contract that evidences a residual interest in the assets of the Group and Company after deducting all of its liabilities. Equity instruments issued by the Group and Company are recorded at the proceeds received, net of direct issue costs.
Sales returns provisions Provisions for sales returns are recognised when the Group has a constructive obligation as a result of a past event. Provisions for sales returns are measured at the present value of the expenditure expected to be required to settle the obligation.
Cash and cash equivalentsCash and cash equivalents for the purpose of the cash flow statement includes cash in hand, deposits at banks, other liquid investments with original maturities of three months or less and bank overdrafts. Bank overdrafts or loans where there is no right of set off are shown within borrowings in current or non-current liabilities on the balance sheet as appropriate.
Borrowing costsBorrowings are recognised initially at fair value, net of transaction costs incurred. Borrowings are subsequently carried at amortised cost; any difference between the proceeds (net of transaction costs) and the redemption value is recognised in the Statement of Comprehensive Income over the period of the borrowings using the effective interest method.
Fees paid on the establishment of loan facilities are recognised as transaction costs of the loan to the extent that it is probable that some or all of the facility will be drawn down. In this case, the fee is deferred until the draw-down occurs and subsequently amortised over the life of the facility. To the extent that there is no evidence that it is probable that some or all of the facility will be drawn down, the fee is capitalised as a prepayment for liquidity services and amortised over the period of the facility to which it relates.
Trade payablesTrade payables are recognised initially at fair value and subsequently measured at amortised cost using the effective interest method.
Taxation including deferred taxCorporation tax, where payable, is provided on taxable profits at the current rate.
The taxation liabilities of certain Group undertakings are reduced wholly or in part by the surrender of losses by fellow Group undertakings.
Deferred tax is provided on all temporary differences at the balance sheet date between the tax bases of assets and liabilities and their carrying amounts for financial reporting purposes.
Deferred tax assets are recognised for all deductible temporary differences, carry-forward of unused tax assets and unused tax losses, to the extent that it is probable that taxable profit will be available against which the deductible temporary differences, and the carry-forward of unused tax assets and unused tax losses can be utilised. The carrying amount of deferred income tax assets is reviewed at each balance sheet date and reduced to the extent that it is no longer probable that sufficient taxable profit will be available to allow all or part of the deferred income tax asset to be utilised.
1. SIGNIFICANT ACCOUNTING POLICIES continued
Notes to the Financial Statements continued
OV
ERVIEW
STRATEG
IC REPO
RTG
OV
ERNA
NCE
FINA
NCIA
L STA
TEMEN
TS
35Hornby PLC Annual Report and Accounts 2017
Deferred income tax assets and liabilities are offset when there is a legally enforceable right to offset current tax assets against current tax liabilities, and when the deferred income tax assets and liabilities relate to income taxes levied by the same taxation authority on either the taxable entity or different taxable entities where there is an intention to settle the balances on a net basis.
Deferred tax assets and liabilities are measured at the tax rates that are expected to apply to the year when the asset is realised or the liability is settled, based on tax rates (and tax laws) that have been enacted or substantively enacted at the balance sheet date. Tax relating to items recognised directly in equity is recognised in equity and not in the Statement of Comprehensive Income.
ProvisionsLiabilities and provisions are recognised when the Group has a present legal or constructive obligation as a result of past events and it is more likely than not that an outflow of resources will be required to settle the obligation and the amount has been reliably estimated. The expense relating to any liability or provision is presented in the Statement of Comprehensive Income net of any reimbursement but only if reimbursement is virtually certain and will be settled simultaneously.
Provisions are measured at the present value of management’s best estimate of the expenditure required to settle the present obligation at the balance sheet date. If material, provisions are determined by discounting the expected future cash flows of the Group at rates that reflect current market assessments of the time value of money.
Share-based paymentHornby PLC operates two share-based payment plans:• Share Option Scheme• Performance Share Plan
The Group issues equity-settled share-based payments to certain employees. Equity-settled share-based payments are measured at fair value (excluding the effect of non-market-based vesting conditions) at the date of grant. The fair value determined at the grant date of the equity-settled share-based payments is expensed on a straight-line basis over the vesting period, based on the Group’s estimate of shares that will eventually vest and adjusted for the effect of non-market-based vesting conditions.
The grant by the Company of options over its equity instruments to the employees of subsidiary undertakings in the Company is treated as a capital contribution. The fair value of employee services received, measured by reference to the grant date fair value, is recognised over the vesting period as an increase to investment in subsidiary undertakings, with a corresponding credit to equity.
Share Option SchemeFair value is measured by use of the Black-Scholes Stochastic model. The expected life used in the models has been adjusted, based on management’s best estimate, for the effects of non-transferability, exercise restrictions and behavioural considerations.
Performance Share PlanAwards are granted to Executive Directors in shares worth 100% of salary, with lower levels of grant for less senior executives.
The Performance Share Plan (‘PSP’) incorporates a two and a half year performance condition based on Total Shareholder Return (‘TSR’) applying to the award respectively and vesting on the two and a half year anniversary of grant as appropriate. The method applied in estimating the fair value of the ‘PSP’ awards is the Black-Scholes Stochastic model.
The TSR fair value is spread over the vesting period of the shares and recognised in the Statement of Comprehensive Income in the appropriate year.
Employee benefit costsDuring the year the Group operated a defined contribution money purchase pension scheme under which it pays contributions based upon a percentage of the members’ basic salary. The scheme is administered by trustees either appointed by the Company or elected by the members (to constitute one-third minimum).
Contributions to defined contribution pension schemes are charged to the Statement of Comprehensive Income according to the year in which they are payable.
Further information on pension costs and the scheme arrangements is provided in note 24.
Share capital and share premiumOrdinary shares issued are shown as share capital at nominal value. The premium received on the sale of shares in excess of the nominal value is shown as share premium within total equity.

36 Hornby PLC Annual Report and Accounts 2017
LeasesThe Group enters into operating leases only. Leases classed as operating leases are expensed on a straight-line basis to the Statement of Comprehensive Income over the lease term.
Financial risk managementFinancial risk factorsThe Group’s operations expose it to a variety of financial risks that include the effects of changes in foreign currency exchange rates, market interest rates, credit risk and its liquidity position. The Group has in place a risk management programme that seeks to limit adverse effects on the financial performance of the Group by using foreign currency financial instruments. In addition, other instruments are used to manage the Group’s interest rate exposure.
(a) Foreign exchange risk The Group is exposed to foreign exchange risks against Sterling primarily on transactions in US Dollars. It enters into forward currency contracts to hedge the cash flows of its product sourcing operation (i.e. it buys US Dollars forwards in exchange for Sterling) and looks forward six–twelve months on a rolling basis at forecasted purchase volumes. The policy framework requires hedging between 70% and 100% of anticipated import purchases that are denominated in US Dollars. The Company has granted Euro-denominated intercompany loans to subsidiary companies that are translated to Sterling at statutory period ends thereby creating exchange gains or losses. The loans to the subsidiaries, Hornby Deutschland GmbH, Hornby Italia s.r.l and Hornby France S.A.S are classified as long-term loans and therefore the exchange gains and losses on consolidation are reclassified to the translation reserve in Other Comprehensive Income as per IAS 21. The loan to the branch in Spain is classified as a long-term loan, however repayable on a shorter timescale than those of the other subsidiaries and therefore the exchange gains or losses are taken to Statement of Comprehensive Income.
(b) Interest rate risk The Group finances its operations through a mixture of retained profits and bank borrowings. The Group borrows, principally in Sterling, at floating rates of interest to meet short-term funding requirements. At the year end the Group’s borrowings comprised a revolving credit facility, bank overdrafts and a fixed-term loan agreement.
(c) Credit risk The Group manages its credit risk through a combination of internal credit management policies and procedures.
(d) Liquidity risk At 31 March 2017 the Group had a revolving credit facility of £7.75 million (2016: £10.0 million) expiring in December 2019 (2016: August 2019). Borrowings in the year ended 31 March 2017 peaked at £8.6 million. The funding needs are determined by monitoring forecast and actual cash flows. The Group regularly monitors its performance against its banking covenants to ensure compliance.
Derivative financial instrumentsTo manage exposure to foreign currency risk, the Group uses foreign currency forward contracts, also known as derivative financial instruments.
Derivatives are initially recognised at fair value on the date a derivative contract is entered into and are subsequently remeasured at their fair value. The Group documents at the inception of the transaction the relationship between hedging instruments and hedged items, as well as its risk management objective and strategy for undertaking various hedge transactions. The Group also documents its assessment, both at hedge inception and on an ongoing basis, of whether the derivatives that are used in hedging transactions are highly effective in offsetting changes in fair values of the hedged items.
(a) Cash flow hedge The effective portion of changes in the fair value of derivatives that are designated and qualify as cash flow hedges are recognised in Other Comprehensive Income. The gain or loss relating to the ineffective portion is recognised immediately in the Statement of Comprehensive Income within operating expenses. Amounts accumulated in Other Comprehensive Income are recycled in the Statement of Comprehensive Income in the periods when the hedged item affects profit or loss (for instance when the forecast purchase that is hedged takes place). The gain or loss relating to the effective portion of forward foreign exchange contracts hedging import purchases is recognised in the Statement of Comprehensive Income within ‘cost of sales’. However, when the forecast transaction that is hedged results in the recognition of a non-financial asset (for example, inventory) the gains and losses previously deferred in the Other Comprehensive Income are transferred from Other Comprehensive Income and included in the initial measurement of the cost of the asset. The deferred amounts are ultimately recognised in cost of goods sold in the case of inventory. When a hedging instrument expires or is sold, or when a hedge no longer meets the criteria for hedge accounting, any cumulative gain or loss existing in equity at that time remains in equity and is recognised in income when the forecast transaction is ultimately recognised in the Statement of Comprehensive Income. When a forecast transaction is no longer expected to occur, the cumulative gain or loss is immediately transferred to the Statement of Comprehensive Income.
1. SIGNIFICANT ACCOUNTING POLICIES continued
Notes to the Financial Statements continued

OV
ERVIEW
STRATEG
IC REPO
RTG
OV
ERNA
NCE
FINA
NCIA
L STA
TEMEN
TS
37Hornby PLC Annual Report and Accounts 2017
(b) Derivatives that do not qualify for hedge accounting Certain derivative instruments are not considered effective and do not qualify for hedge accounting. Such derivatives are classified at fair value through the Statement of Comprehensive Income, and changes in the fair value of derivative instruments that do not qualify for hedge accounting are recognised immediately in the Statement of Comprehensive Income.
Fair value estimationThe fair values of short-term deposits, loans and overdrafts with a maturity of less than one year are assumed to approximate to their book values.
The fair values of the derivative financial instruments used for hedging purposes are disclosed in note 19.
Foreign currencyTransactions denominated in foreign currencies are recorded in the relevant functional currency at the exchange rates ruling at the date of the transaction. Foreign exchange gains and losses resulting from such transactions are recognised in the Statement of Comprehensive Income, except when deferred and disclosed in Other Comprehensive Income as qualifying cash flow hedges. Monetary assets and liabilities denominated in foreign currencies are translated at the exchange rates ruling at the balance sheet date and any exchange differences are taken to the Statement of Comprehensive Income.
Foreign exchange gains/losses recognised in the Statement of Comprehensive Income relating to foreign currency loans and other foreign exchange adjustments are included within operating profit.
On consolidation, the Statement of Comprehensive Income and cash flows of foreign subsidiaries are translated into Sterling using average rates that existed during the accounting period. The balance sheets of foreign subsidiaries are translated into Sterling at the rates of exchange ruling at the balance sheet date. Gains or losses arising on the translation of opening and closing net assets are recognised in Other Comprehensive Income.
Dividend distributionFinal dividends are recorded in the Statement of Changes in Equity in the period in which they are approved by the Company’s shareholders. Interim dividends are recorded in the period in which they are approved and paid.
Critical judgements in applying the accounting policiesThe Group makes estimates and assumptions concerning the future. The resulting accounting estimates will, by definition, seldom equal the related actual results. The estimates and assumptions that may have an element of risk causing an adjustment to the carrying amounts of assets and liabilities within the next financial year include provisions for stock obsolescence, customer returns, doubtful debts, impairment reviews, fair values of share-based payments, fair values of derivatives and recoverability of deferred tax assets. All of the above are estimated with reference to historical data, expectation of future events and reviewed regularly.
Whenever there is a substantiated risk that an item of stock’s sellable value may be lower than its actual stock value, a provision for the difference between the two values is made. Management review the stock holdings on a regular basis and consider where a provision for excess or obsolete stock should be made based on expected demand for the stock and its condition.
The provision for sales returns is based on historic returns data applied to sales for the current year and this provision is reviewed by management on an ongoing basis.
Specific debtors are provided for when there is significant doubt that a repayment of debt will be fulfilled considering specific knowledge of the customer and sales terms of the debt outstanding.
The critical areas of judgement applied within the impairment reviews conducted include the weighted average cost of capital used in discounting the cash flows of the cash-generating units, the assessment of the initial growth rate used, the growth rate in perpetuity of the cash flows and the forecast operating profits of the cash-generating units. The judgements used within this assessment are set out within note 8.
The critical areas of judgement used in the share-based payment charge for the year include the assessment of the fair value of the option along with the expected volatility and option term. These are based on historical data where this is available and best estimates where historical data is not available. Further details in relation to share-based payments are given in note 22.
The deferred tax assets are assessed based on the current trading performance, expected future cash flows in the specific countries and the nature of the tax base.
The fair value of the financial derivatives is determined by the mark to market value at the year end date.
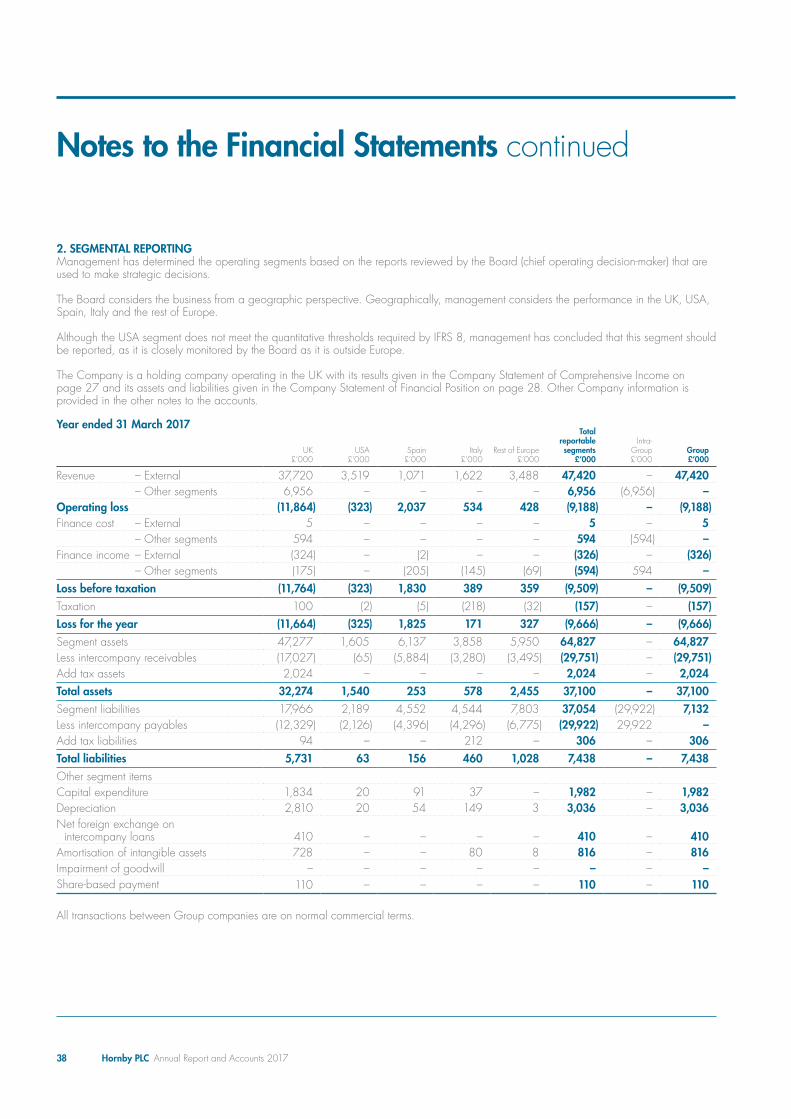
38 Hornby PLC Annual Report and Accounts 2017
2. SEGMENTAL REPORTING Management has determined the operating segments based on the reports reviewed by the Board (chief operating decision-maker) that are used to make strategic decisions.
The Board considers the business from a geographic perspective. Geographically, management considers the performance in the UK, USA, Spain, Italy and the rest of Europe.
Although the USA segment does not meet the quantitative thresholds required by IFRS 8, management has concluded that this segment should be reported, as it is closely monitored by the Board as it is outside Europe.
The Company is a holding company operating in the UK with its results given in the Company Statement of Comprehensive Income on page 27 and its assets and liabilities given in the Company Statement of Financial Position on page 28. Other Company information is provided in the other notes to the accounts.
Year ended 31 March 2017
UK £’000
USA £’000
Spain £’000
Italy £’000
Rest of Europe £’000
Total reportable segments
£’000
Intra- Group £’000
Group £’000
Revenue – External 37,720 3,519 1,071 1,622 3,488 47,420 – 47,420 – Other segments 6,956 – – – – 6,956 (6,956) –Operating loss (11,864) (323) 2,037 534 428 (9,188) – (9,188)Finance cost – External 5 – – – – 5 – 5 – Other segments 594 – – – – 594 (594) –Finance income – External (324) – (2) – – (326) – (326) – Other segments (175) – (205) (145) (69) (594) 594 –Loss before taxation (11,764) (323) 1,830 389 359 (9,509) – (9,509)Taxation 100 (2) (5) (218) (32) (157) – (157)Loss for the year (11,664) (325) 1,825 171 327 (9,666) – (9,666)Segment assets 47,277 1,605 6,137 3,858 5,950 64,827 – 64,827Less intercompany receivables (17,027) (65) (5,884) (3,280) (3,495) (29,751) – (29,751)Add tax assets 2,024 – – – – 2,024 – 2,024Total assets 32,274 1,540 253 578 2,455 37,100 – 37,100Segment liabilities 17,966 2,189 4,552 4,544 7,803 37,054 (29,922) 7,132Less intercompany payables (12,329) (2,126) (4,396) (4,296) (6,775) (29,922) 29,922 –Add tax liabilities 94 – – 212 – 306 – 306Total liabilities 5,731 63 156 460 1,028 7,438 – 7,438Other segment items Capital expenditure 1,834 20 91 37 – 1,982 – 1,982Depreciation 2,810 20 54 149 3 3,036 – 3,036Net foreign exchange on
intercompany loans 410 – – – – 410 – 410Amortisation of intangible assets 728 – – 80 8 816 – 816Impairment of goodwill – – – – – – – –Share-based payment 110 – – – – 110 – 110
All transactions between Group companies are on normal commercial terms.
Notes to the Financial Statements continued

OV
ERVIEW
STRATEG
IC REPO
RTG
OV
ERNA
NCE
FINA
NCIA
L STA
TEMEN
TS
39Hornby PLC Annual Report and Accounts 2017
Year ended 31 March 2016
UK £’000
USA £’000
Spain £’000
Italy £’000
Rest of Europe £’000
Total reportable segments
£’000
Intra- Group £’000
Group £’000
Revenue – External 42,562 3,080 2,470 2,275 5,370 55,757 – 55,757 – Other segments 6,534 – 2,250 696 822 10,302 (10,302) _Operating loss (3,801) (4) (7,214) (528) (1,577) (13,124) – (13,124)Finance cost – External (379) – (38) (3) (9) (429) – (429) – Other segments (175) – (181) (130) (56) (542) 542 –Finance income – External 21 – – – – 21 – 21 – Other segments 542 – – – – 542 (542) –Loss before taxation (3,792) (4) (7,433) (661) (1,642) (13,532) – (13,532)Taxation (182) – – – – (182) – (182)Loss for the year (3,974) (4) (7,433) (661) (1,642) (13,714) – (13,714)Segment assets 55,604 1,704 5,088 3,673 3,696 69,765 (23,918) 45,847Less intercompany receivables (20,918) (53) (720) (1,051) (1,176) (23,918) 23,918 –Add tax assets 1,752 – – 157 295 2,204 – 2,204Total assets 36,438 1,651 4,368 2,779 2,815 48,051 – 48,051Segment liabilities 14,036 1,923 11,141 4,414 5,799 37,313 (21,609) 15,704Less intercompany payables – (1,774) (10,635) (4,026) (5,174) (21,609) 21,609 –Add tax liabilities 207 – 4 – – 211 – 211Total liabilities 14,243 149 510 388 625 15,915 – 15,915Other segment items Capital expenditure 3,393 13 1,113 39 4 4,562 _ 4,562Depreciation 2,447 21 1,059 162 16 3,705 – 3,705Net foreign exchange on intercompany loans 389 – – – – 389 – 389Amortisation of intangible assets 603 – – 71 49 723 – 723Impairment of goodwill – – 3,990 – – 3,990 – 3,990Share-based payment 18 – – – – 18 – 18
All transactions between Group companies are on normal commercial terms.
3. FINANCE COSTSGroup Company
2017 £’000
2016 £’000
2017 £’000
2016 £’000
Finance costs:Interest expense on bank borrowings (326) (429) – –Interest expense on intercompany borrowings – – (205) (181)
(326) (429) (205) (181)Finance income:Bank interest 5 21 – –Interest income on intercompany loans – – 175 174
5 21 175 174Net finance costs (321) (408) (30) (7)

40 Hornby PLC Annual Report and Accounts 2017
4. LOSS BEFORE TAXATIONGroup Company
2017 £’000
2016 £’000
2017 £’000
2016 £’000
The following items have been included in arriving at loss before taxation:Staff costs (note 24) 10,587 11,010 1,452 1,147Inventories:– Cost of inventories recognised as an expense (included in cost of sales) 23,339 26,808 – –– Stock provision (646) (895) – –Depreciation of property, plant and equipment:– Owned assets 3,036 3,705 – 19Profit on disposal of fixed assets 1,439 193 926 223Other operating lease rentals payable:– Plant and machinery 92 125 – –– Property 719 1,058 – –Repairs and maintenance expenditure on property, plant and equipment 86 171 – –Research and development expenditure 1,154 1,760 – –Foreign exchange (gains)/losses:– On trading transactions and ineffective hedges – (135) – –Impairment of trade receivables 486 163 – –Share-based payment charge/(credit) 110 18 76 (48)Other operating expenses/(income):– Foreign exchange on trading transactions (292) (822) – –– Net impact of foreign exchange on intercompany loans (410) (389) – –– Movement on fair value of ineffective hedge – 135 – –– Amortisation of intangible assets – brands 344 384 – –
Group Company2017
£’0002016
£’0002017
£’0002016
£’000
Exceptional items comprise:– Restructuring costs 3,889 993 761 –– Implementation of ERP system – 1,174 – –– Refinancing 944 762 191 191– Profit on disposal of property (1,530) (223) (926) (223)– Impairment of property, plant and equipment – 1,158 – –– Impairment of goodwill – 3,990 – –– Impairment of investment – – 5,775 9,543
3,303 7,854 5,801 9,511
The exceptional items totalling £3,303,000 (2016: £7,854,000) include restructuring costs (£3,889,000) relating to the streamlining of the European operations, redundancy costs, professional fees, reorganisation in the UK and the costs of running the Margate site, costs relating to the 2016 equity issue and bank refinancing (£944,000) less the profit on the sale of the Margate and Spanish properties (£1,530,000).
The Company’s exceptional items include £5,775,000 (2016: £9,543,000) in respect of impairment charges against investments in overseas subsidiaries following the restructuring.
Notes to the Financial Statements continued

OV
ERVIEW
STRATEG
IC REPO
RTG
OV
ERNA
NCE
FINA
NCIA
L STA
TEMEN
TS
41Hornby PLC Annual Report and Accounts 2017
Services provided by the Company’s auditors and network firmsDuring the year the Group (including its overseas subsidiaries) obtained the following services from the Company’s auditors and network firms as detailed below:
Group Company2017
£’0002016
£’0002017
£’0002016
£’000
Fees payable to the Company’s auditors for the audit of Parent Company and consolidated accounts 50 103 10 15
Fees payable to the Company’s auditors and its associates for other services:– The auditing of accounts of the Company’s subsidiaries 62 39 – 39– Audit-related assurance services 5 5 – –– Tax advisory services – 19 – –– Tax compliance services – 1 – –– Other advisory work 95 – – –
212 167 10 54
In the current financial year the level of non-audit fees was within the 1:1 ratio to audit fees as per Audit Committee policy. Other advisory work relates to the raising of equity in 2016.
5. INCOME TAX CHARGE/(CREDIT)Analysis of tax charge/(credit) in the year
Group Company2017
£’0002016
£’0002017
£’0002016
£’000
Current tax– UK taxation – – – 89adjustments in respect of prior years – (43) – –– overseas taxation 212 (8) – –adjustments in respect of prior years 45 – – –
257 (51) – 89Deferred tax (note 20)– current year (199) (569) (94) (3)– overseas taxation – 348 – –– adjustments in respect of prior years – 255 – (7)– effect of tax rate change on opening balance 99 199 (6) (11)
(100) 233 (100) (21)Total tax charge/(credit) to the loss before tax 157 182 (100) 68
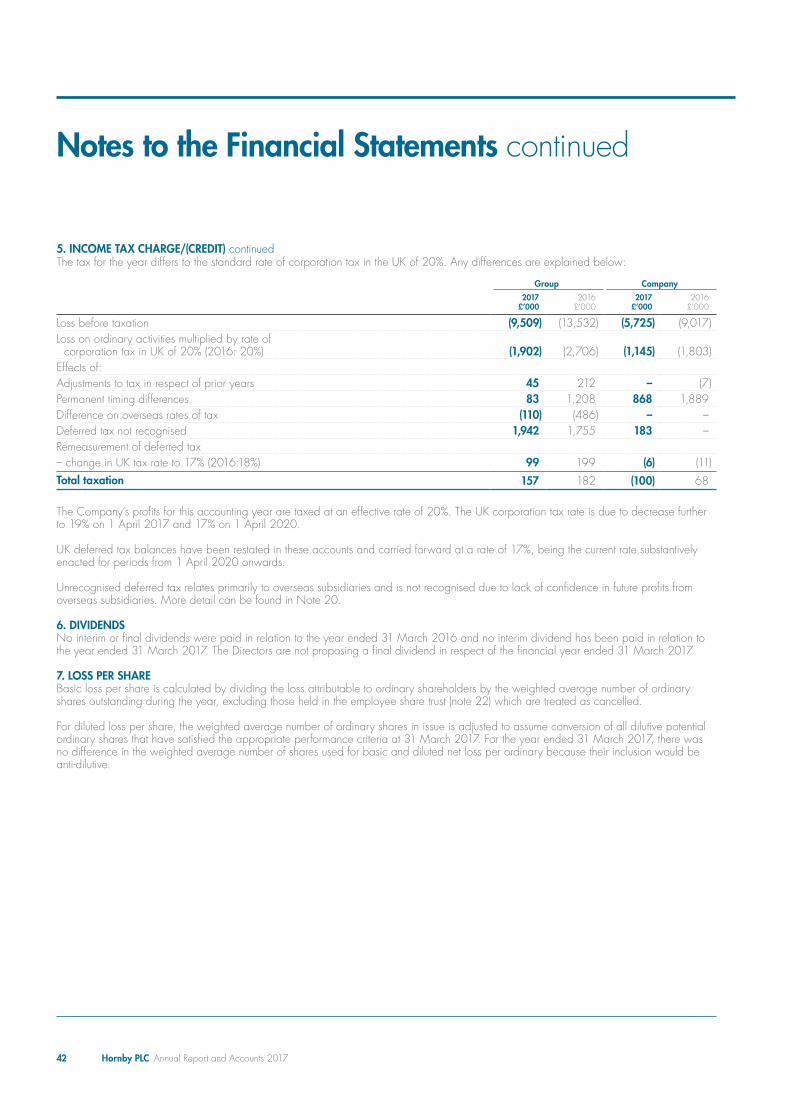
42 Hornby PLC Annual Report and Accounts 2017
The tax for the year differs to the standard rate of corporation tax in the UK of 20%. Any differences are explained below:
Group Company2017
£’0002016
£’0002017
£’0002016
£’000
Loss before taxation (9,509) (13,532) (5,725) (9,017)Loss on ordinary activities multiplied by rate of
corporation tax in UK of 20% (2016: 20%) (1,902) (2,706) (1,145) (1,803)Effects of:Adjustments to tax in respect of prior years 45 212 – (7)Permanent timing differences 83 1,208 868 1,889Difference on overseas rates of tax (110) (486) – –Deferred tax not recognised 1,942 1,755 183 –Remeasurement of deferred tax– change in UK tax rate to 17% (2016:18%) 99 199 (6) (11)Total taxation 157 182 (100) 68
The Company’s profits for this accounting year are taxed at an effective rate of 20%. The UK corporation tax rate is due to decrease further to 19% on 1 April 2017 and 17% on 1 April 2020.
UK deferred tax balances have been restated in these accounts and carried forward at a rate of 17%, being the current rate substantively enacted for periods from 1 April 2020 onwards.
Unrecognised deferred tax relates primarily to overseas subsidiaries and is not recognised due to lack of confidence in future profits from overseas subsidiaries. More detail can be found in Note 20.
6. DIVIDENDSNo interim or final dividends were paid in relation to the year ended 31 March 2016 and no interim dividend has been paid in relation to the year ended 31 March 2017. The Directors are not proposing a final dividend in respect of the financial year ended 31 March 2017. 7. LOSS PER SHAREBasic loss per share is calculated by dividing the loss attributable to ordinary shareholders by the weighted average number of ordinary shares outstanding during the year, excluding those held in the employee share trust (note 22) which are treated as cancelled.
For diluted loss per share, the weighted average number of ordinary shares in issue is adjusted to assume conversion of all dilutive potential ordinary shares that have satisfied the appropriate performance criteria at 31 March 2017. For the year ended 31 March 2017, there was no difference in the weighted average number of shares used for basic and diluted net loss per ordinary because their inclusion would be anti-dilutive.
5. INCOME TAX CHARGE/(CREDIT) continued
Notes to the Financial Statements continued

OV
ERVIEW
STRATEG
IC REPO
RTG
OV
ERNA
NCE
FINA
NCIA
L STA
TEMEN
TS
43Hornby PLC Annual Report and Accounts 2017
Reconciliations of the loss and weighted average number of shares used in the calculations are set out below.
2017 2016
(Loss)/earnings
£’000
Weighted average
number of shares
’000
Per-share amount
pence
(Loss)/ earnings
£’000
Weighted average
number of shares ’000
Per-share amount pence
ReportedBasic loss per shareLoss attributable to ordinary shareholders (9,666) 76,384 (12.65) (13,714) 49,200 (27.87)Effect of dilutive securitiesOptions – – – – – –Diluted loss per share (9,666) 76,384 (12.65) (13,714) 49,200 (27.87)
UnderlyingLoss attributable to ordinary shareholders (9,666) 76,384 (12.65) (13,714) 49,200 (27.87)Amortisation of intangibles 275 – 0.36 307 – 0.62Restructuring costs 3,111 – 4.07 794 – 1.61Implementation of new ERP system – – – 939 – 1.91Refinancing 755 – 0.99 610 – 1.24Profit on disposal of property (1,223) – (1.6) (178) – (0.36)Impairment of PPE – tooling – – – 1,158 – 2.36Impairment of goodwill – – – 3,990 – 8.11Net foreign exchange translation adjustments (328) – (0.43) (311) – (0.64)Underlying basic loss/EPS (7,076) 76,384 (9.26) (6,405) 49,200 (13.02)Underlying diluted loss/EPS (7,076) 76,384 (9.26) (6,405) 49,200 (13.02)
The above numbers used to calculate the EPS for the year ended 31 March 2017 and 31 March 2016 have been tax effected at the rate of 20% respectively with the exception of Hornby Spain where the net deferred tax asset associated with the impairment in 2016 has not been recognised.

44 Hornby PLC Annual Report and Accounts 2017
8. GOODWILL
Group £’000
CostAt 1 April 2016 13,007Exchange adjustments 38At 31 March 2017 13,045Aggregate impairment At 1 April 2016 8,491Charge for the year –Exchange adjustments –At 31 March 2017 8,491Net book amount at 31 March 2017 4,554Cost At 1 April 2015 12,973Exchange adjustments 34At 31 March 2016 13,007Aggregate impairment At 1 April 2015 4,509Charge for the year 3,990Exchange adjustments (8)At 31 March 2016 8,491Net book amount at 31 March 2016 4,516Net book amount at 31 March 2015 8,464
The Company has no goodwill.
The goodwill has been allocated to cash-generating units and a summary of carrying amounts of goodwill by geographical segment (representing cash-generating units) at 31 March 2017 is as follows:
GroupUK
£’000USA
£’000France £’000
Germany £’000
Total £’000
At 31 March 2017 3,992 10 358 194 4,554At 31 March 2016 3,992 8 337 179 4,516
Goodwill allocated to the above cash-generating units of the Group has been measured based on benefits each geographical segment is expected to gain from the business combination.
Impairment tests for goodwillManagement reviews the business performance based on geography. Budgeted revenue was based on expected levels of activity given results to date, together with expected economic and market conditions. Budgeted operating profit was calculated based upon management’s expectation of operating costs appropriate to the business as reflected in the new business plan.
The relative risk adjusted (or ‘beta’) discount rate applied reflects the risk inherent in hobby based product companies. In determining this discount rate, management has applied an adjustment for risk of such companies in the industry on average determined using the betas of comparable hobby based product companies. The forecasts are based on approved budgets for the year ending 31 March 2018 and the three-year business plan for the year ending 31 March 2021. Cash flows beyond the four-year period are extrapolated using an estimated 4% year-on-year growth rate. The cash flows were discounted using a pre-tax discount rate of 13% (2016: 13%) which management believes is appropriate for all territories.
Notes to the Financial Statements continued

OV
ERVIEW
STRATEG
IC REPO
RTG
OV
ERNA
NCE
FINA
NCIA
L STA
TEMEN
TS
45Hornby PLC Annual Report and Accounts 2017
The key assumptions used for value-in-use calculations for the year ended 31 March 2017 are as follows:
GroupUK
(Corgi)
UK (Airfix and
Humbrol) France Spain Italy Germany
EDITDA1 38.9% 35.6% 37.4% n/a n/a 40.7%Growth rate to perpetuity2 1.0% 1.0% 1.0% n/a n/a 1.0%
The key assumptions used for value-in-use calculations for the year ended 31 March 2016 are as follows:
GroupUK
(Corgi)
UK (Airfix and Humbrol) France Spain Italy Germany
Gross Margin1 46.2% 46.2% 59.7% 59.7% 59.7% 59.7%Growth rate to perpetuity2 1.0% 1.0% 1.0% 1.0% 1.0% 1.0%
1. Budgeted contribution: Corgi and Airfix/Humbrol # Budgeted EBITDA: France and Germany.2. Weighted average growth rate used to extrapolate cash flows beyond the budget period.
These assumptions have been used for the analysis of each CGU within the operating segments.
For the UK CGU, the recoverable amount calculated based on value-in-use exceeded carrying value by £9.0 million. A reduction in EBITDA to respectively 59% for Corgi and 43% for Airix/Humbrol, or a rise in discount rate to respectively 23% for Corgi and 44% for Airfix/Humbrol would remove the remaining headroom.
For the France CGU, the recoverable amount calculated based on value in use exceeded carrying value by £975k. A reduction in EBITDA to 28%, or a rise in discount rate to 40% would remove the remaining headroom.
For the Germany CGU, the recoverable amount calculated based on value in use exceeded carrying value by £662k. A reduction in EBITDA to 45%, or a rise in discount rate to 27% would remove the remaining headroom.
9. INTANGIBLE ASSETS
GroupBrand names
£’000Customer lists
£’000
Computer software
£’000Total
£’000
Intangible assetsCostAt 1 April 2016 4,813 1,405 2,329 8,547Additions – – 226 226Exchange adjustments 101 10 – 111At 31 March 2017 4,914 1,415 2,555 8,884Accumulated amortisation At 1 April 2016 2,203 1,228 339 3,770Charge for the year 249 95 472 816Exchange adjustments 74 10 – 84At 31 March 2017 2,526 1,333 811 4,670Net book amount at 31 March 2017 2,388 82 1,744 4,214

46 Hornby PLC Annual Report and Accounts 2017
GroupBrand names
£’000Customer lists
£’000
Computer Software
£’000Total
£’000
Intangible assetsCostAt 1 April 2015 4,683 1,372 988 7,043Additions – – 1,341 1,341Exchange adjustments 130 33 – 163At 31 March 2016 4,813 1,405 2,329 8,547Accumulated amortisationAt 1 April 2015 1,897 1,075 – 2,972Charge for the year 263 121 339 723Exchange adjustments 43 32 – 75At 31 March 2016 2,203 1,228 339 3,770Net book amount at 31 March 2016 2,610 177 1,990 4,777Net book amount at 31 March 2015 2,786 297 988 4,071
All amortisation charges in the year have been charged in other operating expenses. The Company held no intangible assets.
10. PROPERTY, PLANT AND EQUIPMENT
Group
Plant and equipment
£’000
Motor vehicles £’000
Tools and moulds £’000
Total £’000
Cost At 1 April 2016 6,806 194 58,801 65,801Exchange adjustments 51 4 1,172 1,227Additions at cost 57 – 1,699 1,756Disposals (2,032) – – (2,032)At 31 March 2017 4,882 198 61,672 66,752Accumulated depreciation At 1 April 2016 5,536 194 52,879 58,609Exchange adjustments 34 1 1,005 1,040Charge for the year 337 1 2,698 3,036Disposals (1,616) – – (1,616)At 31 March 2017 4,291 196 56,582 61,069Net book amount at 31 March 2017 591 2 5,090 5,683
Depreciation is charged in the Group’s Statement of Comprehensive Income within Administrative expenses.
9. INTANGIBLE ASSETS continued
Notes to the Financial Statements continued

OV
ERVIEW
STRATEG
IC REPO
RTG
OV
ERNA
NCE
FINA
NCIA
L STA
TEMEN
TS
47Hornby PLC Annual Report and Accounts 2017
Group
Freehold land and buildings
£’000
Plant and equipment
£’000
Motor vehicles
£’000
Tools and moulds £’000
Total £’000
CostAt 1 April 2015 2,952 6,598 239 55,039 64,828Exchange adjustments 47 88 6 1,030 1,171Additions at cost – 395 – 2,826 3,221Transfer to current assets held for sale (2,999) – – – (2,999)Disposals – (275) (51) (94) (420)At 31 March 2016 – 6,806 194 58,801 65,801Accumulated depreciationAt 1 April 2015 1,371 5,156 230 47,811 54,568Exchange adjustments 47 75 7 882 1,011Charge for the year 32 544 – 3,129 3,705Transfer to current assets held for sale (1,450) – – – (1,450)Impairment – – – 1,158 1,158Disposals – (239) (43) (101) (383)At 31 March 2016 – 5,536 194 52,879 58,609Net book amount at 31 March 2016 – 1,270 – 5,922 7,192Net book amount at 31 March 2015 1,581 1,442 9 7,228 10,260
The impairment charge in the previous year relates to tooling held in Hornby Espana S.A. and Hornby Hobbies Limited, which management no longer intend to use in the medium-term operations of the business.
The Group holds no finance leases (2015: none).
Company
Plant and equipment
£’000Total
£’000
CostAt 1 April 2016 and at 31 March 2017 4 4Accumulated depreciationAt 1 April 2016 4 4Charge for the year – –At 31 March 2017 4 4Net book amount at 31 March 2017 – –
Company
Freehold land and buildings
£’000
Plant and equipment
£’000Total
£’000
CostAt 1 April 2015 2,428 4 2,432Transfer to current assets held for sale (2,428) – (2,428)Net book amount at 31 March 2016 – 4 4Accumulated depreciationAt 1 April 2015 1,221 4 1,225Charge for the year 19 – 19Transfer to current assets held for sale (1,240) – (1,240)At 31 March 2016 – 4 4Net book amount at 31 March 2016 – – –Net book amount at 31 March 2015 1,207 – 1,207
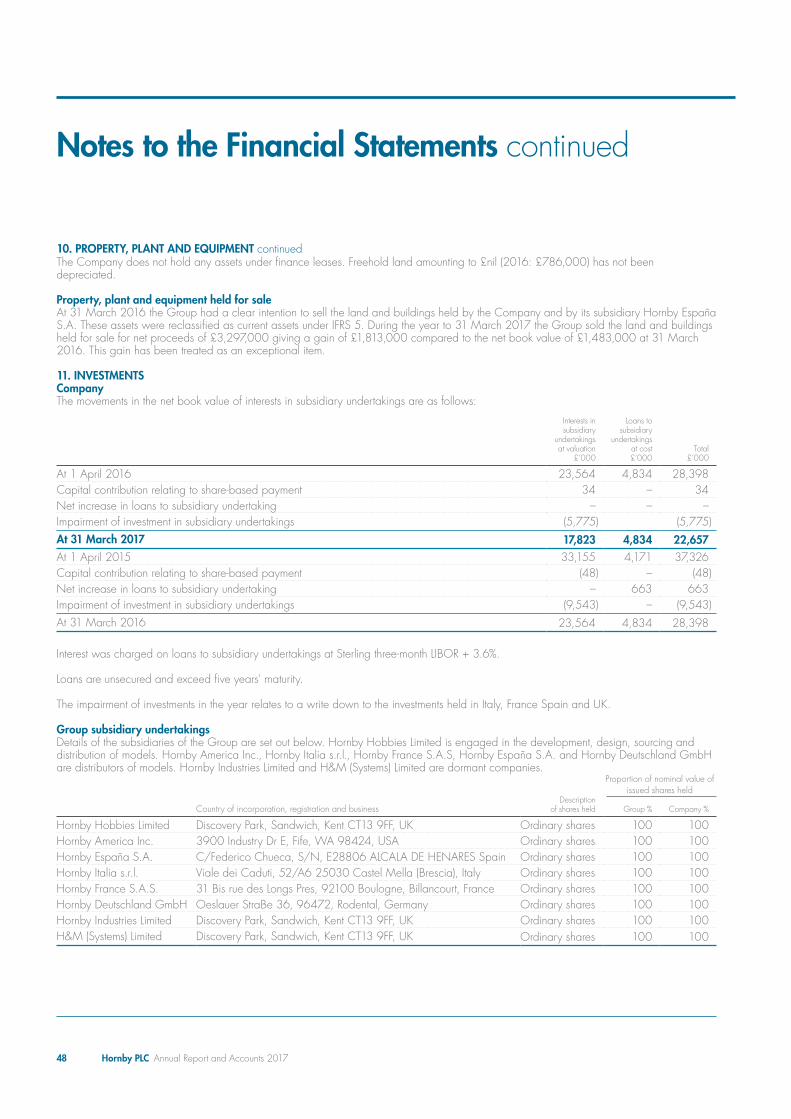
48 Hornby PLC Annual Report and Accounts 2017
The Company does not hold any assets under finance leases. Freehold land amounting to £nil (2016: £786,000) has not been depreciated.
Property, plant and equipment held for saleAt 31 March 2016 the Group had a clear intention to sell the land and buildings held by the Company and by its subsidiary Hornby Espana S.A. These assets were reclassified as current assets under IFRS 5. During the year to 31 March 2017 the Group sold the land and buildings held for sale for net proceeds of £3,297,000 giving a gain of £1,813,000 compared to the net book value of £1,483,000 at 31 March 2016. This gain has been treated as an exceptional item.
11. INVESTMENTSCompanyThe movements in the net book value of interests in subsidiary undertakings are as follows:
Interests in subsidiary
undertakings at valuation
£’000
Loans to subsidiary
undertakings at cost £’000
Total £’000
At 1 April 2016 23,564 4,834 28,398Capital contribution relating to share-based payment 34 – 34Net increase in loans to subsidiary undertaking – – –Impairment of investment in subsidiary undertakings (5,775) (5,775)At 31 March 2017 17,823 4,834 22,657At 1 April 2015 33,155 4,171 37,326Capital contribution relating to share-based payment (48) – (48)Net increase in loans to subsidiary undertaking – 663 663Impairment of investment in subsidiary undertakings (9,543) – (9,543)At 31 March 2016 23,564 4,834 28,398
Interest was charged on loans to subsidiary undertakings at Sterling three-month LIBOR + 3.6%.
Loans are unsecured and exceed five years’ maturity.
The impairment of investments in the year relates to a write down to the investments held in Italy, France Spain and UK. Group subsidiary undertakingsDetails of the subsidiaries of the Group are set out below. Hornby Hobbies Limited is engaged in the development, design, sourcing and distribution of models. Hornby America Inc., Hornby Italia s.r.l., Hornby France S.A.S, Hornby España S.A. and Hornby Deutschland GmbH are distributors of models. Hornby Industries Limited and H&M (Systems) Limited are dormant companies.
Proportion of nominal value of issued shares held
Country of incorporation, registration and businessDescription
of shares held Group % Company %
Hornby Hobbies Limited Discovery Park, Sandwich, Kent CT13 9FF, UK Ordinary shares 100 100Hornby America Inc. 3900 Industry Dr E, Fife, WA 98424, USA Ordinary shares 100 100Hornby España S.A. C/Federico Chueca, S/N, E28806 ALCALA DE HENARES Spain Ordinary shares 100 100Hornby Italia s.r.l. Viale dei Caduti, 52/A6 25030 Castel Mella (Brescia), Italy Ordinary shares 100 100Hornby France S.A.S. 31 Bis rue des Longs Pres, 92100 Boulogne, Billancourt, France Ordinary shares 100 100Hornby Deutschland GmbH Oeslauer StraBe 36, 96472, Rodental, Germany Ordinary shares 100 100Hornby Industries Limited Discovery Park, Sandwich, Kent CT13 9FF, UK Ordinary shares 100 100H&M (Systems) Limited Discovery Park, Sandwich, Kent CT13 9FF, UK Ordinary shares 100 100
10. PROPERTY, PLANT AND EQUIPMENT continued
Notes to the Financial Statements continued

OV
ERVIEW
STRATEG
IC REPO
RTG
OV
ERNA
NCE
FINA
NCIA
L STA
TEMEN
TS
49Hornby PLC Annual Report and Accounts 2017
12. INVENTORIESGroup Company
2017 £’000
2016 £’000
2017 £’000
2016 £’000
Work in progress – 57 – –Finished goods 9,680 13,580 – –
9,680 13,637 – –
Movements on the Group provision for impairment of inventory is as follows: 2017
£’0002016
£’000
At 1 April 1,442 706Provision for inventory impairment (234) 774Inventory written-off during the year (423) (45)Exchange adjustments 11 7At 31 March 796 1,442
13. TRADE AND OTHER RECEIVABLESGroup Company
2017 £’000
2016 £’000
2017 £’000
2016 £’000
Current:Trade receivables 8,884 12,303 – –Less: provision for impairment of receivables (1,026) (540) – –Trade receivables – net 7,858 11,763 – –Other receivables 803 103 – –Prepayments 585 1,326 48 74Amounts owed by subsidiary undertaking – – 24,061 15,255
9,246 13,192 24,109 15,329
Concentrations of credit risk with respect to trade receivables are limited due to the Group’s customer base being large and unrelated and therefore the provision for receivables impairments are deemed adequate.
Gross trade receivables can be analysed as follows:2017
£’0002016
£’000
Fully performing 4,823 9,939Past due 3,035 1,824Fully impaired 1,026 540Trade receivables 8,884 12,303
As of 31 March 2017, trade receivables of £3,035,000 (2016: £1,824,000) were past due but not impaired. These relate to a number of independent customers for whom there is no recent history of default. The ageing analysis of these trade receivables is as follows:
2017 £’000
2016 £’000
1–120 days 2,257 1,451>120 days 778 373
3,035 1,824
As of 31 March 2017, trade receivables of £1,026,000 (2016: £540,000) were impaired and provided for. The amount of provision was £1,026,000 (2016: £540,000) as of 31 March 2017.
Significant financial difficulties of the customer, probability that the customer will enter bankruptcy or financial reorganisation are considered indications that the trade receivable is impaired.

50 Hornby PLC Annual Report and Accounts 2017
The ageing of these receivables, based on due date, is as follows:
2017 £’000
2016 £’000
1–120 days 233 57> 120 days 793 483
1,026 540
Movements on the Group provision for impairment of trade receivables is as follows:
2017 £’000
2016 £’000
At 1 April 540 375Provision for receivables impairment 450 163Receivables written-off during the year as uncollectible (53) (23)Exchange adjustments 89 25At 31 March 1,026 540
The (release)/charge relating to the movement in provision has been included in ‘Administrative expenses’ in the Statement of Comprehensive Income.
The carrying amounts of the Group and Company trade and other receivables and amounts owed by subsidiary undertaking are denominated in the following currencies:
Group Company2017
£’0002016
£’0002017
£’0002016
£’000
Sterling Intercompany – – 24,061 15,255Sterling 5,440 7,648 – –Euro 2,628 3,907 – –US Dollar 593 311 – –HK Dollar – – – –
8,661 11,866 24,061 15,255
14. CASH AND CASH EQUIVALENTSGroup Company
2017 £’000
2016 £’000
2017 £’000
2016 £’000
Cash at bank and in hand 1,580 677 6 1
15. TRADE AND OTHER PAYABLESGroup Company
2017 £’000
2016 £’000
2017 £’000
2016 £’000
Current:Trade payables 3,212 5,306 – –Other taxes and social security 677 797 4 14Other payables 655 564 – –Accruals 2,120 696 23 80
6,664 7,363 27 94
13. TRADE AND OTHER RECEIVABLES continued
Notes to the Financial Statements continued
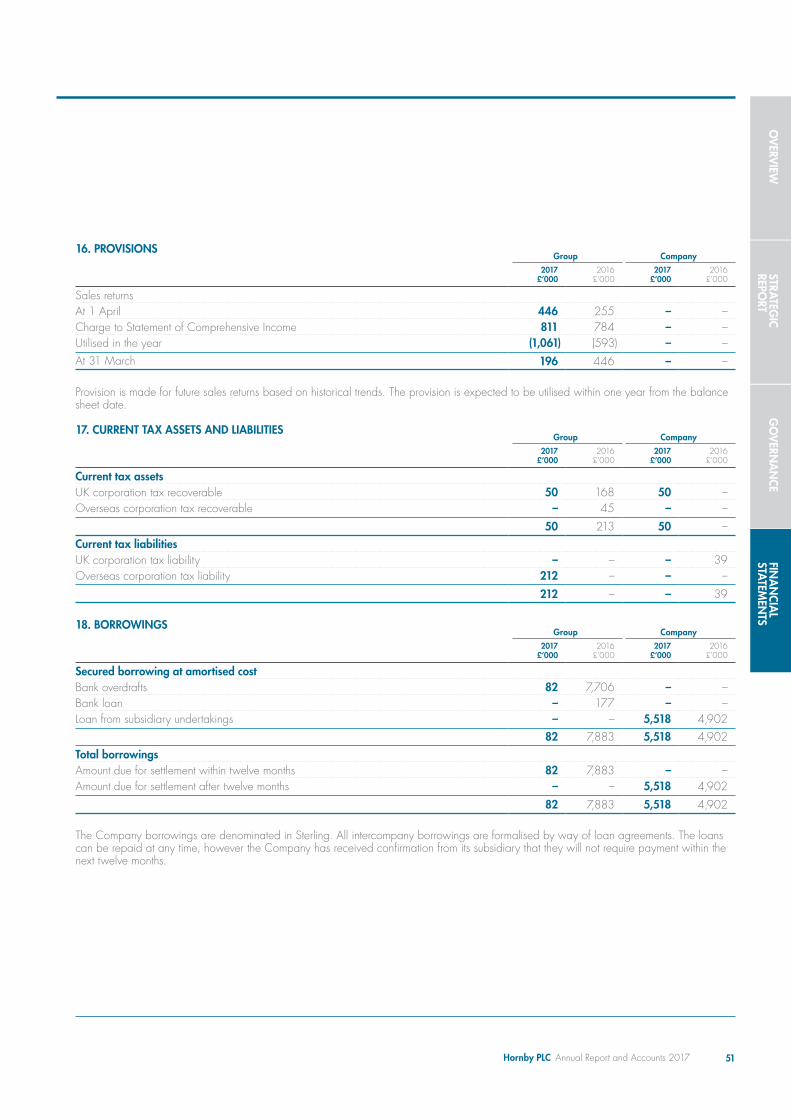
OV
ERVIEW
STRATEG
IC REPO
RTG
OV
ERNA
NCE
FINA
NCIA
L STA
TEMEN
TS
51Hornby PLC Annual Report and Accounts 2017
16. PROVISIONSGroup Company
2017 £’000
2016 £’000
2017 £’000
2016 £’000
Sales returnsAt 1 April 446 255 – –Charge to Statement of Comprehensive Income 811 784 – –Utilised in the year (1,061) (593) – –At 31 March 196 446 – –
Provision is made for future sales returns based on historical trends. The provision is expected to be utilised within one year from the balance sheet date.
17. CURRENT TAX ASSETS AND LIABILITIESGroup Company
2017 £’000
2016 £’000
2017 £’000
2016 £’000
Current tax assetsUK corporation tax recoverable 50 168 50 –Overseas corporation tax recoverable – 45 – –
50 213 50 –Current tax liabilitiesUK corporation tax liability – – – 39Overseas corporation tax liability 212 – – –
212 – – 39
18. BORROWINGSGroup Company
2017 £’000
2016 £’000
2017 £’000
2016 £’000
Secured borrowing at amortised costBank overdrafts 82 7,706 – –Bank loan – 177 – –Loan from subsidiary undertakings – – 5,518 4,902
82 7,883 5,518 4,902Total borrowingsAmount due for settlement within twelve months 82 7,883 – –Amount due for settlement after twelve months – – 5,518 4,902
82 7,883 5,518 4,902
The Company borrowings are denominated in Sterling. All intercompany borrowings are formalised by way of loan agreements. The loans can be repaid at any time, however the Company has received confirmation from its subsidiary that they will not require payment within the next twelve months.
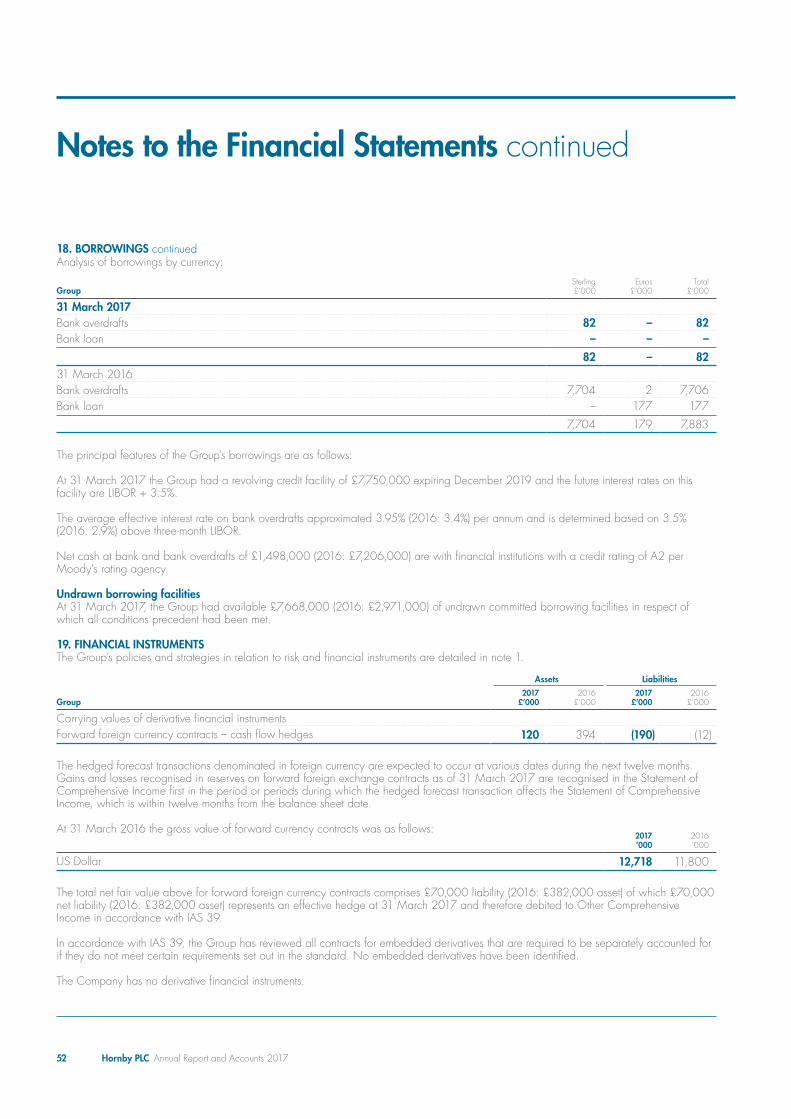
52 Hornby PLC Annual Report and Accounts 2017
Analysis of borrowings by currency:
GroupSterling £’000
Euros £’000
Total £’000
31 March 2017Bank overdrafts 82 – 82Bank loan – – –
82 – 8231 March 2016Bank overdrafts 7,704 2 7,706Bank loan – 177 177
7,704 179 7,883
The principal features of the Group’s borrowings are as follows:
At 31 March 2017 the Group had a revolving credit facility of £7,750,000 expiring December 2019 and the future interest rates on this facility are LIBOR + 3.5%.
The average effective interest rate on bank overdrafts approximated 3.95% (2016: 3.4%) per annum and is determined based on 3.5% (2016: 2.9%) above three-month LIBOR.
Net cash at bank and bank overdrafts of £1,498,000 (2016: £7,206,000) are with financial institutions with a credit rating of A2 per Moody’s rating agency.
Undrawn borrowing facilitiesAt 31 March 2017, the Group had available £7,668,000 (2016: £2,971,000) of undrawn committed borrowing facilities in respect of which all conditions precedent had been met.
19. FINANCIAL INSTRUMENTS The Group’s policies and strategies in relation to risk and financial instruments are detailed in note 1.
Assets Liabilities
Group2017
£’0002016
£’0002017
£’0002016
£’000
Carrying values of derivative financial instruments Forward foreign currency contracts – cash flow hedges 120 394 (190) (12)
The hedged forecast transactions denominated in foreign currency are expected to occur at various dates during the next twelve months. Gains and losses recognised in reserves on forward foreign exchange contracts as of 31 March 2017 are recognised in the Statement of Comprehensive Income first in the period or periods during which the hedged forecast transaction affects the Statement of Comprehensive Income, which is within twelve months from the balance sheet date.
At 31 March 2016 the gross value of forward currency contracts was as follows:2017 ’000
2016 ’000
US Dollar 12,718 11,800
The total net fair value above for forward foreign currency contracts comprises £70,000 liability (2016: £382,000 asset) of which £70,000 net liability (2016: £382,000 asset) represents an effective hedge at 31 March 2017 and therefore debited to Other Comprehensive Income in accordance with IAS 39.
In accordance with IAS 39, the Group has reviewed all contracts for embedded derivatives that are required to be separately accounted for if they do not meet certain requirements set out in the standard. No embedded derivatives have been identified.
The Company has no derivative financial instruments.
18. BORROWINGS continued
Notes to the Financial Statements continued

OV
ERVIEW
STRATEG
IC REPO
RTG
OV
ERNA
NCE
FINA
NCIA
L STA
TEMEN
TS
53Hornby PLC Annual Report and Accounts 2017
Fair values of non-derivative financial assets and liabilitiesFor the Group and the Company, as at 31 March 2017 and 31 March 2016, there is no difference between the carrying amount and fair value of each of the following classes of financial assets and liabilities, principally due to their short maturity: trade and other receivables, cash at bank and in hand, trade and other payables and current borrowings. Bank deposits attract interest within 1.0% of the ruling market rate. There is no significant difference between the fair value and carrying amount of non-current borrowings as the impact of discounting is not significant.
Maturity of financial liabilities
GroupBank loan
£’000
Overdraft facilities
£’000
Accounts payable and
accruals £’000
2017 Total
£’000
Less than one year – 82 6,664 6,746Between one and two years – – – –Between two and five years – – – –More than five years – – – – – 82 6,664 6,746
Bank loan £’000
Overdraft facilities £’000
Accounts payable and
accruals £’000
2016 Total
£’000
Less than one year 177 7,706 7,363 15,246Between one and two years – – – –Between two and five years – – – –More than five years – – – –
177 7,706 7,363 15,246
Company
2017 Intercompany
debt £’000
2016 Intercompany
debt £’000
More than five years (note 18) 5,518 4,902
Hierarchy of financial instruments The following tables present the Group’s assets and liabilities that are measured at fair value at 31 March 2017 and 31 March 2016. The table analyses financial instruments carried at fair value, by valuation method. The different levels have been defined as follows:• Quoted prices (unadjusted) in active markets for identical assets or liabilities (Level 1).• Inputs other than quoted prices included within level 1 that are observable for the asset or liability, either directly (that is, as prices) or
indirectly (that is, derived from prices) (Level 2).• Inputs for the asset or liability that are not based on observable market data (that is, unobservable inputs) (Level 3).
There were no transfers or reclassifications between Levels within the year. Level 2 hedging derivatives comprise forward foreign exchange contracts and have been fair valued using forward exchange rates that are quoted in an active market. The effects of discounting are generally insignificant for Level 2 derivatives.
The fair value of the following financial assets and liabilities approximate their carrying amount: Trade and other receivables, other current financial assets, cash and cash equivalents (excluding bank overdrafts), trade and other payables.

54 Hornby PLC Annual Report and Accounts 2017
Financial InstrumentsLevel 1 £’000
Level 2 £’000
Level 3 £’000
Total £’000
AssetsTrading derivatives – – – –Derivatives used for hedging – 120 – 120Available-for-sale financial assets – – – –Total assets as at 31 March 2017 – 120 – 120LiabilitiesInterest rate swap – – – –Derivatives used for hedging – (190) – (190)Total liabilities at 31 March 2017 – (190) – (190)
Level 1 £’000
Level 2 £’000
Level 3 £’000
Total £’000
AssetsTrading derivatives – – – –Derivatives used for hedging – 394 – 394Available-for-sale financial assets – – – –Total assets as at 31 March 2016 – 394 – 394LiabilitiesInterest rate swap – – – –Derivatives used for hedging – (12) – (12)Total liabilities at 31 March 2016 – (12) – (12)
Interest rate sensitivityThe Group is exposed to interest rate risk as the Group borrows funds at both fixed and floating interest rates. The exposure to these borrowings varies during the year due to the seasonal nature of cash flows relating to sales.
In order to measure risk, floating rate borrowings and the expected interest costs are forecast on a monthly basis and compared to budget using management’s expectations of a reasonably possible change in interest rates.
The effect on both income and equity based on exposure to borrowings at the balance sheet date for a 1.0% increase in interest rates is £41,000 (2016: £83,000) before tax. A 1% fall in interest rates gives the same but opposite effect. 1% is considered an appropriate benchmark given the minimum level of movement in the UK interest rate over recent years and expectation over the next financial year.
Foreign currency sensitivityThe Group is primarily exposed to fluctuations in US Dollars and Euros. The following table details how the Group’s income and equity would increase on a before tax basis, given a 10% revaluation in the respective currencies against Sterling and in accordance with IFRS 7 all other variables remaining constant. A 10% devaluation in the value of Sterling would have the opposite effect. The 10% change represents a reasonably possible change in the specified foreign exchange rates in relation to Sterling.
Comprehensive income and equity sensitivity2017
£’0002016
£’000
US Dollars 3,349 995Euros 1,163 1,067
4,512 2,062
Notes to the Financial Statements continued
19. FINANCIAL INSTRUMENTS continued
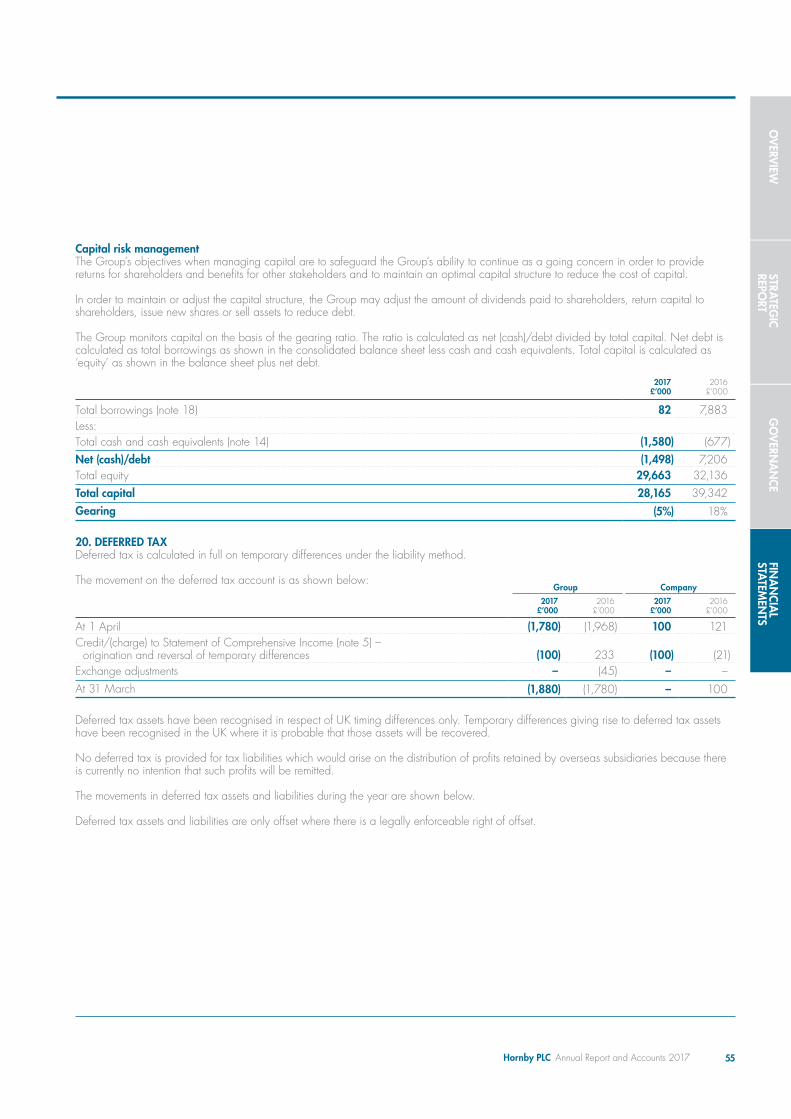
OV
ERVIEW
STRATEG
IC REPO
RTG
OV
ERNA
NCE
FINA
NCIA
L STA
TEMEN
TS
55Hornby PLC Annual Report and Accounts 2017
Capital risk managementThe Group’s objectives when managing capital are to safeguard the Group’s ability to continue as a going concern in order to provide returns for shareholders and benefits for other stakeholders and to maintain an optimal capital structure to reduce the cost of capital.
In order to maintain or adjust the capital structure, the Group may adjust the amount of dividends paid to shareholders, return capital to shareholders, issue new shares or sell assets to reduce debt.
The Group monitors capital on the basis of the gearing ratio. The ratio is calculated as net (cash)/debt divided by total capital. Net debt is calculated as total borrowings as shown in the consolidated balance sheet less cash and cash equivalents. Total capital is calculated as ‘equity’ as shown in the balance sheet plus net debt.
2017 £’000
2016 £’000
Total borrowings (note 18) 82 7,883Less:Total cash and cash equivalents (note 14) (1,580) (677)Net (cash)/debt (1,498) 7,206Total equity 29,663 32,136Total capital 28,165 39,342Gearing (5%) 18%
20. DEFERRED TAXDeferred tax is calculated in full on temporary differences under the liability method.
The movement on the deferred tax account is as shown below:Group Company
2017 £’000
2016 £’000
2017 £’000
2016 £’000
At 1 April (1,780) (1,968) 100 121Credit/(charge) to Statement of Comprehensive Income (note 5) –
origination and reversal of temporary differences (100) 233 (100) (21)Exchange adjustments – (45) – –At 31 March (1,880) (1,780) – 100
Deferred tax assets have been recognised in respect of UK timing differences only. Temporary differences giving rise to deferred tax assets have been recognised in the UK where it is probable that those assets will be recovered.
No deferred tax is provided for tax liabilities which would arise on the distribution of profits retained by overseas subsidiaries because there is currently no intention that such profits will be remitted.
The movements in deferred tax assets and liabilities during the year are shown below.
Deferred tax assets and liabilities are only offset where there is a legally enforceable right of offset.

56 Hornby PLC Annual Report and Accounts 2017
Group Company
Deferred tax liabilitiesRevaluation
£’000
Accelerated capital
allowances £’000
Acquisition intangibles
£’000
Other including
accelerated capital
allowances £’000
Total £’000
Revaluation £’000
Accelerated capital
allowances £’000
Total £’000
At 1 April 2016 100 – 111 – 211 100 – 100Credit to Statement of Comprehensive
Income (100) – (17) – (117) (100) – (100)Transferred from deferred tax assets – – – – – – –At 31 March 2017 – – 94 – 94 – – –At 1 April 2015 114 7 – 10 131 114 7 121Credit to Statement of Comprehensive
Income (14) (7) – (10) (31) (14) (7) (21)Transferred from deferred tax assets – – 111 – 111 – – –At 31 March 2016 100 – 111 – 211 100 – 100
Group Company
Deferred tax assets
Short-term incentive plan
£’000
Acquisition intangibles
£’000Other
£’000Total
£’000
Short-term incentive plan
£’000Total
£’000
At 1 April 2016 – – (1,991) (1,991) – –Charge to Statement of Comprehensive Income – – 17 17 – –Foreign exchange – – – – – –Transferred to deferred tax liabilities – – – – – –At 31 March 2017 – – (1,974) (1,974) – –At 1 April 2015 – (161) (1,938) (2,099) – –Charge/(Credit) to Statement of Comprehensive Income – 272 (8) 264 – –Foreign exchange – – (45) (45) – –Transferred to deferred tax liabilities – (111) – (111) – –At 31 March 2016 – – (1,991) (1,991) – –Net deferred tax (asset)/liabilityAt 31 March 2017 (1,880) – –At 31 March 2016 (1,780) – 100
2017 2016
GroupRecognised
£’000
Not recognised
£’000Recognised
£’000
Not recognised
£’000
Deferred tax comprises:Depreciation in excess of capital allowances (1,901) (71) (1,404) –Other temporary differences – UK 21 (1,510) (376) –Other temporary differences – overseas – (2,537) – (2,644)Deferred tax asset (1,880) (4,118) (1,780) (2,644)
The UK deferred tax asset not recognised of £1,581,000 primarily relates to unrecognised losses in Hornby Hobbies Limited of £8,179,000 (2016: £141,000) (potential deferred tax asset of £1,400,000) and Hornby PLC of £633,000 (potential deferred tax asset of £108,000). It also relates to a potential deferred tax asset in respect of accelerated capital allowances of £71,000 and a potential deferred tax asset in respect of short-term timing differences of £12,000.
Notes to the Financial Statements continued
20. DEFERRED TAX continued
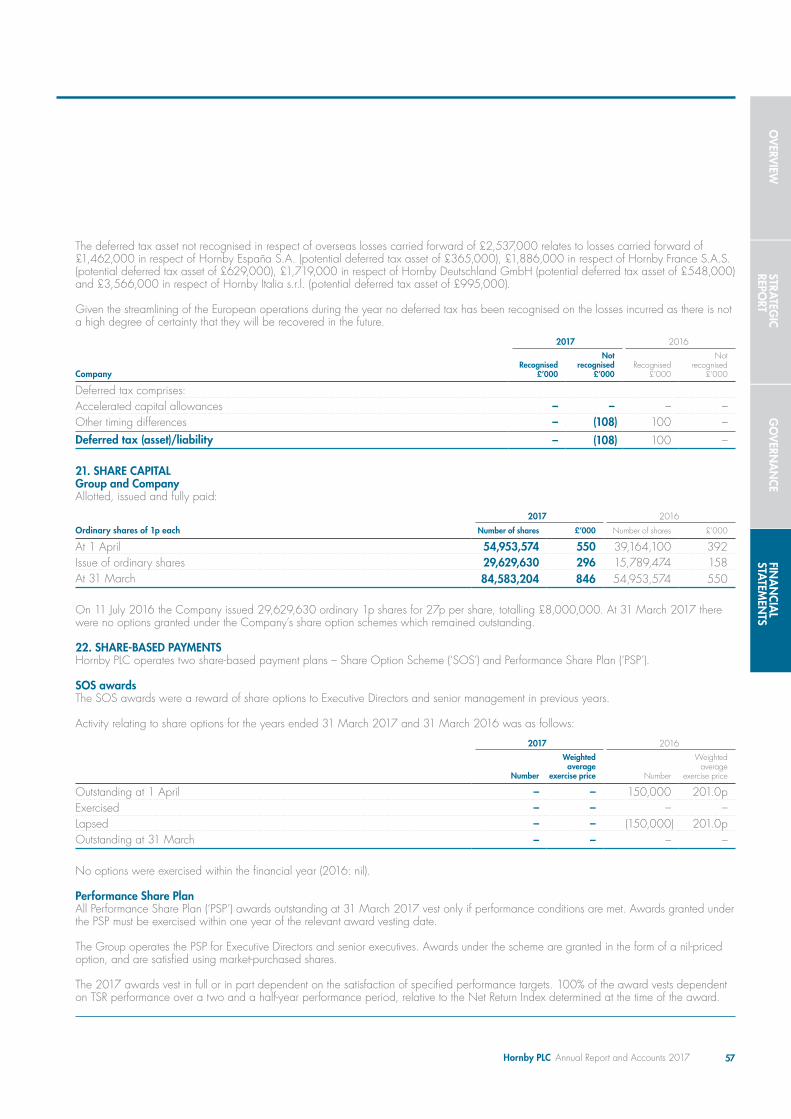
OV
ERVIEW
STRATEG
IC REPO
RTG
OV
ERNA
NCE
FINA
NCIA
L STA
TEMEN
TS
57Hornby PLC Annual Report and Accounts 2017
The deferred tax asset not recognised in respect of overseas losses carried forward of £2,537,000 relates to losses carried forward of £1,462,000 in respect of Hornby Espana S.A. (potential deferred tax asset of £365,000), £1,886,000 in respect of Hornby France S.A.S. (potential deferred tax asset of £629,000), £1,719,000 in respect of Hornby Deutschland GmbH (potential deferred tax asset of £548,000) and £3,566,000 in respect of Hornby Italia s.r.l. (potential deferred tax asset of £995,000).
Given the streamlining of the European operations during the year no deferred tax has been recognised on the losses incurred as there is not a high degree of certainty that they will be recovered in the future.
2017 2016
CompanyRecognised
£’000
Not recognised
£’000Recognised
£’000
Not recognised
£’000
Deferred tax comprises:Accelerated capital allowances – – – –Other timing differences – (108) 100 –Deferred tax (asset)/liability – (108) 100 –
21. SHARE CAPITALGroup and CompanyAllotted, issued and fully paid:
2017 2016
Ordinary shares of 1p each Number of shares £’000 Number of shares £’000
At 1 April 54,953,574 550 39,164,100 392Issue of ordinary shares 29,629,630 296 15,789,474 158At 31 March 84,583,204 846 54,953,574 550
On 11 July 2016 the Company issued 29,629,630 ordinary 1p shares for 27p per share, totalling £8,000,000. At 31 March 2017 there were no options granted under the Company’s share option schemes which remained outstanding.
22. SHARE-BASED PAYMENTSHornby PLC operates two share-based payment plans – Share Option Scheme (‘SOS’) and Performance Share Plan (‘PSP’).
SOS awardsThe SOS awards were a reward of share options to Executive Directors and senior management in previous years.
Activity relating to share options for the years ended 31 March 2017 and 31 March 2016 was as follows:
2017 2016
Number
Weighted average
exercise price Number
Weighted average
exercise price
Outstanding at 1 April – – 150,000 201.0pExercised – – – –Lapsed – – (150,000) 201.0pOutstanding at 31 March – – – –
No options were exercised within the financial year (2016: nil).
Performance Share PlanAll Performance Share Plan (‘PSP’) awards outstanding at 31 March 2017 vest only if performance conditions are met. Awards granted under the PSP must be exercised within one year of the relevant award vesting date.
The Group operates the PSP for Executive Directors and senior executives. Awards under the scheme are granted in the form of a nil-priced option, and are satisfied using market-purchased shares.
The 2017 awards vest in full or in part dependent on the satisfaction of specified performance targets. 100% of the award vests dependent on TSR performance over a two and a half-year performance period, relative to the Net Return Index determined at the time of the award.

58 Hornby PLC Annual Report and Accounts 2017
All plans are subject to continued employment. To the extent that such shares in the above plans are awarded to employees below fair value, a charge calculated in accordance with IFRS 2 ‘Share-based Payment’ is included within other operating expenses in the Statement of Comprehensive Income. This charge for the Group amounts to £110,000, of which £94,000 has been taken to reserves and £16,000 to accruals representing the National Insurance due, and the charge for the Company amounted to £76,000 in the year ended 31 March 2017 (2016: £18,000 charge for the Group amount and the credit for the Company amounted to £47,000).
The following table summarises the key assumptions used for grants during the year:
2017 PSP1 2016 PSP1
Fair value (p) 11.13p 68.61pOptions pricing model used Black-Scholes (Stochastic) Black-Scholes (Stochastic)Share price at grant date (p) 29.0p 68.0pExercise price (p) nil nilExpected volatility (%) 58.0% 32.4%Risk-free rate (%) n/a n/aExpected option term (years) 2.5 3Expected dividends (per year, %) 0% 0%
1 Assumptions for TSR component only.
Assumptions on expected volatility and expected option term have been made on the basis of historical data, wherever available, for the period corresponding with the vesting period of the option. Best estimates have been used where historical data is not available in this respect.
23. RESERVESCapital redemption reserveThis reserve records the nominal value of shares repurchased by the Company.
Translation reserveThe translation reserve represents the foreign exchange movements arising from the translation of financial statements in foreign currencies.
Hedging reserveThe hedging reserve comprises the effective portion of changes in the fair value of forward foreign exchange contracts that have not yet occurred.
Other reservesThis reserve represents historic negative goodwill arising prior to the transition to IFRS.
24. EMPLOYEES AND DIRECTORSGroup Company
2017 £’000
2016 £’000
2017 £’000
2016 £’000
Staff costs for the year:Wages and salaries 8,541 8,559 871 834 Share-based payments (note 22) 94 18 76 (48)Social security costs 911 1,090 104 121 Other pension costs (note 25) 442 555 74 107 Redundancy and compensation for loss of office 599 788 327 133
10,587 11,010 1,452 1,147
The redundancy costs form part of the restructuring costs in the year classified as exceptional items.
Notes to the Financial Statements continued
22. SHARE-BASED PAYMENTS continued
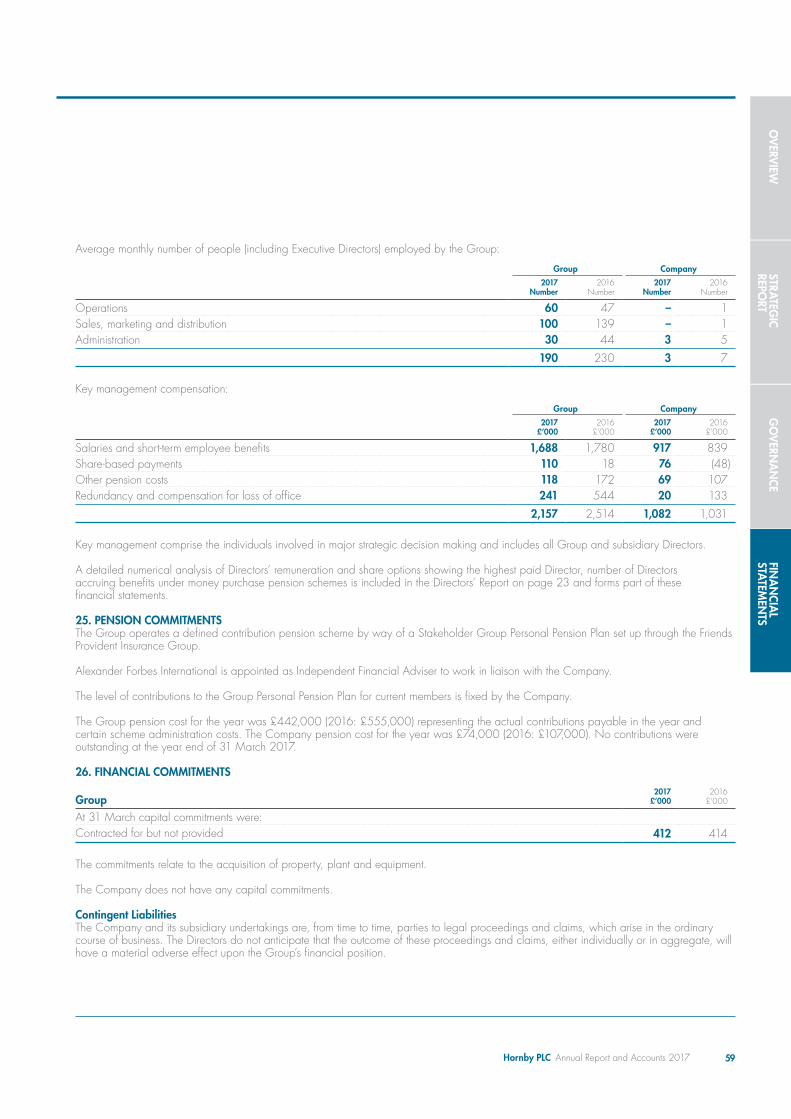
OV
ERVIEW
STRATEG
IC REPO
RTG
OV
ERNA
NCE
FINA
NCIA
L STA
TEMEN
TS
59Hornby PLC Annual Report and Accounts 2017
Average monthly number of people (including Executive Directors) employed by the Group:
Group Company2017
Number2016
Number2017
Number2016
Number
Operations 60 47 – 1 Sales, marketing and distribution 100 139 – 1 Administration 30 44 3 5
190 230 3 7
Key management compensation:
Group Company2017
£’0002016
£’0002017
£’0002016
£’000
Salaries and short-term employee benefits 1,688 1,780 917 839 Share-based payments 110 18 76 (48)Other pension costs 118 172 69 107 Redundancy and compensation for loss of office 241 544 20 133
2,157 2,514 1,082 1,031
Key management comprise the individuals involved in major strategic decision making and includes all Group and subsidiary Directors.
A detailed numerical analysis of Directors’ remuneration and share options showing the highest paid Director, number of Directors accruing benefits under money purchase pension schemes is included in the Directors’ Report on page 23 and forms part of these financial statements.
25. PENSION COMMITMENTSThe Group operates a defined contribution pension scheme by way of a Stakeholder Group Personal Pension Plan set up through the Friends Provident Insurance Group.
Alexander Forbes International is appointed as Independent Financial Adviser to work in liaison with the Company.
The level of contributions to the Group Personal Pension Plan for current members is fixed by the Company.
The Group pension cost for the year was £442,000 (2016: £555,000) representing the actual contributions payable in the year and certain scheme administration costs. The Company pension cost for the year was £74,000 (2016: £107,000). No contributions were outstanding at the year end of 31 March 2017.
26. FINANCIAL COMMITMENTS
Group2017
£’0002016
£’000
At 31 March capital commitments were:Contracted for but not provided 412 414
The commitments relate to the acquisition of property, plant and equipment.
The Company does not have any capital commitments.
Contingent LiabilitiesThe Company and its subsidiary undertakings are, from time to time, parties to legal proceedings and claims, which arise in the ordinary course of business. The Directors do not anticipate that the outcome of these proceedings and claims, either individually or in aggregate, will have a material adverse effect upon the Group’s financial position.
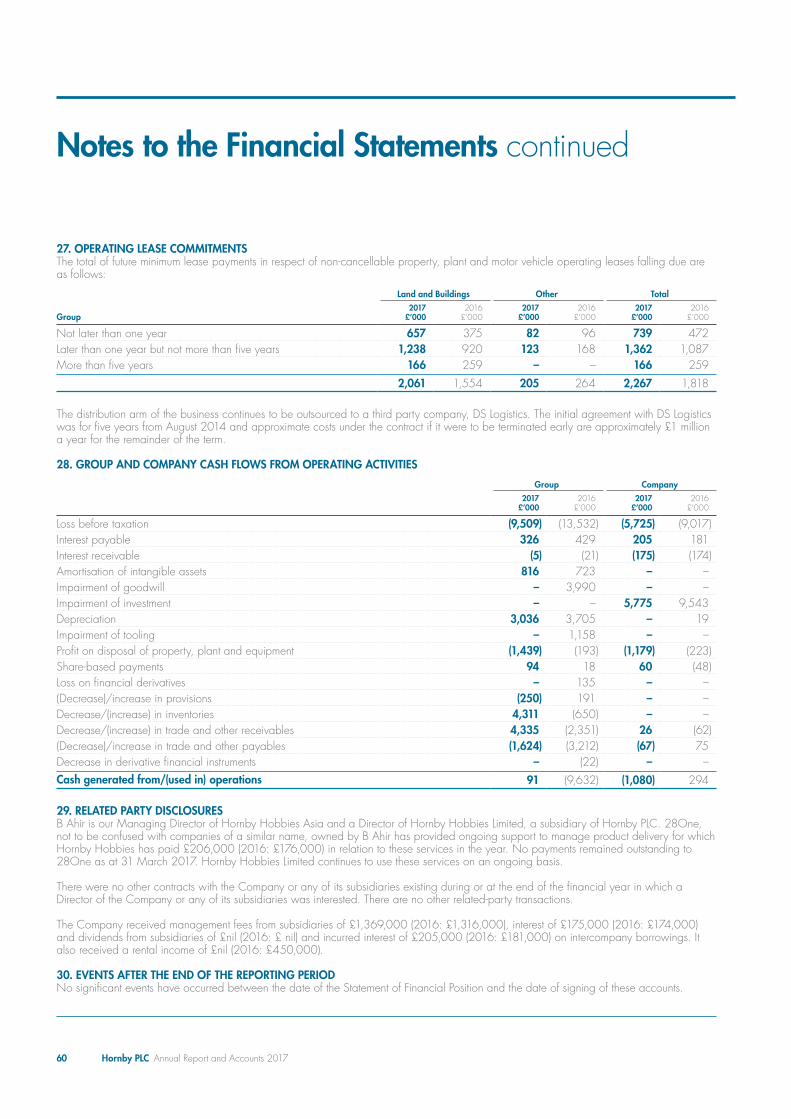
60 Hornby PLC Annual Report and Accounts 2017
27. OPERATING LEASE COMMITMENTSThe total of future minimum lease payments in respect of non-cancellable property, plant and motor vehicle operating leases falling due are as follows:
Land and Buildings Other Total
Group2017
£’0002016
£’0002017
£’0002016
£’0002017
£’0002016
£’000
Not later than one year 657 375 82 96 739 472Later than one year but not more than five years 1,238 920 123 168 1,362 1,087More than five years 166 259 – – 166 259
2,061 1,554 205 264 2,267 1,818
The distribution arm of the business continues to be outsourced to a third party company, DS Logistics. The initial agreement with DS Logistics was for five years from August 2014 and approximate costs under the contract if it were to be terminated early are approximately £1 million a year for the remainder of the term. 28. GROUP AND COMPANY CASH FLOWS FROM OPERATING ACTIVITIES
Group Company2017
£’0002016
£’0002017
£’0002016
£’000
Loss before taxation (9,509) (13,532) (5,725) (9,017)Interest payable 326 429 205 181Interest receivable (5) (21) (175) (174)Amortisation of intangible assets 816 723 – –Impairment of goodwill – 3,990 – –Impairment of investment – – 5,775 9,543Depreciation 3,036 3,705 – 19Impairment of tooling – 1,158 – –Profit on disposal of property, plant and equipment (1,439) (193) (1,179) (223)Share-based payments 94 18 60 (48)Loss on financial derivatives – 135 – –(Decrease)/increase in provisions (250) 191 – –Decrease/(increase) in inventories 4,311 (650) – –Decrease/(increase) in trade and other receivables 4,335 (2,351) 26 (62)(Decrease)/increase in trade and other payables (1,624) (3,212) (67) 75Decrease in derivative financial instruments – (22) – –Cash generated from/(used in) operations 91 (9,632) (1,080) 294
29. RELATED PARTY DISCLOSURESB Ahir is our Managing Director of Hornby Hobbies Asia and a Director of Hornby Hobbies Limited, a subsidiary of Hornby PLC. 28One, not to be confused with companies of a similar name, owned by B Ahir has provided ongoing support to manage product delivery for which Hornby Hobbies has paid £206,000 (2016: £176,000) in relation to these services in the year. No payments remained outstanding to 28One as at 31 March 2017. Hornby Hobbies Limited continues to use these services on an ongoing basis.
There were no other contracts with the Company or any of its subsidiaries existing during or at the end of the financial year in which a Director of the Company or any of its subsidiaries was interested. There are no other related-party transactions.
The Company received management fees from subsidiaries of £1,369,000 (2016: £1,316,000), interest of £175,000 (2016: £174,000) and dividends from subsidiaries of £nil (2016: £ nil) and incurred interest of £205,000 (2016: £181,000) on intercompany borrowings. It also received a rental income of £nil (2016: £450,000).
30. EVENTS AFTER THE END OF THE REPORTING PERIODNo significant events have occurred between the date of the Statement of Financial Position and the date of signing of these accounts.
Notes to the Financial Statements continued

OV
ERVIEW
STRATEG
IC REPO
RTG
OV
ERNA
NCE
FINA
NCIA
L STA
TEMEN
TS
61Hornby PLC Annual Report and Accounts 2017
If you have sold or otherwise transferred all of your ordinary shares in Hornby Plc, please forward this document as soon as possible to the purchaser or transferee, or to the stockbroker, bank or other agent through or to whom the sale or transfer was effected for transmission to the purchaser or transferee of your ordinary shares.
NOTICE OF ANNUAL GENERAL MEETINGNotice is hereby given that the thirty-sixth Annual General Meeting of Hornby Plc (the ‘Company’) will be held at the offices of Berwin Leighton Paisner LLP, Adelaide House, London Bridge, London, EC4R 9HA on Wednesday, 6 September 2017 at 11.00 a.m. for the following purposes:
To consider and, if thought fit, to pass the following resolutions, of which numbers 1 to 8 (inclusive) will be proposed as ordinary resolutions and numbers 9 and 10 as special resolutions.
ORDINARY RESOLUTIONS1. To receive and adopt the Company’s Annual Report and Accounts for the financial year ended 31 March 2017 together with the Report
of the Directors and Auditors.
2. To approve the Directors’ Remuneration, as set out within the Directors’ Report on pages 22 to 24 of the Company’s Annual Report and Accounts, for the financial year ended 31 March 2017.
3. To re-elect Martin George as a Director of the Company.
4. To re-elect David Adams as a Director of the Company.
5. To re-elect James Wilson as a Director of the Company.
6. To reappoint PricewaterhouseCoopers LLP, the retiring auditors, as auditors of the Company to hold office from the conclusion of the Annual General Meeting to the conclusion of the next meeting at which accounts are laid before the Company.
7. To authorise the Directors to agree the auditors’ remuneration.
8. THAT, in place of the equivalent authority given to the Directors at the last Annual General Meeting (but without prejudice to the continuing authority of the Directors to allot shares pursuant to an offer or agreement made by the Company before the expiry of the authority pursuant to which such offer or agreement was made), the Directors be generally and unconditionally authorised in accordance with section 551 of the Companies Act 2006 (the ‘Act’) to allot shares in the Company or grant rights to subscribe for or to convert any security into shares in the Company up to a maximum aggregate nominal amount of £281,944.01, provided that this authority shall expire at the conclusion of the Company’s next Annual General Meeting following the date of the passing of the resolution, but so that the Company may, before the expiry of such period, make an offer or agreement which would or might require shares to be allotted or rights to subscribe for or convert securities into shares to be granted after the expiry of such period and the Directors may allot shares or grant rights to subscribe for or convert securities into shares pursuant to such an offer or agreement as if this authority had not expired.
Notice of Annual General Meeting (Unaudited)
62 Hornby PLC Annual Report and Accounts 2017
SPECIAL RESOLUTIONS9. THAT, subject to and conditional on the passing of resolution 8, the Directors be empowered, pursuant to section 570 of the Act, to allot
equity securities (within the meaning of section 560 of the Act) for cash pursuant to the authority conferred by resolution 8 as if section 561(1) of the Act did not apply to any such allotment, provided that this power shall be limited to the allotment of equity securities:
(a) in connection with an offer of such securities by way of Rights Issue (defined below); (b) otherwise than pursuant to resolution 9(a) above up to an aggregate nominal amount of £42,291.60; and(c) in addition to the amount in paragraph 9(b) above, the allotment of equity securities for cash up to an aggregate nominal amount of
£42,291.60, provided that any allotment of equity securities under this paragraph 9(c) shall only be used in connection with an acquisition or specified capital investment,
and that this authority shall expire at the conclusion of the Company’s next Annual General Meeting following the date of the passing of the resolution, save that the Company may, before such expiry, make an offer or agreement which would or might require equity securities to be allotted after such expiry and the Directors may allot equity securities in pursuance of any such offer or agreement as if this power had not expired.
This power applies in relation to a sale of treasury shares as if all references in this resolution to an allotment included any such sale and in the first paragraph of the resolution the words ‘pursuant to the authority conferred by resolution 8’ were omitted in relation to such sale.
In this resolution, ‘Rights Issue’ means an offer of equity securities open for acceptance for a period fixed by the Directors to holders of ordinary shares in the capital of the Company on the register on a record date fixed by the Directors in proportion as nearly as may be to the respective numbers of ordinary shares held by them, but subject to such exclusions or other arrangements as the Directors may deem necessary or expedient to deal with any treasury shares, fractional entitlements or legal or practical issues arising under the laws of, or the requirements of any recognised regulatory body or any stock exchange in any territory or any other matter.
10. THAT the Company be generally and unconditionally authorised to make market purchases (within the meaning of section 693(4) of the Act) of ordinary shares on such terms as the Directors think fit, and where such shares are held as treasury shares, the Company may use them for the purposes set out in section 727 of the Act, including for the purpose of its employee share schemes, provided that:
(a) the maximum number of ordinary shares hereby authorised to be purchased is 8,458,320;(b) the minimum price, exclusive of any expenses, which may be paid for an ordinary share is 1 pence;(c) the maximum price, exclusive of any expenses, which may be paid for each ordinary share is an amount equal to the higher of:
ii. (105%, of the average of the middle market quotations for an ordinary share, as derived from the London Stock Exchange Daily Official List, for the five business days immediately preceding the day on which the ordinary share is contracted to be purchased; and
iii. the amount equal to the higher of the price of the last independent trade of an ordinary share and the highest current independent bid for an ordinary share as derived from the London Stock Exchange trading service SETS; and
(d) the authority hereby conferred shall, unless previously revoked or varied, expire at the conclusion of the Company’s next Annual General Meeting following the date of the passing of this resolution, or, if earlier, on the expiry of 18 months from the date of the passing of this resolution (except in relation to the purchase of ordinary shares, the contract for which was concluded before the expiry of this authority and which will or may be executed wholly or partly after such expiry).
By order of the Board
D MulliganCompany SecretaryDated: 11 August 2017Registered office: 3rd Floor, The Gateway, Innovation Way, Discovery Park, Sandwich, Kent, CT13 9FFRegistered in England and Wales with number 01547390
Notice of Annual General Meeting (Unaudited)continued

OV
ERVIEW
STRATEG
IC REPO
RTG
OV
ERNA
NCE
FINA
NCIA
L STA
TEMEN
TS
63Hornby PLC Annual Report and Accounts 2017
NOTES (UNAUDITED)1. Only holders of ordinary shares, or their duly appointed representatives, are entitled to attend, vote and speak at the AGM. A member
so entitled may appoint (a) proxy/(ies), who need not be (a) member(s), to attend, speak and vote on his/her behalf. A member may appoint more than one proxy, provided that each proxy is appointed to exercise the rights attached to a different share or shares held by him/her. A form of proxy is enclosed with this Notice and instructions for its completion are set out on the form.
2. Proxies may only be appointed by completing and returning the form of proxy enclosed with this Notice to the Company’s Registrars, Capita Asset Services PXS1, 34 Beckenham Road, Beckenham, Kent BR3 4TU.
3. To be valid a proxy appointment and any power of attorney or other authority, if any, under which it is signed or a duly certified copy of such power of attorney must reach the office of the Company’s Registrars not less than 48 hours (excluding any part of a day which is not a working day) before the time fixed for the AGM or any adjournment thereof. Therefore, the form of proxy must be received by the Company’s Registrars by 11.00 a.m. on 4 September 2017.
4. Return of the form of proxy will not preclude a member from attending the AGM and voting in person. A vote withheld option is provided on the form of proxy to enable you to instruct your proxy to abstain on any particular resolution. However, it should be noted that a ‘vote withheld’ is not a vote in law and will not be counted in the calculation of the proportion of votes ‘For’ and ‘Against’ a resolution. If you select ‘Discretionary’ or fail to select any of the options, your proxy can vote as he or she chooses or can decide not to vote. Your proxy can also do this on any other resolution that is put to the AGM. A shareholder must inform the Company’s registrars in writing of any termination of the authority of a proxy.
5. The Company, pursuant to Regulation 41 of the Uncertificated Securities Regulations 2001, specifies that only those shareholders on the register of members of the Company as at close of business on 4 September 2017 (or, if the AGM is adjourned, shareholders on the register of members not later than 48 hours (excluding any part of a day which is not a working day) before the time fixed for the adjourned meeting) are entitled to attend and/or vote at the AGM (or any adjournment thereof) in respect of the number of shares registered in their name at that time. Subsequent changes to the register of securities shall be disregarded in determining the rights of any person to attend and vote at the AGM (or any adjournment thereof).
6. Any corporation which is a member can appoint one or more corporate representatives who may exercise on its behalf all of its powers as a member provided that they do not do so in relation to the same shares.
7. In order to facilitate voting by corporate representatives at the AGM, arrangements will be put in place at the meeting so that (i) if a corporate member has appointed the Chairman of the meeting as its corporate representative with instructions to vote on a poll in accordance with the directions of all of the other corporate representatives for that member at the meeting, then on a poll those corporate representatives will give voting directions to the Chairman and the Chairman will vote (or withhold a vote) as corporate representative in accordance with those directions; and (ii) if more than one corporate representative for the same corporate member attends the meeting but the corporate member has not appointed the Chairman of the meeting as its corporate representative, a designated corporate representative will be nominated, from those corporate representatives who attend, who will vote on a poll and the other corporate representatives will give voting directions to that designated corporate representative. Corporate members are referred to the guidance issued by the Institute of Chartered Secretaries and Administrators on proxies and corporate representatives – http://www.icsa.org.uk/ for further details of this procedure. The guidance includes a sample form of representation letter if the Chairman is being appointed as described in (i) above.
8. You may not use any electronic address provided in this Notice or in any related documents (including the form of proxy) to communicate with the Company for any purposes other than those expressly stated.
64 Hornby PLC Annual Report and Accounts 2017
Hornby welcomes contact with its shareholders.
If you have questions or enquiries about the Group or its products, please contact:
D MulliganGroup Finance DirectorHornby PLC3rd Floor, The GatewayInnovation WayDiscovery ParkSandwich Kent CT13 9FFwww.hornby.com
Shareholders’ Information Service


Hornby PLC3rd Floor, The Gateway, Innovation WayDiscovery Park, SandwichKentCT13 9FFwww.hornby.com
ANNUAL REPORT AND ACCOUNTS 2017
5213HH-Hornby_PLC_Annual_Report_2017.Indd 1 05/06/2017 14:18
Ho
rnb
y PLC A
nn
ua
l Rep
ort a
nd
Ac
co
un
ts 2017