annual report and update 2004-2005
TRANSCRIPT

Annual report and update
2004-2005
Investment Number: 01-85-08072

COMPREHENSIVE ECONOMIC DEVELOPMENT STRATEGY 2005
Puerto Rico Planning Area • Annual Report • CEDS Update • EDA Investment Number: 01-85-08072 i
July 2005
Mr. Paul M. RaetschRegional DirectorU.S. Department of CommerceEconomic Development AdministrationThe Curtis Center Suite 140 SouthIndependence Square WestPhiladelphia, PA 19106
Dear Mr. Raetsch:
On behalf of the Commonwealth of Puerto Rico, the Puerto Rico Development Area, the Office of theGovernor, the Planning Board of Puerto Rico (PRPB), and the Comprehensive Economic DevelopmentStrategy (CEDS) committee, please accept submission of the Puerto Rico CEDS Annual Report, our2005 update of the island-wide CEDS. Please note, this document was prepared in accordance with theguidelines established by the U.S. Department of Commerce under the provisions of the Public Worksand Economic Development Act of 1965, as amended; and, the comprehensive amendments by theEconomic Development Administration Reform Act of 1998, (PAEDA); and, the Investment PolicyGuidelines of the EDA.
As was the case last year, this year’s report our 2005 CEDS Update reflects our considerable involvement,during fiscal year 2004, in the Puerto Rico 2025 initiative. As you may recall, said project was a majormulti-sector development initiative and reflected our authentic commitment to stakeholder-led strategicdevelopment. Consequently, now more than ever, the strategies, goals and objectives articulated hereinrespond to the genuine strengths, weaknesses, opportunities, and threats which confront our economyand environment.
As always, we look forward to continuing our efforts to improve economic development planning inPuerto Rico, in partnership with the EDA and its distinguished Region 2 staff.
Sincerely,
Ángel D. Rodríguez
Chairman
MINILLAS GOVERNMENT CENTERDE DIEGO AVE., STOP 22, SANTURCEPO BOX 41119, SAN JUAN, PUERTO RICO 000940-1119
COMMONWEALTH OF PUERTO RICOOFFICE OF THE GOVERNORPLANNING BOARD

COMPREHENSIVE ECONOMIC DEVELOPMENT STRATEGY 2005
Puerto Rico Planning Area • Annual Report • CEDS Update • EDA Investment Number: 01-85-08072 ii
COMPREHENSIVE ECONOMIC
DEVELOPMENT STRATEGY
ANNUAL REPORT AND UPDATEFY 2005
The preparation of this report was financially supported througha federal grant from the United States Department of
Commerce, Economic Development Administration, underSection 301 (b), Title III of the Public Works andEconomic Development Act of 1965, as amended.
Including the comprehensive amendments by the EconomicDevelopment Administration Reform Act of 1998, (PAEDA)
EDA Investment Number: 01-85-08072

COMPREHENSIVE ECONOMIC DEVELOPMENT STRATEGY 2005
Puerto Rico Planning Area • Annual Report • CEDS Update • EDA Investment Number: 01-85-08072 iii
Economic and Statistical Staff:Marieli Álvarez UlloaLuis Aviles RiveraRosa Burgos BonillaNéstor Crespo SotoJuan Cruz UrbinaAlejandro Díaz MarreroRonald Irizzry VelázquezNelson López EsquerdoCarmelo Navarro DíazAida A. Nevárez RiveraEvelyn Ortiz MaldonadoElda I. Parés RosadoAngel L. Rivera MontañezHéctor Rivera Reyes
Secretarial Staff:Oneida Cruz GonzálezLuz M. Febus OrtizCarmen M. Santos MarreroNancy Rodríguez CaraballoWanda I. Semidey Montañez
Graphics Arts Team:Nancy Más Marrero - Pavel De Jesús, MPP - Aida A. Nevárez Rivera
Ángel D. Rodríguez, Eng.Chairman
Puerto Rico Planning Board
Prof. José M. Auger MarchandDirector
Economic and Social Planning Program
Pavel De Jesús, MPPSpecial Assistant - Chairman
CEDS Executive DirectorCEDS Chief Editor
William Echevarría RiveraDirector
Models, Projections andSocial Analysis Subprogram
José L. Vélez QuiñonesDirector
Statistics Subprogram
Gerardo Sanchez DuvergéDirector
Economomic Analysis Subprogram
Lillian Torres AguirreDirector
Office of the Census
COMPREHENSIVE ECONOMIC DEVELOPMENT STRATEGY 2005
Puerto Rico Planning Area • Annual Report • CEDS Update • EDA Investment Number: 01-85-08072 iii

COMPREHENSIVE ECONOMIC DEVELOPMENT STRATEGY 2005
Puerto Rico Planning Area • Annual Report • CEDS Update • EDA Investment Number: 01-85-08072 iv
Cover
Cover Letter: Chairman Ángel D. Rodríguez i
Title Page ii
Acknowledgment of PRPB Staff iii
Table of Contents iv
PR 2025 Thanks and Acknowledgment vii
Editor’s Note ix
Section I: Organization and Management 1Introduction 1The Executive Branch 1Inside the Puerto Rico Planning Board 2Central Goal and Principal Objectives of the PRPB 3PRPB Organizational Flowchart 3Instruments of Planning Policy 4Eligibility and Responsibility 4PRPB Investment Analysis and the EDA Investment Policy Guidelines 5Organizing and Staffing for Economic Development 6Membership on the CEDS Committee 7Composition of the CEDS Committee 7Staff Support for the CEDS Committee 9Procedures and Internal Mechanisms of the CEDS Committee 9Program Effectiveness 12
Section II: Puerto Rico’s Economy Today and Tomorrow, Assessment and VisionThe Economy of Puerto Rico During FY 2004, and Projections for FY 2005 and FY 2006 14
Introduction 14Setting the Context 14
The Economy of Puerto Rico During FY 2004; Overall Performance 14The Economy of Puerto Rico During FY 2005; The Monthly Economic Indicators 17Macroeconomic Projections For FY 2005 and FY 2006 21
The United States Economy 22Adjusted Exports 23Visitor’s Expenditures 23Construction Activity 24Equipment and Machinery 25Federal Transfer Payments 25
Economic Perspectives for FY 2005 and FY 2006, in the Context of Historic Trends 25Gross Product 26Personal Income and personal Consumption 26
Table of Contents
Topic Pages

COMPREHENSIVE ECONOMIC DEVELOPMENT STRATEGY 2005
Puerto Rico Planning Area • Annual Report • CEDS Update • EDA Investment Number: 01-85-08072 v
Why Project Puerto Rico 2025? 27Credit and What Follows 30The Stakeholder-led Approach 31The Puerto Rico 2025 Work Plan 31Participation in Puerto Rico 2025 33Descriptions of Economic Development Conditions;
the PR 2025 Economic Assesment and Vision 34Local Businesses and Entrepreneurship 36High-Tech Industries 38Knowledge-Based Services 40Trade and the Travel Industry 42The New Agriculture 44
Descriptions of Land Use and Natural Resource Conditions;the PR 2025 Environmental Assesment and Vision 45
Environmental Quality 45Land Use 47Water and Waste 48Energy 49Transportation 51Information and Telecommunications Infrastructure 53
Section III: Strategies and Objectives; Charting a Course to a Dynamic Economic Future 55Implications of the Assessment Vision 55Overview of the Methodology for the Strategic Prioritization Phase 57The New Development Paradigm 59Common Themes Among the PR 2025 Strategies and Objectives 61Governor Acevedo Vila’s Initiatives 61
Personal Responsibility 61A New Direction 62Public Spending and Redirecting Resources 65Increasing Public Revenues 66Working in Concert 67
What Follows: The Strategies 68Strategies for immediate start 69Strategies to be started in the short-term 71Strategies to be started in the medium-term 74Strategies to be started in the long-term 77Utilities – Fundamental Objectives from the Vision 79Utilities – Strategies and Objectives 79Utilities – Direct Benefit versus “Do-ability” 81Transport – Fundamental Objectives from the Vision 82Transport – Strategies and Objectives 82Transport – Direct Benefit versus “Do-ability” 84Land Use and Environment – Fundamental Objectives from the Vision 85Land Use and Environment – Strategies and Objectives 85Land Use and Environment – Direct Benefit versus “Do-ability” 87
Topic Pages

COMPREHENSIVE ECONOMIC DEVELOPMENT STRATEGY 2005
Puerto Rico Planning Area • Annual Report • CEDS Update • EDA Investment Number: 01-85-08072 vi
Competitiveness – Fundamental Objectives from the Vision 88Competitiveness – Strategies and Objectives 88Competitiveness – Direct Benefit versus “Do-ability” 90Opportunities and Income – Fundamental Objectives from the Vision 91Opportunities and Income – Strategies and Objectives 91Opportunities and Income – Direct Benefit versus “Do-ability” 93Innovation – Fundamental Objectives from the Vision 94Innovation – Strategies and Objectives 94Innovation – Direct Benefit versus “Do-ability” 97Strategies in the Productivity and Competitiveness area - Organized by Flowchart 98Strategies in the Opportunity and Income area - Organized by Flowchart 98Strategies in the Innovation area - Organized by Flowchart 99Strategies in the Enterprise area - Organized by Flowchart 99Strategies in the Education area - Organized by Flowchart 100Strategies in the Health area - Organized by Flowchart 101Strategies in the Public Safety area - Organized by Flowchart 102Strategies in the Culture area - Organized by Flowchart 103Strategies in the Utilities area - Organized by Flowchart 104Strategies in the Land-use and Environment area - Organized by Flowchart 104Strategies in the Transport area - Organized by Flowchart 105
Section IV: The Implementation Plan; Commencement and Execution 106The CEDS Evaluation Process 106Phases of Evaluation 106Grading System 107Continued General Advisory Regarding Process Changes 107Formal Invitation to EDA 107All Investment Proposals Considered, FY 2005 108Tabular Summary of Investment Proposals Submitted 110
Appendix A: Statistics and Data

COMPREHENSIVE ECONOMIC DEVELOPMENT STRATEGY 2005
Puerto Rico Planning Area • Annual Report • CEDS Update • EDA Investment Number: 01-85-08072 vii
Puerto Rico 2025Thanks and Acknowledgements
The development of the Puerto Rico 2025 Vision and Call to Action has dependedentirely on the active participation of thousands of individuals and organizations.The individuals who have contributed their time and insights are too numerous toname, but the Puerto Rico 2025 Steering Committee has formerly recognized thefollowing organizations and individuals who have provided significant support andresources to the project:
Community and non-profit organizations:
Fundación Comunitaria*; Fundos Unidos; Asociación de Organizaciones Comunitariasde Vivienda de Interés Social; Asociación de Pacientes y Familiares de Pacientes deParkinson; Banco de Alimentos de PR; Boys and Girls Club; Boys Scouts of America;Concilio Caribe de Niñas Escuchas; Esperanza para la Vejez; Iniciativa Comunitariapara la Revitalización; Lucha contra el Sida; YMCA; Comité Comunitario Pro Vivienda;Corporación de Servicios de Salud y Medicina Avanzada
Aibonito: Casa Pensamiento; Arecibo: Oficina para el Desarrollo Humano; Bayamón:Centro Geriátrico El Remanso; Fundación Acción Social Refugio Eterno; Hogar deNiños Forjadores de Esperanza; Hogar Escuela Sor María Rafaela; InstitutoPsicopedagógico; Sociedad Puertorriqueña de Epilepsia; Caguas: Centro deEnvejecientes Club de Oro; Colegio Católico Notre Dame; Fundesco; Proyecto Adiósa las drogas...a Dios; Caimito: Christian Community Center; Juncos, Canovanas:Hogar Fuente de Vida; Cataño: Asociación Pro Juventud del Barrio Palmas; Cayey:Centro de Orientación Mujer y Familia; Centro de Respiro y Rehabilitación SanFrancisco, Ceiba: Corporación de Desarrollo Económico de, Cidra: Centro Margarita;Cupey: Centro de Servicios Comunitarios Vida Plena; El Hogar del Niño; Fajardo:Integral Community Development Corporation; Guánica: Instituto Especial para elDesarrollo Integral del Individuo, Familia y Comunidad; Guaynabo: Centro Renacer,Fundación Puertorriqueña Síndrome de Down; Humacao: Casa de la Bondad; Centrode Enseñanza para la Familia; Oficina para el Desarrollo; Programa de EducaciónComunal de Entrega y Servicio (PECES); Loíza: Centro Esperanza; Centro Providenciapara Personas de Mayor Edad; Mayagüez: Corporación de Desarrollo del Oeste;Naranjito: Programa del Adolescente de; Ponce: NHS; Instituto Pre Vocacional eIndustrial; San Germán: Hogar Portal de Amor; Movimiento Juan XXI; San Juan:Casa La Providencia; Centro Joaquina Vedruna; Concilio de la Comunidad, LlorénsTorre; Colegio de Actores de Teatro de Puerto Rico; Colegio San Gabriel para NiñosSordos; Iglesia Presbiteriana, Puerto Nuevo; Instituto de Servicios Comunales,Instituto del Hogar Celia y Harris Bunker, Proyecto Península de Cantera; CaparraTerrace, SJ: Salvation Army; Hato Rey, SJ: Movimiento para Alcance de VidaIndependiente (MAVI); Puerto Nuevo, SJ: Centro de Ayuda Social; Rio Piedras, SJ:Centro APACEDO; Colegio de Educación Especial y Rehabilitación Integral (CODERI)Fundación Hogar Niñito Jesús; Hogares Rafaela Ybarra; Santurce, SJ: Fundación Dr.García Rinaldi; La Fondita de Jesús; Residencial Las Margaritas; Toa Baja: Corporaciónde Desarrollo de Vivienda de; Trujillo Alto: Fundesco; Hogar Resurrección; VegaAlta: Hogar Ruth.

COMPREHENSIVE ECONOMIC DEVELOPMENT STRATEGY 2005
Puerto Rico Planning Area • Annual Report • CEDS Update • EDA Investment Number: 01-85-08072 viii
Business organizations and professional associations:
Cámara de Comercio*; Asociación de Industriales*; Asociación de Banqueros*;Asociación de Hoteles y Turismo*; Asociación de Paradores; Asociación deExportadores; Asociación de Productos; MIDA; Pharmaceutical Industry Association;Securities Industry Association ; Asociación de Constructores de Hogares; Asociaciónde Contratistas Generales ; Liga de Cooperativas ; Colegio de Médicos Cirujanos;Colegio de Ingenieros y Agrimensores; Colegio de Arquitectos y Arquitectos Paisajistas;Colegio de Contadores Públicos Autorizados; Asociación de Economistas*; SociedadPuertorriqueña de Planificación*; Center for the New Economy; PROCOMP
Educational institutions:
Departamento de Educación*; Asociación de Educación Privada; Superintendenciade Escuelas Católicas; Universidad de Puerto Rico; Universidad del Sagrado Corazón;Universidad Interamericana; Sistema Universitario Ana G. Méndez; Carlos AlbizuUniversity; Universidad Politecnica.
Government agencies and public authorities:
Departamento de Desarrollo Económico y Comercio*; Oficina de Gerencia yPresupuesto; Administración de Fomento Económico e Industrial (PRIDCO)*; Juntade Planificación*; Departamento de Corrección y Rehabilitación; Departamento deEducación*; Departamento de Justicia; Departamento de la Familia; Departamentode Recreación y Deportes; Departamento de Recursos Naturales y Ambientales*;Departamento de Salud; Departamento del Trabajo y Recursos Humanos;Departamento de Transportación y Obras Públicas*; Departamento de Vivienda;Administración de Fomento Comercial*; Banco de Desarrollo Económico; BancoGubernamental de Fomento (BGF)*; Administración de Familia y Niños; Administraciónde Seguros de Salud de PR (ASES); Administración de Servicios Médicos (ASEM);Centro Cardiovascular de PR y del Caribe; Escuela de Artes Plásticas; Oficina delControl de Drogas; Autoridad de Acueductos y Alcantarillados (AAA); Autoridad deCarreteras y Transportación*; Autoridad de Energía Eléctrica; Autoridad de los Puertos;Compañía de Turismo*; Junta de Calidad Ambiental (JCA)*; Junta Reglamentadorade Telecomunicaciones
Coordinating team:
The team of professionals from: DDEC*, PR Planning Board*, La Fortaleza, H. CaleroConsulting Group, Alfredo Carrasquillo, and A.T. Kearney, who, together, have providedthe day-to-day coordination of project Puerto Rico 2025.
* Indicates an organization that participates in the CEDS committee

COMPREHENSIVE ECONOMIC DEVELOPMENT STRATEGY 2005
Puerto Rico Planning Area • Annual Report • CEDS Update • EDA Investment Number: 01-85-08072 ix
Editor’s Note:
It is my great pleasure to share with you, on behalf of the Commonwealth of Puerto Rico,the Puerto Rico Development Area, the Office of the Governor, the Planning Board ofPuerto Rico (PRPB), and the Comprehensive Economic Development Strategy (CEDS)committee—the 2005 Puerto Rico CEDS Annual Report, our 2005 update of the island-wide CEDS.
As was the case last year, substantive portions of this year’s report the 2005 CEDS Updatedraw upon the deliverables of project Puerto Rico 2025 and consequently reflects mynearly daily participation in the project during fiscal year 2004.
As you may recall, I was a member of the local contingent of the Puerto Rico 2025 projectCoordination Team, I worked with professionals from Departamento de DesarrolloEconómico y Comercio (DDEC), the PRPB, La Fortaleza, H. Calero Consulting Group,Alfredo Carrasquillo, and A.T. Kearney, providing day-to-day coordination and work onthe project. Together we were able to help Puerto Rico complete a broad-based, non-partisan initiative to develop a long-term vision and strategic plan for Puerto Rico.Fundamentally, the project was a major multi-sector development initiative and the goalsand objectives it generated reflect the collective determinations of Puerto Rican society toa greater degree than any development plan to which I have been privy.
While many of Puerto Rico’s previous economic development strategies have drawn thesame conclusions or made similar recommendations—after all, the problems remain largelythe same—none had previously sought to stand that process in an organic, fundamentallydemocratic, stakeholder driven process. Consequently, as its foundation for success, thePuerto Rico 2025 initiative had a broad stakeholder coalition of community, business, andlabor leaders, as well as policy-makers, academicians, opinion shapers, and decision makers.This depth of direct participation was enriched through surveys, community meetings,workshop, and many extensive sectoral consultive panel meetings. Accordingly, the inputand expertise of thousands of Puerto Rico’s residents, citizens, and friends of the initiativefurther improved the project outputs.
Development and validation of strategies
for the 10 focus areas
Evaluation of the strategies
in terms of contribution to
achieve the Vision
Prioritization of strategies and
definition of implementation
packages
Assessment Results
Vision Puerto Rico 2025
Interviews with experts
Stakeholder & A.T. Kearney
Global experience
Immediate term
strategies
Short-term strategies
Medium-term strategies
Long-term strategies
Strategic PlanA Strategic Plan Development
Source: Puerto Rico 2025
Strategic Plan Development

COMPREHENSIVE ECONOMIC DEVELOPMENT STRATEGY 2005
Puerto Rico Planning Area • Annual Report • CEDS Update • EDA Investment Number: 01-85-08072 x
In its totality, this range of participation and the subsequent leverage of expertise and insightensured that the project outputs of are of such a scope and breadth that they clearlyexceed the ability of any one organization to accomplish or any previous initiatives’inclusiveness. While the work product of the Puerto Rico 2025 initiative encompassesmany—if not all—critical aspects of Puerto Rico’s development concerns—the economic,socio-cultural, environmental (and infrastructure) development dynamics—the 2004 CEDSand now the 2005 CEDS Update, utilizes, in particular, those outputs from the Economicand Environmental topic areas.
Jointly, these two umbrella topic areas cover all the requirements of the CEDS in theirconsiderable discussion of Economic Development Conditions as well as Land Use andNatural Resource Conditions.
To that end, the analytical framework applied to each topic area was, and remains, twofold:
• First, during the assessment and visioning project phases, the inputs—research,literature reviews, interviews, data and panel findings—were subjected to SWOTanalysis (or Strengths Weaknesses Opportunities and Threats) then, the outputswere validated and organized for presentation; and,
• Second, during the prioritization and implementation phases, the project the outputswere refined and enhanced through further validation, editorial clarifications. Finally,under the facilitation and leadership of Prof. Carlos E. Bana, London School ofEconomics, MCDA protocols (or Multi-Criteria Decision making Analysis) wereused to prioritize the strategies articulated from the vision phase.
The resultant outputs of Puerto Rico 2025—the analytical content as well as the vision andstrategy articulation—comprises nearly half of Section II: Puerto Rico’s Economy Todayand Tomorrow; Assessment and Visioning and nearly the entirety of Section III:Goals and Objectives. And, as was the case last year, it is my expectation that you willfind this year’s 2005 update to be an informative and rewarding guide for economicdevelopment policy and funding decicions.
Nevertheless, I would also like to underscore, that this year, we return to using many ofour traditional sources of economic reporting and analysis through the inclusion of relevantanalytical products and deliverables as published by the PRPB. For example, the firstportion of Section II: Puerto Rico’s Economy Today and Tomorrow, Assessmentand Visioning. This Sub-Section pertains to revising reports on the performace of theeconomy during 2004 and, divulging perliminary data on the performace, thus far, of theeconomy during 2005 as well as, fortcasts regarding the expected performance during 2006.
Sincerely,
Pavel De Jesús, MPPSpecial Assistant of the ChairmanCEDS Committee Executive Director

COMPREHENSIVE ECONOMIC DEVELOPMENT STRATEGY 2005
Puerto Rico Planning Area • Annual Report • CEDS Update • EDA Investment Number: 01-85-08072 1
Introduction
Accepted by voters in a referendum in March 1952,the Constitution that created the Commonwealth ofPuerto Rico, was drafted by an elected constituentassembly, later ratified by U.S. Congress, and subse-quently proclaimed on July 25, 1952. Puerto Rico’sconstitution defines internal government terms andprocesses similar to those of the U.S., for examplePuerto Rico elects a two-chamber Legislature, anExecutive and a Judicial Branch. Every four years atthe same time that the US Presidential election isheld, Puerto Ricans vote for a Governor, currentlythe Honorable Anibal Acevedo Vila, as well as itslegislative representatives.
The primary document defining the relationship be-tween Puerto Rico and the federal government, en-titled the Federal Relations Statute, consists ofthose elements of the historically significant JonesAct of 1917 which were not rendered null by thecreation of the Commonwealth status. Under the termsof the Federal Relations Statute, the federal govern-ment exerts authority over all activities related toforeign relations and defense, as well as postal andcustoms services. The measure also provides that alltrade between Puerto Rico and the U.S. must becarried in US flag bearing vessels.
Traditionally the three mainstays of Puerto Rico’s re-lationship with the U.S. are a common currency, acommon defense and US citizenship. Yet, at thesame time as Puerto Ricans residing in Puerto Ricoare United States citizens, they do not enjoy the rightto participate in national elections. While Puerto Ricodoes benefit from representation in the United StatesHouse of Representatives through its ResidentCommissioner, Puerto Ricans maintaining fulltimeresidency on the island neither vote in Presidentialelections nor for the election of members of UnitedStates Senate as these privileges are expressly pro-hibited.
Please note, except on certain specified congressionalcommittees, the Resident Commissioner does not ex-
ercise the FULL privilege of vote, yet, does exercisethe privilege of voice. For further details, pleaseview the web-site of the office of the Resident Com-missioner at http://www.house.gov/fortuno.
The Executive Branch
During the recent past, the Executive Branch ofPuerto Rico has undergone significant structural re-organization, and continues to do so, the focus ofwhich has been downsizing government, improvingefficiency and lowering operational costs. The pri-mary means of lowering operational costs has beenexecuted through the concept of Umbrella Depart-ments—consolidation—whereby departments of thecentral government which share similar public policygoals and render related services have been joinedunder one roof or “umbrella”.
Using this structural configuration allows PuertoRico’s central government to capitalize on the ca-pacity of diverse agencies, programs and functionsto render seamless services to Puerto Rico’sgeneral public and specific client populations while,at the same time, maximizing opportunity for in-novation and cost reduction at the agency level.This structure has the advantage of also retainingsignificant command and control capacity. Crucialin this configuration are the component elementsof the greater Office of the Governor of theCommonwealth of Puerto Rico, they are; theOffice of the Chief of Staff, the Puerto RicoPlanning Board (PRPB), the Regulations andPermits Administration, the EnvironmentalQuality Board, the Central CommunicationsOffice and the Office of Management andBudget. In addition, created in 2001 under theCalderon Administration, a program to deal specifi-cally with the development necessities of PuertoRico’s poor communities—termed the SpecialCommunities Program—also works directly fromthe Governor’s Office.
The Umbrella Department concept was promulgatedon April 6, 1993 under the Executive Reorganization
Organization & Management; a guidefor those who do not know Puerto RicoSECTION I:

COMPREHENSIVE ECONOMIC DEVELOPMENT STRATEGY 2005
Puerto Rico Planning Area • Annual Report • CEDS Update • EDA Investment Number: 01-85-08072 2
Act of 1999, or Act Number 5, which also estab-lished the foundational umbrella departments, theyare:
1. Security (Commission on Security and Public Pro-tection), Prisons (Department of Correction andRehabilitation),
2. Natural Resources (Department of Natural Re-sources and the Environment),
3. Agricultural Activities (Department of Agricul-ture),
4. Industry, Trade and Tourism (Department ofEconomic Development and Commerce),
5. Human Resources and Employment Pro-grams (Department of Labor and Human Re-sources),
6. Public Finance (Department of the Treasury),and
7. Family and Community Services (Departmentof the Family).
Much of the savings garnered in the reorganizationand restructuring effort were derived from the elimi-nation of 18 public instrumentalities as well as theconsolidation of several public bodies and theprivatization of the Puerto Rico Maritime ShippingAuthority.
Inside the Puerto Rico PlanningBoard
The Puerto Rico Planning Board (PRPB) is part ofthe Office of the Governor of the Commonwealth ofPuerto Rico and was created pursuant to Act No.213 of 1942, and later reorganized under the PRPB’sOrganic Law, or Law No. 75 of June 24 1975 (itself,currently under revision).
On April 30, 2001, Governor, the Honorable SilaMaria Calderon amended the PRPB’s Organic Lawwith Law No. 26 in order to expand the size of thesitting board from three (3) full-time associated mem-bers to seven (7) full-time members. The Governorof Puerto Rico appoints the associated members forsixyear terms and designates one (1) of the associ-ated members as Chairperson of the entire Board.Board members must be reconfirmed at the start ofany new administration. The PRPB is currently com-posed of this seven (7) member full-time Board andone (1) alternate member.
Currently, the full Board is comprised of:
1. Mr. Angel D. Rodriguez, Eng.Chairman
2. Ms. Wanda Capó Rivera, JDVice Chair
3. Ms. Iris C. Cuadrado Gómez, Plan.Associated Member
4. Ms. Wanda Marrero , PhD.Associated Member
5. Mr. Frederick Muhlach, Arq.Associated Member
6. VacantAssociated Member
7. VacantAssociated Member
Long established as a meeting place for Puerto Rico’scommunity of planners and practitioners, the PRPBhas served as a natural point of coalescence amongindividuals involved in economic, social, and physicalplanning. Consequently, the PRPB is uniquely posi-tioned to coordinate and manage the preparation andapplication of the Comprehensive Economic Devel-opment Strategy (CEDS).
This capacity is derived of the PRPB’s ability to func-tion as a fulcrum, where participation of the publicand private sector is augmented by sound Micro andMacro analysis in strategy development. Sound datagathering, data collection, and harmonization of zon-ing conflicts and/or petitions form the backbone thePRPB’s ability; however, the PRPB is particularlyadept at both economic and demographic analysisand boasts considerable experience in organizing publicparticipation in policy formation.
Since its inception, the PRPB has striven to serve theCommonwealth of Puerto Rico—the population ofthe Commonwealth, public and private entities, thegovernment at large, and in particular, the local mu-nicipal governments (collectively our “clients”)—withdistinction and honor. As one of the oldest agenciesof the Commonwealth, with its antecedents in themilitary Governor’s administrative apparatus, thePRPB has served a principal role through most ofPuerto Rico’s periods of crucial physically growth,significant social transformation, and economic revo-lution. It is for this reason that, the PRPB is uniquelyprepared to manage the CEDS process.

COMPREHENSIVE ECONOMIC DEVELOPMENT STRATEGY 2005
Puerto Rico Planning Area • Annual Report • CEDS Update • EDA Investment Number: 01-85-08072 3
The PRPB’s interest, regarding the CEDS annualreport, is to develop an efficient instrument capableof guiding targeted and effective investment of tax-payer resources. These initiatives are framed as thoseactivities which will cultivate economic independenceand solvency at the regional and local municipal lev-els without sacrificing responsiveness to local input,participation, and accountability.
Central Goal and PrincipalObjectives of the PRPB
The central goal of the PRPB is to assist in themanagement of integrated economic, social and physi-cal development of the Commonwealth and leverageits comparative advantage as an interdisciplinary groupof planning professionals. To accomplish this centraltask, the PRPB adheres to eight (8) principal objec-tives. The objectives of the PRPB are the following:
To maintain a descriptive profile of the physical,economic and social resources of the island and par-ticipate in a proactive manner in the articulation andcoordination of their use for the sustainable develop-ment of Puerto Rico; and,
1) To prepare, adopt and recommend to theGovernor and the Legislative Assembly the pro-gramming of capital improvement initiatives; and,
2) To make viable the implementation of theMunicipal Reform Law and the territorial ordi-nance plans with the purpose of promoting thedecentralization of government services by meansof regionalization and transfer of services to themunicipalities and the private sector; and,
3) To elaborate a master plan for the develop-ment of areas of high tourism potential in orderto augment the participation of this economicsector; and,
4) To make the evaluation process and the grant-ing of construction permits more agile; and,
5) To promote citizen participation in the devel-opment of our cities and establishment of edu-cational programs concerning the environment;and,
6) To produce studies and analysis concerningsocial dynamics that can help the Commonwealthof Puerto Rico in formulating public policies re-garding the island’s social ills; and,
7) To make certain that Federal investment inPuerto Rico advances the defined objectives forthe island.
April 2002
Office of the Chairman PR Developmental
Disabilities Council Members of the Board
Secretary’s Office Legal Affairs
Office
Dept. of Information
Systems
Bureau Of Operations
Bureau of Geographic
Information Systems
Bureau Of Analysis and Programming
Dept. of Administration
Office of Auxiliary Services
Finance Office
Budget Office
Human Resources
Dept. of Economic & Social Planning
Office of the
Census
Federal Proposal Review Office
Dept. of Physical Planning
Office of Technical
Studies
Bureau of Economic Analysis
Bureau of Statistics
Bureau of Social Analysis, Models and
Projections
Bureau of Land Use
Construction
Bureau of Land Use Plans
Office of Information and Service Referal

COMPREHENSIVE ECONOMIC DEVELOPMENT STRATEGY 2005
Puerto Rico Planning Area • Annual Report • CEDS Update • EDA Investment Number: 01-85-08072 4
Together, these eight (8) principal objectives consti-tute the policy context of the PRPB’s activities as itmeets the responsibilities derived therein and the man-date set forth in the Organic Law, the enabling legis-lation.
The (8) principal objectives serve the additional pur-pose of reinforcing the PRPB’s philosophical andpractical belief in an enterprise-wide perspective, theentrepreneurial spirit, and the direct participation ofcitizens, experts, the public sector, and the privatesector in endeavors of economic, social and physicalplanning. It is the perspective of the PRPB, that to-gether these communities can plan a better, brighter,and more dynamic future for Puerto Rican society.
Instruments of Planning Policy
Since 1975, the Puerto Rico Planning Board’s taskshave varied to adjust to a more comprehensiveconcept of planning. As a result, the Puerto RicoPlanning Board is no longer required to prepare aMaster Plan, with mainly physical connotations. Itsprincipal responsibility is currently to formulate aComprehensive Development Plan (CDP). TheCDP includes policies and strategies that areimplemented through three distinct policy instruments;they are, a Land Use Plan (LUP), a Land Budget(LB), and a Four Year Investment Program (4YearPlan).
The LandUse Program designates the distributionand allocation of land resources among competinguses. Every project scheduled for execution inPuerto Rico must conform to the officialLandUse Plan, with particular emphasis placedon the Objectives and Public Policies articulatedtherein.
The LandBudget is prepared by in order toensure the best possible use of Puerto Rico’slimited land resources. The LB includesestimates of the quality and the location of landdemanded, as well as a priority system todetermine specific land uses during a given period.
The Four Year Investment Plan is a generaloutline of social and economic goals that the
Government strives to achieve at the end of afour year period. The 4Year Plan also serves asa tool to coordinate fixed investment by thegovernment required to realize macroeconomicgoals in specific sectors.
Traditionally the Comprehensive EconomicDevelopment Strategy (CEDS) is comprised,principally, of the CDP along with the CEDS AnnualReport (July). However, supplemental to these itemsare any committee approved needs assessments,planning studies, field visit briefs, and in particularspecialized development strategies—local economicdevelopment strategies or local comprehensiveinitiatives.
It is however, the distinct function of the CEDS annualreport to:
1. Articulate the extent to which, in the judgmentof the committee, said investment proposalconforms with and advances the goals andobjectives of the CEDS, and in particular asarticulated in the annual report; and,
2. Articulate the priority level, in terms of PuertoRico’s strategic economic development, ofany given investment proposal submitted forconsideration; and,
3. Articulate the extent to which, in the judgmentof the committee, said investment proposalconforms to the relevant EDA investmentguidelines and policies; and,
4. Articulate the extent to which, in the judgmentof the committee, said investment proposalqualifies for the EDA’s funding considerationpre-application process.
Eligibility and Responsibility
In view of Puerto Rico’s persistent highunemployment and low family income levels, theCommonwealth is eligible as a Redevelopment Areaunder the provisions of the Public Works andEconomic Development Act of 1965. The entiretyof Puerto Rico’s municipalities and their agencies arefully eligible to receive assistance from the United
COMPREHENSIVE ECONOMIC DEVELOPMENT STRATEGY 2005
Puerto Rico Planning Area • Annual Report • CEDS Update • EDA Investment Number: 01-85-08072 5
States Department of Commerce EconomicDevelopment Administration (EDA). To this end, thePRPB has been designated the agency responsiblefor coordinating the Commonwealth’s economicdevelopment planning process, in this case with aspecific emphasis upon the CEDS initiative.
Under the administration of the Honorable SilaMaria Calderon, a new permit process wasannounced, one which allows the PRPB toconcentrate on several of its comparativeadvantages. Advantages such as:
A) Economic, social and physical strategic planningthat is grounded in sound and comprehensiveanalysis; and,
B) Inter-entity coordination; and,
C) Leverage of a long-term planning horizon indecision making.
These responsibilities encompass economicdevelopment planning and include the organizationand coordination of the Comprehensive EconomicDevelopment Strategy (CEDS) as well as itscommittee that, in turn, serve as an advisory group tothe PRPB on the matter of economic development.
PRPB Investment Analysis andthe EDA Investment PolicyGuidelines
As transparency is an important priority of the PRPBand the Acevedo-Vila administration, in an effort tocommunicate with the citizenry, the PRPB hasprovided, and continues to provide, the following initialresponse, to the new Investment Policy Guidelinespromulgated by the EDA under the leadership ofDavid A. Sampson, U.S. Assistant Secretary ofCommerce for Economic Development – EDA.
1) Market-based: The PRPB engages themarket practically by maintaining two way informationflows between the PRPB and our client groups. Toaccomplish this, the PRPB uses a number of
instruments such as needs assessments, planningstudies, field visits, as well as sustained contact withcommunity leaders, industry leaders, and electedofficials.
This method allows the PRPB to emphasizesynergistic approach to problem solving.Philosophically, our central task, mission, and generalobjectives recognize the importance of opting forprivate sector (or quasi-public sector) solutions aspreferable, whenever feasible. In this way, the PRPBmakes market based economic development and jobcreation a central feature of our approach to theCEDS, and our EDA partnership.
2) Proactive Investments: The PRPB understandseffective economic development planning to requireproactive action, an enterprise-wide perspective,entrepreneurialism, partnership and collaboration. Weaim to achieve long term capacity improvementsvia successful short-term investments. Buildingtowards greater district capacity, the PRPB expectsinnovative uses of resources to characterize theCEDS document and the investments approvedtherein.
3) Economic Changes and Diversification:Besides responding to immediate economic conditions,the PRPB strives to anticipate the evolving needs ofour district in light of “the state of the field” ofeconomic analysis, development, and planning. Inaddition, the PRPB understands diversification, todescribe achievement of a condition whereby theorganic responses of the districts’ local economiesare dynamic and solvent. The organic responsecapability sought by the PRPB is dependent uponongoing efforts.
4) Private Capital Investment: The PRPBcontinues the tradition of underscoring the importanceof retention and expansion of private capitalinvestment in existing district industry, while alsoattracting new ventures to the district. In addition, inrecognition of the relationship between private capitalinvestment and demand for high skills (living wageearning skills), the PRPB maintains a focus onworkforce development (if not transformation) amongthe district’s labor force.

COMPREHENSIVE ECONOMIC DEVELOPMENT STRATEGY 2005
Puerto Rico Planning Area • Annual Report • CEDS Update • EDA Investment Number: 01-85-08072 6
5) High probability of success and including: ahigh level of local, state and private matching funds;a high degree of commitment of local political “capital”by elected officials; and a high level of commitmentof human resources to project outcomes: The PRPBCEDS process, as well as the evaluation criteriaderived from the strategy, reinforces the EDA’semphasis on demonstrating robust “shareholder”communities for a given investment proposal. TheCEDS benefits significantly from the PRPB’s role asa point of coalescence for Puerto Rico’s island widecommunity of “shareholders”.
6) Higher Paying Jobs: created improvement ofthe District’s average wage levels is a priority goalof the PRPB. Our CEDS process supports thoseproposed investment opportunities that are appropriategiven the level of community investment demonstratedby proponents as well as those investment proposalswhich create jobs providing wages above the areaaverage or the area median, depending upon whichis higher.
7) Return on Taxpayer Investment (RTI): ThePRPB provides the EDA a solid RTI by facilitatinga process that targets investment opportunitiescompliant with the EDA’s vision of economicdevelopment. The result is clear; quality investmentoptions of diminished risk that conform to bothcommunity needs and the plans and public policies ofthe Commonwealth, thereby delivering RTI for eachinvestment selected by the EDA. In this way,investment proposals of significant impact, and interest,to the district are identified and submitted forconsideration to the EDA.
The PRPB has articulated three (3) program leveltasks as a guide for its work with the CEDScommittee. They are as follows:
Task 1: To continue the process ofcomprehensive development planning, prioritizingeconomic stability, economic solvency andeconomic dynamism.
Task 2: To assess current proposals for economicdevelopment in light of the EDA’s new InvestmentPolicy Guidelines.
Task 3: To improve the system used to assignpriorities compatible with government goals atthe local level.
Organizing and Staffing ForEconomic Development
In Puerto Rico, the work of the ComprehensiveEconomic Development Strategy Committee(formerly known as the Economic DevelopmentEvaluation Committee) or CEDS Committee hasbeen assigned to the Puerto Rico Planning Board(PRPB). The entire island of Puerto Rico is classifiedas a “Redevelopment Area”—the Puerto RicoEconomic Development Area—as determined byit persistent high unemployment and low family incomelevels as well as those guidelines established by theEDA. Therefore, the CEDS Committee is responsiblefor the evaluation of all Investment Proposals(formerly known as project proposals) for economicdevelopment seeking EDA funds that originate inPuerto Rico.
It is the principal goal of the Commonwealth of PuertoRico, the PRPB, and the CEDS Committee, under itsobligation to the EDA as a participant in the EDA’splanning assistance investment program to ensure thatall investment proposals which the CEDS Committeerecommends for invitation to participate in the EDA’spre-proposal phase of EDA funding consideration havebeen evaluated and recommended by a body of theindividuals who are representative of various sectorsand groups in society which compose the communityof the Puerto Rico Economic Development Area andits economy.
The decisions of the CEDS Committee are made inaccordance with the public policies of TheCommonwealth of Puerto Rico. The CEDSCommittee works and operates independently of thedaily operations of the PRPB, although, fundingneeds for the CEDS Committee and its activitiesare met through both Federal and Local fundingshares. These “Shares” are provided annually bythe EDA and the PRPB on competitive basis whereinthe PRPB applies to maintain continued eligibilityfor the CEDS program.

COMPREHENSIVE ECONOMIC DEVELOPMENT STRATEGY 2005
Puerto Rico Planning Area • Annual Report • CEDS Update • EDA Investment Number: 01-85-08072 7
Membership on the CEDSCommittee
The CEDS Committee is composed of the designatedheads (or their representatives) of the following publicand private entities which represent the indicatedgroup. Those participants identified in the Bylaws ofthe CEDS Committee are:
Group: Entity:Local The Federation of Mayors Government (Federación de Alcaldes)
The Association of Mayors(Asociación de Alcaldes)
Business PR Chamber of Commerce(PR Camera de Comercio)PR Department of Commerce(Departamento de Comercio de PR)
Industry Industrial Association(Asociación de Industriales)PR Industrial DevelopmentCompany(Compañía de Fomento Industrial)
Finance Association of Banks(Asociación de Bancos)Economic Development Bank(Banco de Desarrollo Económico)
Agriculture Association of Agriculturalists(Asociación de Agricultores)PR Department of Agriculture(Departamento de Agricultura)
Professionals Association of Economists of PR(Asociación de Economistas de PR)Puerto Rican Society of Planners(Sociedad Puertorriqueña dePlanificación)
Education One expert in the area ofEducation (Un asesor de educación)
Women One women with knowledge ofplanning (Un mujer con conoci-miento de planificación)
Tourism PR Tourism Company(Compañía de Turismo)
Once a person is designated by the organization orrepresenting entity, this person is considered a“permanent member” of the CEDS Committee asdefined in the Bylaws. However, the CEDSCommittee may always recommend changes in itscomposition to the Chairman of the PRPB or his/herdelegate.
Although, the CEDS Committee Bylaws preserve theright of the PRPB Chairman to take action to changethe composition of the CEDS Committee underseveral terms and conditions, functionally, the post onthe CEDS committee is held by the institutionrepresenting that community. Normally, the term ofthe individual on the CEDS Committee coincides withthe term during which the individual occupies theirpost in the organization.
A majority of the members who are present at thepertinent meeting, wherein the Chairman of the PRPB(or his /her delegate) presides chooses the CEDSCommittee President. If a majority elects to, the CEDSCommittee may also establish other positions anddesignate its members, properly chosen by a majorityof the permanent members present at the pertinentmeeting, to additional positions such as CEDSCommittee Vice-president or Secretary, among others.The CEDS Committee Executive Director orSecretary may be a permanent member of the CEDSCommittee, although, it is not required.
Composition of the CEDSCommittee
The entire CEDS Committee is comprised of bothgovernment officials and citizens from the widercommunity whose participation on the CEDSCommittee is stipulated in the manner detailed above.Members are invited to participate on the committeein response to the particular expertise or knowledgearea their participation is expected to leverage.
The following is an updated membership roster ofthe CEDS Committee. This roster includes: (1) thename of each committee member, (2) each member’sprofessional title; and, (3) the name of each member’sorganization, in both English and Spanish (addresses

COMPREHENSIVE ECONOMIC DEVELOPMENT STRATEGY 2005
Puerto Rico Planning Area • Annual Report • CEDS Update • EDA Investment Number: 01-85-08072 8
are available upon request and with permission of theindividual member).
Hon. José ApontePresidentMayor’s Association / Asociación de Alcaldes
Edgardo Rodriguez, Alternate
Sra. Enid Toro de BaézPresidentUnited Retailers of Association of PRCentro Unido de Detallistas de PR
Hon. Jorge Silvas PurasSecretaryDepartment of Economic Development andCommerce / Departamento DesarrolloEconómico y Comercio
Hon. Jorge Silvas PurasInterim Executive DirectorPR Industrial Development Corp. (PRIDCO)Fomento Industrial de PR
Andres Gomez, Alternate
Dr. Nelson ColónDirectorPuerto Rico Community FoundationFundación Comunitaria de Puerto Rico
Ms. Alida Rivera, Alternate
Reynaldo EncarnaciónPresidentIndustrial AssociationAsociación de Industriales
Mr. Pavel De Jesús, MPPSpecial Assistant to the ChairmanExecutive Director, CEDS CommitteePuerto Rico Planning BoardJunta de Planificación de Puerto Rico
Juan Santiago, Agro.PresidentAgricultural FederationFederación de Agricultores
Mr. Carlos W. LópezChairman DesignateEnvironmental Quality Board (EQB)Junta de Calidad Ambiental (JCA)
Mr. Royston Delanoy, Alternate
Hon. Gabriel AlcaráSecretary DesignateDepartment Transportation and Public WorksDepartamento de Transportación y ObrasPúblicas (DTOP)
Hon. Aníbal MeléndePresidentFederation of Mayors / Federación de Alcaldes
Ms. Lourdes Romero, Agro.Interim Executive DirectorRural Development AdministrationAdministración de Desarrollo Rural
Lcdo. Fernando BonillaExecutive DirectorPorts Authority / Autoridad de los Puertos
Isben Santiago, Alternate
Mr. Antonio PerezVice PresidentEconomic Development Bank of PRBanco de Desarrollo Económico de PR
Ms. Maria Guzman, Alternate
Mr. Rafael Argunde TorresSecretary NomineePR Department of EducationDepartamento de Educación de PR
Luis BenítezPresidentAssociation of EconomistsAsociación de Economistas
Eng. Ángel D. RodríguezChairmanPuerto Rico Planning BoardJunta de Planificación de Puerto Rico

COMPREHENSIVE ECONOMIC DEVELOPMENT STRATEGY 2005
Puerto Rico Planning Area • Annual Report • CEDS Update • EDA Investment Number: 01-85-08072 9
Hon. Javier VelezSecretary DesignateDepartment of Natural ResourcesDepartamento de Recursos Naturales
Hon. José O. Fabre LaboySecretary DesignateDepartment of AgricultureDepartamento de Agricultura
Ms. Myrainne Roa MéndezInterim Executive DirectorPuerto Rico Developmental Disabilities Council /Consejo Estatal sobre Deficiencias en elDesarrollo
Sr. José VegaExecutive DirectorEconomic Development Center, University of PR,Mayagüez Campus / Centro de DesarrolloEconómico UPR Recinto de Mayagüez
Mr. Leonardo CorderoPresidentPuerto Rico Chamber of CommerceCámara de Comercio de Puerto Rico
The President, or his delegate on the CEDSCommittee, at the request of a majority of themembers of CEDS Committee, may designate asubcommittee whose function will be to analyze anyissue of interest to the members of the CEDSCommittee. The CEDS Committee has established aSubcommittee for the Evaluation of InvestmentProposals. Composed of members from the largerboard, the Subcommittee for the Evaluation ofInvestment Proposals meets no less than once peryear (in this specific capacity) in order to render theofficial recommendation of the CEDS Committee.
The principal functions of the CEDS Committee arecoordinated and administered by the ExecutiveDirector who (with the approval of the EDA) iscontracted, hired, or assigned to the task of ExecutiveDirector by the Chairman of the PRPB in order tosupply “Staff Support” to the CEDS Committee.
Staff Support for the CEDSCommittee
In order to meet the obligations of the EDA’s planningassistance investment program the PRPB is requiredto contract, hire, or designate an Executive Directorto the CEDS Committee. In addition, the PRPB isobligated to provide a secretary for the ExecutiveDirector. Together, the CEDS Committee ExecutiveDirector and his/her secretary form the “executivestaff” of the CEDS Committee.
This mechanism of the executive staff has beenestablished in order to expedite the activities of theCEDS Committee and ensure that its work isconducted with greater effectiveness, efficiency, andin such a manner as to minimize any undue burdenon any individual member of the CEDS Committee.As well as to ensure that, despite the particularlogistical difficulties of any given program cycle, onan annual basis, the primary deliverable of the CEDSCommittee, the CEDS document, the annual report,is completed to the satisfaction of the EDA. For thisreason, the majority of the day to day proceduralaspects of the work of the CEDS Committee havebeen delegated to the Executive Director.
Since September 17, 2001 Mr. Pavel De Jesús,MPP has fulfilled the position of Executive Director,and, during that same period the role of secretary tothe CEDS Committee Executive Director has beenfulfilled by several individuals, most recently LucyFebus (FY 2005) has worked as secretary.
Procedures and InternalMechanisms of the CEDSCommittee
Attendance of the Permanent Members: Thepermanent members of the CEDS Committee, or theirdelegates, are required to attend all meetings of theCEDS Committee properly announced. The ExecutiveDirector is responsible for providing a calendar of sixmonths with the necessary meetings of the period.In cases of necessity, a permanent member may

COMPREHENSIVE ECONOMIC DEVELOPMENT STRATEGY 2005
Puerto Rico Planning Area • Annual Report • CEDS Update • EDA Investment Number: 01-85-08072 10
designate a civil employee, or member of theorganization, or agency, to represent the permanentmember on the CEDS Committee, so that he/shemay attend in his/her place. A permanent memberthat has been absent in three (3) consecutive meetingsor five (5) meetings, in four (4) months, will have toinform the CEDS Committee, by means of thePresident or Executive Director, as to his/heravailability to continue as a permanent member ofthe CEDS Committee. Should the conclusion be metthat it will not be possible to fulfill his/her duties toattend the meetings, then, the President of the CEDSCommittee or Executive Director shall request of theChairman of the PRPB that the Chairman make aformal request of the entity to which the permanentmember in question belongs, that another person bedesignated to the CEDS Committee.
Quorum: A majority of the permanent members (8of 15) constitute the committee quorum at the hourof any meeting. If committee quorum for the plannedmeeting is not met, another meeting can be set forfifteen minutes from that time and, a majority ofthose permanent members present at the new meetingshall constitute the meeting quorum for that meeting.Either finding of quorum is required to make decisionson the subjects before the CEDS Committee on themeeting agenda. Quorum is established by countingany permanent member present, or those personsrepresenting the permanent member, at the meetingin question.
Decision Making: All decisions of the CEDSCommittee are made in accordance with the publicpolicies of The Commonwealth of Puerto Rico.
Only the permanent members of the CEDS Committee,as identified according to the Bylaws (summarizedabove) are be able to vote or to make decisions onmatters before the CEDS Committee. In order torender a decision it is necessary that the meeting hasbe initiated with quorum, as identified according tothe rules for establishing quorum in the Bylaws(summarized above). A simple majority of the presentpermanent members in the meeting as identifiedaccording to rules for establishing quorum is sufficientto decide matters on that day’s agenda.
Please recall, establishment and execution of internaladministrative or procedural mechanisms necessaryto accomplish the principal goal of the Commonwealth
of Puerto Rico, the PRPB, and the CEDS Committee(within the guidelines proscribed by the Bylaws)regarding this program—”to ensure that all investmentproposals which the CEDS Committee recommendsfor invitation to participate in the EDA’s pre-proposalphase of EDA funding consideration have beenevaluated and recommended by a body of theindividuals who are representative of various sectorsand groups in society which compose the communityof the Puerto Rico Economic Development Area andits economy”—fall under the purview of those CEDSCommittee positions described under the Bylaws ofthe CEDS Committee. They are, but not limited tothe Chairman of the PRPB, the President of theCEDS Committee and, the CEDS CommitteeExecutive Director.
Formulation of Goals and Objectives: Becausethe decisions of the CEDS Committee are made inaccordance with the public policies of theCommonwealth of Puerto Rico, any Goals andObjectives are understood to be formulated or refinedin like manner.
Goals and Objectives are primarily developed inaccordance with and as a result of findings and policyrecommendations entailed within the following:
Ten Year Assessment program of TheCommonwealth of Puerto Rico entitled“Project Puerto Rico (the appropriate year)”.The Commonwealth of Puerto Rico beganwork on “Project Puerto Rico 2025” duringFY 2003, calendar year 2002 and completedthis work during FY 2005, calendar year 2004.The CEDS Executive Director, Mr. DeJesús, as well as many other members of theCEDS Committee participated the PuertoRico 2025 initiative since September 2003.Please note, this CEDS update documentcontains sections of analysis and work productwhich are specifically the by product of thePuerto Rico 2025 initiative and the partiesinvolved in its management and work productdelivery.
For more information regarding Project PR2025, please see the segment below entitled“Program Effectiveness” subsectionDevelopment of Goals and Objectives aswell as the section entitled The Economy

COMPREHENSIVE ECONOMIC DEVELOPMENT STRATEGY 2005
Puerto Rico Planning Area • Annual Report • CEDS Update • EDA Investment Number: 01-85-08072 11
of Puerto Rico and the Section Goals andObjectives.
During interim years, particularly during the latterhalf of the ten year period, Goals and Objectives arerefined in accordance with and as a result of findingsand policy recommendations entailed within:
.1. The Four Year Investment “La Pica”2. The Land Use Plans of the PRPB3. The Land Use Budget of the PRPB4. The Annual Economic Report to the Governor5. The best judgment and professional expertise
of the CEDS Committee.
All related decisions are rendered in accordance withthe decision making procedures and provisos forestablishment and execution of the principal goal ofthe Commonwealth of Puerto Rico, the PRPB, andthe CEDS Committee as articulated within the Bylawsof the CEDS Committee (summarized above).
Investment Proposal Selection:Investment Proposals are sought throughout the FYby; the CEDS Committee, the Executive Director,The UPR Mayagüez University Center, and EDAstaff. In February (normally) of each year a specificrequest for submission of Investment Proposals issent to a wide range of recipients which include; the78 mayors of Puerto Rico’s municipalities, themunicipal representatives or entities responsible foreconomic development in the local, and any officialsworking in the area of federal affairs. In 2004, thecomplete list approached 200 individuals.
For this proposal solicitation, in order to guaranteerevision and publication in the CEDS in time for theend of Puerto Rico’s FY, the CEDS Committeeobserves a May 1st dead line for submissions, thisyear however the dead line was delayed until June1st. Shortly thereafter, the CEDS Executive Directororganizes and distributes the proposals to theSubcommittee for the Evaluation of InvestmentProposals. The members of the Subcommittee thenreview the submissions for the express purpose ofdetermining:
a. The Development Area Priority Level: Thisdesignation relays the level of importance tothe development area of each investmentproposal in light of; economic trends, eco-
nomic projections, and the public policy em-bodied in the CEDS document and, subse-quently, the results of the designation of agrade reflecting said finding. The greaterthe concurrence of a given Investment Pro-posal with the specific Goals and Objectivesof the CEDS program the higher the prioritylevel assigned.
The classification used in the DevelopmentArea Priority Level(s) process includes thefollowing three (3) grades: A. reflects highpriority; and, B. reflects intermediate prior-ity, and, C. reflects low priority; and, NImeans Not Included in the CEDS due toreservations concerning the orientation of theinvestment
b. The Level of EDA Appropriateness: Thisdesignation relays the level of appropriate-ness in light of the EDA’s investment pro-posal guidelines (as promulgated during theprevious year) and subsequently designatesa grade reflecting said compatibility. Com-mittee members utilize an evaluation Guide(a sheet) which assigns points on the basisthree primary categories: Program Require-ments, Budget, and Employment Estimates.
Those projects accumulating sufficient pointsto be considered “more satisfactory” or“completely satisfactory” are then reconsid-ered among the committee members in lightof the EDA’s investment proposal guidelinesin a caucus review. For a sample copy ofthe form, see Appendix B of this report.During the caucus review, CEDS Commit-tee members are then asked to render theirfinal grade based on the accumulated pointsand subsequent discussion. The averagegrade designation is subsequently assignedto the project and later published in theCEDS as the official recommendation to theEDA for its consideration.
The classification used in the Level of EDAAppropriateness process includes the fol-lowing three (3) grades: A. reflects a highlevel of appropriateness; and, B. reflects aintermediate level of appropriateness; and,C. reflects a low level of appropriateness.

COMPREHENSIVE ECONOMIC DEVELOPMENT STRATEGY 2005
Puerto Rico Planning Area • Annual Report • CEDS Update • EDA Investment Number: 01-85-08072 12
NR. means Not Recommended due to eli-gibility concerns
In January of 2002, as part of the committee’sproposal solicitation process, the CEDS Committeedeployed a “rolling review” process. Actually, by virtueof the ebb and flow of proposal submissions, thisprocess is in fact a staggered review.
Said process is structured in the following manner:
1. Initially a firm due date (traditionally May1st) is set in order to guarantee that anysubmitted proposal shall be processed in timefor inclusion in the CEDS of that programcycle.
2. Any proposal received afterward isconsidered once a minimum of three (3)proposals have been accumulated, or at thenext most convenient opportunity for theSubcommittee for the Evaluation ofInvestment Proposals.
Those proposals received after the due date and afterthe beginning of the next program cycle on July 1st
(PR FY) are subject to the staggered review processand later included among those published in the CEDSof that program cycle under the same criteria above.
Program Effectiveness
Participation:One of the principal difficulties of the CEDSCommittee is orchestrating consistent participation.The following list of contributing dynamics have beenidentified by CEDS Committee members andassociated professionals as the primary explanatoryfactors:
1. Turnover in the positions of permanentmembers of the CEDS Committee; and,
2. Lack of major development initiatives to sparkand maintain interest; and,
3. Size of the P.R. Development Area; and,4. Geographic, topographic, spatial characteristics
that function as disincentives for participation;and
5. Deep rooted partisan behavior, particularlyduring the year prior to and just after elections.
Corrective Actions:Step #1: In December 2001, approximately two monthsinto the tenure of the Current Executive Director,Pavel De Jesús, MPP it was agreed that an achievableremedy for persistent poor participation might be toformalize the expectation of roughly quarterly meetingsinstead of simply adjourning meetings as necessaryand customary in recent years. This recommendationreceived strong support by the EDR, Ernesto Cruz,who helped to promulgate the expectation amongCEDS Committee members and made possibleadoption of the new expectation.
Since the institution of the expectation of participationat quarterly meetings, the number of meetings heldsuccessfully each year has increased and the numberof participants at each meeting has also increasedconsistently (see table above). Most significantly, fromFY 2002 to FY 2003 we more than doubled thenumber of participants (12 to 33) despite succeedingin adding on only one additional meeting. Progresshas been slow but steady and primarily the result ofword of mouth that the CEDS Committee is doinginteresting work once again. During FY 2004, thenormal process of quarterly meeting was irrelevantas the preponderance of CEDS committee memberswho were involved in the Puerto Rico 2025 initiativewas substantial and the process deployed by ATKearney called for a different configuration ofmeetings.
Step #2:
The CEDS Committee Executive Director initiatedgeneral discussion and planning around the contentsand procedures of the 2003 CEDS. Consensus wasreached that establishment of at least two (2)additional subcommittees in the areas of Goals &Objectives as well as Measures & Milestones was aprudent addition to the established Proposal Evaluationsubcommittee. However, it was decided later thatthese two (2) subcommittees should be combinedunder the single a Goals & Objectives subcommitteewhich would be charged with the specific task ofconducting an annual review of the same titled sectionof the CEDS and recommending any changes deemednecessary. Moreover, during the remainder of FY 03it proved infeasible to establish sufficient participationto pursue this option and so by the start of FY 04,“Project Puerto Rico 2025” had begun under the
COMPREHENSIVE ECONOMIC DEVELOPMENT STRATEGY 2005
Puerto Rico Planning Area • Annual Report • CEDS Update • EDA Investment Number: 01-85-08072 13
management of AT Kearney, whose work plan andproject structure called for a different organization ofexpertise during its various phases—thus the additionalsubcommittees became unnecessary.
Development of Goals and ObjectivesAs mentioned previously, the CEDS Goals andObjectives were primarily developed in accordancewith and, as a result of, findings and policyrecommendations entailed within the ten yearassessment program of the Commonwealth of PuertoRico entitled “Project Puerto Rico (the appropriateyear). The Commonwealth of Puerto Rico began workon “Project Puerto Rico 2025” during FY 2003,calendar year 2002 and completed this work duringFY 2005, calendar year 2004. The CEDS ExecutiveDirector, Mr. De Jesús, as well as many othermembers of the CEDS Committee participated thePuerto Rico 2025 initiative since September 2003.Please note, this CEDS 2005 update contains sectionsof analysis and work product which are specificallythe by product of the Puerto Rico 2025 initiative andthe parties involved in its management and workproduct delivery.
Complimenting the initial work stages of the PR 2025Project was a separate but beneficial projectconducted by the PRPB under the title “Juntes conla Junta”, a series of town hall meetings heldthroughout the island of Puerto Rico during 2003.
During FY 2003, CY 2002, the Commonwealth ofPuerto Rico began planning and contract negotiationsrelated to work on “Project Puerto Rico 2025”.Ultimately, by FY 2004, CY 2003, the Department ofEconomic Development contracted with AT Kearneyfor an 11-month intensive effort to develop a non-partisan, implementable vision of Puerto Rico’s future.This vision addresses the economic, social, culturaland environmental needs and hopes of Puerto Ricansociety, by mobilizing the active participation of theprivate sector, non-government organizations (NGOs)and the public at large. PR 2025 built on, but wasnot constrained by, relevant past analyses developedpractical recommendations intended to enable a futurevision for Puerto Rico based on public consensus,commitment and policy continuity.
The work product and outputs of PR 2025 processwere largely completed in July of FY 2004, calendar
year 2004. While related findings were made publicin the Spanish language during June 2004 the expectedEnglish language translations were developed forrelease during August 2004 and made available bythe end of Fall 2004, FY 2005.
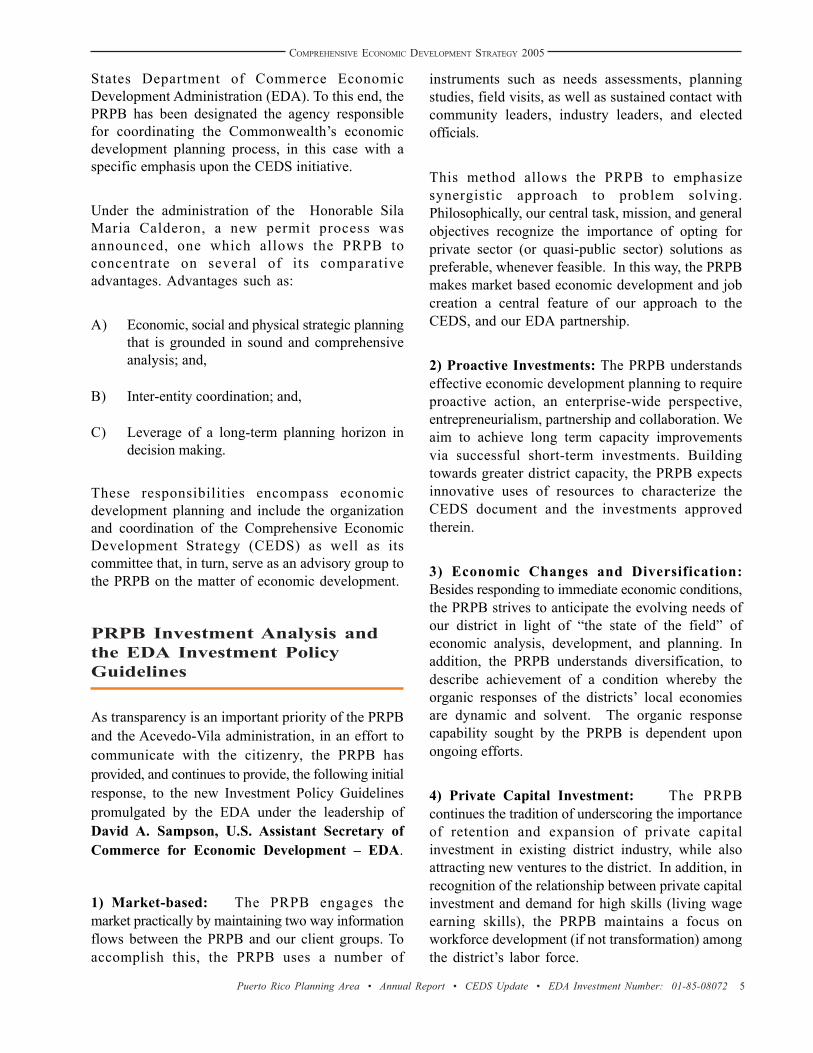
Program Cycle By Puerto Rico FY
2001 2002 2003 2004 2005Num. of meetings during the year 1 2 3 +20 2
Meetings Goal -NA- 2 4 NA 4
Results -NA- -1 -2
Num. of participantsduring the year 6 12 33+ +1,000 20
ParticipationGoal -NA- 35 50 NA 50
Results -NA- -23 -17 -30
NA = Not Available or Applicable
Performance During FY 2005This year, we fell short of our meetings goal by +50%during the 2005 program cycle as well as ourattendance goals largely as a direct consequence ofthe 2004 election cycle. Puerto Rico’s election season(pre and post) were particularly controversial andfinal election results were not finalized till nearly 2005.As a result of these circumstances much of PuertoRico’s public and private sector human resourceswere in-flux for a prolonged period of time and ourability to establish and retain participation wasthoroughly compromised.
Mitigating this unfavorable result is the fact that interms of meetings we were, nevertheless, able tosustain committee activity at our FY 2002 levels andin terms of participation at nearly the levels of FY2003. Therefore, we expect that FY 2006, not unlikeFY 2002, will be a strong rebuilding year and that weare well positioned to recover more quickly and meetor exceed performance goals in subsequent years.

COMPREHENSIVE ECONOMIC DEVELOPMENT STRATEGY 2005
Puerto Rico Planning Area • Annual Report • CEDS Update • EDA Investment Number: 01-85-08072 14
The Economy of Puerto RicoDuring FY 2004, And Projectionsfor FY 2005 and FY 2006
IntroductionThe Puerto Rico Planning Board (PRPB), incompliance with its mandate, is the agency of theCommonwealth responsible for monitoring theeconomy of Puerto Rico, in order to identify the pulseof the island economy. In accordance with this duty,the PRPB develops projections and analysis, whichtogether with other policy tools, are used as thefoundation of policy decisions in both the private andpublic sectors. The protocols and procedures for ourprojections and analysis are complex and subtle, andreflect an approximation, or estimation, of the actualstate of the economy, and its component elements.Consequently, these predictions should not beinterpreted as a precise recipe or exact diagnosticformula for making policy decisions.
Setting the ContextTo set the framework for the synopsis that follows,in January of each year the PRPB executes a seriesof projections for: 1) the upcoming fiscal year (FY),in this case FY 2006; 2) the current FY, in this caseFY 2005; and 3) revisions for the most recent FY forwhich all data has been collected, the previous FY, inthis case, FY 2004. In this manner, our annual workproduct enables the PRPB to report onmacroeconomic conditions, specifically: A) how weexpect the economy to perform during the short-term, through our projections for FY 2006; B) howcritical diagnostic variables suggest the economy isactually performing, through our projections for FY2005 thus far; and, C) how the economy performedduring the previous period, based on analysis of theFY 2004 data set. During FY 2004, the economy ofPuerto Rico continued its recuperation, which beganin FY 2003, and was consistent in performance withthe economy of the United States as a whole, as wellas the External Sector of the Economy in PuertoRico.
The Economy of Puerto RicoDuring FY 2004; OverallPerformance
During FY 2004, Gross Product (GP) rose to$50,320.00, in current prices, for an increase of$2,881.5, million or 6.1% over FY 2003, which hadbeen registered at $47,438.5 million. This increaserepresents the value in the market of all economicproduction activities of Puerto Rico’s residents—itsphysical participants. In constant prices, the samefigure equals $6,881.5 million and reflects an increaseof $185.0 million or 2.8% over the 2003 figure.During the same period, FY 2004, Internal Demand(ID) increased by 4.8% in constant prices, from$61,332.7 million in FY 2003 to $64,249.6 million. Inconstant prices, this reflected an increase of 3.4%.Several important external (exogenous) factors aidedthe growth of the economy during FY 2004, such asthe improved performance of the US economy andthe stability of interest rates. The latter was mostsignificant for the local economy, as stable ratesspawned a favorable credit market for businessesand individual consumers, thereby permitting the PuertoRican economy to continue at a pace of activity similarto that of previous fiscal years.
Puerto Rico’s Economy Today andTomorrow, Assessment and VisionSECTION II:
Real Gross ProductAnnual Growth, Fiscal Years 01 -04
1.5
-0.3
2.0
2.8
-1.0
0.0
1.0
2.0
3.0
2001 2002r 2003r 2004p
r – Revised p - Preliminary
Percent
COMPREHENSIVE ECONOMIC DEVELOPMENT STRATEGY 2005
Puerto Rico Planning Area • Annual Report • CEDS Update • EDA Investment Number: 01-85-08072 15
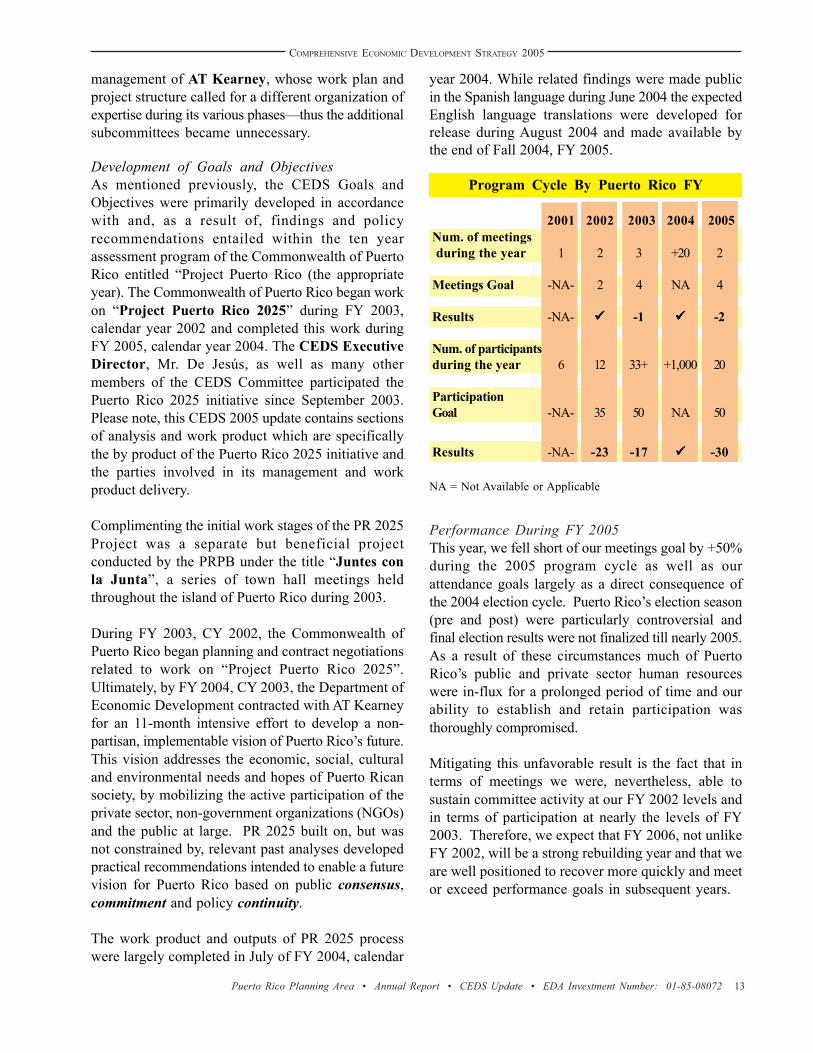
During FY 2004, Personal Consumption Expenditures(PCE) increased to $42,905.2 million, rising $1,925.2million or 4.7% above the FY 2003 level of $40,980.0million. In constant prices, PCE was registered at$8,774.7 million during FY 2004, reflecting an increaseof 3.4% over FY 2003. The real growth achievedwas $287.0 million and was sustained by an increaseof 3.7% registered in consumption expenditures forservices. During the same period, the consumption ofnon-durable goods was of 4.1%, whereas expenditureson durable goods realized an increase of only 0.9%.It is prudent to emphasize that PCE accounted for69.5% percent of real internal demand during FY2004 and represents a positive circumstance thatdemonstrates consumer confidence and a generallypositive outlook, with regard to growth of oureconomy.
In current prices, a total of $9,022.0 in FY 2004,Government Consumption Expenditures (GCE) of theCommonwealth of Puerto Rico, and its MunicipalCounties, increased by $288.3 million or 3.3% overthe $8,733.7 million of FY 2003. In constant prices,the same variable, GCE, realized a 0.2% expansionduring FY 2004. One should note that theseexpenditures include the value of compensation paidto public employees, the value of merchandise, aswell as other administrative services procured bypublic entities. In constant terms, this reflected adecrease of 0.3% in the above expenses,corresponding to the municipalities, whereas thoseexpenses corresponding to Commonwealth of PuertoRico saw a growth of 0.3%
During FY 2004, in current prices, Gross DomesticInvestment (GDI) registered a change of $703.3million or 6.1% over FY 2003, reflecting an increasefrom $11,619.1 million to $12,322.4 million. It isprudent to underscore that, in real terms, GDI wasthe principal internal factor which contributed to theobserved growth in the Gross Product, during thesame period. This component, which includes GDI ofFixed Capital and the Change in Inventories, grew6.9%, in constant prices, during FY 2004, after havingsuffered two consecutive dips during FY 2002 andFY 2003. In addition, GDI of Fixed Capital, whichincludes the value of Put-in-Place Construction andthe purchase of machinery and equipment, grew 6.7%in real terms during FY 2004. It is important to recallthat investment in capital is the means by which aneconomy renews itself and increases its productivityin order to utilize its resources with greater efficiencyand effectiveness. Consequently, during theproceeding reporting period, such changes, particularlyin the investment of resources in machinery andequipment, increase the expectation of futureincremental growth in both the productivity as wellas the overall activity of the economy. Moreover,incremental changes in real terms are an indicator ofinvestor confidence in the Puerto Rican economy.
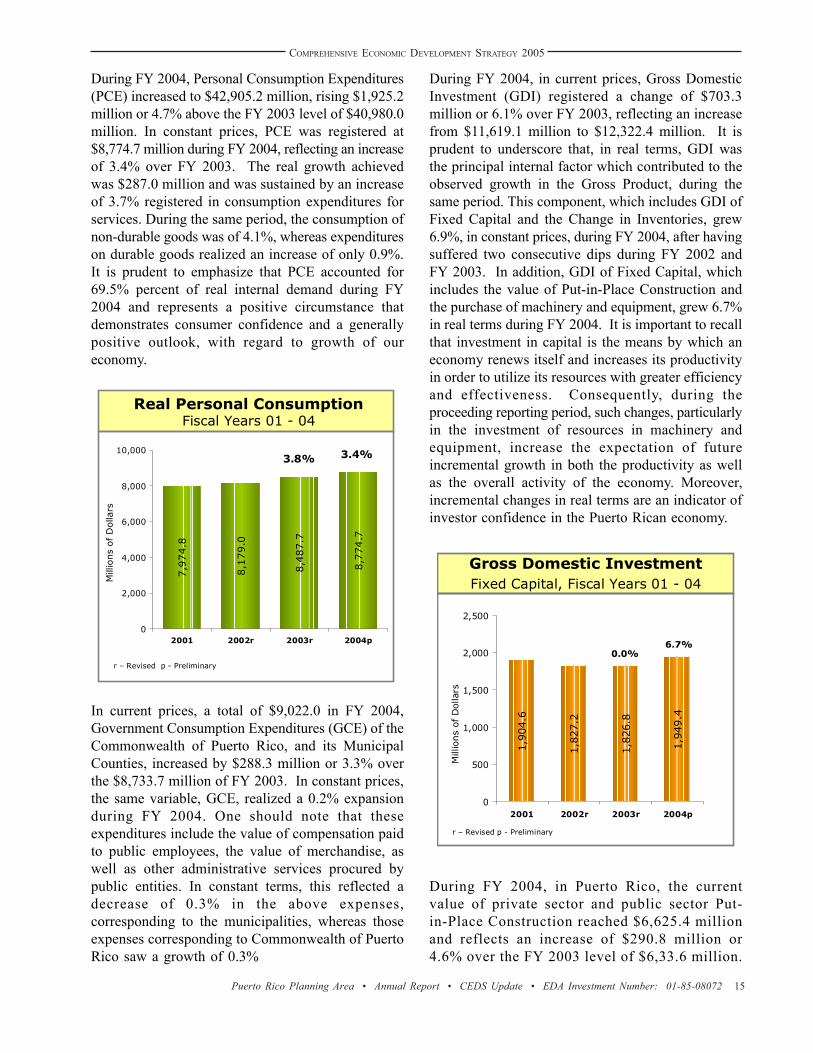
During FY 2004, in Puerto Rico, the currentvalue of private sector and public sector Put-in-Place Construction reached $6,625.4 millionand reflects an increase of $290.8 million or4.6% over the FY 2003 level of $6,33.6 million.
8,7
74.7
8,4
87.7
7,9
74.8
8,1
79.0
0
2,000
4,000
6,000
8,000
10,000
2001 2002r 2003r 2004p
Real Personal ConsumptionFiscal Years 01 - 04
3.8% 3.4%
r – Revised p - Preliminary
Mill
ions
of
Dolla
rs
1,9
49.4
1,8
26.8
1,9
04.6
1,8
27.2
0
500
1,000
1,500
2,000
2,500
2001 2002r 2003r 2004p
Gross Domestic InvestmentFixed Capital, Fiscal Years 01 - 04
0.0%6.7%
r – Revised p - Preliminary
Mill
ions
of
Dolla
rs

COMPREHENSIVE ECONOMIC DEVELOPMENT STRATEGY 2005
Puerto Rico Planning Area • Annual Report • CEDS Update • EDA Investment Number: 01-85-08072 16
Private sector construction activity reached$3,934.3 million for an increase of 3.3% or $125.1million as compared to FY 2003, when it reached$3809.2 million. In comparison, during FY 2004,public sector construction activity reached $2,691.0million, reflecting an increase of 6.6% or $167.7million as compared to FY 2003, when it reached
$2525.4 million. During FY 2004, investment in publicsector public works projects was characterized by$1,601.8 million from public corporations, $744.0million from the government of the Commonwealthof Puerto Rico, and $345.3 million from municipalcounty governments. These investments in publicworks denote a 1.5% increase over FY 2003.Moreover, during FY 2004, the other component ofGDI Fixed Capital, purchases of equipment andmachinery, rose 6.8% or $344.0 million over FY 2003
to $5,371.5 million. Of the total equipment andmachinery investment, 94.7% was made by the privatesector and represents an 11.8% increase in real terms.
During FY 2004, exports of Good and Services was$66,732.7 million. During that same period, adjustedexports were $59,449.4 million, whereas imports were$80,662.3 million. Together, this denotes a net balanceof -$13,929.6 million or an increase of 0.3% over FY2003 when that same balance was -$13,894.2 million.In real terms, this represents an increase of 4.3% inthe negative net balance, reflecting Puerto Rico’sbalance of trade.
$2,691.1 $3,934.3
Public Private
millions
The Distribution of Construction Investment
Public versus Private, 2004
millions
Construction InvestmentAnnual Growth Rates, 1997 - 2004
22.3
-3.9
-1.3
4.6
-2.4
4.5
14.214.5
-8.0
-4.0
0.0
4.0
8.0
12.0
16.0
20.0
24.0
1997 1998 1999 2000 2001 2002 2003r 2004p
Percent
r – Revised p - Preliminary
4,8
64.4
4,9
27.1
5,0
27.5
5,3
71.5
0
1,000
2,000
3,000
4,000
5,000
6,000
2001 2002 2003r 2004p
Investment in Machinery and Equipment
Current Prices, Fiscal Years 01 - 04
r – Revised p - Preliminary
Mill
ions
of
Dolla
rs
37394.7
36740.6
42512.8
44716.5
59,4
49.4
56,3
34.7
49,0
38.9
49,6
10.1
0
15,000
30,000
45,000
60,000
2001 2002 2003 2004
Exports Imports
Mill
ions
of D
olla
rs
Adjusted Merchandise:Exports and ImportsFiscal Years 01 - 04

COMPREHENSIVE ECONOMIC DEVELOPMENT STRATEGY 2005
Puerto Rico Planning Area • Annual Report • CEDS Update • EDA Investment Number: 01-85-08072 17
The Economy During FY 2005;The Monthly EconomicIndicators
During the initial months of FY 2005, the data do notshow risk in the short or medium terms.Nevertheless, it is important to recall that severalindicators were affected by the impact of TropicalStorm Jeanne, which converted into a hurricaneweather pattern here in Puerto Rico.
During FY 2005, according to the Housing Surveyby the Puerto Rican Department of Work and HumanResources, the labor market in Puerto Rico exhibitedincreases during the period from July 2004 throughFebruary 2005. Please note the survey datamentioned, for the decade between 1990 and 2000,has been revised as a consequence of the PopulationCensus of 2000. Nevertheless, during FY 2005,as compared to the previous year, TotalEmployment grew by 3.1% to reach 1,233,000 andthe Work Force grew by 1.5% to reach 1,374,000.
In addition, the Participation Rate was 46.7% or 0.4percentage points above the same period during theprevious year (FY 2004), when it was 46.3%.Moreover, the Unemployment Rate fell 1.4% to 10.2%as compared to FY 2004. Alternatively, as comparedto FY 2004, the same data from the 2005Establishment Survey shows that Total Non-Agricultural Employment increased 1.3% for a totalof 1,042,800.
In contrast to the employment figures, during theseinitial months of FY 2005, the Total Number ofAuthorized Construction Permits approved by thePermit and Regulations Administration hasdecreased by 1.5% as compared to FY 2004. Here,the reduction reflects decreases in both the publicsector (15.1%) and the private sector (0.3%).
Likewise, during FY 2005 a 3.0% decrease was notedin the monetary Value of Construction Permits, ascompared to FY 2004, as measured in millions ofdollars, during the period for which the pertinentfigures are available, July to January.
1,1
75
1,1
97
1,2
33
1,1
41
1,1
49
0
250
500
750
1,000
1,250
2001 2002 2003 2004 2005
Total Average EmploymentJuly - February
3.1%
Note: Revised Data, DTRH
Thou
sands
of P
eople
10.1
11.9 12.111.6
10.2
0.0
3.0
6.0
9.0
12.0
15.0
2001 2002 2003 2004 2005
Unemployment RateJuly - February
Percent
-1.4 pts.
Note: Revised Data, DTRH
4,7
84
5,3
17
5,5
35
5,4
54
5,0
77
0
1,000
2,000
3,000
4,000
5,000
6,000
2001 2002 2003 2004 2005
Num
ber
of
Perm
its
Total Construction Permits:July - January
-1.5%

COMPREHENSIVE ECONOMIC DEVELOPMENT STRATEGY 2005
Puerto Rico Planning Area • Annual Report • CEDS Update • EDA Investment Number: 01-85-08072 18
However—unlike the case of Authorized ConstructionPermits—when we disaggregate the constituentcomponents of the Value of Construction Permits,we see that the public and private sectors moved inopposite directions: whereas the private sectorevidenced a 5.8% drop in the value of the permitsrendered, the public sector showed a slight increase,of 3.2%.
The principal indicators for Tourism Activity in PuertoRico during FY 2005 evidence a positive trend. Therelevant data cover the period from July 2004 throughthe end of December 2005, and show that the Totalof Persons Registered in Hotels and Paradores
reached 1,009,062 for an increase of 5.5% over lastyear’s data. Moreover, the Total of Non-residentsRegistered in Hotels and Paradores increased by 6.6%for a total of 653,186 persons, in comparison to lastyear’s data. However, conversely, as a result of anexpansion in the number of hotel rooms available,Puerto Rico’s Occupation Rate in Hotels andParadores decreased in FY 2005, compared to FY2004, as the island’s relevant establishmentsexperienced a 0.7 percentage point reduction and fellto 65.1%.
In relation to the External Sector of the Economy,during the first six months of FY 2005, the Value ofExports suffered a slight decrease of 0.02% from$28,530.4 million in FY 2004 to $28,523.9 million.
Total Value ofConstruction Permits
July - January
1,6
93.0
2,0
46.7
1,2
32.8
1,7
53.8
1,7
01.9
0
500
1,000
1,500
2,000
2,500
2001 2002 2003 2004 2005
Mill
ions
of
Dolla
rs
-3.0%
1,001.30
1,134.801,205.00
1,135.301,167.50
548.8 566.6
879.2
231.4
558.2
0
400
800
1,200
2001 2002 2003 2004 2005
Mill
ions
of
Dolla
rs
Private Public
Value of Construction Permits: Public and Private
July - January
- 5.8%: 03 – 04 + 3.2%: 03 – 04
830,
706
943,
980
956,
782
1,00
9,06
2
856,
510
0
180,000
360,000
540,000
720,000
900,000
1,080,000
2001 2002 2003 2004 2005
Num
ber
of Pe
rson
s
Total Number of Persons Registered in Hotels and Paradores
July - December
5.5%
4,766 4,6605,029 5,084 5,071
311124 288 451 383
0
1,000
2,000
3,000
4,000
5,000
6,000
2001 2002 2003 2004 2005
Num
ber
of
Per
mits
Private Public
Construction Permits:Public and Private
July - January
- 15.1%: 04 – 05- 0.31%: 04 – 05
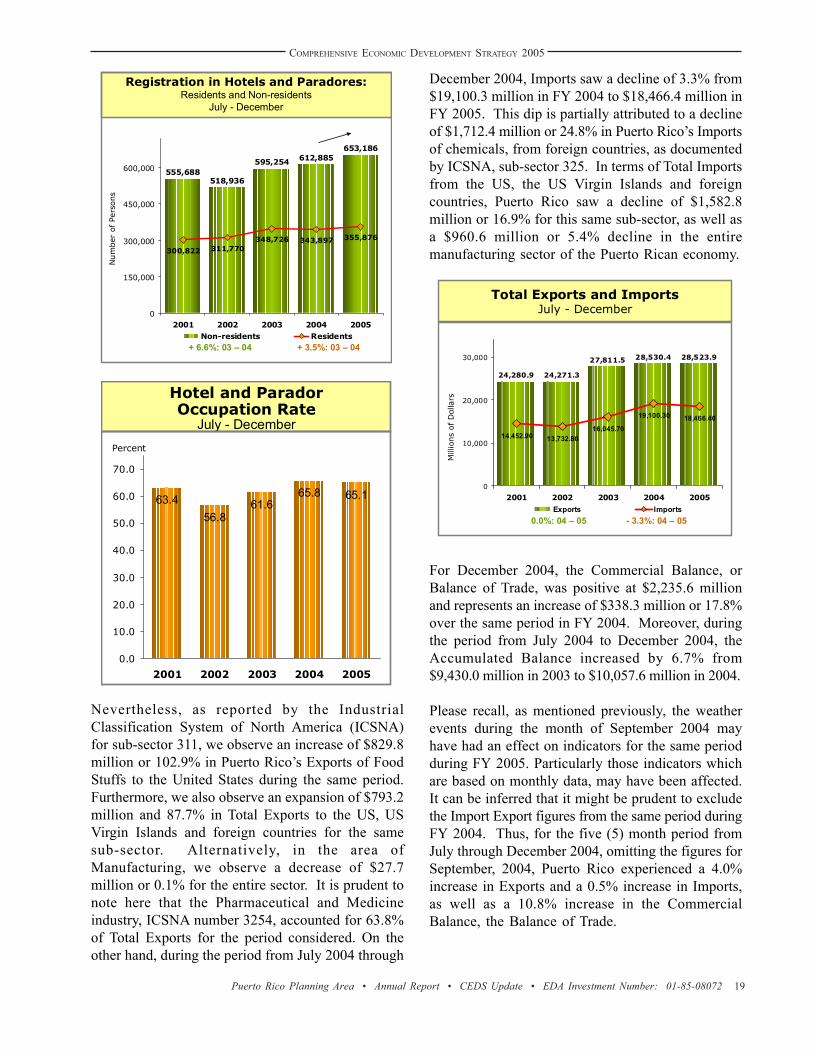
COMPREHENSIVE ECONOMIC DEVELOPMENT STRATEGY 2005
Puerto Rico Planning Area • Annual Report • CEDS Update • EDA Investment Number: 01-85-08072 19
Nevertheless, as reported by the IndustrialClassification System of North America (ICSNA)for sub-sector 311, we observe an increase of $829.8million or 102.9% in Puerto Rico’s Exports of FoodStuffs to the United States during the same period.Furthermore, we also observe an expansion of $793.2million and 87.7% in Total Exports to the US, USVirgin Islands and foreign countries for the samesub-sector. Alternatively, in the area ofManufacturing, we observe a decrease of $27.7million or 0.1% for the entire sector. It is prudent tonote here that the Pharmaceutical and Medicineindustry, ICSNA number 3254, accounted for 63.8%of Total Exports for the period considered. On theother hand, during the period from July 2004 through
December 2004, Imports saw a decline of 3.3% from$19,100.3 million in FY 2004 to $18,466.4 million inFY 2005. This dip is partially attributed to a declineof $1,712.4 million or 24.8% in Puerto Rico’s Importsof chemicals, from foreign countries, as documentedby ICSNA, sub-sector 325. In terms of Total Importsfrom the US, the US Virgin Islands and foreigncountries, Puerto Rico saw a decline of $1,582.8million or 16.9% for this same sub-sector, as well asa $960.6 million or 5.4% decline in the entiremanufacturing sector of the Puerto Rican economy.
For December 2004, the Commercial Balance, orBalance of Trade, was positive at $2,235.6 millionand represents an increase of $338.3 million or 17.8%over the same period in FY 2004. Moreover, duringthe period from July 2004 to December 2004, theAccumulated Balance increased by 6.7% from$9,430.0 million in 2003 to $10,057.6 million in 2004.
Please recall, as mentioned previously, the weatherevents during the month of September 2004 mayhave had an effect on indicators for the same periodduring FY 2005. Particularly those indicators whichare based on monthly data, may have been affected.It can be inferred that it might be prudent to excludethe Import Export figures from the same period duringFY 2004. Thus, for the five (5) month period fromJuly through December 2004, omitting the figures forSeptember, 2004, Puerto Rico experienced a 4.0%increase in Exports and a 0.5% increase in Imports,as well as a 10.8% increase in the CommercialBalance, the Balance of Trade.
555,688518,936
595,254 612,885653,186
300,822 311,770348,726 343,897 355,876
0
150,000
300,000
450,000
600,000
2001 2002 2003 2004 2005Non-residents Residents
Num
ber
of
Pers
ons
Registration in Hotels and Paradores:Residents and Non-residents
July - December
+ 6.6%: 03 – 04 + 3.5%: 03 – 04
Total Exports and ImportsJuly - December
28,523.9
24,271.3
28,530.427,811.5
24,280.9
14,452.90 13,732.8016,045.70
19,100.30 18,466.40
0
10,000
20,000
30,000
2001 2002 2003 2004 2005
Exports Imports
Mill
ions
of
Dol
lars
0.0%: 04 – 05 - 3.3%: 04 – 05
Hotel and ParadorOccupation Rate
July - DecemberPercent
56.861.6
65.8 65.163.4
0.0
10.0
20.0
30.0
40.0
50.0
60.0
70.0
2001 2002 2003 2004 2005

COMPREHENSIVE ECONOMIC DEVELOPMENT STRATEGY 2005
Puerto Rico Planning Area • Annual Report • CEDS Update • EDA Investment Number: 01-85-08072 20
When we examine the Production of Electric Energyduring the first six months of FY 2005, we observethat Puerto Rico increased its Total Production by0.3% to 12,423.8 million kilowatt-hours; yet, if weagain exclude the month of September, with thesame rationale, we see that the increase in TotalElectric Energy Production was 2.2%. Further, ifwe look at consumption figures, and specificallydisaggregate Industrial Electric Energy Consumptionand Commercial Electric Energy Consumption, wesee a slight increase of 0.6% for IndustrialConsumption and a slight decrease of 0.7% forCommercial Consumption. Again, if we excludeSeptember, 2004, the adjusted figure for CommercialConsumption reflects an increase of 3.4%.
19,853.9
23,126.1 23,643.724,581.7
20,411.9
11,917.60 11,615.2013,380.30
15,685.80 15,761.00
0
8,000
16,000
24,000
2001 2002 2003 2004 2005
Mill
ions
of
Dolla
rs
Exports Imports
Total Exports and ImportsJuly-Aug-Oct-Nov-Dec
+ 4.0%: 04 – 05 + 0.5%: 04 – 05
12,391.6 12,423.812,171.511,558.311,388.6
2,080 1,995.80 2,050.90 2092.1 2,102.60
1,000
5,000
9,000
13,000
2001 2002 2003 2004 2005
Mill
iones
of
Kilo
watt
s /
Hr.
Production Consumption
Electric Energy:Production and Industrial Consumption
July - December
+ 0.3%: 04 – 05 + 0.6%: 04 – 05
10,141.4 10,273.6 10,496.8
9,622.59,501.8
1,743.70 1,668.40 1,702.70 1,753.30 1,813.10
1,000
5,000
9,000
13,000
2001 2002 2003 2004 2005
Mill
ions
of
Kilo
watt
s /
Hr.
Production Consumption
Electric Energy:Production and Industrial Consumption
July-Aug-Oct-Nov-Dec
+ 2.2%: 04 – 05 - 0.7%: 04 – 05
4,1
55.1
4,3
31.0
4,3
01.5
3,9
54.5
4,0
03.3
0
900
1,800
2,700
3,600
4,500
2001 2002 2003 2004 2005
Mill
ions
of
Kilo
wat
ts /
Hr.
-0.7%
Commercial Electric Energy Consumption
July - December
8,7
25.0
9,1
04.5
9,4
29.0
10,0
37.6
10,9
00.2
0
3,000
6,000
9,000
12,000
2001 2002 2003 2004 2005
Mill
ions
of
Dolla
rs
8.6%
Retail SalesJuly - January

COMPREHENSIVE ECONOMIC DEVELOPMENT STRATEGY 2005
Puerto Rico Planning Area • Annual Report • CEDS Update • EDA Investment Number: 01-85-08072 21
During the period from July, 2004, through January,2005, Retail Sales reflected an increase of 8.6% to$10,900.2 million, over $10,037.6 for FY 2004.Between 1997 and the present, during the same periodfrom July to January, the percent of Retail Salesincrease has fluctuated between 2.6% and 8.6%,where this period for FY 2000 was its low point, andthis period for FY 2005, was the highest.
Finally, the behavior of several other valuable monthlyindicators are in accordance with the trends discussedabove as well as our expectations derived from theprevious year’s analysis and, our emergingunderstanding based on current observations. Forexample, during the first six months of FY 2005,Concrete Production increased 18.2%, although thiswas not reflected in Concrete Sales, which showedno change over FY 2004. Moreover, when we look
at Total Bankruptcies, we observe a reduction of13.6%, in which Commercial Bankruptcies decreased11.6%, and Personal Bankruptcies declined by 14.0%.
Macroeconomic Projections ForFY 2005 and FY 2006
In this section of our analysis, in accordance with itsofficial econometric models, the Puerto Rico PlanningBoard (PRPB) will present a synopsis of conclusionsbased in its Macroeconomic Projections for both thenear-term (the remainder of FY 2005) and the short-term (FY 2006). It is prudent to note that thesemodels and projections incorporate factors for theshort-term which may affect the performance of theisland’s economy in the foreseeable future. It islikewise critical to underscore for the reader that, intheoretical terms, Puerto Rico’s economy is accuratelycharacterized as both “small” and “highly-open”.Consequently, our island economy is exceedinglysusceptible to changes in the state of the economythat arise, not only from interaction with the muchlarger economy of the United States, but also as aresult of interface with the Global Economy. Thus,for all the advantages and potential disadvantages,Puerto Rico’s economy is a clear participant in ourincreasingly interdependent global community.
Among the primary assumptions factored into theeconometric model for Puerto Rico’s economy areexogenous variables, whose values are determined
22,21020,923 20,93320,949
22,037
18,322 17,471 17,46515,787
18,656
5,000
10,000
15,000
20,000
25,000
2001 2002 2003 2004 2005
Thousa
nds
of
Bags
(94 lb
s.)
Sales Production
Cement:Sales and Production
July - December
0.0%: 04 – 05 + 18.2%: 04 – 05
6,7847,288
6,295
7,2666,823
0
1,500
3,000
4,500
6,000
7,500
9,000
2001 2002 2003 2004 2005
Num
ber
-13.6%
Total BankruptciesJuly - December
69066461 6369
6906
5941
211 214 199176
231
0
2,000
4,000
6,000
8,000
2001 2002 2003 2004 20050
50
100
150
200
250
300
350
400
450
500
Personal Comercial
Bankruptcies:Personal and Commercial
July - December
- 14.0%: 04 – 05 - 11.6%: 04 – 05

COMPREHENSIVE ECONOMIC DEVELOPMENT STRATEGY 2005
Puerto Rico Planning Area • Annual Report • CEDS Update • EDA Investment Number: 01-85-08072 22
outside the scope of the econometric model. Principalexogenous variables are 1) the Global Economy, 2)the U.S. Economy; 3) Exports of AdjustedMerchandise; 4) Visitors’ Expenditures; 5) Investmentin Construction; 6) Investment in equipment andmachinery; and, 7) Federal Transfer Payment toindividuals.
During calendar year 2004, to a significant extent,the recuperation of the global economy both deepenedand amplified. For this year, average growth in theaggregate, has amounted to 5.0% and been sustainedby strong incremental increases among industrializedcountries, as well as an extraordinarily rapid expansionof emerging markets—principally China. Thiscircumstance has been accompanied by: A) a robustincrease in industrial production, as well as the flowof global commerce; B) an acceleration in the growthof Personal Consumption brought on by favorableconditions in the labor market; and, C) continuedstrength among investment activities, supported bythe restructuring of corporate balance sheets, followingthe collapse of the technology bubble in the market.
Nevertheless, and despite these positivecircumstances, deceleration has been observed in thegrowth rate during the second half of the year, eventhough a correction of this nature is inevitable, andperhaps desired, after four consecutive quarters ofexceptionally rapid expansion, since the third quarterof 2003. The growth rate of Gross Domestic Product(GDP) for various principal driver economies,including the US, has lowered expectations. Thisrealignment has generated concern that we mayperhaps be at the beginning of a jam/recession(atolladero). Moreover, China’s GDP has alsodecelerated, although, in China’s case this change isregarded as fortuitous, since without some correctionthere exists the persistent risk of over heating itseconomy. Further, the rapid increase in the cost ofpetroleum has played a role in the current conditionsof the global economy, specifically, to weaken globalexpansion during recent months, with the unfortunateprobability of continued impact for several quartersduring the foreseeable future. Notwithstanding thispossibility, so far the “petroleum impact” has beenmoderate. Finally, since the end of 2003, aggregateglobal product has increased rapidly, and the price ofmerchandise has increased significantly. Theseincreases are a consequence of inflation, although,again these changes may still be characterized asbeing moderate.
The United States EconomyDuring 2004, greater stability and solid growth of theUS economy signaled a confirmation of its continuedrecovery, after a brief recession during 2001, and theslow and unstable recuperation of 2002 and 2003.The preliminary figures for the expansion of theeconomy during 2004 have registered at 4.4% andconstitute the greatest expansion since 1999 whenreal GDP also grew at the rate of 4.4%. Nevertheless,while 2004, in general terms, was a positive year, itwas not a year devoid of risk or surprise. Theunexpected rise in the price of the petroleum didindeed affect all energy related costs and was apredominant feature of activity throughout the year.
Petroleum in the US, as reported by the pricereference “West Texas Intermediate”, reached anaverage price per barrel of $41.61 during 2004, andan average price per barrel of $33.76 when adjustedto the Puerto Rico fiscal calendar (June through July).Respectively, these figures represent increases of33.7% and 12.9% in comparison with averagecorresponding prices achieved during 2003. Withouta doubt, this situation, during the past year, constitutesa primary source of the relative increase in inflation.During 2004, the Consumer Price Index (CPI), oneof the tools used to measure inflation, increased 2.7%over 2003, when the CPI reached 2.3%. Meanwhile,the Producer Price Index (PPI) increased 3.6%, sincethe 3.9% increase of 2000. In addition to theseinflationary pressures, the weakness in the US Dollar,beginning in 2002, began showing a decline in relativevalue, as compared to other currencies.
In this environment of greater acceleration in thegrowth of the economy, together with the inflationrate, and continued depreciation of the US Dollar, theOpen Market Committee of the Federal Reserve,reengaged restrictive monetary policies. At the sametime, at its June 2004 meeting, it sought to maintainstability in prices and begin a cycle of increases inthe Federal Funds rate, with a 25-percentage pointincrease. After this initial increase, the committeethen moved to increase the rate four (4) additionaltimes until it reached 2.25% at the close of 2004, andthen increased the rate an additional 25 percentagepoints during its February 2005 meeting.
With regard to the relevant projections for 2005 and2006, it is estimated that the general behavior of theeconomy will be similar to that of 2004, and

COMPREHENSIVE ECONOMIC DEVELOPMENT STRATEGY 2005
Puerto Rico Planning Area • Annual Report • CEDS Update • EDA Investment Number: 01-85-08072 23
consequently characterized by a moderate, althougha good and healthy, rhythm. Alternatively, regardingprojections for real GDP through January, 2005, theconsensus between “Global Insight” and the “BlueChip Economic Indicators” is impressive. Where theformer indicates growth of 3.6% and 3.3% during2005 and 2006, the later is projecting 3.6% and 3.4%growth during the same periods. Additionally, bothgroups of analysts concur that, unlike previous years—where the key factors of growth were strongconsumer consumption, the housing market andgovernment spending—for this year and next, growthwill be spurred by fixed capital investment andexports. Moreover, both groups expect these twofactors to show significant growth in particularexports, since the devalued US Dollar is expected tostimulate additional net external demand.
These projections are, in part, explained by “GlobalInsight” estimates which anticipate a dip in the priceof a barrel of crude oil, where average prices (WTI),during 2005, are expected to be between $43.04 and$40.00, and possibly as low as $36.21, during 2006.Moreover, both “Global Insight” and “Blue Chip”indicate that during 2005, the core inflation index—which excludes food and energy prices and, ismonitored by the Federal Reserve—will rise, as wasthe case in 2004, but this time at a greater rate,expected to be closer to 2.0%.
In addition, continuing the trend which began in June,2004, the Federal Reserve maintains its trajectory ofmonetary policy decisions of increases in federal fundsinterest rates. Both “Global Insight” and “Blue Chip”agree that the greater economic growth is dictatedby the historic trend, and the gradual rise in both thecore and general inflation indexes. This, in addition tothe fall of the dollar, allows us to anticipate that theinterest rate reference (federal funds) will beincreased by at least 3.5% during the current year.“Global Insight” estimates 2.97% and 3.60%, for 2005and 2006 respectively, as the anticipated average rates.
Finally, despite the positive economic scenariopresented for the US economy during 2005 and 2006,it is important not to loose sight of both the positiveand negative impacts of economic decisions andrelated policy, which are likely to occur as a result ofthe existing budget deficit and balance of trade.Therefore, this period could be one of great relevance
for the highly sensitive topics of fiscal policy, as theyplay out in the public sphere now and in the nearfuture: deficit reduction; reform of the tax code; and,perhaps the most controversial of all, reform of theexisting social security system.
Adjusted ExportsIn Puerto Rico, during FY 2004, the value of adjustedexports increased by 5.5% to $59,449.4 million, whichin absolute terms was a $3,114.7 million increaseover the previous year. Export activity is stimulatedby both the projected US growth trend and thedemand for goods. For FY 2005 and FY 2006,projections anticipate adjusted exports of $63,176.0million and $67,296.0 million respectively or a 6.3%and 6.5% increase in growth. Moreover, growthamong adjusted exports will be driven by electricmachinery, non-electric machinery and scientificinstruments, as well as by pharmaceuticals.
Visitor’s ExpendituresTourism is one of the most important service activitiesof the economy, both for its development potential aswell as its contribution to gross product. Globally,Tourism has demonstrated impressive growth.Consequently, during FY 2004, visitor’s expenditures—those of non- residents— reached $3,024.0 million.This is 13.0% above FY 2003, when visitor’sexpenditures grew by 7.6% and reached $2,676million. This solid trend is expected to continue intoFY 2005 and FY 2006. Estimates predict a 7.3%growth, with a total of $3,245.0 million in FY 2005,
67,2
96.0
63,1
76.0
56,3
34.7
59,4
49.4
0
10,000
20,000
30,000
40,000
50,000
60,000
70,000
2003r 2004p 2005* 2006*
Mill
ions
of
Dolla
rs
Adjusted ExportsFiscal Years 03 - 06
r – Revised p – Preliminary * - Projected

COMPREHENSIVE ECONOMIC DEVELOPMENT STRATEGY 2005
Puerto Rico Planning Area • Annual Report • CEDS Update • EDA Investment Number: 01-85-08072 24
and 7.5% growth with a total of $3,488.0 million, .inFY 2006,
Construction ActivityConstruction activity or “investment in construction”refers, specifically, to new construction realized bythe private sector; the central government of thecommonwealth, and municipal governments.Moreover, it is one of the most important factors ineconomic development of any community, country oreconomy. Consequently, the importance ofconstruction activity cannot be considered lightly interms of its short and long-term impacts, particularly,as construction activity relates to the growth of grossproduct. As such, every economic sector contributesto this investment in one form or another. For example,both individuals and private sector firms contribute tothis investment through the acquisition of housing andproperty, while the government, both central andmunicipal, contribute via activity to develop theinfrastructure.
Despite this important role in the economy, during thethree years prior to FY 2004, construction activityexperienced negative growth. Nevertheless, duringFY 2004, construction activity experienced a realincrease of 1.5%, as compared to the previous year,and registered an absolute increase of $14.0 millionfor a total of $923.0 million. In current terms, thisrepresents an expansion in investment in constructionto $6,625.4 million for an increase of 4.6%.
For FY 2005 and FY 2006, the projections forinvestment in construction are conservative, as theperformance of this sector of activity is dependentupon a diverse suite of factors that occur at both thelocal and international levels of the economy. Theprincipal factor, in global terms, has been theincremental increase in the price of constructionmaterials, a trend not seen in nearly 60 years. Thistendency is principally a consequence of the rise indemand in China and other Asian countries for theseproducts. In addition, the situation has beenexacerbated by the rise in the global cost of metals,the reduction of imports of raw materials from Braziland Turkey, and the new US Environmental ProtectionAgency (EPA) requirements and standards for thetreatment of wood. This trend is strengthened byincreased interest rates, higher petroleum prices, andthe impact of higher gasoline prices on transportationcosts.
Based on these factors, the projections for FY 2005suggest that investment in construction, in real terms,will grow by 1.3% or increase to $935.0 million. Incurrent prices the projection is $6,842.0 million for anincrease of 3.3%. Alternatively, for FY 2006,projections indicate, in real terms, growth of 1.3% oran increase to $947.0 million, while in current pricesthe projection is $7,046.0 million for an increase of3.0%. These growth rates are derived from alreadyscheduled public infrastructure projects of governmentagencies, and private sector development projects,
Visitor’s ExpendituresFiscal Years 1999- 2006
2,1
38.5
2,3
87.9
2,7
28.1
2,4
86.4
2,6
76.6
3,0
24.0
3,2
45.0
3,4
88.0
0
500
1,000
1,500
2,000
2,500
3,000
3,500
199
9
200
0
200
1
20
02
r
20
03
r
20
04
p
20
05
*
20
06
*
Mill
ions
of
Dolla
rs
13.0%7.3%
7.5%
r – Revised p – Preliminary * - Projected
Investment In ConstructionCurrent Prices
Fiscal Years 1999 - 2006
6,5
51.4
6,8
49.3
6,4
91.2
6,3
34.6
6,6
25.4
6,8
42.0
7,0
46.0
6,7
56.9
0
1,500
3,000
4,500
6,000
7,50019
99
20
00
20
01
20
02
20
03
r
20
04
p
20
05
*
20
06
*
Mill
ions
of
Dolla
rs
4.6%3.3%
3.0%
r – Revised p – Preliminary * - Projected

COMPREHENSIVE ECONOMIC DEVELOPMENT STRATEGY 2005
Puerto Rico Planning Area • Annual Report • CEDS Update • EDA Investment Number: 01-85-08072 25
on behalf of the pharmaceutical andtelecommunications industries.
Equipment and MachineryInvestment(s) in equipment and machinery can bedefined as the purchase of equipment and machinery,as final goods, realized by the private sector, thecentral government of the commonwealth and themunicipal governments. Such investments are utilizedin the formation of capital, although, primarily, it isprivate industry which accounts for the majority ofthis investment. Accordingly, in FY 2004, realinvestment in equipment and machinery representedapproximately 53% of gross domestic investment(GDI) for a total of $1,026.4 million, representing anincrease of 11.8% or $5,371.5 million in current pricesfor a growth rate of 6.8%. In nominal terms, for FY2005 and FY 2006 the projections for this variableare $5,640.0 and $5,934.0 million, respectively, withcorresponding growth rates of 5.0% and 5.2%. Inconstant prices, the values estimated are $1,067.0million and 4.0% for FY 2005, and $1,112.0 millionand 4.2% for FY 2006.
Federal Transfer PaymentsBy virtue of their magnitude and nature, federaltransfer payments play an important role in theeconomy of the island and are recognized for theirimportance for overall service improvement, publicworks projects for infrastructure development,improvement in education and, generally, quality of
life improvements. Accordingly, federal transferpayments constitute an immensely important“external” funding stream for the Puerto Ricaneconomy. During FY 2004, payments to individualsaccounted for a total of $9,432.8 million andrepresented a 0.4% increase or an absolute growthof $40.3 million. The corresponding projections forthe current and upcoming fiscal years, anticipate acontinued positive trend for the island economy. DuringFY 2005, 5.0% growth is expected for a total of$9,902.0 and during FY 2006, a growth of 5.7% isexpected for a total of $10,464.0.
Economic Perspectives forFY 2005 and FY 2006, in theContext of Historic Trends
During FY 2004, the economy of Puerto Ricocontinued its positive performance and achieved realgrowth of 2.8%, after an increase of 2.0% in FY2003, and a reduction of 0.3% during FY 2002. Inreal terms, each of the components of gross productcontributed favorably to growth during FY 2004.Among the factors which influenced growth in theeconomy were the economic recovery of NorthAmerica and the increase in personal consumptionexpenditures among Puerto Rican residents. In currentprices gross product reached $50,320.1 million andgrew 6.1% over FY 2003.
5,9
34.0
5,6
40.0
5,0
27.5
5,3
71.5
0
1,000
2,000
3,000
4,000
5,000
6,000
2003r 2004p 2005* 2006*
Mill
ions
of D
olla
rs
Investment in Machinery and Equipment
Fiscal Years 03 - 06
r – Revised p – Preliminary * - Projected
Federal Transfer PaymentsFiscal Years 03 - 06
r – Revised p – Preliminary * - Projected
9,4
31.8
9,3
91.5
9,9
02.
0
10,4
64.0
0
2,000
4,000
6,000
8,000
10,000
12,000
2003r 2004p 2005* 2006*
Mill
ions
of D
olla
rs

COMPREHENSIVE ECONOMIC DEVELOPMENT STRATEGY 2005
Puerto Rico Planning Area • Annual Report • CEDS Update • EDA Investment Number: 01-85-08072 26
-0.3
2.0 2.12.6
2.22.8 2.8
2.3 2.5
-1.0
0.0
1.0
2.0
3.0
4.0
5.0
2002r
2003r
2004p
Gross ProductGrowth Rates, Fiscal Years 02 - 06
Constant Prices
2005 2006
r – Revised p – Preliminary
Historic Projected
Percent
Min
.
Base
Max.
Min
.
Base
Max.
Min
.
Base
Max
.
Min
.
Base
Max
.
Gross ProductIn accordance with base scenario projections, duringFY 2005, the Puerto Rico Planning Board (PRPB)estimates Puerto Rico’s real gross product at $7,042.0million, and during FY 2006, we estimate real grossproduct at $7,218.0 million, representing increases of2.3% and 2.5%, respectively. In current prices, for2005 and 2006, the PRPB estimates gross productvalues as $53,339.0 million and $56,486.0 million, withgrowth rates of 6.0% and 5.9% respectively. Giventhe inherent uncertainty of predicting the performanceof the economy, the PRPB generates two additionalscenarios: first, the minimum scenario, wherein wemake a conservative estimate, and second, a maximumscenario, wherein we make an optimistic estimate.With regard to the minimum projection, the PRPBestimates conservative performance of the economyto be 2.1% growth in real gross product during FY2005 and 2.2% during FY 2006. With regard to themaximum projection, the PRPB estimates optimisticperformance of the economy to realize 2.6% growthin real gross product during FY 2005 and 2.8% duringFY 2006.
Personal Income and PersonalConsumptionDuring FY 2004, real personal income increased by3.2% as compared to FY 2003, and reached $9,563.5million. Nevertheless, this increase was less than FY2003, when real personal income increased by 4.7%over FY 2002. The PRPB projections for FY 2005indicate that real personal income will achieve 2.6%growth, or $9,810.0 million, whereas, projections forFY 2006 indicate 3.6% growth, at $10,164.0 million.
In current prices, during FY 2005 and FY 2006, theestimated values are $49,081.0 million and $51,767.0million, respectively, and represent a growth of 5.0%and 5.5% respectively, for each of the yearsconsidered.
During FY 2004, real personal consumption, theprincipal component of gross product, reached$8,774.7 million for an equivalent of 3.4% growth, ascompared to FY 2003. The PBPB estimated thevalue of real personal consumption for FY 2005 at$9,010.0 million, representing a 2.7% growth. For FY2006 PRPB projections estimate a value of $9,280.0million, representing 3.0% growth. In current prices,
41,0
79.5
42,
038.
6
44,7
44.
7
46,7
62.
4
51,7
67.
0
49,0
81.
0
0
10,000
20,000
30,000
40,000
50,000
60,000
2001 2002r 2003r 2004p 2005* 2006*
Personal IncomeCurrent Prices, Fiscal Years 01 -06
r – Revised p – Preliminary * - Projected
4.5%5.0%
5.5%
Mill
ions
of D
olla
rs
37,5
90.3
38,8
44.9
40,9
80.0
42,9
05.2
45,0
81.0
47,2
63.0
0
10,000
20,000
30,000
40,000
50,000
2001 2002r 2003r 2004p 2005* 2006*
Personal Consumption Expenditures
Current Prices, Fiscal Years 01 -06
4.7%5.1%
4.8%
r – Revisado p – Preliminar * - Proyectado

COMPREHENSIVE ECONOMIC DEVELOPMENT STRATEGY 2005
Puerto Rico Planning Area • Annual Report • CEDS Update • EDA Investment Number: 01-85-08072 27
the figures estimated for the same periods are$45,081.0 and $47,263.0, or increases of 5.1% and4.8%, respectively.
Finally, it is prudent at this juncture to again underscorethat any economic projection, forecast, orprognostication is absolutely a function of the expectedmovement of exogenous factors, which underlie thesame analytical process. Accordingly, any economicprojection must be evaluated, particularly withreference to the anticipated, as well as unanticipatedchanges, which might occur, among these complexand interrelated exogenous variables.
Why Project Puerto Rico 2025?Since the time of Operation Bootstrap in the 1950s,Puerto Rico has been considered one of the “models”of development – alongside such well-known success-stories as Singapore, Taiwan and Ireland. From beingone of the poorest societies in the world, Puerto Ricohas transformed itself into a “developed” country,enjoying higher levels of income, education, healthcoverage, and infrastructure provision than any otherregion of Latin America.
However, despite these achievements (or perhaps,because of them), Puerto Rico today faces manychallenges. For example, economic growth that
averaged in excess of 8% per year in the period 1950-1980 has declined to an average of 3-4% per year forthe last 20 years. As a result, household incomes whichwere gradually catching up with the US average havebarely kept pace with US growth rates and have beenovertaken by other countries which were previouslymuch poorer than Puerto Rico.
Source: Puerto Rico 2025; Planning Board; World Bank – World Development Indicators; A.T. Kearney Analysis
$328 $723
$3,930
$6,421
$10,550
$1,729
1950 1960 1970 1980 1990 2000
Growth of Puerto Rico’s GNP per capita
$ per capita (current dollars)
Source: Puerto Rico 2025; Planning Board; World Bank – World Development Indicators; A.T. Kearney Analysis
$328 $723
$3,930
$6,421
$10,550
$1,729
1950 1960 1970 1980 1990 2000
Growth of Puerto Rico’s GNP per capita
$ per capita (current dollars)
Illiteracy rate % of population with 10 years old or above
35.1%
24.7%16.6%
10.8% 10.3% 10.6% 8.5%
1950 1980 1990 2003E197019601940
Illiteracy rate % of population with 10 years old or above
35.1%
24.7%16.6%
10.8% 10.3% 10.6% 8.5%
1950 1980 1990 2003E197019601940Source: Puerto Rico 2025; Planning Board; World Bank – World
Development Indicators; A.T. Kearney Analysis
4661
72 73 74 7669
Life expectancy evolutionNumber of years
1950 1980 1990 2003E197019601940Source: Puerto Rico 2025; Planning Board; World Bank – World
Development Indicators; A.T. Kearney Analysis
Source: Puerto Rico 2025; Estudios Technicos; U.S. Department of Energy; International Labour Organisation, LABORSTA database; World Trade Organization;
Labor costs – Puerto Rico vs. selected locations –
2002$US per hour in pharmaceuticals
0.3
1.4
5.3
10.1
18.6
14.5
Mexico
Ireland
Singapore
Puerto Rico
China
United States

COMPREHENSIVE ECONOMIC DEVELOPMENT STRATEGY 2005
Puerto Rico Planning Area • Annual Report • CEDS Update • EDA Investment Number: 01-85-08072 28
Moreover, while, Puerto Rico maintains a strong positionin pharmaceutical and high tech manufacturing andcontinues to attract investment in these sectors, PuertoRico’s traditional sources of competitiveadvantage (low labor costs, tax incentives and freeaccess to the US market) have gradually been eroded,as more low-cost countries offer similar incentives andtake advantage of free trade agreements. Also, povertyand unemployment rates remain unacceptably high.Very few local companies compete in export marketsor invest in innovation, and economic activity is highlydependent on personal and government consumption,partly fed by US Federal Transfers and the informaleconomy.
Alternatively, Puerto Rico boasts near-universaleducation and health coverage, with results thatmatch or even exceed performance in many OECDcountries. However, relative to their size and fundinglevels, the quality of output of Puerto Rico’s educationand health systems is disappointing. Educationoverhead costs are excessive, school dropout rates arehigh, and quality is widely perceived to be deteriorating.Increasing care costs and an aging population willfurther aggravate the overstretched health system.High levels of youth poverty and unemployment,combined with the prevalence of drugs result inalarming homicide levels and breakdown of family andcommunity structures.
Puerto Rico’s transportation, communication, andutilities infrastructure are among the best in its regionand, although sometimes perceived as burdensome,effective environmental and zoning regulations ensurethat Puerto Ricans enjoy better environmentalprotection than many similar rapidly-developingeconomies. However, much of Puerto Rico’sinfrastructure (from roads to airports and ports, fromelectricity and water supply to landfills and wastetreatment facilities) is already near capacity and willexceed capacity within the next few years. At thesame time, as a small island with high population densityand finite resources, Puerto Rico clearly cannot affordthe economic and environmental costs of continuedinfrastructure-development and resource-consumptionat current rates.
Moreover, the world around Puerto Rico is changingfast, presenting new challenges. Demographic andincome growth in emerging markets, particularly in Asia,are causing fundamental shifts in global markets forgoods and services and in the sources of productionand human talent. Reduction in trade barriers isprompting more and more countries to competefor investment and exports. Whole industries, from
% Average US weighted tariff rate
Open access to US market – Puerto Rico vs. rest of the World –
4.0
1.9
1990 2001Source: Puerto Rico 2025; Estudios Technicos; U.S. Department
of Energy; International Labour Organisation, LABORSTA database; World Trade Organization;
% Average US weighted tariff rate
Open access to US market – Puerto Rico vs. rest of the World –
4.0
1.9
1990 2001Source: Puerto Rico 2025; Estudios Technicos; U.S. Department
of Energy; International Labour Organisation, LABORSTA database; World Trade Organization;
Note: 1) Excludes agricultural and fuel productsSource: Puerto Rico 2025; UNCTAD, World Trade
Organization (WTO)
0
50
100
150
200
1995
1997
1999
2001
2003
Number of WTO members
0
50
100
150
200
1995
1997
1999
2001
2003
Number of WTO members
Number of regional trade agreements
0
50
100
150
200
1980
1985
1990
1995
2000
2003
Number of regional trade agreements
0
50
100
150
200
1980
1985
1990
1995
2000
2003

COMPREHENSIVE ECONOMIC DEVELOPMENT STRATEGY 2005
Puerto Rico Planning Area • Annual Report • CEDS Update • EDA Investment Number: 01-85-08072 29
manufacturing to services, are moving the bulk of theirproduction from the Americas and Europe to Asia.Many developed countries face the same socialchallenges as Puerto Rico (declining education quality,escalating healthcare costs, increasing crime and socialtension), and many have implemented successfulinnovations to tackle these issues. Increasing globaldemand for resources (water, energy, land) will fuelresource-shortages, tension, and heightenenvironmental consciousness and the search for moreefficient processes. Accelerating technology innovation(in IT and communications, life sciences, and newmaterials) is redefining entire industries – threateningthose who have sunk costs in existing technologyplatforms and offering opportunity to those who canleapfrog to leadership in emerging technologies. Atthe same time, global integration and communicationtechnologies are empowering citizens and civilorganizations – with enormous potential to enhance theparticipative process, but also to increase resistanceto change.
In the context of these global changes and PuertoRico’s internal challenges, Puerto Rico cannot affordto rest on its laurels or continue on the same path.Those states and countries that have enjoyed thegreatest economic, social and environmental progressin recent years are those that continuously scan theexternal environment, adjust their strategy to reflect
the new competitive reality, and develop broad politicalconsensus to push through these strategies.
For example, in 1979, Ireland was one of the poorestcountries in Western Europe, mired in recession andpolitical turmoil. Since the 1980s, governments of bothparties have followed a common fiscal and monetaryagenda, used special incentives to promote industrialdevelopment, and instituted a series of “socialcontracts” with unions and employer associations tokeep wages in line with productivity growth. While,today, Ireland boasts one of the highest income levelsin the world (higher than Switzerland, Canada and theUnited Kingdom), unemployment is among the lowest,and the country draws one of the largest FDI flows asa percentage of its GDP, almost 20% in 2000.
Alternatively, Singapore has followed a similartrajectory, transforming itself from an unstable and“backward” British military base in the 1960s to thesecond richest country in the world today. To do so,the government has consistently emphasized efficientand transparent government and tight monetarypolicy, promoted FDI and free trade, and invested ininfrastructure and labor-force skills. Through thisprocess, Singapore has continuously reassessed itscomparative advantages and refocused its economicactivity; from textiles and food in the 1960s, tochemicals and electronics in the 1980s to a leading IT,services, and biotech center today. One of the structuralsupports for this culture of innovation, evaluation and
GNP per capita in PPP terms
0
5,000
10,000
15,000
20,000
25,000
30,000
35,000
40,000
1980 1990 2000
Source: Puerto Rico 2025; World Development Indicators
USA
Ireland
UKSingapore
Mexico
GNP per capita in PPP terms
0
5,000
10,000
15,000
20,000
25,000
30,000
35,000
40,000
1980 1990 2000
Source: Puerto Rico 2025; World Development Indicators
USA
Ireland
UKSingapore
Mexico
Weighted average US tariff rates1)
0
1
2
3
4
5
1989
1990
1991
1992
1993
1994
1995
1996
1997
1998
1999
2000
2001
Note: 1) Excludes agricultural and fuel productsSource: Puerto Rico 2025; UNCTAD, World Trade
Organization (WTO)

COMPREHENSIVE ECONOMIC DEVELOPMENT STRATEGY 2005
Puerto Rico Planning Area • Annual Report • CEDS Update • EDA Investment Number: 01-85-08072 30
change has been a Board of Advisors comprising topforeign business executives which, as leaders of thebusiness community have supported this process.
In the this context it is clear, in socio-economic andhistorical terms, what Puerto Rico needs to acomplish:
1. Redefine its economic policies to focus on newareas of competitive advantage; and,
2. Overhaul its social systems to ensure qualityof life and opportunity for all; and,
3. Make proactive investments in technologiesand techniques to preserve its environment;and,
4. Promote continuous benchmarking andoutward orientation to stay ahead of the pack.
Unfortunately, Puerto Rico has not effectively norsystematically addressed these challenges: many ofPuerto Rico’s institutions have the same goalsand structures as in the 1950s. Very few institutions(public or private) have invested resources in innovationor in understanding the changes happening in the world.There is little continuity in policy-making because ofpartisanship and pandering to narrow interest groups.
Thus, project Puerto Rico 2025 was intended as aground-breaking initiative to change all that – bydeveloping Consensus about the changes that areneeded, building Commitment to push through thesechanges, and establishing Continuity in policy-makingto see them through toward the economy, society,culture and environment Puerto Ricans want anddeserve.
Credit and What Follows
As stated previously, the development of the PuertoRico 2025 Vision and Call to Action has dependedentirely on the active participation of thousands ofindividuals and organizations. The individuals who havecontributed their time, insights, significant support, andresources are too numerous to name, however, a listof those participants recognized formerly by the PuertoRico 2025 Steering Committee has been included atthe beginning of this document.
For the primary working group—termed the projectCoordinating Team and composed of; DDEC, laJunta de Planificación de PR, La Fortaleza, H. CaleroConsulting Group, Alfredo Carrasquillo, and A.T.Kearney, who have provided the day-to-daycoordination of the project—the daily work beganroughly in July 2003. However, for various membersof the project, in particular those among the SteeringCommittee and the Executive Committee, theground work for this project began as far back as thespring of 2001.
What follows are the essential analytical outputs—in the Economic and Environmental topic areas—as developed for public dissemination, of the nearlyyear long project. That is to say, as the CEDS byits nature and mandate is less focused on the Socialand Cultural topic areas of the project, they havebeen largly omitted. The following text, althoughformatted differently, is almost identical to therelevant passages of the document published by theDepartamento de Desarrollo Económico yComercio de PR (DDEC) under the title PR 2025- A New Vision For The Future, in June 2004.
Evolution ofSingapore’s industrial output
1.1% 0.9%
32.8%
5.5%
3.7%42.1%
16.0%
12.4%
32.0%
65.8%
50.0%
16.7% 14.5%
3.7%2.8%
1961 1981 1996
Other
ElectronicsChemicals
Food and
beverageTextiles
Source: Puerto Rico 2025; World Development Indicators

COMPREHENSIVE ECONOMIC DEVELOPMENT STRATEGY 2005
Puerto Rico Planning Area • Annual Report • CEDS Update • EDA Investment Number: 01-85-08072 31
The Stakeholder-led Approach
The objectives of Puerto Rico 2025 were to:
• Develop a holistic vision of PR that includeseconomic, social, cultural, and environmental(and infrastructure) development.
• The vision required needed to be innovating andchallenging, while at the same time pragmatic.
• With practical foundations for planning andimplementation in both the short and long run inorder to achieve the success of the vision.
• The project, by its very design and nature, was tobuild the consensus and compromise of thecommunity towards the vision. To ensure the activeparticipation of all sectors of Puerto Rico’s societyin the development of the vision; to establishstrategic priorities; and to implement the plan.
• The recommendations must ensure the continuityin executing the plan, regardless of politicaltransitions, instituting appropriate mechanisms forimplementation that are anchored in both the privateand non-government sectors. That is, to overcomeincremental and occasionally contradicting policiesthat have hampered the development of PuertoRico during the past twenty years.
Puerto Rico 2025 is not just a new economicmodel, instead, it is a holistic plan for all aspects ofPuerto Rico’s economic, social, cultural, andenvironmental development. It advances as one of itsprecepts that not only should social, cultural andenvironmental quality of life be the ultimate aim of anyeconomic development program, but recognizes thatin today’s world, social and cultural vibrancy as wellas environmental quality are core determinants ofeconomic competitiveness and attractiveness.
The Puerto Rico 2025 Work PlanTo achieve these plan objectives, the Puerto Rico 2025initiative was composed of four phases of work:
1. An Assessment Phase – in order to understandwhere Puerto Rico stands today and establish theCase for Action.
It is important to note the Assessment wasexecuted using both a SWOT analysis
Description of strategic issues in “performance
indicators”
Panels
Meetings
Data
Benchmarking
Assessment Document 1
Hypothesis proofing
Trend analysis
Description of strategic issues in “performance
indicators”
Panels
Meetings
Data
Benchmarking
Assessment Document 1
Hypothesis proofing
Trend analysis
Source: Puerto Rico
Approach — Assessment Phase
Refined vision
Emerging vision for PR 2025
Inputs to adjust/ enhance
emerging vision
Community
Panels
Vision Document
1
2
Source: Puerto Rico 2025
Approach — Visioning Phase
Source: Puerto Rico 2025

COMPREHENSIVE ECONOMIC DEVELOPMENT STRATEGY 2005
Puerto Rico Planning Area • Annual Report • CEDS Update • EDA Investment Number: 01-85-08072 32
framework—i.e. looking at Puerto Rico’sStrengths, Weaknesses, Opportunities and, Threats(SWOT)—as well as an Consultative Panelframework and sought specifically to utilize priorinvestigations and studies rather than duplicateefforts or ignore other bodies of work.
2. A Visioning Phase - to define a common visionfor Puerto Rico’s desired future state in 2025.
3. A definition and Prioritization (of the Strategies)Phase - required to achieve the articulated visionwhich utilized an MCDA framework (MultiCriteria Decision Making Analysis) under thedirection of Prof. Carlos Bana e Costa, LondonSchool of Economics.
4. A Launch (Phase) of an Implementation Entityintended to push forward these recommendations.
However, the unifying theme throughout all four phasesof work, the critical component has been stakeholderparticipation.
In the Assessment phase, government, business andcommunity leaders provided input to the analysis ofPuerto Rico’s critical strengths, weaknesses,opportunities, and threats during extensive ConsultativePanels in each of the 18 working areas. Later, utilizingoutputs from the Assessment, hundreds of citizensprovided input to the development of the Vision phasethough surveys, workshops and dialogues.
Once the vision was defined an editorial committeecomprising members of the Steering Committee and
Approach — Strategic Prioritization
Define options to close gaps
Options evaluation
Risk analysis of options
Strategic Plan Document
2
3Refined strategic plan
Risk-benefit analysis of
options
Source: Puerto Rico
Approach - Strategic Prioritization
IMPLEMENTATION
Strategic Options/
Plans
The Vision Development ProcessSurveys (400+)
Social Dialogues (400+ participants)
18 Consultative Panels (200+participants)
Meetings with Professional Associations
Student contests
Executive and Steering Committee input
Previous studies and visions for Puerto Rico
Global trendsand models
Assessment (The Case for
Action)
Draft Vision
Refinement
Additional surveys and interviews
Feedback from EC, SC,
Panels
Vision
DecemberDecember January-February
Source Puerto Rico 2025
Source: Puerto Rico 2025
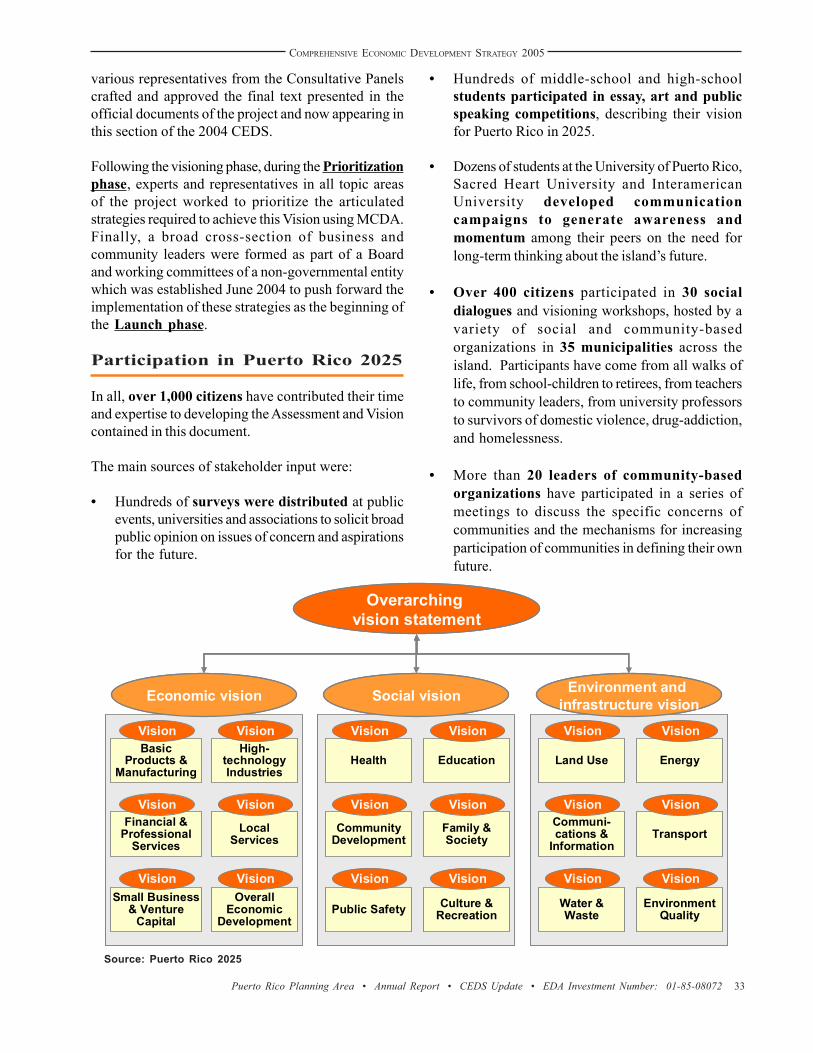
COMPREHENSIVE ECONOMIC DEVELOPMENT STRATEGY 2005
Puerto Rico Planning Area • Annual Report • CEDS Update • EDA Investment Number: 01-85-08072 33
various representatives from the Consultative Panelscrafted and approved the final text presented in theofficial documents of the project and now appearing inthis section of the 2004 CEDS.
Following the visioning phase, during the Prioritizationphase, experts and representatives in all topic areasof the project worked to prioritize the articulatedstrategies required to achieve this Vision using MCDA.Finally, a broad cross-section of business andcommunity leaders were formed as part of a Boardand working committees of a non-governmental entitywhich was established June 2004 to push forward theimplementation of these strategies as the beginning ofthe Launch phase.
Participation in Puerto Rico 2025
In all, over 1,000 citizens have contributed their timeand expertise to developing the Assessment and Visioncontained in this document.
The main sources of stakeholder input were:
• Hundreds of surveys were distributed at publicevents, universities and associations to solicit broadpublic opinion on issues of concern and aspirationsfor the future.
Basic Products &
Manufacturing
High-technology Industries
Financial & Professional
Services
Small Business & Venture
Capital
Overall Economic
Development
Health Education
Community Development
Family & Society
Public Safety Culture & Recreation
Land Use Energy
Communi-cations &
InformationTransport
Water & Waste
Environment Quality
Local Services
Vision
Vision
Vision
Vision
Vision
Vision
Vision
Vision
Vision
Vision
Vision
Vision
Vision
Vision
Vision
Vision
Vision
Vision
Economic vision Social vision Environment and infrastructure vision
Overarching vision statement
• Hundreds of middle-school and high-schoolstudents participated in essay, art and publicspeaking competitions, describing their visionfor Puerto Rico in 2025.
• Dozens of students at the University of Puerto Rico,Sacred Heart University and InteramericanUniversity developed communicationcampaigns to generate awareness andmomentum among their peers on the need forlong-term thinking about the island’s future.
• Over 400 citizens participated in 30 socialdialogues and visioning workshops, hosted by avariety of social and community-basedorganizations in 35 municipalities across theisland. Participants have come from all walks oflife, from school-children to retirees, from teachersto community leaders, from university professorsto survivors of domestic violence, drug-addiction,and homelessness.
• More than 20 leaders of community-basedorganizations have participated in a series ofmeetings to discuss the specific concerns ofcommunities and the mechanisms for increasingparticipation of communities in defining their ownfuture.
Source: Puerto Rico 2025

COMPREHENSIVE ECONOMIC DEVELOPMENT STRATEGY 2005
Puerto Rico Planning Area • Annual Report • CEDS Update • EDA Investment Number: 01-85-08072 34
• More than 200 leading thinkers in each sectorof the economy, society, infrastructure andenvironment have come together in 18Consultative Panels to complete the assessmentof Puerto Rico’s situation today and agree onfuture goals for each sector.
• Leaders of the PR2025 Steering Committee andof Puerto Rico’s leading professionalassociations have participated in meetings andworkshops to share their own priorities for the future.
• An additional 20 panels, with over 120stakeholders participating, in order to renderthe strategy prioritization.
The challenges in undertaking a project of this magnitudeand ambition cannot be underestimated. However, thelevel of cross-society participation and momentumgenerated gives hope that this may indeed be a uniqueopportunity to break the mold of skepticism and divisionin Puerto Rico, and build a truly holistic, trend-breaking,and yet practical, vision for Puerto Rico’s future.
Descriptions of EconomicDevelopment Conditions;the Puerto Rico 2025 EconomicAssessment and Vision
In 2025, Puerto Rico is a prosperous, productive,and innovative society, capable of generatingknowledge with an entrepreneurial spirit andsupported by an efficient public sector.
Globally integrated, Puerto Rico creates a fertileand dynamic environment for internal growth andprovides its population with ample opportunitiesto reach its potential and to equitably share thebenefits of such growth potential. This resultsfrom:
A country that fosters entrepreneurialactivity;
A fiscal policy that facilitates and encouragesproductivity, income generation, and savings;
A legal framework that protects the balancebetween production and natural wealth;
Knowledge and technology are the maindrivers of the economy;
An agile, accessible, and reliable publicsystem of economic, social, and geographicalinformation.
Economic development increases profits,reduces unemployment, inequality, and povertyrates, allowing all members of society to achievetheir full potential using their knowledge andtalent.
Puerto Rico offers workers, entrepreneurs, andinvestors (local and foreign) the most competitivelocation to generate wealth in the Americas, interms of:
Human capital, knowledge and productivity;Quality of life;
A natural environment capable of sustainingeconomic activities;
A built environment and technology;Social harmony and professional ethic;Political and legal stability;
Access to capital;
A fair regulatory framework and fiscal policy.
Source: Puerto Rico 2025; Penn World Tables 6.1, Alan Heston and Robert Summers; World Bank, World Development Indicators 2002; A.T. Kearney analysis
US
Singapore
Chile
Slowing growth of per capita income – Real PPP-adjusted GDP per capita –
S. Korea
Ireland
Taiwan
Puerto Rico
6.4%
13.6%
8.0%
10.8%
12.4%
9.0%
7.5%
1960 – 1980 1980 – 2000
6.1%
8.0%
8.3%
9.1%
9.9%
4.3%
5.5%
Source: Puerto Rico 2025; Penn World Tables 6.1, Alan Heston and Robert Summers; World Bank, World Development Indicators 2002; A.T. Kearney analysis
US
Singapore
Chile
Slowing growth of per capita income – Real PPP-adjusted GDP per capita –
S. Korea
Ireland
Taiwan
Puerto Rico
6.4%
13.6%
8.0%
10.8%
12.4%
9.0%
7.5%
1960 – 1980 1980 – 2000
6.1%
8.0%
8.3%
9.1%
9.9%
4.3%
5.5%US
Singapore
Chile
Slowing growth of per capita income – Real PPP-adjusted GDP per capita –
S. Korea
Ireland
Taiwan
Puerto Rico
6.4%
13.6%
8.0%
10.8%
12.4%
9.0%
7.5%
1960 – 1980 1980 – 2000
6.1%
8.0%
8.3%
9.1%
9.9%
4.3%
5.5%
Slowing growth of per capita income – Real PPP-adjusted GDP per capita –
S. Korea
Ireland
Taiwan
Puerto Rico
6.4%
13.6%
8.0%
10.8%
12.4%
9.0%
7.5%
1960 – 1980 1980 – 2000
Slowing growth of per capita income – Real PPP-adjusted GDP per capita –
S. Korea
Ireland
Taiwan
Puerto Rico
6.4%
13.6%
8.0%
10.8%
12.4%
9.0%
7.5%
1960 – 1980 1980 – 2000
6.1%
8.0%
8.3%
9.1%
9.9%
4.3%
5.5%

COMPREHENSIVE ECONOMIC DEVELOPMENT STRATEGY 2005
Puerto Rico Planning Area • Annual Report • CEDS Update • EDA Investment Number: 01-85-08072 35
It goes without saying that economic prosperity is afundamental requirement for Puerto Rico’s successover the next 20 years. Increasing standards of living,reducing poverty, unemployment and crime, buildingschools, hospitals and infrastructure, providing theresources to protect our environment – all aredependent on maintaining and increasing Puerto Rico’seconomic output.
In the modern era of globalization, more and morecountries compete to attract investment and promoteexports. Economic growth and prosperity are in turndependent on increasing competitiveness andproductivity. Hence, Puerto Rico will not create orattract the jobs that people want, unless it offers localand foreign workers, entrepreneurs and investors themost competitive location to do business and generatewealth.
Furthermore, in a world of accelerating technologicaland demographic change and increasing resourcescarcity, continuous innovation and learning are the onlyway to stay competitive. And the best way to ensurethat Puerto Rico stays innovative is to stimulate localentrepreneurs – multinationals may come and go, butinnovative local businesses and workers will be the keyto keeping Puerto Rico at the cutting edge of the globaleconomy.
Fifty years ago, under Operation Bootstrap, Puerto Ricoembraced the idea of global integration, competitionand innovation, and became one of the role models ofdevelopment. Today, Puerto Rico clearly ranks as themost successful society in Latin America – both interms of income levels and by virtually every measureof human development, including life expectancy,literacy, educational attainment, and infrastructurequality, among others.
Moreover, as the focus of global competition changesfrom one based on production (agriculture andmanufacturing) to one based on knowledge (technologyand services), Puerto Rico has significant assets thatmany other countries would be eager to have. It has aleading position in the key high-technology and serviceindustries (pharmaceuticals, electronics, financialservices, professional services, tourism, private healthand education services, etc.), a prime location at thecross-roads between Latin America and NorthAmerica, high levels of tertiary education, superiorinfrastructure, and a very attractive location forknowledge workers – a warm island, with beautifulbeaches, mountains, historic cities, and a vibrant,friendly culture.
There are many signs, however, that Puerto Rico isnot taking as much advantage of these assets as itshould. During the period 1950-75, Puerto Rico wasone of the fastest growing economies in the world, butfor the last 20-30 years, Puerto Rico’s growth rate hasdeclined to little more than average, meaning that manycountries in Asia and Europe have now surpassedPuerto Rico in economic growth.
As a result, unemployment (in excess of 10% of theworkforce) and poverty rates (in excess of 40% of thepopulation) have remained unacceptably high. WhilePuerto Rico has enjoyed great success in using tax-breaks and other incentives to attract pharmaceuticaland electronic firms to establish manufacturing plantsin the island, not enough has been done to leveragetheir presence and establish sophisticated local suppliersand indigenous R&D to support these industries. Asother countries compete to lure these companies awaywith lower costs and similar incentives and access tothe US market, Puerto Rico has developed few intrinsicanchors to keep these companies here.
With very few world-class export-oriented local firms,Puerto Rico has remained highly dependent on
Income convergence– GDP per Capita as a % of US levels –
21.5
41.9
55.1
16.7
80.4
76.4
32.9
12.0
9.8
37.5
1950 1960 19901970 20001980
Singapore
Ireland
Taiwan
S.Korea
PuertoRico
Source: Puerto Rico 2025; Penn World Tables 6.1, Alan Heston and Robert Summers; World Bank, World Development Indicators 2002; A.T. Kearney analysis

COMPREHENSIVE ECONOMIC DEVELOPMENT STRATEGY 2005
Puerto Rico Planning Area • Annual Report • CEDS Update • EDA Investment Number: 01-85-08072 36
government spending, US Federal transfers, personalconsumption and the informal economy to driveeconomic activity. The large and cumbersome publicsector in turn imposes extra costs on Puerto Rico’sbusinesses and threatens its competitiveness as alocation.
Compared to most other regions of the world, PuertoRico’s “glass is still more than half-full” (in terms ofindustry-base, skill levels, location, infrastructure, etc.),but clearly significant changes are required to maintainand improve Puerto Rico’s position and truly provideeconomic opportunity and justice for all Puerto Ricans.
The economic vision for 2025 addresses each of theseissues, with clear emphasis on each of the factors thatwill ensure Puerto Rico’s economic success:
• Innovation, knowledge and technology as thedrivers of the economy
• Integration into the global economy, coupled withlocal enterprise and locally-generated growth
• An efficient public sector, with rational fiscal andregulatory structures
• Opportunity and prosperity for all
• Competitiveness and productivity, defined not justby lower cots, but as much by Puerto Rico’s qualityof life, human and financial capital, naturalenvironment, infrastructure, social harmony andpolitical and legal stability.
To support this overarching economic vision, the PuertoRico 2025 Vision also defines specific visions for thecomponents of Puerto Rico’s economy:
• Local enterprises
• High-technology industries
• Knowledge-based services
• Retail and the Travel Industry
• The New Agriculture
The following describes the specific visions for eachof these five areas.
Local Businesses andEntrepreneurship
In 2025, local entrepreneurs, workers andinvestors are a fundamental driving force ofeconomic development, innovation, exportactivity, and participation in global supply chains,given:
The conviction that progress entails risks;
A high level of management competency andtechnological knowledge;
Emphasis on technology transfer andResearch and Development;
Well developed capital markets;
The brand “Made in Puerto Rico” is recognizedas a brand of the best quality.
Why is this important?While attracting and retaining global investors willremain critical for Puerto Rico’s economicadvancement and absorption of global best practices,development of strong locally-owned enterprises willbe just as important to Puerto Rico’s economicdynamism in future years. International firms bringcritical know-how and capital to Puerto Rico, but inthe global knowledge-economy, locally-owned
New businesses created per millionpopulation
PuertoRico
Chile Ireland Singa–-pore
Mexico USA
225 303 346532
2,330 2,455
Annual average number 1998 - 2002
New businesses created per millionpopulation
PuertoRico
Chile Ireland Singa–-pore
Mexico USA
225 303 346532
2,330 2,455
Annual average number 1998 - 2002
Source: Puerto Rico 2025

COMPREHENSIVE ECONOMIC DEVELOPMENT STRATEGY 2005
Puerto Rico Planning Area • Annual Report • CEDS Update • EDA Investment Number: 01-85-08072 37
companies can provide a more reliable source ofcontinuous replenishment of innovation and investmentand play a critical role in refocusing investment in areasconsistent with Puerto Rico’s areas of competitiveadvantage. As free-trade agreements andcommunication technologies continue to lower tradebarriers, international firms will tend to relocate theirproduction to lower-cost locations. Local firms willalso exit industries that are no longer competitive inPuerto Rico, but they will tend to re-invest in new areaswhere Puerto Rico offers competitive advantages, thuscontinuously replenishing the supply of jobs, innovation,and productivity improvement (which in turn increasesincomes).
Developing world-class local suppliers is also the bestway to keep international investors in Puerto Rico. IfPuerto Rican firms develop unique capabilities andrelationships as suppliers of goods and services tomultinationals, the foreign firms will find it harder torelocate their production simply because anotherjurisdiction offers lower costs or taxes.
Local enterprise is also critical to ensuring thateconomic opportunity is open to all. In successful
market economies, small and medium enterprisescreate jobs faster than large firms and tend to be agreater source of innovation and flexibility in theeconomy. Small business activity and self-employmentalso provide the best means to generate wealth andself-sufficiency in the poorest communities and amongthose marginalized from the formal economy.
How is Puerto Rico performingtoday?Puerto Rico has a vibrant entrepreneurial sector. Localsmall and medium-sized businesses account for morethan half of total output and generate two-thirds of newjobs in the economy. Several Puerto Rican firms haveproven that they can compete in global markets – fromthe financial sector, to engineering and construction, tomanufacturing of high-technology products, to supplyof basic manufactures to major retailers, to food andbeverages. Beyond the well-known local businesses,the informal sector is full of countless small firms andemploys people creating legitimate businesses – albeitwithout the responsibilities and benefits of full accessto formal financial and legal systems.
Nevertheless, there is a widely held perception thatPuerto Rico has not done as much as it could tostimulate and support local entrepreneurs – particularlyin the value-added technology and knowledge sectorsthat will be key drivers of economic growth: IT, lifesciences, business process management, media and
Source: Puerto Rico 2025; Guayacan Fund annual reports; Technology Administration, State Science and Technology Indicators; U.S. Patent and Trademark Office; A.T. Kearney analysis
New Hampshire
Missouri
Arizona
Puerto Rico
Indiana 0.9
7.1
11.0
11.5
27.1
30.7
33.7
2.0
3.5
2.9
Washington
New Jersey
U.S. average$ 9.22
Venture capital investmentPer $ 1,000 of gross product
Massachusetts
California
Colorado
2000$
New Hampshire
Missouri
Arizona
Puerto Rico
Indiana 0.9
7.1
11.0
11.5
27.1
30.7
33.7
2.0
3.5
2.9
Washington
New Jersey
U.S. average$ 9.22
Venture capital investmentPer $ 1,000 of gross product
Massachusetts
California
Colorado
2000$
0.9
7.1
11.0
11.5
27.1
30.7
33.7
2.0
3.5
2.9
Washington
New Jersey
U.S. average$ 9.22
Venture capital investmentPer $ 1,000 of gross product
Massachusetts
California
Colorado
2000$
73.6
43.3
0.70.93.11.00
50100150200250300350400
Chile Mexico Brazil Singa-pore
PuertoRico
Ireland
2000 2001 per million people
Patents granted
Number of patents73.6
43.3
0.70.93.11.00
50100150200250300350400
Chile Mexico Brazil Singa-pore
PuertoRico
Ireland
2000 2001 per million people
Patents granted
Number of patents
Source: Puerto Rico 2025; Guayacan Fund annual reports; Technology Administration, State Science and Technology Indicators; U.S. Patent and Trademark Office; A.T. Kearney analysis
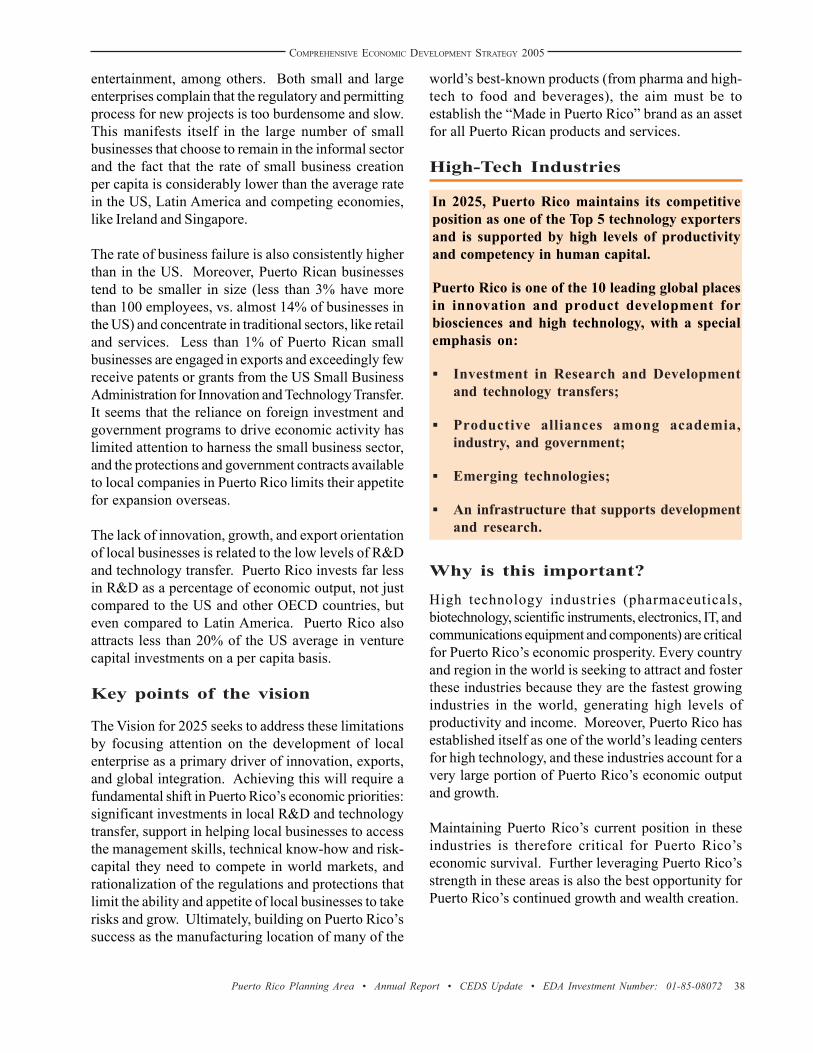
COMPREHENSIVE ECONOMIC DEVELOPMENT STRATEGY 2005
Puerto Rico Planning Area • Annual Report • CEDS Update • EDA Investment Number: 01-85-08072 38
entertainment, among others. Both small and largeenterprises complain that the regulatory and permittingprocess for new projects is too burdensome and slow.This manifests itself in the large number of smallbusinesses that choose to remain in the informal sectorand the fact that the rate of small business creationper capita is considerably lower than the average ratein the US, Latin America and competing economies,like Ireland and Singapore.
The rate of business failure is also consistently higherthan in the US. Moreover, Puerto Rican businessestend to be smaller in size (less than 3% have morethan 100 employees, vs. almost 14% of businesses inthe US) and concentrate in traditional sectors, like retailand services. Less than 1% of Puerto Rican smallbusinesses are engaged in exports and exceedingly fewreceive patents or grants from the US Small BusinessAdministration for Innovation and Technology Transfer.It seems that the reliance on foreign investment andgovernment programs to drive economic activity haslimited attention to harness the small business sector,and the protections and government contracts availableto local companies in Puerto Rico limits their appetitefor expansion overseas.
The lack of innovation, growth, and export orientationof local businesses is related to the low levels of R&Dand technology transfer. Puerto Rico invests far lessin R&D as a percentage of economic output, not justcompared to the US and other OECD countries, buteven compared to Latin America. Puerto Rico alsoattracts less than 20% of the US average in venturecapital investments on a per capita basis.
Key points of the vision
The Vision for 2025 seeks to address these limitationsby focusing attention on the development of localenterprise as a primary driver of innovation, exports,and global integration. Achieving this will require afundamental shift in Puerto Rico’s economic priorities:significant investments in local R&D and technologytransfer, support in helping local businesses to accessthe management skills, technical know-how and risk-capital they need to compete in world markets, andrationalization of the regulations and protections thatlimit the ability and appetite of local businesses to takerisks and grow. Ultimately, building on Puerto Rico’ssuccess as the manufacturing location of many of the
world’s best-known products (from pharma and high-tech to food and beverages), the aim must be toestablish the “Made in Puerto Rico” brand as an assetfor all Puerto Rican products and services.
High-Tech Industries
In 2025, Puerto Rico maintains its competitiveposition as one of the Top 5 technology exportersand is supported by high levels of productivityand competency in human capital.
Puerto Rico is one of the 10 leading global placesin innovation and product development forbiosciences and high technology, with a specialemphasis on:
Investment in Research and Developmentand technology transfers;
Productive alliances among academia,industry, and government;
Emerging technologies;
An infrastructure that supports developmentand research.
Why is this important?
High technology industries (pharmaceuticals,biotechnology, scientific instruments, electronics, IT, andcommunications equipment and components) are criticalfor Puerto Rico’s economic prosperity. Every countryand region in the world is seeking to attract and fosterthese industries because they are the fastest growingindustries in the world, generating high levels ofproductivity and income. Moreover, Puerto Rico hasestablished itself as one of the world’s leading centersfor high technology, and these industries account for avery large portion of Puerto Rico’s economic outputand growth.
Maintaining Puerto Rico’s current position in theseindustries is therefore critical for Puerto Rico’seconomic survival. Further leveraging Puerto Rico’sstrength in these areas is also the best opportunity forPuerto Rico’s continued growth and wealth creation.

COMPREHENSIVE ECONOMIC DEVELOPMENT STRATEGY 2005
Puerto Rico Planning Area • Annual Report • CEDS Update • EDA Investment Number: 01-85-08072 39
How is Puerto Rico performingtoday?
Manufacturing of high technology products (primarilypharmaceuticals, computers and electronics, scientific,and professional instruments) accounts for almost 40%of Puerto Rico’s total GDP. These sectors have alsoaccounted for more than 40% of Puerto Rico’s GDPgrowth in the last five years.
Measured as a stand-alone entity, Puerto Rico ranksas the world’s fifth largest manufacturer ofpharmaceutical products and the world’s largestexporter (including exports to the US). It also ranksamong the world’s 10 largest exporters of scientificand professional instruments and 20 largest exportersof computer hardware. What’s more, despite thephasing out of tax benefits under Section 936 of theUS federal tax code and increasing competition fromlower cost locations, Puerto Rico’s output per workerin these sectors continues to be exceptionally high andPuerto Rico continues to attract significant investments,particularly in the pharmaceutical and biotechnologysectors.
Despite these strengths, Puerto Rico’s dominantposition in these industries is always under threat. Asmore and more countries can offer similar taxadvantages and trade access to the US, Puerto Rico’srelatively high wages, high energy and waste disposalcosts, and slow permitting and approval process putthe island at a competitive disadvantage. Moreworrisome, Puerto Rico has done relatively little todevelop intrinsic advantages in these industries (interms of local suppliers, human capital and R&D) thatmight keep these industries in Puerto Rico even in theface of lower cost competition.
Thanks to their long presence, Puerto Rico hasdeveloped accumulated management and technicalskills in these industries, but Puerto Rico today producesrelatively few science and engineering graduates,invests very little in R&D compared to the OECD andLatin American averages, and has developed few localsuppliers for these industries.
Key points of the vision
The Vision for 2025 addresses both the need to retainthese industries in Puerto Rico and the need to leveragePuerto Rico’s strong base in these industries into
Computer hardwareShare of global exports
0.1%
2.8%
2.9%
4.9%
5.5%
6.2%
10.5%
18.5%
0.8%
9.4%
5.1%
USA
Singapore
Japan
Malaysia
UK
Germany
Mexico
France
Brazil
China
Puerto Rico
Source: Puerto Rico 2025; EpsicomPharmaceutical Markets Factbook2003, United Nations Statistical Department; Organization of Economic Cooperation and Development; Planning Board, Statistical Appendix; A.T. Kearney analysis
PharmaceuticalsShare of global exports
Source: Puerto Rico 2025; EpsicomPharmaceutical Markets Factbook2003, United Nations Statistical Department; Organization of Economic Cooperation and Development; Planning Board, Statistical Appendix; A.T. Kearney analysis
0.2%
0.4%
0.7%
6.2%
10.3%
10.7%
14.3%
24.5%
10.6%
Puerto Rico
Germany
USA
UK
France
Ireland
Mexico
Singapore
Brazil

COMPREHENSIVE ECONOMIC DEVELOPMENT STRATEGY 2005
Puerto Rico Planning Area • Annual Report • CEDS Update • EDA Investment Number: 01-85-08072 40
becoming a true center for high-technology R&D, notsimply a high-tech manufacturing center. The first goalwill be achieved through continued emphasis onincreasing productivity and skills development. Thesecond goal will require radical changes in PuertoRico’s current industrial policy: significant investmentsin R&D infrastructure, increased emphasis on R&Dand technology transfer in the government policy, atuniversities and in private firms, and alliances amongall three sectors to achieve the necessary scale andsynergies.
Most importantly, Puerto Rico’s promotion agencies,academic institutions, and corporations must developproactive long-term policies to identify and fosteremerging technologies. With accelerating technologicalchange, Puerto Rico cannot simply seek to attractindustries that already exist, but must invest 5-10 yearsahead in the early research and development for thepromising technologies of tomorrow. Absent this anddespite its technology leadership today, Puerto Ricomay find itself stuck in “sunset” technology sectors, asclusters based on new technologies emerge elsewhere.
Knowledge-Based Services
In 2025, Puerto Rico produces and exports highquality services based on knowledge thatsupport productive activities in the followingareas:
Finance;
Education;
Health;
Applied Research;
Information Technology;
Culture and Performing Arts;
Professional Services;
Transportation and Logistics.
Why is this important?Just as the transition from agriculture to manufacturingspurred the first great increase in productivity andincomes (in Puerto Rico and elsewhere), so now theshift from manufacturing to services is a prerequisitefor societies seeking to raise productivity and incomes.
Scientific instrumentsShare of global exports
0.2%
1.7%
2.1%
3.0%
6.9%
13.8%
1.5%
27.6%
4.7%
USA
Germany
UK
France
Mexico
Ireland
Singapore
Puerto Rico
Brazil
Source: Puerto Rico 2025; EpsicomPharmaceutical Markets Factbook2003, United Nations Statistical Department; Organization of Economic Cooperation and Development; Planning Board, Statistical Appendix; A.T. Kearney analysis
1) According to a survey on competitiveness conducted by ProcompSource: Puerto Rico 2025; “Analisis Preliminar de Competitividad
de Puerto Rico”, Procomp; Global Competitiveness Report 2001-2002;A.T.Kearney analysis
Main issues affecting the business environment in Puerto Rico1)
13%
17%
21%
26%
52%Government Bureaucracy
Labor Regulations
Imposed Regulations
Access to financing
Crime
2002
Main issues affecting the business environment in Puerto Rico1)
13%
17%
21%
26%
52%Government Bureaucracy
Labor Regulations
Imposed Regulations
Access to financing
Crime
2002

COMPREHENSIVE ECONOMIC DEVELOPMENT STRATEGY 2005
Puerto Rico Planning Area • Annual Report • CEDS Update • EDA Investment Number: 01-85-08072 41
Worldwide, service industries already account for themajority of economic output and employment, and theirshare of both continues to grow. In more developedcountries, as manufacturing moves to lower costlocations like China and India, development of theservices sector, particularly value-added knowledge-based services, is critical for continued economicprosperity and growth. Even in manufacturingenterprises, it is the service components of the value-chain (e.g. research and product development,marketing, sales, etc.) that generate the greatest valueand returns.
Many countries, from low-cost locations like India, tomore developed countries like Canada, Ireland andSingapore, are taking advantage of IT andcommunication technologies to establish themselves ashubs for “offshore” services to the US and othermarkets.
For Puerto Rico, with its attractive location, human skillsbase, and unique location at the geographic, culturaland linguistic crossroads between North America andLatin America, there is clearly a great opportunity tobecome a knowledge services hub for the region, justas Singapore, Hong Kong, and Miami act as hubs forfinancial and professional services in their regions.
How is Puerto Rico performingtoday?Puerto Rico has a strong base in the knowledge-servicesectors, particularly financial services and otherprofessional services. Together these sectors accountfor roughly 10% of GDP and an even larger share oflocally owned business.
Nine of Puerto Rico’s twelve publicly listed firms,including the three largest firms in Puerto Rico, arefinancial institutions. Puerto Rico’s banks earn a higherReturn on Common Equity and Return on Assets thanthe US average. These banks have grown assets byroughly 10% per year for the last five years, and havecaptured market share from international competitors.
While smaller in size, Puerto Rico also has good potentialin other professional services. With a higher proportionof university graduates than most European countries,Puerto Rico has a particularly deep talent pool in keysectors, such as law, management, accounting, computersciences, engineering, and architecture. Several PuertoRican professional service firms already export theirservices, from engineering to management consultingto IT, to other countries in the region.
Administrative burden for start-ups Rank in the Global Competitiveness Report
Rank out of 81 locations 2002
MEDIAN
HIGHLY COMPETITIVE
COMPETITIVE DISADVANTAGE
PUERTO RICORank 44
SINGAPORERank 8
SOUTH KOREARank 50
IRELANDRank 19
1) According to a survey on competitiveness conducted by ProcompSource: Puerto Rico 2025; “Analisis Preliminar de Competitividad de Puerto
Rico”, Procomp; Global Competitiveness Report 2001-2002;A.T.Kearney analysis
Source: Puerto Rico 2025; U.S. Census Bureau, County Business Patterns (2003); Angel Ruiz; Planning Board, Statistical Appendix; U.S. Small Business Administration; A.T. Kearney analysis
2001
Payroll establishmentsBy employment size
1 to 4employees
60.0%
Puerto Rico
Under 20 employees
Under 100employees
87.0%
97.0%
46.4%
76.7%
86.1%
Over 100employees
United States
2001
Payroll establishmentsBy employment size
Payroll establishmentsBy employment size
1 to 4employees
60.0%
Puerto Rico
Under 20 employees
Under 100employees
87.0%
97.0%
46.4%
76.7%
86.1%
Over 100employees
United States

COMPREHENSIVE ECONOMIC DEVELOPMENT STRATEGY 2005
Puerto Rico Planning Area • Annual Report • CEDS Update • EDA Investment Number: 01-85-08072 42
Despite these assets, Puerto Rico has done little tonurture its position as a knowledge-services hub forthe region. Until recently, Puerto Rico’s investmentand promotion agencies focused exclusively onmanufacturing. Most professional service firms aresmall in size, with limited operations or customersoutside Puerto Rico. Without focus on these areas,Puerto Rico will remain in the shadow of Miami as theservices hub for the region, and may even be overtakenby other countries in the region that are aggressivelypromoting offshore services: e.g. Costa Rica, Chile,Panama, Jamaica, and several smaller Caribbeanislands. If and when the Cuban economy opens up, itwill also present a major threat to Puerto Rico in theseareas, given the strength of its education, health andresearch systems.
Key points of the visionThe Vision for 2025 envisages Puerto Rico as a hubfor knowledge services in the region, leveraging itsexisting strengths in financial and professional servicesand logistics, but also promoting itself as a center forhealth and education services, IT, business processoutsourcing and arts and entertainment contentdevelopment.
Achieving this vision will require a significantreorientation of promotion activities, to emphasizeknowledge services, as much as manufacturing andtourism.
Trade and the Travel Industry
In 2025, retail trade and the travel industryprovide a wide range of competitive priceswith a world-class service.
The combination of natural beauty, efficientinfrastructure, cultural assets, touristservices, trade, and entertainment makePuerto Rico the most attractive destination ofthe region.
Puerto Rico is one of the most preferredplaces in the Americas for conventions, largesport events and shows.
Why is this important?The provision of world-class, competitive local services(retail, wholesale, hotels, restaurants, entertainment,recreation, travel, etc.) is critical for the quality of lifeof island residents and to attract international visitors.
Wider choice, greater efficiency and better customerservice in Puerto Rico’s retail, entertainment andhospitality sectors result in lower prices and better livingstandards for all residents. Moreover, the quality andcompetitiveness of these sectors will determine theisland’s attractiveness not only as a tourist destination,but also as a place to live for knowledge workers,investors, students, and retirees, among others. Aswealth grows worldwide, retail trade, entertainment,and tourism spending will continue to grow as a shareof world output, and the quality of retail and otherservices will be a key determinant of the country’sattractiveness for other industries.
How is Puerto Rico performingtoday?Retail, wholesale, tourism and other services(including construction) already account for 20% ofPuerto Rico’s economic output and more than 25%of employment.
Puerto Rico
United States
0.76%
2.60%
Commerce Financialservices
Manufactures
0.8%
7.7%
4.0%
Servicesector
Overall productivitygrowth = 2.32%
Growth of labor productivity 1990 to 2002
Small businesses engaged in exportsAs a share of total firms
1.8%
Source: Puerto Rico 2025; U.S. Census Bureau, County Business Patterns (2003); Angel Ruiz; Planning Board, Statistical Appendix; U.S. Small Business Administration; A.T. Kearney analysis
Puerto Rico
United States
0.76%
2.60%
Commerce Financialservices
Manufactures
0.8%
7.7%
4.0%
Servicesector
Overall productivitygrowth = 2.32%
Growth of labor productivity 1990 to 2002
Small businesses engaged in exportsAs a share of total firms
1.8%
Puerto Rico
United States
0.76%
2.60%
Commerce Financialservices
Manufactures
0.8%
7.7%
4.0%
Servicesector
Overall productivitygrowth = 2.32%
Growth of labor productivity 1990 to 2002
Small businesses engaged in exportsAs a share of total firms
1.8%
Source: Puerto Rico 2025; U.S. Census Bureau, County Business Patterns (2003); Angel Ruiz; Planning Board, Statistical Appendix; U.S. Small Business Administration; A.T. Kearney analysis

COMPREHENSIVE ECONOMIC DEVELOPMENT STRATEGY 2005
Puerto Rico Planning Area • Annual Report • CEDS Update • EDA Investment Number: 01-85-08072 43
Puerto Rico has the largest retail sector in theCaribbean, with vigorous competition between somelarge local players and major international entrants.Productivity in the retail sector (in terms of sales persquare foot and per employee) is lower than the USaverage and high-density retail markets like Singapore,but is significantly higher than the rest of Latin Americaand much of Europe. Nevertheless, both the retail andwholesale sectors are fragmented and dominated bysmall players, and employment growth has outpacedsales growth in the sector, leading to reduced sales peremployee.
Puerto Rico is also the leading tourism destination inthe Caribbean, with an excellent endowment of naturalassets, cultural attractions, and internationaltransportation links. However, with a large number ofoverseas Puerto Ricans, cruise passengers, andbusiness visitors included in Puerto Rico’s tourismfigures, the average length of stay is low, and a largenumber of visitors stay outside the hotel and small inns(“parador”) system. Despite significant governmentpromotion and incentives, tourism continues to accountfor only 5% of GDP, vs. a global average closer to10% and a Caribbean average close to 20%. PuertoRico’s position is always under threat from lower costcompetitors in the region, and Puerto Rico’s share of
Caribbean tourism has declined from 21% in 1985 to17% in 2000.
Key points of the vision
Looking forward, the Vision for 2025 envisages retail,hospitality, entertainment, recreation, and travelservices as an integrated economic sector that mustoffer choice, competition, and quality to both residentsand visitors.
As incomes continue to rise in Puerto Rico andcompetition from lower cost destinations intensifies,Puerto Rico must position itself not simply as a “sunand sand” destination, but as a vibrant entertainment,
Source: Puerto Rico 2025; World Tourism Organization (WTO)
International tourist arrivals(MM/2002)
3.1
18.619.720.124.2
36.839.841.951.7
77.0
France United States
China Canada Austria
Spain Italy United Kingdom
Mexico Puerto Rico
Source: Puerto Rico 2025; World Tourism Organization (WTO)
International tourist arrivals(MM/2002)
3.1
18.619.720.124.2
36.839.841.951.7
77.0
France United States
China Canada Austria
Spain Italy United Kingdom
Mexico Puerto Rico
International tourist arrivals(MM/2002)
3.1
18.619.720.124.2
36.839.841.951.7
77.0
France United States
China Canada Austria
Spain Italy United Kingdom
Mexico Puerto Rico
-13.1%
11.0%
0.6%2.4%
-0.7%
5.9%
1.9% 2.4%
-6.7%
3.3%
-2.6%
-11.9%
-3.9%
-9.4%
-4.0%
6.3%6.2%
0.3% 1.1%
4.6%
2002/2001 2001/2000
International tourism arrivals(% variation)
France United States
China Canada Austria
Spain Italy United Kingdom
Mexico Puerto Rico
Source: Puerto Rico 2025; World Tourism Organization (WTO)
-13.1%
11.0%
0.6%2.4%
-0.7%
5.9%
1.9% 2.4%
-6.7%
3.3%
-2.6%
-11.9%
-3.9%
-9.4%
-4.0%
6.3%6.2%
0.3% 1.1%
4.6%
2002/2001 2001/2000
International tourism arrivals(% variation)
France United States
China Canada Austria
Spain Italy United Kingdom
Mexico Puerto Rico
-13.1%
11.0%
0.6%2.4%
-0.7%
5.9%
1.9% 2.4%
-6.7%
3.3%
-2.6%
-11.9%
-3.9%
-9.4%
-4.0%
6.3%6.2%
0.3% 1.1%
4.6%
2002/2001 2001/2000
International tourism arrivals(% variation)
France United States
China Canada Austria
Spain Italy United Kingdom
Mexico Puerto Rico
Source: Puerto Rico 2025; World Tourism Organization (WTO)
23%
28%
57%
64%
86%
150%
176%
325%
110%
Openness to trade Exports and imports as a share of GDP
% of GDP 2001
Singapore
Ireland
Panama
Puerto Rico
Dominican Republic
Chile
Brazil
Mexico
USA
Note: Direct investment to Puerto Rico includes investment from US sources.
Source: Puerto Rico 2025; International Monetary Fund, International Financial Statistics; UNCTAD; Planning Board, Statistical Appendix; PRIDCO; A.T. Kearney analysis
23%
28%
57%
64%
86%
150%
176%
325%
110%
Openness to trade Exports and imports as a share of GDP
% of GDP 2001
Singapore
Ireland
Panama
Puerto Rico
Dominican Republic
Chile
Brazil
Mexico
USA 23%
28%
57%
64%
86%
150%
176%
325%
110%
Openness to trade Exports and imports as a share of GDP
% of GDP 2001
Singapore
Ireland
Panama
Puerto Rico
Dominican Republic
Chile
Brazil
Mexico
USA
Openness to trade Exports and imports as a share of GDP
% of GDP 2001
Singapore
Ireland
Panama
Puerto Rico
Dominican Republic
Chile
Brazil
Mexico
USA
Note: Direct investment to Puerto Rico includes investment from US sources.
Source: Puerto Rico 2025; International Monetary Fund, International Financial Statistics; UNCTAD; Planning Board, Statistical Appendix; PRIDCO; A.T. Kearney analysis

COMPREHENSIVE ECONOMIC DEVELOPMENT STRATEGY 2005
Puerto Rico Planning Area • Annual Report • CEDS Update • EDA Investment Number: 01-85-08072 44
convention and business center – with the added bonusof its location, climate, and topography. Like majorcities in the US and Europe, or Singapore and HongKong, it is the combination of conventions, sportingevents, cultural activities, retail, and entertainmentofferings that, despite being a high-cost destination, willmaximize Puerto Rico’s competitiveness and incomefrom tourism.
The New Agriculture
In 2025, Puerto Rico has a feasible agricultureand agribusiness sector in which leadingtechnologies play a critical role in enhancingproductivity and quality.
Agribusiness entrepreneurs identify andcapitalize on those markets in which Puerto Ricohas achieved a competitive advantage.
Why is this important?In developed countries worldwide, agriculture accountsfor a very small portion of economic output andemployment. In the 30 countries that make up theOrganization of Economic Cooperation andDevelopment (OECD), agriculture accounts on averagefor less than 2% of output and lass than 7% ofemployment.
Nevertheless, even in wealthy economies, agricultureremains an important policy issue, partly for emotionaland political reasons, but also because it has importantimpacts in segments of the economy. Agriculturegenerates a large number of jobs per unit of output,and those jobs tend to be concentrated among lowerskilled workers and in more economicallydisadvantaged regions. Appropriate, productiveagriculture can help to sustain the prosperity of ruralcommunities, balance growth, and play a role inpreserving non-urban, green environments. In a worldof increasing tension and insecurity, many alsoemphasize agriculture’s role in maintaining food supplyand security.
How is Puerto Rico performingtoday?Primary produce industries in Puerto Rico today(agriculture, fisheries, aquaculture) account for lessthan 1% of total output and less than 2% of totalemployment. Even if one includes food and beveragemanufacturers and other businesses based onagricultural products, this sector accounts for less than5% of total output and employment. The vast majorityof Puerto Rico’s food and other agricultural productsare imported. As a small island with relatively highwages and other factor costs, Puerto Rico simplycannot compete with larger-scale and/or lower-costagricultural production centers in the US, LatinAmerica, and elsewhere.
Nevertheless, the success of several food and beveragebusinesses (from Puerto Rico’s well-known rum, juiceand Hispanic food brands, to lesser known exportersof fruit, coffee, and other agricultural products) clearlydemonstrates that Puerto Rico can compete inagribusiness niches, where established brands or uniqueassets provide competitive advantage. Indeed, evenvery high-income economies like the Netherlands andDenmark still derive almost 20% of their export
Inward direct investment Direct investment per capita
US$ per capita 2002
164
138
110
94
134
435
6,325
1,560
106
Ireland
Singapore
Puerto Rico
Costa Rica
United States
Mexico
Chile
Dominican Republic
Brazil
Note: Direct investment to Puerto Rico includes investment from US sources.
Source: Puerto Rico 2025; International Monetary Fund, International Financial Statistics; UNCTAD; Planning Board, Statistical Appendix; PRIDCO; A.T. Kearney analysis
Inward direct investment Direct investment per capita
US$ per capita 2002
164
138
110
94
134
435
6,325
1,560
106
Ireland
Singapore
Puerto Rico
Costa Rica
United States
Mexico
Chile
Dominican Republic
Brazil
Inward direct investment Direct investment per capita
US$ per capita 2002
164
138
110
94
134
435
6,325
1,560
106
Ireland
Singapore
Puerto Rico
Costa Rica
United States
Mexico
Chile
Dominican Republic
Brazil
Note: Direct investment to Puerto Rico includes investment from US sources.
Source: Puerto Rico 2025; International Monetary Fund, International Financial Statistics; UNCTAD; Planning Board, Statistical Appendix; PRIDCO; A.T. Kearney analysis

COMPREHENSIVE ECONOMIC DEVELOPMENT STRATEGY 2005
Puerto Rico Planning Area • Annual Report • CEDS Update • EDA Investment Number: 01-85-08072 45
revenues from agricultural products – by focusing onbranding, use of technology, and high productivity.
Key points of the vision
The Vision for 2025 foresees that agriculture andagribusiness will continue to play a small, but important,role in Puerto Rico’s economy, through a similaremphasis on technology deployment, productivity,quality and value-addition (through productdevelopment, marketing, branding, etc.).
Agriculture will only be viable in Puerto Rico, if localagribusinesses focus on clear market niches wherePuerto Rico has competitive advantages – premiumproducts and brands with unique local associations(rums, coffee, cigars, etc.), products and brandstargeted at the Puerto Rican and broader Hispanicpopulation living elsewhere in the Americas, andselected import-substitution opportunities for high-costor perishable products that do not make sense to importto Puerto Rico or neighboring smaller islands.
Descriptions of Land Use andNatural Resource Conditions;the Puerto Rico 2025Environmental Assessmentand Vision
In 2025, Puerto Rico has a healthy environmentcapable of sustaining life in all its forms as wellas social and economic activity within aframework of sustainability.
All of us are responsible for the preservation ofour natural resources, for looking after aninfrastructure that is adequately planned;ensuring that the natural and built environmentsare well maintained, and that the limits of ourecological systems are respected.
Infrastructure and environment are integral parts ofthe Puerto Rico 2025 vision since they are part of thegoals of economic and social development for the island.The responsible and sustainable use of resourcesconstitutes the main theme in this area. Going forward,they are needed to support Puerto Rico’scompetitiveness and the quality of life of its citizens.
To support this overarching vision for environment andinfrastructure, the Puerto Rico 2025 Vision also definesspecific visions for the components:
• Environmental quality• Land use• Water and Waste• Energy• Transportation• Information and telecommunications infrastructure
Environmental Quality
In 2025, the principle of individual andcollective respect for the essence of theenvironment is the basic rule that guidesdecision-making and planning, so that naturaland built environments provide heath,resources, pleasure, and guarantee thesustainable development of Puerto Rico.
Puerto Rico’s trade balance in food products
$81
-$15
-$25
-$52
-$69
-$92
-$95
-$141
-$177
-$183
-$303
Prepared meat,fish and seafood
Fish and seafood
Meat
Beveragesand spiritsDairy products
Fresh vegetablesCereals and grainsSugar andconfectionaryAnimal feedstock
Coffee and tea
Fruits and nuts
2002US$ millions
Source: Puerto Rico 2025.Source: Puerto Rico 2025.

COMPREHENSIVE ECONOMIC DEVELOPMENT STRATEGY 2005
Puerto Rico Planning Area • Annual Report • CEDS Update • EDA Investment Number: 01-85-08072 46
Why is this important?
Environment is an integral part of the developmentchallenge. At the same time that economicdevelopment has led to dramatic improvements inquality of life across the globe, environmental factorssuch as indoor and outdoor air pollution, waterbornediseases, and exposure to toxic chemicals threaten thehealth of millions of people, and natural resources -land, water, and forests - are being degraded at alarmingrates in many countries. The economic costs ofenvironmental degradation have been estimated at 4to 8 percent of Gross Domestic Product (GDP)annually in many developing nations. Yet, dealing with
environmental problems is often difficult because oftheir complex characteristics, including delayed andcumulative impacts, irreversible damages, and regionaland global implications, among others. In this context,the concept of sustainable development, built on abalance of economic growth, social cohesion, andenvironmental protection, is increasingly gainingmomentum across the globe.
Puerto Rico has been facing many challenges in thepreservation of its environment in the last decades.Rapid development, uncontrolled urban sprawl, highpopulation density, high consumption, and wastegeneration rates have put significant stress on keynatural systems in the island.
How is Puerto Rico performingtoday?
Although a set of comprehensive laws and institutionsfor environmental protection has been put in place, bothat the federal and commonwealth levels, implementationand compliance remain as key problems. In this context,by many measures, environmental quality is stillunacceptable: several water bodies have becomepolluted, and sensitive ecosystems have been impactedby rapid and ill-controlled development. This situationis aggravated when considering that the share of thePuerto Rico budget spent on environment is almost halfof the average invested by the US states.
Without effective implementation and enforcement ofenvironmental laws, coordinated resource use plans,incentives and education, then quality of life in the longterm is mostly likely to be undermined, competitivenessimpacted, and several critical resources lost forever.
Key points of the vision
The Puerto Rico 2025 vision on environmental qualityis aligned with the concept of sustainable development.The vision ensures the availability of needed resourcesto support the island’s economic development whilepreserving Puerto Rico’s attractiveness as a healthyplace to live and enjoy. These characteristics are notonly important by themselves, but as requirements forany location aspiring to be a knowledge-based society,attracting high caliber professionals.
State Spending on EnvironmentAs % of Total State Budget
2002% of State Budget for Environment
1.4%
0.8%
US average Puerto Rico
Source: Puerto Rico 2025
State Spending on EnvironmentAs % of Total State Budget
2002% of State Budget for Environment
1.4%
0.8%
US average Puerto Rico
State Spending on EnvironmentAs % of Total State Budget
2002% of State Budget for Environment
1.4%
0.8%
US average Puerto Rico
Source: Puerto Rico 2025
Source: Puerto Rico 2025; World Bank 2003
2002% of total land area
Nationally protected areas
Ireland
4.9%
11.5%
23.0%25.9%
3.5%1.0%
PuertoRico Singapore
L. America&
Caribbean
CostaRica
U.S.
Source: Puerto Rico 2025; World Bank 2003
2002% of total land area
Nationally protected areas
Ireland
4.9%
11.5%
23.0%25.9%
3.5%1.0%
PuertoRico Singapore
L. America&
Caribbean
CostaRica
U.S.
–% of State Budget for Environment
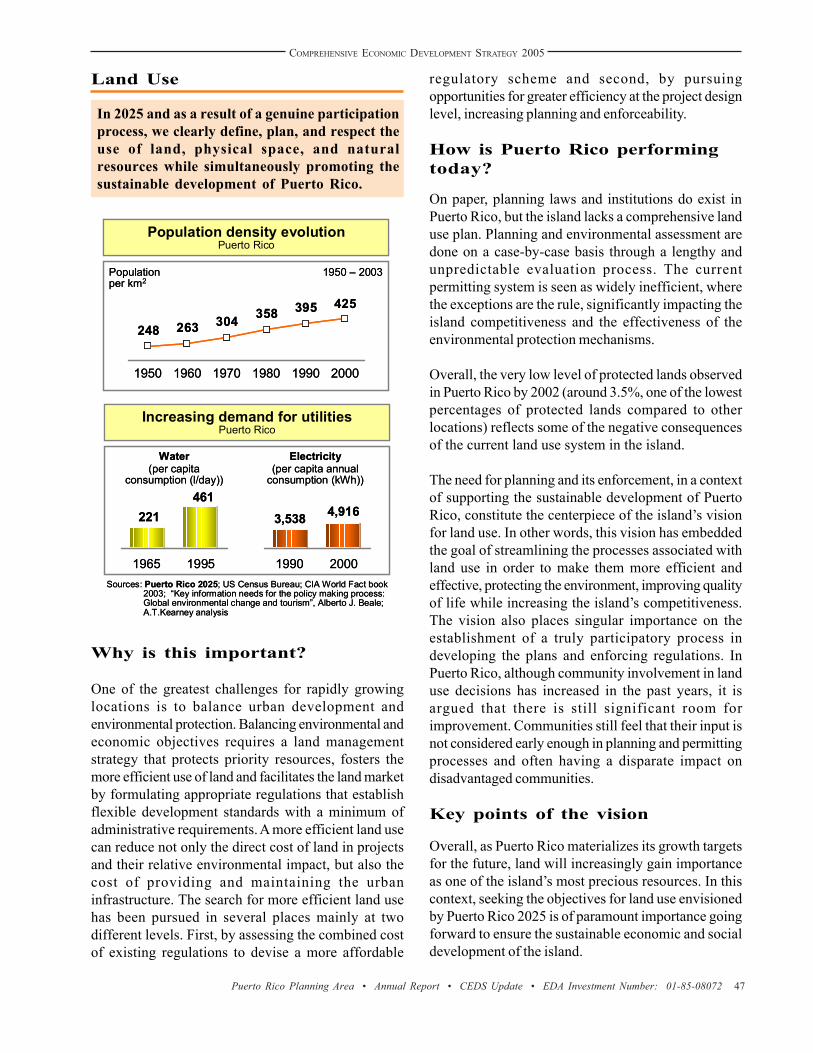
COMPREHENSIVE ECONOMIC DEVELOPMENT STRATEGY 2005
Puerto Rico Planning Area • Annual Report • CEDS Update • EDA Investment Number: 01-85-08072 47
Land Use
In 2025 and as a result of a genuine participationprocess, we clearly define, plan, and respect theuse of land, physical space, and naturalresources while simultaneously promoting thesustainable development of Puerto Rico.
Why is this important?
One of the greatest challenges for rapidly growinglocations is to balance urban development andenvironmental protection. Balancing environmental andeconomic objectives requires a land managementstrategy that protects priority resources, fosters themore efficient use of land and facilitates the land marketby formulating appropriate regulations that establishflexible development standards with a minimum ofadministrative requirements. A more efficient land usecan reduce not only the direct cost of land in projectsand their relative environmental impact, but also thecost of providing and maintaining the urbaninfrastructure. The search for more efficient land usehas been pursued in several places mainly at twodifferent levels. First, by assessing the combined costof existing regulations to devise a more affordable
regulatory scheme and second, by pursuingopportunities for greater efficiency at the project designlevel, increasing planning and enforceability.
How is Puerto Rico performingtoday?
On paper, planning laws and institutions do exist inPuerto Rico, but the island lacks a comprehensive landuse plan. Planning and environmental assessment aredone on a case-by-case basis through a lengthy andunpredictable evaluation process. The currentpermitting system is seen as widely inefficient, wherethe exceptions are the rule, significantly impacting theisland competitiveness and the effectiveness of theenvironmental protection mechanisms.
Overall, the very low level of protected lands observedin Puerto Rico by 2002 (around 3.5%, one of the lowestpercentages of protected lands compared to otherlocations) reflects some of the negative consequencesof the current land use system in the island.
The need for planning and its enforcement, in a contextof supporting the sustainable development of PuertoRico, constitute the centerpiece of the island’s visionfor land use. In other words, this vision has embeddedthe goal of streamlining the processes associated withland use in order to make them more efficient andeffective, protecting the environment, improving qualityof life while increasing the island’s competitiveness.The vision also places singular importance on theestablishment of a truly participatory process indeveloping the plans and enforcing regulations. InPuerto Rico, although community involvement in landuse decisions has increased in the past years, it isargued that there is still significant room forimprovement. Communities still feel that their input isnot considered early enough in planning and permittingprocesses and often having a disparate impact ondisadvantaged communities.
Key points of the vision
Overall, as Puerto Rico materializes its growth targetsfor the future, land will increasingly gain importanceas one of the island’s most precious resources. In thiscontext, seeking the objectives for land use envisionedby Puerto Rico 2025 is of paramount importance goingforward to ensure the sustainable economic and socialdevelopment of the island.
Population per km2
Population density evolution Puerto Rico
1950 – 2003
395 425
248 263358304
1980 1990 2000197019601950
Sources: Puerto Rico 2025; US Census Bureau; CIA World Fact book 2003; “Key information needs for the policy making process: Global environmental change and tourism”, Alberto J. Beale; A.T.Kearney analysis
Water (per capita
consumption (l/day))
Increasing demand for utilities Puerto Rico
221
1965 1995
461
Electricity (per capita annual
consumption (kWh))
3,538
1990 2000
4,916

COMPREHENSIVE ECONOMIC DEVELOPMENT STRATEGY 2005
Puerto Rico Planning Area • Annual Report • CEDS Update • EDA Investment Number: 01-85-08072 48
Water and Waste
In 2025, all residents of Puerto Rico haveaccess to sufficient and high quality water, andthese resources are used in a cost-effectivemanner, thereby ensuring the existence ofreserves.
The production, consumption, and recycling ofmaterials are managed and conducted in such away that minimizes the generation of waste, whichin turn is used as a resource.
Why is this important?Access to water is advocated to be a fundamentaluniversal right with significant impact on social andeconomic development. During the past century, whileworld population tripled, the use of water increased sixfold and, going forward, by 2025 an estimated 4 billionpeople will live under conditions of severe water stress.To address this situation, governments throughout theglobe have been applying more stringent regulations topreserve water bodies, besides the implementation ofincentives and educational programs focused on buildinga more conscious mindset towards the rational use ofwater.
Given its potentially strong pollutant impact on theenvironment, not only in water sources, but also in landand air, waste management emerges as a topic forcareful consideration. Globally, waste generation has
2.53.1 3.4
4.3 4.4 4.7 4.95.5
4.9
2002Pounds per person per day
Waste generated
Source: Puerto Rico 2025; National and state environmental agencies, SWMA; A.T.Kearney analysis
WesternEurope
HongKong
Ireland
NY
FL
US
Singa-pore
PuertoRico
NJ
2.53.1 3.4
4.3 4.4 4.7 4.95.5
4.9
2002Pounds per person per day
Waste generated
Source: Puerto Rico 2025; National and state environmental agencies, SWMA; A.T.Kearney analysis
WesternEurope
HongKong
Ireland
NY
FL
US
Singa-pore
PuertoRico
NJ
increased at a fast pace and, although expected tofollow GDP growth for most developed nations until2025, it is most likely to grow at higher rates indeveloping economies, mainly driven by changes inconsumption patterns. Developed nations have beenfocusing their attention on sustainable wastemanagement strategies that, ultimately, promote thereduction of resource inputs, maximizing their efficientuse, and minimizing the final impact on land, air, andwater. In these cases, recycling and innovativeprocedures for waste reuse have greatly contributedto the reduction of land filling and the environmentalimpact of waste as a whole.
How is Puerto Rico performingtoday?
The current situation of water and waste managementin Puerto Rico demands considerable attention. Thelack of a coordinated long-term plan and the inefficientmanagement of natural resources have impacted waterbodies to the extent that, today, 40% of the island’ssurface water does not meet quality standards. Also,Puerto Rico’s excellent aquifers have shown signs ofdecreasing quality and capacity due to different degreesof contamination, excessive use, and poormanagement. Despite providing broad access, thewater distribution infrastructure lacks reliability, withinterruptions of supply being common in some areas.Overall, the water company presents low productivitylevels, scale issues, and maintenance challenges thatare reflected in a 50% distribution loss of all waterproduced. Moreover, less than 20 percent of the
2002% of total waste recycled
Waste recycled
8%
27% 28%
42% 43% 45%
57%
16%
Ireland PuertoRico
FL US NY CA Singa-pore
NJ
Source: Puerto Rico 2025; National and state environmental agencies, SWMA; A.T.Kearney analysis
2002% of total waste recycled
Waste recycled
8%
27% 28%
42% 43% 45%
57%
16%
Ireland PuertoRico
FL US NY CA Singa-pore
NJ
Source: Puerto Rico 2025; National and state environmental agencies, SWMA; A.T.Kearney analysis

COMPREHENSIVE ECONOMIC DEVELOPMENT STRATEGY 2005
Puerto Rico Planning Area • Annual Report • CEDS Update • EDA Investment Number: 01-85-08072 49
population in Puerto Rico receives drinking water thatmeets all health-based standards.
Waste management and sanitation also represent achallenge in the island. Besides other environmentalimpacts, waste figures as one of the key root causes inthe contamination of water sources. Direct dischargeof sewage by individuals into rivers and other bodiesof water and widespread use of septic tanks that failto meet environmental standards still represent anissue. Moreover, the generation of solid waste in PuertoRico has achieved alarming levels in the last decades,with significant impact in the natural systems.
Today, the island produces twice as much waste percapita as the average observed in Western Europe,and presents modest recycling rates. At this pace, mostlandfills in Puerto Rico are expected to reach capacitywithin the next 10 years, with most of them operatingin violation of environmental standards. Moreover,Puerto Rico’s industrial waste infrastructure presentssome clear deficiencies like the inexistence of anindustrial sewer system and hazardous waste sites.
All these limitations in infrastructure are not only riskyfrom environmental and social points of view, but theyalso impact the island’s attractiveness to investmentsin high value added production processes and servicesthat are highly dependent on reliable access to qualitywater and proper waste management facilities.
Key points of the vision
In this context, the Puerto Rico 2025 vision for waterand waste places emphasis on the broad access tosufficient water with the required quality, and pointsout the need for planned use of resources in order tominimize the waste generation and ensure the properhandling of what cannot be recycled or reused.
The vision entrusts the concept of water as afundamental universal right, strongly reinforcing PuertoRico’s commitment to the preservation of its waterbodies and towards policies that foster the optimal useof its resources in a sustainable fashion.
The goals embedded in this vision are of paramountimportance to ensure the quality of life envisioned forPuerto Rico while supporting key knowledge-basedclusters that will drive the island’s economicdevelopment going forward.
Given the geographical conditions of Puerto Rico, withlimited space, high population density and fragileenvironment, the vision for 2025 on water and wastesignals the need for substantial community mobilizationtowards greater care for its most valuable naturalresources.
Energy
In 2025, Puerto Rico is a leader in thedevelopment and usage of renewable energysources and clean technologies.
All of us in Puerto Rico have access to reliableenergy services and resources that areeconomically feasible, socially acceptable,environmentally healthy, and abundant enoughto achieve the sustainable development goalsof Puerto Rico.
Why is this important?
Access to reliable energy resources at competitive costsand in a sustainable fashion is a fundamental concernacross the globe. Energy is vital for social and economicdevelopment, supporting productive capacity and socialcohesion.
99%
89%
88%
87%
84%
100%
Sanitation coverage is either in the form of public sewage access or septic tanks
Population with access to improved urban sanitation
Jamaica
Argentina
Costa Rica
Brazil
Puerto Rico
Mexico
Source: Puerto Rico 2025; Interviews; Paul Budde Communication; World Bank, Pan American Health Organization; A.T. Kearney analysis

COMPREHENSIVE ECONOMIC DEVELOPMENT STRATEGY 2005
Puerto Rico Planning Area • Annual Report • CEDS Update • EDA Investment Number: 01-85-08072 50
The successful development of an economy based onknowledge clusters as envisioned by Puerto Rico ishighly dependent on the availability of cost competitiveand reliable power sources. Such clusters – oftendependent on sophisticated electronic equipment,telecommunications networks, agile mobility, controlledproduction and research environments and highcustomer service levels – are strongly impacted byunreliable energy supplies and power outages.
How is Puerto Rico performingtoday?
Going forward, Puerto Rico faces a major challenge inimproving the competitiveness of its energy sources.The island currently faces industrial electricity costs73% higher than the average observed in developedeconomies and is highly dependent on imported oil. Suchhigh costs are influenced by outdated cross-subsidiesschemes when compared to international standards anda relatively inefficient electric power utility company,characterized by low levels of productivity. Moreover,an aging infrastructure and lack of adequatemaintenance lead to poor reliability and low servicelevels.
These characteristics significantly decrease thecompetitiveness of the Puerto Rican infrastructurewhen compared to other locations, demanding redundantprivate investments in individual power facilities.
In seeking constant improvements in power supply,high-income countries are rapidly modernizing theirenergy systems. They are creating the market rulesand incentives to support the attraction of privateinvestment while responding to public concerns anddemands of tougher environmental standards imposedon energy suppliers and users. With increasingeconomic growth, the world’s “resource-use” burdenis rising faster than population growth. For this reason,the concept of promoting development throughsustainable strategies is continuously gainingmomentum. When envisioning the future, nations wantto ensure that current generations meet their needswithout compromising the ability of future generationsto meet theirs. Such objectives are of fundamental
19.10%
7.60%
1.50%
2.30%
1.70%
1.40%
0% 5% 10% 15% 20% 25%
World Renewable Energy Supply: Annual Growth Rates
Solar/ Wind / Tide
Solid Biomass
MSW / Biogas / Liquid Biomass
Hydro
Geothermal
TPES
Source: Puerto Rico 2025
World: Oil
Coal
Nuclear
Gas
Renewable
Puerto Rico:
Oil Coal
RenewableGas
Source: Puerto Rico 2025
Electricity Production: Fuel Shares in 2001
GDP OF PETROLEUM:Refineries & Electric Energy
-200.0
0.0
200.0
400.0
600.0
800.0
1,000.0
1,200.0
1,400.0
1,600.0
1994 1995 1996 1997 1998 1999 2000 2001r 2002r 2003p
Petroleoum and petroleum productsRefineriesOther petroleum productsElectric energy
Source: PR Planning Board, Economic & Social Planning Program, Economic Analysis Subprogram
p – Preliminary figures. r – Revised figures
Millions of Dollars
Fiscal Years

COMPREHENSIVE ECONOMIC DEVELOPMENT STRATEGY 2005
Puerto Rico Planning Area • Annual Report • CEDS Update • EDA Investment Number: 01-85-08072 51
importance for Puerto Rico given the island’s fragileenvironment and small size.
Although by some measures the environmental impactrelated to energy production has improved in the lastdecade, Puerto Rico still faces significant challenges.The island’s efforts to implement renewable sourcesof energy have been immaterial so far, while the shareof world production of electricity from renewableapproaches 20%. Additionally, the electricity productionin Puerto Rico presents low diversification towardscleaner fossil fuels, with around 70% of its electricityproduction depending on oil. Such electricity supply ismostly generated by old technology infrastructure,accounting for 71% of all industrial air pollution and33% of industrial surface water discharges in the island.
Vehicular emissions are also a point of concern. Therelatively low fuel prices in Puerto Rico represent amajor disincentive to the use of public transportation,which is also incipient in the island. Such low pricesare a direct consequence of fuel taxes around 6 timeslower than the average observed in developedeconomies.
Key points of the vision
As a direct call for action to improve the performanceof the energy sector in the island, the energy vision forPuerto Rico 2025 fully embraces the concept ofsustainable development, considering that power needsare met while preserving a healthy environment. Inparticular, the vision drives Puerto Rico to achieveleadership in the development and application ofrenewable sources of energy and clean technologies.Puerto Rico 2025 recognizes the importance ofsignificantly improving the performance of the energysector, emphasizing broad and reliable access to costcompetitive power sources in order to fully support theeconomic development envisioned for the future of theisland.
Transportation
In 2025, the needs of access and mobility ofmaritime, air, and ground transportation are metat the lowest possible economic, social, andenvironmental cost while at the same timeintegrating them in the planning process for landuse planning and advanced technologies.
Why is this important?
Transportation is central to development. At the sametime that it supports quality of life providing physicalaccess to jobs, health, education and other amenities,it is also of paramount importance for economicdevelopment and competitiveness through the physicalaccess to resources and markets. Efficient andeffective linkages that support the mobility of goods,people, and information are major enablers of asuccessful knowledge-based economy. In a context ofincreasing globalization, and of domestic andinternational trade liberalization, a sustainable, wellfunctioning transportation system is a crucialdeterminant of a country’s competitiveness.
Although critical for development, inappropriatelydesigned and poorly integrated transport strategies canhave significantly negative economic, social, andenvironmental consequences. In this context, planningand its implementation through targeted regulations and
Source: Puerto Rico 2025; Ocean Shipping Consultants; “AnalisisPreliminar de Competitividad de Puerto Rico”, Procomp; Global Competitiveness Report 2001-2002; “The Evolution of Ports in a Competitive World” – World Bank; “Measuring Port Performance” – Patrick Fourgeaud – The World Bank; A.T.Kearney analysis
Transshipment handling costs US$ per transshipment container
2002US$
$233 $257 $271
$368
$449
MIT,Panama
Kingston,Jamaica
Freeport,Bahamas
Miami PuertoRico

COMPREHENSIVE ECONOMIC DEVELOPMENT STRATEGY 2005
Puerto Rico Planning Area • Annual Report • CEDS Update • EDA Investment Number: 01-85-08072 52
stricter demand management policies has gainedsignificant importance. By consolidating different setsof inputs, such plans represent the most effective wayto optimize the network’s investments and efficiencywhile minimizing environmental impact and safetyconcerns. The integration of transportation and landuse plans is also seen as essential to define whichinfrastructure projects should be handled at a centralizedlevel and which ones at a local level. This practicewould represent a major improvement in the case of
Puerto Rico, where a comprehensive land use plan isstill lacking.
Globally, the traditional dominance of the public sectorin the operation of transport services generally resultedin several adverse effects such as high public deficits,poorly maintained infrastructure, and low service levels.This situation has led several nations throughout theWorld to seek more cost-effective transportation
strategies, driven by increasing utilization of competitivemarket structures involving the private sector whilegovernments assume an enabling and supervising role.In Puerto Rico, the role of the government intransportation is still substantial, even encompassingregulated rates for trucking.
How is Puerto Rico performingtoday?
Overall, key efficiency issues in the island’stransportation infrastructure represent importantchallenges for the future. San Juan’s port operationsare expensive and with low productivity compared withother ports in the Caribbean, which are driving scaleand market share backed up by significant investmentsand the management experience of some of the largestglobal stevedores. Puerto Rico also faces costdisadvantages in maritime shipments to and from the
Puerto Rico holds 44% market share of all flights to the Caribbean
Airport traffic Number of flights per week – 2002
850
425
250
250
175
1,600
Jamaica
Bahamas
Cancun
Cuba
Dominican Republic
Puerto Rico
Source: Puerto Rico 2025; Interviews; Paul Budde Communication; World Bank, Pan American Health Organization; A.T. Kearney analysis
Source: Puerto Rico 2025; US Census, Dublin Transportation Office, Secretaria Municipal de Transportes. Interpress Service, Singapore Department of Statistics, Federal Highway Authority; A.T.Kearney analysis
Usage of public transportation compares poorly to major global cities
% of workers that use mass transit to go to work
%
5%
11%
45%
52%
55%
63%
12%
25%
Miami
Los Angeles
Dublin
Sao Paulo
NYC
Singapore
San Juan
2002
Mexico City
Usage of public transportation compares poorly to major global cities
% of workers that use mass transit to go to work
%
5%
11%
45%
52%
55%
63%
12%
25%
Miami
Los Angeles
Dublin
Sao Paulo
NYC
Singapore
San Juan
2002
Mexico City
Puerto Rico ranks 10th
in the US for traffic densityAverage daily vehicle traffic per lane
5,2245,928
6,679
6,8916,914
8,4509,436
9,698
6,2826,208
Vehicles
Michigan
Rhode Island
Hawaii
Connecticut
Maryland
Massachusetts
Puerto Rico
Florida
California
New Jersey
2002
Top 10th in traffic
density in the US
Source: Puerto Rico 2025; US Census, Dublin Transportation Office, Secretaria Municipal de Transportes. Interpress Service, Singapore Department of Statistics, Federal Highway Authority; A.T.Kearney analysis
Puerto Rico ranks 10th
in the US for traffic densityAverage daily vehicle traffic per lane
5,2245,928
6,679
6,8916,914
8,4509,436
9,698
6,2826,208
Vehicles
Michigan
Rhode Island
Hawaii
Connecticut
Maryland
Massachusetts
Puerto Rico
Florida
California
New Jersey
2002
Top 10th in traffic
density in the US
Source: Puerto Rico 2025; US Census, Dublin Transportation Office, Secretaria Municipal de Transportes. Interpress Service, Singapore Department of Statistics, Federal Highway Authority; A.T.Kearney analysis

COMPREHENSIVE ECONOMIC DEVELOPMENT STRATEGY 2005
Puerto Rico Planning Area • Annual Report • CEDS Update • EDA Investment Number: 01-85-08072 53
Source: Puerto Rico 2025; Interviews; Paul Budde Communication; World Bank, Pan American Health Organization; A.T. Kearney analysis
Widespread penetration with 61% of Internet users outside the San Juan metropolitan area
Internet penetration Connections/10,000 people – 2002
Jamaica
Bermuda
Chile
Virgin Islands
Puerto Rico
2,727
2,490
2,375
2,291
2,264
4,644
Aruba
US due to the obligation of using American-flag shipsas stated by the Jones Act
Moreover, while several locations in the world havebeen providing greater incentives to the use of publictransport through efficient pricing for congestion andpollution, Puerto Rico is still lagging in this dimension.
As a consequence, high traffic density and pollutantemission in the urban areas significantly penalize theisland’s quality of life and competitiveness. Suchsituation is driven not only by the limited availability ofpublic transportation in Puerto Rico and the lack of acomprehensive public transportation plan, but also byvery low gas prices that represent an incentive forpeople to drive. In this context, the development of astrategic approach to motorization in Puerto Rico isbecoming increasingly critical.
Key points of the vision
The 2025 vision addresses the current transportationissues in the island by emphasizing integrated planning,cost-effective services, and transportation technologiesas key principles. Given Puerto Rico’s high dependencyon imports and exports and the fact that it will continueto target the international markets to support itseconomic development, the vision for 2025 is offundamental importance in the consolidation of PuertoRico as a key player in the global supply chains, fullyintegrated with the World. The vision also recognizesthe need to optimize the economic, social, andenvironmental costs associated with transport in a clearreference to the concept of sustainable development.
Information andTelecommunications Infrastructure
In 2025, Puerto Rico has a state of the arttelecommunications and information technologyinfrastructure that is widely used, is reliable, itdistinguishes Puerto Rico in a global contextand provides ample opportunities for all.
Why is this important?
Access to information and communicationstechnologies has become crucial to a sustainable agendaof economic and social development. In the modern
world, these technologies not only represent a key inputto support economic development but they also offeropportunities for global integration, the empowermentof individuals and communities and the enhancementof the efficiency and transparency of the public sector.
In particular, the availability of state-of-the-arttelecommunications and information technologyinfrastructure represents a major enabler for anysociety envisioning a development model based onknowledge clusters, since such technologies constitutethe foundation for building up, disseminating andapplying knowledge. Nowadays, technologicalinnovations, economic pressures, and regulatoryreforms are making access to such technologies moreaffordable, creating opportunities not only for substantialbusiness development but also helping to close the digitaldivision established in several regions of the world.
How is Puerto Rico performingtoday?
Despite depicting some advanced characteristics in itstelecom infrastructure, such as 100% digital networks,Puerto Rico lags the level of infrastructure andaccessibility of several advanced economies, presentinglower penetration rates in fixed and mobile telephonyas well as Internet and broadband. In several cases,such as high speed Internet access, the infrastructureis available across the island but competition amongproviders is comparatively low, harming service

COMPREHENSIVE ECONOMIC DEVELOPMENT STRATEGY 2005
Puerto Rico Planning Area • Annual Report • CEDS Update • EDA Investment Number: 01-85-08072 54
0.0
100.0
200.0
300.0
400.0
500.0
600.0
Mill
ions
of
Dol
lars
1995
1996
1997
1998
1999
2000
2001
2002
r
2003
p
Fiscal Yearsp - preliminary
r - revised
Source: Junta de Planificación, Programa de Planificación Económica y Social, Subprograma de Análisis Económico
Value of Construction Activity:Telecommunications Projects
0.00
500.00
1,000.00
1,500.00
2,000.00
1994 1995 1996 1997 1998 1999 2000 2001r 2002r 2003p
Total Communications Radio & TVTelephone Cable TV
Source: Junta de Planificación, Programa de Planificación Económica y Social, Subprograma de Análisis Económico
Gross Domestic Product: Communications
Fiscal Years
Millions of Dollars
affordability. Moreover, reliability and provision of speedof advanced services are seen as key areas forimprovement.
Key points of the vision
The Puerto Rico 2025 vision recognizes that a weakor expensive communications infrastructure couldthreaten the island’s ability to compete in fast growth,high technology markets. In this context, the vision notonly calls for the deployment of the most advancedinformation and communications technologies availablein the world, but it also targets the broad availability ofaffordable and reliable services to all as a key driverto support the island’s future social and economicdevelopment.

COMPREHENSIVE ECONOMIC DEVELOPMENT STRATEGY 2005
Puerto Rico Planning Area • Annual Report • CEDS Update • EDA Investment Number: 01-85-08072 55
Values Brand
Requirements and
strategies
Vision statement
18 vision elements
Validation and prioritization of the strategic options for implementation
Identification of objectives
and strategies required to achieve the 2025 Vision
Pre-validation of objectives
and strategies with key
stakeholders –individual interviews
Validation workshops
(one for each focus area/
panel)
Decision Conferences at the panel
level (one for each focus
area)
Strategic Decision
Conferences
STEP 1 STEP 2 STEP 3 STEP 5 STEP 6
Evaluation and
consolidation of cross-effects
between areas
STEP 4
More than 40 interviews with key stakeholders
More than 120 stakeholders involved in
the 20 panels
10 panels with 85 subject experts
10 panels with 87 subject experts
2 workshops with 29
selected stakeholders
Strategies and Objectives; Charting aCourse to a Dynamic Economic FutureSECTION III:
Source Puerto Rico 2025
Source Puerto Rico 2025
Implications of the Assesmentand Vision
What became clear as a result of our work on Project2025, particularly as evidenced through theAssessment and the Vision Phases is that the worldis changing fast, and, now more than ever, Puerto Ricomust respond adequately to secure a satisfactory futurefor its citizens and residents. This tremendous changeis being driven by a host of factors such as; an everaccelerating pace of demographic change, expanding
globalization, exponential technology innovation,elemental shifts in the location of global demand, globaltrade, and global investment.
Fundamentally, Puerto Rico faces more competitorsin every field and greater challenges in meetingthe terms of its social contract as evidenced inincreasing health care costs, expanding demand foradequate education which prepares people forparticipation in a knowledge based economy, lagginginfrastructure improvements needed to facilitateefficiencies in other areas of activity, yet, all the while,controlling costs and environmental impacts.
In principle, Puerto Rico has many of the assetsrequired to succeed in the global knowledge economythat is “the glass is more than half full”. Not takingadvantage of these assets increases the risk that PuertoRico will become a victim, not a beneficiary, ofcurrent global change. However, in practice, while inmany respects “the glass is more than half full” PuertoRico is burdened with significant countervailingliabilities and thoroughly mired in an institutional cultureif ineffectual decision making and limited vision.

COMPREHENSIVE ECONOMIC DEVELOPMENT STRATEGY 2005
Puerto Rico Planning Area • Annual Report • CEDS Update • EDA Investment Number: 01-85-08072 56
Strategies were evaluated in terms of contribution to the Vision’s objectives and the Vision’s do-ability
Vision Statements
Economic Social Infrastructure/ environment Culture
FUNDAMENTAL OBJECTIVES
… … … … …… … … … … … … … … …… … … … … … … … … …… … … … …… … … … …… … … … … … … … … …… … … … … … … … … …… … … … …… … … … …… … … … … … … … … …… … … … … … … … … …… … … … … … … … … …
Innov. & Enterp.
Compet. & Conn.
Opport. & Income
Innov. & Enterp.
Compet. & Conn.
Opport. & Income Health Public
Safety Educ.Health Public Safety Educ. Utilities Land &
Envir. Transp.Utilities Land & Envir. Transp. CultureCulture
… … … … …… … … … … … … … … …… … … … … … … … … …… … … … …… … … … …… … … … … … … … … …… … … … … … … … … …… … … … …… … … … …… … … … … … … … … …… … … … … … … … … …… … … … … … … … … …
… … … … …… … … … … … … … … …… … … … … … … … … …… … … … …… … … … …… … … … … … … … … …… … … … … … … … … …… … … … …… … … … …… … … … … … … … … …… … … … … … … … … …… … … … … … … … … …… … … … …
– I 1– I 2– I 3– …– I n
– P 1– P 2– P 3– …– P n
– C 1– C 2– C 3– …– C n
Innovation and
Enterprise
Productivity and
Competitive-ness
Culture
STRATEGIES
…
DIRECT EFFECT
DIRECT EFFECT
DIRECT EFFECT
… … … … … … … ………
The Output of the Assessment and Vision phases, resulted in stakeholders focusing on 10 topic areas that captured the
interrelationships among the previous 18 panels
Economic Development
Innovation and Enterprise
1
Competitiveness and Connectivity
2
Income and Opportunity
3
Social Development
Health
1
Education
2
Public Safety
3
Infrastructure / Environment
Utilities
1
Land Use and Environment
2
Transport
3
Culture
Culture
1
Focus Areas for the Strategic Prioritization Phase
Source Puerto Rico 2025
Source Puerto Rico 2025
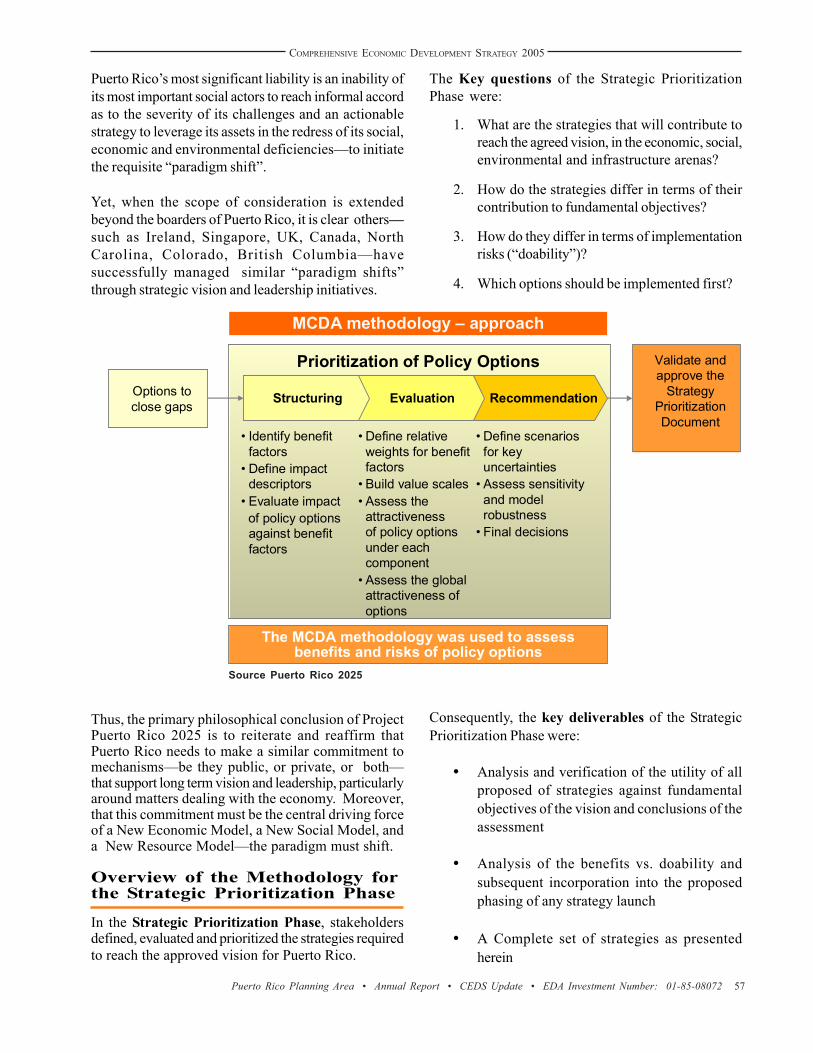
COMPREHENSIVE ECONOMIC DEVELOPMENT STRATEGY 2005
Puerto Rico Planning Area • Annual Report • CEDS Update • EDA Investment Number: 01-85-08072 57
Prioritization of Policy OptionsOptions to close gaps
Validate and approve the
Strategy Prioritization Document
RecommendationEvaluationStructuring
MCDA methodology – approach
• Identify benefit factors
• Define impact descriptors
• Evaluate impact of policy options against benefit factors
• Define relative weights for benefit factors
• Build value scales• Assess the
attractiveness of policy options under each component
• Assess the global attractiveness of options
• Define scenarios for key uncertainties
• Assess sensitivity and model robustness
• Final decisions
The MCDA methodology was used to assess benefits and risks of policy options
Source Puerto Rico 2025
Puerto Rico’s most significant liability is an inability ofits most important social actors to reach informal accordas to the severity of its challenges and an actionablestrategy to leverage its assets in the redress of its social,economic and environmental deficiencies—to initiatethe requisite “paradigm shift”.
Yet, when the scope of consideration is extendedbeyond the boarders of Puerto Rico, it is clear others—such as Ireland, Singapore, UK, Canada, NorthCarolina, Colorado, British Columbia—havesuccessfully managed similar “paradigm shifts”through strategic vision and leadership initiatives.
Thus, the primary philosophical conclusion of ProjectPuerto Rico 2025 is to reiterate and reaffirm thatPuerto Rico needs to make a similar commitment tomechanisms—be they public, or private, or both—that support long term vision and leadership, particularlyaround matters dealing with the economy. Moreover,that this commitment must be the central driving forceof a New Economic Model, a New Social Model, anda New Resource Model—the paradigm must shift.
Overview of the Methodology forthe Strategic Prioritization Phase
In the Strategic Prioritization Phase, stakeholdersdefined, evaluated and prioritized the strategies requiredto reach the approved vision for Puerto Rico.
The Key questions of the Strategic PrioritizationPhase were:
1. What are the strategies that will contribute toreach the agreed vision, in the economic, social,environmental and infrastructure arenas?
2. How do the strategies differ in terms of theircontribution to fundamental objectives?
3. How do they differ in terms of implementationrisks (“doability”)?
4. Which options should be implemented first?
Consequently, the key deliverables of the StrategicPrioritization Phase were:
• Analysis and verification of the utility of allproposed of strategies against fundamentalobjectives of the vision and conclusions of theassessment
• Analysis of the benefits vs. doability andsubsequent incorporation into the proposedphasing of any strategy launch
• A Complete set of strategies as presentedherein

COMPREHENSIVE ECONOMIC DEVELOPMENT STRATEGY 2005
Puerto Rico Planning Area • Annual Report • CEDS Update • EDA Investment Number: 01-85-08072 58
Mapping of strategies in terms of their expected benefits & their do-ability
Example of the Output Obtained in Each of the 10 Decision Conferences
Strategy LStrategy K
Strategy J
Strategy I
Strategy H
Strategy G
Strategy F
Strategy E
Strategy D
Strategy C
Strategy B
Strategy A
Strategy V
Strategy U
Strategy T
Strategy S
Strategy R
Strategy Q
Strategy P
Strategy O
Strategy N
Strategy M
Wave II
HighLow Consolidated Do-ability
High
Low
Dire
ct
Ben
efit
to
achi
eve
the
visi
on
Wave III
Wave I
Architecture of Strategy Comparisons; contribution to the Vision’s objectives and the Vision’s do-ability
DIRECT BENEFIT
CROSS EFFECTS
POSITIVE
NEGATIVE
DO-ABILITY (EFFORT)
RATIO BENEFIT/ EFFORT
ADJUSTED BENEFIT
DIRECT BENEFIT
CROSS EFFECTS
POSITIVE
NEGATIVE
DO-ABILITY (EFFORT)
RATIO BENEFIT/ EFFORT
ADJUSTED BENEFIT
MCDA Generation of the Benefit / Effort Ratios
Evaluated by the Stakeholders from each of
the 10 Panels
Evaluated in the Decision Conferences
Source Puerto Rico 2025
Source Puerto Rico 2025

COMPREHENSIVE ECONOMIC DEVELOPMENT STRATEGY 2005
Puerto Rico Planning Area • Annual Report • CEDS Update • EDA Investment Number: 01-85-08072 59
• A Strategic Plan designed for implementationthrough the formation of a not-for-profitorganization—”Todos para Puerto Rico”.
Throughout the process, participation was critical toidentify, validate and prioritize the strategic options tobe implemented. During the prioritization phase morethan 150 strategic initiatives were identified andevaluated under a consolidated structure that collapsedthe initial 18 expert consultive panels from theassessment phase into 10 aggregate topic headings.
Consequently, on the economic front Basic Products& Manufacturing, High-technology Industries, Financial& Professional Services, Local Services, SmallBusiness & Venture Capital, and Overall EconomicDevelopment;
Became:
• Competitiveness & Connectivity,
• Income & Opportunity, and
• Innovation & Enterprise.
Alternatively, on the social front CommunityDevelopment, Family & Society, Culture & Recreationwere incorporated among various other topic areas,although Culture became its own topic area with itsown respective vision. Finally, Land Use, Energy,Communications & Information, Water & Waste,Environment Quality;
Became:
• Transport,
• Utilities, and
• Land Use & Environment.
Utilizing these 10 panels—Competitiveness &Connectivity, Income & Opportunity, Innovation&Enterprise, Health, Public Safety, Education, Culture,Transport, Utilities, and Land Use & Environment—the strategies were pre-validated against the findingsof the assessment and the articulated vision and then,under the leadership of Prof. Carlos Bana e Costa,London School of Economics, the strategies of eachtopic area were further prioritized based on both theirdirect expected benefits and doability, as well asthe expected cross effects between areas. Oncethe panel results were organized, the findings were
validated again during 2 Strategic DecisionConferences among a representative group ofparticipants.
The resultant final output is a comprehensive andphased plan to address all area’s of Puerto Rico’sdevelopment; Competitiveness & Connectivity, Income& Opportunity, Innovation & Enterprise, Education,Health, Culture, Public Safety, Transport, Land Use &Environment, and Utilities and is composed of:
• 21 Immediate Strategic Initiatives:to be launched by January 2005; and,
• 59 Short-term Strategic Initiatives:to be launched within the next year; and,
• 57 Medium-term Strategic Initiatives:to be launched within the next 3 years; and,
• 32 Long-term Strategic Initiatives:to be launched within the next 5 years.
The New Development Paradigm
Collectively, the 169 strategies generated by the projectcharacterize a fundamental redirection in Puerto Rico’sdevelopment path, a paradigm shift intended to returnPuerto Rico to its former glories as a tiger economy, asociety in positive flux, and an environmental splendor.A Puerto Rico that is prosperous, productive, andinnovative. A society, capable of generating knowledgewith an entrepreneurial spirit and supported by anefficient public sector; a Globally integrated place thatcreates a fertile and dynamic environment for internalgrowth; an environment that provides its populationwith ample opportunities to reach their potential as wellas an equitably share the benefits of such growthpotential.
A Puerto Rico where economic development increasesprofits, reduces unemployment, reduces inequality, anddiminishes poverty rates. A Puerto Rico whereeconomic development facilitates all members ofsociety in the achievement their full potential using theirknowledge and talent while offering workers,entrepreneurs, and investors (local and foreign) the mostcompetitive location to generate wealth in theAmericas.
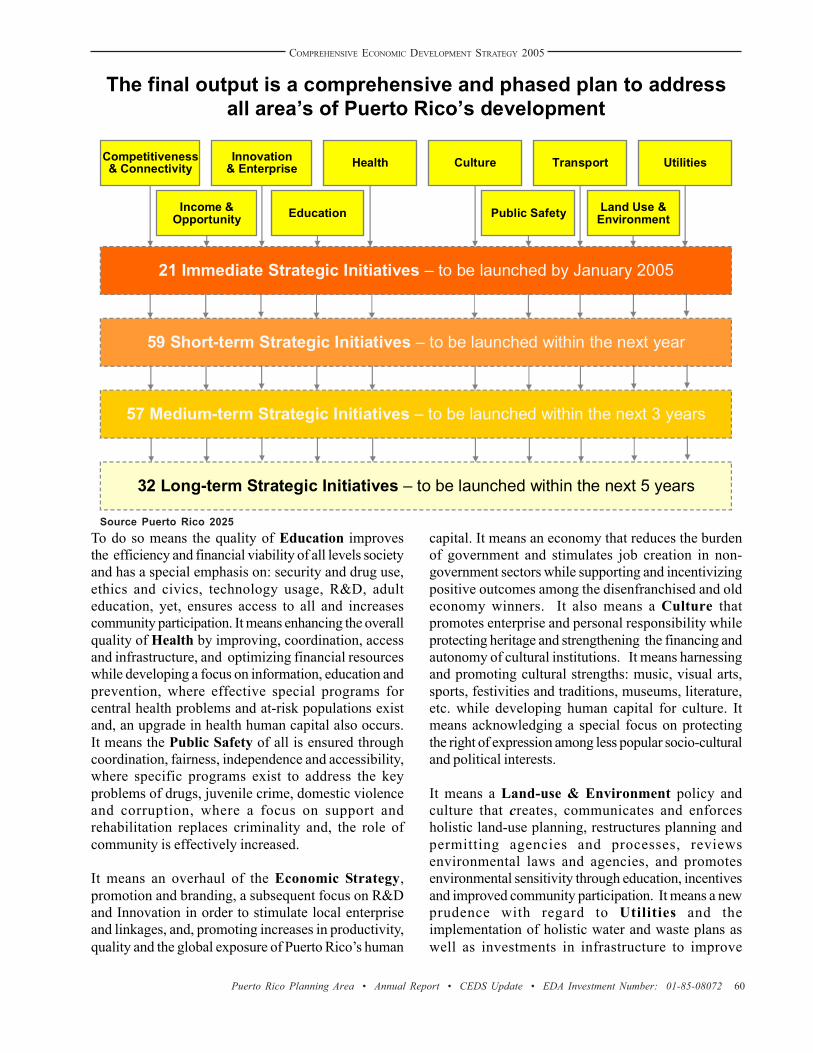
COMPREHENSIVE ECONOMIC DEVELOPMENT STRATEGY 2005
Puerto Rico Planning Area • Annual Report • CEDS Update • EDA Investment Number: 01-85-08072 60
The final output is a comprehensive and phased plan to address all area’s of Puerto Rico’s development
21 Immediate Strategic Initiatives – to be launched by January 2005
59 Short-term Strategic Initiatives – to be launched within the next year
57 Medium-term Strategic Initiatives – to be launched within the next 3 years
32 Long-term Strategic Initiatives – to be launched within the next 5 years
Innovation& Enterprise
Competitiveness & Connectivity
Income &Opportunity
Health
Education Public Safety
Transport
Land Use & Environment
UtilitiesCulture
Source Puerto Rico 2025To do so means the quality of Education improvesthe efficiency and financial viability of all levels societyand has a special emphasis on: security and drug use,ethics and civics, technology usage, R&D, adulteducation, yet, ensures access to all and increasescommunity participation. It means enhancing the overallquality of Health by improving, coordination, accessand infrastructure, and optimizing financial resourceswhile developing a focus on information, education andprevention, where effective special programs forcentral health problems and at-risk populations existand, an upgrade in health human capital also occurs.It means the Public Safety of all is ensured throughcoordination, fairness, independence and accessibility,where specific programs exist to address the keyproblems of drugs, juvenile crime, domestic violenceand corruption, where a focus on support andrehabilitation replaces criminality and, the role ofcommunity is effectively increased.
It means an overhaul of the Economic Strategy,promotion and branding, a subsequent focus on R&Dand Innovation in order to stimulate local enterpriseand linkages, and, promoting increases in productivity,quality and the global exposure of Puerto Rico’s human
capital. It means an economy that reduces the burdenof government and stimulates job creation in non-government sectors while supporting and incentivizingpositive outcomes among the disenfranchised and oldeconomy winners. It also means a Culture thatpromotes enterprise and personal responsibility whileprotecting heritage and strengthening the financing andautonomy of cultural institutions. It means harnessingand promoting cultural strengths: music, visual arts,sports, festivities and traditions, museums, literature,etc. while developing human capital for culture. Itmeans acknowledging a special focus on protectingthe right of expression among less popular socio-culturaland political interests.
It means a Land-use & Environment policy andculture that creates, communicates and enforcesholistic land-use planning, restructures planning andpermitting agencies and processes, reviewsenvironmental laws and agencies, and promotesenvironmental sensitivity through education, incentivesand improved community participation. It means a newprudence with regard to Utilities and theimplementation of holistic water and waste plans aswell as investments in infrastructure to improve

COMPREHENSIVE ECONOMIC DEVELOPMENT STRATEGY 2005
Puerto Rico Planning Area • Annual Report • CEDS Update • EDA Investment Number: 01-85-08072 61
efficiency and reliability. It also means emphasis onclean technologies as well as renewable sources andrenewable resources. It also means reductions in usageand waste generation while increasing independentoversight and incentives to improve performance ofthe Utilities sector and related industries. It requiresinvestments in Transportation, at multiple levels, tofirst ensure capacity and efficiency of existinginfrastructure and then ensure reductions in automobile,particularly car useage through rational land-useplanning, collective transportation and effectiveincentive mechanisms. It means, promoting clean fuelsand clean technologies as well as investments in newairports, maritime ports and freight systems whenwarranted. Vastly superior community participationmust be achieved as well.
Common Themes Among the PR2025 Strategies and Objectives
1. Increase use of technology and information
2. Increase efficiency and financial viability ofinstitutions
3. Increase external oversight, accountabilityand incentives
4. Focus on quality of human capital
5. Focus on personal responsibility: ethics,awareness, usage, etc.
6. Improve community participation and accessfor less advantaged
7. Improve planning and coordination
8. Increase investment in targeted areas
Governor Acevedo Vila’sInitiatives
What follows is a synopsis and adaptation of materialsfrom A) “Plan Para Un Puerto Rico Nuevo” (PlanFor A New Puerto Rico); and, B) the “Message on2005-2006 Budget submitted by the Governor of theCommonwealth of Puerto Rico Hon. Aníbal Acevedo-
Vilá to the Fifteenth Legislative Assembly on March16, 2005”; and, C) the “State of the Commonwealthof Puerto Rico Address Honorable Aníbal Acevedo-Vilá Governor Before the Fifteenth LegislativeAssembly March 9th, 2005.”
The astute reader will note many of the themes,priorities and, imperatives which emerged from thePuerto Rico 2025 process have been incorporated,to varying degrees, in the conceptual framework andimplicit assessment of Puerto Rico’s current situationpresented here, as extracted, reformatted and slightlyedited for purposes of this document. In particular,as examples, the CEDS Executive Director wouldunderscore the clear emphasis upon the followingkey issues:
A. A focus on personal responsibility: ethics,awareness and, usage among all segments ofthe population and sectors of economic activitywith a special emphasis on external oversight,accountability and incentive-ized behavior.
B. Improvement of the efficiency and financialviability of institutions, particularly publicsector organizations and those rendering criticalservices for the normal, safe and, secure andprosperous activity of the population.
C. The quality of human capital and energizingthe entrepreneurial spirit as well as improvedcommunity participation and access for lessadvantaged
D. Increase investment in targeted areas andprudent use of technology and informationespecially to improve planning andcoordination.
As promulgated to date, these imperatives set theunderpinnings of Governor Acevedo Vila’s initiativesand speak directly to the policy recommendations ofPR 2025.
Personal ResponsibilityUnder the heading of An Era of Responsibility, theAcevedo Vila Administration has identified anunemployment rate that is not acceptable; anunemployment rate that has averaged in the last

COMPREHENSIVE ECONOMIC DEVELOPMENT STRATEGY 2005
Puerto Rico Planning Area • Annual Report • CEDS Update • EDA Investment Number: 01-85-08072 62
fifteen years no less than 10%, high crime rates,especially among violent crimes and crimes resultingin deaths, a 40% school drop out rate among allchildren that start school and, finally a deficit of overa billion dollars. Moreover, Governor Acevedo Vilahas asserted “In simple words: the government hasnot solved your problems and spends more than whatit has available. This is the way it has been for thelast 20 years.” In acknowledgement of thesecircumstances Governor Acevedo Vila has called fora new sense of shared responsibility and a new eraof responsibility wherein each resident of the islandis called upon to participate in transforming thegovernment into an effective instrument, into a vibrantentity and one focused on generating the results thatthe people want.
This call to responsibility requires the three (3)branches of the government act as part of a responsibleprocess wherein, the fiscal and budgetaryconsequences of each decision are evaluated and,where no measure is to be pursued unless the costand payment source is clearly identified. Yet, beyondthe public sector, businesses, professional groups,unions, religious groups, community groups and allthe citizens of the island are called upon to rethinkour fiscal and civic responsibilities in light of ourcollective efforts to build a future that we desire.
A New DirectionConsequently, Puerto Rico needs a New Direction,one will take our island to new heights in development,peace and sustained progress. A direction based onthe values and strengths of our community: solidarity,dignity found in honest work, optimism, our familytraditions, our genius, our pride and our faith. To thatend, Governor Acevedo Vila proposes hisadministration’s plan which will serve us as a guidetowards a better future by encompassing tri-partisanproposals as well as multi-sector initiatives as oneconsolidated agenda for Puerto Rico.
The New Direction agenda is b an integrated visionof society and, aptly articulated by the concept of a“Triangle of Success”, a triangle where the threecomponents of success are:
(1) A new economy; and,(2) A safe and peaceful society; and,(3) First class education that will minimize school
drop out rates.
The three components of the Triangle of Success areclosely intertwined and highly interdependent and, atthe same time, they speak to foundational desires fora better quality of life, with better health, and greaterenjoyment as well as conservation of ourenvironment—in sum—a first class Puerto Rico. Toachieve true progress, we have to work with thewhole triangle for example, a new direction inemployment opportunities is needed in order toeliminate the social injustices that feed crime and anew direction in our educational system is imperativeto generate the very employment opportunities thatare needed. Alternatively, without a new direction,the present educational system will continue togenerate high levels of school drop-outs; without anew direction, we will never succeed in the fightagainst crime. Therefore, Governor Acevedo Vilacalls upon our Puerto Rican community to focus ourenergy, resources and strength to build an economythat generates more and better jobs, first class schoolsfor our children and safety in our communities.
A New EconomyIn order to accomplish these administration goals, ANew Economy must be actively pursued, one whichwill be the axis of the future of Puerto Rico onewhich focuses on our most valuable economicresources: our people, our entrepreneurs, ourprofessionals and our labor-force. In essence, a newdirection for our economy requires that we Supportour Local Entrepreneur as the bedrock of a newand successful economy and this direction representsan economic vision that should have been a reality along time ago. A vision which acknowledges that thisgeneration is capable of having the entrepreneur andthe local worker as the actual central character inthe story of our economic development successes.
Among other measures, Governor Acevedo Vilaproposes to promote 1,000 new Puerto Ricanbusinesses within the next four years with an initialinvestment of $30 million through the program calledKey To Your Business and will be nurtured by a jointgovernmental, private and academic fund. Loansand financing will be extended to enterprising PuertoRicans with vision to enable each to start his/hernew business. Yet, funding alone is insufficient tomove in a new direction towards a new economy soGovernor Acevedo Vila proposes that the permitsand support to actually make use of theaforementioned funds will also be expedited and

COMPREHENSIVE ECONOMIC DEVELOPMENT STRATEGY 2005
Puerto Rico Planning Area • Annual Report • CEDS Update • EDA Investment Number: 01-85-08072 63
decentralized, particularly where it environmentalimpacts are not a concern; and the training programsfor other jobs and workers consolidated and reorientedtowards this generation of new enterprises. Inaddition, in order to give these businesses somedemand side support, the proposed legislation willrequire 15% of all purchases made by the governmentto originate with local businesses; but the demandside stimulation goes beyond simply purchases,because the government will pay suppliers of goodsand services on time. Finally, since we desire ourlocal entrepreneurs to become regional and then globaleconomic actors, the governments will provideaggressive incentives to promote the export of localgoods and services.
A Knowledge-based SocietyWhen the Administration speaks of a new economythe situation Puerto Rico is facing must be understandand confronted. Which means an uncompromisingcommitment to a Knowledge-based Economy andBiotechnology so-as-to diversify Puerto Rico’sportfolio of economic activity, actors and in particular–its economic winners. Where traditionally the light-manufacturing sector has been, and still is, the centralpillar of our economy, the pursuit of our desires forthe future cannot depend exclusively on this sectorfor our development. Economic opportunity is nowgrounded in technology, services and the capability tocompete in the Knowledge Economy. Accordingly,Governor Acevedo Vila will redirect efforts towardsinvestment in biotechnology, computer sciences,telecommunications and other related sector. As partand parcel of this initiative, the government will investin first class infrastructure and the development ofPuerto Rico’s human capital. In order to accomplishthis, we need private sector industries and, above all,academic institutions, to strengthen their scienceinitiatives and biotechnology research anddevelopment. For example, this year —incollaboration with the University Of Puerto Rico(UPR) at Mayagüez Campus, a new biotechnologybuilding will have its corner stone laid and at theUPR Rió Piedras Campus the construction of thenew Molecular Sciences building will begin.Furthermore, a Technology Park will be developed atthe old Roosevelt Roads Military base facility, whichwill serve as the headquarters for new businessesdedicated to the knowledge-based economy.
Infrastructure and PlanningDespite the emphasis on a new economy, oureconomic development requires modernInfrastructure and Planning for our Future. Thismeans adequate planning and smart investment inadvanced infrastructure, the improvement of our urbansurroundings and, the proactive protection of ourenvironment. In order to meet these goals, in part,the Acevedo Vila Administration will focus upon:
(1) The construction of the PORTAL TO THEFUTURE project where the old RooseveltRoads military base is located. This planincludes the aforementioned Technology Park,areas for environmental protection, thedevelopment of the airport and maritime-port,housing, shopping centers and tourist facilitiesamong other uses. This development will alsoallow Puerto Rico to have — for the firsttime— a properly planned modern city.Consequently, the combined investment ofpublic and private which the project has alreadyattracted is around at $2.5 billion, in a littleover ten years, and represents the potential tocreate 20,000 new jobs. To that end, thegovernment will allocate $500,000 to enable theRoosevelt Roads Naval Base LandsRedevelopment Authority to begin its work anddirect investment.
(2) The NETWORK(ed) CITY project, where thegovernment will develop the areas that surroundthe Urban Train, particularly, at each station,with public and private funds through a wellplanned combination of housing, commerce,recreational areas and government buildings.Moreover, the NETWORK(ed) CITY projectwill establish a linear connection between theMunicipal Counties of Bayamón, Guaynabo,Cupey, Río Piedras, and Hato Rey.
(3) The INTERNATIONAL CONVENTIONDISTRICT in Isla Grande, which will open itsdoors in November 2005, is projected to createover 3,000 jobs. By the same date theconstruction of a 500 room hotel will start underthe administration of the Sheraton chain, aswell as a housing project of 97 units. Theseefforts, will be further bolstered by full

COMPREHENSIVE ECONOMIC DEVELOPMENT STRATEGY 2005
Puerto Rico Planning Area • Annual Report • CEDS Update • EDA Investment Number: 01-85-08072 64
integration of the International ConventionsDistrict with the Miramar area of San Juan.In order to facilitate this integration, and aprofound transformation of the area, therecommendation has been accepted to movethe Puerto Rico Justice DepartmentHeadquarters out of Miramar. This new zone,including the new Coliseum Building, the rebirthof the El Condado residential and tourism areaand the possible development of the old SanJuan Municipal landfill, will provide a muchneeded revitalization to the infrastructure of thetourist and some key residential areas that hostthis sector for the Island.
(4) Completion of the ROADS PROGRAM; duringhis tenure as Resident Commissioner, GovernorAcevedo Vila advanced this plan through therequisite subcommittees and now he issupporting the efforts of the current ResidentCommissioner, Luis Fortuño, who is working inWashington DC to advance transportationprojects. This $120 million dollar increase willbe used for the construction of new roads andnow, includes essential projects that ResidentCommissioner Fortuño is proposing.
(5) EXTENSION OF THE URBAN TRAINSYSTEM, to include service in and betweenthe Municipal Counties of Carolina and Caguas.Again, both Governor Acevedo Vila andResident Commissioner Fortuño are confidentthat the federal bill for highway andtransportation systems will include funding forthese extensions of the Urban Train, which,will allow for the exponential development ofthese existing corridors of activity as well as areemphasis upon planning polices to increaseour urban population densities.
(6) The PORT OF THE AMERICAS, in theMunicipal County of Ponce. The draining,dredging and reconstruction of the loading areawill begin during this summer and, the projectwill be acquiring the necessary adjacentproperties to maximize the contemplated usageas well as deploy the most productive versionof the port development contemplated.
(7) Development of the MAYAGÜEZ 2010INFRASTRUCTURE [PROJECT], necessary
to host the Central American Games in 2010.This initiative will include the development ofthe Aguadilla Airport.
(8) LEGACY 100,000 PROJECT, where, in orderto preserve our natural environment, theGovernment is proposing to dedicate over100,000 acres during the next 10 years forenvironmental [conservation] purposes.LEGACY 100,000 will begin with close to 5,000acres that the Puerto Rico Department ofNatural Resources will soon acquire andincludes acreage at the former Roosevelt Roadsmilitary base, to preserve these lands as partof the Gates to the Future project.
Structural DeficitsThe Acevedo Vila Administration will focus onachieving a budget that directly attacks our island’sfiscal problems; our structural inefficiencies andlimitations, which, for years, successive governmentshave ignored because doing so is essential toparticipating in An Era of Responsibility. If thepublic sector is to take action, take leadership, inpursuit of a New Direction, a direction that will helpus realize a New Economy; an economy thatsupports a robust and satisfying quality of life and acommunity where our educational and professionalsuccesses are anchored in a Knowledge-basedEconomy and Biotechnology and, our daily activityis supported by modern Infrastructure and Planningfor our Future then the structural deficits in ourgovernment must be addressed and the requisitedifficult decisions cannot be postponed.
Initially Governor Acevedo Vila seeks to eliminatethe primary cause that have resulted in budget deficitssuch as the authorization of annual budgets that appearbalanced but, in point of fact, only do so by postponingobligations until the following fiscal year. Hence,year after year Puerto Rico has accumulated hugedebts that now the people of Puerto Rico must pay,somehow. Specifically, these practices includemeasures such as approving appropriations made tocertain agencies even though they were insufficientto meet the full suit of obligations; approving lawswithout defining the costs that they entail nor, whichrecurrent sources of income will pay for suchinitiatives in the future. Consequently, Puerto Ricohas taken loans and opened lines of credit to coverthese funding insufficiencies in the operational budget
COMPREHENSIVE ECONOMIC DEVELOPMENT STRATEGY 2005
Puerto Rico Planning Area • Annual Report • CEDS Update • EDA Investment Number: 01-85-08072 65
and in doing so have gone to the extreme of takingloans against future loans.
These practices have allowed, and even encouraged,administrative inefficiencies, unnecessary spendingthroughout the government; a lack of controls andmonitoring in the use of funds; and the continuedcreation of new offices, agencies and more red tape.Today, the government is comprised of 144 agenciesand public corporations and requires a generalfund budget, approved by the Legislative Assembly,which, reached $8,854 million last year. This samebudget included a $550 million loan from the PuertoRico Government Development Bank (GDB) as wellas $131 million in non-recurrent revenues.Nevertheless, despite these huge funding allocations,that same budget was insufficient for Puerto Rico’sneeds. As of today, it is estimated that severalagencies will spend $443 million more than what theywere assigned meaning that this years budget in factcost $9,297 million. Exacerbated by insufficientrevenues from tax collections in the amount of roughly$87 million, these four structural factors constitutenearly $1,300 million in funding that are needed tocover the current budget obligations, yet, are notavailable for the next year.
In order to meet this shortfall, the director of thePuerto Rico Office of Management and Budget(OMB), the Puerto Rico Secretary of the Treasuryand, the GDB president will be implementing seriousand strict spending control measures, aggressivemeasures of to reduce tax evasion and austere fiscalresponsibility recommendations. In order to generaterevenues or achieve savings equivalent to those $1,300million of structural deficit, the Acevedo VilaAdministration, needs to add nearly $400 million tocover debts, assign funds for legislated or negotiatedsalary increases as well as additional appropriations.In other words, for the next fiscal year, we need tofind $1,700 million in new revenues or spending cuts.
In spite of this situation, the FY 2006 General Fundbudget submitted is both balanced and real and, willallow Puerto Rico to comply with all its obligations, inthe amount of $9,684 million, yet, it will also steer theisland in the New Direction championed byGovernor Acevedo Vila . This has beenaccomplished without additional loans for operationalexpenses while acknowledging the limitations we faceas well as the obligations we must meet. As the
GDB begins to proactively restructure and refinancePuerto Rico’s existing debt, not a single new loan foroperational expenses will be rendered because in ourpursuit of An Era of Responsibility the public sectormust lead by example.
Public Spending and RedirectingResourcesRecognizing the FY 2006 budget as a transitionalbudget while we implement a true tax and fiscalreform; one that accomplishes substantial reductionsin assignments to several agencies and budget items,to a redirection of resources towards trulyfundamental areas: education, public safety andeconomic development as well as health, new incomesources, and aggressively fighting tax evasion—all ofwhich, play crucial roles in the Triangle for Success.In order to put government to work efficiently, vacantpolitical positions in all public agencies have beenfrozen, travel has been limited, and the use of cellularphones and official vehicles curtailed as fundamentalcontrols on expenses. Yet, these measures do not gofar enough to reduce the size of the governmentwhere Puerto Rico expends 2.2 million dollars perhour on the central government payroll, or $16 millionper day. Accordingly, the size of government needsreduction. Using various means, the FY 2006,transition budget, includes an unprecedented $370million reduction in budget items, including payrolland the number of agencies. It establishes strictcontrols in public spending and constitutes thebeginning of a profound process of government reformthat will provide us with a more agile, sensible andefficient government, a government that is closer toyou—a truly functional and competent government.
Facing Puerto Rico’s budget reality necessitates areorganization of the government to allocate resourcesrationally and start solving problems. As a first phaseof the FY 2006 budget, as a transitional budget asPuerto Rico moves towards a more comprehensivetax and fiscal reform. To control expenses, thefollowing steps are necessary and require the sharedresponsibility of the Executive and Legislativebranches for the well being of Puerto Rico.
First: consolidation, relocation and eliminations toreduce the number of offices and governmentagencies; through this measure the total number ofagencies can be reduced by 18. Second: the freezingof positions as a measure to control public spending.
COMPREHENSIVE ECONOMIC DEVELOPMENT STRATEGY 2005
Puerto Rico Planning Area • Annual Report • CEDS Update • EDA Investment Number: 01-85-08072 66
Third: the non-renewal of transitory and irregularcontracts gradually as each contract come to term,so as allow an adjustment period and mitigate averseimpacts in essential services to the citizenry. Fourth:an incentive program for eligible employees to exercisethe option of retirement NOW, by offering a $2,000bonus. Fifth: an incentive program for early retirementfor those employees approaching standard eligibilitywherein, the government has set aside $20 million tofinance the costs; this program would include thefunds needed to increase the government’scontribution to the Retirement System as providedfor in the proposed legislation. Sixth: a four-daylabor week, a voluntary program for employees wherethey would have a 15% reduction and would retainall vacation and retirement benefits. Seventh: theelimination of subsidies to public corporations andother entities in order to allow market pressures topromote greater efficiency and quality of service aswell as the corresponding revenues for the self-sufficiency of these same organizations.
Increasing Public RevenuesAlthough in the immediate term the cost reductionsoutlined above are both necessary and prudent, thestructural deficit described previously, together withthe obligations required by law, is such a large burdenthat, by themselves, in the short term, these measuresare not enough. Consequently, measures must betaken swiftly to increase revenues; primarily TaxReform must be legislated, yet, to begin that processwe can initially begin a Head on attack on taxevasion.
The Acevedo Vila Administration, through theSecretary of the Treasury, has begun implementing amultidisciplinary effort to attack tax evasion on allfronts with a particular emphasis on better detectionand thus mitigation as well as, elimination of functionalloopholes and other technicalities which facilitateevasion. But the department will also take actionagainst the evasion of taxes on crude oil and itsderivatives. In addition, with regard to income taxes,the Treasury Department will deploy software andtechniques to detect evasion based on the consumer’sconsumption patterns and other activities. Thismeasure will facilitate the capture of tax evaderswho tend to be professionals, who report middle classincomes but have upper class purchasing power.Collectively, these measures should garner anadditional $95 million in the next fiscal year.
Yet even this, is not sufficient; to balance the nextbudget, we need to take measures that requirelegislative action and address our structuraldeficiencies. Therefore, Governor Acevedo Vila,proposes the following changes that start Puerto Ricooff in the New Direction, and lay the foundation forrobust economic, social and environmentaldevelopment:
(1) Eliminate the exclusions from the 6.6%excise tax paid by importers. This measurehas become necessary because of theoutrageous and boldfaced excise tax evasionthat is increasingly common practice. The trendin Puerto Rico is that more and more articlesare sold and, consumed, on our island—we area great consumer market. However, excisetax collections have not increase along withsales. For example, from 1999, excise taxcollections have been nearly constant between$500-$600 million per year, yet, during the sameperiod, consumption increased from $34,000 to$43,000 million. Again, between 1999 and2004, excise tax collections increased by only3%; yet, during the same period, consumptionincreased by 26%. The primary source of thisdisjuncture, between sales and tax receipts, isthat in Puerto Rico, there are 35 exclusionsfrom this tax yet we only inspect on the orderof 3% of our monthly cargo intake. Theproposed measure will produce $639 million forpriorities in the budget and will have a two-year effectiveness, which will allow us enoughtime to implement the Tax Reform that I willbe proposing shortly
(2) Increasing the tax rate for financialinstitutions for the next two years. Rankingthird in all of Latin America after Mexico andBrazil, Puerto Rico has a highly successfulfinancial industry. In Puerto Rico our industryoffers personal banking, insurance, personalinvestment and credit services and theenterprises include commercial banks,brokerage agencies, insurance companies, creditagencies, lending companies and mortgagebanks. Therefore, given the robust nature ofthis sector’s activity, the Acevedo VilaAdministration, through the Secretary of theTreasury, proposes a special tax be imposedfor two (2) years as a transitory measure in

COMPREHENSIVE ECONOMIC DEVELOPMENT STRATEGY 2005
Puerto Rico Planning Area • Annual Report • CEDS Update • EDA Investment Number: 01-85-08072 67
anticipation of the tax reform and as a stopgapmeasure until structural reforms have begun totake shape. The estimated revenues producedby this measure are estimated at $180 millionper year.
(3) Uniformity of the applicable rate of thecapital gains tax. According to the InternalRevenue Code, currently the applicable ratefor long-term revenues, from the sale of capitalassets, varies between 5% and 25%. Thismeasure, in order to generate approximately$60 million in recurrent revenues, seeks to seta uniform rate at 20% and will impose ameasure of social justice on the system for thesalaried working middle class which paysincome tax rates from a minimum of 7% up to33%, thus carrying a heavier proportional burdenthan those individuals who benefit from thecurrent capital gains scheme. Again, thismeasure would be effective for only two (2)years, as a transitory measure, in anticipationof the tax reform initiatives required to structuralreforms.
(4) Increase the cost of vehicle registrationstickers for luxury cars. Currently, all motorvehicles pay a flat amount for their validationstickers. The proposed measure will increasethe cost of validation stickers only for carsworth $40,000 or more. Luxury vehicle area differentiated product and it is unfair that amiddle price range vehicle requires the sameamount for its validation. The proposed measurewill produce an estimated $30 million inadditional revenues.
The urgent need to implement measures to reducespending and increase government revenues, such asthose outlined above, is evident when we itemize theupcoming budget. Of the $9,684 million thatcomprise the General Fund Budget for fiscal year2005-06, we are obligated to allocate: a nearly $250million increase, in formula allocations to the Courts,the UPR and, the municipalities; over $100 millionto cover previously approved laws, including salaryincreases; almost $400 million to cover the recurrentoperational deficits of particular agencies; and, justover $27 million to pay central government’s owndebts to its own public corporations since, thegovernment has been delinquent, even, in paying itself.
That is, from the total budget for next year, almost$800 million will be absorbed by these inescapableand new debts or obligations.
Nevertheless, this circumstance is not insurmountableand, although the Governor Acevedo Vila cannotavoid what needs to be done; buy redirectingresources and generating some stop-gap fundingmeasures the Acevedo Vila Administration, willstart Puerto Rico on the path in the New Direction.Consequently, the presentation funding allocationsembodied in the proposed FY 2006-07 budget areimportant investments needed to advance Puerto Ricoin the New Direction, through the Triangle for Successwhere we seek a New Economy, better Education,and Public Safety, and improvements in public healthwhich protect our community. Many of these itemizedallocations will be under the custody of the PR OMBwhich will allow for strict and professional controls,especially as related to payroll measures, so as toavoid many of the errors which caused the hugedeficits in many agencies today.
Working in ConcertThe Framework of interests and the action planoutlined has been the outcome of a serious exerciseof economic analysis, of a frank balancing the needsof Puerto Rico against the obligations we haveincurred—particularly the large debts that burden us—and significant adjustments are required to turn thetide in Puerto Rico’s favor. Together, we can beginearning more than we spend by assume responsibilityto spend Puerto Rico’s limited funds prudently andwith profound respect for our communities criticalneeds. Therefore, the Acevedo VilaAdministration, calls upon all of Puerto Rico’sstakeholder; the public sector, elected officials, thefor-profit private sector, the not-for-profit privatesector, community groups, churches and individualscitizens and residents alike to answer the call to action,to participate in An Era of Responsibility, and movePuerto Rico in a New Direction, a better direction.A way of doing business where we value theresources of the government and make wise use ofexisting services and our limited resources so thatthey we can preserve them from becoming moreexpensive and reaching fewer people. In particular,Governor Acevedo Vila invites Puerto Rico to takecare and protect our public spaces especially theproperty in our schools, hospitals and publictransportation systems so that each of us is

COMPREHENSIVE ECONOMIC DEVELOPMENT STRATEGY 2005
Puerto Rico Planning Area • Annual Report • CEDS Update • EDA Investment Number: 01-85-08072 68
contributing to a culture of preservation. So that eachinstitution is empowered to make Puerto Rico a betterplace. So that each organization contributes to thebest use of Puerto Rico’s limited resources. Inaddition, private enterprise, associations, civic andcommunity based organizations are exhorted to fulfilltheir fiscal responsibilities, that Puerto Rico cancontinue to provide them with the physicalinfrastructure necessary to facilitate all activity andthe service infrastructure to render results.
A Puerto Rico without resources has no future. APuerto Rico country without a sense of purpose hasno future. A Puerto Rico at war with itself has nofuture. For these reasons, the Acevedo VilaAdministration calls upon all of Puerto Rico’sstakeholders to look beyond the issues that traditionallydivide us, to work collectively on the solutions andinstead to put first our need to resolve critical issues;to put first our assault on social inequalities, to putfirst our fight against the violence in our streets, toput first the lack of educational resources in ourschools. For in putting these issues first, we willhave put foremost on our community agenda ourchildren and our future. We will have put the caretakers of our Puerto Rico’ tomorrow foremost today.We will have put those who contribute with theirwork to the growth of this land and our economyforemost today. We will have put those who needand provide health services foremost today. We willhave put those who need and provide protectionforemost today.
If Puerto Rico strives to do this, the quality of life ofour citizens will improve. The vicious circle ofstructural deficits, inefficient service and imprudentallocation of resources can be transformed into avirtuous circle of well rendered services, strategicand effective resource allocations and shrewdmanagement of fiscal resources. When we put atcenter the well being of Puerto Rican families—bettereducation, more safety in your streets, better jobopportunities, better health conditions—there is nooption but to implement the policy measures outlinedby Governor Acevedo Vila. Personal responsibilitymust be assumed for our circumstances today.
The necessary decisions, no matter how difficult theymay be, must be made and we must and choosecorrectly for the well being of our future, for ourfamilies. Puerto Rico must choose correctly for the
well being of our businesses, our churches, our forestsand, our beaches. Puerto Rico must sow the seedfor the future; lay the cobble stones upon the path inthe New Direction. Side by side, Puerto Ricansmust work together in An Era of Responsibility toachieve a New Economy, a knowledge-basedeconomy and the modern infrastructure needed. Sideby side, Puerto Ricans must work together toeliminate structural deficits and reduce spending aswell as redirect resources. Side by side, PuertoRicans must work together to increase public revenuesand render efficiently the serves they support. Sideby side, Puerto Rico must work hand in hand tosecure a today and tomorrow we can all be proud toclaim as our own.
What Follows: The Strategies
In the next portion of this section, section III, you willfind 1) all the project strategies organized andpresented according to their respective implementationwaves and topic area. This section includes strategiesfor the social and cultural areas.
Next, you will find 2) all the strategies presentedby topic area. Each topic area commences with the“Fundamental Objectives from the Vision”and thenpresents the strategies for each of the topic areaspreviously identified and are accompanied by theirrespective objectives. This section excludes the socialand cultural topic areas and focuses exclusivly uponthe Economic topic area and the Infrestructure andEnviornment topic area.
Finally, you will find 3) a series of strategy flow chartsdemonstrating graphically the relationship between eachof the strategies according to their respectiveimplementation wave. Although they are presented inSpanish, this section does include strategies for thesocial and cultural topic areas.
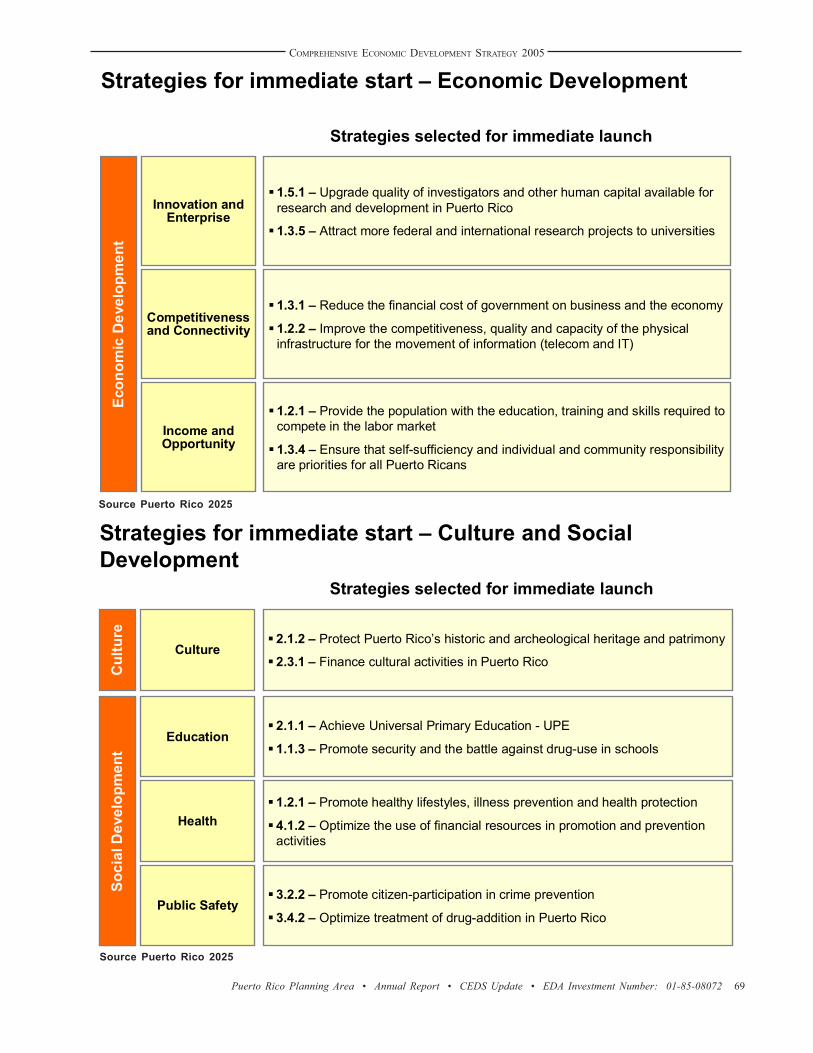
COMPREHENSIVE ECONOMIC DEVELOPMENT STRATEGY 2005
Puerto Rico Planning Area • Annual Report • CEDS Update • EDA Investment Number: 01-85-08072 69
Strategies for immediate start – Economic DevelopmentEc
onom
ic D
evel
opm
ent
Innovation and Enterprise
Competitiveness and Connectivity
Income and Opportunity
Strategies selected for immediate launch
1.5.1 – Upgrade quality of investigators and other human capital available for research and development in Puerto Rico
1.3.5 – Attract more federal and international research projects to universities
1.3.1 – Reduce the financial cost of government on business and the economy
1.2.2 – Improve the competitiveness, quality and capacity of the physical infrastructure for the movement of information (telecom and IT)
1.2.1 – Provide the population with the education, training and skills required to compete in the labor market
1.3.4 – Ensure that self-sufficiency and individual and community responsibility are priorities for all Puerto Ricans
Strategies for immediate start – Culture and Social Development
Soci
al D
evel
opm
ent
Education
Health
Public Safety
Strategies selected for immediate launch
2.1.1 – Achieve Universal Primary Education - UPE
1.1.3 – Promote security and the battle against drug-use in schools
1.2.1 – Promote healthy lifestyles, illness prevention and health protection
4.1.2 – Optimize the use of financial resources in promotion and prevention activities
3.2.2 – Promote citizen-participation in crime prevention
3.4.2 – Optimize treatment of drug-addition in Puerto Rico
Culture2.1.2 – Protect Puerto Rico’s historic and archeological heritage and patrimony
2.3.1 – Finance cultural activities in Puerto RicoCul
ture
Source Puerto Rico 2025
Source Puerto Rico 2025

COMPREHENSIVE ECONOMIC DEVELOPMENT STRATEGY 2005
Puerto Rico Planning Area • Annual Report • CEDS Update • EDA Investment Number: 01-85-08072 70
Strategies for immediate start – Environment and Infrastructure Development
Infr
astr
uctu
re D
evel
opm
ent
Utilities
Land Use and Environment
Transport
Strategies selected for immediate launch
3.2.2 – Implement and update the waste management plan
2.1.1 – Review and update the water and sewage long-term plan
1.1.1 – Create and enact an island-wide land-use master plan, clearly defining the intended use of all land areas
1.2.2 – Communicate the land-use master plan and the permitting process to the community
3.2.3 – Create and promote efficient and reliable collective transportation
3.2.1 – Complete the highway and road network
MERGED (1.1.1 - 1.2.1 - 2.1.1 - 2.2.1) – Improve the productivity and attractiveness of existing ports and airports to make them more competitive
Source Puerto Rico 2025
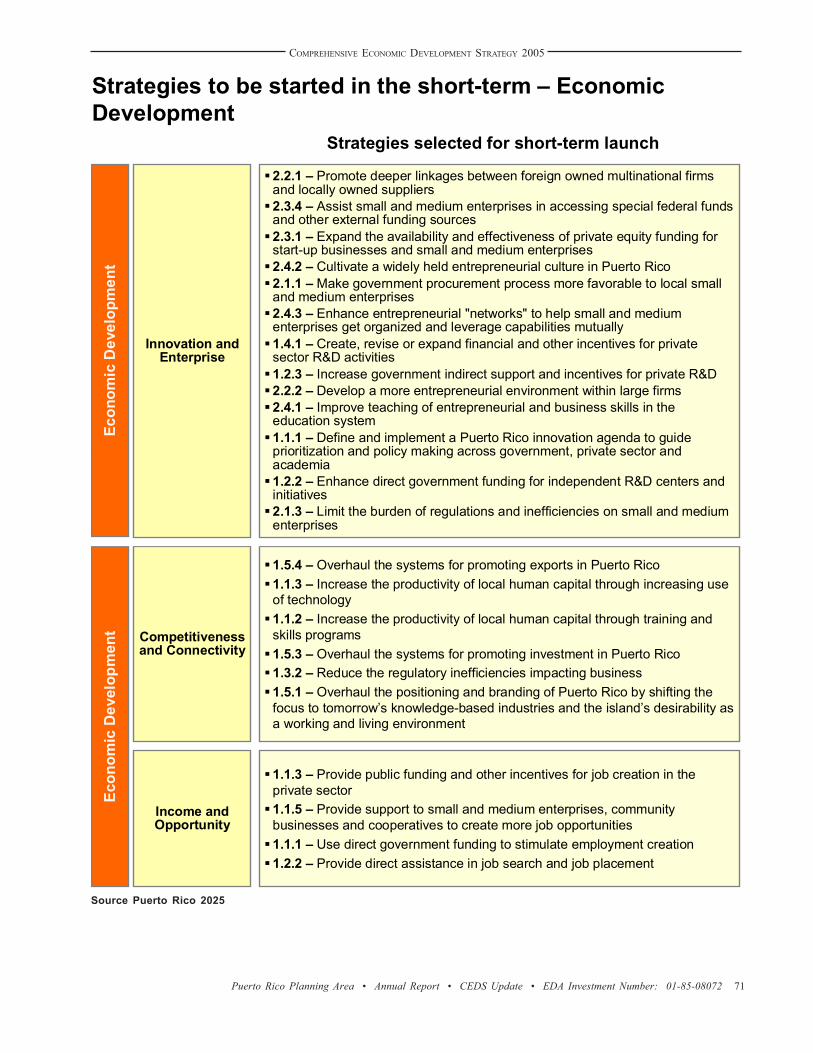
COMPREHENSIVE ECONOMIC DEVELOPMENT STRATEGY 2005
Puerto Rico Planning Area • Annual Report • CEDS Update • EDA Investment Number: 01-85-08072 71
Strategies to be started in the short-term – Economic Development (cont.)
Competitiveness and Connectivity
Income and Opportunity
Strategies selected for short-term launch
1.5.4 – Overhaul the systems for promoting exports in Puerto Rico1.1.3 – Increase the productivity of local human capital through increasing use of technology1.1.2 – Increase the productivity of local human capital through training and skills programs1.5.3 – Overhaul the systems for promoting investment in Puerto Rico1.3.2 – Reduce the regulatory inefficiencies impacting business1.5.1 – Overhaul the positioning and branding of Puerto Rico by shifting the focus to tomorrow’s knowledge-based industries and the island’s desirability as a working and living environment
1.1.3 – Provide public funding and other incentives for job creation in the private sector1.1.5 – Provide support to small and medium enterprises, community businesses and cooperatives to create more job opportunities1.1.1 – Use direct government funding to stimulate employment creation1.2.2 – Provide direct assistance in job search and job placement
Econ
omic
Dev
elop
men
tStrategies to be started in the short-term – Economic Development
Econ
omic
Dev
elop
men
t
Innovation and Enterprise
Strategies selected for short-term launch
2.2.1 – Promote deeper linkages between foreign owned multinational firms and locally owned suppliers2.3.4 – Assist small and medium enterprises in accessing special federal funds and other external funding sources2.3.1 – Expand the availability and effectiveness of private equity funding for start-up businesses and small and medium enterprises2.4.2 – Cultivate a widely held entrepreneurial culture in Puerto Rico2.1.1 – Make government procurement process more favorable to local small and medium enterprises2.4.3 – Enhance entrepreneurial "networks" to help small and medium enterprises get organized and leverage capabilities mutually1.4.1 – Create, revise or expand financial and other incentives for private sector R&D activities1.2.3 – Increase government indirect support and incentives for private R&D2.2.2 – Develop a more entrepreneurial environment within large firms2.4.1 – Improve teaching of entrepreneurial and business skills in the education system1.1.1 – Define and implement a Puerto Rico innovation agenda to guide prioritization and policy making across government, private sector and academia 1.2.2 – Enhance direct government funding for independent R&D centers and initiatives2.1.3 – Limit the burden of regulations and inefficiencies on small and medium enterprises
Source Puerto Rico 2025
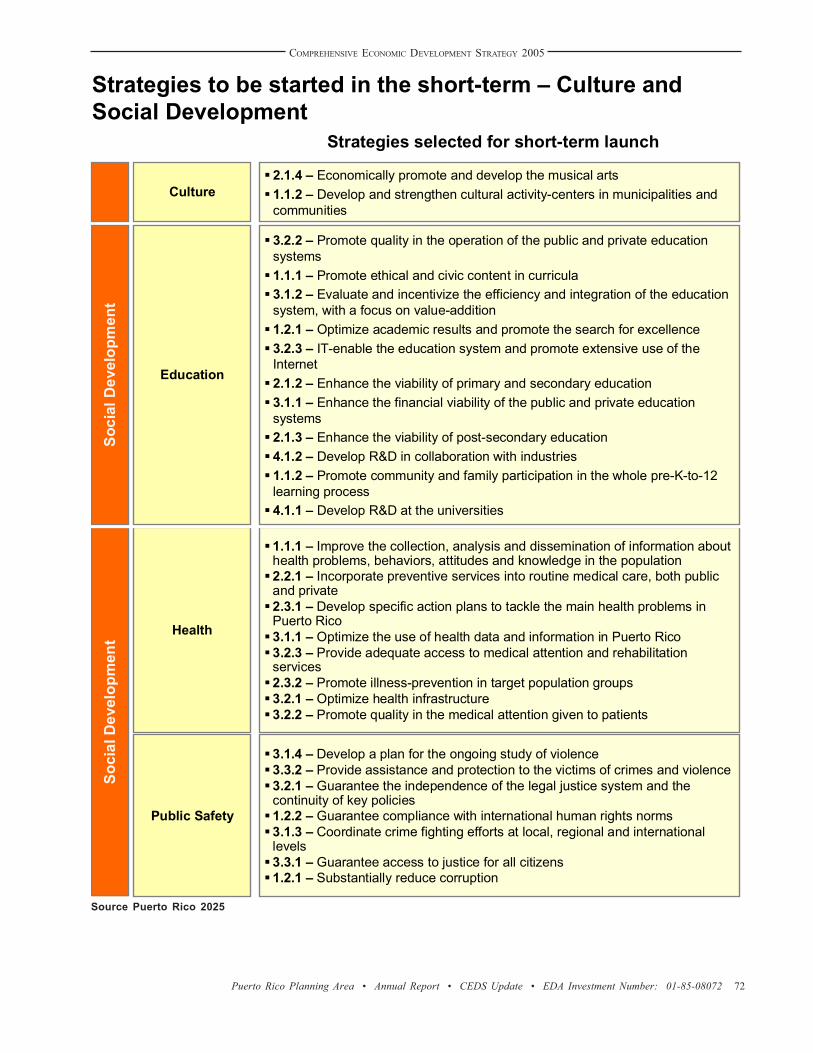
COMPREHENSIVE ECONOMIC DEVELOPMENT STRATEGY 2005
Puerto Rico Planning Area • Annual Report • CEDS Update • EDA Investment Number: 01-85-08072 72
Strategies to be started in the short-term – Culture and Social Development (cont.)
Health
Public Safety
Strategies selected for short-term launch
1.1.1 – Improve the collection, analysis and dissemination of information about health problems, behaviors, attitudes and knowledge in the population 2.2.1 – Incorporate preventive services into routine medical care, both public and private2.3.1 – Develop specific action plans to tackle the main health problems in Puerto Rico 3.1.1 – Optimize the use of health data and information in Puerto Rico3.2.3 – Provide adequate access to medical attention and rehabilitation services2.3.2 – Promote illness-prevention in target population groups3.2.1 – Optimize health infrastructure 3.2.2 – Promote quality in the medical attention given to patients
3.1.4 – Develop a plan for the ongoing study of violence3.3.2 – Provide assistance and protection to the victims of crimes and violence3.2.1 – Guarantee the independence of the legal justice system and the continuity of key policies1.2.2 – Guarantee compliance with international human rights norms3.1.3 – Coordinate crime fighting efforts at local, regional and international levels3.3.1 – Guarantee access to justice for all citizens1.2.1 – Substantially reduce corruption
Soci
al D
evel
opm
ent
Strategies to be started in the short-term – Culture and Social Development
Soci
al D
evel
opm
ent
Education
Strategies selected for short-term launch
3.2.2 – Promote quality in the operation of the public and private education systems1.1.1 – Promote ethical and civic content in curricula3.1.2 – Evaluate and incentivize the efficiency and integration of the education system, with a focus on value-addition1.2.1 – Optimize academic results and promote the search for excellence3.2.3 – IT-enable the education system and promote extensive use of the Internet2.1.2 – Enhance the viability of primary and secondary education3.1.1 – Enhance the financial viability of the public and private education systems2.1.3 – Enhance the viability of post-secondary education4.1.2 – Develop R&D in collaboration with industries1.1.2 – Promote community and family participation in the whole pre-K-to-12 learning process4.1.1 – Develop R&D at the universities
Culture2.1.4 – Economically promote and develop the musical arts1.1.2 – Develop and strengthen cultural activity-centers in municipalities and communities
Source Puerto Rico 2025

COMPREHENSIVE ECONOMIC DEVELOPMENT STRATEGY 2005
Puerto Rico Planning Area • Annual Report • CEDS Update • EDA Investment Number: 01-85-08072 73
Strategies to be started in the short-term – Environment and Infrastructure Development
Infr
astr
uctu
re D
evel
opm
ent
Utilities
Land Use and Environment
Transport
Strategies selected for short-term launch
2.1.2 – Increase investment in water and sewage infrastructure and systems to improve efficiency and reliability and decrease pollution 5.1.3 – Promote the use of renewable sources of energy4.2.1 – Strengthen the energy-sector regulatory body so that it becomes truly independent
1.3.1 – Strengthen land-use enforcement mechanisms
1.1.3 – Restructure the adjudication, permitting and approval process
2.2.2 – Expand the capacity of passenger air terminals
3.2.4 – Ensure that the land use plan reduces the need for transportation
3.2.2 – Increase the efficiency and capacity of existing roads
Infr
astr
uctu
re D
evel
opm
ent
Utilities
Land Use and Environment
Transport
2.1.2 – Increase investment in water and sewage infrastructure and systems to improve efficiency and reliability and decrease pollution 5.1.3 – Promote the use of renewable sources of energy4.2.1 – Strengthen the energy-sector regulatory body so that it becomes truly independent
1.3.1 – Strengthen land-use enforcement mechanisms
1.1.3 – Restructure the adjudication, permitting and approval process
2.2.2 – Expand the capacity of passenger air terminals
3.2.4 – Ensure that the land use plan reduces the need for transportation
3.2.2 – Increase the efficiency and capacity of existing roads
Source Puerto Rico 2025

COMPREHENSIVE ECONOMIC DEVELOPMENT STRATEGY 2005
Puerto Rico Planning Area • Annual Report • CEDS Update • EDA Investment Number: 01-85-08072 74
Strategies to be started in the medium-term – Economic Development
Econ
omic
Dev
elop
men
t
Innovation and Enterprise
Strategies selected for medium-term launch
1.3.1 – Reform University budget and incentive structure to promote R&D and technology transfer2.1.2 – Reduce tax burden and other financial costs that government imposes on small and medium enterprises1.3.4 – Attract more global talent to do R&D at universities1.4.2 – Fund major scientific infrastructure projects needed to attract more private sector R&D2.1.4 – Improve the effectiveness of existing entities designed to promote the growth and formation of small and medium enterprises2.3.2 – Enhance debt financing options available to small and medium enterprises1.3.2 – Increase funding for laboratories, research centers and other R&D infrastructure at universities1.2.1 – Create government research centers to pursue high-priority research needs
Econ
omic
Dev
elop
men
t
Competitiveness and Connectivity
Income and Opportunity
1.1.6 – Promote multi-lingual abilities in all sectors of the economy1.1.5 – Deepen linkages between Puerto Rico's people and the world
1.1.4 – Institute programs to attract more global talent to Puerto Rico
1.5.2 – Improve the ongoing process for defining the overall economic strategy of Puerto Rico
1.4.2 – Rationalize unproductive subsidies distorting competition and resource allocation in key economic sectors
1.1.6 – Provide support and incentives to non-profit organizations to create more job opportunities
1.3.1 – Reform social-assistance programs to encourage gainful employment
1.4.2 – Encourage saving and asset building among poor and marginalized people
Source Puerto Rico 2025

COMPREHENSIVE ECONOMIC DEVELOPMENT STRATEGY 2005
Puerto Rico Planning Area • Annual Report • CEDS Update • EDA Investment Number: 01-85-08072 75
Strategies to be started in the medium-term – Culture and Social Development
Cul
ture
Culture
Strategies selected for medium-term launch
2.1.5 – Economically promote and develop the representative arts2.3.2 – Develop human capital for cultural production1.1.1 – Support and foster public and private cultural initiatives that guarantee the autonomy of cultural organizations4.1.1 – Promote Puerto Rican festivities and traditions1.1.3 – Facilitate access to schools specializing in art and culture1.2.2 – Provide incentives for professional and high-competition sports in Puerto Rico2.1.1 – Promote the development, management and coordination of museums1.2.1 – Promote recreation and sport activities among children and youngsters in the school and university systems2.1.3 – Economically promote and develop plastic arts2.2.1 – Promote the development of literature and its diffusion within and outside Puerto Rico2.2.2 – Foster reading habits3.2.1 – Promote social responsibility in the audiovisual and printed communication media
Soci
al D
evel
opm
ent
Education
Health
Public Safety
2.1.4 – Guarantee education for disadvantaged groups2.2.1 – Guarantee education for the disabled1.2.2 – Optimize retention and graduation rates in schools and universities1.2.4 – Develop arts and culture2.2.2 – Promote adult education
4.1.1 – Optimize the use of financial resources for health treatment 2.1.1 – Reduce environmental risks to health3.1.2 – Promote coordination between diverse public and private organizations for the achievement of health objectives2.1.2 – Guarantee food assistance for higher risk groups and strengthennutritional food surveillance systems 4.1.3 – Promote and reinforce human resource skills in the health system
3.1.2 – Develop a juvenile criminal justice plan3.5.1 – Prevent and eradicate domestic violence and sexual aggression, and eliminate recurrence3.1.1 – Expedite penal procedures3.4.1 – Promote the habilitation and rehabilitation of the prison population
Source Puerto Rico 2025
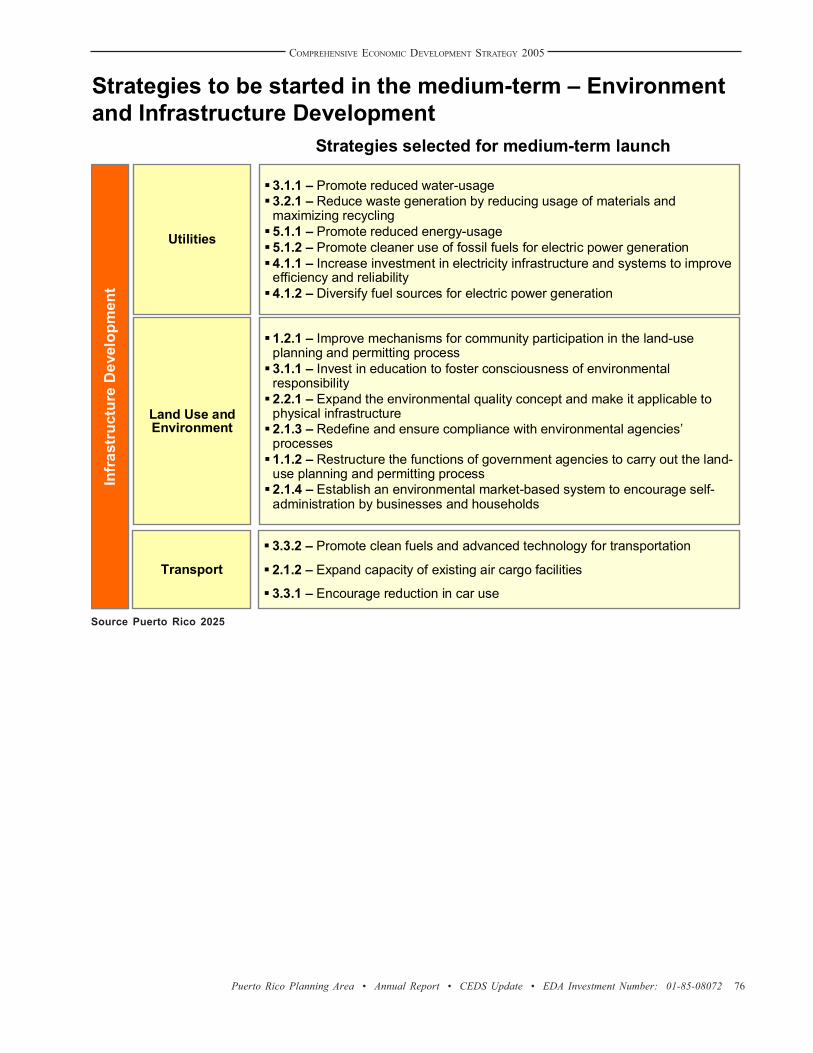
COMPREHENSIVE ECONOMIC DEVELOPMENT STRATEGY 2005
Puerto Rico Planning Area • Annual Report • CEDS Update • EDA Investment Number: 01-85-08072 76
Strategies to be started in the medium-term – Environment and Infrastructure Development
Infr
astr
uctu
re D
evel
opm
ent
Utilities
Land Use and Environment
Strategies selected for medium-term launch
3.1.1 – Promote reduced water-usage3.2.1 – Reduce waste generation by reducing usage of materials and maximizing recycling5.1.1 – Promote reduced energy-usage5.1.2 – Promote cleaner use of fossil fuels for electric power generation4.1.1 – Increase investment in electricity infrastructure and systems to improve efficiency and reliability 4.1.2 – Diversify fuel sources for electric power generation
1.2.1 – Improve mechanisms for community participation in the land-use planning and permitting process 3.1.1 – Invest in education to foster consciousness of environmental responsibility2.2.1 – Expand the environmental quality concept and make it applicable to physical infrastructure 2.1.3 – Redefine and ensure compliance with environmental agencies’processes 1.1.2 – Restructure the functions of government agencies to carry out the land-use planning and permitting process 2.1.4 – Establish an environmental market-based system to encourage self-administration by businesses and households
Transport
3.3.2 – Promote clean fuels and advanced technology for transportation
2.1.2 – Expand capacity of existing air cargo facilities
3.3.1 – Encourage reduction in car use
Source Puerto Rico 2025

COMPREHENSIVE ECONOMIC DEVELOPMENT STRATEGY 2005
Puerto Rico Planning Area • Annual Report • CEDS Update • EDA Investment Number: 01-85-08072 77
Strategies to be started in the long-term – Economic Development
Econ
omic
Dev
elop
men
t
Innovation and Enterprise
Competitiveness and Connectivity
Income and Opportunity
Strategies for long-term launch
2.3.3 – Enhance use of public equity funding for local enterprises
1.1.1 – Reduce the total effective cost of human resources in Puerto Rico
1.4.1 – Remove protections and other impediments limiting competition in key economic sectors
1.2.3 – Provide physical infrastructure which facilitates access to jobs1.1.2 – Optimize the distribution of jobs in the public sector1.3.3 – Improve compensation packages to make it more attractive to work1.4.1 – Increase participation of poor and marginalized populations in formal financial networks1.3.2 – Use direct government funds to increase the incentives for seeking employment1.1.4 – Diminish regulations in order to stimulate job creation
Strategies to be started in the long-term – Culture and Social Development
Soci
al D
evel
opm
ent Education
Health
Public Safety
Strategies for long-term launch
NO STRATEGIES FOR LONG-TERM
NO STRATEGIES FOR LONG-TERM
3.1.5 – Guarantee the effectiveness of programs that receive public funding through external assessment
Culture
1.2.4 – Promote recreation and sports among third age (elder) individuals2.3.3 – Promote Puerto Rican cultural production in the international environment2.2.3 – Promote library-management and the conservation and diffusion of Puerto Rico’s documentary patrimony1.2.3 – Promote recreation and sports among the physically and mentallydisabled
Cul
ture
Source Puerto Rico 2025
Source Puerto Rico 2025

COMPREHENSIVE ECONOMIC DEVELOPMENT STRATEGY 2005
Puerto Rico Planning Area • Annual Report • CEDS Update • EDA Investment Number: 01-85-08072 78
Strategies to be started in the long-term – Environment and Infrastructure Development
Infr
astr
uctu
re D
evel
opm
ent
Utilities
Land Use and Environment
Transport
Strategies for long-term launch2.1.3 – Redefine water and sewage pricing structure 4.1.3 – Redefine energy pricing structure 2.2.1 – Strengthen the water and waste regulatory body so that it becomes truly independent4.2.2 – Open the electric power market to competition in all areas (generation, transmission and distribution)2.2.2 – Open the water and sewage market to competition at all levels
3.1.2 – Promote environmental consciousness among individuals through regulation and incentives3.1.3 – Define community compliance goals for environment safekeeping2.1.1 – Strengthen or modify current environmental laws, or explore new regulation schemes to ensure environmental conservation 1.3.2 – Strengthen funding mechanisms to purchase property and/or compensate owners impacted by land-use enforcements
3.4.2 – Create new mechanisms to incorporate the community in transportation planning and communication process1.1.2 – Expand the capacity of sea ports for cargo services2.2.3 – Increase the number and frequency of air connections for passengers3.1.2 – Invest in new land freight systems 1.2.3 – Increase the number and frequency of maritime connections for passengers3.1.1 – Improve the productivity of land freight services 1.2.2 – Expand capacity of passenger sea terminals1.1.3 – Transform small and military sea ports into new ports for shipping services2.1.3 – Transform small and military airports into new airports for cargo services
Source Puerto Rico 2025

COMPREHENSIVE ECONOMIC DEVELOPMENT STRATEGY 2005
Puerto Rico Planning Area • Annual Report • CEDS Update • EDA Investment Number: 01-85-08072 79
UTILITIES – Strategies and their objectivesStrategies
2.1.1 Review and update the water and sewage long-term plan
Ensure sustainable access to water and processing of sewage, by defining long-term supply and demand, and tailoring future development in line with sustainable water resources
2.1.1 Review and update the water and sewage long-term plan
Ensure sustainable access to water and processing of sewage, by defining long-term supply and demand, and tailoring future development in line with sustainable water resources
ObjectivesNumber
2.1.2Increase investment in water and sewage infrastructure and systems to improve their efficiency and reliability and decrease pollution
Improve the infrastructure of the water and sewage systems, so as to maximize their reliability and efficiency and minimize losses and pollution
2.1.2Increase investment in water and sewage infrastructure and systems to improve their efficiency and reliability and decrease pollution
Improve the infrastructure of the water and sewage systems, so as to maximize their reliability and efficiency and minimize losses and pollution
2.1.3 Redefine water and sewage pricing structure
Ensure that the water and sewage pricing is structured in such away that it promotes efficient usage and reduces the financial debts of the authority, while maintaining social justice
2.1.3 Redefine water and sewage pricing structure
Ensure that the water and sewage pricing is structured in such away that it promotes efficient usage and reduces the financial debts of the authority, while maintaining social justice
2.2.1Strengthen the water and sewage regulatory body so that it becomes truly independent
Ensure that the water and sewage systems are operated as efficiently and effectively as possible, by separating the regulatory and operational functions and giving the regulatory body real authority
2.2.1Strengthen the water and sewage regulatory body so that it becomes truly independent
Ensure that the water and sewage systems are operated as efficiently and effectively as possible, by separating the regulatory and operational functions and giving the regulatory body real authority
2.2.2 Open the water and sewage market to competition at all levels
Ensure that the water and sewage systems are operated as efficiently and effectively as possible, by stimulating competition in the various parts of the water and sewage system
2.2.2 Open the water and sewage market to competition at all levels
Ensure that the water and sewage systems are operated as efficiently and effectively as possible, by stimulating competition in the various parts of the water and sewage system
Source Puerto Rico 2025
Source Puerto Rico 2025
UTILITIES – Fundamental Objectives from the Vision
Guarantee reliable accessto all Provide reliable access to all, with the needed technology and quality
Optimize social and environmental impact
Minimize or eliminate the utilities’ negative impact on the environment and society
Minimize economic cost Maximize the efficiency and productivity of the utilities
OBJECTIVES DESCRIPTION OF THE OBJECTIVES

COMPREHENSIVE ECONOMIC DEVELOPMENT STRATEGY 2005
Puerto Rico Planning Area • Annual Report • CEDS Update • EDA Investment Number: 01-85-08072 80
UTILITIES – Strategies and their objectives (cont.)Strategies
2.1.1 Review and update the water and sewage long-term plan
Ensure sustainable access to water and processing of sewage, by defining long-term supply and demand, and tailoring future development in line with sustainable water resources
2.1.1 Review and update the water and sewage long-term plan
Ensure sustainable access to water and processing of sewage, by defining long-term supply and demand, and tailoring future development in line with sustainable water resources
ObjectivesNumber
2.1.2Increase investment in water and sewage infrastructure and systems to improve their efficiency and reliability and decrease pollution
Improve the infrastructure of the water and sewage systems, so as to maximize their reliability and efficiency and minimize losses and pollution
2.1.2Increase investment in water and sewage infrastructure and systems to improve their efficiency and reliability and decrease pollution
Improve the infrastructure of the water and sewage systems, so as to maximize their reliability and efficiency and minimize losses and pollution
2.1.3 Redefine water and sewage pricing structure
Ensure that the water and sewage pricing is structured in such away that it promotes efficient usage and reduces the financial debts of the authority, while maintaining social justice
2.1.3 Redefine water and sewage pricing structure
Ensure that the water and sewage pricing is structured in such away that it promotes efficient usage and reduces the financial debts of the authority, while maintaining social justice
2.2.1Strengthen the water and sewage regulatory body so that it becomes truly independent
Ensure that the water and sewage systems are operated as efficiently and effectively as possible, by separating the regulatory and operational functions and giving the regulatory body real authority
2.2.1Strengthen the water and sewage regulatory body so that it becomes truly independent
Ensure that the water and sewage systems are operated as efficiently and effectively as possible, by separating the regulatory and operational functions and giving the regulatory body real authority
2.2.2 Open the water and sewage market to competition at all levels
Ensure that the water and sewage systems are operated as efficiently and effectively as possible, by stimulating competition in the various parts of the water and sewage system
2.2.2 Open the water and sewage market to competition at all levels
Ensure that the water and sewage systems are operated as efficiently and effectively as possible, by stimulating competition in the various parts of the water and sewage system
3.1.1 Promote reduced water-usageUse incentives, education and other means to encourage businesses and households to minimize unnecessary use of water, thereby conserving Puerto Rico’s limited water resources
3.1.1 Promote reduced water-usageUse incentives, education and other means to encourage businesses and households to minimize unnecessary use of water, thereby conserving Puerto Rico’s limited water resources
3.2.1Reduce waste generation by reducing usage of materials and maximizing recycling
Use incentives, education and other means to encourage businesses and households to minimize unnecessary use of materials (packaging, etc.) and maximize recycling, thereby minimizing the amount of solid-waste that needs to be processed (in landfills, etc.)
3.2.2 Implement and update the waste management plan
Reduce the negative impact of waste on the environment and the economy, by implementing and continuously updating the long-term waste-management plan
3.2.2 Implement and update the waste management plan
Reduce the negative impact of waste on the environment and the economy, by implementing and continuously updating the long-term waste-management plan
4.1.1Increase investment in electricity infrastructure and systems to improve efficiency and reliability
Improve the infrastructure of the electric power system, so as to maximize its reliability and efficiency and minimize losses and pollution
4.1.1Increase investment in electricity infrastructure and systems to improve efficiency and reliability
Improve the infrastructure of the electric power system, so as to maximize its reliability and efficiency and minimize losses and pollution
4.1.2 Diversify fuel sources for electric power generation
Reduce the cost and risk associated with heavy dependency on oil, by permitting and promoting use of other fuel sources (gas,other fossil fuels, renewable energy sources, etc.)
4.1.2 Diversify fuel sources for electric power generation
Reduce the cost and risk associated with heavy dependency on oil, by permitting and promoting use of other fuel sources (gas,other fossil fuels, renewable energy sources, etc.)
Source Puerto Rico 2025

COMPREHENSIVE ECONOMIC DEVELOPMENT STRATEGY 2005
Puerto Rico Planning Area • Annual Report • CEDS Update • EDA Investment Number: 01-85-08072 81
Strategies
4.1.3 Redefine electricity pricing structureEnsure that electricity pricing is structured is such a way that it promotes efficient generation, distribution and usage and coversreinvestment needs, while maintaining social justice
4.1.3 Redefine electricity pricing structureEnsure that electricity pricing is structured is such a way that it promotes efficient generation, distribution and usage and coversreinvestment needs, while maintaining social justice
ObjectivesNumber
4.2.1Strengthen the electricity regulatory body so that it becomes truly independent
Ensure that the electricity system is operated as efficiently and effectively as possible, by separating the regulatory and operational functions and giving the regulatory body real authority
4.2.1Strengthen the electricity regulatory body so that it becomes truly independent
Ensure that the electricity system is operated as efficiently and effectively as possible, by separating the regulatory and operational functions and giving the regulatory body real authority
4.2.2Open the electric power market to competition in all areas (generation, transmission and distribution)
Ensure that the electricity system is operated as efficiently and effectively as possible, by stimulating competition in the various parts of the generation, transmission and distribution system
5.1.1 Promote reduced energy-usage
Use incentives, education and other means to encourage businesses and households to minimize unnecessary use of energy, thereby reducing the burden on the economy and the environment
5.1.1 Promote reduced energy-usage
Use incentives, education and other means to encourage businesses and households to minimize unnecessary use of energy, thereby reducing the burden on the economy and the environment
5.1.2 Promote cleaner use of fossil fuels for electric power generation
Promote the use of newer technologies and processes that minimize the environmental impact of fossil fuels used in electricity power generation
5.1.2 Promote cleaner use of fossil fuels for electric power generation
Promote the use of newer technologies and processes that minimize the environmental impact of fossil fuels used in electricity power generation
HighLow Doability
High
Low
Dire
ct B
enef
it Sc
ore
(Dire
ct C
ontri
butio
n of
the
stra
tegy
to a
chie
ve th
e V
isio
n)
50%
Result of the Experts’ Evaluation during the Decision Conferences
1005.1.3
5.1.2 5.1.1
4.2.2
4.2.1
4.1.3
4.1.2 4.1.1
3.2.2 3.2.1
3.1.1
2.2.1
2.1.3
2.1.2
2.1.1
5.1.3 Promote the use of renewable sources of energy
Minimize environmental impact and economic costs, by permitting and promoting use of renewable fuel sources (solar, wind, geothermal, hydrogen, etc.)
5.1.3 Promote the use of renewable sources of energy
Minimize environmental impact and economic costs, by permitting and promoting use of renewable fuel sources (solar, wind, geothermal, hydrogen, etc.)
Source Puerto Rico 2025
Source Puerto Rico 2025
UTILITIES - Strategies and their objectives (cont.)
UTILITIES - Direct benefit-doability matrix from the decisionconference
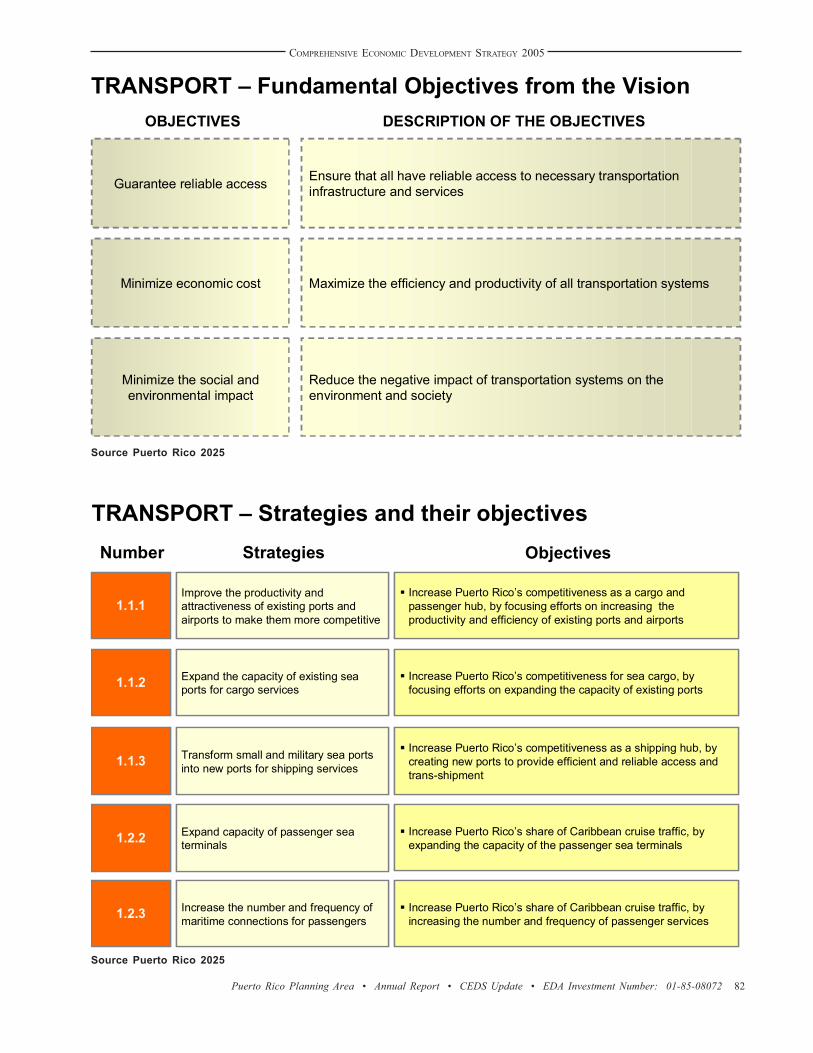
COMPREHENSIVE ECONOMIC DEVELOPMENT STRATEGY 2005
Puerto Rico Planning Area • Annual Report • CEDS Update • EDA Investment Number: 01-85-08072 82
TRANSPORT – Strategies and their objectivesStrategies
1.1.1Improve the productivity and attractiveness of existing ports and airports to make them more competitive
Increase Puerto Rico’s competitiveness as a cargo and passenger hub, by focusing efforts on increasing the productivity and efficiency of existing ports and airports
1.1.1Improve the productivity and attractiveness of existing ports and airports to make them more competitive
Increase Puerto Rico’s competitiveness as a cargo and passenger hub, by focusing efforts on increasing the productivity and efficiency of existing ports and airports
ObjectivesNumber
1.1.2 Expand the capacity of existing sea ports for cargo services
Increase Puerto Rico’s competitiveness for sea cargo, by focusing efforts on expanding the capacity of existing ports1.1.2 Expand the capacity of existing sea
ports for cargo servicesIncrease Puerto Rico’s competitiveness for sea cargo, by focusing efforts on expanding the capacity of existing ports
1.1.3 Transform small and military sea ports into new ports for shipping services
Increase Puerto Rico’s competitiveness as a shipping hub, by creating new ports to provide efficient and reliable access and trans-shipment
1.1.3 Transform small and military sea ports into new ports for shipping services
Increase Puerto Rico’s competitiveness as a shipping hub, by creating new ports to provide efficient and reliable access and trans-shipment
1.2.2 Expand capacity of passenger sea terminals
Increase Puerto Rico’s share of Caribbean cruise traffic, by expanding the capacity of the passenger sea terminals1.2.2 Expand capacity of passenger sea
terminalsIncrease Puerto Rico’s share of Caribbean cruise traffic, by expanding the capacity of the passenger sea terminals
1.2.3 Increase the number and frequency of maritime connections for passengers
Increase Puerto Rico’s share of Caribbean cruise traffic, by increasing the number and frequency of passenger services1.2.3 Increase the number and frequency of
maritime connections for passengersIncrease Puerto Rico’s share of Caribbean cruise traffic, by increasing the number and frequency of passenger services
Source Puerto Rico 2025
Source Puerto Rico 2025
TRANSPORT – Fundamental Objectives from the Vision
Guarantee reliable access Ensure that all have reliable access to necessary transportationinfrastructure and services
Minimize the social and environmental impact
Reduce the negative impact of transportation systems on the environment and society
Minimize economic cost Maximize the efficiency and productivity of all transportation systems
OBJECTIVES DESCRIPTION OF THE OBJECTIVES

COMPREHENSIVE ECONOMIC DEVELOPMENT STRATEGY 2005
Puerto Rico Planning Area • Annual Report • CEDS Update • EDA Investment Number: 01-85-08072 83
TRANSPORT – Strategies and their objectives (cont.)Strategies
2.1.2 Expand capacity of existing air cargo facilities
Increase Puerto Rico’s competitiveness for air cargo, by focusing efforts on expanding the capacity of existing air cargo facilities2.1.2 Expand capacity of existing air cargo
facilitiesIncrease Puerto Rico’s competitiveness for air cargo, by focusing efforts on expanding the capacity of existing air cargo facilities
ObjectivesNumber
2.1.3 Transform small and military airports into new airports for cargo services
Increase Puerto Rico’s competitiveness for air cargo, by creating new cargo airports to provide efficient and reliable access and trans-shipment
2.1.3 Transform small and military airports into new airports for cargo services
Increase Puerto Rico’s competitiveness for air cargo, by creating new cargo airports to provide efficient and reliable access and trans-shipment
2.2.2 Expand capacity of passenger air terminals
Increase Puerto Rico’s competitiveness as a business and tourism location, by expanding the capacity of passenger air terminals
2.2.2 Expand capacity of passenger air terminals
Increase Puerto Rico’s competitiveness as a business and tourism location, by expanding the capacity of passenger air terminals
2.2.3 Increase the number and frequency of air connections for passengers
Increase Puerto Rico’s competitiveness as a business and tourism location, by increasing the number and frequency of flights to and from Puerto Rico
2.2.3 Increase the number and frequency of air connections for passengers
Increase Puerto Rico’s competitiveness as a business and tourism location, by increasing the number and frequency of flights to and from Puerto Rico
3.1.1 Improve the productivity of land freight services
Increase the efficiency and reliability of Puerto Rico’s inland freight services, by focusing on improving the productivity of existing providers and infrastructure
3.1.1 Improve the productivity of land freight services
Increase the efficiency and reliability of Puerto Rico’s inland freight services, by focusing on improving the productivity of existing providers and infrastructure
3.1.2 Invest in new land freight systemsIncrease the efficiency and reliability of Puerto Rico’s inland freight services, by building new land freight systems (e.g. freight rail systems)
3.1.2 Invest in new land freight systemsIncrease the efficiency and reliability of Puerto Rico’s inland freight services, by building new land freight systems (e.g. freight rail systems)
3.2.1Complete the highway and road network to ensure the connectivity of the transportation system
Ensure that residents, businesses and visitors throughout the island have efficient and safe access to services and opportunities, by completing the highway and road network
3.2.1Complete the highway and road network to ensure the connectivity of the transportation system
Ensure that residents, businesses and visitors throughout the island have efficient and safe access to services and opportunities, by completing the highway and road network
3.2.2 Increase the efficiency and capacity of existing roads
Provide efficient and reliable access and mobility for passengers and cargo throughout Puerto Rico by upgrading and improving the road network
3.2.2 Increase the efficiency and capacity of existing roads
Provide efficient and reliable access and mobility for passengers and cargo throughout Puerto Rico by upgrading and improving the road network
3.2.3 Create and promote efficient and reliable collective transportation
Provide efficient and reliable access and mobility for passengers throughout Puerto Rico by creating and promoting more extensive collective transportation
3.2.3 Create and promote efficient and reliable collective transportation
Provide efficient and reliable access and mobility for passengers throughout Puerto Rico by creating and promoting more extensive collective transportation
3.2.4 Ensure that the land use plan reduces the need for transportation
Promote the utilization of mixed land use to reduce the need fortransportation and make non-motorized modes more attractive and practical
3.2.4 Ensure that the land use plan reduces the need for transportation
Promote the utilization of mixed land use to reduce the need fortransportation and make non-motorized modes more attractive and practical
Source Puerto Rico 2025

COMPREHENSIVE ECONOMIC DEVELOPMENT STRATEGY 2005
Puerto Rico Planning Area • Annual Report • CEDS Update • EDA Investment Number: 01-85-08072 84
TRANSPORT – Strategies and their objectives (cont.)Strategies
3.3.1 Encourage reduction in car use
Use incentives, education and other means to encourage businesses and households to minimize unnecessary use of vehicles, thereby reducing congestion, and negative economic and environmental impacts
3.3.1 Encourage reduction in car use
Use incentives, education and other means to encourage businesses and households to minimize unnecessary use of vehicles, thereby reducing congestion, and negative economic and environmental impacts
ObjectivesNumber
3.3.2 Promote clean fuels and advanced technology for transportation
Use incentives, education and other means to encourage businesses and households to minimize environmental impact by using cleaner transport fuels and technologies
3.3.2 Promote clean fuels and advanced technology for transportation
Use incentives, education and other means to encourage businesses and households to minimize environmental impact by using cleaner transport fuels and technologies
3.4.2Create new mechanisms to incorporate the community in transportation planning and communication process
Improve public involvement by communities in transportation planning in order to ensure social acceptance3.4.2
Create new mechanisms to incorporate the community in transportation planning and communication process
Improve public involvement by communities in transportation planning in order to ensure social acceptance
HighLow Doability
High
Low
Dire
ct B
enef
it Sc
ore
(Dire
ct C
ontri
butio
n of
the
stra
tegy
to a
chie
ve th
e V
isio
n)
50%
Result of the Experts’ Evaluation during the Decision Conferences
1003.4.2
3.3.2
3.3.1
3.2.43.2.3
3.2.2 3.2.1
3.1.2
3.1.1
2.2.3
2.2.2
2.2.1
2.1.3
2.1.2
2.1.1
1.2.31.2.2
1.2.1
1.1.3
1.1.2
1.1.1
Source Puerto Rico 2025
Source Puerto Rico 2025
TRANSPORT - Direct benefit-doability matrix from the decision conference

COMPREHENSIVE ECONOMIC DEVELOPMENT STRATEGY 2005
Puerto Rico Planning Area • Annual Report • CEDS Update • EDA Investment Number: 01-85-08072 85
LAND USE/ENVIRONMENT – Strategies and their objectivesStrategies
1.1.1Create and enact an island-wide Land-Use master plan clearly defining the intended use of all land areas
Increase the efficiency of the permitting process and reduce thenegative impact of poorly-planned development, by creating and enacting an island-wide coordinated land-use plan that has the force of law
ObjectivesNumber
1.1.2Restructure the functions of government agencies to carry out the land-use planning and permitting process
Increase the effectiveness and efficiency of the agencies responsible for land-use planning and permitting (JP, ARPE, municipalities, etc.), by restructuring their responsibilities and processes, where appropriate
1.1.3 Restructure the adjudication, permitting and approval process
Increase the speed of the permitting process and reduce the number of exceptions, by restructuring the adjudication and approval process, where necessary
1.1.3 Restructure the adjudication, permitting and approval process
Increase the speed of the permitting process and reduce the number of exceptions, by restructuring the adjudication and approval process, where necessary
1.2.1Improve mechanisms for community participation in the land-use planning and permitting process
Improve public involvement by communities in the land-use planning and permitting process in order to ensure greater understanding, acceptance and compliance
1.2.1Improve mechanisms for community participation in the land-use planning and permitting process
Improve public involvement by communities in the land-use planning and permitting process in order to ensure greater understanding, acceptance and compliance
1.2.2Communicate the land-use master plan and the permitting process to the community
Inform the community about the land use plan and permitting processes in order to ensure greater understanding and compliance
1.2.2Communicate the land-use master plan and the permitting process to the community
Inform the community about the land use plan and permitting processes in order to ensure greater understanding and compliance
Source Puerto Rico 2025
Source Puerto Rico 2025
LAND USE AND ENVIRONMENT – Fundamental Objectives from the Vision
Guarantee protection of the environment Improve protection of land, air and water resources
Improve social quality Support improvement in social quality of life by providing a safer and more healthy environment
Facilitate economic development Support economic development
OBJECTIVES DESCRIPTION OF THE OBJECTIVES

COMPREHENSIVE ECONOMIC DEVELOPMENT STRATEGY 2005
Puerto Rico Planning Area • Annual Report • CEDS Update • EDA Investment Number: 01-85-08072 86
LAND USE/ENVIRONMENT – Strategies and their objectives (Cont.)
Strategies
1.1.1Create and enact an island-wide Land-Use master plan clearly defining the intended use of all land areas
Increase the efficiency of the permitting process and reduce thenegative impact of poorly-planned development, by creating and enacting an island-wide coordinated land-use plan that has the force of law
ObjectivesNumber
1.1.2Restructure the functions of government agencies to carry out the land-use planning and permitting process
Increase the effectiveness and efficiency of the agencies responsible for land-use planning and permitting (JP, ARPE, municipalities, etc.), by restructuring their responsibilities and processes, where appropriate
1.1.2Restructure the functions of government agencies to carry out the land-use planning and permitting process
Increase the effectiveness and efficiency of the agencies responsible for land-use planning and permitting (JP, ARPE, municipalities, etc.), by restructuring their responsibilities and processes, where appropriate
1.1.3 Restructure the adjudication, permitting and approval process
Increase the speed of the permitting process and reduce the number of exceptions, by restructuring the adjudication and approval process, where necessary
1.1.3 Restructure the adjudication, permitting and approval process
Increase the speed of the permitting process and reduce the number of exceptions, by restructuring the adjudication and approval process, where necessary
1.2.1Improve mechanisms for community participation in the land-use planning and permitting process
Improve public involvement by communities in the land-use planning and permitting process in order to ensure greater understanding, acceptance and compliance
1.2.1Improve mechanisms for community participation in the land-use planning and permitting process
Improve public involvement by communities in the land-use planning and permitting process in order to ensure greater understanding, acceptance and compliance
1.3.1 Strengthen land-use enforcement mechanisms
Increase enforcement activities and take visible action against infractions, to increase compliance with land use plans1.3.1 Strengthen land-use enforcement
mechanisms Increase enforcement activities and take visible action against infractions, to increase compliance with land use plans
1.3.2Strengthen funding mechanisms to purchase property and/or compensate owners impacted by land-use enforcements
Ensure that the financial resources are available to compensate owners negatively impacted by land-use requirements1.3.2
Strengthen funding mechanisms to purchase property and/or compensate owners impacted by land-use enforcements
Ensure that the financial resources are available to compensate owners negatively impacted by land-use requirements
2.1.1Strengthen or modify current environmental laws, and explore new regulation schemes to ensure environmental conservation
Undertake regular review and updating of all environmental regulations, to ensure that the environment is being protected, while not unnecessarily constraining development
2.1.1Strengthen or modify current environmental laws, and explore new regulation schemes to ensure environmental conservation
Undertake regular review and updating of all environmental regulations, to ensure that the environment is being protected, while not unnecessarily constraining development
2.1.3 Redefine and ensure compliance with environmental agencies’ processes
Undertake regular review and updating of environmental agencies and processes, to ensure that environmental regulation is being implemented as efficiently as possible
2.1.3 Redefine and ensure compliance with environmental agencies’ processes
Undertake regular review and updating of environmental agencies and processes, to ensure that environmental regulation is being implemented as efficiently as possible
2.1.4Establish environmental market based systems to encourage self-administration by businesses and households
Where appropriate, establish market-based systems (e.g. credits for lower usage, penalties for higher usage of resources) to encourage self-administration by businesses and households
2.1.4Establish environmental market based systems to encourage self-administration by businesses and households
Where appropriate, establish market-based systems (e.g. credits for lower usage, penalties for higher usage of resources) to encourage self-administration by businesses and households
2.2.1Expand the environmental quality concept and make it applicable to physical infrastructure
Use incentives, education and other means to encourage businesses and households to incorporate environmental considerations into all buildings and other infrastructure
2.2.1Expand the environmental quality concept and make it applicable to physical infrastructure
Use incentives, education and other means to encourage businesses and households to incorporate environmental considerations into all buildings and other infrastructure
Source Puerto Rico 2025

COMPREHENSIVE ECONOMIC DEVELOPMENT STRATEGY 2005
Puerto Rico Planning Area • Annual Report • CEDS Update • EDA Investment Number: 01-85-08072 87
LAND USE/ENVIRONMENT – Strategies and their objectives (Cont.)
Strategies ObjectivesNumber
3.1.1Invest in education to foster consciousness of environmental responsibility
Promote broad-based environmental conservation, by focusing on education and community awareness campaigns3.1.1
Invest in education to foster consciousness of environmental responsibility
Promote broad-based environmental conservation, by focusing on education and community awareness campaigns
3.1.2Promote environmental consciousness among individuals through regulation and incentives
Promote broad-based environmental conservation, by focusing on regulations and incentives to change individual behavior3.1.2
Promote environmental consciousness among individuals through regulation and incentives
Promote broad-based environmental conservation, by focusing on regulations and incentives to change individual behavior
3.1.3 Define community compliance goals for environment safekeeping
Promote broad-based environmental conservation, by focusing on measurement systems, whereby the environmental impact of each household and neighborhood is tracked and reported
3.1.3 Define community compliance goals for environment safekeeping
Promote broad-based environmental conservation, by focusing on measurement systems, whereby the environmental impact of each household and neighborhood is tracked and reported
LAND USE AND ENVIRONMENT – Direct benefit-doability matrix from the decision conference
HighLow Doability
High
Low
Dire
ct B
enef
it Sc
ore
(Dire
ct C
ontri
butio
n of
the
stra
tegy
to a
chie
ve th
e V
isio
n)
50%
Result of the Experts’ Evaluation during the Decision Conferences
100
1.1.1
1.1.2
1.1.3
1.2.1
1.2.2
1.3.1
1.3.22.1.1
2.1.3
2.1.4
2.2.13.1.1
3.1.2
3.1.3
Source Puerto Rico 2025
Source Puerto Rico 2025

COMPREHENSIVE ECONOMIC DEVELOPMENT STRATEGY 2005
Puerto Rico Planning Area • Annual Report • CEDS Update • EDA Investment Number: 01-85-08072 88
COMPETITIVENESS – Fundamental Objectives from the Vision
Maximize productivity and competitiveness
Ensure that across all industries, the Puerto Rican economy has high levels of productivity and is internationally competitive
Maximize the quality of life and attractiveness as a
location to liveEstablish Puerto Rico as an attractive location in which to live
Maximize global integration Increase Puerto Rico’s connectivity to the world so as to facilitate exports, investment and knowledge transfer
OBJECTIVES DESCRIPTION OF THE OBJECTIVES
COMPETITIVENESS – Strategies and their objectivesStrategies
1.1.1Reduce the total effective cost of human resources in Puerto Rico
ObjectivesNumber
1.1.2
1.1.3
1.1.4
1.1.5
Increase the productivity of local human capital through training and skills programs
Increase the productivity of local human capital through increasing use of technology
Institute programs to attract more global talent to Puerto Rico
Deepen linkages between Puerto Rico’s people and the world
Increase Puerto Rico’s competitiveness as a place to do businessby increasing the use of productivity-enhancing technology in all segments of the economy: manufacturing, services, logistics, transport, government, education, health, etc.
Increase Puerto Rico’s competitiveness as a place to do businessby increasing the output-productivity of local workers through training, skills improvement and education programs
Increase Puerto Rico’s competitiveness and connectivity to the world by attracting more international talent to work in Puerto Rico: entrepreneurs, investors, knowledge-workers, researchers, professors, students, etc.
Increase the competitiveness and connectivity of Puerto Rico’s workforce by increasing their exposure to international best practices – through study-abroad, internships/exchanges, training programs, etc.
Increase Puerto Rico’s competitiveness as a place to do businessby decreasing the total effective cost of labor (focusing on areas like benefits, workers comp, work-days, employment taxes, etc.)
Source Puerto Rico 2025
Source Puerto Rico 2025
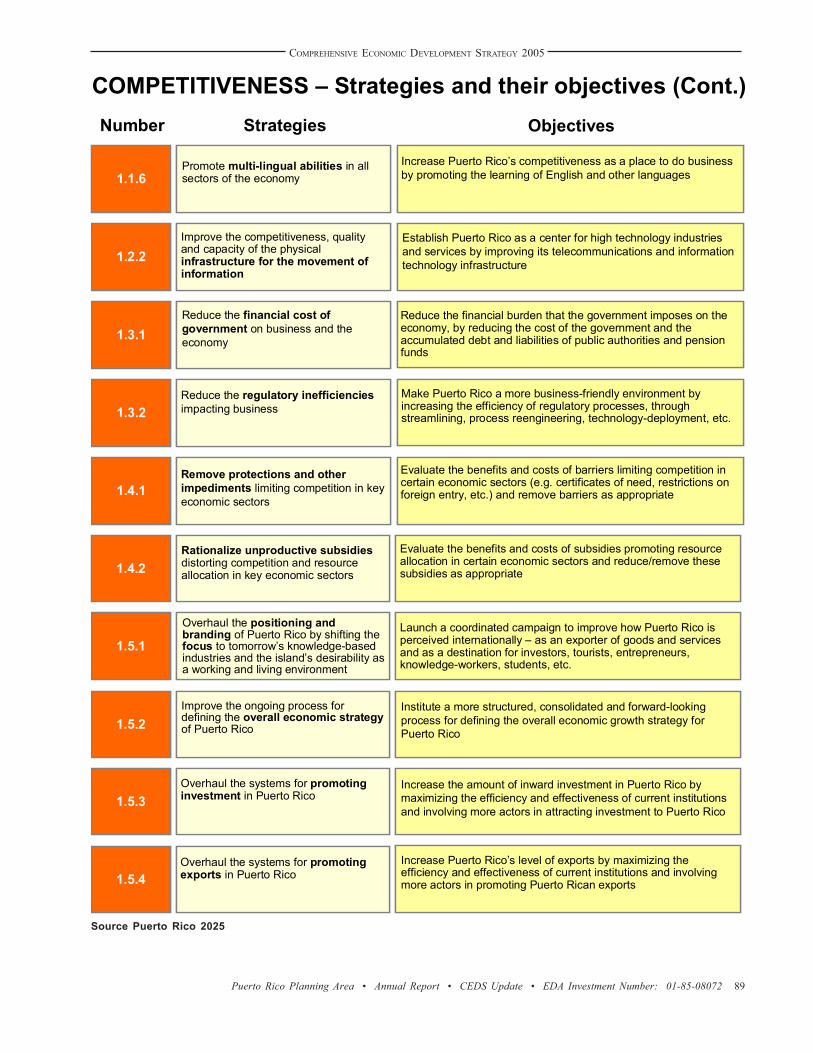
COMPREHENSIVE ECONOMIC DEVELOPMENT STRATEGY 2005
Puerto Rico Planning Area • Annual Report • CEDS Update • EDA Investment Number: 01-85-08072 89
1.2.21.2.2
COMPETITIVENESS – Strategies and their objectives (Cont.)Strategies
1.1.6Promote multi-lingual abilities in all sectors of the economy1.1.6Promote multi-lingual abilities in all sectors of the economy
ObjectivesNumber
Improve the competitiveness, quality and capacity of the physical infrastructure for the movement of information
Establish Puerto Rico as a center for high technology industriesand services by improving its telecommunications and informationtechnology infrastructure
Increase Puerto Rico’s competitiveness as a place to do businessby promoting the learning of English and other languages
1.3.1Reduce the financial cost of government on business and the economy1.3.1Reduce the financial cost of government on business and the economy
1.3.21.3.2
1.4.11.4.1
Reduce the regulatory inefficiencies impacting business
Remove protections and other impediments limiting competition in key economic sectors
Make Puerto Rico a more business-friendly environment by increasing the efficiency of regulatory processes, through streamlining, process reengineering, technology-deployment, etc.
Evaluate the benefits and costs of barriers limiting competition in certain economic sectors (e.g. certificates of need, restrictions on foreign entry, etc.) and remove barriers as appropriate
Reduce the financial burden that the government imposes on the economy, by reducing the cost of the government and the accumulated debt and liabilities of public authorities and pension funds
1.4.21.4.2
1.5.11.5.1
Rationalize unproductive subsidiesdistorting competition and resource allocation in key economic sectors
Overhaul the positioning and branding of Puerto Rico by shifting the focus to tomorrow’s knowledge-based industries and the island’s desirability as a working and living environment
Launch a coordinated campaign to improve how Puerto Rico is perceived internationally – as an exporter of goods and services and as a destination for investors, tourists, entrepreneurs, knowledge-workers, students, etc.
Evaluate the benefits and costs of subsidies promoting resource allocation in certain economic sectors and reduce/remove these subsidies as appropriate
1.5.2Improve the ongoing process for defining the overall economic strategyof Puerto Rico1.5.2Improve the ongoing process for defining the overall economic strategyof Puerto Rico
1.5.31.5.3
1.5.41.5.4
Overhaul the systems for promoting investment in Puerto Rico
Overhaul the systems for promoting exports in Puerto Rico
Increase the amount of inward investment in Puerto Rico by maximizing the efficiency and effectiveness of current institutions and involving more actors in attracting investment to Puerto Rico
Increase Puerto Rico’s level of exports by maximizing the efficiency and effectiveness of current institutions and involving more actors in promoting Puerto Rican exports
Institute a more structured, consolidated and forward-looking process for defining the overall economic growth strategy for Puerto Rico
Source Puerto Rico 2025

COMPREHENSIVE ECONOMIC DEVELOPMENT STRATEGY 2005
Puerto Rico Planning Area • Annual Report • CEDS Update • EDA Investment Number: 01-85-08072 90
COMPETITIVENESS – Direct benefit-doability matrix from the decision conference
HighLow Doability
High
Low
Dire
ct B
enef
it Sc
ore
(Dire
ct C
ontri
butio
n of
the
stra
tegy
to a
chie
ve th
e V
isio
n)
50%
Result of the Experts’ Evaluation during the Decision Conferences
100
1.5.4
1.5.31.5.2
1.5.1
1.4.2
1.4.1
1.3.2
1.3.1
1.2.2
1.1.6
1.1.5
1.1.4
1.1.3
1.1.2
1.1.1
Source Puerto Rico 2025

COMPREHENSIVE ECONOMIC DEVELOPMENT STRATEGY 2005
Puerto Rico Planning Area • Annual Report • CEDS Update • EDA Investment Number: 01-85-08072 91
OPPORTUNITIES AND INCOME – Fundamental Objectives from the Vision
Improve income levels for all Improve income levels for all
Maximize social equity Ensure more equitable access for all to opportunities to grow their incomes and wealth
Maximize economic opportunities for all
Create opportunities for all, particularly for people of low resources, to increase their standard of living
OBJECTIVES DESCRIPTION OF THE OBJECTIVES
OPPORTUNITIES/INCOME – Strategies and their objectivesStrategies
1.1.1 Use direct government funding to stimulate employment creation1.1.1 Use direct government funding to stimulate employment creation
ObjectivesNumber
1.1.21.1.2
1.1.31.1.3
1.1.41.1.4
1.1.51.1.5
Optimize the distribution of jobs in the public sector
Provide public funding and other incentives for job creation in the private sector
Diminish regulations in order to stimulate job creation
Provide support to small and medium enterprises, community businesses and cooperatives to create more job opportunities
Use government funds to finance targeted projects to help with job creation
Review and rationalize public sector employment both geographically and across agencies to optimize equitable job opportunities
Give incentives to the private sector to create job opportunities across the island, especially in high unemployment areas
Review hiring and other regulations to allow for increased flexibility in the labor market
Help foster small and medium enterprises and cooperatives in Puerto Rico to increase the number of job opportunities they provide
Source Puerto Rico 2025
Source Puerto Rico 2025

COMPREHENSIVE ECONOMIC DEVELOPMENT STRATEGY 2005
Puerto Rico Planning Area • Annual Report • CEDS Update • EDA Investment Number: 01-85-08072 92
OPPORTUNITIES/INCOME – Strategies and their objectives (Cont.)
Strategies
1.1.6Provide support and incentives to non-profit organizations to create more job opportunities
1.1.6Provide support and incentives to non-profit organizations to create more job opportunities
ObjectivesNumber
1.2.11.2.1
1.2.21.2.2
1.2.31.2.3
1.3.11.3.1
Provide the population with the education, training and skills required to compete in the labor market
Provide direct assistance in job search and job placement
Provide physical infrastructure which facilitates access to jobs
Reform social-assistance programsto encourage gainful employment
Help foster non-profit organizations to increase job opportunities across Puerto Rico
Improve the skills and knowledge base of especially the disadvantaged population to make them more competitive in the market place
Organize public and private forces to provide assistance and mentoring to those that are trying to enter the labor force
Put into place the physical infrastructure, (e.g. transportation, child care facilities, etc.) that will make it easier for individuals to seek employment outside their homes
Reform the existing social assistance programs to make gainful employment more attractive than being on social assistance
1.3.2Use direct government funds to increase the incentives for seeking employment
1.3.2Use direct government funds to increase the incentives for seeking employment
1.3.31.3.3
1.3.41.3.4
1.4.11.4.1
1.4.21.4.2
Improve compensation packages to make it more attractive to work
Ensure that self-sufficiency and individual and community responsibility are priorities for all Puerto Ricans
Raise participation of poor and marginalized populations in formal financial networks
Encourage saving and asset buildingamong poor and marginalized people
Provide monetary and other incentives to make it more attractiveto work than to receive social assistance
Find ways to make employment more attractive, by adjusting compensation packages and increasing the softer benefits –training, community-building, etc.
Instill in the population of the island a sense of pride and self-reliance
Help optimize personal wealth of poor and marginalized people byenabling them to accumulate assets
Help bring the marginalized into the formal economy and alleviate poverty by encouraging greater use of banks and financial institutions
Source Puerto Rico 2025

COMPREHENSIVE ECONOMIC DEVELOPMENT STRATEGY 2005
Puerto Rico Planning Area • Annual Report • CEDS Update • EDA Investment Number: 01-85-08072 93
OPPORTUNITIES AND INCOME – Direct benefit-doability matrix from the decision conference
HighLow Doability
High
Low
Dire
ct B
enef
it Sc
ore
(Dire
ct C
ontri
butio
n of
the
stra
tegy
to a
chie
ve th
e V
isio
n)
50%
Result of the Experts’ Evaluation during the Decision Conferences
100 1.4.2
1.4.1
1.3.4
1.3.3
1.3.2
1.3.1
1.2.3 1.2.2
1.2.1
1.1.6
1.1.5
1.1.4
1.1.3
1.1.21.1.1
Source Puerto Rico 2025

COMPREHENSIVE ECONOMIC DEVELOPMENT STRATEGY 2005
Puerto Rico Planning Area • Annual Report • CEDS Update • EDA Investment Number: 01-85-08072 94
INNOVATION – Fundamental Objectives from the Vision
Maximize R&D in Puerto Rico
Increase the quantity and scope of research and development conducted in Puerto Rico
Maximize Enterprise Start-up and Growth
Establish an environment in which local enterprises can foster and grow
Maximize Commercialization Promote innovation by ensuring that the R&D coming out of the public, private sectors and the universities is commercialized properly
OBJECTIVES DESCRIPTION OF THE OBJECTIVES
INNOVATION – Strategies and their objectivesStrategies
1.1.1
Define and implement a Puerto Rico innovation agenda to guide prioritization and policy making across government, private sector and academia
Establish appropriate island-wide coordinating mechanisms between government, private sector and academia, to identify high potential R&D areas, guide policy decisions promoting R&D, and leverage expertise and resources across sectors and projects
ObjectivesNumber
1.2.1 Create government research centersto pursue high-priority research needs
Where appropriate, mobilize local and/or US government funding to create government research centers focused on high-priority R&D areas (e.g. like federal R&D labs in the US)
1.2.2Enhance direct government fundingfor independent R&D centers and initiatives
Significantly increase the “science and technology fund” to provide direct government funding for private sector and university R&D initiatives in Puerto Rico
1.2.3 Increase government indirect support and incentives for private R&D
Increase the use of tax-incentives and other government support (subsidies, infrastructure, training etc.) to stimulate more private sector and university R&D in Puerto Rico
1.3.1Reform University budget and incentive structure to promote R&Dand technology transfer
Reform incentive systems at Puerto Rico’s universities (compensation, promotion, tenure, budget-allocation, etc.) to encourage more professors and students to engage in research and innovation
Source Puerto Rico 2025
Source Puerto Rico 2025

COMPREHENSIVE ECONOMIC DEVELOPMENT STRATEGY 2005
Puerto Rico Planning Area • Annual Report • CEDS Update • EDA Investment Number: 01-85-08072 95
INNOVATION – Strategies and their objectives (cont.)Strategies
1.3.2Increase funding for laboratories, research centers and other R&D infrastructure at universities
Attract more corporations and researchers to conduct R&D at Puerto Rico’s universities, by increasing/reallocating the funding available for physical infrastructure for R&D
ObjectivesNumber
1.3.4 Attract more global talent to conduct R&D at universities
Attract more international researchers to conduct research at Puerto Rico’s universities, by making more funding available and changing processes and attitudes towards hiring foreigners
1.3.5 Attract more federal and international research projects to universities
Launch a coordinated campaign, bringing together a number of existing initiatives, to significantly increase the amount of outside R&D investment attracted to Puerto Rico
1.4.1Create, revise or expand financial and other incentives for private sector R&D activities
Increase the use of tax-incentives and other government support (subsidies, infrastructure, training etc.) to stimulate more private sector R&D in Puerto Rico
1.4.2Fund major scientific infrastructure projects needed to attract more private sector R&D
Evaluate and invest as necessary in the physical infrastructure (e.g. broadband networks, laboratories, etc.) required to attract and foster increased corporate R&D in Puerto Rico
1.5.1Upgrade quality of investigators and other human capital available for R&D in Puerto Rico
Identify the specific skills required to become a leading R&D center and expand programs to develop human resources with these skills
2.1.1Make government procurement process more favorable to local small and medium enterprises
Evaluate all government procurement programs to ensure that they give local entrepreneurs fair opportunities to compete and grow their businesses
2.1.2Reduce the tax burden and other financial costs that government imposes on small and medium enterprises
Review all taxes and financial costs imposed by the government on SMEs, to identify areas where the financial cost could be reduced, thereby stimulating growth and employment-generation
2.1.3Limit the burden of regulations and inefficiencies on small and medium enterprises
Review all regulatory and process burdens imposed by the government on SMEs, to identify areas where these burdens could be reduced, thereby stimulating growth and employment-generation
Source Puerto Rico 2025

COMPREHENSIVE ECONOMIC DEVELOPMENT STRATEGY 2005
Puerto Rico Planning Area • Annual Report • CEDS Update • EDA Investment Number: 01-85-08072 96
INNOVATION – Strategies and their objectives (Cont.)Strategies
2.1.4Improve the effectiveness of existingentities designed to promote the growth and formation of small and medium enterprises
Undertake a comprehensive review of the various entities and programs designed to help entrepreneurs (SBDCs, community business centers, etc.) to ensure their effectiveness and coordination
ObjectivesNumber
2.2.1Promote deeper linkages between foreign owned multinational firms and locally owned suppliers
Deploy incentives and other tools to promote more linkages between foreign investors and local companies – e.g. more subcontracting to local suppliers, mentoring programs, technology-transfer,etc.
2.2.2 Develop a more entrepreneurial environment within large firms
Establish mechanisms (competitions, rewards, etc.) to encourage large foreign and local firms to promote intrapreneurship among their employees
2.3.1Expand the availability and effectiveness of private equity funding for start-up businesses and small and medium enterprises
Continue to promote the development of the venture capital and angel sector in Puerto Rico, so as to increase availability of private equity funding for start-up and growth businesses
2.3.2Enhance debt financing options available to small and medium enterprises
Continue to innovate and promote the financing options available to SMEs from banks and other debt-financing institutions
2.3.3 Enhance use of public equity fundingfor local enterprises
Explore ways to promote the use of public equity funding and encourage more Puerto Rican companies to go public
2.3.4Assist small and medium enterprisesin accessing special federal funds and other external funding sources
Augment the various initiatives designed to help local companiesaccess SBA and other international funding sources for small andmedium enterprises
2.4.1Improve teaching of entrepreneurial and business skills in the education system
Review curricula at all stages of the education system, to ensure sufficient emphasis is being given to development of entrepreneurial and management skills
2.4.2 Cultivate a widely held entrepreneurial culture in Puerto Rico
Launch an island-wide communication campaign to promote the virtues of entrepreneurship at all levels of society
2.4.3Enhance entrepreneurial "networks"to help small and medium enterprises get organized and leverage capabilities mutually
Encourage the establishment of entrepreneur support networks and associations to enable knowledge-sharing and resource-sharing between small and medium enterprises
Source Puerto Rico 2025

COMPREHENSIVE ECONOMIC DEVELOPMENT STRATEGY 2005
Puerto Rico Planning Area • Annual Report • CEDS Update • EDA Investment Number: 01-85-08072 97
INNOVATION – Direct benefit-doability matrix from the decision conference
HighLow Doability
High
Low
Dire
ct B
enef
it Sc
ore
(Dire
ct C
ontri
butio
n of
the
stra
tegy
to a
chie
ve th
e V
isio
n)
50%
Result of the Experts’ Evaluation during the Decision Conferences
100
1.1.1
1.2.1
1.2.2 1.2.3
1.3.1
1.3.2
1.3.4 1.3.5
1.4.1
1.4.2
1.5.1
2.1.1
2.1.2
2.1.3
2.1.4
2.2.1 2.2.2 2.3.1
2.3.2 2.3.3
2.3.4
2.4.1
2.4.2
2.4.3
Source Puerto Rico 2025

COMPREHENSIVE ECONOMIC DEVELOPMENT STRATEGY 2005
Puerto Rico Planning Area • Annual Report • CEDS Update • EDA Investment Number: 01-85-08072 98
Strategies in the Productivity and Competitiveness area have been prioritized as follows
Productivity and Competitiveness
Increase competitiveness
Improve planning & promotion
Productivity of human capital
Competitiveness of infrastructure
Productivity of government
Sector-specific constraints on
competitiveness
Reduce cost & size of government
Reduce regulatory inefficiencies
Reduce unproductive subsidiesRemove protections in key sectors
Increase training and skills programs
Increase technology usage
Increase exposure to global best practices
Attract more global talent to PR
Improve economic strategy devt. process
Overhaul investment promotion system
Overhaul export promotion system
Overhaul branding/ positioning of PR
Improve IT & telecom infrastructure
Improve passenger transportation*
Improve freight transportation*
Improve utilities*
Promote multi-lingual abilities
Reduce total effective labor costs
Immediate Strategies Short-term Strategies Medium-term Strategies Long-term Strategies
*Strategies addressed by Transport and Utilities panels
Source Puerto Rico 2025
Strategies in the Opportunity and Income area have been prioritized as follows
Opportunity and Income
Increase ability to access
opportunities
Increase incentives to access
opportunitiesImprove financial
security
Immediate Strategies Short-term Strategies Medium-term Strategies Long-term Strategies
Increase employment opportunities
Increase participation in formal financial networks
Improve education & training for labor market
Increase job search and placement support
Encourage saving and asset building
Reform welfare programs to incent employment
Use government funds to increase incentives for work (e.g. EITC)
Adjust compensation to increase incentives for work
Provide incentives for job-creation by private sector
Provide support/ incentives for job-creation by SMEs/ cooperatives
Use direct government funding to stimulate job creation
Provide support/ incentives for job-creation by non-profit sector
Public campaigns to promote self-sufficiency
Provide physical support in keeping jobs
Optimize distribution of jobs in public sector
Reduce labor regulations to stimulate job creation
Source Puerto Rico 2025
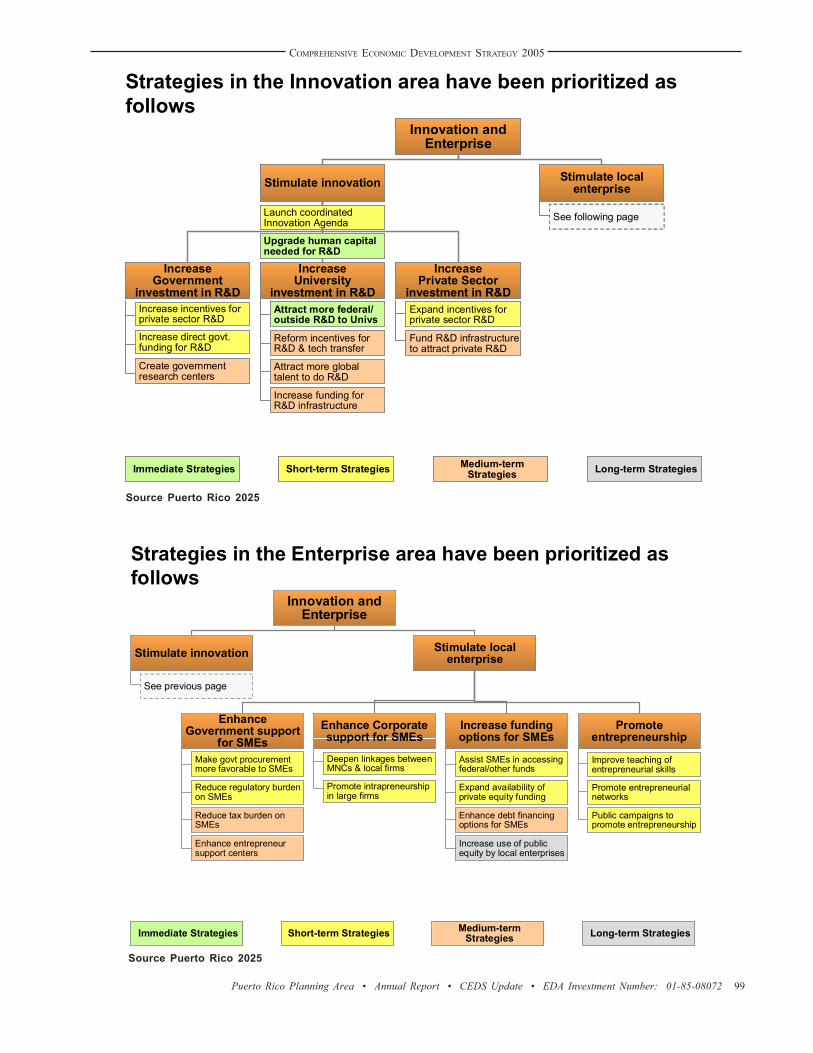
COMPREHENSIVE ECONOMIC DEVELOPMENT STRATEGY 2005
Puerto Rico Planning Area • Annual Report • CEDS Update • EDA Investment Number: 01-85-08072 99
Strategies in the Innovation area have been prioritized as follows
Innovation and Enterprise
Stimulate innovation Stimulate local enterprise
Increase Government
investment in R&D
Increase University
investment in R&D
Increase Private Sector
investment in R&DExpand incentives for private sector R&D
Fund R&D infrastructure to attract private R&D
Increase incentives for private sector R&D
Increase direct govt. funding for R&D
Create government research centers
Attract more federal/ outside R&D to Univs
Reform incentives for R&D & tech transfer
Attract more global talent to do R&D
Increase funding for R&D infrastructure
Immediate Strategies Short-term Strategies Medium-term Strategies Long-term Strategies
See following pageLaunch coordinated Innovation Agenda
Upgrade human capital needed for R&D
Strategies in the Enterprise area have been prioritized as follows
Innovation and Enterprise
Stimulate local enterpriseStimulate innovation
Enhance Corporate support for SMEs
Increase funding options for SMEs
Promote entrepreneurship
Public campaigns to promote entrepreneurship
Promote entrepreneurial networks
Deepen linkages between MNCs & local firms
Promote intrapreneurshipin large firms
Assist SMEs in accessing federal/other funds
Expand availability of private equity funding
Enhance debt financing options for SMEs
Increase use of public equity by local enterprises
Immediate Strategies Short-term Strategies Medium-term Strategies Long-term Strategies
See previous page
Enhance Government support
for SMEsMake govt procurement more favorable to SMEs
Reduce regulatory burden on SMEs
Reduce tax burden on SMEs
Enhance entrepreneur support centers
Improve teaching of entrepreneurial skills
Source Puerto Rico 2025
Source Puerto Rico 2025

COMPREHENSIVE ECONOMIC DEVELOPMENT STRATEGY 2005
Puerto Rico Planning Area • Annual Report • CEDS Update • EDA Investment Number: 01-85-08072 100
Educación
Desarrollar un sistema educativo de alta calidad
Garantizar un sistema educativo eficiente y efectivo
Garantizar el acceso a la educación para todos
Strategies in the Education area have been prioritized as follows
Ver página siguienteVer página siguiente
Promover valores éticos y cívicos
Desarrollar el capital social necesario
Desarrollar I&D en universidades e
industria
Estrategias inmediatas
Estrategias a corto plazo
Estrategias a medio plazo
Estrategias a largo plazo
Optimización de tasas de retención y graduación
Optimización de resultados académicos y búsqueda de la excelencia
Desarrollo de las artes y la cultura
Contenido ético y cívico en los currículos
Seguridad en escuelas
Participación de la comunidad en la educación
Desarrollo de I&D junto a la industria
Desarrollo de I&D en las universidades
Educación
Desarrollar un sistema educativo de alta calidad
Garantizar un sistema educativo eficiente y efectivo
Garantizar el acceso a la educación para todos
Ver página anterior
Estrategias inmediatas
Estrategias a corto plazo
Estrategias a medio plazo
Estrategias a largo plazo
Proveer igualdad de oportunidades a todos
Proveer un sistema educativo inclusivo
Tener un sistema educativo ágil y flexible
Hacer el mejor uso posible de los recursos
Alcanzar la educación primaria universal
Viabilización de la enseñanza primaria y secundaria
Viabilización de la enseñanza postsecundaria
Educación de grupos desfavorecidos
Educación de adultos
Educación de los discapacitados
Incentivar y evaluar la eficiencia e integración del sistema
Garantizar la viabilidad financiera del sistema público y privado
Informatización del sistema educativo
Garantizar la calidad total en la operación del sistema
Source Puerto Rico 2025
Source Puerto Rico 2025

COMPREHENSIVE ECONOMIC DEVELOPMENT STRATEGY 2005
Puerto Rico Planning Area • Annual Report • CEDS Update • EDA Investment Number: 01-85-08072 101
Salud
Sistema enfocado hacia la prevención y la protección
Garantizar la viabilidad financiera a largo plazo del
sistema de saludSistema que sea un modelo
de calidad y eficiencia
Análisis y difusión de datos de salud (perfil, conductas)
Promover estilos de vida saludable
Efectividad en sanidad ambiental y segur. aliment.
Prevención como parte del cuidado médico rutinario
Medidas específicas por
problema y grupo
Estrategias inmediatas
Estrategias a corto plazo
Estrategias a medio plazo
Estrategias a largo plazo
Ver página siguienteVer página siguiente
Analizar y diseminar el perfil epidemiológico y hábitos de la población
Promoción de estilos de vida saludable
Garantizar la seguridad alimentaria y fortalecer sistemas de vigilancia
Reducción de riesgos medioambientales
Educación de los discapacitados
Prevención en grupos específicos de población
Medidas específicas para los principales problemas de salud
Strategies in the Health area have been prioritized as follows
Salud
Sistema enfocado hacia la prevención y la protección
Garantizar la viabilidad financiera a largo plazo del
sistema de saludSistema que sea un modelo
de calidad y eficiencia
Estrategias inmediatas
Estrategias a corto plazo
Estrategias a medio plazo
Estrategias a largo plazo
Sistema de atención integrado y eficiente
Sistema de atención equitativo y de calidad
Hacer el mejor uso posible de los recursos
para salud
Promoción de la calidad en la prestación médica al paciente
Optimización de la infraestructura de salud
Acceso adecuado a servicios de atención médica y rehabilitación
Coordinación en actuación de organizaciones públicas y privadas
Optimización del uso de datos y la información en salud
Optimización de recursos financieros para tratamiento
Optimización de recursos financieros p/ promoción y prevención
Ver página anterior
Promover las capacidades de los recursos humanos en salud
Source Puerto Rico 2025
Source Puerto Rico 2025

COMPREHENSIVE ECONOMIC DEVELOPMENT STRATEGY 2005
Puerto Rico Planning Area • Annual Report • CEDS Update • EDA Investment Number: 01-85-08072 102
Seguridad Pública
Optimizar el sistema de administración de justicia
Minimizar los niveles de criminalidad
Promover una sociedad fundada en valores éticos y
cívicos
Estrategias inmediatas
Estrategias a corto plazo
Estrategias a medio plazo
Estrategias a largo plazo
Strategies in the Public Safety area have been prioritized as follows
Sistema judicial eficiente y confiable
Sistema judicial integro y despolitizado
Sistema judicial que propicie la prevención
y rehabilitaciónSistema judicial
equitativo
Ver página siguienteVer página siguiente
Agilización del procedimiento penal
Coordinación de esfuerzos a nivel local, regional e internacional
Definición de un Plan de justicia criminal juvenil
Evaluación para la efectividad de programas con fondos públicos
Garantizar independencia del sistema y continuidad de políticas claves
Garantizar acceso a la justicia para todos
Fomento de la habilitación y rehabilitación de la población carcelaria
Seguridad Pública
Optimizar el sistema de administración de justicia
Minimizar los niveles de criminalidad
Promover una sociedad fundada en valores éticos y
cívicos
Estrategias inmediatas
Estrategias a corto plazo
Estrategias a medio plazo
Estrategias a largo plazo
Ver página anteriorGarantizar la participación ciudadana en lucha contra crimenOptimización del tratamiento de la drogodependencia
Estudio continuo de la violencia
Prevención y erradicación de la violencia doméstica y la agresión sexual
Aplicación de la normativa internacional en derechos humanos
Erradicación de la corrupción
Asistencia y protección a víctimas de crimenes y violencia
Source Puerto Rico 2025
Source Puerto Rico 2025

COMPREHENSIVE ECONOMIC DEVELOPMENT STRATEGY 2005
Puerto Rico Planning Area • Annual Report • CEDS Update • EDA Investment Number: 01-85-08072 103
Strategies in the Culture area have been prioritized as follows
Estrategias inmediatas
Estrategias a corto plazo
Estrategias a medio plazo
Estrategias a largo plazo
Cultura
Explotar económica y socialmente el patrimonio
cultural y el talento existente
Promover una sociedad fundada en sólidos valores
éticos y cívicosGarantizar acceso a la
cultura y el esparcimiento
Garantizar una amplia oferta cultural
Garantizar una amplia oferta de recreación y
deportes
Apoyo y estímulo a la cultura
Centros municipales de cultura
Escuelas especializadas
Recreación en jóvenes
Deporte profesional
Recreación para discapacitados
Recreación para la tercera edad
Responsabilidad de los mediosVer página siguiente
Estrategias inmediatas
Estrategias a corto plazo
Estrategias a medio plazo
Estrategias a largo plazo
Cultura
Explotar económica y socialmente el patrimonio
cultural y el talento existente
Promover una sociedad fundada en sólidos valores
éticos y cívicosGarantizar acceso a la
cultura y el esparcimiento
Promover el patrimonio artístico y
arquitectónicoPromover el patrimonio
literario
Ver página anterior
Promover las fiestas, tradiciones y costumbres
Ver página anterior
Protección del Patrimonio
Promoción de las artes musicales
Gestión de museos
Promoción de las artes plásticas
Promoción de las artes de la representación
Impulsar la producción cultural
Desarrollo de las letras
Fomento de la lectura
Gestión de bibliotecas
Financiamiento de la cultura
Desarrollo de capital humano
Promoción internacional
Divulgación de las tradiciones
Source Puerto Rico 2025
Source Puerto Rico 2025

COMPREHENSIVE ECONOMIC DEVELOPMENT STRATEGY 2005
Puerto Rico Planning Area • Annual Report • CEDS Update • EDA Investment Number: 01-85-08072 104
Strategies in the Land-use and Environment area have been prioritized as follows
Immediate Strategies Short-term Strategies Medium-term Strategies Long-term Strategies
Land-Use and Environment
Improve environmental quality
Promote environmental responsibility
Improve land-use management
Redefine and improve compliance with environmental agencies’processes
Use market mechanisms to incentcompliance & conservation
Promote environmental responsibility through incentives and regulations
Promote environmental responsibility through setting community targets
Create an integrated & detailed land-use plan with force of law
Communicate new plan and permit process to community
Strengthen enforcement of the new land-use plan
Restructure the adjudication, permitting and approval process
Promote environmental awareness through education
Apply environmental quality concepts to all projects
Restructure entities responsible for planning and permitting
Improve community participation in planning and permitting process
Strengthen financing for acquiring land and compensating owners
Evaluate and improve environmental regulations
Strategies in the Utilities area have been prioritized as follows
Immediate Strategies Short-term Strategies Medium-term Strategies Long-term Strategies
Utilities
Improve Waste-Management
Improve Electric Power System
Reduce impact of energy on the environment
Improve Water and Sewage System
Promote reduced energy usage
Implement long-term waste management plan
Reduce waste generation by reducing usage & maximizing recycling
Promote usage of renewable energy sources
Increase investment in infrastructure to improve efficiency and reliability
Diversify fuel sources for power generation
Redefine energy pricing structure
Review and update water and sewage long-term plan
Increase investment in infrastructure to improve efficiency and reliability
Redefine water and sewage pricing structure
Strengthen regulatory body so it becomes truly independent
Strengthen regulatory body so it becomes truly independent
Promote reduced water usage
Improve performance by increasing competition
Promote cleaner use of fossil fuels
Improve performance by increasing competition
Source Puerto Rico 2025
Source Puerto Rico 2025

COMPREHENSIVE ECONOMIC DEVELOPMENT STRATEGY 2005
Puerto Rico Planning Area • Annual Report • CEDS Update • EDA Investment Number: 01-85-08072 105
Strategies in the Transport area have been prioritized as follows
Immediate Strategies Short-term Strategies Medium-term Strategies Long-term Strategies
Transportation
Improve on-island transport access
Minimize social and environmental impact
Improve international transport access
Create and promote efficient and reliable collective transportation
Complete the highway and road network
Promote clean transportation fuels and technologies
Improve community participation in transportation planning
Improve productivity of existing ports and airports
Expand air passenger capacity
Expand air cargo capacity
Expand sea cargo and passenger capacity
Encourage reduced car use
Reduce demand for transport through improved land-use
Increase international passenger air and sea connections
Convert / create major new ports
Convert / create major new airports
Increase efficiency and capacity of existing roads
Increase productivity of existing road freight systems
Invest in new land-freight systems

COMPREHENSIVE ECONOMIC DEVELOPMENT STRATEGY 2005
Puerto Rico Planning Area • Annual Report • CEDS Update • EDA Investment Number: 01-85-08072 106
The Implementation Plan;Commencement and ExecutionSECTION IV:
The CEDS Evaluation Process
The Comprehensive Economic DevelopmentStrategy (CEDS) committee for the Puerto RicoDevelopment Area is responsible for the evaluationof those investment proposals submitted for itsconsideration.
As the entire Commonwealth of Puerto Ricoqualifies as a Redevelopment Area under provisionsof the Public Works and Economic DevelopmentAct of 1965 , the entirety of Puerto Rico’sMunicipalities, their agencies, and the agencies ofthe central government of Puerto Rico, are fullyeligible to receive assistance from the UnitedStates Department of Commerce EconomicDevelopment Administration (EDA) .Subsequently, each proposal submitted to thecommittee is considered for inclusion in the CEDSunder the established CEDS evaluation process.
Among the various factors considered throughout thestrategy several are particularly important, and bearrepeating; they are:
The economic trends and context, as describedin previous sections of this document; and,
The probability a given proponent shall berequired, by virtue of the undertaking, to carryout additional phases, at a later stage and in aspecific area; and,
The potential of the investment proposal togenerate or retain good jobs—new jobs,permanent jobs, high skill jobs, high wage jobs,jobs paying higher than the area average wageor area median wage—solid employmentopportunities; and,
Need.
Reader’s Note: A selection of statistical indicators,in tabular format, and a group of maps specifyingsocio-economic indicators which are applicableto the decision making process are included inAppendix A: Statistical Appendix.
Phases of Evaluation
Currently, the CEDS evaluation process consists ofthe following phases:
1. Identification of Investment Proposals:Accepting, finding, and suggesting solid investmentproposals and/or encouraging the transformationof good ideas into solid investment proposals; and,
2. Evaluation of Investment Proposals:
a. Determination of the Development AreaPriority Level: This designation relays thelevel of importance to the development areaof each investment proposal—in light ofeconomic trends and projections, and thepublic policy embodied in the CEDS 2004—and subsequently results in the designationof a grade reflecting said finding; and,
b. Consideration of the Level of EDAAppropriateness: This designation relays thelevel of appropriateness in light of the EDA’sinvestment proposal guidelines (aspromulgated in US FY 2002) andsubsequently designates a grade reflectingsaid compatibility; and,
3. Authorship of an official letter of certificationand referral to the EDA for its ownconsideration for those investment proposalsdeemed both:
a. Important to the economic development ofthe Puerto Rico Development Area; and,
b. Consistent with the EDA Investment PolicyGuidelines

COMPREHENSIVE ECONOMIC DEVELOPMENT STRATEGY 2005
Puerto Rico Planning Area • Annual Report • CEDS Update • EDA Investment Number: 01-85-08072 107
However, to be clear:
Not every proposal submitted is included in theComprehensive Development Strategy, the CEDSdocument.
Nor is every investment proposal deemed ofequal importance.
Nevertheless, having identified important investmentopportunities and included them in the CEDS documentit is the strong desire of the CEDS committee that,federal agencies and administrations, the governmentof the Commonwealth of Puerto Rico, the privatesector, foundations, the not-for-profit sector, and thepublic shall embrace the challenge of supporting anyand all proposals included in the CEDS as worthyeconomic development projects.
Grading System
The classification used in designating the DevelopmentArea Priority Level(s) includes the following three(3) grades:
A. reflects high priority; and,
B . reflects intermediate priority, and,
C. reflects low priority.
NI. indicates Not Included in the CEDS updatedue to reservations regarding the orientationof the investment
The classification used in the Level of EDAAppropriateness process includes the following three(3) grades:
A. reflects a high level of appropriateness; and,
B . reflects a intermediate level ofappropriateness; and,
C. reflects a low level of appropriateness.
NR. means Not Recommended due to eligibilityconcerns
Again, every investment proposal submitted forreview and potential inclusion in theComprehensive Development Strategy, the CEDS
document, is carefully considered in light of thefactors listed above, and throughout this document;unfortunately, not every proposal submitted tothe CEDS committee conforms with the programguidelines and requirements of the EDA’sassistance program and therefore, to date, cannotbe included in the CEDS document, in accordancewith the management program designed, published,and promulgated by the CEDS committee.
Continued General AdvisoryRegarding Process Changes
As the above format represents an innovation in theevaluation process which occurred during Cycles aninnovation designed to render some return on theinvestment of time applicants expend in preparinginvestment proposals for the CEDS committeeevaluation process—it remains a possibility thatcontinued and further refinements may occur duringthe pending program cycle PR FY 2006.
It should be understood, that said process innovationsoccurred as a response to the urgings of bothproponents and committee members. As always, thegoal of our effort was, and shall remain, to endeavorto amplify the comprehensive and strategic nature ofthis document and its continued functionality.
Formal Invitation to the EDA
As each proposal has been identified, to varyingdegrees, as appropriate in light of the Goals, Objectives,and policy priorities of the Puerto Rico DevelopmentArea, the EDA is invited to consider any proposalincluded in the CEDS document. However, onlythose proposals which have also received a graderegarding their appropriateness in light of the EDA’sinvestment policy guidelines (as promulgated duringFY 2002) carry the full confidence of the CEDScommittee as proposals that are ready for seriousconsideration under the EDA’s pre-application programand procedures.

COMPREHENSIVE ECONOMIC DEVELOPMENT STRATEGY 2005
Puerto Rico Planning Area • Annual Report • CEDS Update • EDA Investment Number: 01-85-08072 108
All Investment ProposalsConsidered, FY 2005
The following section lists each Municipality, the titleof the Investment Proposal which it submitted to theCEDS committee for evaluation. The listing alsoincludes the priority and recommendationclassifications rendered by the committee. If theInvestment Proposal received a “AA” rating we haveincluded the estimated duration of the proposalactivities as well as a brief description. For furtherdetails regarding any AA – Rated InvestmentProposal, please see the Appendix to that effect.
It is prudent to note here that, this year FY 2005, theCEDS committee received six (6) proposals forevaluation in comparison to the roughly 12-15 thatwe receive on average. It is the considered opinionof the Executive Director that this resulted from twodistinct factors which bear mentioning. First, thedecrease is partially due to the lag which occursbetween each election cycle wherein any newadministration must ramp up to full capacity and bringits people to date; and, second, a general perceptionthat Strengthening American Communities Initiative(SACI) meant that the threshold for success wouldbe significantly higher.
Municipal County of AñascoMulti-tenant Industrial Building
Priority: BRecommendation: C
Municipal County of CayeyRenovation of a Downtown Commercial Buildinginto a[n] Innovation Technology Center (CIT)
Priority: ARecommendation: A
Comments: Cayey’s investment proposal,addresses a number of policy imperatives, bothspecifically and generally, articulated under “SectionIII: Strategies and Objectives” of the CEDS 2005Update, and, are consequently pertinent in theconsideration of all projects developed throughout
FY 2005 in the Commonwealth of Puerto Rico.Please observe, principally, Cayey’s investmentproposal addresses those strategies and objectivesas articulated under the economic developmentfocus area for strategic prioritization, particularlyas they relate to the themes of: 1) increasing theuse of technology and information; and, 2) focusingon the quality of human capital; and, 3) focusingupon personal responsibility; and, 4) improvingcommunity participation and access for the lessadvantaged.
Moreover, where, this project shall enhance basiceconomic infrastructure in Cayey as well as makeinvestments in long-term human capital productivityimprovements (which are geared towards marketdemand for high-tech, knowledge economy skillsets) the Municipal County is also well prepared toexecute the initiative as described in its applicationthrough its status as a primary stakeholder inINTECO, Iniciativa Tecnológica Centro-Oriental (or The Center-East Technology Initiative)which has the distinction of being among the mostwidely respected multi-sector partnerships in PuertoRico—a partnership with tangible private sectorsupport and input.
Accordingly, the Municipal County of Cayey hasbeen assigned an (A) level of importance becauseof its orientation and service towards an area greaterthan Cayey itself; and, an (A) as exceptionallyeligible for invitation to begin pre-proposaldevelopment activities according to the relevant andestablished guidelines and procedures of the EDA,as well as the existing precidents of the CEDScommiteee.
Municipal County of Las MaríasConstrucción de una Plaza de Mercado en elMunicipio (Construction of a Market Plaza)
Priority: CRecommendation: NR
Municipal County of VillalbaConstrucción de Edificio Multifabril (Constructionof a Multi-tenant Industrial [Activity] Building)
Priority: BRecommendation: B

COMPREHENSIVE ECONOMIC DEVELOPMENT STRATEGY 2005
Puerto Rico Planning Area • Annual Report • CEDS Update • EDA Investment Number: 01-85-08072 109
Municipal County of YabucoaComprehensive Economic Development Study ofYabucoa’s Downtown (CEDS-YD)
Priority: BRecommendation: A
Comments: Yabucoa’s investment proposal,addresses a number of policy imperatives, bothspecifically and generally, articulated under “SectionIII: Strategies and Objectives” of the CEDS 2005Update, and, are consequently pertinent in theconsideration of all projects developed throughoutFY 2005 in the Commonwealth of Puerto Rico.Please observe, principally, Yabucoa’s investmentproposal responds to those strategies and objectivesas articulated under the economic development,as well as the infrastructure/environment focusareas for strategic prioritization particularly as theyrelate to the themes of: 1) improving planning andcoordination; and, 2) increasing investment intargeted areas; and, 3) focusing upon personalresponsibility.
Nevertheless, in any subsequent development ofthis proposal, the committee would encourageYabucoa and the EDA to look closely at the issueof Yabucoa’s proximity to the former Naval BaseRoosevelt Roads and the economic developmentand planning activity being initiated As well as theseparate issue of ensuring that the Yabucoa CEDStruly compliments its Land Use Plan as oppose toduplicating the same or similar planning activities.
Accordingly, Yabucoa has been assigned a (B) levelof importance, because of its orientation atexclusively the municipal level; yet, notwithstanding,an (A) as exceptionally eligible for invitation tobegin pre-proposal development activities accordingto the relevant and established guidelines andprocedures of the EDA, as well as the existingprecidents of the CEDS commiteee.
Apoyo Empresarial Para la Península deCantera, Inc.
Barbosa 607 – Commercial Office Project
Priority: BRecommendation: B

COMPREHENSIVE ECONOMIC DEVELOPMENT STRATEGY 2005
Puerto Rico Planning Area • Annual Report • CEDS Update • EDA Investment Number: 01-85-08072 110
CO
MPR
EHEN
SIV
E EC
ON
OM
IC D
EVEL
OPM
ENT
STR
ATEG
Y 2
005
Puer
to R
ico
Plan
ning
Are
a •
An
nual
Rep
ort
•
CED
S U
pdat
e •
ED
A In
vest
men
t N
umbe
r:
01-8
5-08
072
1
10
E.D.A
# 1Mu
nicipa
lity of
Añas
coMu
ltiten
ant In
dustr
ial B
uildin
g46
3,320
$
20%
1,853
,280
$
80
%2,3
16,88
8$
100%
00
00
012
BC
# 1
# 2Mu
nicipa
lity of
Cay
eyRe
nova
tion o
f an e
mpty
Down
town
Come
rcial
Build
ing in
to a I
nnov
ation
Te
chno
logy C
enter
(CIT)
187,4
20$
20
%74
9,680
$
80%
937,1
00$
100%
150
70
226
AA
# 2
# 3Mu
nicipi
o de L
as M
arias
Cons
trucc
ión de
una P
laza d
e Me
rcado
en el
Mun
icipio
de10
0,000
$
25%
300,0
00$
75
%40
0,000
$
10
0%10
011
021
18C
NR# 3
# 4Mu
nicipi
o de V
illalba
Cons
trucc
ión de
Edif
icio M
ultifa
bril
500,0
00$
50
%50
0,000
$
50%
1,000
,000
$
10
0%37
013
60
173
18B
B# 4
# 5Mu
nicipa
lity of
Yabu
coa
Comp
rehen
sive E
cono
mic
Deve
lopme
nt Stu
dy of
Yabu
coa's
Do
wntow
n (CE
DSYD
)25
,000
$
20
%10
0,000
$
80%
125,0
00$
100%
nana
nana
na6
BA
# 5
# 6Ap
oyo E
mpres
arial
para
la Pe
nínsu
la de
Can
tera ,
Inc.
Barbo
sa 60
7 - C
omme
rcial
Offic
e Pr
oject
1,858
,764
$
65%
1,000
,000
$
35
%2,8
58,76
4$
100%
310
320
6324
BB
# 6
NA =
Not A
pplica
ble
na
= No
t Ava
ilable
(not
provid
ed in
the r
equis
ite m
ateria
ls)
Temp
EDA
Co
mpati
bility
CEDS
Con
solid
ated R
esult
s - FY
05
Loca
l / Ot
her
Distr
ict
Prior
ity
Leve
l
New
Save
dTo
tal
Job C
reatio
n Brea
kdow
n
% of
Total
Inves
tmen
t Pr
opon
ent
Inves
tmen
t Prop
osal
Tit
le or
Desc
riptor
Term
of
Inves
tmen
t (m
onths
)
Perm
In
$In
$Ch
eck
Total
Inve
stmen
t
Finan
cial In
vestm
ent B
reakd
own
In $
% of
Total

COMPREHENSIVE ECONOMIC DEVELOPMENT STRATEGY 2005
Puerto Rico Planning Area • Annual Report • CEDS Update • EDA Investment Number: 01-85-08072 A-1
STATISTICAL APPENDIX A:
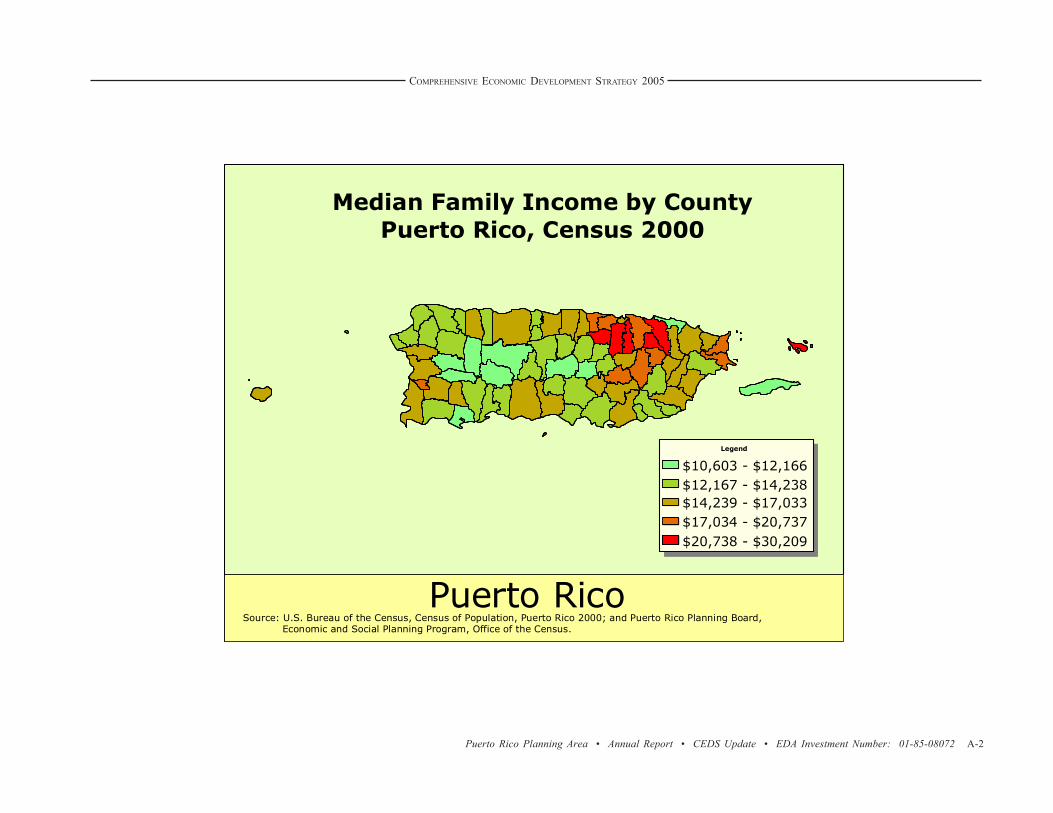
COMPREHENSIVE ECONOMIC DEVELOPMENT STRATEGY 2005
Puerto Rico Planning Area • Annual Report • CEDS Update • EDA Investment Number: 01-85-08072 A-2
Median Family Income by CountyPuerto Rico, Census 2000
Median Family Income by CountyPuerto Rico, Census 2000
Legend
$10,603 - $12,166$12,167 - $14,238$14,239 - $17,033$17,034 - $20,737$20,738 - $30,209
Legend
$10,603 - $12,166$12,167 - $14,238$14,239 - $17,033$17,034 - $20,737$20,738 - $30,209
Source: U.S. Bureau of the Census, Census of Population, Puerto Rico 2000; and Puerto Rico Planning Board, Economic and Social Planning Program, Office of the Census.
Puerto RicoSource: U.S. Bureau of the Census, Census of Population, Puerto Rico 2000; and Puerto Rico Planning Board,
Economic and Social Planning Program, Office of the Census.
Puerto Rico

COMPREHENSIVE ECONOMIC DEVELOPMENT STRATEGY 2005
Puerto Rico Planning Area • Annual Report • CEDS Update • EDA Investment Number: 01-85-08072 A-3
Families Under Poverty Level by CountyPuerto Rico, Census 2000
Legend
28.3% - 39.9%40.0% - 48.5%48.6% - 53.3%53.4% - 58.0%58.1% - 64.1%
Legend
28.3% - 39.9%40.0% - 48.5%48.6% - 53.3%53.4% - 58.0%58.1% - 64.1%
Source: U.S. Bureau of the Census, Census of Population, Puerto Rico 2000; and Puerto Rico Planning Board, Economic and Social Planning Program, Office of the Census.
Puerto Rico

COMPREHENSIVE ECONOMIC DEVELOPMENT STRATEGY 2005
Puerto Rico Planning Area • Annual Report • CEDS Update • EDA Investment Number: 01-85-08072 A-4
Unemployment Rate by CountyPuerto Rico, Census 2000
L egend
9.4% - 15.5%15.6% - 20.2%20.3% - 24.3%24.4% - 28.9%29.0% - 35.7%
L egend
9.4% - 15.5%15.6% - 20.2%20.3% - 24.3%24.4% - 28.9%
29.0% - 35.7%
Source: U.S. Bureau of the Census, Census of Population, Puerto Rico 2000; and Puerto Rico Planning Board, Economic and Social Planning Program, Office of the Census.
Puerto Rico

COMPREHENSIVE ECONOMIC DEVELOPMENT STRATEGY 2005
Puerto Rico Planning Area • Annual Report • CEDS Update • EDA Investment Number: 01-85-08072 A-5
Source: U.S. Bureau of the Census, Census of Population, Puerto Rico 2000; and Puerto Rico Planning Board, Economic and Social Planning Program, Office of the Census.
Selected Economic Characteristics by County2000 Census
Puerto Rico 19.2 16,543 44.6
Adjuntas 30.9 11,102 61.7Aguada 22.1 12,869 55.6Aguadilla 25.3 13,320 51.5Aguas Buenas 15.5 14,662 49.8Aibonito 23.2 14,676 48.5Añasco 23.7 14,830 49.3Arecibo 20.7 15,150 47.6Arroyo 33.4 13,093 52.2Barceloneta 23.8 13,908 51.6Barranquitas 25.1 12,166 58.9Bayamón 13.1 22,403 31.8Cabo Rojo 18.5 15,852 42.7Caguas 16.2 19,321 38.6Camuy 20.1 14,645 48.0Canóvanas 21.1 15,033 50.1Carolina 12.6 23,412 30.7Cataño 20.9 15,749 46.7Cayey 17.9 15,939 47.4Ceiba 18.4 18,851 37.0Ciales 23.7 12,315 58.0Cidra 18.6 17,262 44.2Coamo 26.4 13,889 51.7Comerío 22.2 12,371 59.0Corozal 16.3 13,280 54.8Culebra 16.8 22,600 33.0Dorado 14.8 18,585 39.9Fajardo 18.6 18,387 38.1Florida 26.6 12,401 54.2Guánica 35.7 11,209 59.9Guayama 27.5 14,648 49.0Guayanilla 27.3 13,187 54.9Guaynabo 9.4 30,209 28.3Gurabo 14.5 18,538 39.8Hatillo 22.5 13,890 52.5Hormigueros 19.4 19,894 33.2Humacao 18.6 16,652 43.7
continuation
Unemployment Rate
County Families Under Poverty Level
2000 Census
Median Family Income
Juncos 22.5 14,672 50.0Lajas 26.4 12,980 52.7Lares 20.2 10,968 61.8Las Marías 30.2 10,707 62.8Las Piedras 22.5 16,408 44.9Loíza 26.8 12,043 56.9Luquillo 23.1 15,203 46.3Manatí 24.0 14,828 47.6Maricao 28.9 10,603 63.0Maunabo 26.1 12,654 54.3Mayagüez 23.0 15,226 45.9Moca 23.9 12,476 55.8Morovis 23.5 13,529 55.7Naguabo 21.5 12,957 54.1Naranjito 17.4 13,815 53.3Orocovis 26.0 11,010 64.1Patillas 28.5 13,980 50.7Peñuelas 26.3 13,686 56.1Ponce 25.1 15,465 47.9Quebradillas 22.8 13,845 51.2Rincón 22.0 13,512 52.9Rio Grande 20.4 17,033 43.2Sabana Grande 22.3 14,685 47.8Salinas 27.8 13,197 54.9San Germán 23.5 16,003 44.9San Juan 13.7 20,640 37.0San Lorenzo 22.0 14,238 51.2San Sebastián 25.1 12,458 54.3Santa Isabel 23.9 13,264 53.6Toa Alta 12.3 21,574 36.9Toa Baja 15.1 20,737 37.2Trujillo Alto 11.5 24,543 31.5Utuado 30.0 11,321 60.3Vega Alta 18.5 15,492 47.4Vega Baja 20.8 15,708 47.1Vieques 28.2 11,036 60.6Villalba 28.9 13,373 57.3Yabucoa 23.8 14,538 51.0Yauco 25.2 13,584 52.7
County
2000 Census
Unemployment Rate
Median Family Income
Families Under Poverty Level

COMPREHENSIVE ECONOMIC DEVELOPMENT STRATEGY 2005
Puerto Rico Planning Area • Annual Report • CEDS Update • EDA Investment Number: 01-85-08072 A-6
AGUADILLAISABELA
AGUADAMOCA
AÑASCO
SANSEBASTIAN
QUEBRADILLAS
CAMUY
HA
TILL
O
ARECIBO
UTUADOLARES
MAYAGUEZ
HORMIGUEROS
LAS MARIAS
MARICAOADJUNTAS
JAYUYA
RINCON
SANGERMAN
CABOROJO
LAJAS
SA
BA
NA
GR
AN
DE
GUANICA
YAUCO
GU
AY
AN
ILL
A
PE
ÑU
ELA
SPONCE JUANA
DIAZ
VILLALBA
OROCOVIS
CIALES
MOROVIS
FLORIDABARCELONETA
MANATI
VEGABAJA
VEGAALTA D
OR
AD
O TOABAJA
CATAÑO
BA
YA
MO
N
GU
AY
NA
BO
RIOPIEDRAS
TRUJILLOALTO
CAR
OLIN
A
SAN JUAN
LOIZA
TOAALTA
COROZAL
NA
RAN
JITO
AGUASBUENAS
COMERIO
CIDRA
CAGUAS
AIBONITO
BARRANQUITAS
COAMO
SALINASSANTAISABEL
CAYEY
GUAYAMA
ARR
OYO
PATILLASMAUNABO
YABUCOA
SANLORENZO HUMACAO
LAS P
IED
RA
S
GURABO
CA
NO
VA
NA
SRIO
GRANDE
NAGUABOCEIBA
FAJARDO
LUQUIL
LO
VIEQUES
CULEBRA
Tax Exemption Zones in Puerto Rico, U.S.A.Tax Exemption Zones in Puerto Rico, U.S.A.
Administrative bulletin No. OE-1998-40 as of December 29, 1998, pursuant toSection 6(e) of Tax Incentives Act of 1998
10 Years15 Years
20 Years
25 Years
JUNCOS

COMPREHENSIVE ECONOMIC DEVELOPMENT STRATEGY 2005
Puerto Rico Planning Area • Annual Report • CEDS Update • EDA Investment Number: 01-85-08072 A-7
Universe: Employed civilian population 16 years Data Set: Census 2000 Summary File 3 (SF 3) - Sample Data
Puerto Rico
Adjuntas Aguada AguadillaAguas
BuenasAibonito Añasco
Total: 930,865 3,339 9,755 14,108 6,338 5,447 6,808Management, professional, and related occupations: 255,417 927 2,007 3,532 1,502 1,315 1,247
Management, business, and financial operations occupations: 92,787 304 627 992 554 376 437Management occupations, except farmers and farm managers 51,804 120 373 662 290 120 228Farmers and farm managers 3,299 123 43 37 33 58 33Business and financial operations occupations: 37,684 61 211 293 231 198 176
Business operations specialists 13,101 31 39 118 41 80 79Financial specialists 24,583 30 172 175 190 118 97
Professional and related occupations: 162,630 623 1,380 2,540 948 939 810Computer and mathematical occupations 6,750 9 22 77 47 10 5Architecture and engineering occupations: 14,103 42 229 328 35 68 137
Architects, surveyors, cartographers, and engineers 9,314 36 101 176 23 53 92Drafters, engineering, and mapping technicians 4,789 6 128 152 12 15 45
Life, physical, and social science occupations 7,078 38 46 126 24 107 29Community and social services occupations 13,149 75 134 157 85 94 88Legal occupations 9,003 25 49 86 33 32 11Education, training, and library occupations 59,536 315 558 1,038 386 325 357Arts, design, entertainment, sports, and media occupations 10,966 6 54 67 32 44 29Healthcare practitioners and technical occupations: 42,045 113 288 661 306 259 154
Health diagnosing and treating practitioners and technical occupations 31,401 63 221 532 226 230 102Health technologists and technicians 10,644 50 67 129 80 29 52
Service occupations: 150,657 474 1,573 2,429 1,039 826 1,107Healthcare support occupations 10,637 49 134 107 77 63 50Protective service occupations: 40,547 165 431 754 331 214 239
Fire fighting, prevention, and law enforcement workers, including supervisors 20,715 116 244 464 153 93 168Other protective service workers, including supervisors 19,832 49 187 290 178 121 71
Food preparation and serving related occupations 37,793 114 489 615 237 164 259Building and grounds cleaning and maintenance occupations 43,445 106 407 781 279 301 424Personal care and service occupations 18,235 40 112 172 115 84 135
Sales and office occupations: 260,317 625 2,338 3,628 1,498 1,181 1,329Sales and related occupations 118,373 297 1,173 1,603 600 449 550Office and administrative support occupations 141,944 328 1,165 2,025 898 732 779
Farming, fishing, and forestry occupations 10,371 322 94 117 57 177 95Construction, extraction, and maintenance occupations: 112,776 570 1,461 1,642 1,111 617 920
Construction and extraction occupations: 70,305 435 938 1,030 790 328 625Supervisors, construction and extraction workers 5,579 37 41 51 75 7 58Construction trades workers 64,527 398 893 970 715 321 560Extraction workers 199 0 4 9 0 0 7
Installation, maintenance, and repair occupations 42,471 135 523 612 321 289 295Production, transportation, and material moving occupations: 141,327 421 2,282 2,760 1,131 1,331 2,110
Production occupations 90,069 275 1,800 1,747 684 1,048 1,715Transportation and material moving occupations: 51,258 146 482 1,013 447 283 395
Supervisors, transportation and material moving workers 1,735 13 15 56 29 0 7Aircraft and traffic control occupations 385 0 0 11 0 0 6Motor vehicle operators 26,777 98 254 390 259 147 172Rail, water and other transportation occupations 3,374 10 27 72 24 9 23Material moving workers 18,987 25 186 484 135 127 187
Source: U.S. Census Bureau, Census 2000
OCCUPATION FOR THE EMPLOYED CIVILIAN POPULATION 16 YEARS AND OVER

COMPREHENSIVE ECONOMIC DEVELOPMENT STRATEGY 2005
Puerto Rico Planning Area • Annual Report • CEDS Update • EDA Investment Number: 01-85-08072 A-8
Universe: Employed civilian population 16 years Data Set: Census 2000 Summary File 3 (SF 3) - Sample Data
Arecibo Arroyo Barceloneta Barranquitas BayamónCabo Rojo
Total: 23,350 3,463 4,926 5,246 62,116 12,801Management, professional, and related occupations: 5,859 801 867 1,365 18,570 3,113
Management, business, and financial operations occupations: 1,839 229 258 316 7,469 1,018Management occupations, except farmers and farm managers 989 171 142 154 3,925 638Farmers and farm managers 100 9 9 73 57 32Business and financial operations occupations: 750 49 107 89 3,487 348
Business operations specialists 376 6 62 34 1,327 132Financial specialists 374 43 45 55 2,160 216
Professional and related occupations: 4,020 572 609 1,049 11,101 2,095Computer and mathematical occupations 70 13 18 24 789 45Architecture and engineering occupations: 389 41 32 59 1,011 146
Architects, surveyors, cartographers, and engineers 212 17 20 22 557 102Drafters, engineering, and mapping technicians 177 24 12 37 454 44
Life, physical, and social science occupations 316 33 60 41 335 132Community and social services occupations 393 48 60 70 712 131Legal occupations 154 14 0 18 624 79Education, training, and library occupations 1,435 227 237 553 4,052 908Arts, design, entertainment, sports, and media occupations 245 10 10 27 897 95Healthcare practitioners and technical occupations: 1,018 186 192 257 2,681 559
Health diagnosing and treating practitioners and technical occupations 745 131 89 201 1,971 398Health technologists and technicians 273 55 103 56 710 161
Service occupations: 3,700 801 717 854 8,811 2,066Healthcare support occupations 277 37 54 92 683 99Protective service occupations: 1,110 334 212 219 2,311 540
Fire fighting, prevention, and law enforcement workers, including supervisors 539 243 80 121 1,006 292Other protective service workers, including supervisors 571 91 132 98 1,305 248
Food preparation and serving related occupations 892 143 186 196 2,422 680Building and grounds cleaning and maintenance occupations 1,076 224 217 255 2,169 547Personal care and service occupations 345 63 48 92 1,226 200
Sales and office occupations: 6,349 649 1,102 1,101 21,810 3,658Sales and related occupations 3,153 278 455 519 9,567 1,882Office and administrative support occupations 3,196 371 647 582 12,243 1,776
Farming, fishing, and forestry occupations 333 25 64 249 87 323Construction, extraction, and maintenance occupations: 2,725 634 871 815 5,942 1,659
Construction and extraction occupations: 1,654 469 506 551 3,028 954Supervisors, construction and extraction workers 124 27 30 24 333 64Construction trades workers 1,518 437 476 527 2,678 890Extraction workers 12 5 0 0 17 0
Installation, maintenance, and repair occupations 1,071 165 365 264 2,914 705Production, transportation, and material moving occupations: 4,384 553 1,305 862 6,896 1,982
Production occupations 3,179 403 963 444 3,362 1,430Transportation and material moving occupations: 1,205 150 342 418 3,534 552
Supervisors, transportation and material moving workers 31 0 0 7 170 0Aircraft and traffic control occupations 0 0 0 0 4 5Motor vehicle operators 619 111 186 268 1,955 324Rail, water and other transportation occupations 58 0 0 27 151 55Material moving workers 497 39 156 116 1,254 168
Source: U.S. Census Bureau, Census 2000
OCCUPATION FOR THE EMPLOYED CIVILIAN POPULATION 16 YEARS AND OVER

COMPREHENSIVE ECONOMIC DEVELOPMENT STRATEGY 2005
Puerto Rico Planning Area • Annual Report • CEDS Update • EDA Investment Number: 01-85-08072 A-9
Universe: Employed civilian population 16 years Data Set: Census 2000 Summary File 3 (SF 3) - Sample Data
Caguas Camuy Canóvanas Carolina Cataño Cayey Ceiba
Total: 38,616 8,432 9,440 57,008 6,432 11,195 4,151Management, professional, and related occupations: 11,507 1,849 1,805 15,899 1,758 2,712 867
Management, business, and financial operations occupations: 4,248 466 541 6,734 798 924 310Management occupations, except farmers and farm managers 2,245 258 287 3,722 435 446 213Farmers and farm managers 57 61 48 37 7 21 0Business and financial operations occupations: 1,946 147 206 2,975 356 457 97
Business operations specialists 466 64 103 1,023 133 164 27Financial specialists 1,480 83 103 1,952 223 293 70
Professional and related occupations: 7,259 1,383 1,264 9,165 960 1,788 557Computer and mathematical occupations 313 45 22 664 86 57 43Architecture and engineering occupations: 593 55 65 819 67 188 19
Architects, surveyors, cartographers, and engineers 375 44 22 475 53 100 14Drafters, engineering, and mapping technicians 218 11 43 344 14 88 5
Life, physical, and social science occupations 375 87 28 302 33 57 27Community and social services occupations 756 146 120 693 89 132 72Legal occupations 258 47 21 654 61 50 23Education, training, and library occupations 2,601 576 541 3,119 240 751 189Arts, design, entertainment, sports, and media occupations 415 38 105 822 84 96 54Healthcare practitioners and technical occupations: 1,948 389 362 2,092 300 457 130
Health diagnosing and treating practitioners and technical occupations 1,478 255 244 1,508 197 356 103Health technologists and technicians 470 134 118 584 103 101 27
Service occupations: 5,399 1,127 1,625 9,411 1,060 1,782 900Healthcare support occupations 454 57 84 761 65 112 27Protective service occupations: 1,355 372 432 2,433 346 359 223
Fire fighting, prevention, and law enforcement workers, including supervisors 595 216 254 953 124 142 96Other protective service workers, including supervisors 760 156 178 1,480 222 217 127
Food preparation and serving related occupations 1,391 284 321 2,438 220 487 327Building and grounds cleaning and maintenance occupations 1,495 324 495 2,253 357 620 183Personal care and service occupations 704 90 293 1,526 72 204 140
Sales and office occupations: 12,052 2,136 2,742 20,056 2,011 2,980 1,276Sales and related occupations 5,749 1,087 1,236 7,984 995 1,466 548Office and administrative support occupations 6,303 1,049 1,506 12,072 1,016 1,514 728
Farming, fishing, and forestry occupations 106 312 32 132 65 96 17Construction, extraction, and maintenance occupations: 4,093 1,020 1,791 5,344 744 1,496 589
Construction and extraction occupations: 2,184 595 1,225 2,681 461 975 347Supervisors, construction and extraction workers 226 26 78 324 33 82 27Construction trades workers 1,951 569 1,147 2,350 428 893 320Extraction workers 7 0 0 7 0 0 0
Installation, maintenance, and repair occupations 1,909 425 566 2,663 283 521 242Production, transportation, and material moving occupations: 5,459 1,988 1,445 6,166 794 2,129 502
Production occupations 3,162 1,545 728 2,724 471 1,502 327Transportation and material moving occupations: 2,297 443 717 3,442 323 627 175
Supervisors, transportation and material moving workers 94 0 29 212 30 0 0Aircraft and traffic control occupations 0 0 0 95 0 0 10Motor vehicle operators 1,242 220 433 1,756 173 353 67Rail, water and other transportation occupations 151 52 26 369 5 30 9Material moving workers 810 171 229 1,010 115 244 89
Source: U.S. Census Bureau, Census 2000
OCCUPATION FOR THE EMPLOYED CIVILIAN POPULATION 16 YEARS AND OVER

COMPREHENSIVE ECONOMIC DEVELOPMENT STRATEGY 2005
Puerto Rico Planning Area • Annual Report • CEDS Update • EDA Investment Number: 01-85-08072 A-10
Universe: Employed civilian population 16 years Data Set: Census 2000 Summary File 3 (SF 3) - Sample Data
Ciales Cidra Coamo Comerío Corozal Culebra Dorado Fajardo
Total: 3,423 10,040 7,515 3,436 7,190 583 8,848 10,131Management, professional, and related occupations: 703 2,482 1,914 745 1,700 151 2,642 2,298
Management, business, and financial operations occupations: 203 858 481 226 632 63 1,087 791Management occupations, except farmers and farm managers 103 506 241 111 316 37 644 492Farmers and farm managers 4 0 66 25 105 0 16 5Business and financial operations occupations: 96 352 174 90 211 26 427 294
Business operations specialists 24 106 67 40 86 26 153 94Financial specialists 72 246 107 50 125 0 274 200
Professional and related occupations: 500 1,624 1,433 519 1,068 88 1,555 1,507Computer and mathematical occupations 5 61 25 10 30 0 53 36Architecture and engineering occupations: 23 140 95 26 55 0 120 94
Architects, surveyors, cartographers, and engineers 10 102 38 26 39 0 74 70Drafters, engineering, and mapping technicians 13 38 57 0 16 0 46 24
Life, physical, and social science occupations 21 100 77 11 40 0 61 62Community and social services occupations 24 99 117 78 63 5 88 176Legal occupations 0 43 30 5 11 0 139 51Education, training, and library occupations 256 612 668 250 581 44 651 548Arts, design, entertainment, sports, and media occupations 15 80 78 12 61 25 118 105Healthcare practitioners and technical occupations: 156 489 343 127 227 14 325 435
Health diagnosing and treating practitioners and technical occupations 131 371 252 112 136 14 215 266Health technologists and technicians 25 118 91 15 91 0 110 169
Service occupations: 448 1,552 1,377 573 955 127 1,529 2,249Healthcare support occupations 53 106 109 23 49 0 94 152Protective service occupations: 103 442 513 155 296 54 296 532
Fire fighting, prevention, and law enforcement workers, including supervisors 65 309 304 69 200 40 172 252Other protective service workers, including supervisors 38 133 209 86 96 14 124 280
Food preparation and serving related occupations 118 308 314 139 299 37 364 689Building and grounds cleaning and maintenance occupations 134 480 281 205 184 27 550 601Personal care and service occupations 40 216 160 51 127 9 225 275
Sales and office occupations: 790 2,409 1,693 682 2,113 104 2,011 2,602Sales and related occupations 364 1,155 758 307 1,071 48 1,017 1,110Office and administrative support occupations 426 1,254 935 375 1,042 56 994 1,492
Farming, fishing, and forestry occupations 75 121 215 82 101 0 66 44Construction, extraction, and maintenance occupations: 684 1,225 848 784 1,010 102 1,065 1,315
Construction and extraction occupations: 480 731 642 609 694 97 653 812Supervisors, construction and extraction workers 31 85 52 17 56 0 46 27Construction trades workers 449 646 590 592 638 97 600 785Extraction workers 0 0 0 0 0 0 7 0
Installation, maintenance, and repair occupations 204 494 206 175 316 5 412 503Production, transportation, and material moving occupations: 723 2,251 1,468 570 1,311 99 1,535 1,623
Production occupations 526 1,536 1,046 361 732 54 857 1,036Transportation and material moving occupations: 197 715 422 209 579 45 678 587
Supervisors, transportation and material moving workers 0 8 0 0 0 0 31 31Aircraft and traffic control occupations 5 7 5 0 0 0 0 0Motor vehicle operators 93 419 230 123 327 14 275 247Rail, water and other transportation occupations 13 32 21 0 12 2 35 83Material moving workers 86 249 166 86 240 29 337 226
Source: U.S. Census Bureau, Census 2000
OCCUPATION FOR THE EMPLOYED CIVILIAN POPULATION 16 YEARS AND OVER

COMPREHENSIVE ECONOMIC DEVELOPMENT STRATEGY 2005
Puerto Rico Planning Area • Annual Report • CEDS Update • EDA Investment Number: 01-85-08072 A-11
Universe: Employed civilian population 16 years Data Set: Census 2000 Summary File 3 (SF 3) - Sample Data
Florida Guánica Guayama Guayanilla Guaynabo Gurabo Hatillo
Total: 2,374 3,909 8,897 4,230 32,983 9,771 8,374Management, professional, and related occupations: 516 712 2,175 1,151 14,089 2,783 1,879
Management, business, and financial operations occupations: 90 224 632 265 6,530 1,119 648Management occupations, except farmers and farm managers 32 143 381 105 4,059 681 345Farmers and farm managers 13 12 20 18 12 17 69Business and financial operations occupations: 45 69 231 142 2,459 421 234
Business operations specialists 25 28 105 43 812 112 88Financial specialists 20 41 126 99 1,647 309 146
Professional and related occupations: 426 488 1,543 886 7,559 1,664 1,231Computer and mathematical occupations 12 0 26 10 376 64 32Architecture and engineering occupations: 33 33 101 72 765 221 71
Architects, surveyors, cartographers, and engineers 28 19 64 45 705 145 55Drafters, engineering, and mapping technicians 5 14 37 27 60 76 16
Life, physical, and social science occupations 19 5 47 8 260 141 54Community and social services occupations 34 42 202 70 358 198 122Legal occupations 6 3 70 18 1,375 72 66Education, training, and library occupations 175 177 668 417 1,698 477 454Arts, design, entertainment, sports, and media occupations 41 6 82 28 701 105 34Healthcare practitioners and technical occupations: 106 222 347 263 2,026 386 398
Health diagnosing and treating practitioners and technical occupations 76 195 231 186 1,671 292 300Health technologists and technicians 30 27 116 77 355 94 98
Service occupations: 435 696 1,693 829 3,492 1,579 1,404Healthcare support occupations 73 42 82 39 185 163 68Protective service occupations: 108 174 471 339 644 470 434
Fire fighting, prevention, and law enforcement workers, including supervisors 58 117 233 251 252 284 266Other protective service workers, including supervisors 50 57 238 88 392 186 168
Food preparation and serving related occupations 92 239 404 216 748 379 347Building and grounds cleaning and maintenance occupations 102 185 523 137 1,361 406 399Personal care and service occupations 60 56 213 98 554 161 156
Sales and office occupations: 422 789 2,164 830 10,069 2,504 2,173Sales and related occupations 200 376 996 384 5,020 1,080 939Office and administrative support occupations 222 413 1,168 446 5,049 1,424 1,234
Farming, fishing, and forestry occupations 37 94 82 79 32 111 417Construction, extraction, and maintenance occupations: 373 745 1,210 757 2,686 1,322 926
Construction and extraction occupations: 276 540 738 548 1,687 773 588Supervisors, construction and extraction workers 19 44 117 51 179 60 29Construction trades workers 252 492 621 497 1,476 713 559Extraction workers 5 4 0 0 32 0 0
Installation, maintenance, and repair occupations 97 205 472 209 999 549 338Production, transportation, and material moving occupations: 591 873 1,573 584 2,615 1,472 1,575
Production occupations 432 621 1,028 363 1,290 928 1,046Transportation and material moving occupations: 159 252 545 221 1,325 544 529
Supervisors, transportation and material moving workers 0 0 8 0 97 22 0Aircraft and traffic control occupations 0 0 0 0 27 0 0Motor vehicle operators 92 122 174 93 624 287 359Rail, water and other transportation occupations 0 21 42 20 89 22 19Material moving workers 67 109 321 108 488 213 151
Source: U.S. Census Bureau, Census 2000
OCCUPATION FOR THE EMPLOYED CIVILIAN POPULATION 16 YEARS AND OVER

COMPREHENSIVE ECONOMIC DEVELOPMENT STRATEGY 2005
Puerto Rico Planning Area • Annual Report • CEDS Update • EDA Investment Number: 01-85-08072 A-12
Universe: Employed civilian population 16 years Data Set: Census 2000 Summary File 3 (SF 3) - Sample Data
Hormigueros Humacao Isabela JayuyaJuana Díaz
Juncos Lajas
Total: 4,665 14,115 9,827 3,126 10,255 8,391 5,662Management, professional, and related occupations: 1,131 3,389 2,131 738 2,286 1,849 1,230
Management, business, and financial operations occupations: 389 1,140 632 160 625 576 544Management occupations, except farmers and farm managers 195 649 411 73 331 303 304Farmers and farm managers 13 23 23 55 10 18 28Business and financial operations occupations: 181 468 198 32 284 255 212
Business operations specialists 49 183 56 10 77 95 126Financial specialists 132 285 142 22 207 160 86
Professional and related occupations: 742 2,249 1,499 578 1,661 1,273 686Computer and mathematical occupations 19 66 43 11 19 58 26Architecture and engineering occupations: 59 164 181 45 121 89 54
Architects, surveyors, cartographers, and engineers 30 102 88 29 69 39 20Drafters, engineering, and mapping technicians 29 62 93 16 52 50 34
Life, physical, and social science occupations 19 195 47 51 95 65 41Community and social services occupations 68 244 167 65 131 150 69Legal occupations 40 54 28 7 36 34 35Education, training, and library occupations 275 825 629 283 711 437 322Arts, design, entertainment, sports, and media occupations 60 64 62 23 53 81 5Healthcare practitioners and technical occupations: 202 637 342 93 495 359 134
Health diagnosing and treating practitioners and technical occupations 133 459 278 78 372 215 73Health technologists and technicians 69 178 64 15 123 144 61
Service occupations: 684 2,278 1,852 485 1,875 1,149 932Healthcare support occupations 75 249 144 66 191 78 31Protective service occupations: 205 546 672 115 567 324 259
Fire fighting, prevention, and law enforcement workers, including supervisors 162 217 482 67 371 191 145Other protective service workers, including supervisors 43 329 190 48 196 133 114
Food preparation and serving related occupations 119 508 392 144 432 306 159Building and grounds cleaning and maintenance occupations 219 691 467 114 524 342 335Personal care and service occupations 66 284 177 46 161 99 148
Sales and office occupations: 1,544 3,534 2,280 427 2,506 2,211 1,267Sales and related occupations 716 1,612 1,345 223 1,219 1,008 635Office and administrative support occupations 828 1,922 935 204 1,287 1,203 632
Farming, fishing, and forestry occupations 10 95 196 134 438 84 209Construction, extraction, and maintenance occupations: 490 2,125 1,435 436 1,420 1,295 844
Construction and extraction occupations: 264 1,472 789 326 885 912 608Supervisors, construction and extraction workers 6 76 56 26 62 122 64Construction trades workers 258 1,396 727 300 823 790 544Extraction workers 0 0 6 0 0 0 0
Installation, maintenance, and repair occupations 226 653 646 110 535 383 236Production, transportation, and material moving occupations: 806 2,694 1,933 906 1,730 1,803 1,180
Production occupations 563 2,111 1,299 663 1,215 1,412 803Transportation and material moving occupations: 243 583 634 243 515 391 377
Supervisors, transportation and material moving workers 5 6 22 0 11 6 0Aircraft and traffic control occupations 0 0 0 0 0 0 0Motor vehicle operators 152 247 275 97 231 235 153Rail, water and other transportation occupations 17 44 58 17 49 14 47Material moving workers 69 286 279 129 224 136 177
Source: U.S. Census Bureau, Census 2000
OCCUPATION FOR THE EMPLOYED CIVILIAN POPULATION 16 YEARS AND OVER
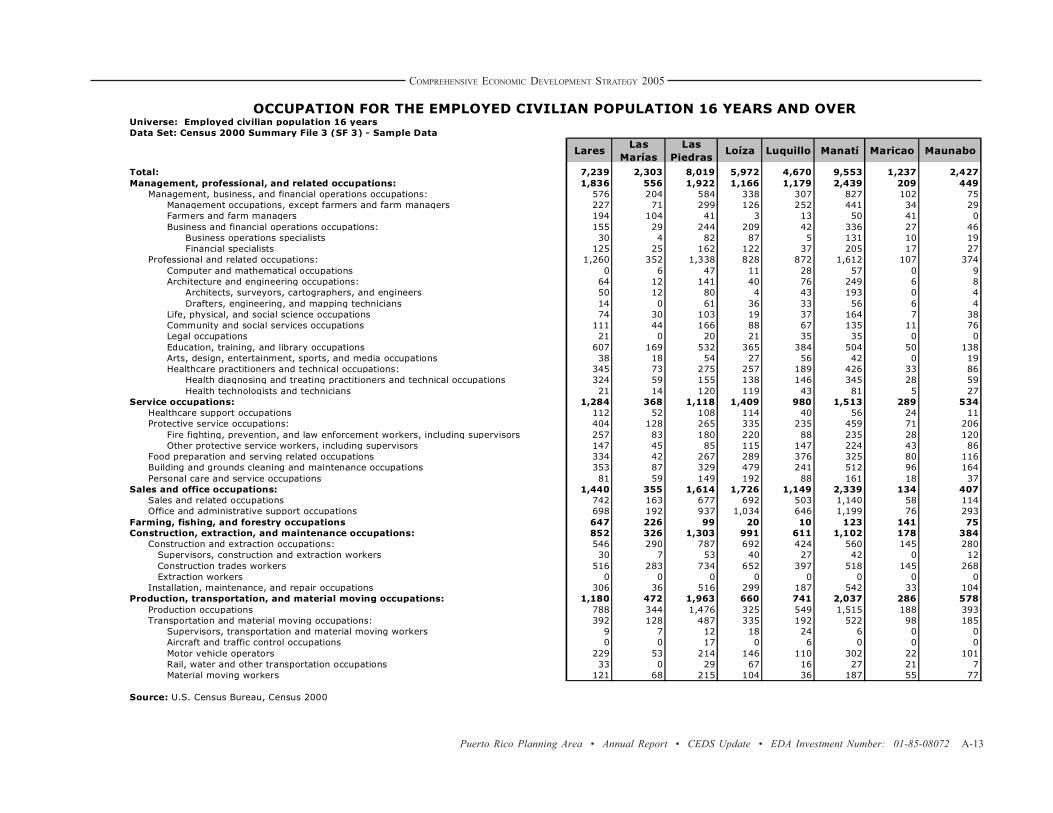
COMPREHENSIVE ECONOMIC DEVELOPMENT STRATEGY 2005
Puerto Rico Planning Area • Annual Report • CEDS Update • EDA Investment Number: 01-85-08072 A-13
Universe: Employed civilian population 16 years Data Set: Census 2000 Summary File 3 (SF 3) - Sample Data
LaresLas
MaríasLas
PiedrasLoíza Luquillo Manatí Maricao Maunabo
Total: 7,239 2,303 8,019 5,972 4,670 9,553 1,237 2,427Management, professional, and related occupations: 1,836 556 1,922 1,166 1,179 2,439 209 449
Management, business, and financial operations occupations: 576 204 584 338 307 827 102 75Management occupations, except farmers and farm managers 227 71 299 126 252 441 34 29Farmers and farm managers 194 104 41 3 13 50 41 0Business and financial operations occupations: 155 29 244 209 42 336 27 46
Business operations specialists 30 4 82 87 5 131 10 19Financial specialists 125 25 162 122 37 205 17 27
Professional and related occupations: 1,260 352 1,338 828 872 1,612 107 374Computer and mathematical occupations 0 6 47 11 28 57 0 9Architecture and engineering occupations: 64 12 141 40 76 249 6 8
Architects, surveyors, cartographers, and engineers 50 12 80 4 43 193 0 4Drafters, engineering, and mapping technicians 14 0 61 36 33 56 6 4
Life, physical, and social science occupations 74 30 103 19 37 164 7 38Community and social services occupations 111 44 166 88 67 135 11 76Legal occupations 21 0 20 21 35 35 0 0Education, training, and library occupations 607 169 532 365 384 504 50 138Arts, design, entertainment, sports, and media occupations 38 18 54 27 56 42 0 19Healthcare practitioners and technical occupations: 345 73 275 257 189 426 33 86
Health diagnosing and treating practitioners and technical occupations 324 59 155 138 146 345 28 59Health technologists and technicians 21 14 120 119 43 81 5 27
Service occupations: 1,284 368 1,118 1,409 980 1,513 289 534Healthcare support occupations 112 52 108 114 40 56 24 11Protective service occupations: 404 128 265 335 235 459 71 206
Fire fighting, prevention, and law enforcement workers, including supervisors 257 83 180 220 88 235 28 120Other protective service workers, including supervisors 147 45 85 115 147 224 43 86
Food preparation and serving related occupations 334 42 267 289 376 325 80 116Building and grounds cleaning and maintenance occupations 353 87 329 479 241 512 96 164Personal care and service occupations 81 59 149 192 88 161 18 37
Sales and office occupations: 1,440 355 1,614 1,726 1,149 2,339 134 407Sales and related occupations 742 163 677 692 503 1,140 58 114Office and administrative support occupations 698 192 937 1,034 646 1,199 76 293
Farming, fishing, and forestry occupations 647 226 99 20 10 123 141 75Construction, extraction, and maintenance occupations: 852 326 1,303 991 611 1,102 178 384
Construction and extraction occupations: 546 290 787 692 424 560 145 280Supervisors, construction and extraction workers 30 7 53 40 27 42 0 12Construction trades workers 516 283 734 652 397 518 145 268Extraction workers 0 0 0 0 0 0 0 0
Installation, maintenance, and repair occupations 306 36 516 299 187 542 33 104Production, transportation, and material moving occupations: 1,180 472 1,963 660 741 2,037 286 578
Production occupations 788 344 1,476 325 549 1,515 188 393Transportation and material moving occupations: 392 128 487 335 192 522 98 185
Supervisors, transportation and material moving workers 9 7 12 18 24 6 0 0Aircraft and traffic control occupations 0 0 17 0 6 0 0 0Motor vehicle operators 229 53 214 146 110 302 22 101Rail, water and other transportation occupations 33 0 29 67 16 27 21 7Material moving workers 121 68 215 104 36 187 55 77
Source: U.S. Census Bureau, Census 2000
OCCUPATION FOR THE EMPLOYED CIVILIAN POPULATION 16 YEARS AND OVER
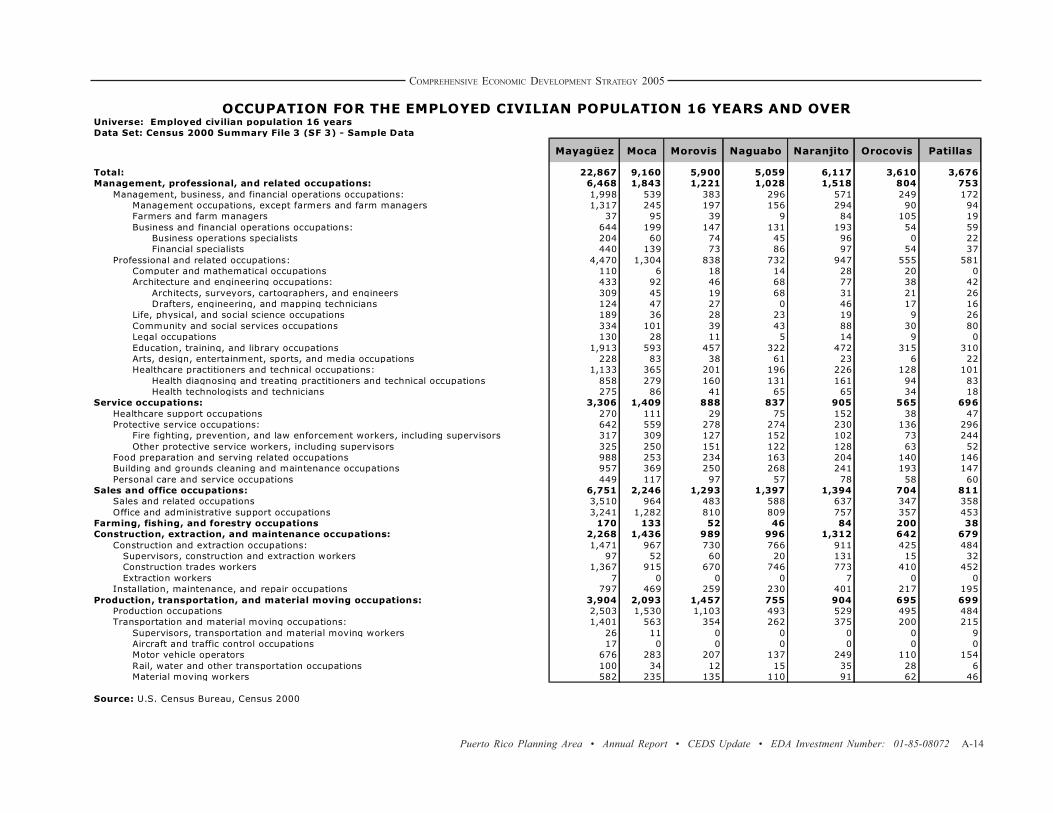
COMPREHENSIVE ECONOMIC DEVELOPMENT STRATEGY 2005
Puerto Rico Planning Area • Annual Report • CEDS Update • EDA Investment Number: 01-85-08072 A-14
Universe: Employed civilian population 16 years Data Set: Census 2000 Summary File 3 (SF 3) - Sample Data
Mayagüez Moca Morovis Naguabo Naranjito Orocovis Patillas
Total: 22,867 9,160 5,900 5,059 6,117 3,610 3,676Management, professional, and related occupations: 6,468 1,843 1,221 1,028 1,518 804 753
Management, business, and financial operations occupations: 1,998 539 383 296 571 249 172Management occupations, except farmers and farm managers 1,317 245 197 156 294 90 94Farmers and farm managers 37 95 39 9 84 105 19Business and financial operations occupations: 644 199 147 131 193 54 59
Business operations specialists 204 60 74 45 96 0 22Financial specialists 440 139 73 86 97 54 37
Professional and related occupations: 4,470 1,304 838 732 947 555 581Computer and mathematical occupations 110 6 18 14 28 20 0Architecture and engineering occupations: 433 92 46 68 77 38 42
Architects, surveyors, cartographers, and engineers 309 45 19 68 31 21 26Drafters, engineering, and mapping technicians 124 47 27 0 46 17 16
Life, physical, and social science occupations 189 36 28 23 19 9 26Community and social services occupations 334 101 39 43 88 30 80Legal occupations 130 28 11 5 14 9 0Education, training, and library occupations 1,913 593 457 322 472 315 310Arts, design, entertainment, sports, and media occupations 228 83 38 61 23 6 22Healthcare practitioners and technical occupations: 1,133 365 201 196 226 128 101
Health diagnosing and treating practitioners and technical occupations 858 279 160 131 161 94 83Health technologists and technicians 275 86 41 65 65 34 18
Service occupations: 3,306 1,409 888 837 905 565 696Healthcare support occupations 270 111 29 75 152 38 47Protective service occupations: 642 559 278 274 230 136 296
Fire fighting, prevention, and law enforcement workers, including supervisors 317 309 127 152 102 73 244Other protective service workers, including supervisors 325 250 151 122 128 63 52
Food preparation and serving related occupations 988 253 234 163 204 140 146Building and grounds cleaning and maintenance occupations 957 369 250 268 241 193 147Personal care and service occupations 449 117 97 57 78 58 60
Sales and office occupations: 6,751 2,246 1,293 1,397 1,394 704 811Sales and related occupations 3,510 964 483 588 637 347 358Office and administrative support occupations 3,241 1,282 810 809 757 357 453
Farming, fishing, and forestry occupations 170 133 52 46 84 200 38Construction, extraction, and maintenance occupations: 2,268 1,436 989 996 1,312 642 679
Construction and extraction occupations: 1,471 967 730 766 911 425 484Supervisors, construction and extraction workers 97 52 60 20 131 15 32Construction trades workers 1,367 915 670 746 773 410 452Extraction workers 7 0 0 0 7 0 0
Installation, maintenance, and repair occupations 797 469 259 230 401 217 195Production, transportation, and material moving occupations: 3,904 2,093 1,457 755 904 695 699
Production occupations 2,503 1,530 1,103 493 529 495 484Transportation and material moving occupations: 1,401 563 354 262 375 200 215
Supervisors, transportation and material moving workers 26 11 0 0 0 0 9Aircraft and traffic control occupations 17 0 0 0 0 0 0Motor vehicle operators 676 283 207 137 249 110 154Rail, water and other transportation occupations 100 34 12 15 35 28 6Material moving workers 582 235 135 110 91 62 46
Source: U.S. Census Bureau, Census 2000
OCCUPATION FOR THE EMPLOYED CIVILIAN POPULATION 16 YEARS AND OVER

COMPREHENSIVE ECONOMIC DEVELOPMENT STRATEGY 2005
Puerto Rico Planning Area • Annual Report • CEDS Update • EDA Investment Number: 01-85-08072 A-15
Universe: Employed civilian population 16 years Data Set: Census 2000 Summary File 3 (SF 3) - Sample Data
Peñuelas Ponce Quebradillas Rincón Río
Grande Sabana Grande
Salinas
Total: 5,196 41,715 5,690 3,372 12,041 5,931 5,751Management, professional, and related occupations: 1,137 12,229 1,235 774 2,734 1,345 1,279
Management, business, and financial operations occupations: 309 3,952 423 381 962 311 301Management occupations, except farmers and farm managers 178 2,408 224 198 471 195 184Farmers and farm managers 15 119 47 11 35 9 5Business and financial operations occupations: 116 1,425 152 172 456 107 112
Business operations specialists 45 433 53 54 114 38 55Financial specialists 71 992 99 118 342 69 57
Professional and related occupations: 828 8,277 812 393 1,772 1,034 978Computer and mathematical occupations 10 168 0 6 71 24 0Architecture and engineering occupations: 22 551 69 54 147 82 41
Architects, surveyors, cartographers, and engineers 4 290 50 35 45 68 20Drafters, engineering, and mapping technicians 18 261 19 19 102 14 21
Life, physical, and social science occupations 23 263 74 19 32 46 37Community and social services occupations 134 791 77 36 224 96 110Legal occupations 16 327 5 0 25 58 19Education, training, and library occupations 330 3,136 320 203 693 450 497Arts, design, entertainment, sports, and media occupations 27 440 37 24 89 42 69Healthcare practitioners and technical occupations: 266 2,601 230 51 491 236 205
Health diagnosing and treating practitioners and technical occupations 223 2,003 180 20 295 171 148Health technologists and technicians 43 598 50 31 196 65 57
Service occupations: 937 6,910 994 678 2,409 1,112 1,114Healthcare support occupations 69 500 78 29 221 97 45Protective service occupations: 365 1,833 290 172 647 473 467
Fire fighting, prevention, and law enforcement workers, including supervisors 232 989 210 98 319 306 274Other protective service workers, including supervisors 133 844 80 74 328 167 193
Food preparation and serving related occupations 209 1,736 287 146 526 205 274Building and grounds cleaning and maintenance occupations 209 2,083 235 296 723 236 249Personal care and service occupations 85 758 104 35 292 101 79
Sales and office occupations: 1,181 11,919 1,227 680 3,339 1,378 1,206Sales and related occupations 549 6,049 593 284 1,353 580 628Office and administrative support occupations 632 5,870 634 396 1,986 798 578
Farming, fishing, and forestry occupations 58 267 92 29 46 71 169Construction, extraction, and maintenance occupations: 1,031 4,556 859 501 1,462 693 936
Construction and extraction occupations: 824 2,601 497 386 988 424 656Supervisors, construction and extraction workers 64 213 11 25 82 26 41Construction trades workers 760 2,378 486 361 906 398 615Extraction workers 0 10 0 0 0 0 0
Installation, maintenance, and repair occupations 207 1,955 362 115 474 269 280Production, transportation, and material moving occupations: 852 5,834 1,283 710 2,051 1,332 1,047
Production occupations 561 3,630 1,031 467 1,135 1,095 798Transportation and material moving occupations: 291 2,204 252 243 916 237 249
Supervisors, transportation and material moving workers 14 73 0 0 37 12 6Aircraft and traffic control occupations 0 0 0 0 7 0 0Motor vehicle operators 170 1,184 153 143 516 124 151Rail, water and other transportation occupations 28 131 14 27 51 16 10Material moving workers 79 816 85 73 305 85 82
Source: U.S. Census Bureau, Census 2000
OCCUPATION FOR THE EMPLOYED CIVILIAN POPULATION 16 YEARS AND OVER
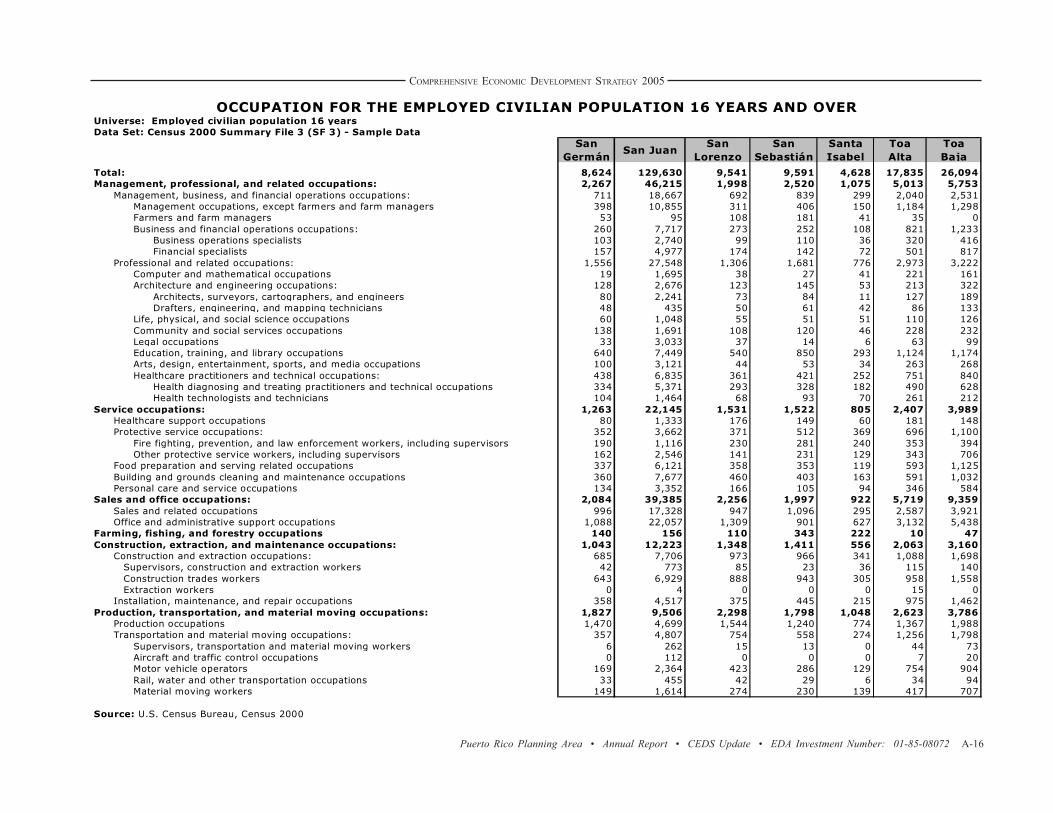
COMPREHENSIVE ECONOMIC DEVELOPMENT STRATEGY 2005
Puerto Rico Planning Area • Annual Report • CEDS Update • EDA Investment Number: 01-85-08072 A-16
Universe: Employed civilian population 16 years Data Set: Census 2000 Summary File 3 (SF 3) - Sample Data
San Germán
San JuanSan
LorenzoSan
SebastiánSanta Isabel
Toa Alta
Toa Baja
Total: 8,624 129,630 9,541 9,591 4,628 17,835 26,094Management, professional, and related occupations: 2,267 46,215 1,998 2,520 1,075 5,013 5,753
Management, business, and financial operations occupations: 711 18,667 692 839 299 2,040 2,531Management occupations, except farmers and farm managers 398 10,855 311 406 150 1,184 1,298Farmers and farm managers 53 95 108 181 41 35 0Business and financial operations occupations: 260 7,717 273 252 108 821 1,233
Business operations specialists 103 2,740 99 110 36 320 416Financial specialists 157 4,977 174 142 72 501 817
Professional and related occupations: 1,556 27,548 1,306 1,681 776 2,973 3,222Computer and mathematical occupations 19 1,695 38 27 41 221 161Architecture and engineering occupations: 128 2,676 123 145 53 213 322
Architects, surveyors, cartographers, and engineers 80 2,241 73 84 11 127 189Drafters, engineering, and mapping technicians 48 435 50 61 42 86 133
Life, physical, and social science occupations 60 1,048 55 51 51 110 126Community and social services occupations 138 1,691 108 120 46 228 232Legal occupations 33 3,033 37 14 6 63 99Education, training, and library occupations 640 7,449 540 850 293 1,124 1,174Arts, design, entertainment, sports, and media occupations 100 3,121 44 53 34 263 268Healthcare practitioners and technical occupations: 438 6,835 361 421 252 751 840
Health diagnosing and treating practitioners and technical occupations 334 5,371 293 328 182 490 628Health technologists and technicians 104 1,464 68 93 70 261 212
Service occupations: 1,263 22,145 1,531 1,522 805 2,407 3,989Healthcare support occupations 80 1,333 176 149 60 181 148Protective service occupations: 352 3,662 371 512 369 696 1,100
Fire fighting, prevention, and law enforcement workers, including supervisors 190 1,116 230 281 240 353 394Other protective service workers, including supervisors 162 2,546 141 231 129 343 706
Food preparation and serving related occupations 337 6,121 358 353 119 593 1,125Building and grounds cleaning and maintenance occupations 360 7,677 460 403 163 591 1,032Personal care and service occupations 134 3,352 166 105 94 346 584
Sales and office occupations: 2,084 39,385 2,256 1,997 922 5,719 9,359Sales and related occupations 996 17,328 947 1,096 295 2,587 3,921Office and administrative support occupations 1,088 22,057 1,309 901 627 3,132 5,438
Farming, fishing, and forestry occupations 140 156 110 343 222 10 47Construction, extraction, and maintenance occupations: 1,043 12,223 1,348 1,411 556 2,063 3,160
Construction and extraction occupations: 685 7,706 973 966 341 1,088 1,698Supervisors, construction and extraction workers 42 773 85 23 36 115 140Construction trades workers 643 6,929 888 943 305 958 1,558Extraction workers 0 4 0 0 0 15 0
Installation, maintenance, and repair occupations 358 4,517 375 445 215 975 1,462Production, transportation, and material moving occupations: 1,827 9,506 2,298 1,798 1,048 2,623 3,786
Production occupations 1,470 4,699 1,544 1,240 774 1,367 1,988Transportation and material moving occupations: 357 4,807 754 558 274 1,256 1,798
Supervisors, transportation and material moving workers 6 262 15 13 0 44 73Aircraft and traffic control occupations 0 112 0 0 0 7 20Motor vehicle operators 169 2,364 423 286 129 754 904Rail, water and other transportation occupations 33 455 42 29 6 34 94Material moving workers 149 1,614 274 230 139 417 707
Source: U.S. Census Bureau, Census 2000
OCCUPATION FOR THE EMPLOYED CIVILIAN POPULATION 16 YEARS AND OVER

COMPREHENSIVE ECONOMIC DEVELOPMENT STRATEGY 2005
Puerto Rico Planning Area • Annual Report • CEDS Update • EDA Investment Number: 01-85-08072 A-17
Universe: Employed civilian population 16 years Data Set: Census 2000 Summary File 3 (SF 3) - Sample Data
Trujillo Alto
UtuadoVega Alta
Vega Baja
Vieques Villalba Yabucoa Yauco
Total: 23,300 6,197 8,612 14,152 1,712 5,303 7,242 10,183Management, professional, and related occupations: 7,847 1,645 1,699 3,382 381 1,184 1,591 2,527
Management, business, and financial operations occupations: 3,135 414 529 1,245 99 258 385 728Management occupations, except farmers and farm managers 1,704 149 261 721 73 104 217 363Farmers and farm managers 17 138 0 23 0 33 16 94Business and financial operations occupations: 1,414 127 268 501 26 121 152 271
Business operations specialists 398 28 100 206 11 43 47 73Financial specialists 1,016 99 168 295 15 78 105 198
Professional and related occupations: 4,712 1,231 1,170 2,137 282 926 1,206 1,799Computer and mathematical occupations 340 39 38 71 4 21 22 39Architecture and engineering occupations: 502 63 58 274 7 69 97 130
Architects, surveyors, cartographers, and engineers 382 35 34 184 7 30 38 91Drafters, engineering, and mapping technicians 120 28 24 90 0 39 59 39
Life, physical, and social science occupations 170 63 17 226 7 33 98 52Community and social services occupations 327 143 110 166 27 82 71 154Legal occupations 362 23 32 67 5 10 16 62Education, training, and library occupations 1,538 637 435 743 127 438 568 654Arts, design, entertainment, sports, and media occupations 319 54 89 108 9 17 32 43Healthcare practitioners and technical occupations: 1,154 209 391 482 96 256 302 665
Health diagnosing and treating practitioners and technical occupations 868 160 247 349 68 187 224 506Health technologists and technicians 286 49 144 133 28 69 78 159
Service occupations: 3,067 1,207 1,390 2,191 479 1,425 1,386 1,701Healthcare support occupations 224 65 138 181 6 64 68 132Protective service occupations: 946 448 404 608 180 801 493 741
Fire fighting, prevention, and law enforcement workers, including supervisors 393 308 183 268 45 596 217 532Other protective service workers, including supervisors 553 140 221 340 135 205 276 209
Food preparation and serving related occupations 722 237 347 547 118 264 280 314Building and grounds cleaning and maintenance occupations 801 361 316 614 136 229 421 384Personal care and service occupations 374 96 185 241 39 67 124 130
Sales and office occupations: 7,498 1,451 2,229 3,521 281 949 1,487 2,844Sales and related occupations 3,020 664 959 1,763 134 377 525 1,575Office and administrative support occupations 4,478 787 1,270 1,758 147 572 962 1,269
Farming, fishing, and forestry occupations 58 183 93 64 34 162 175 353Construction, extraction, and maintenance occupations: 2,545 873 1,257 1,802 314 594 1,112 1,227
Construction and extraction occupations: 1,468 675 757 995 272 482 689 756Supervisors, construction and extraction workers 119 77 26 55 13 18 47 38Construction trades workers 1,328 598 718 940 259 464 642 718Extraction workers 21 0 13 0 0 0 0 0
Installation, maintenance, and repair occupations 1,077 198 500 807 42 112 423 471Production, transportation, and material moving occupations: 2,285 838 1,944 3,192 223 989 1,491 1,531
Production occupations 995 458 1,421 2,274 110 670 1,138 1,058Transportation and material moving occupations: 1,290 380 523 918 113 319 353 473
Supervisors, transportation and material moving workers 58 6 0 24 14 9 0 7Aircraft and traffic control occupations 11 0 0 0 7 6 0 0Motor vehicle operators 773 235 312 487 66 127 170 248Rail, water and other transportation occupations 61 32 0 25 3 18 45 35Material moving workers 387 107 211 382 23 159 138 183
Source: U.S. Census Bureau, Census 2000
OCCUPATION FOR THE EMPLOYED CIVILIAN POPULATION 16 YEARS AND OVER

COMPREHENSIVE ECONOMIC DEVELOPMENT STRATEGY 2005
Puerto Rico Planning Area • Annual Report • CEDS Update • EDA Investment Number: 01-85-08072 A-18
Municipio
Municipal County2000 1999 2000 1999 2000 1999 2000 1999
Puerto Rico 2,161 2,361 139,381 142,291 55,704 57,618 110,795 114,288
Adjuntas 14 14 219 255 128 173 186 226Aguada 28 30 977 964 362 321 854 832Aguadilla 11 44 4,863 5,304 1,954 2,270 4,094 4,371Aguas Buenas 8 10 324 783 226 409 290 661Aibonito 10 13 2,252 2,311 969 971 2,049 2,067Añasco 22 21 3,233 2,864 1,773 1,259 3,042 2,607Arecibo 48 51 4,269 4,144 1,359 1,396 3,449 3,580Arroyo 6 6 611 521 292 256 547 451Barceloneta 19 19 6,674 6,335 2,602 2,525 5,308 4,691Barranquitas 8 8 79 74 20 19 48 59Bayamón 170 195 5,631 6,015 1,278 1,464 3,231 3,688Cabo Rojo 38 37 1,175 1,156 498 490 1,039 1,020Caguas 116 123 5,592 5,557 2,324 2,339 4,481 4,414Camuy 15 16 2,358 2,569 1,448 1,593 2,301 2,459Canóvanas 24 27 1,105 1,311 319 370 804 1,006Carolina 101 115 3,905 3,672 954 908 2,579 2,493Cataño 43 42 1,632 1,449 341 308 792 785Cayey 27 31 2,895 2,968 1,197 1,205 2,491 2,555Ceiba 9 8 379 232 266 141 361 217Ciales 10 10 801 726 327 269 738 659Cidra 26 29 2,934 3,093 1,257 1,210 2,426 2,455Coamo 16 17 1,376 1,525 439 440 1,156 1,299Comerío 4 5 759 750 625 584 745 756Corozal 17 17 970 993 711 766 846 919Culebra a/ a/ a/ a/ a/ a/ a/ a/Dorado 25 23 2,041 1,862 1,210 1,233 1,697 1,546Fajardo 11 16 1,292 1,058 646 523 1,009 802Florida 4 1 39 44 6 9 36 40Guánica 8 9 1,194 1,211 653 635 1,165 1,146
Tabla 9 Numero de Establecimientos:
Table 9 - Number of Establishments:
Numero de Estabecimientos
Number of EstablishmentsTrabajadores de Produccion
Production Workers
Empleo Total y Trabajadores de Produccion en las Industrias manufacturas- Por Municipio -MARZO 2000
Total Employment and Production Workers in the Manufacturing Industries - By Municipal County - MARCH 2000
Ambos Sexos / Both Genders Mujeres / WomenEmpleo Total / Total Employment

COMPREHENSIVE ECONOMIC DEVELOPMENT STRATEGY 2005
Puerto Rico Planning Area • Annual Report • CEDS Update • EDA Investment Number: 01-85-08072 A-19
Municipio
Municipal County2000 1999 2000 1999 2000 1999 2000 1999
Puerto Rico 2,161 2,361 139,381 142,291 55,704 57,618 110,795 114,288
Guayama 22 22 2,789 2,778 943 1,239 2,082 2,087Guayanilla 11 9 234 138 18 18 111 62Guaynabo 82 83 4,769 4,058 1,161 1,108 2,331 2,263Gurabo 30 34 1,509 1,615 460 503 969 1,156Hatillo 22 23 816 817 231 203 608 623Hormigueros 7 7 228 262 84 93 180 193Humacao 46 46 3,751 3,742 1,654 1,532 3,221 3,194Isabela 22 24 1,205 1,807 424 660 1,059 1,625Jayuya 7 7 1,262 1,123 699 637 1,148 992Juana Díaz 22 23 1,192 583 557 190 1,058 488Juncos 20 21 1,349 1,330 570 563 1,215 1,156Lajas 10 13 675 722 538 526 657 678Lares 8 9 739 880 501 572 710 831Las Marías 6 5 39 15 14 0 28 11Las Piedras 23 25 4,750 4,802 1,935 2,242 4,484 4,504Loíza 5 4 291 261 22 86 69 161Luquillo 9 10 786 839 456 496 750 776Manatí 26 31 3,535 3,908 1,134 1,339 2,564 2,956Maricao a/ a/ a/ a/ a/ a/ a/ a/Maunabo 4 4 33 34 21 19 28 25Mayagüez 74 80 6,047 8,465 2,921 3,957 5,383 7,489Moca 11 15 479 406 317 217 433 363Morovis 12 14 758 1,103 600 598 719 957Naguabo 9 10 618 675 363 349 500 532Naranjito 17 19 120 177 55 74 98 152Orocovis 9 9 507 468 406 354 504 450Patillas 11 11 847 844 472 496 826 792Peñuelas 8 8 209 169 26 15 100 123Ponce 123 138 7,613 7,894 2,395 2,522 6,281 6,446
Tabla 9 Numero de Establecimientos:
Empleo Total y Trabajadores de Produccion en las Industrias manufacturas- Por Municipio -MARZO 2000
Numero de Estabecimientos Trabajadores de Produccion
Table 9 - Number of Establishments:
Total Employment and Production Workers in the Manufacturing Industries - By Municipal County - MARCH 2000
Empleo Total / Total EmploymentAmbos Sexos / Both Genders Mujeres / WomenNumber of Establishments Production Workers

COMPREHENSIVE ECONOMIC DEVELOPMENT STRATEGY 2005
Puerto Rico Planning Area • Annual Report • CEDS Update • EDA Investment Number: 01-85-08072 A-20
Municipio
Municipal County2000 1999 2000 1999 2000 1999 2000 1999
Puerto Rico 2,161 2,361 139,381 142,291 55,704 57,618 110,795 114,288
Quebradillas 8 8 900 1,150 534 703 878 1,109Rincón 4 7 170 296 55 165 157 276Rio Grande 15 19 1,237 1,149 385 399 1,096 1,006Sabana Grande 9 9 1,320 1,416 743 808 1,164 1,216Salinas 16 17 584 458 183 167 319 312San Germán 23 21 2,128 152 1,049 1,028 1,964 1,932San Juan 266 318 7,597 6,832 1,790 1,632 3,603 3,695San Lorenzo 19 22 1,858 1,959 909 1,008 1,677 1,754San Sebastián 32 37 1,362 1,212 849 732 1,163 1,100Santa Isabel 6 7 1,278 1,833 563 884 1,081 1,544Toa Alta 21 21 653 684 206 217 477 521Toa Baja 67 63 3,233 3,197 784 719 2,284 2,152Trujillo Alto 33 40 899 916 207 224 639 704Utuado 8 9 300 316 166 192 276 284Vega Alta 18 18 1,192 1,212 270 309 1,051 1,065Vega Baja 40 39 4,675 4,361 2,136 1,878 4,215 3,730Vieques a/ a/ a/ a/ a/ a/ a/ a/Villalba 7 9 489 537 258 280 403 430Yabucoa 12 13 1,377 1,335 825 866 1,294 1,272Yauco 30 28 543 558 87 87 393 422
Tabla 9 Numero de Establecimientos:
Empleo Total y Trabajadores de Produccion en las Industrias manufacturas- Por Municipio -MARZO 2000
Numero de Estabecimientos Trabajadores de Produccion
Table 9 - Number of Establishments:
Total Employment and Production Workers in the Manufacturing Industries - By Municipal County - MARCH 2000
Empleo Total / Total EmploymentAmbos Sexos / Both Genders Mujeres / WomenNumber of Establishments Production Workers

COMPREHENSIVE ECONOMIC DEVELOPMENT STRATEGY 2005
Puerto Rico Planning Area • Annual Report • CEDS Update • EDA Investment Number: 01-85-08072 A-21
TABLA 1 - SERIES SELECCIONADAS DE INGRESO Y PRODUCTO, TOTAL Y PER CAPITA: AÑOS FISCALES TABLE 1 - SELECTED SERIES OF INCOME AND PRODUCT, TOTAL AND PER CAPITA: FISCAL YEARS
1995 1996 1997 1998 1999 2000 2001r 2002r 2003r 2004p
Total a precios corrientes Total in current dollars (En millones de dólares) (In millions of dollars)
Producto bruto 28,452.3 30,357.0 32,342.7 35,110.7 38,281.2 41,418.6 44,046.6 45,071.3 47,438.5 50,320.0 Gross productIngreso neto 23,653.4 24,853.9 26,968.1 28,824.4 29,907.7 32,610.4 34,581.6 35,852.9 38,480.9 41,187.8 Net incomeIngreso personal 27,377.6 29,914.1 32,663.3 34,340.2 36,614.5 38,855.7 41,079.5 42,038.6 44,744.7 46,762.4 Personal incomeIngreso personal disponible 25,590.9 27,975.9 30,607.2 32,065.8 34,041.7 36,238.6 38,405.2 39,251.3 41,648.7 43,610.1 Disposable personal incomeGastos de consumo personal 25,923.3 27,831.0 30,010.8 31,980.3 34,008.0 36,132.6 37,590.3 38,844.9 40,980.0 42,905.2 Personal consumption expendituresProducto bruto interno 42,647.3 45,340.8 48,187.0 54,086.4 57,841.0 61,701.8 69,208.4 71,623.5 74,834.4 78,842.2 Gross domestic productInversión interna bruta de capital fijo 6,558.9 7,589.9 8,528.7 9,118.1 11,477.5 11,852.5 11,684.1 11,355.6 11,362.2 11,996.9 Gross fixed domestic investment
Total a precios constantes de 1954 Total in constant 1954 dollars (En millones de dólares) (In millions of dollars)
Producto bruto 5,491.8 5,671.2 5,864.2 6,054.7 6,300.1 6,487.1 6,585.1 6,562.6 6,696.5 6,881.5 Gross productIngreso personal (1) 6,546.5 7,073.6 7,578.5 7,806.4 8,250.2 8,491.2 8,714.4 8,851.5 9,267.5 9,563.5 Personal income (1)Ingreso personal disponible (1) 6,119.3 6,615.3 7,101.4 7,289.3 7,670.5 7,919.3 8,147.0 8,264.6 8,626.2 8,918.8 Disposable personal income (1)Gastos de consumo personal 6,198.7 6,581.6 6,962.5 7,270.2 7,662.9 7,896.4 7,974.8 8,179.0 8,487.7 8,774.7 Personal consumption expenditures Producto bruto interno 8,069.3 8,256.0 8,658.9 9,137.8 9,630.3 9,945.4 10,573.3 10,670.2 10,691.8 11,007.6 Gross domestic productInversión interna bruta de capital fijo 1,157.7 1,284.8 1,440.7 1,496.4 1,892.4 1,922.0 1,904.6 1,827.2 1,826.8 1,949.4 Gross fixed domestic investment
Per cápita a precios corrientes Per capita in current dollars (En dólares) (In dollars)
Producto bruto 7,761 8,196 8,643 9,313 10,099 10,877 11,507 11,709 12,262 12,947 Gross productIngreso neto 6,452 6,710 7,207 7,645 7,890 8,564 9,034 9,314 9,947 10,597 Net incomeIngreso personal 7,468 8,076 8,729 9,108 9,659 10,204 10,732 10,921 11,566 12,031 Personal incomeIngreso personal disponible 6,980 7,553 8,179 8,505 8,981 9,516 10,033 10,197 10,766 11,220 Disposable personal incomeGastos de consumo personal 7,071 7,514 8,020 8,482 8,972 9,489 9,820 10,091 10,593 11,039 Personal consumption expendituresProducto bruto interno 11,633 12,241 12,877 14,346 15,259 16,203 18,080 18,607 19,344 20,285 Gross domestic product
Per cápita a precios constantes Per capita in constant de 1954 (En dólares) 1954 dollars (In dollars)
Producto bruto 1,498 1,531 1,567 1,606 1,662 1,704 1,720 1,705 1,731 1,771 Gross productIngreso personal 1,786 1,910 2,025 2,071 2,176 2,230 2,277 2,300 2,396 2,461 Personal incomeIngreso personal disponible 1,669 1,786 1,898 1,933 2,024 2,080 2,128 2,147 2,230 2,295 Disposable personal incomeGastos de consumo personal 1,691 1,777 1,861 1,928 2,022 2,074 2,083 2,125 2,194 2,258 Personal consumption expendituresProducto bruto interno 2,201 2,229 2,314 2,424 2,541 2,612 2,762 2,772 2,764 2,832 Gross domestic product
(Continúa - Continue)

COMPREHENSIVE ECONOMIC DEVELOPMENT STRATEGY 2005
Puerto Rico Planning Area • Annual Report • CEDS Update • EDA Investment Number: 01-85-08072 A-22
TABLA 1 - SERIES SELECCIONADAS DE INGRESO Y PRODUCTO, TOTAL Y PER CAPITA: AÑOS FISCALES (CONT.)TABLE 1 - SELECTED SERIES OF INCOME AND PRODUCT, TOTAL AND PER CAPITA: FISCAL YEARS (CONT.)
1995 1996 1997 1998 1999 2000 2001r 2002r 2003r 2004p
Otras estadísticas Other statistics
Crecimiento en el producto bruto (%) Increase in gross product (%) A precios corrientes 6.8 6.7 6.5 8.6 9.0 8.2 6.3 2.3 5.3 6.1 In current prices A precios constantes 3.4 3.3 3.4 3.2 4.1 3.0 1.5 -0.3 2.0 2.8 In constant prices
Ingreso promedio por familia (2) Average family income (2) (En dólares) (In dollars) A precios corrientes 26,137 28,267 30,551 30,968 32,842 34,693 36,488 36,285 35,859 37,990 In current dollars A precios constantes de 1954 6,250 6,684 7,088 7,040 7,400 7,581 7,740 7,818 7,905 8,120 In constant 1954 dollars
Número promedio de personas Average number of persons por familia 3.5 3.5 3.5 3.4 3.4 3.4 3.4 3.4 3.3 3.3 per family
Sueldos y jornales 15,299.7 16,303.0 17,472.4 18,264.0 19,217.9 20,488.8 21,357.7 21,858.6 23,214.4 24,487.7 Salaries and wages (En millones de dólares) (In millions of dollars)
Empleo, total 1,051 1,092 1,128 1,137 1,147 1,159 1,158 1,170 1,211 1,234 Employment, total (En miles de personas) (3) (In thousands of persons) (3)
Productividad (En dólares) (4) 7,678 7,560 7,676 8,037 8,396 8,581 9,131 9,120 8,829 8,920 Productivity (In dollars) (4)
Indice de precios al consumidor Consumer's price index para todas las familias (5) 133.8 140.6 148.2 156.6 164.8 174.2 188.6 197.1 212.9 231.9 for all families (5) Tasa de inflación 4.0 5.1 5.4 5.7 5.2 5.7 8.3 4.5 8.0 8.9 Inflation Rate
Población (En miles de personas) (6) 3,666 3,704 3,742 3,770 3,791 3,808 3,828 3,849 3,869 3,887 Population (In thousands of persons) (6)
r- Cifras revisadas. r- Revised figures. p- Cifras preliminares. p- Preliminary figures.(1) Deflacionado por el índice implícito de precios para deflacionar los gastos de consumo personal. (1) Deflated by implicit price deflators for personal consumption expenditures.(2) El número de familias aquí utilizado es producto de la división de la población total entre el promedio (2) The number of families used here represents the division of the total population by the de personas por familia. Para propósitos del censo de población, una familia consiste de un jefe de average number of persons per family. For the purpose of the population census, hogar y una persona o más que viven en el mismo hogar y están emparentados con el jefe a familly consists of a householder and one or more other persons living in the del hogar por nacimiento, matrimonio o adopción. same household who are related to the householder by birth, marriage or adoption.(3) Departamento del Trabajo y Recursos Humanos, Negociado de Estadísticas, Encuesta de Vivienda. (3) Department of Labor and Human Resources, Bureau of Statistics, Household Survey.(4) Se obtiene dividiendo el producto bruto interno a precios constantes entre el empleo total. (4) Obtained from the division of gross domestic product at constant prices by total employment.(5) 1984=100. (5) 1984=100.(6) Promedio de los estimados de la población al principio y al final del año fiscal. (6) Average of population estimates at the beginning and end of the fiscal year.
Fuente: Junta de Planificación, Programa de Planificación Económica y Social, Source: Puerto Rico Planning Board, Program of Economic and Social Planning, Subprograma de Análisis Económico. Subprogram of Economic Analysis.
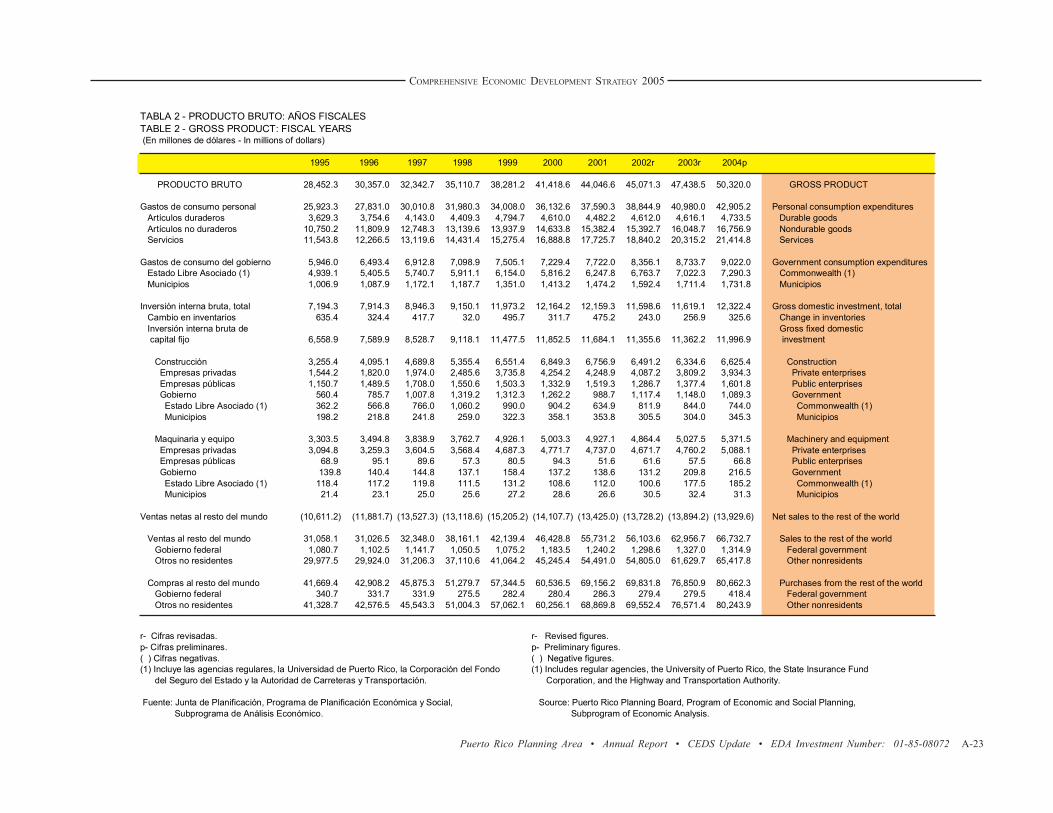
COMPREHENSIVE ECONOMIC DEVELOPMENT STRATEGY 2005
Puerto Rico Planning Area • Annual Report • CEDS Update • EDA Investment Number: 01-85-08072 A-23
TABLA 2 - PRODUCTO BRUTO: AÑOS FISCALES TABLE 2 - GROSS PRODUCT: FISCAL YEARS (En millones de dólares - In millions of dollars)
1995 1996 1997 1998 1999 2000 2001 2002r 2003r 2004p
PRODUCTO BRUTO 28,452.3 30,357.0 32,342.7 35,110.7 38,281.2 41,418.6 44,046.6 45,071.3 47,438.5 50,320.0 GROSS PRODUCT
Gastos de consumo personal 25,923.3 27,831.0 30,010.8 31,980.3 34,008.0 36,132.6 37,590.3 38,844.9 40,980.0 42,905.2 Personal consumption expenditures Artículos duraderos 3,629.3 3,754.6 4,143.0 4,409.3 4,794.7 4,610.0 4,482.2 4,612.0 4,616.1 4,733.5 Durable goods Artículos no duraderos 10,750.2 11,809.9 12,748.3 13,139.6 13,937.9 14,633.8 15,382.4 15,392.7 16,048.7 16,756.9 Nondurable goods Servicios 11,543.8 12,266.5 13,119.6 14,431.4 15,275.4 16,888.8 17,725.7 18,840.2 20,315.2 21,414.8 Services
Gastos de consumo del gobierno 5,946.0 6,493.4 6,912.8 7,098.9 7,505.1 7,229.4 7,722.0 8,356.1 8,733.7 9,022.0 Government consumption expenditures Estado Libre Asociado (1) 4,939.1 5,405.5 5,740.7 5,911.1 6,154.0 5,816.2 6,247.8 6,763.7 7,022.3 7,290.3 Commonwealth (1) Municipios 1,006.9 1,087.9 1,172.1 1,187.7 1,351.0 1,413.2 1,474.2 1,592.4 1,711.4 1,731.8 Municipios
Inversión interna bruta, total 7,194.3 7,914.3 8,946.3 9,150.1 11,973.2 12,164.2 12,159.3 11,598.6 11,619.1 12,322.4 Gross domestic investment, total Cambio en inventarios 635.4 324.4 417.7 32.0 495.7 311.7 475.2 243.0 256.9 325.6 Change in inventories Inversión interna bruta de Gross fixed domestic capital fijo 6,558.9 7,589.9 8,528.7 9,118.1 11,477.5 11,852.5 11,684.1 11,355.6 11,362.2 11,996.9 investment
Construcción 3,255.4 4,095.1 4,689.8 5,355.4 6,551.4 6,849.3 6,756.9 6,491.2 6,334.6 6,625.4 Construction Empresas privadas 1,544.2 1,820.0 1,974.0 2,485.6 3,735.8 4,254.2 4,248.9 4,087.2 3,809.2 3,934.3 Private enterprises Empresas públicas 1,150.7 1,489.5 1,708.0 1,550.6 1,503.3 1,332.9 1,519.3 1,286.7 1,377.4 1,601.8 Public enterprises Gobierno 560.4 785.7 1,007.8 1,319.2 1,312.3 1,262.2 988.7 1,117.4 1,148.0 1,089.3 Government Estado Libre Asociado (1) 362.2 566.8 766.0 1,060.2 990.0 904.2 634.9 811.9 844.0 744.0 Commonwealth (1) Municipios 198.2 218.8 241.8 259.0 322.3 358.1 353.8 305.5 304.0 345.3 Municipios
Maquinaria y equipo 3,303.5 3,494.8 3,838.9 3,762.7 4,926.1 5,003.3 4,927.1 4,864.4 5,027.5 5,371.5 Machinery and equipment Empresas privadas 3,094.8 3,259.3 3,604.5 3,568.4 4,687.3 4,771.7 4,737.0 4,671.7 4,760.2 5,088.1 Private enterprises Empresas públicas 68.9 95.1 89.6 57.3 80.5 94.3 51.6 61.6 57.5 66.8 Public enterprises Gobierno 139.8 140.4 144.8 137.1 158.4 137.2 138.6 131.2 209.8 216.5 Government Estado Libre Asociado (1) 118.4 117.2 119.8 111.5 131.2 108.6 112.0 100.6 177.5 185.2 Commonwealth (1) Municipios 21.4 23.1 25.0 25.6 27.2 28.6 26.6 30.5 32.4 31.3 Municipios
Ventas netas al resto del mundo (10,611.2) (11,881.7) (13,527.3) (13,118.6) (15,205.2) (14,107.7) (13,425.0) (13,728.2) (13,894.2) (13,929.6) Net sales to the rest of the world
Ventas al resto del mundo 31,058.1 31,026.5 32,348.0 38,161.1 42,139.4 46,428.8 55,731.2 56,103.6 62,956.7 66,732.7 Sales to the rest of the world Gobierno federal 1,080.7 1,102.5 1,141.7 1,050.5 1,075.2 1,183.5 1,240.2 1,298.6 1,327.0 1,314.9 Federal government Otros no residentes 29,977.5 29,924.0 31,206.3 37,110.6 41,064.2 45,245.4 54,491.0 54,805.0 61,629.7 65,417.8 Other nonresidents
Compras al resto del mundo 41,669.4 42,908.2 45,875.3 51,279.7 57,344.5 60,536.5 69,156.2 69,831.8 76,850.9 80,662.3 Purchases from the rest of the world Gobierno federal 340.7 331.7 331.9 275.5 282.4 280.4 286.3 279.4 279.5 418.4 Federal government Otros no residentes 41,328.7 42,576.5 45,543.3 51,004.3 57,062.1 60,256.1 68,869.8 69,552.4 76,571.4 80,243.9 Other nonresidents
r- Cifras revisadas. r- Revised figures.p- Cifras preliminares. p- Preliminary figures.( ) Cifras negativas. ( ) Negative figures.(1) Incluye las agencias regulares, la Universidad de Puerto Rico, la Corporación del Fondo (1) Includes regular agencies, the University of Puerto Rico, the State Insurance Fund del Seguro del Estado y la Autoridad de Carreteras y Transportación. Corporation, and the Highway and Transportation Authority.
Fuente: Junta de Planificación, Programa de Planificación Económica y Social, Source: Puerto Rico Planning Board, Program of Economic and Social Planning, Subprograma de Análisis Económico. Subprogram of Economic Analysis.

COMPREHENSIVE ECONOMIC DEVELOPMENT STRATEGY 2005
Puerto Rico Planning Area • Annual Report • CEDS Update • EDA Investment Number: 01-85-08072 A-24
TABLA 3 - PRODUCTO BRUTO A PRECIOS CONSTANTES DE 1954: AÑOS FISCALES TABLE 3 - GROSS PRODUCT IN CONSTANT 1954 DOLLARS: FISCAL YEARS (En millones de dólares - In millions of dollars)
1995 1996 1997 1998 1999 2000 2001 2002r 2003r 2004p
PRODUCTO BRUTO 5,491.8 5,671.2 5,864.2 6,054.7 6,300.1 6,487.1 6,585.1 6,562.6 6,696.5 6,881.5 GROSS PRODUCT
Gastos de consumo personal 6,198.7 6,581.6 6,962.5 7,270.2 7,662.9 7,896.4 7,974.8 8,179.0 8,487.7 8,774.7 Personal consumption expenditures Artículos duraderos 1,165.0 1,194.6 1,298.6 1,342.7 1,489.0 1,407.5 1,435.9 1,437.7 1,417.4 1,430.4 Durable goods Artículos no duraderos 2,480.2 2,703.0 2,854.7 2,896.2 3,043.2 3,130.6 3,169.2 3,194.0 3,234.3 3,367.7 Nondurable goods Servicios 2,553.6 2,684.1 2,809.2 3,031.4 3,130.6 3,358.4 3,369.8 3,547.3 3,836.0 3,976.6 Services
Gastos de consumo del gobierno 1,483.8 1,558.2 1,639.1 1,669.5 1,742.3 1,644.9 1,708.9 1,803.1 1,848.1 1,851.4 Government consumption expenditure Estado Libre Asociado (1) 1,221.2 1,288.6 1,352.9 1,371.9 1,402.7 1,288.6 1,349.5 1,421.0 1,433.7 1,438.2 Commonwealth (1) Municipios 262.6 269.7 286.2 297.6 339.6 356.3 359.4 382.1 414.4 413.2 Municipios
Inversión interna bruta, total 1,312.9 1,352.7 1,539.6 1,504.1 2,001.3 1,990.3 2,013.8 1,872.5 1,874.2 2,004.4 Gross domestic investment, total Cambio en inventarios 155.2 67.9 98.9 7.7 108.9 68.4 109.3 45.2 47.4 55.1 Change in inventories Inversión interna bruta de Gross fixed domestic capital fijo 1,157.7 1,284.8 1,440.7 1,496.4 1,892.4 1,922.0 1,904.6 1,827.2 1,826.8 1,949.4 investment
Construcción 527.4 649.7 728.7 811.7 971.7 1,000.5 989.7 943.8 909.0 923.0 Construction Empresas privadas 250.2 288.8 306.7 376.7 554.1 621.4 622.4 594.3 546.6 548.1 Private enterprises Empresas públicas 186.4 236.3 265.4 235.0 223.0 194.7 222.5 187.1 197.6 223.2 Public enterprises Gobierno 90.8 124.7 156.6 199.9 194.6 184.4 144.8 162.5 164.7 151.8 Government Estado Libre Asociado (1) 58.7 89.9 119.0 160.7 146.8 132.1 93.0 118.1 121.1 103.6 Commonwealth (1) Municipios 32.1 34.7 37.6 39.3 47.8 52.3 51.8 44.4 43.6 48.1 Municipios
Maquinaria y equipo 630.3 635.1 712.0 684.7 920.7 921.5 914.8 883.4 917.8 1,026.4 Machinery and equipment Empresas privadas 590.6 592.3 668.7 649.4 875.5 878.8 879.5 848.4 869.0 972.2 Private enterprises Empresas públicas 13.1 17.3 16.6 10.4 15.2 17.4 9.6 11.2 10.5 12.8 Public enterprises Gobierno 26.6 25.5 26.7 24.9 30.0 25.3 25.7 23.8 38.3 41.4 Government Estado Libre Asociado (1) 22.5 21.3 22.1 20.3 24.8 20.0 20.8 18.3 32.4 35.4 Commonwealth (1) Municipios 4.1 4.2 4.5 4.7 5.1 5.3 4.9 5.5 5.9 6.0 Municipios
Ventas netas al resto del mundo (3,503.6) (3,821.3) (4,277.0) (4,389.1) (5,106.4) (5,044.5) (5,112.4) (5,292.0) (5,513.5) (5,749.0) Net sales to the rest of the world
Ventas al resto del mundo 4,981.4 4,712.8 4,593.8 5,133.2 5,257.0 5,620.4 6,617.6 6,450.1 7,104.4 7,407.8 Sales to the rest of the world Gobierno federal 257.9 260.7 264.9 238.8 242.3 258.6 263.1 273.4 274.8 268.9 Federal government Otros no residentes 4,723.5 4,452.1 4,328.9 4,894.4 5,014.7 5,361.8 6,354.5 6,176.6 6,829.5 7,138.9 Other nonresidents
Compras al resto del mundo 8,485.1 8,534.1 8,870.8 9,522.3 10,363.4 10,664.9 11,730.0 11,742.1 12,617.9 13,156.8 Purchases from the rest of the world Gobierno federal 81.3 78.4 77.0 62.6 63.6 61.3 60.7 58.8 57.9 85.6 Federal government Otros no residentes 8,403.7 8,455.7 8,793.8 9,459.7 10,299.8 10,603.7 11,669.3 11,683.3 12,560.0 13,071.2 Other nonresidents
r- Cifras revisadas. r- Revised figures. p- Cifras preliminares. p- Preliminary figures. ( ) Cifras negativas. ( ) Negative figures. (1) Incluye las agencias regulares, la Universidad de Puerto Rico, (1) Includes regular agencies, the University of Puerto Rico, la Corporación del Fondo del Seguro del Estado the State Insurance Fund Corporation, y la Autoridad de Carreteras y Transportación. and the Highway and Transportation Authority.
Fuente: Junta de Planificación, Programa de Planificación Económica y Social, Source: Puerto Rico Planning Board, Program of Economic and Social Planning, Subprograma de Análisis Económico. Subprogram of Economic Analysis.

COMPREHENSIVE ECONOMIC DEVELOPMENT STRATEGY 2005
Puerto Rico Planning Area • Annual Report • CEDS Update • EDA Investment Number: 01-85-08072 A-25
TABLA 8 - INVERSION INTERNA BRUTA DE CAPITAL FIJO: AÑOS FISCALES TABLE 8 - GROSS FIXED DOMESTIC INVESTMENT: FISCAL YEARS (En millones de dólares - In millions of dollars)
1995 1996 1997 1998 1999 2000 2001 2002r 2003r 2004p
TOTAL 6,558.9 7,589.9 8,528.7 9,118.1 11,477.5 11,852.5 11,684.1 11,355.6 11,362.2 11,996.9 TOTAL
Construcción (1) 3,255.4 4,095.1 4,689.8 5,355.4 6,551.4 6,849.3 6,756.9 6,491.2 6,334.6 6,625.4 Construction (1)
Vivienda 859.9 1,066.5 1,242.4 1,459.2 2,089.7 1,905.8 2,166.5 2,400.1 2,340.2 2,355.4 Housing
Privada 743.0 956.8 1,106.3 1,341.5 1,901.7 1,750.9 2,029.4 2,245.3 2,106.7 2,155.6 Private
Pública 116.9 109.7 136.1 117.7 188.0 154.9 137.1 154.8 233.5 199.8 Public
Edificios industriales y Industrial and commercial comerciales (2) 1,835.1 2,243.0 2,439.6 2,577.1 3,149.4 3,681.2 3,601.8 2,973.7 2,846.4 3,180.7 buildings (2)
Empresas privadas 801.2 863.2 867.7 1,144.2 1,834.1 2,503.3 2,219.5 1,841.9 1,702.6 1,778.7 Private enterprises
Empresas públicas 1,033.9 1,379.8 1,571.9 1,432.9 1,315.3 1,178.0 1,382.2 1,131.8 1,143.9 1,402.0 Public enterprises
Carreteras, escuelas y otras Roads, schools, and other obras públicas 560.4 785.6 1,007.8 1,319.2 1,312.3 1,262.2 988.7 1,117.5 1,148.0 1,089.3 public works
Gobierno del E.L.A. 362.2 566.8 766.0 1,060.2 990.0 904.2 634.9 811.9 844.0 744.0 Commonwealth government
Gobiernos municipales 198.2 218.8 241.8 259.0 322.3 358.1 353.8 305.5 304.0 345.3 Municipal governments
Maquinaria y equipo 3,303.5 3,494.8 3,838.9 3,762.7 4,926.1 5,003.3 4,927.1 4,864.4 5,027.5 5,371.5 Machinery and equipment
Empresas privadas 3,094.8 3,259.3 3,604.5 3,568.4 4,687.3 4,771.7 4,737.0 4,671.7 4,760.2 5,088.1 Private enterprises
Empresas públicas (3) 68.9 95.1 89.6 57.3 80.5 94.3 51.6 61.6 57.5 66.8 Public enterprises (3)
Gobierno (4) 139.8 140.4 144.8 137.1 158.4 137.2 138.6 131.2 209.8 216.5 Government (4)
r- Cifras revisadas. r- Revised figures. p- Cifras preliminares. p- Preliminary figures.(1) No incluye las inversiones de la Autoridad de las Navieras (1) Does not include investments by the Puerto Rico Maritime de Puerto Rico. Shipping Authority.(2) Incluye instalaciones eléctricas y telefónicas; acueductos y (2) Includes electric and telephone installations, aqueducts and alcantarillados; y refinerías. sewers, and refineries.(3) Incluye las inversiones de la Autoridad de las Navieras (3) Includes investments by the Puerto Rico Maritime de Puerto Rico. Shipping Authority.(4) Incluye gobierno del E.L.A. y municipios. (4) Includes Commonwealth government and municipios.
Fuente: Junta de Planificación, Programa de Planificación Económica y Social, Source: Puerto Rico Planning Board, Program of Economic and Social Planning, Subprograma de Análisis Económico. Subprogram of Economic Analysis.

COMPREHENSIVE ECONOMIC DEVELOPMENT STRATEGY 2005
Puerto Rico Planning Area • Annual Report • CEDS Update • EDA Investment Number: 01-85-08072 A-26
TABLA 12 - INGRESO NETO INTERNO DE LA MANUFACTURA: AÑOS FISCALES TABLE 12 - NET MANUFACTURING DOMESTIC INCOME: FISCAL YEARS (En millones de dólares - In millions of dollars)
1995 1996 1997 1998 1999 2000 2001 2002r 2003r 2004p
TOTAL 16,684.5 17,210.9 17,969.1 21,529.3 21,661.7 22,348.3 27,389.8 29,454.0 30,624.6 32,169.3 TOTAL
Alimentos y productos relacionados 2,325.5 1,772.2 1,687.9 1,687.1 1,500.5 1,513.3 1,571.5 1,653.2 1,800.9 1,840.3 Food and kindred products
Productos de tabaco 85.3 85.0 77.4 76.8 79.3 54.7 72.5 54.6 100.6 128.0 Tobacco products
Productos textiles 38.0 43.2 41.3 37.7 30.4 18.8 30.6 30.0 5.4 6.1 Textile mill products
Ropa y productos relacionados 578.0 604.1 571.2 554.6 557.7 558.2 533.8 494.3 420.0 567.9 Apparel and related products
Muebles y artículos de madera 61.4 64.6 69.0 65.1 69.7 80.2 74.5 78.9 79.8 83.8 Furniture and wood products
Impresos y publicaciones 188.7 190.2 209.3 221.1 254.2 253.9 224.2 206.9 235.5 254.3 Printing and publishing
Productos químicos y derivados 9,347.0 9,804.9 10,639.0 13,762.0 13,302.1 13,815.5 16,909.1 18,700.8 19,013.5 20,065.7 Chemical and allied products
Productos de piedra, arcilla y cristal 157.9 171.3 190.3 180.8 204.5 191.0 197.7 187.0 194.2 190.4 Stone, clay, and glass products
Maquinaria y productos metálicos 3,139.4 3,767.9 3,777.3 4,240.3 4,978.8 5,246.4 7,230.1 7,654.6 8,294.4 8,480.1 Machinery and metal products
Productos de papel 71.8 75.8 81.7 83.1 87.6 80.6 85.7 80.7 70.4 62.7 Paper and allied products
Productos de cuero 180.3 173.2 196.3 158.9 130.3 113.3 86.5 59.7 42.6 46.7 Leather products
Otra manufactura 511.3 458.7 428.4 461.9 466.5 422.3 373.7 253.3 367.3 443.2 Other manufacturing
r - Cifras revisadas. r- Revised figures. p- Cifras preliminares. p- Preliminary figures.
Fuente: Junta de Planificación, Programa de Planificación Económica y Social, Source: Puerto Rico Planning Board, Program of Economic and Social Planning, Subprograma de Análisis Económico. Subprogram of Economic Analysis.
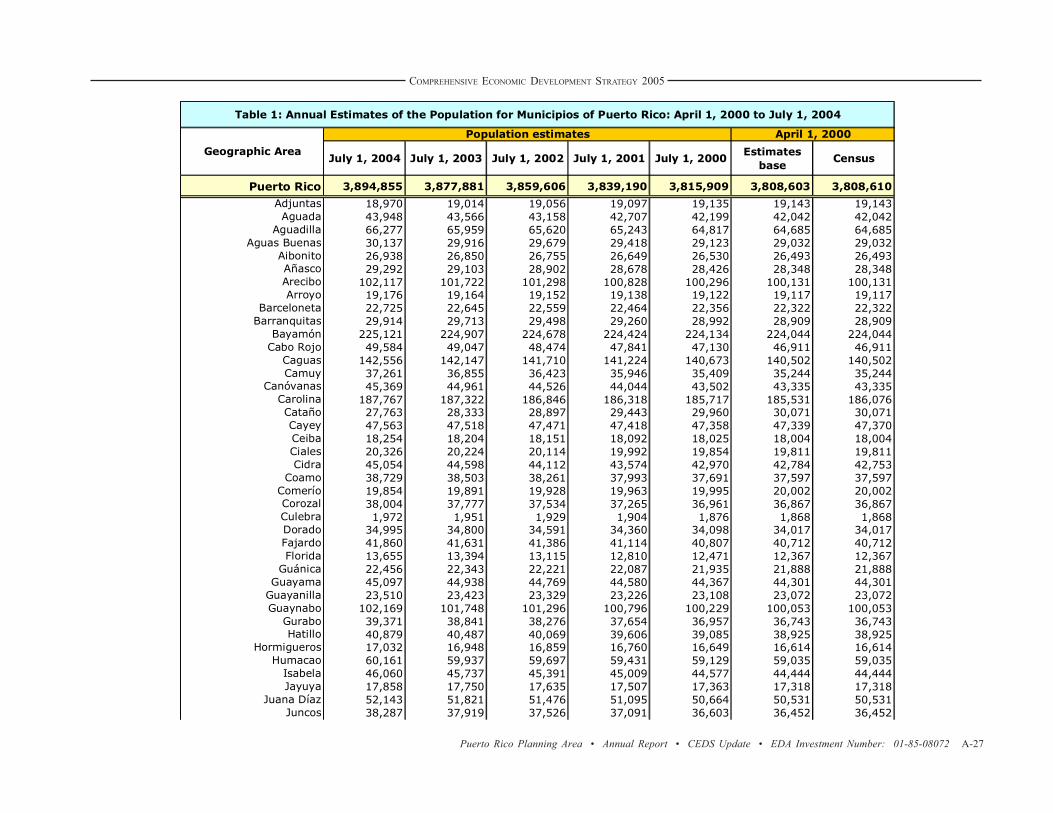
COMPREHENSIVE ECONOMIC DEVELOPMENT STRATEGY 2005
Puerto Rico Planning Area • Annual Report • CEDS Update • EDA Investment Number: 01-85-08072 A-27
July 1, 2004 July 1, 2003 July 1, 2002 July 1, 2001 July 1, 2000Estimates
baseCensus
Puerto Rico 3,894,855 3,877,881 3,859,606 3,839,190 3,815,909 3,808,603 3,808,610
.Adjuntas 18,970 19,014 19,056 19,097 19,135 19,143 19,143.Aguada 43,948 43,566 43,158 42,707 42,199 42,042 42,042
.Aguadilla 66,277 65,959 65,620 65,243 64,817 64,685 64,685.Aguas Buenas 30,137 29,916 29,679 29,418 29,123 29,032 29,032
.Aibonito 26,938 26,850 26,755 26,649 26,530 26,493 26,493.Añasco 29,292 29,103 28,902 28,678 28,426 28,348 28,348.Arecibo 102,117 101,722 101,298 100,828 100,296 100,131 100,131.Arroyo 19,176 19,164 19,152 19,138 19,122 19,117 19,117
.Barceloneta 22,725 22,645 22,559 22,464 22,356 22,322 22,322.Barranquitas 29,914 29,713 29,498 29,260 28,992 28,909 28,909
.Bayamón 225,121 224,907 224,678 224,424 224,134 224,044 224,044.Cabo Rojo 49,584 49,047 48,474 47,841 47,130 46,911 46,911
.Caguas 142,556 142,147 141,710 141,224 140,673 140,502 140,502.Camuy 37,261 36,855 36,423 35,946 35,409 35,244 35,244
.Canóvanas 45,369 44,961 44,526 44,044 43,502 43,335 43,335.Carolina 187,767 187,322 186,846 186,318 185,717 185,531 186,076.Cataño 27,763 28,333 28,897 29,443 29,960 30,071 30,071.Cayey 47,563 47,518 47,471 47,418 47,358 47,339 47,370.Ceiba 18,254 18,204 18,151 18,092 18,025 18,004 18,004.Ciales 20,326 20,224 20,114 19,992 19,854 19,811 19,811.Cidra 45,054 44,598 44,112 43,574 42,970 42,784 42,753
.Coamo 38,729 38,503 38,261 37,993 37,691 37,597 37,597.Comerío 19,854 19,891 19,928 19,963 19,995 20,002 20,002.Corozal 38,004 37,777 37,534 37,265 36,961 36,867 36,867.Culebra 1,972 1,951 1,929 1,904 1,876 1,868 1,868.Dorado 34,995 34,800 34,591 34,360 34,098 34,017 34,017.Fajardo 41,860 41,631 41,386 41,114 40,807 40,712 40,712.Florida 13,655 13,394 13,115 12,810 12,471 12,367 12,367
.Guánica 22,456 22,343 22,221 22,087 21,935 21,888 21,888.Guayama 45,097 44,938 44,769 44,580 44,367 44,301 44,301
.Guayanilla 23,510 23,423 23,329 23,226 23,108 23,072 23,072.Guaynabo 102,169 101,748 101,296 100,796 100,229 100,053 100,053
.Gurabo 39,371 38,841 38,276 37,654 36,957 36,743 36,743.Hatillo 40,879 40,487 40,069 39,606 39,085 38,925 38,925
.Hormigueros 17,032 16,948 16,859 16,760 16,649 16,614 16,614.Humacao 60,161 59,937 59,697 59,431 59,129 59,035 59,035
.Isabela 46,060 45,737 45,391 45,009 44,577 44,444 44,444.Jayuya 17,858 17,750 17,635 17,507 17,363 17,318 17,318
.Juana Díaz 52,143 51,821 51,476 51,095 50,664 50,531 50,531.Juncos 38,287 37,919 37,526 37,091 36,603 36,452 36,452
Table 1: Annual Estimates of the Population for Municipios of Puerto Rico: April 1, 2000 to July 1, 2004
Geographic Area
Population estimates April 1, 2000

COMPREHENSIVE ECONOMIC DEVELOPMENT STRATEGY 2005
Puerto Rico Planning Area • Annual Report • CEDS Update • EDA Investment Number: 01-85-08072 A-28
.Lajas 27,170 26,988 26,794 26,579 26,336 26,261 26,261
.Lares 36,108 35,768 35,406 35,005 34,554 34,415 34,415.Las Marías 11,612 11,501 11,383 11,253 11,106 11,061 11,061
.Las Piedras 36,603 36,177 35,723 35,221 34,658 34,485 34,485.Loíza 33,509 33,315 33,107 32,877 32,617 32,537 32,537
.Luquillo 20,329 20,227 20,118 19,997 19,859 19,817 19,817.Manatí 47,501 47,082 46,634 46,139 45,581 45,409 45,409
.Maricao 6,519 6,505 6,490 6,474 6,455 6,449 6,449.Maunabo 12,854 12,832 12,808 12,781 12,750 12,741 12,741
.Mayagüez 97,350 97,624 97,891 98,146 98,383 98,434 98,434.Moca 41,841 41,410 40,951 40,443 39,873 39,697 39,697
.Morovis 31,430 31,136 30,822 30,476 30,085 29,965 29,965.Naguabo 24,082 24,017 23,947 23,869 23,780 23,753 23,753.Naranjito 30,235 30,130 30,018 29,894 29,753 29,709 29,709.Orocovis 24,660 24,497 24,322 24,129 23,911 23,844 23,844
.Patillas 20,301 20,271 20,240 20,204 20,164 20,152 20,152.Peñuelas 28,037 27,773 27,490 27,178 26,827 26,719 26,719
.Ponce 185,744 185,927 186,106 186,276 186,434 186,468 186,475.Quebradillas 26,713 26,460 26,189 25,890 25,554 25,450 25,450
.Rincón 15,577 15,414 15,241 15,049 14,833 14,767 14,767.Río Grande 54,423 54,011 53,570 53,082 52,532 52,362 52,362
.Sabana Grande 26,878 26,690 26,488 26,265 26,013 25,935 25,935.Salinas 31,943 31,778 31,600 31,404 31,182 31,113 31,113
.San Germán 37,732 37,607 37,474 37,325 37,157 37,105 37,105.San Juan 433,319 433,727 434,116 434,496 434,847 434,919 434,374
.San Lorenzo 42,806 42,444 42,057 41,628 41,146 40,997 40,997.San Sebastián 45,857 45,526 45,173 44,782 44,340 44,204 44,204
.Santa Isabel 22,376 22,234 22,082 21,914 21,724 21,665 21,665.Toa Alta 70,950 69,524 68,006 66,342 64,492 63,929 63,929.Toa Baja 95,432 95,164 94,877 94,559 94,197 94,085 94,085
.Trujillo Alto 80,431 79,485 78,476 77,362 76,112 75,728 75,728.Utuado 35,437 35,417 35,395 35,372 35,344 35,336 35,336
.Vega Alta 38,911 38,711 38,497 38,261 37,993 37,910 37,910.Vega Baja 63,710 63,354 62,974 62,553 62,076 61,929 61,929
.Vieques 9,253 9,224 9,193 9,158 9,118 9,106 9,106.Villalba 29,277 29,003 28,711 28,388 28,025 27,913 27,913
.Yabucoa 40,061 39,899 39,725 39,532 39,314 39,246 39,246.Yauco 47,680 47,422 47,145 46,838 46,491 46,384 46,384
Release Date: April 14, 2005
Note: The April 1, 2000 Population Estimates base reflects changes to the Census 2000 population from the Count Question Resolution program and geographic program revisions. Dash (-) represents zero or rounds to zero. (X) Not applicable
Suggested Citation:
Table 1: Annual Estimates of the Population for Municipios of Puerto Rico: April 1, 2000 to July 1, 2004 (PRM-EST2004-01)
Source: Population Division, U.S. Census Bureau
July 1, 2004 July 1, 2003 July 1, 2002 July 1, 2001 July 1, 2000Estimates
baseCensus
Table 1: Annual Estimates of the Population for Municipios of Puerto Rico: April 1, 2000 to July 1, 2004
Geographic Area
Population estimates April 1, 2000

COMPREHENSIVE ECONOMIC DEVELOPMENT STRATEGY 2005
Puerto Rico Planning Area • Annual Report • CEDS Update • EDA Investment Number: 01-85-08072 A-29
TABLA 15 - INGRESO PERSONAL: AÑOS FISCALES TABLE 15 - PERSONAL INCOME: FISCAL YEARS (En millones de dólares - In millions of dollars)
1995 1996 1997 1998 1999 2000 2001 2002r 2003r 2004p
INGRESO PERSONAL 27,377.6 29,914.1 32,663.3 34,340.2 36,614.5 38,855.7 41,079.5 42,038.6 44,744.7 46,762.4 PERSONAL INCOME
Compensación a empleados 17,773.0 18,957.9 20,261.5 21,155.8 22,098.1 23,504.0 24,389.0 25,080.4 26,726.2 28,281.7 Employees' compensation
Empresas 12,292.5 12,901.3 13,798.9 14,652.4 15,275.0 16,644.4 16,857.8 17,167.6 18,062.0 19,163.8 Business Gobierno 4,440.3 4,841.2 5,220.1 5,251.2 5,529.6 5,477.7 5,991.9 6,302.8 7,005.8 7,388.5 Government Personas e instituciones sin fines Household and nonprofit de lucro 377.7 465.1 478.9 488.5 512.5 497.3 614.1 634.4 673.4 753.3 institutions Resto del mundo 662.5 750.2 763.6 763.8 781.0 884.7 925.2 975.5 985.1 976.2 Rest of the world
Menos: Aportaciones a sistemas de Less: Contributions for social seguridad social 3,077.8 3,321.7 3,459.7 3,713.3 3,750.8 3,978.5 4,206.1 4,293.1 4,683.4 4,846.0 insurance
Empleados 1,242.6 1,342.6 1,385.4 1,502.9 1,510.1 1,596.5 1,724.4 1,776.6 1,907.7 1,997.2 Employees Patronos 1,835.2 1,979.1 2,074.3 2,210.4 2,240.7 2,382.0 2,481.7 2,516.5 2,775.8 2,848.7 Employers
Ingresos procedentes de la propiedad 4,784.9 5,432.3 5,997.5 6,357.4 6,772.1 7,594.3 8,024.6 7,615.7 8,404.4 8,762.0 Proprietors' income
Ganancia de empresas no Income of unincorporated incorporadas 1,768.0 1,953.1 2,119.0 2,130.1 2,241.4 2,306.9 2,311.2 2,301.9 2,416.5 2,655.6 enterprises Dividendos de corporaciones Dividends of domestic locales 88.9 94.0 102.2 112.2 157.3 167.7 187.3 201.8 229.6 249.4 corporations Ingresos misceláneos y dividendos Miscellaneous income and recibidos del exterior 8.8 6.3 10.1 12.1 12.7 14.8 17.6 16.4 13.3 15.3 dividends received from abroad Ganancia de personas por Rental income of arrendamiento 1,386.2 1,453.2 1,836.7 1,731.1 2,140.7 2,541.7 3,030.8 3,182.5 3,342.0 3,536.1 persons Intereses recibidos por personas 1,533.0 1,925.7 1,929.5 2,371.9 2,220.1 2,563.4 2,477.5 1,913.1 2,402.9 2,305.6 Personal interest income
Pagos de transferencia 7,897.5 8,845.6 9,863.9 10,540.3 11,495.0 11,735.9 12,871.9 13,635.6 14,297.5 14,564.5 Transfer payments
Gobierno del E.L.A. Commonwealth government y municipios 1,392.7 1,637.8 2,065.2 2,187.4 2,395.3 2,589.2 2,988.3 3,147.4 3,116.4 3,251.4 and municipios Gobierno federal 5,676.0 6,252.6 6,777.8 7,002.6 7,684.6 7,677.3 8,216.2 8,691.4 9,391.5 9,431.8 Federal government Gobiernos estatales de E.E.U.U. 18.0 17.0 16.7 18.1 17.2 14.5 11.2 17.1 19.1 16.4 U.S. state governments Empresas 444.2 553.0 583.6 848.2 771.4 884.9 1,071.1 1,094.9 1,077.7 1,115.4 Business Otros no residentes 366.6 385.1 420.6 483.9 626.6 570.0 585.2 684.8 692.9 749.4 Other nonresidents
r - Cifras revisadas. r - Revised figures. p- Cifras preliminares. p- Preliminary figures.
Fuente: Junta de Planificación, Programa de Planificación Económica y Social, Source: Puerto Rico Planning Board, Program of Economic and Social Planning, Subprograma de Análisis Económico. Subprogram of Economic Analysis.

COMPREHENSIVE ECONOMIC DEVELOPMENT STRATEGY 2005
Puerto Rico Planning Area • Annual Report • CEDS Update • EDA Investment Number: 01-85-08072 A-30
TABLA 23 - EXPORTACIONES DE MERCANCIA REGISTRADA POR SISTEMA DE CLASIFICACION INDUSTRIAL DE AMERICA DEL NORTE (SCIAN): AÑOS FISCALES TABLE 23 - EXPORTS OF RECORDED MERCHANDISE BY NORTH AMERICAN INDUSTRIAL CLASSIFICATION SYSTEM (NAICS): FISCAL YEARS (En millones de dólares - In millions of dollars)
SCIAN / NAICS 1995 1996 1997 1998 1999 2000 2001 2002 2003 2004
EXPORTACIONES REGISTRADAS, TOTAL 23,811.3 22,944.4 23,946.8 30,272.9 34,901.8 38,465.7 46,900.8 47,172.3 55,175.3 55,080.2 RECORDED EXPORTS, TOTAL
11 Agricultura, silvicultura, pesca y caza 89.1 69.2 85.0 84.4 71.9 89.6 66.7 70.5 36.9 40.6 Agriculture, forestry, fishing and hunting
21 Minería 13.1 9.6 11.3 59.8 33.0 39.0 7.2 5.4 4.1 2.7 Mining
31-33 Manufactura 23,326.1 22,562.5 23,567.1 29,823.3 34,480.5 37,993.1 46,442.3 46,722.9 54,690.1 54,601.7 Manufacturing
311 Alimentos 2,720.5 3,208.5 3,265.3 3,544.9 4,115.4 3,745.8 3,488.6 3,553.5 3,265.4 2,663.8 Food312 Productos de bebidas y de tabaco 296.6 242.3 267.6 294.5 239.5 227.5 353.4 278.6 304.0 338.8 Beverage and tobacco products
313-314 Textiles 148.7 150.8 111.4 72.1 75.6 80.1 79.3 75.4 106.2 125.9 Textiles315 Ropa 755.9 681.9 696.2 734.0 654.6 617.2 601.5 545.8 431.1 316.9 Apparel316 Cuero y productos afines 463.9 357.9 383.0 446.1 379.4 317.7 261.5 159.7 95.6 101.9 Leather and allied products321 Productos de madera 23.0 20.9 11.3 8.8 10.9 9.6 14.3 7.0 8.4 23.0 Wood products322 Papel 62.1 66.9 31.2 36.5 29.2 30.4 30.2 42.8 23.8 27.0 Paper323 Imprenta 63.0 53.2 45.9 51.2 42.6 47.3 41.6 31.3 32.8 15.5 Printing324 Productos de petróleo y de carbón 298.5 248.4 227.3 179.0 150.0 229.7 257.3 77.3 389.7 476.2 Petroleum and coal products325 Químicos 11,076.9 9,879.4 10,616.2 15,737.6 19,578.2 22,624.9 30,767.1 33,307.1 39,603.9 37,632.6 Chemicals3254 Farmacéuticos y medicinas 6,058.3 6,241.1 8,927.5 13,975.9 18,097.9 21,265.6 29,096.4 31,425.9 36,645.8 35,196.7 Pharmaceuticals and medicines326 Productos de plástico y de goma 127.2 139.2 135.4 127.3 128.1 143.1 133.0 107.5 142.7 127.4 Plastics and rubber products327 Productos de minerales no metálicos 52.5 53.5 69.4 43.4 42.6 52.5 47.1 64.4 79.1 73.2 Nonmetallic mineral products331 Metales primarios 30.6 19.8 22.6 48.9 27.0 32.0 205.0 78.2 78.8 75.1 Primary metals332 Productos fabricados de metal 71.9 69.2 81.1 75.7 78.3 67.5 95.0 102.8 74.1 81.1 Fabricated metal products333 Maquinaria 509.5 395.8 453.4 617.0 662.4 709.1 680.4 508.7 616.8 614.6 Machinery334 Productos de computadora y electrónicos 3,458.8 4,066.9 4,218.3 4,869.8 5,193.3 6,189.4 6,094.5 4,404.7 5,686.3 7,145.9 Computer and electronic products3341 Computadoras y equipo periférico 1,359.7 2,613.6 3,139.1 3,556.8 3,599.8 4,223.7 4,667.3 3,390.6 4,414.8 4,969.8 Computers and peripheral equipment335 Equipos eléctricos, enseres Electrical equipment, appliance,
y componentes 1,392.4 1,216.2 1,234.3 1,193.2 1,044.7 1,053.7 1,213.8 984.3 1,200.4 1,213.2 and component336 Equipo de transportación 194.8 159.4 157.0 154.5 166.4 191.5 210.3 252.7 223.6 292.9 Transportation equipment337 Muebles y productos relacionados 20.4 18.4 19.0 12.9 21.1 18.1 16.5 22.4 17.2 10.2 Furniture and related products339 Manufactura miscelánea 1,559.0 1,513.9 1,521.1 1,575.8 1,841.3 1,606.0 1,851.9 2,118.9 2,310.2 3,246.5 Miscellaneous manufacturing3391 Equipos y materiales de uso médico 1,413.7 1,413.5 1,423.6 1,493.6 1,762.5 1,504.7 1,755.9 2,068.5 2,250.7 3,165.6 Medical equipment and supplies
Otros sectores (1) 383.1 303.1 283.4 305.3 316.5 344.1 384.6 373.4 444.1 435.2 Other sectors (1)
(1) Incluye servicios de reparación y mercancía no clasificada. (1) Includes repair services and merchandise not classified.
Nota: La clasificación de mercancía registrada de acuerdo al Sistema de Clasificación Industrial Note: The classification of recorded merchandise according to the North American Industrial de América del Norte no equivale necesariamente a la Clasificación Industrial Uniforme. Classification System does not necessarily equals the Standard Industrial Classification.
Fuente: Junta de Planificación, Programa de Planificación Económica y Social, Source: Puerto Rico Planning Board, Program of Economic and Social Planning, Subprograma de Análisis Económico. Subprogram of Economic Analysis.

COMPREHENSIVE ECONOMIC DEVELOPMENT STRATEGY 2005
Puerto Rico Planning Area • Annual Report • CEDS Update • EDA Investment Number: 01-85-08072 A-31
TABLA 24 - IMPORTACIONES DE MERCANCIA REGISTRADA POR SISTEMA DE CLASIFICACION INDUSTRIAL DE AMERICA DEL NORTE (SCIAN): AÑOS FISCALES TABLE 24 - IMPORTS OF RECORDED MERCHANDISE BY NORTH AMERICAN INDUSTRIAL CLASSIFICATION SYSTEM (NAICS): FISCAL YEARS (En millones de dólares - In millions of dollars)
SCIAN / NAICS 1995 1996 1997 1998 1999 2000 2001 2002 2003 2004
IMPORTACIONES REGISTRADAS,TOTAL 18,816.6 19,060.9 21,387.4 21,797.5 25,299.4 27,042.8 29,149.3 28,984.6 33,749.7 38,897.6 RECORDED IMPORTS,TOTAL
11 Agricultura, silvicultura, pesca y caza 411.3 544.8 553.8 587.2 525.9 448.2 517.8 503.1 446.9 460.9 Agriculture, forestry, fishing and hunting
21 Minería 629.2 528.7 356.6 152.1 97.1 490.0 225.1 315.5 800.1 945.9 Mining
31-33 Manufactura 17,173.4 17,414.5 19,869.7 20,445.4 23,830.5 25,386.5 27,679.5 27,360.2 31,608.1 36,408.6 Manufacturing
311 Alimentos 1,705.1 1,757.4 1,833.6 1,784.3 1,880.5 1,820.7 2,135.0 1,952.3 1,981.7 2,052.2 Food312 Productos de bebidas y de tabaco 298.6 251.5 252.1 303.2 360.5 302.3 432.2 386.5 292.4 368.2 Beverage and tobacco products
313-314 Textiles 418.5 362.5 364.5 369.1 377.0 375.0 372.1 288.8 288.2 318.3 Textiles315 Ropa 382.7 480.1 444.9 516.7 594.3 642.0 644.6 671.6 643.2 570.0 Apparel316 Cuero y productos afines 431.8 430.5 455.7 355.2 349.1 333.2 332.8 299.6 270.6 234.6 Leather and allied products321 Productos de madera 183.4 195.7 171.1 181.7 220.6 184.8 182.0 139.7 140.1 155.8 Wood products322 Papel 412.7 449.5 419.5 425.1 487.9 452.6 547.0 480.7 475.5 509.9 Paper323 Imprenta 105.9 113.0 110.5 125.8 141.5 153.8 186.5 220.2 215.8 211.3 Printing324 Productos de petróleo y de carbón 958.5 1,141.4 1,540.2 1,557.8 1,359.9 1,931.4 2,309.3 1,592.7 1,923.1 2,070.0 Petroleum and coal products325 Químicos 3,666.1 4,158.9 5,438.8 5,879.4 7,355.0 9,135.9 10,503.0 12,324.5 15,111.2 19,289.3 Chemicals3251 Químicos básicos 922.4 1,221.0 1,387.4 1,182.7 1,660.9 1,849.4 2,172.6 2,796.7 3,044.6 3,285.7 Basic chemicals3254 Farmacéuticos y medicinas 1,156.0 1,721.6 3,350.0 3,978.9 4,876.7 6,474.8 7,414.2 8,628.7 11,212.6 15,191.9 Pharmaceuticals and medicines326 Productos de plástico y de goma 417.0 378.8 426.4 462.2 529.7 474.9 546.8 521.9 637.9 547.9 Plastics and rubber products327 Productos de minerales no metálicos 172.8 180.1 218.0 208.9 261.8 253.7 268.3 264.1 271.2 242.6 Nonmetallic mineral products331 Metales primarios 340.6 342.5 405.9 410.4 400.7 333.6 398.5 341.4 401.8 410.2 Primary metals332 Productos fabricados de metal 331.5 333.9 376.9 391.5 488.1 445.9 565.5 396.5 500.1 492.0 Fabricated metal products333 Maquinaria 826.3 941.0 999.2 1,061.0 1,353.6 1,227.6 1,280.9 1,073.6 1,153.3 1,133.5 Machinery334 Productos de computadora y electrónicos 2,652.2 2,147.3 2,036.4 2,299.4 2,771.6 2,799.5 2,711.3 2,168.3 2,658.7 3,105.4 Computer and electronic products335 Equipos eléctricos, enseres Electrical equipment, appliance,
y componentes 1,092.5 920.0 950.3 892.3 1,047.0 970.8 796.4 721.0 773.3 776.4 and component336 Equipo de transportación 1,853.7 1,784.8 2,272.7 2,131.7 2,695.3 2,350.0 2,160.1 2,189.7 2,345.8 2,355.5 Transportation equipment3361 Vehículos de motor 1,637.8 1,426.2 1,750.4 1,667.1 2,100.9 2,028.6 1,820.6 1,898.7 2,043.3 2,090.2 Motor vehicles337 Muebles y productos relacionados 166.7 180.1 233.2 245.6 288.7 247.3 255.6 257.2 271.2 275.9 Furniture and related products339 Manufactura miscelánea 756.7 865.4 919.8 844.2 867.5 951.4 1,051.7 1,069.9 1,252.9 1,289.6 Miscellaneous manufacturing
Otros sectores (1) 602.7 572.9 607.3 612.9 846.0 718.2 726.9 805.8 894.5 1,082.2 Other sectors (1)
(1) Incluye servicios de reparación y mercancía no clasificada. (1) Includes repair services and merchandise not classified.
Nota: La clasificación de mercancía registrada de acuerdo al Sistema de Clasificación Industrial Note: The classification of recorded merchandise according to the North American Industrial de América del Norte no equivale necesariamente a la Clasificación Industrial Uniforme. Classification System does not necessarily equals the Standard Industrial Classification.
Fuente: Junta de Planificación, Programa de Planificación Económica y Social, Source: Puerto Rico Planning Board, Program of Economic and Social Planning, Subprograma de Análisis Económico. Subprogram of Economic Analysis.

COMPREHENSIVE ECONOMIC DEVELOPMENT STRATEGY 2005
Puerto Rico Planning Area • Annual Report • CEDS Update • EDA Investment Number: 01-85-08072 A-32
TABLA 25 - BALANCE COMERCIAL: AÑOS FISCALESTABLE 25 - TRADE BALANCE: FISCAL YEARS (En millones de dólares - In millions of dollars)
1995 1996 1997 1998 1999 2000 2001 2002 2003 2004
Exportaciones registradas, total 23,811.3 22,944.4 23,946.8 30,272.9 34,901.8 38,465.7 46,900.8 47,172.3 55,175.3 55,080.2 Recorded exports, total
Estados Unidos 21,106.9 20,148.6 21,187.3 27,397.4 30,535.2 33,763.6 41,367.2 41,739.7 47,647.0 45,418.7 United States
Países extranjeros 2,539.6 2,658.4 2,668.3 2,797.7 4,308.5 4,638.5 5,440.7 5,362.8 7,456.3 9,574.5 Foreign countries
Islas Vírgenes 164.8 137.3 91.3 77.9 58.1 63.7 92.9 69.7 72.0 86.9 Virgin Islands
Importaciones registradas, total 18,816.6 19,060.9 21,387.4 21,797.5 25,299.4 27,042.8 29,149.3 28,984.6 33,749.7 38,897.6 Recorded imports, total
Estados Unidos 12,158.1 11,909.3 13,317.8 13,225.9 15,136.0 15,079.7 15,586.1 14,561.3 16,503.4 17,596.2 United States
Países extranjeros 6,351.5 6,784.8 7,625.6 7,987.2 9,610.6 11,309.9 12,769.7 13,736.1 16,374.6 20,363.4 Foreign countries
Islas Vírgenes 307.0 366.8 444.1 584.5 552.8 653.2 793.5 687.2 871.7 938.1 Virgin Islands
Balance comercial 4,994.7 3,883.5 2,559.4 8,475.4 9,602.4 11,422.9 17,751.5 18,187.7 21,425.6 16,182.6 Trade balance
Estados Unidos 8,948.8 8,239.3 7,869.5 14,171.5 15,399.2 18,683.9 25,781.1 27,178.4 31,143.6 27,822.6 United States
Países extranjeros (3,811.9) (4,126.4) (4,957.3) (5,189.5) (5,302.1) (6,671.4) (7,329.0) (8,373.3) (8,918.4) (10,788.8) Foreign countries
Islas Vírgenes (142.2) (229.5) (352.8) (506.6) (494.7) (589.5) (700.6) (617.5) (799.6) (851.2) Virgin Islands
( ) Cifras negativas. ( ) Negative figures.
Fuente: Junta de Planificación, Programa de Planificación Económica y Social, Source: Puerto Rico Planning Board, Program of Economic and Social Planning, Subprograma de Análisis Económico. Subprogram of Economic Analysis.

COMPREHENSIVE ECONOMIC DEVELOPMENT STRATEGY 2005
Puerto Rico Planning Area • Annual Report • CEDS Update • EDA Investment Number: 01-85-08072 A-33
TABLA 32 - ESTADO DE EMPLEO DE LAS PERSONAS DE 16 AÑOS DE EDAD Y MAS: AÑOS FISCALES TABLE 32 - EMPLOYMENT STATUS OF PERSONS 16 YEARS OLD AND OVER: FISCAL YEARS (En miles de personas - In thousands of persons)
1995 1996 1997 1998 1999 2000 2001 2002 2003 2004
Personas de 16 años y más 2,654 2,684 2,708 2,740 2,782 2,820 2,850 2,905 2,958 2,999 Persons 16 years and over
Grupo trabajador 1,219 1,268 1,298 1,317 1,310 1,303 1,293 1,330 1,378 1,392 Labor force
Empleados 1,051 1,092 1,128 1,137 1,147 1,159 1,158 1,170 1,211 1,234 Employed
Desempleados 168 175 170 179 163 143 135 160 167 158 Unemployed
Tasa de participación 45.9 47.2 48.0 48.1 47.2 46.2 45.4 45.8 46.6 46.4 Participation rate
Tasa de desempleo 13.8 13.8 13.1 13.6 12.5 11.0 10.5 12.0 12.1 11.4 Unemployment rate
p- Cifras preliminares. p- Preliminary figures.
Fuente: Departamento del Trabajo y Recursos Humanos, Source: Department of Labor and Human Resources, Negociado de Estadísticas del Trabajo, Encuesta de Vivienda. Bureau of Labor Statistics, Household Survey.