annual report - alpek · 2016 annual report alpek, s.a.b. de c.v. av. gómez morín 1111 sur col....
TRANSCRIPT

2016Annual Report
Alpek, S.A.B. de C.V.Av. Gómez Morín 1111 Sur
Col. Carrizalejo, San Pedro Garza GarcíaNuevo León, Mexico, 66254
www.alpek.com
2016 Annual Report + Alpek

TABLE OF CONTENTS
Corporate profileFinancial highlightsFootprintOur products in daily lifePetrochemical chainsLetter to shareholdersPolyesterPlastics & ChemicalsStrategic investmentsSustainabilityBoard of DirectorsManagement TeamCorporate GovernanceGlossaryConsolidated financial statements
123469
121720244445464749
Investor Relations
Hernán F. LozanoSabino Parra
Av. Gómez Morín 1111 Sur
Col. Carrizalejo, San Pedro Garza García
Nuevo León, CP. 66254, Mexico
www.alpek.com
P
RINTED WITH
100% WIND ENERGY
Supplied by Community EnergyDes
ign
& P
hoto
grap
hy: 3
3Vis
ual
| Pr
inte
r: E
arth
colo
r, H
oust
on
CORPORATE PROFILE
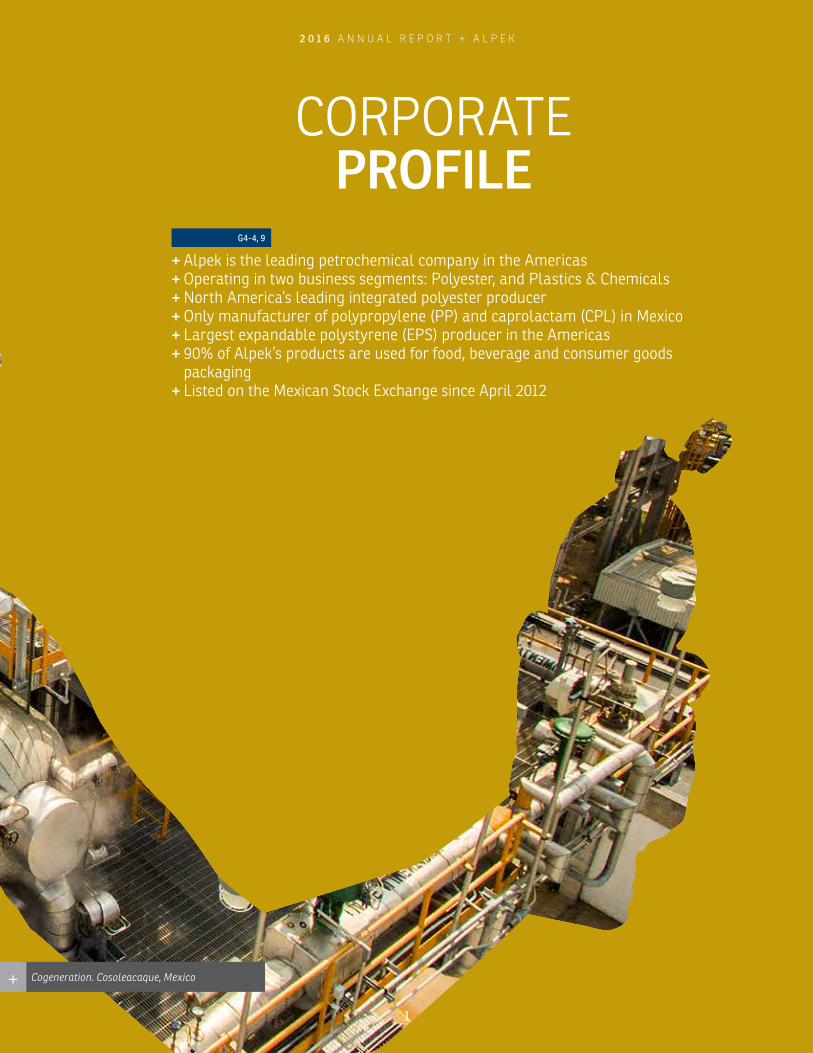
+ Alpek is the leading petrochemical company in the Americas + Operating in two business segments: Polyester, and Plastics & Chemicals + North America’s leading integrated polyester producer + Only manufacturer of polypropylene (PP) and caprolactam (CPL) in Mexico + Largest expandable polystyrene (EPS) producer in the Americas + 90% of Alpek’s products are used for food, beverage and consumer goods packaging + Listed on the Mexican Stock Exchange since April 2012
G4-4, 9
2 0 1 6 A N N U A L R E P O R T + A L P E K
1
Cogeneration. Cosoleacaque, Mexico +
FINANCIAL HIGHLIGHTS
EBITDA(1) Millions of dollars
Majority Net Income(2) Millions of dollars
Assets Millions of dollars
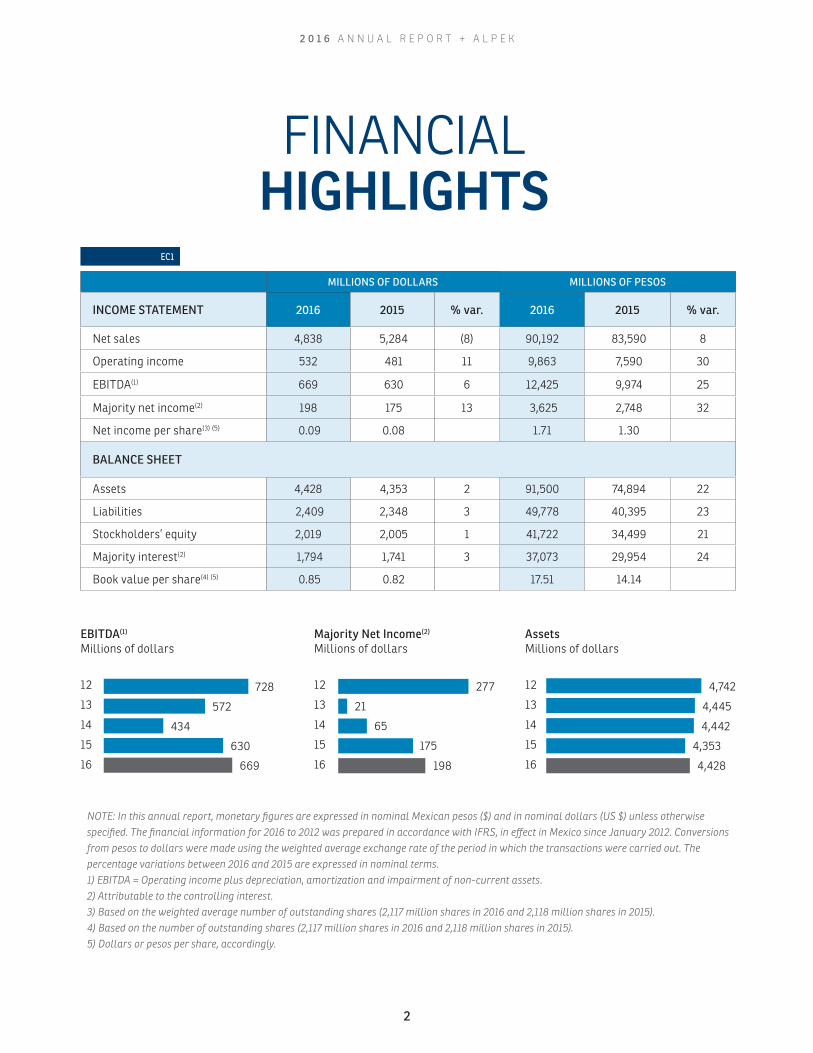
NOTE: In this annual report, monetary figures are expressed in nominal Mexican pesos ($) and in nominal dollars (US $) unless otherwise specified. The financial information for 2016 to 2012 was prepared in accordance with IFRS, in effect in Mexico since January 2012. Conversions from pesos to dollars were made using the weighted average exchange rate of the period in which the transactions were carried out. The percentage variations between 2016 and 2015 are expressed in nominal terms.1) EBITDA = Operating income plus depreciation, amortization and impairment of non-current assets. 2) Attributable to the controlling interest.3) Based on the weighted average number of outstanding shares (2,117 million shares in 2016 and 2,118 million shares in 2015).4) Based on the number of outstanding shares (2,117 million shares in 2016 and 2,118 million shares in 2015).5) Dollars or pesos per share, accordingly.
12
13
14
15
16 669
434
630
728
572
12
13
14
15
16 198
65
175
277
21
12
13
14
15
16
4,353
4,428
4,742
4,445
4,442
EC1
MILLIONS OF DOLLARS MILLIONS OF PESOS
INCOME STATEMENT 2016 2015 % var. 2016 2015 % var.
Net sales 4,838 5,284 (8) 90,192 83,590 8
Operating income 532 481 11 9,863 7,590 30
EBITDA(1) 669 630 6 12,425 9,974 25
Majority net income(2) 198 175 13 3,625 2,748 32
Net income per share(3) (5) 0.09 0.08 1.71 1.30
BALANCE SHEET
Assets 4,428 4,353 2 91,500 74,894 22
Liabilities 2,409 2,348 3 49,778 40,395 23
Stockholders’ equity 2,019 2,005 1 41,722 34,499 21
Majority interest(2) 1,794 1,741 3 37,073 29,954 24
Book value per share(4) (5) 0.85 0.82 17.51 14.14
2 0 1 6 A N N U A L R E P O R T + A L P E K
2
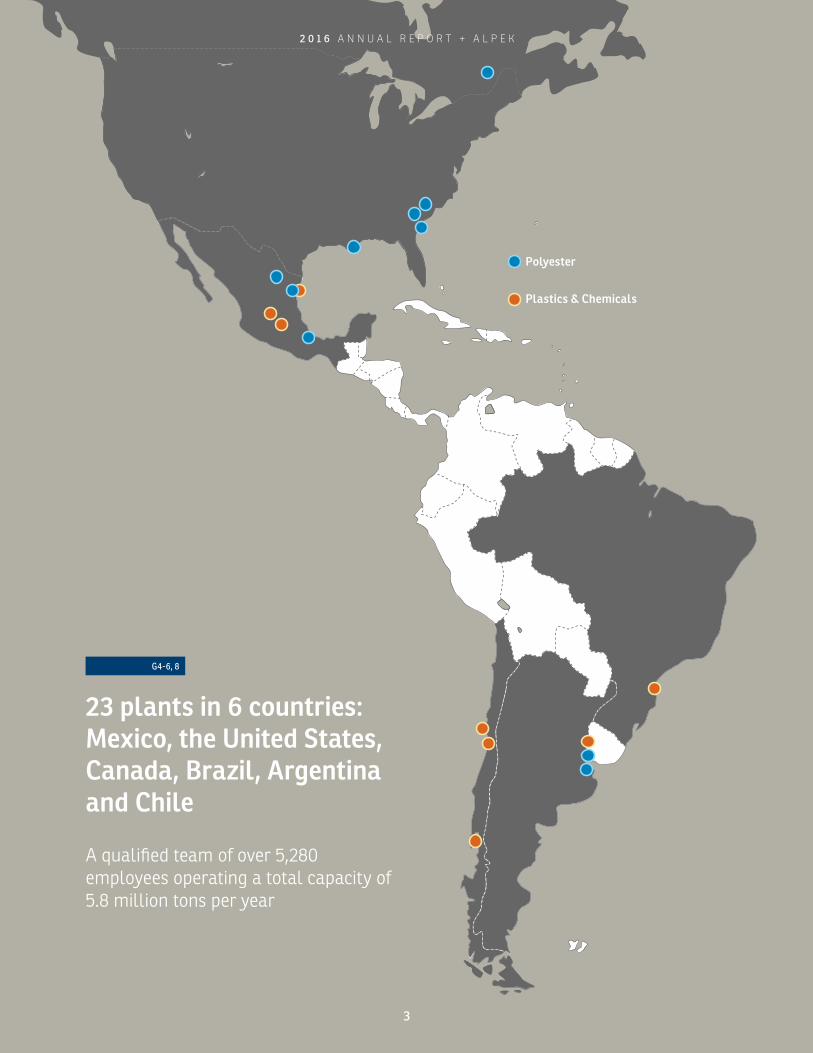
23 plants in 6 countries: Mexico, the United States, Canada, Brazil, Argentina and Chile
A qualified team of over 5,280 employees operating a total capacity of 5.8 million tons per year
Polyester
Plastics & Chemicals
G4-6, 8
2 0 1 6 A N N U A L R E P O R T + A L P E K
3

OUR PRODUCTS IN DAILY LIFE
13:30
Lemonade for
lunch
PET bottle
6:30
Vitamins for the
little ones
PET bottle
6:00
A nice workout to
start the day
PET bottle and
polyester fiber
clothes
18:30
Safety first in
the car
Polyester filament
seatbelt
POLYESTER
Alpek Polyester (PET). Columbia, United States+
G4-4
2 0 1 6 A N N U A L R E P O R T + A L P E K
4
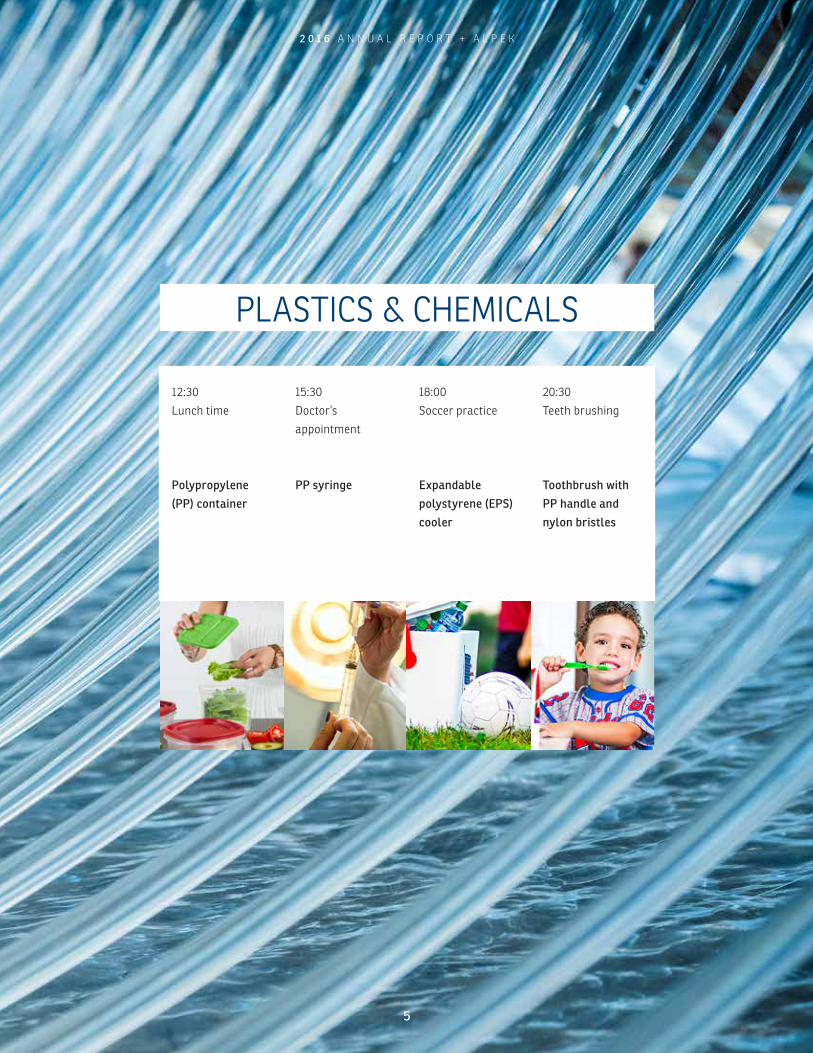
15:30
Doctor’s
appointment
PP syringe
18:00
Soccer practice
Expandable
polystyrene (EPS)
cooler
20:30
Teeth brushing
Toothbrush with
PP handle and
nylon bristles
12:30
Lunch time
Polypropylene
(PP) container
PLASTICS & CHEMICALS
2 0 1 6 A N N U A L R E P O R T + A L P E K
5
Oil
Oil Refinery Reformer
Propylene
C
H
H
C
CH3
H
Paraxylene
Benzene
PET
Styrene
CH2
Cyclohexane
Caprolactam
EPS
Ethane
Methane
Propane
Ethylene
C
H
H
C
H
H
Ethylene Oxide
O
CH2
CH2
Refinery Naphtha
Cracker
Cracker
Cracker
Cracker
PTA
AmmoniumSulfate
Fibers
Ammonia
H
H
H
N
Polypropylene
MonoethyleneGlycol
Naphtha
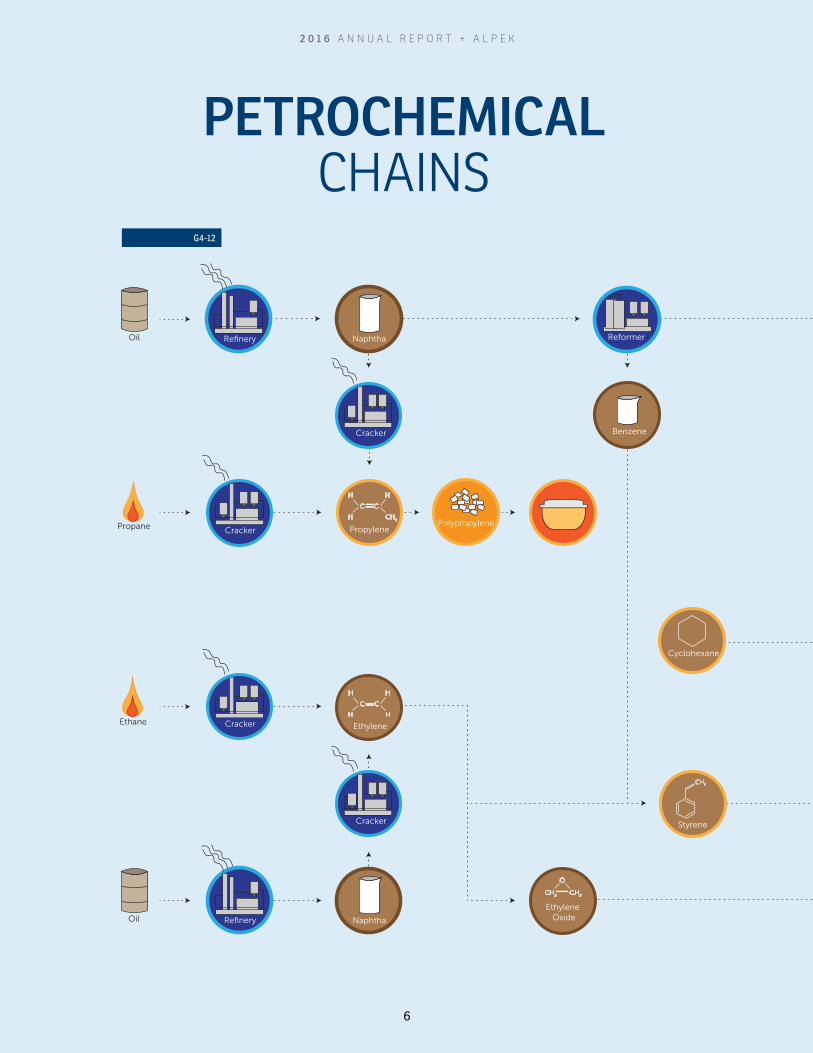
PETROCHEMICAL CHAINS
G4-12
2 0 1 6 A N N U A L R E P O R T + A L P E K
6

Alpek products are used by millions of people every day in a wide range of applications.
Polyester
Plastics & Chemicals
Oil
Oil Refinery Reformer
Propylene
C
H
H
C
CH3
H
Paraxylene
Benzene
PET
Styrene
CH2
Cyclohexane
Caprolactam
EPS
Ethane
Methane
Propane
Ethylene
C
H
H
C
H
H
Ethylene Oxide
O
CH2
CH2
Refinery Naphtha
Cracker
Cracker
Cracker
Cracker
PTA
AmmoniumSulfate
Fibers
Ammonia
H
H
H
N
Polypropylene
MonoethyleneGlycol
Naphtha
2 0 1 6 A N N U A L R E P O R T + A L P E K
7

2 0 1 6 A N N U A L R E P O R T + A L P E K
88
Alpek Polyester (PET). Cosoleacaque, Mexico+

2016 was a year of contrasts, with a significant
difference between the results of the first half of the year compared
to the second, as well as between our two business segments. Crude
oil price volatility, combined with several extraordinary events such
as Hurricane Matthew, adversely affected Alpek’s Polyester seg-
ment. However, our polypropylene (PP) and expandable polystyrene
(EPS) businesses posted record results for the year, driving the per-
formance of our Plastics & Chemicals (P&C) segment.
The crude oil and feedstock price environment was challenging once
again during 2016. The annual average Brent price was US $44 per
barrel, fluctuating between a minimum of US $31 per barrel in Janu-
ary and a maximum of US $54 per barrel in December, following the
agreement announced by the OPEC at the end of the year. This high
volatility affected the price of our feedstocks, mainly paraxylene
(Px) and propylene, causing temporary distortions in results.
Alpek’s consolidated 2016 sales totaled US $4.838 billion, down 8%
year-over-year, reflecting lower average prices in both business seg-
ments as a result of the decline in oil and feedstock prices. The an-
nual sales volume was similar to the previous year, with a marginal
increase in P&C.
Consolidated EBITDA was US $669 million in 2016, 6% more than
in 2015 but 4% below the revised guidance of US $700 million, with
a significant difference between the results of Alpek’s two business
segments.
Consolidated 2016 EBITDA includes benefits from inventory gains and
non-operating items totaling US $32 million, such that comparable
EBITDA was US $637 million, 3% below that of 2015.
Polyester segment sales were US $3.444 billion in 2016, 10% lower
than 2015 due to a 10% decrease in average price. Volume was flat
and below our growth expectations mainly as a result of low demand
for polyester fiber in the United States and for PET in Argentina.
2016 Polyester EBITDA was US $349 million, 2% more than in 2015.
However, this figure includes a benefit of US $18 million from non-
cash inventory gains and non-operating items. Adjusting for this
benefit, comparable EBITDA was US $331 million, 13% lower than
the previous year.
Crude oil price volatility, the force majeure declared at three US PET
plants as a result of Hurricane Matthew and low demand for poly-
ester fiber in the United States were three external factors that were
particularly negative for this segment.
Nevertheless, positive events for the Polyester segment during the
year included final affirmative determinations in the US PET anti-
dumping and countervailing duty investigations and the startup of
the multiyear monoethylene glycol (MEG) supply agreement with
Huntsman.
Despite Asian reference polyester margins remaining at historical
lows, 2016 was the first year since 2010 in which PTA demand ex-
pansion exceeded installed capacity growth in China. This situation
is necessary for the Chinese supply/demand balance to improve and
support a gradual recovery in global polyester margins.
The P&C segment posted sales of US $1.394 billion in 2016, 3% less
than the previous year, as a 1% increase in volume was more than
offset by a 5% decrease in average price.
By contrast, P&C EBITDA grew 14% year-over-year, to US $322 mil-
lion. This figure includes a US $14 million benefit from non-cash in-
ventory gains and non-operating items. Thus, comparable 2016 P&C
EBITDA was US $308 million, up 13% versus 2015.
P&C EBITDA growth was driven by record results from our PP and
EPS businesses, which posted comparable annual increases of 14%
and 27% respectively.
LETTER TOSHAREHOLDERS
Dear shareholders:
G4-1, 2, 13
2 0 1 6 A N N U A L R E P O R T + A L P E K
9

The PP business benefited from a margin expansion in North Ameri-
ca, reflecting lower feedstock costs and a favorable balance between
supply and demand in the region. However, reference margins reached
an unsustainably high level during the first half of the year and fell
shortly thereafter to stabilize above historical levels by year-end.
EPS results largely reflect the successful integration of the busi-
nesses acquired in North and South America in 2015, combined with
a favorable margin environment resulting from higher Asian refer-
ence styrene prices.
On a macro level, global financial markets were impacted by the re-
sult of the US elections. In the particular case of Mexico, this caused
a significant depreciation of the Mexican peso vis-à-vis the US dollar.
Alpek’s solid financial position, supported by dollar-denominated
cash flows, long-term, fixed-interest debt, low leverage and high in-
terest coverage ratios, allowed us to overcome this situation.
As of year-end 2016, net debt was US $1.042 billion, US $320 million
more than 2015, as a result of the ongoing investment in strategic
projects. However, our financial ratios remain at healthy levels: a
net debt to EBITDA of 1.6 times and interest coverage of 10.5 times.
Alpek’s strategic Capex program continued throughout 2016. Annual
Capex reached US $345 million, making this the third consecutive
year in which we have invested more than US $300 million.
PROGRESS WITH STRATEGIC PROJECTSWe made significant progress with five projects involving vertical in-
tegration, operating efficiency and capacity expansion:
Firstly, in June 2016 Alpek began supplying monoethylene glycol
(MEG) from Huntsman in accordance with the US $65 million, mul-
tiannual agreement. This was the second of our six major strategic
projects to begin operating, following the startup of the Cosolea-
caque cogeneration plant in 2015.
Secondly, Alpek completed its investment to obtain the supply rights
to 500 thousand tons of integrated PET per year from the plant that
M&G is building in Corpus Christi, Texas. The facility is expected to
begin operations in 2017, starting with PET production and then PTA.
Thirdly, as of year-end 2016 we had invested 40% of the total amount
required for the construction of our second cogeneration plant at
the Altamira site in the state of Tamaulipas. This facility will have
a capacity of 350 megawatts, 3.5 times that of our existing plant in
Cosoleacaque, Veracruz, and is expected to begin generating elec-
tricity in 2018.
Fourthly, the construction of two propylene storage spheres pro-
gressed as planned during the year. This initiative will improve lo-
gistics and increase the capacity utilization of our PP facility. Startup
during the first half of 2017 will make it the third of our six major
projects to be concluded.
And finally, the investment in our 75-thousand-ton EPS capacity ex-
pansion in Altamira reached 40% of the total programmed amount
at the close of 2016. When the expansion begins operating in 2018,
Alpek’s Altamira facility will be the largest EPS plant outside China.
ACQUISITIONSIn 2016, Alpek announced three acquisitions that complement its ex-
isting operations, two in the Polyester segment and one in P&C.
The first in the Polyester segment was the acquisition of a con-
trolling interest in Selenis Canada Inc., which operates Canada’s
only PET plant with an annual capacity of 144 thousand tons. In
addition to expanding Alpek’s operations in North America, this
asset allows us to complement our portfolio with differentiated
PET products.
The second one involves an agreement signed with Petrobras to ac-
quire its 100% interests in Companhia Petroquímica de Pernambuco
(Petroquímica Suape) and Companhia Integrada Têxtil de Pernam-
buco (Citepe). These two companies operate South America’s only
integrated polyester site, which has an annual capacity of 700 thou-
sand tons of PTA, 450 thousand tons of PET and 90 thousand tons of
texturized polyester filament. Subject to pending corporate and gov-
ernmental approvals, this acquisition will increase Alpek’s installed
capacity by approximately 22%.
These two transactions consolidate our presence in the Americas
and provide synergies that reinforce the Company’s integrated poly-
ester platform.
Within the P&C segment, we acquired an EPS plant in Concón,
Chile. The facility’s installed capacity of 20 thousand tons per year
complements the EPS operations that we acquired in South Amer-
ica during 2015.
At Alpek, we strive to operate in harmony with all our stakeholder
groups: shareholders, customers, employees, communities and sup-
pliers, as well as with the environment. Our sustainability strategy is
based on identifying and addressing concerns from them all.
2 0 1 6 A N N U A L R E P O R T + A L P E K
10
In 2015, we concluded a materiality assessment of social, environ-
mental, economic and corporate governance matters through which
we identified 13 issues that are particularly important to our stake-
holders. This report presents information on a total of 108 indicators
that pertain to these issues, and 39 others related to our operations.
Results presented this year include: related to internal well-being,
31 average training hours per employee versus 27 hours in 2015; and
related to the community, the benefitting of more than 50 schools
and 7,380 students.
We reaffirm our commitment to continuously improve across
the four pillars that make up our sustainability model: i) internal
well-being, ii) community, iii) environment and iv) sustainable eco-
nomic value creation.
In summary, 2016 was a year characterized by a volatile crude oil
price environment, as well as other external factors that adversely
affected our Polyester results. However, it was a record year for our
PP and EPS businesses, we made significant progress with strategic
projects and we closed acquisitions that complement our operations
in both business segments.
Armando Garza Sada
Chairman of the Board
José de Jesús Valdez Simancas
Chief Executive Officer
We expect downward pressure on our 2017 results, largely due to the
normalization of polypropylene margins following their peak during
the first half of 2016. We maintain a cautious view as we expect fur-
ther volatility in global financial markets driven by the change of
administration in the United States.
Under these conditions, financial discipline becomes increasingly
important together with a number of other factors such as: our long-
term, fixed-interest debt that protects us against interest rate hikes;
dollar-denominated cash flows that mitigate the risks from foreign
exchange rate fluctuations; low leverage and high interest coverage
that provide financial flexibility; and geographical diversification
that reduces our country risk.
In 2017, we will continue to implement our strategic projects. We are
also committed to consistently paying dividends to our sharehold-
ers, which in 2016 totaled approximately US $110 million.
We would like to take this opportunity to thank our employees, cus-
tomers, suppliers and creditors, the community and, in particular,
you, our shareholders, for putting your trust once again in this Board
of Directors.
Sincerely,
2 0 1 6 A N N U A L R E P O R T + A L P E K
11
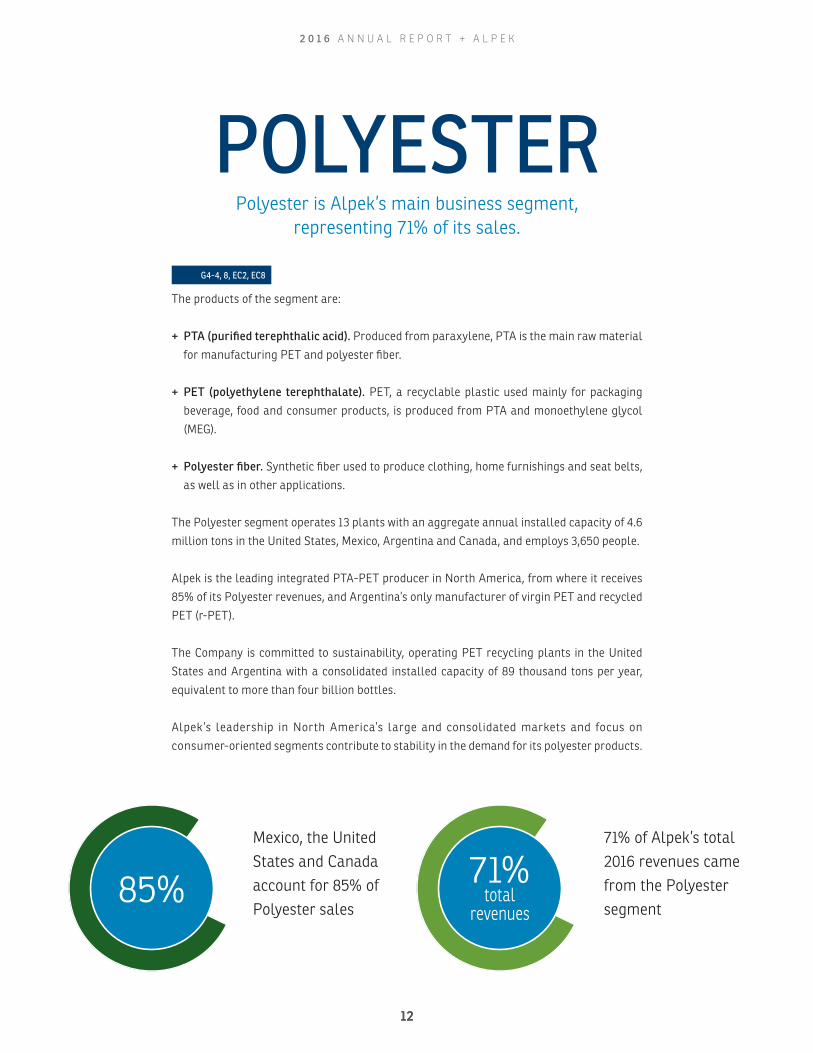
Polyester is Alpek’s main business segment, representing 71% of its sales.
The products of the segment are:
+ PTA (purified terephthalic acid). Produced from paraxylene, PTA is the main raw material
for manufacturing PET and polyester fiber.
+ PET (polyethylene terephthalate). PET, a recyclable plastic used mainly for packaging
beverage, food and consumer products, is produced from PTA and monoethylene glycol
(MEG).
+ Polyester fiber. Synthetic fiber used to produce clothing, home furnishings and seat belts,
as well as in other applications.
The Polyester segment operates 13 plants with an aggregate annual installed capacity of 4.6
million tons in the United States, Mexico, Argentina and Canada, and employs 3,650 people.
Alpek is the leading integrated PTA-PET producer in North America, from where it receives
85% of its Polyester revenues, and Argentina’s only manufacturer of virgin PET and recycled
PET (r-PET).
The Company is committed to sustainability, operating PET recycling plants in the United
States and Argentina with a consolidated installed capacity of 89 thousand tons per year,
equivalent to more than four billion bottles.
Alpek’s leadership in North America’s large and consolidated markets and focus on
consumer-oriented segments contribute to stability in the demand for its polyester products.
POLYESTER
71% of Alpek’s total 2016 revenues came from the Polyester segment
71%total
revenues
Mexico, the United States and Canada account for 85% of Polyester sales
85%
G4-4, 8, EC2, EC8
2 0 1 6 A N N U A L R E P O R T + A L P E K
1212

Alpek Polyester (PET). Cosoleacaque, Mexico+
2 0 1 6 A N N U A L R E P O R T + A L P E K
13
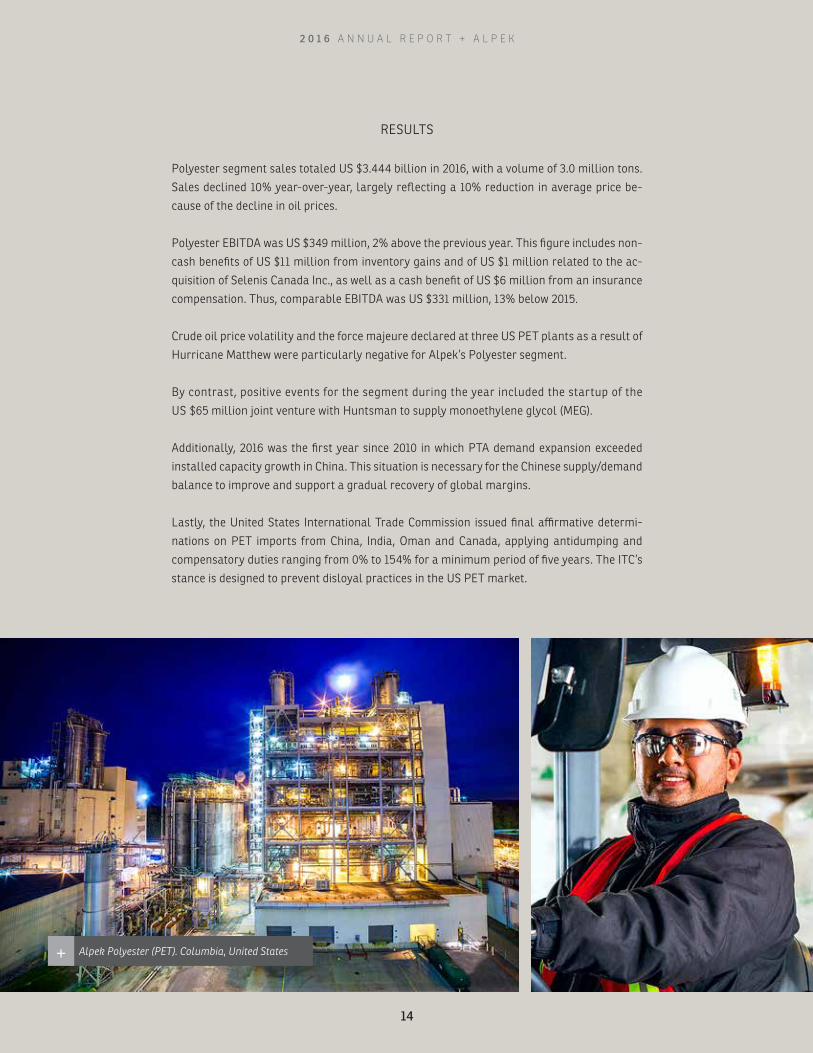
RESULTS
Polyester segment sales totaled US $3.444 billion in 2016, with a volume of 3.0 million tons.
Sales declined 10% year-over-year, largely reflecting a 10% reduction in average price be-
cause of the decline in oil prices.
Polyester EBITDA was US $349 million, 2% above the previous year. This figure includes non-
cash benefits of US $11 million from inventory gains and of US $1 million related to the ac-
quisition of Selenis Canada Inc., as well as a cash benefit of US $6 million from an insurance
compensation. Thus, comparable EBITDA was US $331 million, 13% below 2015.
Crude oil price volatility and the force majeure declared at three US PET plants as a result of
Hurricane Matthew were particularly negative for Alpek’s Polyester segment.
By contrast, positive events for the segment during the year included the startup of the
US $65 million joint venture with Huntsman to supply monoethylene glycol (MEG).
Additionally, 2016 was the first year since 2010 in which PTA demand expansion exceeded
installed capacity growth in China. This situation is necessary for the Chinese supply/demand
balance to improve and support a gradual recovery of global margins.
Lastly, the United States International Trade Commission issued final affirmative determi-
nations on PET imports from China, India, Oman and Canada, applying antidumping and
compensatory duties ranging from 0% to 154% for a minimum period of five years. The ITC’s
stance is designed to prevent disloyal practices in the US PET market.
Alpek Polyester (PET). Columbia, United States+
2 0 1 6 A N N U A L R E P O R T + A L P E K
14

PET container with PP cap+
2 0 1 6 A N N U A L R E P O R T + A L P E K
15

Indelpro (PP). Altamira, Mexico+
2 0 1 6 A N N U A L R E P O R T + A L P E K
16

Its main products are:
+ Polypropylene (PP). PP is a recyclable plastic made from propylene and used to produce
containers, medical instruments and packaging for food and autoparts, among other ap-
plications. It is the segment’s main product, accounting for 46% of its sales.
+ Expandable polystyrene (EPS). EPS is a low-density, impact-absorbing polymer used for
packaging products such as domestic appliances and electronics, as well as for thermal
insulation and lightening the load of structural slabs in building works. It represents 30%
of the segment’s sales.
+ Caprolactam (CPL). CPL is the main feedstock for making Nylon 6, a synthetic fiber used in
clothing, tire cord and engineering plastics, as well as other applications.
+ Specialty and industrial chemicals. These products have a wide variety of applications
across diverse industries, including the oil, pharmaceutical, automotive and consumer
goods sectors.
+ Ammonium sulfate. Nitrogen rich derivative of the CPL production process that is used as
a fertilizer.
PLASTICS & CHEMICALS
The P&C segment accounts for 29% of Alpek’s sales.
Mexico, the United States and Canada account for 78% of Plastics & Chemicals sales
78%
Plastics & Chemicals represented 29% of Alpek’s total 2016 revenues
29%total
revenues
G4-13, EC2, EC7, EC8
2 0 1 6 A N N U A L R E P O R T + A L P E K
17
Alpek leads the market for most of the products in this segment. In particular, it is Mexico’s
sole producer of PP and CPL, and the largest EPS manufacturer in the Americas.
RESULTS
The P&C segment posted sales of US $1.394 billion in 2016, with a volume of 934 thousand
tons. 2016 sales declined 3% year-over-year because a 1% increase in volume was more than
offset by a 5% reduction in average price.
2016 P&C EBITDA was US $322 million, 14% above the previous year. This figure includes
non-cash benefits of US $12 million from inventory gains and of US $2 million related to the
acquisition of EPS assets in South America. Thus, comparable P&C EBITDA was US $308 mil-
lion, up 13% versus 2015, driven by record results of the PP and EPS businesses.
Reference PP margins were unsustainably high during the first half of the year but began to
fall in the final six months, stabilizing above historical levels by year-end.
Alpek’s EPS results reflect the successful integration of the operations acquired in North
and South America in 2015 and higher margins because of the increase in Asian reference
styrene prices.
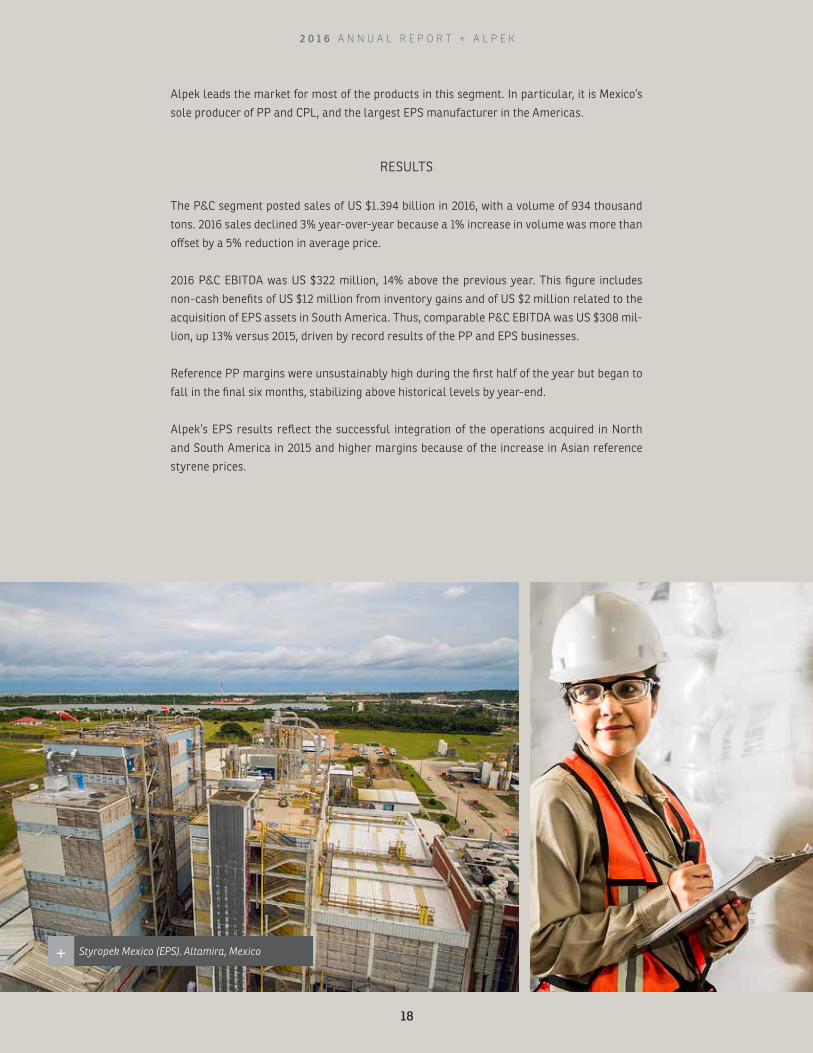
Name reptas re lab ide il et omni odi a voles dolorestrum netur sit asped quo est ipsande riatur.+ Styropek Mexico (EPS). Altamira, Mexico+
2 0 1 6 A N N U A L R E P O R T + A L P E K
18

Polypropylene containers+
2 0 1 6 A N N U A L R E P O R T + A L P E K
19

Annual Capex, mainly for the projects in our strategic plan, reached
US $345 million in 2016, making this the third consecutive year in
which we invested over US $300 million.
We expect to have concluded the six most important initiatives of the
plan by 2018. In its entirety, it involves an investment of more than
US $1,000 million and will generate an incremental EBITDA estimat-
ed at US $250 million annually.
Two of the projects are already operating. The first is the cogene-
ration plant in Cosoleacaque, Veracruz, which came on line in 2015.
In its second full year of operations, it produced savings of US $16
million through the production of 668 GigaWatts/h of electricity and
1.37 tons of steam.
The second project started up in the second quarter of 2016,
supplying monoethylene glycol (MEG) in accordance with the US $65
million multiannual agreement with Huntsman. This initiative gives
Alpek contractual rights to the production of approximately 150
thousand tons of MEG per year and will generate estimated annual
savings of US $20 million.
STRATEGIC INVESTMENTS
PROGRESS WITH STRATEGIC PROJECTS
The third project, to be concluded during the first half of 2017, is the
construction of two polypropylene storage spheres. This will im-
prove logistics and increase the capacity utilization of our PP facility,
producing estimated savings of US $10 million annually.
The fourth project involves supply from the integrated PET plant
that M&G is building in Corpus Christi, Texas. During the year, we
completed the investment of US $350 corresponding to the original
supply contract and acquired rights to an additional 100 thousand
tons of PET. The PET capacity is expected to begin operating in 2017,
followed by PTA production.
The fifth project to come on line will be the 75-thousand-ton capac-
ity expansion of our EPS site in Altamira, Tamaulipas, making it the
largest such facility outside China. This initiative is part of the trans-
formation process that has made us America’s largest EPS producer
with a total capacity of 250 thousand tons per year.
Finally, Alpek’s second cogeneration plant, currently being built in
Altamira, will begin operations in 2018. It represents our largest in-
vestment after Corpus Christi and will have a capacity of 350 MW. As
of year-end 2016, we had invested approximately 40% of the US 350
million required.Our strategic growth plan includes investments of more than one billion dollars to provide an incremental EBITDA of US $250 million per year.
Cogeneration. Cosoleacaque, Mexico+
G4-13, EC2, EC7, EC8
2 0 1 6 A N N U A L R E P O R T + A L P E K
20
2 0 1 6 A N N U A L R E P O R T + A L P E K
21

ACQUISITIONS
In 2016, we also announced two acquisitions in the Polyester segment and one in P&C.
The Polyester segment acquired a controlling interest in Selenis Canada Inc., which operates
Canada’s only PET plant, with an annual capacity of 144 thousand tons. In addition to expand-
ing Alpek’s operations in North America, the asset positions us to complement our portfolio
with differentiated PET products.
This segment also signed an agreement with Petrobras to acquire Companhia Petroquími-
ca de Pernambuco (Petroquímica Suape) and Companhia Integrada Textil de Pernambuco
(Citepe), companies that operate Brazil’s only integrated polyester site. The agreement, which
is subject to pending corporate and governmental approval, will increase Alpek’s annual
capacity by approximately 22%, adding 700 thousand tons of PTA, 450 thousand tons of PET
and 90 thousand tons of texturized polyester filament.
The P&C segment also acquired an EPS plant in Concón, Chile. The facility’s annual installed
capacity of 20 thousand tons complements our South American operations.
Going forward, we will continue with our proactive search for new investment opportunities,
selecting them rigorously to ensure that our resources are invested in the most profitable
projects, implementing them efficiently, and administering them with financial discipline in
order to assure flexibility at all stages of their development.
Name reptas re lab ide il et omni odi a voles dolorestrum netur sit asped quo est ipsande riatur.+ Cogeneration. Cosoleacaque, Mexico+
2 0 1 6 A N N U A L R E P O R T + A L P E K
22

Name reptas re lab ide il et omni odi a voles dolorestrum netur sit asped quo est ipsande riatur.+ Alpek Polyester (PTA, PET and cogeneration). Cosoleacaque, Mexico+
2 0 1 6 A N N U A L R E P O R T + A L P E K
23

Fully aware of the impor-
tance of our legacy to future generations, we at Alpek endeavor to
work in harmony with the environment and society. The company’s
products are a result of our responsible use of resources and ongo-
ing cooperation with neighbors, business partners and employees
and their families. To achieve this, we focus on continuous improve-
ment, innovation and ethical, responsible conduct.
In this fifth edition of our annual sustainability report, we present
our progress in sustainable development over the period of January
1st to December 31st, 2016, using version G4 of the Global Reporting
Initiative (GRI) methodology for the second time. In accordance with
this standard, we selected the core option of compliance, focusing
our report on the issues that are of particular relevance to our stake-
holders. For more information on how we identified and responded
to these issues, please consult the section on our materiality study
on page 27.
The GRI G4 indicators shown in this report are denoted in each sec-
tion. The full list of GRI indicators to which we responded can be
found at: http://www.alpek.com/es/gri-report.html. The link also
includes the UN’s Sustainable Development Goals to 2030, to which
the actions we implemented in 2016 contribute.
SUSTAINABILITY
In 2016, we invested more than US $40 million in programs and initiatives regarding social responsibility in our operations.
Fauna at Alpek Polyester lagoon.Altamira, Mexico+
G4-28 to 30, 32, 33
2 0 1 6 A N N U A L R E P O R T + A L P E K
24

2 0 1 6 A N N U A L R E P O R T + A L P E K
25

Name reptas re lab ide il et omni odi a voles dolorestrum netur sit asped quo est ipsande riatur.+ Talk about enviromental care. Viva Verde project+
2 0 1 6 A N N U A L R E P O R T + A L P E K
26

The materiality study also helped us to define the focus of some
of our programs, in order to better serve our stakeholders’ needs.
For example, after finding out that our stakeholders see climate
change as a priority area, in 2016 we presented our first emis-
sions report to the Carbon Disclosure Project (CDP) and continue
to strengthen our emissions strategy, with the aim of aligning our
activities to the international goal –established by the UN– of lim-
iting global warming to 2ºC or less by 2030.
The relevance of these aspects to our stakeholders was the de-
termining factor in defining our sustainability priorities and the
concrete actions we took in 2016.
Operation and risk strategy
Investor relations
CSR management
Corporate governance
Labor practices
Distribution of wealth
Health and safety
Energy eco-efficiency
Water management
Climate change and emissions strategy
Community engagement
Relations with NGOs and regulatory
agencies
Customer and supplier relations
0 10 20 30 40 50 60 70 80 90 100%
10
20
30
40
50
60
70
80
90
100%
Materiality matrix
Relevance to stakeholders
Impa
ct o
n A
lpek
MATERIALITY STUDYMaterial aspect: CRS management
Our 2015 Annual Report presented the
results of our first materiality study, an exhaustive process of
consultation and analysis involving all our stakeholders, which
helped us to understand their priorities, the areas where we
have been most effective, and those where we should continue
improving. The process led to the identification of 13 material
aspects of our activities in four key sustainability areas: society
and employees, the environment, sustainable value creation and
corporate governance.
G4-18 to 21
MATERIAL ASPECTS
Operations and risk strategy
Investor relations
CSR management
Corporate governance
Labor practices
Distribution of wealth
Health and safety
Energy eco-efficiency
Water management
Climate change and emissions strategy
Community engagement
Relations with NGOs and regulatory agencies
Customer and supplier relations
2 0 1 6 A N N U A L R E P O R T + A L P E K
27
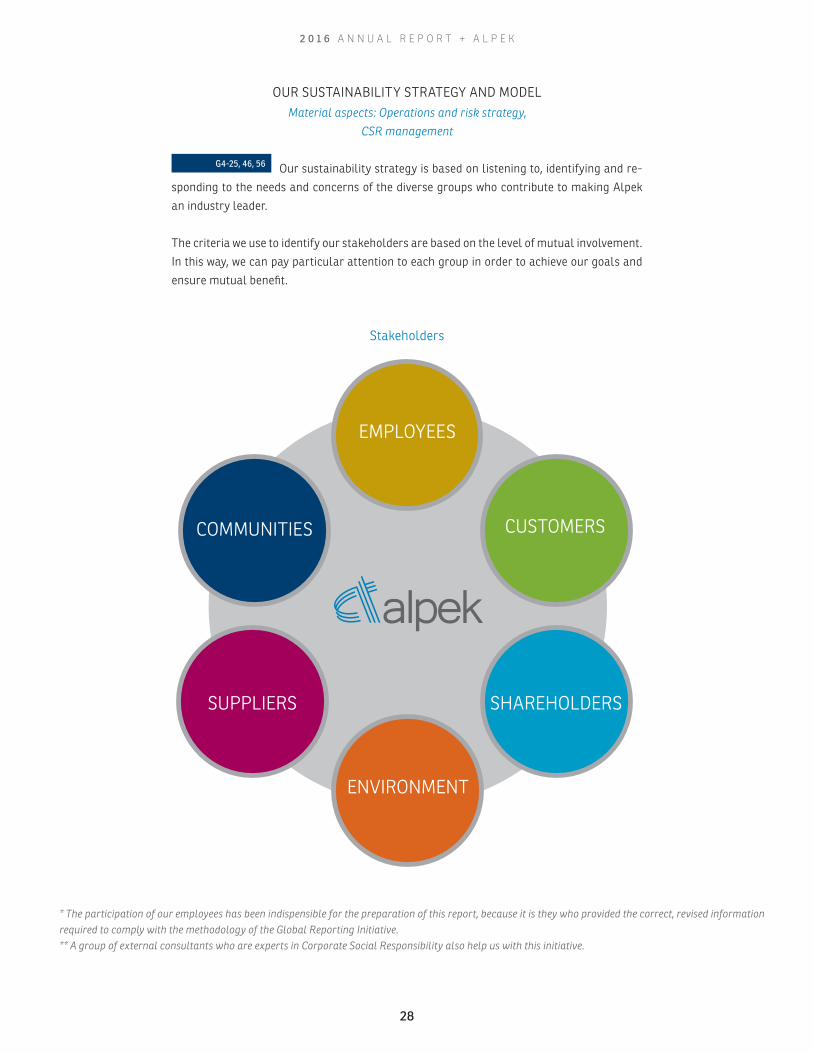
OUR SUSTAINABILITY STRATEGY AND MODELMaterial aspects: Operations and risk strategy,
CSR management
Our sustainability strategy is based on listening to, identifying and re-
sponding to the needs and concerns of the diverse groups who contribute to making Alpek
an industry leader.
The criteria we use to identify our stakeholders are based on the level of mutual involvement.
In this way, we can pay particular attention to each group in order to achieve our goals and
ensure mutual benefit.
Stakeholders
G4-25, 46, 56
* The participation of our employees has been indispensible for the preparation of this report, because it is they who provided the correct, revised information required to comply with the methodology of the Global Reporting Initiative.** A group of external consultants who are experts in Corporate Social Responsibility also help us with this initiative.
CUSTOMERS
SHAREHOLDERSSUPPLIERS
COMMUNITIES
EMPLOYEES
ENVIRONMENT
2 0 1 6 A N N U A L R E P O R T + A L P E K
28
Mis
sio
n Visio
n
Bienestar internovalu
e cr
eation
Sust
aina
ble economic
Enviro
nmen
t
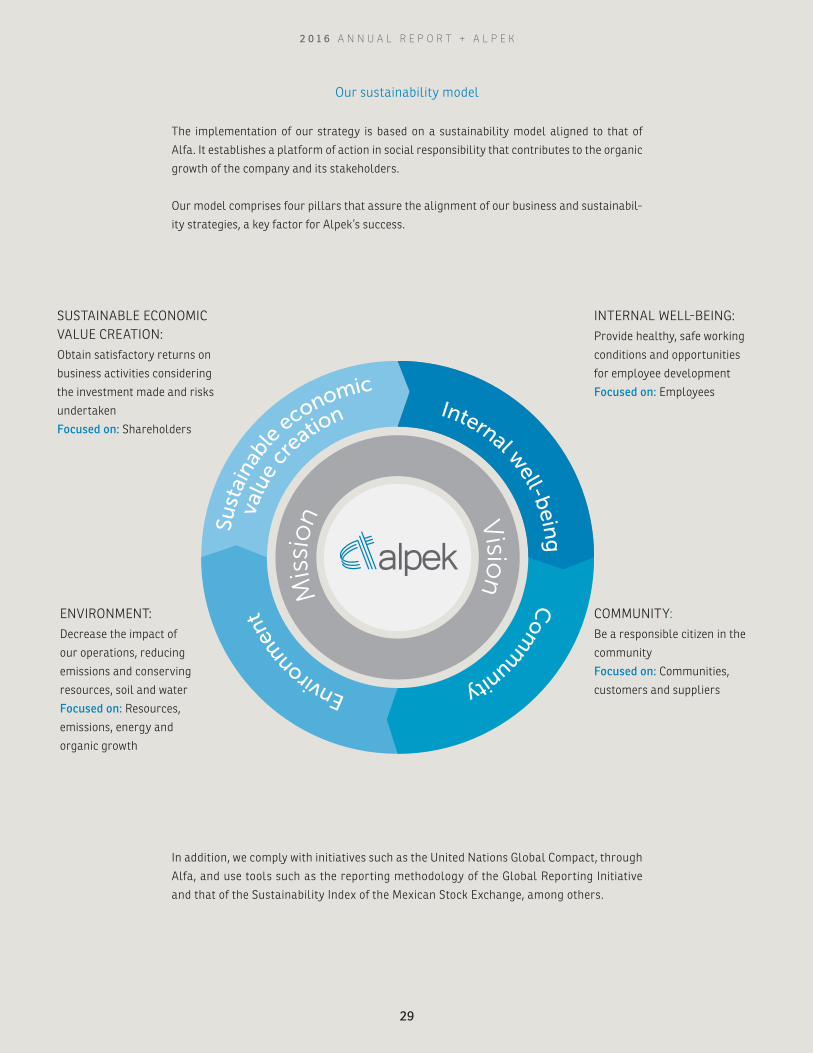
Internal well-bein
gC
omm
unity
ENVIRONMENT:Decrease the impact of
our operations, reducing
emissions and conserving
resources, soil and water
Focused on: Resources,
emissions, energy and
organic growth
INTERNAL WELL-BEING:Provide healthy, safe working
conditions and opportunities
for employee development
Focused on: Employees
COMMUNITY:Be a responsible citizen in the
community
Focused on: Communities,
customers and suppliers
Our sustainability model
The implementation of our strategy is based on a sustainability model aligned to that of
Alfa. It establishes a platform of action in social responsibility that contributes to the organic
growth of the company and its stakeholders.
Our model comprises four pillars that assure the alignment of our business and sustainabil-
ity strategies, a key factor for Alpek’s success.
In addition, we comply with initiatives such as the United Nations Global Compact, through
Alfa, and use tools such as the reporting methodology of the Global Reporting Initiative
and that of the Sustainability Index of the Mexican Stock Exchange, among others.
SUSTAINABLE ECONOMIC VALUE CREATION: Obtain satisfactory returns on
business activities considering
the investment made and risks
undertaken
Focused on: Shareholders
2 0 1 6 A N N U A L R E P O R T + A L P E K
29

Communication with stakeholdersMaterial aspect: CSR management
We must respond to the concerns and suggestions of our stakeholder
groups in order to assure our permanence over time, so we are in continuous communication
with them through diverse media.
In 2016, we interacted with our stakeholders in the ways shown below:
G4-24, 26, 27
SHAREHOLDERS
- Quarterly meetings and annual results- Investor relations- Quarterly reports and calls- Annual Shareholders’ Meeting
CUSTOMERS
- Toll-free telephone service- E-mail contact- One-on-one meetings- Satisfaction survey
EMPLOYEES
- Labor climate survey- Transparency mailbox- E-mail bulletins- Communication screens
SUPPLIERS
- Direct communication- Supplier development program- Program for identifying SR in the value chain
COMMUNITIES
- Community engagement programs- Focus groups at neighborhood meetings- Contingency plans- Immediate attention
MATERIALITY ANALYSIS
2 0 1 6 A N N U A L R E P O R T + A L P E K
30
Corporate governance
Alpek’s economic well-being and the continuity
of its operations are based on acting with responsibility towards its
stakeholders.
This conviction begins with the Board of Directors and permeates
throughout the entire organization. The Board continuously pro-
motes initiatives to ensure the sustainability of our operations and
is closely involved in the evaluation, development and approval of
Alpek’s mission, vision, values and comprehensive strategy.
Alpek’s management team supports the Board of Directors in imple-
menting initiatives and monitoring compliance with environmental,
economic and social goals. Each one of these areas is administered
from a specific department in Alpek and in each of its companies.
Progress is monitored through specific measurable indicators and
evaluated periodically to assure the improvement and continuity of
our strategies.
Investor Relations is responsible for the Sustainability section, which
has been part of the Annual Report for Shareholders for the past
three years. The department has an open channel of communication
with the shareholders and financial markets. In this way, we ensure
that the information provided to these groups corresponds to exactly
what we have done and its scope, in accordance with the goals es-
tablished in our sustainability strategy, which is directly related to
our business strategy.
CREATION OF SUSTAINABLE ECONOMIC VALUEMaterial aspect: CSR management
Creating economic value in a responsible way is
our highest priority. We know that doing this in a sustainable manner
is the only way to benefit our shareholders, communities and the
environment in which we operate.
2016 was characterized by volatility in oil and feedstock prices,
which largely affected our Polyester segment, while our Plastics
and Chemicals segment posted record results for its PP and EPS
businesses.
Our 2016 financial performance is summarized below:
Aspect(millions of USD)
2015 2016
Consolidated revenues 5,284 4,838
Consolidated net income 233 272
Majority net income 175 198
Basic and diluted earnings per share (dollars)
0.08 0.09
Income tax 54 164
Dividends 160 225
Capital expenditures and acquisitions
317 345
Net debt 722 1,042
Net debt/EBITDA (times) 1.1 1.6
G4-42, EC1
G4-35, 42
On the basis of this communication, we selected the key aspects for
2016 as: operating safety for our communities; product and service
quality for our customers and suppliers; and business strategy and
sustainability for our shareholders. Our employees also expressed
their ideas on innovation, business vision and labor relations.
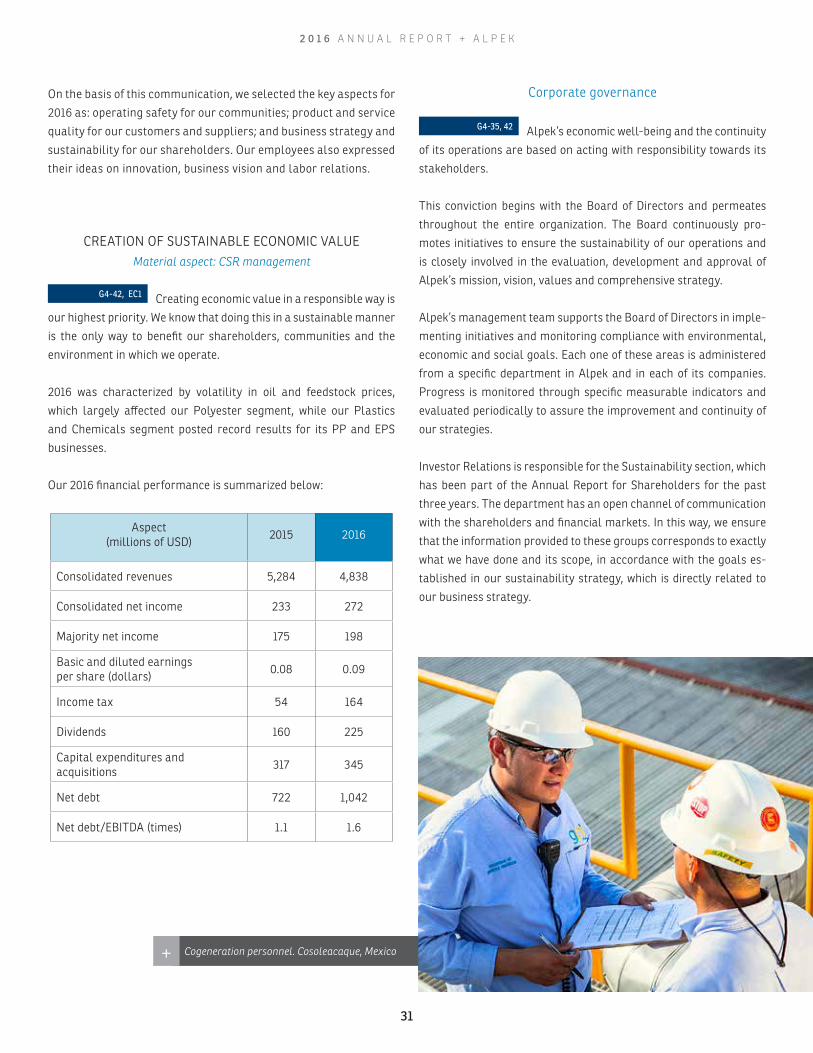
Cogeneration personnel. Cosoleacaque, Mexico+
2 0 1 6 A N N U A L R E P O R T + A L P E K
31

Financial opportunities and risks due to climate change
Material aspects: Distribution of wealth, Operations and
risk strategy, Climate change and emissions strategy
The Alpek team works with a dynamic and
highly innovative focus to adapt our actions to the continuous
progress and change in the world in which we operate. We under-
stand the great challenge our business faces because we work with
non-renewable resources, so every year we dedicate resources and
design strategies to optimize our processes and operate in an in-
creasingly sustainable manner.
By continuously analyzing the events, trends and factors that affect
our industry, we identify the risks and opportunities that climate
change represents for the efficiency of our operations. Ever-stricter
environmental laws and standards, natural disasters that affect the
logistics of product delivery, and water and oil shortages constitute
great challenges not only for the sector but also for the entire planet.
To face these challenges, we invest in technology, the improvement
of our equipment and processes, and making strategic acquisitions
to enhance our competitiveness and optimize resources. Examples
of these actions include: the construction of a second cogeneration
plant in Altamira, Tamaulipas, that will come on line in 2018; and the
building of two storage spheres for propylene, a very-delicate basic
feedstock for our operations, that progressed according to plan and
will be finished during the first half of 2017.
During the year, we also changed standard light bulbs for LED ones
at a number of our facilities, and automated the process for collect-
ing and managing the company’s sustainability information using
a cloud-based system that helps us to follow the indicators better.
These, and other initiatives, help us to protect the environment while,
at the same time, generating economic benefits.
INTERNAL WELL-BEINGOur employees
Material aspects: Distribution of wealth, Labor practices
Alpek’s employees are our main strength and
greatest wealth so we are committed to providing them with the best
possible working conditions. Although, due to the nature of our op-
erations, our workforce consists mainly of men, we operate with solid
gender-equality policies, such as DAK Americas’ Equal Employment
Opportunity Policy, maternity and paternity benefits, and other
specific benefits, such as flextime and working from home. Wages
and salaries are based on the profile of any given position and the
competencies of the person who will occupy it, not on the gender.
Benefits are granted according to an employee’s category and the
activities he/she carries out.
The ratio of the base salary of our male employees to that of our
female employees is 1:1, in other words, there is no difference in
salary at all.
EC2
EC5, LA12, LA13
Type of employee Men Women Total
Executives and employees 1,489 543 2,032
Union members 3,121 131 3,252
Total 4,610 674 5,284
87% 13% 100%
Laboratory personnel, Alpek Polyester. Altamira, Mexico+
Type of contract Total
Permanent 5,108/ 86.85%
Part-time 176/ 3.00%
External 597/ 10.15%
2 0 1 6 A N N U A L R E P O R T + A L P E K
32
Training and development
One of our goals is to work continuously to as-
sure the personal and professional growth of our people. Year after
year, we improve our training processes, adapting them to the cur-
rent needs of the labor environment and ensuring they have strategic
relevance. In 2016, two of the main focuses of our training program
were industrial safety and leadership in the workplace. For example,
DAK Americas implemented the Emerging Talent Program across all
its US facilities and held a training session for its management team
in the Center for Creative Leadership.
The table below summarizes our 2016 training initiatives in terms of
hours dedicated to each employee:
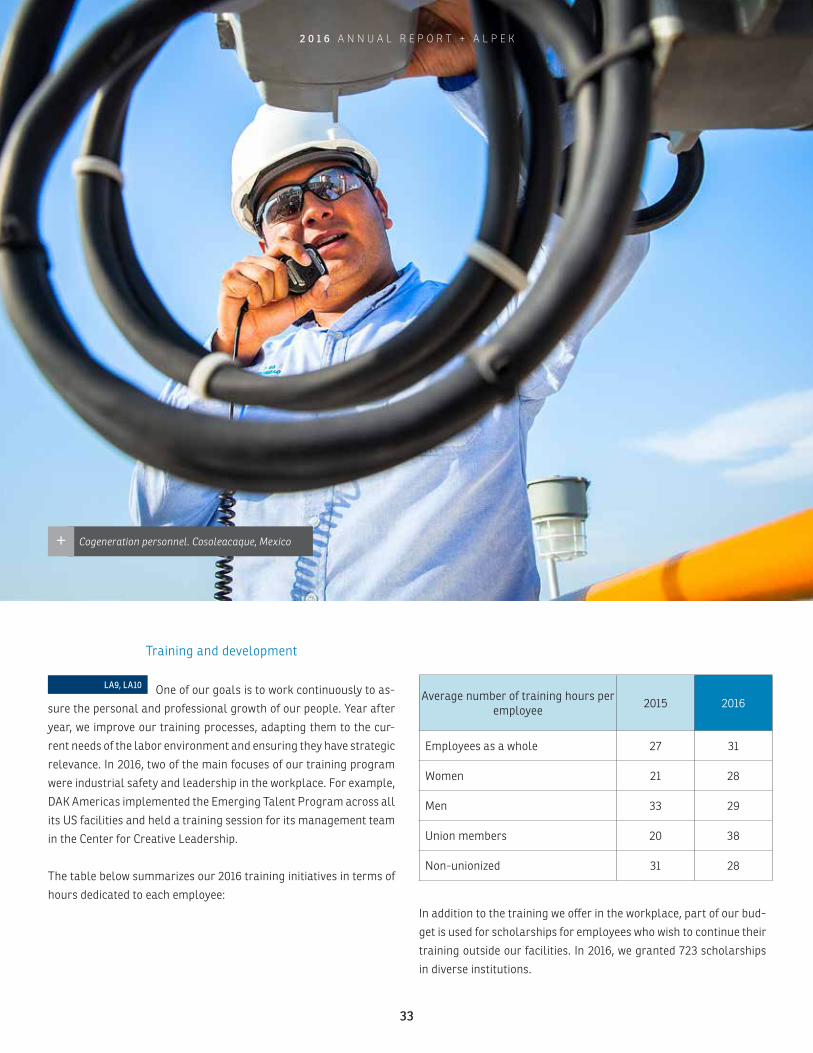
Cogeneration personnel. Cosoleacaque, Mexico+
LA9, LA10Average number of training hours per
employee2015 2016
Employees as a whole 27 31
Women 21 28
Men 33 29
Union members 20 38
Non-unionized 31 28
In addition to the training we offer in the workplace, part of our bud-
get is used for scholarships for employees who wish to continue their
training outside our facilities. In 2016, we granted 723 scholarships
in diverse institutions.
2 0 1 6 A N N U A L R E P O R T + A L P E K
33

Alpek Polyester, Indelpro and Styropek personnel taking part in an AINSTAC simulation exercise+
2 0 1 6 A N N U A L R E P O R T + A L P E K
34

We supported our employees’ families in 2016, giving a total of
1,136 scholarships and educational grants to their children. We
also invested more than double the 2015 amount in 34 family
events for more than 5,300 participants. Additionally, at our US
sites we offered financial education courses, such as SmartDollar,
for family members.
In Mexico, we took part in the ANSPAC Woman program, the objec-
tive of which is to promote universal values for the betterment of
women and their families.
Occupational health and safetyMaterial aspect: Health and safety
The most essential requirement for our em-
ployees to be able to carry out their functions effectively is to do so
in a safe place of work. Consequently, we invest in the right safety
equipment, encourage personnel from all areas of the company to
join our health and hygiene committees, and create awareness of
how to lead a healthy life.
In 2016, Alpek companies invested $18 million in 89 health and
safety programs, including courses on the use of items of per-
sonal protection, chemical risks and carcinogenic substances, as
well as in our brigade campaigns. More than 8,200 Alpek em-
ployees were benefited.
We also implemented programs for respiratory protection, vaccina-
tion campaigns and initiatives for practicing yoga in the office. We
keep a record of the health of our workers and, if any of them carry
out activities with elevated risk, we reinforce the necessary safety
measures and conditions.
We regret to report an accident at the DAK Americas Columbia plant
in South Carolina in 2016, which resulted in the death of one of our
workers and two more injured. We are deeply sorry for this loss
which drives us to redouble our efforts and continue working to avoid
any further incidents.
The table below summarizes our results in the area of occupational
safety in 2016:
Indicator 2015 2016
Loss ratio 43.8 17.4
Frequency 2.2 1.08
Accidents 21 12
Lost days 416 193
Fatalities 0 1
Among our company’s most outstanding achievements are the fol-
lowing: i) 5.2 years without an accident with lost time at our Styropek
plant in Argentina, ii) 75% reduction in loss ratio and 30% decrease
in frequency at Akra Polyester, iii) 10 years without an incapacitating
accident at Styropek Mexico and iv) 19 years without an incapacitat-
ing accident in Petrotemex’s laboratory and engineering area.
LA5, LA8
Styropek personnel wearing pink shirts for breast cancer awareness+
2 0 1 6 A N N U A L R E P O R T + A L P E K
35
ENVIRONMENT
The sustainability of our operations depends to
a large extent on our maintaining and complying with strict environ-
mental standards. We recognize that the use of petroleum deriva-
tives implies a great commitment, which we make through actions
that range from the continuous monitoring and review of the pro-
cesses in our facilities to the promoting of an environmental culture
outside them. In 2016, Alpek invested US $21.7 million in this issue,
distributed as follows:
Area of investment(millions of dollars) 2015 2016
Reduction of emissions 19.2 3.3
Environmental management costs
7.2 3.9
Waste disposal and reduction
1.3 0.01
Prevention costs 1.0 0.2
Other environmental actions
0.3 4.7
Remediation costs 0 9.6
Total 29.0 21.7
We underpin this commitment with agreements with governments
and municipalities, participating in processes such as the Energy
Efficiency Certification System in several nations and the obtaining
of ISO environmental certification.
For example, in 2016 Akra Polyester obtained certification under the
new version of ISO 14001, becoming the first Mexican company to
comply with this version of the standard.
Energy efficiencyMaterial aspect: Energy eco-efficiency
Through projects such as our cogeneration
plants, one already functional in Cosoleacaque, Veracruz, and an-
other one being built in Altamira, Tamaulipas, we make our use of
non-renewable resources increasingly efficient. As well as gener-
ating electricity, these facilities produce steam that we use in the
production processes. As a result, in June 2016 Alpek’s PTA plant in
Cosoleacaque stopped using its last conventional furnace and to-
day obtains the steam used in its processes from the cogeneration
plant. This represents a reduction of 76,070 GJ in external electricity
use, equivalent to the annual consumption of 2,349 Mexican homes.
The cogeneration plant produced a total of 686 GWh of electricity in
2016, which was used to supply most of our Mexican PTA and PET
operations. The reduction of energy consumption per produced ton
was one of the main targets for all Alpek companies this year.
Name reptas re lab ide il et omni odi a voles dolorestrum netur sit asped quo est ipsande riatur.+
EN27, EN31
EN3, EN4, EN6
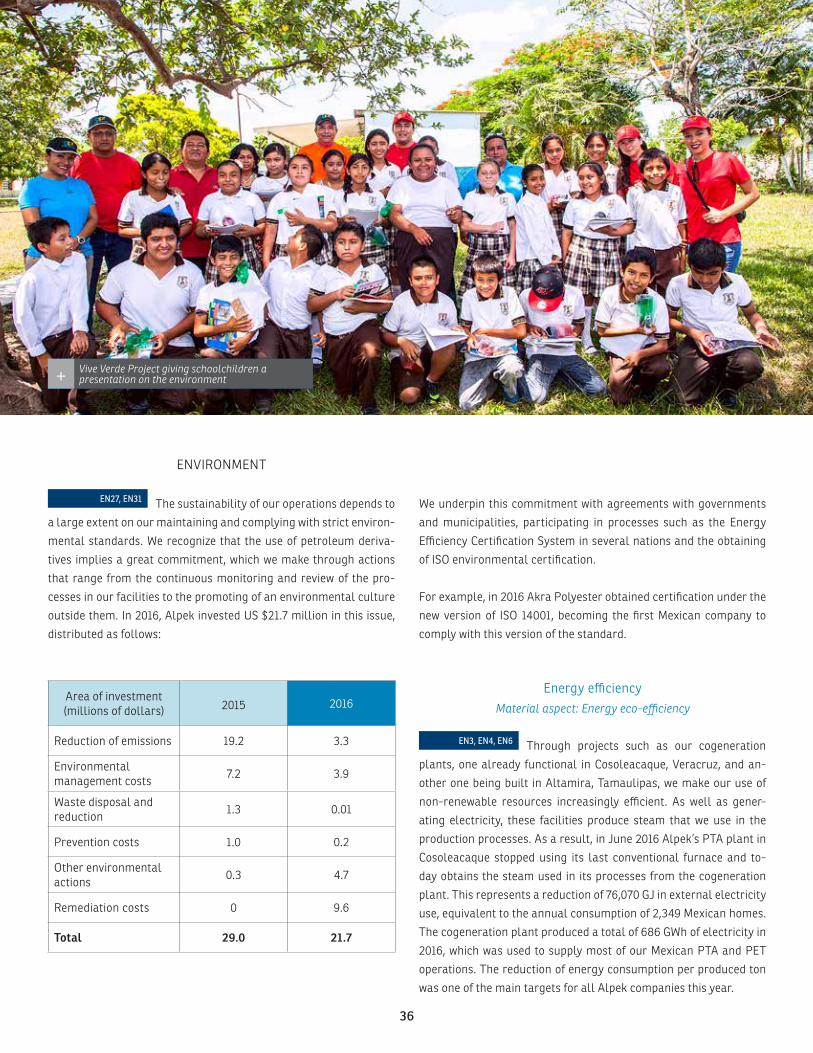
Vive Verde Project giving schoolchildren a presentation on the environment+
36

The aggregate effect of the initiatives the Alpek companies have implemented resulted in
savings of 345,536 GJ in 2016, equivalent to the annual electricity needs of 10,670 Mexican
homes.
EN8, EN10
Energy source Direct consumption (GJ x 106) Indirect consumption (GJ x 106)
2015 2016 2015 2016
Natural gas 20.7 21.3
Coal 0.5 0.5
Alternative fuels 0.1 0.1
Fuel oil 0.0 0.1
Electricity 6.5 6.5
Steam 5.9 6.6
Total 21.2 21.9 12.4 13.1
Water careMaterial aspect: Water management
Water is a crucial resource for our operations. Working to reduce our
water footprint and using this resource in a more responsible way are core goals of all our
operating processes. We have 12 company-owned water treatment plants and also use third-
party support to reduce our water consumption and promote its reuse and recycling.
Water consumption by source (millions of m3) 2015 2016
Rivers, lakes and seas 89.5 96.4
Underground water 3.5 3.1
Municipal water supply 1.2 2.7
Waste water from another organization 0 0.6
Other 0.5 0.2
Total 94.6 103.0
2015 2016
Treated water (millions of m3) 15.1 12.2
2 0 1 6 A N N U A L R E P O R T + A L P E K
37
In 2016, Alpek’s companies reduced their water consumption through
actions and programs such as those described below:
In Mexico, Petrotemex implemented a water recovery and treatment
project, which resulted in a total of 1.2 million m3 of treated water by
the end of the third quarter, equivalent to the annual average con-
sumption of 40,823 Mexican families.
Univex treated and reused 1.7 million m3 of water, 83% of the total
consumption of its operations, and reduced water use by 2.5 m3 per
ton of produced caprolactam.
Meanwhile, Akra Polyester obtained 96% of the water consumed in
its processes from another organization’s waste water.
Two of our plants are close to areas with significant water resources
and biodiversity. The Columbia plant in the United States is located
24 kilometers from the Congaree National Park, while the Zárate
plant in Argentina is less than 25 kilometers from the Paraná Delta
Biosphere Reserve. These two facilities contribute to the protection
and preservation of their local habitats.
Water discharge
We work to ensure that our wastewater discharge is continuously
declining and cleaner, complying 100% with current national and
international standards. In 2016, 11.3 million m3 of water were dis-
charged into rivers and lakes once they had been treated in internal
and external water treatment plants.
REDUCTION OF EMISSIONS Material aspect: Climate change and emissions strategy
Caring for the atmosphere and the quali-
ty of the air we breathe is of great importance to Alpek and consti-
tutes part of our international agenda. We work to this end through
emissions reduction programs at all our plants and through our
participation in the carbon credit system. Moreover, in 2016 the
company presented its first report to the Carbon Disclosure Proj-
ect, showing the results of our efforts to mitigate climate change
and contribute to the UN goal of limiting global warming to 2ºC or
less by 2030.
Total 2016 CO2 emissions are broken down in the table below:
CO2 Emissions 2015 2016
Direct emissions (tons CO2e x 106) 1.21 1.25
Indirect emissions (tons CO2e x 106) 1.08 1.14
Total 2.29 2.39
Emissions of other pollutants
Tons emitted per Pollutant 2015 2016
NOx 431.3 596
SOx 766.1 277
Volatile organic compounds
(VOCs)Not quantified 536
Hazardous air pollutants
(HAPs)Not quantified 362
Particulates (PM) Not quantified 106
Even as our operations grew in 2016, the implemented initiatives al-
lowed us to maintain a stable emissions level compared to 2015.
EN15, EN16, EN19, EN21
2 0 1 6 A N N U A L R E P O R T + A L P E K
38

Vive Verde Project talks+
39
2 0 1 6 A N N U A L R E P O R T + A L P E K

Raw materials and use of resources
Alpek continuously looks for ways to make its operations more effi-
cient and environmentally friendly. In 2016, we began building two
spheres for storing propylene, a basic feedstock that requires very
careful handling and storage. This project will improve logistics and
increase the capacity utilization of our polypropylene plant.
Another initiative that we have implemented to optimize resources
is the operation of two PET recycling plants, with an aggregate pro-
cessing capacity of 89,000 tons per year. In 2016, Alpek processed
69,400 tons, equivalent to planting 417,000 trees because the emis-
sions that would have been generated in producing new PET were
not generated.
We also reduced our production of hazardous and non-hazardous
waste by using our resources better. In 2016, Petrotemex set the goal
of lowering its hazardous waste by 300 tons, which it partially ful-
filled by reducing hazardous waste generation by 205 tons.
Another outstanding program is DAK Americas’ Zero Waste pro-
gram, through which this company had reduced the waste its sends
to landfills by 98% as of year-end 2016.
Alpek’s efforts in this area vary greatly in scale, ranging from the re-
cycling of office waste such as paper and cardboard to the recycling
and reuse of raw materials. For example, in 2016 Styropek Mexico
recovered 60.64 tons of styrene and 1,230 tons of organic phase
polymer which were used directly in the manufacturing process.
Vive Verde event+
2 0 1 6 A N N U A L R E P O R T + A L P E K
40
OUR CUSTOMERS AND SUPPLIERSMaterial aspects: Customer and supplier relations,
Relations with NGOs and regulatory agencies
Alpek builds long-term, win-win relationships of shared responsibil-
ity with its value-chain partners. We assure the quality of the prod-
ucts we offer by continuously reviewing our processes and building a
close relationship with our suppliers. Consequently, all Alpek com-
panies have an executive in charge of supervising the performance
of the value chain.
In 2016, we continued auditing our transport companies to ensure
that they comply with the requirements to enter our facilities; made
monthly inspections of the contractors who supply our safety equip-
ment and tools; and evaluated the quality of the work, services and
materials at the end of a given assignment. At our PET and PTA
facilities in Mexico, every year we audit the management, quality,
environmental impact, vehicles, raw materials and policies of the
eighteen freight companies responsible for delivering our feedstock.
It is important to note that in 2016 Petrotemex gave safety training
to the more than 1,500 external contractors who work in its facilities,
and Indelpro obtained the AISTAC* award for companies that give
significant support to their suppliers in Mexico.
In the case of our customers, all Alpek companies gave out satisfac-
tion surveys, making sure that at least 50% of them were answered.
The overall rating for 2016 was 94% positive, compared to 91% in
2015. Not only is this a good result, but it also encourages us to con-
tinue working in accordance with our sustainability strategy.
*AISTAC: Asociación de Industriales del Sur de Tamaulipas, A.C.
PARTICIPATION IN CHAMBERS AND ASSOCIATIONS
One of the most effective ways of driving our industry, developing the
value chain and complying with current rules and regulations is by
collaborating with other companies in our sector. This keeps us up to
date on any changes in the industry and related legal rulings, as well
as on industry requirements, and positively and proactively helps
us to support its sustainable growth. For example, in 2016 Indelpro
actively participated as a promoter of the setting up of the supplier
committee of AISTAC, through which they boost their suppliers’ de-
velopment by sharing best practices with other affiliated companies.
In 2016, we actively participated in the following organizations:
OUR COMMUNITYMaterial aspect:
Community engagement
Our neighboring communities grant us li-
cense to operate. In exchange, Alpek implements programs to serve
their needs and improve their quality of life.
For example, in 2016 more than 50 schools and 7,380 students ben-
efited from Alpek’s support. DAK Americas alone repaired, painted
and supported civic activities at 30 schools close to its plants in the
United States.
Petrotemex held an event called Vive Verde (Live Green) in which
employees visited schools, giving talks to students on how to live
with an environmental culture and take care of the planet.
During the year, Styropek Mexico partnered with the association
CARITAS of Tampico to help communities affected by Hurricane Earl
and sent support for those displaced by heavy rainfall in Tampico,
Madero and Altamira.
Univex has a program for donating agricultural products, result-
ing from the testing of fertilizers in pilot programs, to neighboring
communities and to the DIF (a family-focused government charity)
of Salamanca. In 2016, it donated 1.2 tons of beans and gave med-
ical orientation sessions and healthcare talks to the inhabitants of
Godoy, a local community.
A total of 309 employees gave an aggregate time of 2,463 man-hours
to voluntary work in 2016.
With regard to the safety of our operations, all Alpek facilities have
channels of communication open to the leaders and authorities of
their neighboring communities, as well as contingency and training
plans for emergencies. For example, Akra Polyester is part of a Local
Committee for Mutual Support. This entity was legally constituted
before the department of Civil Protection to assure mutual support
between companies and the community in case of emergencies or
environmental contingencies.
DAK Americas sites, with the exception of Pearl River, have Commu-
nity Advisory Panels, forums with local leaders to discuss the impact
of operations and any other concerns that the members of neighbor-
ing communities might have.
G4-12, 15, 24 to 26, EN33, LA14, LA15, HR4, HR10, HR11, SO9, SO10EC7, SO1
2 0 1 6 A N N U A L R E P O R T + A L P E K
41
Company Association
Participation in steering committees or special projects
Above minimum financial support
Akra ANIQ (Asociación Nacional de la Industria Química) No No
DAK Americas
AFMA (American Fiber Manufacturers Association) Yes Yes
CAIRPLAS (Cámara Argentina de la Industria de Reciclados Plásticos) Yes No
CAPCA (Carolinas Air Pollution Control Association) Yes No
CCAM (Cámara de Comercio Argentina-Mexicana) No No
CEMPRE (Compromiso Empresario para el Reciclado) No No
CERA (Cámara de Exportadores de la República Argentina) No No
CICAZ (Comité Interindustrial de Conservación del Ambiente Zárate Campana)
Yes No
CIPETAR (Cámara de la Industria del PET Argentina) Yes No
CIQyP (Cámara de la Industria Química y Petroquímica) No No
CIRA (Cámara de Importadores de la República Argentina) No No
IAE (Instituto Argentino del Empaque) No No
INDA (Association of the Nonwoven Fabrics Industry) No No
IPA (Instituto Petroquímico Argentino) No No
MMA (Mississippi Manufacturers Association) No No
NAPCOR (National Association for PET Container Resources) Yes No
NCMA (North Carolina Manufacturers Alliance) Yes No
NCTO (National Council of Textile Organizations) Yes Yes
SCMA (South Carolina Manufacturers Alliance) Yes Yes
STA (Southern Textile Association) No No
SYFA (Synthetic Yarn and Fiber Association) Yes Yes
PETRA (The PET Resin Association) Yes Yes
UET (Unión Empresaria de Municipio Tigre) No No
UIZ (Unión Industrial de Zárate) Yes No
2 0 1 6 A N N U A L R E P O R T + A L P E K
42
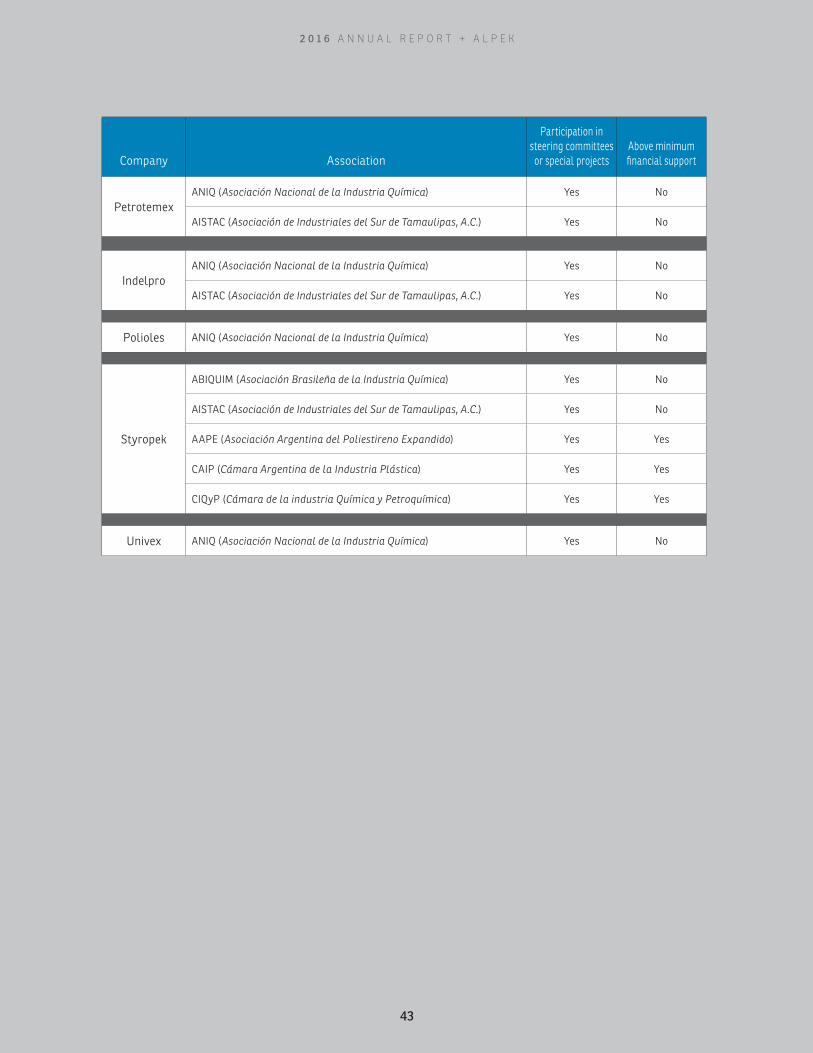
Company Association
Participation in steering committees or special projects
Above minimum financial support
PetrotemexANIQ (Asociación Nacional de la Industria Química) Yes No
AISTAC (Asociación de Industriales del Sur de Tamaulipas, A.C.) Yes No
IndelproANIQ (Asociación Nacional de la Industria Química) Yes No
AISTAC (Asociación de Industriales del Sur de Tamaulipas, A.C.) Yes No
Polioles ANIQ (Asociación Nacional de la Industria Química) Yes No
Styropek
ABIQUIM (Asociación Brasileña de la Industria Química) Yes No
AISTAC (Asociación de Industriales del Sur de Tamaulipas, A.C.) Yes No
AAPE (Asociación Argentina del Poliestireno Expandido) Yes Yes
CAIP (Cámara Argentina de la Industria Plástica) Yes Yes
CIQyP (Cámara de la industria Química y Petroquímica) Yes Yes
Univex ANIQ (Asociación Nacional de la Industria Química) Yes No
2 0 1 6 A N N U A L R E P O R T + A L P E K
43

BOARD OF DIRECTORS
Armando Garza Sada (3)
Chairman of the Board of Alpek, S.A.B. de C.V.
+ Board member of Alpek since April 2011. Chairman of the Board of ALFA and NEMAK. Member of the Boards of CEMEX, FEMSA, Frisa Industrias, Grupo Lamosa, Liverpool, Proeza and ITESM. Member of the Board of Consejo Mexicano de Negocios (CMN).
Álvaro Fernández Garza (3)
President of ALFA, S.A.B. de C.V.
+ Board member of Alpek since April 2011. Co-Chairman of the Board of Axtel. Member of the Boards of ALFA, NEMAK, Cydsa, Grupo Aeropuertario del Pacífico, Vitro, Universidad de Monterrey (UDEM), Georgetown University (Latin American Board) and Museo de Arte Contemporáneo de Monterrey.
Francisco José Calderón Rojas (2)
Chief Financial Officer of Grupo Franca Industrias, S.A. de C.V.
+ Board member of Alpek since April 2012. Member of the Boards of Franca Industrias, Franca Servicios, Franca Desarrollos and Universidad de Monterrey (UDEM), and an Alternate Member of the Boards of FEMSA and Coca Cola FEMSA.
Rodrigo Fernández Martínez (3)
President of Sigma Mexico and Latin America
+ Board member of Alpek since April 2012. Previously Marketing and Finance Director of Sigma.
Andrés E. Garza Herrera (1A)
Chief Executive Officer of Qualtia Alimentos, S.A. de C.V.
+ Board member of Alpek since April 2012. President of Mexican Consumer Products Industry Council / Consejo Mexicano de la Industria de Productos de Consumo, A.C. (ConMéxico). Member of the Boards of Xignux, Banorte Regional, Universidad de Monterrey (UDEM) and Ciudad de los Niños.
Merici Garza Sada (4)
Investor
+ Board member of Alpek since April 2012.
Pierre Francis Haas García (1)
Advisory Services Director of Hartree Partners LP
+ Board member of Alpek since April 2012.
Jaime Serra Puche (1A)
Founding Partner and Chief Executive Officer of SAI Consultores, S.C.
+ Board member of Alpek since April 2012. Member of the Boards of Fondo México, Tenaris, Vitro, Rotoplas, Fresnillo plc and Grupo Financiero BBVA Bancomer.
Enrique Zambrano Benítez (1A)
Chairman of the Board and Chief Executive Officer of Grupo Proeza, S.A. de C.V.
+ Board member of Alpek since April 2012. Member of the Boards of Grupo Proeza, CFE and ITESM.
Carlos Jiménez BarreraSecretary of the Board
Key
1. Independent Board Member
2. Independent Patrimonial Board Member
3. Related Patrimonial Board Member
4. Patrimonial Board Member
A. Audit and Corporate Practices Committee
G4-34, 38
2 0 1 6 A N N U A L R E P O R T + A L P E K
44

MANAGEMENT TEAM
1. José de Jesús Valdez SimancasChief Executive Officer
CEO of Alpek since 1988. Former CEO of
Petrocel, Indelpro and Polioles, and former
Chairman of the National Association
of the Chemical Industry (ANIQ). Holds
an undergraduate degree and MBA
from ITESM and a Master’s in Industrial
Engineering from Stanford University.
2. Eduardo Escalante CastilloChief Financial Officer
Chief Financial Officer of Alpek
since 2013. Former President of the
Caprolactam Division of Alpek and
President of AOL Mexico. Holds an
undergraduate degree from ITESM and
a Master’s in Engineering from Stanford
University.
5. Jorge González EscobedoPresident of the Filaments Fibers Business Unit
President of Alpek’s Filaments Fibers
Business Unit since 2005. Joined Alfa in
1974 and is a former Vice President of
Alpek’s Industrial Filaments Business
Unit. Holds an undergraduate degree
and an MBA from ITESM.
6. Alejandro Llovera ZambranoPresident of the Polypropylene Business Unit
President of Alpek’s Polypropylene
Business Unit since 2008. Joined Alfa
in 1985, is a former Director of Human
Resources at Alfa, held several executive
positions in Alpek’s Synthetic Fibers
Business Unit and former Chairman of
ANIQ. Holds an undergraduate degree
and an MBA from ITESM.
7. José Luis Zepeda PeñaPresident of the EPS and Chemicals Business Unit
President of Alpek’s EPS and Chemicals
Business Unit since 1999. Joined Alpek
in 1986 and is former Vice President of
Planning, Finance and Administration,
and Sales at Grupo Petrotemex. Holds
an undergraduate degree and Master’s
in Chemical Sciences from UNAM and an
MBA from ITESM.
8. Gustavo Talancón GómezPresident of the Caprolactam and Fertilizers Business Unit
President of the Caprolactam and
Fertilizer Business Unit since 2013.
Joined Alfa in 1989, is former CEO
of Terza, and held several executive
positions in Alpek’s Polypropylene
and Nylon and Polyester Filaments
Business Units. Holds an undergraduate
degree from ITESM and a graduate
degree from IPADE.
3. Felipe Garza MedinaCo-President of Alpek Polyester
President of Alpek’s PTA Business Unit from 2008 to 2016. Joined Alfa in 1977 and is former CEO of Indelpro and Galvacer. Holds an undergraduate degree from Stanford University and an MBA from Cornell University.
4. Jorge P. Young CerecedoCo-President of Alpek Polyester
President of Alpek’s PET and Staple Fibers Business Unit from 2012 to 2016.Former Executive Vice President of PET Resins and Vice President of Planning and Administration of DAK Americas LLC. Holds an undergraduate degree from ITESM and an MBA from the University of Pennsylvania.
517 8 3 426
G4-34, 39
2 0 1 6 A N N U A L R E P O R T + A L P E K
45

CORPORATE GOVERNANCE
Once a year, all companies that are listed on the Bolsa Mexicana de
Valores, S.A.B. de C.V. (BMV) must disclose the extent to which they
adhere to the CMPC by answering a questionnaire. The responses of
the different companies may be consulted on the BMV’s website.
A summary of Alpek’s principles of corporate governance is presented
below, reflecting the answers the company gave to the questionnaire
in June 2016 and updated where necessary:
+ The Board of Directors is made up of nine members, who have
no alternates. Of the nine directors, four are independent board
members, four are related proprietary board members and one
is an independent proprietary board member. This annual report
provides information on all the board members, identifying those
who are independent and their participation in the Audit and Cor-
porate Practices Committee.
+ The Board of Directors is advised by the Audit and Corporate
Practices Committee. The Committee Chairman is an independent
board member.
+ The Board of Directors meets every three months. Meetings of the
Board may be called by the Chairman of the Board, the Chairman
of the Audit and Corporate Practices Committee, the Secretary of
the Board or at least 25% of its members. At least one such meet-
ing every year is dedicated to defining the company’s medium and
long-term strategies.
+ Members must inform the Chairman of the Board of any conflicts
of interest that may arise, and abstain from participating in any
related deliberations. The average attendance at Board Meetings
in 2016 was 94.4%.
+ The Audit and Corporate Practices Committee studies and issues
recommendations to the Board of Directors on matters such as se-
lecting and determining the fees to be paid to the external auditor,
coordinating with the company’s internal audit area and studying
accounting policies.
+ Additionally, the Audit and Corporate Practices Committee is re-
sponsible for issuing recommendations to the Board of Directors
on matters related to corporate practices, such as employment
terms and severance payments for senior executives, and com-
pensation policies
+ The company has internal control systems with general guide-
lines that are submitted to the Audit and Corporate Practices
Committee for its opinion. In addition, the external auditor vali-
dates the effectiveness of the internal control system and issues
reports thereon.
+ The Board of Directors is advised by the planning and finance de-
partment when evaluating matters relating to the feasibility of in-
vestments, strategic positioning of the company, alignment of in-
vesting and financing policies, and review of investment projects.
This is carried out in coordination with the planning and finance
department of the holding company, Alfa, S.A.B. de C.V.
+ Alpek has a department specifically dedicated to maintaining an
open line of communication between the company and its share-
holders and investors. This ensures that investors have the finan-
cial and general information they require to evaluate the compa-
ny’s development and progress. Alpek uses press releases, notices
of material events, quarterly results conference calls, investor
meetings, its website and other communication channels.
+ Alpek promotes good corporate citizenship and adheres to the
recommendations of its holding company, Alfa, S.A.B. de C.V. It
has a mission, vision and values, and code of ethics that are pro-
moted within the organization.
G4-38, 42, 47, 49, 58
2 0 1 6 A N N U A L R E P O R T + A L P E K
46

GLOSSARYCaprolactam (CPL)
CPL is made by reacting cyclohexane, ammonia and sulfur and
is the raw material for the production of Nylon 6 polymer. Nylon
6 is a synthetic resin that, because of its strength, flexibility and
softness, has a range of end uses, including for sportswear, under-
clothes and engineering plastics.
Clean Industry Certification
Certification granted by the Mexican Environmental Protection
Agency (PROFEPA) to companies that comply with environmental
legislation.
Cogeneration
Process that produces both electricity and steam.
Comprehensive Responsibility Administrative System (Mexican
National Association of the Chemical Industry, ANIQ)
Certification given to companies that comply with the six compre-
hensive responsibility requirements established by the ANIQ, cov-
ering Process safety, Health and safety in the workplace, Product
safety, Transportation and distribution, Prevention and control of
environmental pollution and Community protection.
CO2 Emissions
Unit to measure the carbon dioxide produced by the burning of sol-
id, liquid and gaseous fuels, including natural gas.
Cyclohexane
Compound produced by the hydrogenation of benzene and used in
caprolactam production.
Ethane
Colorless, odorless hydrocarbon with a molecular formula of
C2H6 that is a component of natural gas.
Ethylene Oxide
Compound produced from ethylene and used as an intermediate in
the production of MEG and other chemicals.
Expandable Polystyrene (EPS)
Light, rigid, cellular plastic, product of the polymerization of sty-
rene monomer. EPS is a versatile material because of its proper-
ties as an impact reducer and thermal insulator, with customized
molding capacity. These properties, combined with the ease with
which it can be processed, make EPS a popular packaging for im-
pact-sensitive items and for protecting perishables. It is also widely
used in construction systems, to lighten floor and roof structures,
and as an insulator.
IntegRex®
Alpek-owned technology for producing PTA and PET from par-
axylene (pX) and monoethylene glycol (MEG), offering significant
cost savings and fewer intermediate steps in the production process.
Investment Grade
Rating given to a company as a result of an evaluation made by
credit-risk rating agencies such as Fitch Ratings, Standard &
Poor’s and Moody’s.
ISO 9001 Certification
Certification issued by rating agencies to those companies that
operate with proven procedures for assuring the quality of their
products, in accordance with the standard defined by the Interna-
tional Organization for Standardization (ISO).
ISO 14001 Certification
Internationally accepted standard for establishing an efficient En-
vironmental Management System (EMS). The standard is designed
to support companies’ profitability and at the same time minimize
environmental impact.
Megawatt (MW)
Unit of power, equal to 1 million watts.
Monoethylene Glycol (MEG)
Raw material with diverse industrial uses, especially for producing
polyester (PET and fiber), antifreeze, refrigerants and solvents.
2 0 1 6 A N N U A L R E P O R T + A L P E K
47

Paraxylene (pX)
Hydrocarbon in the xylene family used to produce PTA. It is also a
component of gasoline.
Polyethylene Terephthalate (PET)
Material widely used in the manufacture of bottles and other
containers for liquids, food and personal hygiene, household and
healthcare products. PET flakes and films are used to produce
caps, trays and recipients. Because of its transparency, strength,
durability and high protection barriers, PET presents no known
health risks, is light and recyclable, and has a wide range of ap-
plications in reusable, temperature-sensitive packaging. PET has
replaced glass and aluminum, as well as other plastics such as
PVC and polyethylene, for making containers.
Polypropylene (PP)
Thermoplastic polymer, produced from the polymerization of
propylene monomer. Its properties include a low specific grav-
ity, great rigidity, resistance to relatively high temperatures and
good resistance to chemicals and fatigue. PP has diverse appli-
cations, including for packaging, textiles, recyclable plastic parts
and different kinds of containers, auto-parts and polymer (plastic)
banknotes.
Polyurethanes (PURs)
Rigid, flexible or elastic, durable materials that are produced by
the reaction of a polyol with an isocyanate. They are very versatile,
offering the elasticity of rubber, combined with the hardness and
durability of a metal. PURs may be hard like fiberglass, spongy like
upholstery foam, protective like varnish, elastic like tire rubber or
sticky like glue.
Propylene
Unsaturated, 3-carbon hydrocarbon, co-product of the cracking
process at petrochemical complexes and a by-product at oil refin-
eries. It is used in the petrochemical industry to produce PP, pro-
pylene oxide, cumene, isopropanol, acrylic acid and acrylnitrile.
It is also converted into a gasoline component by alkylation with
butanes or pentanes.
Propylene Oxide
Compound produced from propylene and used to manufacture
commercial and industrial products, including polyols, glycols and
glycoethers.
Purified Terephthalic Acid (PTA)
Aromatic dicarboxylic acid, the main raw material in polyester pro-
duction. PTA is produced by the oxidation of paraxylene. It is used
to manufacture PET, which is then used to make bottles for water,
soft drinks and other beverages, containers and other packaging,
and polyester fiber for rugs, clothing, furniture and industrial ap-
plications, as well as other consumer products.
Single Step®
One-step technology for the production of EPS, where the EPS
pearls are impregnated with a pre-expanded agent during the po-
lymerization process.
Styrene Monomer
Unsaturated hydrocarbon used to make a variety of plastics, syn-
thetic rubber, protective coatings and resins. It is the main raw ma-
terial in EPS production and also used as a solvent and chemical
intermediate.
Watt
Unit of power in the International System of Units (SI).
2 0 1 6 A N N U A L R E P O R T + A L P E K
4848

Management’s analysis
Report of the independent auditors
Consolidated statements of financial position
Consolidated statements of income
Consolidated statements of comprehensive income
Consolidated statements of changes in stockholders’ equity
Consolidated statements of cash flows
Notes to the consolidated financial statements
50
58
62
63
64
65
66
67
Alpek, S. A. B. de C. V. and subsidiariesAt December 31, 2016 and 2015
CONSOLIDATED FINANCIAL STATEMENTS
2 0 1 6 A N N U A L R E P O R T + A L P E K
49
MANAGEMENT’SANALYSIS
2016The following analysis complements the Letter to Shareholders,
Audited Financial Statements and Complementary Information. Un-
less otherwise specified, figures are expressed in millions of nomi-
nal pesos for information corresponding to 2014 through 2016, with
certain figures expressed in millions of dollars (US $) due to the high
dollarization of Alpek’s revenues. Percentage variations are stated
in nominal terms and all information is presented in accordance
with International Financial Reporting Standards (IFRS).
Economic EnvironmentIn 2016, world economic growth continued to show weakness and fi-
nancial market volatility persisted, mostly as a result of events such
as Brexit, the US presidential elections and the standardization of
monetary policy by the US Federal Reserve (Fed). During the year,
the US dollar increased in value with respect to most currencies,
including the Mexican peso, due mainly to expectations of enhanced
economic growth in the US and the Fed’s increase in interest rates.
Lastly, the reference price of crude oil increased significantly to-
wards the end of the year after OPEC announced it had reached an
agreement to cut production. Thus, at the close of 2016 the price of
Brent oil was 55% above that of December 31, 2015.
The behavior of the Mexican GDP and other variables that are key to
better understanding Alpek’s results are described in the following
paragraphs:
US Gross Domestic Product (GDP) increased 1.6%(a) (estimated) in
2016, below the 2.6% growth of the previous year. Consumer infla-
tion was 2.1%(b), 0.6%(b) above 2015.
Mexico’s GDP growth decreased from 2.5% in 2015 to 2.3% (esti-
mated) in 2016. Consumer inflation was 3.4%(d) in 2016, higher than
the 2.1%(d) recorded in 2015. The Mexican peso depreciated 19.5%(e)
in nominal terms in 2016, compared to a depreciation of 17.0%(e) in
2015. In real terms, the average annual overvaluation of the Mex-
ican peso against the US dollar decreased from 11.8%(e) in 2015 to
6.3%(e) in 2016.
With regard to Mexican interest rates, the average TIIE (Interbank
Equilibrium Interest Rate) for the year was 4.5%(b) in 2016 in nominal
terms, as compared to 3.3% in 2015. In real terms, interest rates
decreased from an annual accumulated rate of 1.9% in 2015 to 0.5%
in 2016.
The annual average nominal 3-month dollar LIBOR rate was 0.7%(d)
in 2016, above the 0.3%(d) of 2015. Incorporating the nominal depre-
ciation of the peso against the dollar, the LIBOR rate in constant
pesos rose from 14.9%(c) in 2015 to 16.5%(c) in 2016.
Sources:
(a) Bureau of Economic Analysis (BEA)
(b) Bureau of Labor Statistics (BLS)
(c) Instituto Nacional de Estadística y Geografía (INEGI)
(d) Banco de México (Banxico)
(e) Banxico: foreign exchange rate for settling liabilities
denominated in foreign currency payable in Mexico
2 0 1 6 A N N U A L R E P O R T + A L P E K
50

Volume – (thousands of tons)
2016 2015 2014VAR. % 2016
vs 2015VAR. % 2015
vs 2014
Polyester 3,004 3,015 3,082 0 (2)
Plastics & Chemicals 934 922 849 1 9
TOTAL VOLUME 3,938 3,937 3,931 0 0
Revenue 2016 2015 2014VAR. % 2016
vs 2015VAR. % 2015
vs 2014
Polyester
Millions of pesos 64,241 60,769 63,228 6 (4)
Millions of dollars 3,444 3,840 4,752 (10) (19)
Plastics & Chemicals
Millions of pesos 25,951 22,821 22,844 14 0
Millions of dollars 1,394 1,444 1,719 (3) (16)
TOTAL REVENUE
Millions of pesos 90,192 83,590 86,072 8 (3)
Millions of dollars 4,838 5,284 6,471 (8) (18)
Price Index 2016 2015 2014VAR. % 2016
vs 2015VAR. % 2015
vs 2014
Polyester
Millions of pesos 104 98 100 6 (2)
Millions of dollars 74 83 100 (10) (17)
Plastics & Chemicals
Millions of pesos 103 92 100 12 (8)
Millions of dollars 74 77 100 (5) (23)
TOTAL
Millions of pesos 105 97 100 8 (3)
Millions of dollars 75 82 100 (8) (18)
2 0 1 6 A N N U A L R E P O R T + A L P E K
51
Revenue
Alpek’s net revenue in 2016 amounted to $90,192 million (US $4.838 billion), 8% above the $83,590 million (US $5.284 billion) posted in 2015.
The increase was due to an 8% rise in average prices. However, average dollar-denominated prices fell 8% as a result of the decline in the
prices of crude oil and main feedstocks, but these effects were offset by the depreciation of the peso against the dollar.
Revenue by Business Segment
Polyester net revenue in 2016 was $64,241 million (US $3.444 billion), 6% more than the $60,769 million (US $3.840 billion) of 2015. The seg-
ment posted a 6% increase in average sales price, while volume remained flat. The average Polyester price fell 10% in 2016 in dollar terms,
pressured by lower prices of main feedstocks such as paraxylene. However, the depreciation of the peso against the dollar offset this effect.
In 2016, net revenue from Plastics & Chemicals reached $25,951 million (US $1.394 billion), compared to $22,821 million (US $1.444 billion)
in 2015. The 14% increase was due to a 1% growth in volume and 12% rise in average sales price. Excluding the foreign exchange effect, the
average price of this segment was 5% less than in 2015, also reflecting the decline in crude and feedstock prices.
Operating Profit and EBITDA
2016 operating profit was $9,863 million (US $532 million), 30% above the $7,590 million (US $481 million) of 2015. Alpek’s two business
segments posted year-over-year operating profit improvement.
EBITDA was $12,425 million (US $669 million) in 2016, an increase of 25% compared to the $9,974 million (US $630 million) posted in 2015.
Consolidated 2016 EBITDA includes non-cash benefits of $622 million (US $32 million) from inventory gains and other non-operating items,
such that comparable EBITDA was $11,803 million (US $637 million), 13% more than in 2015.
Polyester EBITDA grew $1,095 million (US $5 million) year-over-year. Excluding the effect of non-cash benefits from inventory gains and
other non-operating items, comparable EBITDA for the Polyester segment rose by $133 million because of the depreciation of the peso
against the dollar. Comparable dollar-denominated EBITDA for the Polyester segment fell 13% year-over-year due to the negative impact of
low crude prices, the force majeure declared on US PET resin products after Hurricane Matthew and the weak demand for polyester fiber.
Plastics & Chemicals EBITDA was $5,948 million (US $322 million) in 2016, driven by record results in the polypropylene and expandable
polystyrene businesses. Excluding the non-cash benefits from inventory gains and other non-operating items, comparable EBITDA for Plas-
tics & Chemicals reached a record $5,695 million (US $308 million), 31% more than the $4,344 million (US $273 million) of 2015.
2 0 1 6 A N N U A L R E P O R T + A L P E K
52

Operating income (EBITDA) – (millions of pesos)
2016 2015 2014VAR. % 2016
vs 2015VAR. % 2015
vs 2014
Polyester 6,514 5,420 3,541 20 53
Plastics & Chemicals 5,948 4,508 2,110 32 114
Other and eliminations (37) 46 59 (180) (22)
TOTAL EBITDA 12,425 9,974 5,710 25 75
Operating Income (EBITDA) – (millions of dollars)
2016 2015 2014VAR. % 2016
vs 2015VAR. % 2015
vs 2014
Polyester 349 344 270 2 27
Plastics & Chemicals 322 284 159 14 79
Other and eliminations (2) 3 5 (162) (35)
TOTAL EBITDA 669 630 434 6 45
Finance Cost, Net
The finance cost, net was -$2,509 million (-US $133 million) in 2016, 35% more than the previous year. The net financing expenses that
make up this item grew from -$931 million (-US $59 million) in 2015 to -$1,133 million (-US $61 million) in 2016, largely reflecting the
depreciation of the Mexican peso and the effect thereof on financial expenses related to dollar-denominated debt. The change in foreign
exchange rate also resulted in the recognition of a non-cash foreign exchange loss of -$1,380 million (-US $72 million) in 2016, compared
to a foreign exchange loss of -$1,114 million (-US $68 million) in 2015.
Finance cost, net(millions of pesos)
2016 2015 2014VAR. % 2016
vs 2015VAR. % 2015
vs 2014
Finance cost (1,414) (1,176) (926) (20) (27)
Finance income 281 245 135 15 82
Finance Cost, Net (1,133) (931) (791) (22) (18)
Foreign exchange gain (loss) (1,380) (1,114) (629) (24) (77)
Valuation of financial derivative instruments 4 183 (77) (98) 339
FINANCE COST, NET (2,509) (1,862) (1,497) (35) (24)
2 0 1 6 A N N U A L R E P O R T + A L P E K
53

Taxes
2016 income tax was $2,358 million (US $126 million), 16% above the $2,040 million (US $130 million) of 2015 as a result of the 29% rise in
income before taxes.
Taxes- (millions of pesos)
2016 2015 2014VAR. % 2016
vs 2015VAR. % 2015
vs 2014
Income taxes
Income before taxes 7,351 5,705 2,197 29 160
Statutory tax rate 30% 30% 30%
Income tax at the statutory rate (2,205) (1,711) (659) (29) (160)
Taxes for permanent differences between accounting-taxable profit
(153) (329) (224) 54 (47)
Total income tax (2,358) (2,040) (883) (16) (131)
Effective tax rate 32% 36% 40%
Made up as follows:
Current income tax (2,470) (2,252) (975) (10) (131)
Adjustment to the provision of income tax from prior years
(33) 9 (6) (473) 237
Deferred tax 145 203 98 29 (108)
Total income tax (2,358) (2,040) (883) (16) (131)
2 0 1 6 A N N U A L R E P O R T + A L P E K
54
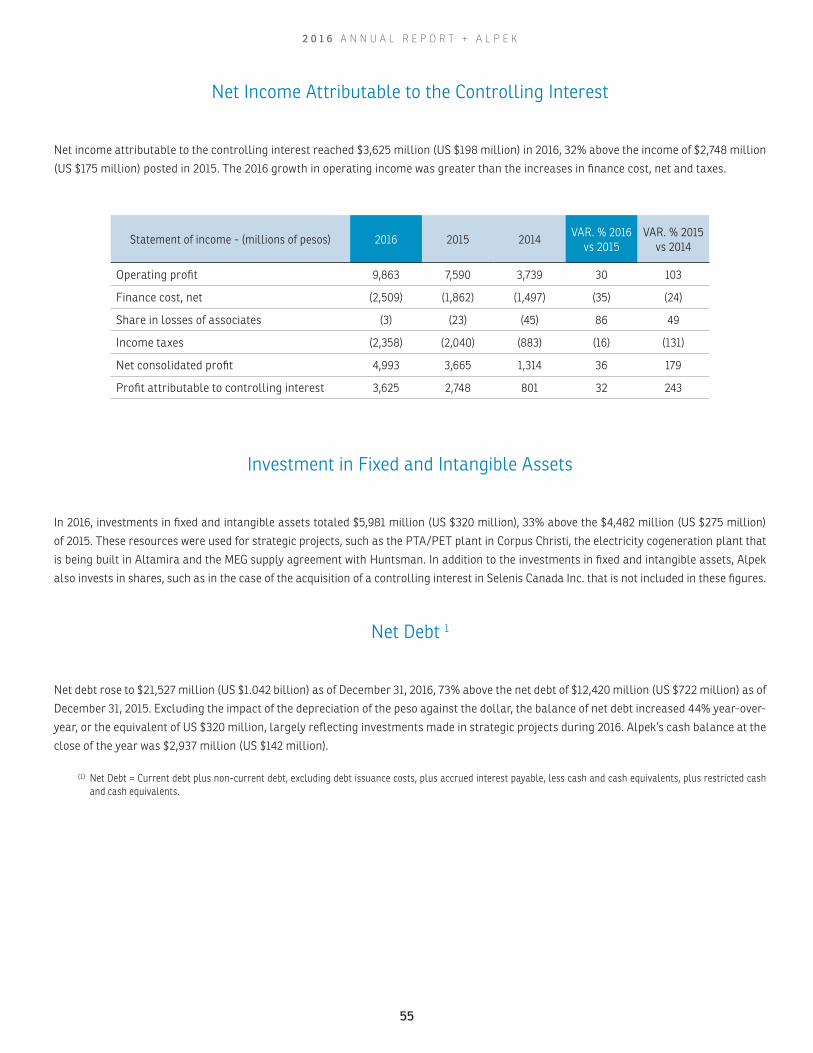
Net Income Attributable to the Controlling Interest
Net income attributable to the controlling interest reached $3,625 million (US $198 million) in 2016, 32% above the income of $2,748 million
(US $175 million) posted in 2015. The 2016 growth in operating income was greater than the increases in finance cost, net and taxes.
Statement of income - (millions of pesos) 2016 2015 2014VAR. % 2016
vs 2015VAR. % 2015
vs 2014
Operating profit 9,863 7,590 3,739 30 103
Finance cost, net (2,509) (1,862) (1,497) (35) (24)
Share in losses of associates (3) (23) (45) 86 49
Income taxes (2,358) (2,040) (883) (16) (131)
Net consolidated profit 4,993 3,665 1,314 36 179
Profit attributable to controlling interest 3,625 2,748 801 32 243
Investment in Fixed and Intangible Assets
In 2016, investments in fixed and intangible assets totaled $5,981 million (US $320 million), 33% above the $4,482 million (US $275 million)
of 2015. These resources were used for strategic projects, such as the PTA/PET plant in Corpus Christi, the electricity cogeneration plant that
is being built in Altamira and the MEG supply agreement with Huntsman. In addition to the investments in fixed and intangible assets, Alpek
also invests in shares, such as in the case of the acquisition of a controlling interest in Selenis Canada Inc. that is not included in these figures.
Net Debt 1
Net debt rose to $21,527 million (US $1.042 billion) as of December 31, 2016, 73% above the net debt of $12,420 million (US $722 million) as of
December 31, 2015. Excluding the impact of the depreciation of the peso against the dollar, the balance of net debt increased 44% year-over-
year, or the equivalent of US $320 million, largely reflecting investments made in strategic projects during 2016. Alpek’s cash balance at the
close of the year was $2,937 million (US $142 million).
(1) Net Debt = Current debt plus non-current debt, excluding debt issuance costs, plus accrued interest payable, less cash and cash equivalents, plus restricted cash and cash equivalents.
2 0 1 6 A N N U A L R E P O R T + A L P E K
55

Millions of dollars % integrated
Short- and long-term debt 2016 2015 Var. 2016 2015
Short-term debt 135 39 242 11 4
Long-term: 1 year 72 21 237 6 2
2 years 27 71 (62) 2 6
3 years 1 27 (97) 0 2
4 years 0 1 (72) 0 0
5 years or more 950 949 0 80 86
Total 1,184 1,108 7 100 100
Avg. maturity long-term debt (years) 5.3 6.3
Avg. maturity total debt (years) 5.2 6.1
Financial Indicators - (Times) 2016 2015 2014
Net debt / EBITDA (US$) 1.6 1.1 1.6
Interest coverage (US$) 10.5 10.7 6.5
Total liabilities / Stockholders’ equity 1.2 1.2 1.2
2 0 1 6 A N N U A L R E P O R T + A L P E K
56
2016 HIGHLIGHTS
Acquisition of an EPS plant in Concón, ChileOn April 1, 2016, Alpek took control of a 20,000 ton per year EPS plant in Concón, Chile, acquired from BASF Chile, S.A. This facility increases
the Company’s EPS installed capacity in South America by more than 30% and complements the operations acquired in 2016.
Startup of MEG supply agreement with HuntsmanDuring the year, Alpek began supplying monoethylene glycol (MEG) in accordance with the US $65 million multi-annual agreement with
Huntsman for rights over approximately 150,000 tons of MEG per year from its plant in Port Neches, TX. The capacity expansion associated
with this agreement began operating in June 2016.
Acquisition of Selenis Canada Inc.In 3Q16, Alpek acquired a controlling interest in Selenis Canada Inc., Canada’s only PET producer, which operates a plant in Quebec, Montreal,
with an annual capacity of 144,000 tons. In addition to expanding Alpek’s operations in North America, this transaction results in synergies
from PTA integration and provides the opportunity to complement the Company’s portfolio with differentiated PET products.
Completion of the investment in Corpus Christi integrated PTA/PET plantIn 2016, Alpek completed the investment to acquire the rights to 500,000 tons of integrated PET per year from the plant that M&G is building
in Corpus Christi, TX. The aggregate amount of the contractual supply rights comprises agreements signed in 2013 and 2015 for 400,000
and 100,000 tons per year, respectively. The new facility is expected to begin operating in 2017, starting with PET production and then PTA.
Agreement signed with PetrobrasOn December 28, Alpek announced the signing of an agreement with Petróleo Brasileiro, S.A. (Petrobras) to acquire its 100% stakes in Com-
panhia Petroquímica de Pernambuco (Petroquímica Suape) and in Companhia Integrada Têxtil de Pernambuco (Citepe). These two compa-
nies operate South America’s only integrated polyester site, with an annual capacity of 700 thousand tons of PTA, 450 thousand tons of PET
and 90 thousand tons of texturized polyester filament. The price agreed upon for Petrobras’ 100% interest in Petroquímica Suape and Citepe
is US $385 million. The transaction is subject to additional corporate approval and several conditions precedent, including the approval of
the corresponding government entities.
DividendsThe Ordinary Shareholders’ Meeting approved the payment of a cash dividend of approximately US $110, which was paid as of March 4, 2016.
2 0 1 6 A N N U A L R E P O R T + A L P E K
57
To the Shareholders and Directors of
Alpek, S. A. B. de C. V. and subsidiaries
Monterrey, N.L., February 17, 2017
REPORT OF THE INDEPENDENT
AUDITORS
Opinion
We have audited the consolidated financial statements of Alpek,
S. A. B. de C. V. and subsidiaries (The “Company”), which comprise
the consolidated statement of financial position as of December 31,
2016 and 2015, and the related consolidated statements of income,
of comprehensive income, of changes in stockholders’ equity and
of cash flows for the years then ended and the notes to the consol-
idated financial statements, which include a summary of significant
accounting policies.
In our opinion, the accompanying consolidated financial statements
present fairly, in all material respects, the consolidated financial
position of the Company as at December 31, 2016 and 2015, and its
financial performance and its consolidated cash flows for the years
then ended in accordance with International Financial Reporting
Standards as issued by the International Accounting Standards
Board (“IFRS”).
Basis for Opinion
We conducted our audit in accordance with International Standards
on Auditing (ISAs). Our responsibilities under those standards are
further described in the Auditor’s Responsibilities for the Audit of
the Consolidated Financial Statements section of our report. We are
independent of the Company in accordance with the Ethics Stan-
dards of Mexican Institute of Public Accountants, A. C. together with
other requirements applicable to our audits of consolidated finan-
cial statements in Mexico, and we have fulfilled our other ethical re-
sponsibilities in accordance with those requirements and standards.
We believe that the audit evidence we have obtained is sufficient and
appropriate to provide a basis for our opinion.
Key Audit Matters
Key audit matters are those matters that, in our professional judg-
ment, were of most significance in our audit of the consolidated
financial statements of the current period. These matters were
addressed in the context of our audit of the consolidated financial
statements as a whole, and in forming our opinion thereon, and we
do not provide a separate opinion on these matters.
2 0 1 6 A N N U A L R E P O R T + A L P E K
58

Key audit matter
Agreements for the production of PTA-PET materials and Technology IntegRex® license with M&G Resins USA, LLC.
As mentioned in Note 2 to the consolidated financial statements,
during 2015, the Company entered into agreements with M&G Res-
ins USA, LLC (M&G), through which the latter agrees to supply 500
thousand tons of PET (manufactured with 420 thousand tons of PTA)
during the five years following the two plants’ (PTA/PET) startup
of operations, which is expected to occur in 2018. PTA is one of the
main materials for the production of PET manufactured by the Com-
pany. As a result of this agreement, the Company paid M&G $8,989
million (US$435 million), of which $7,439 million (US$360 million)
was recognized as intangible assets, amortizable on the basis of the
production volumes and $1,550 million (US$75 million) was recog-
nized as prepayment for the purchase of inventories. The calcula-
tions required to determine the classification of these payments, of
the fair values and the assumptions used are complex, as a result
of which, the Company hired the services of an independent expert.
We focused on this area due to the importance of the amount of the
payments made and due to the fact that classification of the payments,
either in intangible assets or prepayments, based on their fair value,
required the application of significant judgments by Management.
In particular, we concentrated our efforts on the significant judg-
ments related to the following aspects: methodologies used, inter-
est rate range, estimated volumes of production and costs.
How our audit addressed the key audit matter
As part of our audit, we obtained and read the contractual agree-
ments pertaining to the transaction.
Due to the significant judgments used in the valuation models for
the determination of fair values, and with the support of our valu-
ation experts, we questioned the premises, assumptions and crite-
ria used by Management and the independent expert, following the
procedures set down below, among others:
• We evaluated and considered the design and operating effec-
tiveness of the internal controls over identification, classifi-
cation and valuation of these transactions. In particular, we
considered the key controls related to interest rates, produc-
tion volumes and costs.
• We verified the capability and objectivity of the independent
expert.
• We compared that the methodologies applied to the deter-
mination of the fair values of these payments correspond to
methodologies and recognized to value assets of similar char-
acteristics in the industry.
• We challenged the significant judgments related to the most
relevant assumptions, premises or variables, and we com-
pared the ranges of interest rates, estimated production vol-
umes and costs with independent market sources commonly
used and accepted for assets with these characteristics for the
industry to which the company pertains.
• We reprocessed a sample of items to determine their fair val-
ue and classification, whether in intangible assets or short or
long-term prepayments.
• We defied Management’s financial projections, including the
residual value, comparing it to the performance and historical
trends of the businesses, obtaining Management’s explana-
tions, if any, of the variations, as well as the supporting evi-
dence.
• We discussed with Management, the sensitivity calculations, as-
sessing the degree to which the assumptions would need to be
modified for an adjustment to be considered for its evaluation.
2 0 1 6 A N N U A L R E P O R T + A L P E K
59
Other Information
Management is responsible for the other information presented. The other information comprises the Annual Report presented to Comisión
Nacional Bancaria y de Valores (“CNBV”) and the Annual Information presented to shareholders (but does not include the financial state-
ments and our auditor’s report thereon), which is expected to be made available to us after the date of this auditor’s report.
Our opinion on the consolidated financial statements does not cover the other information and we will not express any form of assurance
conclusion thereon.
However, in connection with our audit of the financial statements of the Company, our responsibility is to read the other information identified
above when it becomes available and, in doing so, consider whether the other information is materially inconsistent with the consolidated
financial statements or our knowledge obtained in the audit, or otherwise appears to be materially misstated.
When we read the other information not yet received, we will issue the report required by the CNBV and if we conclude that there is a material
misstatement therein, we are required to communicate the matter to those charged with governance and, if required, describe the issue in
our report.
Responsibilities of Management and Those Charged with Governance for the Consolidated Financial Statements
Management is responsible for the preparation and fair presentation of the consolidated financial statements in accordance with Internation-
al Financial Reporting Standards as issued by the International Accounting Standards Board and for such internal control as Management
determines is necessary to enable the preparation of consolidated financial statements that are free from material misstatement, whether
due to fraud or error.
In preparing the consolidated financial statements, Management is responsible for assessing the Group’s ability to continue as a going con-
cern, disclosing, as applicable, matters related to going concern and using the going concern basis of accounting unless Management either
intends to liquidate the Group or to cease operations, or has no realistic alternative but to do so.
Those charged with governance are responsible for overseeing the Company’s financial reporting process.
Auditors’ Responsibilities for the Audit of the Consolidated Financial Statements
Our objectives are to obtain reasonable assurance about whether the consolidated financial statements as a whole are free from material
misstatement, whether due to fraud or error, and to issue an auditor’s report that includes our opinion. Reasonable assurance is a high level
of assurance, but is not a guarantee that an audit conducted in accordance with ISAs will always detect a material misstatement when it
exists. Misstatements can arise from fraud or error and are considered material if, individually or in the aggregate, they could reasonably be
expected to influence the economic decisions of users taken on the basis of these consolidated financial statements.
As part of an audit in accordance with ISAs, we exercise professional judgment and maintain professional skepticism throughout the audit.
We also:
• Identify and assess the risks of material misstatement of the consolidated financial statements, whether due to fraud or error, design
and perform audit procedures responsive to those risks, and obtain audit evidence that is sufficient and appropriate to provide a basis
for our opinion. The risk of not detecting a material misstatement resulting from fraud is higher than for one resulting from error, as
fraud may involve collusion, forgery, intentional omissions, misrepresentations, or the override of internal control.
2 0 1 6 A N N U A L R E P O R T + A L P E K
60

• Obtain an understanding of internal control relevant to the audit in order to design audit procedures that are appropriate in the circum-
stances, but not for the purpose of expressing an opinion on the effectiveness of the Company’s internal control.
• Evaluate the appropriateness of accounting policies used and the reasonableness of accounting estimates and related disclosures
made by Management.
• Conclude on the appropriateness of Management’s use of the going concern basis of accounting and, based on the audit evidence ob-
tained, whether a material uncertainty exists related to events or conditions that may cast significant doubt on the Company’s ability
to continue as a going concern. If we conclude that a material uncertainty exists, we are required to draw attention in our auditor’s
report to the related disclosures in the consolidated financial statements or, if such disclosures are inadequate, to modify our opinion.
Our conclusions are based on the audit evidence obtained up to the date of our auditor’s report. However, future events or conditions
may cause the Company to cease to continue as a going concern.
• Evaluate the overall presentation, structure and content of the consolidated financial statements, including the disclosures, and wheth-
er the consolidated financial statements represent the underlying transactions and events in a manner that achieves fair presentation.
• Obtain sufficient appropriate audit evidence regarding the financial information of the entities or business activities within the Company
and subsidiaries to express an opinion on the consolidated financial statements. We are responsible for the direction, supervision and
performance of the Company and subsidiaries audit. We remain solely responsible for our audit opinion.
We communicate with those charged with governance regarding, among other matters, the planned scope and timing of the audit and signif-
icant audit findings, including any significant deficiencies in internal control that we identify during our audit.
We also provide those charged with governance with a statement that we have complied with relevant ethical requirements regarding inde-
pendence, and to communicate with them all relationships and other matters that may reasonably be thought to bear on our independence,
and where applicable, related safeguards.
From the matters communicated with those charged with governance, we determine those matters that were of most significance in the audit
of the consolidated financial statements of the current period and are therefore the key audit matters. We describe these matters in our au-
ditor’s report unless law or regulation precludes public disclosure about the matter or when, in extremely rare circumstances, we determine
that a matter should not be communicated in our report because the adverse consequences of doing so would reasonably be expected to
outweigh the public interest benefits of such communication.
The engagement partner on the audit resulting in this independent auditor’s report is Héctor Rábago Saldívar.
PricewaterhouseCoopers, S. C.
Héctor Rábago Saldívar
Audit Partner
2 0 1 6 A N N U A L R E P O R T + A L P E K
61
At December 31,
Note 2016 2015AssetCURRENT ASSET:Cash and cash equivalents 6 Ps 2,935 Ps 6,650Restricted cash and cash equivalents 6 2 3Trade and other receivables, net 7 15,918 13,384Inventories 9 14,853 12,086Derivative financial instruments 16 56 203Prepayments 10 457 338
Total current asset 34,221 32,664
NON-CURRENT ASSET:Property, plant and equipment, net 11 40,699 31,322Goodwill and intangible assets, net 12 11,875 8,812Deferred income taxes 21 433 361Prepayments 10 1,570 1,228Other assets 13 2,702 507
Total non-current asset 57,279 42,230
Total asset Ps 91,500 Ps 74,894
Liability and Stockholders’ equity
CURRENT LIABILITY:Debt 19 Ps 2,787 Ps 678Suppliers and other accounts payable 17 15,492 11,693Derivative financial instruments 16 71 848Income tax payable 22 694 1,371Provisions 18 363 338
Total current liability 19,407 14,928
NON-CURRENT LIABILITY:Debt 19 21,551 18,276Derivative financial instruments 16 646 711Provisions 18 7 185Deferred income taxes 21 5,883 4,707Income tax payable 22 553 28Employee benefits 20 1,227 1,108Other liabilities 23 504 452
Total non-current liability 30,371 25,467
Total liability 49,778 40,395
STOCKHOLDERS’ EQUITYControlling interest:Capital stock 24 6,048 6,052Share premium 9,071 9,071Retained earnings 24 11,292 10,009Other reserves 24 10,662 4,822
Total controlling interest 37,073 29,954
Non-controlling interest 14 4,649 4,545
Total stockholders’ equity 41,722 34,499
Total liability and stockholders’ equity Ps 91,500 Ps 74,894The accompanying notes are an integral part of these consolidated financial statements.
José de Jesús Valdez Simancas Eduardo Alberto Escalante Castillo Chief Executive Officer Chief Financial Officer
Alpek, S. A. B. de C. V. and subsidiaries CONSOLIDATED STATEMENTS OF FINANCIAL POSITIONAt December 31, 2016 and 2015In millions of Mexican pesos
2 0 1 6 A N N U A L R E P O R T + A L P E K
62

Note 2016 2015
Revenue 3 u) Ps 90,192 Ps 83,590Cost of sales 26 ( 76,943 ) ( 73,029 )
Gross profit 13,249 10,561
Selling expenses 26 ( 1,578 ) ( 1,377 )Administrative expenses 26 ( 2,043 ) ( 1,839 )Other income, net 27 235 245
Operating profit 9,863 7,590
Finance income 28 3,565 2,795Finance cost 28 (6,074 ) ( 4,657 )
Finance cost, net ( 2,509 ) ( 1,862 )
Share of losses of associates accounted for by the equity method ( 3 ) ( 23 )
Profit before income taxes 7,351 5,705
Income taxes 30 ( 2,358 ) ( 2,040 )
Net consolidated profit Ps 4,993 Ps 3,665
Profit attributable to:Controlling interest Ps 3,625 Ps 2,748Non-controlling interest 1,368 917
Ps 4,993 Ps 3,665
Basic and diluted earnings per share in pesos Ps 1.71 Ps 1.30
Weighted average of outstanding shares (in millions of shares) 2,117 2,118
The accompanying notes are an integral part of these consolidated financial statements.
José de Jesús Valdez Simancas Eduardo Alberto Escalante Castillo Chief Executive Officer Chief Financial Officer
CONSOLIDATED STATEMENTS OF INCOMEFor the years ended December 31, 2016 and 2015In millions of Mexican pesos
Alpek, S. A. B. de C. V. and subsidiaries
2 0 1 6 A N N U A L R E P O R T + A L P E K
63

Note 2016 2015
Net consolidated profit Ps 4,993 Ps 3,665
Other items of comprehensive income of the year:
Items that will not be reclassified to the statement of income:
Remeasurement of obligations for employee benefits, net of taxes 20, 30 64 ( 3 )
Items that will be reclassified to the statement of income:
Effect of derivative financial instruments designatedas cash flow hedges, net of taxes 16, 30 384 ( 400 )
Translation effect of foreign entities 24, 30 6,233 3,843
Share of other comprehensive results of associates ( 2 ) -
Total other comprehensive income for the year 6,679 3,440
Total comprehensive income for the year Ps 11,672 Ps 7,105
Attributable to:Controlling interest Ps 9,527 Ps 5,628Non-controlling interest 2,145 1,477
Total comprehensive income for the year Ps 11,672 Ps 7,105
The accompanying notes are an integral part of these consolidated financial statements.
José de Jesús Valdez Simancas Eduardo Alberto Escalante Castillo Chief Executive Officer Chief Financial Officer
CONSOLIDATED STATEMENTS OF COMPREHENSIVE INCOME For the years ended December 31, 2016 and 2015In millions of Mexican pesos
Alpek, S. A. B. de C. V. and subsidiaries
2 0 1 6 A N N U A L R E P O R T + A L P E K
64
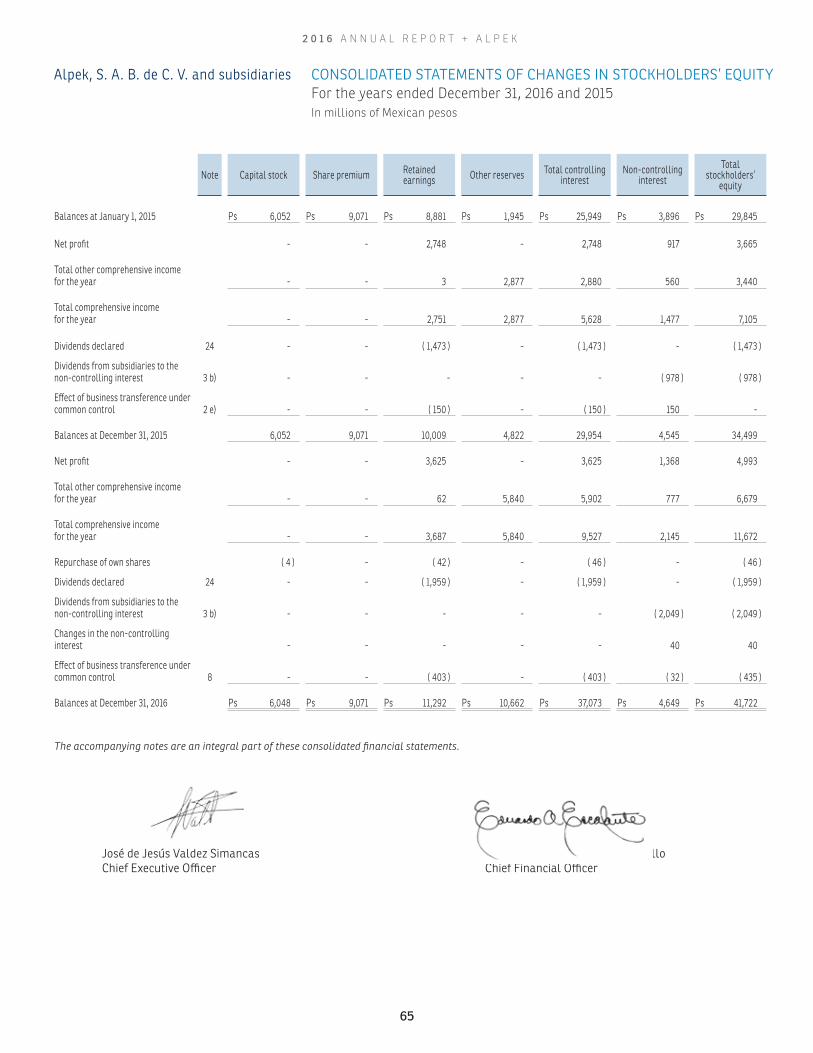
Note Capital stock Share premium Retained earnings Other reserves Total controlling
interestNon-controlling
interestTotal
stockholders’ equity
Balances at January 1, 2015 Ps 6,052 Ps 9,071 Ps 8,881 Ps 1,945 Ps 25,949 Ps 3,896 Ps 29,845
Net profit - - 2,748 - 2,748 917 3,665
Total other comprehensive income for the year - - 3 2,877 2,880 560 3,440
Total comprehensive income for the year - - 2,751 2,877 5,628 1,477 7,105
Dividends declared 24 - - ( 1,473 ) - ( 1,473 ) - ( 1,473 )
Dividends from subsidiaries to the non-controlling interest 3 b) - - - - - ( 978 ) ( 978 )
Effect of business transference under common control 2 e) - - ( 150 ) - ( 150 ) 150 -
Balances at December 31, 2015 6,052 9,071 10,009 4,822 29,954 4,545 34,499
Net profit - - 3,625 - 3,625 1,368 4,993
Total other comprehensive income for the year - - 62 5,840 5,902 777 6,679
Total comprehensive income for the year - - 3,687 5,840 9,527 2,145 11,672
Repurchase of own shares ( 4 ) - ( 42 ) - ( 46 ) - ( 46 )
Dividends declared 24 - - ( 1,959 ) - ( 1,959 ) - ( 1,959 )
Dividends from subsidiaries to thenon-controlling interest 3 b) - - - - - ( 2,049 ) ( 2,049 )
Changes in the non-controlling interest - - - - - 40 40
Effect of business transference under common control 8 - - ( 403 ) - ( 403 ) ( 32 ) ( 435 )
Balances at December 31, 2016 Ps 6,048 Ps 9,071 Ps 11,292 Ps 10,662 Ps 37,073 Ps 4,649 Ps 41,722
The accompanying notes are an integral part of these consolidated financial statements.
José de Jesús Valdez Simancas Eduardo Alberto Escalante Castillo Chief Executive Officer Chief Financial Officer
CONSOLIDATED STATEMENTS OF CHANGES IN STOCKHOLDERS’ EQUITYFor the years ended December 31, 2016 and 2015In millions of Mexican pesos
Alpek, S. A. B. de C. V. and subsidiaries
2 0 1 6 A N N U A L R E P O R T + A L P E K
65
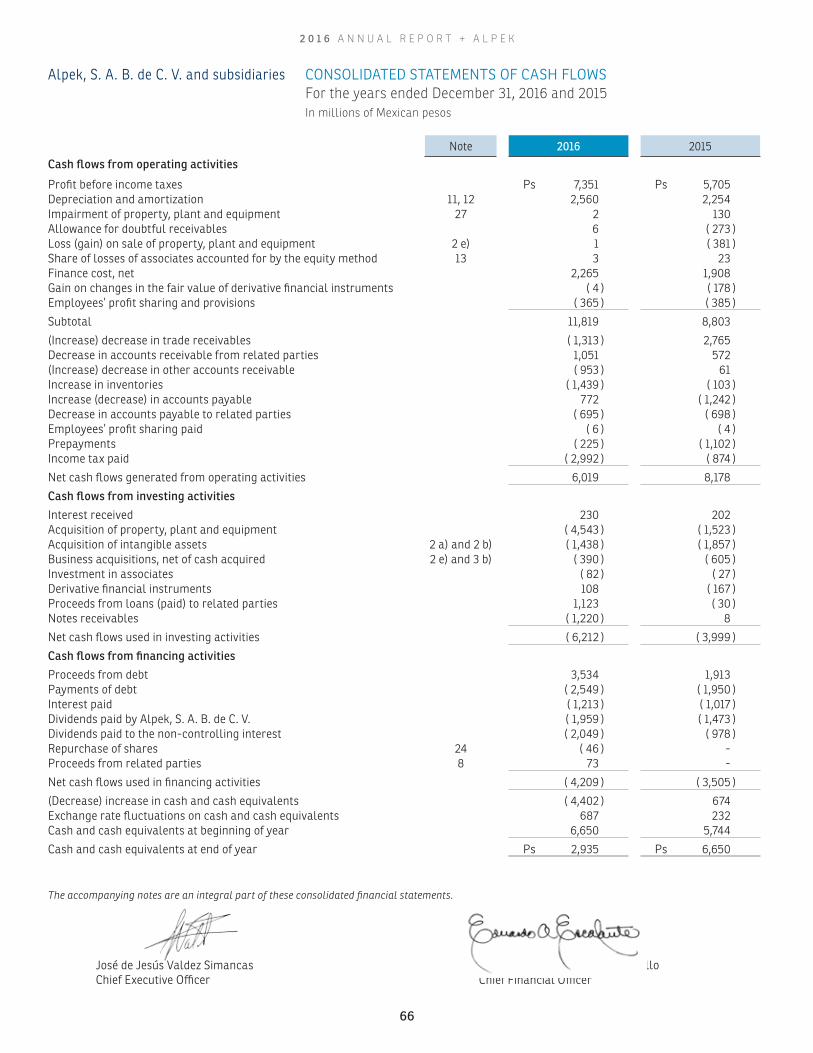
Note 2016 2015Cash flows from operating activities
Profit before income taxes Ps 7,351 Ps 5,705Depreciation and amortization 11, 12 2,560 2,254Impairment of property, plant and equipment 27 2 130Allowance for doubtful receivables 6 ( 273 )Loss (gain) on sale of property, plant and equipment 2 e) 1 ( 381 )Share of losses of associates accounted for by the equity method 13 3 23Finance cost, net 2,265 1,908Gain on changes in the fair value of derivative financial instruments ( 4 ) ( 178 )Employees’ profit sharing and provisions ( 365 ) ( 385 )
Subtotal 11,819 8,803
(Increase) decrease in trade receivables ( 1,313 ) 2,765Decrease in accounts receivable from related parties 1,051 572(Increase) decrease in other accounts receivable ( 953 ) 61Increase in inventories ( 1,439 ) ( 103 )Increase (decrease) in accounts payable 772 ( 1,242 )Decrease in accounts payable to related parties ( 695 ) ( 698 )Employees’ profit sharing paid ( 6 ) ( 4 )Prepayments ( 225 ) ( 1,102 )Income tax paid ( 2,992 ) ( 874 )
Net cash flows generated from operating activities 6,019 8,178
Cash flows from investing activities
Interest received 230 202Acquisition of property, plant and equipment ( 4,543 ) ( 1,523 )Acquisition of intangible assets 2 a) and 2 b) ( 1,438 ) ( 1,857 )Business acquisitions, net of cash acquired 2 e) and 3 b) ( 390 ) ( 605 )Investment in associates ( 82 ) ( 27 )Derivative financial instruments 108 ( 167 )Proceeds from loans (paid) to related parties 1,123 ( 30 )Notes receivables ( 1,220 ) 8
Net cash flows used in investing activities ( 6,212 ) ( 3,999 )
Cash flows from financing activities
Proceeds from debt 3,534 1,913Payments of debt ( 2,549 ) ( 1,950 )Interest paid ( 1,213 ) ( 1,017 )Dividends paid by Alpek, S. A. B. de C. V. ( 1,959 ) ( 1,473 )Dividends paid to the non-controlling interest ( 2,049 ) ( 978 )Repurchase of shares 24 ( 46 ) -Proceeds from related parties 8 73 -
Net cash flows used in financing activities ( 4,209 ) ( 3,505 )
(Decrease) increase in cash and cash equivalents ( 4,402 ) 674Exchange rate fluctuations on cash and cash equivalents 687 232Cash and cash equivalents at beginning of year 6,650 5,744
Cash and cash equivalents at end of year Ps 2,935 Ps 6,650
The accompanying notes are an integral part of these consolidated financial statements.
José de Jesús Valdez Simancas Eduardo Alberto Escalante Castillo Chief Executive Officer Chief Financial Officer
CONSOLIDATED STATEMENTS OF CASH FLOWS For the years ended December 31, 2016 and 2015In millions of Mexican pesos
Alpek, S. A. B. de C. V. and subsidiaries
2 0 1 6 A N N U A L R E P O R T + A L P E K
66

NOTE 1 – General information
Alpek, S. A. B. de C. V. and subsidiaries (“Alpek” or the “Company”) operates through two major business segments: polyester chain products
and plastic products. The polyester chain business segment, comprises the production of purified terephthalic acid (PTA), polyethylene tere-
phthalate (PET) and polyester fibers, which serves the food and beverage packaging, textile and industrial filament markets. The Plastics &
Chemicals business segment, comprises the production of polypropylene (PP), expandable polystyrene (EPS), caprolactam (CPL), fertilizers
and other chemicals, which serves a wide range of markets, including the consumer goods, food and beverage packaging, automotive, con-
struction, agriculture, oil industry, pharmaceutical markets and others.
Alpek is the most important petrochemical company in Mexico and the second largest in Latin America, is the main integrated producer of
polyester in North America. Besides, it operates the largest EPS plant in the continent, and one of the largest PP plants in North America
and is the only producer of Caprolactam in Mexico.
The shares of Alpek, S. A. B. de C. V. are traded on the Mexican Stock Exchange and has Alfa, S. A. B. de C. V. (“Alfa”) as its main holding
company.
Alpek, S. A. B. de C. V. is located in Avenida Gómez Morín Sur No. 1111, Col. Carrizalejo, San Pedro Garza García, Nuevo León, Mexico and
operates plants located in Mexico, the United States of America, Canada, Argentina, Chile and Brazil.
In the following notes to the financial statements when referring to pesos or “Ps”, it means millions of Mexican pesos. When referring to
dollars or “US$”, it means millions of dollars from the United States of America. When referring to euros or “€” it means millions of euros.
NOTE 2 – Significant events
2016
a) IntegRex® technology license and signature of a supply agreement with M&G
During 2015, Alpek through its subsidiary Grupo Petrotemex, S. A. de C. V. (“Grupo Petrotemex”), held a licensing agreement for IntegRex®
PTA technology and another PTA-PET supply agreement with M&G Resins USA, LLC (“M&G”). These agreements will allow M&G to use
the IntegRex® PTA technology in the PTA-PET integrated plant to be constructed in Corpus Christi, Texas in the United States of America
(the Plant).
On the other hand, Grupo Petrotemex will pay US$435 to M&G during the construction of the Plant according to an established calendar
and in compliance with certain milestones, by which Grupo Petrotemex will obtain supply rights of the Plant for 500 thousand tons of
PET (manufactured with 420 thousand tons of PTA) per year for a period of five years starting from the first day of the month in which
the plant is completed and ready to manufacture and sale their products. In accordance to the supply agreement, Grupo Petrotemex
will supply raw materials for the manufacturing of its PTA-PET volume. It is estimated that the M&G plant in Corpus Christi will start
operations in 2018.
NOTES TO THE CONSOLIDATED FINANCIAL STATEMENTSAt December 31, 2016 and 2015In millions of Mexican pesos, except where otherwise indicated
Alpek, S. A. B. de C. V. and subsidiaries
2 0 1 6 A N N U A L R E P O R T + A L P E K
67
At December 31, 2016, Grupo Petrotemex has completed the payments amounting to Ps 8,989 (US$435), of which Ps 7,439 (US$360) are
recorded in the intangible assets caption and correspond to the before mentioned supply rights and will be amortized once the PET
supply begins, and Ps 1,550 (US$75) as a prepayment of inventory within the prepayments caption.
b) Monoethylene Glycol (MEG) manufacturing agreement
On December 15, 2014, the Company through its subsidiary DAK Americas LLC (“DAK”) entered into a Toll Manufacturing Agreement with
Huntsman Petrochemical LLC (“Huntsman”) in which will obtain the supply rights of Monoethylene Glycol (MEG), which is used in the
production of PET polyester, at a preferred toll rate. Huntsman will develop, own and operate the equipment for the production of MEG
in its Port Neches, Texas plant and DAK will supply the raw materials for the production. The installation of equipment and beginning
of production took place during June 2016.
On the other hand, DAK paid US$65 to Huntsman during the installation of the equipment according to an established calendar and in
compliance with certain milestones; therefore, DAK obtained the supply rights up to 28.8 million of pounds of product per year for a 15
years period commencing on the first day of the month in which the equipment was installed and the production began. At December
31, 2016, payments are recorded under the intangible assets caption and are amortized within the cost of sales on a straight line basis
during the life of the contract since the month of June 2016, once the supply of MEG began.
c) Cogeneration plant construction project
During the last quarter of 2016, Alpek started the construction of a steam and electric cogeneration project through its subsidiary Grupo
Petromex, in which it is estimated that an investment will be made in an amount approximating US$350. This cogeneration plant will
generate approximately 350 megawatts of electricity, as well as all the steam necessary to meet the requirements of its PTA plant
located in Altamira, Tamaulipas, Mexico. The cogeneration plant will also supply energy to other ALFA entities outside of Altamira.
At December 31, 2016, the Cogeneration plant is in the construction stage, and payments have been made amounting to Ps 2,449
(US$126) as part of the startup of the construction of the plant. Payments will be made in accordance with the percentage of completion
and it is estimated that its construction will be completed in 2018.
d) Stock purchase contract of Petroquimica SUAPE and CITEPE
On December 28, 2016, Alpek, through its subsidiary Grupo Petrotemex, signed a stock purchase contract with Petróleo Brasileiro, S. A.
(“Petrobras”) to acquire its equity in Companhia Petroquimica de Pernambuco (“Petroquimica Suape”) and Companhia Integrada Textil
de Pernambuco (“Citepe”).
Petroquimica Suape and Citepe operate an integrated PTA-PET site in Ipojuca, Pernambuco, Brazil, with a capacity of 700,000 and
450,000 tons of PTA and PET per year, respectively. Citepe also operates a textured polyester filament plant with a capacity of 90,000
tons per year.
The price agreed upon for the 100% equity of Petrobras in Petroquimica Suape and Citepe amounts to US$385. This amount will be paid
in Brazilian reals at the date on which the transaction is closed, and it is subject to working capital and debt adjustments, among other
things.
Additional corporate approvals are required to close this transaction, in addition to the approval of government authorities with
competent jurisdiction. That contract sets forth a maximum fifteen month period to complete the transaction as of the date of the
contract. At the issue date of these financial statements, the approvals and conditions are in the process of being complied with.
2 0 1 6 A N N U A L R E P O R T + A L P E K
68
2015
e) Agreements between Alpek and BASF for the expanded polystyrene (EPS) and polyurethane (PU) businesses
During July 2014, Alpek (“Alpek”) and BASF (“BASF”) signed the agreements related to the expanded polystyrene (EPS) and polyurethane
(PU) businesses previously held through their joint venture Polioles, S.A de C.V. (“Polioles”) in Mexico, as well as the EPS business of
BASF in North and South America, except for the Neopor ® (gray EPS) of BASF business.
Alpek acquired all EPS business activities from Polioles, including an EPS plant in Altamira, Mexico. Likewise, BASF acquired all PU
business activities from Polioles, including certain assets located in Lerma, Mexico’s facility, as well as all marketing and sales rights
for the PU, isocyanate and polyol systems. Once the transaction was completed, Polioles continued operating as a joint venture between
Alpek and BASF, with a product portfolio comprising of industrial chemicals and specialties.
Alpek also acquired the EPS business of BASF in North and South America, including:
• EPS sales and distribution channels of BASF in North and South America
• The EPS plants of BASF in Guaratinguetá, Brazil and General Lagos, Argentina, and
• The EPS transformation business of BASF in Chile (Aislapol, S. A.)
The combined capacity of all EPS production units acquired by Alpek is approximately 230,000 tons a year. This figure includes 165,000
tons a year of Polioles plant in Altamira, Mexico. Approximately, 440 employees work in the businesses subject to the agreements, 380
of them in the EPS businesses and 60 in the PU businesses. Most of them continue performing their roles under the new ownership
framework.
A series of transactions can be carried out with the purpose of forming a business combination in the most effective manner from the
economic point of view. According to IFRS, an agreement to acquire a business through a series of related transactions is a business
combination, and the way to recognize it should be as if it was a single transaction. Therefore, the events previously mentioned were
considered as transactions that are related and were carried out in a combined way one only agreement with reference to the fair value
according to each business.
Transactions included in this agreement were as follows:
PU business sale to BASF
In March 2015, through its subsidiary Polioles, Alpek completed the sale to BASF MEXICANA of all the polyurethane (PU) business
activities, including assets selected in the Lerma, Mexico plant, as well as all marketing and sales rights of PU, isocyanate and polyol
systems. From Alpek’s standpoint, the PU business sold was not considered as a business line or segment; therefore, IFRS 5 “Non-
current Assets Held for Sale and Discontinued Operations” dispositions respect to the presentation as a discontinued operation, are not
applicable. Rather, the transaction was carried out through the sale of a group of assets at market terms, and the total consideration
received was Ps 407, which it was outstanding at December 31, 2015 and the net book value transferred was Ps 26, this transaction
resulted in a gain of Ps 381 and was recorded in the consolidated income statement as other income (expense), net.
2 0 1 6 A N N U A L R E P O R T + A L P E K
69
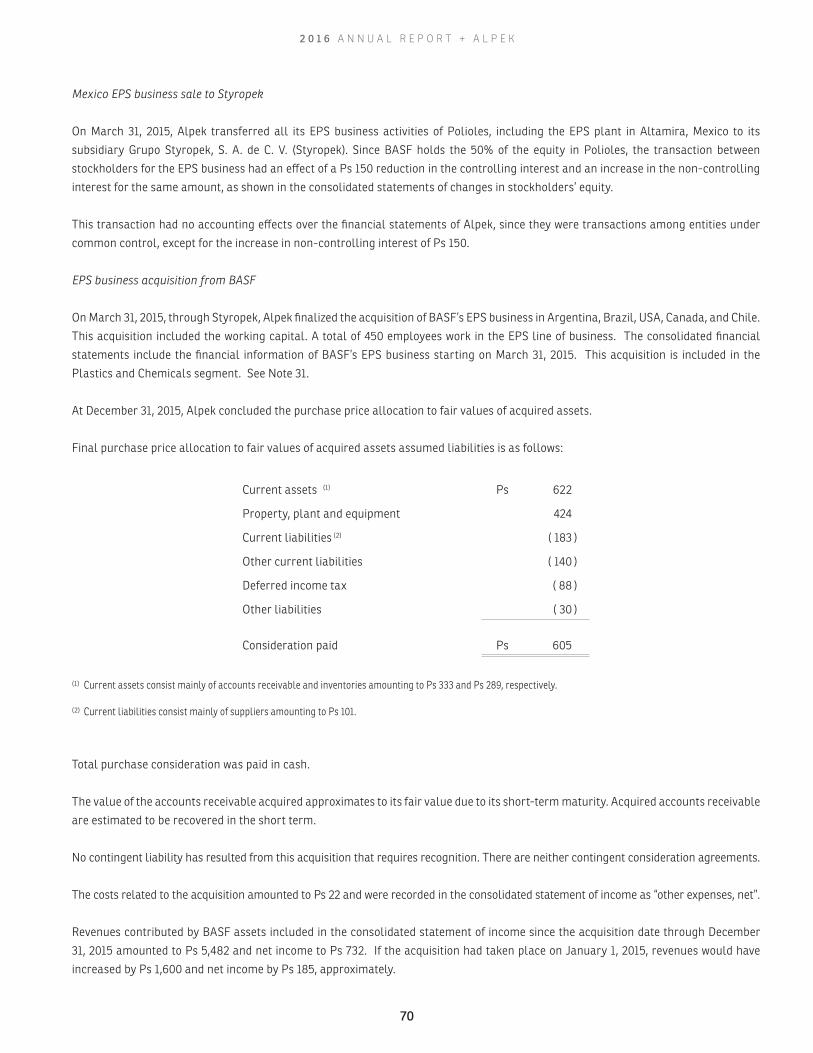
Mexico EPS business sale to Styropek
On March 31, 2015, Alpek transferred all its EPS business activities of Polioles, including the EPS plant in Altamira, Mexico to its
subsidiary Grupo Styropek, S. A. de C. V. (Styropek). Since BASF holds the 50% of the equity in Polioles, the transaction between
stockholders for the EPS business had an effect of a Ps 150 reduction in the controlling interest and an increase in the non-controlling
interest for the same amount, as shown in the consolidated statements of changes in stockholders’ equity.
This transaction had no accounting effects over the financial statements of Alpek, since they were transactions among entities under
common control, except for the increase in non-controlling interest of Ps 150.
EPS business acquisition from BASF
On March 31, 2015, through Styropek, Alpek finalized the acquisition of BASF’s EPS business in Argentina, Brazil, USA, Canada, and Chile.
This acquisition included the working capital. A total of 450 employees work in the EPS line of business. The consolidated financial
statements include the financial information of BASF’s EPS business starting on March 31, 2015. This acquisition is included in the
Plastics and Chemicals segment. See Note 31.
At December 31, 2015, Alpek concluded the purchase price allocation to fair values of acquired assets.
Final purchase price allocation to fair values of acquired assets assumed liabilities is as follows:
Current assets (1) Ps 622
Property, plant and equipment 424
Current liabilities (2) ( 183 )
Other current liabilities ( 140 )
Deferred income tax ( 88 )
Other liabilities ( 30 )
Consideration paid Ps 605
(1) Current assets consist mainly of accounts receivable and inventories amounting to Ps 333 and Ps 289, respectively.
(2) Current liabilities consist mainly of suppliers amounting to Ps 101.
Total purchase consideration was paid in cash.
The value of the accounts receivable acquired approximates to its fair value due to its short-term maturity. Acquired accounts receivable
are estimated to be recovered in the short term.
No contingent liability has resulted from this acquisition that requires recognition. There are neither contingent consideration agreements.
The costs related to the acquisition amounted to Ps 22 and were recorded in the consolidated statement of income as “other expenses, net”.
Revenues contributed by BASF assets included in the consolidated statement of income since the acquisition date through December
31, 2015 amounted to Ps 5,482 and net income to Ps 732. If the acquisition had taken place on January 1, 2015, revenues would have
increased by Ps 1,600 and net income by Ps 185, approximately.
2 0 1 6 A N N U A L R E P O R T + A L P E K
70

NOTE 3 - Summary of significant accounting policies
The accompanying consolidated financial statements and notes were authorized for issuance on February 17, 2017, by officials with the legal
power to sign the basic financial statements and accompanying notes.
The following are the most significant accounting policies followed by the Company, which have been consistently applied in the preparation
of their financial information in the years presented, unless otherwise specified:
a) Basis for preparation
The consolidated financial statements of Alpek have been prepared in accordance with the International Financial Reporting Standards
(“IFRS”) issued by the International Accounting Standards Board (“IASB”). The IFRS include all International Accounting Standards
(“IAS”) in force and all related interpretations issued by the International Financial Reporting Interpretations Committee (“IFRS IC”),
including those previously issued by the Standing Interpretations Committee (“SIC”).
The consolidated financial statements have been prepared on a historical cost basis, except for the derivative financial instruments
designated as hedges which are measured at fair value and for the financial assets and liabilities at fair value through profit or loss with
changes reflected in income and for financial assets available for sale.
The preparation of the consolidated financial statements according to IFRS requires the use of certain critical accounting estimates.
Additionally, it requires Management to exercise judgment in the process of applying the Company’s accounting policies. The areas
involving a higher degree of judgment or complexity, or areas where judgments and estimates are significant to the consolidated
financial statements are disclosed in Note 5.
b) Consolidation
i. Subsidiaries
The subsidiaries are all the entities over which the Company has the power to govern the financial and operating policies of the
entity. The Company controls an entity when it is exposed, or has the right to variable returns from its interest in the entity and it is
capable of affecting the returns through its power over the entity. Where the Company’s interest in subsidiaries is less than 100%,
the share attributed to outside shareholders is presented as non-controlling interest.
The subsidiaries are consolidated from the date on which control is transferred to the Company and until the date it loses that
control.
The Company applies the acquisition method in accounting for business combinations. The Company defines a business combination
as a transaction in which obtains control over the business, which is defined as a set of activities and assets which are conducted and
managed in order to obtain benefits in the form of dividends, less costs or other economic benefits directly to investors.
The consideration transferred for the acquisition of a subsidiary is the fair value of the assets transferred, the liabilities incurred
with the ex-owners of the acquired business and the equity interests issued by the Company. The consideration transferred includes
the fair value of any asset or liability resulting from a contingent consideration arrangement. Identifiable acquired assets and
liabilities and contingent liabilities assumed in a business combination are initially measured at their fair values at the acquisition
date. The Company recognizes any non-controlling interest in the acquiree based on the share of the non-controlling interest in
the net identifiable assets of the acquired entity.
2 0 1 6 A N N U A L R E P O R T + A L P E K
71

The Company accounts for business combinations of entities under common control using the predecessor method. The predecessor
method involves the incorporation of the carrying amounts of the acquired entity, which includes the goodwill recognized at the
consolidated level with respect to the acquiree. Any difference between the consideration transferred and the carrying amount of
the net assets acquired at the level of the subsidiary is recognized in stockholders’ equity.
The acquisition-related costs are recognized as expenses when they are incurred.
Goodwill is initially measured as excess of the sum of the consideration transferred and the fair value of the non-controlling
interest over the net identifiable assets acquired. If the consideration transferred is less than the fair value of the net assets of the
subsidiary acquired in the case of a bargain purchase, the difference is recognized directly in the consolidated statement of income.
If the business combination is achieved in stages, the value in books at the acquisition date of the equity previously held by
the Company in the acquired entity is remeasured at its fair value at the acquisition date. Any loss or gain resulting from such
remeasurement is recorded in income of the year.
Transactions and intercompany balances, as well as unrealized gains (losses) on transactions between Alpek’s companies are
eliminated in preparing the consolidated financial statements. In order to ensure consistency with the policies adopted by the
Company, the amounts reported by the subsidiaries have been changed where it was deemed necessary.
At December 31, 2016 and 2015, the main companies that comprise the consolidated of the Company are as follows:
Country (1) Percentage of Ownership (2)
Functionalcurrency
2016 2015
Alpek, S. A. B. de C. V. (Holding company) Mexican pesoGrupo Petrotemex, S. A. de C. V. (Holding company) 100 100 US dollar
DAK Americas, LLC USA 100 100 US dollarDak Resinas Americas México, S. A. de C. V. 100 100 US dollarDAK Americas Exterior, S. L. (Holding company) Spain 100 100 Euro
DAK Americas Argentina, S. A. Argentina 100 100 Argentine pesoSelenis Canada Inc. (3) Canada 50 - US dollar
Tereftalatos Mexicanos, S. A. de C. V. 91 91 US dollarAkra Polyester, S. A. de C. V. 93 93 US dollarCogeneración de Energía Limpia de Cosoleacaque, S. A. de C. V. 100 100 Mexican peso
Indelpro, S. A. de C. V. (Indelpro) 51 51 US dollarPolioles, S. A. de C. V. (Polioles) 50 50 US dollarGrupo Styropek, S. A. de C. V. (Holding company) 100 100 Mexican peso
Styropek México, S. A. de C. V. 100 100 US dollarStyropek, S. A. Argentina 100 100 Argentine pesoAislapol, S. A. Chile 100 100 Chilean pesoStyropek do Brazil, LTD Brazil 100 100 Brazilean real
Unimor, S. A. de C. V. (Holding company) 100 100 Mexican pesoUnivex, S. A. 100 100 Mexican peso
(1) Companies incorporated in Mexico, except those indicated.(2) Ownership percentage that Alpek has in the holding companies which in turn has in other companies. Ownership percentages and the voting rights are the same.(3) On July 29, 2016, through its subsidiary DAK Americas Exterior, S. L., Alpek acquired a controlling interest in Selenis Canada, Inc. (Selenis), the only producer
of PET in Canada, which operates a plant located in Montreal, Quebec with capacity to produce 144 thousand tons annually. The acquisition of Selenis met the criteria of a business acquisition, and the amount of the consideration paid amounted to US$17.2. The consolidated financial statements include the financial information of Selenis beginning on August 1, 2016. This business acquisition is included in the Polyester segment.
2 0 1 6 A N N U A L R E P O R T + A L P E K
72

At December 31, 2016 and 2015, there are no significant restrictions on the investment in shares of the subsidiaries companies above
mentioned.
ii. Absorption (dilution) of control in subsidiaries
The effect of absorption (dilution) of control in subsidiaries, i.e., an increase or decrease in the percentage of control, is recorded in
stockholders’ equity, directly in retained earnings, in the period in which the transactions that cause such effects occur. The effect
of absorption (dilution) of control is determined by comparing the carrying amount of the investment according to percentage of
ownership before the event of dilution or absorption against the carrying amount with the new percentage of ownership after the
relevant event. In the case of loss of control, the dilution effect is recognized in income.
iii. Sale or disposal of subsidiaries
When the Company ceases to have control any retained interest in the entity is remeasured at fair value, and the change against
the carrying amount is recognized in the consolidated income statement. The fair value is the initial carrying amount for the
purposes of accounting for any subsequent retained interest in the associate, joint venture or financial asset. Any amount previously
recognized in comprehensive income in respect of that entity is accounted for as if the Company had directly disposed of the related
assets and liabilities. This implies that the amounts recognized in the comprehensive income are reclassified to income for the year.
iv. Associates
Associates are all entities over which the Company has significant influence but not control. Generally an investor must hold
between 20% and 50% of the voting rights in an investee for it to be an associate. Investments in associates are accounted for using
the equity method and are initially recognized at cost. The Company’s investment in associates includes goodwill identified at
acquisition, net of any accumulated impairment loss. The Company has an investment of which it owns 50% and it is consolidated.
See critical judgment in Note 5.2.
If the equity in an associate is reduced but significant influence is maintained, only a portion of the amounts recognized in the
comprehensive income are reclassified to income for the year, where appropriate.
The Company’s share in profits or losses of associates, post-acquisition, is recognized in the consolidated income statement and its
share in the other comprehensive income of associates is recognized as other comprehensive income. The cumulative movements
after acquisition are adjusted against the carrying amount of the investment. When the Company’s share of losses in an associate
equals or exceeds its equity in the associate, including unsecured receivables, the Company does not recognize further losses
unless it has incurred obligations or made payments on behalf of the associate.
The Company assesses at each reporting date whether there is objective evidence that the investment in the associate is impaired.
If so, the Company calculates the amount of impairment as the difference between the recoverable amount of the associate and its
carrying amount and recognizes it in “share in loss of associates” in the consolidated income statement.
Unrealized gains on transactions between the Company and its associates are eliminated to the extent of the Company’s share in
such gains. Unrealized losses are also eliminated unless the transaction provides evidence that the asset transferred is impaired.
In order to ensure consistency with the policies adopted by the Company, the accounting policies of associates have been modified.
When the Company ceases to have significant influence over an associate, any difference between the fair value of any retained
interest plus any proceeds from disposing apart interest in the associate less the carrying amount of the investment at the date the
equity method was discontinued is recognized in the consolidated income statement.
2 0 1 6 A N N U A L R E P O R T + A L P E K
73
c) Foreign currency translation
i. Functional and presentation currency
The amounts included in the financial statements of each of the Company’s subsidiaries and associates should be measured using
the currency of the primary economic environment in which the entity operates (“the functional currency”). The consolidated
financial statements are presented in Mexican pesos, which is the Company’s presentation currency.
ii. Transactions and balances
Foreign currency transactions are translated into the functional currency using the exchange rates prevailing at the dates of
the transactions or valuation where items are re-measured. Foreign exchange gains and losses resulting from the settlement
of such transactions and from the translation at closing date exchange rates of monetary assets and liabilities denominated in
foreign currencies are recognized as foreign exchange gains and losses in the consolidated income statement, except when those
transactions arise from cash flow hedges, are recognized in other comprehensive income.
Foreign exchange gains and losses resulting from changes in the fair value of monetary financial assets and liabilities denominated
in a foreign currency are recognized in the consolidated income statement, except when those transactions arise from cash flow
hedges or hedges of a net investment in a foreign operation.
Translation differences on monetary financial assets and liabilities classified as fair value through profit or loss are recognized in
the consolidated income statement as part of the fair value gain or loss. Translation differences on non-monetary financial assets
classified as available for sale are included in other comprehensive income.
iii. Translation of subsidiaries with a functional currency different from their recording currency
The financial statements of subsidiaries, having a recording currency different from their functional currency were translated into
the functional currency in accordance with the following procedure:
a. The balances of monetary assets and liabilities denominated in the recording currency were translated at the closing exchange
rates.
b. The balances and movements of nonmonetary assets, liabilities and stockholders’ equity were translated at the historical
exchange rates. In the case of the movements of non-monetary items recognized at fair value, which occurred during the period,
stated in the recording currency, these were translated using the historical exchange rates in effect on the date when the fair
value was determined.
c. The revenue, costs and expenses of the periods, expressed in the recording currency, were translated at the exchange rate of
the date they were accrued and recognized in the consolidated income statement, except when they arose from non-monetary
items, in which case the historical exchange rate of the non-monetary items was used.
d. The differences in exchange arising in the translation from the recording currency to the functional currency were recognized
as income or expense in the consolidated income statement in the period they arose.
2 0 1 6 A N N U A L R E P O R T + A L P E K
74

iv. Translation of subsidiaries with a functional currency different from their presentation currency.
The results and financial position of all Company entities (none of which is in a hyperinflationary environment) with a functional
currency different from the presentation currency are translated into the presentation currency as follows:
a. Assets and liabilities for each consolidated statement of financial position presented are translated at the closing exchange rate
at the statement of financial position date;
b. The stockholders’ equity of each consolidated statement of financial position presented is translated at historical exchanges rates.
c. Income and expenses for each consolidated income statement are translated at average exchange rate (when the average
exchange rate is not a reasonable approximation of the cumulative effect of the rates of the transaction, to the exchange rate at
the date of the transaction is used); and
d. All resulting exchange differences are recognized in other comprehensive income.
The goodwill and adjustments to fair value arising at the date of acquisition of a foreign operation so as to measure them at fair value
are recognized as assets and liabilities of the foreign entity and translated at the exchange rate at the closing date. Exchange differences
arising are recognized in other comprehensive income.
Listed below are the most important exchange rates:
Local currency to Mexican pesos
Closing exchange rate at December 31
Annual averageexchange rate (*)
Country Functional currency 2016 2015 2016 2015
USA US dollar 20.66 17.21 18.66 15.85
Argentina Argentine peso 1.30 1.33 1.26 1.72
Brazil Brazilean real 6.35 4.34 5.41 4.80
Chile Chilean peso 0.03 0.02 0.03 0.02
(*) This data is informative. For translation purposes monthly average exchange rates are used.
d) Cash and cash equivalents
Cash and cash equivalents include cash on hand, bank deposits available for operations and other short-term investments of high
liquidity with original maturities of three months or less, all of which are subject to insignificant risk of changes in value. Bank overdrafts
are presented as other current liabilities.
e) Restricted cash and cash equivalents
Cash and cash equivalents whose restrictions cause them not to comply with the definition of cash and cash equivalents given above,
are presented in a separate line in the consolidated statement of financial position and are excluded from cash and cash equivalents in
the statement cash flows.
2 0 1 6 A N N U A L R E P O R T + A L P E K
75
f) Financial instruments
Financial assets
The Company classifies its financial assets in the following categories: at fair value through profit or loss, loans and receivables,
investments held to maturity and available for sale. The classification depends on the purpose for which the financial assets were
acquired. Management determines the classification of its financial assets upon initial recognition. Purchases and sales of financial
assets are recognized on the settlement date.
Financial assets are written off in full when the right to receive the related cash flows expires or is transferred and the Company has also
transferred substantially all risks and rewards of ownership, as well as control of the financial asset.
i. Financial assets at fair value through profit or loss
Financial assets at fair value through profit or loss are financial assets held for trading. A financial asset is classified in this
category if acquired principally for the purpose of selling in the short term. Derivative financial instruments are classified in this
category, unless they are designated as hedges.
Financial assets at fair value through profit or loss are initially recognized at fair value and transaction costs are expensed in the
consolidated income statement. Gains or losses from changes in fair value of these assets are presented in the consolidated income
statement as incurred.
ii. Accounts receivable
The accounts receivables are non-derivative financial assets with fixed or determinable payments that are not quoted in an active
market. They are included in current assets, except for maturities greater than 12 months after the consolidated statement of
financial position date. These are classified as non-current assets.
Accounts receivable are initially calculated at fair value plus directly attributable transaction costs and subsequently at amortized
cost. When circumstances occur that indicate that the amounts receivable will not be collected at the amounts originally agreed
or will be collected in a different period, the receivables are impaired.
iii. Investments held to maturity
If the Company intends and has the demonstrable ability to hold debt securities to maturity, they are classified as investments held
to maturity. Assets in this category are classified as current assets if expected to be settled within the next 12 months, otherwise
they are classified as non-current. Initially they are recognized at fair value plus any directly attributable transaction costs, and
subsequently they are valued at amortized cost using the effective interest method. At December 31, 2016 and 2015, the Company
had no such investments.
iv. Financial assets available for sale
Financial assets available for sale are non-derivative financial instruments that are either designated in this category or not classified
in any of the other categories. They are included in non-current assets unless their maturity is less than 12 months or Management
intends to dispose of the investment within the next 12 months after the consolidated statement of financial position date.
Financial assets available for sale are initially recognized at fair value plus directly attributable transaction costs. Subsequently,
these assets are carried at fair value (unless they cannot be measured by their value in an active market and the value is not
reliable, in which case they will be recognized at cost less impairment).
2 0 1 6 A N N U A L R E P O R T + A L P E K
76
Gains or losses arising from changes in fair value of monetary and non-monetary instruments are recognized directly in the
consolidated statement of comprehensive income in the period in which they occur.
When instruments classified as available for sale are sold or impaired, the accumulated fair value adjustments recognized in equity
are included in the consolidated income statement.
Financial liabilities
Financial liabilities that are not financial derivatives instruments are initially recognized at fair value and subsequently valued at
amortized cost using the effective interest method. Liabilities in this category are classified as current liabilities if is expected to be
settled within the next 12 months, otherwise they are classified as non-current.
Suppliers and other accounts payable are obligations to pay for goods or services that have been acquired or received in the ordinary
course of business. Loans are initially recognized at fair value, net of transaction costs incurred. Debt is subsequently carried at
amortized cost; any difference between the funds received (net of transaction costs) and the settlement value is recognized in the
consolidated income statement over the term of the loan using the effective interest method.
Offsetting financial assets and liabilities
Assets and liabilities are offset and the net amount is presented in the consolidated statement of financial position when there is a
legally enforceable right to offset the recognized amounts and there is an intention to settle on a net basis or to realize the asset and
settle the liability simultaneously.
Impairment of financial instruments
a. Financial assets measured at amortized cost
The Company assesses at the end of each year whether there is objective evidence of impairment of each financial asset or group of
financial assets. An impairment loss is recognized if there is objective evidence of impairment as a result of one or more events that
occurred after the initial recognition of the asset (a “loss event”) and provided that the loss event (or events) has an impact on the
estimated future cash flows arising from the financial asset or group of financial assets that can be reliably estimated.
Aspects evaluated by the Company to determine whether there is objective evidence of impairment are:
• Significant financial difficulty of the issuer or debtor.
• Breach of contract, such as default in payments of interest or principal.
• Granting a concession to the issuer or debtor, by the Company, as a result of financial difficulties of the issuer or debtor and
that otherwise would not be considered.
• There is likelihood that the issuer or debtor will enter bankruptcy or other financial reorganization.
• Disappearance of an active market for that financial asset due to financial difficulties.
• Verifiable information indicates that there is a measurable decrease in the estimated future cash flows related to a group of
financial assets after initial recognition, although the decrease cannot yet be identified with the individual financial assets of
the Company, such as:
i. Adverse changes in the payment status of borrowers in the group of assets.
ii. National or local conditions that correlate with default on the assets in the group.
2 0 1 6 A N N U A L R E P O R T + A L P E K
77
Based on the items listed above, the Company assesses whether there is objective evidence of impairment. Subsequently, for
the category accounts receivable, when impairment exists, the amount of loss is measured as the difference between the asset’s
carrying amount and the present value of estimated future cash flows (excluding future credit losses that have not been incurred)
discounted at the original effective interest rate. The carrying amount of the asset is reduced by that amount, which is recognized
in the consolidated income statement under administrative expenses.
If a held-to-maturity investment has a variable interest rate, the discount rate for measuring any impairment loss is the current
effective interest rate determined under the contract. Alternatively, the Company could determine the impairment of the asset given
its fair value determined on the basis of a current observable market price.
If in the subsequent years, the impairment loss decreases and the decrease can be related objectively to an event occurring after
the date on which such impairment was recognized (such as an improvement in the debtor’s credit rating), the reversal of the loss
impairment is recognized in the consolidated income statement.
Impairment amounts of accounts receivable are shown in Note 7.
b. Financial assets available for sale
In the case of debt financial instruments, the Company also uses the above-listed criteria to identify whether there is objective
evidence of impairment. In the case of equity financial instruments, a significant reduction of approximately to 30%of the cost of the
investment against its fair value or a reduction of the fair value against the cost for a period longer than 12 months is considered
objective evidence of impairment.
Subsequently, in the case of financial assets available for sale, an impairment loss determined by computing the difference between
the acquisition cost and the current fair value of the asset, less any impairment loss previously recognized, is reclassified from the
other comprehensive income to the consolidated income statement. Impairment losses recognized in the consolidated income
statement related to equity financial instruments are not reversed through the consolidated income statement. Impairment losses
recognized in the consolidated income statement related to financial debt instruments could be reversed in subsequent years, if the
fair value of the asset is increased as a result of a subsequent event.
g) Derivative financial instruments and hedging activities
All derivative financial instruments are identified and classified as fair value hedges or cash flow hedges, or for trading and are recognized
in the consolidated statement of financial position as assets and/or liabilities at fair value and similarly measured subsequently at fair
value. The fair value is determined based on recognized market prices and its fair value is determined using valuation techniques
accepted in the financial sector.
The hedging derivatives are classified as a non-current asset or liability if the remaining maturity of the hedged item is more than 12
months and as a current asset or liability if the remaining maturity of the hedged item is less than 12 months.
Derivative financial instruments classified as hedges are contracted for risk hedging purposes and meet all hedging requirements; their
designation at the beginning of the hedging operation is documented, describing the objective, hedge item, risks to be hedged and the
effectiveness of the hedging relationship, characteristics, accounting recognition and how the effectiveness is to be measured.
2 0 1 6 A N N U A L R E P O R T + A L P E K
78

Fair value hedges
Changes in the fair value of derivative financial instruments are recorded in the consolidated income statement. The change in fair value
of the hedging instruments and the gain or loss on the hedged item attributable to the hedged risk are recorded in the consolidated
income statement. At December 31, 2016 and 2015, the Company has no derivative financial instruments classified as fair value hedges.
Cash flow hedges
The changes in the fair value of derivative instruments associated to cash flow hedges are recorded in stockholders’ equity. The effective
portion is temporarily recorded in comprehensive income, within stockholders’ equity and is reclassified to the consolidated income
statement when the hedged item affects this. The ineffective portion is immediately recorded in income.
Net investment hedge
Net investment hedge in a foreign operation is recorded similarly to cash flow hedges. Any gain or loss of the hedged instrument related
to the effective portion of the hedge is recorded in other comprehensive income. The gain or loss of the ineffective portion is recorded in
the consolidated statement of income. Accumulated gains and losses in equity are transferred to the consolidated statement of income
on the disposal or partial disposal of the foreign operation. At December 31, 2016 and 2015, the Company has no derivative financial
instruments classified as net investment hedges.
Discontinuation of hedge accounting
The Company discontinues the hedge accounting when the derivative has expired, has been sold, cancelled or exercised, or when the
hedge does not meet the criteria for hedge accounting, or when the Company decides to cancel the hedge designation.
On discontinuing hedge accounting, in the case of fair value hedges, the adjustment to the carrying amount of a hedged item for which
the effective interest rate method is used, is amortized to income over the period to maturity. In the case of cash flow hedges, the amounts
accumulated in equity as a part of comprehensive income remain in equity until the time when the effects of the forecasted transaction
affect income. In the event the forecasted transaction is not likely to occur, the income or loss accumulated in comprehensive income
are immediately recognized in the consolidated income statement.
When the hedge of a forecasted transaction appears satisfactory and subsequently does not meet the effectiveness test, the cumulative
effects in comprehensive income in stockholders’ equity are transferred proportionally to the consolidated income statement to the
extent, the forecasted transaction impacts it.
The fair value of derivative financial instruments presented in the financial statements of the Company, is a mathematical approximation
of their fair value. It is computed using proprietary models of independent third parties using assumptions based on past and present
market conditions and future expectations at the respective consolidated statement of financial position date.
h) Inventories
Inventories are stated at the lower of cost and net realizable value. Cost is determined using the average cost method. The cost of
finished goods and work-in-progress includes cost of product design, raw materials, direct labor, other direct costs and production
overheads (based on normal operating capacity). It excludes loan costs. The net realizable value is the estimated selling price in the
normal course of business, less the applicable variable selling expenses. Costs of inventories include any gain or loss transferred from
equity corresponding to raw material purchases that qualify as cash flow hedges.
2 0 1 6 A N N U A L R E P O R T + A L P E K
79

i) Property, plant and equipment
Items of property, plant and equipment are recorded at cost less the accumulated depreciation and any accrued impairment losses. The
costs include expenses directly attributable to the asset acquisition.
Subsequent costs are included in the asset’s carrying amount or recognized as a separate asset, as appropriate, only when it is probable
that future economic benefits associated with the item will flow to the Company and the cost of the item can be reliably measured. The
carrying amount of the replaced part is derecognized. Repairs and maintenance are recognized in the consolidated income statement
during the year they are incurred. Major improvements are depreciated over the remaining useful life of the related asset.
Depreciation is calculated using the straight-line method, considering separately each of the asset’s components, except for land, which
is not subject to depreciation. The average useful lives of assets families are as follows:
Buildings and constructions 40 to 50 years
Machinery and equipment 10 to 40 years
Transportation equipment 15 years
Furniture and laboratory equipment and information technology 2 to 13 years
Others 3 to 20 years
The spare parts or replacements to be used after one year and attributable to specific machinery are classified as property, plant and
equipment in other fixed assets.
Borrowing costs directly attributable to the acquisition related to property, plant and equipment whose acquisition or construction
requires a substantial period (minimum nine months), are capitalized as part of the cost of acquiring such qualifying assets, up to the
moment when they are suitable for their intended use or sale.
Assets classified as property, plant and equipment are subject to impairment tests when events or circumstances occur indicating that
the carrying amount of the assets may not be recoverable. An impairment loss is recognized in the consolidated income statement in
other expenses, net, for the amount by which the carrying amount of the asset exceeds its recoverable amount. The recoverable amount
is the higher of fair value less costs to sell and its value in use.
The residual value and useful lives of assets are reviewed at least at the end of each reporting period and, if expectations differ from
previous estimates, the changes are accounted for as a change in accounting estimate.
Gains and losses on disposal of assets are determined by comparing the sale value with the carrying amount and are recognized in other
expenses, net, in the consolidated income statement.
j) Leases
The classification of leases as finance or operating depends on the substance of the transaction rather than the form of the contract.
Leases in which a significant portion of the risks and rewards relating to the leased property are retained by the lessor are classified as
operating leases. Payments made under operating leases (net of incentives received by the lessor) are recognized in the consolidated
income statement based on the straight-line method over the lease period.
2 0 1 6 A N N U A L R E P O R T + A L P E K
80
Leases where the Company assumes substantially all the risks and rewards of ownership are classified as finance leases. Finance leases
are capitalized at the beginning of the lease, at the lower of the fair value of the leased property and the present value of the minimum
lease payments. If its determination is practical, in order to discount the minimum lease payments to present value, the interest rate
implicit in the lease is used; otherwise, the incremental borrowing rate of the lessee should be used. Any initial direct costs of the leases
are added to the original amount recognized as an asset.
Each lease payment is allocated between the liability and finance charges to achieve a constant rate on the outstanding balance. The
corresponding rental obligations are included in non-current debt, net of finance charges. The interest element of the finance cost is
charged to the income for the year during the period of the lease, so as to produce a constant periodic rate of interest on the remaining
balance of the liability for each period. Property, plant and equipment acquired under finance leases are depreciated over the shorter
of the asset’s useful life and the lease term.
k) Goodwill and intangible assets
Intangible assets are recognized in the consolidated statement of financial position when they meet the following conditions: they are
identifiable, provide future economic benefits and the Company has control over such benefits.
Intangible assets are classified as follows:
i. Indefinite useful life - These intangible assets are not amortized and are subject to annual impairment assessments. As of December
31, 2016 and 2015, no factors have been identified limiting the useful life of these intangible assets.
ii. Finite useful life - These assets are recognized at cost less the accumulated amortization and impairment losses recognized. They
are amortized on a straight, line basis according to their estimated useful life, determined based on the expectation of generating
future economic benefits, and are subject to impairment tests when triggering events of impairment are identified.
The estimated useful lives of intangible assets with finite useful lives are summarized as follows:
Development costs 15.5 years
Supply rights 15 years
No compete agreements 5 to 10 years
Customer relationships 6 to 7 years
Software and licenses 3 to 7 years
Intellectual property rights 20 to 25 years
Tolling rights 15 years
Others 20 years
a. Goodwill
Goodwill represents the excess of the acquisition cost of a subsidiary over the Company’s equity in the fair value of the identifiable
net assets acquired, determined at the date of acquisition, and is not subject to amortization. Goodwill is shown under goodwill and
intangible assets and is recognized at cost less accumulated impairment losses, which are not reverted. Gains or losses on the disposal
of an entity include the carrying amount of goodwill relating to the entity sold.
2 0 1 6 A N N U A L R E P O R T + A L P E K
81

b. Development costs
Research costs are recognized in income as incurred. Expenditures on development activities are recognized as intangible assets when
such costs can be reliably measured, the product or process is technically and commercially feasible, potential future economic benefits
are obtained and the Company intends also has sufficient resources to complete the development and to use or sell the asset. Their
amortization is recognized in income by the straight-line method over the estimated useful life of the asset. Development expenditures
that do not qualify for capitalization are recognized in income as incurred.
c. Intangible assets acquired in a business combination
When an intangible asset is acquired in a business combination it is recognized at fair value at the acquisition date. Subsequently
intangible assets acquired in a business combination such as: trademarks, customer relations, intellectual property rights, no-
competition agreements, among others, are carried at cost less accumulated amortization and accumulated impairment losses.
l) Impairment of non-financial assets
Assets that have an indefinite useful life, for example goodwill, are not amortizable and are subject to annual impairment tests. Assets
that are subject to amortization are reviewed for impairment when events or changes in circumstances indicate that the carrying
amount may not be recoverable. An impairment loss is recognized for the amount by which the asset’s carrying amount exceeds its
recoverable amount. The recoverable amount is the higher of the asset’s fair value less costs to sell and its value in use. For the purpose
of assessing impairment, assets are grouped at the lowest levels at which separately identifiable cash flows exist (cash generating units).
Non-financial assets other than goodwill that have suffered impairment are reviewed for possible reversal of the impairment at each
reporting date.
m) Income taxes
The caption of income taxes in the consolidated income statement represents the sum of the current income taxes and the deferred
income taxes.
The amount of the income tax reflected in the consolidated income statement represents the current tax in the year, as well as the effects
of deferred income tax, which is determined in each subsidiary using the asset and liability method, applying the tax rate established
by the legislation enacted or substantially enacted at the date of the statement of consolidated financial position where the Company
operates and generates taxable income to the total of the temporary differences resulting from comparing the carrying amounts and
tax bases of assets and liabilities that are expected to be applied when the deferred asset tax is realized or the deferred liability tax is
settled, considering the tax losses carry forward to be recoverable. The effect of a change in current tax rates is recognized in income
of the period in which the rate change is enacted.
Management periodically evaluates positions taken in tax returns with respect to situations in which the applicable law is subject to
interpretation. Provisions are recognized when it is appropriate, based on the amounts expected to be paid to the tax authorities.
Deferred income tax assets are recognized only to the extent that is probable that future taxable profit will be available against which
the temporary differences can be utilized.
The deferred income tax on temporary differences arising from investments in subsidiaries and associates is recognized, unless the
period of reversal of temporary differences is controlled by the Company and it is probable that the temporary differences will not
reverse in the foreseeable future.
2 0 1 6 A N N U A L R E P O R T + A L P E K
82
Deferred income tax assets and liabilities are offset when there is a legally enforceable right, and when taxes are levied by the same
tax authority, either the same taxable entity or entities that may be settled or recovered their liabilities and tax assets, on a net basis.
n) Employee benefits
i. Pension plans
Defined contribution plans:
A defined contribution plan is a pension plan under which the Company pays fixed contributions into a separate entity. The Company
has no legal or constructive obligations to pay further contributions if the fund does not hold sufficient assets to pay all employees
the benefits relating to their service in the current and past periods. The contributions are recognized as employee benefit expense
when they are due.
Defined benefit plans:
A defined benefit plan is a plan under which the Company has a legal or constructive obligation for paying a pension when the
employee reach the retirement age, considering factors such as compensation, years of services and age.
The liability recognized in the consolidated statement of financial position in respect of defined benefit plans is the present value of
the defined benefit obligation at the consolidated statement of financial position date less the fair value of plan assets. The defined
benefit obligation is calculated annually by independent actuaries using the projected unit credit method. The present value of the
defined benefit obligation is determined by discounting the estimated future cash outflows using discount rates according to IAS
19 that are denominated in the currency in which the benefits will be paid, and have maturities that approximate the terms of the
pension liability.
The remeasurements of defined benefit obligations and plan assets are recognized directly in stockholders’ equity within other
items of the comprehensive income in the year they occur.
The Company determines the net finance expense (income) by applying the discount rate to the liability (asset) for net defined
benefits.
Past-service costs are recognized immediately in the consolidated income statement.
ii. Other post-employment benefits
The Company provides medical benefits after termination of employment to its retired employees of certain subsidiaries. The
right to access these benefits usually depends on the employee´s having worked until retirement age and completing a minimum of
years of service. The expected costs of these benefits are accrued over the period of employment using the same criteria as those
described for defined benefit pension plans.
2 0 1 6 A N N U A L R E P O R T + A L P E K
83
iii. Termination benefits
Termination benefits are payable when employment is terminated by the Company before the normal retirement date or when
an employee accepts voluntary termination of employment in exchange for these benefits. The Company recognizes termination
benefits in the first of the following dates: (a) when the Company can no longer withdraw the offer of these benefits, and (b) when the
Company recognizes the costs from restructuring within the scope of the IAS 37 and it involves the payment of termination benefits.
If there is an offer that promotes the termination of the employment relationship voluntarily by employees, termination benefits
are valued based on the number of employees expected to accept the offer. Any benefits to be paid more than 12 months after the
consolidated statement of financial position date are discounted to their present value.
iv. Short-term benefits
The Company provides benefits to employees in the short term, which may include wages, salaries, annual compensation and
bonuses payable within 12 months. The Company recognizes an undiscounted provision when it is contractually obligated or when
past practice has created an obligation.
v. Employees’ profit sharing and bonuses
The Company recognizes a liability and an expense for bonuses and employees’ profit sharing when it has a legal or constructive
obligation to pay these benefits and determines the amount to be recognized based on the profit for the year after certain adjustments.
o) Provisions
Provisions represent a present, legal or assumed obligation as a result of past events, where an outflow of resources to meet the
obligation is likely and the amount can be reliably estimated. Provisions are not recognized for future operating losses.
Provisions are measured at the present value of the expenses that are expected to be required to settle the obligation using a pre-tax
rate that reflects current market value considerations, the time value of money and the specific risk of the obligation. The increase in
the provision over the course of time is recognized as interest expense.
When there are a number of similar obligations, the likelihood that an outflow will be required in settlement is determined by considering
the class of obligations as a whole. A provision is recognized even if the likelihood of an outflow with respect to any one item included in
the same class of obligations may be small.
Provisions for legal claims are recognized when the Company has a present obligation (legal or assumed) as a result of past events, it
is likely that an outflow of economic resources will be required to settle the obligation and the amount can be reasonably estimated.
A restructuring provision is recorded when the Company has developed a formal detailed plan for the restructure, and a valid expectation
for the restructure has been created between the people affected, possibly for having started the plan implementation or for having
announced its main characteristics to them.
2 0 1 6 A N N U A L R E P O R T + A L P E K
84

p) Share-based payments
The Company’s compensation plans are referred in 50% to the value of the shares of Alfa and the other 50% to the value of the shares
of Alpek, in favor of certain senior executives of the Company and its subsidiaries. The conditions for granting such compensation to the
eligible executives include among other things, compliance with certain metrics such as the level of profit achieved, the permanence in
the Company up to 5 years, etc. The Board of Directors of Alfa has appointed a technical committee for the administration of the plan,
which reviews the estimated cash settlement of this compensation at the end of the year. Payment of the plan is always subject to the
sole discretion of ALFA’s top Management. Adjustments to such estimate are charged or credited to the consolidated income statement.
The fair value of the amount payable to employees in respect of share-based payments which are settled in cash is recognized as an
expense, with a corresponding increase in liabilities, over the period of service required. The liability is included under other liabilities
and is adjusted at each reporting date and the settlement date. Any change in the fair value of the liability is recognized as compensation
expense in the consolidated income statement.
q) Treasury shares
The Shareholders’ Meeting periodically authorizes a maximum amount for the acquisition of the Company’s own shares. Upon the
occurrence of a repurchase of its own shares, they become treasury shares and the amount is charged to stockholders’ equity at
purchase price: a portion to capital stock at its modified historical value, and the balance to retained earnings. These amounts are stated
at their historical value.
r) Capital stock
The Company’s ordinary shares are classified as capital. Incremental costs directly attributable to the issuance of new shares are
included in equity as a deduction from the consideration received, net of taxes.
s) Comprehensive income
Comprehensive income is composed of net income plus other items of comprehensive income, net of taxes, which comprise the effects
of the translation of foreign subsidiaries, the effects of derivative financial instruments for cash flow hedging, remeasurements of
obligations for employee benefits, the effects of changes in the fair value of financial instruments available for sale, the equity in other
items of comprehensive income of associates, and other items specifically required to be reflected in stockholders’ equity and which do
not constitute capital contributions, reductions or distributions.
t) Segment reporting
Segment information is presented consistently with the internal reporting provided to the Chief Executive Officer who is the highest
authority in operational decision-making, resource allocation and assessment of operating segment performance.
u) Revenue recognition
Revenue comprises the fair value of the consideration received or receivable for the sale of goods and services in the normal course of
operations. Revenue is shown net of value added tax, customer returns, rebates and similar discounts and after eliminating intercompany
revenue.
2 0 1 6 A N N U A L R E P O R T + A L P E K
85
Revenue from the sale of goods and products are recognized when all and each of the following conditions are met:
• The risks and rewards of ownership have been transferred.
• The amount of revenue can be reliably measured.
• It is likely that future economic benefits will flow to the Company.
• The Company retains no involvement associated with ownership nor effective control of the sold goods.
• The costs incurred or to be incurred in respect of the transaction can be measured reasonably.
Revenues from services are recognized as follows:
• The amount of revenue can be reliably measured.
• It is likely that future economic benefits will flow to the Company.
• The stage of completion of the service, on the date of the consolidated statement of financial position can be measured reliably.
• The costs incurred or to be incurred in respect of the transaction can be measured reasonably.
The revenue recognition criteria depend on the contractual conditions with the Company’s costumers. In some cases, depending on
the agreements with each costumer, the risks and benefits associated to the property are transferred when the goods are taken by the
costumers in the Company’s plant. In other cases, the risks and benefits associated to the property are transferred when the goods are
delivered in the plant of the costumers.
Dividend income from investments is recognized once the rights of shareholders to receive this payment have been established (when it
is probable that the economic benefits will flow to the entity and the revenue can be reliably valued).
Interest income is recognized when it is likely that the economic benefits will flow to the entity and the amount of revenue can be reliably
valued by applying the effective interest rate.
v) Earnings per share
Earnings (losses) per share are calculated by dividing the profit (loss) attributable to the shareholders of the parent by the weighted
average number of common shares outstanding during the year. At December 31, 2016 and 2015, there are no dilutive effects from
financial instruments potentially convertible into shares.
2 0 1 6 A N N U A L R E P O R T + A L P E K
86
w) Changes in accounting policies and disclosures
The following standards were adopted by the Company for the first time beginning on January 1, 2016, which did not have a material
impact on the Company:
• Annual improvements to the IFRS - cycle 2012-2014.
• Disclosure initiative - Changes to IAS 1.
The adoption of these changes had no impact in the current period or any previous periods and it is not likely to affect future periods.
x) New accounting pronouncements
A number of new standards, modifications, and interpretations of standards have been published, which are not effective for reporting
periods at December 31, 2016, and they have not been adopted early by the Company. The evaluation of the Company on the effects of
these new standards and interpretations are discussed below:
IFRS 9 - “Financial instruments “, addresses the classification, measurement and recognition of financial assets and liabilities and
introduces new rules for hedge accounting. In July 2014, the IASB made additional changes to the classification and measurement
rules and also introduced a new impairment model. These last changes now comprise the entire new financial instruments standard.
Following the approved changes, the Company no longer expects any impact from the new rules of classification, measurement and
decrease of its financial assets or liabilities. There will be no impact on the Company’s accounting from financial liabilities, since the new
requirements only affect financial liabilities at fair value through income and the Company has no such liabilities. The new hedge rules
pair up the Company’s hedge accounting and risk management. As a general rule, the hedge accounting will be much easier to apply
since the standard introduces an approach based on principles. The new standard introduces extensive disclosure requirements and
changes in presentation, which will continue to be assessed by the Company. The new impairment model is a model of expected credit
losses; therefore, it would result in advance recognition of credit losses.
The Company continues assessing how its hedge agreements and impairment provisions are affected by the new rules. The standard is
effective for the periods beginning on or after January 1, 2018. Early adoption is allowed.
IFRS 15 - “Revenue from contracts with customers”, is a new standard issued by the IASB for revenue recognition. This standard replaces
IAS 18 “Revenues”, IAS 11 “Construction contracts”, as well as the interpretations to the aforementioned standards. The new standard is
based on the fact that revenue should be recorded when the control over the good or different service is transferred to the customer, so
that this control notion replaces the existing notion of risks and benefits.
The standard allows for a complete retrospective approach and a modified retrospective approach for its adoption. The Company has
assessed the two approaches and it considers that the modified retrospective approach will be used for adoption. Under this approach the
entities will recognize adjustments from the effect of initial application (January 1, 2018) in retained earnings in the financial statements
at December 2018 without restating comparative periods, by applying the new rules to contracts effective as of January 1, 2018 or those
that even when held in prior years continue to be effective at the date of initial application.
For disclosure purposes in the financial statements at 2018, the amounts of affected items must be disclosed, considering the application
of the current revenue standard, as well as an explanation of the reason for the significant changes made.
During 2016, Management performed a diagnosis to identify areas that require a major analysis to determine the possible impact of the
new standard IFRS 15. The matters considered most relevant and require a major analysis are: identify if there are additional obligations
to be met in contracts with customers, the transfer of control over products and at which it should be recognized as revenue, based on
the new guidelines on this standard.
2 0 1 6 A N N U A L R E P O R T + A L P E K
87
At December 31, 2016, the Company is in process of assessing the impacts of this new standard in its financial statements. The standard
is effective for periods beginning on or after January 1, 2018. Early adoption is permitted.
IFRS 16 - “Leases”. The IASB issued in January 2016 a new standard for lease accounting. This standard will replace current standard
IAS 17, which classifies leases into financial and operating. IAS 17 identifies leases as financial in nature when the risks and benefits
of an asset are transferred, and identifies the rest as operating leases. IFRS 16 eliminates the classification between financial and
operating leases and requires the recognition of a liability showing future payments and assets for “right of use” in most leases. The
IASB has included some exceptions in short-term leases and in low-value assets. The aforementioned amendments are applicable to
the lease accounting of the lessee, while the lessor maintains similar conditions to those currently available. The most significant effect
of the new requirements is shown in an increase in leasing assets and liabilities, also affecting the statement of income in depreciation
expenses and financing of recorded assets and liabilities, respectively, and decreasing expenses relative to leases previously recognized
as operating leases.
At the issue date of these financial statements, the Company has non-cancelable operating lease agreements amounting to Ps 2,682.
However, it has still not been determined to what degree these commitments will have as a result of recognizing an asset and a liability
for future payments, and how this affects net income and classification of the Company’s cash flows.
The standard is effective for periods that begin on or after January 1, 2019. The Company does not have the intent to adopt the standard
early at this stage.
There are no additional standards, amendments or interpretations issued but not yet effective that could have a significant effect on the
Company.
NOTE 4 - Risks management
4.1 Financial risk factors
The Company’s activities expose it to various financial risks: market risk (including foreign exchange risk, price risk, interest rate risk on cash
flows and interest rate risk on fair value), credit risk and liquidity risk. The Company’s risk management plan considers the unpredictability
of the financial markets and seeks to minimize the potential negative effects on the financial performance of the Company. The Company
uses derivative financial instruments to hedge some risk exposures.
The objective is to protect the financial health of the business taking into account the volatility associated with exchange rates and interest
rates. Additionally, due to the nature of the industries in which it participates, the Company has entered into derivative hedges of input prices.
2 0 1 6 A N N U A L R E P O R T + A L P E K
88

ALFA the ultimate controlling company of Alpek has a Risk Management Committee, constituted by the Chairman, the Chief Executive Officer,
the Chief Financial Officer of the holding Company and a financial executive from the holding Company who acts as technical secretary. The
Committee oversees derivative transactions proposed by the subsidiaries of ALFA in which the maximum possible loss exceeds (US$1). This
Committee supports both the Executive Director and the Chairman of the Board of Directors of ALFA. All new derivative transactions that the
Company proposes to make, and the renewal of existing derivatives, require to be approved by both the Company and the holding Company
in accordance with the following schedule of authorizations:
Possible Maximum Loss US$
Individual transactions
Cumulative annual transactions
Company’s Chief Executive Officer 1 5Risk Management Committee of ALFA 30 100Finance Committee 100 300Board of Directors of ALFA >100 >300
The proposed transactions must meet certain criteria, including that the hedges are lower than exposures, and that they are the result of a
fundamental analysis and properly documented. Sensitivity analyses and other risk analyses should be performed before the operation is
carried out.
a) Market risk
i. Exchange rate risk
The Company operates internationally and is exposed to the exchange rate risk, mainly in relation to Mexican pesos and with currencies
different to the functional currency in which its subsidiaries operate. The Company is exposed to foreign exchange risk arising from
future commercial transactions in assets and liabilities in foreign currencies and investments abroad.
The respective exchange rates of the Mexican peso and the U.S. dollar are very important factors for the Company due to the effect they
have on their results. Moreover, Alpek has no influence whatsoever, over their movements. On the other hand, Alpek estimates that most
of its revenues are denominated in foreign currency, either because they come from products that are exported from Mexico, or because
they come from products that are manufactured and sold abroad, or because even if sold in Mexico the price of such products are set
based on international prices in foreign currencies such as the U.S. dollar.
For this reason, in the past, when the Mexican peso has appreciated in real terms against other currencies such as the U. S. dollar, the
Company’s profit margins have been reduced. On the other hand, when the Mexican peso has lost value, the Company’s profit margins
have been increased. However, although this factor correlation has appeared on several occasions in the recent past, there is no
assurance that it will be repeated if the exchange rates between the Mexican peso and other currencies fluctuate again.
The Company participates in operations with derivative financial instruments on exchange rates for the purpose of controlling the total
comprehensive cost of its financing and the volatility associated with exchange rates. Additionally, it is important to note the high
“dollarization” of the Company’s revenues, since a large proportion of its sales are made abroad, providing a natural hedge against its
obligations in dollars, while at the same time its income level is affected in the event exchange rate appreciation. Based on the overall
exchange rate exposure at December 31, 2016 and 2015, a hypothetical variation of 5% in the exchange rate MXN/USD, holding all other
variables constant, would result in an effect on the consolidated income statement by Ps 69 and Ps 56, respectively. See Note 16.
2 0 1 6 A N N U A L R E P O R T + A L P E K
89
ii. Price risk
In carrying out its activities, the Company depends on the supply of raw materials provided by its suppliers, both in Mexico and abroad,
among which are intermediate petrochemicals, principally.
In the most recent years, the price of some inputs has shown volatility, especially those arising from oil and natural gas.
In order to fix the selling prices of certain of its products, the Company has entered into agreements with certain customers. The practice
in the industry in North America has been to set prices on a cost plus margin basis, by reference to a price formula for transferring the
variations in the costs of the main raw materials and energy to achieve a predictable margin. At the same time, the Company has entered
into transactions involving derivatives on natural gas, gasoline, ethylene, ethane, paraxylene and brent crude seeking to reduce the
volatility of prices of these inputs, the Company does not suffer fluctuations upward or downward.
Additionally, it has entered into derivative financial instruments transactions to hedge purchases of certain raw materials, since these
inputs have a direct or indirect relationship with the prices of its products.
The derivative financial operations have been privately contracted with various financial institutions, whose financial strength was highly
rated at the time by rating agencies. The documentation used to formalize the contract operations is that based generally on the “Master
Agreement”, generated by the “International Swaps & Derivatives Association” (“ISDA”), which is accompanied by various accessory
documents known in generic terms as “Schedule”, “Credit Support Annex” and “Confirmation”.
Regarding natural gas, Pemex is the only supplier in Mexico. The selling price of natural gas at first hand is determined by the price of
that product on the “spot” market in South Texas, USA, which has experienced volatility. For its part, the CFE is a decentralized public
company in charge of producing and distributing electricity in Mexico. Electricity rates have also been influenced by the volatility of
natural gas, since most power plants are gas-based.
The Company entered into various derivative agreements with various counterparties to protect it against increases in prices of natural
gas and other raw materials. In the case of natural gas derivatives, hedging strategies for products were designed to mitigate the
impact of potential increases in prices. The purpose is to protect the price from volatility by taking positions that provide stable cash
flow expectations, and thus avoid price uncertainty. The reference market price for natural gas is the “Henry Hub New York Mercantile
Exchange (NYMEX)”. The average price per MMBTU for 2016 and 2015 was 2.31 and 2.60 US dollars, respectively.
At December 31, 2016, the Company had hedges of natural gas, ethylene, ethane and paraxylene prices for a portion expected of
consumption needs in Mexico and the United States. Based on the general input exposure at December 31, 2016 and 2015, a hypothetical
increase (decrease) of 10% in market prices applied to fair value and keeping all other variables constant, such as exchange rates, the
increase (decrease) would result in an immaterial effect on the consolidated income statement for 2016 and 2015.
iii. Interest rate risk and cash flow
The interest rate risk of the Company arises from long-term loans entered into with banking institutions. Loans at variable rates expose
the Company to interest rate risk on cash flows that are partially offset by cash held at variable rates. Loans at fixed rates expose the
Company to interest rate risk at fair value.
At December 31, 2016 and 2015, if interest rates on variable rate loans were increased/decreased by 10%, interest expense, in the
consolidated income statement, would increase/decrease by Ps 7 and Ps 7, respectively.
2 0 1 6 A N N U A L R E P O R T + A L P E K
90
b) Credit risk
Credit risk is managed on a group basis, except for the credit risk related to accounts receivable balances. Each subsidiary is responsible
for managing and analyzing credit risk for each of its new customers before setting the terms and conditions of payment. Credit risk is
generated from cash and cash equivalents, derivative financial instruments and deposits with banks and financial institutions as well as
credit exposure to customers, including receivables and committed transactions. If wholesale customers are rated independently, these
are the ratings used. If there is no independent rating, the Company’s risk control group evaluates the creditworthiness of the customer,
taking into account their financial position, past experience and other factors.
Individual risk limits are determined based on internal and external ratings in accordance with limits set by the Board. The credit risk
analysis is performed regularly.
During 2016 and 2015, credit limits were not exceeded and Management does not expect losses in excess of the impairment recognized
in the corresponding periods.
The impairment provision for doubtful accounts represents estimated losses resulting from the inability of customers to make required
payments. In determining the allowance for doubtful accounts, significant estimates have to be made. The Company performs ongoing
credit evaluations of its customers and adjusts credit limits based upon payment history and the customer’s current creditworthiness, as
determined by a review of their current credit information. In addition, the Company considers a number of factors to determine the size
and appropriate timing for the recognition of allowances, including historical collection experience, customer base, current economic
trends and the ageing of the accounts receivable portfolio.
c) Liquidity risk
In the past, the Company has generated and expects to continue generating positive operation cash flows. Operation cash flows mainly
represent the inflow of net income (adjusted for depreciation and other items not related to cash) and the outflow of working capital
increases necessary to grow the business. Cash flows used in investment activities, represent capital expenditures (Capex) required for
the growth, as well as business acquisitions. Financing activities cash flows are related mainly with the indebtedness changes to grow
the business or indebtedness paid with cash of operations or refinancing operations, as well as dividends paid.
The main cash flow needs of the Company are for working capital, Capex, maintenance, business combinations and payment of debt.
The Company’s abilities to finance cash flow needs depend on the continuous ability to generate cash from operations, general capacity
and terms of finance agreements, as well as access to capital markets. The Company believes that the future cash flows of operations
together with the access to funds available under such finance agreements and capital markets, will provide it with adequate resources
to finance predictable operating requirements, Capex, acquisitions and new business development activities.
The following tables analyze the derivative and non-derivative financial liabilities, grouped according to their maturity, from the
consolidated statement of financial position date to the contractual maturity date. Derivative financial liabilities are included in the
analysis to know the timing of the Company’s cash flows for these liabilities.
2 0 1 6 A N N U A L R E P O R T + A L P E K
91
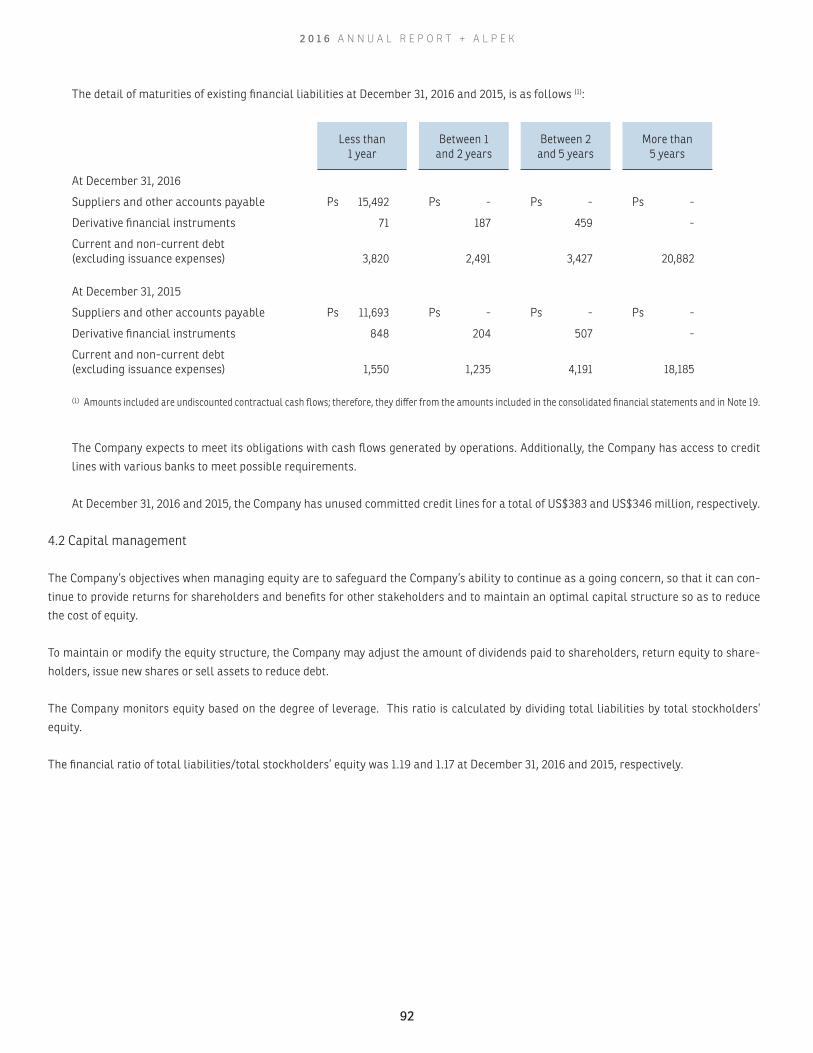
The detail of maturities of existing financial liabilities at December 31, 2016 and 2015, is as follows (1):
Less than1 year
Between 1 and 2 years
Between 2 and 5 years
More than5 years
At December 31, 2016
Suppliers and other accounts payable Ps 15,492 Ps - Ps - Ps -
Derivative financial instruments 71 187 459 -
Current and non-current debt (excluding issuance expenses) 3,820 2,491 3,427 20,882
At December 31, 2015
Suppliers and other accounts payable Ps 11,693 Ps - Ps - Ps -
Derivative financial instruments 848 204 507 -
Current and non-current debt (excluding issuance expenses) 1,550 1,235 4,191 18,185
(1) Amounts included are undiscounted contractual cash flows; therefore, they differ from the amounts included in the consolidated financial statements and in Note 19.
The Company expects to meet its obligations with cash flows generated by operations. Additionally, the Company has access to credit
lines with various banks to meet possible requirements.
At December 31, 2016 and 2015, the Company has unused committed credit lines for a total of US$383 and US$346 million, respectively.
4.2 Capital management
The Company’s objectives when managing equity are to safeguard the Company’s ability to continue as a going concern, so that it can con-
tinue to provide returns for shareholders and benefits for other stakeholders and to maintain an optimal capital structure so as to reduce
the cost of equity.
To maintain or modify the equity structure, the Company may adjust the amount of dividends paid to shareholders, return equity to share-
holders, issue new shares or sell assets to reduce debt.
The Company monitors equity based on the degree of leverage. This ratio is calculated by dividing total liabilities by total stockholders’
equity.
The financial ratio of total liabilities/total stockholders’ equity was 1.19 and 1.17 at December 31, 2016 and 2015, respectively.
2 0 1 6 A N N U A L R E P O R T + A L P E K
92

4.3 Fair value estimation
The following is an analysis of financial instruments measured by the fair value valuation method. The three different levels used are pre-
sented below:
• Level 1: Quoted prices for identical instruments in active markets.
• Level 2: Other valuations including quoted prices for similar instruments in active markets that are directly or indirectly
observable.
• Level 3: Valuations made through techniques wherein one or more of their significant data inputs are non-observable.
The following table presents the Company’s assets and liabilities that are measured at fair value at December 31, 2016:
Level 1 Level 2 Level 3 Total
Assets
Derivative with hedge accounting treatment Ps - Ps 56 Ps - Ps 56
Financial assets available for sale - - 172 172
Total Ps - Ps 56 Ps 172 Ps 228
Liabilities
Financial liabilities at fair value through profit or loss -Negotiable derivative Ps - Ps 12 Ps - Ps 12
Employees’ benefits based on shares 31 - - 31
Derivative with hedge accounting treatment - 705 - 705
Total Ps 31 Ps 717 Ps - Ps 748
The following table presents the Company’s assets and liabilities that are measured at fair value at December 31, 2015:
Level 1 Level 2 Level 3 Total
Assets
Financial assets at fair value through profit or loss -Negotiable derivative Ps - Ps 203 Ps - Ps 203
Derivative with hedge accounting treatment - - - -
Financial assets available for sale - - 144 144
Total Ps - Ps 203 Ps 144 Ps 347
Liabilities
Financial liabilities at fair value through profit or loss -Negotiable derivative Ps - Ps 17 Ps - Ps 17
Employees’ benefits based on shares 55 - - 55
Derivative with hedge accounting treatment - 1,542 - 1,542
Total Ps 55 Ps 1,559 Ps - Ps 1,614
There are no transfers between levels 1 and 2, or between levels 2 and 3 in the reported periods.
2 0 1 6 A N N U A L R E P O R T + A L P E K
93
Level 1
The fair value of financial instruments traded in active markets is based on quoted market prices at the consolidated statement of financial
position date. A market is considered active if quoted prices are clearly and regularly available from a stock exchange, dealer, broker, industry
group, pricing service or regulatory agency, and those prices represent actual and regular market transactions at arm-length conditions.
The trading price used for financial assets held by Alpek is the current bid price.
Level 2
The fair value of financial instruments that are not traded in an active market is determined by using valuation techniques. These valuation
techniques maximize the use of observable market data when available and rely as little as possible on estimates specific to the Company. If
all significant inputs required to measure an instrument at fair value are observable, the instrument is classified at Level 2.
Level 3
If one or more of the significant inputs is not based on observable market data, the instrument is classified at Level 3.
Specific valuation techniques used to value financial instruments include:
• Market quotations or offers from retailers for similar instruments.
• The fair value of swaps is calculated as the present value of future cash flows estimated in observable return curves.
• The fair value of forward contracts is determined using exchange rates at the consolidated statement of financial position
date, when the resulting value is discounted at present value.
• Other techniques, such as the analysis of discounted cash flows, used to determine the fair value of the remaining financial
instruments.
Financial assets included within this level are only financial assets available for sale, which correspond to investment in company’s shares
that are not quoted in the active market and therefore, the fair value may not be reliably determined.
NOTE 5 - Critical accounting estimates and judgments
Estimates and judgments are continually evaluated and are based on historical experience and other factors, including expectations of fu-
ture events that are believed to be reasonable under the circumstances.
5.1 Critical accounting estimates and assumptions
The Company makes estimates based on assumptions concerning the future. The resulting accounting estimates will be, by definition, sel-
dom equal to the related actual results. The estimates and assumptions that have a significant risk of causing a material adjustment to the
carrying amounts of assets and liabilities within the next financial year are the following:
2 0 1 6 A N N U A L R E P O R T + A L P E K
94
a) Property, plant, equipment and finite life intangibles
The Company estimates the useful lives of its property, plant and equipment and finite life intangibles in order to determine the
depreciation and amortization expense, respectively, to be recorded during the reporting period. The useful life of these assets is
calculated when the asset is acquired and is based on the past experience with similar assets, considering advance technological
changes or changes of other kind. If technological changes would occur faster than estimated, or differently from anticipated, the useful
lives assigned to these assets may need to be reduced. This would result in the recognition in a greater depreciation and amortization
expense in future periods. Alternatively, these types of technological changes may result in recognizing a charge for impairment to show
the reduction in the value of assets. The Company reviews assets annually to know if they show signs of impairment, or when certain
events or circumstances indicate that the carrying amount cannot be recovered during the remaining life of the assets, in case there
are signs of impairment, the Company carries out a study to determine the value in use of assets. At December 31, 2016 and 2015, there
were no indicators of impairment.
b) Income taxes
The Company is subject to income taxes in numerous jurisdictions and critical judgment is required to determine the global income tax
provisions. There are many transactions and calculations for which the ultimate tax determination could be uncertain. The Company
recognizes liabilities in anticipation of a tax audit based on estimates of whether additional taxes will be paid. When the final tax
outcome of these matters is different from the amounts that were initially recorded, such differences will impact the current and
deferred income tax assets and liabilities in the period in which such determination is made. If income before taxes increases/decreases
by 5%, income tax will be increased/decreased by Ps 118.
c) The fair value of derivative financial instruments
The fair value of financial instruments that are not traded in an active market is determined by using fair value hierarchies. The Company
uses its judgment to select a variety of methods and make assumptions that are based mainly on market conditions existing at the end of
each reporting period. If the fair value estimation varies by 5%, the effect on income would be modified by Ps 1 and the equity by Ps 32.
d) Pension benefits
The present value of pension obligations depends on a number of factors determined on an actuarial basis using different assumptions.
Assumptions used in the determination of the net cost (income) for pensions include the discount rate. Any change in the assumptions
will impact the carrying amounts of pension obligations.
The Company determines the adequate discount rate at year end. This interest rate should be used to determine the present value
of future cash outflows expected required to settle pension obligations. In the determination of the appropriate discount rate, the
Company considers the discount interest rate in conformity with IAS 19 (Revised) “Employee benefits” denominated in the currency used
to pay benefits with terms at maturity that approximate the obligations terms of related pension obligations. Other key assumptions for
pension obligations are based, in part, on the current market conditions. See analysis of sensibility in Note 20.
2 0 1 6 A N N U A L R E P O R T + A L P E K
95

5.2 Critical judgments in applying the entity’s accounting policies
a) Basis for consolidation
The financial statements include the assets, liabilities and results of all entities in which the Company has a controlling interest. The
balances and significant intercompany transactions have been eliminated in consolidation. To determine control, the Company considers
whether it has the power to govern the financial and operational strategy of the respective entity and not just the power of the capital
held by the Company. As a result of this analysis, the Company has exercised critical judgment to decide whether to consolidate the
financial statements of Polioles and Indelpro, where the determination of control is not clear. Based on the principal substantive right
of Alpek in accordance with the by-laws of Polioles to appoint the General Director, who has control over the relevant decision making
and based on the by-laws of Indelpro and supported in the General Law of Mercantile Organizations, which allow Alpek to control
the decisions over relevant activities by a simple majority through an ordinary shareholders’ meeting, where it holds 51% of Indelpro.
Management has concluded that there are circumstances and factors described in the bylaws of Polioles and applicable standards that
allow the Company to conduct the daily operations of Polioles and Indelpro, therefore, demonstrate control. The Company will continue
to evaluate these circumstances at the date of each consolidated statement of financial position to determine if this critical judgment
is still valid. If the Company determines that it has no control over Polioles and Indelpro, they will need to be deconsolidated and be
accounted for using the equity method.
NOTE 6 - Cash and cash equivalents
The cash and cash equivalents are comprised as follows:
At December 31,
2016 2015
Cash and bank accounts Ps 1,886 Ps 3,226
Short-term bank deposits 1,049 3,424
Cash and cash equivalents Ps 2,935 Ps 6,650
Restricted cash and cash equivalents
At December 31, 2016 and 2015, the Company has restricted cash of approximately Ps 2 and Ps 3, respectively. The balances are required to
be held in escrow as deposits related to workers compensation reserves. The restricted cash balance is classified as current assets in the
consolidated statement of financial position based on the maturity date of the restriction.
2 0 1 6 A N N U A L R E P O R T + A L P E K
96

NOTE 7 - Trade and other receivables, net
Trade and other accounts receivable are comprised as follows:
At December 31,
2016 2015
Trade receivables Ps 11,377 Ps 8,351
Provision for impairment of trade receivables ( 186 ) ( 155 )
Trade receivables, net 11,191 8,196
Accounts receivable from related parties (Note 8) 1,101 2,954
Recoverable taxes 3,384 1,978
Interest receivable 2 -
Other debtors 240 256
Current portion Ps 15,918 Ps 13,384
At December 31, 2016 and 2015, trade receivables and other accounts receivable include past-due balances not impaired of Ps 2,082 and
Ps 1,433, respectively.
As of December 31 2016 and 2015, the balance of other debtors is comprised primarily by travel expenses, customs expenses, among others.
The aging analysis of the balances due from customers and other receivables not impaired is as follows:
At December 31,
2016 2015
1 to 30 days Ps 1,101 Ps 587
30 to 90 days 239 183
90 to 180 days 161 57
More than 180 days 581 606
Ps 2,082 Ps 1,433
At December 31, 2016 and 2015, trade and other accounts receivable of Ps 186 and Ps 155, respectively were totally impaired. Trade and other
accounts receivable impaired correspond mainly to companies going through difficult economic situations. Part of the impaired accounts is
expected to be recovered.
2 0 1 6 A N N U A L R E P O R T + A L P E K
97

Movements in the provision for impairment of trade receivables are analyzed as follows:
2016 2015
Initial balance (January 1) ( Ps 155 ) ( Ps 393 )
Provision for impairment in trade receivables ( 60 ) ( 12 )
Trade receivables written-off during the year 15 261
Cancellation of unused provision for impairment 24 ( 11 )
Exchange rate fluctuations ( 10 ) -
Final balance (December 31) ( Ps 186 ) ( Ps 155 )
The maximum risk in accounts receivable is the carrying amount at December 31, 2016 and 2015. Increases in the provision for impairment
of trade and other receivables are recognized in the consolidated income statement under the caption selling expenses.
NOTE 8 - Related parties transactions
Transactions with related parties during the years ended December 31, 2016 and 2015, which were celebrated as if the conditions carried out
in terms similar to those of arm’s - length transactions with independent third parties were as follows:
2016 2015
Revenue
Revenue from finished goods sales:
Affiliates Ps - Ps 75
Shareholders with significant influence over subsidiaries 1,343 1,225
Revenue from services:
Affiliates 350 311
Shareholders with significant influence over subsidiaries 180 12
Revenue from financial interest:
Holding company 28 28
Affiliates 10 8
Shareholders with significant influence over subsidiaries 6 6
Other revenue:
Affiliates 1 5
Shareholders with significant influence over subsidiaries (Note 2e) - 676
2 0 1 6 A N N U A L R E P O R T + A L P E K
98

2016 2015
Costs / expenses
Purchase of finished goods and raw materials:
Affiliates ( Ps 3 ) ( Ps 21 )
Shareholders with significant influence over subsidiaries ( 915 ) ( 1,317 )
Administrative services expenses:
Affiliates ( 346 ) ( 202 )
Shareholders with significant influence over subsidiaries ( 15 ) ( 55 )
Interest expenses:
Associates ( 1 ) -
Other expenses:
Affiliates ( 69 ) -
Shareholders with significant influence over subsidiaries (Note 2e) ( 6 ) ( 298 )
Dividends declared:
Holding company ( 1,608 ) ( 1,209 )
Other shareholders ( 351 ) ( 264 )
Dividends from subsidiaries to the non – controlling interest:
Shareholders with significant influence over subsidiaries ( 1,967 ) ( 912 )
Other shareholders ( 82 ) ( 66 )
Effect of business transference under common control (1) ( 435 ) -
(1) During the month of November 2016, Alpek received from ALFA (Holding Company) the transfer of shares representative of 100% of the capital stock of Petrocel, S. A. (company that has the operating rights of a maritime terminal in Altamira, Tamaulipas), thus since that date became a subsidiary of Alpek. The cost of this transactions amounted to $1, and represented the acquisition of negative net assets amounting to Ps 434.
For the year ended December 31, 2016, wages and benefits received by top officials of the Company were
Ps 336 (Ps 266 in 2015), comprising of base salary and law benefits and supplemented by a variable compensation program that is
basically based on the performance of the Company and by the market value of its shares.
The Company and its subsidiaries report that they had no significant transactions with related parties or conflicts of interest to disclose
at December 31, 2016 and 2015.
2 0 1 6 A N N U A L R E P O R T + A L P E K
99
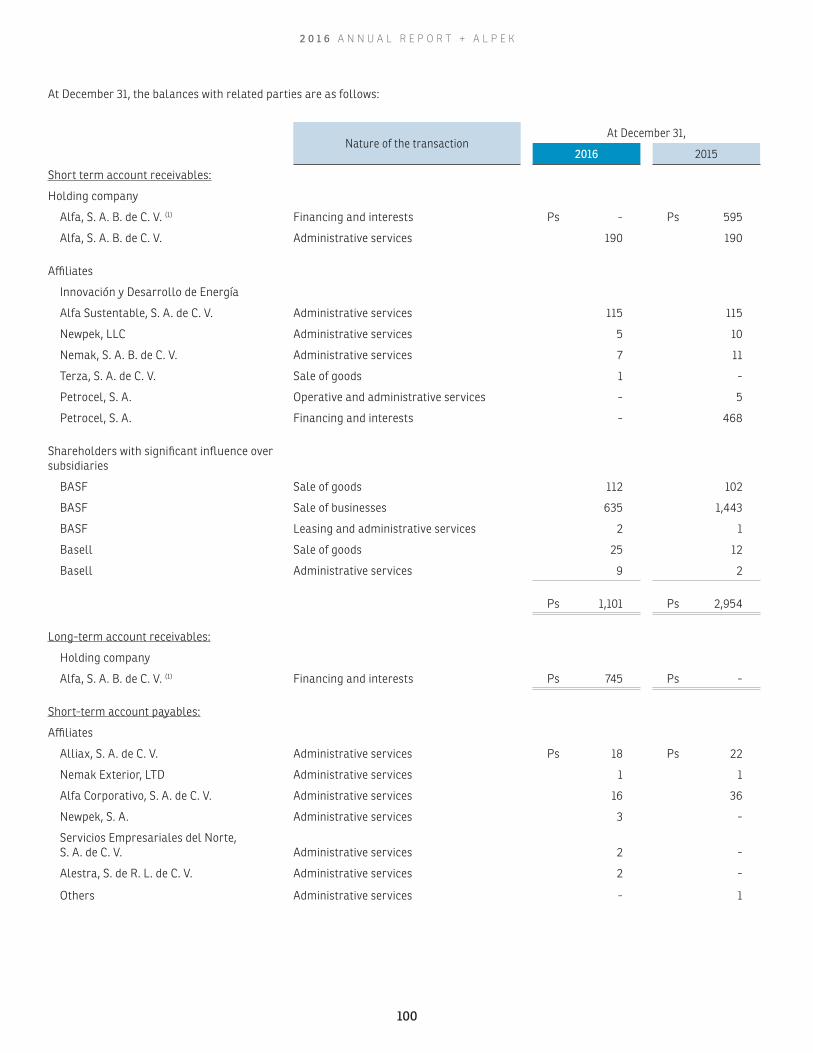
At December 31, the balances with related parties are as follows:
Nature of the transactionAt December 31,
2016 2015
Short term account receivables:
Holding company
Alfa, S. A. B. de C. V. (1) Financing and interests Ps - Ps 595
Alfa, S. A. B. de C. V. Administrative services 190 190
Affiliates
Innovación y Desarrollo de Energía
Alfa Sustentable, S. A. de C. V. Administrative services 115 115
Newpek, LLC Administrative services 5 10
Nemak, S. A. B. de C. V. Administrative services 7 11
Terza, S. A. de C. V. Sale of goods 1 -
Petrocel, S. A. Operative and administrative services - 5
Petrocel, S. A. Financing and interests - 468
Shareholders with significant influence over subsidiaries
BASF Sale of goods 112 102
BASF Sale of businesses 635 1,443
BASF Leasing and administrative services 2 1
Basell Sale of goods 25 12
Basell Administrative services 9 2
Ps 1,101 Ps 2,954
Long-term account receivables:
Holding company
Alfa, S. A. B. de C. V. (1) Financing and interests Ps 745 Ps -
Short-term account payables:
Affiliates
Alliax, S. A. de C. V. Administrative services Ps 18 Ps 22
Nemak Exterior, LTD Administrative services 1 1
Alfa Corporativo, S. A. de C. V. Administrative services 16 36
Newpek, S. A. Administrative services 3 -
Servicios Empresariales del Norte, S. A. de C. V. Administrative services 2 -
Alestra, S. de R. L. de C. V. Administrative services 2 -
Others Administrative services - 1
2 0 1 6 A N N U A L R E P O R T + A L P E K
100
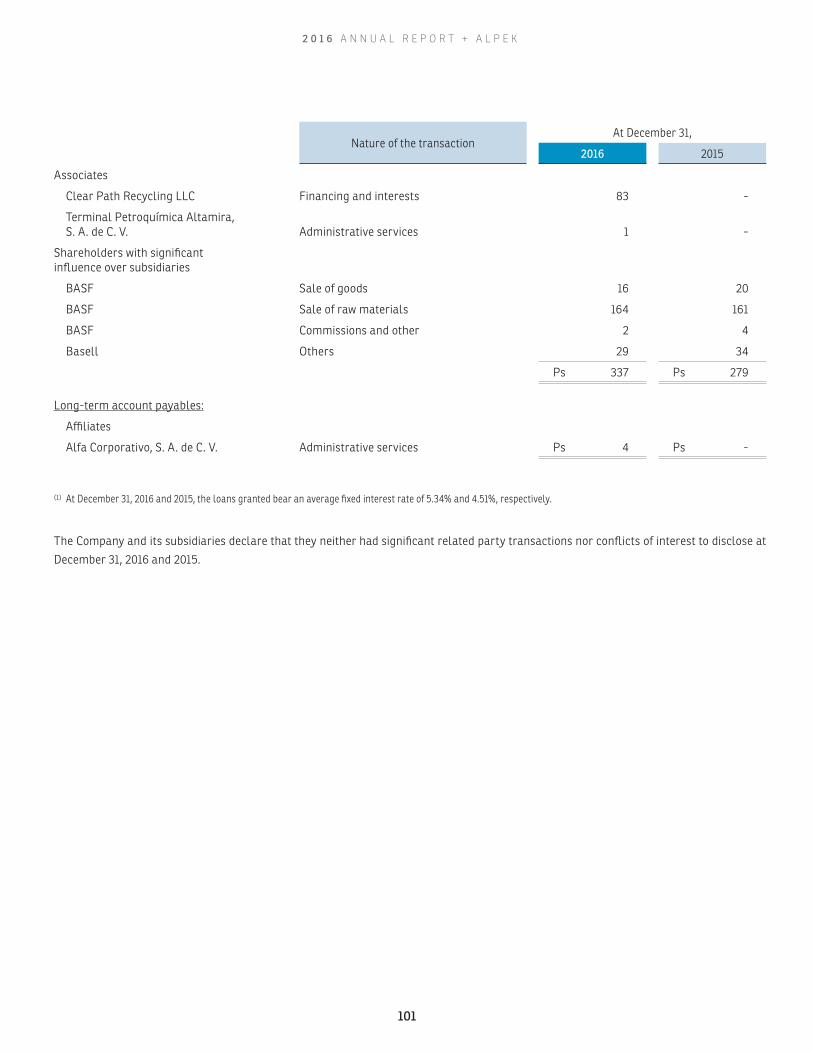
Nature of the transactionAt December 31,
2016 2015
Associates
Clear Path Recycling LLC Financing and interests 83 -
Terminal Petroquímica Altamira, S. A. de C. V. Administrative services 1 -
Shareholders with significantinfluence over subsidiaries
BASF Sale of goods 16 20
BASF Sale of raw materials 164 161
BASF Commissions and other 2 4
Basell Others 29 34
Ps 337 Ps 279
Long-term account payables:
Affiliates
Alfa Corporativo, S. A. de C. V. Administrative services Ps 4 Ps -
(1) At December 31, 2016 and 2015, the loans granted bear an average fixed interest rate of 5.34% and 4.51%, respectively.
The Company and its subsidiaries declare that they neither had significant related party transactions nor conflicts of interest to disclose at
December 31, 2016 and 2015.
2 0 1 6 A N N U A L R E P O R T + A L P E K
101

NOTE 9 - Inventories
At December 31,
2016 2015
Finished goods Ps 8,419 Ps 5,795
Raw material and other consumables 4,924 5,082
Materials and tools 1,002 793
Work in process 508 416
Ps 14,853 Ps 12,086
For the years ended at December 31, 2016 and 2015, the cost of raw materials consumed and the changes in inventories of work in process
and finished goods recognized in the cost of sales amounted to Ps 76,943 and Ps 73,029, respectively.
For the years ended December 31, 2016 and 2015, it was recognized in the Consolidated Statement of Income a provision amounting to Ps 22
and Ps 28, respectively, related to damaged, slow-moving and obsolete inventory.
At December 31, 2016 and 2015, there were no inventories pledged as collateral.
NOTE 10 - Prepayments
The current portion and non-current portion of prepaid expenses is summarized as follows:
At December 31,
2016 2015
Current portion (1) Ps 457 Ps 338
Noncurrent portion (2) 1,570 1,228
Total prepaid expenses Ps 2,027 Ps 1,566
(1) This item mainly consists of advertising and prepaid insurance.
(2) This item mainly represents advances on inventories forthcoming years related to supply rights, as described in Note 2 a), in the amount of Ps 1,550 and Ps 1,102 at December 31, 2016 and 2015, respectively.
2 0 1 6 A N N U A L R E P O R T + A L P E K
102

NOTE 11 - Property, plant and equipment, net
Land Buildings andconstructions
Machinery and equipment
Transportation equipment
Furniture, lab and information
technology equipment
Construction in process
Other fixed assets Total
Year ended December 31, 2015
Beginning balance Ps 2,988 Ps 3,624 Ps 19,061 Ps 69 Ps 238 Ps 919 Ps 494 Ps 27,393Additions - 7 47 3 7 1,477 36 1,577Additions through business acquisitions 37 104 257 3 16 9 - 426Disposals - - ( 28 ) ( 1 ) - ( 1 ) ( 11 ) ( 41 )Impairment - - ( 14 ) - - ( 27 ) ( 1 ) ( 42 )Translation effect 236 534 2,857 8 37 121 102 3,895Depreciation charge recognized in the year - ( 222 ) ( 1,697 ) ( 12 ) ( 76 ) - - ( 2,007 )Transfers 3 89 661 5 66 ( 850 ) 147 121
Carrying value at December 31, 2015 Ps 3,264 Ps 4,136 Ps 21,144 Ps 75 Ps 288 Ps 1,648 Ps 767 Ps 31,322
At December 31, 2015
Cost Ps 3,264 Ps 11,764 Ps 55,399 Ps 284 Ps 1,411 Ps 1,648 Ps 767 Ps 74,537
Accumulated depreciation - ( 7,628 ) ( 34,255 ) ( 209 ) ( 1,123 ) - - ( 43,215 )
Carrying value at December 31, 2015 Ps 3,264 Ps 4,136 Ps 21,144 Ps 75 Ps 288 Ps 1,648 Ps 767 Ps 31,322
Year ended December 31, 2016
Beginning balance Ps 3,264 Ps 4,136 Ps 21,144 Ps 75 Ps 288 Ps 1,648 Ps 767 Ps 31,322
Additions 1 11 31 8 5 4,574 35 4,665Additions through business acquisitions - 54 875 - 1 5 - 935Disposals ( 8 ) - ( 3 ) - ( 1 ) ( 1 ) ( 14 ) ( 27 ) Impairment - - ( 1 ) - ( 1 ) - - ( 2 ) Translation effect 367 752 4,061 13 58 525 150 5,926 Depreciation charge recognized in the year - ( 241 ) ( 1,904 ) ( 13 ) ( 87 ) - - ( 2,245 ) Transfers 100 137 1,068 ( 13 ) 64 ( 1,197 ) ( 34 ) 125
Carrying value at December 31, 2016 Ps 3,724 Ps 4,849 Ps 25,271 Ps 70 Ps 327 Ps 5,554 Ps 904 Ps 40,699
At December 31, 2016
Cost Ps 3,724 Ps 14,198 Ps 68,412 Ps 329 Ps 1,774 Ps 5,554 Ps 904 Ps 94,895
Accumulated depreciation - ( 9,349 ) ( 43,141 ) ( 259 ) ( 1,447) - - ( 54,196)
Carrying value at December 31, 2016 Ps 3,724 Ps 4,849 Ps 25,271 Ps 70 Ps 327 Ps 5,554 Ps 904 Ps 40,699
Depreciation expenses of Ps 2,217 and Ps 1,981 were recorded in cost of sales, Ps 4 and Ps 5, in selling expenses and Ps 24 and Ps 21, in ad-
ministrative expenses in 2016 and 2015, respectively.
The Company has capitalized costs of loans in qualified assets for Ps 51 and Ps 2 for the years ended December 31, 2016 and 2015, respective-
ly. Costs from loans were capitalized at the weighted average rate of loans that amounts to approximately 4.9%.
2 0 1 6 A N N U A L R E P O R T + A L P E K
103

NOTE 12 - Goodwill and intangible assets, net
Finite life Indefinite life
Development costs Supply rights No-compete
agreementsCustomers
relationshipsSoftware and
licenses
Intellectual property rights,
tolling rights and others
Goodwill Others Total
Cost
At January 1, 2015 Ps 663 Ps 2,927 Ps 198 Ps 536 Ps 90 Ps 2,341 Ps 250 Ps 7 Ps 7,012
Additions 5 1,741 - - 11 99 5 - 1,861
Translation effect 112 620 ( 2 ) 91 10 392 42 1 1,266
At December 31, 2015 780 5,288 196 627 111 2,832 297 8 10,139
Additions 7 947 - - - 484 7 - 1,445
Transfers - - - 1 1 ( 7 ) ( 1 ) - ( 6 )
Translation effect 158 1,204 15 125 16 628 59 2 2,207
At December 31, 2016 Ps 945 Ps 7,439 Ps 211 Ps 753 Ps 128 Ps 3,937 Ps 362 Ps 10 Ps 13,785
Amortization
At January 1, 2015 ( Ps 267 ) Ps - ( Ps 99 ) ( Ps 160 ) ( Ps 43 ) ( Ps 360 ) Ps - Ps - ( Ps 929 )
Amortization ( 48 ) - ( 44 ) ( 46 ) ( 4 ) ( 105 ) - - ( 247 )
Translation effect ( 47 ) - - ( 31 ) ( 6 ) ( 67 ) - - ( 151 )
At December 31, 2015 ( 362 ) - ( 143 ) ( 237 ) ( 53 ) ( 532 ) - - ( 1,327 )
Amortization ( 46 ) - ( 19 ) ( 54 ) ( 24 ) ( 172 ) - - ( 315 )
Transfers - - - - - 7 - - 7
Translation effect ( 78 ) - ( 15 ) ( 53 ) ( 11 ) ( 118 ) - - ( 275 )
At December 31, 2016 ( Ps 486 ) Ps - ( Ps 177 ) ( Ps 344 ) ( Ps 88 ) ( Ps 815 ) Ps - Ps - ( Ps 1,910 )
Net carrying value
Cost Ps 780 Ps 5,288 Ps 196 Ps 627 Ps 111 Ps 2,832 Ps 297 Ps 8 Ps 10,139
Amortization ( 362 ) - ( 143 ) ( 237 ) ( 53 ) ( 532 ) - - ( 1,327 )
At December 31, 2015 Ps 418 Ps 5,288 Ps 53 Ps 390 Ps 58 Ps 2,300 Ps 297 Ps 8 Ps 8,812
Cost Ps 945 Ps 7,439 Ps 211 Ps 753 Ps 128 Ps 3,937 Ps 362 Ps 10 Ps 13,785
Amortization (486) - ( 177 ) ( 344 ) ( 88 ) ( 815 ) - - ( 1,910 )
At December 31, 2016 Ps 459 Ps 7,439 Ps 34 Ps 409 Ps 40 Ps 3,122 Ps 362 Ps 10 Ps 11,875
Of the total amortization expense, Ps 295 and Ps 247 have been recorded in cost of sales and Ps 20 and Ps 0 in administrative expenses in
2016 and 2015, respectively.
Incurred research and development expenses that have been recorded in the 2016 and 2015 consolidated statements of income were Ps 62
and Ps 55, respectively.
2 0 1 6 A N N U A L R E P O R T + A L P E K
104
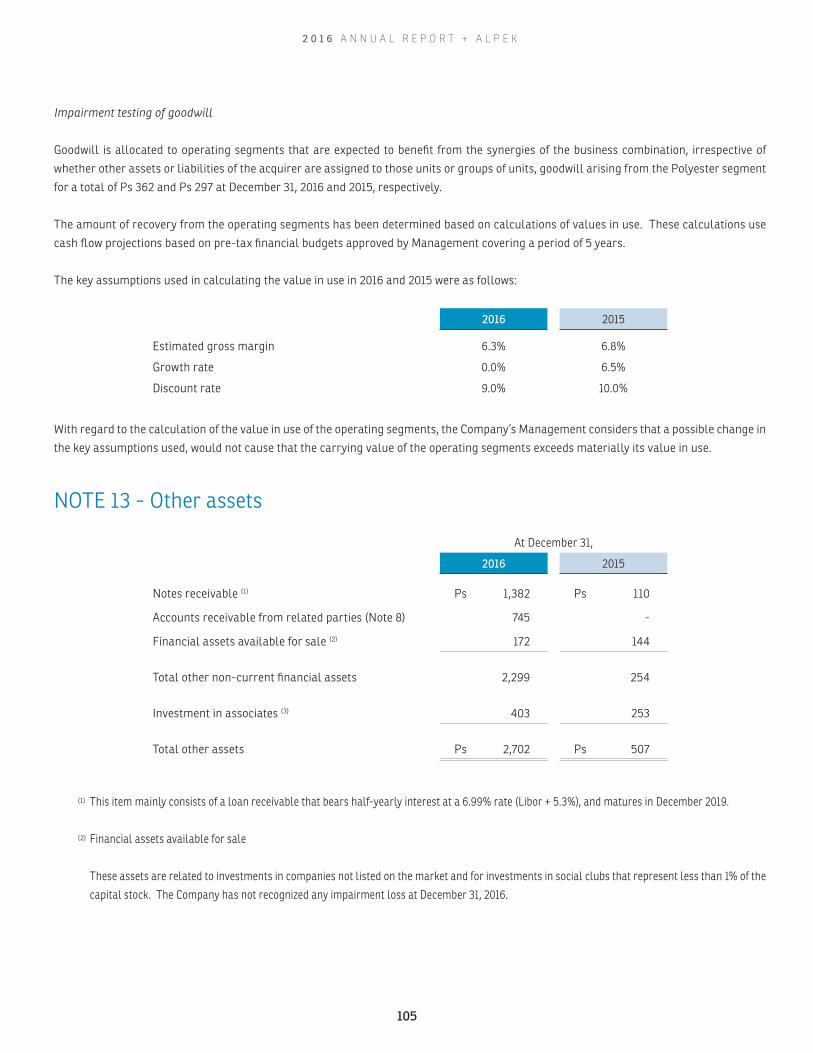
Impairment testing of goodwill
Goodwill is allocated to operating segments that are expected to benefit from the synergies of the business combination, irrespective of
whether other assets or liabilities of the acquirer are assigned to those units or groups of units, goodwill arising from the Polyester segment
for a total of Ps 362 and Ps 297 at December 31, 2016 and 2015, respectively.
The amount of recovery from the operating segments has been determined based on calculations of values in use. These calculations use
cash flow projections based on pre-tax financial budgets approved by Management covering a period of 5 years.
The key assumptions used in calculating the value in use in 2016 and 2015 were as follows:
2016 2015
Estimated gross margin 6.3% 6.8%
Growth rate 0.0% 6.5%
Discount rate 9.0% 10.0%
With regard to the calculation of the value in use of the operating segments, the Company’s Management considers that a possible change in
the key assumptions used, would not cause that the carrying value of the operating segments exceeds materially its value in use.
NOTE 13 - Other assets
At December 31,
2016 2015
Notes receivable (1) Ps 1,382 Ps 110
Accounts receivable from related parties (Note 8) 745 -
Financial assets available for sale (2) 172 144
Total other non-current financial assets 2,299 254
Investment in associates (3) 403 253
Total other assets Ps 2,702 Ps 507
(1) This item mainly consists of a loan receivable that bears half-yearly interest at a 6.99% rate (Libor + 5.3%), and matures in December 2019.
(2) Financial assets available for sale
These assets are related to investments in companies not listed on the market and for investments in social clubs that represent less than 1% of the
capital stock. The Company has not recognized any impairment loss at December 31, 2016.
2 0 1 6 A N N U A L R E P O R T + A L P E K
105

The movement of financial assets available for sale is as follows:
2016 2015
Balance at January 1 Ps 144 Ps 129
Translation effect 20 15
Additions 8 -
Balance at December 31 Ps 172 Ps 144
Financial assets available for sale are denominated in the following currencies:
At December 31,
2016 2015
USD Ps 124 Ps 104
MXN 48 40
Total Ps 172 Ps 144
None of the financial assets available for sale are expired or impaired.
(3) Investment by associates
Following is presented summarized financial information of associated companies of the group that are not significant, which are accounted for by
the equity method:
2016 2015
Net loss ( Ps 4 ) ( Ps 71 )
Other comprehensive income ( 2 ) -
Comprehensive income ( Ps 6 ) ( Ps 71 )
Investment in associates at December 31 Ps 403 Ps 253
There are neither commitments non contingencies liabilities regarding the Company’s investment in associates as of December 31, 2016.
2 0 1 6 A N N U A L R E P O R T + A L P E K
106
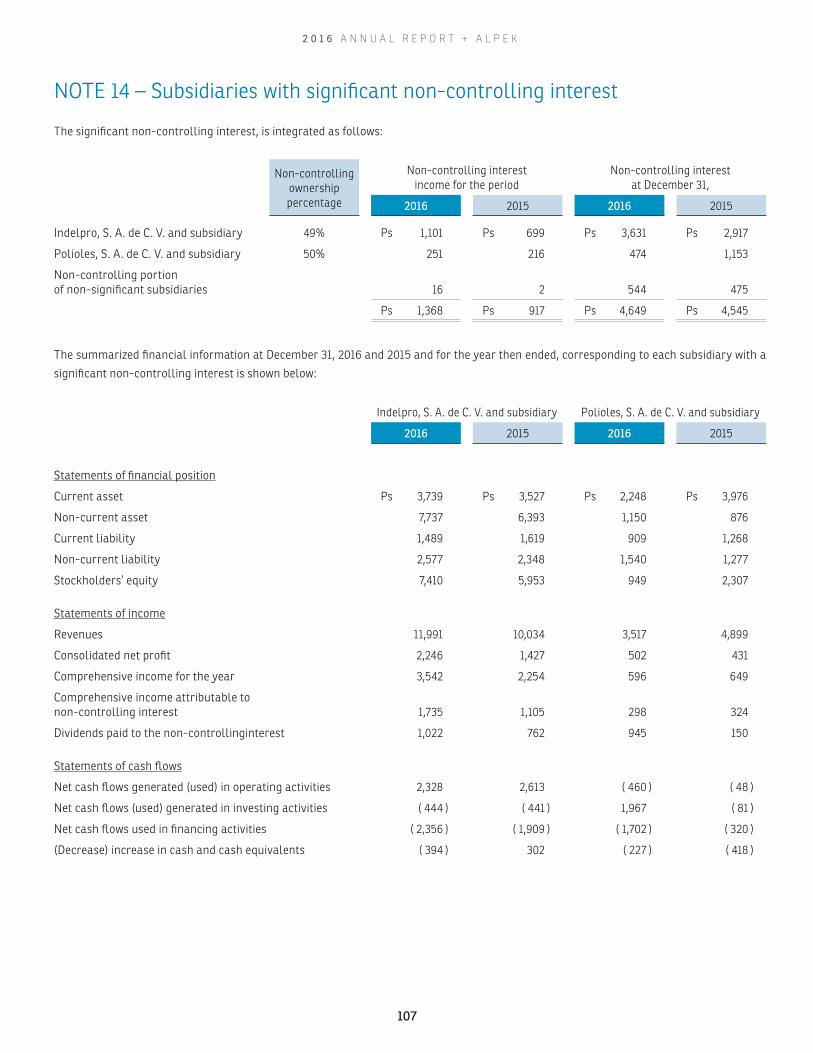
NOTE 14 – Subsidiaries with significant non-controlling interest
The significant non-controlling interest, is integrated as follows:
Non-controlling ownership percentage
Non-controlling interestincome for the period
Non-controlling interestat December 31,
2016 20152016 2015
Indelpro, S. A. de C. V. and subsidiary 49% Ps 1,101 Ps 699 Ps 3,631 Ps 2,917
Polioles, S. A. de C. V. and subsidiary 50% 251 216 474 1,153
Non-controlling portionof non-significant subsidiaries 16 2 544 475
Ps 1,368 Ps 917 Ps 4,649 Ps 4,545
The summarized financial information at December 31, 2016 and 2015 and for the year then ended, corresponding to each subsidiary with a
significant non-controlling interest is shown below:
Indelpro, S. A. de C. V. and subsidiary Polioles, S. A. de C. V. and subsidiary
2016 20152016 2015
Statements of financial position
Current asset Ps 3,739 Ps 3,527 Ps 2,248 Ps 3,976
Non-current asset 7,737 6,393 1,150 876
Current liability 1,489 1,619 909 1,268
Non-current liability 2,577 2,348 1,540 1,277
Stockholders’ equity 7,410 5,953 949 2,307
Statements of income
Revenues 11,991 10,034 3,517 4,899
Consolidated net profit 2,246 1,427 502 431
Comprehensive income for the year 3,542 2,254 596 649
Comprehensive income attributable to non-controlling interest 1,735 1,105 298 324
Dividends paid to the non-controllinginterest 1,022 762 945 150
Statements of cash flows
Net cash flows generated (used) in operating activities 2,328 2,613 ( 460 ) ( 48 )
Net cash flows (used) generated in investing activities ( 444 ) ( 441 ) 1,967 ( 81 )
Net cash flows used in financing activities ( 2,356 ) ( 1,909 ) ( 1,702 ) ( 320 )
(Decrease) increase in cash and cash equivalents ( 394 ) 302 ( 227 ) ( 418 )
2 0 1 6 A N N U A L R E P O R T + A L P E K
107
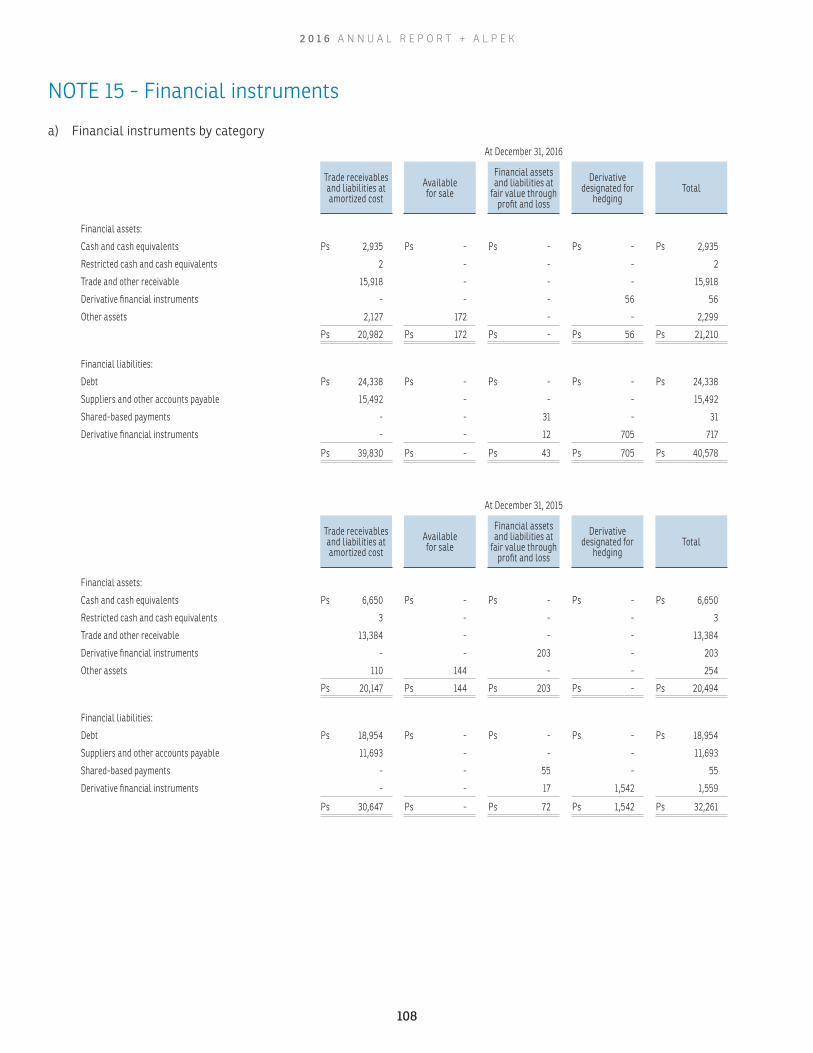
NOTE 15 - Financial instruments
a) Financial instruments by categoryAt December 31, 2016
Trade receivables and liabilities at amortized cost
Available for sale
Financial assets and liabilities at
fair value through profit and loss
Derivative designated for
hedgingTotal
Financial assets:
Cash and cash equivalents Ps 2,935 Ps - Ps - Ps - Ps 2,935
Restricted cash and cash equivalents 2 - - - 2
Trade and other receivable 15,918 - - - 15,918
Derivative financial instruments - - - 56 56
Other assets 2,127 172 - - 2,299
Ps 20,982 Ps 172 Ps - Ps 56 Ps 21,210
Financial liabilities:
Debt Ps 24,338 Ps - Ps - Ps - Ps 24,338
Suppliers and other accounts payable 15,492 - - - 15,492
Shared-based payments - - 31 - 31
Derivative financial instruments - - 12 705 717
Ps 39,830 Ps - Ps 43 Ps 705 Ps 40,578
At December 31, 2015
Trade receivables and liabilities at amortized cost
Available for sale
Financial assets and liabilities at
fair value through profit and loss
Derivative designated for
hedgingTotal
Financial assets:
Cash and cash equivalents Ps 6,650 Ps - Ps - Ps - Ps 6,650
Restricted cash and cash equivalents 3 - - - 3
Trade and other receivable 13,384 - - - 13,384
Derivative financial instruments - - 203 - 203
Other assets 110 144 - - 254
Ps 20,147 Ps 144 Ps 203 Ps - Ps 20,494
Financial liabilities:
Debt Ps 18,954 Ps - Ps - Ps - Ps 18,954
Suppliers and other accounts payable 11,693 - - - 11,693
Shared-based payments - - 55 - 55
Derivative financial instruments - - 17 1,542 1,559
Ps 30,647 Ps - Ps 72 Ps 1,542 Ps 32,261
2 0 1 6 A N N U A L R E P O R T + A L P E K
108
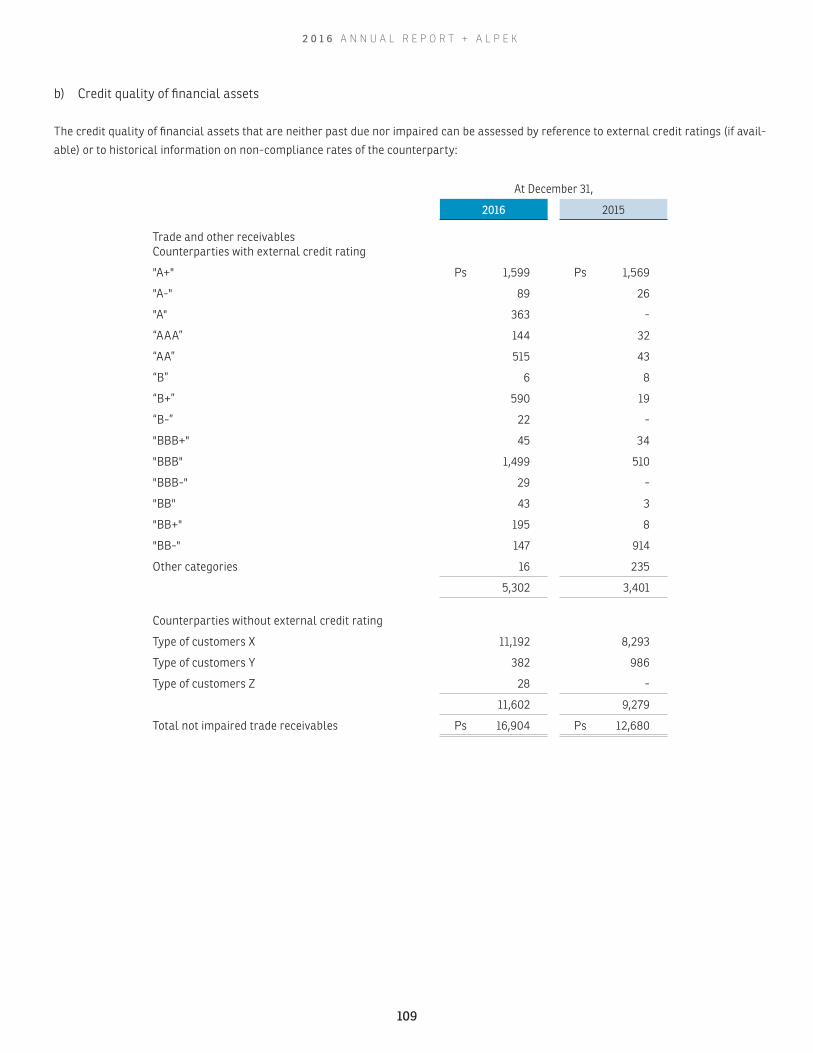
b) Credit quality of financial assets
The credit quality of financial assets that are neither past due nor impaired can be assessed by reference to external credit ratings (if avail-
able) or to historical information on non-compliance rates of the counterparty:
At December 31,
2016 2015
Trade and other receivablesCounterparties with external credit rating
"A+" Ps 1,599 Ps 1,569
"A-" 89 26
"A" 363 -
“AAA” 144 32
“AA” 515 43
“B” 6 8
“B+” 590 19
“B-” 22 -
"BBB+" 45 34
"BBB" 1,499 510
"BBB-" 29 -
"BB" 43 3
"BB+" 195 8
"BB-" 147 914
Other categories 16 235
5,302 3,401
Counterparties without external credit rating
Type of customers X 11,192 8,293
Type of customers Y 382 986
Type of customers Z 28 -
11,602 9,279
Total not impaired trade receivables Ps 16,904 Ps 12,680
2 0 1 6 A N N U A L R E P O R T + A L P E K
109
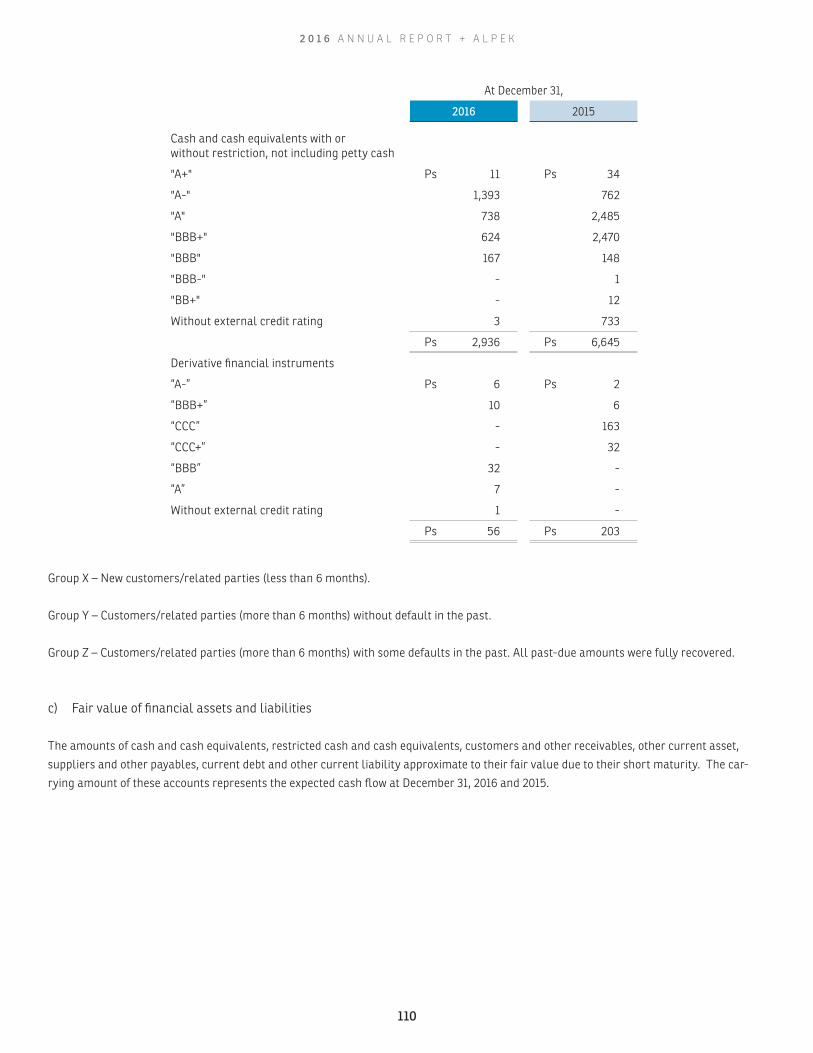
At December 31,
2016 2015
Cash and cash equivalents with or without restriction, not including petty cash
"A+" Ps 11 Ps 34
"A-" 1,393 762
"A" 738 2,485
"BBB+" 624 2,470
"BBB" 167 148
"BBB-" - 1
"BB+" - 12
Without external credit rating 3 733
Ps 2,936 Ps 6,645
Derivative financial instruments
“A-” Ps 6 Ps 2
“BBB+” 10 6
“CCC” - 163
“CCC+” - 32
“BBB” 32 -
“A” 7 -
Without external credit rating 1 -
Ps 56 Ps 203
Group X – New customers/related parties (less than 6 months).
Group Y – Customers/related parties (more than 6 months) without default in the past.
Group Z – Customers/related parties (more than 6 months) with some defaults in the past. All past-due amounts were fully recovered.
c) Fair value of financial assets and liabilities
The amounts of cash and cash equivalents, restricted cash and cash equivalents, customers and other receivables, other current asset,
suppliers and other payables, current debt and other current liability approximate to their fair value due to their short maturity. The car-
rying amount of these accounts represents the expected cash flow at December 31, 2016 and 2015.
2 0 1 6 A N N U A L R E P O R T + A L P E K
110

The carrying amount and the estimated fair value of the rest of the financial assets and liabilities are presented as follows:
At December 31, 2016 At December 31, 2015
Carrying amount
Fairvalue
Carrying amount
Fairvalue
Financial assets
Non-current receivable Ps 2,127 Ps 2,131 Ps 110 Ps 110
Financial liabilities
Non-current debt 21,551 21,946 18,276 17,965
The estimated fair values as of December 31, 2016 and 2015, were determined based on discounted cash flows using rates that reflect a sim-
ilar credit risk depending on the currency, maturity period and country where the debt was incurred. As part of the main rates used are the
interbank equilibrium interest rate (“TIIE”) for the instruments in pesos and Libor for instruments held in dollars. These fair values do not
consider the current portion of financial assets and liabilities, as the current portion approximates their fair value. This is a measure of fair
value of Level 3.
NOTE 16 - Derivative financial instruments
The effectiveness of derivative financial instruments designated as hedges is measured periodically. At December 31, 2016 and 2015 the
Company’s Management assessed the effectiveness of its hedges for accounting purposes and has concluded that they are highly effective.
Notional amounts related to derivative financial instruments reflect the contracted reference volume; however they do not reflect the
amounts at risk with respect to future cash flows. The amounts at risk are generally limited to the unrealized profit or loss from the market
valuation of such instruments, which may vary according to changes in the market value of the underlying, its volatility and the credit quality
of the counterparties.
The principal obligations which the Company is subject to depends on the type of contract and the conditions stipulated in each one of the
derivative financial instruments in force at December 31, 2016 and 2015.
Trading derivatives are classified as current assets or liabilities. The fair value of hedges is classified as a non-current asset or liability if
the maturity of the hedged item is greater than 12 months and as a current asset or liability if the maturity of the hedged item is lesser than
12 months.
2 0 1 6 A N N U A L R E P O R T + A L P E K
111

a) Exchange rate derivatives
Derivative financial instruments related to exchange rate positions with trading accounting treatment are summarized as follows:
At December 31, 2016
Type of derivative, value or contract
Notional amount
Underlying assetFair value
Maturity
Unit Reference 2017 2018 2019+
USD/MXN ( Ps 186 ) Pesos / Dollar 20.66 ( Ps 12 ) ( Ps 12 ) Ps - Ps -
( Ps 12 ) ( Ps 12 ) Ps - Ps -
At December 31, 2015
Type of derivative, value or contract
Notional amount
Underlying assetFair value
Maturity
Unit Reference 2016 2017 2018+
USD/MXN ( Ps 688 ) Pesos / Dollar 17.21 ( Ps 13 ) ( Ps 13 ) Ps - Ps -
ARS/USD 800 Ps Arg / Dollar 12.94 202 202 - -
Ps 189 Ps 189 Ps - Ps -
b) Energy
Positions of derivative financial instruments natural gas, gasoline, ethylene, ethane, paraxylene and brent crude, are summarized as fol-
lows:
At December 31, 2016
Type of derivative, value or contract
Notional amount
Underlying assetFair value
Maturity
Unit Reference 2017 2018 2019+
With hedge accounting treatment:
Ethylene 1 Ps 350 Cent Dollar/lb 25.33 Ps 20 Ps 20 Ps - Ps -
Natural gas 1 2,106 Dollar / MBTU 3.72 ( 646 ) - ( 187 ) ( 459 )
Ethane 1 3 Cent Dollar/Gallon 26.37 1 1 - -
Px 1 2,650 Dollar/MT 795 ( 24 ) ( 24 ) - -
( Ps 649 ) ( Ps 3 ) ( Ps 187 ) ( Ps 459 )
At December 31, 2015
Type of derivative, value or contract
Notional amount
Underlying assetFair value
Maturity
Unit Reference 2016 2017 2018+
With hedge accounting treatment:
Ethylene 1 Ps 809 Cent Dollar/lb 19.22 ( Ps 230 ) ( Ps 230 ) Ps - Ps -
Natural gas 1 2,923 Dollar / MBTU 2.32 ( 961 ) ( 250 ) ( 204 ) ( 507 )
Ethane 1 46 Cent Dollar/Gallon 15.05 ( 5 ) ( 5 ) - -
Px 1 3,252 Dollar/MT 772 ( 309 ) ( 309 ) - -
Gasolina 1 72 Dollar / Gallon 1.25 ( 38 ) ( 38 ) - -
With trade accounting treatment:
Brent crude 5 Dollar / BBL 38.91 ( 2 ) ( 2 ) - -
( Ps 1,545 ) ( Ps 834 ) ( Ps 204 ) ( Ps 507 )
(1) Cash flow hedges.
2 0 1 6 A N N U A L R E P O R T + A L P E K
112
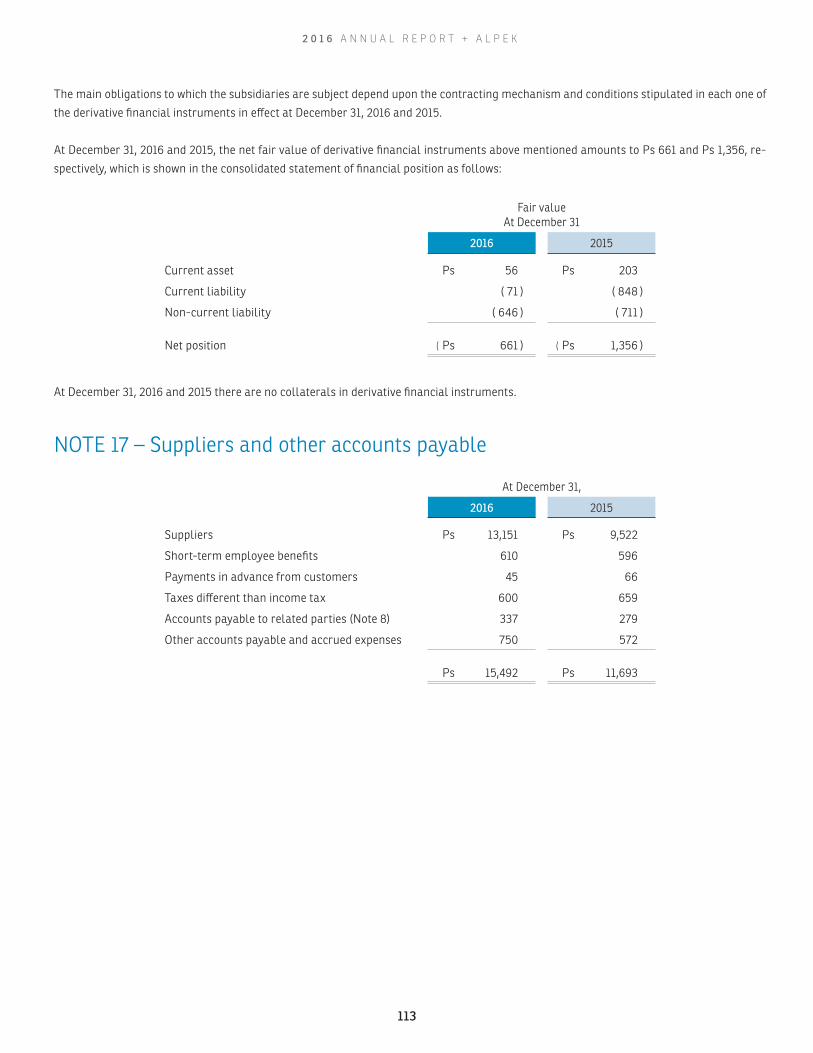
The main obligations to which the subsidiaries are subject depend upon the contracting mechanism and conditions stipulated in each one of
the derivative financial instruments in effect at December 31, 2016 and 2015.
At December 31, 2016 and 2015, the net fair value of derivative financial instruments above mentioned amounts to Ps 661 and Ps 1,356, re-
spectively, which is shown in the consolidated statement of financial position as follows:
Fair valueAt December 31
2016 2015
Current asset Ps 56 Ps 203
Current liability ( 71 ) ( 848 )
Non-current liability ( 646 ) ( 711 )
Net position ( Ps 661 ) ( Ps 1,356 )
At December 31, 2016 and 2015 there are no collaterals in derivative financial instruments.
NOTE 17 – Suppliers and other accounts payable
At December 31,
2016 2015
Suppliers Ps 13,151 Ps 9,522
Short-term employee benefits 610 596
Payments in advance from customers 45 66
Taxes different than income tax 600 659
Accounts payable to related parties (Note 8) 337 279
Other accounts payable and accrued expenses 750 572
Ps 15,492 Ps 11,693
2 0 1 6 A N N U A L R E P O R T + A L P E K
113

NOTE 18 - Provisions
Restructuring, demolition and environmental
remediation
Indemnities from dismissal
and othersOthers Total
At January 1, 2015 Ps 733 Ps 57 Ps - Ps 790
Increases - - 33 33
Payments ( 352 ) ( 29 ) ( 11 ) ( 392 )
Translation effect 90 7 ( 5 ) 92
At December 31, 2015 471 35 17 523
Increases - - - -
Payments ( 210 ) ( 10 ) ( 6 ) ( 226 )
Translation effect 69 5 ( 1 ) 73
At December 31, 2016 Ps 330 Ps 30 Ps 10 Ps 370
2016 2015
Short-term provisions Ps 363 Ps 338
Long-term provisions 7 185
At December 31 Ps 370 Ps 523
The provisions shown in the above table are mainly related to the closure of the plant in Cape Fear located in Wilmington, North Carolina
carried out in June 2013. The purpose of this closure was to improve cost competitive, through distributing production to the most efficient
plants in its productive network.
During 2016, the Company continued the works of dismantling and demolition of the plant in Cape Fear, as was originally announced
during 2013. At December 31, 2016, the balance of this provision amounts to Ps 360 (US$17), which is in line with the initial estimate made
by the Management will be disbursed over 2017 according to the plan of dismantling and demolition of the plant.
2 0 1 6 A N N U A L R E P O R T + A L P E K
114
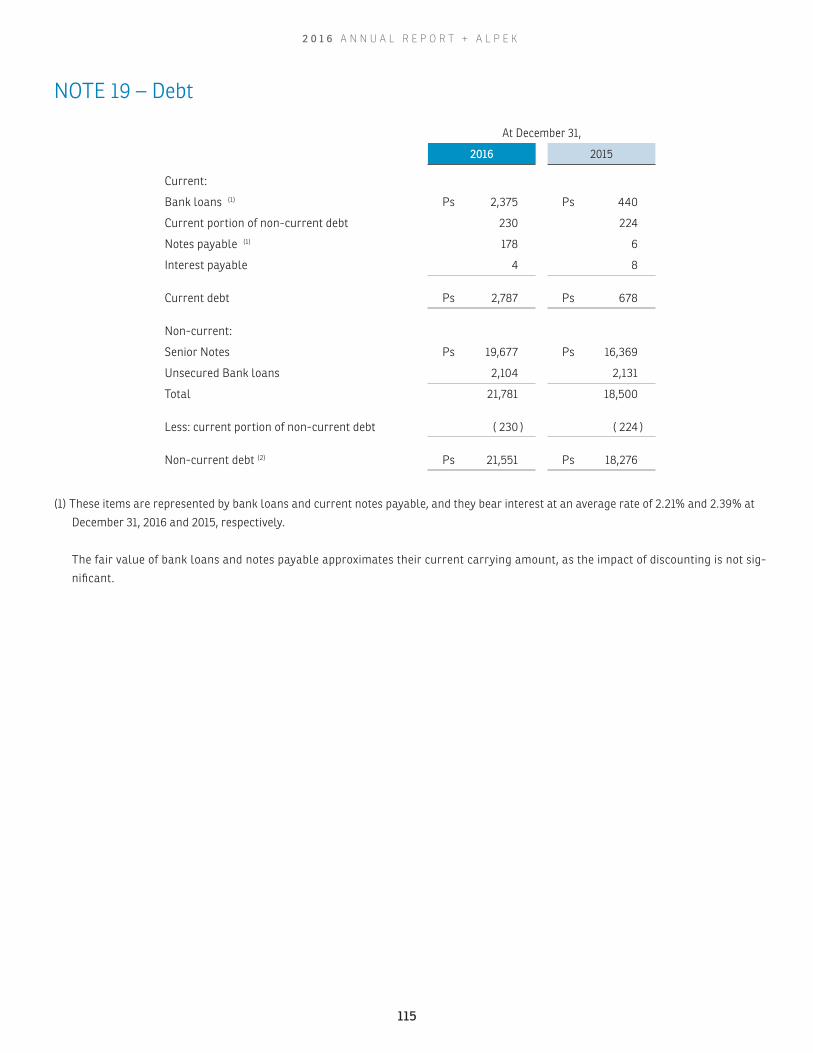
NOTE 19 – Debt
At December 31,
2016 2015
Current:
Bank loans (1) Ps 2,375 Ps 440
Current portion of non-current debt 230 224
Notes payable (1) 178 6
Interest payable 4 8
Current debt Ps 2,787 Ps 678
Non-current:
Senior Notes Ps 19,677 Ps 16,369
Unsecured Bank loans 2,104 2,131
Total 21,781 18,500
Less: current portion of non-current debt ( 230 ) ( 224 )
Non-current debt (2) Ps 21,551 Ps 18,276
(1) These items are represented by bank loans and current notes payable, and they bear interest at an average rate of 2.21% and 2.39% at
December 31, 2016 and 2015, respectively.
The fair value of bank loans and notes payable approximates their current carrying amount, as the impact of discounting is not sig-
nificant.
2 0 1 6 A N N U A L R E P O R T + A L P E K
115
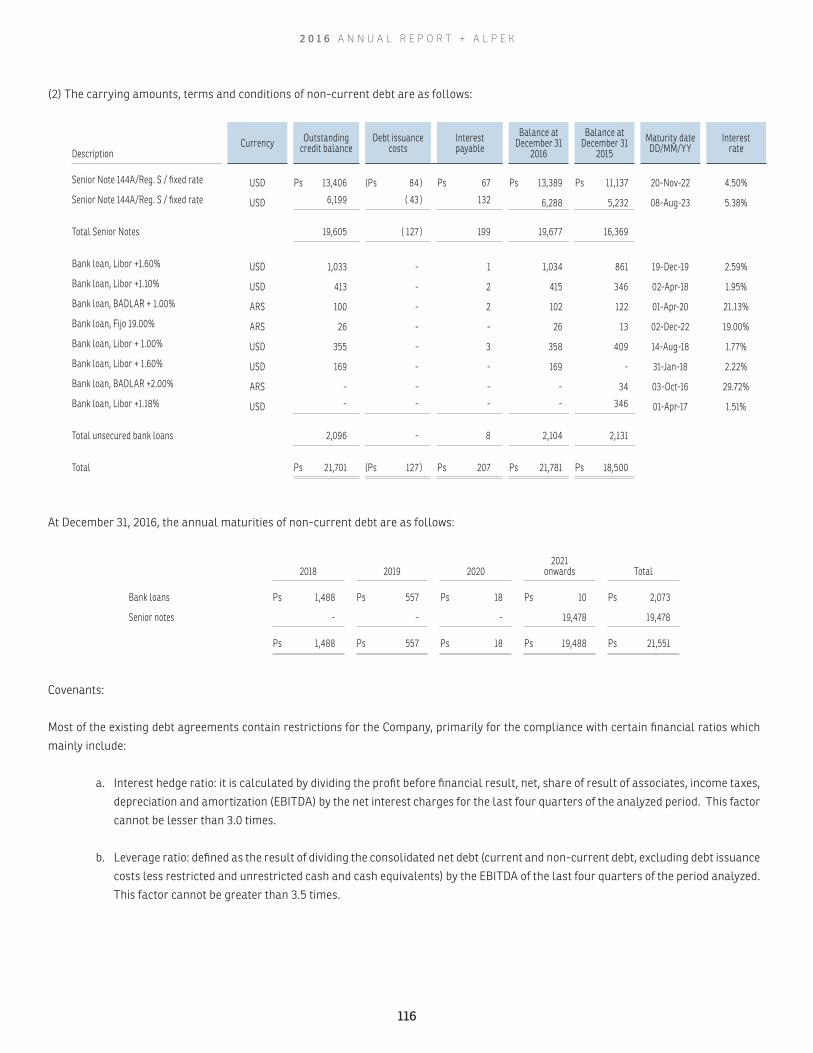
(2) The carrying amounts, terms and conditions of non-current debt are as follows:
DescriptionCurrency Outstanding
credit balanceDebt issuance
costsInterest payable
Balance at December 31
2016
Balance at December 31
2015Maturity date DD/MM/YY
Interestrate
Senior Note 144A/Reg. S / fixed rate USD Ps 13,406 ( Ps 84 ) Ps 67 Ps 13,389 Ps 11,137 20-Nov-22 4.50%
Senior Note 144A/Reg. S / fixed rate USD 6,199 ( 43 ) 132 6,288 5,232 08-Aug-23 5.38%
Total Senior Notes 19,605 ( 127 ) 199 19,677 16,369
Bank loan, Libor +1.60% USD 1,033 - 1 1,034 861 19-Dec-19 2.59%
Bank loan, Libor +1.10% USD 413 - 2 415 346 02-Apr-18 1.95%
Bank loan, BADLAR + 1.00% ARS 100 - 2 102 122 01-Apr-20 21.13%
Bank loan, Fijo 19.00% ARS 26 - - 26 13 02-Dec-22 19.00%
Bank loan, Libor + 1.00% USD 355 - 3 358 409 14-Aug-18 1.77%
Bank loan, Libor + 1.60% USD 169 - - 169 - 31-Jan-18 2.22%
Bank loan, BADLAR +2.00% ARS - - - - 34 03-Oct-16 29.72%
Bank loan, Libor +1.18% USD - - - - 346 01-Apr-17 1.51%
Total unsecured bank loans 2,096 - 8 2,104 2,131
Total Ps 21,701 ( Ps 127 ) Ps 207 Ps 21,781 Ps 18,500
At December 31, 2016, the annual maturities of non-current debt are as follows:
2018 2019 20202021
onwards Total
Bank loans Ps 1,488 Ps 557 Ps 18 Ps 10 Ps 2,073
Senior notes - - - 19,478 19,478
Ps 1,488 Ps 557 Ps 18 Ps 19,488 Ps 21,551
Covenants:
Most of the existing debt agreements contain restrictions for the Company, primarily for the compliance with certain financial ratios which
mainly include:
a. Interest hedge ratio: it is calculated by dividing the profit before financial result, net, share of result of associates, income taxes,
depreciation and amortization (EBITDA) by the net interest charges for the last four quarters of the analyzed period. This factor
cannot be lesser than 3.0 times.
b. Leverage ratio: defined as the result of dividing the consolidated net debt (current and non-current debt, excluding debt issuance
costs less restricted and unrestricted cash and cash equivalents) by the EBITDA of the last four quarters of the period analyzed.
This factor cannot be greater than 3.5 times.
2 0 1 6 A N N U A L R E P O R T + A L P E K
116

Additionally, there are other restrictions regarding incurring additional debt or taking loans that require mortgaging assets, dividend pay-
ments and submission of financial information, which if not met or remedied within a specified period to the satisfaction of creditors may
cause the debt to become payable immediately. During 2016 and 2015, the financial ratios were calculated according to the formulas set
out in the loan agreements. At December 31, 2016 and the date of issuance of these financial statements, the Company and its subsidiaries
complied satisfactorily with such covenants and restrictions.
During the years ended December 31 2016 and 2015, there were not significant debt transactions, the main increase is generated due to the
exchange rate of the debt held in US dollars. The amounts shown in the Consolidated Statements of Cash Flows correspond to credit lines
utilized and paid during the year.
NOTE 20 - Employee benefits
The valuation of retirement plan employee benefits includes formal plans and constructive obligations that covers all employees and is
based primarily on their years of service, current age and estimated salary at retirement date.
The principal subsidiaries of the Company have established irrevocable trust funds for payment of pensions and seniority premiums and
health-care expenses. The contributions in 2016 amounted to Ps 33 (Ps 62 in 2015).
Following is a summary of the main financial information of such employee benefits:
At December 31,
2016 2015
Liability for employees’ benefits:
Pension benefits Ps 940 Ps 858
Post-employment medical benefits 177 168
1,117 1,026
Defined contribution liability 110 82
Employees’ benefits in the consolidated statement of financial position Ps 1,227 Ps 1,108
Charge to the consolidated income statement for:
Pension benefits ( Ps 56 ) ( Ps 61 )
Post-employment medical benefits ( 8 ) ( 7 )
( 64 ) ( 68 )
Remeasurement of obligations for employees’ benefits recognized in the statement of comprehensive income for the year Ps 100 ( Ps 3 )
Remeasurement of accumulated obligations for employees benefits ( Ps 131 ) ( Ps 231 )
2 0 1 6 A N N U A L R E P O R T + A L P E K
117
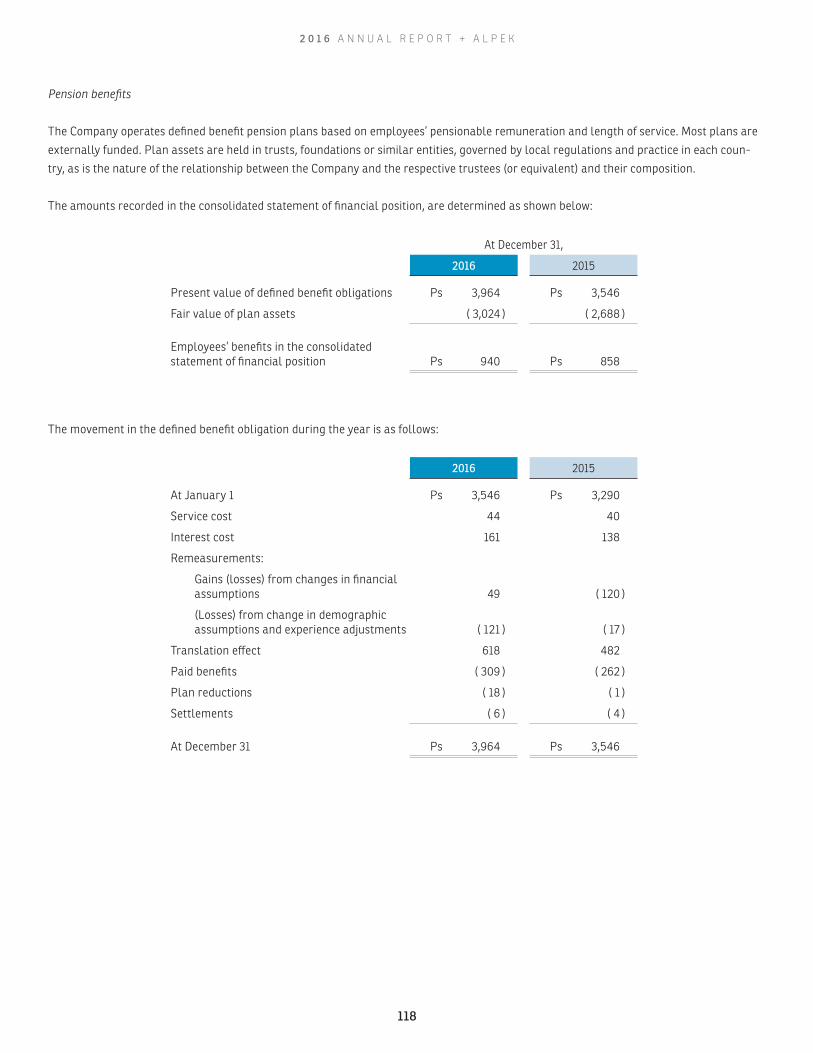
Pension benefits
The Company operates defined benefit pension plans based on employees’ pensionable remuneration and length of service. Most plans are
externally funded. Plan assets are held in trusts, foundations or similar entities, governed by local regulations and practice in each coun-
try, as is the nature of the relationship between the Company and the respective trustees (or equivalent) and their composition.
The amounts recorded in the consolidated statement of financial position, are determined as shown below:
At December 31,
2016 2015
Present value of defined benefit obligations Ps 3,964 Ps 3,546
Fair value of plan assets ( 3,024 ) ( 2,688 )
Employees’ benefits in the consolidated statement of financial position Ps 940 Ps 858
The movement in the defined benefit obligation during the year is as follows:
2016 2015
At January 1 Ps 3,546 Ps 3,290
Service cost 44 40
Interest cost 161 138
Remeasurements:
Gains (losses) from changes in financial assumptions 49 ( 120 )
(Losses) from change in demographic assumptions and experience adjustments ( 121 ) ( 17 )
Translation effect 618 482
Paid benefits ( 309 ) ( 262 )
Plan reductions ( 18 ) ( 1 )
Settlements ( 6 ) ( 4 )
At December 31 Ps 3,964 Ps 3,546
2 0 1 6 A N N U A L R E P O R T + A L P E K
118
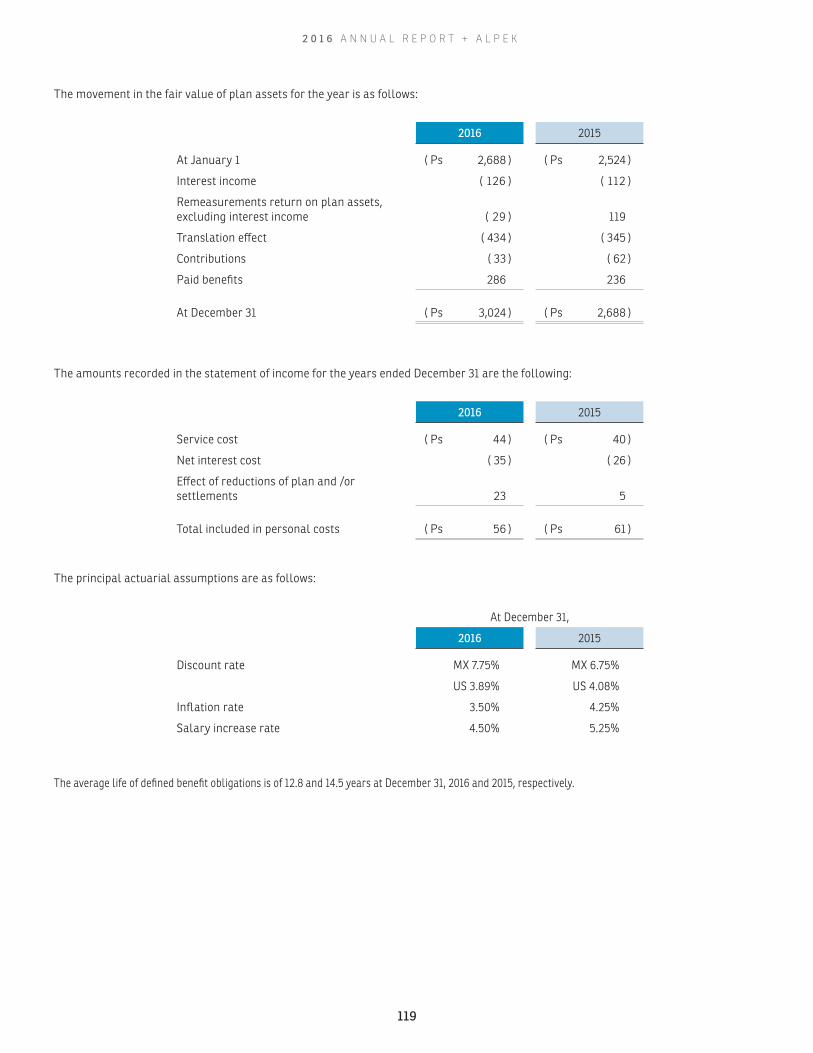
The movement in the fair value of plan assets for the year is as follows:
2016 2015
At January 1 ( Ps 2,688 ) ( Ps 2,524 )
Interest income ( 126 ) ( 112 )
Remeasurements return on plan assets,excluding interest income ( 29 ) 119
Translation effect ( 434 ) ( 345 )
Contributions ( 33 ) ( 62 )
Paid benefits 286 236
At December 31 ( Ps 3,024 ) ( Ps 2,688 )
The amounts recorded in the statement of income for the years ended December 31 are the following:
2016 2015
Service cost ( Ps 44 ) ( Ps 40 )
Net interest cost ( 35 ) ( 26 )
Effect of reductions of plan and /or settlements 23 5
Total included in personal costs ( Ps 56 ) ( Ps 61 )
The principal actuarial assumptions are as follows:
At December 31,
2016 2015
Discount rate MX 7.75% MX 6.75%
US 3.89% US 4.08%
Inflation rate 3.50% 4.25%
Salary increase rate 4.50% 5.25%
The average life of defined benefit obligations is of 12.8 and 14.5 years at December 31, 2016 and 2015, respectively.
2 0 1 6 A N N U A L R E P O R T + A L P E K
119

The sensitivity analysis of the main assumptions for defined benefit obligations is as follows:
Effect in defined benefit obligations
Change in assumption
Increase in assumption
Decrease in assumption
Discount rate Mx 1% Decreases by Ps 19 Increases by Ps 22
Discount rate US 1% Decreases by Ps 366 Increases by Ps 441
Prior sensibility analyses are based on a change in assumptions, while the all other assumptions remain constant. In practice, this is slightly
probable, and the changes in some assumptions may be correlated. In the calculation of the sensibility from the defined benefit obligation,
significant actuarial assumptions the same method (present value of calculated defined benefit obligation with the projected unit credit
method at reporting period) has been applied as in the calculation of liabilities for pensions recognized within the consolidated statement of
financial position.
Post-employment medical benefits
The Company has post-employment medical benefits schemes mainly in DAK Americas. The method of accounting, assumptions and the
frequency of valuations are similar to those used for defined benefit pension schemes. Most of these plans are not being funded.
In addition to the assumptions above mentioned, the main actuarial assumption it is a long-term increase in health costs by 8.0% in 2016
and 6.7% in 2015.
Amounts recognized in the statement of financial position are determined as follows:
At December 31,
2016 2015
Present value of defined benefit obligations Ps 177 Ps 168
Fair value of plan assets - -
Employees’ benefits in the consolidated statement of financial position Ps 177 Ps 168
2 0 1 6 A N N U A L R E P O R T + A L P E K
120

The movements of defined benefit obligations are as follows:
2016 2015
At January 1 Ps 168 Ps 154
Service cost 2 2
Interest cost 6 5
Employee contributions 18 16
Remeasurements:
Gain from changes in financial assumptions - ( 5 )
Gains from changes in demographic assumptions
and experience adjustments 1 25
Translation effect 32 24
Plan reductions - -
Paid benefits ( 50 ) ( 53 )
At December 31 Ps 177 Ps 168
The amounts recorded in the consolidated statement of income for the years ended December 31 are the following:
2016 2015
Service cost ( Ps 2 ) ( Ps 2 )
Net interest cost ( 6 ) ( 5 )
Effect of reductions on plan and/or settlements - -
Total included in personal costs ( Ps 8 ) ( Ps 7 )
At December 31, 2016, the effect of a 1% fluctuation in the incremental rate of medical expenses is as follows:
Rate
Increase Decrease
Effect in defined benefit obligation 13 ( 11 )
Employee benefits
Plan assets are comprised as follows:
At December 31,
2016 2015
Investment funds (listed) Ps 1,962 Ps 1,738
Cash and cash equivalents 1,062 949
2 0 1 6 A N N U A L R E P O R T + A L P E K
121
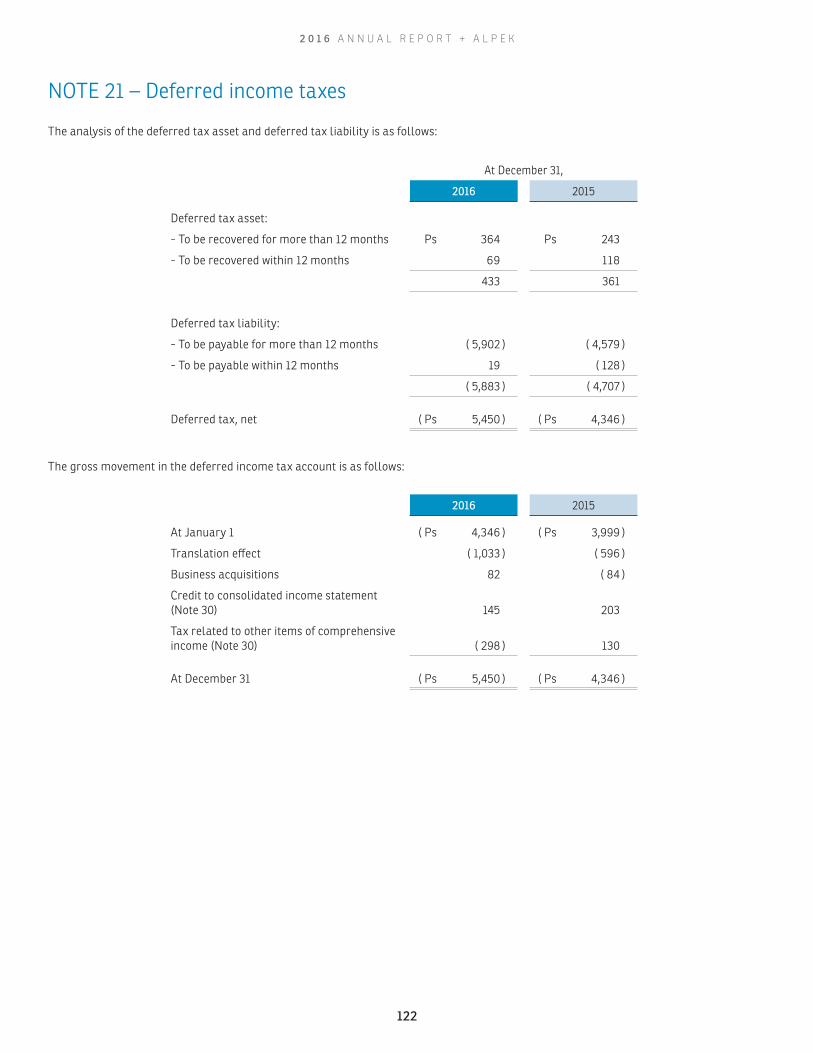
NOTE 21 – Deferred income taxes
The analysis of the deferred tax asset and deferred tax liability is as follows:
At December 31,
2016 2015
Deferred tax asset:
- To be recovered for more than 12 months Ps 364 Ps 243
- To be recovered within 12 months 69 118
433 361
Deferred tax liability:
- To be payable for more than 12 months ( 5,902 ) ( 4,579 )
- To be payable within 12 months 19 ( 128 )
( 5,883 ) ( 4,707 )
Deferred tax, net ( Ps 5,450 ) ( Ps 4,346 )
The gross movement in the deferred income tax account is as follows:
2016 2015
At January 1 ( Ps 4,346 ) ( Ps 3,999 )
Translation effect ( 1,033 ) ( 596 )
Business acquisitions 82 ( 84 )
Credit to consolidated income statement (Note 30) 145 203
Tax related to other items of comprehensive income (Note 30) ( 298 ) 130
At December 31 ( Ps 5,450 ) ( Ps 4,346 )
2 0 1 6 A N N U A L R E P O R T + A L P E K
122

The change of the temporary differences that requires deferred income tax recognition for the year ended December 31, as follows:
2016 2015
Provisions Ps 139 Ps 262
Derivative financial instruments 124 4
Tax loss carryforwards 1,798 1,500
Total deferred tax asset 2,061 1,766
Inventories ( Ps 66 ) ( Ps 53 )
Property, plant and equipment, net ( 6,328 ) ( 5,464 )
Intangible assets, net ( 442 ) ( 289 )
Other temporary differences, net ( 675 ) ( 306 )
Total deferred tax liability ( 7,511 ) ( 6,112 )
Net deferred tax liability ( Ps 5,450 ) ( Ps 4,346 )
At December 31, 2016, the Company has accumulated tax loss carryforwards for a total of Ps 5,993 expiring as shown below:
Loss incurredin the year
Amortizable tax loss carryforwards
Maturity date
2007 Ps 187 2017
2008 138 2018
2009 162 2019
2010 162 2020
2011 595 2021
2012 194 2022
2013 52 2023
2014 838 2024
2015 2,773 2025
2016 892 Subsequent
Ps 5,993
2 0 1 6 A N N U A L R E P O R T + A L P E K
123

NOTE 22 - Income tax payable
Due to the elimination of the tax consolidation regime in Mexico, the Company decided to incorporate itself into the new optional Regime for
Groups of Companies beginning in 2014. This regime consists of grouping companies with specific characteristics, which have the possibility
of deferring part of the tax on earnings payable in three years. The deferment percentage is calculated by using a factor determined in ac-
cordance with the amount of taxable income and tax loss in the year.
Income tax payable is summarized as follows:
At December 31,
2016 2015
Current portion Ps 694 Ps 1,371
Non-current portion 553 28
Total income tax payable Ps 1,247 Ps 1,399
NOTE 23 - Other liabilities
At December 31,
2016 2015
Deferred income (1) Ps 500 Ps 452
Other 4 -
Total other liabilities Ps 504 Ps 452
(1) This item corresponds to revenues charged in advance and relates to the future delivery of goods.
NOTE 24 - Stockholders’ equity
At December 31, 2016, the capital stock is variable, with a fixed minimum of Ps 6,048 represented by 2,118,163,635 ordinary, nominative
shares, “Class I” Series “A”, with no par value, fully subscribed and paid in. The variable capital entitled to withdrawal will be represented, if
issued, by registered “Class II” Series “A” shares without par value.
During 2016, the Company repurchased 1,526,384 shares in the amount of Ps 46, in connection with a repurchase program that was approved
by the Company’s stockholders and exercised discretionally by Management. At December 31, 2016, the Company holds 1,526,384 treasury
shares, and the market value of the share was Ps 24.77 pesos.
The net income of the year is subject to decisions made by the General Stockholders’ Meeting, the Company’s by-laws and the General Law of
Mercantile Corporations. In accordance with the General Law of Mercantile Corporations, the legal reserve should be increased annually by
5% of the net annual income until it reaches 20% of the fully paid in capital stock. At December 31, 2016 and 2015, the legal reserve amounts
to Ps 514 and Ps 377, respectively.
2 0 1 6 A N N U A L R E P O R T + A L P E K
124
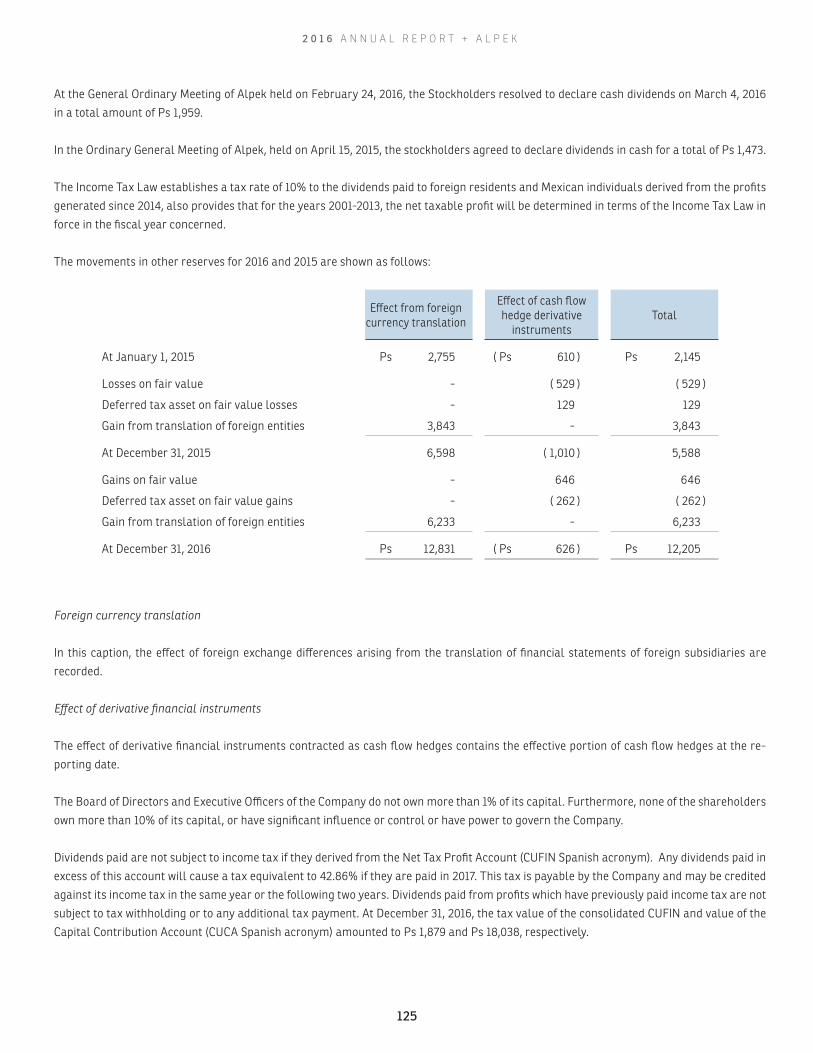
At the General Ordinary Meeting of Alpek held on February 24, 2016, the Stockholders resolved to declare cash dividends on March 4, 2016
in a total amount of Ps 1,959.
In the Ordinary General Meeting of Alpek, held on April 15, 2015, the stockholders agreed to declare dividends in cash for a total of Ps 1,473.
The Income Tax Law establishes a tax rate of 10% to the dividends paid to foreign residents and Mexican individuals derived from the profits
generated since 2014, also provides that for the years 2001-2013, the net taxable profit will be determined in terms of the Income Tax Law in
force in the fiscal year concerned.
The movements in other reserves for 2016 and 2015 are shown as follows:
Effect from foreign currency translation
Effect of cash flow hedge derivative
instrumentsTotal
At January 1, 2015 Ps 2,755 ( Ps 610 ) Ps 2,145
Losses on fair value - ( 529 ) ( 529 )
Deferred tax asset on fair value losses - 129 129
Gain from translation of foreign entities 3,843 - 3,843
At December 31, 2015 6,598 ( 1,010 ) 5,588
Gains on fair value - 646 646
Deferred tax asset on fair value gains - ( 262 ) ( 262 )
Gain from translation of foreign entities 6,233 - 6,233
At December 31, 2016 Ps 12,831 ( Ps 626 ) Ps 12,205
Foreign currency translation
In this caption, the effect of foreign exchange differences arising from the translation of financial statements of foreign subsidiaries are
recorded.
Effect of derivative financial instruments
The effect of derivative financial instruments contracted as cash flow hedges contains the effective portion of cash flow hedges at the re-
porting date.
The Board of Directors and Executive Officers of the Company do not own more than 1% of its capital. Furthermore, none of the shareholders
own more than 10% of its capital, or have significant influence or control or have power to govern the Company.
Dividends paid are not subject to income tax if they derived from the Net Tax Profit Account (CUFIN Spanish acronym). Any dividends paid in
excess of this account will cause a tax equivalent to 42.86% if they are paid in 2017. This tax is payable by the Company and may be credited
against its income tax in the same year or the following two years. Dividends paid from profits which have previously paid income tax are not
subject to tax withholding or to any additional tax payment. At December 31, 2016, the tax value of the consolidated CUFIN and value of the
Capital Contribution Account (CUCA Spanish acronym) amounted to Ps 1,879 and Ps 18,038, respectively.
2 0 1 6 A N N U A L R E P O R T + A L P E K
125

NOTE 25 - Shared-based payments
Alpek has a stock based compensation scheme referred to at 50% of the value of stock of its holding company and the other 50% of the value
of shares of Alpek, S. A. B. de C. V. for directors of the Company and its subsidiaries. In accordance with the terms of the plan, the eligible
directors will obtain a cash payment contingent upon achieving both quantitative and qualitative metrics derived from the following financial
measures:
• Improved share price
• Improvement in net income
• Permanence of the executives in the Company
The program consists in determining a number of shares which the executives will have a right to, that will be paid in cash over the next five
years; i.e., 20% every year and will be paid at the average price of the share at the end of each year.
The average price of the shares in pesos used as reference is:
2016 2015
Alfa, S. A. B. de C. V. Ps 26.73 Ps 34.30
Alpek, S. A. B. de C. V. 26.10 23.48
The short-term and long-term liabilities are comprised as follows:
At December 31,
2016 2015
Short-term Ps 10 Ps 18
Long-term 21 37
Total carrying amount Ps 31 Ps 55
2 0 1 6 A N N U A L R E P O R T + A L P E K
126

NOTE 26 - Expenses classified by their nature
The total cost of sales and selling and administrative expenses, classified by the nature of the expense, are comprised as follows:
2016 2015
Raw materials and others ( Ps 60,305 ) ( Ps 58,782 )
Employee benefit expenses (Note 29) ( 4,227 ) ( 3,799 )
Human resource expenses ( 54 ) ( 76 )
Maintenance ( 1,411 ) ( 1,093 )
Depreciation and amortization ( 2,560 ) ( 2,254 )
Advertising expenses ( 3 ) ( 2 )
Freight charges ( 4,325 ) ( 3,865 )
Energy consumption and fuel (gas, electricity, etc.) ( 3,514 ) ( 2,885 )
Travel expenses ( 170 ) ( 132 )
Operating lease expenses ( 775 ) ( 639 )
Technical assistance, professional fees and administrative services ( 937 ) ( 1,042 )
Others (insurance and finance, water, containers and packaging, etc.) ( 2,283 ) ( 1,676 )
Total ( Ps 80,564 ) ( Ps 76,245 )
NOTE 27 - Other income (expenses), net
Other income (expenses) for the years ended December 31, are comprised as follows:
2016 2015
Gain on sale of wastes Ps 3 Ps 9
Gain on sale of property, plant and equipment 1 382
Impairment of property, plant and equipment ( 2 ) ( 130 )
Valuation of derivative financial instruments - ( 6 )
Expenses related to acquisition projects ( 5 ) -
Gain on business acquisition 36 -
Income from a loss recovery (1) 112 -
Other income 90 -
Other expense - ( 10 )
Total Ps 235 Ps 245
(1) This item represents the recovery of a plant insurance of DAK Argentina.
2 0 1 6 A N N U A L R E P O R T + A L P E K
127

NOTE 28 - Finance income and costs
Finance cost, net for the years ended December 31, are comprised as follows:
2016 2015
Finance income:
Interest income on short-term bank deposits Ps 150 Ps 188
Interest income on loans from related parties 44 42
Other finance income 87 15
Foreign exchange gains 3,280 2,367
Gains for changes in the fair value of financialassets at fair value through profit or loss 4 183
Total finance income Ps 3,565 Ps 2,795
Finance costs:
Interest expense on loans from related parties ( Ps 1 ) Ps -
Interest expense on bank loans ( 143 ) ( 128 )
Non-bank interest expense ( 926 ) ( 787 )
Interest cost on employees benefits, net ( 44 ) ( 31 )
Other finance expenses (factoring and others) ( 300 ) ( 230 )
Foreign exchange loss ( 4,660 ) ( 3,481 )
Total finance costs ( Ps 6,074 ) ( Ps 4,657 )
Finance cost, net ( Ps 2,509 ) ( Ps 1,862 )
NOTE 29 - Employee benefit expenses
Employee benefits expenses for the years ended December 31, are integrated as follows:
2016 2015
Salaries, wages and benefits ( Ps 3,102 ) ( Ps 2,854 )
Social security contributions ( 304 ) ( 262 )
Employee benefits (Note 20) ( 22 ) ( 37 )
Other contributions ( 799 ) ( 646 )
Total ( Ps 4,227 ) ( Ps 3,799 )
2 0 1 6 A N N U A L R E P O R T + A L P E K
128
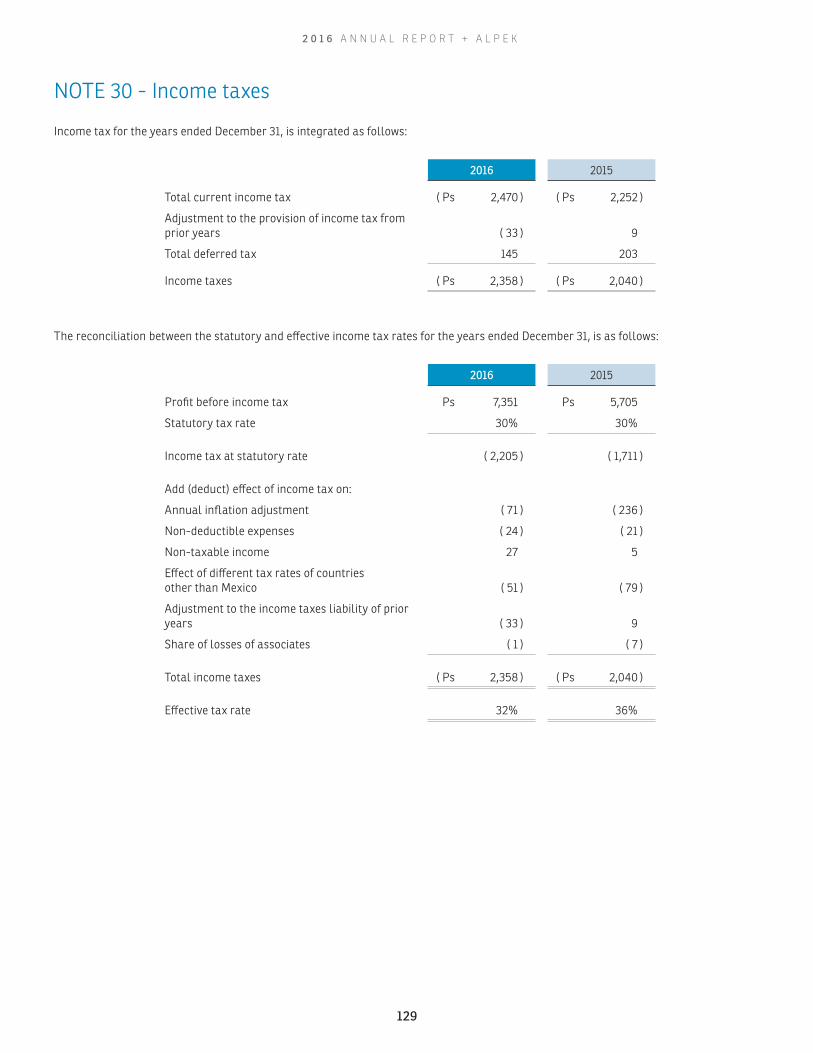
NOTE 30 - Income taxes
Income tax for the years ended December 31, is integrated as follows:
2016 2015
Total current income tax ( Ps 2,470 ) ( Ps 2,252 )
Adjustment to the provision of income tax from prior years ( 33 ) 9
Total deferred tax 145 203
Income taxes ( Ps 2,358 ) ( Ps 2,040 )
The reconciliation between the statutory and effective income tax rates for the years ended December 31, is as follows:
2016 2015
Profit before income tax Ps 7,351 Ps 5,705
Statutory tax rate 30% 30%
Income tax at statutory rate ( 2,205 ) ( 1,711 )
Add (deduct) effect of income tax on:
Annual inflation adjustment ( 71 ) ( 236 )
Non-deductible expenses ( 24 ) ( 21 )
Non-taxable income 27 5
Effect of different tax rates of countries other than Mexico ( 51 ) ( 79 )
Adjustment to the income taxes liability of prior years ( 33 ) 9
Share of losses of associates ( 1 ) ( 7 )
Total income taxes ( Ps 2,358 ) ( Ps 2,040 )
Effective tax rate 32% 36%
2 0 1 6 A N N U A L R E P O R T + A L P E K
129

The charge (credit) to income tax related to other items of the comprehensive income for the years ending December 31, are as follows:
2016 2015
Before taxes Tax charge(credit) After taxes Before taxes Tax charge
(credit) After taxes
Translation effect of foreign currency Ps 6,233 Ps - Ps 6,233 Ps 3,843 Ps - Ps 3,843
Remeasurement of obligations for employee benefits 100 ( 36 ) 64 ( 3 ) - ( 3 )
Effect of derivative financial instrumentsfor hedging purposes of cash flow 646 ( 262 ) 384 ( 530 ) 130 ( 400 )
Share of other comprehensive results of associates ( 2 ) - ( 2 ) - - -
Other comprehensive income items Ps 6,977 ( Ps 298 ) Ps 6,679 Ps 3,310 Ps 130 Ps 3,440
Deferred tax ( Ps 298 ) Ps 130
NOTE 31 - Segment reporting
Segment reporting is presented, consistently with the internal report provided to the Chief Operating Officer, who has been identified as the
Company’s Executive Director, and represents the highest authority in operational decision making, allocation of resources and performance
assessment of operating segments.
An operating segment is defined as a component of an entity on which separate financial information is regularly being evaluated.
Management controls and assesses its operations through two business segments: the Polyester business chain and the Plastics and Chem-
icals business. These segments are managed separately since its products vary and targeted markets are different. Their activities are
performed through various subsidiaries.
The operations between operating segments are performed at market value and the accounting policies with which the financial information
by segments is prepared, are consistent with those described in Note 3.
The Company has defined the Adjusted EBITDA as the calculation of adding operating income, depreciation, amortization, and noncurrent
asset impairment.
The Company evaluates the performance of each of the operating segments based on Adjusted EBITDA, considering that this indicator is a
good metric to evaluate operating performance and the ability to meet principal and interest obligations with respect to indebtedness, and
the ability to fund capital expenditures and working capital requirements. Nevertheless, Adjusted EBITDA is not a measure of financial per-
formance under IFRS and should not be considered as an alternative to net income as a measure of operating performance or cash flows as
a measure of liquidity.
2 0 1 6 A N N U A L R E P O R T + A L P E K
130
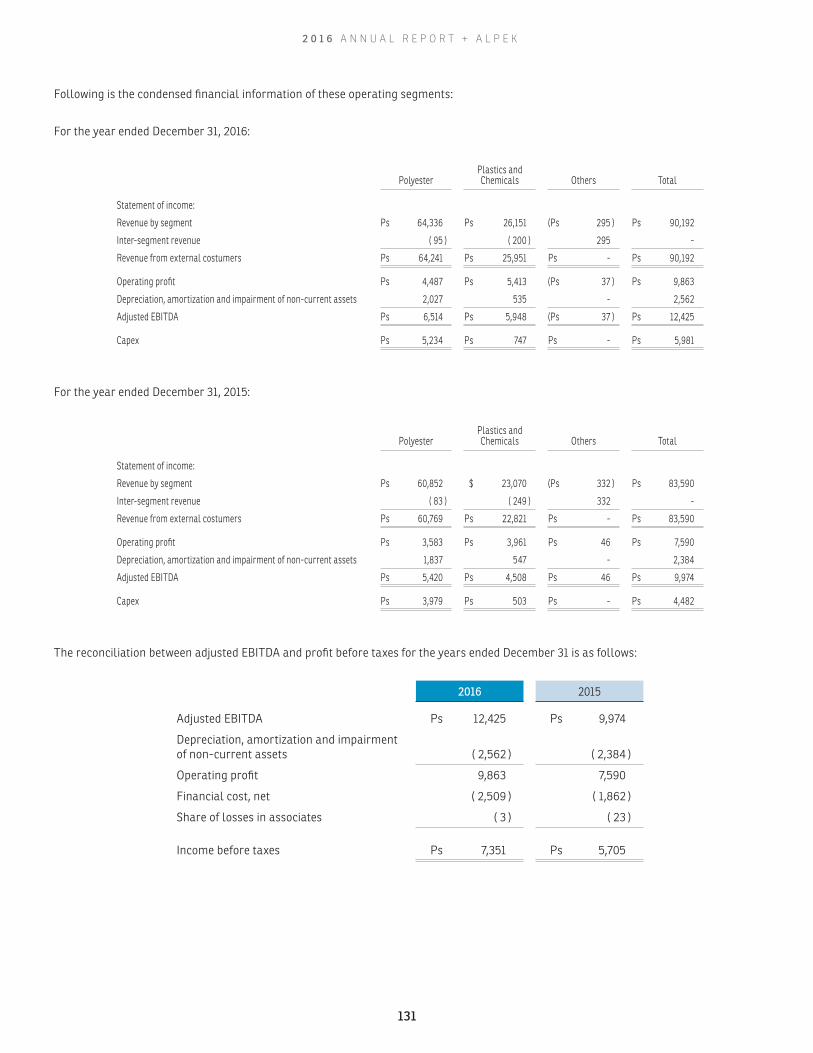
Following is the condensed financial information of these operating segments:
For the year ended December 31, 2016:
PolyesterPlastics and Chemicals Others Total
Statement of income:
Revenue by segment Ps 64,336 Ps 26,151 ( Ps 295 ) Ps 90,192
Inter-segment revenue ( 95 ) ( 200 ) 295 -
Revenue from external costumers Ps 64,241 Ps 25,951 Ps - Ps 90,192
Operating profit Ps 4,487 Ps 5,413 ( Ps 37 ) Ps 9,863
Depreciation, amortization and impairment of non-current assets 2,027 535 - 2,562
Adjusted EBITDA Ps 6,514 Ps 5,948 ( Ps 37 ) Ps 12,425
Capex Ps 5,234 Ps 747 Ps - Ps 5,981
For the year ended December 31, 2015:
PolyesterPlastics and Chemicals Others Total
Statement of income:
Revenue by segment Ps 60,852 $ 23,070 ( Ps 332 ) Ps 83,590
Inter-segment revenue ( 83 ) ( 249 ) 332 -
Revenue from external costumers Ps 60,769 Ps 22,821 Ps - Ps 83,590
Operating profit Ps 3,583 Ps 3,961 Ps 46 Ps 7,590
Depreciation, amortization and impairment of non-current assets 1,837 547 - 2,384
Adjusted EBITDA Ps 5,420 Ps 4,508 Ps 46 Ps 9,974
Capex Ps 3,979 Ps 503 Ps - Ps 4,482
The reconciliation between adjusted EBITDA and profit before taxes for the years ended December 31 is as follows:
2016 2015
Adjusted EBITDA Ps 12,425 Ps 9,974
Depreciation, amortization and impairment of non-current assets ( 2,562 ) ( 2,384 )
Operating profit 9,863 7,590
Financial cost, net ( 2,509 ) ( 1,862 )
Share of losses in associates ( 3 ) ( 23 )
Income before taxes Ps 7,351 Ps 5,705
2 0 1 6 A N N U A L R E P O R T + A L P E K
131
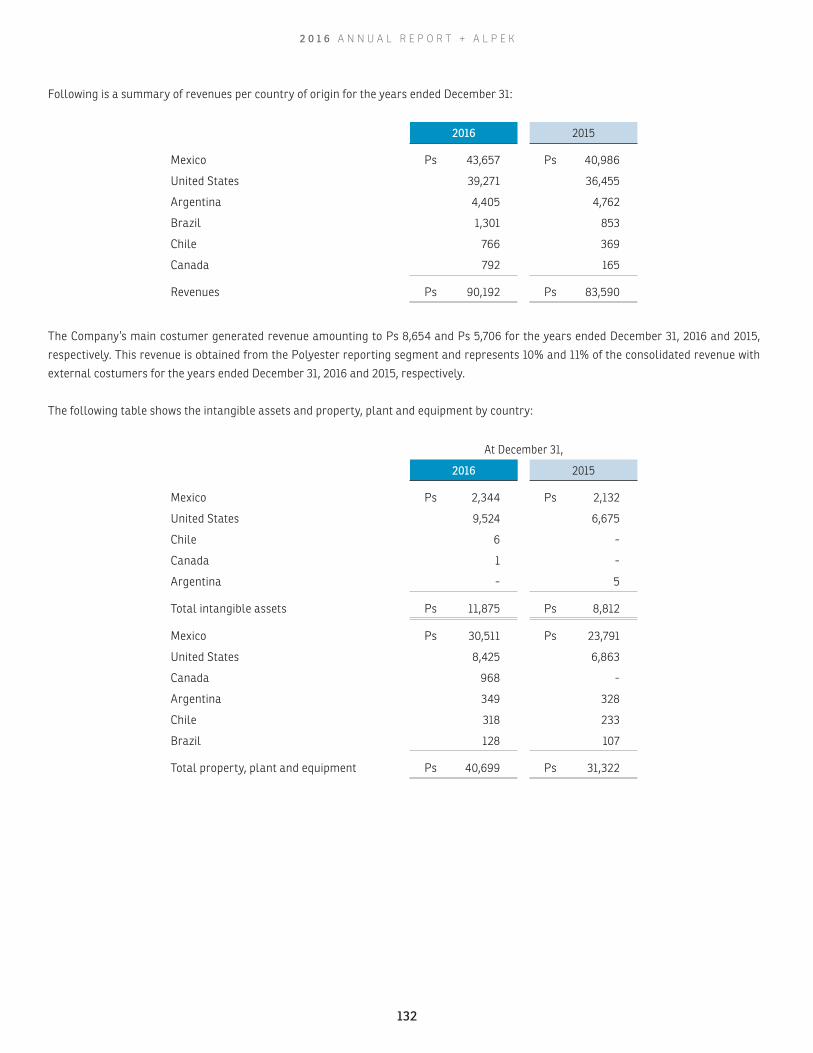
Following is a summary of revenues per country of origin for the years ended December 31:
2016 2015
Mexico Ps 43,657 Ps 40,986
United States 39,271 36,455
Argentina 4,405 4,762
Brazil 1,301 853
Chile 766 369
Canada 792 165
Revenues Ps 90,192 Ps 83,590
The Company’s main costumer generated revenue amounting to Ps 8,654 and Ps 5,706 for the years ended December 31, 2016 and 2015,
respectively. This revenue is obtained from the Polyester reporting segment and represents 10% and 11% of the consolidated revenue with
external costumers for the years ended December 31, 2016 and 2015, respectively.
The following table shows the intangible assets and property, plant and equipment by country:
At December 31,
2016 2015
Mexico Ps 2,344 Ps 2,132
United States 9,524 6,675
Chile 6 -
Canada 1 -
Argentina - 5
Total intangible assets Ps 11,875 Ps 8,812
Mexico Ps 30,511 Ps 23,791
United States 8,425 6,863
Canada 968 -
Argentina 349 328
Chile 318 233
Brazil 128 107
Total property, plant and equipment Ps 40,699 Ps 31,322
2 0 1 6 A N N U A L R E P O R T + A L P E K
132
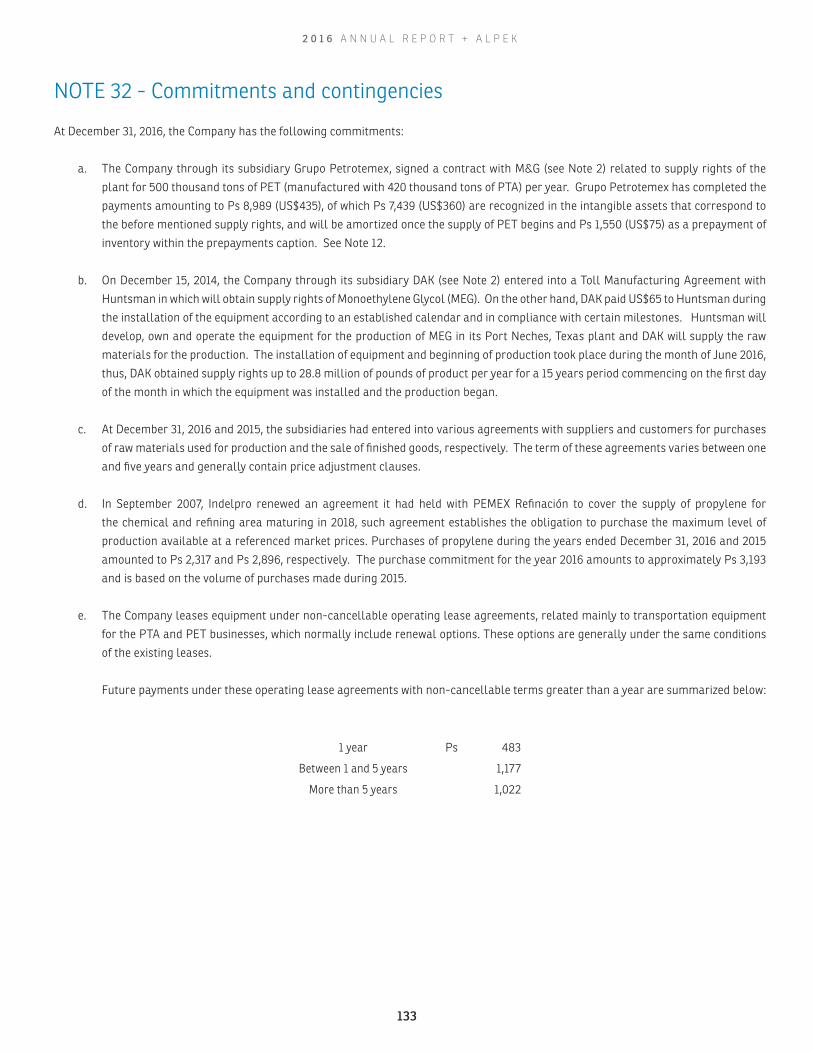
NOTE 32 - Commitments and contingencies
At December 31, 2016, the Company has the following commitments:
a. The Company through its subsidiary Grupo Petrotemex, signed a contract with M&G (see Note 2) related to supply rights of the
plant for 500 thousand tons of PET (manufactured with 420 thousand tons of PTA) per year. Grupo Petrotemex has completed the
payments amounting to Ps 8,989 (US$435), of which Ps 7,439 (US$360) are recognized in the intangible assets that correspond to
the before mentioned supply rights, and will be amortized once the supply of PET begins and Ps 1,550 (US$75) as a prepayment of
inventory within the prepayments caption. See Note 12.
b. On December 15, 2014, the Company through its subsidiary DAK (see Note 2) entered into a Toll Manufacturing Agreement with
Huntsman in which will obtain supply rights of Monoethylene Glycol (MEG). On the other hand, DAK paid US$65 to Huntsman during
the installation of the equipment according to an established calendar and in compliance with certain milestones. Huntsman will
develop, own and operate the equipment for the production of MEG in its Port Neches, Texas plant and DAK will supply the raw
materials for the production. The installation of equipment and beginning of production took place during the month of June 2016,
thus, DAK obtained supply rights up to 28.8 million of pounds of product per year for a 15 years period commencing on the first day
of the month in which the equipment was installed and the production began.
c. At December 31, 2016 and 2015, the subsidiaries had entered into various agreements with suppliers and customers for purchases
of raw materials used for production and the sale of finished goods, respectively. The term of these agreements varies between one
and five years and generally contain price adjustment clauses.
d. In September 2007, Indelpro renewed an agreement it had held with PEMEX Refinación to cover the supply of propylene for
the chemical and refining area maturing in 2018, such agreement establishes the obligation to purchase the maximum level of
production available at a referenced market prices. Purchases of propylene during the years ended December 31, 2016 and 2015
amounted to Ps 2,317 and Ps 2,896, respectively. The purchase commitment for the year 2016 amounts to approximately Ps 3,193
and is based on the volume of purchases made during 2015.
e. The Company leases equipment under non-cancellable operating lease agreements, related mainly to transportation equipment
for the PTA and PET businesses, which normally include renewal options. These options are generally under the same conditions
of the existing leases.
Future payments under these operating lease agreements with non-cancellable terms greater than a year are summarized below:
1 year Ps 483
Between 1 and 5 years 1,177
More than 5 years 1,022
2 0 1 6 A N N U A L R E P O R T + A L P E K
133
At December 31, 2016, the Company has the following contingencies:
a. During the normal course of the business, the Company may be involved in disputes and litigations. While the results of these can’t
be predicted, the Company does not believe that there are actions pending to apply, claims or legal proceedings against or affecting
the Company which, if it will result in an adverse resolution to the Company, would negatively impact the results of its operations
or its financial position.
b. Some of the subsidiaries use hazardous materials to manufacture polyester filaments and staple fibers, polyethylene terephthalate
(PET) and terephthalatic acid (PTA) resin, polypropylene (PP) resin, expandable polystyrene (EPS), caprolactam (CPL), chemical
specialties and they generate and dispose of waste, such as catalysts and glycols. These and other activities of the subsidiaries are
subject to various federal, state and local laws and regulations governing the generation, handling, storage, treatment and disposal
of hazardous substances and wastes. According to such laws, the owner or lessor of real estate property may be liable for, among
other things, (i) the costs of removal or remediation of certain hazardous or toxic substances located on, in, or emanating from,
such property, as well as the related cost of investigation and property damage and substantial penalties for violations of such
law, and (ii) environmental contamination of facilities where its waste is or has been disposed of. Such laws impose such liability
without regard to whether the owner or lessee knew of, or was responsible for, the presence of such hazardous or toxic substances.
Although the subsidiaries estimate that there are no existing material liabilities relating to noncompliance with environmental
laws and regulations, there can be no assurance that there are no undiscovered potential liabilities related to historic or current
operations that will require investigation and/or remediation under environmental laws, or that future uses or conditions will not
result in the imposition of an environmental liability or expose them to third-party or related parties actions, such as tort suits.
Furthermore, there can be no assurance that changes in environmental regulations in the future will not require the subsidiaries
to make significant capital expenditures to change methods of disposal of hazardous materials or otherwise alter aspects of their
operations.
NOTE 33 - Subsequent events
In preparing the financial statements the Company has evaluated the events and transactions for their recognition or disclosure subsequent
to December 31, 2016 and through February 17, 2017 (date of issuance of the financial statements), and has concluded that there are no sub-
sequent events affecting them.
José de Jesús Valdez Simancas Eduardo Alberto Escalante Castillo
Chief Executive Officer Chief Financial Officer
2 0 1 6 A N N U A L R E P O R T + A L P E K
134
TABLE OF CONTENTS
Corporate profileFinancial highlightsFootprintOur products in daily lifePetrochemical chainsLetter to shareholdersPolyesterPlastics & ChemicalsStrategic investmentsSustainabilityBoard of DirectorsManagement TeamCorporate GovernanceGlossaryConsolidated financial statements
123469
121720244445464749
Investor Relations
Hernán F. LozanoSabino Parra
Av. Gómez Morín 1111 Sur
Col. Carrizalejo, San Pedro Garza García
Nuevo León, CP. 66254, Mexico
www.alpek.com
P
RINTED WITH
100% WIND ENERGY
Supplied by Community EnergyDes
ign
& P
hoto
grap
hy: 3
3Vis
ual
| Pr
inte
r: E
arth
colo
r, H
oust
on

2016Annual Report
Alpek, S.A.B. de C.V.Av. Gómez Morín 1111 Sur
Col. Carrizalejo, San Pedro Garza GarcíaNuevo León, Mexico, 66254
www.alpek.com
2016 Annual Report + Alpek