annual report - fascore.com€¦ · annual report dws variable series i dws capital growth vip. 2 |...
TRANSCRIPT
DECEMBER 31, 2011
ANNUAL REPORT
DWS VARIABLE SERIES I
DWS Capital Growth VIP
2 | DWS Variable Series I �DWS Capital Growth VIP
Contents
3 Performance Summary
4 Management Summary
5 Portfolio Summary
6 Investment Portfolio
8 Statement of Assets and Liabilities
8 Statement of Operations
9 Statement of Changes in Net Assets
10 Financial Highlights
11 Notes to Financial Statements
16 Report of Independent Registered Public Accounting Firm
17 Information About Your Fund’s Expenses
18 Tax Information
18 Proxy Voting
19 Investment Management Agreement Approval
22 Summary of Management Fee Evaluation by Independent Fee Consultant
24 Board Members and Officers
This report must be preceded or accompanied by a prospectus. To obtain an additional prospectus or summary
prospectus, if available, call (800) 728-3337 or your financial representative. We advise you to consider the
Fund’s objectives, risks, charges and expenses carefully before investing. The summary prospectus and
prospectus contain this and other important information about the Fund. Please read the prospectus carefully
before you invest.
Stocks may decline in value. The fund may lend securities to approved institutions. See the prospectus for details.
DWS Investments is part of Deutsche Bank’s Asset Management division and, within the U.S., represents the retail asset managementactivities of Deutsche Bank AG, Deutsche Bank Trust Company Americas, Deutsche Investment Management Americas Inc. and DWSTrust Company.
NOT FDIC/NCUA INSURED�NO BANK GUARANTEE�MAY LOSE VALUE�NOT A DEPOSITNOT INSURED BY ANY FEDERAL GOVERNMENT AGENCY
DWS Variable Series I �DWS Capital Growth VIP
| 3
Performance Summary December 31, 2011
Fund performance shown is historical, assumes reinvestment of all dividend and capital gain distributions, and does not
guarantee future results. Investment return and principal value fluctuate with changing market conditions so that, when
redeemed, shares may be worth more or less than their original cost. Current performance may be lower or higher than the
performance data quoted. Please contact your participating insurance company for the Fund’s most recent month-end
performance. Performance doesn’t reflect charges and fees (�contract charges") associated with the separate account that
invests in the Fund or any variable life insurance policy or variable annuity contract for which the Fund is an investment
option. These charges and fees will reduce returns. While all share classes have the same underlying portfolio, their
performance will differ.
The gross expense ratios of the Fund, as stated in the fee table of the prospectus dated May 1, 2011 are 0.51% and 0.85% for
Class A and Class B shares, respectively, and may differ from the expense ratios disclosed in the Financial Highlights tables
in this report.
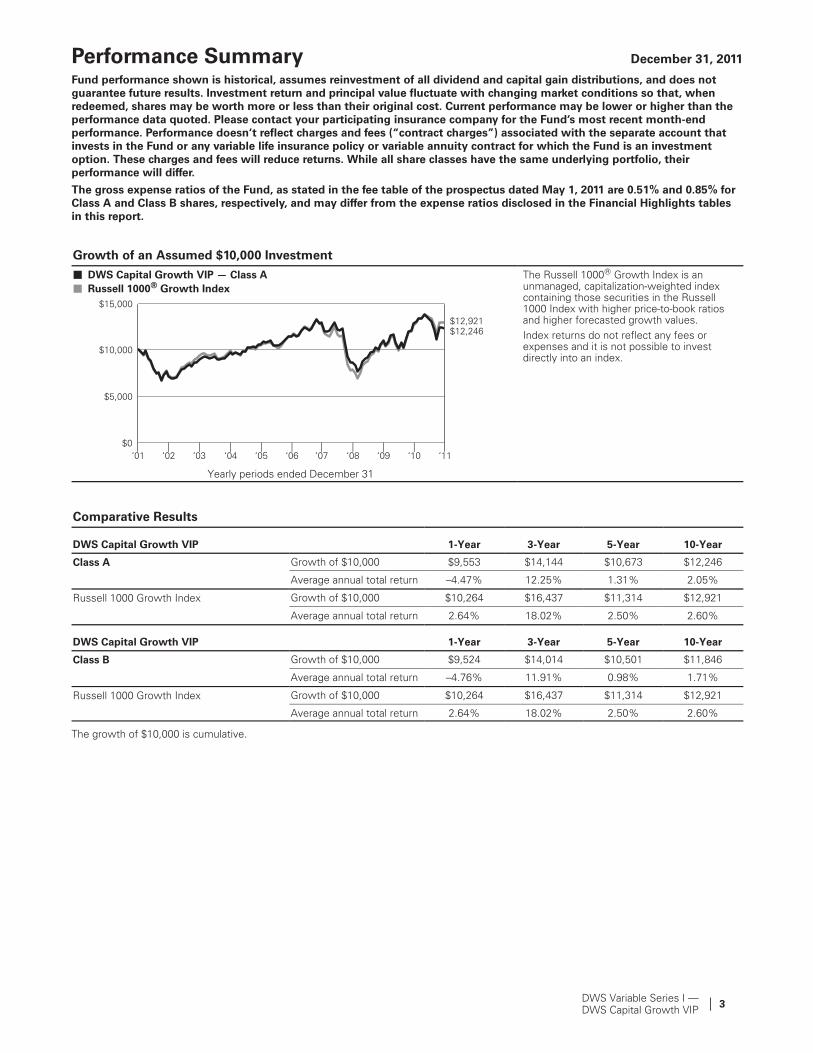
Growth of an Assumed $10,000 Investment
��DWS Capital Growth VIP � Class A
��Russell 1000� Growth Index
The Russell 1000® Growth Index is anunmanaged, capitalization-weighted indexcontaining those securities in the Russell1000 Index with higher price-to-book ratiosand higher forecasted growth values.
Index returns do not reflect any fees orexpenses and it is not possible to investdirectly into an index.
’01
$12,921
$15,000
|’02
$0
’11|
’03|
’04|
’05
$10,000
$12,246
|’10
$5,000
|’06
|’07
|’08
|’09
Yearly periods ended December 31
Comparative Results
DWS Capital Growth VIP 1-Year 3-Year 5-Year 10-Year
Class A Growth of $10,000 $9,553 $14,144 $10,673 $12,246
Average annual total return –4.47% 12.25% 1.31% 2.05%
Russell 1000 Growth Index Growth of $10,000 $10,264 $16,437 $11,314 $12,921
Average annual total return 2.64% 18.02% 2.50% 2.60%
DWS Capital Growth VIP 1-Year 3-Year 5-Year 10-Year
Class B Growth of $10,000 $9,524 $14,014 $10,501 $11,846
Average annual total return –4.76% 11.91% 0.98% 1.71%
Russell 1000 Growth Index Growth of $10,000 $10,264 $16,437 $11,314 $12,921
Average annual total return 2.64% 18.02% 2.50% 2.60%
The growth of $10,000 is cumulative.
4 | DWS Variable Series I �DWS Capital Growth VIP
Management Summary December 31, 2011
Stocks began the annual period on a strong note, as the U.S. Federal Reserve Board’s (the Fed’s) stimulative
quantitative easing initiative, signs of improving economic growth and strong corporate earnings induced
investors to buy stocks through the first five months of the year.1 From that point, the investing backdrop
gradually grew less favorable for three reasons. The primary issue weighing on the market was the European
debt crisis, which raised fears of a broader financial system collapse similar to 2008–2009. At the same time,
growth in China � which is generally seen as the engine of the world economy � slowed precipitously. Even
more relevant to the U.S. market, the domestic economy exhibited weakness in a number of areas. In response
to these developments, the U.S. stock market slipped lower during June and then plunged during the third
quarter. The market subsequently staged a recovery in the fourth quarter following a pickup in a number of key
economic indicators, enabling the Russell 1000 Growth® Index to finish the period with a slightly positive return.2
For the 12 months ended December 31, 2011, the Fund returned –4.47% (Class A shares, unadjusted for contract
charges), underperforming the 2.64% return of the Russell 1000 Growth Index.
During 2011, underperformance was primarily driven by unfavorable stock selection, with all 10 sectors detracting
from relative return. The majority of the underperformance was concentrated within information technology,
energy, materials, consumer staples, financials and health care, as holdings in these sectors underperformed
their respective benchmark positions by the widest margins.3 Sector allocation also detracted from relative
performance in almost every sector, especially based on underweights to consumer staples and consumer
discretionary, which were above-average performers in the benchmark.4,5 In addition, the Fund’s overweight in
industrials hurt performance, as the sector was one of the benchmark’s bottom performers during the year. No
sector contributed positively through stock selection or allocation, and the Fund’s cash holdings also weighed on
relative performance as the benchmark rose.
Going forward, we will continue to seek high-quality companies that we believe will outperform in the long run,
with lower overall risk.
Owen Fitzpatrick, CFALead Portfolio Manager
Thomas M. Hynes, Jr., CFA
Brendan O’Neill, CFAPortfolio Managers
1 Quantitative easing is a type of monetary policy whereby governments buy government or other types of securities from the market inorder to increase the money supply.
2 The Russell 1000 Growth Index is an unmanaged, capitalization-weighted index containing those securities in the Russell 1000® Indexwith higher price-to-book ratios and higher forecasted growth values.
Index returns do not reflect fees or expenses and it is not possible to invest directly into an index.3 Consumer staples are the industries that manufacture and sell products such as food and beverages, prescription drugs, and household
products.4 The consumer discretionary sector represents industries that produce goods and services that are not necessities in everyday life.5 �Overweight" means the Fund holds a higher weighting in a given sector or security than the benchmark. �Underweight" means the
Fund holds a lower weighting.
The views expressed reflect those of the portfolio management team only through the end of the period of the report as stated on the cover.The management team’s views are subject to change at any time based on market and other conditions and should not be construed as arecommendation. Past performance is no guarantee of future results. Current and future portfolio holdings are subject to risk.
DWS Variable Series I �DWS Capital Growth VIP
| 5
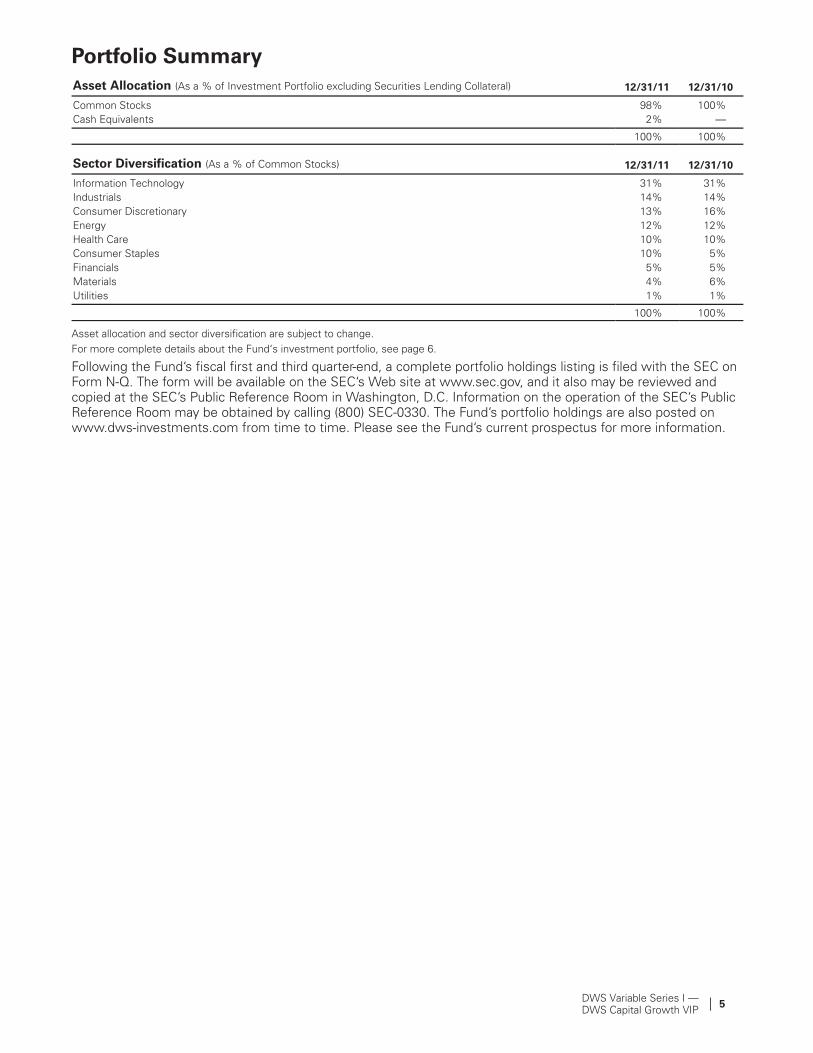
Portfolio Summary
Asset Allocation (As a % of Investment Portfolio excluding Securities Lending Collateral) 12/31/11 12/31/10
Common Stocks 98% 100%
Cash Equivalents 2% �
100% 100%
Sector Diversification (As a % of Common Stocks) 12/31/11 12/31/10
Information Technology 31% 31%
Industrials 14% 14%
Consumer Discretionary 13% 16%
Energy 12% 12%
Health Care 10% 10%
Consumer Staples 10% 5%
Financials 5% 5%
Materials 4% 6%
Utilities 1% 1%
100% 100%
Asset allocation and sector diversification are subject to change.
For more complete details about the Fund’s investment portfolio, see page 6.
Following the Fund’s fiscal first and third quarter-end, a complete portfolio holdings listing is filed with the SEC onForm N-Q. The form will be available on the SEC’s Web site at www.sec.gov, and it also may be reviewed andcopied at the SEC’s Public Reference Room in Washington, D.C. Information on the operation of the SEC’s PublicReference Room may be obtained by calling (800) SEC-0330. The Fund’s portfolio holdings are also posted onwww.dws-investments.com from time to time. Please see the Fund’s current prospectus for more information.
6 | DWS Variable Series I �DWS Capital Growth VIP
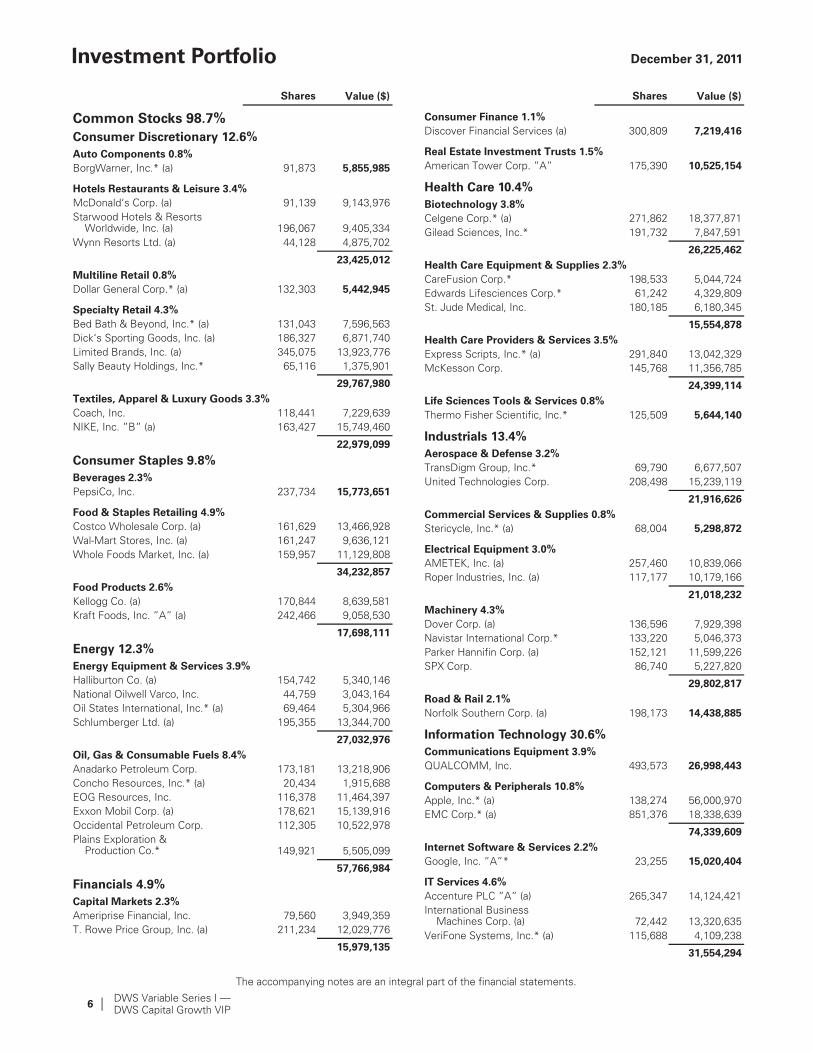
Investment Portfolio December 31, 2011
Shares Value ($)
Common Stocks 98.7%
Consumer Discretionary 12.6%
Auto Components 0.8%
BorgWarner, Inc.* (a) 91,873 5,855,985
Hotels Restaurants & Leisure 3.4%
McDonald’s Corp. (a) 91,139 9,143,976
Starwood Hotels & ResortsWorldwide, Inc. (a) 196,067 9,405,334
Wynn Resorts Ltd. (a) 44,128 4,875,702
23,425,012
Multiline Retail 0.8%
Dollar General Corp.* (a) 132,303 5,442,945
Specialty Retail 4.3%
Bed Bath & Beyond, Inc.* (a) 131,043 7,596,563
Dick’s Sporting Goods, Inc. (a) 186,327 6,871,740
Limited Brands, Inc. (a) 345,075 13,923,776
Sally Beauty Holdings, Inc.* 65,116 1,375,901
29,767,980
Textiles, Apparel & Luxury Goods 3.3%
Coach, Inc. 118,441 7,229,639
NIKE, Inc. "B" (a) 163,427 15,749,460
22,979,099
Consumer Staples 9.8%
Beverages 2.3%
PepsiCo, Inc. 237,734 15,773,651
Food & Staples Retailing 4.9%
Costco Wholesale Corp. (a) 161,629 13,466,928
Wal-Mart Stores, Inc. (a) 161,247 9,636,121
Whole Foods Market, Inc. (a) 159,957 11,129,808
34,232,857
Food Products 2.6%
Kellogg Co. (a) 170,844 8,639,581
Kraft Foods, Inc. "A" (a) 242,466 9,058,530
17,698,111
Energy 12.3%
Energy Equipment & Services 3.9%
Halliburton Co. (a) 154,742 5,340,146
National Oilwell Varco, Inc. 44,759 3,043,164
Oil States International, Inc.* (a) 69,464 5,304,966
Schlumberger Ltd. (a) 195,355 13,344,700
27,032,976
Oil, Gas & Consumable Fuels 8.4%
Anadarko Petroleum Corp. 173,181 13,218,906
Concho Resources, Inc.* (a) 20,434 1,915,688
EOG Resources, Inc. 116,378 11,464,397
Exxon Mobil Corp. (a) 178,621 15,139,916
Occidental Petroleum Corp. 112,305 10,522,978
Plains Exploration &Production Co.* 149,921 5,505,099
57,766,984
Financials 4.9%
Capital Markets 2.3%
Ameriprise Financial, Inc. 79,560 3,949,359
T. Rowe Price Group, Inc. (a) 211,234 12,029,776
15,979,135
Shares Value ($)
Consumer Finance 1.1%
Discover Financial Services (a) 300,809 7,219,416
Real Estate Investment Trusts 1.5%
American Tower Corp. "A" 175,390 10,525,154
Health Care 10.4%
Biotechnology 3.8%
Celgene Corp.* (a) 271,862 18,377,871
Gilead Sciences, Inc.* 191,732 7,847,591
26,225,462
Health Care Equipment & Supplies 2.3%
CareFusion Corp.* 198,533 5,044,724
Edwards Lifesciences Corp.* 61,242 4,329,809
St. Jude Medical, Inc. 180,185 6,180,345
15,554,878
Health Care Providers & Services 3.5%
Express Scripts, Inc.* (a) 291,840 13,042,329
McKesson Corp. 145,768 11,356,785
24,399,114
Life Sciences Tools & Services 0.8%
Thermo Fisher Scientific, Inc.* 125,509 5,644,140
Industrials 13.4%
Aerospace & Defense 3.2%
TransDigm Group, Inc.* 69,790 6,677,507
United Technologies Corp. 208,498 15,239,119
21,916,626
Commercial Services & Supplies 0.8%
Stericycle, Inc.* (a) 68,004 5,298,872
Electrical Equipment 3.0%
AMETEK, Inc. (a) 257,460 10,839,066
Roper Industries, Inc. (a) 117,177 10,179,166
21,018,232
Machinery 4.3%
Dover Corp. (a) 136,596 7,929,398
Navistar International Corp.* 133,220 5,046,373
Parker Hannifin Corp. (a) 152,121 11,599,226
SPX Corp. 86,740 5,227,820
29,802,817
Road & Rail 2.1%
Norfolk Southern Corp. (a) 198,173 14,438,885
Information Technology 30.6%
Communications Equipment 3.9%
QUALCOMM, Inc. 493,573 26,998,443
Computers & Peripherals 10.8%
Apple, Inc.* (a) 138,274 56,000,970
EMC Corp.* (a) 851,376 18,338,639
74,339,609
Internet Software & Services 2.2%
Google, Inc. "A"* 23,255 15,020,404
IT Services 4.6%
Accenture PLC "A" (a) 265,347 14,124,421
International BusinessMachines Corp. (a) 72,442 13,320,635
VeriFone Systems, Inc.* (a) 115,688 4,109,238
31,554,294
The accompanying notes are an integral part of the financial statements.
DWS Variable Series I �DWS Capital Growth VIP
| 7
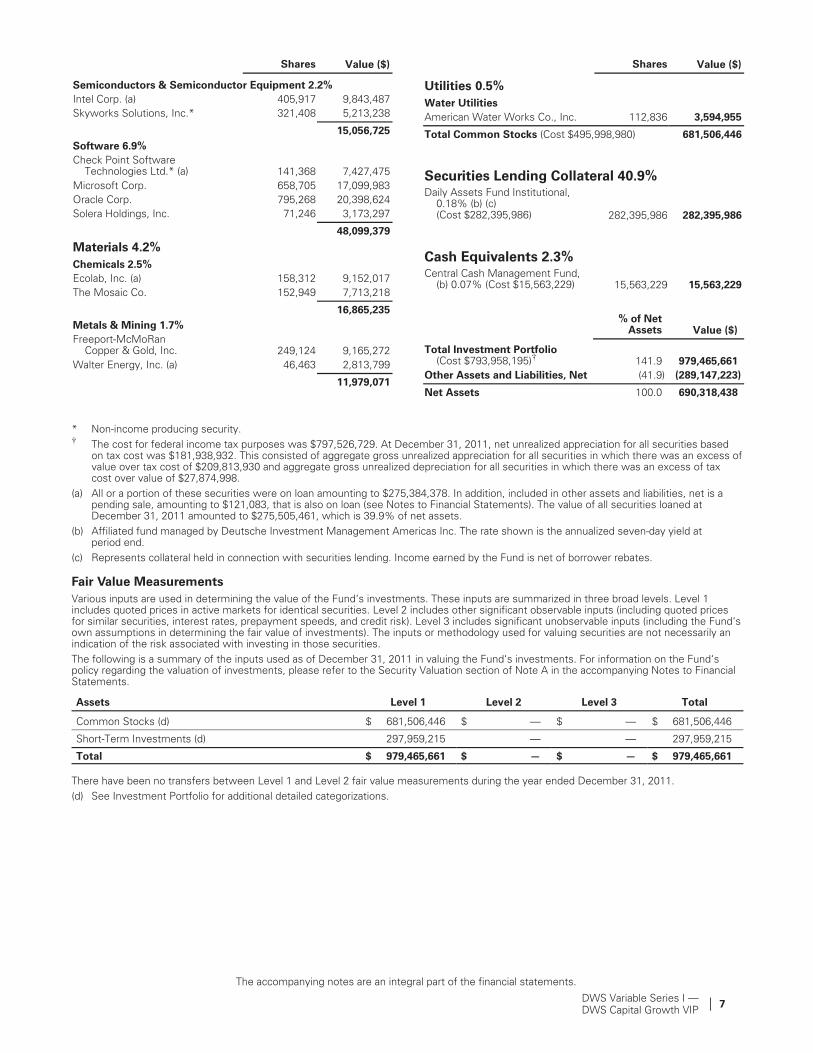
Shares Value ($)
Semiconductors & Semiconductor Equipment 2.2%
Intel Corp. (a) 405,917 9,843,487
Skyworks Solutions, Inc.* 321,408 5,213,238
15,056,725
Software 6.9%
Check Point SoftwareTechnologies Ltd.* (a) 141,368 7,427,475
Microsoft Corp. 658,705 17,099,983
Oracle Corp. 795,268 20,398,624
Solera Holdings, Inc. 71,246 3,173,297
48,099,379
Materials 4.2%
Chemicals 2.5%
Ecolab, Inc. (a) 158,312 9,152,017
The Mosaic Co. 152,949 7,713,218
16,865,235
Metals & Mining 1.7%
Freeport-McMoRanCopper & Gold, Inc. 249,124 9,165,272
Walter Energy, Inc. (a) 46,463 2,813,799
11,979,071
Shares Value ($)
Utilities 0.5%
Water Utilities
American Water Works Co., Inc. 112,836 3,594,955
Total Common Stocks (Cost $495,998,980) 681,506,446
Securities Lending Collateral 40.9%Daily Assets Fund Institutional,
0.18% (b) (c)(Cost $282,395,986) 282,395,986 282,395,986
Cash Equivalents 2.3%Central Cash Management Fund,
(b) 0.07% (Cost $15,563,229) 15,563,229 15,563,229
% of NetAssets Value ($)
Total Investment Portfolio(Cost $793,958,195)� 141.9 979,465,661
Other Assets and Liabilities, Net (41.9) (289,147,223)
Net Assets 100.0 690,318,438
* Non-income producing security.� The cost for federal income tax purposes was $797,526,729. At December 31, 2011, net unrealized appreciation for all securities based
on tax cost was $181,938,932. This consisted of aggregate gross unrealized appreciation for all securities in which there was an excess ofvalue over tax cost of $209,813,930 and aggregate gross unrealized depreciation for all securities in which there was an excess of taxcost over value of $27,874,998.
(a) All or a portion of these securities were on loan amounting to $275,384,378. In addition, included in other assets and liabilities, net is apending sale, amounting to $121,083, that is also on loan (see Notes to Financial Statements). The value of all securities loaned atDecember 31, 2011 amounted to $275,505,461, which is 39.9% of net assets.
(b) Affiliated fund managed by Deutsche Investment Management Americas Inc. The rate shown is the annualized seven-day yield atperiod end.
(c) Represents collateral held in connection with securities lending. Income earned by the Fund is net of borrower rebates.
Fair Value Measurements
Various inputs are used in determining the value of the Fund’s investments. These inputs are summarized in three broad levels. Level 1includes quoted prices in active markets for identical securities. Level 2 includes other significant observable inputs (including quoted pricesfor similar securities, interest rates, prepayment speeds, and credit risk). Level 3 includes significant unobservable inputs (including the Fund’sown assumptions in determining the fair value of investments). The inputs or methodology used for valuing securities are not necessarily anindication of the risk associated with investing in those securities.
The following is a summary of the inputs used as of December 31, 2011 in valuing the Fund’s investments. For information on the Fund’spolicy regarding the valuation of investments, please refer to the Security Valuation section of Note A in the accompanying Notes to FinancialStatements.
Assets Level 1 Level 2 Level 3 Total
Common Stocks (d) $ 681,506,446 $ � $ � $ 681,506,446
Short-Term Investments (d) 297,959,215 � � 297,959,215
Total $ 979,465,661 $ � $ � $ 979,465,661
There have been no transfers between Level 1 and Level 2 fair value measurements during the year ended December 31, 2011.
(d) See Investment Portfolio for additional detailed categorizations.
The accompanying notes are an integral part of the financial statements.
8 | DWS Variable Series I �DWS Capital Growth VIP
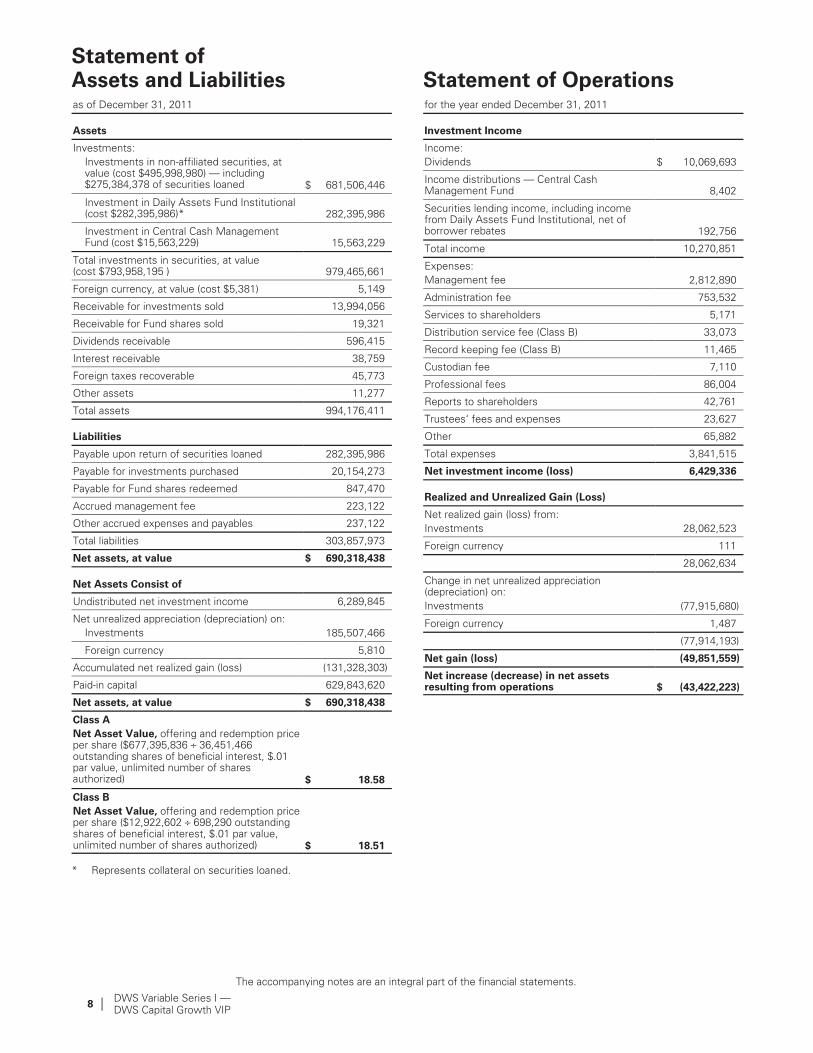
Statement ofAssets and Liabilitiesas of December 31, 2011
Assets
Investments:
Investments in non-affiliated securities, atvalue (cost $495,998,980) � including$275,384,378 of securities loaned $ 681,506,446
Investment in Daily Assets Fund Institutional(cost $282,395,986)* 282,395,986
Investment in Central Cash ManagementFund (cost $15,563,229) 15,563,229
Total investments in securities, at value(cost $793,958,195 ) 979,465,661
Foreign currency, at value (cost $5,381) 5,149
Receivable for investments sold 13,994,056
Receivable for Fund shares sold 19,321
Dividends receivable 596,415
Interest receivable 38,759
Foreign taxes recoverable 45,773
Other assets 11,277
Total assets 994,176,411
Liabilities
Payable upon return of securities loaned 282,395,986
Payable for investments purchased 20,154,273
Payable for Fund shares redeemed 847,470
Accrued management fee 223,122
Other accrued expenses and payables 237,122
Total liabilities 303,857,973
Net assets, at value $ 690,318,438
Net Assets Consist of
Undistributed net investment income 6,289,845
Net unrealized appreciation (depreciation) on:
Investments 185,507,466
Foreign currency 5,810
Accumulated net realized gain (loss) (131,328,303)
Paid-in capital 629,843,620
Net assets, at value $ 690,318,438
Class A
Net Asset Value, offering and redemption priceper share ($677,395,836 ÷ 36,451,466outstanding shares of beneficial interest, $.01par value, unlimited number of sharesauthorized) $ 18.58
Class B
Net Asset Value, offering and redemption priceper share ($12,922,602 ÷ 698,290 outstandingshares of beneficial interest, $.01 par value,unlimited number of shares authorized) $ 18.51
* Represents collateral on securities loaned.
Statement of Operationsfor the year ended December 31, 2011
Investment Income
Income:
Dividends $ 10,069,693
Income distributions � Central CashManagement Fund 8,402
Securities lending income, including incomefrom Daily Assets Fund Institutional, net ofborrower rebates 192,756
Total income 10,270,851
Expenses:
Management fee 2,812,890
Administration fee 753,532
Services to shareholders 5,171
Distribution service fee (Class B) 33,073
Record keeping fee (Class B) 11,465
Custodian fee 7,110
Professional fees 86,004
Reports to shareholders 42,761
Trustees’ fees and expenses 23,627
Other 65,882
Total expenses 3,841,515
Net investment income (loss) 6,429,336
Realized and Unrealized Gain (Loss)
Net realized gain (loss) from:
Investments 28,062,523
Foreign currency 111
28,062,634
Change in net unrealized appreciation(depreciation) on:
Investments (77,915,680)
Foreign currency 1,487
(77,914,193)
Net gain (loss) (49,851,559)
Net increase (decrease) in net assetsresulting from operations $ (43,422,223)
The accompanying notes are an integral part of the financial statements.
DWS Variable Series I �DWS Capital Growth VIP
| 9
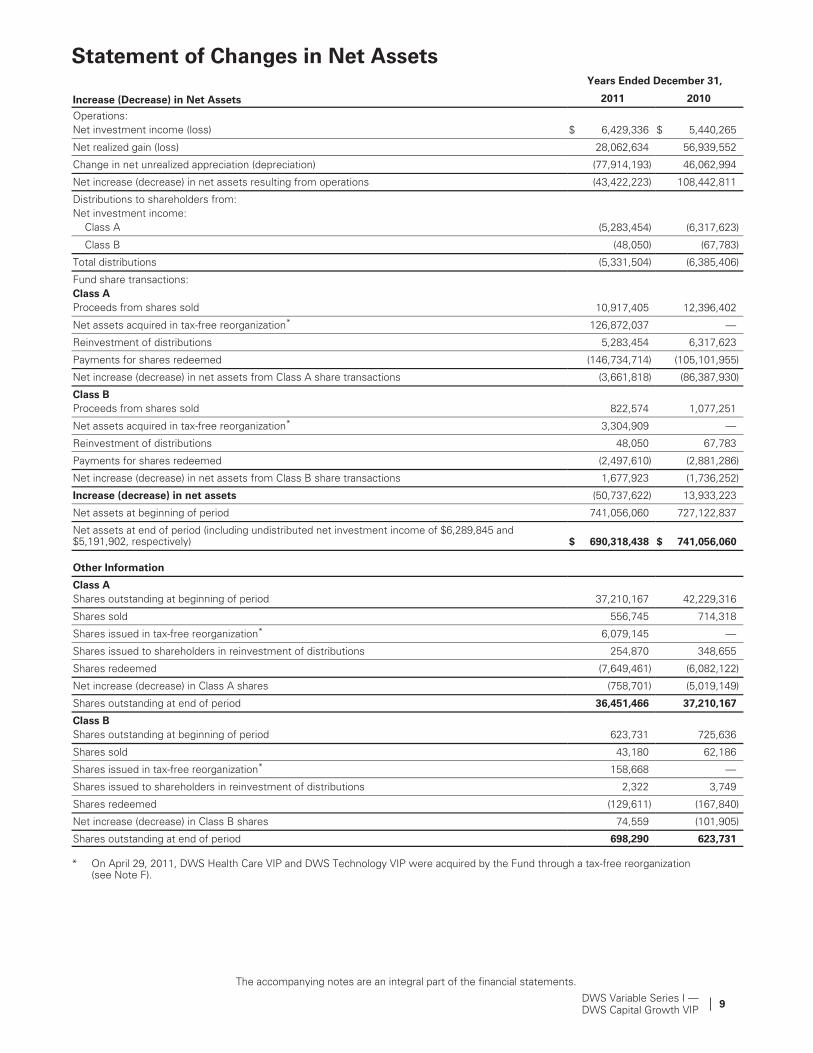
Statement of Changes in Net Assets
Increase (Decrease) in Net Assets
Years Ended December 31,
2011 2010
Operations:
Net investment income (loss) $ 6,429,336 $ 5,440,265
Net realized gain (loss) 28,062,634 56,939,552
Change in net unrealized appreciation (depreciation) (77,914,193) 46,062,994
Net increase (decrease) in net assets resulting from operations (43,422,223) 108,442,811
Distributions to shareholders from:
Net investment income:
Class A (5,283,454) (6,317,623)
Class B (48,050) (67,783)
Total distributions (5,331,504) (6,385,406)
Fund share transactions:
Class A
Proceeds from shares sold 10,917,405 12,396,402
Net assets acquired in tax-free reorganization* 126,872,037 �
Reinvestment of distributions 5,283,454 6,317,623
Payments for shares redeemed (146,734,714) (105,101,955)
Net increase (decrease) in net assets from Class A share transactions (3,661,818) (86,387,930)
Class B
Proceeds from shares sold 822,574 1,077,251
Net assets acquired in tax-free reorganization* 3,304,909 �
Reinvestment of distributions 48,050 67,783
Payments for shares redeemed (2,497,610) (2,881,286)
Net increase (decrease) in net assets from Class B share transactions 1,677,923 (1,736,252)
Increase (decrease) in net assets (50,737,622) 13,933,223
Net assets at beginning of period 741,056,060 727,122,837
Net assets at end of period (including undistributed net investment income of $6,289,845 and$5,191,902, respectively) $ 690,318,438 $ 741,056,060
Other Information
Class A
Shares outstanding at beginning of period 37,210,167 42,229,316
Shares sold 556,745 714,318
Shares issued in tax-free reorganization* 6,079,145 �
Shares issued to shareholders in reinvestment of distributions 254,870 348,655
Shares redeemed (7,649,461) (6,082,122)
Net increase (decrease) in Class A shares (758,701) (5,019,149)
Shares outstanding at end of period 36,451,466 37,210,167
Class B
Shares outstanding at beginning of period 623,731 725,636
Shares sold 43,180 62,186
Shares issued in tax-free reorganization* 158,668 �
Shares issued to shareholders in reinvestment of distributions 2,322 3,749
Shares redeemed (129,611) (167,840)
Net increase (decrease) in Class B shares 74,559 (101,905)
Shares outstanding at end of period 698,290 623,731
* On April 29, 2011, DWS Health Care VIP and DWS Technology VIP were acquired by the Fund through a tax-free reorganization(see Note F).
The accompanying notes are an integral part of the financial statements.
10 | DWS Variable Series I �DWS Capital Growth VIP
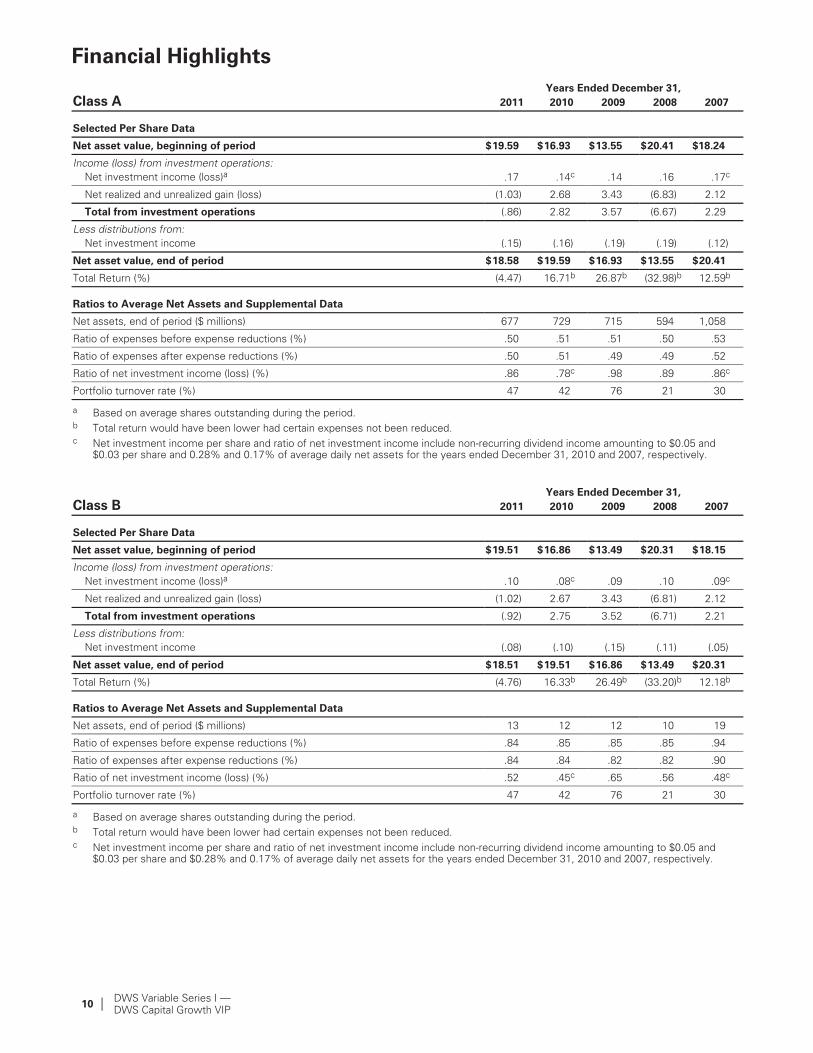
Financial Highlights
Class AYears Ended December 31,
2011 2010 2009 2008 2007
Selected Per Share Data
Net asset value, beginning of period $19.59 $16.93 $13.55 $20.41 $18.24
Income (loss) from investment operations:
Net investment income (loss)a .17 .14c .14 .16 .17c
Net realized and unrealized gain (loss) (1.03) 2.68 3.43 (6.83) 2.12
Total from investment operations (.86) 2.82 3.57 (6.67) 2.29
Less distributions from:
Net investment income (.15) (.16) (.19) (.19) (.12)
Net asset value, end of period $18.58 $19.59 $16.93 $13.55 $20.41
Total Return (%) (4.47) 16.71b 26.87b (32.98)b 12.59b
Ratios to Average Net Assets and Supplemental Data
Net assets, end of period ($ millions) 677 729 715 594 1,058
Ratio of expenses before expense reductions (%) .50 .51 .51 .50 .53
Ratio of expenses after expense reductions (%) .50 .51 .49 .49 .52
Ratio of net investment income (loss) (%) .86 .78c .98 .89 .86c
Portfolio turnover rate (%) 47 42 76 21 30
a Based on average shares outstanding during the period.b Total return would have been lower had certain expenses not been reduced.c Net investment income per share and ratio of net investment income include non-recurring dividend income amounting to $0.05 and
$0.03 per share and 0.28% and 0.17% of average daily net assets for the years ended December 31, 2010 and 2007, respectively.
Class BYears Ended December 31,
2011 2010 2009 2008 2007
Selected Per Share Data
Net asset value, beginning of period $19.51 $16.86 $13.49 $20.31 $18.15
Income (loss) from investment operations:
Net investment income (loss)a .10 .08c .09 .10 .09c
Net realized and unrealized gain (loss) (1.02) 2.67 3.43 (6.81) 2.12
Total from investment operations (.92) 2.75 3.52 (6.71) 2.21
Less distributions from:
Net investment income (.08) (.10) (.15) (.11) (.05)
Net asset value, end of period $18.51 $19.51 $16.86 $13.49 $20.31
Total Return (%) (4.76) 16.33b 26.49b (33.20)b 12.18b
Ratios to Average Net Assets and Supplemental Data
Net assets, end of period ($ millions) 13 12 12 10 19
Ratio of expenses before expense reductions (%) .84 .85 .85 .85 .94
Ratio of expenses after expense reductions (%) .84 .84 .82 .82 .90
Ratio of net investment income (loss) (%) .52 .45c .65 .56 .48c
Portfolio turnover rate (%) 47 42 76 21 30
a Based on average shares outstanding during the period.b Total return would have been lower had certain expenses not been reduced.c Net investment income per share and ratio of net investment income include non-recurring dividend income amounting to $0.05 and
$0.03 per share and $0.28% and 0.17% of average daily net assets for the years ended December 31, 2010 and 2007, respectively.
DWS Variable Series I �DWS Capital Growth VIP
| 11
Notes to Financial Statements
A. Organization and Significant Accounting Policies
DWS Variable Series I (the �Series�) is registered under the Investment Company Act of 1940, as amended(the �1940 Act�), as an open-end, registered management investment company organized as a Massachusettsbusiness trust. The Series consists of five diversified funds: DWS Bond VIP, DWS Growth & Income VIP,DWS Capital Growth VIP, DWS Global Small Cap Growth VIP (formerly DWS Global Opportunities VIP) andDWS International VIP (individually or collectively hereinafter referred to as a �Fund� or the �Funds�). Thesefinancial statements report on DWS Capital Growth VIP. The Series is intended to be the underlying investmentvehicle for variable annuity contracts and variable life insurance policies to be offered by the separate accounts ofcertain life insurance companies (�Participating Insurance Companies�).
Multiple Classes of Shares of Beneficial Interest. The Fund offers two classes of shares (Class A shares andClass B shares). Class B shares are subject to Rule 12b-1 distribution fees under the 1940 Act and recordkeepingfees equal to an annual rate of 0.25% and up to 0.15%, respectively, of the average daily net assets of theClass B shares of the Fund. Class A shares are not subject to such fees.
Investment income, realized and unrealized gains and losses, and certain fund-level expenses and expensereductions, if any, are borne pro rata on the basis of relative net assets by the holders of all classes of shares,except that each class bears certain expenses unique to that class (including the applicable 12b-1 distribution feesand recordkeeping fees). Differences in class-level expenses may result in payment of different per sharedividends by class. All shares have equal rights with respect to voting subject to class-specific arrangements.
The Fund’s financial statements are prepared in accordance with accounting principles generally accepted in theUnited States of America, which require the use of management estimates. Actual results could differ from thoseestimates. The policies described below are followed consistently by the Fund in the preparation of its financialstatements.
Security Valuation. Investments are stated at value determined as of the close of regular trading on the New YorkStock Exchange on each day the exchange is open for trading.
Various inputs are used in determining the value of the Fund’s investments. These inputs are summarized in threebroad levels. Level 1 includes quoted prices in active markets for identical securities. Level 2 includes othersignificant observable inputs (including quoted prices for similar securities, interest rates, prepayment speeds,and credit risk). Level 3 includes significant unobservable inputs (including the Fund’s own assumptions indetermining the fair value of investments). The inputs or methodology used for valuing securities are notnecessarily an indication of the risk associated with investing in those securities.
Equity securities are valued at the most recent sale price or official closing price reported on the exchange (U.S.or foreign) or over-the-counter market on which they trade and are categorized as Level 1 securities. Securities forwhich no sales are reported are valued at the calculated mean between the most recent bid and asked quotationson the relevant market or, if a mean cannot be determined, at the most recent bid quotation.
Money market instruments purchased with an original or remaining maturity of sixty days or less, maturing at par,are valued at amortized cost, which approximates value, and are categorized as Level 2. Investments in open-endinvestment companies are valued at their net asset value each business day and are categorized as Level 1.
Securities and other assets for which market quotations are not readily available or for which the above valuationprocedures are deemed not to reflect fair value are valued in a manner that is intended to reflect their fair value asdetermined in accordance with procedures approved by the Trustees and are generally categorized as Level 3. Inaccordance with the Fund’s valuation procedures, factors used in determining value may include, but are notlimited to, the type of the security; the size of the holding; the initial cost of the security; the existence of anycontractual restrictions on the security’s disposition; the price and extent of public trading in similar securities ofthe issuer or of comparable companies; quotations or evaluated prices from broker-dealers and/or pricingservices; information obtained from the issuer, analysts, and/or the appropriate stock exchange (forexchange-traded securities); an analysis of the company’s or issuer’s financial statements; an evaluation of theforces that influence the issuer and the market(s) in which the security is purchased and sold and with respect todebt securities; the maturity, coupon, creditworthiness, currency denomination and the movement of the marketin which the security is normally traded. The value determined under these procedures may differ from publishedvalues for the same securities.
Disclosure about the classification of fair value measurements is included in a table following the Fund’sInvestment Portfolio.
New Accounting Pronouncement. In May 2011, Accounting Standards Update 2011-04 (ASU 2011-04),Amendments to Achieve Common Fair Value Measurement and Disclosure Requirements in U.S. GAAP and

12 | DWS Variable Series I �DWS Capital Growth VIP
IFRSs, was issued and is effective during interim and annual periods beginning after December 15, 2011. ASU2011-04 amends Accounting Standards Codification (ASC) Topic 820, Fair Value Measurement. The amendmentsare the result of the work by the Financial Accounting Standards Board and the International AccountingStandards Board to develop common requirements for measuring fair value and for disclosing information aboutfair value measurements in accordance with GAAP. Management is currently evaluating the application of ASU2011-04 and its impact, if any, on the Fund’s financial statements.
Securities Lending. The Fund lends securities to certain financial institutions. The Fund retains beneficialownership of the securities it has loaned and continues to receive interest and dividends paid by the issuer ofsecurities and to participate in any changes in their market value. The Fund requires the borrowers of thesecurities to maintain collateral with the Fund consisting of either cash or liquid, unencumbered assets having avalue at least equal to the value of the securities loaned. When the collateral falls below specified amounts, thelending agent will use its best effort to obtain additional collateral on the next business day to meet requiredamounts under the security lending agreement. The Fund may invest the cash collateral into a joint tradingaccount in an affiliated money market fund pursuant to Exemptive Orders issued by the SEC. The Fund receivescompensation for lending its securities either in the form of fees or by earning interest on invested cash collateralnet of borrower rebates and fees paid to a lending agent. Either the Fund or the borrower may terminate the loan.There may be risks of delay and costs in recovery of securities or even loss of rights in the collateral should theborrower of the securities fail financially. The Fund is also subject to all investment risks associated with thereinvestment of any cash collateral received, including, but not limited to, interest rate, credit and liquidity riskassociated with such investments.
Foreign Currency Translations. The books and records of the Fund are maintained in U.S. dollars. Investmentsecurities and other assets and liabilities denominated in a foreign currency are translated into U.S. dollars at theprevailing exchange rates at period end. Purchases and sales of investment securities, income and expenses aretranslated into U.S. dollars at the prevailing exchange rates on the respective dates of the transactions.
Net realized and unrealized gains and losses on foreign currency transactions represent net gains and lossesbetween trade and settlement dates on securities transactions, the acquisition and disposition of foreigncurrencies, and the difference between the amount of net investment income accrued and the U.S. dollar amountactually received. That portion of both realized and unrealized gains and losses on investments that results fromfluctuations in foreign currency exchange rates is not separately disclosed but is included with net realized andunrealized gain/appreciation and loss/depreciation on investments.
Federal Income Taxes. The Fund is treated as a separate taxpayer as provided for in the Internal Revenue Code,as amended. It is the Fund’s policy to comply with the requirements of the Internal Revenue Code, as amended,which are applicable to regulated investment companies, and to distribute all of its taxable income to the separateaccounts of the Participating Insurance Companies which hold its shares.
Under the Regulated Investment Company Modernization Act of 2010, net capital losses may be carried forwardindefinitely, and their character is retained as short-term and/or long-term. Previously, net capital losses werecarried forward for eight years and treated as short-term. As a transition rule, the Act requires thatpost-enactment net capital losses be used before pre-enactment net capital losses.
At December 31, 2011, the Fund had a net tax basis capital loss carryforward of approximately $127,751,000,including $60,976,000 of pre-enactment losses of which $33,901,000 was inherited from its merger with DWSTechnology VIP in the current year and $27,075,000 was inherited from its merger with other affiliated funds inprevious years and may be applied against any realized net taxable capital gains of each year until fully utilized oruntil December 31, 2012 ($28,616,000), December 31, 2015 ($19,311,000), December 31, 2016 ($41,665,000) andDecember 31, 2017 ($38,159,000), the respective expiration dates, whichever occurs first, and which may besubject to certain limitations under Section 382-384 of the Internal Revenue Code.
The Fund has reviewed the tax positions for the open tax years as of December 31, 2011 and has determined thatno provision for income tax is required in the Fund’s financial statements. The Fund’s federal tax returns for theprior three fiscal years remain open subject to examination by the Internal Revenue Service.
Distribution of Income and Gains. The Fund will declare and distribute dividends from its net investment income,if any, annually, although additional distributions may be made if necessary. Net realized gains from investmenttransactions, in excess of available capital loss carryforwards, would be taxable to the Fund if not distributed, and,therefore, will be distributed to shareholders at least annually.
The timing and characterization of certain income and capital gain distributions are determined annually inaccordance with federal tax regulations which may differ from accounting principles generally accepted in theUnited States of America. These differences primarily relate to certain securities sold at a loss. As a result, netinvestment income (loss) and net realized gain (loss) on investment transactions for a reporting period may differ
DWS Variable Series I �DWS Capital Growth VIP
| 13
significantly from distributions during such period. Accordingly, the Fund may periodically make reclassificationsamong certain of its capital accounts without impacting the net asset value of the Fund.
At December 31, 2011, the Fund’s components of distributable earnings (accumulated losses) on a tax basis areas follows:
Undistributed ordinary income* $ 6,289,845
Capital loss carryforwards $ (127,751,000)
Net unrealized gain appreciation (depreciation) investments $ 181,938,932
In addition, the tax character of distributions paid to shareholders by the Fund is summarized as follows:
Years Ended December 31,
2011 2010
Distributions from ordinary income* $ 5,331,504 $ 6,385,406
* For tax purposes, short-term capital gain distributions are considered ordinary income distributions.
Expenses. Expenses of the Series arising in connection with a specific Fund are allocated to that Fund. OtherSeries expenses which cannot be directly attributed to a Fund are apportioned among the Funds in the Series.
Contingencies. In the normal course of business, the Fund may enter into contracts with service providers thatcontain general indemnification clauses. The Fund’s maximum exposure under these arrangements is unknownas this would involve future claims that may be made against the Fund that have not yet been made. However,based on experience, the Fund expects the risk of loss to be remote.
Other. Investment transactions are accounted for on a trade date plus one basis for daily net asset valuecalculations. However, for financial reporting purposes, investment transactions are reported on trade date.Interest income is recorded on the accrual basis. Dividend income is recorded on the ex-dividend date net offoreign withholding taxes. Certain dividends from foreign securities may be recorded subsequent to theex-dividend date as soon as the Fund is informed of such dividends. Realized gains and losses from investmenttransactions are recorded on an identified cost basis and may include proceeds from litigation.
B. Purchases and Sales of Securities
During the year ended December 31, 2011, purchases and sales of investment securities (excluding short-terminvestments) aggregated $353,604,662 and $488,652,071, respectively.
C. Related Parties
Management Agreement. Under the Investment Management Agreement with Deutsche InvestmentManagement Americas Inc. (�DIMA� or the �Advisor�), an indirect, wholly owned subsidiary of Deutsche BankAG, the Advisor directs the investments of the Fund in accordance with its investment objectives, policies andrestrictions. The Advisor determines the securities, instruments and other contracts relating to investments to bepurchased, sold or entered into by the Fund.
Pursuant to the Investment Management Agreement with the Advisor, the Fund pays a monthly management feebased on the Fund’s average daily net assets, computed and accrued daily and payable monthly at the followingannual rates:
First $250 million of average daily net assets .390%
Next $750 million of average daily net assets .365%
Over $1 billion of average daily net assets .340%
Accordingly, for the year ended December 31, 2011, the fee pursuant to the Investment Management Agreementwas equivalent to an annual effective rate of 0.37% of the Fund’s average daily net assets.
Administration Fee. Pursuant to an Administrative Services Agreement, DIMA provides most administrativeservices to the Fund. For all services provided under the Administrative Services Agreement, the Fund pays theAdvisor an annual fee (�Administration Fee�) of 0.10% of the Fund’s average daily net assets, computed andaccrued daily and payable monthly. For the year ended December 31, 2011, the Administration Fee was $753,532,of which $59,675 is unpaid.
Service Provider Fees. DWS Investments Service Company (�DISC�), an affiliate of the Advisor, is the transferagent, dividend-paying agent and shareholder service agent for the Fund. Pursuant to a sub-transfer agencyagreement between DISC and DST Systems, Inc. (�DST�), DISC has delegated certain transfer agent,dividend-paying agent and shareholder service agent functions to DST. DISC compensates DST out of the
14 | DWS Variable Series I �DWS Capital Growth VIP
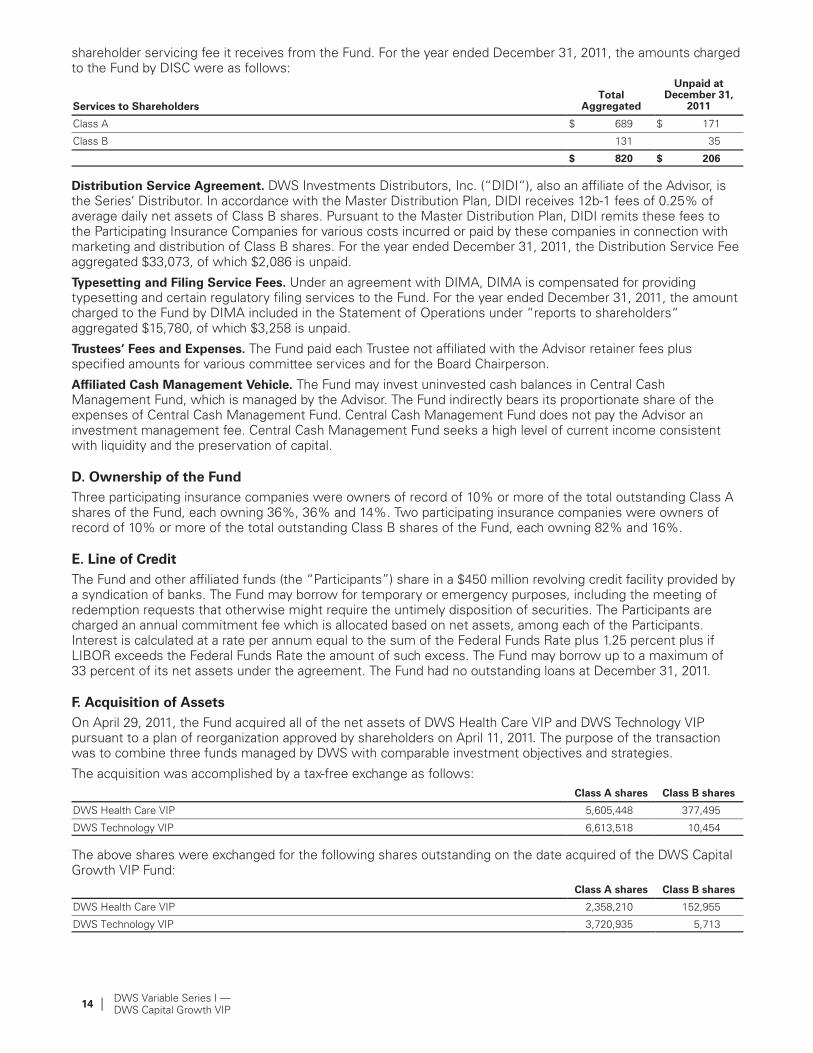
shareholder servicing fee it receives from the Fund. For the year ended December 31, 2011, the amounts chargedto the Fund by DISC were as follows:
Services to ShareholdersTotal
Aggregated
Unpaid atDecember 31,
2011
Class A $ 689 $ 171
Class B 131 35
$ 820 $ 206
Distribution Service Agreement. DWS Investments Distributors, Inc. (�DIDI�), also an affiliate of the Advisor, isthe Series’ Distributor. In accordance with the Master Distribution Plan, DIDI receives 12b-1 fees of 0.25% ofaverage daily net assets of Class B shares. Pursuant to the Master Distribution Plan, DIDI remits these fees tothe Participating Insurance Companies for various costs incurred or paid by these companies in connection withmarketing and distribution of Class B shares. For the year ended December 31, 2011, the Distribution Service Feeaggregated $33,073, of which $2,086 is unpaid.
Typesetting and Filing Service Fees. Under an agreement with DIMA, DIMA is compensated for providingtypesetting and certain regulatory filing services to the Fund. For the year ended December 31, 2011, the amountcharged to the Fund by DIMA included in the Statement of Operations under �reports to shareholders�aggregated $15,780, of which $3,258 is unpaid.
Trustees’ Fees and Expenses. The Fund paid each Trustee not affiliated with the Advisor retainer fees plusspecified amounts for various committee services and for the Board Chairperson.
Affiliated Cash Management Vehicle. The Fund may invest uninvested cash balances in Central CashManagement Fund, which is managed by the Advisor. The Fund indirectly bears its proportionate share of theexpenses of Central Cash Management Fund. Central Cash Management Fund does not pay the Advisor aninvestment management fee. Central Cash Management Fund seeks a high level of current income consistentwith liquidity and the preservation of capital.
D. Ownership of the Fund
Three participating insurance companies were owners of record of 10% or more of the total outstanding Class Ashares of the Fund, each owning 36%, 36% and 14%. Two participating insurance companies were owners ofrecord of 10% or more of the total outstanding Class B shares of the Fund, each owning 82% and 16%.
E. Line of Credit
The Fund and other affiliated funds (the �Participants") share in a $450 million revolving credit facility provided bya syndication of banks. The Fund may borrow for temporary or emergency purposes, including the meeting ofredemption requests that otherwise might require the untimely disposition of securities. The Participants arecharged an annual commitment fee which is allocated based on net assets, among each of the Participants.Interest is calculated at a rate per annum equal to the sum of the Federal Funds Rate plus 1.25 percent plus ifLIBOR exceeds the Federal Funds Rate the amount of such excess. The Fund may borrow up to a maximum of33 percent of its net assets under the agreement. The Fund had no outstanding loans at December 31, 2011.
F. Acquisition of Assets
On April 29, 2011, the Fund acquired all of the net assets of DWS Health Care VIP and DWS Technology VIPpursuant to a plan of reorganization approved by shareholders on April 11, 2011. The purpose of the transactionwas to combine three funds managed by DWS with comparable investment objectives and strategies.
The acquisition was accomplished by a tax-free exchange as follows:
Class A shares Class B shares
DWS Health Care VIP 5,605,448 377,495
DWS Technology VIP 6,613,518 10,454
The above shares were exchanged for the following shares outstanding on the date acquired of the DWS CapitalGrowth VIP Fund:
Class A shares Class B shares
DWS Health Care VIP 2,358,210 152,955
DWS Technology VIP 3,720,935 5,713
DWS Variable Series I �DWS Capital Growth VIP
| 15
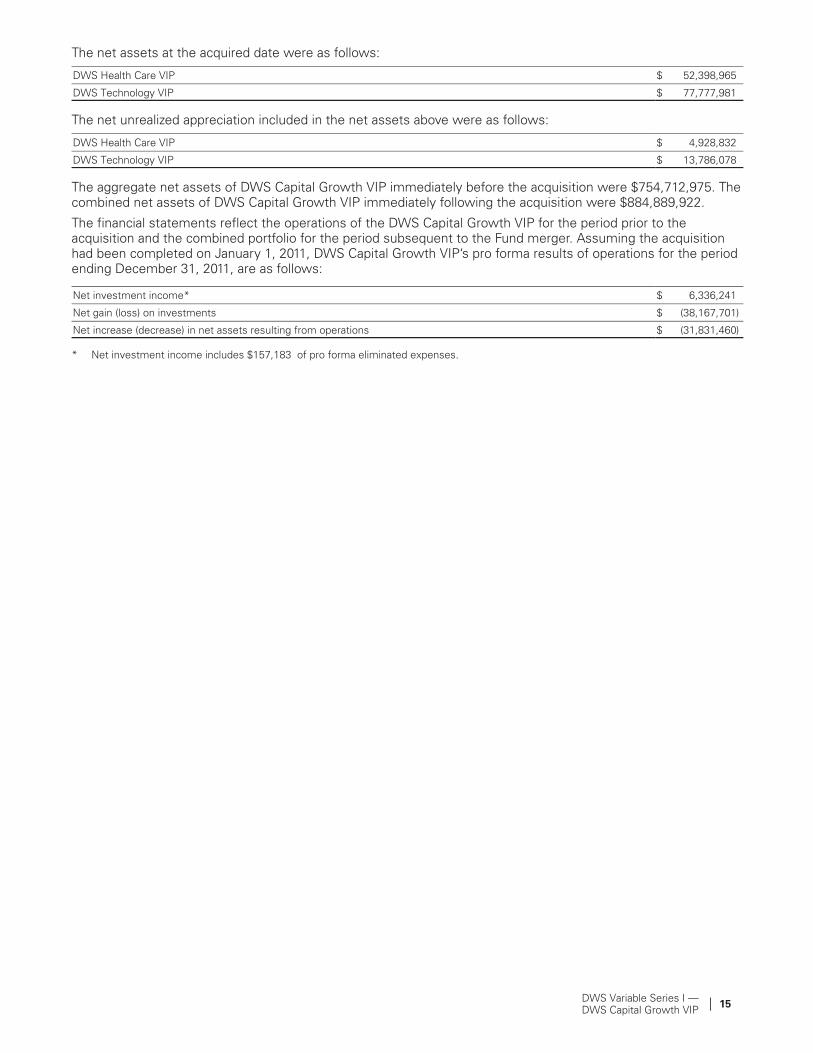
The net assets at the acquired date were as follows:
DWS Health Care VIP $ 52,398,965
DWS Technology VIP $ 77,777,981
The net unrealized appreciation included in the net assets above were as follows:
DWS Health Care VIP $ 4,928,832
DWS Technology VIP $ 13,786,078
The aggregate net assets of DWS Capital Growth VIP immediately before the acquisition were $754,712,975. Thecombined net assets of DWS Capital Growth VIP immediately following the acquisition were $884,889,922.
The financial statements reflect the operations of the DWS Capital Growth VIP for the period prior to theacquisition and the combined portfolio for the period subsequent to the Fund merger. Assuming the acquisitionhad been completed on January 1, 2011, DWS Capital Growth VIP’s pro forma results of operations for the periodending December 31, 2011, are as follows:
Net investment income* $ 6,336,241
Net gain (loss) on investments $ (38,167,701)
Net increase (decrease) in net assets resulting from operations $ (31,831,460)
* Net investment income includes $157,183 of pro forma eliminated expenses.
16 | DWS Variable Series I �DWS Capital Growth VIP
Report of Independent Registered Public Accounting Firm
To the Trustees of DWS Variable Series I and the Shareholders of DWS Capital Growth VIP:
In our opinion, the accompanying statement of assets and liabilities, including the investment portfolio, and the
related statements of operations and of changes in net assets and the financial highlights present fairly, in all
material respects, the financial position of DWS Capital Growth VIP (the �Fund") at December 31, 2011 and the
results of its operations, the changes in its net assets, and the financial highlights for the periods indicated
therein, in conformity with accounting principles generally accepted in the United States of America. These
financial statements and financial highlights (hereafter referred to as �financial statements�) are the responsibility
of the Fund’s management. Our responsibility is to express an opinion on these financial statements based on
our audits. We conducted our audits of these financial statements in accordance with the standards of the Public
Company Accounting Oversight Board (United States). Those standards require that we plan and perform the
audit to obtain reasonable assurance about whether the financial statements are free of material misstatement.
An audit includes examining, on a test basis, evidence supporting the amounts and disclosures in the financial
statements, assessing the accounting principles used and significant estimates made by management, and
evaluating the overall financial statement presentation. We believe that our audits, which included confirmation of
securities at December 31, 2011 by correspondence with the custodians and brokers, provide a reasonable basis
for our opinion.
Boston, Massachusetts
February 15, 2012
PricewaterhouseCoopers LLP
DWS Variable Series I �DWS Capital Growth VIP
| 17
Information About Your Fund’s Expenses
As an investor of the Fund, you incur two types of
costs: ongoing expenses and transaction costs.
Ongoing expenses include management fees,
distribution and service (12b-1) fees and other Fund
expenses. Examples of transaction costs include
contract charges and account maintenance fees,
which are not shown in this section. The following
tables are intended to help you understand your
ongoing expenses (in dollars) of investing in the Fund
and to help you compare these expenses with the
ongoing expenses of investing in other mutual funds.
The example in the table is based on an investment of
$1,000 invested at the beginning of the six-month
period and held for the entire period (July 1, 2011 to
December 31, 2011).
The tables illustrate your Fund’s expenses in two
ways:
� Actual Fund Return. This helps you estimate the
actual dollar amount of ongoing expenses (but not
transaction costs) paid on a $1,000 investment in
the Fund using the Fund’s actual return during the
period. To estimate the expenses you paid over
the period, simply divide your account value by
$1,000 (for example, an $8,600 account value
divided by $1,000 = 8.6), then multiply the result
by the number in the �Expenses Paid per $1,000"
line under the share class you hold.
� Hypothetical 5% Fund Return. This helps you to
compare your Fund’s ongoing expenses (but not
transaction costs) with those of other mutual
funds using the Fund’s actual expense ratio and a
hypothetical rate of return of 5% per year before
expenses. Examples using a 5% hypothetical Fund
return may be found in the shareholder reports of
other mutual funds. The hypothetical account
values and expenses may not be used to estimate
the actual ending account balance or expenses
you paid for the period.
Please note that the expenses shown in these tables
are meant to highlight your ongoing expenses only
and do not reflect any transaction costs. The
�Expenses Paid per $1,000" line of the tables is
useful in comparing ongoing expenses only and will
not help you determine the relative total expense of
owning different funds. If these transaction costs had
been included, your costs would have been higher.
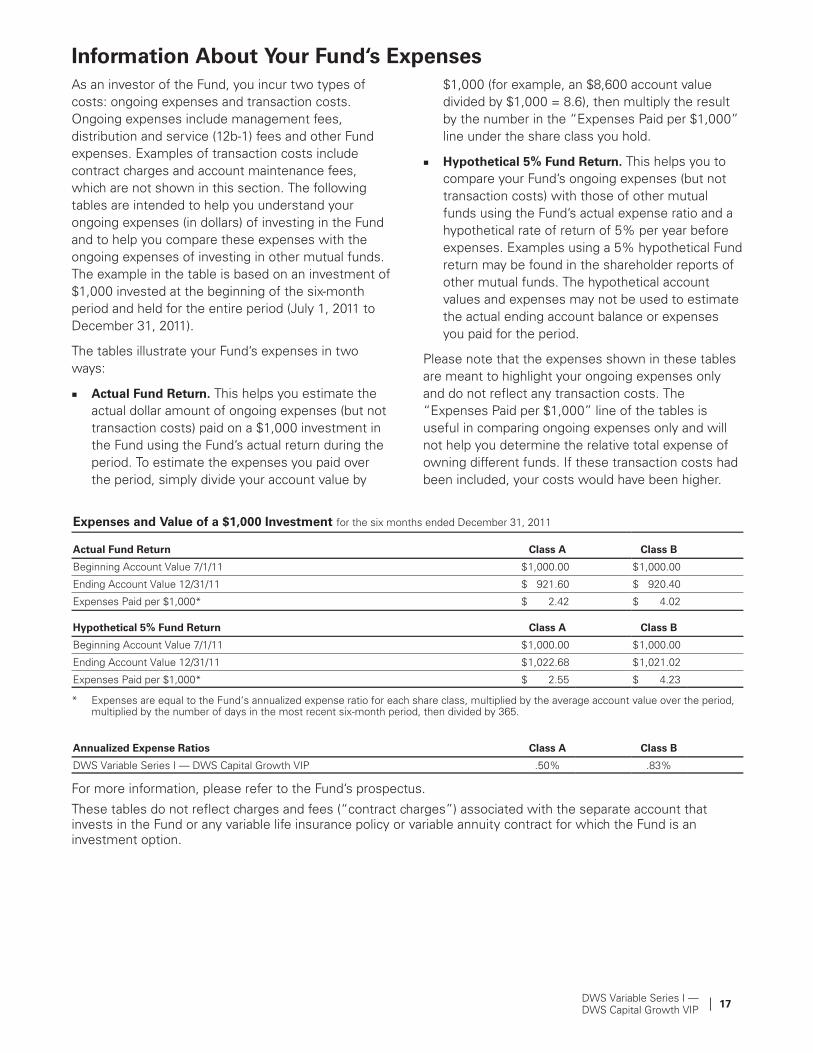
Expenses and Value of a $1,000 Investment for the six months ended December 31, 2011
Actual Fund Return Class A Class B
Beginning Account Value 7/1/11 $1,000.00 $1,000.00
Ending Account Value 12/31/11 $ 921.60 $ 920.40
Expenses Paid per $1,000* $ 2.42 $ 4.02
Hypothetical 5% Fund Return Class A Class B
Beginning Account Value 7/1/11 $1,000.00 $1,000.00
Ending Account Value 12/31/11 $1,022.68 $1,021.02
Expenses Paid per $1,000* $ 2.55 $ 4.23
* Expenses are equal to the Fund’s annualized expense ratio for each share class, multiplied by the average account value over the period,multiplied by the number of days in the most recent six-month period, then divided by 365.
Annualized Expense Ratios Class A Class B
DWS Variable Series I � DWS Capital Growth VIP .50% .83%
For more information, please refer to the Fund’s prospectus.
These tables do not reflect charges and fees (�contract charges") associated with the separate account thatinvests in the Fund or any variable life insurance policy or variable annuity contract for which the Fund is aninvestment option.
18 | DWS Variable Series I �DWS Capital Growth VIP
Tax Information (Unaudited)
For corporate shareholders, 100% of the ordinary dividends (i.e., income dividends plus short-term capital gains)
paid during the Fund’s fiscal year ended December 31, 2011 qualified for the dividends received deduction.
Please consult a tax advisor if you have questions about federal or state income tax laws, or on how to prepare
your tax returns. If you have specific questions about your account, please contact your insurance provider.
Proxy Voting
The Series’ policies and procedures for voting proxies for portfolio securities and information about how the
Series voted proxies related to its portfolio securities during the 12-month period ended June 30 are available on
our Web site � www.dws-investments.com (click on �proxy voting"at the bottom of the page) � or on the
SEC’s Web site � www.sec.gov. To obtain a written copy of the Series’ policies and procedures without charge,
upon request, call us toll free at (800) 728-3337.
DWS Variable Series I �DWS Capital Growth VIP
| 19
Investment Management Agreement ApprovalThe Board of Trustees approved the renewal of DWS Capital Growth VIP’s investment management agreement(the �Agreement") with Deutsche Investment Management Americas Inc. (�DWS") in September 2011.
In terms of the process that the Board followed prior to approving the Agreement, shareholders should knowthat:
� In September 2011, all of the Fund’s Trustees were independent of DWS and its affiliates.
� The Trustees met frequently during the past year to discuss fund matters and dedicated a substantial amountof time to contract review matters. Over the course of several months, the Board’s Contract Committee, incoordination with the Board’s Equity Oversight Committee, reviewed comprehensive materials received fromDWS, independent third parties and independent counsel. These materials included an analysis of the Fund’sperformance, fees and expenses, and profitability compiled by the Fund’s independent fee consultant. TheBoard also received extensive information throughout the year regarding performance of the Fund.
� The Independent Trustees regularly meet privately with their independent counsel to discuss contract reviewand other matters. In addition, the Independent Trustees were also advised by the Fund’s independent feeconsultant in the course of their review of the Fund’s contractual arrangements and considered acomprehensive report prepared by the independent fee consultant in connection with their deliberations (the�IFC Report").
� In connection with reviewing the Agreement, the Board also reviewed the terms of the Fund’s Rule 12b-1plan, distribution agreement, administrative services agreement, transfer agency agreement and othermaterial service agreements.
� Based on its evaluation of the information provided, the Contract Committee presented its findings andrecommendations to the Board. The Board then reviewed the Contract Committee’s findings andrecommendations.
In connection with the contract review process, the Contract Committee and the Board considered the factorsdiscussed below, among others. The Board also considered that DWS and its predecessors have managed theFund since its inception, and the Board believes that a long-term relationship with a capable, conscientiousadvisor is in the best interests of the Fund. The Board considered, generally, that shareholders chose to invest orremain invested in the Fund knowing that DWS managed the Fund, and that the Agreement was approved by theFund’s shareholders. DWS is part of Deutsche Bank, a major global banking institution that is engaged in a widerange of financial services. The Board believes that there are significant advantages to being part of a global assetmanagement business that offers a wide range of investing expertise and resources, including hundreds ofportfolio managers and analysts with research capabilities in many countries throughout the world.
While shareholders may focus primarily on fund performance and fees, the Fund’s Board considers these andmany other factors, including the quality and integrity of DWS’s personnel and such other issues as back-officeoperations, fund valuations, and compliance policies and procedures.
Nature, Quality and Extent of Services. The Board considered the terms of the Agreement, including the scopeof advisory services provided under the Agreement. The Board noted that, under the Agreement, DWS providesportfolio management services to the Fund and that, pursuant to a separate administrative services agreement,DWS provides administrative services to the Fund. The Board considered the experience and skills of seniormanagement and investment personnel, the resources made available to such personnel, the ability of DWS toattract and retain high-quality personnel, and the organizational depth and stability of DWS. The Board reviewedthe Fund’s performance over short-term and long-term periods and compared those returns to variousagreed-upon performance measures, including market indices and a peer universe compiled by the independentfee consultant using information supplied by Lipper Inc. (�Lipper"). The Board also noted that it has put into placea process of identifying �Focus Funds" (e.g., funds performing poorly relative to their benchmark or a peeruniverse compiled by an independent fund data service), and receives more frequent reporting and informationfrom DWS regarding such funds, along with DWS’s remedial plans to address underperformance. The Boardbelieves this process is an effective manner of identifying and addressing underperforming funds. Based on theinformation provided, the Board noted that for the one-, three- and five-year periods ended December 31, 2010,the Fund’s performance (Class A shares) was in the 2nd quartile, 1st quartile and 1st quartile, respectively, of theapplicable Lipper universe (the 1st quartile being the best performers and the 4th quartile being the worstperformers). The Board also observed that the Fund has performed the same as its benchmark in the one-yearperiod and has outperformed its benchmark in the three- and five-year periods ended December 31, 2010.
On the basis of this evaluation and the ongoing review of investment results by the Board, the Board concludedthat the nature, quality and extent of services provided by DWS historically have been and continue to besatisfactory.
20 | DWS Variable Series I �DWS Capital Growth VIP
Fees and Expenses. The Board considered the Fund’s investment management fee schedule, operating expensesand total expense ratios, and comparative information provided by Lipper and the independent fee consultantregarding investment management fee rates paid to other investment advisors by similar funds (1st quartile beingthe most favorable and 4th quartile being the least favorable). With respect to management fees paid to otherinvestment advisors by similar funds, the Board noted that the contractual fee rates paid by the Fund, whichinclude a 0.10% fee paid to DWS under the Fund’s administrative services agreement, were lower than themedian (1st quartile) of the applicable Lipper peer group (based on Lipper data provided as of December 31,2010). The Board noted that the Fund’s Class A shares total (net) operating expenses were expected to be lowerthan the median (1st quartile) of the applicable Lipper expense universe (based on Lipper data provided as ofDecember 31, 2010) (�Lipper Universe Expenses"). The Board also reviewed data comparing each share class’stotal (net) operating expenses to the applicable Lipper Universe Expenses. The Board considered the Fund’smanagement fee rate as compared to fees charged by DWS and certain of its affiliates for comparable mutualfunds and considered differences in fund and fee structures between the DWS Funds. The Board also consideredhow the Fund’s total (net) operating expenses compared to the total (net) operating expenses of a morecustomized peer group selected by Lipper (based on such factors as asset size).
The information considered by the Board as part of its review of management fees included information regardingfees charged by DWS and its affiliates to similar institutional accounts and to similar funds offered primarily toEuropean investors (�DWS Europe funds"), in each case as applicable. The Board observed that advisory feerates for institutional accounts generally were lower than the management fees charged by similarly managedDWS U.S. mutual funds (�DWS Funds"), but also took note of the differences in services provided to DWS Fundsas compared to institutional accounts. In the case of DWS Europe funds, the Board observed that fee rates forDWS Europe funds generally were higher than for similarly managed DWS Funds, but noted that differences inthe types of services provided to DWS Funds relative to DWS Europe funds made it difficult to compare suchfees.
On the basis of the information provided, the Board concluded that management fees were reasonable andappropriate in light of the nature, quality and extent of services provided by DWS.
Profitability. The Board reviewed detailed information regarding revenues received by DWS under theAgreement. The Board considered the estimated costs and pre-tax profits realized by DWS from advising theDWS Funds, as well as estimates of the pre-tax profits attributable to managing the Fund in particular. The Boardalso received information regarding the estimated enterprise-wide profitability of DWS and its affiliates withrespect to all fund services in totality and by fund. The Board and the independent fee consultant reviewedDWS’s methodology in allocating its costs to the management of the Fund. Based on the information provided,the Board concluded that the pre-tax profits realized by DWS in connection with the management of the Fundwere not unreasonable. The Board also reviewed information regarding the profitability of certain similarinvestment management firms. The Board noted that while information regarding the profitability of such firms islimited (and in some cases is not necessarily prepared on a comparable basis), DWS and its affiliates’ overallprofitability with respect to the DWS fund complex (after taking into account distribution and other servicesprovided to the funds by DWS and its affiliates) was lower than the overall profitability levels of many comparablefirms for which such data was available.
Economies of Scale. The Board considered whether there are economies of scale with respect to themanagement of the Fund and whether the Fund benefits from any economies of scale. The Board noted that theFund’s management fee schedule includes fee breakpoints. The Board concluded that the Fund’s fee schedulerepresents an appropriate sharing between the Fund and DWS of such economies of scale as may exist in themanagement of the Fund at current asset levels.
Other Benefits to DWS and Its Affiliates. The Board also considered the character and amount of other incidentalbenefits received by DWS and its affiliates, including any fees received by DWS for administrative servicesprovided to the Fund and any fees received by an affiliate of DWS for distribution services. The Board alsoconsidered benefits to DWS related to brokerage and soft-dollar allocations, including allocating brokerage to payfor research generated by parties other than the executing broker dealers, which pertain primarily to fundsinvesting in equity securities, along with the incidental public relations benefits to DWS related to DWS Fundsadvertising and cross-selling opportunities among DWS products and services. The Board concluded thatmanagement fees were reasonable in light of these fallout benefits.
Compliance. The Board considered the significant attention and resources dedicated by DWS to documentingand enhancing its compliance processes in recent years. The Board noted in particular (i) the experience andseniority of both DWS’s chief compliance officer and the Fund’s chief compliance officer; (ii) the large number ofDWS compliance personnel; and (iii) the substantial commitment of resources by DWS and its affiliates tocompliance matters.

DWS Variable Series I �DWS Capital Growth VIP
| 21
Based on all of the information considered and the conclusions reached, the Board unanimously determined thatthe continuation of the Agreement is in the best interests of the Fund. In making this determination, the Boarddid not give particular weight to any single factor identified above. The Board considered these factors over thecourse of numerous meetings, certain of which were in executive session with only the Independent Trusteesand their counsel present. It is possible that individual Trustees may have weighed these factors differently inreaching their individual decisions to approve the continuation of the Agreement.

22 | DWS Variable Series I �DWS Capital Growth VIP
Summary of Management Fee Evaluation by IndependentFee ConsultantSeptember 26, 2011
Pursuant to an Order entered into by Deutsche Investment Management Americas and affiliates (collectively, �DeAM")with the Attorney General of New York, I, Thomas H. Mack, have been appointed the Independent Fee Consultant forthe DWS Funds (formerly the DWS Scudder Funds). My duties include preparing an annual written evaluation of themanagement fees DeAM charges the Funds, considering among other factors the management fees charged by othermutual fund companies for like services, management fees DeAM charges other clients for like services, DeAM’s costsof supplying services under the management agreements and related profit margins, possible economies of scale if aFund grows larger, and the nature and quality of DeAM’s services, including fund performance. This report summarizesmy evaluation for 2011, including my qualifications, the evaluation process for each of the DWS Funds, considerationof certain complex-level factors, and my conclusions. I served in substantially the same capacity in 2007, 2008, 2009and 2010.
Qualifications
For more than 35 years I have served in various professional capacities within the investment management business. Ihave held investment analysis and advisory positions, including securities analyst, portfolio strategist and director ofinvestment policy with a large investment firm. I have also performed business management functions, includingbusiness development, financial management and marketing research and analysis.
Since 1991, I have been an independent consultant within the asset management industry. I have provided services toover 125 client organizations, including investment managers, mutual fund boards, product distributors and relatedorganizations. Over the past ten years I have completed a number of assignments for mutual fund boards, specificallyincluding assisting boards with management contract renewal.
I hold a Master of Business Administration degree, with highest honors, from Harvard University and Master ofScience and Bachelor of Science (highest honors) degrees from the University of California at Berkeley. I am anindependent director and audit committee financial expert for two closed-end mutual funds and have served in variousleadership and financial oversight capacities with non-profit organizations.
Evaluation of Fees for each DWS Fund
My work focused primarily on evaluating, fund-by-fund, the fees charged to each of the 109 mutual fund portfolios inthe DWS Fund family. For each Fund, I considered each of the key factors mentioned above, as well as any otherrelevant information. In doing so I worked closely with the Funds’ Independent Directors in their annual contractrenewal process, as well as in their approval of contracts for several new funds (documented separately).
In evaluating each Fund’s fees, I reviewed comprehensive materials provided by or on behalf of DeAM, includingexpense information prepared by Lipper Analytical, comparative performance information, profitability data, managerhistories, and other materials. I also accessed certain additional information from the Lipper and Morningstar databasesand drew on my industry knowledge and experience.
To facilitate evaluating this considerable body of information, I prepared for each Fund a document summarizing the keydata elements in each area as well as additional analytics discussed below. This made it possible to consider each keydata element in the context of the others.
In the course of contract renewal, DeAM agreed to implement a number of fee and expense adjustments requested bythe Independent Directors which will favorably impact future fees and expenses, and my evaluation includes the effectsof these changes.
Fees and Expenses Compared with Other Funds
The competitive fee and expense evaluation for each fund focused on two primary comparisons:
The Fund’s contractual management fee (the advisory fee plus the administration fee where applicable) comparedwith those of a group of typically 12–15 funds in the same Lipper investment category (e.g. Large CapitalizationGrowth) having similar distribution arrangements and being of similar size.
The Fund’s total expenses compared with a broader universe of funds from the same Lipper investment categoryand having similar distribution arrangements.
These two comparisons provide a view of not only the level of the fee compared with funds of similar scale but alsothe total expense the Fund bears for all the services it receives, in comparison with the investment choices available inthe Fund’s investment category and distribution channel. The principal figure-of-merit used in these comparisons wasthe subject Fund’s percentile ranking against peers.
DeAM’s Fees for Similar Services to Others
DeAM provided management fee schedules for all of its US domiciled fund and non-fund investment managementaccounts in any of the investment categories where there is a DWS Fund. These similar products included the otherDWS Funds, non-fund pooled accounts, institutional accounts and sub-advisory accounts. Using this information, Icalculated for each Fund the fee that would be charged to each similar product, at the subject Fund’s asset level.
DWS Variable Series I �DWS Capital Growth VIP
| 23
Evaluating information regarding non-fund products is difficult because there are varying levels of services required fordifferent types of accounts, with mutual funds generally requiring considerably more regulatory and administrativetypes of service as well as having more frequent cash flows than other types of accounts. Also, while mutual fund feesfor similar fund products can be expected to be similar, there will be some differences due to different pricingconditions in different distribution channels (e.g. retail funds versus those used in variable insurance products),differences in underlying investment processes and other factors.
Costs and Profit Margins
DeAM provided a detailed profitability analysis for each Fund. After making some adjustments so that the presentationwould be more comparable to the available industry figures, I reviewed profit margins from investment managementalone, from investment management plus other fund services (excluding distribution) provided to the Funds by DeAM(principally shareholder services), and DeAM profits from all sources, including distribution. A later section commentson overall profitability.
Economies of Scale
Economies of scale � an expected decline in management cost per dollar of fund assets as fund assets grow � arevery rarely quantified and documented because of inherent difficulties in collecting and analyzing relevant data.However, in virtually every investment category that I reviewed, larger funds tend to have lower fees and lower totalexpenses than smaller funds. To see how each DWS Fund compares with this industry observation, I reviewed:
The trend in Fund assets over the last five years and the accompanying trend in total expenses. This shows if theFund has grown and, if so, whether total expense (management fees as well as other expenses) have declined as apercent of assets.
Whether the Fund has break-points in its management fee schedule, the extent of the fee reduction built into theschedule and the asset levels where the breaks take effect, and in the case of a sub-advised Fund how the Fund’sbreak-points compare with those of the sub-advisory fee schedule.
How the Fund’s contractual fee schedule compares with trends in the industry data. To accomplish this, Iconstructed a chart showing how actual latest-fiscal-year contractual fees of the Fund and of other similar fundsrelate to average fund assets, with the subject Fund’s contractual fee schedule superimposed.
Quality of Service � Performance
The quality-of-service evaluation focused on investment performance, which is the principal result of the investmentmanagement service. Each Fund’s performance was reviewed over the past 1, 3, 5 and 10 years, as applicable, andcompared with that of other funds in the same investment category and with a suitable market index.
In addition, I calculated and reviewed risk-adjusted returns relative to an index of similar mutual funds’ returns and asuitable market index. The risk-adjusted returns analysis provides a way of determining the extent to which the Fund’sreturn comparisons are mainly the product of investment value-added (or lack thereof) or alternatively takingconsiderably more or less risk than is typical in its investment category.
I also received and considered the history of portfolio manager changes for each Fund, as this provided an importantcontext for evaluating the performance results.
Complex-Level Considerations
While this evaluation was conducted mainly at the individual fund level, there are some issues relating to thereasonableness of fees that can alternatively be considered across the whole fund complex:
I reviewed DeAM’s profitability analysis for all DWS Funds, with a view toward determining if the allocationprocedures used were reasonable and how profit levels compared with public data for other investment managers.
I considered whether DeAM and affiliates receive any significant ancillary or �fall-out" benefits that should beconsidered in interpreting the direct profitability results. These would be situations where serving as the investmentmanager of the Funds is beneficial to another part of the Deutsche Bank organization.
I considered how aggregated DWS Fund expenses had varied over the years, by asset class and in the context oftrends in asset levels.
I reviewed the structure of the DeAM organization, trends in staffing levels, and information on compensation ofinvestment management and other professionals compared with industry data.
Findings
Based on the process and analysis discussed above, which included reviewing a wide range of information frommanagement and external data sources and considering among other factors the fees DeAM charges other clients, thefees charged by other fund managers, DeAM’s costs and profits associated with managing the Funds, economies ofscale, possible fall-out benefits, and the nature and quality of services provided, in my opinion the management feescharged the DWS Funds are reasonable.
Thomas H. MackPresident, Thomas H. Mack & Co., Inc.
24 | DWS Variable Series I �DWS Capital Growth VIP
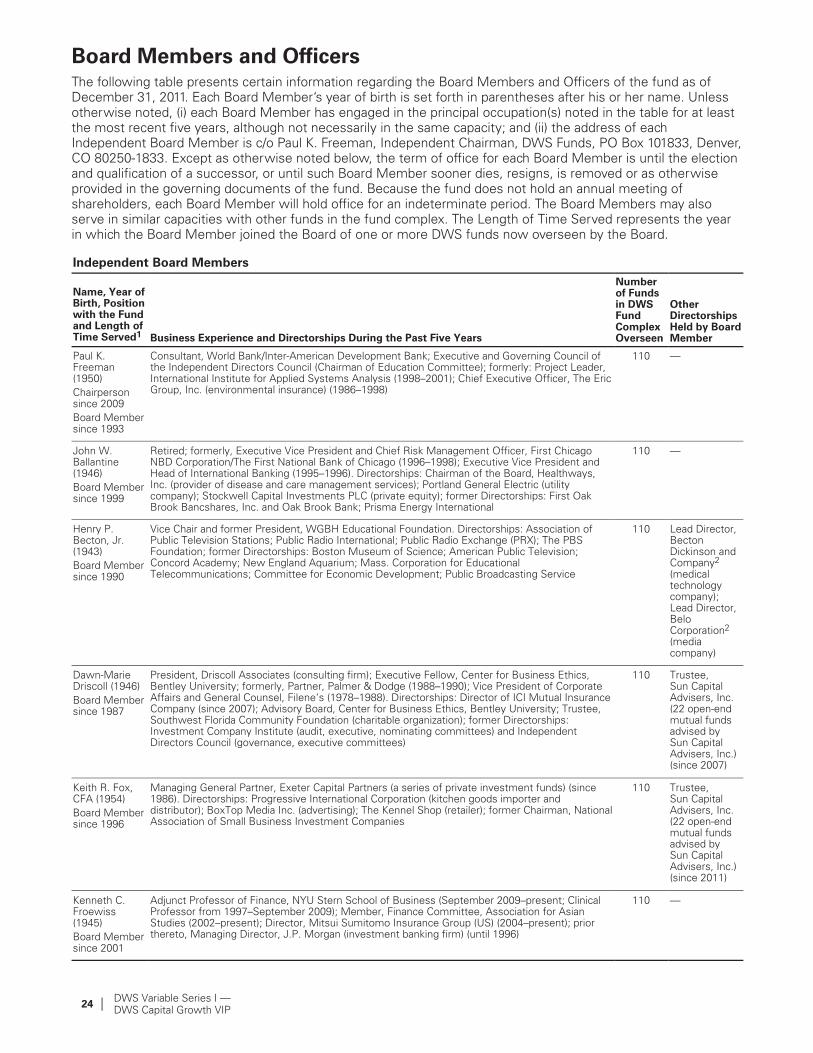
Board Members and OfficersThe following table presents certain information regarding the Board Members and Officers of the fund as ofDecember 31, 2011. Each Board Member’s year of birth is set forth in parentheses after his or her name. Unlessotherwise noted, (i) each Board Member has engaged in the principal occupation(s) noted in the table for at leastthe most recent five years, although not necessarily in the same capacity; and (ii) the address of eachIndependent Board Member is c/o Paul K. Freeman, Independent Chairman, DWS Funds, PO Box 101833, Denver,CO 80250-1833. Except as otherwise noted below, the term of office for each Board Member is until the electionand qualification of a successor, or until such Board Member sooner dies, resigns, is removed or as otherwiseprovided in the governing documents of the fund. Because the fund does not hold an annual meeting ofshareholders, each Board Member will hold office for an indeterminate period. The Board Members may alsoserve in similar capacities with other funds in the fund complex. The Length of Time Served represents the yearin which the Board Member joined the Board of one or more DWS funds now overseen by the Board.
Independent Board Members
Name, Year ofBirth, Positionwith the Fundand Length ofTime Served1 Business Experience and Directorships During the Past Five Years
Numberof Fundsin DWSFundComplexOverseen
OtherDirectorshipsHeld by BoardMember
Paul K.Freeman(1950)
Chairpersonsince 2009
Board Membersince 1993
Consultant, World Bank/Inter−American Development Bank; Executive and Governing Council ofthe Independent Directors Council (Chairman of Education Committee); formerly: Project Leader,International Institute for Applied Systems Analysis (1998–2001); Chief Executive Officer, The EricGroup, Inc. (environmental insurance) (1986–1998)
110 �
John W.Ballantine(1946)
Board Membersince 1999
Retired; formerly, Executive Vice President and Chief Risk Management Officer, First ChicagoNBD Corporation/The First National Bank of Chicago (1996–1998); Executive Vice President andHead of International Banking (1995–1996). Directorships: Chairman of the Board, Healthways,Inc. (provider of disease and care management services); Portland General Electric (utilitycompany); Stockwell Capital Investments PLC (private equity); former Directorships: First OakBrook Bancshares, Inc. and Oak Brook Bank; Prisma Energy International
110 �
Henry P.Becton, Jr.(1943)
Board Membersince 1990
Vice Chair and former President, WGBH Educational Foundation. Directorships: Association ofPublic Television Stations; Public Radio International; Public Radio Exchange (PRX); The PBSFoundation; former Directorships: Boston Museum of Science; American Public Television;Concord Academy; New England Aquarium; Mass. Corporation for EducationalTelecommunications; Committee for Economic Development; Public Broadcasting Service
110 Lead Director,BectonDickinson andCompany2
(medicaltechnologycompany);Lead Director,BeloCorporation2
(mediacompany)
Dawn-MarieDriscoll (1946)
Board Membersince 1987
President, Driscoll Associates (consulting firm); Executive Fellow, Center for Business Ethics,Bentley University; formerly, Partner, Palmer & Dodge (1988–1990); Vice President of CorporateAffairs and General Counsel, Filene’s (1978–1988). Directorships: Director of ICI Mutual InsuranceCompany (since 2007); Advisory Board, Center for Business Ethics, Bentley University; Trustee,Southwest Florida Community Foundation (charitable organization); former Directorships:Investment Company Institute (audit, executive, nominating committees) and IndependentDirectors Council (governance, executive committees)
110 Trustee,Sun CapitalAdvisers, Inc.(22 open-endmutual fundsadvised bySun CapitalAdvisers, Inc.)(since 2007)
Keith R. Fox,CFA (1954)
Board Membersince 1996
Managing General Partner, Exeter Capital Partners (a series of private investment funds) (since1986). Directorships: Progressive International Corporation (kitchen goods importer anddistributor); BoxTop Media Inc. (advertising); The Kennel Shop (retailer); former Chairman, NationalAssociation of Small Business Investment Companies
110 Trustee,Sun CapitalAdvisers, Inc.(22 open-endmutual fundsadvised bySun CapitalAdvisers, Inc.)(since 2011)
Kenneth C.Froewiss(1945)
Board Membersince 2001
Adjunct Professor of Finance, NYU Stern School of Business (September 2009–present; ClinicalProfessor from 1997–September 2009); Member, Finance Committee, Association for AsianStudies (2002–present); Director, Mitsui Sumitomo Insurance Group (US) (2004–present); priorthereto, Managing Director, J.P. Morgan (investment banking firm) (until 1996)
110 �
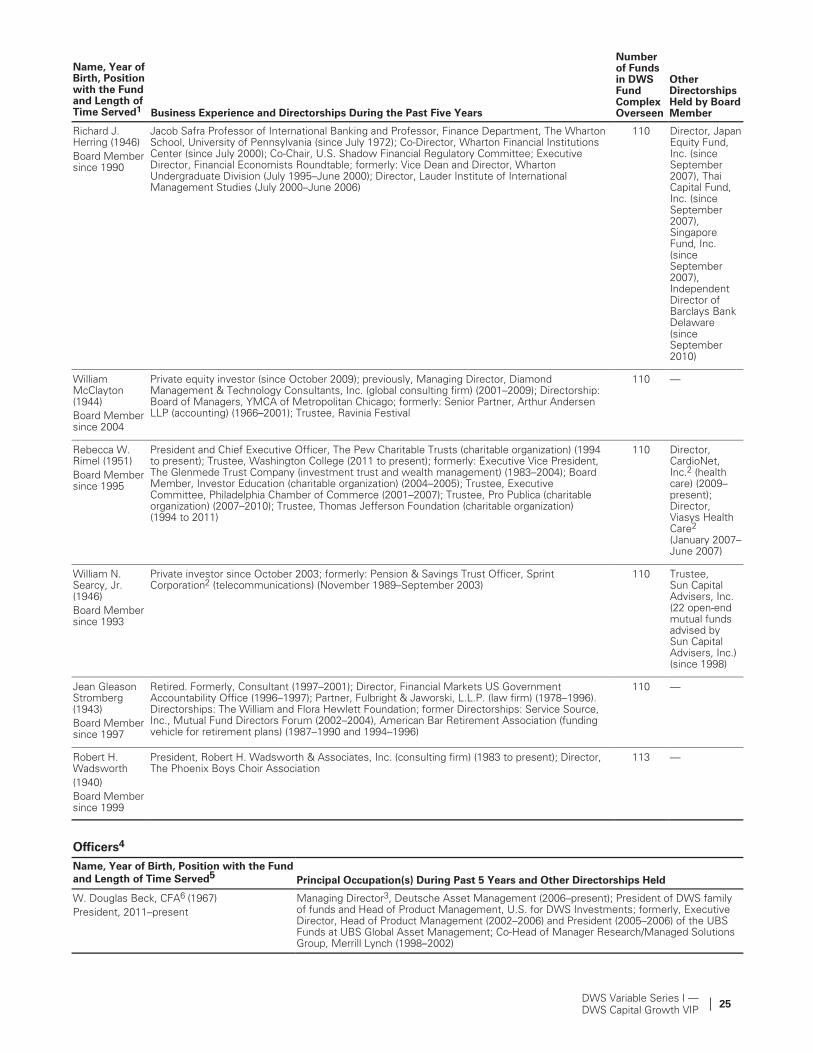
DWS Variable Series I �DWS Capital Growth VIP
| 25
Name, Year ofBirth, Positionwith the Fundand Length ofTime Served1
OtherDirectorshipsHeld by BoardMember
Numberof Fundsin DWSFundComplexOverseenBusiness Experience and Directorships During the Past Five Years
Richard J.Herring (1946)
Board Membersince 1990
Jacob Safra Professor of International Banking and Professor, Finance Department, The WhartonSchool, University of Pennsylvania (since July 1972); Co-Director, Wharton Financial InstitutionsCenter (since July 2000); Co-Chair, U.S. Shadow Financial Regulatory Committee; ExecutiveDirector, Financial Economists Roundtable; formerly: Vice Dean and Director, WhartonUndergraduate Division (July 1995–June 2000); Director, Lauder Institute of InternationalManagement Studies (July 2000–June 2006)
110 Director, JapanEquity Fund,Inc. (sinceSeptember2007), ThaiCapital Fund,Inc. (sinceSeptember2007),SingaporeFund, Inc.(sinceSeptember2007),IndependentDirector ofBarclays BankDelaware(sinceSeptember2010)
WilliamMcClayton(1944)
Board Membersince 2004
Private equity investor (since October 2009); previously, Managing Director, DiamondManagement & Technology Consultants, Inc. (global consulting firm) (2001–2009); Directorship:Board of Managers, YMCA of Metropolitan Chicago; formerly: Senior Partner, Arthur AndersenLLP (accounting) (1966–2001); Trustee, Ravinia Festival
110 �
Rebecca W.Rimel (1951)
Board Membersince 1995
President and Chief Executive Officer, The Pew Charitable Trusts (charitable organization) (1994to present); Trustee, Washington College (2011 to present); formerly: Executive Vice President,The Glenmede Trust Company (investment trust and wealth management) (1983–2004); BoardMember, Investor Education (charitable organization) (2004–2005); Trustee, ExecutiveCommittee, Philadelphia Chamber of Commerce (2001–2007); Trustee, Pro Publica (charitableorganization) (2007–2010); Trustee, Thomas Jefferson Foundation (charitable organization)(1994 to 2011)
110 Director,CardioNet,Inc.2 (healthcare) (2009–present);Director,Viasys HealthCare2
(January 2007–June 2007)
William N.Searcy, Jr.(1946)
Board Membersince 1993
Private investor since October 2003; formerly: Pension & Savings Trust Officer, SprintCorporation2 (telecommunications) (November 1989–September 2003)
110 Trustee,Sun CapitalAdvisers, Inc.(22 open-endmutual fundsadvised bySun CapitalAdvisers, Inc.)(since 1998)
Jean GleasonStromberg(1943)
Board Membersince 1997
Retired. Formerly, Consultant (1997–2001); Director, Financial Markets US GovernmentAccountability Office (1996–1997); Partner, Fulbright & Jaworski, L.L.P. (law firm) (1978–1996).Directorships: The William and Flora Hewlett Foundation; former Directorships: Service Source,Inc., Mutual Fund Directors Forum (2002–2004), American Bar Retirement Association (fundingvehicle for retirement plans) (1987–1990 and 1994–1996)
110 �
Robert H.Wadsworth
(1940)
Board Membersince 1999
President, Robert H. Wadsworth & Associates, Inc. (consulting firm) (1983 to present); Director,The Phoenix Boys Choir Association
113 �
Officers4
Name, Year of Birth, Position with the Fund
and Length of Time Served5Principal Occupation(s) During Past 5 Years and Other Directorships Held
W. Douglas Beck, CFA6 (1967)
President, 2011–present
Managing Director3, Deutsche Asset Management (2006–present); President of DWS familyof funds and Head of Product Management, U.S. for DWS Investments; formerly, ExecutiveDirector, Head of Product Management (2002–2006) and President (2005–2006) of the UBSFunds at UBS Global Asset Management; Co-Head of Manager Research/Managed SolutionsGroup, Merrill Lynch (1998–2002)
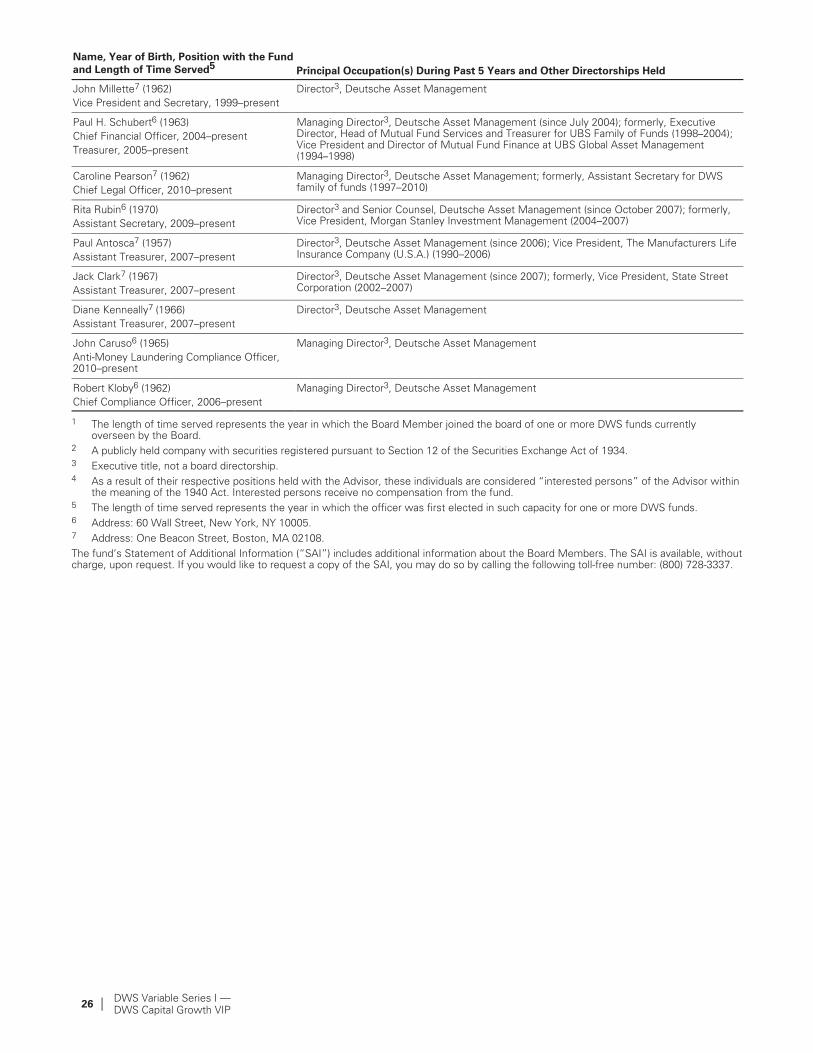
26 | DWS Variable Series I �DWS Capital Growth VIP
Name, Year of Birth, Position with the Fund
and Length of Time Served5Principal Occupation(s) During Past 5 Years and Other Directorships Held
John Millette7 (1962)
Vice President and Secretary, 1999–present
Director3, Deutsche Asset Management
Paul H. Schubert6 (1963)
Chief Financial Officer, 2004–present
Treasurer, 2005–present
Managing Director3, Deutsche Asset Management (since July 2004); formerly, ExecutiveDirector, Head of Mutual Fund Services and Treasurer for UBS Family of Funds (1998–2004);Vice President and Director of Mutual Fund Finance at UBS Global Asset Management(1994–1998)
Caroline Pearson7 (1962)
Chief Legal Officer, 2010–present
Managing Director3, Deutsche Asset Management; formerly, Assistant Secretary for DWSfamily of funds (1997–2010)
Rita Rubin6 (1970)
Assistant Secretary, 2009–present
Director3 and Senior Counsel, Deutsche Asset Management (since October 2007); formerly,Vice President, Morgan Stanley Investment Management (2004–2007)
Paul Antosca7 (1957)
Assistant Treasurer, 2007–present
Director3, Deutsche Asset Management (since 2006); Vice President, The Manufacturers LifeInsurance Company (U.S.A.) (1990–2006)
Jack Clark7 (1967)
Assistant Treasurer, 2007–present
Director3, Deutsche Asset Management (since 2007); formerly, Vice President, State StreetCorporation (2002–2007)
Diane Kenneally7 (1966)
Assistant Treasurer, 2007–present
Director3, Deutsche Asset Management
John Caruso6 (1965)
Anti-Money Laundering Compliance Officer,2010–present
Managing Director3, Deutsche Asset Management
Robert Kloby6 (1962)
Chief Compliance Officer, 2006–present
Managing Director3, Deutsche Asset Management
1 The length of time served represents the year in which the Board Member joined the board of one or more DWS funds currentlyoverseen by the Board.
2 A publicly held company with securities registered pursuant to Section 12 of the Securities Exchange Act of 1934.3 Executive title, not a board directorship.4 As a result of their respective positions held with the Advisor, these individuals are considered �interested persons" of the Advisor within
the meaning of the 1940 Act. Interested persons receive no compensation from the fund.5 The length of time served represents the year in which the officer was first elected in such capacity for one or more DWS funds.6 Address: 60 Wall Street, New York, NY 10005.7 Address: One Beacon Street, Boston, MA 02108.
The fund’s Statement of Additional Information (�SAI") includes additional information about the Board Members. The SAI is available, withoutcharge, upon request. If you would like to request a copy of the SAI, you may do so by calling the following toll-free number: (800) 728−3337.

DWS Variable Series I �DWS Capital Growth VIP
| 27
Notes

28 | DWS Variable Series I �DWS Capital Growth VIP
DWS Investments Distributors, Inc.
222 South Riverside Plaza
Chicago, IL�60606
(800) 621-1148
VS1capgro-2� (R-025820-1 2/12)