annual report - biessegroup.com · as announced on 28 february of this year, the is a plan to float...
TRANSCRIPT

REPORT
ANNUAL REPORT 31 DECEMBER 2017
17

INDEX THE BIESSE GROUPGroup Structure pag. 08Financial Highlights pag. 12Corporate bodies pag. 14
DIRECTORS’ REPORT General economic overview pag. 18Business sector review pag. 202017 Trends pag. 21 Main events pag. 22Income Statement highlights pag. 32Statement of Financial Position highlights pag. 37Main risks and uncertainties to which Biesse S.p.A. and the Group are exposed pag. 39Corporate governance pag. 442017 Research and Development Activities pag. 44Reconciliation between tthe Equity and Results and Consolidated Equity and Results of the Parent pag. 50Related party transactions pag. 50Other related party transaction pag. 51Information on significant companies outside the EU pag. 52Personnel pag. 52Shares in Biesse and/or its subsidiaries, held directly or indirectly by members of the Board of Directors, the Board of Statutory Auditors and the General Manager, as well as by their respective spouses where not legally separated and by their children pag. 53“Atypical and/or Unusual” transactions of the year pag. 54Significant events after the reporting date and outlook pag. 54Directors’ report of Biesse S.p.A. pag. 57Other information pag. 60Proposal to the ordinary shareholders’ meeting pag. 61
CONSOLIDATED FINANCIAL STATEMENTS AT 31 DECEMBER 2017Consolidated Income Statement pag. 64Consolidated Statement of Comprehensive Income pag. 65Consolidated Statement of Financial Position pag. 66Consolidated Statement of Cash Flows pag. 67Consolidated Statement of Changes in Equity pag. 68
NOTES TO THE CONSOLIDATED FINANCIAL STATEMENTSNotes to the Consolidated Financial Statements pag. 71Statement of Financial Position pag. 90Annexes pag. 117
CASE HISTORIES pag. 120INDEPENDENT AUDITOR’S REPORT pag. 136
Cover:
Rezzonico chandeliermade with Intermac technological solutionsexhibited at the 2018 Milan Design Weekdesigner: Raffaello Galiottoproducer: Generelli Marmi
2
LIVE THE EXPERIENCE
THINKFORWARD is the ability of Biesse Group to look ahead and anticipate the future, raising the bar in technological innovation and digital transformation. We create and share innovation by planning, developing and distributing integrated solutions and advanced services to help our customers produce more, better and with greater safety.
THINK FORWARD

2017 ANNUAL REPORT
54
DEAR SHAREHOLDER,
the financial year ending 31 December 2017 represents another record year for Biesse, with the strongest ever results for all key financial components: consolidated revenue, operating profita-bility and net profit, all of which contributed towards a positive Financial Position of more than € 30 M at the end of the year. We are proud of these results, which are the fruit of the extra-ordinary work of the men and women working for the Group, both in Italy and throughout the world, with unequalled dedica-tion and perseverance. These results are based solidly on the three cornerstones of our strategy: innovation, the distribution network, and customer service, with the latter the target of un-precedented investments that will also characterise the next three years. Growth across all of the Group’s Divisions was once again abo-ve the average for the respective industries, and resulted in a si-gnificant improvement in our market shares at the global level.
From a geographical viewpoint, starting with the domestic market, it is clear that our business segments are finally expe-riencing a generalised phase of recovery; The Group’s consoli-dated turnover in our country accounts for 16.6% of the total, and is up from previous years thanks also to the enlightened tax incentives that the Government has introduced, specifi-cally with regard to the Industry 4.0. incentives scheme. Inter-nationally, as well as considerable growth in Western Europe (+10.1%), business in the Asia-Pacific area is also up (+18.9%), while recovery in Eastern Europe, although not yet not comple-te, continues (+18.9%); revenue from the North American mar-ket (U.S.A. and Canada) accounts for 16.2% of group turnover.
In terms of the Group’s various businesses, the “Wood” Divi-sion continues to dominate, with 71% of total sales making it by far the Group’s most important business. At the same time, the “Glass&Stone” Division, and in particular the “Mechatro-nics” Division (the top performer in terms of profitability), are growing at exceptional rates.
Also as a result of the above, we have achieved particularly en-couraging results in the financial markets, which over the last 12 months have seen us achieve unprecedented levels of per-formance. At the official closing on 31 March 2018, the STAR segment of the Italian Stock Exchange (Borsa Italiana) recor-ded a growth of 89.2% in the price of our shares compared with the same period of 2016, and an increase of 435.6% over the official quotation in June 2001. Total capitalisation of Biesse’s shares at the end of March 2018, exceeded € 1.3 billion. Group turnover was up 11.6% from the previous year, EBITDA was over € 89 million, while EBIT was almost € 67 million, be-fore non-recurrent items.. Net profit was up 44.7% on 2016, re-aching € 42.7 million, with a satisfactory, desired reduction in the tax rate compared to Biesse’s historical average (tax rate of 29.6% at the end of 2017). This latter figure was positively impacted by the “patent box” effect that the Group achieved in December 2017 solely in regard to the company HSD S.p.A.; we expect the parent company, Biesse S.p.A., to also obtain this tax relief in 2018.
The Financial Position at 31 December 2017 was positive, and equal to € 30.4 million, with net cash flow of over € 36 million re-sulting from the Group’s traditional business. This means that net of the dividends paid in May 2017 (€ 9.8 million) and of the substantial investments made in innovation and the expansion of productive capacity, the Biesse Group generated cash flow of € 26.4 million (a net improvement on December 2016).
During 2017, Biesse continued to implement significant hiring schemes, with the aim of structuring its international organi-sation to provide support to the Group’s business strategies. Despite the fact that this inevitably impacts the structure of costs, the investment in human capital constitutes a vital aid to the growth envisaged by the Group’s business plan.
Our proven capacity to create worth, together with the unque-stionable validity of the “Biesse” business model, means that at the next Shareholders’ Meeting we can propose payment of an ordinary dividend of € 0.48 per share, to be distributed with value date 9 May 2018 (issue of dividend coupon on 7 May 2018).
On 28 February 2018 the new Three-Year Business Plan (2018-2019-2020) was approved, containing clear references to the Group’s future development, not only in the traditional business sectors, but also in “adjacent” industries where our technology can be effectively employed, as in the case of recent succes-ses in the sector of machinery for the processing of Advanced Materials (plastics, composites and aluminium). As announced on 28 February of this year, the is a plan to float Biesse’s Mechatronics Division on the stock exchange (STAR segment) with the aim of guaranteeing the subsidiary HSD S.p.A. the financial support it needs for further growth, inclu-ding that of its external lines. Biesse shall of course maintain control of HSD, thus guaranteeing the business synergies in their respective sectors, while at the same time granting it gre-ater autonomy and means with which to strengthen HSD’s lea-dership in the design, production and marketing of electrospin-dles, bi-rotary electroheads, smart devices for the processing of wood, metal, alloys and composite materials, aimed at au-tomotive and aerospace companies, and consumer electronic goods, robotic systems and furniture producers.
Thanks to the SOPHIA (IIOT) Platform, in the next three years Biesse will continue to invest in digital technologies, including them systematically in the company’s “core” processes in order to synchronise innovation and growth. The related pro-ducts will permit the company to improve customer-product relations through applications, software and new pay-per-use services, designed to lend support to the process of servitiza-tion that Biesse considers of considerable strategic importan-ce. The aim is to offer our customers both a unique experience in terms of the services associated with our products, and the best possible solutions offered by the 4.0 industrial revolution.
Group Managing DirectorStefano Porcellini
LETTER TO SHAREHOLDER
GROWTH

THEGROUP
Biesse Group is a global leader in technologies for processing wood, glass, stone, plastic and metal. Founded in Pesaro in 1969 by Giancarlo Selci, the company has been listed on the STAR sector of Borsa Italiana since June 2001 and is currently a constituent of the FTSE IT Mid Cap index.

2017 ANNUAL REPORT
98
The following companies belong to the Biesse Group and are included in the scope of consolidation:
GROUP STRUCTURE
Notes: the different colours represent the subgroups of the control chain
Compared to the consolidated financial statements for as at and the year ended 31 December 2016, the scope of consoli-dation underwent the following changes:
• Acquisition of the company BS SOFT S.r.l. on 10 April 2017. With the aim of strengthening its offer in the system world and being even more autonomous in the development of projects in support of Industry 4.0, Biesse S.p.A., through the newCo. BT SOFT on 10 April 2017 acquired control of the company Avant S.r.l. Software & Engineering, specialised in the develop-ment of software for the integration and supervision of wor-king cells and lines. The Avant applications can automatically manage all information of the production process, from cut-ting to edgebanding, drilling and, in recent years, also sorting, the backbone of every batch-one production. The acquisition price amounted to € 500 thousand. The difference between the acquisition price and the amount of assets and liabilities acquired, amounting to € 494,210, pending the PPA, was provi-sionally allocated to goodwill in the wood division.• The liquidation of Intermac Guangzhou Co. Ltd was comple-ted in June 2017.• On 27 July 2017, a newco was set up called Montresor & Co. S.r.l. (with a 90% stake held by Biesse S.p.A. and 10% by Dona-toni Macchine S.r.l.) whose purpose is the acquisition of Mon-tresor & C. S.r.l., which is based in the province of Verona and manufactures edge polishers machinery (glass and marble). The acquisition was completed on 3 August 2017 with the pay-ment of the first tranche of 65% of the agreed price (€ 4.8 mil-lion, net of payables due to employees, payments on account and/or guarantee deposits and the estimate of the invento-ries bought). In the agreements among the members of the newco (Montresor & Co. S.r.l.), the possibility is envisaged for the non-controlling stakeholder Donatoni to undertake a share capital increase for a further 30% to reach a 40% stake. The
difference between the acquisition price and the value of as-sets and liabilities acquired, amounting to € 2,414,071, pending the PPA, was provisionally allocated to goodwill in the glass division. On 21 December 2017, 30% of Biesse S.p.A. sharehol-dings were transferred to Donatoni Macchine S.r.l. At the same time, the liquidation of Montresor & C. S.r.l. took place.• On 27 July 2017, Biesse S.p.A. signed an agreement to acqui-re 60% of the shares of MOVETRO S.r.l., which operates in the production of flat-glass storage and movement systems and is based in the province of Padua. This transaction will enable the Glass & Stone Division to extend the offer of products to high-end customers and to integrate Systems projects. The contract envisages the payment of € 2.7 million (Biesse S.p.A. has already paid a deposit of € 540 thousand). The contract also envisages the granting of a put option in favour of the sel-lers and a call option in favour of the buyers on the remaining 40% stake. The put option cannot be exercised before 31 July 2022 and after 31 December 2025, while the call option can-not be exercised before 31 July 2025 and after 31 July 2028. The consideration for the two options will be calculated on the basis of the multipliers of some financial statements figures of the company being acquired. • Furthermore, it should be noted that during 2016 the process was started to shorten the chain of control over the Chinese companies. This project was completed in 2017 and involved the companies Biesse Hong Kong Ltd and Centre Gain Ltd, both resident in Hong Kong. It implied the transfer of all the as-sets and liabilities from the parent to the subsidiary (the name of which was changed, as part of this transaction, to Biesse Hong Kong Ltd) and the subsequent liquidation of the parent. The liquidation and cancellation of the parent was completed in June 2017. The organizational chart shows the equity in-vestments.

2017 ANNUAL REPORT
1110
FINANCIAL HIGHLIGHTS

2017 ANNUAL REPORT
1312
Statement of financial position data and financial ratios
FINANCIAL HIGHLIGHTS
(1) The criteria for determining amounts relating to interim results and aggregate equity and financial data are described in the Directors’ Report and the Notes to the Consolidated Financial Statements.
EURO 000’S 2017 % OF SALES 2016 % OF SALES CHANGE %
Revenue from sales and services 690,120 100.0% 618,489 100.0% 11.6%
Normalised Added value (1) 288,607 41.8% 252,396 40.8% 14.3%
Normalised EBITDA (Normalised gross operating profit) (1) 89,452 13.0% 75,845 12.3% 17.9%
Normalised EBIT (Normalised operating profit) (1) 66,881 9.7% 56,341 9.1% 18.7%
EBIT (Operating profit) (1) 63,606 9.2% 55,062 8.9% 15.5%
Profit (Loss) for the year 42,738 6.2% 29,464 4.8% 45.1%
EURO 000’S31 DECEMBER
201731 DECEMBER
2016
Net invested capital (1) 157,966 156,589
Equity 188,337 159,723
Net financial position (1) (30,371) (3,135)
Net operating working capital (1) 38,674 66,920
Gearing (net financial position/equity) (0,16) (0,02)
Fixed asset/standing capital ratio 1,14 1,09
Order intake 596,776 507,934
2016 20162017 2017
Ebitda Ebit
15.0%
0.0%
5.0%
10.0%
0.0%
2.0%
4.0%
6.0%
8.0%
10.0%12.3%
8.9%13.0%9.2%
Personnel
* the figure includes temporary staff.
31 DECEMBER2017
31 DECEMBER2016
Number of employees at year end 4,042 3,799
0
3600 0
50
100
150
200
3800
4000
4200
10,000
0
50,000
100,000
30,000
20,000
2016
2016
2016
2016
2017
2017
2017
2017
Net Financial Position
Number of employees
Net Operating Working Capital
Turnover per employee
4,027
30,370
66,920
38,674
3,799
162,84,042170,8

14
BOARD OF DIRECTORS
Chairman and Chief Executive Officer Roberto SelciManaging Director Giancarlo SelciExecutive Director Alessandra ParpajolaExecutive Director and Group Managing Director Stefano PorcelliniExecutive Director Cesare TintiIndependent Director Salvatore GiordanoIndependent Director Elisabetta Righini
BOARD OF STATUTORY AUDITORS
Chairman Giovanni CiurloStanding Statutory Auditor Cristina AmadoriStanding Statutory Auditor Riccardo PierpaoliAlternate Statutory Auditor Silvia CecchiniAlternate Statutory Auditor Nicole Magnifico
CONTROL AND RISKS COMMITTEEREMUNERATION COMMITTEE – RELATED PARTY COMMITTEE
Salvatore GiordanoElisabetta Righini
SUPERVISORY BODY
Salvatore Giordano Elisabetta Righini Domenico CiccopiediElena Grassetti
INDEPENDENT AUDITORS
KPMG S.p.A.
CORPORATE BODIES
15

DIRECTORS’
REPORT ON OPERATIONS

2017 ANNUAL REPORT
1918
GLOBAL ECONOMIC TRENDThe world economy has continued to strengthen. Following solid growth in world GDP during the third quarter of 2017, sur-vey indicators show a sustained momentum in global expan-sion over the last months of the year. The Global Composite PMI (Purchasing Managers Index) for production rose to 54.4 in December, up from 54.0 in the previous month. The very po-sitive performance recorded in December reflects the vigorous expansion in advanced economies and a recovery in emerging economies, driven by China and India in particular. The latest figures are consistent with indications of an ongoing, wide-spread and synchronized global economic recovery.The survey indicators show that the robust surge in world trade persisted in the last quarter of 2017. On a global level, growth in imports of goods slowed in the early months of the fourth quarter, with a quarter on quarter increase of 0.8% on the volume of import goods in November, after recording +1.6 for the third quarter. The decline was driven by the trend of imports in Asia and several advanced economies. Trade indicators, however, show a greater degree of resilience, sug-gesting that global imports in the fourth quarter increased at a similar pace to that observed in the previous quarter. The global PMI for new foreign orders rose to 53.8 in December, up from 53.7 in the previous month, standing above the long-term average.In November, global inflation increased. Consumer price in-flation in OECD countries rose from 2.2 % in October to 2.4% in November on an annual basis, reflecting growth in the pri-ces for energy and food supplies. With the exception of these goods, however, inflation remained unchanged at 1.9%.
UNITED STATESThe recovery cycle continued in the United States. After su-stained GDP growth at an annualised rate of 3.2% for the third quarter, growth is expected to have remained robust in the last three months of 2017. The activity is propelled by ac-commodating financial conditions and a sustained climate of trust, as well as a temporary stimulus associated with re-construction operations on the heels of autumn hurricanes. In line with robust economic activity, the labour market has continued to strengthen. Employment in the non-agricultural sector recorded an increase of 148,000 units in December, while the unemployment rate remained unchanged at 4.1%. Despite stringent conditions in the labour market, annual sa-lary growth continued to be subdued, showing a slight increa-se to 2.5% in December. In the same month, the total 12-mon-th inflation rate measured by the CPI fell to 2.1% due to price trends in the energy industry. However, excluding food and energy supplies, the rate strengthened reaching 1.8% for De-cember year on year, up from 1.7% in the previous month. The Federal Open Market Committee (FOMC) continued the gradual transition towards a less accommodating approach, raising the target rate range on Federal Funds to 1.25-1.50% in the last month of the year. The US government has also reached an agreement on tax reform. The law on jobs and tax reductions (Tax Cuts and Jobs Act), which entered into force on 1 January 2018, permanently provides for corporate tax reduction, alleviating the burden on small businesses, tempo-rary cut of personal income tax and expansion of the taxable base. The consequent lack of revenue should be partially of-fset by additional taxation on foreign source income for US multinationals. Overall, it is likely that the fiscal.
JAPANIn Japan, economic activity remains buoyant and labour market conditions continue to strengthen. In the third quarter of 2017, real GDP was up 0.6% on the previous quarter and recent econo-mic indicators continue to show robust growth for the following quarter. The labour market has continued to strengthen, with the November unemployment rate falling to 2.7%, - a level which is similar to the figures recorded in the early 90s. However, wage pressures remain modest, showing a total nominal wage incre-ase of 0.9% in November over the corresponding period. In the same month, the gross inflation rate measured by CPI for the 12 months rose to 0.6%, but the inflation rate excluding food and energy supplies remained close to zero. Furthermore, the latest Tankan survey on company expectations for inflation suggests that caution regarding further price increases is continuing.
UNITED KINGDOMIn the United Kingdom, economic activity recorded a slight re-covery after the marked slowdown in the first half of 2017. Ac-cording to final estimates, real GDP growth increased slightly in the third quarter, reaching 0.4%. Recent indicators point to con-tinued economic expansion at a similar pace to that which was observed during the transition to the new year. Surveys suggest a favourable trend in exports, with the PMI index for consumer sentiment on exports and figures for new export orders in the manufacturing industry both steady on high levels in the last quarter of 2017. Against this trend, indicators show diminishing growth in the service industry. The 12-month CPI inflation rate has fallen slightly, reducing from 3.1% in November to 3% in De-cember, but it is expected to continue to weigh on disposable income.
EMERGING COUNTRIES In China, economic activity indicators point to a continued expansionary momentum. In the fourth quarter, GDP was up 6.8% as compared to the same quarter in the previous year. In 2017, production was 6.9% higher overall as compared to the previous year, exceeding the 6.5% target level set by the gover-nment. Consumer price inflation recorded a slight increase in December, going from 1.7% in the previous month to 1.8%. A de-cline in inflation for mining production and raw materials cut to 4.9% the inflation rate on production, which was equal to 5.8% in November. The Central Economic Work Conference of Decem-ber, an annual meeting held to define the national program for the Chinese economy, confirmed that the authorities saw the main priorities for 2018 being identified as high quality growth, further supply side reforms and financial risk mitigation.
GENERAL ECONOMIC OVERVIEW EUROZONEA solid and general expansion continues in the Eurozone. In the third quarter of 2017, real GDP rose by 0.7% over the previous period, driven by the positive contribution of domestic demand and net exports, after an equal increase in the second quarter. At the same time, GDP growth received no contribution from changes in inventories in the third quarter. The most recent economic indicators, based on both real data and survey re-sults, remain high and confirm the expectations of robust and protracted growth around the turn of the year, at a pace similar to that observed in the previous two quarters.Consumer spending has increased further, and in this way continues to play an essential role in supporting the current economic expansion. In the third quarter of 2017, consumer spending rose by 0.4% over the previous period, after slightly higher growth in the previous quarter. This slowdown largely reflects a lesser growth in consumption of goods, while the consumption of services seems to have grown substantially in the third quarter, in line with the second quarter. Growth in consumption of durable goods, however, continues to sur-pass consumption rates in semi-durable and non-durable goods. On a year on year basis, consumption increased by 1.9% in the third quarter of 2017 - a similar rate to that recor-ded in the second quarter. Faced with this constant trend, the growth rate for the same period in the prior year has increa-sed for real household disposable income, going from 1.3% in the second quarter to 1.6% in the third quarter. In line with an unchanged growth in consumption and a greater increase in income for the third quarter of 2017, the 12-month rate for changes in savings also rose for the same period. Neverthe-less, in the third quarter, the savings rate (expressed as a rol-ling four-quarter average) fell to a new low of 12%.The Eurozone labour markets continue to improve, and this supports household income and consumer spending. In the third quarter of 2017, employment increased by a further 0.4% compared to the previous period, bringing the annual increase to 1.7%. Employment currently stands around 1.2% higher than the pre-crisis highs in the first quarter of 2008. In November 2017, the unemployment rate in the Eurozone was 8.7%, a fall of 8.8% compared with October, or 3.3 percentage points below the post-crisis peak recorded in April 2013. This decline is broad based, affecting different age groups and genders. Long-term unemployment (meaning the number
of people unemployed for at least 12 months, expressed as a percentage of the labour force) continues to decline, thou-gh remaining above pre-crisis levels. Survey data points to a persistent growth in employment in the coming period, with increasing signs of labour shortages in some countries and industries.
ITALYEconomic activity accelerated in the third quarter of 2017 than-ks to both domestic and foreign demand. The most recent in-dications compared to the previous period suggest that GDP would continue to expand by around 0.4% in the fourth quarter, supported by an increase in added value in both industry and the service sector.Over summer, GDP increased by 0.4% in economic terms, a sli-ght increase compared to the previous period. National demand (stimulated by investments in capital goods in particular) contri-buted to a growth in production, as did foreign trade to an equal extent, with a more marked upturn in exports as compared to imports. The change in inventories instead subtracted half a percentage point from the escalation in production. Added value has risen in industry, thanks to strong growth in manufacturing and a recovery in construction. In the service industry, activity remained stable overall: there was a decrease in the financial and IT sectors, while there was an increase in the trade and real estate sectors. According to estimates, GDP increased in the fourth quarter, as it had also done in the previous period. In De-cember, the Ita-coin indicator developed by the Bank of Italy rea-ched its highest level since the summer of 2010 (up to 0.49 from 0.44 in November). Company surveys confirmed a return in con-fidence to levels seen prior to the double recession. Consumer surveys indicate a continuation in the current recovery, which began last spring. On this basis, GDP for 2017 overall (calculated on the basis of seasonally adjusted quarterly data, adjusted to the number of working days) is likely to have increased by 1.5% (or 1.4% pre-adjustment).

2017 ANNUAL REPORT
2120
UCIMU – SISTEMI PER PRODURREAs is clear from the provisional figures prepared by the Bu-siness Culture and Research Centre of UCIMU, in the fourth quarter of 2017, the index increased by 21.5% compared to the same period of the previous financial year. The overall re-sult was partially due to a positive response in foreign orders, but was mainly determined by the excellent results contribu-ted by Italian domestic manufacturing.In particular, foreign orders increased by 6.2% as compared to the period from October to December 2016. The absolute value of the index was 138.4. On the domestic front, Italian machine tool manufacturers recorded an 86.2% increase in total orders as compared to the fourth quarter of 2016. The absolute value of the index was 285.4. Year on year, the to-tal index recorded an increase of 13.7% compared to 2016. Foreign orders grew by 4.7%, a complete recovery from the downturn recorded last year. Domestic orders showed a 45.9% increase, demonstrating the Italian market’s great pro-pensity to investments. Massimo Carboniero, the Chairman of UCIMU-SISTEMI PER PRODURRE, stated: “The trend for orders taken in 2017 evidences two decidedly positive phenomena for manufacturing. On one hand, the in-dex shows that cross-border contracts have recovered, whe-reas the results in 2016 had been disappointing. On the other hand, excellent performance has been recorded for invest-ments in domestic production systems, where users have in-creasingly acquired the latest technology for their companies throughout 2017”.“With reference to the domestic market,” continued Massimo Carboniero, “the impact of measures taken under the Indu-stry 4.0 plan is evident, particularly in regards to Super and Hyper depreciation, where it has affected sales trends and or-ders received. In the case of the latest survey results (relating to the period October-December 2017), the amount of orders received will have a direct impact on 2018 GDP. Between this and the new measures made available by government autho-rities, 2018 is set to be a very positive year”.“However, it must be noted that,” said Carboniero, “as expected, the Industry 4.0 provision relating to training and continuing professional development for key personnel runs the risk of not being fully effective for two quite different rea-sons. On one hand, the activation of said provision is depen-dent on local or national collective bargaining agreements, and this method may hinder those SMEs that do not have union representation within their organisation. On the other hand, the tax credit that is available for expenses incurred by companies investing in training 4.0 is only applicable to hours worked by personnel involved in operations. Therefore, the entire portion relating to the cost of external trainers is excluded. Since this is a clearly significant amount, there is a risk that the choice of trainers may be affected more by the price than the value of the service offered”.“Finally, on the international front,” said Massimo Carboniero, “in order to support the recovery of orders which began in 2017, it could be useful to fine-tune the new Law on Coopera-tion, which allows individuals also to participate in Italian co-operation-related projects, but whose current version makes it difficult for SMEs to apply”.
ACIMALLWoodworking machines and systems used in the furniture industry continue to show good signs of recovery. This is the trend that emerged clearly from the draft report drawn up by the Research Office of Acimall, the Confindustria member as-sociation that represents businesses in this industry in Italy. According to data released in the last few days of 2017, the value of production has reached € 2.29 billion, 11.6% higher than the previous year. Exports record an excellent perfor-mance, rising 7.1% to € 1.6 billion compared to 2016. Among our best ten customers, the United States is in the lead, having purchased Italian woodworking technology worth € 165.5 million. They are followed by Germany (€ 105.8 million), Poland (€ 102.4 million) and France (€ 92.5 million). The value of imports also increased (€ 199 million, 10% higher than the previous year). The domestic market is also continuing along the road to growth, thanks to the investment support measu-res launched by the Italian Government in recent years, with clear expectations for further progress in both the short and medium term. In 2016, Italian ‘consumers’ of woodworking machines invested € 743 million, which became € 894 million (a further € 140 million) in 2017. Everything seems to indicate that 2018 may see a domestic market that is close to one billion euro: a new record after reaching € 900 million in 2001.The data that has emerged from traditional economic status surveys undertaken by the Acimall research office also fa-vours a rosy future, with fourth quarter 2017 closing with an increase in orders of 36.8%, as compared to the same quar-ter in 2016 (it was 42.9% in the period July-August compared to the same period in the previous year). This figure is the sum-total of the results made on orders from overseas, whi-ch grew by 35.2% (51.5% in the previous quarter) and excel-lent performance in Italian demand, 49.5% higher than the October-December 2016 period (it was +19.7% in the second quarter).
BUSINESS SECTOR REVIEW 2017 TRENDS
For the third consecutive year, the Biesse Group closed with a record turnover of € 690 million; the fourth quarter strengthened the positive trend already seen during the year, both in terms of turnover (amounting to € 192 million) and economic profitability, and with a strong Net Financial Position (equal to € 30.4 million) resulting from a significant cash flow generation.As concerns the machine tools order intake, an overall increase of approximately 17.5% was recorded at the end of 2017 (€ 597 million compared to € 508 million of the previous year), with a Group backlog at the end of December 2017 of around € 215 million (approximately +31% over of 2016). As regards sales volumes, Group revenue amounted to € 690,120 thousand at the end of 2017, reporting an increase of 11.6% compared to the previous year. Normalised EBITDA totalled € 89,452 thousand, up by € 13,607 thousand compared with the previous year (+17.9%). EBIT im-proved in the current year as well, rising by € 8,543 thousand (€ 63,606 thousand in 2017 compared to € 55,062 thousand in 2016). As a percentage of revenue, it increased from 8.9% to 9.2%. If we analyse segment reporting, in 2017 the Mechatronics Di-vision recorded an excellent result in percentage terms (+13.7% compared to 2016) due to the increase in sales volumes, the dif-ferent sales mix by distribution channel (increasing importance of its own sales branches) and by product (luxury items with a high technological content). The Glass & Stone and Wood Divi-sions too performed outstandingly in percentage terms, conti-nuing their growth trend in terms of volumes (+12.7% and + 8.6% compared to 2016, respectively) and profits.The geographical breakdown of sales compared to the previous year period showed a particularly positive performance for East Europe (+18.9%), accounting for a larger share of consolidated turnover (from 12.6% to 13.4%). The Asia-Pacific area also indicated a good performance (+18.9%), while Western Europe recorded a significant 10.1% increase, confirming its position as the Group’s baseline zone. Finally, the Americas show an increase of 1.9 percentage points. It is also noted that the Group results were negatively affected by “non-recurring events and impairment losses” for a total of € 3,275 thousand. This was due to phase-out effects, extraordi-nary costs incurred in the Australian branch, non-recurring per-sonnel expense incurred in the Chinese and Indian production subsidiaries, and the impairment of development costs relating to projects no longer deemed strategic. The year before, these events had negatively affected the operating profit for a total or € 1,279 thousand. As in the income statement of the previous years, in order to make the impact during the year clearer to un-derstand, these events were reported in a separate line of the reclassified income statement in the Directors’ Report.
On the financial position front, net operating working capital re-corded a decrease of € 28.2 million, which was attributable to good momentum in collections, leading to a reduction in trade receivables (by around € 9.4 million) and an increase in inven-tories (equal to roughly € 12.4 million). These movements were partially offset by an increase in trade payables (€ 31.3 million).As at 31 December 2017, the Group’s Net Financial Position amounted to € 30.4 million, up by € 34.4 million compared to 30 June 2017 and € 39.5 million compared to 30 September 2017. The increase in profits and the constant attention to the perfor-mance of net operating working capital once again underpin the generation of cash (free cashflow of € 35.2 million) which at the end of 2017 generated a net financial position, also net of dividends paid (cash-out of over € 9.8 million) and investments made. Compared to last December, the Net Financial Position was up by € 25.4 million overall. CONSOLIDATED NON-FINANCIAL STATEMENTThe Consolidated Non-Financial Statement (hereinafter referred to as ‘NFS’) of BIESSE Group (hereinafter also referred to as the ‘Group’) has been prepared in accordance with Italian Legislati-ve Decree no. 254 dated 30 December 2016. The NFS reports on environmental, social and staff-related issues, as well as the respect for human rights, the fight against active and passive corruption (hereinafter also referred to as the ‘Decree scope’) and additional issues identified through a materiality analysis process as being material for Biesse. The NFS is published in a separate and specific document. It refers to the financial year ended 31 December 2017 and inclu-des data from the parent BIESSE S.p.A. and the wholly-owned subsidiaries. In regard to this, reference should be made to the paragraph ‘scope of consolidation’ in the notes to the Consolida-ted Financial Statements. The NFS was approved by the BIESSE S.p.A. Board of Directors on 12 March 2018 and is subject to review by the appointed auditors.

22
MAIN EVENTS
Intermac America exhibited its hi-tech products at StonExpo Marmomacc Americas, held in Las Vegas from 18 to 20 January. At the Mandalay Bay Convention Center the Intermac stand had working versions of the Master 38 machining centre and the 5-axis JET 625 by Donatoni, an outstanding partner of the group.On 27 January at the Biesse Campus in Pesaro the one2one event Integrated Automation on CNC took place, a meeting dedi-cated to the manufacturers of furniture and contract manufactu-rers of shaped panels, as well as to companies looking for inno-vative solutions for the loading and unloading of heavy panels. From 23 January to 3 February, the Biesse Campus in Pesaro hosted the Academy weeks, to allow partners and subsidiaries, above all, to discover and experience Biesse innovation. The an-nual event allows colleagues to take part, through an innovative formula, in continuous training, to receive updates on the innova-tions in Biesse products and on the last year news, taking part in seminars and discussion panels.
From 22 to 24 February the Distributor 2.0 dealer meeting was held in Pesaro, an event with a highly innovative formula, which was designed by Biesse in order to listen to its strategic part-ners and organised to facilitate interaction and the exchange of knowhow and successful experiences among professionals from around the world.On the same dates, the subsidiary Biesse Iberica exhibited its te-chnologies at the Promat fair in Valencia, dedicated to materials, technologies and solutions for interior design and architecture projects. In the Biesse stand, customers and visitors were able to see the flexible and innovative Made in Biesse technological so-lutions, with a focus on the residential building and construction sector. On 28 February, the Board of Directors of Biesse S.p.A. approved the updating of the business plan for the three-year pe-riod 2017-2019..
From 1 to 4 March Biesse India took part in Delhiwood at India Expo Center, the main Indian fair dedicated to hi-tech solutions for the woodworking sector, exhibiting machines that meet the requirement for “Affordable High-tech Solutions”. The four days of the fair allowed Biesse to show the latest technological inno-vations for the processing of panels and solid wood, and more besides. One of the main innovations was the presentation of the Cabinet software to manage production, a solution of great interest for customers and visitors 450 square meters in surface
area, 10 machines exhibited, including CNC, solutions for sizing, drilling, edgebanding and sanding. Holding centre stage was Skipper V31 for drilling, which will be manufactured in the Biesse Group factory in India. In addition, at the exhibition Biesse an-nounced the forthcoming inauguration of the new factory near Makali, in Bangalore, which will allow to increase the production area to more than 20 thousand square metres. From 7 to 9 March Biesse took part in the Woodshow trade fair in Dubai with a larger exhibition space and a wider range of tech-nologies compared to previous editions. By way of confirmation of the Group’s particular attention to the Middle East, during the fair the ambitious project of the Biesse Group Campus in Dubai was presented, a project aimed at providing all the necessary support to customers in this important geographic area.From 14 to 16 March Biesse solutions for advanced hi-tech ma-terials were on display at Jec World 2017 in Paris, the internatio-nal exhibition dedicated to the whole segment of composite ma-terials, from raw materials to machines for the transformation of finished products. This event shows that Biesse renewed its range of technologies for advanced materials, with ad-hoc so-lutions for a growing sector, offering its customers a complete and integrated range of machining centres, sizing centres, wa-terjet cutting systems and sanding machines for all the stages of processing. In addition, again with specialist technologies for the processing of advanced materials, Biesse took part in the Mecspe trade fair in Parma from 23 to 25 March.Diamut and Intermac opened the doors for Inside Intermac “Sto-ne Edition”, the event dedicated for the first time exclusively to the working of stone, stone materials and ceramics, once again alongside Donatoni Macchine. From 16 to 18 March the Inside Intermac “Glass edition” event took place for solutions dedicated to the working of glass. In addition, Intermac exhibited its hi-tech innovations at the Intec trade fair in Leipzig in Germany from 7 to 10 March and at the Izmir trade fair in Turkey from 22 to 25 March. Biesse was present at the Fimma trade fair in Brazil from 28 to 31 March in collaboration with the local dealer. On the same da-tes, the Group took part in the Interzum trade fair in Guangzhou in China, the key Asian meeting for machines for woodworking and furniture and furnishings production. An opportunity to di-scover how the opportunities offered by the fourth industrial revolution are accessible to everyone through machines made by the Biesse Group.
JAN
FEB
MAR
23

24 25

26
The one2one Advanced Material event held at the Biesse Trive-neto branch included three days dedicated to plastic and advan-ced materials processing, as well as an area entirely given over to Uniteam technologies. From 19 to 21 April, the one2one Solid Wood event was held at the Biesse Campus in Pesaro, dedicated to the world of solid wood in its universal use, which also staged the first ever seminar on Biesse Housing solutions, with special guest Casa Clima. Biesse Schweiz organised an open house, opening up the doors of its office to its current and potential cu-stomers from 27 to 29 April. Thanks to two important collaborations with customers in the world of glass and wood, Biesse Group successfully took part in the 2017 Design Week, which saw Milan become a world ca-pital of furnishing and design from 4 to 9 April. Having teamed up with Fiam, it was present at the Salone del Mobile with its “Ghost 30th Anniversary” project, created to celebrate 30 years of the icon international design armchair, developed thanks to the technological solutions produced by Intermac. It is a matter of great pride that Biesse Group took part in this project, whi-ch combines technology, design and social issues. In fact, the mini Ghosts developed as part of the project by internationally famous designers will be put up for auction and the profits al-located to support the populations struck by the earthquake in Central Italy. We would also remind you of the institutional pre-sence of the group at the Fuorisalone, together with Wood-Skin in the location of Ventura Lambrate, a temporary design district given over entirely to Innovation, design and experimentation. Among the most important participations during this month, from 4 to 7 April Intermac America was present at the Coverings Expo fair in Orlando, the most important stone sector appoint-ment in North America, exhibiting, at centre stage, the Master 38 machining centre. On these same dates, Biesse France showed off its technology for the processing of plastic and composite materials at the Industrie Lyon fair. From 8 to 12 April, it took part in the Izwood fair, one of the most important sector events in Turkey, and from 20 to 22 April in ISA Sign Expo, held in Las Vegas with a focus on technologies used to process plastic and composite materials. Finally, from 25 to 27 April, Intermac UK exhibited at the 25th edition of the Natural Stone Show in Lon-don, flaunting its innovative technological solutions for stone processing. Biesse Group then exhibited for the first time at the Hannover Messe trade fair, the world’s most important showcase for inno-vation, with a technological solution displayed on the Accenture stand from 24 to 28 April. The joint participation in Hannover Messe is the next step in a partnership embarked on with Ac-centure, for the development of an IoT project, which will allow group customers to generate even more value from industrial machines, offering customers new functions and creating a so-lid range of evolved digital services. The Milan Technology Hub fair set the stage for the third dimension from 20 to 22 April: Biesse Group teamed up with Indexlab and Wood-Skin to unveil the Arches project, a 3-metre tall structure comprising 202 diffe-
rent two-dimensional elements assembled together. Biesse Group also had a great many HR appointments: Conta-mination Lab of the Marche Polytechnic University stopped off at the Pesaro Campus, with students of agriculture, economics, engineering, sciences and medicine. The project stems from the initiative promoted by MIUR (Ministry for Education, University and Research), which envisages a cross-contamination of the academic world and social-economic system, with a view to promoting culture. The Assessment Days continue to run for talented young graduates, meeting the Biesse Group for the very first time. A staff selection technique, focused on asses-sing potential and personal aptitudes, uses different individual and group tools, such as simulations, tests and drills, through which selectors can record the behaviour of candidates in order to assess their skills, capacities, motivation and attitudes, a real opportunity to test competences and invest in the future.At their ordinary meeting held on 28 April 2017, the Shareholders of Biesse S.p.A. approved in second call the 2016 Separate and Consolidated Financial Statements, both prepared in accordan-ce with IFRS. The Shareholders also resolved to distribute a € 0.36 dividend per share in light of the positive results achieved in 2016 (ex-dividend date scheduled for 8 May 2017 – record date 9 May 2017), paying a total of € 9,857,895,12 – excluding treasury shares.
MAY
From 22 to 26 May Hannover hosted the Ligna trade fair, the most important biennial appointment in the wood sector. The great flow of visitors to the stand, which covered more than 5,000 square meters, and the satisfaction shown by customers, the press and partners were an important and gratifying respon-se to the investments made by the Group to develop increasin-gly efficient services, offer increasingly innovative products and strengthen its experience in global markets. “This edition made us particularly proud of the innovations presented by Biesse” said Federico Broccoli, Wood Division Director/Sales and Bran-ch Division Director. “The layout of our stand was entirely ba-sed on the 4.0 concept with interconnected technologies that offer customers the significant benefit of reducing production times and creating efficiency”. The interest aroused by the Ma-chines Knowledge Center and by the renewed bSuite bears wi-tness to how strongly customers need products and services that can revolutionise traditional production areas. The first is a new platform developed in collaboration with Accenture that guarantees a series of features and services for obtaining more value from the machines; the second is a software suite made in Biesse that makes the most advanced technology accessible to anyone. Over the 5-day trade fair, 4,500 visitors from all around the world visited the Biesse stand, generating € 45 million worth of incoming orders, 35% of which are 4.0 lines. Never before had
APR
27

2017 ANNUAL REPORT
2928
the Group achieved such figures at any trade fair.From 17 to 20 May Intermac took part in Lamiera, the trade fair dedicated to the metalworking industry, and presented a ran-ge of 4.0 ready solutions to turn the factories belonging to our customers into true “smart factories”. Intermac Commercial Director Franco Angelotti commented: “The participation of the company in the Lamiera trade fair certainly represents a major positive for Intermac, and interest in our company’s technolo-gies has been confirmed by a steady influx of visitors, welcomed by a team of staff that has recently been strengthened even fur-ther, with new members engaged with a view to responding fully to the growing demands we receive from the market. Intermac solutions for the metal processing industry are extremely ver-satile, and are therefore widely used across many sectors, and are perfect for both small-scale artisan applications and large industrial companies”. Middle East Stone, which is now in its third edition, took place from 22 to 25 May at the Dubai World Trade Centre, hosting over 300 companies and international brands from the natural stone, marble and ceramics industry. Intermac, by its participation at this event, showed its desire to strengthen its presence in this fast-growing market. From 24 to 27 May Intermac also took part in China Glass in Beijing with specific solutions for the Chinese market, an excellent showcase for presenting solutions tailored to the needs of the Chinese market.
JUN
In June, the Group took part in a number of small events, such as roadshows at resellers, tech tours at the Campuses around the world and collaboration with universities and training in-stitutes, hosting meetings at the Headquarters in Pesaro. On 16 and 17 June, the Biesse and Intermac Inside took place in Dongguan in China. Over 100 visitors from 50 companies visited our showroom to discover the technological innova-tions for working wood, glass and stone. From 13 to 16 June Biesse France took part in the FIP trade fair in Lyon, the key event in France for the plastic materials sector, showing the Group’s strong investment in this growing sector.An institutional event worth mentioning was the charity din-ner “A new school for Cascia” organized in collaboration with Fiam Italia together with Fondazione Mediolanum Onlus in fa-vour of Fondazione Francesca Rava - NPH Italia Onlus to sup-port the school rebuilding program in central Italy following the earthquake, in particular a school for 60 children in Ca-scia. The event saw the participation of numerous guests and partners, who actively contributed to the fund-raising, thus giving even more value to the solidarity project. Numerous institutions and guests took part, such as Foreign Minister Alfano who opened the evening, followed by speeches by the Chief Executive Officer of Fiam Italia, representatives of the
Selci family, Fondazione Mediolanum Onlus and Fondazione Francesca Rava. This project coincided with the 30th anni-versary of Fiam’s Ghost chair and with the 30th anniversary of Intermac, the Biesse Group division that specialises in te-chnologies for working glass that can assist in the creation of outstanding products, such as the iconic Ghost. This is a bond which goes beyond business, a date on which to meet and promote solidarity, inviting numerous partners from the local area to contribute to the cause.
JUL
On 9 and 10 July, the Inside event of Biesse China took place in Guangzhou dedicated to Biesse and Intermac technolo-gical innovations, with a focus on solutions for automation and the opportunities offered by the 4.0 industrial revolution. In July, the Headquarters hosted the meeting of Assiot and Assofluid, which was designed to examine, through discus-sion with the main players in the user sectors, the trends that characterise technological development in the sector of me-chatronics for power transmission and automation. The Tech Tours from Turkey, Israel and Poland took place in Pesaro and gave visitors insight into the types of technology, the possibi-lity to visit our factories and to see our systems installed at customers’ premises. In addition, the Headquarters was the focus of a training trip undertaken by students of the German Berufsakademie Melle university, who visited our company to see and touch at first hand Biesse-branded technologies, enriching their theoretical know-how with a full-immersion experience. The AWFS trade fair took place from 19 to 22 July, and the Biesse America and Biesse Canada branches enjoyed great success and an excellent level of order intake. The edition was focused on the global launch of Sophia, the Biesse pla-tform, created from an IIoT pilot project, which now enables customers to enjoy a wide range of services in order to op-timise their asset management. “We can provide efficient add-ons to give added value to our machines. IoT is a new world for our industry. Our vision for IoT is to become more predictive of our customers’ needs and anticipate all require-ments for support. We want to deliver the new power to our customers to give them a tangible competitive advantage,” said Federico Broccoli, Branch Division Director and Wood Division Director/Sales. On 27 July 2017 Biesse S.p.A. signed an agreement to acqui-re 60% of the shares of MOVETRO S.r.l., which operates in the production of flat-glass storage and movement systems and is based in the province of Padua. This transaction will enable the Glass & Stone Division to extend the offer of products to high-end customers and to integrate Systems projects. The contract envisages the payment of € 2.7 million (Biesse S.p.A.
has already paid the entire amount). The contract also envisa-ges the granting of a put option in favour of the sellers and a call option in favour of the buyers on the remaining 40% sta-ke. The put option cannot be exercised before 31 July 2022 and after 31 December 2025, while the call option cannot be exercised before 31 July 2025 and after 31 July 2028. The consideration for the two options will be calculated on the basis of the multipliers of some financial statement figures of the company being acquired.On 27 July 2017, a newco was set up called Montresor & Co. S.r.l. (with a 90% stake held by Biesse S.p.A. and 10 % by Do-natoni Macchine S.r.l.) whose purpose is the acquisition of Montresor & C. S.r.l., which is based in the province of Verona and manufactures edge polishers machinery (glass and mar-ble). The acquisition was completed on 3 August 2017 with the payment of the first tranche of 65% of the agreed price (€ 4.8 million, net of payables due to employees, payments on account and/or guarantee deposits and the estimate of the inventories bought). In the agreements among the members of the newco (Montresor & Co. S.r.l.), the possibility is envisa-ged for the non-controlling stakeholder Donatoni to underta-ke a share capital increase for a further 30% to reach a 40% stake. The payment of the remaining 35% should take place by the end of 2017.
AUG
Biesse technologies for drilling, edgebanding and nesting were the protagonists at Kofurn, the main South Korean trade fair in the sector that was held from 30 August to 3 Septem-ber in Seoul. This included the public launch of the new Rover S FT machining centre together with the Stream A edgeban-ding machine and the Skipper 100 and V31 drilling machines. There was also space for the software modules bSolid and bCabinet.
Intermac and Diamut were among the companies starring at the fifteenth edition of the Glassbuilt trade fair, which was held from 12 to 14 September in Atlanta, USA. A presence which enabled visitors to see the performance of the best machi-ning centres and the technology of Genius cutting benches, as well as the range of diamond tools for the glass industry, which completed the product offer available to customers.Intermac took part together with Donatoni and Montresor in the Marmomac trade fair from 27 to 30 September in Verona, with an exhibition area that was among the biggest at the whole event. The realisation of the smart factory, the imple-mentation of automation in delivering a decisive change to optimising processes, a complete customer care offer: these are the ambitious goals with which Intermac and Donatoni Macchine marked out their innovation journey.Among the events were the open house of Biesse Triveneto, which opened its premises to customers to show the oppor-tunities offered by the Smart 4.0 factory. An event dedicated to solutions integrated with digital technologies. In order to innovate and grow, it is important to plan. The lea-ders of Biesse Group from around the world met at the sub-sidiary in North America for the 2017 edition of the Subsidia-ries Meeting. A week focused on assessments, analyses and planning so that every leader of a subsidiary can influence its future development, with a fully customer-focussed vision.
OTT
4.0 ready machines and Digital Manufacturing: Intermac at Vitrum 2017 revealed the factory of the future that everyone can use. The appointment with Vitrum, one of the most im-portant trade fairs for the glassworking sector, happens every two years in Milan. Intermac presented solutions aimed at all manufacturing companies, from big players with high levels of production, to companies that need batch-one production, to small specialist companies. In a surface area of over 800 sq.m. all the Intermac technologies were on display, from new Master machining centres, to solutions for cutting in the Ge-nius range, the waterjets of the Primus range and Vertmax, the vertical machining centres designed for maximum ver-satility. Integrated machinery that enables the optimisation of the manufacturing process, reducing costs and improving our customers’ daily work, taking them into the era of “Digi-tal Manufacturing”. Diamut confirmed its technological and innovation leadership with all visitors, highlighting the latest innovations that have been developed. The products were not only on display, but also in operation in the demo area where processing was undertaken by tools under the careful gaze of our experts.From 11 to 13 October Biesse took part in the Visual Impact trade fair in Sydney, Australia, one of the most important
SEP

2017 ANNUAL REPORT
3130
events in the world of plastic and advanced material working. In addition, again in October it took part in the Wood Proces-sing Machinery trade fair in Tuyap with 26 machines over 1,500 sq.m., with 75 Biesse experts to support customers and visitors.From 16 to 20 October the Headquarters in Pesaro hosted the second edition of the Finance Meeting aimed at people who work in the finance area of Biesse worldwide. A working week focussed on the issue of “Change” with a rich program of workshops, roundtables and lessons. Two valuable exter-nal collaborations enriched everything. On the one hand, the volleyball player Jack Sintini motivated and moved the au-dience with a speech focussed on the importance of being a team and setting objectives in order to react to change. On the other, during a day spent at the San Patrignano Commu-nity, the issues of corporate social responsibility were addres-sed with the possibility of seeing close up another example of being positive, paying back and changing. From 19 to 21 October, 4000 customers from all over the world took part in the now well-established annual appoint-ment which is a reference point in the sector for the working of wood and hi-tech materials, Inside Biesse, at the Head-quarters in Pesaro. The event was met with great satisfaction from national and international representetives and ended with a +29.2% rise in orders received compared to the pre-vious year. Also, the seminars aroused great interest, in par-ticular the presentation of SOPHIA, the Biesse new service platform developed in collaboration with Accenture, with a speech by Jean Cabanes, Lead Industrial Equipment Global at Accenture and a senior figure in the Industry 4.0 field. The-re were also numerous demos requested for B_AVANT, the BiesseSystems supervisor for the integrated and efficient management of production plant, based on machining needs.
NOV
Biesse Middle East opened the new Campus in Dubai, a lea-ding-edge centre for technology and training which is unique in the region and which immediately lets us provide our cu-stomers with excellent service and support, directly on site. A three-day event, from 7 to 9 November, aimed at customers, visitors and partners launched the new structure to show clo-se up the Made in Biesse hi-tech solutions and allow to meet our experts. Following the inaugural event, the showroom dedicated to machines for working wood, glass, stone and hi-tech materials continues to be constantly available for de-monstrations of the permanently present technologies. An area of the new premises is completely dedicated to servi-cing and spares, enabling the hosting of training for staff and customers. In Stuttgart, Germany, the Blechexpo fair was held at which Intermac presented Primus 322, the ideal solution for com-panies that require maximum productivity to cut any type of
material, enabling a high level of flexibility in planning. Viet presented SV, a complete solution for deburring, rounding and satin finishing which guarantees an effective result both on external borders of the piece and in bores or pockets, even of small size.Also important are the investments in the Russian market, with the new premises inaugurated last year and active par-ticipation in relevant trade fairs. At Woodex, which took place in Moscow from 14 to 17 November, the company displayed on a stand of 600 square meters 8 machines, including ma-chining centres, edgebanding machines, sanding machines and sizing centres, to show customers how Biesse solutions can increase their competitiveness, reducing costs, impro-ving work and optimising processes.
DIC
The month of December saw completion of the first edition of Future Lab, the training project dedicated to the young ta-lents in Biesse Group, which saw around 100 new hires over the recent years, all protagonists of an important opportunity for growth. Discussion and training days were held on the to-pics of project management and leadership, and these were alternated with time dedicated to hearing the professional expectations, motivations and ambitions of each individual. The project’s objective is to design personal plans for deve-lopment of skills and professional growth within the company. At the beginning of December, the Zak Glass Technology Expo was held. The 15th edition of the trade fair was held in Mumbai, India. Genius CT-A was shown at the fair, presen-ting the float glass cutting table which guarantees maximum performance, reliability and durability, thanks to quality com-ponents and technological solutions: maximum machining precision thanks to cutting-edge software that is easy to use.In the same period, Intermac technology was shown at Roca-lia in Lyon, in tandem with partner Donatoni. The Master 33.3 machining centres were shown, with Waterjet technology in-stalled on the Primus range and the Donatoni JET 625. The Donatoni product has become the best seller in this category, thanks to the combination of its state-of-the-art technology and Intermac’s extensive distribution network. Diamut was also on the stand, completing the offer available to our cu-stomers with its own line of high-tech diamond tools for the stone and synthetic materials industries.On 21 December 2017, 30% of Biesse S.p.A. shareholdings were transferred to Donatoni Macchine S.r.l. The liquidation of Montresor & C. S.r.l. took place at the same time.

2017 ANNUAL REPORT
3332
INCOME STATEMENT HIGHLIGHTS INCOME STATEMENT FOR THE YEAR ENDED 31 DECEMBER 2017 HIGHLIGHTING NON-RECURRING ITEMS
EURO 000’S 2017 % OF SALES 2016 % OF SALES CHANGE %
Revenue from sales and services 690,120 100.0% 618,489 100.0% 11.6%
Change in inventories, wip, semi-finished products and finished products 15,387 2.2% 12,649 2.0% 21.6%
Other Revenues 4,669 0.7% 3,548 0.6% 31.6%
Revenue 710,175 102.9% 634,686 102.6% 11.9%
Raw materials, consumables, supplies and goods (285,501) (41.4)% (257,726) (41.7)% 10.8%
Other operating costs (136,067) (19.7)% (124,564) (20.1)% 9.2%
Normalised added value 288,607 41.8% 252,396 40.8% 14.3%
Personnel expense (199,155) (28.9)% (176,551) (28.5)% 12.8%
Normalised gross operating profit 89,452 13.0% 75,845 12.3% 17.9%
Depreciation and amortisation (19,904) (2.9)% (17,858) (2.9)% 11.5%
Provisions (2,668) (0.4)% (1,645) (0.3)% 62.2%
Normalised operating profit 66,881 9.7% 56,341 9.1% 18.7%
Impairment losses and non-recurring items (3,275) (0.5)% (1,279) (0.2)% -
Operating profit 63,606 9.2% 55,062 8.9% 15.5%
Net financial expense (1,859) (0.3)% (1,534) (0.2)% 21.2%
Net exchange rate losses (1,017) (0.1)% (1,144) (0.2)% (11.1)%
Pre-tax profit (loss) 60,730 8.8% 52,385 8.5% 15.9%
Income taxes (17,992) (2.6)% (22,921) (3.7)% (21.5)%
Profit (Loss) for the year 42,738 6.2% 29,464 4.8% 45.1%
In 2017, Revenue from sales and services amounted to € 690,120 thousand, compared with € 618,489 thousand in 2016, up by 11.6% over the previous year.
The breakdown of sales by segment shows the significant increase in the Mechatronics Division (13.7% compared to 2016), from € 86,622 thousand to € 98,503 thousand; the divi-sion slightly increased its share of Group sales (from 14% to 14.3%). The performances of the other Divisions show in turn significant increases compared to 2016. To be more precise, the Glass & Stone Division recorded the highest increase with +12.7%, whereas the Wood and Tooling Divisions reported +8.6% and +10.4%, respectively.
The geographical breakdown of sales compared to the pre-vious year showed a particularly positive performance for Eastern Europe (+18.9%), accounting for a larger share of consolidated turnover (from 12.6% to 13.4%). The Asia-Paci-fic area also indicated a good performance (+18.9%), while Western Europe recorded a significant 10.1% increase, con-firming its position as the Group’s baseline zone. Finally, the Americas show an increase of 1.9 percentage points.
For further details on sales analysis, reference should be made to the following tables in the section concerning Seg-ment Reporting.
EURO 000’S 2017 % OF SALES 2016 % OF SALES CHANGE %
Revenue from sales and services 690,120 100.0% 618,489 100.0% 11.6%
Change in inventories, wip, semi-finished products and finished products 15,387 2.2% 12,649 2.0% 21.6%
Other revenue 4,669 0.7% 3,548 0.6% 31.6%
Revenue 710,175 102.9% 634,686 102.6% 11.9%
Raw materials, consumables, supplies and goods (287,017) (41.6)% (258,979) (41.9)% 10.8%
Other operating costs (136,194) (19.7)% (124,564) (20.1)% 9.3%
Added value 286,964 41.6% 251,143 40.6% 14.3%
Personnel expense (199,311) (28.9)% (176,551) (28.5)% 12.9%
Gross operating profit 87,653 12.7% 74,592 12.1% 17.5%
Depreciation and amortisation (19,904) (2.9)% (17,858) (2.9)% 11.5%
Provisions (2,652) (0.4)% (1,645) (0.3)% 61.2%
Impairment losses (1,492) (0.2)% (26) (0.0)% -
Operating profit 63,606 9.2% 55,062 8.9% 15.5%
Net financial expense (1,859) (0.3)% (1,534) (0.2)% 21.2%
Net exchange rate losses (1,017) (0.1)% (1,144) (0.2)% (11.1)%
Pre-tax profit (loss) 60,730 8.8% 52,385 8.5% 15.9%
Income taxes (17,992) (2.6)% (22,921) (3.7)% (21.5)%
Profit (Loss) for the year 42,738 6.2% 29,464 4.8% 45.1%
INCOME STATEMENT RECLASSIFIED BY NATURE AS AT 31 DECEMBER 2017

2017 ANNUAL REPORT
3534
BREAKDOWN OF REVENUE BY OPERATING SEGMENT
EURO 000’S 2017 % 2016 % CHANGE %
Wood Division 489,189 70.9% 450,605 72.9% 8.6%
Glass/Stone Division 108,241 15.7% 96,040 15.5% 12.7%
Mechatronics Division 98,503 14.3% 86,622 14.0% 13.7%
Tooling Division 13,250 1.9% 12,006 1.9% 10.4%
Components Division 21,218 3.1% 19,139 3.1% 10.9%
Intercompany eliminations (40,281) -5.8% (45,924) (7.4)% (12.3)%
Total 690,120 100.0% 618,489 100.0% 11.6%
EURO 000’S 2017 % 2016 % CHANGE %
Western Europe 309,211 44.8% 280,720 45.4% 10.1%
Asia-Pacific 153,158 22.2% 128,824 20.8% 18.9%
Eastern Europe 92,296 13.4% 77,633 12.6% 18.9%
North America 111,585 16.2% 109,497 17.7% 1.9%
Rest of the World 23,871 3.5% 21,813 3.5% 9.4%
Total 690,120 100.0% 618,487 100.0% 11.6%
BREAKDOWN OF REVENUE BY GEOGRAPHICAL SEGMENT
The Revenues amounted to € 710,175 thousand, up by 11.9% compared to 2016 (€ 634,686 thousand).
The following table shows a breakdown of costs as a percen-tage of revenues.
Intercompany elimination
Components Division
Tooling Division
Mechatronics Division
Glass/Stone Division
Wood Division
-10.0% 0.0% 10.0% 20.0% 30.0% 40.0% 50.0% 60.0% 70.0% 80.0%
31-12-2017
31-12-2016
EURO 000’S 2017 % 2016 %
Revenue 710,175 100.0% 634,686 100.0%
Raw materials and goods 285,501 40.2% 257,726 40.6%
Other operating costs 136,067 19.2% 124,564 19.6%
Service costs 118,137 16.6% 108,160 17.0%
Use of third party assets 10,745 1.5% 8,814 1.4%
Sundry operating expense 7,184 1.0% 7,590 1.2%
Added value 288,607 40.6% 252,396 39.8%
The normalised added value (totalling € 288,607 thousand), calculated as a percentage of the revenues, increased by 0.8% compared to the previous year (40.6% compared to 39.8%). The impact of raw materials and goods decreased (40.6% in the previous year compared to 40.2% in 2017). Other ope-rating expense showed an increase in absolute terms com-pared to the previous year (€ 11,503 thousand), largely due to the item Service costs (which increased from € 108,160 thousand to € 118,137 thousand, up by 9.2%); their impact on the revenues decreased slightly. In detail, this change is attri-butable to both “variable” cost items (for example, outsourced processing, third-party technical services, sales commissions and transport fees) and to other “fixed” components (travel and lodging expenses, trade fairs and maintenance).
In 2017, the normalised added value totalled € 288,607 thou-sand, up by 14.3% compared to last year (€ 252,396 thousand) and with an impact on revenue up from 40.8 % to 41.8%.
In 2017, Personnel expense amounted to € 199,155 thou-sand, compared to € 176,551 thousand in 2016, an approxi-mate € 22,604 thousand increase in absolute terms and with an impact on revenue up by 0.4% compared to 2016.
The increase in absolute terms is mainly related to the fixed component of wages, salaries and social security contri-butions (+ € 19,983 thousand, +12.2% compared to 2016) mainly due to the increase in the headcount in accordance with the recruiting policy adopted by the Group to support the medium-term business strategies. Finally, the increase in per-sonnel expense was also due to the increase in the bonus re-muneration variable component (+ € 1,395 thousand, +10.7%, on 2016) whereas the R&D capitalisation is up compared to 2016 (+ € 720 thousand, +7.4%)
The normalised gross operating profit was € 89,452 thousand (€ 75,845 thousand in 2016).
Depreciation and amortisation increased by 11.5% (from € 17,858 thousand to € 19,904 thousand) due to the policy to in-crease investments that has been implemented over the last few years in order to support the growth of operations. The-se increases involve both property, plant and equipment, the depreciation of which increased by € 1,067 thousand (from € 7,838 thousand to € 8,905 thousand, + 13.6%), and intangible assets, the amortisation of which increased by € 978 thou-sand (from € 10,020 thousand to € 10,998 thousand, + 9.8%).
Western Europe44.8%
Asia-Pacific22.2%
Eastern Europe13.4%
North America16.2%
Rest of the World3.5%
Western Europe45.4%
Asia-Pacific20.8%
Eastern Europe12.6%
North America17.7%
Rest of the World3.5%
-5.8%
3.1%
1.9%
14.3%
15.7%
-7.4%
3.1%
1.9%
14.0%
15.5%
70.9%72.9%
2017 2016

2017 ANNUAL REPORT
3736
Provisions amounted to € 2,652 thousand, increasing com-pared to the previous year (€ 1,645 thousand loss), largely because of the adjustment of the product warranty provision.
The normalised operating profit amounted to € 66,881 thou-sand, sharply improving on last year (€ 56,341 thousand), with a change in percentage terms of 18.7%.Impairment losses and non-recurring items were negati-ve to the tune of € 3,275 thousand, which is attributable to product phase outs, extraordinary costs incurred by the Au-stralian branch, non-recurring personnel expense incurred by the subsidiaries in China and India and the write-down of development costs concerning projects no longer considered strategic
Consequently, operating profit amounted to € 63,606 thou-sand, up by 15.3% compared to the previous year (€ 55,062 thousand). Net financial expense, amounting to € 1,859 thousand, was up by 21.2% compared to the previous year (€ 1,534 thousand).Net exchange rate losses in 2017 were € 1,017 thousand (compared to € 1,144 thousand in 2016).
Pre-tax profit thus amounted to € 60,730 thousand. The balance of income taxes was negative to the tune of € 17,992 thousand. This is attributable to the following factors: current IRES (Italian corporate income tax) and IRAP (Italian regional business tax) taxes amounting to € 12,986 thousand and € 3,015 thousand, respectively; provisions for income ta-xes relating to foreign subsidiaries (€ 4,045 thousand), taxes (positive € 1,412 thousand), other taxes (€ 11.3 thousand), and net deferred tax (€ 653 thousand).
The significant reduction in the tax-rate is mainly due to re-cognizing a tax benefit for the three-year period 2015-2017 in regards to the optional Patent Box scheme. In the month of December, the Group company HSD SPA actually signed a preliminary agreement with the Italian Revenue Agency for access to the subsidy in question, which allows for a share of the income deriving from use of intangible property to be excluded from taxation. The related effect is recognized un-der both current taxes for the year, and Prior-year taxes relati-ve to previous years.The Group therefore recorded a profit for the year of € 42,738 thousand.
STATEMENT OF FINANCIAL POSITION HIGHLIGHTSSTATEMENT OF FINANCIAL POSITION AS AT 31 DECEMBER 2017
The increase in the item intangible assets (around € 9.9 mil-lion) is largely due to the capitalisation of costs for the deve-lopment of products that are nearly completed and expected to generate an economic return in the coming years. In the reference period, design activities required new investments amounting to € 14,443 thousand (€ 9,241 thousand in 2016). In addition, around € 1 million investments are recorded for the implementation of the ORACLE software in the Group’s subsidiaries.
Compared to 31 December 2016, net property, plant and equi-pment increased by approximately € 8.6 million. Besides the amounts concerning the regular replacement of work equip-
ment, the Group bolstered the HSD America branch (for the purchase of the new building) by a total € 1.2 million.
On the financial position front, net operating working capital recorded a decrease of € 28.2 million, which was attributable to good momentum in collections, leading to a reduction in trade receivables (by around € 9.4 million) and an increase in inventories (equal to roughly € 12.4 million). These move-ments were partially offset by an increase in trade payables (€ 31.3 million).
EURO 000’S31 DECEMBER
201731 DECEMBER
2016
Intangible assets 75,107 65,218
Property, plant and equipment 90,515 81,939
Financial assets 2,648 2,346
Non-current assets 168,270 149,503
Inventories 143,210 130,785
Trade receivables 119,380 128,748
Trade payables (223,916) (192,613)
Net operating working capital 38,674 66,920
Post-employment benefits (13,456) (13,746)
Provision for risk and charges (10,405) (11,994)
Other net payables (35,617) (44,998)
Net deferred tax assets 10,501 10,011
Other net liabilities (48,978) (60,727)
Net invested capital 157,966 155,696
Share capital 27,393 27,393
Profit for the previous year and other reserves 117,434 102,656
Profit (Loss) for the year 42,558 29,384
Non-controlling interests 952 290
Equity 188,337 159,723
Bank loans and borrowings and loans and borrowings from other financial backers 49,050 42,354
Other financial assets (519) (87)
Cash and cash equivalents (78,902) (46,295)
Net financial position (1) (30,371) (4,027)
Total sources of funding 157,966 155,696

2017 ANNUAL REPORT
3938
NET FINANCIAL POSITION
As at 31 December 2017, the Group’s Net Financial Position amounted to € 30.4 million, up by € 34.2 million compared to 30 June 2017 and € 21.1 million compared to 30 September 2017. The increase in profits and the constant attention to the performance of net operating working capital once again un-derpin the generation of cash (free cashflow of € 35.2 million)
which at the end of 2017 actually generated a positive finan-cial position also net of dividends paid (cash-out of over € 9.8 million) and investments planned. Compared to last Decem-ber, the Net Financial Position was up by € 26.3 million overall.
EURO 000’S 31 DECEMBER2017
30 SEPTEMBER2017
30 JUNE2017
31 MARCH2017
31 DECEMBER 2016
Financial assets: 79,421 60,029 44,099 49,510 46,755
Current financial assets 519 14 15 (587) 461
Cash and cash equivalents 78,902 60,015 44,084 50,097 46,295
Short-term financial lease payables (199) (31) (59) (111) (111)
Short-term bank loans and borrowings and loans and borrowings from other financial backers (29,086) (24,238) (21,430) (37,140) (35,035)
Short-term net financial position 50,136 35,760 22,610 12,259 11,609
Medium/Long-term financial lease payables (1,060) (2,183) (23) - (43)
Medium/Long-term bank loans and borrowings (18,705) (24,372) (26,438) (7,305) (7,539)
Medium/Long-term net financial indebtedness (19,765) (26,554) (26,460) (7,305) (7,582)
Total net financial position 30,371 9,205 (3,851) 4,955 4,027
MAIN RISKS AND UNCERTAINTIES TO WHICH BIESSE S.P.A. AND THE GROUP ARE EXPOSEDOPERATING RISKS
RISKS RELATING TO GENERAL ECONOMIC CONDITIONSAs it operates in a competitive global market, the Biesse Group’s, financial position and cash flows are affected by the general conditions and trends of the global economy. There-fore, any economic downturn or political instability in one or more key markets, as well as lending conditions, can have a significant impact on the Group’s economic performance and strategies and affect its future prospects in both the short and medium to long term.
RISKS RELATED TO THE LEVEL OF COMPETITIVENESS AND CYCLICAL NATURE OF THE INDUSTRYDemand is cyclical and depends on general economic con-ditions, end customers’ propensity to consume, credit avai-lability, and any government stimulus measures. A negative trend in demand, or the Group’s inability to adapt effectively to external market conditions, could have a significant negative impact on the Group’s business prospects as well as on its results of operations and financial position.All of the Group’s revenue substantially come from the me-chanical tool sector, which is a competitive industry. The Group competes in Europe, North America and in the Asia Pacific region with other major international players. These markets are all highly competitive in terms of product quality, innovation, price and customer service.
RISKS RELATING TO SALES ON INTERNATIONAL MARKETS AND EXPOSURE TO SHIFTING LOCAL CONDITIONSA significant part of the Group’s production and sales is carri-ed out in countries outside the European Union. The Group is exposed to risks inherent to operating on a global scale, inclu-ding risks relating to exposure to local economic and political conditions and to the potential implementation of policies re-stricting imports and/or exports.In addition, being exposed to compliance with several tax re-gimes, the Biesse Group is therefore subject to transfer pri-cing risks.In particular, the Biesse Group operates in several emerging markets including India, Russia, China and Brazil. The Group’s exposure to these countries has gradually increased; there-fore, any adverse political or economic development in these areas could have a negative impact on the Group’s prospects and business as well as on its results.
RISKS RELATING TO FLUCTUATIONS IN THE PRICES OF RAW MATERIALS AND COMPONENTSThe Group’s exposure to increases in the prices of raw materials mainly derives from the purchase of components and semi-fini-shed products given that the direct purchase of raw materials for production is not significant.The Group, therefore, does not hedge those risks, but rather tends to transfer their management and economic impact to its own suppliers, agreeing with them, where necessary, purchase prices that ensure stability for periods of at least one quarter.The high level of competition and fragmentation of the sector in which Biesse operates often makes it difficult to transfer sudden and/or significant increases in purchase prices enti-rely on to sales prices.
RISKS RELATING TO THE ABILITY TO OFFER INNOVATIVE PRODUCTSThe success of the Group’s operations depends on its ability to maintain or increase its share of the markets in which it currently operates and/or to expand in new markets by of-fering innovative, high-quality products that ensure adequate profitability levels. Should the Group fail to develop and offer innovative and competitive products compared to those of its main competitors in terms of, amongst other things, price, quality and functionality, or should there be any delay in laun-ching new models that are strategic to the Group’s business, the Group’s market share may decline, negatively affecting its business prospects as well as its results and/or financial position.
RISKS RELATING TO MANAGEMENTThe success of the Group depends in large part on the ability of its executive directors and other management members to effectively manage the Group and its individual business divisions. The loss of an executive director, senior manager or other key personnel as a result of organisational changes and/or the Group’s restructuring, with no timely and adequate replacement and reorganisation, as well as the inability to at-tract and retain new and qualified staff, could therefore have a negative impact on the Group’s business prospects as well as on its results and/or its financial position.
RISKS RELATING TO RELATIONS WITH SUPPLIERSThe Group purchases raw materials, semi-finished products and components from a large number of suppliers and relies on services and products provided by other companies out-side the Group. Close collaboration between the manufacturer and its sup-pliers is customary in the sectors in which Biesse operates: on the one hand, it can result in economic benefits in ter-ms of cost reduction; on the other, the Group’s reliance on these suppliers implies that the difficulties they experience (whether due to internal or external factors) could negatively affect the Group.
RISKS RELATED TO OFFSHORINGThe Group has been relocating its manufacturing operations for a few years now. This process involved China and India, both by opening new production plants and acquiring existing ones. As a result, the Group’s exposure to the performance of these countries has increased in recent years. Political and economic developments in these emerging markets, inclu-ding any situation of crisis or instability, could significantly af-fect negatively the Group’s business prospects in the future.

2017 ANNUAL REPORT
4140
FINANCIAL RISKS
RISKS RELATING TO FINANCIAL REQUIREMENTSThe liquidity risk is normally defined as the risk that the com-pany might be unable to meet its payment obligations due to the difficulty in raising funds (funding liquidity risk) or sell assets on the market (asset liquidity risk). The result is a ne-gative impact on profit or loss should the company be for-ced to bear additional costs to meet its obligations or, in the worst-case scenario, a situation of insolvency threatening its viability as a going concern.Among the lines considered “medium term”, the Biesse Group used the opportunity of a “subsidised and dedicated” funding by supranational entities (EIB) since a specific five-year loan was granted in 2015 through UniCredit Banca.Given that cash flow generation was concentrated especially at the end of 2017, the Group has a high availability of credit li-nes – higher than actual needs – hence debt consists almost entirely of residual amounts relating to previous unsecured/mortgage loans.
CREDIT RISKThe Group is exposed to various concentrations of credit risk in the various markets in which it operates, although credit exposure is divided across a large number of counterparties and customers. Financial assets are recognized net of impairment losses calculated based on counterparty default risk, taking into ac-count available information on the customer’s solvency as well as historical-statistical data.
RISKS RELATING TO EXCHANGE RATE FLUCTUATIONSThe Biesse Group, as it operates in several markets around the world, is naturally exposed to market risks relating to the fluctuation in interest and exchange rates. The exposu-re to currency risk is mainly linked to differing geographical distribution in commercial activities, which leads to having cashflows from exports nominated in currencies different to that of the production region. In particular, the Biesse Group is primarily exposed on net exports going from the Eurozone to other currency areas (mainly US dollar, Australian dollar, Bri-tish pound, Swiss franc, Indian rupee, Hong Kong dollar and Chinese yuan). In order to keep improving performance in ma-naging currency risk, and to be increasingly consistent in the way it is reported in the accounts, the Biesse Group has adop-ted a new Currency Risk Management Policy. It is aimed at establishing, among other things, stringent rules for tackling and mitigating risk related to exchange rate fluctuations. In the Policy at issue, the instruments through which to hedge against this risk – be it centralised or decentralised – are also determined. Nevertheless, sudden fluctuations in exchange rates could have a negative impact on the Group’s results.
RISKS RELATING TO INTEREST RATE FLUCTUATIONSThe Group, even if it has a positive net financial position, is in any case exposed to an interest rate fluctuation risk. The Group’s exposure to interest rate risk mainly arises from the volatility of financial expense related to floating-rate debt partially offset by the remuneration rates (which are also va-riable) of available assets.The Group’s operating and financial policies are aimed at mi-nimising the impact of such risks on the Group’s performance by improving its results and net financial position.
RISKS RELATING TO THE ABILITY OF CUSTOMERS TO FI-NANCE INVESTMENTSThe Biesse Group, since it operates in the sector of long-term capital goods, is subject to the negative impact of potential tightening of credit standards by financial institutions for cu-stomers intending to buy goods using financing (e.g. opera-ting leases, secured credit, etc.).
RISKS CONNECTED TO THE UNITED KINGDOM LEAVING THE EUROPEAN UNION (SO-CALLED “BREXIT”)The Group analysed the potential impacts that the United Kin-gdom leaving the European Union could have. There are no potential financial, operating and strategic risks connected to “Brexit”.
41

2017 ANNUAL REPORT
434242 43

2017 ANNUAL REPORT
4544
CORPORATE GOVERNANCE
2017 RESEARCH AND DEVELOPMENT ACTIVITIES
The Corporate Governance system of Biesse S.p.A. complies with the principles set out in the Code of Conduct for Listed Companies and the international best practices. The Board of Directors approved on 12 March 2018 the Corporate Go-vernance and Ownership Structure Report pursuant to Article 123-bis of the 2017 Consolidated Finance Act. This Report is published on the Parent’s website www.biesse.com in the “Investor Relations” section, “Corporate Governan-ce” subsection, and constitutes a reference for legal purposes. Biesse S.p.A. has adopted a traditional governance and con-trol model as envisaged by Italian Law, with a Shareholders’ Meeting, a Board of Directors, a Board of Statutory Auditors
and Independent Auditors. The corporate bodies are appoin-ted at the Shareholders’ Meeting and hold office for three ye-ars. The representation of Independent Directors, as defined in the Code, and their role in both the Board and the Parent’s Committees (Control and Risks Committee, Related Party Committee, Remuneration Committee), are fit for ensuring the interests of all shareholders are balanced and all sides of a discussion are freely aired in the meetings of the Board of Directors.
WOOD DIVISION – BIESSE BRAND
TFS SEEDXPSite for developing and updating the SW platform and libra-ries.
TFS THMISite for developing and updating the interface features instal-led on the machines.
INSIDER M FTB 1300In 2017, the Insider M KT technical, mechanical and electricalproject was completed.
TECHNO LINE BT FDT MN AND CNIn 2017, the detailed project of the Techno FDT linear drillingmachine was changed in order to further improve the controlfeatures and provide for the software and hardware platformfor the interface and management of the in-line integratedmachine and “Industry 4.0”. The prototype machine will be built and tested during 2018.
FLEXIBLE DRILLING MACHINEDevelopment has continued on a machining center for high-productivity drilling with manual or automatic loading.
SKIPPER 100 – RESTYLING 2017Development has been completed on a machining center de-dicated to drilling for the mid-range market with manual orautomatic loading to increase performance and productivity.
WINLINE 16.XXDevelopment has been completed of a high production-machi-ning center to produce fixtures and hardwood components.
SKIPPER 130 – RESTYLING 2017Development has been completed on a machining center de-dicated to drilling for the mid-to-high-end range of the marketwith manual or automatic loading to increase performanceand productivity.
ROVER M5 MACHINING CENTREDevelopment has been completed on a 5-axis machining cen-ter for processing thick components.
ROVER B FT MACHINING CENTRE (2017)Development has been completed on a high-range machiningcenter for nesting processing of wood-based materials. Theproject will enhance both the performance of the operatingunits and the machine configuration options to meet the dif-ferent production needs of customers operating in a highlycompetitive sector.
ROVER K FT MACHINING CENTREDevelopment has been completed on an entry-level machi-ning center for nesting processing of wood-based materials.
RFSDevelopment has continued to optimise the performance ofthe edgebanding unit used for different Rover machining cen-tres in order to increase the types of processed edges andboost productivity
ROVER K 1Y32 G MACHINING CENTRE (2017)Development has been completed on a gantry 4-axis machi-ning center for the artisan market. New solutions for reducingthe overall dimensions of the installation of the machine willbe designed.
ROVER A FT MACHINING CENTRE (STEP2)Development has continued on a mid-to-low-end gantry 5-axis machining centre for nesting processing of both wood-basedand plastic materials.
EXCEL P&R (STEP2)Development has been completed on a pantograph with bartables for high productivity, characterised by the significantrigidity of the structures and very high modularity of the ope-rating groups.
ROVER C – C3 MACHINING CENTREDevelopment has been completed on a 5-axis machining
center aimed at providing solutions optimised to reduce thedimensions of installation.
ROVER SLAVE ROBOTDevelopment began and has been completed on a slave robotfor the machining centre.
ROVER K 1Y32 EDGE MACHINING CENTREDevelopment has begun on a gantry machining center forboth milling and edging shaped panels, in order to meet theneeds of manufacturing market.
SAFETY DEVICESDevelopment has begun on a new safety system usingnon-contact devices for detecting workers within the dangerzone of a machining center.
HFSDevelopment has been continued of a new edgebanding unitused for different Rover machining centres in order to increa-se the types of processed edges and boost productivity.
ROVER A FT SMART MACHINING CENTREDevelopment has begun on a mid-to-low-end gantry 5-axismachining centre for nesting processing of both wood-basedand plastic materials, with particular attention being paid tothe ergonomics of use and the minimisation of the overallspace requirements.
VEKTOR PROJECTSThis range of machinery has been enriched with the additionof the Vektor 3.0 prototype machine. The refinement phase ofthis project will be completed at the same time as the pre-se-ries order. Development of the Vektor Smart project has begun, with a goal of completing the range of machinery equipped with haulage systems, which have entry-level con-figurations.
EKO 2.2A new machine with a clamp panel transport system for stre-amlining the range of EKO family product offer. This productis expected to integrate with or replace the EKO 902 model.
EXTRA E - MIXIn 2017, development work began on the E-MIX project, themachining centre for processing cross-laminated timber(CLT) panels used for the walls of pre-fab timber homes. Theaim of the project is to unify and rationalize the available offe-rings that are currently spread over two different types of ma-chinery. This would bring clear advantages in terms of carryover and related costs. The first prototype will be assembledas from May 2018.
ADVANCED MATERIAL – BIESSE BRAND
PLAST RANGEThe EKO 2.1 PLAST is a new piece of machinery with aclamp-panel transport system, which is produced as a carry-over from the EKO 2.1 Wood range. The goal is to satisfymarket demand for other materials. Vektor Plast will completethe vertical range of product offerings in this market.
Materia CLIn 2017, development work continued on the Materia CLproject - the low band machining center designed for proces-sing composite materials and aluminium.In particular, design and prototyping of the various list sizeswas completed, introducing new solutions for the operatinghead and workpiece locking system.
Materia CL 2018In 2017, design work aimed at industrialising the Materia CLproduct began. To achieve this goal, new structural solutionswere identified to improve the machining center’s productionprocess, noticeably lowering the final cost. The first prototypeincluding the new solutions will be assembled as from April2018.
Materia LDIn 2017, development work began on the Materia LD project -the medium band machining center designed for processingcomposite materials and aluminium. In particular, the designfor the first prototype in the development plan was completed.
Materia MRIn 2017, development work began on the Materia MR project- the high band machining centre designed for processinglarge items made from different materials (timber, compositematerials, aluminum). In particular, a structural design for thefirst prototype in the development plan began. The first pro-totype will be assembled as from June 2018.
GLASS & STONE DIVISION - INTERMAC BRAND
MASTER ENTRY LEVEL (MASTER 30)The project for the development of a range of CNC mechani-cal-cutting machines for glass products, natural or syntheticstone products, with diamond tools for processing for furnitu-re and building industries, was completed.
NEW VERTICAL RANGE (STEP 1)Design work began on mechanical-cutting machines for ma-nufacturers of industrial glass or plastic products, featuringtools for drilling, milling, grinding and polishing. They willcome in a range of sizes to meet the needs of workshops andindustrial facilities in the building, furniture and energy sector.
PRIMUS 402Working tests and trials were undertaken of a range of high-pressure water cutters for materials such as glass, stone,steel, aluminium and plastics, which, if necessary can usesand for cutting extremely hard materials. Waterjet cutters al-low executing complex cuts, combining flexibility and cuttingquality for workshops and industrial facilities.
GENIUS CT RED bars and belts (STEP 1)A project has been developed for a range of machinery desi-gned to cut monolithic sheets for automatic production lines.This machinery can be accessorised with functional groups,which allow it to perform multiple functions, which is mainlynecessary in the construction, energy, furniture making, andautomotive industries.
GENIUS HP250 (STEP1)A project related to an up-market, high-performance in-line

2017 ANNUAL REPORT
4746
machine for cutting laminated sheets, used mainly in the buil-ding industry, is under development with the main purpose ofincreasing productivity.
DOUBLE EDGING GRINDING MACHINE FKValidation tests have been completed to produce glass pro-ducts, natural or synthetic stone products on two flat profile-edging machines, which can be adjusted depending on theglass sheet size, with diamond tools, for workshops and in-dustrial.
CONTROL ROUNDING UNITValidation tests have been completed on a functional unit forthe execution of joints that can be applied on machines forstraight grinding, using diamond tools, for workshops andindustrial facilities operating in the furniture and building sec-tors facilities operating in the furniture and building sectors.
TOOLING DIVISION - DIAMUT BRAND
ARRIS POLISHING GRINDERSResearch and design of a cup grinding wheel with resinoidbond that is suitable for polishing glass sheets arris. The goalis to replace a product that is currently purchased externally,with one that is manufactured in-house and consequently re-ducing costs.
POLYURETHANE BODYResearch and design of flash grinding wheel bodies, madewith an aluminum core covered in a flexible layer of polyuretha-ne rubber. The goal is to replace a product which is currently purchased externally, with a lower cost product manufactured in-house, potentially attaining a variety of color types.
NEW BUSETTI GRINDERSResearch and design of a new type of cup grinding wheel witha metal bond and a structure which allows internal cooling onthe diamond belt. The goal is to introduce an innovative newproduct to the market.
WATERJET DIAMOND GRINDERSResearch was carried out jointly with the Milan PolytechnicUniversity on WaterJet turning techniques using diamondgrinding wheels and a metallic bond.
SEMI-FINISHED PRODUCTSResearch and design of economical bonds for producing se-mi-finished products for assembly at the Diamut Brazil ma-chining center.
MECHATRONICS DIVISION (HSD)
BI-ROTARY HEADS FOR MACHINE TOOLSDesign of a new range of BI-ROTARY heads with Direct Drivetechnology designed for processing metal, composite mate-rials, timber and derivatives. These products are characteri-sed by greater dynamic performance, improved processing precision and high-quality surface finishings.They can be equipped also with high-power electrospindleswith different types of tool holder.
ELECTROSPINDLESExtension of the electrospindles range designed for metal
processing, with the production of milling and turning ver-sions: GAMMA ES511 and ES575, in various versions andpowers required. Design work began on the (ES334, ES328) range of high-speed electrospindles, dedicated to the “Tap-ping Centers”. These electrospindles are characterized by a speed of 30,000 revolutions per minute (rpm) and air-oil lubri-fied bearings, which allow acceleration/deceleration times of less than 2 seconds. They are also designed for processing components with high-quality surface finishings (e.g. smar-tphones, tablets, etc.).
SMARTMOTORDesign of the new SmartMotor SM137 - a range of servomo-tors with small dimensions but high performance. The projectis also characterized by highly flexible usage, as they can beused on two different types of fieldbus (Enet, Canopen). A stand-alone version will be also be developed from this, fordriving high precision electric motors. The Field Bus industrialcommunication systems exchange information betweendevices installed on a machine tool (e.g. between an electro-spindle and the numeric control system). Instead of havinga pair of wires for each sensor, every device is connected toand transmits data on a single set of wires (similar to the waycomputers, servers and other devices are connected througha company network).
PRINTED-CIRCUIT BOARDSWith the goal of extending the IoT Ready functionalities (alre-ady included in some products since 2011), a multifunctionboard has been developed which is equipped with electro-spindles and bi rotary heads, characteristic of the e-CORE™brand. To achieve this, specific sensors such as a tri-axial ac-celerometer have also been developed, in order to allow themonitoring of HSD products and keeping in mind preventiveand predictive services.
INDEPENDENT SPINDLE BORING HEADSBoring head development has been directed at improvingfunctionality and reliability. This will allow more intensive useand products will be distinguished according to the type ofend use. The technological solutions that have been develo-ped therefore focus on intensive use (heads with independentshort tubes for use on sound absorbent panels and hard pla-stic materials) and standard processing for wood and woodderivatives (spindles with reduced protrusion).
AGGREGATESDesign work on a multifunctional group with integrated directmotor, suitable for horizontal drilling and blade cutting. Thesystem is equipped with a 180mm blade unit, four indepen-dent horizontal units. The component is designed for a 0-360°working area.
TURNING TABLESHSD has begun designing turning tables for use with indu-strial machine tools. This initiative forms part of a strategicproject in partnership with OEMs that manufacture five axismachine processing tools. Processing of this type can bedone using bi-rotary heads and electrospindles coupled to aturning table.
CNC - WRTDrivers have been developed to support the new YaskawaSIGMA7 machines. The features of these new drivers will
bring technology advantages to the machinery.Automated monitoring of the maximum circularity error hasbeen developed, directed at improving processing precision.The concept of having dynamic datasets has also been de-veloped for the same reason, namely to provide an option tochange motor control parameters depending on the type ofprocessing. These datasets will allow users to make a real-ti-me decision to prioritize speed at the cost of precision, or, onthe contrary, to prioritise precision at the cost of speed. Fur-thermore, continuous setpoint monitoring has been introdu-ced for the segmented programs, which is capable of preven-ting imprecisions in the processing.
BH1000The BH1000 (HSD’s PLC controller for micro PCs) has recei-ved a hardware update with a new Intel CPU, and an operatingsystem update with Windows 10 IoT. The QUIXP real time ex-tension has also been updated to work with the new operatingsystem.
SM141 AND CP400 DRIVEFirmware to support Ethercat has been developed.
STEPPER DRIVE CP100Introduction of drivers to support SSI absolute encoders.
NEW MOTOR SM137D FIRMWAREDevelopment of firmware to ensure compatibility withSM137C.
BPAD – WIRELESS PALMTOP DEVICECreation of compatibility software that is capable of runningold applications that were developed for the palmtop RM850,on the new bPad.
SOFTWARE PLATFORMS AND COMPONENTS 2017
BSOLID 3.0.2 (CAD/CAM)In 2017, development continued of a new integrated program-ming system for wood, stone and glass processing. The focuswas on the development of new features:• Improvements to the preventative collision control for pie-cework production.• New graphics engine (additional development step).• Improvements to the barcode functionality (Vertmax).• Management and testing of new Biesse machines (new Ro-ver K and A FT among others).The automatic processing allows switching from the drawingto the object to be manufactured by the machine with a click.The unique realistic simulation allows the engineering of aproduct before manufacturing it and removes many of theuncertainties arising from the use of complex machines suchas machining centers.
BPROCESSIn 2017, bProcess completed the contract of the customer“Apollo kitchen”, from the order to putting into production toshipping, through the management of warehouses and as-sembly instructions
BWINDOWSAdd-in for bSolid for designing and manufacturing windows.It allows the design of the most varied forms of windows and
increases integration with Biesse machines. It also allows thetime needed for configuring windows to be drastically redu-ced, and offers the option of designing windows in 3D.bWindows 3.0.2 has been released. It includes a new tool(bDoors) for designing hollow core, glass or moulded doors.
BEDGEAdd-in for bSolid for the management of machining centersfor wood edgebanding. The goal of this project is to simplify as much as possible the use of these machines that is very difficult today, through the massive use of simplified interfa-ces and technologies arising from operational research and artificial intelligence, which allow bEdge to carry out all those edgebanding design phases that are carried out manually to-day. In 2017, management of edgebanding with a “No Glue” device was introduced.
BNESTbNest achieves extreme simplicity of use and total integrationwith bSuite, this allows the customer to work in a moreorganised and controlled way, thanks to the bSolid simulation.Based on a bProcess platform, it allows a direct connectionwith the cabinet designing software and integration into themost popular ERP systems.In 2017, development work continued on this bSuite compo-nent, with a revision of various features and improvement ofa number of graphics.

2017 ANNUAL REPORT
494848 49

2017 ANNUAL REPORT
5150
RECONCILIATION BETWEEN THE EQUITY AND RESULTS AND CONSOLIDATED EQUITY AND RESULTS OF THE PARENT
RELATED PARTY TRANSACTIONS
In compliance with Consob Communication No.DEM/6064293 of 28 July 2006, below is a table showing the
reconciliation of the equity and results for the year of the pa-rent with the consolidated equity and results for the year.
EURO 000’SEQUITY
31/12/2017PROFIT FOR 2017
EQUITY 31/12/2016
PROFIT FOR 2016
Equity and profit for the year of the ultimate 176,973 38,812 148,025 21,942
Elimination of carrying amount of consolidated equity investments:
Difference between carrying amount and amount of equity held 23,182 24,539
Pro-quota results contributed by investees 21,574 16,548
Derecognition of impairment losses/reversal of impairment losses on equity investments 3,999 10,280
Dividends (22,187) (16,492)
Elimination of the effects of transactions between consolidated companies:
Intercompany losses included in closing inventories (12,206) 360 (12,566) (2,893)
Intercompany losses on non-current assets (564) (564)
Equity and profit of the year attributable to owners of the ultimate 187,385 42,558 159,433 29,384
Non-controlling interests 952 180 290 80
Total equity 188,337 42,738 159,723 29,464
With reference to transactions with the Ultimate Parent Bi.Fin. S.r.l. details are reported below.
It is hereby declared that, pursuant to Article 2.6.2., paragraph 13 of the Rules of the Markets organised and managed by Borsa Italiana S.p.A., all of the conditions set forth in Article 37 of Consob Regulation No. 16191/2007 have been complied with. These conditions prohibit the listing of shares for subsidiaries that are subject to direction and coordination by another company.
EURO 000’SREVENUE
2017REVENUE
2016 COSTS
2017 COSTS
2016
Ultimate Parent
Bi. Fin. S.r.l. - - 370 334
EURO 000’SRECEIVABLES AT
31 DECEMBER2017
RECEIVABLES AT 31 DECEMBER
2016
PAYABLES AT 31 DECEMBER
2017
PAYABLES AT 31 DECEMBER
2016
Ultimate Parent
Bi. Fin. S.r.l. 977 977 - -
OTHER RELATED PARTY TRANSACTIONS
The following have been identified as related parties: the Board of Directors, the Board of Statutory Auditors, SEMAR S.r.l., Wirutex S.r.l. and Fincobi S.r.l. (the first is a related party owing to family relationships with the owner, the second and
the third are subsidiaries of Bi.Fin. S.r.l., the Ultimate parent). During the year, transactions with the aforementioned parties were as follows:
We can confirm that the transactions disclosed above, which are mainly of a financial nature, were carried out under terms
and conditions that were not different from those arm’s len-gth parties would have agreed.
EURO 000’SREVENUE
2017REVENUE
2016 COSTS
2017 COSTS
2016
Other related companies
Fincobi S.r.l. 1 1 15 15
Se. Mar. S.r.l. 26 4 3,251 3,200
Wirutex S.r.l. - 36 26 1,105
Members of the Board of Directors
Members of the Board of Directors 0 - 1,826 2,649
Members of the Board of Statutory Auditors
Members of the Board of Statutory Auditors - - 168 155
Total 27 41 5,656 7,458
EURO 000’SRECEIVABLES
2017RECEIVABLES
2016PAYABLES
2017PAYABLES
2016
Other related companies
Fincobi S.r.l. - - - -
Edilriviera S.r.l. - - - -
Se. Mar. S.r.l. 3 4 1,276 1,251
Wirutex S.r.l. 31 47 9 342
Members of the Board of Directors
Members of the Board of Directors 31 - 34 18
Members of the Board of Statutory Auditors
Members of the Board of Statutory Auditors - - 168 160
Total 1,043 1,028 1,488 1,771

2017 ANNUAL REPORT
5352
INFORMATION ON SIGNIFICANT COMPANIES OUTSIDE THE EU
PERSONNEL
Biesse S.p.A. controls directly or indirectly some companies established and regulated by the law of States outside the European Union (“Significant Companies outside the EU” as defined by Consob Regulation No. 16191 of 29 October 2007 as amended).With reference to these companies, it should be noted that:• All the Significant Companies outside the EU draw up a reporting package for the purposes of preparing the Con-solidated Financial Statements; their statement of financial position and income statement are made available to the sha-reholders of Biesse S.p.A. within the terms and timeframes provided for by the relevant regulations.
• Biesse S.p.A. obtained the articles of association as well as the composition and powers of the corporate bodies of the Significant Companies outside the EU.• The Significant Companies outside the EU:- provide the independent auditors of the parent with the infor-mation required for auditing the annual and interim financial statements of the parent itself;- have an administrative and accounting system fit for sub-mitting on a regular basis to the management and the inde-pendent auditors of Biesse S.p.A. the data related to results of operations, financial position and cash flows required for preparing the Consolidated Financial Statements.
The Group’s dimensions are constantly growing, with an in-crease in the number of branches and employees. In such a context, being able to manage HR processes in a way that is uniform and organic using the best performing tools, be-comes fundamental. To this end, in 2017 a HR project was launched to integrate at Group level the procedures for sto-ring staff details, also using the support of new software de-dicated to this purpose. A further goal is to allow employees to quickly access information and materials that are made available to them by the company, and to give innovative to-ols to the Group’s divisions for optimising the processes for managing teams, increasing efficiency. Developing and implementing effective staff selection sy-stems is a fundamental strategy for sustainable Group growth and to guarantee transparency and equality, while completely respecting equal opportunity and enhancing individual skills. The Biesse Group strives for continuous improvement in the selection process, directed at identifying not only the skills and capabilities required in the immediate future, but also the opportunities required to grow as a team and take on other ro-les over time. The goal is to reinforce every area of the Group, trusting in the skills of men and women with greater experien-ce, combined with the enthusiasm of those who are starting their professional development path.
Staff training forms the basis for the continuous innovation, reliability and quality of goods and services offered by the Group to its customers. For this reason, training is structu-red in such a way as to ensure a differentiated and inclusive offering, which is oriented towards involving professionals at all levels.
It is the Group’s belief that the only way growth can remain sound and continuous over time, is through dedicated invest-ment in developing and refining employee skills.The Biesse Group believes that continuous learning is the key to a successful future. Every year it organises weeks of trai-ning at the Headquarters, directed at branch employees and business partners around the world. Full days are dedicated to exploring product innovations and new sales tools. Trai-ning for sales staff is regular and ongoing. It tracks techno-logical product developments and innovations being made to services offered by the Group, so that staff are always able to provide added value to customers. Bearing witness to the attention paid by the Group to ethics and business integrity in every aspect, during 2017, various activities were carried out in relation to engagement, infor-mation and training, including remote learning, in relation to Italian Legislative Decree no. 231/2001, the Code of Conduct, anti-corruption and human rights. Based on the belief that young talent should be developed, the ‘Future Lab’ project was presented in July 2017 - an initia-tive dedicated to the young people who have been recruited over the last few years. They were given an opportunity to participate in full days of discussion and training on topics such as project management and leadership, and these were alternated with time dedicated to hearing their professional expectations, motivations and ambitions of each individual. The project’s objective was to design personal development plans to expand skills and professional growth within the Group.
SHARES IN BIESSE AND/OR ITS SUBSIDIARIES, HELD DIRECTLY OR INDIRECTLY BY MEMBERS OF THE BOARD OF DIRECTORS, THE BOARD OF STATUTORY AUDITORS AND THE GENERAL MANAGER, AS WELL AS BY THEIR RESPECTIVE SPOUSES WHERE NOT LEGALLY SEPARATED AND BY THEIR CHILDREN
NO. OF SHARES HELD DIRECTLY AND
INDIRECTLY AT 31/12/2016
NO. OF SHARES SOLD IN 2017
NO. OF SHARES PURCHASED
IN 2017
NO. OF SHARES HELD DIRECTLY
AND INDIRECTLY AT 31/12/2017
% OF SHARE CAPITAL
Roberto Selci 0 0 0.00%
Chairman
Giancarlo Selci 13,970,500 13,970,500 51.00%
Managing Director
Stefano Porcellini 0 0 0.00%
Executive Director and General Manager
Alessandra Parpajola 600 600 0 0.00%
Executive Director
Cesare Tinti 0 0 0.00%
Executive Director
Salvatore Giordano 200 200 0 0.00%
Independent Director
Elisabetta Righini 0 0 0.00%
Independent Director
Giovanni Ciurlo 0 0 0.00%
Statutory Auditor
Cristina Amadori 0 0 0.00%
Statutory Auditor
Riccardo Pierpaoli 0 0 0.00%
Statutory Auditor

2017 ANNUAL REPORT
5554
ATYPICAL AND/OR UNUSUAL TRANSACTIONS OF THE YEAR
SIGNIFICANT EVENTS AFTER THE REPORTING DATE AND OUTLOOK
In 2017, there were no such transactions.
Trade fairs and events have always been an essential oppor-tunity for the Biesse Group to meet customers and are an important opportunity to set out innovative technological so-lutions. Every year the Group takes part in over 50 trade fairs worldwide, directly and together with its subsidiaries. It also organises global “Inside” events as well as “one2one” and “Te-ch-tour” events, focused on specific technological solutions or aimed at a particular target. Besides the now consolidated presence at trade fairs and events for the working of wood, glass and stone, the Group is making significant investments
in the world of plastic and compound materials. The concept that guides the Group is “Thinkforward”, i.e. the ability to create innovation through integrated solutions, whi-ch are sophisticated but simple in their use, to produce more, better and at lower cost. It is an incentive to look forward, to understand how the digital factory can change the way in whi-ch we conceive of and produce things. Here below is a brief description of the main events and trade fairs.
JANUARY 2018From 15 to 18 January Intermac took part in the Steelfab tra-de fair, dedicated to the metal industry. The event took place in Sharjah, in the Middle East. The Primus 322 machine was displayed: it is a waterjet cutting machine that ensures high performance, as well as easy programming and versatility. The decision to attend Steelfab confirms Intermac’s commit-ment to the Middle Eastern market, which is further demon-strated by the use of Waterjet technology at the Biesse Group permanent campus that has been inaugurated in the Dubai Silicon Oasis. Among the chief events to start off the year was the Back to business event. It was hosted by the Bies-se Campus in Pesaro and customers were invited to discover new business opportunities. This event showcased a return to technology, experimentation, and productivity - an example of the way innovation can transform businesses into being 4.0 ready, ranging from production to product sales. In the same time period as the Back to Business event, the Biesse Group also hosted the Academy weeks at the Headquarters. This three-week event is directed at branch employees and business partners around the world, with full days dedicated to exploring product innovations and new sales tools. This re-gular and ongoing training tracks technological product deve-lopments and innovations being made in the Group’s service offering, so that we are always able to provide added value to customers. Biesse participated in the Megan ExpoMueblera event held in Mexico City - a trade fair for getting close to customers in the region and showing them the group’s innovative ability born from its guiding philosophy: Thinkforward. It represents the ability to create innovation through integrated solutions, which are sophisticated but simple in their use, in order to have better and greater production, at a lower cost. Having a presence at Klimahouse in Bolzano, an event dedicated to housing where technology meets sustainability, was also im-portant. Customers and visitors were able to make contact with our specialists, and learn about solutions for building the housing of the future.
FEBRUARY 2018On 9 February 2018, Biesse S.p.A. announced its intention to
move forward with listing the subsidiary HSD S.p.A. on the Electronic Stock Market organized and managed by Borsa Italiana S.p.A., in the STAR segment. Biesse S.p.A., however, will continue to hold a controlling position in HSD S.p.A. The transaction should be completed within the first half of 2018, compatibly with market conditions.As a result of the listing process, the company HSD S.p.A. has taken steps to adopt, and expects implementation thereof following the successful listing on the Stock Exchange, the following:• Preparation of Governance regulations (for regulating rela-ted party transactions, market abuse, internal dealing, tran-sparency, etc.).• Finalising contracts with Biesse S.p.A. for business relation-ships and centralised services.• Finalising contracts with Directors and key management in relation to regulating base earnings, conditions of service, and long-term incentive schemes.With regards to the subsidiary HSD S.p.A., the Board of Direc-tors met in a session held on 9 February 2018 and proposed that the date for the Shareholders’ Meeting should be set for 22 March 2018, with the following agenda:1. Consider and approve admission of the Company’s ordi-nary shares to trading on the Electronic Stock Market orga-nised and managed by Borsa Italiana S.p.A. and, assuming conditions are met, in the corresponding Star Segment. This should take place through a private placement directed exclu-sively at qualified Italian investors and foreign institutional in-vestors outside the United States of America (with the excep-tion of Canada, Japan and Australia) in accordance with the Regulation S adopted pursuant to the United States of Ame-rica Securities Act of 1933. Applicable and consequential re-solutions.2. Changes to articles 4.1, 5.7, 6 and 16 of the company’s by-laws.3. Dematerialisation of shares.4. Splitting the Company’s shares by a ratio of 100 (one hun-dred) newly issued shares replacing each of the existing ordi-nary shares. Applicable and consequential resolutions.5. Statutory changes as necessary in preparation for admis-
sion to listing of the company’s ordinary shares, pursuant to current legislation and Corporate Governance Code recom-mendations. Adoption of new company by-laws, effective from when the Company’s shares first open for trade on the Electronic Stock Market organised and managed by Borsa Ita-liana S.p.A.6. Proposal to introduce shares with increased voting rights along with the related by law amendments, effective from the date when the Company’s shares open for trade on the Electronic Stock Market organised and managed by Borsa Ita-liana S.p.A. Applicable and consequential resolutions.7. Pre-emptive offer, in tranches, with option rights excluded pursuant to article 2441, paragraph 5 of the Italian Civil Code, by issuing a maximum number of 30,000,000 (thirty million) ordinary shares of the Company, with no par value, in one or more tranches, to service the Company’s public offer under the listing transaction, effective from when Borsa Italiana S.p.A. is-sues the provision for admitting the shares to trading on the Electronic Stock Market organized and managed by Borsa Ita-liana S.p.A.; applicable and consequential resolutions.8. Approval of the shareholders’ meeting regulations, effecti-ve from when the Company’s shares open for trade on the Electronic Stock Market organised and managed by Borsa Italiana S.p.A.9. Appointment of statutory auditors for 2018-2026 effective from when the Company’s shares first open for trade on the Electronic Stock Market organized and managed by Borsa Ita-liana S.p.A.; applicable and consequential resolutions.10. Adoption of a number of guidelines regarding me-dium-long term management incentive schemes, effective from when the Company’s shares first open for trade on the Electronic Stock Market organised and managed by Borsa Ita-liana S.p.A.. Applicable and consequential resolutions.
On 28 February 2018, the Board of Directors of HSD S.p.A. resolved the following:• Approval of the 2018-2020 three-year plan.• Approval of a new dividend policy, in line with that which is already in place for the parent Biesse S.p.A.Furthermore, the Board of Directors discussed the possibility of taking over from the Ultimate parent, Bi.Fin. S.r.l., the finan-cial lease contract that is currently in place for the Gradara Production Plant, where the company operates at present. Timelines for such a process are not yet certain; however, the transfer should take shape by the end of 2018 and would en-tail HSD making a financial commitment of approximately € 5 million. With this takeover, HSD would also enter into pos-session of a portion of adjacent land. This would allow HSD to plan an expansion of the production area, which is necessary to support growth in the years ahead. The cost of this new investment can be quantified as an additional € 8 million.On the same date, 28 February 2018, the shareholders’ mee-ting of HSD S.p.A. was also held. At this meeting the sharehol-ders resolved the following, effective from the time of listing:• Approval of the project to admit the Company’s shares to tra-de on the Electronic Stock Market organised and managed by Borsa Italiana S.p.A., and in the Star Segment (if applicable), while conferring on the Board of Directors the power to carry out the necessary actions.• Approval of a number of amendments to the current com-pany by-laws and adoption of new company by-laws compa-tible with the current legal provisions as applicable to listed companies.• Approval for the shares of Monte Titoli S.p.A. to be demate-
rialised, along with the consequent withdrawal and cancella-tion of securities representing the Company’s shares.• Approval to split the ordinary shares of the Company, with 100 new shares to be issued in replacement of each of the ordinary shares outstanding.• Approval to introduce into the by-laws the ability to issue shares with increased voting rights.• Increase in share capital without option rights, through the issue of a maximum number of 30,000,000 shares. • Approval of the shareholders’ meeting regulation.• Appointment of KPMG S.p.A. for the legally-required audit for 2018-2026.• Approval of guidelines regarding medium to long-term ma-nagement incentive schemes. On 27 and 28 February, Biesse Middle East opened its do-ors to customers and visitors from the entire Region, at the new Dubai Campus that was inaugurated in November 2017. Intermac took part in the thirteenth exhibition of Stona, the Indian trade fair that took place in Bangalore from 7 to 10 Fe-bruary. It was an opportunity to provide information to profes-sionals in the stone industry about the technological synergy between Intermac, Donatoni Macchine and Montresor. Biesse Deutschland reaffirmed its presence by attending the trade fair in Cologne, Germany, from 20 to 23 February. This inter-national rendezvous was dedicated to Housing technologies, and the goal was to demonstrate those of Biesse’s solutions that are specific to this industry. The Turkish branch atten-ded the CNR Expo and trade fair in Istanbul, focussing on machines dedicated to manufacturing doors. More than 500 customers have lived the Biesse experience with Biesse Iberi-ca’s stand at Fimma 2018 - Spain’s most important trade fair for the industry. The exhibition had 11 machines on display, which were directed towards all types of specialists in wood, from large factories with high production volumes, to compa-nies that need to produce thousands of products tailored to customer needs, or small businesses with craft-like features. Biesse France participated in Eurobois with an area of 1000 m2, where visitors could see the innovative technological so-lutions up close and live the Biesse experience. Star of the event was SOPHIA, the Internet of Things (IoT) platform cre-ated in collaboration with Accenture that during the fair won the Innovation Award.On 28 February, the Board of Directors of Biesse S.p.A. appro-ved the updating of its business plan for the three-year period 2018-2020. Based on the initiatives set out in the above busi-ness plan and on the assessment of the international macro-economic situation, the results expected by the Biesse Group in the period examined are as follows: • Higher Consolidated Net Revenue at a three-year structural CAGR of 9.5% (revenue above € 906 million expected in 2020) • Higher Added Value with a three-year CAGR of 10.8% (43.4% record impact in 2020). • Increase in operating margins: • EBITDA with a three-year CAGR of 12.7% (14% impact in 2020). • EBIT with a three-year CAGR of 14.7% (10.6% impact in 2020). • Positive free cash flow with a total of € 120 million in the three-year period 2018-2020 (free cash flow margin of 5% in 2020) net of planned investments (Capex total of € 142.6 mil-lion). In 2017, consolidated turnover was estimated to grow by 11.6% compared to the previous year, € 690 million, while EBI-TDA stood at 12.9% of consolidated revenue.

2017 ANNUAL REPORT
5756
The Board – chaired by Roberto and Giancarlo Selci – appro-ved actions to support the growth plan for 2018-2020, always with a focus on investments in innovation, service, and the marketing/sales area. “The plan starts from the excellent results for 2017,” - com-mented Group General Manager, Stefano Porcellini - “which closed with growth in consolidated revenue of 11.6%, EBITDA of 12.9%, and significant cash generation that led the Group to achieve a net financial position of over € 30 million.”
OUTLOOK The approved plan provides for an average growth of 9.5 % in the three-year period 2018-2020, more balanced if compared with a positive 2017, supported both by an efficient business strategy and by a particularly favorable trend in key markets driven by the increasing demand for technology due to the 4.0 industrial revolution.The growth projection for the next three years remains po-sitive, also supported by the backlog of € 215 million (+31%
compared to 2016) and by the confirmation of the positive trend of order intakes in the first months of the current year, encouraging signs of maintaining the upswing. In any case, the new business plan must be seen in continuity with the previous plans; Biesse wishes to maintain the current investment growth strategy with the aim of stabilising the re-sults achieved in recent years.
DIRECTORS’ REPORT OF BIESSE S.P.A.INCOME STATEMENT HIGHLIGHTS
Income Statement for the year ended 31 December 2017 highlighting non-recurring items
EURO 000’S 2017 % OF SALES 2016 % OF SALES CHANGE %
Revenue from sales and services 435,916 100.0% 391,688 100.0% 11.3%
Change in inventories, wip, semi-finished products and finished products 2,603 0.6% 6,107 1.6% (57.4)%
Other revenue 5,784 1.3% 4,613 1.2% 25.4%
Revenue 444,304 101.9% 402,408 102.7% 10.4%
Raw materials, consumables, supplies and goods (234,140) (53.7)% (211,858) (54.1)% 10.5%
Other operating costs (59,148) (13.6)% (52,471) (13.4)% 12.7%
Normalised added value 151,016 34.6% 138,079 35.3% 9.4%
Personnel expense (101,540) (23.3)% (94,294) (24.1)% 7.7%
Normalised gross operating profit 49,476 11.3% 43,786 11.2% 13.0%
Depreciation and amortisation (13,427) (3.1)% (12,321) (3.1)% 9.0%
Provisions (614) (0.1)% (761) (0.2)% (19.4)%
Normalised operating profit 35,435 8.1% 30,704 7.8% 15.4%
Impairment losses and non-recurring items (1,476) (0.3)% (3) (0.0)% -
Operating profit 33,959 7.8% 30,701 7.8% 10.6%
Net financial expense (213) (0.0)% (338) (0.1)% (36.8)%
Net exchange rate gains (losses) 137 0.0% (948) (0.2)% -
Pre-tax profit (loss) 50,223 11.5% 32,852 8.4% 52.9%
Income taxes (11,411) (2.6)% (10,910) (2.8)% 4.6%
Profit (Loss) for the year 38,812 8.9% 21,942 5.6% 76.9%
In 2017, Revenue from sales and services amounted to € 435,916 thousand, compared with € 391,688 thousand in 2016, up by 11.3% over the previous year. As already shown in the Group’s sales analysis, it should be noted the good performan-
ce of the Wood and Glass & Stone Divisions. Reference should be made to what has already been said on the Group’s sales analysis.

2017 ANNUAL REPORT
5958
The Revenue amounted to € 444,304 thousand, compared with € 402,408 thousand on 31 December 2016, up by 10.4 %
Added value as a percentage of the revenue slightly decre-ased compared to the previous year (from 34.3% in 2016 to 34% in 2017). This decrease is mainly related to the higher impact of consumption of raw materials and goods on the va-lue of production (from 52.6% to 52.7%); also, other operating costs recorded a higher impact (13.3% compared to 13.0%).
Personnel expense in 2017 was € 101,540 thousand, compa-red to € 94,294 thousand in 2016, with an increase of € 7,246 thousand in absolute terms, equal to 7.7%. The fixed compo-nent of wages and salaries increased by about € 5,950 thou-sand (+6.6%), especially as a result of the increase in the he-adcount in accordance with the recruiting policy adopted by the Group. The variable components related to performance bonuses and other bonuses (€ 9,332 thousand compared to € 8,193 thousand in 2016) and the capitalization of wages and salaries for staff employed in R&D activities (€ 9,030 thou-sand compared to € 8,819 thousand in 2016) rose compared to the figures recorded in the previous year owing respectively to the positive results achieved by the parent and to the conti-nuing innovation in products.
Gross operating profit was € 49,476 thousand, with a 13.0% improvement compared to the previous year in line with the increase in turnover.
Depreciation and amortisation increased by 9.0% (from € 12,321 thousand to € 13,427 thousand): depreciation totalled € 4,021 thousand (up by 8.6%), while amortisation amounted to € 9,407 thousand (up by 9.1%). This increase was mainly due to R&D projects that were capitalized also in previous years, for which during 2017 production and the consequent amortisation started.
Provisions stood at € 614 thousand, down by € 761 thousand compared to the previous year.
Non-recurring items amounted to € 1,476 thousand, which was an increase compared to the previous year and was due to research and development projects that were incomplete and fully depreciated.
The operating profit was € 33,959 thousand.
Net financial expenses decreased compared to the previous year (from € 338 thousand to € 213 thousand, 36.8%).Net exchange rate losses increased compared to the previous year (from € 948 thousand to € 137 thousand). Net financial expenses included impairment losses on finan-cial assets of € 3,999 thousand; this amount refers both to the
from the previous year; in order to better understand margins, costs as a percentage of the revenue are broken down below.
impairment loss the equity investment held in Biesse Hong Kong of approximately € 6,999 thousand and to reversal of impairment losses on equity investments in Bre.Ma S.r.l. (€ 3 million). Net financial expense also includes dividends received by the subsidiaries totalling € 20,349 thousand (€ 13,718 thousand in 2016) as detailed below:
• HSD S.p.A.: € 14,000 thousand. • Biesservice Scandinavia AB: € 72 thousand. • Biesse America: € 1,187 thousand.• Biesse Canada: € 391 thousand.• Biesse UK: € 1,247 thousand.• Biesse Deutschland: € 525 thousand.• Biesse France: € 1,700 thousand.• Biesse Asia: € 508 thousand.• Biesse Iberica: € 700 thousand.• Biesse Tecno System: € 19 thousand.
The pre-tax profit therefore was € 50,223 thousand, up com-pared to € 32,852 thousand in 2016.
The balance of income taxes was negative to the tune of € 11,411 thousand.
Current IRES taxes amounted to € 8,753 thousand, deriving for € 8,737 thousand from the calculation of the profit for the year and for € 17 thousand from the reclassification of taxes recognized directly in equity referring to the actuarial income of post-employment benefits. The IRAP current taxes amoun-ted to € 1,803 thousand. Deferred tax expenses of € 64 thou-sand refer mainly to the change in temporary IRES recoveries.
Consequently, profit for the year amounted to € 38,812 thou-sand.
EURO 000’S 2017 % 2016 %
Revenue 444,304 100.0% 402,408 100.0%
Raw materials and goods 234,140 52.7% 211,858 52.6%
Other operating costs 59,148 13.3% 52,471 13.0%
Service costs 53,462 12.0% 47,291 11.8%
Use of third party assets 3,340 0.8% 3,081 0.8%
Sundry operating expense 2,346 0.5% 2,099 0.5%
Added value 151,016 34.0% 138,079 34.3%
EURO 000’S31 DECEMBER
201731 DECEMBER
2016
Intangible assets 48,613 45,019
Property, plant and equipment 47,452 38,932
Financial assets 81,999 67,747
Non-current assets 178,064 151,698
Inventories 54,380 49,946
Trade receivables 121,342 122,059
Trade payables (146,922) (134,823)
Net operating working capital 28,800 37,183
Post-employment benefits (10,619) (11,197)
Provision for risk and charges (4,990) (4,433)
Other net payables (16,871) (28,147)
Net deferred tax assets 2,105 2,169
Other net liabilities (30,375) (41,608)
Net invested capital 176,489 147,273
Share capital 27,393 27,393
Profit for the previous year and other reserves 110,768 98,690
Profit (Loss) for the year 38,812 21,942
Equity 176,973 148,025
Bank loans and borrowings and loans and borrowings from other financial backers 72,103 33,725
Other financial assets (26,571) (13,313)
Cash and cash equivalents (46,016) (21,164)
Net financial position (1) (485) (752)
Total sources of funding 176,489 147,273
STATEMENT OF FINANCIAL POSITION HIGHLIGHTS
Net intangible assets increased compared to 31 december 2016 (+ € 4 million). This increase is due to higher investmen-ts totalling around € 14.5 million, mainly attributable to R&D capitalization of new products (of around € 10.3 million) and new ICT investments (of around € 4.2 million), net of relevant amortization for the year.Net property, plant and equipment rose by approximately € 8.5 million. This increase confirms a trend already observed in previous years, with the expansion of manufacturing facilities and consequent investments, aimed at improving the use of manufacturing space.Financial assets increased by approximately € 14.3 million. During 2017 the Parent moved forward with the acquisition of Movetro S.r.l., Montresor S.r.l. and BSoft S.r.l. for a total value of € 4.1 million (please refer to notes on the change in scope
of consolidation for more details) and with the increases in capital for the companies Biesse Gulf, Biesse Hong Kong and Biesse Turkey.Net working capital decreased as a whole by around € 8.4 million compared to 31 December 2016 due to the increase in trade payables (around € 0.7 million) as a result of the de-crease in sales at the end of the year and of the increase in inventories (around € 4.4 million) in light of the strong trend in orders. These changes were partially offset by the increase in trade payables (approximately € 12.1 million).

2017 ANNUAL REPORT
6160
NET FINANCIAL POSITION
OTHER INFORMATION
EURO 000’S31 DECEMBER
201731 DECEMBER
2016
Financial assets: 62,755 34,477
Current financial assets 16,739 13,313
Cash and cash equivalents 46,016 21,164
Short-term financial lease payables (199) (111)
Short-term bank loans and borrowings and loans and borrowings from other financial backers (44,318) (30,874)
Short-term net financial position 18,238 3,491
Medium/Long-term financial lease payables (1,060) (3)
Medium/Long-term bank loans and borrowings (16,693) (2,736)
Medium/Long-term net financial indebtedness (17,754) (2,739)
Total net financial position 485 752
At the end of December 2016, the Parent’s net financial posi-tion was € 0.5 million, down by € 0.3 million compared to the previous year.
Finally, it should be noted that the Parent does not own sha-res/stakes of ultimate parents nor did it own or trade them during 2016. There is therefore nothing to disclose for the purposes of Article 2428, paragraph 2, sections 3 and 4 of the Italian Civil Code.
For further details, reference should be made to what has al-ready been said about the Group’s net financial position.
Pursuant to Article 2497-bis paragraph 4 of the Italian Civil Code, note must be taken that Bi.Fin. S.r.l., based in Pesaro, via della Meccanica No. 16, manages and coordinates Biesse S.p.A. and, indirectly through the latter, the related Subsidiaries.
PROPOSAL TO THE ORDINARY SHAREHOLDERS’ MEETINGDear shareholders,
You are invited to approve the financial statements for the year ended 31 December 2017, with the present Directors’ Report, as they stand.The Board of Directors, taking into account the positive fi-nancial position and results for 2017, proposes to distribute dividends to Shareholders to be taken from the profit for the year at the rate of € 0.48 for each eligible share, totalling € 13,148,660.16, less the dividends on treasury shares held on the ex-dividend date of 8 May 2018. The portion of the divi-dend referring to these latter will be allocated to the Extraor-dinary Reserve.
Therefore, you are invited to resolve on the allocation of the profit for the year of € 38,811,913.31 as follows: • Allocation of € 13,148,660.16 to dividends.• Allocation of € 75,332.65 to the reserve for unrealised exchange gains.• Allocation of the residual profit of € 25,587,920.50 to the Ex-traordinary Reserve.The coupons will be paid in a lump sum starting from 10 May 2018 (with ex-dividend date as from 8 May 2018 and record date on 9 May 2018) by means of qualified financial interme-diaries.
Pesaro, 12/03/2018 The Chairman of the Board of Directors
Roberto Selci

2017 ANNUAL REPORT
6362
CONSOLIDATED
FINANCIAL STATEMENTS

2017 ANNUAL REPORT
6564
CONSOLIDATED INCOME STATEMENT1 EURO 000’S NOTE 2017 2016
Revenue 5 690,120 618,489
Total other revenue 6 4,669 3,548
Change in inventories of finished goods and work in progress 15,387 12,649
Raw materials, consumables and goods 7 (287,017) (258,979)
Personnel expense 8 (199,311) (176,551)
Depreciation, amortisation and impairment losses 9 (24,047) (19,529)
Other operating costs 10 (136,194) (124,564)
Operating profit 63,606 55,062
Financial income 11 9,932 9,533
Financial expense 11 (12,808) (12,210)
Pre-tax profit (loss) 60,730 52,385
Income taxes 24 (17,992) (22,921)
Profit (Loss) for the year 42,738 29,464
Attributable to:
Attributable to owners of the ultimate 42,558 29,384
Attributable to non-controlling interests 180 80
Earnings per share 12 1,55 1,07
Diluted (€/cents) 12 1,55 1,07
1 In accordance with Consob Resolution No. 15519 of 27 July 2006, the effects of related-party transactions and non-recurring transactions on the Income Statement are shown in the relevant statement in Annex 1 and in the Directors’ Report on Operations.
CONSOLIDATED STATEMENT OF COMPREHENSIVE INCOME EURO 000’S NOTE 2017 2016
Profit (Loss) for the year 42,738 29,464
Translation differences of foreign operations 21 (4,570) (922)
Net gain/loss on cash flow hedges 21 (0) (73)
Income taxes on other comprehensive income 21 0 20
Items that may be reclassified to profit or loss (4,570) (974)
Measurement of defined-benefit plans 21 (70) (316)
Income taxes on items that will not be reclassified to profit or loss 15 6
Items that will not be reclassified to profit or loss (55) (311)
Total comprehensive income for the year 38,113 28,179
Attributable to:
Owners of the ultimate 176 74
Non-controlling interests 37,937 28,105

2017 ANNUAL REPORT
6766
CONSOLIDATED STATEMENT OF FINANCIAL POSITION2
EURO 000’S NOTE31 DECEMBER
201731 DECEMBER
2016
ASSETS
Property, plant and equipment 13 90,515 81,939
Goodwill 14 22,660 19,316
Intangible assets 15 52,448 45,901
Deferred tax assets 24 13,121 12,987
Other financial assets and receivables (including derivatives) 16 2,648 2,296
Other assets 19 0 50
Total non-current assets 181,391 162,490
Inventories 17 143,210 130,785
Trade receivables 18 119,380 128,751
Other assets 19 24,428 17,312
Other financial assets and receivables (including derivatives) 16 519 461
Cash and cash equivalents 20 78,902 46,295
Total current assets 366,438 323,603
TOTAL ASSETS 547,830 486,093
EURO 000’S NOTE31 DECEMBER
201731 DECEMBER
2016
EQUITY AND LIABILITIES
Share capital 27,393 27,393
Reserves 117,892 102,934
Retained earnings (458) (278)
Profit (Loss) for the year 42,558 29,385
Equity attributable to the owners of the ultimate 21 187,385 159,433
Non-controlling interests 952 290
TOTAL EQUITY 188,337 159,723
Financial liabilities 22 19,765 7,539
Post-employment benefits 23 13,456 13,746
Deferred tax liabilities 24 2,620 2,976
Provisions for risks and charges 25 1,367 2,377
Other liabilities 27 307 137
Total non-current liabilities 37,516 26,775
Financial liabilities 22 29,285 35,189
Tax payables 24 3,606 8,982
Provisions for risks and charges 25 9,039 9,617
Trade payables 26 223,916 192,613
Other liabilities 27 56,132 53,191
Total Current liabilities 321,977 299,591
LIABILITIES 359,493 326,366
TOTAL EQUITY AND LIABILITIES 547,830 486,090
2 In accordance with Consob Resolution No. 15519 of 27 July 2006, the effects of related-party transactions and non-recurring transactions on the Statement of Finan-cial Position are shown in the relevant statement in Annex 1.
CONSOLIDATED STATEMENT OF CASH FLOWS
EURO 000’S 2017 2016
OPERATING ACTIVITIES
Profit for the year 42,738 29,464
Change for:
Income taxes 17,992 22,921
Depreciation and amortisation of tangible and intangible assets 19,848 17,858
Gains/losses from sales of property, plant and equipment (371) 0
Impairment losses on intangible assets 1,476 26
Net Financial expense 2,638 1,778
SUBTOTAL OPERATING ACTIVITIES 84,322 72,047
Change in trade receivable 10,627 (23,872)
Change in inventories (12,326) (15,424)
Change in trade payables 27,994 32,888
Other changes in other operating assets and liabilities (3,676) 3,972
NET CASH FLOWS FROM OPERATING ACTIVITIES 106,941 69,611
Income tax paid (22,422) (19,729)
Interest paid (1,372) (1,572)
NET CASH FLOWS FROM OPERATING ACTIVITIES 83,147 48,310
INVESTING ACTIVITIES
Acquisition of property, plant and equipment (21,681) (18,410)
Proceeds from sale of property, plant and equipment 2,776 182
Acquisition of inangible assets (14,105) (12,727)
Proceeds from sale of intangible assets (40) 116
Acquisitions of equity investments (1,640) (536)
Change in other financial assets 410 (1,180)
Interest received 275 456
NET CASH FLOWS USED IN INVESTING ACTIVITIES (34,004) (32,099)
FINANCING ACTIVITIES
Change in financial activites/liabilities (including derivatives) (18,193) (17,283)
Finance lease payments 1,104 (1,847)
Other changes 12,502 7,366
Dividends paid (9,858) (9,871)
NET CASH FLOWS USED IN FINANCING ACTIVITIES (14,445) (21,635)
NET INCREASE (DECREASE) IN CASH AND CASH EQUIVALENTS 34,697 (5,424)
OPENING CASH AND CASH EQUIVALENTS 46,295 51,553
Effect of exchange rate fluctuations on cash held (2,089) 166
CLOSING CASH AND CASH EQUIVALENTS 78,902 46,295

2017 ANNUAL REPORT
6968
CONSOLIDATED STATEMENT OF CHANGES IN EQUITY
EURO 000’S NOTE SHARE CAPITAL
HEDGING AND TRANSLATION
RESERVESEQUITY
RESERVESOTHER
RESERVESTREASURY
SHARESPROFIT
(LOSS) FOR THE YEAR
EQUITY ATTRIBUTABLE TO THE OWNERS OF THE
ULTIMATE
NON-CON-TROLLING
INTERESTSTOTAL
EQUITY
Opening balances at 01/01/2016 21 27,393 (1,214) 36,202 57,854 (96) 20,971 141,110 275 141,385
Other comprehensive income
(969) (310) (1,279) (7) (1,286)
Profit for the year 29,384 29,384 80 29,464
Total comprehensive income/expense for the year
(969) (310) 29,384 28,105 73 28,178
Dividends paid (9,858) (9,858) (13) (9,871)
Allocation of profit for the previous year 20,971 (20,971) -
Other changes 75 75 (45) 30
Closing balances at 31/12/2016 21 27,393 (2,183) 36,202 68,732 (96) 29,384 159,432 290 159,722
EURO 000’S NOTE SHARE CAPITAL
HEDGING AND TRANSLATION
RESERVESEQUITY
RESERVESOTHER
RESERVESTREASURY
SHARESPROFIT
(LOSS) FOR THE YEAR
EQUITY ATTRIBUTABLE TO THE OWNERS OF THE
ULTIMATE
NON-CON-TROLLING
INTERESTSTOTAL
EQUITY
Opening balances at 01/01/2017 21 27,393 (2,183) 36,202 68,732 (96) 29,384 159,432 290 159,722
Other comprehensive income
(4,632) (162) (4,793) 168 (4,625)
Profit for the year 42,558 42,558 180 42,738
Total comprehensive income/expense for the year
(4,632) (162) 42,558 37,765 348 38,113
Dividends paid (9,858) (9,858) (29) (9,887)
Allocation of profit for the previous year 29,384 (29,384) -
Other changes 47 47 342 389
Closing balances at 31/12/2017 21 27,393 (6,815) 36,202 88,143 (96) 42,558 187,385 952 188,337
(1) Please see the statement of comprehensive income for a detailed itemisation of the changes
69

2017 ANNUAL REPORT
717070
NOTES TO THE CONSOLIDATED FINANCIAL STATEMENTS1. GENERAL INFORMATION
The company preparing the financial statementsBiesse S.p.A. is an Italian company with registered office in Pe-saro. It is the parent of the Biesse Group and operates in the market for machinery and systems for processing wood, glass and stone. The company is listed on the STAR segment of the Milan Stock Exchange. The Consolidate Financial Statements as at and for the year eneded 31 December 2017 incorporate the individual financial statements of Biesse S.p.A. and subsidiaries which it controls directly or indirectly (hereinafter defined as the “Group”) and the amount of its equity investments, in proportion to the percen-tage held, in associates. The consolidated financial statements at 31 December 2017 were approved during the meeting of the Board of Directors held today (12 March 2018).
Basis of presentationThe presentation currency of the consolidated Financial Sta-tements is the Euro. Balances are shown in thousands of Euro, unless otherwise indicated. It should also be noted that some differences might be found in tables due to the roun-ding of amounts shown in thousands of Euro.These consolidated financial statements were approved du-ring the meeting of the Board of Directors on 12 March 2018.Consolidation scopeThe statement of financial position, income statement and statement of comprehensive income as at and for the year ended 31 December 2017 include the financial statements of subsidiaries in addition to those of the parent. The subsidia-ries over which the parent exercises control are listed below.
List of companies consolidated on a line-by-line basis
NAME AND REGISTERED OFFICE CURRENCYSHARE
CAPITALDIRECTLY
CONTROLLEDINDIRECTLY
CONTROLLEDOWNERSHIP
VEHICLE BIESSE GROUP
Parent
Biesse S.p.A. EUR 27,393,042
Via della Meccanica, 16 Loc. Chiusa di Ginestreto (PU) 3,340 0.8% 3,081 0.8%
151,016 34.0% 138,079 34.3%
Italian subsidiaries:
Bre.Ma. Brenna Macchine S.r.l. EUR 70,000 98% 98%
Via Manzoni, sncAlzate Brianza (CO)
Biesse Tecno System S.r.l. EUR 100,000 50% 50%
Via della Meccanica, 16Loc. Chiusa di Ginestreto (PU)
Viet Italia S.r.l. EUR 10,000 85% 100%
Via della Meccanica, 16Loc. Chiusa di Ginestreto (PU)
Axxembla S.r.l. EUR 10,000 100% 100%
Via della Meccanica, 16Loc. Chiusa di Ginestreto (PU)
Uniteam S.p.A. EUR 390,000 100% 100%
Via della Meccanica 12Thiene (VI)
BSoft S.r.l. EUR 10,000 100% 100%
Via Carlo Cattaneo, 24Portomaggiore (FE)
Montresor & Co. S.r.l. EUR 1,000,000 60% 60%
Via Francia, 13Villafranca (VR)
Movetro S.r.l. EUR 51,000 60% 60%
Via Marco Polo, 12Carmignano di Sant’Urbano (PD)

2017 ANNUAL REPORT
7372
NAME AND REGISTERED OFFICE CURRENCYSHARE
CAPITALDIRECTLY
CONTROLLEDINDIRECTLY
CONTROLLEDOWNERSHIP
VEHICLE BIESSE GROUP
Foreign subsidiaries:
Biesse America Inc. USD 11,500,000 100% 100%
4110 Meadow Oak Drive – Charlotte, North Carolina – USA
Biesse Canada Inc. CAD 180,000 100% 100%
18005 Rue Lapointe – Mirabel (Quebec) – Canada EUR 70,000 98% 98%
Biesse Group UK Ltd. GBP 655,019 100% 100%
Lamport Drive – Daventry Northamptonshire – Gran Bretagna
Biesse France Sarl EUR 1,244,000 100% 100%
4, Chemin de Moninsable – Brignais – Francia
Biesse Group Deutschland GmbH EUR 1,432,600 100% 100%
Gewerberstrasse, 6 – Elchingen (Ulm) – Germania
Biesse Schweiz GmbH
Grabenhofstrasse, 1 – Kriens – Svizzera CHF 100,000 100% Biesse G. 100%
100%
Biesse Austria GmbH
Am Messezentrum, 6 Salisburgo – Austria EUR 390,000 100% 100%
EUR 35,000 100%Biesse G.
Deutschland GmbH
100%
Biesservice Scandinavia AB SEK 200,000 60% 60%
Maskinvagen 1 Lindas – Svezia EUR 10,000 100% 100%
Biesse Iberica Woodworking Machinery s.l. EUR 699,646 100% 100%
C/De La Imaginaciò, 14 Poligon Ind. La Marina – Gavà Barcellona – Spagna
WMP- Woodworking Machinery Portugal, Unipessoal Lda EUR 5,000 100% Biesse Iberica 100%
Sintra Business Park, 1, São Pedro de Penaferrim, – Sintra – Portogallo W. M. s.l.
Biesse Group Australia Pty Ltd. AUD 15,046,547 100% 100%
3 Widemere Road Wetherill Park – Sydney – Australia
Biesse Group New Zealand Ltd. NZD 3,415,665 100% 100%
Unit B, 13 Vogler Drive Manukau – Auckland – New Zealand
Biesse Manufacturing Co. Pvt. Ltd. INR 1,224,518,391 100% 100%
Jakkasandra Village, Sondekoppa rd. Nelamanga Taluk – Bangalore –India
Biesse Asia Pte. Ltd. EUR 1,548,927 100% 100%
Zagro Global Hub 5 Woodlands Terr. – Singapore
Biesse Indonesia Pt.
Jl. Kh.Mas Mansyur 121 – Jakarta – Indonesia IDR 2,500,000,000 100% Biesse Asia Pte. Ltd. 100%
NAME AND REGISTERED OFFICE CURRENCYSHARE
CAPITALDIRECTLY
CONTROLLEDINDIRECTLY
CONTROLLEDOWNERSHIP
VEHICLE BIESSE GROUP
Biesse Malaysia SDN BHD 444,304 100,0% 402,408 100,0%
Dataran Sunway , Kota Damansara – Petaling Jaya, Selangor Darul Ehsan – Malaysia MYR 5,000,000 100% Biesse Asia Pte.
Ltd. 100%
Biesse Korea LLC
Geomdan Industrial Estate, Oryu-Dong, Seo-Gu – Incheon – Corea del Sud KRW 99,546,612 100% Biesse Asia Pte.
Ltd. 100%
Biesse (HK) Ltd. USD 11,500,000 100% 100%
Room 1530, 15/F, Langham Place, 8 Argyle Street, Mongkok, Kowloon – Hong Kong HKD 216,955,160 100% 100%
Dongguan Korex Machinery Co. Ltd
Dongguan City – Guangdong Province – Cina RMB 182,338,950,36 100% Biesse (HK) LTD 100%
Biesse Trading (Shanghai) Co. Ltd. RMB 45,370,000 100% Biesse (HK) 100%
Room 301, No.228, Jiang Chang No.3 Road, Zha Bei District,– Shanghai – Cina LTD
Intermac do Brasil Comercio de Maquinas e Equipamentos Ltda. GBP 655,019 100% 100%
Andar Pilotis Sala, 42 Sao Paulo – 2300 Brasil
EUR 1,244,000 100% 100%
BRL
12,964,254 100% 100% 100%
Biesse Turkey Makine Ticaret Ve Sanayi A.S.
Şerifali Mah. Bayraktar Cad. Nutuk Sokak No:4 Ümraniye,Istanbul –Turchia TRY
20,500,000 100% 100% 100%
OOO Biesse Group Russia RUB 10,000,000 100% 100%
Ul. Elektrozavodskaya, 27 Moscow, Russian Federation
Biesse Gulf FZE AED 6,400,000 100% 100%
Dubai, free Trade Zone
Biesse Taiwan TWD 500,000 100% Biesse Asia 100%
6F-5, No. 188, Sec. 5, Nanking E. Rd., Taipei City 105, Taiwan (ROC)
HSD S.p.A. EUR 1,141,490 100% 100%
Via della Meccanica, 16 Loc. Chiusa di Ginestreto (PU)
HSD Mechatronic (Shanghai) Co. Ltd. RMB 2,118,319 100% Hsd S.p.A. 100%
D2, 1st floor, 207 Taiguroad, Waigaoqiao Free Trade Zone – Shanghai – Cina
Hsd Usa Inc. USD 250,000 100% Hsd S.p.A. 100%
3764 SW 30th Avenue – Hollywood, Florida – USA
HSD Mechatronic Korea LLC KWN 101,270,000 100% HSD S.p.A. 100%
414, Tawontakra2, 76, Dongsan-ro, Danwon-gu, Ansan-si 15434, South Korea
HSD Deutschland GmbH EUR 25,000 100% Hsd S.p.A. 100%
Brükenstrasse,2 – Gingen – Germania

2017 ANNUAL REPORT
7574
Compared to the consolidated financial statements as at and for the year ended 31 December 2016, the scope of consoli-dation underwent the following changes: • Acquisition of the company BS SOFT S.r.l. on 10 April 2017. With the aim of strengthening its offer in the Systems wor-ld and being even more autonomous in the development of projects in support of Industry 4.0, Biesse S.p.A., through the newco. BT SOFT on 10 April 2017 acquired control of the company Avant S.r.l. Software & Engineering, specialised in the development of software for the integration and supervi-sion of working cells and lines. The Avant applications can au-tomatically manage all information of the production process, from cutting to edgebanding, drilling and, in recent years, also sorting, the backbone of every batch-one production. The ac-quisition price amounted to € 500 thousand. The difference between the acquisition price and the value of assets and lia-bilities acquired, amounting to € 494,210, pending the PPA, was provisionally allocated to goodwill in the wood division. • The liquidation of Intermac Guangzhou Co. Ltd was comple-ted in June 2017. • On 27 July 2017, a newco was set up called Montresor & Co. S.r.l. (with a 90% stake held by Biesse S.p.A. and 10 % by Donatoni Macchine S.r.l.) whose purpose is the acquisition of Montresor & C. S.r.l., which is based in the province of Verona and manufactures edge polishers machinery (glass and mar-ble). The acquisition was completed on 3 August 2017 with the payment of the first tranche of 65% of the agreed price (€ 4.8 million, net of payables due to employees, payments on account and/or guarantee deposits and the estimate of the inventories bought). In the agreements among the members of the newco (Montresor & Co. S.r.l.), the possibility is envisa-ged for the non-controlling stakeholder Donatoni to undertake a share capital increase for a further 30% to reach a 40% sta-ke. The difference between the acquisition price and the value of assets and liabilities acquired, amounting to € 2,414,071, pending the PPA, was provisionally allocated to goodwill in
the glass division. On 21 December 2017, 30% of Biesse S.p.A. shareholdings were transferred to Donatoni Macchine S.r.l. The liquidation of Montresor & C. S.r.l. took place at the same time.• On 27 July 2017, Biesse S.p.A. signed an agreement to acqui-re 60% of the shares of MOVETRO S.r.l., which operates in the production of flat-glass storage and movement systems and is based in the province of Padua. This transaction will enable the Glass & Stone Division to extend the offer of products to high-end customers and to integrate Systems projects. The contract envisages the payment of € 2.7 million (Biesse S.p.A. has already paid a deposit of € 540 thousand). The contract also envisages the granting of a put option in favour of the sellers and a call option in favour of the buyers on the remai-ning 40% stake. The put option cannot be exercised before 31 July 2022 and after 31 December 2025, while the call option cannot be exercised before 31 July 2025 and after 31 July 2028. The consideration for the two options will be calculated based on the multipliers of some financial statements figures of the company being acquired.
Furthermore, it should be noted that during 2016 the process was started to shorten the chain of control over the Chinese companies. This project was completed in 2017 and involved the companies Biesse Hong Kong Ltd and Centre Gain Ltd, both resident in Hong Kong. It implied the transfer of all the assets and liabilities from the parent to the subsidiary (the name of which was changed as part of this transaction to Biesse Hong Kong Ltd) and the subsequent liquidation of the parent. The liquidation and cancellation of the parent were completed in June 2017. The organizational chart shows the equity investments.
2. STATEMENT OF COMPLIANCE WITH INTERNATIONAL FINANCIAL REPORTING STANDARDS
Statement of compliance with international financial repor-ting standards and general standardsThe consolidated financial statements at 31 December 2017 have been prepared in accordance with the International Fi-nancial Reporting Standards (IFRS), issued by the Internatio-nal Accounting Standard Board (“IASB”) and endorsed by the European Union, as well as with the implementing provisions issued pursuant to article 9 of Italian Law Decree 38/2005 and the Consob regulations and provisions regarding finan-cial statements.The consolidated financial statements have been prepared on the historical cost basis, with the exception of derivative financial instruments, held-for-sale financial assets and fi-nancial instruments classified as available for sale, which are measured at fair value; the consolidated financial statements have been prepared also on a going concern basis.This disclosure was prepared in accordance with the provi-sions of Consob (Commissione Nazionale per le Società e la Borsa – the regulatory authority for the Italian securities’ market), with particular reference to resolutions No. 15519 and 15520 of 27 July 2006 and to communication No.
DEM6064293 of 28 July 2006. It should be noted that, with re-ference to said Consob Resolution No. 15519 of 27 July 2006 on the format of financial statements, specific additional in-come statement and statement of financial position were in-cluded, highlighting significant related party transactions, so as to improve the readability of the information. With reference to the statement of cash flows, transactions with related parties refer to trade receivables and payables, other receivables and payables, and the distribution of divi-dends. As far as the statement of comprehensive income is concerned, no transactions with related parties have been identified. In regards to the statement of changes in equity, transactions with related parties related to the distribution of dividends.
Financial statementsAll statements conform to the minimum content requiremen-ts set by the International Financial Reporting Standards and the applicable provisions laid down by national legislation and CONSOB. The statements adopted are considered fit for fairly presenting the Group’s result of operations, financial position
3. BASIS OF PREPARATION
Use of estimates and judgements The preparation of the financial statements and notes thereto pursuant to IFRS requires management to make estimates and assumptions that affect the reported amounts of assets and lia-bilities as well as disclosures relating to contingent assets and liabilities at the reporting date. The estimates and assumptions used are based on historical experience and other factors dee-med as material. Actual results may differ from these estimates. Estimates and assumptions are reviewed on an ongoing basis and the effect of any resulting changes is reflected in profit or loss in the reporting period in which the estimates are reviewed if the review affects only that reporting period, or also in sub-sequent reporting periods if the review affects both the current year and future years.Information on assumptions and uncertainties in estimates that have significant risk of causing material changes in the carrying amount of assets and liabilities during the year ended 31 De-cember 2017 are provided in the following notes:• Note 14 - Goodwill: primary assumptions for determining reco-verable amounts.• Note 15 - Intangible assets: primary assumptions for determi-ning the likelihood of recovering development costs.• Note 17 - Inventories: primary assumptions for determining the allowance for inventory write-downs.
• Note 18 - Receivables: primary assumptions for determining the allowance for impairment.• Note 23 - Employee benefits: primary actuarial assumptions • Note 24 - Recognition of deferred tax assets: availability of futu-re taxable income for offset against carried forward tax losses.• Note 25 - Recognition and measurement of provisions for risks and contingent liabilities: primary assumptions regarding the likelihood and measurement of an outflow of resources.Furthermore, different accounting standards and disclosure re-quirements for the Group to assess the fair value of financial and non-financial assets and liabilities. In assessing the fair va-lue of an asset or liability, the Group makes use of observable market data where possible. Fair value, in application of IFRS 13 guidance, is categorised in a number of hierarchical levels ba-sed on the inputs used in measurement techniques, as shown below:• Level 1: inputs used in the measurement are represented by the quoted prices in active market for assets or liabilities identi-cal to those being measured.• Level 2 – input data other than quoted prices included within level 1 that are observable in the market, either directly (i.e. as prices) or indirectly (i.e. derived from prices).• Level 3 – input data that are not based on observable market data.
and cash flows; in particular, we believe that the financial sta-tements reclassified by nature provide reliable and material information for the purposes of correctly representing the Group’s performance. The statements composing the Finan-cial Statements are:
Income Statement Costs are classified based on their nature, highlighting inte-rim results with respect to operating and pre-tax profit/(loss). Operating profit/(loss) is calculated as the difference betwe-en net revenue and operating costs (including non-monetary costs relating to depreciation, amortisation and impairment losses on current and non-current assets, net of any reversal of impairment losses) and including capital gains and losses on the sale of non-current assets.
Statement of Comprehensive IncomeThis statements includes the items that make up the profit or loss for the year. For each group of categories, it also shows income and costs that have been recognized directly in equity pursuant to IFRS.
Statement of Financial PositionThis statement shows a breakdown of current and non-cur-rent assets and liabilities.An asset/liability is considered to be current when it satisfies any of the following criteria:• It is expected to be realised/settled, or intended for sale or consumption, in the Group’s normal operating cycle.• It is held primarily for the purpose of being traded.• It is expected to be realised/settled within 12 months after the reporting date.In the absence of all three conditions, the assets/liabilities are classified as non current.
Statement of Changes in EquityThe statement shows the changes in the equity items related to:• The allocation of the parent’s and subsidiaries’ profit/(loss) for the year to non-controlling interests.• Amounts relating to transactions with shareholders (purcha-se and sale of treasury shares).• Any gains or losses net of any tax effects which, as required by IFRS, are either recognized directly in equity (gains or los-ses from trading of treasury shares, actuarial gains or losses arising from the measurement of defined benefit plans) or in a separate balancing item under equity (share-based payments for stock option plans).• Changes in valuation reserves relating to derivative instru-ments hedging future cash flows, net of any tax effects.
Statement of Cash FlowsThe Statement of Cash Flows is prepared using the indirect method, whereby net profit or loss is adjusted for the effects of transactions of a non monetary nature, any deferrals or ac-cruals of past or future operating cash receipts or payments, and items of income or expense associated with investing or financing cash flows. Income and expense relating to interest, dividends and inco-me taxes are classified as cash flows according to the type of underlying transaction that generated them.Cash and cash equivalents recognized in the statement of cash flows include the balance of this item at the reporting date. Foreign currency cash flows have been translated at the average exchange rate for the year.

2017 ANNUAL REPORT
7776
Main accounting policiesThe accounting policies adopted in the consolidated financial statements at 31 December 2017 have been consistently ap-plied also to the year included for comparison purposes. The main accounting policies used to prepare these consoli-dated financial statements are shown below.
A. BASIS OF CONSOLIDATIONGeneral standardsThe consolidated financial statements at 31 December 2017 include the individual financial statements of the parent, Bies-se S.p.A., and of the Italian and foreign companies which it controls. Control exists when the parent is exposed to variable returns deriving from its relationship with the entity, or has rights to such returns, while at the same time having the ability to in-fluence those returns by exercising its power over the entity itself. The individual financial statements of subsidiaries are inclu-ded in the consolidated financial statements from the time when the parent begins to exercise control until the date on which such control ceases.Where material differences arise, these financial statements are reclassified and adjusted as appropriate to conform to the accounting policies and measurement criteria adopted by the parent. 31 December is the reporting date for all the compa-nies in the Group.The carrying amount of equity investments in consolidated companies is eliminated to offset the corresponding share of equity of the investees by attributing their fair value at the date of acquisition to the relevant individual assets or liabili-ties. Any residual difference, if positive, is included in non-cur-rent assets and, secondarily, in the goodwill item; if negative, it is recognized in profit or loss.The results of subsidiaries acquired or divested during the year are included in the income statement from the effective
date of acquisition to the effective date of disposal.Non-controlling interests in the acquiree are initially measu-red at their proportionate interest in the fair value of recogni-zed assets, liabilities and contingent liabilities.Receivables and payables, income and expense, and gains and losses arising from intercompany group transactions are eliminated. Capital gains and losses on intra-group sales of capital goods are eliminated where they are deemed to be material. Any shares in equity and profit attributable to third parties are recognized under the corresponding item of the financial statements.
Translation of financial statements of foreign operationsThe financial statements of companies whose functional cur-rency is different from the presentation currency of the Con-solidated Financial Statements (Euro) and that do not operate in countries with hyperinflationary economies, are translated as follows:• Assets and liabilities, including goodwill and fair value adjust-ments arising on consolidation, are translated at the closing exchange rate.• Income and expense are translated at the average exchange rate for the year, considered a reasonable approximation of the exchange rate at the dates of the transactions.Exchange rate differences emerging from the conversion pro-cess are recorded in other comprehensive income and inclu-ded under equity in the hedging and translation reserve.On disposal of the economic entity that gave rise to exchange rate gains/losses, the cumulative amount of exchange diffe-rences recognized in a separate component of equity will be reclassified to profit or loss.
SHOWN BELOW ARE THE EXCHANGE RATES USED AS AT 31 DECEMBER 2017 AND 31 DECEMBER 2016 FOR TRANSLATION FINANCIAL STATEMENT UTENS IN FOREIGN CURRENCY(SOURCE WWW.BANCADITALIA.IT)
CURRENCY31 DECEMBER
201731 DECEMBER
2016
Average Closing Average Closing
US Dollar / Euro 1,1297 1,1993 1,1069 1,0541
Brazilian Real / Euro 3,6054 3,9729 3,8561 3,4305
Canadian Dollar / Euro 1,4647 1,5039 1,4659 1,4188
Pound Sterling / Euro 0,8767 0,8872 0,8195 0,8562
Swedish Krone / Euro 9,6351 9,8438 9,4689 9,5525
Australian Dollar / Euro 1,4732 1,5346 1,4883 1,4596
New Zealand Dollar / Euro 1,5897 1,6850 1,5886 1,5158
Indian Rupee / Euro 73,5324 76,6055 74,3717 71,5935
Chinese Renmimbi Yuan / Euro 7,6290 7,8044 7,3522 7,3202
Swiss Franc / Euro 1,1117 1,1702 1,0902 1,0739
Indonesian Rupiah / Euro 15,118,02 16,239,12 14,720,83 14,173,40
Hong Kong Dollar /Euro 8,8045 9,3720 8,5922 8,1751
Malaysian Ringgit /Euro 4,8527 4,8536 4,5835 4,7287
South Korean Won /Euro 1,276,74 1,279,61 1,284,18 1,269,36
Turkish Lira/Euro 4,1206 4,5464 3,34 3,71
Russian Rouble/euro 65,9383 69,3920 74,14 64,30
UAE Dirham/euro 4,1475 4,4044 4,06 3,87
Taiwan Dollar/euro 34,3635 35,6555 35,69 34,00
Business combinationsBusiness combinations are accounted for using the acqui-sition method. This method requires that the consideration transferred in a business combination be measured at fair value, calculated as the sum of the acquisition-date fair value of the assets transferred and the liabilities assumed and the equity instruments issued by the Group in exchange for con-trol of the acquiree. Transaction-related ancillary charges are recognized in profit or loss as incurred.At the acquisition date, the identifiable assets acquired and liabilities assumed are recognized at their acquisition-date fair value, except for the following items, which are measured instead in accordance with the relevant standards:• Deferred tax assets and liabilities.• Employee benefit assets and liabilities.• Liabilities or equity instruments relating to share-based pay-ments of the acquiree or Group-related share-based paymen-ts issued in exchange for contracts of the acquiree.• Assets held for sale and Discontinued Operations.In accordance with IFRS 3 (Business Combinations), goodwill is recognized at the date the Group obtains control of a bu-siness, and is measured as the excess of (a) over (b) in the following way:a) The aggregate of: • The consideration transferred (measured in accordance with IFRS 3, i.e. generally determined on the basis of the ac-quisition-date fair value). • The amount of any non-controlling interest in the acquiree measured in proportion to the non-controlling interest’s share in the recognized amounts of the acquiree’s identifiable net assets measured at their fair value.• In a business combination achieved in stages, the acquisi-tion-date fair value of the acquirer’s previously-held equity in-
terest in the acquiree.b) The fair value of the identifiable assets acquired, net of the identifiable liabilities and contingent liabilities assumed, at the date control is obtained.
IFRS 3 also requires:• Separate recognition in profit or loss of costs related to the business combination.• In a business combination achieved in stages, the acquirer shall re-measure its previously held equity investment in the acquiree at the acquisition-date fair value, and separately re-cognize the resulting gain or loss, if any, in profit or loss for the year.Any considerations subject to conditions set out in the bu-siness combination contract are measured at the acquisi-tion-date fair value and included in the consideration paid du-ring the business combination in order to determine goodwill. Any subsequent changes in this fair value, classifiable as me-asurement period adjustments, are included retrospectively in goodwill. Changes in fair value, classifiable as measure-ment period adjustments, are those deriving from additional information about facts and circumstances that existed at the acquisition date, obtained during the measurement pe-riod (which shall not exceed one year from the date of the business combination).If the initial recognition of a business combination is incom-plete by the end of the reporting period in which the business combination occurred, the Group recognizes the provisional amounts for the items for which the recognition is incomple-te. These provisional amounts are adjusted during the mea-surement period to reflect new information obtained about facts and circumstances that existed as of the acquisition

2017 ANNUAL REPORT
7978
date and, if known, would have affected the amounts of the assets and liabilities recognized as of that date.
B. TREATMENT OF FOREIGN CURRENCY TRANSACTIONSAll transactions are accounted for in the functional currency of the primary economic environment in which each com-pany of the Group operates. Transactions denominated in currencies other than the functional currency of the Group’s companies are initially translated into the functional currency using the exchange rate at the date of the transaction. Sub-sequently, monetary assets and liabilities (defined by IAS 21 as assets or liabilities held for collection or payment, where the amount is set in advance or able to be established) are translated using the closing rate; non-monetary assets and liabilities, which are valued at historical cost in foreign curren-cies, are translated using the exchange rate at the date of the transaction; and non-monetary assets and liabilities, which are measured at fair value in a foreign currency, are translated at the effective exchange rate at the date of determination of fair value.Exchange rate changes arising from translation are charged to the Income Statement for the year.To hedge its exposure to currency risk, the Group has ente-red into some forward and option contracts (see below the Group’s accounting policies relating to these derivative instru-ments).
C. REVENUE RECOGNITIONSales of goods are recognized when goods are shipped and the company has transferred to the buyer all significant risks and rewards of ownership of the goods. Generally, revenue from the sale of goods is recognized when the goods are deli-vered to the carrier under the terms of the relevant contracts, which is the time when the aforementioned risks and rewards are transferred. Revenue is not recognized when there is no certainty that the related consideration is recoverable. Reve-nue is measured at the fair value of the consideration recei-ved, taking account of discounts, rebates, premiums, returns and promotional expenses that substantially fall under com-mercial discounts; in addition, revenue does not include sales of raw materials and waste.Revenue arising from the rendering of services is recognized in profit or loss by reference to the stage of completion of the contract activity at the reporting date, determined either on the basis of work already carried out or, alternatively, in rela-tion to the percentage of completion of total services.Dividends are recognized through profit or loss as at the time when shareholders become entitled to receive payment, that is, usually, when the Shareholders resolve to distribute divi-dends.
D. GOVERNMENT GRANTSGovernment grants are recognized when there is reasonable assurance that the entity will comply with all the conditions attaching to the grant and that the grant will be received. Grants are recognized in profit or loss over the period in which the entity recognizes as expense the related costs which the grants are intended to compensate.The benefit of a government loan at a below-market rate of interest is treated as a government grant. This benefit is me-asured at the inception of the loan as the difference betwe-en the initial carrying amount of the loan (fair value plus any costs directly attributable to obtaining it) and the proceeds received, and it is subsequently recognized in profit or loss in
accordance with the regulations relating to the recognition of government grants.
E. EMPLOYEE BENEFITSShort-term employee benefitsShort-term employee benefits are recognized as costs as at the time when the service giving rise to those benefits is pro-vided. The Group recognizes a liability for the amount that is expected to be paid when there is a current, legal or implicit obligation to make such payments due to past events, and it is possible to make a reliable estimate of the obligation.
Post-employment benefitsProvisions for employee benefits on termination of employ-ment are represented by the post-employment benefits of the parent. Post-employment benefits are recognized in accor-dance with the arrangements of defined benefit plans under IAS 19.Post employments benefits are recognized at the expected future value of employee benefits as at the time when the employment relationship is terminated. This obligation is determined on the basis of actuarial assumptions. The mea-surement is carried out at least annually, with the support of an independent actuary, and using the projected unit credit method. The actuarial method considers financial variables such as, for instance, the discount rate or the long-term expected return on plan assets and the growth rates of sala-ries, and considers the probability that potential future events will occur using demographic variables such as, for instance, mortality rates and employee turnover or retirement rates. More precisely, the discount rates taken as reference are the rates or rate curves on high-quality corporate bonds (Euro Composite AA interest-rate curve) in the respective reference markets. The rates of future salary increases reflect the long-term expectation of the Group for the reference markets and inflation.Actuarial gains and losses that emerge following the reva-luation of liabilities for defined benefit plans are immediately recognized in other comprehensive income, while net interest and other costs relating to defined benefit plans are recogni-zed in profit or loss. Contributions payable under defined contribution plans are recognized as a cost in the income statement for the financial year in the period in which the employees provided the servi-ce. Contributions paid in advance are recognized as assets, to the extent that the advance payment will result in a reduction in future payments or refund.
Share-based payment agreementsThe fair value of the amount payable to employees in relation to share appreciation rights, adjusted for cash, is recognized as a cost with a corresponding increase in liabilities in the pe-riod during which the employees accrued the unconditional right to receive payment. The liability is valued at each repor-ting date, and at the settlement date, on the basis of the fair value for the share appreciation rights. Any changes in the fair value of the liability are recorded in the profit/(loss).
F. COSTS AND CHARGESThe costs relating to the purchase of goods and services are recognized when their amount can be measured reliably. Co-sts for the purchase of goods are recognized at the time of delivery, which, on the basis of the existing contracts, is the time when all related risks and rewards are transferred. Ser-
vice costs are recognized on an accrual basis as the services are rendered.
G. FINANCIAL INCOME AND EXEPENSEIInterest income and expense are recorded in profit or loss on an accrual basis, using the effective interest method. The effective interest method is a rate that accurately discounts expected future cash flows, based on the expected life of the financial instrument and the carrying amount of the financial asset or liability.
H. INCOME TAXESTaxes are recognized in profit or loss, with the exception of those relating to transactions recognized directly in equity, in which case the related effect is also recognized in equity. Income taxes include current taxes and deferred tax assets and liabilities. Current taxes are recognized on the basis of the estimated amount that the Group expects to have to pay, calculated by applying to the tax base of each company in the Group the ap-plicable tax rate at the reporting date in force in the respective countries. Income taxes relating to dividend distribution are recognized when a liability to pay the dividend is recognized. Deferred tax assets and liabilities are stated using the liability method, i.e. they are calculated on all temporary differences arising between the tax bases of assets and liabilities and their carrying amount for consolidated financial reporting purposes. Deferred tax assets and liabilities are not recognized on goo-dwill and on assets and liabilities that do not affect tax base.Deferred tax assets are recognized only if the taxes are con-sidered recoverable in the light of the expected tax income of future years. The recoverability is assessed at the end of each reporting period, and any amount no longer likely to be recovered is recognized in profit or loss.The tax rates used in recognizing deferred tax assets and lia-bilities are those expected to be in force in the relevant coun-try in the tax period in which the temporary differences are expected to be realised or settled.Deferred tax assets and liabilities are offset only for similar positions and if there is a legally enforceable right to offset them; otherwise, the related payables and receivables are re-cognized.As from 2008, the Biesse S.p.A. has participated in the Biesse Group national tax consolidation scheme, along with subsi-diaries BRE.MA. Brenna Macchine S.r.l., Viet Italia S.r.l., HSD S.p.A. and Axxembla S.r.l. In this context, pursuant to articles 117 and following of Presidential Decree 917/86, the IRES tax has been determined at an aggregated level by offsetting the positive and negative taxable amounts for the companies indicated. The financial relationships and the mutual respon-sibilities and obligations between the companies are defined in the regulation governing participation in the Biesse Group tax consolidation scheme. In the Biesse Group consolidated financial statements, taxes payable that are transferred to the parent are recorded under the item ‘Payables to the parent’ and receivables deriving from IRES losses that are transferred to the parent are recorded under the item ‘Receivables from the parent’.
I. EARNINGS PER SHAREBasic earnings per share are calculated by dividing profit or loss attributable to the owners of the parent by the weighted average number of ordinary shares outstanding during the year. Diluted earnings per share are calculated by dividing
profit or loss attributable to the owners of the parent by the weighted average number of shares outstanding, taking into account the effects of all potential dilutive ordinary shares.
J. PROPERTY, PLANT AND EQUIPMENTRecognition and measurementAn item of property, plant and equipment is measured at ac-quisition or production cost, including ancillary charges, less any subsequent accumulated depreciation and any impair-ment losses.Any financial charges incurred in the acquisition or con-struction of capitalised assets - where a certain period of time typically passes in making the asset ready for use or sale - are capitalised and amortised over the life of the class of assets to which they refer. All other financial charges are recognized in profit or loss during the financial year to which they refer.If an element of property, plant and equipment consists of various items with different useful lives, those items are ac-counted for separately (if material).Leasehold improvements are classified under property, plant and equipment in accordance with the nature of the cost in-curred. The depreciation period is the shorter of the asset’s residual useful life and the residual lease term.Assets under construction are recorded at cost under ‘assets under construction’ until their construction is complete. Once they become available for use, the cost is re classified to the corresponding item line and becomes subject to depreciation.The gain or loss generated by the sale of property, plant, ma-chinery, equipment and other assets is determined as the dif-ference between the net consideration received on disposal and the net residual value of the asset. It is recorded in profit or loss for the year in which the sale takes place.
Subsequent costsCosts incurred after assets are acquired as well as the co-sts associated with replacing various parts of assets in this category are added to the carryng amount of the item to whi-ch they refer and capitalised only when the inherent future economic benefit of the asset increases. In this case, the co-sts are also depreciated on the basis of the remaining useful life of the asset. All other costs are expensed in profit or loss when incurred. When the cost of replacing asset parts is capitalised, the re-sidual value of the parts being replaced is charged to the in-come statement.
Fixed assets under finance leasesProperty, plant and equipment owned under finance lease contracts for which the Group has substantially assumed all risks and rewards deriving from ownership, are recognized as fixed assets at the contract start date at either fair value, or at the present value of the contracted lease instalments, whi-chever is lower. They are amortised over the estimated useful life of the asset and adjusted to any impairment as determi-ned according to the methods indicated below. The amount payable to the lessor is shown under financial liabilities.
DepreciationDepreciation periods start from when the asset is available for use, and end at either the date when the asset is classi-fied as being held for sale in compliance with IFRS 5, or on the date on which the asset is removed from the accounting records, whichever is the later.Any changes to the depreciation plans only apply prospecti-

2017 ANNUAL REPORT
8180
vely. The amount to be depreciated represents the original carryng amount less the net expected disposal value of the asset at the end of its useful life when it is material and can be reasonably determined.Depreciation amounts are determined by using special finan-
cial rates that correspond to the estimated useful life of each individual non-current asset. The annual rates applied by the Group are as follows:
K. INTANGIBLE ASSETS AND GOODWILLGoodwillGoodwill is an intangible asset with an indefinite useful life that arises from business combinations accounted for using the acquisition method. It is recognized as the positive diffe-rence between the acquisition cost and the Group’s interest, having measured at fair value all other identifiable assets, lia-bilities and contingent liabilities attributable to both the Group and non-controlling interests (full fair value method) at the acquisition date.Goodwill is an intangible asset with an indefinite useful life, and is therefore not subject to amortisation. However, it re-mains subject to impairment test at least once a year, ge-nerally at the reporting date at the consolidated financial statements, in order to verify that there has been no loss in value, unless market or management indicators identified by the Group suggest that the impairment test is necessary also when preparing interim reports.Goodwill is measured by identifying the cash-generating units (CGUs) that benefit from the synergies of the acquisition. The cash flows are discounted at the cost of capital in relation to the specific risks of the unit. Impairment losses are recognized in profit or loss whenever the discounted cash flow calculation indicates that the reco-verable amount of the CGU is lower than its carrying amount. Losses identified in this way are not subject to any subse-quent reversal of impairment losses.
Development costs and other intangible assetsIntangible assets generated by developing Group products are recognized as assets only when the following requiremen-ts are met:• The cost attributable to the asset during its development can be reliably measured.• The product or process is feasible in both technical and commercial terms.• Future economic benefits are likely.• The Group has sufficient resources available and intends to complete the asset’s development, and to use or sell the asset. These intangible assets are amortized on a straight-line ba-sis over their useful lives. Whenever the above criteria are not met, development costs are expensed to the income state-ment for the year in which they are incurred.Capitalized development costs are recognized at cost less ac-cumulated amortization and/or any accumulated impairment losses. Research and development costs are recognized in profit or loss as incurred.Other intangible assets including trademarks, patents and licences, which have a finite useful life, are initially recogni-zed at acquisition cost, and are systematically amortised on a straight-line basis over their useful life or over a period not exceeding that established by the underlying licence or pur-chase contract.
CATEGORY RATE
Buildings 2% -3%
Plant and machinery 10% -20%
Equipment 12% - 25%
Furniture and fittings 12%
Office machinery 20%
Motor vehicles 25%
The annual rates applied by the Group are as follows:
CATEGORY RATE
Trademarks 10%
Patents 33,33%
Development costs 10% - 20%
Software and licences 20%
Subsequent costs are only capitalized when the expected fu-ture economic benefit that can be attributed to the correspon-ding asset increases. All other subsequent costs are recogni-zed in profit or loss as incurred.
L. INVESTMENT PROPERTYInvestment property, represented by property held to earn ren-tals and/or for capital appreciation, is measured at cost, in-cluding ancillary charges, less any accumulated depreciation and any impairment losses. Investment property is deprecia-ted on a straight-line basis over its useful life at a 3% rate for buildings and a 10% rate for plant.
M. ASSETS AND LIABILITIES CLASSIFIED AS HELD FOR SALENon-current assets and discontinued operations consisting of assets and liabilities are classified as held for sale when their carrying amount is expected to be recovered through a sale transaction rather than through their use in company operations. This condition is met only when the sale is highly probable, the assets are available for immediate sale in their present condition, and Management has committed to sell it within twelve months of the date of classification. Assets and liabilities held for sale are reported separately from the other assets and liabilities in the statement of financial position. The corresponding asset amounts of the previous financial year are not reclassified.Non-current assets and discontinued operations classified as held for sale are measured at the lower of the carrying amount and fair value less costs to sell.
N. FINANCIAL ASSETS AND LIABILITIESFinancial assets include available-for-sale equity investments in other companies, non-current receivables and loans, trade receivables, as well as other receivables and financial assets such as cash and cash equivalents. Financial liabilities inclu-de financial payables, payables to suppliers, other payables and financial liabilities. Derivative instruments are also included amongst financial assets and liabilities.Financial assets and liabilities are recognized when the entity becomes a party to the contractual provisions of the financial instrument. Their initial recognition takes into account direct-ly attributable transaction and issue costs. Subsequent me-asurement depends on the type of financial instrument and is subject to the categories of financial assets and liabilities listed below:
Loans and receivablesLoans and receivables are financial assets which are not con-sidered derivative instruments and which are not listed on
an active market. Furthermore, either fixed or determinable payments are expected to occur. These assets are initially re-cognized at fair value, and subsequently at amortised cost, using the effective interest rate method. The carrying amount of loans and receivables is reduced when there are objective indications that an impairment has occurred. The loss, recor-ded in profit or loss, is measured as the difference between the carrying amount of the asset, and the present value of future cash flows. If the original grounds for a subsequently reduce in following periods, then the carrying amount will be restored to a point where it matches the amount that it would have been by applying the amortised cost method.With reference to trade receivables, impairment losses are generally recognized through specific allowances for impair-ment.Assets are derecognized off as soon as the right to receive cash flows ceases to exist when all corresponding risks and rewards have been materially transferred, or whenever assets are considered to be totally irrecoverable after all necessary debt collection procedures have been completed. For trade receivables which had already been impaired, the correspon-ding allowance will also be reduced at the time when the re-ceivable is derecognized.
Held-to-maturity financial assetsFinancial assets that the Group intends and is able to hold until maturity are initially measured at fair value. After initial recognition, they are valued at amortised cost using the ef-fective interest rate method less any impairment losses. If in subsequent reporting periods the indications that led to the impairment loss no longer exist, the impairment loss is rever-sed to the amount that would have derived from application of the amortized cost.
Financial assets held for tradingFinancial assets classified as held for trading are measured at fair value at the end of each reporting period and any changes thereof are recognized in profit or loss.
Available-for-sale financial assetsFinancial assets available for sale are measured at fair value. Any subsequent changes in fair value are recorded in other comprehensive income, and are shown in a capital reserve. When a financial asset is derecognized, any accumulated pro-fit or loss is reclassified from other comprehensive income to profit or loss. Unlisted equity investments whose fair value cannot be reliably measured are measured at cost less any impairment losses. This category mainly includes non-con-trolling interests.

2017 ANNUAL REPORT
8382
Trade payablesTrade payables are initially recognized at nominal value where this is substantially representative of their fair value and then are measured at amortized cost using the effective interest rate method. Payables are written off when the specific con-tractual obligation is extinguished.
Financial liabilitiesFinancial liabilities are initially recognized at the fair value of the amount received, net of transaction costs directly attribu-table to the liability itself.After initial recognition, financial liabilities are valued at amor-tized cost using the effective interest rate method.
Derivative instruments and hedge accountingDerivative instruments are underwritten for hedging purpo-ses under the scope of the Biesse Group exchange rate risk management policy. As of 2016 since not all requirements to apply hedge accounting procedures have been met, said deri-vative instruments have been initially recognized at fair value. Any subsequent changes in fair value are recognized in profit or loss.
O. PROVISIONS FOR RISKS AND CHARGESProvisions for risks and charges are recognized where the-re are legal or implicit, contractual or otherwise obligations towards third parties, deriving from past events, which are likely to require an outlay of resources whose amount can be reliably estimated.Whenever it is estimated that these obligations will mature after twelve months and that the related effects will be mate-rial, they are discounted at a rate that reflects the time value of money and the risks specific to the recognized liability. In those cases, the increase in the provision due to the passage of time and any effect arising from a change in the discount rate are recognized as a finance expense. Any change in the estimate of provisions is reflected in profit or loss in the repor-ting period in which they arise.
Contingent liabilitiesThe Group is subject to legal and tax disputes falling under the jurisdiction of several states, in relation to which a liability is ascertained when it is considered probable that a financial outlay will occur, and the amount of the resulting losses can be reasonably estimated. If an outflow of financial resources becomes probable but its amount cannot be determined, this fact is reported in the notes to the consolidated financial sta-tements.In the ordinary course of business, management monitors the progress of disputes also thanks to the support of its own legal advisors as well as legal and tax experts.
Product WarrantiesThe Group allocates provisions to cover the estimated costs of providing warranty services on products sold. The provi-sions are determined based on a model that uses available hi-storical information regarding the nature, frequency and ave-rage cost of warranty actions, for the purpose of assigning estimated costs against the corresponding sales revenue.
P. INVENTORIESInventories are valued at the lower of cost (determined using the weighted average cost method) and the net realizable va-lue, namely, the estimated sale price less all estimated costs
related to finalizing the goods, the cost of sales, and distribu-tion costs that must be incurred in order to finalize the sale.The cost comprises the cost of direct materials and, where appropriate, direct labor, general production overheads and other costs incurred in bringing the inventories to their pre-sent location and condition. Obsolete and slow moving inventories are written down in re-lation to the possibility that they can be used or sold.The allowance for inventory write-downs reflects manage-ment’s estimate of impairment losses expected by the Group and is calculated on the basis of past experience as well as historical and expected trends in the market for second-hand equipment and spare parts, and any losses due to specific activities put into place by the Group.
Q. CASH AND CASH EQUIVALENTSCash and cash equivalents include cash on hand, bank depo-sits and cash equivalents that can be liquidated within three months. Items included in cash and cash equivalents are me-asured at fair value, and any corresponding changes are reco-gnized in profit or loss.
R. SHARE CAPITALShare capital represents subscribed and paid-up capital. Any incremental costs that are directly attributable to issuing or-dinary shares are recognized as a decrease in equity. Income tax relating to capital transaction costs are recognized in ac-cordance with IAS 12. As provided for under IAS 32, any treasury shares are recogni-zed as a reduction in equity. Any consideration received from a subsequent sale or reissue of such treasury shares would then recognized as an increase in equity. Gains and losses from trading, if any, are recognized under equity, net of tax effects.
S. IMPAIRMENT LOSSES ON PROPERTY, PLANT AND EQUI-PMENT AND INTANGIBLE ASSETSAt each reporting date, the Group assesses whether any even-ts or circumstances occurred that may impair the recoverable amount of property, plant and equipment and intangible as-sets with a finite useful life, and, if an indication of impairment exists, it estimates the recoverable amount of the assets in order to determine whether they are impaired.Goodwill and the other intangible assets with an indefinite useful life are tested for impairment annually and whenever there is any indication of impairment.The recoverability of the recognized amounts is tested by comparing the carrying amount with the higher of its fair value less costs to sell, where an active market exists, and the value in use. The value in use is determined based on the present value of the future cash flows expected to be derived from continuing use of an asset or group of assets and from its disposal at the end of its useful life.
The Directors determine the recoverable goodwill amount by calculating the value in use for the cash generating units to which goodwill is allocated. The Cash Generating Units have been defined as a group of similar assets that generate inde-pendent cash inflows through continuing use of the assets attributable to it. In line with the provisions of the relevant accounting standards, and consistent with the organisational and business structure, the Biesse Group has identified a sin-gle Cash Generating Unit (henceforth referred to as the ‘CGU’).Management makes several assumptions in calculating the
present value of future cash flows, including estimates of fu-ture increases in sales, gross operating profit, operating co-sts, the growth rate of terminal values, investments, changes in working capital and the weighted average cost of capital (discount rate), taking account of the specific risks of the as-set or of the cash generating units. The expected cash flows used in the model are calculated during the Group’s budge-ting and planning process. They represent the best estimate of the amounts and timing of future cash flows based on the Group’s long-term plan, which is updated annually, reviewed by the strategic management and approved by the parent’s Board of Directors while approving the Group’s long-term bu-siness plan. Expected sales growth is based on management forecasts. The operating costs estimated in the expected cash flows are also determined on the basis of management estimates for the next three years and are supported by the Group’s product development and production plans. The amounts of investments and working capital estimated in the expected cash flows are determined on the basis of se-veral factors, including the information necessary to support expected future growth rates and the product development plan. The carrying amount attributed to the cash-generating unit is determined with reference to the statement of finan-cial position by direct, where applicable, or indirect allocation criteria.
If the recoverable amount of a property plant and equipment or intangible asset (including goodwill) is less than the car-rying amount, then the carrying amount is reduced and it is adjusted to match the recoverable amount. This reduction reflects a loss in value, which will be recognized in profit or loss.
Where there are indications that a prior year impairment rela-ted to property plant and equipment or intangible assets other than goodwill may no longer exist, or may have been reduced, then the recoverable value of the asset is estimated anew. If the revised value is higher than the net book value, the book value will be increased to match the recoverable amount. The reinstated value cannot exceed the book value that would have been determined (net of write downs and depreciation) if no impairment had been recognized in previous years.The reinstated value of an asset other than goodwill is reco-gnized in profit or loss. Any impairment recorded for goodwill cannot be reinstated in subsequent years.
T. FINANCE AND OPERATING LEASE CONTRACTSLease contracts are classified as finance leases whenever the terms of the contract substantially transfer all the risks and rewards incidental to ownership to the lessee. Assets acqui-red through leases are initially recognized at the fair value of the leased asset, or the present value of the minimum pay-ments due for the lease, whichever is lower. After initial reco-gnition, the asset is measured in accordance with the relevant accounting standard applicable.Assets held under finance leases are recognized as property, plant and equipment, recognizing a financial liability of equal amount. The liability is gradually reduced on the basis of the principal repayment plan included in the contractual lease ter-ms, while the carrying amount of the asset is systematically depreciated on the basis of its useful life.All other leases are considered to be operating leases, and are not recognized in the statement of financial position. Lease payments under an operating lease are recognized in profit or
loss on a straight-line basis over the lease term.
U. ACCOUNTING STANDARDS, AMENDMENTS AND IFRS INTERPRETATIONS EFFECTIVE AS FROM 1 JANUARY 2017In January 2016, the IASB published an amendment to IAS 12. This amendment concerns the recognition of deferred tax assets referring in particular to debt instruments measured at fair value. Moreover, the amendment clarifies the requiremen-ts for recognition of deferred tax assets on unrealized losses. Amendments to IAS 12 are effective as from 1 January 2017, with earlier adoption permitted.In January 2016, the IASB also issued some amendments to IAS 7. The amendments require the party preparing the fi-nancial statements to provide, in the statement of cash flows, a reconciliation of the opening and closing amounts of the statement of financial position for each item for which the cash flows were or could be reclassified in the financial as-sets. Moreover, the amendment requires the obligation to di-sclose important issues for understanding corporate liquidity. Amendments apply beginning on 1 January 2017 but early adoption is allowed.The adoption of these amendments had no impact on the consolidated financial statements of the Group.
V. ACCOUNTING STANDARDS, AMENDMENTS AND INTER-PRETATIONS ENDORSED BY THE EUROPEAN UNION BUT NOT YET APPLICABLE AND NOT ADOPTED IN ADVANCE BY THE GROUP AS AT 31 DECEMBER 2017In May 2014, the IASB issued IFRS 15 – Revenue from Con-tracts with Customers, which will replace IAS 18 – Revenue and IAS 11 – Construction Contracts, as well as some IFRIC interpretations. This standard sets out the requirements for recognizing revenue pursuant to the new framework. Initially, it was expected to become effective as from 1 January 2016. In September 2015, the IASB decided to postpone this date to 1 January 2018, with early adoption permitted. In July 2014, the IASB published “IFRS 9 – Financial instru-ments”. The amendments introduced by the new standard include a logical approach for the classification and measu-rement of financial instruments driven by cash flow characte-ristics and the business model in which the asset is held, an expected loss impairment model for financial assets and a substantially reformed measurement approach to hedge accounting. The standard is applicable retrospectively, with limited exceptions, beginning on 1 January 2018, with early adoption permitted. The Group will adopt these new standards and amendments, based on the relevant expected effective date; the adoption of the new standards should have no significant impact.In January 2016, the IASB published a new accounting stan-dard: IFRS 16, which amends the provisions of IAS 17. The new standard aligns the accounting treatment of operating and finance leases for the lessee. IFRS 16 requires the lessee to recognize in the statement of financial position the assets and liabilities concerning the transaction both for operating and finance lease contracts. Lease contracts with a term equal or less than 12 months and those covering assets of very low value are excluded from the financial method. With IFRS 16, the issue of distinguishing between operating and finance lease does no longer exist, since each lease con-tract must be recognized with the financial method, with the exception of short-term contracts and those for assets with a non-significant value. The standard is applicable beginning on 1 January 2019, with early adoption permitted.

2017 ANNUAL REPORT
8584
The Group will adopt this new standard as from the planned application date and it is considered that the adoption will re-sult in an increase in the Net Financial Position (or indebted-ness) and an improvement in EBITDA.
W. ACCOUNTING STANDARDS, AMENDMENTS AND IN-TERPRETATIONS NOT YET ENDORSED BY THE EUROPEAN UNION (IFRS 9 AND IFRS 15)At the reporting date, there are no accounting standards that the Group can apply and for which the endorsement process necessary for their adoption by the competent bodies of the European Union is incomplete.
4. OPERATING SEGMENTS
IFRS 8 - Operating segments - defines an operating segment as an entity:• That engages in business activities generating both revenue and costs.• Whose operating results are reviewed regularly by the chief decision maker, and for which separate financial information is available.
The Group is currently organized into five operating divisions – Wood, Glass & Stone, Mechatronics, Tooling and Compo-nents – for management purposes. These divisions consti-tute the bases for the Group’s segment reporting. The main activities are as follows:• Wood – production, distribution, installation and after-sales
service of panel processing machines and systems.• Glass & Stone – production, distribution, installation and after-sales service of glass and stone processing machines,• Mechatronics – production and distribution of industrial me-chanical and electronic components.• Tooling – production and distribution of glass and stone processing tools for all the machines on the market.• Components – production and distribution of other compo-nents related to additional precision processing.
Third party customer revenue obtained by the Group are broken down as follows:
The following table shows an inventory breakdown by operating segment:
EURO 000’S WOODGLASS &
STONETOOLING MECHATRONICS COMPONENTS ELIMINATIONS GROUP TOTAL
2017
External revenue 489,840 108,113 12,740 71,370 8,057 0 690,120
Intrasegment revenue 699 128 509 27,133 13,161 (41,630) 0
Total revenue 490,539 108,241 13,250 98,503 21,218 (41,631) 690,120
Operating profit of segment 44,539 4,490 818 21,836 829 (0) 72,512
Unallocated ordinary costs (8,906)
Operating profit 63,606
Unallocated financial expense (2,876)
Pre-tax profit 60,730
Income taxes (17,992)
Profit for the year 42,738
2016
External revenue 448,977 96,040 11,512 61,961 (4) 2 618,488
Intrasegment revenue 1,629 0 494 24,661 19,142 (45,926) 0
Total revenue 450,606 96,040 12,006 86,622 19,138 (45,923) 618,488
Operating profit of segment 37,498 3,189 1,064 21,055 682 0 63,488
Unallocated ordinary costs (8,426)
Operating profit 55,062
Unallocated financial expense (2,677)
Pre-tax profit 52,385
Income taxes (22,921)
Profit for the year 29,464
The breakdown of sales by segment shows the significant increase in the Mechatronics Division (13.7% compared to 2016), from € 86,622 thousand to € 98,503 thousand; the divi-sion slightly increased its share of Group sales (from 14% to 14.3%). The performances of the other Divisions show in turn significant increases compared to 2016. To be more precise,
the Glass & Stone Division recorded the highest increase with +12.7%, whereas the Wood and Tooling Divisions reported +8.6% and +10.4%, respectively.
EURO 000’S WOODGLASS &
STONETOOLING
MECHATRO-NICS
COMPONENTS GROUP TOTAL
2017 104,049 11,309 2,593 22,244 3,016 143,210
2016 90,770 17,255 2,906 17,348 2,506 130,785

2017 ANNUAL REPORT
8786
ANALYSIS BY GEOGRAPHICAL SEGMENT TURNOVER
EURO 000’S 2017 % 2016 %
Western Europe 309,211 44.8% 280.720 45,4%
Asia - Pacific 153,158 22.2% 128.824 20,8%
Eastern Europe 92,296 13.4% 77.633 12,6%
North America 111,585 16.2% 109.497 17,7%
Rest of the World 23,871 3.5% 21.813 3,5%
Group Total 690,120 100.0% 618.487 100,0%
The geographical breakdown of sales compared to the pre-vious year showed a particularly positive performance for Eastearn Europe (+18.9%), accounting for a larger share of consolidated turnover (from 12.6% to 13.4%). The Asia-Paci-fic area also indicated a good performance (+18.9%), while
Western Europe recorded a significant 10.1% increase, con-firming its position as the Group’s baseline zone. Finally, the Americas show an increase of 1.9 percentage points.
For further details on the trend in revenue, reference should be made to the Directors’ Report.
As no operations were discontinued, the data above relates exclusively to continuing operations.
5. REVENUE
Revenue from the sale of goods and services provided by the Group for the period ended 31 December 2017 are detailed below:
EURO 000’S 2017 2016
Revenue from sales 644,459 580,092
Revenue from services 44,661 37,093
Other revenue 1,000 1,304
Revenues 690,120 618,489
6. OTHER REVENUE
An analysis of the Group’s other revenue for the period ended 31 December 2017 is as follows:
EURO 000’S 2017 2016
Lease and rental income 84 123
Commissions and royalties 487 412
Income-related grants 333 596
Gains on sales of assets 399 71
Other non-recurring income and prior year income 3,366 2,345
Total other revenue 4,669 3,548
Gains on sales of assets include the € 368 thousand gain realised by HSD USA from the sale of a building owned for € 709 thousand. The item ‘Other non-recurring income and prior year income’ includes proceeds of € 53 thousand arising from the recognition of research and development tax credits
received by the parent on the basis of Italian Legislative De-cree no.145 dated 23 December 2013.The item ‘Income-related grants’ contains grants receivable for training courses carried out internally.
7. CONSUMPTION OF RAW MATERIALS, CONSUMABLES, SUPPLIES AND GOODS
For the year ended 31 December 2017, this item amounted to € 287,017 thousand, which was an increase of 10.8% compa-red to the previous year (€ 258,979 thousand). This item inclu-des all procurement costs related to production, and primarily consists of € 278,465 thousand for the cost of purchasing raw materials, € 11,553 thousand for the cost of purchasing finished goods, and a positive change of € 6,576 thousand for
raw material inventories. Calculated as a percentage of reve-nue, this was a decrease of 0.3% compared to the previous year (from 41.9% to 41.6%). This effect is due to the current strategy for penetrating new markets and sectors, where the necessary economies of scale have not yet been achieved.
The increase in personnel expense is linked to an increase in the Group’s headcount, which rose from 3,799 units as at 31 December 2016 to 4,042 as at 31 December 2017. The expense figure also includes subcontract staff. The increase
in personnel concerned mainly production staff.The item ‘Capitalization and recovery of personnel expense’ mainly includes capitalized costs for the development of new products.
8. PERSONNEL EXPENSE
Personnel expense for 2017 amounted to € 199,311 thousand - an increase of € 22,760 thousand as compared to the previous year (which amounted to € 176,551 thousand). The item is detailed as follows:
EURO 000’S 2017 2016
Wages, salaries and social security contributions 184,250 164,267
Productivity bonus, other bonuses and related social security contributions 14,438 13,043
Accruals to pension plans 7,077 6,202
Other personnel expense 3,617 2,757
Capitalization and recovery of personnel expense (10,071) (9,718)
Personnel expense 199,311 176,551

2017 ANNUAL REPORT
8988
9. AMORTIZATION, DEPRECIATION
EURO 000’S 2017 2016
Depreciation 8,906 7,838
Amortisation 10,998 10,020
Impairment losses on non-current assets 1,492 26
Provision for risk and allowance for impairment 2,652 1,644
Amortizations, depreciation and impairment losses 24,047 19,529
EURO 000’S 2017 2016
Production services 32,191 29,086
Maintenance 4,687 4,129
Sales commissions and transport 23,601 21,282
Consultancy fees 5,648 5,823
Utilities 5,845 5,363
Exhibitions and advertising 10,701 11,900
Insurance 1,912 2,131
Directors, statutory auditors and consultants' remuneration 2,831 2,514
Travel 19,621 16,370
Other 11,162 9,563
Use of third party assets 10,745 8,814
Other operating costs 7,249 7,590
Other operating costs 136,194 124,564
This item went from € 11,691 thousand as at 31 December 2016 to € 24,047 thousand as at 31 December 2017 - an in-crease of € 12,356 thousand as compared to the previous year.The item ‘Impairment/losses on non current’ as at 31 Decem-ber 2017 refers solely to the depreciation of development projects which were abandoned the years.
Concerning the item ‘Provisions for risk and allowance for im-pairment,’ please see note 25 for provisions for risks, and note 18 for allowance for impairment.
Other operating expense increased by € 11,630 thousand compared to 2016 (+ 9.3%). This increase is due both to va-riable cost components (production services up by € 3,105 thousand, sales commissions and transport up by € 2,319
thousand, travel expenses up by € 3,251 thousand) and to fixed components (maintenance up by € 558 thousand). Co-sts for trade fairs and advertising fell from € 11,900 thousand to € 10,701 thousand.
10. OTHER OPERATING COSTS
The item Other operating expense of the Group as at 31 December 2017 is detailed below:
EURO 000’S 2017 2016
Income from financial receivables (9) 268
Bank interest 76 38
Interest from customers 26 50
Interest from others 220 99
Financial discounts received 37 62
Other financial income 0 19
Exchange rate gains 9,582 8,997
Total financial income 9,932 9,533
EURO 000’S 2017 2016
Bank, mortgage and financing interest 1.327 1.404
Finance lease interest 2 12
Interest expense to others 51 179
Bills discounted 768 535
Impairment losses on current financial assets 43 2
Other financial expense 18 (63)
Exchange rate losses 10,599 10,140
Financial expense 12,808 12,210
11. FINANCIAL INCOME AND EXPENSE
The item Financial income is detailed below:
The item Finance expense is detailed below:
SERVICES SERVICE SUPPLIER BENEFICIARY FEES (2017)
Audit KPMG S.p.A. Biesse S.p.A. 245
KPMG Network Subsidiaries 472
Other services KPMG Network Biesse S.p.A. 370
KPMG S.p.A. Biesse S.p.A. 59
KPMG S.p.A. Subsidiaries 11
Total 1,158
Remuneration paid to Directors, Statutory Auditors and In-dependent Auditors is included in the item Other operating expense. As required by article 149-duodecies of the Consob
Issuers’ Regulations, a list of the services provided by the In-dependent Auditors and their network is shown below:
Exchange rate gains and losses include both realized and un-realized exchange rate differences, deriving from either Euro translation of ordinary operations or from closing exchange rate adjustments for payables and receivables shown in fo-reign currencies.
For the year ended 31 December 2017, the Group had recor-ded net exchange rates losses of € 1,017 thousand, of whi-ch € 587 thousand were realized exchange losses and € 430 thousand from unrealized exchange losses.

2017 ANNUAL REPORT
9190
12. BASIC AND DILUTED EARNINGS PER SHARE
13. PROPERTY, PLANT AND EQUIPMENT
The following table shows the calculation of basic net earnin-gs per share (Basic EPS) and diluted net earnings per share
(Diluted EPS) as shown in the consolidated income state-ment schedule:
As there were no dilutive effects, the same calculation is also applicable to diluted earnings per share. Basic earnings per share for 2017 totalled 1.55 Euro/cent and were calculated by dividing the profit attributable to the ow-
ners of the parent, amounting to € 42,558 thousand, by the weighted average number of ordinary shares outstanding du-ring the year.
EURO 000’S 2017 2016
Profit (Loss) for the year 42,558 29,384
Weighted average number of shares used to calculate basic and diluted earnings per share 27,393 27,393
Base and diluted profit for the year (in Euro) 1,55 1,07
EURO 000’S 2017 2016
Weighted average number of outstanding shares – for the calculation of basic earnings 27,383 27,383
Effect of treasury shares (10) (10)
Weighted average number of outstanding shares – for the calculation of basic earnings 27,373 27,373
Dilutive effects 0 0
Weighted average number of outstanding shares – for the calculation of diluted earnings 27,373 27,373
STATEMENT OF FINANCIAL POSITION
EURO 000’S HISTORICAL COST
Land and buildings
Plant and machinery Equipment Other assets Assets under
construction Total
Amount at 31/12/2015 72,364 55,979 18,685 28,613 3,129 178,769
Increase 4,256 3,573 2,182 2,102 4,214 16,327
Decrease (456) (768) (33) (2,305) - (3,562)
Exchange rates, reclassifications, other movements 3,692 1,386 546 (975) 775 5,426
Amount at 31/12/2016 79,856 60,170 21,380 27,436 8,118 196,959
Increase 5,162 9,505 2,457 4,361 437 21,921
Decrease (640) (402) (76) (588) (2,239) (3,946)
Exchange rates, reclassifications, other movements (5,174) (5,580) (178) 1,078 1,329 (8,526)
Amount at 31/12/2017 79,204 63,692 23,583 32,286 7,644 206,409
EURO 000’S ACCUMULATED DEPRECIATION
Land and buildings
Plant and machinery Equipment Other assets Assets under
construction Total
Amount at 31/12/2015 24,042 44,985 15,654 24,226 - 108,908
Depreciation of the year 2,073 2,739 1,418 1,608 - 7,838
(Decrease) (18) (719) (83) (2,160) - (2,980)
Exchange rates, reclassifications, other movements 3,692 1,386 546 (975) 775 5,426
Amount at 31/12/2016 26,029 49,069 15,866 24,056 - 115,020
Depreciation of the year 2,153 2,953 1,712 2,088 - 8,906
(Decrease) (203) (303) (71) (537) - (1,114)
Exchange rates, reclassifications, other movements (3,117) (5,147) 1,988 (641) - (6,918)
Amount at 31/12/2017 24,861 46,572 19,495 24,966 - 115,893
EURO 000’S CARRYING AMOUNT
Land and buildings
Plant and machinery Equipment Other assets Assets under
construction Total
Amount at 31/12/2016 53,827 11,101 5,514 3,380 8,118 81,939
Amount at 31/12/2017 54,343 17,120 4,088 7,320 7,644 90,515
During 2017, the Group made investments in plant and ma-chinery of € 9,505 thousand. These increases are due to the normal replacement of work tools and the purchase of machi-nery and equipment.Investments in buildings mainly consist of the relocation of the subsidiary HSD USA, which involved the purchase of a new property for € 1,209 thousand and the sale of the old
company-owned building for a price of € 709 thousand.Depreciation for 2017 amounted to € 8,906 thousand.Land and buildings owned by the Group are not subject to mortgages.
14. GOODWILL
Goodwill is allocated to the cash-generating units (CGUs) identified on the basis of the Group’s operating segments. Management, in line with the provisions of IFRS 8, identified the following operating segments:
• Wood – production, distribution, installation and after-sales service of panel processing machines and systems.• Glass & Stone – production, distribution, installation and after-sales service of glass and stone processing machines.• Mechatronics – production and distribution of industrial me-chanical and electronic components.
• Tooling – production and distribution of glass and stone processing tools for all the machines on the market.• Components – production and distribution of other compo-nents related to additional precision processing.

2017 ANNUAL REPORT
9392
The following table shows the allocation of goodwill by operating segment:
EURO 000’S 2017 2016
Wood 8,455 8,117
Glass & Stone 4,666 1,660
Mechatronics 5,599 5,599
Tooling 3,940 3,940
Total 22,660 19,316
EURO 000’S 2017 2016
WACC 7.3 % 6.7%
CAGR ricavi prospettici 9.5 % 10.7%
Growth rate terminal value 1.5 % 1.5%
As required by accounting standards, the Directors determine the recoverable goodwill amount by calculating the value in use at least once a year. By its nature, this method requires the Directors to materially assess the performance of opera-ting cash flows during the period being used for the calcula-tion, as well as assessing the discount rate and growth rate for said cash flows.
Estimates of operating cash flows for future financial years were made on the basis of the business plan for the 2018-2020 period (hereinafter referred to as the ‘Plan’) as approved by the Board of Directors on 28 February 2018, and based on
the estimates of long-term growth in revenue and associated profits.The recoverable value of the Cash Generating Unit was veri-fied by determining its value in use, taken as the present value of future cash flows generated by the CGU, and calculated in accordance with the Discounted cash flow method.
Assumptions underlying Discounted cash flow
The primary assumptions used by the Group to estimate future cash flows for the purposes of the impairment test are as follows:
In greater detail, the following factors were considered to de-termine the discount rate:• With reference to the yield on risk-free securities, reference was made to the yield curve of 10-year Italian Government bonds (based on a 24-month measurement period).• The systematic risk coefficient (β) considered was that of Biesse (compared to that of comparable businesses in the machinery sector – Eurozone).• As for the specific risk premium (MRP), it was assumed to be 5.5%.• Finally, the rate of the gross cost of debt was assumed to be 2%, determined on the basis of the average cost of the Group’s debt and takes into account a Biesse spread applied to the Risk-free Rate.
Assumptions underlying cash flow estimatesOperating cash flows used to test for impairment in 2017 were based on the business plan for the three-year period 2018-2020, as approved by the Biesse S.p.A. Board of Directors on 28 February 2018. For the remaining periods, cash flows have been extrapolated based on the industry’s medium-long term growth rate of 1.5%. The expected future cash flows refer to the CGU in its current condition and exclude the estimates of future cash flows that may arise from future restructuring plans or other structural changes.
The primary assumptions underlying the determination of future cash flows are as follows:
Impairment test results
EURO 000’S 2017 2016
Average impact of COGS revenue 51.3 % 51.4 %
Average impact of personelexpense on revenue 21.6 % 24.0 %
Average impact of opex on revenue 13.1 % 12.0 %
EURO 000’S (BIESSE GROUP - ALL DIVISIONS) 2017
Carrying Amount 223,297
Recoverable amount 1,047,629
Impairment losses -
EURO 000’S (WOOD DIVISION) 2017
Carrying Amount 112,335
Recoverable amount 700,557
Impairment losses -
EURO 000’S (GLASS DIVISION) 2017
Carrying Amount 25,785
Recoverable amount 31,833
Impairment losses -
EURO 000’S (MECATRONIC DIVISION) 2017
Carrying Amount 29,684
Recoverable amount 190,987
Impairment losses -
EURO 000’S (TOOLING DIVISION) 2017
Carrying Amount 2,682
Recoverable amount 2,874
Impairment losses -
EURO 000’S (COMPONENT DIVISION) 2017
Carrying Amount 9,086
Recoverable amount 13,853
Impairment losses -

2017 ANNUAL REPORT
9594
Breakeven pointTo eliminate the excess at a consolidated level between value in use and carryng amount in regards to the impairment test carried out for the year ended 31 December 2017, the cost of capital (WACC) should increase by 18,200 basis points.
Furthermore, growth in ‘as is’ cash flows as evidenced in the terminal value should be negative and lower than 32,000 ba-sis points, and EBITDA should be less than the ‘as is’ plan of over € 100 million.
Sensitivity analysisA sensitivity analysis of the CGU results in question was also carried out. In every case, the value in use remained higher than the book value, even when assuming deterioration in key parameters such as:
• Half a percentage point increase in the discount rate.• Half a percentage point reduction in the growth rate.• Halving the CAGR on sales revenue.
The sensitivity analysis was carried out by examining the effects of these changes, considering them both separately and together.Finally, it should be noted that the estimates and budget figu-res to which the aforementioned variables were applied are calculated by the Group’s management on the basis of past experience and expectations about the trend in the markets in which the Group operates. Therefore, the management
makes judgements and estimates in calculating the recove-rable amount of the cash-generating unit. The Group cannot guarantee that goodwill will not become impaired in future periods. Indeed, various factors relating also to the evolution of the challenging market conditions could result in adjust-ments to goodwill. The Group continues to monitor the circu-mstances and events that could require further impairment testing.
For individual business units, please see the following table:
The following shows the recoverable values obtained after modifying the parameters indicated above:
WOOD GLASS MECATRONICS COMPONENT TOOLING
WACC + 26,200 b,p, + 600 b,p, + 23,700 b,p, + 200 b,p, + 2,700 b,p,
Growth rate terminal value -50,500 b,p, -100 b,p, -36,500 b,p, -100 b,p, -300 b,p,
EBITDA - € 72 mln - € 0,8 mln - € 19,5 mln - € 1 mln - € 0,5 mln
WOOD GLASS/STONE MECATRONICS COMPONENT TOOLING
Wacc +0,5% CGU (VC) 112,335 25,785 29,684 2,682 9,086
CGU (VR) 641,348 25,789 174,640 3,549 12,545
Growth rate -0,5% CGU (VC) 112,335 25,785 29,684 2,682 9,086
CGU (VR) 648,731 26,683 176,136 3,544 12,676
CAGR -50% CGU (VC) 112,335 25,785 29,684 2,682 9,086
CGU (VR) 263,221 33,012 116,185 3,596 9,294
15. INTANGIBLE ASSETS
EURO 000’S ACCUMULATED AMORTISATION
Development costs
Patents, trademarks and other intangible
assets
Asset under development
and payments on account
Total
Amount at 31/12/2015 38,795 17,231 - 56,026
Depreciation of the year 7,330 2,690 - 10,020
(Decrease) (132) (85) - (217)
Exchange rates, reclassifications, other movements (48) (69) - (117)
Amount at 31/12/2016 45,945 19,767 - 65,712
Depreciation of the year 7,826 3,172 - 10,998
(Decrease) - (83) - (83)
Exchange rates, reclassifications, other movements (126) (335) - (462)
Amount at 31/12/2017 53,644 22,520 - 76,165
EURO 000’S HISTORICAL COST
Development costs
Patents, trademarks and other intangible
assets
Asset under development
and payments on account
Total
Amount at 31/12/2015 55,603 32,290 11,086 98,979
Increase 130 3,834 10,291 14,255
Decrease (132) (91) (105) (328)
Exchange rates, reclassifications, other movements 7,649 (794) (6,434) 422
Amount at 31/12/2016 63,250 35,239 14,839 113,328
Increase 9 5,659 10,909 16,577
Decrease - (9) (31) (39)
Exchange rates, reclassifications, other movements 8,220 2,359 (8,727) 1,852
Amount at 31/12/2017 71,479 43,248 16,990 131,717
EURO 000’S IMPAIRMENT LOSSES
Development costs
Patents, trademarks and other intangible
assets
Asset under development
and payments on account
Total
Amount at 31/12/2016 - 1,715 - 1,715
Exchange rate gains(losses), reclassifications and other changes - (86) 1,476 1,390
Amount at 31/12/2017 - 1,629 1,476 3,105
EURO 000’S CARRYING AMOUT
Development costs
Patents, trademarks and other intangible
assets
Asset under development
and payments on account
Total
Amount at 31/12/2016 17,305 13,757 14,839 45,901
Amount at 31/12/2017 17,835 19,099 15,514 52,448

2017 ANNUAL REPORT
9796
The intangible assets shown above have a finite useful life and are amortized accordingly.Patents, trademarks and other rights are amortized in rela-tion to their useful life, which is estimated to be five years on average.As at 31 December 2017, the consolidated financial state-ments include assets that represent new product develop-ment costs of € 32 million, of which € 14.2 million appears under assets under development and payments on account. Capitalizing development costs involves the Directors pre-paring estimates, since the recoverability of those costs de-
pends on cash flows from the sale of products marketed by the Biesse Group. These estimates are characterised by both a complexity of assumptions underlying the revenue and future margin projections, and by strategic industrial choices made by the Directors.As at 31 December 2017, no previously capitalized develop-ment costs were impaired. Intangible assets are unencum-bered.
16. OTHER FINANCIAL ASSETS
17. INVENTORIES
Other current and non-current financial assets are detailed as follows:
EURO 000’S 2017 2016
Non-controlling equity investments in other businesses and consortia - 50
Other receivables / Guarantee deposits - non-current portion 2,648 2,296
Other financial assets 2,648 2,346
EURO 000’S31 DECEMBER
201731 DECEMBER
2016
Raw materials, consumables and supplies 46,731 40,999
Work in progress and semi-finished products 18,530 17,762
Work in progress 0 746
Finished goods 65,451 56,672
Spare parts 12,498 14,607
Inventories 143,210 130,785
Inventories equal to € 143,210 thousand are net of the al-lowances for inventory write-downs, amounting to € 2,269 thousand for raw materials (+€ 213 thousand compared to 2016), € 2,424 thousand for spare parts (+€ 395 thousand compared to 2016) and € 1,838 thousand for finished goods (+€ 591 thousand compared to 2016). Allowance for inventory write-downs of raw materials as a percentage of the historical cost of the related inventories is equal to 4.6% while that for finished goods is 2.7 %. The Group’s inventories increased compared to the previous year by € 12,425 thousand. This increase is due to the need to facilitate the scheduling of the deliveries planned in the
first quarter of 2018 in light of the positive trend in orders. In greater detail, raw material inventories increased by € 5,732 thousand and finished goods inventories increased by € 8,779 thousand. On the other hand, the spare parts inventories de-creased by € 2,109 thousand. The allowance for inventory write-downs reflects manage-ment’s estimate of impairment losses expected by the Group and is calculated on the basis of past experience as well as historical and expected trends in the market for second-hand equipment and spare parts also due to specific actions put into place by the Group.
18. TRADE RECEIVABLES
The Group’s trade receivables as at 31 December 2017 and 31 December 2016 are detailed below:
EURO 000’S 2017 2016
Trade receivables due from third parties 124,425 133,050
Trade receivables due from related parties 190 53
Trade receivables due from the ultimate 4 (0)
Allowance for impairment (5,238) (4,353)
Trade receivables 119,380 128,751
EURO 000’S 2017 2016
Opening balance 4,485 5,495
Accrual for the year 1,618 940
Utilised (494) (1,959)
Net exchange rate gains (losses) (371) 9
Closing balance 5,238 4,485
EURO 000’S31 DECEMBER
201731 DECEMBER
2016
Not due 73,954 88,246
Overdue by 1 to 30 days 16,731 14,381
Overdue by 30 to 180 days 14,226 15,552
Overdue by 180 to 365 days 6,332 5,274
Overdue more than 365 days 8,137 5,299
Total 119,380 128,751
Management believes that the carrying amount of trade re-ceivables is a reasonable approximation of their fair value. The trade receivables due from third parties of € 124,425
thousand reflects a decrease of around € 8,703 thousand as compared to the previous year (€ 133,128 thousand as at 31 December 2016). Change in allowance are shown below:
Accrual to the allowance for impairment are made on the ba-sis of both an assessment of specific loans where specific disputes exist (and are generally supported by an accom-panying legal opinion) and general evaluations grounded in historical experience.
The amount of the accruals is calculated on the basis of the present value of estimated recoverable amounts, accounting
for the related recovery expenses, if any, and the fair value of the collateral given to the Group, if any.In any case, the Directors monitor overdue loans by con-ducting a periodic analysis of the main accounts. Impairment losses are then recognized for the loans that are objectively partially or totally non-collectable. The following table shows a breakdown by overdue date:
For further details on credit management, please see note 29. For an analysis of trade receivables due from related parties
and the ultimate parent, please see note 30.
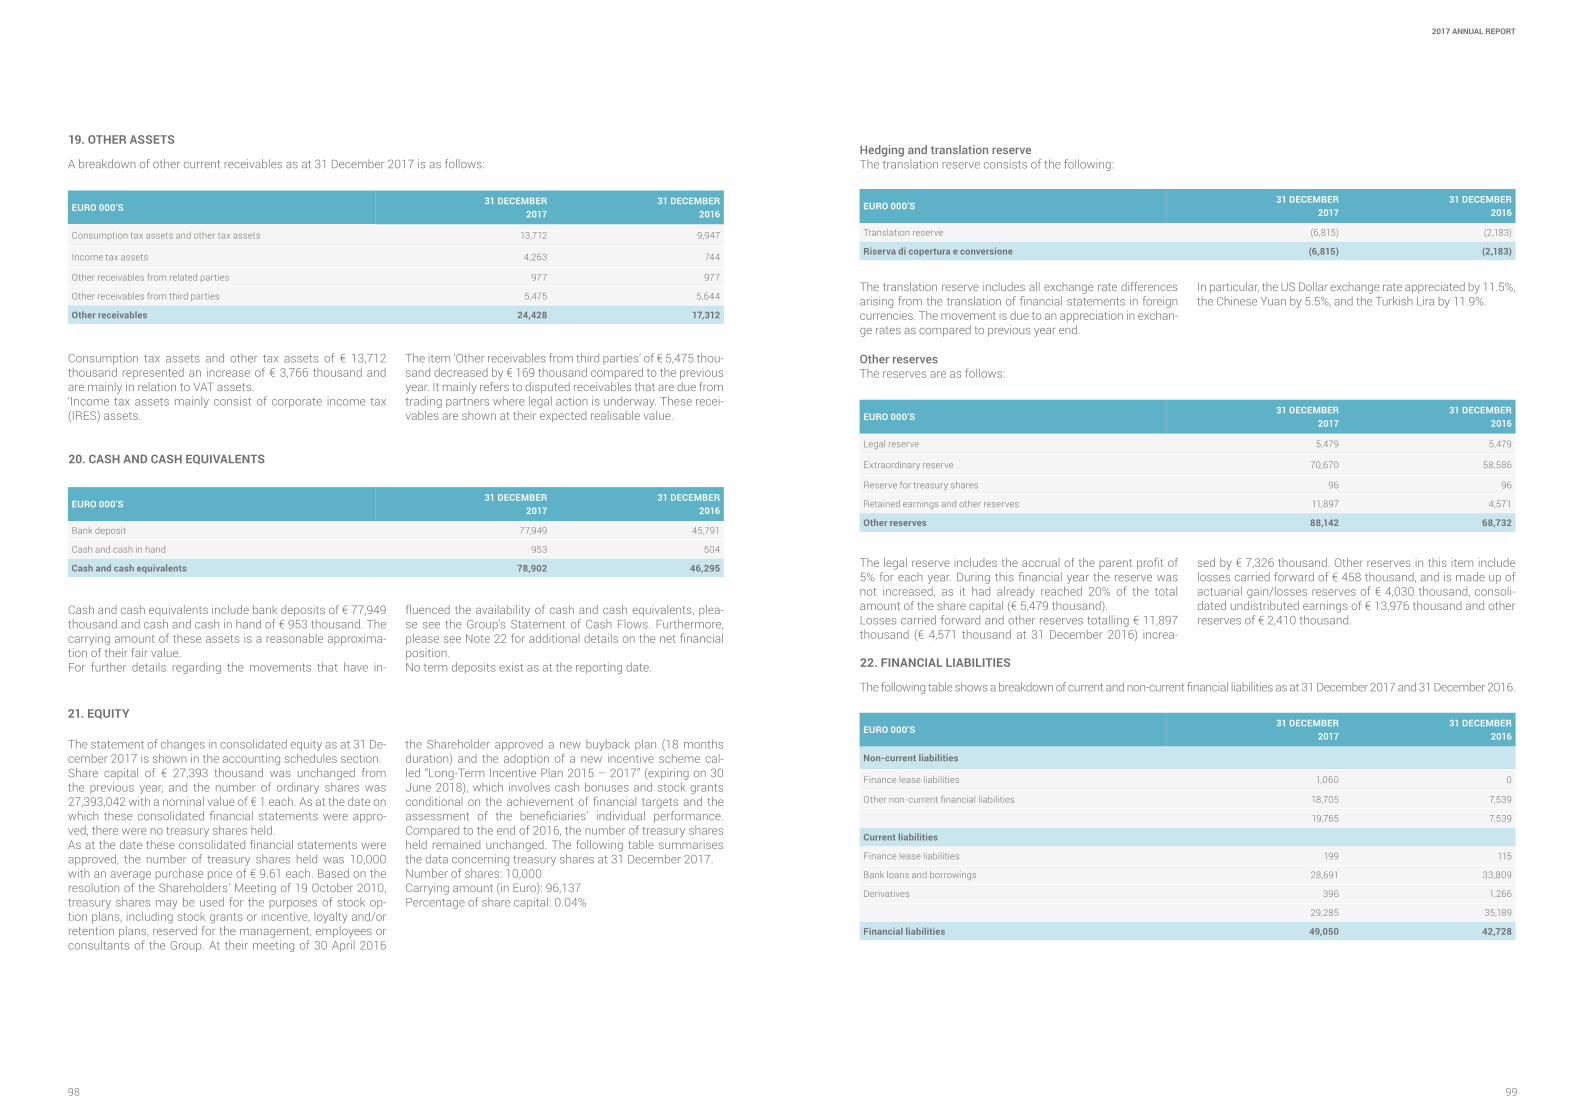
2017 ANNUAL REPORT
9998
19. OTHER ASSETS
20. CASH AND CASH EQUIVALENTS
A breakdown of other current receivables as at 31 December 2017 is as follows:
EURO 000’S31 DECEMBER
201731 DECEMBER
2016
Consumption tax assets and other tax assets 13,712 9,947
Income tax assets 4,263 744
Other receivables from related parties 977 977
Other receivables from third parties 5,475 5,644
Other receivables 24,428 17,312
EURO 000’S31 DECEMBER
201731 DECEMBER
2016
Bank deposit 77,949 45,791
Cash and cash in hand 953 504
Cash and cash equivalents 78,902 46,295
Consumption tax assets and other tax assets of € 13,712 thousand represented an increase of € 3,766 thousand and are mainly in relation to VAT assets.‘Income tax assets mainly consist of corporate income tax (IRES) assets.
The item ‘Other receivables from third parties’ of € 5,475 thou-sand decreased by € 169 thousand compared to the previous year. It mainly refers to disputed receivables that are due from trading partners where legal action is underway. These recei-vables are shown at their expected realisable value.
Cash and cash equivalents include bank deposits of € 77,949 thousand and cash and cash in hand of € 953 thousand. The carrying amount of these assets is a reasonable approxima-tion of their fair value. For further details regarding the movements that have in-
fluenced the availability of cash and cash equivalents, plea-se see the Group’s Statement of Cash Flows. Furthermore, please see Note 22 for additional details on the net financial position.No term deposits exist as at the reporting date.
21. EQUITY
The statement of changes in consolidated equity as at 31 De-cember 2017 is shown in the accounting schedules section.Share capital of € 27,393 thousand was unchanged from the previous year, and the number of ordinary shares was 27,393,042 with a nominal value of € 1 each. As at the date on which these consolidated financial statements were appro-ved, there were no treasury shares held.As at the date these consolidated financial statements were approved, the number of treasury shares held was 10,000 with an average purchase price of € 9.61 each. Based on the resolution of the Shareholders’ Meeting of 19 October 2010, treasury shares may be used for the purposes of stock op-tion plans, including stock grants or incentive, loyalty and/or retention plans, reserved for the management, employees or consultants of the Group. At their meeting of 30 April 2016
the Shareholder approved a new buyback plan (18 months duration) and the adoption of a new incentive scheme cal-led “Long-Term Incentive Plan 2015 – 2017” (expiring on 30 June 2018), which involves cash bonuses and stock grants conditional on the achievement of financial targets and the assessment of the beneficiaries’ individual performance. Compared to the end of 2016, the number of treasury shares held remained unchanged. The following table summarises the data concerning treasury shares at 31 December 2017. Number of shares: 10,000 Carrying amount (in Euro): 96,137 Percentage of share capital: 0.04%
Hedging and translation reserveThe translation reserve consists of the following:
Other reservesThe reserves are as follows:
EURO 000’S31 DECEMBER
201731 DECEMBER
2016
Translation reserve (6,815) (2,183)
Riserva di copertura e conversione (6,815) (2,183)
EURO 000’S31 DECEMBER
201731 DECEMBER
2016
Legal reserve 5,479 5,479
Extraordinary reserve 70,670 58,586
Reserve for treasury shares 96 96
Retained earnings and other reserves 11,897 4,571
Other reserves 88,142 68,732
EURO 000’S31 DECEMBER
201731 DECEMBER
2016
Non-current liabilities
Finance lease liabilities 1,060 0
Other non-current financial liabilities 18,705 7,539
19,765 7,539
Current liabilities
Finance lease liabilities 199 115
Bank loans and borrowings 28,691 33,809
Derivatives 396 1,266
29,285 35,189
Financial liabilities 49,050 42,728
The translation reserve includes all exchange rate differences arising from the translation of financial statements in foreign currencies. The movement is due to an appreciation in exchan-ge rates as compared to previous year end.
In particular, the US Dollar exchange rate appreciated by 11.5%, the Chinese Yuan by 5.5%, and the Turkish Lira by 11.9%.
The legal reserve includes the accrual of the parent profit of 5% for each year. During this financial year the reserve was not increased, as it had already reached 20% of the total amount of the share capital (€ 5,479 thousand).Losses carried forward and other reserves totalling € 11,897 thousand (€ 4,571 thousand at 31 December 2016) increa-
sed by € 7,326 thousand. Other reserves in this item include losses carried forward of € 458 thousand, and is made up of actuarial gain/losses reserves of € 4,030 thousand, consoli-dated undistributed earnings of € 13,976 thousand and other reserves of € 2,410 thousand.
22. FINANCIAL LIABILITIES
The following table shows a breakdown of current and non-current financial liabilities as at 31 December 2017 and 31 December 2016.

2017 ANNUAL REPORT
101100
Finance lease liabilitiesAssets subject to finance leases have been accounted for using the methodology provided for by IAS 17.
The following table breaks down the minimum payments and present value of minimum lease payments by due date:
Bank overdrafts and other financial liabilitiesFor 2017, the average loan collection rate was 0.59%, while the cash use rate on current accounts was 0.28%.As at 31 December 2017, the amount of unused credit lines was about € 125.3 million.As at 31 December 2017, short-term revolving credit lines re-present 72.8% of total financing, whereas the remaining part is represented by unsecured loans and residual portions of capital goods leases.
DerivativesLiabilities composed of derivative instruments are equal to the fair value of foreign currency hedging transactions
(forward contracts) in place as at 31 December 2017, being € 396 thousand. The Group has chosen not to adopt hedge accounting policies for recognizing this type of instrument. Net financial position Shown below is a breakdown of net financial debt as at 31 December 2017 and 31 December 2016. Please note, net financial debt is presented in accordance with the provi-sions set out by CONSOB Communication no.6064293 da-ted 28 July 2006 as well as with the recommendations of ESMA/2013/319.
EURO 000’S MINIMUM LEASE PAYMENTS AS AT 31 DECEMBER
PRESENT VALUE OF MINIMUM PAYMENTS LEASE AT 31 DECEMBER
2017 2016 2017 2016
Within the year 344 153 199 111
Between one and five years 2,318 3 1,060 3
Due after the fifth year 361 - - -
Total 3,024 156 1,259 115
A reconciliation between minimum lease payments due to the finance lease company and their present value is as follows:
EURO 000’S31 DECEMBER
201731 DECEMBER
2016
Minimum lease payments 3,024 156
Future financial expense (1,765) (41)
Total 1,259 115
EURO 000’S31 DECEMBER
201731 DECEMBER
2016
Cash 953 504
Cash equivalents 77,949 45,791
Cash and cash equivalents 78,902 46,295
Financial assets 519 461
Current bank loans and boorrowings 28,690 33,769
Current portion of non-current indebtness 199 111
Other current financial liabilities 396 1,266
Current financial indebtness 29,285 35,146
Current net financial indebtness position 50,136 11,609
Other non-current financial liabilities 19,765 -
Other non-current financial liabilities 19,765 -
Long-term financial indebtness 19,765 7,582
Net financial indebtness position 30,371 4,027
As at 31 December 2017, the net financial position was € 30,371 thousand. As at 31 December 2016, net financial
debt was positive at € 4,027 thousand.
23. POST-EMPLOYMENT BENEFITS
This item solely relates to post employments benefits reco-gnized by the parent in compliance with current Italian legi-slation, which guarantees that employees are paid benefits
when the employment relationship ends.
Movement in the item Post-employment is as follows:
EURO 000’S31 DECEMBER
201731 DECEMBER
2016
Opening balance 13,745 13,535
Net financial expenses (24) (7)
Benefits paid out (710) (430)
Net actuarial gain/(losses) 77 421
Other movements 368 227
Closing balance 13,456 13,745
The assumptions used for measuring the obligation of post-employment benefits are set below:
ECONOMIC ASSUMPTIONS 2017 2016
Year inflation rate 1.50% 1.50%
Year discount rate from -0.26% to 2018 to 1.48% to 2032 from -0.22% to 2017 to 1.48% to 2031

2017 ANNUAL REPORT
103102
DEMOGRAPHIC ASSUMPTION 2017 2016
Death RG48 mortality tables published by the State General Accounting Office
Disability INPS tables by age and sex
Retirement 100% upon achievement AGO requirements
Probability Advances 1.80% 1.80%
EURO 000’S 2017 2016
Pre-tax profit (loss) 60,730 - 52,385 -
National income tax rate 24% (14,590) 24.02% (14,406) 27.50%
Other differences (1,801) 2.97% (5,054) 9.65%
Income taxes for the year and effective tax rate (16,391) 26.99% (19,460) 32.04%
IRAP and other current taxes (3,003) (2,991)
Income taxes related to previous years 1,402 (470)
Income taxes for the year and effective tax rate (17,992) (22,921)
Average number of employeesThe average number of employees in 2017 was 3,949 (3,621 in 2016).
24. INCOME TAXES
Income taxes recognized in profit or loss
EURO 000’S 2017 2016
IRES and other deferred taxes 12,345 13,888
Income tax related to foreign subsidiaries 4,046 5,572
IRES and other taxes for the year 16,391 19,460
IRAP and other current taxes 3,015 3,003
IRAP and other deferred taxes (12) (12)
Income taxes related to previous years (1,413) 553
Other taxes 11 (83)
Income taxes 17,992 22,921
Income taxes related to foreign subsidiaries are calculated at the tax rates in force in each country.IRES and other deferred taxes, negative to the tune of €12,345 thousand overall (€ 13,888 thousand in 2016), mainly include the IRES tax expense for the year (determined by the national tax consolidation scheme), and the use of deferred tax assets set aside in previous years.On 5 December 2017, HSD S.p.A. signed a preliminary agree-ment with the Italian Revenue Agency for access to tax relief
in relation to the Patent Box. This agreement (which covers the 5 financial years from 2015 to 2019 inclusive) allows the recognition of tax benefits totalling € 3.7 million for IRES and IRAP. This represents € 2.1 million combined for 2015 and 2016 and € 1.6 million for 2017 year.The provision for taxes for the year can be reconciled with the reported profit or loss for the year as follows:
Deferred tax assets/liabilitiesHere below are the main items of deferred tax assets and liabilities.
EURO 000’S 2017 2016
Accrual to provisions for risks and charges 10,914 3,314
Intercompany profits included in the amount of closing inventories (2,138) 5,650
Other 4,345 4,022
Deferred tax assets 13,121 12,986
Accelerated Amortisation 3,031 1,662
Capitalised costs 177 171
Goods under finance lease 23 31
Other (611) 1,112
Deferred tax liabilities 2,620 2,976
Net deferred tax assets 2,620 2,976
Posizione netta 10,501 10,010
As at 31 December 2017, the Group recorded deferred tax as-sets of € 10,501 thousand (€ 10,010 thousand at 31 Decem-ber 2016). Management recognized such deferred tax assets to the extent they are likely to be recovered. The calculation of the various items took into consideration budget results and forecasts for the subsequent years consistent with those used for the purposes of impairment testing, approved by the Board of Directors of the company on 28 February 2018, and
described in the paragraph above concerning the recoverable amount of non-current assets.Deferred taxation as at 31 December 2017 takes into account the change in IRES rate provided for as from 2017, as introdu-ced by the 2016 Italian Stability Act. It also takes into account any other legislative changes in countries where the compa-nies of the Group operate.
25. PROVISION FOR RISKS AND CHARGES
EURO 000’S 31 DECEMBER 2017
Warranty Retirement of agents Legal disputes Tax disputes Total
Opening balance 8,561 354 2,560 519 11,994
Non current 2,377
Current 9,617
Accruals 681 (0) 357 1,100 2,138
Utilised (1,543) (14) (972) (623) (3,152)
Exchange rate gains (losses) and other differences (1,679) - 1,111 (6) (574)
Amount at 31/12/2017 6,019 340 3,056 990 10,406
Non current 1,367
Current 9,039

2017 ANNUAL REPORT
105104
The warranty provision represents the Group management’s best estimate of the obligations deriving from the warranty on products sold by the Group. The provision derives from estimates based on past experience and on the analysis of the level of reliability of the marketed products. The provi-sions for retirement of agents refers to the liabilities related to existing agency agreements.Movements in the warranty provision relate to the release of a Total Care provision (for the UK) and use of the provision against repairs performed under warranty. Movements in le-
gal disputes relate to legal cases, particularly where the pa-rent has settled with customers for damages. The allocation to the provision for risks of € 1,100 thousand as at 31 De-cember 2017 can mainly be attributed to the parent company Biesse S.p.A. This provision reflects the tax risks associated with the notice of assessment issued to the company in Oc-tober by the Italian Revenue Agency, in regards to the 2012, 2013 and 2014 tax periods.
Trade payables amounting to € 223,916 thousand (€ 192,613 thousand as at 31 December 2016) mainly relate to material supplies delivered in the last months of the year. It should be noted that trade payables are due within the next year and it
is believed that their carrying amount at the reporting date is a reasonable approximation of their fair value.For an analysis of trade payables due to related parties and the ultimate parent, please see note 30.
Other liabilities amounted to € 56,132 thousand, increasing by € 2,941 thousand compared to the previous year.In more detail, this balance consists of:• Tax liabilities of € 10,401 thousand, Social security liabilities of € 12,253 thousand and Other payables to employees of € 23,928 thousand. This is an increase over the previous finan-
cial year, which is consistent with the increase in the number of staff.• Other payables to third parties of € 9,521 thousand, mainly consisting of deferred income. This is an increase over the previous year (€ 8,018 thousand at 31 December 2016).
26. TRADE PAYABLES
27. OTHER LIABILITIES
The Group’s trade payables as at 31 December 2017 and 31 December 2016 are detailed below:
A breakdown of other liabilities as at 31 December 2017 is as follows:
EURO 000’S 2017 2016
Trade payables to suppliers 221,149 190,843
Trade payables to related parties 2,703 1,770
Trade payables to the ultimate 63 (0)
Trade payables 223,916 192,613
EURO 000’S 2017 2016
Tax liabilities 10,401 13,938
Social security liabilities 12,253 10,991
Other payables to employees 23,928 20,245
Other payables to third parties 9,521 8,018
Other payables to the ultimate 29 (0)
Other liabilities 56,132 53,191
28. FINANCIAL ASSETS/LIABILITIES FOR DERIVATIVE INSTRUMENTS
EURO 000’S 31 DECEMBER 2017 31 DECEMBER 2016
Asset Liability Asset Liability
Currency derivatives 505 396 374 (1,266)
Total 505 396 374 (1,266)
The amount of open contracts at year end (with a negative balance of € 109 thousand) refers to hedging contracts that are not compatible with the requirements of IAS 39 for the ap-plication of hedge accounting. As of 2016, the Group no lon-
ger records financial derivatives with the method envisaged for hedge accounting, given the complexity of this accounting method.
29. FINANCIAL RISK MANAGEMENT
The Group is subject to the following financial risks con-nected to its operations:• Market risks, consisting primarily of risks relating to fluctua-tions in exchange and interest rates.• Credit risk, relating specifically to trade receivables and, to a lesser extent, other financial assets.• Liquidity risk, with reference to the availability of financial re-sources to settle the obligations related to financial liabilities.The Group’s risk management policies aim to identify and analyse the risks to which the Group is exposed. They also endeavour to establish appropriate limits and controls, and to monitor risk and compliance with these limits. These policies and associated procedures are regularly reviewed in order to reflect any changes to market conditions or Group activities.With regard to the risk connected with the fluctuation in raw material prices, the Group tends to transfer their manage-ment and economic impact to its own suppliers by agreeing purchase costs for periods of no less than six months. The impact of the main raw materials, steel in particular, on the average value of the Group’s products is marginal compared to the final production cost. The following paragraphs use sensitivity analysis to assess the potential impact on actual results that hypothetical fluctuations in benchmarks may cause. As required under IFRS 7, these analyses are based on simplified scenarios being applied to actual data for benchmark periods. By their very nature, these analyses cannot be considered to truly evi-dence the effect of future changes in the benchmark in view of different financial and equity structures as well as different market conditions. Nor are they able to reflect the interrela-tions and complexity of the reference markets.
Market riskMarket risk is the risk that the fair value of a financial instru-ment (or future cash flows from that instrument) will fluctua-te as a result of changes in market prices due to changes in exchange rates, interest rates or share prices. The purpose of the market risk management is managing and controlling the group’s exposure to that risk within acceptable limits, while at the same time optimising investment returns.
Currency riskGeographical variety in the distribution of production and commercial activities brings about an exposure to currency risk, in terms of both transactions and translations.
a)Transactional currency riskThis risk comes about due to the individual companies car-rying out commercial and financial transactions in currencies other than their normal operating currency. Exchange rates may fluctuate between the time when the commercial/finan-cial relationship begins and the time when the transaction is completed (collection/payment), thus originating gains or losses.The Group manages such risk by making use of derivative instrument purchases, such as forward exchange contracts and cross currency swaps. On 11 March 2016, the Biesse S.p.A. Board of Directors passed a resolution approving a new currency risk management policy for the Biesse Group, and as previously mentioned, this put on hold the Group’s use of hedge accounting techniques for recognizing derivative in-struments for 2016 and 2017. This was due to the fact that the rules set out in IAS 39 were found to be quite stringent when applied effectively and fully with respect to the busi-ness operations.

2017 ANNUAL REPORT
107106
The following table provides a quantitative summary of the Group’s exposure to currency risk:
EURO 000’S AT 31 DECEMBER 2017
2017 2016 2017 2016
Australian Dollar 19,958 19,095 7,836 13,832
Canadian Dollar 6,378 5,855 8,777 7,314
Swiss Franc 3,216 6,144 2,949 1,805
Pound Sterling 10,488 10,256 10,585 13,019
Hong Kong Dollar 4,184 10,415 117 7,702
Indian Rupee 4,242 6,093 7,181 5,475
US Dollar 48,107 31,798 52,078 25,091
New Zealand Dollar 2,068 4,218 2,235 2,331
Chinese Renmimbi Yuan 12,653 18,298 32,075 36,888
Other currencies 14,651 9,835 13,304 8,100
Total 125,947 122,007 137,138 121,557
In defining the amount exposed to interest rate risk, the Group also includes foreign currency orders acquired in the period before they become trade receivables (shipping invoicing).A sensitivity analysis follows illustrating the impact on profit or loss of a +15%/-15% appreciation/depreciation of the Euro.
This analysis assumes that all other variables are held con-stant, particularly interest rates.
EURO 000’S IMPACT ON INCOME STATEMENT
If exchange rate > 15% If exchange rate < 15%
Australian Dollar (1,581) 2,139
Canadian Dollar 313 (423)
Swiss Franc (35) 47
Pound Sterling 13 (17)
Hong Kong Dollar (530) 718
Indian Rupee 383 (519)
US Dollar 518 (701)
New Zealand Dollar 22 (30)
Chinese Renmimbi Yuan 2,533 (3,427)
Total 1,635 (2,213)
The amounts reported above, are shown gross of hedging (which is not material in value)..
b) Currency translation riskThe Group holds a controlling interest in companies that pre-pare Financial Statements in currencies other than the Euro, which is the currency used for presenting the consolidated financial statements. This therefore exposes the Group to translation risk, which arises from translating assets and lia-bilities of these subsidiaries into Euro.The effects of these variations are accounted for directly un-der equity in the translation reserve.The main exposures to translation risk are constantly moni-tored. As at the reporting date, it was decided not to adopt specific hedging policies for this type of exposure.
Interest rate risk
Interest rate risk represents exposure to variations in the fair value of, or future cash flows from, financial assets or liabili-ties, due to changes in market interest rates.The Group is exposed to fluctuations in interest rates with re-ference to financial expense relating to payables due to lease companies for non-current assets acquired under finance le-ases. Considering that the exposure is currently limited, and there is substantial stability in interest rates (for the Eurozo-ne), the Group has chosen not to undertake hedging against this liability. The sensitivity analysis aimed at assessing the potential im-pact of a hypothetical sudden and unfavourable 10% change in short-term interest rates on financial instruments (typically cash and some financial payables) reveals no significant im-pact on the profit or the equity of the Group.
Credit riskCredit risk represents the Group’s exposure to potential finan-cial losses deriving from the failure of commercial and finan-cial counterparties to fulfil their contractual obligations.The main exposure is towards customers. In order to limit this risk, the Group has implemented procedures for asses-sing the financial potential and soundness of its customers, monitoring expected cash flows from collections and for any debt collection activities.These procedures typically provide for sales to be finalized by
obtaining advance payments. However, for those customers who are considered strategically important by Management, credit can be provided with limits being established and mo-nitored.The carrying amount of financial assets, less any impairment for expected losses, represents the maximum exposure to credit risk.For more information on how the allowance for impairment was determined and on the characteristics of overdue recei-vables, please refer to Note 18 on trade receivables.
Liquidity riskLiquidity risk is the risk that available financial resources will be insufficient to meet financial and commercial obligations as and when they fall due.Negotiation and management of banking relationships are centralized at the Biesse Group level, by virtue of the Cash Pooling agreement signed on 22 December 2011, so as to en-sure that short and medium-term financial needs will be met at the lowest possible cost. Raising medium and long-term capital funds on the market is also optimized with centralized management.The type of prudent risk management described above im-plies maintaining an adequate level of cash and/or readily convertible short-term securities. The trade receivables por-tfolio and the conditions by which they are regulated also contribute to maintaining an equilibrium in working capital, particularly in regards to hedging payables due to suppliers.The following table shows the expected flows based on the maturities of financial liabilities other than derivatives. Balan-ces relating to financial lease liabilities, bank overdrafts and bank loans are expressed at their contractual value without being discounted, including both principal and interest. Loans and other financial liabilities are classified on the basis of the earliest maturity date, and revolving credit lines as well as other liabilities whose maturities are not available are consi-dered payable on demand (“worst case scenario”).
31/12/2017
EURO 000’S AT 31 DECEMBER 2017
Less than 30 days 30-180 days 180 days-1year 1-5 years After 5 years Total
Trade and other payables 133,716 119,855 21,854 4,414 209 280,048
Finance lease liabilities 20 119 103 1,083 - 1,325
Bank loans and borrowings 1,839 4,726 22,264 18,224 658 47,712
Total 135,575 124,700 44,221 23,721 867 329,085

2017 ANNUAL REPORT
109108
31/12/2016
EURO 000’S AT 31 DECEMBER 2017
Less than 30 days 30-180 days 180 days-1year 1-5 years After 5 years Total
Trade and other payables 105,826 80,843 11,630 292 288 198,879
Financial lease payables 91 29 28 7 - 154
Bank loans and borrowings 5,284 11,639 16,886 6,778 776 41,362
Total 111,201 92,510 28,544 7,077 1,063 240,396
The Group monitors liquidity risk by controlling net flows on a daily basis in order to ensure financial resources are mana-ged efficiently.The amount of trade receivables and the conditions attached to them balance the working capital and, in particular, cover
trade payables.As at 31 December 2017, the Group had lines of credit arran-ged for the entire Group.
Classification of financial instruments Below are the types of financial instruments included in the consolidated financial statements:
EURO 000’S 2017 2016
FINANCIAL ASSETS
Measured at fair value through profit or loss:
Derivative financial assets 505 374
Measured at amortised cost :
Trade receivables 119,380 128,748
Other assets 3,626 7,571
- other financial assets and non-current receivables 2,649 2,296
- other current assets 977 5,275
Cash and cash equivalents 78,902 46,295
FINANCIAL LIABILITIES
Measured at fair value through profit or loss:
Derivative financial liabilities 396 1,266
Measured at amortised cost :
Trade payables 223,916 144,973
Bank loans and borrowings 47,395 41,462
Finance lease liabilities 1,259
Other current liabilities 36,210 31,253
The carrying amount of the above financial assets and liabi-lities is equal to or is a reasonable approximation of their fair value.For financial instruments recognized at fair value in the sta-tement of financial position, IFRS 7 requires that fair value measurements be classified using a fair value hierarchy that reflects the significance of the inputs used in making the me-asurements. To this end, IFRS 13 identifies the three levels of FV that have already been indicated earlier in these consoli-dated:
Level 1 – input data used in the measurements are represen-ted by quoted prices in active markets for assets or liabilities identical to those being measured;Level 2 – input data other than quoted prices included within level 1 that are observable in the market, either directly (i.e. prices) or indirectly (i.e. derived from prices);Level 3 – input data that are not based on observable market data.Financial instruments measured at fair value are classified under Level 2 (same as in 2016). During the year there were no transfers between Levels.
30. RELATED PARTY TRANSACTIONS
Biesse S.p.A. is owned by Bi.Fin S.r.l.Set out below are the Group income statement and statement of financial position balances for related party transactions carried out in 2017 and 2016. Please note that commercial transactions between these entities were conducted under
normal market conditions, and all transactions were finalized in the interests of the Group.It is also noted that companies owned by close relatives of directors on the Board are included among related parties.
EURO 000’SREVENUE AT
31-12-2017REVENUE AT
31-12-2016COSTS AL
31-12-2017COSTS AL
31-12-2016
Ultimate Parent
Bi. Fin. S.r.l. - - 370 334
Other related companies
Fincobi S.r.l. 1 1 15 15
Se. Mar. S.r.l. 26 4 3,251 3,200
Wirutex S.r.l. - 36 26 1,105
Members of the Board of Directors
Members of the Board of Directors 0 - 1,826 2,649
Members of the Board of Statutory Auditors
Members of the Board of Statutory Auditors - - 168 155
Total 27 41 5,656 7,458
EURO 000’SRECEIVABLES AT 31-12-2017
RECEIVABLES AT 31-12-2016
PAYABLES AT 31-12-2017
PAYABLES AT 31-12-2016
Other related companies
Fincobi S.r.l. - - - -
Edilriviera S.r.l. - - - -
Se. Mar. S.r.l. 3 4 1,276 1,251
Wirutex S.r.l. 31 47 9 342
Members of the Board of Directors
Members of the Board of Directors 31 - 34 18
Members of the Board of Statutory Auditors
Members of the Board of Statutory Auditors - - 168 160
Total 1,043 1,028 1,488 1,771

2017 ANNUAL REPORT
111110
For all the years under consideration, no guarantees have been given or received. The Group has not accounted for any losses on receivables from related parties in the current or previous years.Fees recognized for Directors are proposed by the Board of Directors and approved at the ordinary shareholders’ meeting according to the average market remuneration levels. It must be noted that there is only one director in the Group who has strategic functions and who also performs management and coordination activities, whose remuneration (including fees and bonuses) is included under personnel.For full details regarding remuneration of Directors and Statu-tory Auditors, please see the Remuneration Report published
on the parent’s website www.biesse.com.Biesse S.p.A. is subject to management and co ordination by the Ultimate Parent Bi.Fin. S.r.l. As the Italian Civil Code requi-res, below we disclose the key data from the latest consoli-dated financial statements of Bi.Fin. S.r.l. as lodged with the Chamber of Commerce, highlighting that: • Reference should be made to the latest approved financial statements, namely the financial statements at 31 December 2016.• Given that summary information is required, it was conside-red appropriate to limit this disclosure to indicating totals for the most material items.
EURO 000’S 2017 2016
Revenue 927 876
Production costs (3,902) (1,421)
Net Exchange rate gains 93 30,814
Income taxes - (61)
Profit (Loss) for the year (2,882) 30,208
EURO 000’S 2016 2015
Non current assets 32,741 32,469
Working capital 25,566 43,343
Total assets 58,307 75,812
Equity
Quote capital 10,569 10,569
Reserves 49,394 33,786
Profit (loss) for the year (2,882) 30,208
Payables 1,226 1,249
Total liabilities 58,307 75,812
31. OPERATING LEASE CONTRACTS
The amount paid by the Group on leases during the year is as follows:
At the reporting date, the amount of lease payments still owed by the Group for operating leases is as follows:
These contracts relate to the lease of buildings (for industrial or commercial use), motor vehicles and office machinery. During the year, the Group did not enter into any contracts as lessor.
EURO 000’S 2017 2016
Instalments paid during the year (10,745) (8,814)
Total (10,745) (8,814)
EURO 000’S 2017 2016
Within one year 3,529 6,708
Between one and five years 4,137 11,722
After five years 46 2,596
Total 7,712 21,026
EURO 000’S 2017 2016
Instalments received during the year 84 123
Total 84 123
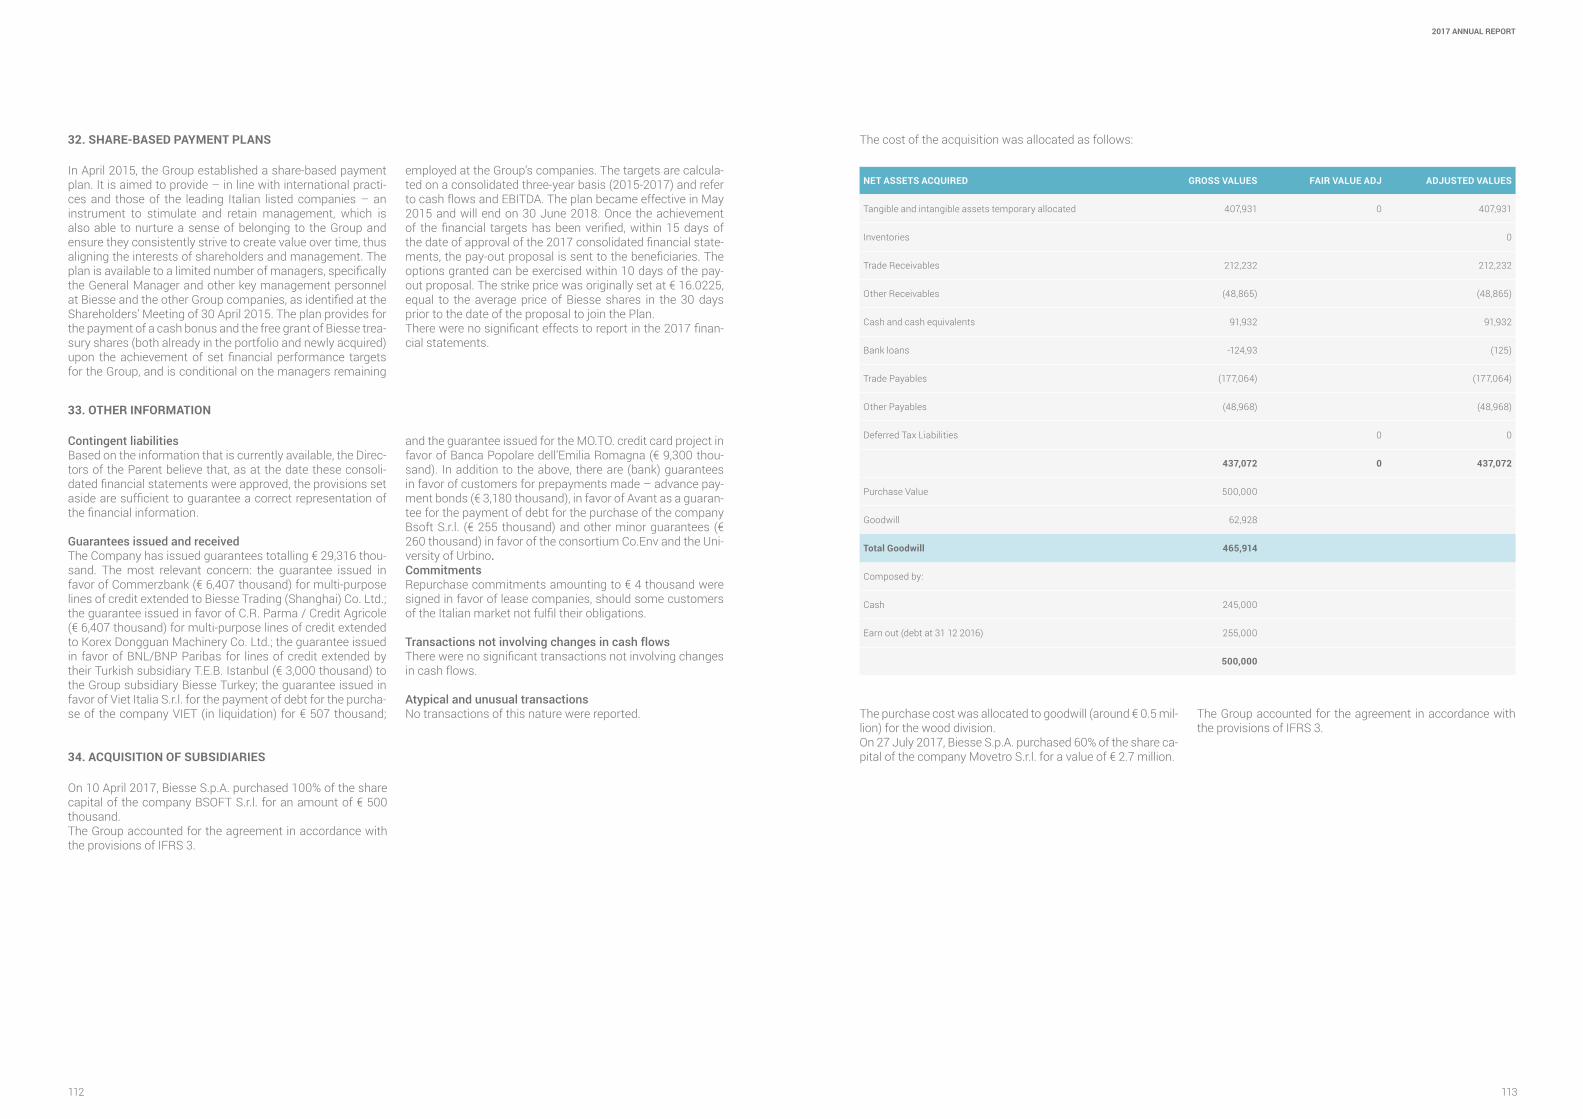
2017 ANNUAL REPORT
113112
32. SHARE-BASED PAYMENT PLANS
34. ACQUISITION OF SUBSIDIARIES
33. OTHER INFORMATION
In April 2015, the Group established a share-based payment plan. It is aimed to provide – in line with international practi-ces and those of the leading Italian listed companies – an instrument to stimulate and retain management, which is also able to nurture a sense of belonging to the Group and ensure they consistently strive to create value over time, thus aligning the interests of shareholders and management. The plan is available to a limited number of managers, specifically the General Manager and other key management personnel at Biesse and the other Group companies, as identified at the Shareholders’ Meeting of 30 April 2015. The plan provides for the payment of a cash bonus and the free grant of Biesse trea-sury shares (both already in the portfolio and newly acquired) upon the achievement of set financial performance targets for the Group, and is conditional on the managers remaining
employed at the Group’s companies. The targets are calcula-ted on a consolidated three-year basis (2015-2017) and refer to cash flows and EBITDA. The plan became effective in May 2015 and will end on 30 June 2018. Once the achievement of the financial targets has been verified, within 15 days of the date of approval of the 2017 consolidated financial state-ments, the pay-out proposal is sent to the beneficiaries. The options granted can be exercised within 10 days of the pay-out proposal. The strike price was originally set at € 16.0225, equal to the average price of Biesse shares in the 30 days prior to the date of the proposal to join the Plan.There were no significant effects to report in the 2017 finan-cial statements.
Contingent liabilitiesBased on the information that is currently available, the Direc-tors of the Parent believe that, as at the date these consoli-dated financial statements were approved, the provisions set aside are sufficient to guarantee a correct representation of the financial information.
Guarantees issued and receivedThe Company has issued guarantees totalling € 29,316 thou-sand. The most relevant concern: the guarantee issued in favor of Commerzbank (€ 6,407 thousand) for multi-purpose lines of credit extended to Biesse Trading (Shanghai) Co. Ltd.; the guarantee issued in favor of C.R. Parma / Credit Agricole (€ 6,407 thousand) for multi-purpose lines of credit extended to Korex Dongguan Machinery Co. Ltd.; the guarantee issued in favor of BNL/BNP Paribas for lines of credit extended by their Turkish subsidiary T.E.B. Istanbul (€ 3,000 thousand) to the Group subsidiary Biesse Turkey; the guarantee issued in favor of Viet Italia S.r.l. for the payment of debt for the purcha-se of the company VIET (in liquidation) for € 507 thousand;
and the guarantee issued for the MO.TO. credit card project in favor of Banca Popolare dell’Emilia Romagna (€ 9,300 thou-sand). In addition to the above, there are (bank) guarantees in favor of customers for prepayments made – advance pay-ment bonds (€ 3,180 thousand), in favor of Avant as a guaran-tee for the payment of debt for the purchase of the company Bsoft S.r.l. (€ 255 thousand) and other minor guarantees (€ 260 thousand) in favor of the consortium Co.Env and the Uni-versity of Urbino.CommitmentsRepurchase commitments amounting to € 4 thousand were signed in favor of lease companies, should some customers of the Italian market not fulfil their obligations.
Transactions not involving changes in cash flowsThere were no significant transactions not involving changes in cash flows.
Atypical and unusual transactionsNo transactions of this nature were reported.
On 10 April 2017, Biesse S.p.A. purchased 100% of the share capital of the company BSOFT S.r.l. for an amount of € 500 thousand. The Group accounted for the agreement in accordance with the provisions of IFRS 3.
The cost of the acquisition was allocated as follows:
NET ASSETS ACQUIRED GROSS VALUES FAIR VALUE ADJ ADJUSTED VALUES
Tangible and intangible assets temporary allocated 407,931 0 407,931
Inventories 0
Trade Receivables 212,232 212,232
Other Receivables (48,865) (48,865)
Cash and cash equivalents 91,932 91,932
Bank loans -124,93 (125)
Trade Payables (177,064) (177,064)
Other Payables (48,968) (48,968)
Deferred Tax Liabilities 0 0
437,072 0 437,072
Purchase Value 500,000
Goodwill 62,928
Total Goodwill 465,914
Composed by:
Cash 245,000
Earn out (debt at 31 12 2016) 255,000
500,000
The purchase cost was allocated to goodwill (around € 0.5 mil-lion) for the wood division.On 27 July 2017, Biesse S.p.A. purchased 60% of the share ca-pital of the company Movetro S.r.l. for a value of € 2.7 million.
The Group accounted for the agreement in accordance with the provisions of IFRS 3.

2017 ANNUAL REPORT
115114
The cost of the acquisition was allocated as follows:
The purchase cost was allocated to goodwill (around € 2.6 million) for the glass division.On 27 July 2017, a newco was set up called Montresor & Co. S.r.l. (with a 90% stake held by Biesse S.p.A. and 10 % by Do-natoni Macchine S.r.l.) whose purpose is the acquisition of Montresor & C. S.r.l., which is based in the province of Verona and manufactures edge polishers machinery (glass and mar-ble). The acquisition was completed on 3 August 2017 with the payment of the first tranche of 65% of the agreed price (€ 4.8 million, net of payables due to employees, payments on account and/or guarantee deposits and the estimate of the
inventories bought). In the agreements among the members of the newco (Montresor & Co. S.r.l.), the possibility is envisa-ged for the non-controlling stakeholder Donatoni to undertake a share capital increase for a further 30% to reach a 40% sta-ke. The difference between the acquisition price and the va-lue of assets and liabilities acquired, amounting to € 634,028, during PPA, was allocated to goodwill in the glass division. On 21 December 2017, 30% of Biesse S.p.A. shareholdings were transferred to Donatoni Macchine S.r.l. The liquidation of Montresor & C. S.r.l. took place at the same time.
NET ASSETS ACQUIRED GROSS VALUES FAIR VALUE ADJ ADJUSTED VALUES
Tangible and intangible assets temporary allocated 195,278 0 195,278
Inventories 1,760,997 1,760,997
Trade Receivables 380,862 380,862
Other Receivables 182,918 249,887
Cash and cash equivalents 502,320 502,320
Bank loans (12,835) (12,835)
Trade Payables (2,312,099) (2,312,099)
Other Payables (472,378) (472,378)
Deferred Tax Liabilities 0 0 0
225,064 0 292,033
% possesion (60%) 175,220
Purchase Value 2,724,610
Goodwill 2,549,390
35. EVENTS AFTER THE REPORTING DATE
On 9 February 2018, Biesse S.p.A. announced its intention to move forward with listing the subsidiary HSD S.p.A. on the Electronic Stock Market organized and managed by Borsa Italiana S.p.A, in the STAR segment. Biesse S.p.A, however, will continue to hold a controlling position in HSD S.p.A. The transaction should be completed within the first half of 2018, compatibly with market conditions.As a result of the listing process, the company HSD S.p.A. has taken steps to adopt, and expects implementation thereof following the successful listing on the Stock Exchange, the following:• Preparation of Governance regulations (for regulating rela-ted party transactions, market abuse, internal dealing, tran-sparency, etc.).• Finalizing contracts with Biesse S.p.A. for business relation-ships and centralized services.• Finalizing contracts with Directors and key management in relation to regulating base earnings, conditions of service, and long-term incentive schemes.With regards to the subsidiary HSD S.p.A., the Board of Direc-tors met in a session held on 9 February 2018 and proposed that the date for the Shareholders’ Meeting should be set for 22 March 2018, with the following agenda:• Consider and approve admission of the Company’s ordinary shares to trading on the Electronic Stock Market organized and managed by Borsa Italiana S.p.A. and, assuming condi-tions are met, in the corresponding Star Segment. This should take place through a private placement directed exclusively at qualified Italian investors and foreign institutional investors outside the United States of America (with the exception of Canada, Japan and Australia) in accordance with the Regu-lation S adopted pursuant to the United States of America Securities Act of 1933. Applicable and consequential resolu-tions.• Changes to articles 4.1, 5.7, 6 and 16 of the company’s by-laws.• Dematerialisation of shares.• Splitting the Company’s shares by a ratio of 100 (one hun-dred) newly issued shares replacing each of the existing ordi-nary shares. Applicable and consequential resolutions.• Statutory changes as necessary in preparation for admis-sion to listing of the company’s ordinary shares, pursuant to current legislation and Corporate Governance Code recom-mendations. Adoption of new company by-laws, effective from when the Company’s shares first open for trade on the Electronic Stock Market organised and managed by Borsa Ita-liana S.p.A.• Proposal to introduce shares with increased voting rights along with the related by law amendments, effective from the date when the Company’s shares open for trade on the Electronic Stock Market organised and managed by Borsa Ita-liana S.p.A. Applicable and consequential resolutions.• Pre-emptive offer, in tranches, with option rights excluded pursuant to article 2441, paragraph 5 of the Italian Civil Code, by issuing a maximum number of 30,000,000 (thirty million) ordinary shares of the Company, with no par value, in one or more tranches, to service the Company’s public offer under the listing transaction, effective from when Borsa Italiana S.p.A. issues the provision for admitting the shares to trading on the Electronic Stock Market organized and managed by Borsa Italiana S.p.A; applicable and consequential resolu-tions.• Approval of the shareholders’ meeting regulations, effecti-ve from when the Company’s shares open for trade on the
Electronic Stock Market organised and managed by Borsa Italiana S.p.A.• Appointment of statutory auditors for 2018-2026 effective from when the Company’s shares first open for trade on the Electronic Stock Market organized and managed by Borsa Ita-liana S.p.A.; applicable and consequential resolutions.• Adoption of a number of guidelines regarding medium-long term management incentive schemes, effective from when the Company’s shares first open for trade on the Electronic Stock Market organized and managed by Borsa Italiana S.p.A. Applicable and consequential resolutions.
On 28 February 2018, the Board of Directors of HSD S.p.A. resolved the following:• Approval of the 2018-2020 three-year plan.• Approval of a new dividend policy, in line with that which is already in place for the parent, Biesse S.p.A.Furthermore, the Board of Directors discussed the possibility of taking over from the ultimate parent, Bi.Fin. S.r.l., the finan-cial lease contract that is currently in place for the Gradara Production Plant, where the company operates at present. Timelines for such a process are not yet certain; however, the transfer should take shape by the end of 2018 and would en-tail HSD making a financial commitment of approximately € 5 million. With this takeover, HSD would also enter into pos-session of a portion of adjacent land. This would allow HSD to plan an expansion of the production area that is necessary to support growth in the years ahead. The cost of this new investment can be quantified as an additional € 8 million.On the same date, 28 February 2018, the shareholders’ mee-ting of HSD S.p.A. was also held. At this meeting, the sharehol-ders resolved the following, effective from the time of listing:• Approval of the project to admit the Company’s shares to tra-de on the Electronic Stock Market organised and managed by Borsa Italiana S.p.A., and in the Star Segment (if applicable), while conferring on the Board of Directors the power to carry out the necessary actions.• Approval of a number of amendments to the current com-pany by-laws and adoption of new company by-laws compa-tible with the current legal provisions as applicable to listed companies.• Approval for the shares of Monte Titoli S.p.A. to be demate-rialised, along with the consequent withdrawal and cancella-tion of securities representing the Company’s shares.• Approval to split the ordinary shares of the Company, with 100 new shares to be issued in replacement of each of the ordinary shares outstanding.• Approval to introduce into the bylaws the ability to issue sha-res with increased voting rights.• Increase in share capital without option rights, through the issue of a maximum number of 30,000,000 shares.• Approval of the shareholders’ meeting regulations.• Appointment of KPMG S.p.A. as the statutory auditors for the 2018-2026 financial years.• Approval of guidelines regarding medium to long term ma-nagement incentive schemes.
On 27 and 28 February, Biesse Middle East opened its do-ors to customers and visitors from the entire Region, at the new Dubai Campus that was inaugurated in November 2017. Intermac took part in the thirteenth exhibition of Stona, the Indian trade fair that took place in Bangalore from 7 to 10 Fe-bruary. It was an opportunity to provide information to profes-sionals in the stone industry about the technological synergy

2017 ANNUAL REPORT
117116
between Intermac, Donatoni Macchine and Montresor. Biesse Deutschland reaffirmed its presence by attending the trade fair in Cologne, Germany, from 20 to 23 February. This inter-national rendezvous was dedicated to Housing technologies, and the goal was to demonstrate those of Biesse’s solutions that are specific to this industry. The Turkish branch atten-ded the CNR Expo and trade fair in Istanbul, focussing on machines dedicated to manufacturing doors. More than 500 customers have lived the Biesse experience with Biesse Iberi-ca’s stand at Fimma 2018 - Spain’s most important trade fair for the industry. The exhibition had 11 machines on display, which were directed towards all types of specialists in wood, from large factories with high production volumes, to compa-nies that need to produce thousands of products tailored to customer needs, or small businesses with craft-like features. Biesse France participated in Eurobois with an area of 1000 m2, where visitors could see the innovative technological so-lutions up close and live the Biesse experience. Star of the event was SOPHIA, the Internet of Things (IoT) platform cre-ated in collaboration with Accenture that during the fair won the Innovation Award.
On 28 February, the Board of Directors of Biesse S.p.A. appro-ved the updating of its business plan for the three-year period 2018-2020. Based on the initiatives set out in the above busi-ness plan and on the assessment of the international macro-economic situation, the results expected by the Biesse Group in the period examined are as follows: • Higher consolidated net revenue at a three-year structural CAGR of 9.5% (revenue above € 906 million expected in 2020). • Higher Added Value with a three-year CAGR of 10.8% (43.4% record impact in 2020).• Increase in operating margins: - EBITDA with a three-year CAGR of 12.7% (14% impact in 2020).- EBIT with a three-year CAGR of 14.7% (10.6% impact in 2020). • Positive free cash flow with a total of 120 million euro in the three-year period 2018-2020 (free cash flow margin of 5% in 2020) net of planned investments (total capex 142.6 million euro).
In 2017, consolidated turnover was estimated to grow by 11.6% compared to the previous year, € 690 million, while EBI-TDA stood at 12.9% of consolidated revenues.“The Board – chaired by Roberto and Giancarlo Selci – appro-ved actions to support the growth plan for 2018-2020, always with a focus on investments in innovation, service, and the marketing/sales area. “The plan starts from the excellent results for 2017,” - commented the Group General Manager, Stefano Porcellini - “which closed with growth in consolidated revenue of 11.6%, EBITDA of 12.9%, and a significant cash ge-neration that led the Group to achieve a net financial position of over € 30 million.”
The Board of Directors, taking into account the positive finan-cial position as at 31 December 2017 and results of opera-tions for 2017, proposes to distribute dividends to Sharehol-ders to be taken from the profit for the year at the rate of € 0.48 for each eligible share, totalling € 13,148,660.16, less the dividends on treasury shares held on the ex-dividend date of 8 May 2018. The portion of the dividend referring to the latter will be allocated to the Extraordinary Reserve.Therefore, you are invited to resolve on the allocation of the profit for the year of € 38,811,913.31 as follows:
• Allocation of € 13,148,660.16 to dividends.• Allocation of € 75,332.65 to the reserve for unrealized exchange gains.• Allocation of the residual profit of € 25,587,920.50 to the Ex-traordinary Reserve.The coupons will be paid in a lump sum starting from 10 May 2018 (with ex-dividend date as from 8 May 2018 and record date on 9 May 2018) by means of qualified financial interme-diaries.
Pesaro, 12/03/2018 The Chairman of the Board of Directors
Roberto Selci
ANNEXES
INCOME STATEMENT IN ACCORDANCE WITH CONSOB RESOLUTION NO. 15519 OF 27 JULY 20061
ANNEX 1
STATEMENT OF FINANCIAL POSITION IN ACCORDANCE WITH CONSOB RESOLUTION NO. 15519 OF 27 JULY 20061
EURO 000’S31 DECEMBER
2017
OF WHICH WITH RELATED
PARTIES%
31 DECEMBER2016
OF WHICH WITH RELATED
PARTIES%
Revenue 690.120 0 0 618.489 0 0
Total other revenue 4,669 27 0.6% 3,548 41 1.2%
Change in inventories of finished goods and work in progress 15,387 - 0.0% 12,649 - 0.0%
Raw materials, consumables and goods (287,017) - 0.0% (258,979) - 0.0%
Personnel expense (199,311) - 0.0% (176,551) - 0.0%
Depreciation, amortisation and impairment losses (136,194) (5,656) 4.2% (124,564) (7,458) 6.0%
Other operating costs (24,047) - 0.0% (19,529) - 0.0%
Operating profit 63,606 (5,629) -8.8% 55,062 (7,416) -13.5%
Financial income 9,932 - 0.0% 9,533 - 0.0%
Financial expense (12,808) - 0.0% (12,210) - 0.0%
Pre-tax profit (loss) 60,730 (5,629) -9.3% 52,385 (7,416) -14.2%
Income taxes (17,992) - 0.0% (22,921) - 0.0%
Profit for the year 42,738 (5,629) -13.2% 29,464 (7,416) -25.2%
EURO 000’S31 DECEMBER
2017
OF WHICH WITH RELATED
PARTIES% INCIDENZA
31 DECEMBER2016
OF WHICH WITH RELATED
PARTIES% INCIDENZA
ASSETS
Property, plant and equipment 90,515 - 0.0% 81,939 - 0.0%
Goodwill 22,660 - 0.0% 19,316 - 0.0%
Other intangible assets 52,448 - 0.0% 45,901 - 0.0%
Deferred tax assets 13,121 - 0.0% 12,987 - 0.0%
Other financial assets and receivables (inluding derivatives) 2,648 - 0.0% 2,296 - 0.0%
Other revcevables 0 - 0.0% 50 - 0.0%
Total non current assets 181,391 - 0.0% 162,490 - 0.0%
Inventories 143,210 - 0.0% 130,785 - 0.0%
Trade receivables 119,380 - 0.0% 128,751 - 0.0%
Other revcevables 24,428 1,043 4.3% 17,312 1,028 5.9%
Other financial assets and receivables (inluding derivatives) 519 - 0.0% 461 - 0.0%
Cash and cash equivalents 78,902 - 0.0% 46,295 - 0.0%
Total Current Assets 366,438 1,043 0.3% 323,603 1,028 0.3%
TOTAL ASSETS 547,830 1,043 0.2% 486,093 1,028 0.2%

2017 ANNUAL REPORT
119118
EURO 000’S31 DECEMBER
2017
OF WHICH WITH RELATED
PARTIES% INCIDENZA
31 DECEMBER2016
OF WHICH WITH RELATED
PARTIES% INCIDENZA
Share capital 27,393 - 0.0% 27,393 - 0.0%
Reserves 117,434 - 0.0% 102,656 - 0.0%
Profit for the year 42,558 - 0.0% 29,385 - 0.0%
Equity attributable to the owners of the parent 187,385 - 0.0% 159,433 - 0.0%
Non-controlling interests 952 - NA 290 - NA
TOTAL EQUITY 188,337 - 0.0% 159,723 - 0.0%
Financial liabilities 19,765 - 0.0% 7,539 - 0.0%
Post-employment benefits 13,456 - 0.0% 13,746 - 0.0%
Deferred tax liabilities 2,620 - 0.0% 2,976 - 0.0%
Provisions for risks and charges 1,367 - 0.0% 2,377 - 0.0%
Provisions for risks and charges 1,367 - 0.0% - - 0.0%
Other liabilities 307 - 0.0% 137 - 0.0%
Total non current liabilities 37,516 - 0.0% 26,775 - 0.0%
Financial liabilities 29,285 - 0.0% 35,189 - 0.0%
Tax payables 3,606 - 0.0% 8,982 - 0.0%
Provisions for risks and charges 9,039 - 0.0% 9,617 - 0.0%
Trade payables 223,916 1,488 0.7% 192,613 1,771 0.9%
Other liabilities 56,132 - 0.0% 53,191 - 0.0%
Total Current Liabilities 321,977 1,488 0.5% 299,591 1,771 0.6%
LIABILITIES 359,493 1,488 0.4% 326,366 1,771 0.5%
TOTAL EQUITY AND LIABILITIES 547,830 1,488 0.3% 486,090 1,771 0.4%
CERTIFICATION OF THE CONSOLIDATED FINANCIAL STATEMENTS IN ACCORDANCE WITH ARTICLE 81-TER OF CONSOB REGULATION NO.11971 OF 14 MAY 1999 AS SUBSEQUENTLY AMENDED AND INTEGRATED
1. The undersigned Roberto Selci and Cristian Berardi in their capacities as, respectively, Chairman and Chief Executive Of-ficer and Manager in charge of financial reporting of Biesse S.p.A., having also taken into account the provisions of art. 154-bis, paragraphs 3 and 4, of Italian Legislative Decree no. 58 of 24 February 1998, hereby state:• The adequacy in relation to the characteristics of the busi-ness.• The effective implementation of the administrative and ac-counting procedures for the preparation of the consolidated financial statements during 2017.
2. The administrative and accounting procedures for prepa-ring the consolidated financial statements at 31 December 2017 were defined, and their adequacy was assessed, based on the rules and methods established by Biesse consistently with the Internal Control – Integrated Framework model is-sued by the Committee of Sponsoring Organizations of the Treadway Commission. This is a reference framework for in-ternationally accepted internal control systems.
3. In addition, they also state that the consolidated financial statements at 31 December 2017:a) Are consistent with the entries in accounting ledgers and records.b) Have been drawn up in accordance with the International Financial Reporting Standards issued by the International Ac-counting Standards Board, endorsed by the European Com-mission with the procedure provided for by art. 6 of Regula-tion (EC) No. 1606/2002 of the European Parliament and the Council of 19 July 2002 and pursuant to art. 9 of the Italian Legislative Decree no. 38/2005; they are capable of providing a true and fair view of the result of operations, financial posi-tion and cash flows of the issuer and the group of companies included in the scope of consolidation.
The Directors’ Report includes a reliable analysis of the per-formance and the results of operations, and the overall po-sition of the issuer and the group of companies included in the scope of consolidation, together with a description of the main risks and uncertainties they are exposed to.
Pesaro, 12 March 2018
The Manager in charge of financial reporting
Cristian Berardi
The Chairman of the Board of Directors
Roberto Selci

2017 ANNUAL REPORT
121120
MADEWITH
CASE HISTORIES

2017 ANNUAL REPORT
123122
THE TIME FRAME AND PRECISION OF THE MACHINING OPERATION, COMBINED WITH A MORE EFFICIENT ORGANISATION OF WORK IN THE PRODUCTION AREA, ESTABLISH TRUE COMPETITIVE ADVANTAGES WITH RESPECT TO THE COMPETITION. BIESSE PLAYS A FUNDAMENTAL ROLE IN THIS MISSION: IT IS, FOR ALL INTENTS AND PURPOSES, A STRATEGIC PARTNER AND NOT MERELY A SUPPLIER OF MACHINERY.
BATHROOM FURNISHINGS, TAILORING MAGIC.
BTMBAGNI
Marco MerliProduct Manager e R&S
CASE HISTORIES
122 123

2017 ANNUAL REPORT
125124
THE CHALLENGE MET BY INTERMAC IN PROVIDING TECHNOLOGY FOR THE NEW FACTORY WAS THAT OF COMBINING A WIDE RANGE OF CAPABILITIES AND DEVELOPING A HIGH LEVEL OF AUTOMATION SO THAT ALL MACHINES WOULD BE ABLE TO COMMUNICATE WITH EACH OTHER, WORKING IN A COORDINATED MANNER WITHOUT ANY INPUT FROM THE OPERATOR.
EVERYTHING IN LINE, WITHOUT EVER TOUCHING THE GLASS.
TAV
Jean-Louis PiscinaDirettore Generale
CASE HISTORIES
124
RELAZIONE FINANZIARIA ANNUALE 2016
125

2017 ANNUAL REPORT
127126
OUR CLIENTS REQUIRE FLEXIBILITY, ADAPTABILITY, AN EXCELLENT QUALITY/PRICE RELATIONSHIP, AND PUNCTUAL DELIVERY.BIESSE TECHNOLOGY RESPONDS TO OUR MANUFACTURING NEEDS AND THE PERSONNEL HAS ALWAYS SUPPORTED OUR EVERY STEP.
BIESSE TECHNOLOGY FOR AIRCRAFTS.
TECNA VANT
Maurizio Patriarca Quality Manager
CASE HISTORIES
126 127

2017 ANNUAL REPORT
129128
NATURE CALLS, TECHNOLOGY ANSWERS.
GENERELLISA
THANKS TO INTERMAC TECHNOLOGY WE ARE ABLE TO CREATE OBJECTS WITH COMPLEX SHAPES, INCREASING PRODUCTIVITY AND AUTONOMOUS WORK.
Matteo Generelli Owner Generelli Sa
CASE HISTORIES
128 129

2017 ANNUAL REPORT
131130
CASE HISTORIES
130
THE UNITEAM MACHINING CENTRE HAS SIGNIFICANTLY REDUCED PRODUCTION COSTS AND OPTIMISED COMPANY LOGISTICS. HAVING THIS TECHNOLOGY HAS HELPED US ACCEPT A CONSTANTLY INCREASING NUMBER OF REQUESTS FROM CUSTOMERS ENGAGED IN THE CONSTRUCTION OF HOUSES AND OTHER BUILDINGS.
BIESSE INNOVATION TO SERVE HOUSING.
Yukitsugu Takahashi President Sky Corporation
SKYCORPORATION
131

2017 ANNUAL REPORT
133132
DIAMUT TECHNOLOGY HAS PROVEN ITSELF TO BE THE WINNING SOLUTION, MEETING THE STRICT PERFORMANCE NEEDS AND BEST RESPECTING THE FUNDAMENTAL REQUIREMENTS FOR COMPLETION OF THE PROJECT.
TECHNOLOGICAL SYNERGY BETWEEN THE TOOL AND THE MATERIAL TO BE SHAPED.
Raffaello GaliottoDesigner
CASE HISTORIES
132
RELAZIONE FINANZIARIA ANNUALE 2016
133

2017 ANNUAL REPORT
135134
INDEPENDENT
AUDITORS’REPORT

2017 ANNUAL REPORT
137136

2017 ANNUAL REPORT
139138

140

BIESSE S.P.A. Headquarters Via della Meccanica, 16 61122 Pesaro - Italy biessegroup.com

BIESSEGROUP.COM