annual report - borregaard
TRANSCRIPT

2020ANNUAL REPORT

2 THE BORREGAARD GROUP
The Borregaard Group .................................................................................4
Message from the CEO ...............................................................................6
The Board of Directors ................................................................................8
Report of the Board of Directors .............................................................10
Corporate governance ...............................................................................18
Sustainability and corporate responsibility ...........................................29
The Group Executive Management ........................................................76
Borregaard Group consolidated financial statements ........................79
Borregaard ASA financial statements ................................................. 127
Statement from the Board of Directors .............................................. 134
Auditor´s report ........................................................................................ 135
Historical key figures .............................................................................. 139
Independent accountant’s assurance report
on Sustainability reporting ..................................................................... 140
Alternative performance measures ..................................................... 142
Group directory ........................................................................................ 143
CONTENTS

THE BORREGAARD GROUP 54 THE BORREGAARD GROUP
THE BORREGAARD GROUPBorregaard operates one of the world’s most advanced biorefineries. The Group provides sustainable products and solutions based on renewable raw materials and unique competence.
/ 1 Not including LignoTech South Africa and LignoTech Ibérica/ 2 See Note 6 to the Borregaard Group consolidated financial statements regarding treatment of the LignoTech South Africa joint venture.
/ 3 Alternative performance measures, see page 142 for definition.
KEY FIGURES
H1/LTI = number of lost time injuries per million hours workedH2/TRI = Total recordable injuries per million hours worked
2,000
1,600
1,400
1,800
1,000
1,200
800
600
400
200
0
GWh
NOx emissionsSO2 emissions
ElectricityHeat
OPERATING REVENUES
NOx AND SO2 EMISSIONS BORREGAARD GROUP
ENERGY CONSUMPTION BORREGAARD GROUP
EBITDA3 ROCE3
1,600
1,400
1,000
1,200
800
600
400
200
0
mt/year
SO2 EMISSIONS SARPSBORG SITE
2013 2014 2015 2016 2017
*Biopolymers and biovanillin ** Metric tonnes dry solids
GROSS AVERAGE PRICE
BIOS
OLUT
IONS
*BI
OMAT
ERIA
LS*
400
300
200
100
0
mt/year
2013 2014 2015 2016 2017
160,000
140,000
100,000
120,000
80,000
60,000
40,000
20,000
0
mt/year
2013 2014 2015 2016 2017
CO2 EMISSIONS BORREGAARD GROUPEARNINGS PER SHARE
SALES REVENUES BY GEOGRAPHICAL AREA 2020
18
16
12
10
14
8
6
4
2
0
SICK LEAVE SARPSBORG SITE
2013 2014 2015 2016 2017
INJURY RATE BORREGAARD GROUP
6%
5%
4%
3%
1%
2%
0%
2013 2014 2015 2016 2017
SICK LEAVE BORREGAARD GROUP
2012 2013 2014 2015 2016
6%
5%
4%
3%
1%
2%
0%
5,000
4,000
3,000
2,000
1,000
0
NOK mill CAGR 4.4%
4,618 4,7855,063
5,328
4,492
2016 2017 2018 2019 2020
8
4
6
2
0
NOK
2016 2017 2018
5.66
4.76
2.25
2019 2020
4.17
2.30
4.36
2.50
5.55
3.50
RoW 1%
Americas 27%
Asia 20%
Europe 52%
SALES VOLUME4
500
400
200
250
300
350
450
100
150
0
50
‘000 mtds
2015 2016 2017 2018
444 450 468
2020
470
416
GROSS AVERAGE PRICE SALES VOLUME
180
160
120
80
100
40
140
60
20
0
‘000 mt
2016 2017 2018
150.7 150.1
2019 2020
153.1 148.4152.3
EMISSIONS TO WATER SARPSBORG SITE
COD (mt/day – organic material)Copper (kg/day)
ROCE 2
%
22
20
18
16
14
15.6%
20.5%
19.5%
16.9%16.5%
2011 2012 2013 2014 2015
100
80
60
40
20
0
12,5
10
7,5
5
2,5
0
mt/day kg/day
2013 2014 2015 2016 2017
%
15
20
10
5
0
21.7%19.1%
12.7%10.5% 11.4%
2016 2017 2018 2019 2020
25
NOK per mtds**
8,000
7,000
3,000
5,000
4,000
6,000
2016 2017 2018 2019 2020
5,618 5,6546,166
6,951
5,684
1,000
0
2,000
NOK per mt**
12,000
10,000
8,000
4,000
6,000
2,000
02016 2017 2018 2019 2020
9,99210,589 10,337 10,665 10,678
GJ/TAD Cellulose
26
25
22
23
24
20
21
2014 2015 2016 2017 2018
25.4
23.9
22.7
21.9
21.1
95 97 99 01 03 05 07 09 11 13 15 17
OBS årstalli �or
UTGÅR 2018
ROCE3
Minimum target over a business cycle
NOK mill
2016 2017 2018 2019
EBITDA3 EBITDA margin3 (%)
1,200
1,000
800
400
600
1,021 1,0
55
200
0
%
24%
20%
16%
8%
4%
0%
22.8%
18.9%19.9%
21.2%22.7%
LTI = number of lost time injuries per million hours workedTRI = Total recordable injuries per million hours worked
Cash flow from operating activities
CASH FLOW FROM OPERATING ACTIVITIES
1,200
1,000
600
800
400
200
0
NOK mill
2016 2017 2018 2019 2020
780
558
697
886
1,081
EBITDA1
Earnings per shareDividend
*Speciality cellulose and cellulose fibrils ** Metric tonnes
903 1,0
07
2020
1,132
2.00
BORREGAARD IN A NUTSHELL• A biorefinery with high value-added • Specialisation in global niches • Strong innovation ability and continuous improvement • Competence as the main competitive advantage
A BIOREFINERY WITH HIGH VALUE-ADDEDThe Group’s business model is closely linked to the integrated nature of its biorefinery in Norway, which utilises the three key components of wood – cellulose fibres, lignin and sugars – to produce a diversified portfolio of products. The biorefinery utilises 82 percent of the feedstock to make
biochemicals and biomaterials that can replace oil-based products. Most of the remaining biomass is converted to energy used in production processes.
In addition to its biorefinery in Sarpsborg, Borregaard has five1 production sites outside Norway dedicated to producing lignin-based products. The company also has sales offices in 13 countries in Europe, Asia and the Americas serving its global customer base. At the end of 2020, the Group had 1,0912 full-time equivalent (FTE) employees.
SUSTAINABILITY INTEGRATED IN STRATEGYBorregaard provides sustainable products and solutions with a documented favourable environmental impact which improve the customers’ climate footprint. Borregaard has also committed to science-based targets (SBTi) to further reduce greenhouse gas emissions and strengthen its sustainability platform.
Borregaard’s business model and products are well positioned to support delivery of the UN’s Sustainability Development Goals (SDGs). The company has prioritised six SDGs based on its ability to contribute to solving these global challenges (see pages 33-34).
SPECIALISATION IN GLOBAL NICHESBorregaard is a supplier of specialised biochemicals and biomaterials to a global customer base. The Group’s main products are biopolymers and biovanillin from lignin, speciality cellulose, cellulose fibrils, fine chemical intermediates and second-generation bioethanol. The products are used in a variety of applications in sectors such as construction and building materials, feed and agriculture, food and pharma, personal care, batteries, biofuel, textiles and various other industries.
The Group’s strong market positions have been developed through in-depth understanding of its markets, production of advanced and specialised products and local presence in the form of a global sales and marketing organisation.
COMPETENCE AS THE MAIN COMPETITIVE ADVANTAGE Borregaard is a competence-driven company with production, research and development (R&D) and sales and marketing as its core competencies. To maintain its leading position, Borregaard has a strong focus on training programmes and cooperation between the various disciplines.
Borregaard has a leading research centre combining various chemicals disciplines, biotechnology and micro biology, developing new or improved products, applications and production technologies. The Group had 89 employees in R&D as of 31 December 2020.
BORREGAARD’S THREE BUSINESS SEGMENTSBioSolutions develops, produces and sells biopolymers and biovanillin from lignin. Biopolymers are used in a wide range of end-market applications, such as agrochemicals, batteries, industrial binders and construction. Biovanillin is supplied to flavour and fragrance companies, as well as to the food and beverage industry.
BioMaterials develops, produces and sells speciality cellulose mainly for use as a raw material in the production of cellulose ethers, cellulose acetate and other speciality products. BioMaterials also includes cellulose fibrils for industrial applications, which is in the commercialisation phase.
Fine Chemicals consists of fine chemical intermediates mainly for contrast agents and second-generation bioethanol.
BioSolutionsLargest supplier and technology leader in lignin-based biopolymers with global markets. Only producer of wood-based vanillin.
BioMaterialsLeading global speciality cellulose supplier. Pioneer in cellulose fibrils.
Fine ChemicalsLeading producer of fine chemical intermediates for contrast agents, significant producer of 2nd generation bioethanol.

76 MESSAGE FROM THE CEOMESSAGE FROM THE CEO
Borregaard’s diversified market strategy has again proven its value as a safety net during difficult financial times. This strategy enables us to reduce our exposure to cyclical market segments through reallocation of volumes across several applications and geographical markets. We have experienced reduced demand in some biopolymers sectors as well as for certain speciality cellulose grades. Overall, we have had only minor interruptions in our operations as a result of the pandemic.
SUSTAINABLE BUSINESS Borregaard has been recognised as a global leader in corporate climate action, and for the third year in a row we achieved a place on the prestigious Climate Change “A-list” of the global environmental non-profit organisation, CDP, for our sustainability reporting. Only 2.8% of the reporting companies made this list in 2020.
Borregaard has prioritised six of the seventeen Sustainable Development Goals set out in the UN’s 2030 Agenda for Sustainable Development where our concepts and products have a positive impact; zero hunger, economic growth, innovation, responsible production, climate action and life on land. These are used as a framework for guiding, communicating and reporting on the company’s strategy, goals and activities.
Utilising the different components of wood, we produce solutions for a variety of applications in sectors such as construction and building materials, feed and agriculture, food and pharma, personal care, batteries, biofuel and textiles. We attach great importance to sourcing wood from forests that are certified and managed in a sustainable manner.
In 2008, Borregaard started working with an independent third party, Norsus, to conduct life cycle assessments (LCAs), mapping the environmental impact from raw materials to finished products. The study has since been updated on several occasions, most recently in 2020. The LCA confirms that the climate footprint of our products and processes have diminished over time. Comparisons with competing products also confirm that Borregaard’s wood-based alternatives provide a significantly better environmental performance than oil-based alternatives.
Borregaard’s products solve different challenges for different customers. Most customers buy our products primarily for their performance. However, some markets are showing signs of a shift towards an increased emphasis on sustainable procurement. Several customers buy our products because of their low carbon footprint, while customers operating in consumer markets prefer
MESSAGE FROM THE CEO2020 has been a challenging year due to the Covid-19 pandemic. In these special times, our focus has been on putting health and safety first in our daily operations.
Covid-19 effects will continue into 2021 and we expect that there will still be some time before the world economy is back to normal. In the meantime, we will maintain all the procedures implemented to safeguard the entire value chain and limit the risk of infection throughout our global organisation.
using natural ingredients or ingredients made from natural raw materials. Health and safety aspects are also important to our customers. Borregaard’s wood-based products represent a non-toxic substitute for chemicals with negative health exposure.
Borregaard has committed to major reductions in greenhouse gas emissions in the years to come. The Science Based Targets Initiative has approved our targets to reduce greenhouse gas emissions, which are in line with the ambitions in the Paris Agreement.
OUR WAY FORWARD In September 2020, Borregaard hosted a Capital Markets Day primarily focused on strategy and sustainability issues. A key consideration in the development of our revised strategic priorities has been the reduced raw material supply base in BioSolutions as a result of discontinued operations in South Africa and Spain. Both these lignin raw material sources were based on hardwood with limited potential for making speciality biopolymers. Therefore, we see this as an opportunity to sharpen our strategy and fully concentrate on specialisation and innovation within this business area.
Our strategic priorities for the coming years will be:Specialisation and diversification within BioSolutions• Specialisation through innovation and market
development• Balance market risk through diversification of the
product portfolio• Timing of further volume expansion guided by
demand development and profitability
Increased value added from the unique Sarpsborg biorefinery• Leverage high-value lignin raw material base in
biopolymers and biovanillin• Enhance product mix in speciality cellulose and
bioethanol• Strong focus on innovation and productivity efforts
Development of the cellulose fibrils business• Continued market development across multiple
applications and geographies• Timing of second step expansion guided by demand
development
Sustainability • Continued emphasis on environmental, social and
governance aspects along the entire value chain
We continue to see business opportunities in several markets where our bio-based products can contribute to improved sustainability in different value chains. This work also includes market introduction of radical innovations like our cellulose fibrils. Targeted investments improving our ability to make higher value-added products have been, and will continue to be, a cornerstone in the development of Borregaard over time.
Kind regards,
Per A. Sørlie, President and CEO
98 THE BOARD OF DIRECTORSTHE BOARD OF DIRECTORS
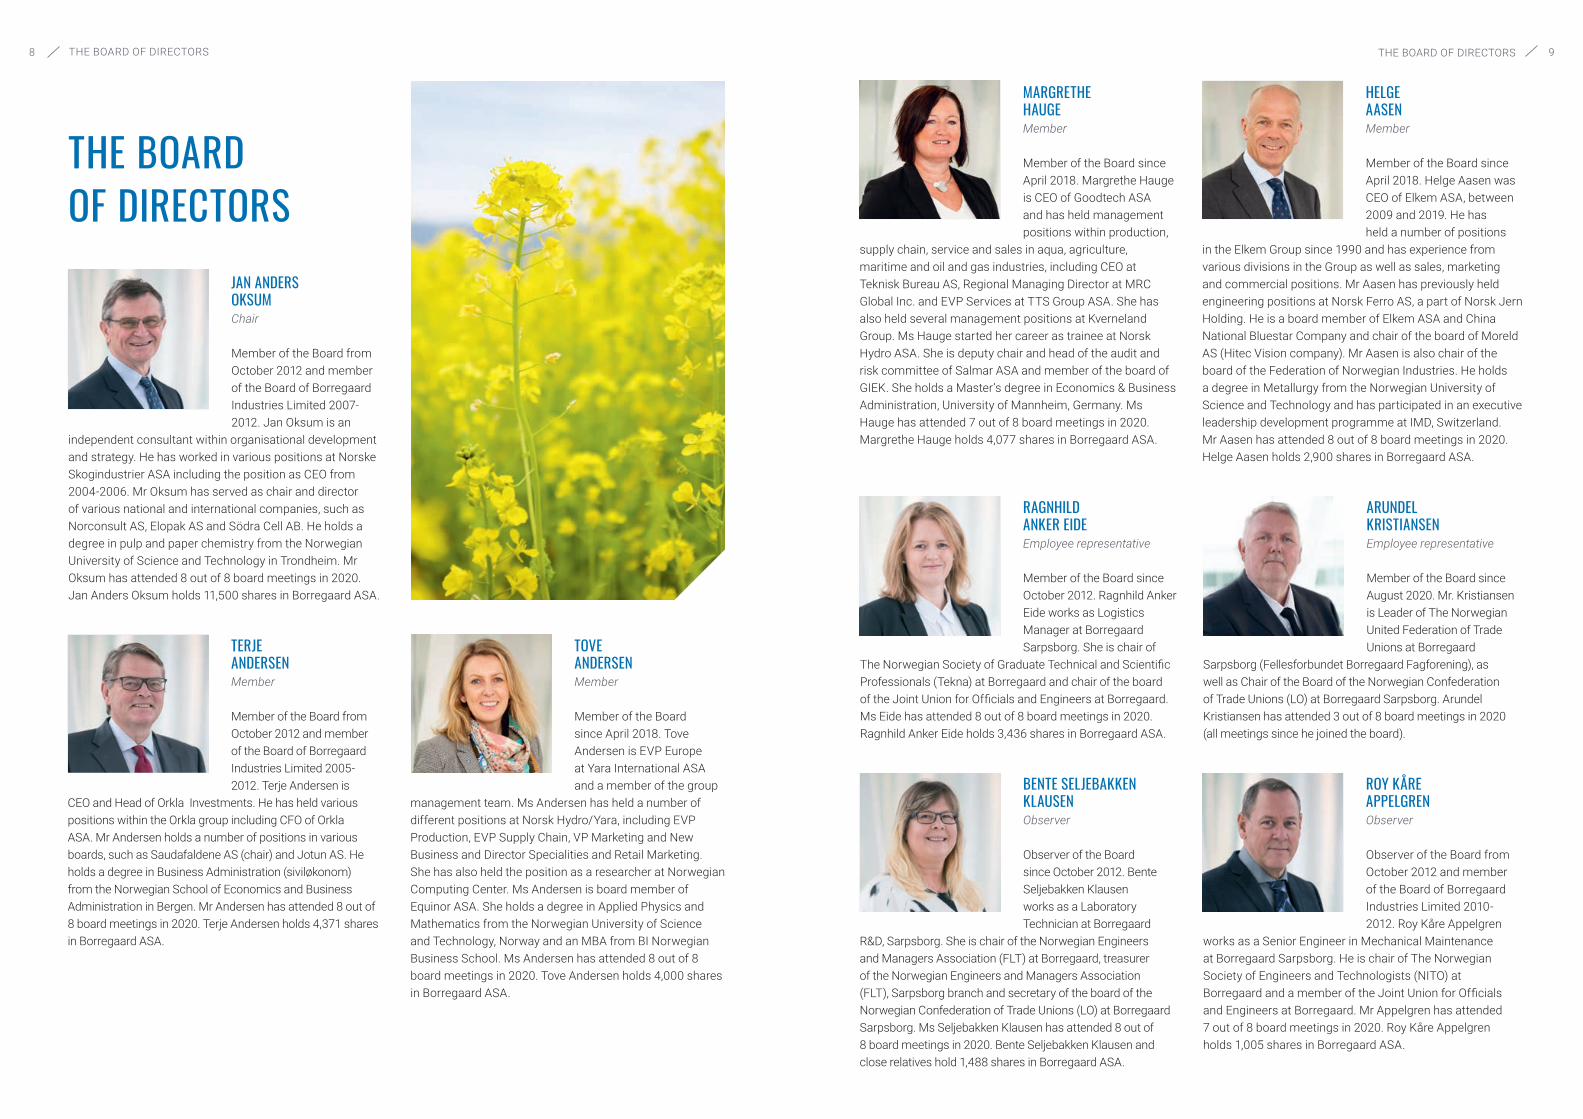
TOVE ANDERSEN Member
Member of the Board since April 2018. Tove Andersen is EVP Europe at Yara International ASA and a member of the group
management team. Ms Andersen has held a number of different positions at Norsk Hydro/Yara, including EVP Production, EVP Supply Chain, VP Marketing and New Business and Director Specialities and Retail Marketing. She has also held the position as a researcher at Norwegian Computing Center. Ms Andersen is board member of Equinor ASA. She holds a degree in Applied Physics and Mathematics from the Norwegian University of Science and Technology, Norway and an MBA from BI Norwegian Business School. Ms Andersen has attended 8 out of 8 board meetings in 2020. Tove Andersen holds 4,000 shares in Borregaard ASA.
MARGRETHE HAUGE Member
Member of the Board since April 2018. Margrethe Hauge is CEO of Goodtech ASA and has held management positions within production,
supply chain, service and sales in aqua, agriculture, maritime and oil and gas industries, including CEO at Teknisk Bureau AS, Regional Managing Director at MRC Global Inc. and EVP Services at TTS Group ASA. She has also held several management positions at Kverneland Group. Ms Hauge started her career as trainee at Norsk Hydro ASA. She is deputy chair and head of the audit and risk committee of Salmar ASA and member of the board of GIEK. She holds a Master’s degree in Economics & Business Administration, University of Mannheim, Germany. Ms Hauge has attended 7 out of 8 board meetings in 2020. Margrethe Hauge holds 4,077 shares in Borregaard ASA.
ARUNDEL KRISTIANSEN Employee representative
Member of the Board since August 2020. Mr. Kristiansen is Leader of The Norwegian United Federation of Trade Unions at Borregaard
Sarpsborg (Fellesforbundet Borregaard Fagforening), as well as Chair of the Board of the Norwegian Confederation of Trade Unions (LO) at Borregaard Sarpsborg. Arundel Kristiansen has attended 3 out of 8 board meetings in 2020 (all meetings since he joined the board).
BENTE SELJEBAKKEN KLAUSEN Observer
Observer of the Board since October 2012. Bente Seljebakken Klausen works as a Laboratory Technician at Borregaard
R&D, Sarpsborg. She is chair of the Norwegian Engineers and Managers Association (FLT) at Borregaard, treasurer of the Norwegian Engineers and Managers Association (FLT), Sarpsborg branch and secretary of the board of the Norwegian Confederation of Trade Unions (LO) at Borregaard Sarpsborg. Ms Seljebakken Klausen has attended 8 out of 8 board meetings in 2020. Bente Seljebakken Klausen and close relatives hold 1,488 shares in Borregaard ASA.
RAGNHILD ANKER EIDE Employee representative
Member of the Board since October 2012. Ragnhild Anker Eide works as Logistics Manager at Borregaard Sarpsborg. She is chair of
The Norwegian Society of Graduate Technical and Scientific Professionals (Tekna) at Borregaard and chair of the board of the Joint Union for Officials and Engineers at Borregaard. Ms Eide has attended 8 out of 8 board meetings in 2020. Ragnhild Anker Eide holds 3,436 shares in Borregaard ASA.
HELGE AASEN Member
Member of the Board since April 2018. Helge Aasen was CEO of Elkem ASA, between 2009 and 2019. He has held a number of positions
in the Elkem Group since 1990 and has experience from various divisions in the Group as well as sales, marketing and commercial positions. Mr Aasen has previously held engineering positions at Norsk Ferro AS, a part of Norsk Jern Holding. He is a board member of Elkem ASA and China National Bluestar Company and chair of the board of Moreld AS (Hitec Vision company). Mr Aasen is also chair of the board of the Federation of Norwegian Industries. He holds a degree in Metallurgy from the Norwegian University of Science and Technology and has participated in an executive leadership development programme at IMD, Switzerland. Mr Aasen has attended 8 out of 8 board meetings in 2020. Helge Aasen holds 2,900 shares in Borregaard ASA.
ROY KÅRE APPELGREN Observer
Observer of the Board from October 2012 and member of the Board of Borregaard Industries Limited 2010-2012. Roy Kåre Appelgren
works as a Senior Engineer in Mechanical Maintenance at Borregaard Sarpsborg. He is chair of The Norwegian Society of Engineers and Technologists (NITO) at Borregaard and a member of the Joint Union for Officials and Engineers at Borregaard. Mr Appelgren has attended 7 out of 8 board meetings in 2020. Roy Kåre Appelgren holds 1,005 shares in Borregaard ASA.
TERJE ANDERSEN Member
Member of the Board from October 2012 and member of the Board of Borregaard Industries Limited 2005-2012. Terje Andersen is
CEO and Head of Orkla Investments. He has held various positions within the Orkla group including CFO of Orkla ASA. Mr Andersen holds a number of positions in various boards, such as Saudafaldene AS (chair) and Jotun AS. He holds a degree in Business Administration (siviløkonom) from the Norwegian School of Economics and Business Administration in Bergen. Mr Andersen has attended 8 out of 8 board meetings in 2020. Terje Andersen holds 4,371 shares in Borregaard ASA.
JAN ANDERS OKSUM Chair
Member of the Board from October 2012 and member of the Board of Borregaard Industries Limited 2007-2012. Jan Oksum is an
independent consultant within organisational development and strategy. He has worked in various positions at Norske Skogindustrier ASA including the position as CEO from 2004-2006. Mr Oksum has served as chair and director of various national and international companies, such as Norconsult AS, Elopak AS and Södra Cell AB. He holds a degree in pulp and paper chemistry from the Norwegian University of Science and Technology in Trondheim. Mr Oksum has attended 8 out of 8 board meetings in 2020. Jan Anders Oksum holds 11,500 shares in Borregaard ASA.
THE BOARD OF DIRECTORS
THE BORREGAARD GROUP 1110 REPORT OF THE BOARD DIRECTORS
within diversity and equal opportunities in a separate report that comply with Norwegian laws. The report is found at www.borregaard.com.
The Group has committed to major reductions in greenhouse gas emissions. The Science Based Targets Initiative approved Borregaard’s targets to reduce greenhouse gas emissions (scope 1 and 2) by 53% by 2030 and 100% by 2050, from a 2009 base year. The targets are in line with the ambitions in the Paris Agreement and well below the level required to limit the global temperature increase to 2°C. For the third year in a row, Borregaard achieved an “A” rating from the global environmental non-profit organisation CDP. This is a recognition of Borregaard’s work to develop the low carbon economy further and reduce emissions and climate risk. Efforts to increase market awareness of Borregaard’s sustainable products have been a prioritised activity in 2020. Documentation of environmental, social and governance (ESG) aspects through life cycle analyses and environmental product declarations (EPD) is an integral part of these efforts.
Since 2015, Borregaard has invested close to NOK 2 billion in expansion projects. The main initiatives have been a new biopolymer plant in Florida, an upgrade of the biopolymer operation in Sarpsborg, the instalment of Borregaard’s Ice Bear technology for high purity speciality cellulose and a new commercial size cellulose fibrils plant. In addition, an expansion of the biovanillin capacity in Sarpsborg will be completed in 2021. The positive impact from the investments continued to materialise in 2020, especially from sales of highly specialised cellulose grades utilising the Ice Bear technology as well as cost savings and increased sales of dried products related to the upgraded biopolymer operation in Sarpsborg. The ramp-up of sales volume from the new biopolymer plant in Florida continued according to plan. However, the financial performance of the operation is still below expectations. Sales of cellulose fibrils continued to grow from a low level. Innovation efforts contributed to an improved innovation rate2 (17.7% in 2020, see page 45) and strengthened market position. In 2020, Borregaard’s gross expenditure on research and innovation was NOK 193 million, representing 3.6% of the Group’s operating revenues. In 2020, Borregaard recognised NOK 40 million of public funding for ongoing research projects, both from the Norwegian Government and the European Union.
Digitalisation is an important part of Borregaard’s improvement efforts. In 2020, the Group implemented a new technology platform which will be an important enabler for further digitalisation. Borregaard’s competence in areas like analytics and data management has been strengthened, both through recruitment and competence development. Several projects are ongoing to improve planning, execution and supervision of plant maintenance, including the use of artificial intelligence to analyse data. Implementation of a new customer relationship management system, development of a new web solution for digital marketing and introduction of better collaboration tools have contributed to an improved sales and marketing process.
Environment, health and safety (EHS) are integral parts of Borregaard’s business model. In 2020, the total recordable injuries per million worked hours (TRIF) were at an all-time low of 5.0 (8.4)3. Sick leave was 3.7% (3.6%). Greenhouse gas emissions (scope 1 and scope 2) decreased by 3.7% in the Group compared with 2019 mainly as a result of using more electricity for steam generation at the biorefinery in Sarpsborg compared with previous years. Installation of low-NOx technology in the bioboiler at the biorefinery was the main reason for a 37% reduction of NOx emissions. Emissions of organic material (COD) to the river Glomma, have been reduced by 42% since 2010. However, COD emissions increased to 57 t/day (55 t/day) in 2020, mainly due to changes in product mix and increased production volume. See the Sustainability and Corporate Responsibility Report from page 28.
Borregaard’s strategic priorities are to capitalise on the completed and on-going expansion investments, increase specialisation and diversification of the product portfolio in BioSolutions, increase value-added from the Sarpsborg biorefinery, further develop the market for cellulose fibrils, and at the same time continue the emphasis on ESG aspects along the entire value chain.
MARKET TRENDSBorregaard’s diversified product portfolio and global market exposure provide flexibility and an inherent hedge against market fluctuations. During the Covid-19 pandemic, the diversified market strategy has proven its value as a safety net, and enabled Borregaard to reduce the exposure to cyclical market segments through reallocation of volumes across several applications and geographical markets.
/ 2 Innovation rate = sales of new products and applications introduced during the previous five years./ 3 Figures in parentheses are for the corresponding period in the previous year./ 1 Alternative performance measures, see page 142 for definition.
REPORT OF THE BOARD OF DIRECTORSBorregaard’s financial performance improved in 2020 with an all-time high EBITDA1 in a challenging business environment caused by the Covid-19 pandemic. During the year, the positive sustainability aspects of Borregaard’s business model has received increasing attention and recognition from the Group’s stakeholders. The Board of Directors would like to thank all Borregaard employees for their contributions to the strong performance in a demanding year.
OVERVIEWBorregaard is a leading global provider of sustainable products and solutions within selected niches of biochemicals, biomaterials and fine chemicals. The Group operates one of the world’s most advanced biorefineries with high value creation through high utilisation of the wood raw material base. Borregaard’s strong innovation competence contributes to continuous specialisation of existing operations as well as the development of new products and applications.
The head office and main production facilities are in Sarpsborg, Norway, where industrial activity based on sulphite pulping started in 1889. The Group has manufacturing operations and sales offices in 13 countries. See Note 7 to the Financial Statements of Borregaard ASA.
HIGHLIGHTS 2020 Borregaard has monitored the Covid-19 situation closely in 2020 and has established emergency measures and implemented procedures to limit the risk of infection
throughout the organisation. In line with the Group’s values, safety and health have been put first. The discontinued raw material supply to LignoTech South Africa and reduced demand in some biopolymers sectors and certain cellulose grades affected sales and results negatively. On the other hand, the increased sales of bioethanol to disinfectants contributed positively. Logistical and other practical challenges have been managed without significant adverse effects on deliveries and production.
Sustainability is a key element in Borregaard’s business model and one of the Group’s three core values. Borregaard promotes a sustainable development, both through minimising negative environmental impact from production, as well as maximising positive environmental impact in various value chains. Borregaard’s business model and products are well positioned to support delivery of the UN’s Sustainability Development Goals (SDGs). The company has prioritised six SDGs based on its ability to contribute to solving these global challenges (see pages 33-34). Borregaard has presented its systematic work

1312 REPORT OF THE BOARD OF DIRECTORS REPORT OF THE BOARD OF DIRECTORS
For BioSolutions, discontinued raw material supply from Sappi Saiccor (South Africa) and Sniace (Spain) in addition to reduced supply from Park Falls, have impacted the sales volume negatively in 2020. The reduced supply has primarily impacted sales to concrete admixtures and low-value industrial applications. Sales volume of specialities increased even though sales to oil field chemicals dropped significantly as a result of reduced demand.
In BioMaterials, sales volume was reduced from last year mainly due to Covid-19 effects. However, product mix improved, and sales of highly specialised grades increased. There has been a reduced demand growth for cellulose ethers to construction due to the Covid-19 pandemic. At the same time the strong growth within food and pharma applications has continued. The impact of low sales prices for textile cellulose has been limited due to reduced exposure to this market segment. The sales of cellulose fibrils are growing.
For Fine Chemicals, deliveries of fine chemical intermediates increased, but with a weaker product mix. Both production and sales volume increased for bioethanol. The product mix improved mainly because of extraordinary sales to disinfectants in the 2nd quarter. In the 2nd half of 2020 deliveries have primarily been to biofuel as this market has normalised after the Covid-19 related reduction in the 2nd quarter.
FINANCIAL PERFORMANCE IN 2020Borregaard’s operating revenues reached NOK 5,328 million (NOK 5,063 million) in 2020. EBITDA1 increased to an all-time high of NOK 1,132 million (NOK 1,007 million). BioMaterials and Fine Chemicals had improved results, whereas BioSolutions had a decline compared with 2019.
In BioSolutions, the negative EBITDA1 effect of reduced raw material supply and lower sales volume in certain biopolymers applications as well as higher distribution costs were partly offset by an improved product mix, cost reductions and favourable net currency effects. For BioMaterials, EBITDA1 improved due to lower wood and energy costs, higher production volume, improved product mix and a positive net currency impact. In Fine Chemicals, the result for bioethanol improved significantly in 2020 due to higher sales and production volume, increased product mix and an extraordinary demand from the disinfectants market in the 2nd quarter. The result for fine chemical intermediates was in line with 2019. The total net currency impact on EBITDA1 was approximately NOK 30 million compared with 2019. Other income and expenses1 were NOK -116 million (NOK -27 million) due to impairment of assets and restructuring costs mainly related to LignoTech South Africa and LignoTech Ibérica and environmental accruals for preventive measures related to former operations at the Sarpsborg site.
Operating profit was NOK 568 million (NOK 558 million). Net financial items amounted to NOK -72 million (NOK-91 million). Profit before tax was NOK 496 million (NOK 467 million). Tax expense was NOK -117 million (NOK -116 million), giving a tax rate of 24% (25%).
Earnings per share were NOK 4.36 (NOK 4.17). Borregaard ASA’s share price was NOK 141.80 at the end of 2020. Compared with the end of 2019, the share value increased by 53% assuming reinvestment of dividends.
CASH FLOW AND FINANCIAL STRUCTURECash flow from operating activities was NOK 886 million (NOK 697 million). The improvement was due to a positive cash effect of an increased EBITDA1, a less unfavourable development in net working capital and lower tax payments. Investments amounted to NOK 503 million (NOK 583 million). Replacement investments were NOK 344 million (NOK 370 million). Expansion investments1 totalled NOK 159 million (NOK 213 million), where the largest expenditure was related to the biovanillin capacity expansion.
Dividend of NOK 229 million (NOK 224 million) was paid out in the 2nd quarter. Realised effect of hedging of net investments in subsidiaries was NOK 10 million (NOK -26 million) in 2020. The Group has sold and repurchased treasury shares with a net payment of NOK 27 million (NOK 25 million).
On 31 December 2020, the Group had net interest-bearing debt1 totalling NOK 1,794 million (NOK 1,876 million), a decrease of NOK 82 million from year-end 2019. The Group was well capitalised with an equity ratio1 of 53.9% and a leverage ratio1 of 1.58 (1.86).
BUSINESS SEGMENTSBioSolutions’ operating revenues reached NOK 3,082 million (NOK 2,982 million) in 2020. EBITDA1 was NOK 632 million (NOK 647 million). Higher distribution costs were partly offset by improved product mix for biopolymers, cost reductions and favourable net currency effects.
Discontinued raw material supply from Sappi Saiccor, Sniace and reduced supply from Park Falls (former Flambeau) were the main reasons for an 11% lower sales volume in 2020 compared with 2019. Consequently, sales to concrete admixtures and certain low-value industrial applications have been reduced. Sales to oil field chemicals dropped significantly as a result of reduced demand. The average price in sales currency was 6% higher than in 2019, mainly due to an improved product mix.
Sales volume from the Florida plant continued to increase in accordance with the ramp-up plan, and the financial result improved in 2020. However, the result is still unsatisfactory, and measures are taken to improve product mix and reduce costs.
H1/LTI = number of lost time injuries per million hours workedH2/TRI = Total recordable injuries per million hours worked
2,000
1,600
1,400
1,800
1,000
1,200
800
600
400
200
0
GWh
NOx emissionsSO2 emissions
ElectricityHeat
OPERATING REVENUES
NOx AND SO2 EMISSIONS BORREGAARD GROUP
ENERGY CONSUMPTION BORREGAARD GROUP
EBITDA3 ROCE3
1,600
1,400
1,000
1,200
800
600
400
200
0
mt/year
SO2 EMISSIONS SARPSBORG SITE
2013 2014 2015 2016 2017
*Biopolymers and biovanillin ** Metric tonnes dry solids
GROSS AVERAGE PRICE
BIOS
OLUT
IONS
*BI
OMAT
ERIA
LS*
400
300
200
100
0
mt/year
2013 2014 2015 2016 2017
160,000
140,000
100,000
120,000
80,000
60,000
40,000
20,000
0
mt/year
2013 2014 2015 2016 2017
CO2 EMISSIONS BORREGAARD GROUPEARNINGS PER SHARE
SALES REVENUES BY GEOGRAPHICAL AREA 2020
18
16
12
10
14
8
6
4
2
0
SICK LEAVE SARPSBORG SITE
2013 2014 2015 2016 2017
INJURY RATE BORREGAARD GROUP
6%
5%
4%
3%
1%
2%
0%
2013 2014 2015 2016 2017
SICK LEAVE BORREGAARD GROUP
2012 2013 2014 2015 2016
6%
5%
4%
3%
1%
2%
0%
5,000
4,000
3,000
2,000
1,000
0
NOK mill CAGR 4.4%
4,618 4,7855,063
5,328
4,492
2016 2017 2018 2019 2020
8
4
6
2
0
NOK
2016 2017 2018
5.66
4.76
2.25
2019 2020
4.17
2.30
4.36
2.50
5.55
3.50
RoW 1%
Americas 27%
Asia 20%
Europe 52%
SALES VOLUME4
500
400
200
250
300
350
450
100
150
0
50
‘000 mtds
2015 2016 2017 2018
444 450 468
2020
470
416
GROSS AVERAGE PRICE SALES VOLUME
180
160
120
80
100
40
140
60
20
0
‘000 mt
2016 2017 2018
150.7 150.1
2019 2020
153.1 148.4152.3
EMISSIONS TO WATER SARPSBORG SITE
COD (mt/day – organic material)Copper (kg/day)
ROCE 2
%
22
20
18
16
14
15.6%
20.5%
19.5%
16.9%16.5%
2011 2012 2013 2014 2015
100
80
60
40
20
0
12,5
10
7,5
5
2,5
0
mt/day kg/day
2013 2014 2015 2016 2017
%
15
20
10
5
0
21.7%19.1%
12.7%10.5% 11.4%
2016 2017 2018 2019 2020
25
NOK per mtds**
8,000
7,000
3,000
5,000
4,000
6,000
2016 2017 2018 2019 2020
5,618 5,6546,166
6,951
5,684
1,000
0
2,000
NOK per mt**
12,000
10,000
8,000
4,000
6,000
2,000
02016 2017 2018 2019 2020
9,99210,589 10,337 10,665 10,678
GJ/TAD Cellulose
26
25
22
23
24
20
21
2014 2015 2016 2017 2018
25.4
23.9
22.7
21.9
21.1
95 97 99 01 03 05 07 09 11 13 15 17
OBS årstalli �or
UTGÅR 2018
ROCE3
Minimum target over a business cycle
NOK mill
2016 2017 2018 2019
EBITDA3 EBITDA margin3 (%)
1,200
1,000
800
400
600
1,021 1,0
55
200
0
%
24%
20%
16%
8%
4%
0%
22.8%
18.9%19.9%
21.2%22.7%
LTI = number of lost time injuries per million hours workedTRI = Total recordable injuries per million hours worked
Cash flow from operating activities
CASH FLOW FROM OPERATING ACTIVITIES
1,200
1,000
600
800
400
200
0
NOK mill
2016 2017 2018 2019 2020
780
558
697
886
1,081
EBITDA1
Earnings per shareDividend
*Speciality cellulose and cellulose fibrils ** Metric tonnes
903 1,0
07
2020
1,132
2.00
/ 1 Alternative performance measures, see page 142 for definition. / 4 Average sales price and sales volume reflect 100% of sales and volume from the J/V in South Africa. Average sales price is calculated using actual FX rates, excluding hedging impact. / 1 Alternative performance measures, see page 142 for definition.

1514 REPORT OF THE BOARD OF DIRECTORS
standing relationships with customers and suppliers across different geographic areas and industry sectors, the company is well placed to manage its ongoing business risks. With a strong equity ratio and good liquidity, the company has adequate resources to continue its operations for the foreseeable future. Hence, in accordance with the Norwegian Accounting Act §3-3a, we confirm that the financial statements have been prepared under the assumption of a going concern. See Note 28 for further disclosure of financial and operational risks.
REMUNERATION OF GROUP EXECUTIVE MANAGEMENTThe Board of Directors has established a Compensation Committee which deals with all important matters related to salary and other remuneration of senior executives before such matters are decided by the Board. In accordance with Norwegian legislation, the Board has also established guidelines for salary and other remuneration of senior executives. The Guidelines for 2020 are included in Note 9 to the consolidated financial statements.
SHAREHOLDER MATTERSAll shares in Borregaard ASA have equal rights and are freely traded. The company has established a programme enabling employees to purchase shares at a discounted price. In connection with this programme and the share option programme for the Group Executive Management and other key employees, Borregaard ASA held 384,678 treasury shares as of 31 December 2020 and 455,636 as of 17 March 2021. See Note 9 regarding share options.
Total number of shares outstanding as of 31 December 2020 was 100 million, including 384,678 treasury shares. Total number of shareholders was 7,175. Borregaard ASA’s share price was NOK 141.80 at the end of 2020, compared with NOK 95.00 at the end of 2019.
OTHER MATTERS AND SUBSEQUENT EVENTSShares to employeesAs part of the employee share programme, Borregaard sold a total of 173,383 shares to employees in February 2021. The share price was NOK 121.71 per share after deduction of a 25% discount. See notifications to the Oslo Stock Exchange on 8, 15 and 24 February 2021.
Share options issuedIn February 2021, 249,000 share options at a strike price of NOK 183.20 were granted under the long-term incentive programme. The options will expire after five years, the vesting period is three years and the options may be exercised during the last two years. See notification to the
Oslo Stock Exchange on 16 February 2021.
Treasury shares From 22 February to 17 March 2021, Borregaard has purchased 250,000 shares under a programme aimed at repurchasing a total of 250,000 own shares. The total amount of treasury shares held by Borregaard as of 17 March 2021 is 455,636. See notifications to the Oslo Stock Exchange from 19 February 2021 and onwards.
There have been no events after the balance sheet date that have had a material impact on the financial statements, or the assessments carried out.
ALLOCATION OF PROFITThe Board has proposed a dividend for 2020 of NOK 2.50 (NOK 2.30) per share to the General Meeting. This corresponds to 57% of net earnings per share for the Group. Dividend payment is estimated at NOK 249 million. The exact amount will depend on the number of treasury shares held at the date of the General Meeting.
In 2020, Borregaard ASA had a profit of NOK 250 million (NOK 232 million). Borregaard ASA is well capitalised with an equity ratio1 of 73% after pay-out of the proposed dividend. The Board proposes the following allocation (NOK million):
OUTLOOK FOR 2021 Total sales volume for BioSolutions in 2021 is forecast to decrease by approximately 10%, mainly depending on raw material supply. The reduced raw material supply and hence lower sales volume will have a positive effect on product mix and average price in sales currency. However, reduced demand in certain speciality applications, particularly oil field chemicals, is expected to continue in markets affected by the Covid-19 pandemic. The market conditions for biovanillin are expected to be unchanged, and the ongoing biovanillin capacity expansion will be completed mid-2021. The full effect of cost savings from the upgrade of the biopolymer operation in Norway will be realised from 2021.
In BioMaterials, the average price in sales currency is expected to be 2-3% below the 2020 level, mainly related to markets affected by the Covid-19 pandemic. However, total
REPORT OF THE BOARD OF DIRECTORS
Operating revenues for BioMaterials were NOK 1,732 million (NOK 1,712 million) for the full year of 2020. EBITDA1 increased to NOK 318 million (NOK 234 million). The increased EBITDA1 was due to lower wood and energy costs, higher production volume, improved product mix, a positive net currency impact and operational incidents at the Sarpsborg site in 2019. Sales of cellulose fibrils were growing, and higher sales volume and cost reductions compensated for the reduced EU Horizon 20205 grant, which ended 30 April 2020.
The average price in sales currency for BioMaterials was 1% higher than in 2019. Highly specialised grades increased to 77% (73%) of sold volume. Demand growth for cellulose ethers to construction applications were at a lower rate due to the Covid-19 pandemic. Sales to food and pharma applications continued to show strong growth. The impact of low prices for textile cellulose was limited due to reduced exposure to this market.
Operating revenues in Fine Chemicals were NOK 543 million (NOK 406 million) for the full year of 2020. EBITDA1 reached NOK 182 million (NOK 126 million).
The result for bioethanol improved significantly in 2020. An extraordinary demand from the disinfectants market in the 2nd quarter contributed to higher sales volume and improved product mix. In the 2nd half of 2020, bioethanol deliveries were mainly to the biofuel segment, as demand was normalised after the Covid-19 related reduction in the 2nd quarter. Increased production volume of bioethanol contributed to higher sales and result. The result for fine chemical intermediates was in line with 2019.
CORPORATE GOVERNANCEBorregaard’s governance systems are based on principles set out in the Norwegian Code of Conduct for Corporate Governance. Borregaard’s internal compliance board (see page 26) reviews and controls compliance matters and reports to the Board annually. See report on Corporate Governance at Borregaard (from page 18). This report is an integral part of the Report of the Board of Directors.
SUSTAINABILITY AND CORPORATE RESPONSIBILITYSustainability is an integral part of Borregaard’s business model. This is reflected in the Group’s main objective: Providing sustainable solutions based on renewable raw materials and unique competence. Borregaard’s 2020 report on sustainability and corporate responsibility
(from page 28) outlines ambitions and achievements within climate and EHS, and Borregaard’s commitment to business ethics and compliance. This report is an integral part of the Report of the Board of Directors. Borregaard’s ESG information is reported according to the GRI6 standard and is assured by an independent third party (see EY’s report on GRI from page 140). The reporting requirements for sustainable financing in EU are under development. Borregaard monitors the process and will make necessary preparations for future reporting.
FINANCIAL AND OPERATIONAL RISKSBorregaard is financially exposed to currency risk for most of its sales, primarily in USD and EUR. A substantial part of this exposure, defined as estimated net cash flow in USD and EUR, is routinely hedged with a nine-month time horizon. Subject to certain criteria being met, the hedging horizon for USD and EUR exposure may be extended up to 36 months. In 2020, substantial EUR and USD amounts were hedged within a 3-year time horizon. See Note 28.
Borregaard is also exposed to price risk for energy, wood and other strategic raw materials. There is also a supply risk for lignin raw material. In sales, all Borregaard’s business segments are exposed to price risk in international and domestic markets. Furthermore, there are production, environmental and safety risks inherently associated with the operation of manufacturing sites. To mitigate these risks, Borregaard has a strong commitment to continuous improvement throughout its worldwide operations, calling on a wide range of measures affecting both revenues and costs. Climate risk assessment comply with the Task Force on Climate-related Financial Disclosures (TCFD). The short and medium-term climate risk is considered to be low.
Credit risk for Borregaard is perceived to be modest due to the quality of its customer base and its stringent credit management policy. Short-term liquidity risk associated with cash flow fluctuations is low because Borregaard has ensured ample short-term and long-term credit facilities from a group of leading Scandinavian banks. As of 31 December 2020, the undrawn portion of available long-term facilities amounted to NOK 1,500 million.
The company’s business activities and financial position, together with the factors likely to affect its future development and performance, are set out above. With its considerable financial resources, together with long-
Dividend 249
Retained earnings 1
Total 250
/ 1 Alternative performance measures, see page 142 for definition./ 5 This project has received funding from the Bio-Based Industries Joint Undertaking (BBI) under the European Union’s Horizon 2020 research and innovation programme under grant agreement No 709746./ 6 Global Reporting Initiative. / 1 Alternative performance measures, see page 142 for definition.

1716 REPORT OF THE BOARD OF DIRECTORSREPORT OF THE BOARD OF DIRECTORS
Sarpsborg, 17 March 2021
THE BOARD OF DIRECTORS OF BORREGAARD ASA
Signed
JAN ANDERS OKSUM Chair
Signed
MARGRETHE HAUGE
Signed
RAGNHILD ANKER EIDE
Signed
TERJE ANDERSEN
Signed
PER A. SØRLIEPresident and CEO
Signed
TOVE ANDERSEN
Signed
ARUNDEL KRISTIANSENSigned
HELGE AASEN
sales volume and volume of highly specialised grades are expected to increase in 2021. In the first half of 2021, wood costs will be lower, but energy costs and freight rates are expected to increase. Sales growth will continue for cellulose fibrils, but new development and customer trials will be delayed due to the Covid-19 pandemic.
No major changes are expected in the market conditions for Fine Chemicals. Bioethanol sales are mainly expected to be in the biofuel segment in 2021.
Borregaard, as a global supplier of products, may be affected by possible further consequences of the Covid-19 pandemic. Borregaard will continue to focus on maintaining sufficient financial capacity to responsibly manage and mitigate any potential effects from the Covid-19 pandemic and will closely monitor the situation.

19CORPORATE GOVERNANCE
CORPORATE GOVERNANCEBorregaard’s principles for good corporate governance form the basis for long-term value creation, benefitting shareholders, employees and society. These principles promote a healthy corporate culture where sustainability, long-term perspective and integrity are fundamental values. The sustainability agenda covers social, environmental and economic responsibility. The Board of Directors is responsible for corporate governance.
Borregaard is subject to the requirements of Section 3–3b of the Norwegian Accounting Act, the Norwegian Code of Practice for Corporate Governance and the Continuing Obligations of Stock Exchange Listed Companies. Electronic versions of the Accounting Act, Code of Practice and Continuing Obligations are freely available at www.lovdata.no, www.nues.no and www.oslobors.no, respectively.
This report follows the system used in the Code of Practice from 17 October 2018. It comprises all clauses of the Code of Practice and describes how Borregaard complies. If there is a deviation, the reason for the deviation is explained.
The Board of Directors approved this report at its meeting on 17 March 2021. The statement is cited on page 134. The General Meeting will consider the statement at its meeting on 14 April 2021.
The Board will ensure that the company complies with the requirements of the applicable laws and regulations. The principles of good corporate governance are integrated into the Board’s decision-making process, and the Board will continually discuss and evaluate the principles and their implementation.
According to the Articles of Association, Borregaard’s purpose involves: “... the development, production and sale of biochemicals, bio-based speciality products and other chemicals, as well as other business operations that are naturally related therewith.”
The Board of Directors has clear objectives, strategies and risk profiles for the company’s business activities. Borregaard’s activities focus on BioSolutions with biopolymers and biovanillin from lignin, BioMaterials which is speciality cellulose and cellulose fibrils, and Fine Chemicals that consists of fine chemical intermediates and second-generation bioethanol. For a more detailed description, see the section The Borregaard Group on page 4. Borregaard’s goal is to deliver good profitability with a targeted return on capital employed1 (ROCE) of minimum 15% pre-tax over a business cycle. For a more detailed
account of corporate goals and strategies, see the section The Borregaard Group on page 4.
The Borregaard Group will contribute to the sustainable development of society through responsible commercial operations and continuous improvement. The Group has ethical guidelines and guidelines for corporate responsibility, available at www.borregaard.com.
The Sustainability and corporate responsibility report can be found from page 28 in this Annual Report. From page 41, the Annual Report gives an account of Borregaard’s systematic work in areas important for stakeholders such as employees, business partners and the community.
The Board evaluates the objectives, strategies and risk profiles yearly.
01 IMPLEMENTATION AND REPORTING ON CORPORATE GOVERNANCE
02 BUSINESS
/ 1 Alternative performance measures, see page 142 for definition.
The Group’s equity as of 31 December 2020 was NOK 3,778 million. The capital structure is appropriate for the company’s objective, strategy and risk profile. The Board has stated the following regarding the dividend policy:
“Under the current dividend policy adopted by the Board, Borregaard intends to pay regular and progressive dividends reflecting the expected long-term earnings and cash flows of the Borregaard Group, targeting an annual dividend between 30% and 50% of the company’s net profit for the preceding financial year”.
For the financial year 2020, the Board proposes a dividend of NOK 2.50 per share, up from NOK 2.30 per share in 2019. Dividend will be paid on 23 April 2021 to shareholders registered in the company’s shareholders’ register as evidenced in a transcript as of 16 April 2021. Acquired shares subject to ordinary settlement in the Norwegian Securities Register (VPS), will carry the right to receive dividends if acquired up to and including 14 April 2021.
The Board has no authority to issue new shares. The authority to purchase treasury shares is limited to defined purposes and applies until the next General Meeting. The
General Meeting votes on each individual purpose to be covered by the authorisation. At the General Meeting in 2020, the Board was authorised to buy treasury shares up to a total nominal value of NOK 10 million, corresponding to 10% of the current share capital. The authorisation is valid until the General Meeting in 2021, but no longer than 30 June 2021.
The authorisation may only be used in connection with share-based incentive programmes, shares for employees and for repurchase of shares for cancellation. As of 31 December 2020, Borregaard held 384 678 treasury shares.
There are no provisions in Borregaard’s Articles of Association concerning the buy-back or issue of shares. Transactions in treasury shares have taken place on the market at stock exchange prices, according to the Oslo Stock Exchange safe harbour rules and according to good stock exchange practice in Norway.
03 EQUITY AND DIVIDENDS

2120
07 NOMINATION COMMITTEE
CORPORATE GOVERNANCECORPORATE GOVERNANCE
All of Borregaard’s shares confer equal rights and are freely negotiable. There are no provisions in the Articles of Association restricting the free negotiability of shares.
Borregaard has one class of shares, and each share entitles the holder to one vote. The nominal value is NOK 1.00.
A more detailed account of the terms and conditions relating to the entitlement to vote at the General Meeting is given below under item 6.
It is Borregaard’s policy that shareholder value shall not be diluted by the issuance of new shares. If the Board proposes a deviation from the pre-emption rights of existing shareholders in the event of an increase in capital, it must justify this as being in the common interest of the company and its shareholders. This justification must be stated in the notice of the General Meeting.
The Instructions for the Board of Borregaard ASA include rules for dealing with cases of transactions with close associates. The Instructions for the Board are publicly available under “Investor Relations” on the company’s website. According to the Instructions, the Chair of the Board must be informed about the transaction and decide on how to deal with the case.
Transactions with related parties are disclosed in Note 33 to the Group accounts. In the case of transactions between Borregaard and a shareholder, the shareholder’s parent company, a member of the Board, executive personnel or close associate of any of these, the Board will ensure that a value assessment is carried out by an independent third party.
05 SHARES AND NEGOTIABILITY
04 EQUALITY OF TREATMENT OF SHAREHOLDERS AND TRANSACTIONS WITH RELATED PARTIES
The Board of Borregaard has taken steps to ensure that as many shareholders as possible may exercise their rights by participating in the General Meeting. The notice of the General Meeting and administrative documents must be available on Borregaard’s website no later than 21 days before the General Meeting. The final date for registration is no more than three days before the General Meeting. The Board, the President and CEO, the external auditor and the Chair of the Nomination Committee will be present at the General Meeting.
Shareholders unable to attend the General Meeting may either appoint a proxy or submit a vote in advance using the Internet, using either DNB or the Norwegian Central Securities Depository (VPS) investor services. There are links to these services on the Borregaard website. Advance votes can also be submitted by post. It is stipulated in the Articles of Association that the notice of the General Meeting must indicate the rules established by the Board for advance voting.
The Articles of Association contain no special provisions with regard to the opening and chairing of the General Meeting. In line with the Code of Practice, the Board will arrange for the General Meeting to be opened by an independent person. In the notice of the General Meeting, the Board will indicate who will open the meeting and propose a Chair who satisfies the independence requirements of the Code of Practice, to be elected by the General Meeting.
If shares have been transferred, the new shareholder may vote if the transfer has been registered with VPS before the final date for registration with the General Meeting. If the transfer has been notified to VPS and evidence of this can be provided at the General Meeting, the shareholder will also be allowed to vote. According to Norwegian law, voting is only permitted in relation to shares registered in the owner’s name. In order to confer voting rights, shares registered to a nominee account must be reregistered under the name of the beneficiary owner in VPS before the final date for registration with the General Meeting.
06 GENERAL MEETINGS
The Articles of Association stipulates that the company shall have a Nomination Committee. The General Meeting elects the members and the Chair of the Committee. There is an option to vote for each individual candidate. The Instructions for the Nomination Committee are available under “Investor Relations” at www.borregaard.com. The members and Chair of the Nomination Committee were elected in 2020 based on a proposal from the Nomination Committee, as recommended by the Code of Practice.
The Nomination Committee consists of four members, elected for one year, i.e. until the General Meeting in 2021. The Nomination Committee will propose:• Candidates for shareholder-elected Board members
and the chair• Candidates for members of the Nomination Committee
and the chair• Remuneration for the Board and the Nomination
Committee
The Nomination Committee has adapted its procedures to comply with the recommendations in the Code of Practice. The Instructions establish guidelines for the preparation and conducting of elections to the Nomination Committee and the Board, as well as the criteria for electability, general requirements for the recommendations and rules for dealing with cases in the course of the Nomination Committee’s work. When the Committee is considering candidates for the Chair of the Board, it is supplemented by a representative appointed by the employee-elected Board members.
Information about the composition of the Nomination Committee, which members are up for election and how input and proposals can be given to the Nomination Committee, can be found under “Investor Relations” on the company’s website. The Nomination Committee has been composed in accordance with the Code of Practice to safeguard the interests of the shareholder community. The composition meets the Code’s requirements for independence. None of the members of the Nomination Committee are members of the Board, nor does the Nomination Committee include the company’s President and CEO or any other executive personnel.
The members are:• Mimi K. Berdal (chair)• Erik Must• Rune Selmar• Ola Wessel-Aas
Borregaard’s SVP Organisation and Public Affairs serves as the secretary of the Nomination Committee.
If a shareholder has given the company proxy to vote, the Chair of the Board or the Chair of the General Meeting will be appointed to vote on the shareholder’s behalf. The proxy form has been designed in such a way that the shareholder may provide instructions for each item to be dealt with, and for each candidate to be elected. Information on the use of proxy voting and shareholders’ rights to have items dealt with at the General Meeting, is given both in the notice of the General Meeting and on Borregaard’s website.
According to the Articles of Association, Clause 7, the Board may decide that documents relating to items to be dealt with at the General Meeting should not be sent
to shareholders, but instead be made available on the Borregaard website. The same applies to documents, which by law must be included in, or attached to, the notice of a General Meeting. A shareholder may at any time demand to have such documents mailed. The provision in the Articles of Association is consistent with Section 5-11a of the Norwegian Public Limited Liability Companies Act. The documents will be available no later than 21 days prior to the General Meeting.

2322
The Board has been put together with the aim of safeguarding the interests of the shareholder community and the company’s need for competence, capacity and diversity. The Board consists of the Chair, six members and two observers. The employees have elected two of the members and the two observers. The composition of the Board meets statutory requirements and the Code of Practice. All shareholder-elected members are independent of the company’s management, main shareholders and important business associates. No one from day-to-day management is a member of the Board. No Board member has ever been disqualified on the grounds of a lack of impartiality.
According to the Norwegian Public Limited Liability Companies Act, the Board’s term of office is two years. Borregaard’s Articles of Association comply with this requirement. The General Meeting may set a shorter term of office.
It is the task of the Nomination Committee to recommend the term of office of the Board. The shareholder-elected members of the Board have been elected for a period
of one year, as an annual evaluation of the composition provides the greatest flexibility. The current Board has been elected for the period leading up to the 2021 General Meeting.
The Articles of Association does not require members of the Board to own shares in the company. However, the General Meeting in 2018 decided that shareholder-elected Board members are required to use part of their remuneration to acquire shares in the company. The Annual Report provides information about Board members’ share ownership, background, qualifications, terms of office, independence and the length of time they have been members of the Board of Borregaard. There is also information about any major positions in other companies and organisations, and participation in Borregaard’s Board meetings. As agreed with the employees, there is no corporate assembly neither in Borregaard ASA nor in its subsidiary, Borregaard AS. Instead, employees have extended representation rights to those companies’ Boards. In accordance with the Norwegian Public Limited Liability Companies Act, employees are entitled to elect two members and two observers to the Board.
CORPORATE GOVERNANCECORPORATE GOVERNANCE
08 THE BOARD OF DIRECTORS: COMPOSITION AND INDEPENDENCE
The duties of the Board of DirectorsThe duties of the Board are stated in the Public Limited Liability Companies Act and in the Instructions for the Board of Directors, which among other things define the responsibilities and obligations of the Board. The rules governing the handling of cases by the Board are also stipulated in the Instructions for the Board. The Instructions for the Board also include regulations governing the President and CEO’s disclosure requirements and the duty to carry out the resolutions of the Board. There are also guidelines on the preparation of matters to be considered by the Board and provisions whereby employees must be informed of the Board’s resolutions. Other instructions, and clarification of the obligations, authorisations and responsibilities of day-to-day management, are adopted on an ongoing basis.
The Board adopts an annual plan of meetings and work that includes its strategic work, commercial issues and control work. The Board held eight meetings and dealt with 66 agenda items in 2020. The Board’s annual evaluation process includes discussions regarding the work in more
detail, see section “Internal Evaluation by the Board”.The President and CEO prepares items for the Board in consultation with the Chair of the Board. The Instructions for the Board contain provisions for the handling of matters before the Board, as well as rules concerning impartiality, joint and parallel investments, see item 4. The Board has established two permanent committees, the Compensation Committee and the Audit Committee, both of which are described in more detail below. These committees pass no resolutions, but they supervise administrative work on behalf of the Board and prepare items for decision by the Board.
The committees may draw on the resources of the company and obtain advice and recommendations from external sources, if necessary.
Compensation CommitteeThe Compensation Committee makes recommendations to the Board regarding the President and CEO’s salary and terms and supervises the general conditions for other executive personnel within the Group. It is chaired by
09 THE WORK OF THE BOARD OF DIRECTORS

2524 CORPORATE GOVERNANCE CORPORATE GOVERNANCE
Jan Oksum. Margrethe Hauge and Ragnhild Anker Eide are members. Borregaard’s SVP Organisation and Public Affairs serves as its secretary. The Compensation Committee held four meetings and dealt with 12 agenda items in 2020. All members of the Compensation Committee participated in all four meetings. The composition of the Committee complies with the Code of Practice requirements for independence, and all members of the Committee are considered to be independent of the executive personnel.
The mandate of the Committee has been incorporated in the Instructions for the Board. The Committee will additionally deal with any specific questions relating to compensation for employees of the Group.
Audit CommitteeThe Audit Committee supports the Board in fulfilling its responsibilities with respect to financial reporting, internal accounting controls and auditing matters. It is chaired by Terje Andersen. Tove Andersen, Helge Aasen and Arundel Kristiansen are members, and the Vice President Finance serves as its secretary. The Audit Committee held six meetings and dealt with 25 agenda items in 2020. All members of the Audit Committee participated in all six meetings. The composition of the Committee complies with the requirements of the Code of Practice for independence and competence. The recommendations of the Nomination Committee provide information as to which members of the Board meet the independence and competence requirements for members of the Audit Committee. The mandate of the Committee has been incorporated in the Instructions for the Board.
Internal evaluation by the BoardThe Board has carried out the annual evaluation of its own activities and competence. The results have been made available to the Nomination Committee.
The Board reviews the company’s guidelines on ethics, anticorruption and corporate responsibility annually. The Group companies must perform regular reviews of the risk factors linked to Borregaard’s corporate responsibility at a general level and review the risk of breaches of the ethical requirements.
Impartiality and conflict of interestThe Instructions for the Board have regulations about impartiality. They establish that members of the Board may not take part in the handling of, or decisions in, matters in which the member or a close associate has a prominent personal or financial interest. Members of the Board shall also at all times consider whether there are any circumstances which, from an objective point of view, are likely to weaken confidence in the member’s impartiality, or which may lead to conflicts of interest in connection with the Board’s handling of the case. Such circumstances must be discussed with the Chair of the Board.
With regard to the Group’s ethical guidelines, employees must, on their own initiative, inform their superiors of any case of impartiality or conflict of interest, and they must not take part in the processing of such cases.
The Board of Directors is the ultimate responsible for Borregaard’s internal control system. Each member of the Group Executive Management is responsible for internal control within their respective areas. Borregaard’s main objective is to provide sustainable solutions based on renewable resources and unique competence. The risk management system is essential for achieving the overall objective.
Risk management Identifying and managing risks and opportunities are integrated multidisciplinary parts of the Group’s business processes. Risk management shall ensure that risks relevant to Borregaard’s objectives are identified, analysed and dealt with at the earliest possible stage and in a cost-
effective manner.
A sound risk culture in Borregaard’s operating units is a prerequisite for a successful risk management process. An operating unit may be a plant, an organisational department, a subsidiary or a business unit. Comprehensive risk assessments related to either operations or projects are carried out on an ongoing basis in all operating units and reported to the next management level. Top-down risk evaluations are mainly focused on climate change, environment, health and safety (EHS) and profitability.
The risk picture is presented and reviewed quarterly by the Audit Committee and at least annually by the Board.
10 RISK MANAGEMENT AND INTERNAL CONTROL
An operating unit’s risk picture identifies the principal risk factors associated with the unit’s value chain. The individual unit managers in the Group are responsible for acquainting themselves with all significant risk factors within their area of responsibility, thus contributing to a financially and administratively sound handling of these risks. Borregaard has established a central risk management function at Group level, headed by the Chief Risk Officer (CRO), who is responsible for Borregaard’s risk management model and implementation support. Furthermore, the Group CRO shall facilitate the risk assessment process and contribute to the identification, analysis and handling of risks across business areas and disciplines.
The Board conducts a review of the Group’s risk picture at least annually. The CRO consolidates the aggregate risk picture which the Group Executive Management reviews before it is submitted to the Audit Committee and finally to the Board.
The stakeholders’ perspective is taken into consideration when assessing and managing risks with potential environmental, social and economic impacts throughout the company’s value chain.
Climate risks assessment comply with the Task Force on Climate-related Financial Disclosures (TCFD). Risks (physical, regulatory, market, cost, and legal) associated with climate change are featured on page 41 of the Sustainability and corporate responsibility report as well as on Borregaard’s webpage.
Information security Borregaard’s activities may be susceptible to various threats related to information management. The implementation of the Borregaard information security policy ensures good information management practices in business processes, as well as compliance with applicable regulatory requirements, such as GDPR. The Group’s information management governs confidentiality, integrity and availability, both strategically and operationally.
The operationalisation of Borregaard’s information management is supported by dedicated internal resources and technical solutions. Raising awareness within the organisation is a key element to safeguard against unwanted dissemination of information; hence, building a culture of information security in the company is prioritised in every area applicable.
Internal control Borregaard has documented its internal procedures,
including a description of authority, in the quality management system. The Group has a dual control principle for approvals, and the main accounting and purchasing system (SAP) enforces the principle.
Personnel within finance and controlling functions perform internal control reviews in the Group’s legal entities.
Monthly financial reports are sent to the Board. Each legal entity submits reports into the consolidation system in accordance with the annual financial calendar. There are monthly meetings among key finance personnel to review financial results, incidents, projects, estimates, etc. This input is used in the monthly reporting to the Board and the quarterly meetings with the Audit Committee.
The Group’s quarterly reports are reviewed by the Audit Committee prior to the Board meeting. Borregaard’s external auditor is present at the Audit Committee meetings and attends the Board meeting when the Board approves the annual financial statements.
Internal control of EHS issues are compliant with the Norwegian regulations relating to systematic health, environmental and safety activities in enterprises (Internal control regulation).
Ethics and corporate responsibilityThe company and its subsidiaries work continuously with ethics, anti-corruption and corporate responsibility, which are integral parts of the basis for decisions.
Borregaard must comply with a number of guidelines and reporting procedures as part of its corporate responsibilities. The main documents have been approved by the company’s Board of Directors, which also sets the overall goals for the areas covered by those reporting procedures.
Guidelines :• General Guidelines for Environment, Health, Safety and
Climate• Human Rights Policy• Anti-Corruption Manual• Corporate Responsibility• Code of Conduct• Corporate Governance Principles• Responsible Sourcing Policy• Competition Law Compliance Manual
The Group’s executive management team is responsible for monitoring the company’s goals, measures and results. Their daily implementation is a line management

2726
12 REMUNERATION OF EXECUTIVE PERSONNEL
CORPORATE GOVERNANCECORPORATE GOVERNANCE
All remunerations of the Board have been disclosed in Note 5 to the financial statements of Borregaard ASA. Board members’ remuneration is not dependent on the company’s financial results, and no share options are granted. The shareholder-elected board members shall use part of their remunerations to acquire shares in the company.
In its recommendation, the Nomination Committee proposed the compensation to the Board for the period up to the General Meeting in 2021.
The Board’s Compensation Committee makes recommendations to the Board regarding the President and CEO’s compensation and terms and supervises the general conditions for executive personnel. The Board assesses the President and CEO’s remuneration annually.
The Board’s statement on salaries and other remuneration of executive personnel (see Note 9 to the consolidated financial statement) contains an account of the
remunerations given to executive personnel and the Group’s Remuneration Guidelines for 2020 including criteria related to share option schemes.
An annual cap has been placed on bonuses and long-term incentives. The Board’s statement is available to shareholders at the same time as the notice of the General Meeting.
11 REMUNERATION OF THE BOARD OF DIRECTORS
13 INFORMATION AND COMMUNICATIONS
Borregaard’s accounting procedures are transparent and in accordance with the International Financial Reporting Standards (IFRS). The Audit Committee monitors the company’s reporting on behalf of the Board.
Borregaard strives to communicate actively and openly with the financial market. The annual and quarterly reports contain information on the various aspects of the company’s activities. The quarterly presentations are published on Borregaard’s website, along with the quarterly and annual reports, under “Investor Relations”.
All shareholders and other financial market players are treated equally as regards access to financial information. The Group’s Investor Relations Department maintains regular contact with shareholders, potential investors, analysts and other financial market stakeholders. Borregaard adheres to the Oslo Stock Exchange recommendation on reporting of relevant information to the investor community. The financial calendar for 2021 is published under “Investor Relations” at www.borregaard.com.
The Board’s approach to takeovers is published on the company’s website under “Investor Relations”. The Board will not seek to prevent or obstruct any takeover bid for Borregaard’s operations or shares. In the event of such a bid, in addition to complying with relevant legislation and regulations, the Board will seek to comply with recommendations in the Code of Practice, including obtaining a valuation from an independent expert.
On this basis, the Board will recommend whether or not the shareholders should accept the bid. There are no other written guidelines in the event of a takeover bid. The Board has not considered it appropriate to draw up any explicit principles other than the actions described above. The Board otherwise concurs with what is stated in applicable laws and regulations and in the Code of Practice regarding this issue.
14 TAKE-OVERS
15 AUDITOR
The Board of Directors has determined the procedure for the external auditor’s regular reporting to the Board. Annually, the external auditor presents to the Board an assessment of risk, internal control and an assessment of the quality of financial reporting. The auditor presents the audit plan for the following year. The external auditor also takes part in the Board’s discussions on the annual financial statements, including a session without the presence of management.
Both the external auditor and the President and CEO attend all meetings of the Board’s Audit Committee. For further information, see Section 10 regarding risk management. Borregaard has guidelines for the management’s use of the external auditor for services other than auditing. Responsibility for monitoring such use in detail has been delegated to the secretary of the Audit Committee,
who is the Vice President Finance. The secretary will approve significant assignments in advance and compile an annual summary of services other than auditing provided to the company.
Details of the company’s use and remuneration of the external auditor are disclosed in Note 5 to the financial statements of Borregaard ASA. The General Meeting is informed about the Group’s overall remuneration of the auditor.
In connection with the auditor’s participation in the Audit Committee and the Board of Directors’ consideration of the annual statements, the auditor also confirms his or her independence.
responsibility in Borregaard. This means that corporate responsibilities are an integral component of all of the operations of Borregaard’s subsidiaries, as well as in various management teams, units and departments.
Sustainability board The internal sustainability board addresses and monitors important sustainability topics, and also initiates processes in which guidelines, goals and measures are developed within the areas covered by this report. The sustainability Board reports to the President and CEO and is chaired by the Senior Vice President of Organisation and Public Affairs.
The status of the work by the business areas involving corporate responsibility is included in the Sustainability and corporate responsibility report.
Compliance boardBorregaard has an internal compliance board consisting of the SVP Organisation and Public Affairs (Chair), General Counsel, Vice President Finance and CRO. The compliance board shall support the Group companies’ management by raising awareness of compliance matters, reporting on its
activity and findings and contribute to improvements. The compliance board reports to the President and CEO and the Board reviews the annual Compliance Report.
Whistleblowing Borregaard aims for transparency and a strong corporate culture to help ensure that difficult or undesirable situations are discussed and resolved. There may be situations where employees see or experience conflicts with our guidelines or expectations. Ideally, such issues should be dealt with where they occur. However, situations may arise where that is difficult, not possible or desirable for the employee. Borregaard has established a whistleblowing system and a separate channel, operated by Borregaard’s General Counsel to deal with such issues. Any unethical behaviour can be reported by e-mail or by phone in accordance with Borregaard’s Code of Conduct, Section 4.2. Whistleblowers may request anonymity, which always will be respected.Borregaard’s written procedures satisfy governmental requirements. The compliance board revised the procedures in autumn 2020. Guidelines are translated into relevant languages and implemented in the company’s subsidiaries worldwide.

THE BORREGAARD GROUP28
Responsible business ...................................................................................32
A: Sustainable business model ...............................................................41
B: Climate and environmental engagement .........................................52
C: Care for people and competence development ..............................64
D: Contribution to society and economic ripple effects .....................70
SUSTAINABILITY AND CORPORATE RESPONSIBILITY

30 THE BORREGAARD GROUP 31THE BORREGAARD GROUP
98%OF 1,000,000 M3 WOOD
CERTIFIED PART OF PURCHASED WOOD
193MILL NOK
INNOVATION EFFORTS
ACDP’S CLIMATE CHANGE A LIST
CLIMATE RATING
32.5%FEMALE SHARE OF NEW
RECRUITMENTS
DIVERSITY
64%RENEWABLE ENERGY
ENERGY
42%REDUCTION IN CO2
SINCE BASE YEAR 2009
GHG REDUCTIONS

3332 SUSTAINABILITY AND CORPORATE RESPONSIBILITYSUSTAINABILITY AND CORPORATE RESPONSIBILITY
RESPONSIBLE BUSINESS1
Borregaard’s main objective is to develop products and solutions based on renewable raw materials and unique competence. Our business model centres around sustainability and therefore, this is always a natural component of the company’s overarching goals. Borregaard’s Board of Directors emphasises the importance of sustainability as an integral part of the company’s operations and development.
/ 1 Borregaard ASA has a statutory duty to comply with the reporting requirements for corporate social responsibility in Section 3-3c of the Norwegian Accounting Act. This requires Borregaard to account for “what the company is doing to integrate respect for human rights, labour rights and social issues, the environment and anticorruption in their business strategies, in their daily operations and in their relationship with stakeholders.”/ 2 (https://sustainabledevelopment.un.org/content/documents/5987our-common-future.pdf) / 3 IPCC, 2013: Summary for Policymakers. In Climate Change 2013: The Physical Science Basis. Contribution of Working Group I to the Fifth Assessment Report of the Intergovernmental Panel on Climate Change [Stocker, T.F., D. Qin, G.-K. Plattner, M. Tignor, S.K. Allen, J. Boschung, A. Nauels, Y. Xia, V. Bex and P.M. Midgley (eds.)]. Cambridge University Press, Cambridge, United Kingdom and New York, NY, USA / 4 United Nations Population Fund, 2020. World Population Dashboard, 06.01.2021 [https:/www.unfa.org/data/world-population-dashboard] United Nations, 2021. World Population Prospects. 06.01.2021 [ https:/population..un.org/wpp/]
The consolidated figures in Borregaard’s sustainability report do not include figures from the Group’s joint venture in South Africa. Borregaard in Sarpsborg accounts for about three-quarters of the Group’s operations (revenues and employees) and thus faces the biggest challenges with respect to EHS, climate and social issues.
Operations and development that meet the needs of the present without compromising the ability of future generations to meet their own needs.
Sustainability is composed of three pillars: environmental (planet), social (people) and economic (profits).
Sustainability is one of Borregaard’s core values. Borregaard’s approach to sustainability is based on the UN document “Our Common Future” (1987)2:
BORREGAARD’S SUSTAINABILITY APPROACH
SOCIAL(People)
ENVIRONMENT(Planet)
ECONOMY(Profit)
PURPOSEBorregaard aims to provide sustainable products and solutions based on renewable raw materials and unique competence
SOCIAL(People)
ENVIRONMENT(Planet)
ECONOMY(Profit)
PURPOSEBorregaard aims to provide sustainable products and solutions based on renewable raw materials and unique competence
GLOBAL CHALLENGES AND SUSTAINABLE SOLUTIONSBorregaard’s innovative products and solutions can play an important role in addressing the world’s greatest sustainable development challenges: Population growth and climate change3.
The UN predicts population growth of more than 10% by 20304, which will generate resource scarcity and an extraordinary demand for climate friendly solutions in our daily lives. The Paris Agreement and the UN Climate Panel have defined specific sustainability goals and measures
within areas such as access to raw materials, energy, food and infrastructure. These factors are expected to increase demand for sustainable products and will present opportunities for Borregaard’s innovative solutions in terms of creating good lives within a sustainable framework.
We take climate action and demonstrate how our business can help advance sustainable development by both minimising negative and maximising positive environmental impacts. The Intergovernmental Panel on Climate Change (IPCC)5 provides a clear description of the world’s challenges in its Special Report where it stresses the dramatic difference between an increase in the global average temperature to 2°C above preindustrial levels, and pursuing efforts to limit the temperature increase to 1.5°C above preindustrial levels.
Borregaard has committed to major greenhouse gas reductions in the years to come. The Science Based Targets Initiative6 has approved Borregaard’s targets of reducing scope 1 and 2 greenhouse gas emissions by 53% by 2030 and 100% by 2050, from a 2009 base year. The approved targets for scope 3 emissions are reductions of 30% by 2030 and by 75% by 2050 from a 2017 base year. The targets are in line with the ambitions in the Paris Agreement and The Science Based Target Initiative has classified our targets as a contribution to limit the global temperature increase to well below 2°C (see page 53).
BORREGAARD’S CONTRIBUTION TO THE UN’S 2030 AGENDA Borregaard has prioritised six of the seventeen Sustainable Development Goals (SDGs) set out in the UN 2030 Agenda for Sustainable Development based on how we as a
company can contribute to solving the global challenges through our activities and solutions: (2) Zero hunger; (8) Decent work and economic growth; (9) Industry, innovation, and infrastructure; (12) Responsible consumption and production; (13) Climate action; and (15) Life on land. Borregaard can have a positive impact in these areas through our unique biorefinery concept and our sustainable products.
The six prioritised SDGs are closely linked to Borregaard’s core operations and are in line with our business strategy with respect to the sourcing of natural raw materials, our production processes and the impact our products have in our customers’ value chains. The six SDGs are reflected in Borregaard’s stakeholder and materiality analysis and are used as a framework for guiding, communicating and reporting on the company’s strategy, goals and activities.
Specific targets and KPIs are presented in this report under the relevant topics. You will find a complete overview of Borregaard’s contributions to all seventeen Sustainable Development Goals on pages 74 and 75.
/ 5 IPCC, 2018: Summary for Policymakers. In: Global warming of 1.5°C. An IPCC Special Report on the impacts of global warming of 1.5°C above pre-industrial levels and related global greenhouse gas emission pathways, in the context of strengthening the global response to the threat of climate change, sustainable development, and efforts to eradicate poverty [V. Mas son-Delmotte, P. Zhai, H. O. Pörtner, D. Roberts, J. Skea, P.R. Shukla, A. Pirani, W. Moufouma-Okia, C. Péan, R. Pidcock, S. Connors, J. B. R. Matthews, Y. Chen, X. Zhou, M. I. Gomis, E. Lonnoy, T. Maycock, M. Tignor, T. Waterfield (eds.)]. World Meteorological Organization, Geneva, Switzerland, 32 pp / 6 Partnership between CDP, UN Global Compact, WRI and WWF
DID YOU KNOW THAT… Borregaard achieved a place on the CDP Climate Change ”A list” in 2018, 2019 and 2020? Only 2.8% of the reporting companies made the list last year.
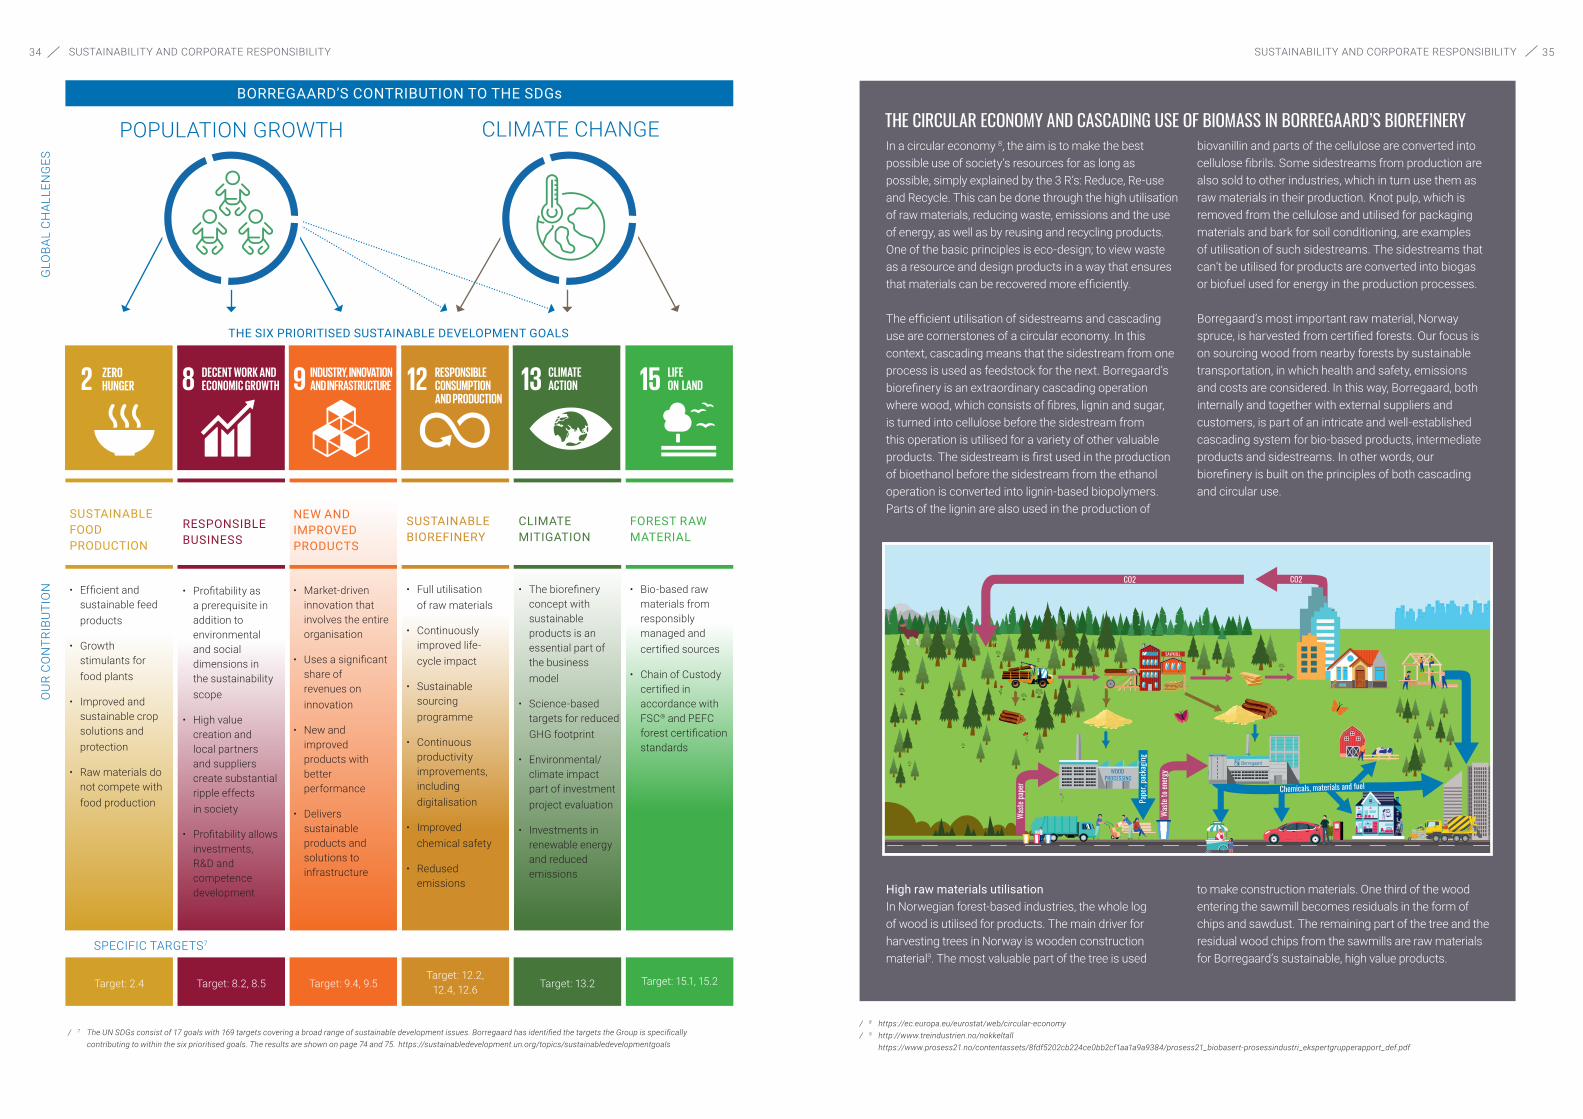
34 35SUSTAINABILITY AND CORPORATE RESPONSIBILITYSUSTAINABILITY AND CORPORATE RESPONSIBILITYG
LOBA
L C
HAL
LEN
GES
OU
R C
ON
TRIB
UTI
ON
SPECIFIC TARGETS7
THE SIX PRIORITISED SUSTAINABLE DEVELOPMENT GOALS
Target: 2.4 Target: 8.2, 8.5 Target: 9.4, 9.5Target: 12.2,
12.4, 12.6 Target: 13.2 Target: 15.1, 15.2
SUSTAINABLE BIOREFINERY
• Full utilisation of raw materials
• Continuously improved life- cycle impact
• Sustainable sourcing programme
• Continuous productivity improvements, including digitalisation
• Improved chemical safety
• Redused emissions
CLIMATE MITIGATION
• The biorefinery concept with sustainable products is an essential part of the business model
• Science-based targets for reduced GHG footprint
• Environmental/ climate impact part of investment project evaluation
• Investments in renewable energy and reduced emissions
FOREST RAW MATERIAL
• Bio-based raw materials from responsibly managed and certified sources
• Chain of Custody certified in accordance with FSC® and PEFC forest certification standards
CLIMATE CHANGEPOPULATION GROWTH
BORREGAARD’S CONTRIBUTION TO THE SDGs
/ 7 The UN SDGs consist of 17 goals with 169 targets covering a broad range of sustainable development issues. Borregaard has identified the targets the Group is specifically contributing to within the six prioritised goals. The results are shown on page 74 and 75. https://sustainabledevelopment.un.org/topics/sustainabledevelopmentgoals
SUSTAINABLE FOOD PRODUCTION
• Efficient and sustainable feed products
• Growth stimulants for food plants
• Improved and sustainable crop solutions and protection
• Raw materials do not compete with food production
RESPONSIBLE BUSINESS
• Profitability as a prerequisite in addition to environmental and social dimensions in the sustainability scope
• High value creation and local partners and suppliers create substantial ripple effects in society
• Profitability allows investments, R&D and competence development
NEW AND IMPROVED PRODUCTS
• Market-driven innovation that involves the entire organisation
• Uses a significant share of revenues on innovation
• New and improved products with better performance
• Delivers sustainable products and solutions to infrastructure
In a circular economy 8, the aim is to make the best possible use of society’s resources for as long as possible, simply explained by the 3 R’s: Reduce, Re-use and Recycle. This can be done through the high utilisation of raw materials, reducing waste, emissions and the use of energy, as well as by reusing and recycling products. One of the basic principles is eco-design; to view waste as a resource and design products in a way that ensures that materials can be recovered more efficiently.
The efficient utilisation of sidestreams and cascading use are cornerstones of a circular economy. In this context, cascading means that the sidestream from one process is used as feedstock for the next. Borregaard’s biorefinery is an extraordinary cascading operation where wood, which consists of fibres, lignin and sugar, is turned into cellulose before the sidestream from this operation is utilised for a variety of other valuable products. The sidestream is first used in the production of bioethanol before the sidestream from the ethanol operation is converted into lignin-based biopolymers. Parts of the lignin are also used in the production of
biovanillin and parts of the cellulose are converted into cellulose fibrils. Some sidestreams from production are also sold to other industries, which in turn use them as raw materials in their production. Knot pulp, which is removed from the cellulose and utilised for packaging materials and bark for soil conditioning, are examples of utilisation of such sidestreams. The sidestreams that can’t be utilised for products are converted into biogas or biofuel used for energy in the production processes.
Borregaard’s most important raw material, Norway spruce, is harvested from certified forests. Our focus is on sourcing wood from nearby forests by sustainable transportation, in which health and safety, emissions and costs are considered. In this way, Borregaard, both internally and together with external suppliers and customers, is part of an intricate and well-established cascading system for bio-based products, intermediate products and sidestreams. In other words, our biorefinery is built on the principles of both cascading and circular use.
CO2
SAWMILL
CO2
Pape
r, pac
kagin
g
Waste
pape
r
Waste
to en
ergy
Chemicals, materials and fuelWOOD
PROCESSINGWOOD
PROCESSING
High raw materials utilisationIn Norwegian forest-based industries, the whole log of wood is utilised for products. The main driver for harvesting trees in Norway is wooden construction material9. The most valuable part of the tree is used
to make construction materials. One third of the wood entering the sawmill becomes residuals in the form of chips and sawdust. The remaining part of the tree and the residual wood chips from the sawmills are raw materials for Borregaard’s sustainable, high value products.
/ 8 https://ec.europa.eu/eurostat/web/circular-economy/ 9 http://www.treindustrien.no/nokkeltall https://www.prosess21.no/contentassets/8fdf5202cb224ce0bb2cf1aa1a9a9384/prosess21_biobasert-prosessindustri_ekspertgrupperapport_def.pdf
THE CIRCULAR ECONOMY AND CASCADING USE OF BIOMASS IN BORREGAARD’S BIOREFINERY

3736 SUSTAINABILITY AND CORPORATE RESPONSIBILITYSUSTAINABILITY AND CORPORATE RESPONSIBILITY
Value creation per tonne CO2
0
2
4
6
8
10
2010 2011 2012 2013 2014 2015 2016 2017 2018 2019 2020
700
800
2014 2015 2016 2017 2018 2019 2020
900
1000
1100
1200
1300Value creation from wood
Borregaard utilises 94% of the purchased wood, of which 82% turns into commercial products, 10% is
used for internal energy and 2% is sold as bioenergy.
Reduced use of input factorsBecause of the high utilisation of wood for products at the biorefinery in Norway, there is a limited quantity of residual biomass and biogas available for energy. Therefore, Borregaard obtains heat energy from additional sources like renewable electricity, recovery of heat energy from production processes, energy from
the incineration of sorted household waste and natural gas. Our continuous efforts to increase Borregaard’s energy efficiency, as well as streamlining production, decreases the input factors per tonne of product produced. In this way, the CO2 footprint of our products is constantly reduced, while the value creation from the resources is increased.
The residual energy from Borregaard’s production processes is the main source of energy for the district heating plant in Sarpsborg, replacing oil heating.
Borregaard’s contribution to strengthen circular value chains EU’s Circular Economy Action Plan10 (part of the European Green Deal) proposes measures to limit the
use of resources and reduce waste along the entire life cycle of products, equipment and infrastructure. The aim is to make sure that the resources are kept in the EU economy for as long as possible. The EU Commission will initiate a sustainable product policy legislative and principles to regulate aspects within improving durability, reusability, upgradeability and reparability, addressing the presence of hazardous chemicals in products, increasing energy and resource efficiency, reducing carbon and environmental footprints, restricting single-use products as well as rewarding products based on sustainability performance.
This will require more from producers, especially in sectors that use the most resources and where the potential for circularity is high, such as within electronics and information and communication technology, batteries, vehicles, packaging, plastics, textiles, construction, food, water and nutrients. Borregaard promotes circularity by offering sustainable solutions within all these areas, and since our products are based on a renewable, non-toxic raw material, they do not have
a negative impact while recycling end products.
Cleantech Cleantech is an industry term used to describe products and services that improve operational performance, productivity or efficiency, while minimising costs, raw materials, energy consumption, waste or pollution. Borregaard is a good example of cleantech. Our bio-based products do well from a climate perspective when compared with petrochemical products, and we have made efforts to reduce greenhouse gas emissions in our production processes by means such as the elimination of heavy fuel oil and increasing the amount of energy supplied from more eco-friendly energy sources. Borregaard has developed the patented BALI concept, which could potentially provide additional sustainable raw materials in the long term. The concept is based on extracting lignin from various forms of biomass, including agricultural waste. The technology is not yet in commercial operation but represents a sustainable source of raw material for the future.
STAKEHOLDER AND MATERIALITY ANALYSIS At Borregaard, we fulfil our corporate responsibilities by developing and running our operations profitably and in a manner that conforms with fundamental ethical values and respect for individual people, society as a whole and the environment.
This approach includes maintaining a dialogue with our most important stakeholders. They are considered when running the business and when decisions are made. Maintaining contact with the company’s various stakeholders is an important means of building trust in Borregaard, as well as understanding the role our company plays in local communities and society as a whole.
We have conducted a stakeholder and materiality analysis based on Borregaard’s sustainability strategy, and our six prioritised Sustainable Development Goals from the UN 2030 Agenda for Sustainable Development (see illustration on page 31). The analysis identifies the economic, social, climate and environmental consequences of the company’s operations that have the greatest impact on our stakeholders’ assessments and decisions.
As a basis for the analysis, Borregaard surveyed the groups, organisations and individuals that are either impacted by the company’s operations or which, in a variety of ways, have an impact on the company’s strategy and goal achievement. Our stakeholders include current and potential customers, investors and lenders, business partners, local communities and neighbours, suppliers, the authorities, current and potential employees, organisations and the media. The model below shows which groups of stakeholders are regarded as most important for Borregaard:
CUSTOMERSEMPLOYEES
AUTHORITIES
SUPPLIERS
LOCAL COMMUNITIES
BUSINESS PARTNERS
INVESTORSAND LENDERS
The figure shows the increase in value creation in NOK per solid cubic meter wood from Borregaard’s biorefinery in Sarpsborg. Value creation is defined as the value of products sold from the biorefinery minus the cost of materials, services and depreciation.
The figure shows the increase in value creation per tonne of scope 1 and scope 2 CO2 emissions from the operations in the Borregaard Group. Value creation is defined as the value of products sold (revenues) minus the cost of materials, services and depreciation.
/ 10 https://ec.europa.eu/environment/circular-economy/pdf/new_circular_economy_action_plan.pdf

3938
Borregaard has identified the company’s most important risks and opportunities based on the company’s core operations and the geographical locations of our units, customers and suppliers. The analysis is based on our values, guidelines, risk assessments and strategy, as well as how Borregaard as a company impacts our stakeholders financially, environmentally and socially.
The analysis reflects the topics our stakeholders are interested in. Each unit in the Borregaard Group assesses issues that are relevant to the relationship between the company and society, facilitate good dialogue and ensure that complaints and other enquiries from external stakeholders are dealt with in a proper manner. The need to implement improvement projects in areas with specific challenges are assessed on an ongoing basis.
The illustration below shows the results of the stakeholder and materiality analysis, “Significance for the stakeholders and Borregaard ’s environmental, economic and social impacts on the world” in the three sustainable dimensions, people, profit and planet. The axes represent the impact of the three dimensions. The analysis guides our main challenges and points out our strategic priorities for improving the positive impact of our main topics in all the sustainability dimensions and the SDGs we have prioritised. The colours in the illustration refer to the chapters A to D, including results for 2020 and targets and plans for 2021. The purpose of our strategic priorities is to develop Borregaard into an even more specialised and competitive company that delivers sustainable products and strong results over time.
Borregaard’s main challenges centre around four areas highlighted in the materiality impact diagram above: Reduction of GHG emissions, reduction of effluents of organic compounds to water, securing long-term sourcing of sustainable forest raw material and successful development and sales of sustainable and climate-friendly products that can replace oil-based products.
Borregaard contributes substantially to climate change mitigation. Delivering on our science-based targets for reducing greenhouse gas emissions and producing products with a low CO2 footprint is one of our main priorities (SDG 13). Our direct emissions stem mainly from the production of heat energy. We have identified several measures to reduce greenhouse gas emissions linked to consumption of heat energy in the years to come, such as reductions in energy consumption and increased use of bioenergy and electricity from renewable sources. Some of the measures will be implemented within 2030, other measures will depend on technology development and governmental support. The increasing need for renewable electricity in society could represent a challenge when it comes to replacing fossil-based energy sources.
Borregaard’s biorefinery in Norway generates emissions of organic matter to water (measured as COD). We have identified both short-term and long-term goals and have set out demanding measures to reduce COD effluents to the river Glomma (SDG 12). The measures will meet the requirements in the EU Water Framework Directive (WFD) as well as other new requirements that will derive from the EU Green Deal process.
The transition to a more bio-based society as well as a growing demand for wood-based products makes the sourcing of sustainable wood raw material increasingly important. This could also tighten the competition in the markets for wood and hence give increased raw material costs. Furthermore, it is expected that the requirements linked to the management of the forests and harvesting operations will be stricter to secure biodiversity and ecological standards. However, if forests are managed in a sustainable way, they can represent an everlasting resource (SDG 15).
In addition to the fact that Borregaard’s bio-based products have a favourable environmental footprint compared with fossil-based alternatives, it is important to the market that the products have a preferable cost-performance position (SDG8). Thus, we make comprehensive efforts on innovation and continuous improvement to increase specialisation and product performance (SDG 9) combined with documented ESG aspects across the whole value chain (SDG 8, 12 and 13). Borregaard has prioritised strategic measures to deliver on the specialisation strategy and to further develop the biorefinery concept. Successful development and marketing of bio-based products will have a positive impact on several SDGs, such as food and feed production (SDG 2), construction and infrastructure (SDG 9 and 11), clean energy (SDG 7), transportation solutions (SDG 9) and chemicals for water purification (SDG 6).
/ The coloured boxes refer to the main areas described in the Sustainability Report, and the corresponding SDGs (see page 41)
FINANCIAL IMPACT
POSITIVE ENVIRONMENTALAND CLIMATE IMPACT
NUMBER OF PEOPLE IMPACTED
CLIMATE IMPACTAND EMISSIONS
WATER CONSUMPTIONAND EFFLUENTS
PUBLIC AND PROCESS SAFETY
DIVERSITY AND EQUALITY
RESPONSIBLE SOURCING
HUMAN RIGHTS
CONTRIBUTION TO SOCIETY ANDECONOMIC RIPPLE EFFECTS
BUSINESS ETHICS AND ANTI-CORRUPTION
SAFE AND HEALTHYWORKING ENVIRONMENT
ACCESS TO HUMAN CAPTIALAND COMPETENCE DEVELOPMENT
WASTE AND CIRCULARITY
FOREST RAW MATERIAL
STRONG INNOVATIONEFFORT
SUSTAINABLE AND CLIMATE-FRIENDLY PRODUCTS
RAW MATERIALS PROCESS PRODUCTS
8 12 13 15 13 13128 9 92 3 6 7 11
SUSTAINABILITY AND CORPORATE RESPONSIBILITYSUSTAINABILITY AND CORPORATE RESPONSIBILITY
The illustration shows how our business impacts different SDGs along the value chain as well as how our products contribute to reach many SDGs.

4140 SUSTAINABILITY AND CORPORATE RESPONSIBILITY SUSTAINABILITY AND CORPORATE RESPONSIBILITY
SUSTAINABILITY LINKED FINANCINGBorregaard has made financial commitments linked to our main sustainability targets by entering sustainability linked financing agreements with financial institutions. In July 2020, Borregaard signed three bilateral multicurrency revolving credit facility agreements totalling NOK 1,500 million with DNB Bank, Skandinaviska Enskilda Banken and Handelsbanken. The facilities are linked to Borregaard’s sustainability targets and the margins can be adjusted based on our progress on three parameters: Borregaard’s 2030 target of reducing greenhouse gas emissions (scope 1 and 2) by 53% compared with 2009 as approved by the Science Based Target Initiative, reduction of the Group’s total recordable injuries and finally, keeping emissions of organic compounds to the Glomma river below certain levels.
SUSTAINABILITY REPORTINGBorregaard has disclosed information on the subject “Climate” to the non-profit CDP investor initiative since 2015. The initiative has evolved into an internationally leading system for climate and environmental reporting and is backed by more than 515 institutional investors and 150 major purchasers. The goal of CDP is to enable companies to measure and manage environmental impact. We have been highlighted as a global leader in corporate climate action by environmental impact, achieving a place on the CDP Climate Change “A List” for our reporting in 2018, 2019 and 2020, as one of a small number of high-performing companies out of thousands that were rated. In 2020, Borregaard also reported on the subject “Forest” for the first time and received the score “B”. In 2021, we plan to disclose information to CDP on all three subjects: Climate, Water and Forests.
EU’S TAXONOMY The EU taxonomy is a classification system, establishing a list of environmentally sustainable economic activities. This system is an important enabler to scale up sustainable investments and a tool to help navigate the transition to a low carbon, resilient and resource efficient economy for investors and companies. The specific guidelines and requirements for the taxonomy are still in the development phase and it is not clear how the different industries will be affected.
Borregaard’s biorefinery concept, with low-carbon emission products from natural renewable raw materials, makes a substantial contribution to the climate change mitigation. Our processes and products are integrated in value chains that supports and enables transitions to a circular economy. Innovation of new climate friendly products is an important enabling activity in alignment with taxonomy’s definition of the manufacturing of low-carbon products.
The reporting requirements for sustainable financing (“Taxonomy”) in EU are under development. Borregaard is performing an assessment to identify which of our activities are taxonomy eligible. We monitor the EU process and will make necessary preparations for future reporting.
Borregaard complies with the UN Global compact’s ten principles of conducting business in the areas of human rights, labour, environment, and anti-corruption, which means that our activities are taxonomy eligible for the minimum safeguards.
MAIN AREASOur most important and material sustainability topics are described in more detail through chapters A to D in this
sustainability report and reflect the company’s four main areas:
Climate andenvironmental engagement
B
Main areas A) Sustainable business model B) Climate, Environment, health and safety
C) Employee and competence development
D) Suppliers and business partners
E) Contribution to society
Care for people and competence
development
C
Main areas A) Sustainable business model B) Climate, Environment, health and safety
C) Employee and competence development
D) Suppliers and business partners
E) Contribution to society
Contribution to society and economic ripple
effects
D
Main areas A) Sustainable business model B) Climate, Environment, health and safety
C) Employee and competence development
D) Suppliers and business partners
E) Contribution to society
A SUSTAINABLE BUSINESS MODEL
Main areas A) Sustainable business model B) Climate, Environment, health and safety
C) Employee and competence development
D) Suppliers and business partners
E) Contribution to society
Our understanding of sustainability and corporate responsibility derives from the fact that our business model itself, the way we run our company and the products we produce, is sustainable and meets global needs. Borregaard’s wood-based products are alternatives to petroleum-based products. The wood is harvested from sustainable sources and we are constantly working to reduce our carbon footprint and the total environmental impact of our production processes. Innovation plays an
important role in improvements, both in terms of reducing process emissions and improving product performance.
Throughout 2020, Borregaard implemented several measures that strengthened and developed the Group’s business model from a sustainability perspective, the results, plans and targets for this work are discussed in this chapter.
A
Main areas A) Sustainable business model B) Climate, Environment, health and safety
C) Employee and competence development
D) Suppliers and business partners
E) Contribution to society
Sustainable business model

4342 SUSTAINABILITY AND CORPORATE RESPONSIBILITY
PLANT NUTRITION
FEED
GLUE
EDTA (Ethylenediaminetetraacetic acid) is an oil-based chemical that binds and holds on to micronutrients. Micronutrients provide nourishment to plants and help them grow healthier and larger and thereby helps to improve sustainable food production. By replacing EDTA with Borregaard’s wood-based biopolymers, CO2 emissions can be reduced by 90%.
By-products from the fishing and aquaculture industry, such as waste from fish farming, gutting and the further processing of fish, can be conserved and turned into valuable feed products for farm animals. When conserving the by-products, the most common preservative is formic acid. This acid requires a lot of energy to produce and creates the toxic gas carbon monoxide during the manufacturing process. Borregaard’s wood-based biopolymers can replace formic acid in the silage process and thereby reduce CO2 emissions linked to the conservation of by-products by 19%. Borregaard’s biopolymers are also significantly less corrosive than formic acid, which improves the safety of the people involved in the conservation process.
Plywood boards are widely used for roofing and flooring in house building, as well as for furniture construction. When these boards are produced, they are glued with a petrochemical-based polymer called phenolic resin. By replacing phenolic resin with Borregaard’s wood-based biopolymers, producers of plywood boards can reduce the CO2 emissions linked to these boards by 68% per raw material unit.
SUSTAINABLE SOLUTIONS
DUST SUPPRESSION Salts are often used to suppress dust on gravel roads. Commonly used salts, such as magnesium chloride and calcium chloride, require a lot of energy to produce and represent environmental concerns regarding accumulation in soilh. By replacing these salts with Borregaard’s wood-based biopolymers, CO2 emissions linked to the dust suppression can be reduced by more than 70%.
ROAD STABILISATION
CONSTRUCTION (PCE)
VANILLA FLAVOUR
Bitumen and cement are commonly used to improve the quality of roads by stabilising road foundations. Bitumen is produced from crude oil and cement is produced mainly from inorganic clays. Both manufacturing processes are known to have a high CO2 footprint. By replacing cement or bitumen with Borregaard’s wood-based biopolymers, CO2 emissions linked to road stabilisation can be reduced by more than 80%.
Concrete is used to make buildings, bridges and other construction material. Plasticisers are dispersants used in concrete to increase the flow of the material and decrease the water going into the concrete. By replacing synthetic plasticisers with wood-based biopolymers, CO2 emissions can be reduced by 50%-88%.
Vanilla is one of the world’s most used flavourings in food, drinks and perfume. However, the natural vanilla bean covers less than 0.5% of the worldwide demand. Consequently, the vanilla bean is often replaced by vanillin, an artificial vanilla flavour most commonly made from mineral oil. In fact, 90% of vanilla taste and smell derives from petrochemical alternatives. Borregaard is the world’s only producer of wood-based vanillin. By replacing oil-based vanillin with vanillin from wood in a chocolate, the CO2 emissions linked to the vanillin are reduced by over 95%.
BIOFUELSSecond-generation biofuels are fuels that can be manufactured from various types of non-food biomass such as wood. Borregaard is one of the world’s largest producers of second-generation biofuels. By replacing petrol with Borregaard's bioethanol in a vehicle, CO2 emissions are reduced by over 85%.
/ 2.4 By 2030, ensure sustainable food production systems and implement resilient agricultural practices that increase productivity and production, that help maintain ecosystems, that strengthen capacity for adaptation to climate change, extreme weather, drought, flooding and other disasters and that progressively improve land and soil quality./ 12.4 By 2020, achieve the environmentally sound management of chemicals and all wastes throughout their life cycle, in accordance with agreed international frameworks, and significantly reduce their release to air, water and soil in order to minimise their adverse impacts on human health and the environment./ 14.1 By 2025, prevent and significantly reduce marine pollution of all kinds, in particular from land-based activities, including marine debris and nutrient pollution./ 9.4 By 2030, upgrade infrastructure and retrofit industries to make them sustainable, with increased resource-use efficiency and greater adoption of clean and environmentally sound technologies and industrial processes, with all countries taking action in accordance with their respective capabilities./ 15.1 By 2020, ensure the conservation, restoration and sustainable use of terrestrial and inland freshwater ecosystems and their services, in particular forests, wetlands, mountains and drylands, in line with obligations under international agreements.
/ 15.2 By 2020, promote the implementation of sustainable management of all types of forests, halt deforestation, restore degraded forests and substantially increase afforestation and reforestation globally./ 12.2 By 2030, achieve the sustainable management and efficient use of natural resources./ Reference: Tiwari, Athena; Rachlin, Joseph W., 2018; A Review of Road Salt Ecological Impacts. Northeastern Naturalist, 25/1,123-142 3/2018./ 7.2: By 2030, increase substantially the share of renewable energy in the global energy mix./ By 2030, enhance inclusive and sustainable urbanization and capacity for participatory, integrated and sustainable human settlement planning and management in all countries./ Integrate climate change measures into national policies, strategies and planning.
SUSTAINABILITY AND CORPORATE RESPONSIBILITY

4544 SUSTAINABILITY AND CORPORATE RESPONSIBILITYSUSTAINABILITY AND CORPORATE RESPONSIBILITY
SUSTAINABLE AND CLIMATE FRIENDLY PRODUCTS
Sustainability dimensions in customer solutions Borregaard’s products solve different challenges for different customers. Most customers purchase our products primarily for their performance. However, the interest in sustainable solutions among existing and potential customers is increasing.
Some of our customers buy our products because of their low carbon footprint. Borregaard’s wood-based bioethanol is a good example of this. Compared with petrol, this second-generation alternative has 85% lower greenhouse gas emissions.
Other customers, especially those who operate in consumer markets, prefer using natural ingredients or ingredients made from natural raw materials in their products. The market for Borregaard’s biovanillin is growing rapidly. This trend is expected to continue and is likely to be reinforced in parallel with the world’s growing sustainability focus.
Health and safety aspects influence customers’ purchasing behaviour. Borregaard’s wood-based products represent a non-toxic substitute for chemicals with negative health exposure. Our biopolymers and cellulose fibrils are good examples of products replacing harmful chemicals in applications such as coatings, agriculture and adhesives.
Borregaard produces sustainable crop solutions, including crop nutrition. For example, when used in the production of corn, vegetables and fruits, Borregaard’s biopolymers improve efficiency, increase the plants’ resistance to stress and enhance crop quality.
These are all examples that show how our products play their part in solving global sustainability challenges in line with UN’s Sustainable Development Goals 2: Zero hunger and 13: Climate action.
Environmental documentation Borregaard has engaged an independent third party, Norsus, to conduct a life cycle assessment (LCA) based on the ISO 14044/48 standard. The LCA analyses the environmental impacts of Borregaard’s products, from raw materials to finished products. The study was carried out
for the first time in 2008 and has since been updated on several occasions, most recently in 2015. The LCA confirms that the negative environmental and climate impacts of Borregaard’s products and processes have diminished over time.
Further assessments in which some of Borregaard’s products were compared with competing oil-based alternatives, confirmed that our products provide better environmental performance than the alternatives in almost all environmental categories. This demonstrates environmental benefits from replacing the alternatives with our products. In 2020, Norsus revised the LCA calculations with updated data on the impact of changes in input factors such as raw materials, chemicals, energy use, transportation, emissions, waste and water consumption. The revised data will be published in the first half of 2021.
Certification is an important part of Borregaard’s sustainability documentation and all our disclosed ESG documentation is assured by an independent third party (see page 140 for EY’s verification report). Borregaard’s second generation bioethanol has an ISCC EU sustainability certification. In addition, several of our cellulose fibrils and biopolymers are certified through the US Department of Agriculture (USDA) BioPreferred program®.
The standards for sustainability documentation are moving towards strict use of third party verified data, standardised methods for calculation of biogenic CO2 and more comprehensive product category rules to define environmental impact. This development is important to avoid greenwashing, and improved standards make comparison between different products more accurate.
Sustainability dilemmas Although Borregaard’s products consistently have good climate and environmental performance, some end applications still represent dilemmas. Examples of such applications are oil extraction, fossil energy systems, selected crop protection products and cigarette filters.
Borregaard’s exposure to such applications is limited. However, Borregaard’s products either represent an improvement in an established value chain or can with further innovation efforts be used in the manufacturing of products to more sustainable applications. Consequently, these products may represent new sustainable long-term opportunities.
STRONG INNOVATION EFFORTS
Strong innovation efforts is one of Borregaard’s strategic priorities. Long-standing research and development have resulted in solutions that respond to important long-term global challenges. To maintain our position as the world’s most advanced biorefinery, Borregaard is dependent on developing the biorefinery concept by finding new bio-based raw materials, as well as new products with high value and good environmental profile.
Borregaard’s innovation success is a result of world class in-house R&D and close co-operation between sales, manufacturing, customers and external institutes and universities in several countries. High focus on continuous improvement leads to better ways of making products through new use of technology, digitalisation, competence development and a more efficient organisation.
Borregaard’s R&D and innovation efforts in 2020 amounted to NOK 193 million. This represents 3.6% of the company’s revenues. The development of new bio-based products continued and the innovation rate for 2020 was 17.7%11.
We have an innovation team of 89 employees, including 28 PhDs. Central R&D is located in Sarpsborg, Norway, which at year-end 2020 employed 67 people from 7 different countries. R&D activities also take place at the R&D centres in India and the US. Each R&D unit represents a centre of excellence with targeted collaboration with customers, universities and research institutes in several countries.
In 2020, Borregaard recognised NOK 40 million (NOK 60 million) in support for ongoing R&D projects, mainly from the EU’s Horizon 202012 programme, the Research Council of Norway, Innovation Norway and Skattefunn13.
/ 11 Innovation rate = sales of new products and applications introduced during the previous five years./ 12 Support from the Bio-Based Industries Joint Undertaking (BBI) under the EU’s Horizon 2020 research and innovation programme in grant agreement no. 709746/ 13 A government program designed to stimulate research and development (R&D) in Norwegian trade and industry
PRODUCT SAFETY Borregaard’s main products are lignin-based biopolymers and speciality cellulose, representing about 80% of our revenues. Both are exempted from registration under the REACH regulation, which means their use is associated with low risk. About 20% of our revenues are from products that are subject to classification according to the Globally Harmonized System of Classification and Labelling of Chemicals (GHS).
Substances which are subject to registration under the REACH regulation undergo a thorough hazard and risk assessment according to regulatory requirements. An electronic chemical health, environmental and safety system is used for the identification and monitoring of substances of concern: REACH Candidate List and REACH Authorisation List. Borregaard does not produce substances included in these lists. The classification according to the Classification, Labelling and Packaging (CLP) Regulation of all products placed
on the market is being evaluated based on intrinsic properties of the ingredients and/or toxicological data on the product. The Safety Data Sheets are regularly revised and updated. The risks for hazardous conditions and unexpected exposure due to use of chemicals at Borregaard are considered to be low.
In order to be compliant with upcoming regulations such as “UK REACH” in the United Kingdom and “KKDIK” in Turkey, Borregaard is preparing for the registration of relevant substances for those markets. International and national chemicals legislation require tests and registrations with the authorities before products can be safely and legally placed on the market. Animal testing might therefore be necessary in some exceptional cases in order to ensure compliance with relevant directives. A procedure for approval and performance of animal testing is in place. The main part of testing performed in recent years has been for the purpose of animal feed applications.

4746 SUSTAINABILITY AND CORPORATE RESPONSIBILITY SUSTAINABILITY AND CORPORATE RESPONSIBILITY
Key initiatives 2021: Continued innovation and market developmentSince 2015, Borregaard has invested close to NOK 2 billion in projects aimed at increasing both the value-added, production capacity and sustainability performance of our wood-based products: A new biopolymer plant in Florida, an upgrade of the biopolymer operation in Sarpsborg, the instalment of Borregaard’s Ice Bear technology for high purity speciality cellulose, a new commercial size cellulose fibrils plant as well as an expansion of the biovanillin capacity in Sarpsborg that will be completed in 2021.
In 2021, we will continue the emphasis on ESG aspects across the entire value chain; all the way from reducing negative impacts related to the sourcing of raw materials, to reducing emissions related to production, as well as the transportation of products to our customers. New digital solutions are being developed and implemented in production, maintenance, marketing, finance and general administration to improve our business model.
Efforts to increase market awareness of our sustainable products have been a prioritised activity in 2020. Documentation of ESG aspects through life cycle analyses (LCA) and environmental product declarations (EPD) is an integral part of these efforts. The LCA confirms that the environmental and climate impacts of our products and processes have diminished over time. Comparisons with competing products also confirm that Borregaard’s wood-based alternatives provide a significantly better environmental performance than oil-based alternatives. In 2021 we will publish new Environmental Product Datasheets (EPDs) for Borregaard’s products.
We continue to see business opportunities in several markets where our bio-based products can contribute to improved sustainability in different value chains. Going forward, Borregaard’s strategic priorities lie within specialisation through innovation and market development for our wood-based products.
Targeted investments improving our ability to make higher value-added products have been, and will continue to be, a cornerstone in the development of Borregaard over time. By focusing our efforts on innovation and productivity, we will increase the value added from our unique biorefinery in Sarpsborg, Norway.
Finally, we will continue the development of our radical innovations, like our cellulose fibrils business, through
continued market development across multiple applications and geographies.
FOREST RAW MATERIAL
Borregaard transforms forest raw material into high value-added products that can replace oil-based products. Because the products are made from a renewable source, they have a low carbon footprint.
Wood is one of the few renewable raw materials that can be produced in large quantities. Forests are important from a climate perspective. While trees are growing, they capture and store CO2 from the atmosphere. As the trees grow old, they capture less CO2 and are ready to be harvested to become biomass for sustainable products that can replace oil-based alternatives.
The transition to a society based on renewable and sustainable solutions with low carbon footprint has resulted in an increased market for wood-based products and hence increased costs for wood raw material. At the same time, Norwegian forests are increasing in size. The standing stock of wood in Norway has grown by 10 million m3 between 2013 and 2017, and the standing volume of spruce has increased 2.7 times, to 419 million m3, over the past 100 years (National Forest Inventory14).
To minimise the impact from felling, Borregaard attaches great importance to sourcing wood from forests that are certified and managed in a proper, sustainable, and eco-friendly manner, including measures to maintain biodiversity. The company ensures that our suppliers comply with the applicable guidelines, laws, and regulations in the countries where the wood is sourced.
To secure the supply of wood, Borregaard has long-term relations with major suppliers that secure supplier development and predictable supplier conditions. Borregaard continuously develops the wood logistics to secure supply channels for wood in the Nordic market, including the Baltic sea region, to increase the sourcing area and lower the landed cost for wood. There are few restrictions in the supply of wood to the site in Sarpsborg, where wood can be supplied by road, rail and sea.
One million solid cubic metres of wood is purchased each year for Borregaard’s biorefinery in Sarpsborg. In 2020, 77%
/ 14 https://www.nibio.no/en/subjects/forest/national-forest-inventory
of the wood came from Norway, 21% came from Sweden and the remaining 2% came from Germany. All the wood is harvested in accordance with the country of origin’s laws on felling, silviculture and biodiversity. Borregaard is Chain of Custody (CoC) certified in accordance with the FSC® and PEFC forest certification standards. In 2020, 98% of the purchased wood was certified. The rest of the purchased wood is controlled in accordance with PEFC15 and/or FSC®16 standards.
Borregaard’s production units outside Norway receive lignin raw material from adjacent pulp mills which purchase FSC® and/or PEFC certified or controlled wood.
Borregaard does not purchase: • Illegally harvested wood • Wood harvested in violation of traditional and human
rights • Wood from forests in which high conservation values
are threatened by management activities• Wood from forests being converted to plantations or
non-forest use; and• Wood from forests in which genetically modified trees
are planted
/ 15 www.pefc.org/ 16 https://www.fsc-uk.org/en-uk/business-area/fsc-certificate-types/controlled-wood/ 17 IPCC, 2019: Summary for Policymakers. In: Climate Change and Land: an IPCC special report on climate change, desertification, land degradation, sustainable land management, food security, and greenhouse gas fluxes in terrestrial ecosystems [P.R. Shukla, J. Skea, E. Calvo Buendia, V. Masson-Delmotte, H.-O. Pörtner, D. C. Roberts, P. Zhai, R. Slade, S. Connors, R. van Diemen, M. Ferrat, E. Haughey, S. Luz, S. Neogi, M. Pathak, J. Petzold, J. Portugal Pereira, P. Vyas, E. Huntley, K. Kissick, M. Belkacemi, J. Malley, (eds.)]. In press.
The 2019 UN Special Report on Climate Change and Land17 shows that land use plays a vital role in the climate system. The use of land contributes to emissions, but also uptake of CO2. Land provides the principal basis for human livelihoods and well-being, including the supply of food, freshwater and multiple other ecosystem services, as well as biodiversity.
Land is both a source and a sink of greenhouse gases and plays a key role in the exchange of energy, water and aerosols between the land surface and atmosphere. Land ecosystems and biodiversity are vulnerable to ongoing climate change. Sustainable land management can contribute to reducing the negative impacts of multiple stressors, including climate change, on ecosystems and societies. In the area of forestry, deforestation is a threat to both climate and biodiversity. Changes in forest cover, for example from planting and replanting trees and permanently removing forests, directly affect regional surface temperature.
Some land-related actions are already being taken that contribute to climate change adaptation, mitigation and
sustainable development. Planting forests in new areas, reduced deforestation and increased use of bioenergy are central among these. Depending on population growth and technology development, the report shows that forest cover must change by between -2 and 12 million km.
However, if bioenergy crops and forests are cultivated in new areas to a large extent, this can put pressure on the land, leading to reduced food security and water shortages. On the other hand, climate measures can be implemented in ways that do not compete with the land area, such as reduced crop losses and food waste, greater efficiency in food production, dieting, forestry and increasing the carbon content in soil.
The black carbon from oil, coal and gas for energy production must be replaced by sustainable alternatives such as water, wind and forests. Transitioning from a fossil-based society to a renewable society also means that the world will need all the wood that can be harvested within a sustainable framework from the world’s forests. Deforestation must be substantially
USE OF FORESTS AS A CLIMATE ACTION Forests play an important role in the battle against climate change. The use of land as a climate action can be an important contribution to emission reduction.
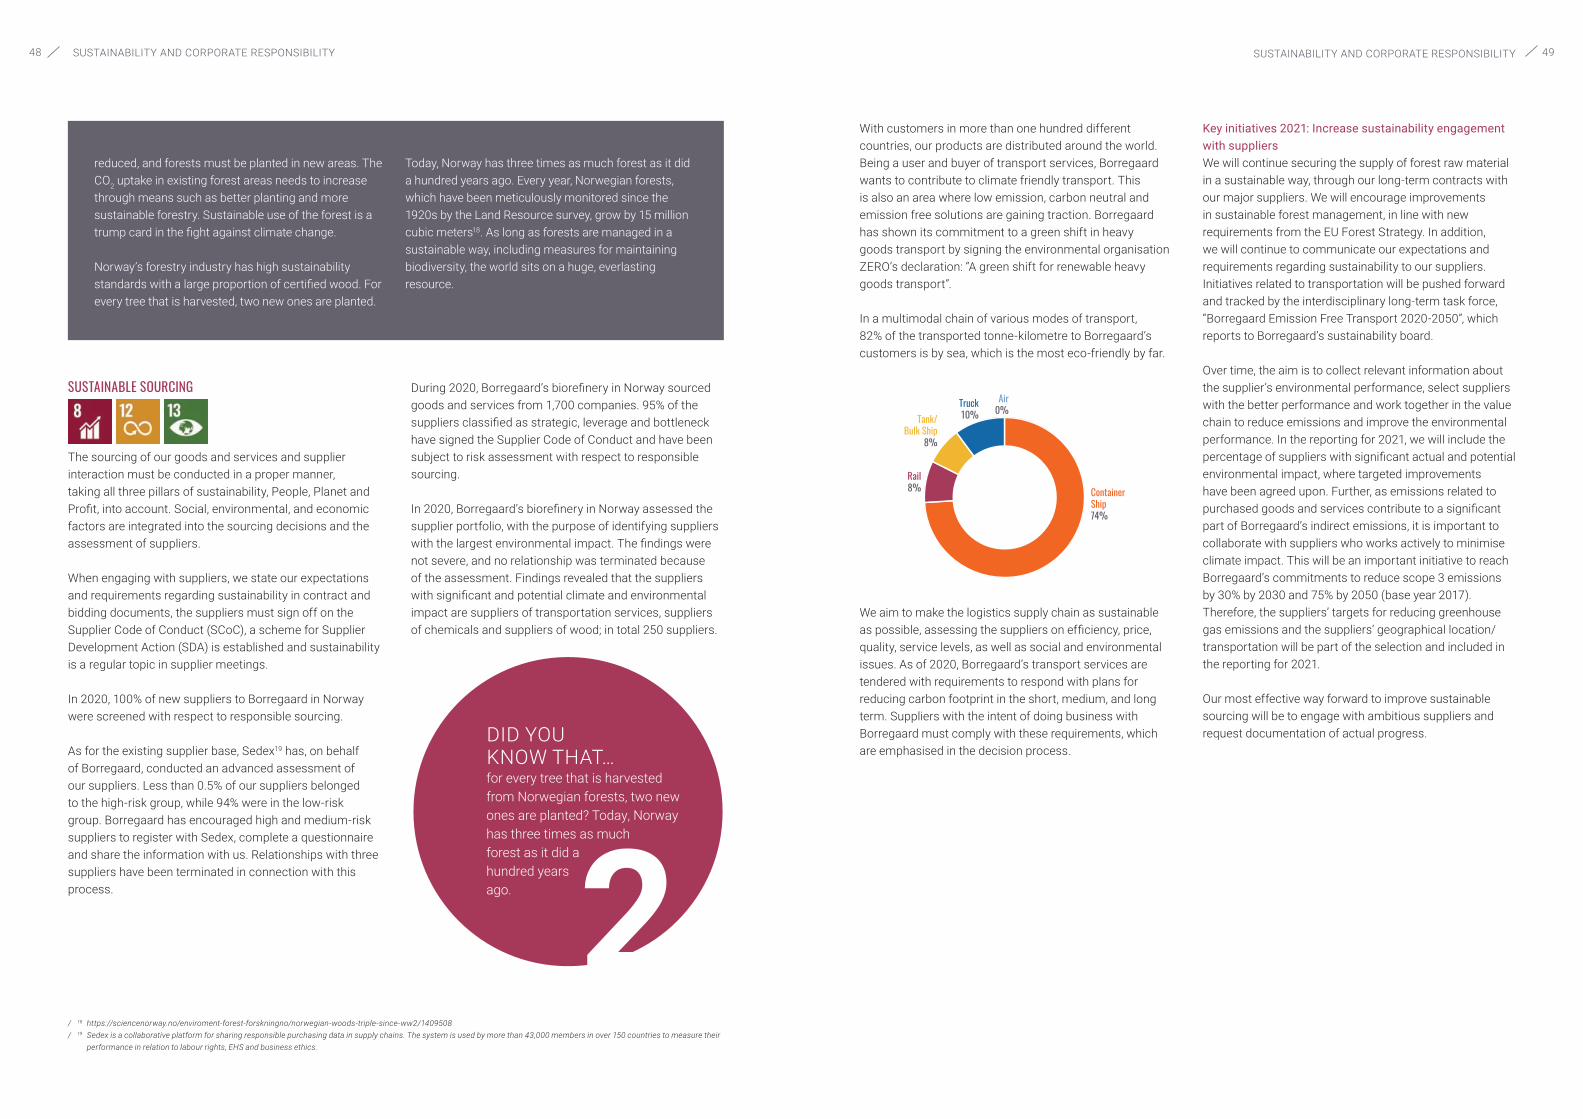
4948 SUSTAINABILITY AND CORPORATE RESPONSIBILITY SUSTAINABILITY AND CORPORATE RESPONSIBILITY
reduced, and forests must be planted in new areas. The CO2 uptake in existing forest areas needs to increase through means such as better planting and more sustainable forestry. Sustainable use of the forest is a trump card in the fight against climate change.
Norway’s forestry industry has high sustainability standards with a large proportion of certified wood. For every tree that is harvested, two new ones are planted.
Today, Norway has three times as much forest as it did a hundred years ago. Every year, Norwegian forests, which have been meticulously monitored since the 1920s by the Land Resource survey, grow by 15 million cubic meters18. As long as forests are managed in a sustainable way, including measures for maintaining biodiversity, the world sits on a huge, everlasting resource.
/ 18 https://sciencenorway.no/enviroment-forest-forskningno/norwegian-woods-triple-since-ww2/1409508/ 19 Sedex is a collaborative platform for sharing responsible purchasing data in supply chains. The system is used by more than 43,000 members in over 150 countries to measure their performance in relation to labour rights, EHS and business ethics.
SUSTAINABLE SOURCING
The sourcing of our goods and services and supplier interaction must be conducted in a proper manner, taking all three pillars of sustainability, People, Planet and Profit, into account. Social, environmental, and economic factors are integrated into the sourcing decisions and the assessment of suppliers.
When engaging with suppliers, we state our expectations and requirements regarding sustainability in contract and bidding documents, the suppliers must sign off on the Supplier Code of Conduct (SCoC), a scheme for Supplier Development Action (SDA) is established and sustainability is a regular topic in supplier meetings.
In 2020, 100% of new suppliers to Borregaard in Norway were screened with respect to responsible sourcing.
As for the existing supplier base, Sedex19 has, on behalf of Borregaard, conducted an advanced assessment of our suppliers. Less than 0.5% of our suppliers belonged to the high-risk group, while 94% were in the low-risk group. Borregaard has encouraged high and medium-risk suppliers to register with Sedex, complete a questionnaire and share the information with us. Relationships with three suppliers have been terminated in connection with this process.
During 2020, Borregaard’s biorefinery in Norway sourced goods and services from 1,700 companies. 95% of the suppliers classified as strategic, leverage and bottleneck have signed the Supplier Code of Conduct and have been subject to risk assessment with respect to responsible sourcing.
In 2020, Borregaard’s biorefinery in Norway assessed the supplier portfolio, with the purpose of identifying suppliers with the largest environmental impact. The findings were not severe, and no relationship was terminated because of the assessment. Findings revealed that the suppliers with significant and potential climate and environmental impact are suppliers of transportation services, suppliers of chemicals and suppliers of wood; in total 250 suppliers.
With customers in more than one hundred different countries, our products are distributed around the world. Being a user and buyer of transport services, Borregaard wants to contribute to climate friendly transport. This is also an area where low emission, carbon neutral and emission free solutions are gaining traction. Borregaard has shown its commitment to a green shift in heavy goods transport by signing the environmental organisation ZERO’s declaration: “A green shift for renewable heavy goods transport”.
In a multimodal chain of various modes of transport, 82% of the transported tonne-kilometre to Borregaard’s customers is by sea, which is the most eco-friendly by far.
We aim to make the logistics supply chain as sustainable as possible, assessing the suppliers on efficiency, price, quality, service levels, as well as social and environmental issues. As of 2020, Borregaard’s transport services are tendered with requirements to respond with plans for reducing carbon footprint in the short, medium, and long term. Suppliers with the intent of doing business with Borregaard must comply with these requirements, which are emphasised in the decision process.
Key initiatives 2021: Increase sustainability engagement with suppliers We will continue securing the supply of forest raw material in a sustainable way, through our long-term contracts with our major suppliers. We will encourage improvements in sustainable forest management, in line with new requirements from the EU Forest Strategy. In addition, we will continue to communicate our expectations and requirements regarding sustainability to our suppliers. Initiatives related to transportation will be pushed forward and tracked by the interdisciplinary long-term task force, “Borregaard Emission Free Transport 2020-2050”, which reports to Borregaard’s sustainability board.
Over time, the aim is to collect relevant information about the supplier’s environmental performance, select suppliers with the better performance and work together in the value chain to reduce emissions and improve the environmental performance. In the reporting for 2021, we will include the percentage of suppliers with significant actual and potential environmental impact, where targeted improvements have been agreed upon. Further, as emissions related to purchased goods and services contribute to a significant part of Borregaard’s indirect emissions, it is important to collaborate with suppliers who works actively to minimise climate impact. This will be an important initiative to reach Borregaard’s commitments to reduce scope 3 emissions by 30% by 2030 and 75% by 2050 (base year 2017). Therefore, the suppliers’ targets for reducing greenhouse gas emissions and the suppliers’ geographical location/transportation will be part of the selection and included in the reporting for 2021.
Our most effective way forward to improve sustainable sourcing will be to engage with ambitious suppliers and request documentation of actual progress.
Borregaard Deutschland Container Ship61%
Borregaard Deutschland Truck
39%
Borregaard Deutschland Container Ship61%
Borregaard Deutschland Truck
39%
Truck10%
Container Ship74%
Rail8%
Tank/Bulk Ship8%
Air0%
Truck10%
Container Ship74%
Rail8%
Tank/Bulk Ship
8%
Air0%
DID YOU KNOW THAT… for every tree that is harvested from Norwegian forests, two new ones are planted? Today, Norway has three times as much forest as it did a hundred years ago.

5150 SUSTAINABILITY AND CORPORATE RESPONSIBILITY SUSTAINABILITY AND CORPORATE RESPONSIBILITY
KEY TARGETS 2021 SDG
Sustainable and climate friendly products
Continued development of new bio-based products 13.2
Strong innovation effort
An innovation rate of 15% 9.5 & 17.16
Forest raw materials
100% of the purchased wood to the biorefinery in Sarpsborg shall be certified (FSC® or PEFC) 15.1 & 15.2
Establish KPIs based on documentation for sourcing of lignin raw material 15.1 & 15.2
Sustainable sourcing
All new suppliers subject to approval in accordance with established policies and procedures (Borregaard Group) 8.5
5 supplier audits (Sarpsborg) 8.5
Identify actions for reducing scope 3 emissions related to purchasing 13.2
CO2 emissions from the various Mode of Transportation (MOT) included in selection criterias 13.2
RESULTS OF KEY TARGETS IN 2020 AND KEY TARGETS FOR 2021
KEY TARGETS 2020 Results Comments SDG
Sustainable and climate friendly products
Continued development of new bio-based products Achieved 13.2
Increased sales and production of bio-based products Partly achieved 13.2
Further improvement of sustainability from an LCA perspective Achieved Lower emissions 13.2
Strong innovation effort
An innovation rate of 15% Achieved 17.7% 9.5 & 17.16
Sustainable sourcing
All new suppliers subject to approval in accordance with established policies and procedures (Sarpsborg) Achieved 8.5
10 supplier audits (Sarpsborg) Partly achievedEight conducted. Two not, due to Covid-19 8.5
Improved documentation of environmental and climate footprint AchievedImproved documentation from suppliers. Continues in 2021 13.2
Standardised text containing Borregaard's objectives and expectations included in requests and documents Achieved
Category specific requirements implemented Achieved
Actions completed for all SDAs Achieved 8.5
Increase rail transport of logs to 23% (Sarpsborg) Achieved 13.2
Surpass 40,000 mt by sea to Europe in 2020 (Sarpsborg) Achieved 13.2
85% of road transport by minimum Euro 6 engines (Sarpsborg) Achieved 13.2
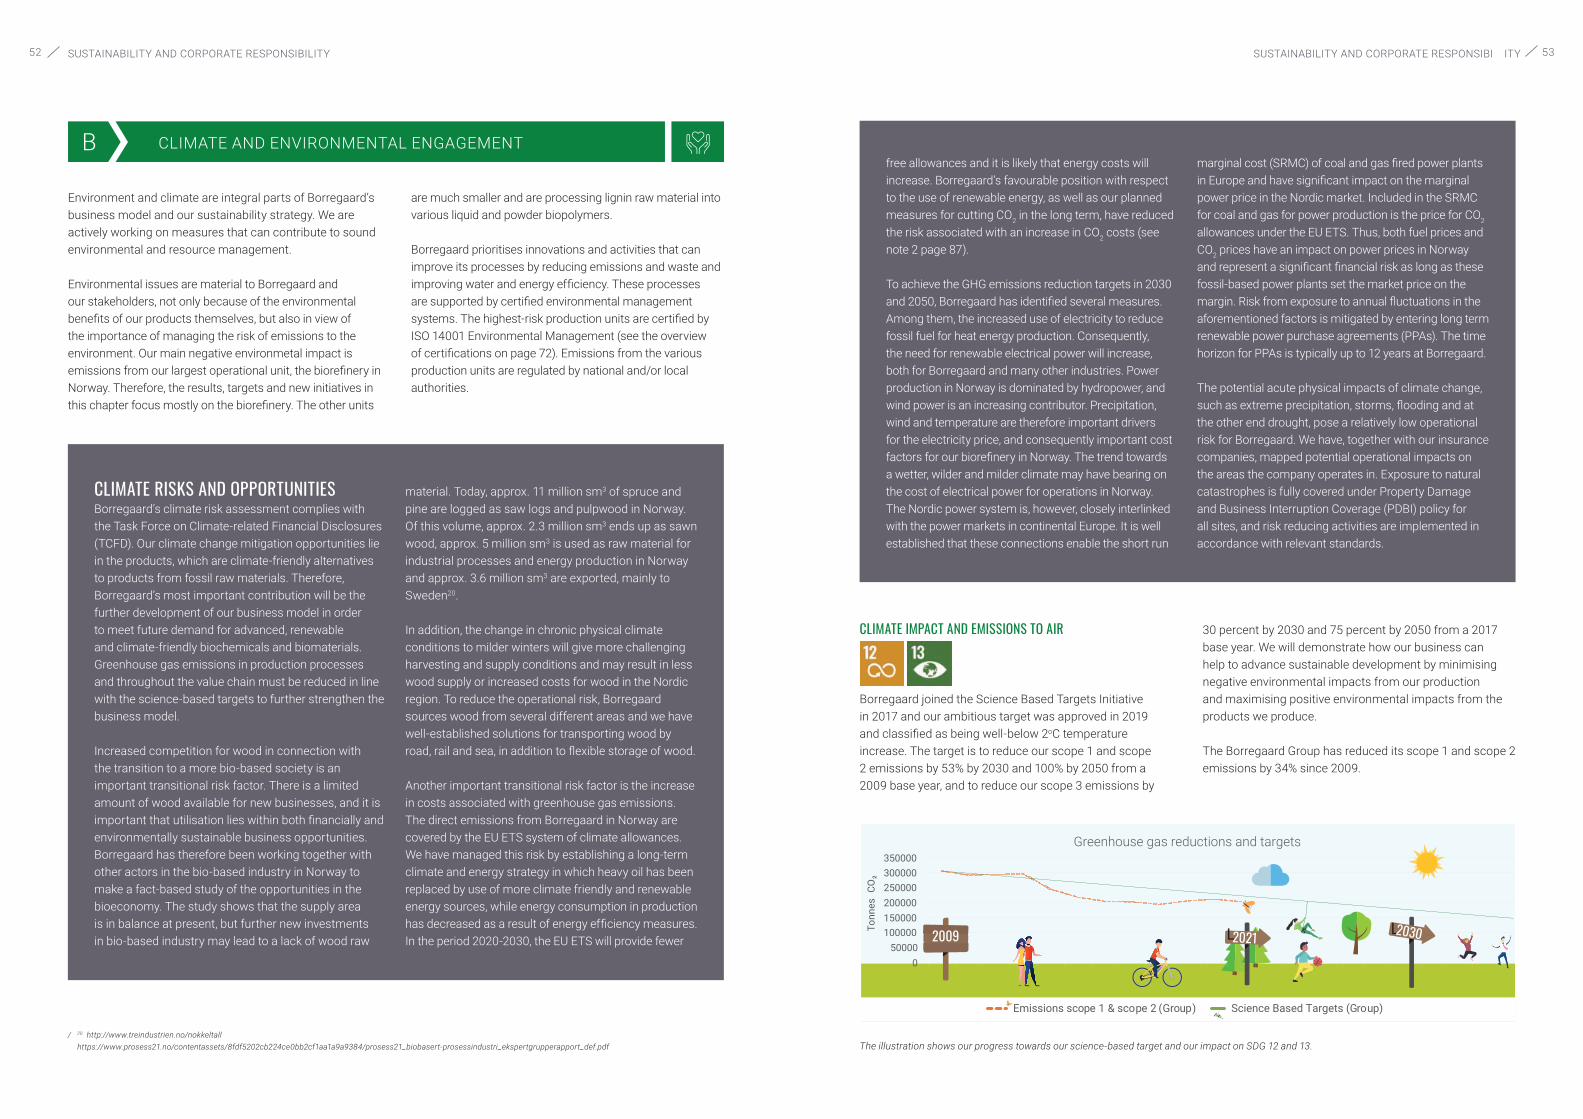
5352 SUSTAINABILITY AND CORPORATE RESPONSIBILITY
Environment and climate are integral parts of Borregaard’s business model and our sustainability strategy. We are actively working on measures that can contribute to sound environmental and resource management.
Environmental issues are material to Borregaard and our stakeholders, not only because of the environmental benefits of our products themselves, but also in view of the importance of managing the risk of emissions to the environment. Our main negative environmetal impact is emissions from our largest operational unit, the biorefinery in Norway. Therefore, the results, targets and new initiatives in this chapter focus mostly on the biorefinery. The other units
are much smaller and are processing lignin raw material into various liquid and powder biopolymers.
Borregaard prioritises innovations and activities that can improve its processes by reducing emissions and waste and improving water and energy efficiency. These processes are supported by certified environmental management systems. The highest-risk production units are certified by ISO 14001 Environmental Management (see the overview of certifications on page 72). Emissions from the various production units are regulated by national and/or local authorities.
B CLIMATE AND ENVIRONMENTAL ENGAGEMENT
Main areas A) Sustainable business model B) Climate, Environment, health and safety
C) Employee and competence development
D) Suppliers and business partners
E) Contribution to society
SUSTAINABILITY AND CORPORATE RESPONSIBILITY
CLIMATE IMPACT AND EMISSIONS TO AIR
Borregaard joined the Science Based Targets Initiative in 2017 and our ambitious target was approved in 2019 and classified as being well-below 2oC temperature increase. The target is to reduce our scope 1 and scope 2 emissions by 53% by 2030 and 100% by 2050 from a 2009 base year, and to reduce our scope 3 emissions by
30 percent by 2030 and 75 percent by 2050 from a 2017 base year. We will demonstrate how our business can help to advance sustainable development by minimising negative environmental impacts from our production and maximising positive environmental impacts from the products we produce.
The Borregaard Group has reduced its scope 1 and scope 2 emissions by 34% since 2009.
/ 20 http://www.treindustrien.no/nokkeltall https://www.prosess21.no/contentassets/8fdf5202cb224ce0bb2cf1aa1a9a9384/prosess21_biobasert-prosessindustri_ekspertgrupperapport_def.pdf
CLIMATE RISKS AND OPPORTUNITIES Borregaard’s climate risk assessment complies with the Task Force on Climate-related Financial Disclosures (TCFD). Our climate change mitigation opportunities lie in the products, which are climate-friendly alternatives to products from fossil raw materials. Therefore, Borregaard’s most important contribution will be the further development of our business model in order to meet future demand for advanced, renewable and climate-friendly biochemicals and biomaterials. Greenhouse gas emissions in production processes and throughout the value chain must be reduced in line with the science-based targets to further strengthen the business model.
Increased competition for wood in connection with the transition to a more bio-based society is an important transitional risk factor. There is a limited amount of wood available for new businesses, and it is important that utilisation lies within both financially and environmentally sustainable business opportunities. Borregaard has therefore been working together with other actors in the bio-based industry in Norway to make a fact-based study of the opportunities in the bioeconomy. The study shows that the supply area is in balance at present, but further new investments in bio-based industry may lead to a lack of wood raw
material. Today, approx. 11 million sm3 of spruce and pine are logged as saw logs and pulpwood in Norway. Of this volume, approx. 2.3 million sm3 ends up as sawn wood, approx. 5 million sm3 is used as raw material for industrial processes and energy production in Norway and approx. 3.6 million sm3 are exported, mainly to Sweden20.
In addition, the change in chronic physical climate conditions to milder winters will give more challenging harvesting and supply conditions and may result in less wood supply or increased costs for wood in the Nordic region. To reduce the operational risk, Borregaard sources wood from several different areas and we have well-established solutions for transporting wood by road, rail and sea, in addition to flexible storage of wood.
Another important transitional risk factor is the increase in costs associated with greenhouse gas emissions. The direct emissions from Borregaard in Norway are covered by the EU ETS system of climate allowances. We have managed this risk by establishing a long-term climate and energy strategy in which heavy oil has been replaced by use of more climate friendly and renewable energy sources, while energy consumption in production has decreased as a result of energy efficiency measures. In the period 2020-2030, the EU ETS will provide fewer
free allowances and it is likely that energy costs will increase. Borregaard’s favourable position with respect to the use of renewable energy, as well as our planned measures for cutting CO2 in the long term, have reduced the risk associated with an increase in CO2 costs (see note 2 page 87).
To achieve the GHG emissions reduction targets in 2030 and 2050, Borregaard has identified several measures. Among them, the increased use of electricity to reduce fossil fuel for heat energy production. Consequently, the need for renewable electrical power will increase, both for Borregaard and many other industries. Power production in Norway is dominated by hydropower, and wind power is an increasing contributor. Precipitation, wind and temperature are therefore important drivers for the electricity price, and consequently important cost factors for our biorefinery in Norway. The trend towards a wetter, wilder and milder climate may have bearing on the cost of electrical power for operations in Norway. The Nordic power system is, however, closely interlinked with the power markets in continental Europe. It is well established that these connections enable the short run
marginal cost (SRMC) of coal and gas fired power plants in Europe and have significant impact on the marginal power price in the Nordic market. Included in the SRMC for coal and gas for power production is the price for CO2 allowances under the EU ETS. Thus, both fuel prices and CO2 prices have an impact on power prices in Norway and represent a significant financial risk as long as these fossil-based power plants set the market price on the margin. Risk from exposure to annual fluctuations in the aforementioned factors is mitigated by entering long term renewable power purchase agreements (PPAs). The time horizon for PPAs is typically up to 12 years at Borregaard.
The potential acute physical impacts of climate change, such as extreme precipitation, storms, flooding and at the other end drought, pose a relatively low operational risk for Borregaard. We have, together with our insurance companies, mapped potential operational impacts on the areas the company operates in. Exposure to natural catastrophes is fully covered under Property Damage and Business Interruption Coverage (PDBI) policy for all sites, and risk reducing activities are implemented in accordance with relevant standards.
050000
100000150000200000250000300000350000
Tonn
es C
O₂
Emissions scope 1 & scope 2 (Group) Science Based Targets (Group)
Greenhouse gas reductions and targets
2009 L2030L2021
The illustration shows our progress towards our science-based target and our impact on SDG 12 and 13.

5554 SUSTAINABILITY AND CORPORATE RESPONSIBILITY
Borregaard’s scope 1 and scope 2 emissions86% of Borregaard’s direct GHG emissions in 2020 originated from the biorefinery in Norway, 12% from the company’s operations in the US, 2% from the German operations and some minor emissions from the operation in the Czech Republic and the UK. Borregaard’s operations in Norway and Germany hold ISO 50001 certification for energy management. 92% of the Group’s total energy consumption is covered by certified management systems.
Borregaard’s direct emissions stem mainly from the use of heat energy in the production processes.
Our operations in Norway meet the company’s continuous need for heat energy (base load) in the form of steam through energy recovery from waste, bioenergy and heat recovery from production. Borregaard stopped using heavy fuel oil for steam production in 2013 when a new multifuel boiler that mainly uses liquefied natural gas (LNG) was installed. LNG has 29% lower CO2 emissions per GJ fuel, compared with heavy fuel oil. The variable load production is now based on a combination of LNG and electricity. Therefore, the GHG emissions associated with the production of heat energy will vary from year to year, depending on the energy source for variable load and production volume.
Borregaard has invested in more capacity for production of lignin-based powder products. An investment in a
new spray dryer for biopolymers was completed at Borregaard’s biorefinery in Norway in 2019. At the same time, a more renewable energy mix was implemented. The new biopolymer plant in Florida (2018) increased its powder production in 2019 and 2020 which led to higher direct GHG emissions. In the long term, a more efficient logistical solution will reduce the indirect emission from transportation accordingly.
We have started to work on a long-term action plan to achieve the science-based targets for 2030 and 2050. Reduction in energy consumption with new technologies, availability of more renewable sources like electricity from hydropower and wind, and biogas obtained from Borregaard’s own or local producers are important measures to achieve the company’s ambitious science-based GHG emission reduction targets. Development in technologies for Carbon Capture and Storage (CCS) or sustainable Carbon Capture and Use (CCU) may be a prerequisite to achieve the target in 2050. Therefore, Borregaard’s biorefinery in Norway has signed an agreement with a cluster of companies in the region, and a feasibility study of technologies and value chains for CCS started up in 2020.
Borregaard receives support for energy measures from various government support schemes in order to meet the needs of a low-emission society.
Indirect emissions along the value chain (scope 3) Indirect emissions are not linked to our production processes, but are associated with factors such as transportation of goods and production of raw materials. 64% our GHG emissions are scope 3 emissions. The biorefinery’s products are made from wood (a renewable raw material) and therefore generate no extra CO2 emissions, either in their usage phase or the end of life treatment phase.
We have reported our indirect scope 3 GHG-emissions since 2017, which has provided us with more knowledge about our indirect emissions and how they can be reduced. The quality of the data is continuously improved, and we report on all the categories that are relevant in the value chain. The reporting is carried out in accordance with the GHG Protocol21. Cuts in scope 3 emissions will particularly apply to transport solutions and the procurement of goods and services, and several initiatives are ongoing to reach our science-based target for scope 3 emissions, see chapter A Sustainable sourcing.
SUSTAINABILITY AND CORPORATE RESPONSIBILITY
Other emissions to air and local air qualityBorregaard’s emissions to air of SO2, NOx and dust particles affect local air quality, and derive mainly from the production of energy to the production processes. Spray drying of biopolymers from lignin to powder results in some emissions of NOx (from the fuel) and dust particles (lignin).
Borregaard has put high priority on reduction of emissions to air. Switching from using heavy fuel oil to more eco-friendly alternatives as well as technological installations have reduced our emissions of NOx by 74% since 2010. The emissions from the use of SO2 at the biorefinery in Norway
have been reduced by 86% since 2010 as a result of an investment programme. SO2 emissions from production in Norway derive from cooking acid used to separate lignin from cellulose. These emissions are generally removed by scrubbers, but they also result in some diffuse emissions. The local authorities have set limits for SO2 concentrations in the air, and the municipality monitors local air quality with respect to SO2 content. The measurements show a general reduction in concentrations of SO2, and the local air quality remains within current limits 99% of the time. The target of zero instances of exceeded local air quality limits was achieved in 2020.
Our direct emissions
24 % Indirect emissions
12% Co2
Co2 Scope 2
Scope 3
Scope 1
Indirect emissions along the value chain
RAW MATERIALS PROCESSES PRODUCTS
Natural, renewable, sustainable
Investments in reduced emissions and greener energy sources
Biochemicals that replace petrochemicals
64%
The illustration shows the distribution of our scope 1, 2 and 3 GHG emissions along the value chain, updated with actual results for 2020.
EMISSIONS TO AIR NOx emission tonnes/year
SO2 emission tonnes/year
593571
512
462
322 344
278
172
118
79 8163 67 65
366 373 364 359
276271
223
179208
182159
187
140
91
2007 2008 2009 2010 2011 2012 2013 2014 2015 2016 2017 2018 2019 2020
The illustration shows the reduced emissions from NOx and SO2, positive impact on SDG12 (12.4).
DID YOU KNOW THAT… Borregaard, through The Science Based Targets Initiative, has committed to reducing greenhouse gas emissions by 100% from 2050? (base year 2009)
/ 21 https://ghgprotocol.org/standards

5756 SUSTAINABILITY AND CORPORATE RESPONSIBILITYSUSTAINABILITY AND CORPORATE RESPONSIBILITY
GRI ref GRI indicator for climate impact and emissions to air Unit 2020 2019 2018302 Energy
302-1 Total energy consumption GWh 1,731 1,732 1,665
302-1 Renewable part of total energy consumption GWh 1,177 1,081 1,072
302-1 Amount of heat energy consumption of total energy consumption GWh 1,193 1,204 1,141
302-1 Amount of electricity consumption of total energy consumption GWh 537 528 524302-3 Heat energy consumption at Borregaard Sarpsborg pr tonnes
of cellulose (air dried)GWh/TAD
cellulose20.9 21.9 21.6
305 Emissions
305-1 Direct (scope 1) GHG emissions (Base year 2009) tCO2e 130,945 141,616 139,856
305-1 Direct (scope 1) biogenic CO2 emissions tCO2e 139,657 131,683 132,248
C.S GHG emissions within EU-ETS system tCO2e 118,200 125,135 126,284305-2 Energy indirect (scope 2) GHG emissions, location based
(Base year 2009)tCO2e 65,414 62,126 58,484
305-2 Energy indirect (scope 2) biogenic CO2 emissions tCO2e 72,159 74,612 74,393
305-3 Other Indirect (scope 3) GHG emissions (Base year 2017) tCO2e 344,612 327,751 330,137
305-3 Biogenic CO2 (scope 3) tCO2e 970,695 1,145,214 1,250,816
305-4 Direct and indirect GHG emission (scope 1 og scope 2) over revenues tCO2e/mill. NOK 37 40 41305-4 Direct and indirect GHG emission (scope 1 og scope 2)
per total energy consumptiontCO2e/GWh 113 118 119
305-5 Reduction of direct GHG emissions (total scope 1) from base year (2009) tCO2e 94,053 83,382 85,142
305-5 Reduction of GHG emissions (total scope 1 og scope2) from base year (2009)
tCO2e 101,985 94,602 100,003
305-5 Reduction of direct GHG emissions (total scope 1) from base year (2009) % 42 37 38
305-5 Reduction of GHG emissions (total scope 1 og scope2) from base year (2009) % 34 32 34
305-7 Emissons of SO2 t 65 72 69
305-7 Emission of NOx t 94 149 197
305-7 Emissions of dust particles t 51 69 70
307 Environmental compliance
307-1 Non-compliance with environmental laws and regulations (air) Number 0 0 0
In 2020, Borregaard’s greenhouse gas emissions (scope 1 and scope 2) decreased by 3,6% compared to 2019. The main reason for the reduction was increased use of electricity used for variable load energy at the biorefinery in Norway compared with previous years. Some of the reduction was due to closure of our operations in Spain and to changes in the operation in Germany. The scope 2 emissions increased due to higher emissions from purchased energy. The GHG emissions within the EU ETS trading system was reduced by 6,935 tonnes.
Installation of low-NOx technology in the bioboiler at the biorefinery in Norway and the increased use of electricity for steam production, resulted in a 35% reduction of NOx, to 91 tonnes in 2020 (140 tonnes in 2019). Thus, the target of an 11% reduction in 2020 was more than achieved.
During the period 2015-2018, several energy efficiency projects were conducted at Borregaard’s biorefinery in Norway. The projects were successfully implemented and
specific energy consumption was reduced gradually in line with the targets. In 2020, Borregaard has gained full effect of the implemented energy efficiency projects and the specific energy consumption has been reduced to 20.9 GJ/tonnes of cellulose (21.9).
Borregaard in Norway supplies surplus heat from low temperature water to the district heating system in the municipality. In 2020, Borregaard replaced 9.3 GWh (11.1 GWh) of fossil energy with surplus heat from the biorefinery.
Key initiatives 2021: Continued emission reductions according to the climate and energy strategy At the biorefinery in Norway, several projects will be conducted to reduce the direct GHG emissions from the use of energy. We are rebuilding the feed to the bioboiler with new technology for vapour recompression (MVR) and salt removal to increase the utilisation of available renewable fuels. This project will potentially result in the capture of 33 GWh of bioenergy, the investment cost is NOK
131 million, with support from Enova22 amounting to NOK 46.2 million.
Another project is to utilise the surplus heat from the compressor station, an investment of NOK 18.6 million, of which support from Enova amounted to NOK 5.2 million. We will continue the work with the optimisation of an evaporator in the new spray dryer (commenced 2019), which will decrease the natural gas consumption for drying lignin. To utilise more surplus heat from low-temperature heat sources, Borregaard will invest NOK 40 million in a heat recovery and integration system, with support from Enova amounting to NOK 11.5 million. This project will be finished in 2022 and the integration is also connected to the district heating system in Sarpsborg. All these projects have a combined potential to reduce our direct GHG emissions by 12,000 tonnes annually.
A higher degree of electrification of the energy consumption at the biorefinery in Norway – either directly or indirectly – is necessary to meet our 2030 and 2050 climate targets. In order to mitigate the exposure to higher electricity prices and tariffs following higher electricity consumption, we are continuously looking to enhance the redundancy of Borregaard’s energy system and facilitate flexibility in our electricity consumption. This will benefit both Borregaard and the energy system as such.
Framework conditions for energy and climate matters are changing rapidly. We expect policy changes, promoting the transition to a carbon-neutral society, to accelerate in 2021. Borregaard monitors and engages actively, e.g. in the development of the European Green Deal23, in cooperation with European and national industry associations.
WATER CONSUMPTION AND REDUCTION OF EFFLUENTS
The highest environmental risk is associated with the main production facility in Norway. Emissions of organic compounds to water (chemical oxygen demand (COD) or biological oxygen demand (BOD)) affect the aquatic environment in the river Glomma. The organic material stems mainly from the washing and processing of biomass into advanced products.
Borregaard has a sustainable water management system. Most of the water withdraw and effluents are linked to Borregaard’s biorefinery in Norway. The site is
self-sufficient and has access to water from the river Glomma via its own water treatment facility. Water is important in the biorefinery, and is used for cooling, steam production and hot water production, as well as washing and transporting biomass in the production processes. However, most of the water used is returned to the river Glomma. Possibilities of reducing water consumption are assessed in connection with investment projects. This is also motivated by the potential gains associated with energy savings and more efficient water treatment. A large proportion of the process water is treated to keep levels of substances in the effluent, such as halogenated organic compounds (AOX) and COD, below the discharge permits. The wastewater treatment facility reduces BOD by 98%.
The water volumes used at Borregaard’s facilities for production of biopolymers from lignin outside Norway are relatively low; less than 1% of the company’s total water consumption. The water is sourced from public waterworks or adjacent industrial areas. There are low emissions to water in the operations outside Norway.
The EU’s BREF standards (ref:) describe the relevant processes and their respective operating conditions and emission rates. Based on the latest review of these standards, Borregaard’s operations in Norway received a new discharge permit from 1 July 2019. The permit has stricter limits for several substances in the effluent, not only for the total discharge flow, but including sub-streams, in shorter average periods. This means that the number of single limits in the permit has increased. The new permit for COD in the effluent is reduced from 69 tonnes to 59 tonnes per 24-hour period (on average over the year) in order to comply with BAT levels for emissions to water.
Borregaard and the Norwegian Institute for Water Research (NIVA) monitor the river Glomma in accordance with the requirements and standards in the EU Water Framework Directive (WFD). This monitoring shows that emissions of easily degradable organic matter (BOD) from our biorefinery have caused a proliferation of bacteria covering riverbed sediments close to the plant. This causes poor oxygen conditions, which has implications for the growth of the river Glomma’s wild salmon stock. As a result, its ecological status is classified as poor and can be defined as a river with water stress. NIVA’s measurements of chemical status in accordance with the WFD standards show a good status. New analyses show that the conditions in the river Glomma downstream from
/ 22 Norwegian government agency that promotes eco-friendly changes in relation to energy use, renewable energy production and new energy and climate technology/ 23 https://waterriskfilter.panda.org/en/Explore/Map

5958 SUSTAINABILITY AND CORPORATE RESPONSIBILITY SUSTAINABILITY AND CORPORATE RESPONSIBILITY
Borregaard have improved, which shows that the reduction in emissions of several substances has had an effect.
Due to low natural reproduction of salmon in the river, Borregaard contributed to financing a salmon cultivation facility in 2012 and we have since covered a major part of the operating costs. Surveys conducted by NIVA show that the natural reproduction in the river has increased and contributes substantially to the young fish population.
Borregaard has reduced the effluents of COD and phosphor by 42 % and 76% over the last 10 years. The long-term goal
of the WFD regulation is to achieve a good ecological status in the river Glomma by 2027. Borregaard has identified both short-term and long-term goals for further cuts in COD effluents. The first goal was to comply with the new water permit which applied from 2019. The next step involves R&D activities in the field of sustainable water treatment solutions as well as technological improvements that will have a positive effect on emissions of organic matter to water. Borregaard will submit an action plan to the Norwegian Environmental Authorities in 2021 with estimated cost, effect on COD and time to implement each activity.
The illustration shows the reduced effluents of COD and phosphor from the biorefinery in Norway which have positive impact on SDG 12 (12.4).
The risk of emissions to water from old landfills and areas with polluted soil from former operations are an important part of the emission control programme. A five-year programme to seal the Opsund landfill, a former waste disposal site on our premises in Norway, was completed in 2020. In 2021, we will implement measures to secure a closed landfill which has been fallow for decades.
From 1949 to 1997, Borregaard used mercury-based technology for chlor-alkali production at the site in Norway. This process led to pollution of the soil in the area surrounding the plant. In 2015, mercury leakage from the area was detected. A programme to build stronger barriers,
achieve more robust treatment capacity of polluted groundwater and to clean polluted areas was initiated. Borregaard made a provision in the financial statements according to estimated costs (see note 35, pages 123 and 124). The concentration of mercury in ground water wells and in the sewage systems has decreased due to these actions, and the emissions in 2019 and 2020 were at an all-time low of 1 kg of mercury. The area will be continuously monitored in close co-operation with the authorities to secure stable and acceptable mercury levels.
The table below shows the results for water and effluents (company spesific indicator (CS)).
GRI ref GRI indicators for water and effluents Unit 2020 2019 2018303 Water and effluents
303-3 Total water withdrawal megalitres 55,349 55,576
303-3 Water withdrawal river Glomma, Borregaard Norway megalitres 52,239 52,654
303-3 Water withdrawal ground water, Borregaard Norway megalitres 0 0
303-3 Water withdrawal surface water other countries megalitres 2,164 2,332303-3 Water withdrawal ground water Florida megalitres 168 190
303-4 Total water discharge megalitres 54,272 52,874
303-4 Water discharge of cooling water river Glomma, Borregaard Norway megalitres 34,917 36,470
303-4 Water discharge of process water river Glomma, Borregaard Norway megalitres 17,629 16,403C.S. COD (organic material) in process water discharged, Borregaard Norway t/day 57 55 61
C.S. AOX (halogenic organic material) in process water discharged, Borregaard Norway t/day 0.27 0.23 0.27
C.S. Suspended solids (fibres) in process water discharged, Borregaard Norway t/day 4.4 4.1 4.0
C.S. Phosphor in process water discharged, Borregaard Norway kg/day 20 20 36
C.S. Nitrogen in process water discharged, Borregaard Norway kg/day 321 397 369C.S. Copper in process water discharged, Borregaard Norway kg/day 9.7 11.6 9.6
303-4 Number of incidents of non-compliance with discharge limits, short-term Number 59
303-4 Number of incidents of non-compliance with discharge limits, long-term Number 0
303-5 Total water consumption megalitres 275 337
307 Environmental compliance
307-1 Compliance with environmental laws and regulations (water/soil) Number 0 0 0
WATER RISK Water scarcity risks have been evaluated for Borregaard’s operations using The WWF Water risk filter24. The overall risk of physical, regulatory, and reputational risks is aligned with the UN Global Compact CEO Water Mandate framework. Physical risk includes scarcity, flooding, water quality and ecosystem status. Regulatory risk includes enabling environment, institutions and governance, management instruments,
and infrastructure and finance. Whilst reputational risk includes cultural importance, biodiversity importance, media scrutiny and conflict.
Most of the water withdrawal, discharge and consumption are linked to our biorefinery in Norway. The river Glomma is the largest river in Norway and has an average water flow of 577 m3/sec. The Sarpsfossen waterfall, which is close to the biorefinery, is Europe’s
98
85
78 7669 66
63 6661
55 57
76
5765 64
41 4035 37 36
20 20
2010 2011 2012 2013 2014 2015 2016 2017 2018 2019 2020
EFFLUENTS TO WATER
COD tonnes/ dayPhosphor kg/ day
largest waterfall (amount of water) and the overall water scarcity risk is low. Climate scenarios for the area around Borregaard’s biorefinery show a wetter climate with more precipitation. Thus, the average water flow in the river Glomma is likely to increase. The biorefinery has access to water from the river Glomma via its own water treatment facility. Due to the large amounts of water available, water withdrawal is considered sustainable compared to areas in the world where water scarcity represents a risk due to climate change.Our production units in USA (Florida and Wisconsin),
Germany, The Czech Republic and UK use less than 5% of the total withdrawal of water at Borregaard. The water is sourced from public waterworks or adjacent industrial areas. Borregaard’s lignin plant in Florida withdraws water from a ground water source, the Floridan aquifer system, which is one of the world’s most productive aquifers. The WWF Water Risk Filter evaluates the water risk level of the area where our Florida plant is located to be moderate. The overall water scarcity risk is low to moderate at Borregaard’s other production units.
/ 24 https://waterriskfilter.panda.org/en/Explore/Map

6160 SUSTAINABILITY AND CORPORATE RESPONSIBILITY SUSTAINABILITY AND CORPORATE RESPONSIBILITY
The water withdrawal is high at the operations in Norway due to the high need of cooling water. The cooling water is returned to the river. The volume of process water discharge and its effluent components are measured and reported as required in the permit from the authorities. The water consumption was 275 megalitres, thus only a small portion of the water withdrawn are consumed.
The emission of COD and AOX to water increased in 2020 to 57 tonnes pr day and 0.27 tonnes/day (55 tonnes pr day, 0.26 tonnes pr day in 2019) due to changes in production mix and an increase in production volume.
Borregaard uses copper as a catalyst in the production process. We have reduced our emissions of copper during 2020, and the recovery rate is more than 80%. The new emission permit for copper is demanding and we exceeded the short-term limits 35 times in 2020. Environmental investments and process measures resulted in reduced copper emissions in 2020 and the emissions are expected to be reduced further in 2021.
The 24-hour period limit for sub-streams in the new permit was exceeded for some substances; all of these have been reported to the Norwegian Environment Agency and measures have been taken to reduce emissions. Number of incidents of non-compliance with discharge limits, long-term was 0.
Initiatives for 2021: Continued reduction of COD and improved reporting on water The new permit for Borregaard’s operations in Norway requires studies to find the best solutions for the further reduction of effluents to water. We will provide the Norwegian Environment Agency with an updated plan in March 2021. These activities are part of our long-term plans to be in line with the WFD in 2027, as well as to be prepared for new requirements that might come as a result of changes in environmental regulations under the EU Green Deal Initiative, for the transition to a low-emission society.
Borregaard is planning to report on the subject “Water” to CDP for the first time in 2021. Water risk analysis will be updated, data collection of water usage will be quality assured and plans and targets for water reductions will be identified.
WASTE MANAGEMENT AND CIRCULARITY
Most of Borregaard’s waste is generated at the biorefinery in Norway, the operations outside Norway generates 20% of the waste.
Recovered energy from waste incineration is an important part of the energy supply for our biorefinery in Norway. This is a part of the daily base load needed for energy supply, and all the energy will be utilised in the continuous production. The biorefinery receives heat energy from two waste incineration plants, one of them operated by Borregaard. Our waste incineration plant alone recovers energy from 66,563 tonnes of municipal waste. This process generates ash. While the bottom ash is classified as non-hazardous waste, the fly ash is classified as hazardous waste. The alkaline fly ash is treated externally to form a stable gypsum phase before it is landfilled. There are research initiatives in Norway25 to find solutions for improved material recovery from waste incineration plants. From the non-hazardous bottom ash, the metals are removed and recycled by our waste operator, and the rest is reused as fill mass.
Despite high raw material utilisation, cascading use of side streams and reduction of input factors over time, there are still some streams that end up as waste in the biorefinery. Gypsum and sludge with some organic content are waste fractions where we will seek circular economy solutions. Borregaard’s biorefinery in Norway is a member of a circular economy initiative called EarthresQue26, where the purpose is to recover earth chemicals and reduce waste for landfilling in the circular economy.
98% of the waste from operations in Norway was source separated and processed by certified waste treatment providers in 2020. Waste plans for the industrial facilities and the company’s own harbour have been established and amounts of waste generated are reported monthly.
The table on the next page shows the results for waste and circularity (company specific indicator(CS)).
GRI ref GRI indicators for waste and circularity Unit 2020 2019 2018306 Waste
306-3 Total amount of waste generated t 40,929 40,380 30,566
306-3 Non-hazardous waste generated t 36,607 35,535 25,663
C.S. Non-hazardous waste, material and energy recovery, Borregaard Norway t 13,572 13,119 14,027
C.S. Non-hazardous waste, to landfill t 22,516 306-3 Hazardous waste generated t 4,606 5,128 5,187
C.S. Hazardous waste, material and energy recovery, Borregaard Norway t 135
C.S. Hazardous waste, to landfill, Borregaard Norway t 4,186
The amount of hazardous waste was reduced by 10% compared to 2019 due to reduced amounts of fly ash. 80% of the hazardous waste and 27% of the non-hazardous waste generated in Borregaard consists of ash from the energy recovery of municipal waste. The hazardous waste is handled by certified waste operators and are reported in a declaration system operated by the Norwegian Environment Agency.
At the biorefinery in Norway, the amount of non-hazardous waste was at the same level as in 2019. In 2020, we reported the amount of non-hazardous waste from the production units outside Norway for the first time. The main fraction of waste is processed sludge to landfill, a total of 12,636 tonnes - 35% of the total amount of non-hazardous waste generated in the Group. 37% of the non-hazardous waste in the Group was material and energy recovered.
Initiatives for 2021: Waste reduction from more circular solutionsBorregaard will develop solutions for waste reduction together with external partners in 2021. We plan to set reduction targets for waste in our sustainability reporting for 2021.
PUBLIC AND PROCESS SAFETY
Public and process safety management are important topics for both Borregaard and our stakeholders in order to control and mitigate the risks involved in the company’s operations. The site in Norway is subject to the EU Directive 96/82/ EC (“Seveso III”), intended to prevent accidents that could potentially cause large-scale harm.
Process safety at Borregaard’s facilities has increased over time due to the systematic monitoring of risk and the implementation of measures aimed at mitigating risk. We strive to have open communication regarding risk
potentials and on-going improvement projects with people who live and work near our production facilities.
Sometimes risks can be eliminated through technical, organisational or business measures. Our elimination of chlorine risk by converting the elemental chlorine to hydrochloric acid (implemented 2012), is one example. Heavy fuel oil, waste oil and propane has been replaced with state-of-the-art liquid natural gas facilities. Sulphur dioxide (SO2) is an important input chemical in production processes at the operations in Norway and cannot be replaced by other chemicals. Risk analysis shows that a large discharge may have severe consequences for third parties, especially from the storage of liquid SO2. Borregaard has invested in new technology which will eliminate the use and storage of liquid SO2. The new plant will be commissioned in 2021.
Independent expertise has carried out extensive risk assessments in line with guidelines from the Norwegian Directorate for Civil Protection (DSB). Based on this work and recommendations by DSB, the municipality has established consideration zones for the area surrounding Borregaard’s operations in Sarpsborg. We therefore expect the long-term development of the area surrounding the plant to be harmonised in line with the expectations of Seveso III.
Borregaard has several lignin spray dryers at our facilities. We have surveyed the risk of dust explosions and implemented risk mitigation measures. The management system for fire prevention has been improved and there is an ongoing programme to modernise the fire protection system.
All storage tanks, with some minor exceptions of low-risk storage tanks, are now in compliance with the Norwegian Tank Regulations (Norwegian Pollution Regulations, Chapter 18) and they are equipped with physical barriers (secondary containment) for the collection of chemicals.
/ 25 https://www.regjeringen.no/contentassets/99097bd500bb41c9a949543587da8467/sluttrapport---ekspertutvalget-for-reduksjon-og-behandling-av-farlig-avfall---191101.pdf/ 26 https://www.nmbu.no/aktuelt/node/40577

6362 SUSTAINABILITY AND CORPORATE RESPONSIBILITY SUSTAINABILITY AND CORPORATE RESPONSIBILITY
KEY TARGETS 2021 SDG
Climate impact and emission to air
Implement energy reduction and CO2 emission reduction activities according to long-term climate and energy action plan to reach our Science based targets for 2030 (Borregaard Group). 13.2
Reduce CO2 emissions to 100 kg CO2/MWh of total energy consumed by 2025 (Borregaard Norway) 13.2
Zero exceedances of local air quality SO2, average emissions per hour (Borregaard Norway) 12.4
Water consumpition and reduction of effluents
Effluent of COD to river Glomma below 57 mt/day (Borregaard Norway) 12.4
Establish long-term action plan to reduce COD effluents to the river Glomma, that will meet the requirements in the EU Water Framework Directive (WFD) (Borregaard Norway) 12.4
Establish targets for reduction in water discharge and water consumption (Borregaard Group) 6.3
Waste management and circularity
Establish targets for waste reduction (Borregaard Group) 12.4
RESULTS OF KEY TARGETS IN 2020 AND KEY TARGETS FOR 2021
KEY TARGETS 2020 Results Comments SDG
Climate
Establish specific action plans in order to achieve the Science Based Target for 2030 (Borregaard Group) Achieved
A revised climate and energy strategy with a plan on how to reach the targets has been presented to and approved by the board. 13.2
Reduce CO2 emissions to 100 kg CO2/MWh of total energy consumed by 2025 (Borregaard Norway)
108 kg CO2/GWh
5,3% reduction compared to 2019. This long-term target is a part of the SBTi action plan. 13.2
Environment
NOx reduction 11% from 2019 to 2020 (Borregaard Norway) Achieved
35% reduction from 2019 to 2020 due to the installation of NOx cleaning at the bioboiler and higher share of heat energy for variable load from electricity. 12.4
Effluent of COD to river Glomma below 57 mt/day (Borregaard Norway) 57 mt/day 57 mt/day 12.4
Zero exceedances of local air quality SO2, average emissions per hour (Borregaard Norway) Achieved
First year of achieving this long-term target. 12.4
GRI ref GRI indicators for public and process safety Unit 2020 2019 2018Company specific indicator (C.S)
C.S Number of fires Number 5 4 1
C.S Number of near-fires Number 11 12 15
Borregaard has procedures to ensure that all new chemicals subject to labelling due to potential risk are assessed for possible substitution by a dedicated committee before they are introduced in the production processes. The existing portfolio of chemicals is subject to a periodical substitution review. During planning and
development of new processes and products, substances are carefully considered in terms of inherent safety.
The table below shows the results for public and process safety for 2020 and previous years for Borregaard Group.
Fire prevention is an important area within process and public safety. We report all our near fires and fires in our deviation report system, and the root cause of all fires is investigated. The consequence of fires in 2020 was low.
Near fires are defined as fires without consequence. In our process safety management programme, we have identified new KPIs that are relevant for our operations and that we will start to report on.
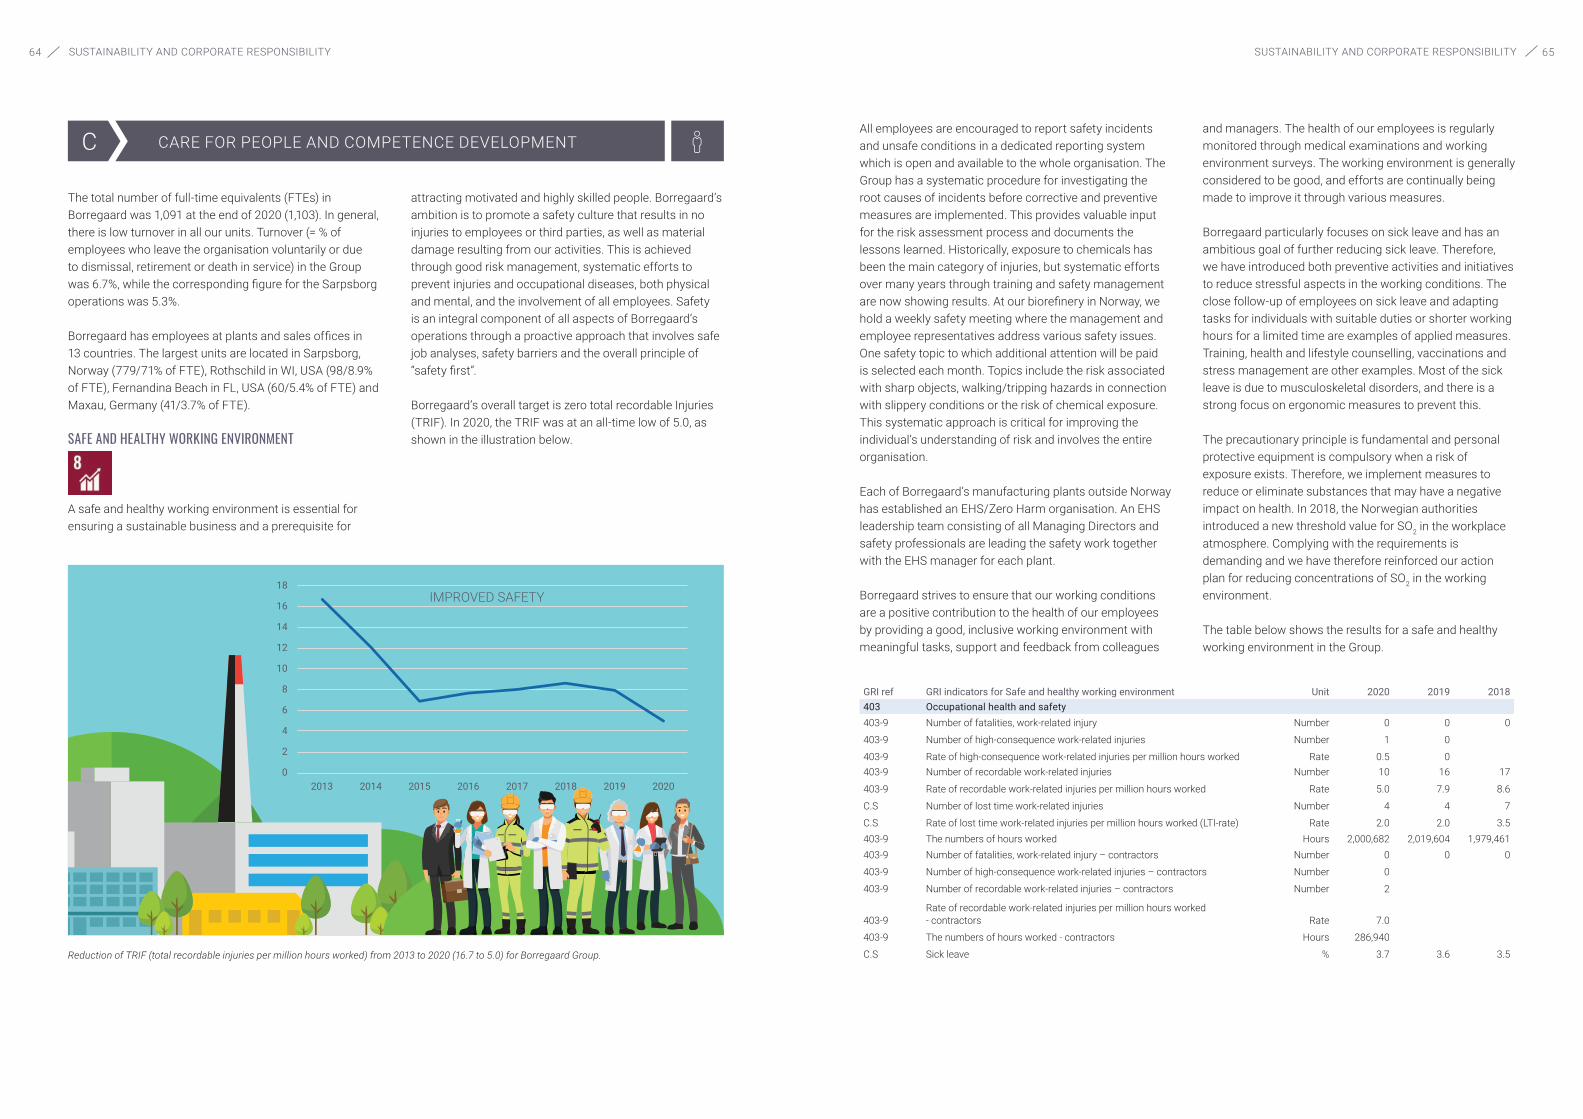
6564 SUSTAINABILITY AND CORPORATE RESPONSIBILITY SUSTAINABILITY AND CORPORATE RESPONSIBILITY
C CARE FOR PEOPLE AND COMPETENCE DEVELOPMENT
Main areas A) Sustainable business model B) Climate, Environment, health and safety
C) Employee and competence development
D) Suppliers and business partners
E) Contribution to society
The total number of full-time equivalents (FTEs) in Borregaard was 1,091 at the end of 2020 (1,103). In general, there is low turnover in all our units. Turnover (= % of employees who leave the organisation voluntarily or due to dismissal, retirement or death in service) in the Group was 6.7%, while the corresponding figure for the Sarpsborg operations was 5.3%.
Borregaard has employees at plants and sales offices in 13 countries. The largest units are located in Sarpsborg, Norway (779/71% of FTE), Rothschild in WI, USA (98/8.9% of FTE), Fernandina Beach in FL, USA (60/5.4% of FTE) and Maxau, Germany (41/3.7% of FTE).
SAFE AND HEALTHY WORKING ENVIRONMENT
A safe and healthy working environment is essential for ensuring a sustainable business and a prerequisite for
attracting motivated and highly skilled people. Borregaard’s ambition is to promote a safety culture that results in no injuries to employees or third parties, as well as material damage resulting from our activities. This is achieved through good risk management, systematic efforts to prevent injuries and occupational diseases, both physical and mental, and the involvement of all employees. Safety is an integral component of all aspects of Borregaard’s operations through a proactive approach that involves safe job analyses, safety barriers and the overall principle of “safety first”.
Borregaard’s overall target is zero total recordable Injuries (TRIF). In 2020, the TRIF was at an all-time low of 5.0, as shown in the illustration below.
IMPROVED SAFETY
0
2
4
6
8
10
12
14
16
18
2013 2014 2015 2016 2017 2018 2019 2020
Reduction of TRIF (total recordable injuries per million hours worked) from 2013 to 2020 (16.7 to 5.0) for Borregaard Group.
All employees are encouraged to report safety incidents and unsafe conditions in a dedicated reporting system which is open and available to the whole organisation. The Group has a systematic procedure for investigating the root causes of incidents before corrective and preventive measures are implemented. This provides valuable input for the risk assessment process and documents the lessons learned. Historically, exposure to chemicals has been the main category of injuries, but systematic efforts over many years through training and safety management are now showing results. At our biorefinery in Norway, we hold a weekly safety meeting where the management and employee representatives address various safety issues. One safety topic to which additional attention will be paid is selected each month. Topics include the risk associated with sharp objects, walking/tripping hazards in connection with slippery conditions or the risk of chemical exposure. This systematic approach is critical for improving the individual’s understanding of risk and involves the entire organisation.
Each of Borregaard’s manufacturing plants outside Norway has established an EHS/Zero Harm organisation. An EHS leadership team consisting of all Managing Directors and safety professionals are leading the safety work together with the EHS manager for each plant.
Borregaard strives to ensure that our working conditions are a positive contribution to the health of our employees by providing a good, inclusive working environment with meaningful tasks, support and feedback from colleagues
and managers. The health of our employees is regularly monitored through medical examinations and working environment surveys. The working environment is generally considered to be good, and efforts are continually being made to improve it through various measures.
Borregaard particularly focuses on sick leave and has an ambitious goal of further reducing sick leave. Therefore, we have introduced both preventive activities and initiatives to reduce stressful aspects in the working conditions. The close follow-up of employees on sick leave and adapting tasks for individuals with suitable duties or shorter working hours for a limited time are examples of applied measures. Training, health and lifestyle counselling, vaccinations and stress management are other examples. Most of the sick leave is due to musculoskeletal disorders, and there is a strong focus on ergonomic measures to prevent this.
The precautionary principle is fundamental and personal protective equipment is compulsory when a risk of exposure exists. Therefore, we implement measures to reduce or eliminate substances that may have a negative impact on health. In 2018, the Norwegian authorities introduced a new threshold value for SO2 in the workplace atmosphere. Complying with the requirements is demanding and we have therefore reinforced our action plan for reducing concentrations of SO2 in the working environment.
The table below shows the results for a safe and healthy working environment in the Group.
GRI ref GRI indicators for Safe and healthy working environment Unit 2020 2019 2018403 Occupational health and safety 403-9 Number of fatalities, work-related injury Number 0 0 0
403-9 Number of high-consequence work-related injuries Number 1 0
403-9 Rate of high-consequence work-related injuries per million hours worked Rate 0.5 0 403-9 Number of recordable work-related injuries Number 10 16 17
403-9 Rate of recordable work-related injuries per million hours worked Rate 5.0 7.9 8.6
C.S Number of lost time work-related injuries Number 4 4 7
C.S Rate of lost time work-related injuries per million hours worked (LTI-rate) Rate 2.0 2.0 3.5403-9 The numbers of hours worked Hours 2,000,682 2,019,604 1,979,461403-9 Number of fatalities, work-related injury – contractors Number 0 0 0
403-9 Number of high-consequence work-related injuries – contractors Number 0
403-9 Number of recordable work-related injuries – contractors Number 2
403-9Rate of recordable work-related injuries per million hours worked - contractors Rate 7.0
403-9 The numbers of hours worked - contractors Hours 286,940
C.S Sick leave % 3.7 3.6 3.5

6766 SUSTAINABILITY AND CORPORATE RESPONSIBILITY SUSTAINABILITY AND CORPORATE RESPONSIBILITY
The number of lost time injuries in Borregaard was the same in 2020 as in 2019; 4. At the biorefinery in Norway, an employee slipped on the ice and got a serious fracture (180 days of absence), due to the long absence the incident is defined as a high consequence incident. One employee was exposed to hydrochloric acid (5 days of absence). At the site in Germany, a person fell and sprained his shoulder (10 days of absence). At the site in Florida, an operator reached into an unguarded discharge chute and amputated the tip of a finger on the rotary valve (10 days of absence). The total recordable injuries decreased from 16 in 2019 to 10 in 2020. The major part of these injuries is not directly related to work tasks but arise from mishaps like slipping, exposure to chemicals etc.
For our contractors there were one incident with a fall to a lower level and one incident with exposure for chemicals, the number of injuries decreased from 2019 (10) to 2020 (2). We have focused on the training of external workers in safety risks. In general, we see the same types of work-related injuries for both employees and contractors.
Proactive safety indicators show that the Group`s safety culture is improving.
The sick leave rate in Borregaard increased slightly in 2020 to 3.7% (3.6%). The increase is mainly related to the Covid-19 pandemic.
Initiatives for 2021: Continuous improvement of the zero harm cultureSome of our safety training plans were delayed due to Covid-19, and we will continue with our initiatives in 2021.
In order to achieve the target of zero TRIF, Borregaard will continue its work to ensure that we have a motivated and proactive organisation in relation to safety, with a high degree of awareness of our responsibility to mitigate risk. The work on reporting, analysing underlying causes, implementing measures in connection with near accidents and hazardous situations, as well as frequent inspections at the facilities, will continue in 2021.
Borregaard’s operations in Norway will focus on life saving
rules, in order to build a strong safety culture and increase the understanding of risk.
Safety among external workers is also a particular area of focus for 2021, with the aim to provide information and guidance in addition to the follow-up of external workers’ fulfilment of safety instructions. From 2021, all external workers and visitors must complete a digital training course on all the relevant safety risks in order to get permission to enter the production site in Norway.
Borregaard will continue to focus on appropriate health promotion measures and preventive working environment measures in close cooperation with employee representatives in 2021. The long-term target for the sick leave rate is 3.0%.
COMPETENCE DEVELOPMENT: CREATING VALUE BY DEVELOPING PEOPLE
High competence is one of the key elements in Borregaard’s specialisation strategy. The combination of unique competences in sales & marketing, R&D and production drives the specialisation strategy and differentiates Borregaard from our competitors.
In 2020, Borregaard conducted a digital introduction programme for 30 new employees from Borregaard units worldwide and provided new employees with an introduction to Borregaard’s strategy, corporate governance, culture and values. New employees also receive training in continuous improvement and innovation.
Borregaard has set up internal training programmes in its areas of core competence. 15% of the company’s employees work in sales, marketing and customer service. It is important to know the various customers’ needs and the value of Borregaard’s products and solutions. To maintain this knowledge, Borregaard also operates an “Application Academy” and a “Sales Academy”. In 2020, Borregaard arranged an application academy with 20 online sessions and approximately 120 participants.
GRI ref GRI indicators for Competence Development Unit 2020 2019 2018402 Training and Education402-2 Introduction (online in 2020), Borregaard Group Number 30 19
402-2 Production Academy Number 44 86
402-2 Application Academy (online in 2020), Borregaard Group Number 120 -
402-2 Finance Academy (online in 2020), Borregaard Group Number 73 -402-2 Digital Business Conference, Borregaard’s commercial organisation Number 200 -
Borregaard uses e-learning systems and programmes as part of our training concepts.
Since Borregaard’s production processes are complex and involve a high degree of integration, significant importance is attached to knowledge and competence in the areas of production and biorefining. Borregaard arranges extensive training programmes for its operators and apprentices.
Based on the current age composition of the workforce, Borregaard’s biorefinery in Norway will experience a growing need for qualified employees in coming years.
To meet these challenges, Borregaard has recruitment activities and school programmes to encourage interest in an industrial career and relevant qualifications. In 2020, Borregaard entered into an agreement with Borg Upper Secondary School in Sarpsborg with a joint vision to create Norway’s best education within process chemistry at operator level. Borregaard onboarded 24 new apprentices in Sarpsborg in 2020. The operations in Sarpsborg have a total of 45 apprentices.
Borregaard underlines the importance of creating an internal job market and favours a high degree of job rotation and internal recruitment to fill vacancies. There were several examples of internal recruitment between divisions and business areas in 2020. This is a crucial element in strengthening the competence and understanding of the totality in the company, in addition to enhancing innovation and continuous improvement in the company. This model also creates career opportunities for our employees.
In 2020, we hired two new trainees to the company’s trainee programme. In total, there are four trainees in the programme. The trainees rotate between different functions within sales and marketing, R&D and finance.
CORPORATE CULTURE THAT SUPPORTS OUR GOALS AND STRATEGYBorregaard has developed a strong corporate culture over many years and through changing times, which helps create a common mindset, core values and an understanding of the business across functions, business areas and geographical boundaries. A sound corporate culture that supports our objectives and strategies is vital for the development of the company and our employees, and is therefore regarded as material in Borregaard’s stakeholder and materiality analysis. Our culture and values document, “The Borregaard Way”, plays an important role in the various introduction and development programmes. This document
focuses on our core values: Sustainability, long-term perspective and integrity. We want our corporate culture to be influenced by market orientation, innovation and our ability to change. An integral part of “The Borregaard Way” is also our leadership principles, where expectations and guidelines for executing leadership in Borregaard are outlined. The leadership principles were revised during 2020 and will be implemented and followed up by training programmes.
Sustainable culture - employees attention to sustainabilityAlthough employee commuting is a small contributor to our indirect emissions (scope 3), we think it is important that all our employees focus on how they as individuals can contribute to our ambitious greenhouse gas emission target. Borregaard has increased its fleet of electric vehicles (EV) for local transport and has installed several EV charging stations at the company’s site in Norway to facilitate employees’ use of electric cars.
In 2020, Borregaard qualified for the regional programme “Home-Work-Home”, an initiative run by the local county aiming to reduce the use of cars between home and work. So far, about 90 Borregaard employees bought or leased e-bikes on payroll deduction, and almost 100 employees bought subsidised tickets for public transport. The programme will continue with new initiatives during 2021.
BUSINESS ETHICS AND ANTI-CORRUPTION
Borregaard’s corporate culture and our integrity and sustainability values include standards and objectives for sound business ethics. Borregaard has a set of guideline documents for corporate responsibility and code of conduct, as well as manuals and more specific guidelines for different areas such as anti-corruption, competition legislation, responsible sourcing, environment, health and safety, and human rights.
The ethical guidelines were revised in 2019 in a process that involved many parts of the organisation, including the unions. The guidelines were implemented by e-learning which was completed by all employees in the 4th quarter of 2020. The training included practical ethical dilemmas, and by the end of 2020, 925 employees had completed the e-learning.
Borregaard’s guidelines for corporate responsibility are integrated parts of our introduction and managerial training programmes. We value the commitment and initiative of all

6968 SUSTAINABILITY AND CORPORATE RESPONSIBILITY SUSTAINABILITY AND CORPORATE RESPONSIBILITY
our employees and emphasise good collaboration between management, employees and their representatives. 87% of Borregaard’s employees work in units that have collective agreements with unions.
Borregaard has established guidelines on whistleblowing, both to various specific functions in the organisation or via a dedicated telephone number or email address. These guidelines are translated into five languages and distributed to the company’s units worldwide (see page 26 Corporate Governance).
DIVERSITY AND EQUAL OPPORTUNITIES
In line with our integrity and sustainability values, Borregaard aims to enhance diversity among our employees and is committed to avoiding discrimination based on gender, sexual orientation, ethnicity, religion or age. Diversity is a positive factor that gives a variety of inputs and views in the internal discussions and processes. We believe that an amplification of diversity, based on cultures, gender, age and different backgrounds will result in a sound and productive working environment with high motivation and low sick leave. The Group has specific guidelines for this area.
We have implemented initiatives aimed at promoting the recruitment of female managers and employees. We deliberately nominate a high proportion of women in management and technical programmes, as well as in the company’s recruitment base. The lowest proportion of women is in production, while the proportion of women in R&D, customer service, HR and finance is above 50%. Borregaard has gender-neutral guidelines and pay systems that provide equal pay for equal work. We have the same working hours for men and women and the degree of part-time employment is low. The ratio of basic salary and payment of women to men at Borregaard in Norway is 110% (women: NOK 636,857/men: NOK 571,791). The pay ratio (fixed/base salary) between the CEO and the median employee in Norway was approximately 6.6 to 1 in 2020.
Borregaard is a global organisation with people of 28 different nationalities. We have experienced that employing people with diverse ethnic and cultural backgrounds is a strength and use diversity as a resource within the organisation. The diversity of nationalities also affects how the Group’s training programmes are put together and staffed.
We have policies and guidelines for adapting working hours and conditions for employees in different phases of their careers.
Borregaard in Norway has joined networks for enabling job training for people who, for various reasons, have difficulties entering the job market.
HUMAN RIGHTS
Borregaard strives to prevent all forms of human rights violations. An important element in “The Borregaard Way” and the “Code of Conduct” is to respect human rights and operate in a way to avoid becoming involved in violations of human rights. We have a responsibility for our own operations, but the duty to respect human rights also applies to our relations with business partners, suppliers, customers, and others who are influenced by company activities.
In 2020, we conducted an internal survey concerning human rights awareness. A group of 110 employees, representing different functions in Borregaard, were asked if they had experienced any violations of human rights, internally or by suppliers. The overall feedback is that human rights is well taken care of at Borregaard. The survey showed that our whistleblowing procedures are not well known to everyone in the company. Therefore, we will seek to provide better information about this in 2021.
CARE FOR PEOPLE DURING A PANDEMICBorregaard has established a contingency organisation to deal with challenges related to the Covid-19 situation and to coordinate measures and information in our global organisation. Group and Sarpsborg site task forces have been active since March 2020, in addition to local task force organisations at the units outside Norway. In addition to national and local governmental measures, Borregaard has established guidelines and measures with regard to use of home offices, extra hygiene measures, travel approvals and entry restrictions for foreign personnel on assignments.
In 2020, few employees have been infected and the majority have been infected outside the workplace. In addition, we have had few cases of quarantined personnel as a result of infected colleagues due to strict distancing measures and other infection control measures at the workplace.
KEY INITIATIVES IN 2021In 2021, an important tool for competence building will be Borregaard’s e-learning platform. Examples of development initiatives are training in new leadership
principles for leaders, and sustainability training for all employees. In addition, the emphasis will be on strengthening the organisation by focusing on diversity and inclusion, in recruitment and employer branding.
KEY TARGETS 2021 SDG
Safe and healthy working environment
Sick leave below 3.5% (Group) 8.8
Total recordable injuries (TRIF) of 0 (Group) 8.8
Diversity and equal opportunities
Minimum 35% of new hires to be female employees 5.5
Establish guidelines within the recruitment process to enhance inclusive and diversity parameters 5.c
Corporate culture that supports our goals and strategy
Implement Borregaard's Leadership principles and Employee Value proposition
Conduct digital sustainability training for all employees 4.7
RESULTS OF KEY TARGETS IN 2020 AND KEY TARGETS FOR 2021
KEY TARGETS 2020 Results Comments SDG
Safe and healthy working environment
Sick leave below 3.5% (Borregaard Group) 3.7%
Increase in sick leave from 3.6% is mainly related to the C-19 pandemic. This is a long-term target for the Group. 8.8
Total recordable injuries (TRIF) of 0 (Borregaard Group) 5
TRIF for Borregaard Group in 2020 = 5 which was the best achievement ever. Long-term target = 0 8.8
Diversity and equal opportunities
Minimum 35% of new hires to be female employees 32.5% 4.7
Corporate culture that supports our goals and strategy
Implement e-training tool for Code of Conduct Achieved
Conduct 3 competence academies: production, application and finance Achieved
Update whistleblowing policy and procedures Achieved

7170
Our stakeholder and materiality analysis states Borregaard’s contribution to society and economic ripple effects as material for the company’s stakeholders. Profitable and sustainable jobs are a prerequisite for welfare and social security. This manifests itself through income and meaningful activity for individuals, as well as through financial contributions through taxes and duties that companies and their employees pay in the countries and local communities in which they operate. The communities where Borregaard has production units see significant ripple effects from suppliers and other activities around our plants.
As of 31 December 2020, Borregaard employed 1,091 FTEs in plants and sales offices in 13 countries. The Group has production units in Norway, the UK, Germany, the Czech Republic and the US.
Borregaard will always seek to meet the tax laws requirements in the countries where we have commercial activity. The company will not enter into arrangements which could be considered artificial or which have tax avoidance as their sole or main objective. Borregaard uses the OECD guidelines for internal pricing, which is an important factor in ensuring that profits and taxes are distributed fairly among different countries.
SHARED INTERESTS WITH LOCAL COMMUNITY
Borregaard impacts and interacts with the local
communities where we are located. Our plants outside Norway are relatively small, while Borregaard has been a cornerstone company in Sarpsborg for generations. We still play an important role in the city and region as an employer, a customer of many suppliers, a socioeconomic contributor through taxes and duties from our operations and as an associate for many stakeholders and voluntary organisations.
Borregaard has a wide network and many stakeholders in Sarpsborg and Viken County. We participate in various forums and organisations involved in urban and regional development and have also provided venues for socially beneficial activities.
In 2020, Borregaard contributed between 4 and 5 million NOK to support measures that benefit both the company and the region, with the overall goal of strengthening our long-term attractiveness as an employer. Our sponsorship strategy has two main pillars: One covers cultural and sports experiences and activities that help make the city and region more attractive. This will again contribute to easier recruitment and retainment of employees. The other area supports measures intended to stimulate young people to understand and become interested in disciplines important to Borregaard and society, such as nature, science and entrepreneurship. This is illustrated by our support and cooperation with different educational institutions, the Inspiria Science Centre, the Young Entrepreneurship scheme and the company’s own Knowledge Plant.
COLLABORATION WITH EDUCATIONAL INSTITUTIONS
Borregaard works closely with schools and educational institutions. We have established our own Knowledge Plant which functions as both an inhouse training centre and as a showroom and venue for school visits. It offers educational programmes that tie in with schools’ curricula, using examples taken from the company. Every year, the Knowledge Plant receives visits from students taking part in educational programmes combining technical training, career advice and a company presentation. From having 1,879 visiting students in 2019, measures related to Covid-19 reduced the number of visitors to 435 in 2020.
D CONTRIBUTION TO SOCIETY AND ECONOMIC RIPPLE EFFECTS
Main areas A) Sustainable business model B) Climate, Environment, health and safety
C) Employee and competence development
D) Suppliers and business partners
E) Contribution to society
SUSTAINABILITY AND CORPORATE RESPONSIBILITY
We also contribute to a University Educated Teacher II scheme in chemistry for upper secondary schools in Viken County, where researchers from Borregaard have created a company-related teaching plan in chemistry. Every year, students from a number of higher education institutions carry out practical tasks and projects or get internships at our company.
Borregaard has programmes and instructors for apprenticeship schemes involving cooperation with vocational schools in the region. These schemes provide apprentices with relevant experience to supplement their theoretical training. We also cooperate with several universities in Norway and other countries.
AWARDS AND RECOGNITIONS Borregaard has received several awards and honours from external bodies over the years. In 2020, Borregaard received The Export Award, issued by Export Credit Norway, GIEK and Innovation Norway, for building value in Norway through foreign markets. The Norwegian Society of Financial Analysts awarded Borregaard the Stockman Award for the best strategic investor communication among small and medium size companies listed in Oslo. In addition, Borregaard was awarded “Best Overall Investor Relations” (small cap) by IR Magazine Awards Europe for leading the way in investor relations. Borregaard’s chair of the Board was awarded “Chair of the year in Norway” by a jury of business executives and the consultancy company Mercuri Urval.
We conduct an annual reputation survey among the general public in the local county regarding our operations in Norway. The survey looks at the local community’s opinion of Borregaard as a place to work, environmental conditions, contribution to the community and people’s general impressions of the company. Besides a very good reputation as a sound company with good products and competitiveness, the company has a good reputation within the areas of environmental conditions and positive contributions to the local community. In 2020, the survey once again confirmed the company’s strong position in the local community around Borregaard’s largest plant.
CERTIFICATION AND AFFILIATION
Borregaard participates in external schemes that contribute to tighter control, improvements and inspiration for a systematic way of working, as well as issues and topics relating to corporate responsibility and sustainable development and operation.
We have committed to the Responsible Care guidelines and objectives, which are part of the European chemical industry’s environmental responsibility initiative. Borregaard holds memberships both as a supplier and purchaser in Sedex27, allowing us to share information about Borregaard and retrieve information about our suppliers; and work together in the supply chain to better manage the social and environmental performance and improve working conditions.
Borregaard subscribes to the services of EcoVadis28 to enable its customers to monitor the Group’s sustainability performance within the topics Environment, Labour and Human Rights, Sustainable Procurement and Ethics. In 2019, Borregaard earned a Silver rating among the top 20% companies represented in the database. Borregaard scored particularly well in the Environment category.
SUSTAINABILITY AND CORPORATE RESPONSIBILITY
TAX PAYMENTS PER COUNTRYAmounts in NOK million Tax paid
Norway 78
United Kingdom 1
Austria 1
Czech Republic 4
Singapore 1
India 1
Brazil 2
Other countries 1
Total tax paid 89
/ 27 www.sedex.com/about-us// 28 https://www.ecovadis.com/
DID YOU KNOW THAT… in 2020, Borregaard received The Norwegian Export Award for building value in Norway through foreign markets?
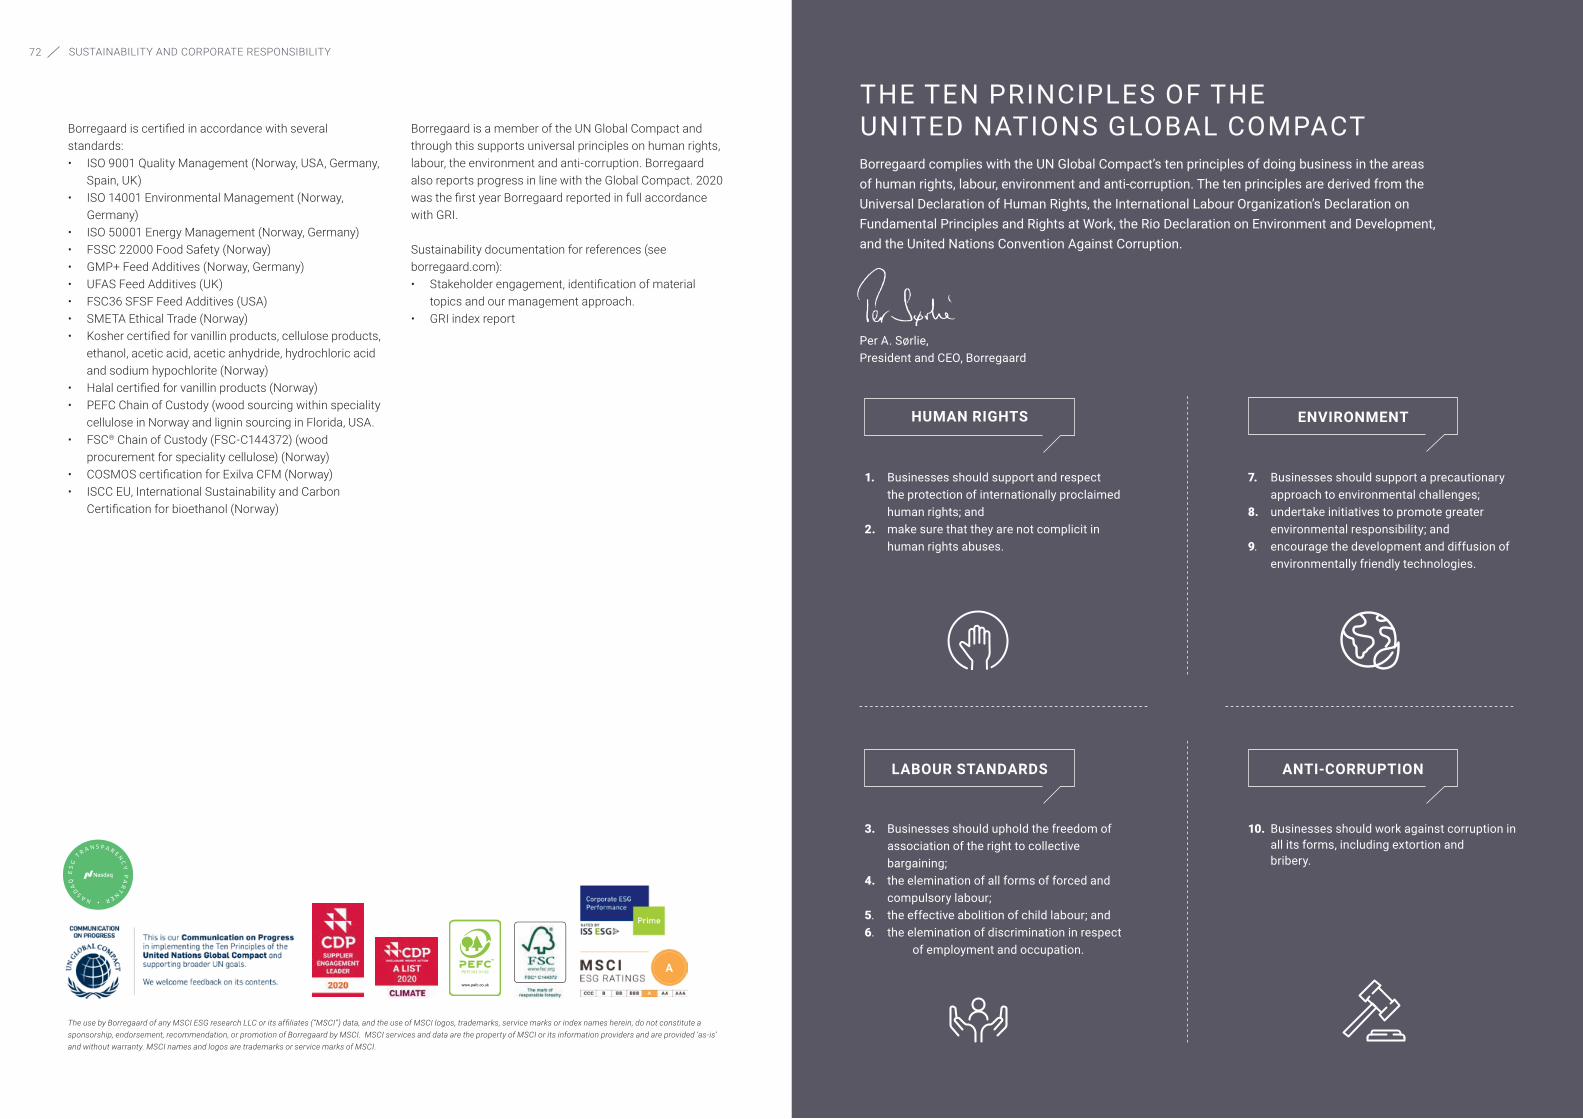
7372
Borregaard is certified in accordance with several standards: • ISO 9001 Quality Management (Norway, USA, Germany,
Spain, UK)• ISO 14001 Environmental Management (Norway,
Germany) • ISO 50001 Energy Management (Norway, Germany) • FSSC 22000 Food Safety (Norway) • GMP+ Feed Additives (Norway, Germany) • UFAS Feed Additives (UK) • FSC36 SFSF Feed Additives (USA) • SMETA Ethical Trade (Norway) • Kosher certified for vanillin products, cellulose products,
ethanol, acetic acid, acetic anhydride, hydrochloric acid and sodium hypochlorite (Norway)
• Halal certified for vanillin products (Norway) • PEFC Chain of Custody (wood sourcing within speciality
cellulose in Norway and lignin sourcing in Florida, USA. • FSC® Chain of Custody (FSC-C144372) (wood
procurement for speciality cellulose) (Norway) • COSMOS certification for Exilva CFM (Norway) • ISCC EU, International Sustainability and Carbon
Certification for bioethanol (Norway)
Borregaard is a member of the UN Global Compact and through this supports universal principles on human rights, labour, the environment and anti-corruption. Borregaard also reports progress in line with the Global Compact. 2020 was the first year Borregaard reported in full accordance with GRI.
Sustainability documentation for references (see borregaard.com): • Stakeholder engagement, identification of material
topics and our management approach.• GRI index report
SUSTAINABILITY AND CORPORATE RESPONSIBILITYSUSTAINABILITY AND CORPORATE RESPONSIBILITY
The use by Borregaard of any MSCI ESG research LLC or its affiliates (“MSCI”) data, and the use of MSCI logos, trademarks, service marks or index names herein, do not constitute a sponsorship, endorsement, recommendation, or promotion of Borregaard by MSCI. MSCI services and data are the property of MSCI or its information providers and are provided ‘as-is’ and without warranty. MSCI names and logos are trademarks or service marks of MSCI.
THE TEN PRINCIPLES OF THE UNITED NATIONS GLOBAL COMPACTBorregaard complies with the UN Global Compact’s ten principles of doing business in the areas of human rights, labour, environment and anti-corruption. The ten principles are derived from the Universal Declaration of Human Rights, the International Labour Organization’s Declaration on Fundamental Principles and Rights at Work, the Rio Declaration on Environment and Development, and the United Nations Convention Against Corruption.
Per A. Sørlie, President and CEO, Borregaard
7. Businesses should support a precautionary approach to environmental challenges;
8. undertake initiatives to promote greater environmental responsibility; and
9. encourage the development and diffusion of environmentally friendly technologies.
ENVIRONMENTHUMAN RIGHTS
1. Businesses should support and respect the protection of internationally proclaimed human rights; and
2. make sure that they are not complicit in human rights abuses.
LABOUR STANDARDS
3. Businesses should uphold the freedom of association of the right to collective bargaining;
4. the elemination of all forms of forced and compulsory labour;
5. the effective abolition of child labour; and6. the elemination of discrimination in respect
of employment and occupation.
ANTI-CORRUPTION
10. Businesses should work against corruption in all its forms, including extortion and bribery.

7574 UN’S SUSTAINABLE DEVELOPMENT GOALS UN’S SUSTAINABLE DEVELOPMENT GOALS
• Borregaard and the rest of the industry generate high added value creation. Through its purchases of goods and services and tax contributions, the industry creates positive ripple effects in the form of direct and indirect jobs
• Substantial tax payments. In 2020, the Borregaard Group’s tax payments amounted to NOK 89 million
• Jobs provide a route out of poverty. Borregaard employs 1,091 FTEs in 13 countries
• Effective and sustainable feed products (SDG 2.4)• Products for improved plant growth stimulants for food plants• Improved and sustainable protection for crops• Raw materials do not compete with food production• Borregaard’s Soypass technology reduces soy in feed and
increases milk production for dairy cattle (SDG 2.4)• Borregaard’s vanillin reduces CO2 emissions by 90% by replacing
oil-based alternatives• Speciality Cellulose in consumer goods applications
• A number of Borregaard’s products replace hazardous chemicals such as solvents (SDG 3.9)
• Products that contribute to fat reduction • Diagnostics (pharma intermediets)• Focus on the health and safety of employees
• Prioritising employee training – many training programmes in the Group
• Cooperation with schools (education, equipment, visitor programmes)
• Supporting a science centre
• Equal treatment rules. Active recruitment of women to all levels and positions. (SDG 5.5, 5.c)
• Overrepresentation of women in managerial development programmes (SDG 5.5)
• 25% of Borregaard’s employees were women in 2020
• A focus on reducing water consumption (SDG 6.3)• Working with, and investing in, emission cuts (SDG 6.3) • Producing products for use in water purification (SDG 6.3)• Own water treatment facility at the plant in Sarpsborg (SDG 6.3)
• 64% renewable energy use in 2020 (SDG 7.2) • Increased production of bioethanol for fuel (SDG 7.2)• Supplies surplus heat from low temperature water to district
heating (SDG 7.2)• Batteries is an application in BioSolutions
• Borregaard and the rest of the industry generate a high level of value creation and positive ripple effects in society. Borregaard employs 1,091 FTEs in 13 countries (SDG 8.2)
• Substantial tax contributions• Good working conditions and training programmes (SDG 8.5) • Over-recruitment of apprentices (in excess of internal needs) • Financial sustainability secures investments, R&D and
competence development • Supplier follow up and approval of new suppliers in accordance
with requirements for responsible sourcing (SDG 8.5)
• Substantial investments in innovation using internal resources, as well as contributions from institutes and universities (SDG 9.5)
• Sustainability is the main focus in innovation work (SDG 9.5)• Developing new, sustainable bio-based industry through the
innovation projects Exilva and BALI (SDG 9.5)• Producing green chemicals used in the construction industry,
such as lignin (SDG 9.4)• Spending a substantial proportion of revenues on
innovation (SDG 9.5)
• A high degree of collective welfare benefits in the company (SDG 10.2 & SDG 10.3)
• A high degree of mobility across the organisation – opportunities for all (SDG 10.2 & 10.3)
• Social engagement in local areas • Support for schools, recreational activities, social
initiatives, urban and sustainable development (SDG 11.3) • Specialty cellulose into construction materials (SDG 11.3)
• Sustainable business model with bio-based products (SDG 12.2) • Investments in renewable energy (sustainability) (SDG 12.2)• Energy strategy for increasing the use of green and
renewable energy and energy efficiency (SDG 12.2)• Environmental investments to cut emissions and waste
(SDG 12.4)• Long-term plan to reduce organic material, COD,
in the discharge of effluent to water, reduced by 40 % last ten years (SDG 12.4)
• Improved chemical safety (SDG 12.4)• Transparent sustainability reporting according to the GRI
standard (SDG 12.6)
• The biorefinery concept is an integral part of the business model – an important climate measure (SDG 13.2)
• Established EHS/climate and energy strategy (SDG 13.2)• Greenhouse gas emissions are assessed in relation to transport
options (SDG 13.2)• Established science-based targets for cutting green house gas
emissions (SDG 13.2)• Investments in renewable energy (SDG 13.2)
• Phosphor in the discharge is reduced by 73 % from 2010 to 2020 (SDG 14.1)
• Utilisation of lignin from pulp mills has led to lower emissions to water
• Built and financed a salmon cultivation facility on own premises
• Sustainability criteria are stressed when purchasing wood (SDG 15.1)
• Active cooperation with stakeholders in the forest value chain (SDG 15.2)
• Chain of Custody certified in accordance with FSC and PEFC forest certification standards (SDG 15.1 & 15.2)
• Guidelines for ethics and corporate social responsibility (SDG 16.3) • Respect for the law and active contribution to good
dialogue with the authorities (SDG 16.3)
• Member of the Global Compact and Responsible Care • Environmental reporting: CDP, Global Compact and annual
report (SDG 17.14 & 17.16)• Represented in various environmental forums, nationally and
internationally (SDG 17.16)• Collaborate with customers on developing more sustainable
product and solutions (SDG 17.16)
ACHIEVE GENDER EQUALITY AND EMPOWER ALL WOMEN AND GIRLS
END HUNGER, ACHIEVE FOOD SECURITY AND IMPROVED NUTRITION AND PROMOTE SUSTAINABLE AGRICULTURE
END POVERTY IN ALL ITS FORMS EVERYWHERE
ENSURE HEALTHY LIVES AND PROMOTE WELL-BEING FOR ALL AT ALL AGES
ENSURE ACCESS TO WATER ANDSANITATION FOR ALL
PROMOTE INCLUSIVE AND SUSTAINABLE ECONOMIC GROWTH, EMPLOYMENT AND DECENT WORK FOR ALL
ENSURE ACCESS TO AFFORDABLE, RELIABLE, SUSTAINABLE AND MODERN ENERGY FOR ALL
ENSURE INCLUSIVE AND QUALITY EDUCATION FOR ALL AND PROMOTE LIFELONG LEARNING
BUILD RESILIENT INFRASTRUCTURE, PROMOTE SUSTAINABLE INDUSTRIALISATION AND FOSTER INNOVATION
REDUCE INEQUALITY WITHIN AND AMONG COUNTRIES
TAKE URGENT ACTION TO COMBAT CLIMATE CHANGE AND ITS IMPACTS
REVITALISE THE GLOBAL PARTNERSHIP FOR SUSTAINABLE DEVELOPMENT
PROMOTE JUST, PEACEFUL AND INCLUSIVE SOCIETIES
SUSTAINABLY MANAGE FORESTS, COMBAT DESERTIFICATION, HALT AND REVERSE LAND DEGRADATION, HALT BIODIVERSITY LOSS
CONSERVE AND SUSTAINABLY USE THE OCEANS, SEAS AND MARINE RESOURCES
MAKE CITIES INCLUSIVE, SAFE, RESILIENT AND SUSTAINABLE
ENSURE SUSTAINABLE CONSUMPTION AND PRODUCTION PATTERNS

7776 THE GROUP EXECUTIVE MANAGEMENTTHE GROUP EXECUTIVE MANAGEMENT
PER BJARNE LYNGSTADChief Financial Officer (CFO)Born: 1961
Per Bjarne Lyngstad has been with Borregaard since 1988. He was appointed CFO in 1998 and prior to that, he assumed various finance and administrative positions
in Borregaard and Borregaard USA. Per Bjarne Lyngstad has a Graduate Programme in Economics and Business Administration (siviløkonom HAE) from the Norwegian School of Economics and Business Administration in Bergen, Norway.
DAG ARTHUR AASBØSenior Vice President (SVP), Organisation and Public AffairsBorn: 1961
Dag Arthur Aasbø has been SVP of Organisation and Public Affairs since 2008. Since joining Borregaard
in 1993, he has assumed positions in Borregaard relating to communications and public affairs. Mr Aasbø also has experience as editor and in communication management roles in various organisations. Dag Arthur Aasbø holds a Bachelor’s Degree in Business Administration from the Norwegian Business School (BI) and has also studied Communications/Journalism and Religion/Ethics.
SVEINUNG HEGGENGeneral CounselBorn: 1958 Sveinung Heggen was appointed General Counsel of Borregaard 1 January 2013. Before joining Borregaard, he served as attorney-at-law at Orkla
ASA, Legal Department (from 1992). Prior to that, he held different positions in the Ministry of Finance, Tax Law Department (1985-1992). Sveinung Heggen holds a Cand. Jur. Degree from the University of Oslo.
OLE GUNNAR JAKOBSENPlant Director of Borregaard’s Sarpsborg Site (Norway)Born: 1969
Ole Gunnar Jakobsen has served as Plant Director of Borregaard’s Sarpsborg production site since 2006. Since joining Borregaard
in 1995, he has assumed various positions in production management in various plants at the site in Sarpsborg. Ole Gunnar Jakobsen holds a Bachelor’s Degree in Mechanical Engineering and a Master’s Degree in Process Engineering from Telemark University College (HiT) in Porsgrunn, Norway.
KRISTIN MISUNDSenior Vice President (SVP), R&D and Business developmentBorn: 1965
Kristin Misund has served as SVP R&D and Business development since May 2019. Since joining
Borregaard in 1993 she has assumed various positions within R&D, including 15 years as R&D Director and head of the Corporate R&D centre. Kristin Misund holds a PhD in organic chemistry from Norwegian University of Science and Technology (NTNU) in Trondheim, Norway.
LIV LONGVA Senior Vice President (SVP), Strategic SourcingBorn: 1969
Liv Longva has been with Borregaard since 2008. She was appointed SVP, Procurement and Strategic Sourcing in 2020. Previously
Ms Longva held positions at NATO C3 Agency, Tandberg Data and the Norwegian Armed Forces. Liv Longva holds a Master of Economics degree from the University of Oslo.
GISLE LØHRE JOHANSENExecutive Vice President (EVP) Speciality Cellulose and Fine ChemicalsBorn: 1959
Gisle Løhre Johansen has served as Executive Vice President (EVP) Speciality Cellulose and Fine Chemicals
from May 2019. Prior to that, he served as SVP of Business Development/R&D since 2007 and EVP of Fine Chemical Intermediates since 2013. Since joining Borregaard in 1991, Mr Løhre Johansen has assumed various positions including Site Manager in Sarpsborg (1999– 2007) and Site Director of Borregaard Schweiz (2006–2007). Gisle Løhre Johansen holds a Master’s Degree in Organic Chemistry from the Norwegian University of Science and Technology (NTNU) in Trondheim, Norway.
PER A. SØRLIE President and Chief Executive Officer (CEO) Born: 1957
Per A. Sørlie has been with Borregaard since 1990 and was appointed President and CEO in 1999. He has served Borregaard as CFO (1990- 1993) and Executive
Vice President of the Fine Chemicals division (1993-1999). Previously, Mr Sørlie held positions as CFO at Bjølsen Valsemølle and Hafslund’s US operations. Per A. Sørlie holds a Degree in Business Administration (siviløkonom) from the Norwegian School of Economics and Business Administration in Bergen, Norway.
TOM ERIK FOSS-JACOBSENExecutive Vice President (EVP), BioSolutionsBorn: 1969
Tom Erik Foss-Jacobsen has served as EVP BioSolutions from May 2019. Prior to that he served as EVP of Speciality Cellulose since
2007. Since joining Borregaard in 1996, he has assumed various roles in sales and marketing. Previously, Mr Foss-Jacobsen worked as a Business Development Manager EMEA at InFocus Corp and as Assistant Product Manager Soft Drinks at Borg Bryggerier. Tom Erik Foss-Jacobsen holds a Master’s Degree in International Marketing and Strategy from the Norwegian Business School (BI) and a Bachelor’s Degree in Civil Engineering.
THE GROUP EXECUTIVE MANAGEMENT

Income statement .........................................................................................80
Earnings per share ........................................................................................80
Statement of comprehensive income .......................................................80
Statement of financial position ...................................................................81
Statement of cash flow ................................................................................82
Statement of changes in equity ..................................................................83
Notes ................................................................................................................85
Statement from the Board of Directors ..................................................134
Auditor’s report .............................................................................................135
CONSOLIDATED FINANCIAL STATEMENTS

80 81CONSOLIDATED FINANCIAL STATEMENTSCONSOLIDATED FINANCIAL STATEMENTS
INCOME STATEMENTAmounts in NOK million Note 2020 2019
Sales revenues 2, 8 5,227 4,951
Other operating revenues 101 112
Operating revenues 2, 7 5,328 5,063
Cost of materials 21 -1,921 -1,890
Payroll expenses 9,10 -1,086 -1,025
Other operating expenses 9,11 -1,189 -1,141
Depreciation and impairment property, plant and equipment 12,17,18 -443 -418
Amortisation intangible assets 17 -5 -4
Other income and expenses1 13 -116 -27
Operating profit 568 558
Finance income 14 521 277
Finance costs 14 -593 -368
Financial items, net 14 -72 -91
Profit/loss before taxes 496 467
Taxes 15 -117 -116
Profit/loss for the year 379 351
Profit/loss attributable to non-controlling interests 31 -57 -66
Profit/loss attributable to owners of the parent 436 417
EBITDA1 7 1,132 1,007
STATEMENT OF FINANCIAL POSITIONAmounts in NOK million Note 31.12.2020 31.12.2019
Assets
Intangible assets 17 86 93
Property, plant and equipment 18 3,973 3,852
Right-of-use assets 12 381 380
Deferred tax assets 15 15 11
Investment in joint venture 6 38 99
Other assets 20 365 240
Non-current assets 4,858 4,675
Inventories 21 887 931
Receivables 22 1,051 991
Cash and cash equivalents 23 207 147
Current assets 2,145 2,069
Total assets 7,003 6,744
Equity and liabilities
Group equity 30 3,668 3,306
Non-controlling interests 31 110 158
Total equity 3,778 3,464
Deferred tax 15 167 80
Provisions and other liabilities 24 124 214
Interest-bearing liabilities 27 1,381 1,419
Non-current liabilities 1,672 1,713
Interest-bearing liabilities 27 623 608
Income tax payable 15 135 79
Other liabilities 25 795 880
Current liabilities 1,553 1,567
Equity and liabilities 7,003 6,744
STATEMENT OF COMPREHENSIVE INCOMEAmounts in NOK million Note 2020 2019
Profit/loss for the year 379 351
ITEMS NOT TO BE RECLASSIFIED TO P&LActuarial gains and losses (after tax) 10, 15 7 -4
Total 7 -4
ITEMS TO BE RECLASSIFIED TO P&LChange in hedging reserve after tax (cash flow) 15, 29 180 9
Change in hedging reserve after tax (net investment in subsidiaries) 15 5 -12
Translation effects -14 7
Translation effects joint venture 6 -10 4
Total 161 8
Total items not to be and to be reclassified to P&L 168 4
The Group's comprehensive income 547 355
Profit/loss attributable to non-controlling interests 31 -56 -64
Profit/loss attributable to owners of the parent 603 419
EARNINGS PER SHAREAmounts in NOK Note 2020 2019
Earnings per share (100 million shares) 16 4.36 4.17
Diluted earnings per share 16 4.37 4.18
CONSOLIDATED FINANCIAL STATEMENTS 2020
/ 1 Alternative performance measures, see page 142 for definition.
Sarpsborg, 17 March 2021
THE BOARD OF DIRECTORS OF BORREGAARD ASA
Signed
JAN ANDERS OKSUM Chair
Signed
MARGRETHE HAUGE
Signed
RAGNHILD ANKER EIDE
Signed
TERJE ANDERSEN
Signed
PER A. SØRLIEPresident and CEO
Signed
TOVE ANDERSEN
Signed
ARUNDEL KRISTIANSENSigned
HELGE AASEN

82 83
STATEMENT OF CASH FLOWAmounts in NOK million Note 2020 2019
Profit/loss before taxes 496 467
Amortisation, depreciation and impairment charges 449 432
Changes in net working capital, etc. -21 -85
Dividend (share of profit) from joint venture 6 51 5
Taxes paid -89 -122
Cash flow from operating activities 886 697
Investments property, plant and equipment and intangible assets* 17,18 -503 -583
Other capital transactions 14 29
Cash flow from investing activities -489 -554
Dividends -229 -224
Proceeds from exercise of share options/shares to employees 35 35
Buy-back of treasury shares -62 -60
Gain/loss on hedges of net investments in subsidiaries 10 -26
Net paid to shareholders -246 -275
Proceeds from interest-bearing liabilities 1,550 2,100
Repayment of interest-bearing debt -1,703 -1,971
Change in interest-bearing receivables/other liabilities 18 -3
Change in net interest-bearing liabilities 27 -135 126
Cash flow from financing activities -381 -149
Change in cash and cash equivalents 23 16 -6
Net cash and cash equivalents as of 1 January 81 86
Change in cash and cash equivalents 16 -6
Currency effect of cash and cash equivalents -1 1
Net cash and cash equivalents as of 31 December 23 96 81
STATEMENT OF CHANGES IN EQUITY
Amounts in NOK million
Share capital
(Note 30)
Share premium
fund
Other paid-in equity
Retained earnings
Hedging reserve
Translation reserve
Actuarial gains/losses
Total Group equity
Non- controlling
interestsTotal
equity
Equity 31 December 2018 100 1,346 645 1,204 -248 93 -17 3,123 198 3,321
Profit/loss for the year - - - 417 - - - 417 -66 351Items in other comprehensive income - - - - -3 9 -4 2 2 4
The Group’s comprehensive income - - - 417 -3 9 -4 419 -64 355
Paid dividend - - - -224 - - - -224 - -224
Buy-back of treasury shares (Note 30) - - - -60 - - - -60 - -60
Exercise of share options (Note 9, 30) - - 18 - - - - 18 - 18
Shares to employees (Note 9, 30) - - 23 - - - - 23 - 23
Option costs (share-based payment) - - 10 - - - - 10 - 10
Additions of non-controlling interests (Note 31) - - - -3 - - - -3 24 21
Equity 31 December 2019 100 1,346 696 1,334 -251 102 -21 3,306 158 3,464
Profit/loss for the year - - - 436 - - - 436 -57 379
Items in other comprehensive income - - - - 185 -25 7 167 1 168
The Group’s comprehensive income - - - 436 185 -25 7 603 -56 547
Paid dividend - - - -229 - - - -229 - -229
Buy-back of treasury shares (Note 30) - - - -62 - - - -62 - -62
Exercise of share options (Note 9, 30) - - 16 - - - - 16 - 16
Shares to employees (Note 9, 30) - - 25 - - - - 25 - 25
Option costs (share-based payment) - - 9 - - - - 9 - 9
Additions of non-controlling interests (Note 31) - - - - - - - - 8 8
Equity 31 December 2020 100 1,346 746 1,479 -66 77 -14 3,668 110 3,778
* INVESTMENTS BY CATEGORYAmounts in NOK million Note 2020 2019
Replacement investments 17, 18 344 370
Expansion investments1 17, 18 159 213
Total 503 583
/ 1 Alternative performance measures, see page 142 for definition.
The cash flow statement has been prepared according to the indirect method and reflects cash flows from operating,
investing and financing activities and explains changes in “Cash and cash equivalents“ in the reporting period.
CONSOLIDATED FINANCIAL STATEMENTSCONSOLIDATED FINANCIAL STATEMENTS

Note 01: General information ......................................................................86Note 02: Basis for preparation ....................................................................86Note 03: New accounting standards .........................................................88Note 04: Use of estimates ...........................................................................88Note 05: Impairment assessments ...........................................................89Note 06: Joint venture ..................................................................................90Note 07: Segments ........................................................................................90Note 08: Revenues and geographical breakdown ..................................93Note 09: Payroll expenses and remuneration ..........................................94Note 10: Pensions .........................................................................................99Note 11: Other operating expenses .........................................................101Note 12: Leases and leasing .....................................................................101Note 13: Other income and expenses1 ....................................................104Note 14: Net financial items ......................................................................104Note 15: Taxes .............................................................................................104Note 16: Earnings per share (EPS) ...........................................................106Note 17: Intangible assets .........................................................................107Note 18: Property, plant and equipment .................................................108Note 19: Overview of financial instruments ...........................................108Note 20: Other assets (non-current) ........................................................110Note 21: Inventories and cost of materials ............................................110Note 22: Receivables (current) .................................................................111Note 23: Cash and cash equivalents .......................................................111Note 24: Provisions and other non-current liabilities ........................... 112Note 25: Other liabilities (current) ............................................................112Note 26: Capital management ..................................................................112Note 27: Funding and interest-bearing liabilities ...................................113Note 28: Financial risk ................................................................................115Note 29: Derivatives and hedging ............................................................118Note 30: Equity and share capital ............................................................120Note 31: Non-controlling interests ...........................................................121Note 32: Pledges and guarantees ............................................................122Note 33: Related parties .............................................................................122Note 34: Government grants .....................................................................123Note 35: Environment, health and safety matters ................................123Note 36: Covid-19 ........................................................................................125Note 37: Other matters and subsequent events ...................................125
NOTES TO THE CONSOLIDATED FINANCIAL STATEMENTS

86 87NOTES TO THE CONSOLIDATED FINANCIAL STATEMENTSNOTES TO THE CONSOLIDATED FINANCIAL STATEMENTS
NOTE 01 GENERAL INFORMATION
The consolidated financial statements for Borregaard ASA (Borregaard/Group), including notes, for the year 2020, were endorsed by the Board of Directors (the Board) of Borregaard ASA on 17 March 2021. Borregaard ASA is a public limited company and its offices are located in Hjalmar Wessels vei 6, 1721 Sarpsborg, Norway. Borregaard develops, produces and markets specialised biomaterials, biochemicals and biofuels to a wide range of customers in global niches. Borregaard’s business model is linked to its advanced biorefinery that utilises the different components in the biomass to produce high value-added products that to a large extent can substitute petrochemical alternatives. Borregaard is an international company with production units and sales offices in the world’s most important industrial markets.
The financial statements for 2020 have been prepared and presented in full compliance with the International Financial Reporting Standards (IFRS), as adopted by the EU. The valuation and recognition of the items in the financial statements have been carried out in accordance with current IFRS standards. The consolidated financial statements contain certain items that are crucial to understand the financial results for 2020. The most important principles are described below. Borregaard is exposed to currency risk for
most of its sales, primarily in USD and EUR. A substantial part of this exposure, defined as estimated net cash flow in USD or EUR, is routinely hedged on a rolling basis with a nine-month time horizon. Subject to certain criteria being met, the hedging horizon may be extended to three years in order to secure competitive margins. On the revenue side, most of Borregaard’s business segments are exposed to price risk in international markets. The accounting policies regarding hedging are described in Note 29 and information regarding currency risks is provided in Note 28. Other income and expenses1 (OIE) are presented as part of operating profit in the Income Statement but are presented after EBITDA1 in the segment information in Note 7, which are reported according to management reporting. See Note 13 for details and specifications. The accounting policies for business areas are described in segment information for the various business areas in Note 7.
Borregaard has business areas as operating segments. The operating segments correspond to the way in which the business areas report figures to the Group executive management (key decision maker). The segments are BioSolutions, BioMaterials and Fine Chemicals.
NOTE 02 BASIS FOR PREPARATION
Borregaard ASA was incorporated as a public limited liability company on 22 August 2012. The Borregaard Group includes subsidiaries and a joint venture directly and indirectly owned by Borregaard ASA. The consolidated financial statements are primarily based on the historical cost principle.
Sales revenues from contracts with customers are recognised when control of the goods or services are transferred to the customer at an amount that reflects the consideration to which the Group expects to be entitled in exchange for those goods or services. The Group has generally concluded that it is the principal in its revenue arrangements. However, Borregaard acts as an agent related to freight services where Borregaard invoices the customer on behalf of the carrier and has no risk related to the freight services. See Note 8.
Sales revenues are presented after deducting discounts, value-added tax and other government charges and taxes. Borregaard sells goods in many different markets, and revenues from the sale of goods are recognised in the income statement when the risk and rewards of ownership
of the goods are passed to the buyer, in accordance with delivery terms. Interest income is recognised in the income statement when earned, while any dividends are recognised on the date they are approved for payment. Interest income and dividends are presented under “financial income”.
The Group has at all times various contracts for the sale and purchase of goods and services in connection with the production. These contracts are regarded as part of Borregaard’s ordinary operating activities and are therefore not specified or indicated in any other way. The contracts are deemed to be strictly sale or purchase contracts with no embedded derivatives. The company also enters into currency derivatives contracts.
Hedging instruments which satisfy the criteria for hedge accounting, are reported at fair value in the statement of financial position and changes in fair value are recognised in comprehensive income. Derivatives which do not satisfy the criteria for hedge accounting, are recognised at fair value through profit and loss.
Assets that no longer justify their value are written down to the recoverable amount, which is the higher of value in use and fair value minus selling costs.
The accrual accounting principle and the going concern assumption are underlying assumptions for preparing the combined financial statements.
An asset or liability is classified as current when it is part of a normal operating cycle, when it is held primarily for trading purposes, when it falls due within 12 months and when it consists of cash or cash equivalents on the statement of financial position date. Other items are non-current. A dividend does not become a liability until it has been formally approved by the General Meeting. The amortisation of intangible assets and other income and expenses1 are presented on separate lines, broken down by segment.
All amounts are in NOK million unless otherwise stated. The functional currency of the parent company (Borregaard ASA) is NOK and the Group’s reporting currency is NOK. Currency exchange rates as of 31 December are used in the balance sheet, whereas average currency exchange rates are used in the profit and loss.
Consolidation principlesThe consolidated financial statements show the overall financial results and the overall financial position when the parent company Borregaard ASA and its controlling interests are presented as a single economic entity. All the companies have applied consistent principles and all internal matters between the companies have been eliminated.
Interests in companies in which the Group alone has control (subsidiaries) have been fully consolidated, line by line, in the consolidated financial statements from the date the Group had control. These entities will be fully consolidated until the date such control ends. An investor controls an investee when the investor is exposed, or has rights, to variable returns from its involvement with the investee and has the ability to affect those returns through its power over the investee. If the Group controls a subsidiary, the non-controlling interests’ share of profit or loss after tax and their share of equity are presented on separate lines.
Interests in companies in which the Group together with others has joint control ( joint ventures, see Note 6) are consolidated based on the equity method. The profit or loss from the joint venture is part of operating profit. Borregaard ASA does not have any interests in associated companies (normally 20-50% owned companies).
Business combinations are accounted for using the acquisition method. In connection with the acquisition of a subsidiary, the establishment of a joint venture or any acquisitions of significant influence in associates, a purchase price allocation is carried out. The acquisition is reported in the financial statements from the date the Group has control. The date of control is normally the date on which the acquisition agreement takes effect and has been approved by all relevant authorities. Assets and liabilities are measured at fair value at the time of acquisition. If there are non-controlling interests in the acquired company, these will be measured at their share of identified assets and liabilities. Goodwill allocated to non-controlling interests is considered separately in each acquisition. Goodwill is determined as the excess of the purchase price and the amount recognised as non-controlling interest over the fair value of identified assets and liabilities assumed.
Other mattersEmission rights. Government granted and purchased CO2 emission allowances expected to be used towards Borregaard’s own emissions are recognised at nominal value (cost). In case there are actual CO2 emissions exceeding the level covered by emission rights, those are recognised as a liability. Sale of government granted CO2 emission rights are recognised at the time of sale at the transaction price. CO2 emission allowances purchased for trading are measured and classified as inventory. As of 31 December 2020, Borregaard owns 774,493 CO2 emission rights.
Contingent liabilities and contingent assets. A contingent liability or asset is a possible obligation or a possible asset whose existence is uncertain and will be confirmed by the occurrence or non-occurrence of a future event, such as the outcome of legal proceedings or the final settlement of an insurance claim. Liabilities are recognised in the financial statements if there is a more than a 50% probability that the liability has arisen; if the probability is lower, the matter is disclosed in notes to the financial statements unless the probability of payment is remote. An asset will only be recognised in the statement of financial position if it is virtually certain (95%) that the Group will realise the asset. The disclosure requirement applies to other contingent assets.
/ 1 Alternative performance measures, see page 142 for definition. / 1 Alternative performance measures, see page 142 for definition.

88 89
Goodwill and intangible assets with an indefinite useful life must be tested annually for impairment to assess whether the values are recoverable. Borregaard carries out this test prior to preparing and presenting its financial statements for the 3rd quarter. If there are indications of impairments, the assets are tested immediately. A new impairment test is carried out in the 4th quarter when necessary, for instance if the underlying assumptions have changed.
Borregaard has substantial non-current assets in the form of tangible (property, plant and equipment) and some minor intangible assets. An explanation of the details of and changes in these assets is presented separately in Note 17 and 18.
Estimate uncertainty, in some cases considerable, attaches to both property, plant and equipment and intangible assets. Both valuation and estimated useful lifetime are based on future information that is always subject to a great degree of uncertainty.
Borregaard routinely monitors assets and if there are indications that the value of an asset is no longer recoverable, an impairment test will be carried out to determine whether the asset can still justify its carrying value. If new estimates conclude that the value is no longer recoverable, the asset is written down to the recoverable amount, i.e. the greater of the net sales value and the value in use (discounted cash flow).
Cash flows relating to the assets are identified (see table below) and discounted. Future cash flow is based on specified assumptions and the plans adopted by the entity. If the discounted value of future cash flows is lower than the capitalised value of the unit’s capital employed, the assets are written down to the recoverable amount. If the discounted value is higher than the capital employed, this means that the value of the intangible asset or goodwill is recoverable.
Borregaard’s goodwill is related to the prior acquisition of Borregaard Austria Group and no impairment charges are identified:
GOODWILL
Amounts in NOK million 2020 2019
Borregaard Austria Group 34 32
Total goodwill 34 32
Estimate assumptions and cash-generating units A cash-generating unit (CGU) is the lowest level at which independent cash flows can be measured. Based on the forecasts, expectations and assumptions that were applied, Borregaard Austria Group’s CGU justify the capitalised value of goodwill at 31 December 2020 and the fair value exceeds the book value.
Calculations of future cash flows are based on a number of assumptions regarding both economic trends and the estimated useful life. Borregaard is affected by fluctuating markets and estimates made in weak markets can differ substantially from estimates made in stronger markets.
The discount rate applied is based on the Group’s cost of capital, which in general has been estimated to be in the range of 6-9% before tax, based on a weighted average of required rates of return for the Group’s equity and debt (WACC).
The required rate of return on the Group’s equity is estimated by using the capital asset pricing model (CAPM). The required rate of return on debt is estimated on the basis of a long-term risk-free interest rate to which is added a credit margin derived from Borregaard’s marginal long-term borrowing rate. The discount rate is adjusted for country risk, the level of inflation and operational risk, depending on the particular value being calculated.
Future cash flows are estimated on the basis of the budget for next year and the following two forecast years. As from year four a terminal value is calculated. Cash flow estimates are sensitive to changes in sales revenues, raw material and energy prices and the coherent ability to maintain margin assumptions. The sensitivity of the estimates, even when there is a reasonable possibility of a change in assumptions, did not give grounds for impairment charges.
The consolidated financial statements will be affected by IFRS amendments in the future. Many IFRS projects are finalised, but some of them have either not been finally adopted or not been endorsed by the EU. It is highly likely that many of these projects will be adopted.
The Group’s intention is to adopt the relevant new and amended standards and interpretations when they become effective and approved by EU.
In 2019, the Borregaard Group applied IFRS 16, Leases, for the first time. Amendments and interpretations that apply for the first time in 2020, do not have an impact on the consolidated financial statements of the Group.
NOTE 04 USE OF ESTIMATES
The management has made use of estimates and assumptions in preparing the financial statements. This applies to assets, liabilities, revenues, expenses and
supplementary information related to contingent liabilities. Areas where estimates have considerable significance are, for example:
Property, plant and equipment are largely based on a directly paid cost price and depreciated over estimated useful life. In the case of several of Borregaard’s tangible assets, changes in assumptions may lead to substantial changes in value.
Other estimates and assumptions are reported in various notes and any information that is not logically included in other notes is presented in Note 37 “Other matters”.
Future events and changes in operating parameters may make it necessary to change estimates and assumptions. New interpretations of standards may result in changes in the principles chosen and presentation. Such changes will be recognised in the financial statements when new estimates
are prepared and whenever new requirements with regard to presentation are introduced. These matters are discussed in both the section on new accounting standards and other notes.
Exercise of judgement The financial statements may also be affected by the choice of accounting principles and the judgement exercised in applying them. This applies, for instance, to the assessment of items presented as other income and expenses on a separate line. It is important to note that a different set of assumptions for the presentation of the financial statements could have resulted in changes in the lines presented.
Amounts in NOK million Note Estimate/assumptions Carrying value
31 December 2020Carrying value
31 December 2019
Property, plant and equipment 18 Recoverable amount and estimation of correct remaining useful life
3,973 3,852
Right-of-use assets 12 Leases and discount rates used 381 380
Pension liabilities (net) 10 Economic and demographic assumptions 90 96
Environmental provisions 13, 35 Environmental accruals for preventive measures to reduce risk of emissions to water from former operations at the Sarpsborg site
24 19
NOTE 03 NEW ACCOUNTING STANDARDS NOTE 05 IMPAIRMENT ASSESSMENTS
NOTES TO THE CONSOLIDATED FINANCIAL STATEMENTSNOTES TO THE CONSOLIDATED FINANCIAL STATEMENTS

90 91
The Group has a 50% interest in Umkomaas Lignin Ltd (LignoTech South Africa). The Group’s interest in the joint venture is accounted for using the equity method in the consolidated financial statements. The result before other income and expenses1 from the joint venture is accounted for as part of operating revenues while other expenses related to the permanent closure in 2020 is included in Other income and expenses1, see Note 13. Summarised financial information of the joint venture, based on its IFRS financial statements, eliminating sales and costs for transactions with the Borregaard Group, and reconciled with the carrying amount of the investment in the consolidated financial statements, are set out below. For guarantees, see Note 32.
The consolidated financial statements include the entire Borregaard Group, where the joint venture is accounted for using the equity method. The consolidated figures in the Sustainability and Corporate Responsibility Report do not include the joint venture as Borregaard does not control the operation of LignoTech South Africa.
Supply of lignin raw material to LignoTech South Africa was interrupted in late March 2020 due to Covid-19 related production curtailment of the calcium line at Sappi’s Saiccor dissolving pulp mill and the lignin production was stopped. In May, the owners of LignoTech South Africa and the Sappi Group, announced that the calcium sulphite line would be shut down for an extended period of time, and hence that the lignin plant would be mothballed. In October 2020, the owners of LignoTech South Africa, Borregaard and the Sappi Group announced the decision to permanently close the lignin production facility and to terminate the cooperation agreement. See Note 13 “Other income and expenses” for further details. The closure is a consequence of Sappi’s decision to convert their calcium sulphite pulp line, which is the source of lignin raw material, to magnesium technology. After the conversion, the spent liquor from the pulping process will be burnt, and the energy and chemicals will be recovered.
The conversion of the pulp line will be completed mid-2021. In the interim period, the calcium sulphite pulp line will be operated to some extent, resulting in limited production of liquid lignin by LignoTech South Africa until the permanent closure comes into effect.
Amounts in NOK million 2020 2019
Operating revenues 132 324
Operating expenses -96 -261
Other income and expenses1 -134 -
Net financial items -12 -1
Profit before taxes -110 62
Taxes 8 -18
Profit/loss for the year before dividend -102 44
Borregaard's share of profit for the year* -51 22
Non-current assets 50 183
Current assets 6 136
Cash and cash equivalents 22 20
Total assets 78 339
Equity 76 198
Non-current liabilities - 40
Current liabilities 2 101
Equity and liabilities 78 339
Borregaard's carrying amount of the investment 38 99
NOTE 06 JOINT VENTURE
NOTE 07 SEGMENTS
2020 2019Share in joint venture 1 January 99 100
Share of profit after tax -51 22
Dividend - -27
Currency translation effect -10 4
Share in joint venture 31 December 38 99
Borregaard has business areas as operating segments. The operating segments correspond to the way in which the business areas report figures to the Group executive management (key decision maker). All lignin-based products, including biovanillin, are organised under one management in BioSolutions. BioMaterials consist of products utilising wood fibres as the main raw material and include the speciality cellulose and cellulose fibrils businesses. Fine
Chemicals include fine chemical intermediates mainly used for diagnostics and bioethanol (mainly for biofuel). Corporate overhead and certain other costs are allocated to the three business segments. Segment performance is primarily measured based on EBITDA1.
BioSolutions develops, produces and sells biopolymers and biovanillin from lignin.
SEGMENTS 2020Amounts in NOK million
Bio- Solutions
Bio- Materials
Fine Chemicals Eliminations
Borregaard Group
Income statement
Total operating revenues 3,082 1,732 543 -29 5,328
Operating expenses -2,450 -1,414 -361 29 -4,196
EBITDA1 632 318 182 - 1,132
Depreciation and write-down -206 -203 -34 - -443
Amortisation and impairment intangible assets -5 - - - -5
Other income and expenses1 -97 -18 -1 - -116
Operating profit 324 97 147 - 568
Net financial items - - - - -72
Profit before tax - - - - 496
Cash flow
Cash flow from operating activities 530 259 97 - 886
Replacement investments -99 -212 -33 - -344
Expansion investments1 -109 -42 -8 - -159
Capital structure
Working capital at year-end 716 307 159 - 1,182
Capital employed1 at year-end - - - - 5,904
Return on capital employed1 - - - - 11.4 %
BioMaterials develops, produces and sells speciality cellulose mainly for use as a raw material in the production of cellulose ethers, cellulose acetate and other speciality products. BioMaterials also includes cellulose fibrils for industrial applications, which are in the market introduction phase.
Fine Chemicals consists of fine chemical intermediates and second-generation bioethanol.
Corporate overhead and certain other costs are allocated to the three business segments. The arm’s length principle is applied to pricing of transactions between the various segments and companies. Borregaard AS provides services to the companies in the Group and charges them for these services.
Figures for the geographical distribution of non-current operating assets, investments in property, plant and equipment, sales revenues and the number of man-years are also presented. See Note 8.
The Group applies the same principles for the presentation of segment information as for the rest of its consolidated financial statements, and the operating profit/loss in the segment information is identical to the information presented
in the income statement for the Group. There is therefore no need for further reconciliation of these income statement items. Borregaard has a central finance function, and the financing of the various segments does not necessarily reflect the real financial strength of the individual segments. Financial items are therefore presented only for the Group as a whole.
The segment information tables show the key figures in which management monitors the business, such as total operating revenues, operating expenses, EBITDA1, depreciation, amortisation and impairment of intangible assets, other income and expenses and operating profit for each business area. It does not disclose internal sales between the various segments as it is considered immaterial.
The table below shows the revenues generated by BioSolutions, BioMaterials and Fine Chemicals. Operating revenues consist of sales revenues (Note 8) and other revenues such as commissions, revenues from waste received for incineration etc.
The segment information also includes cash flow from operating activities, replacement investments, expansion investments1 and working capital for each area.
/ 1 Alternative performance measures, see page 142 for definition. / 1 Alternative performance measures, see page 142 for definition.
* Of which NOK -67 million is Other income and expenses1
NOTES TO THE CONSOLIDATED FINANCIAL STATEMENTSNOTES TO THE CONSOLIDATED FINANCIAL STATEMENTS

92 93
/ 1 Alternative performance measures, see page 142 for definition. / 2 Excluding employees in joint venture in LignoTech South Africa.
SEGMENTS 2019
Amounts in NOK millionBio-
SolutionsBio-
MaterialsFine
Chemicals EliminationsBorregaard
Group
Income statement
Total operating revenues 2,982 1,712 406 -37 5 063
Operating expenses -2,335 -1,478 -280 37 -4 056
EBITDA1 647 234 126 - 1 007
Depreciation and write-down -183 -203 -32 - -418
Amortisation and impairment intangible assets -4 - - - -4
Other income and expenses1 -16 -11 - - -27
Operating profit 444 20 94 - 558
Net financial items - - - - -91
Profit before tax 467
Cash flow
Cash flow from operating activities 442 177 78 - 697
Replacement investments -123 -216 -31 - -370
Expansion investments1 -176 -34 -3 - -213
Capital structure
Working capital at year-end 717 287 139 - 1,143
Capital employed1 at year-end - - - - 5,815
Return on capital employed1 - - - - 10.5 %
RECONCILIATION CAPITAL EMPLOYED1 Amounts in NOK million 2020 2019
Capital employed1 5,904 5,815
Other non-current assets 191 57
Cash and cash equivalents 207 147
Net deferred tax -152 -69
Interest-bearing liabilities -2,004 -2,027
Income tax payable -135 -79
Accumulated write-down and amortisation of goodwill and intangible assets -165 -162
Other (derivatives, accruals, etc.) -68 -218
Equity 3,778 3,464
RECONCILIATION WORKING CAPITAL Amounts in NOK million 2020 2019
Receivables 1,051 991
Inventories 887 931
Other liabilities -795 -880
Derivatives etc. not included in above items 39 101
Working capital 1,182 1,143
NOTE 08 REVENUES AND GEOGRAPHICAL BREAKDOWN
Revenue is recognised to depict the transfer of promised goods or services to customers in an amount that reflects the consideration to which the entity expects to be entitled in exchange for those goods or services. IFRS 15 applies to all revenue contracts and provides a model for the recognition and measurement of sales of some non-financial assets (e.g. disposals of property, plant and equipment).
For contracts with customers, sale of Borregaard’s products is generally expected to be the only performance obligation. The Group’s revenue recognition occurs at a point in time when control of the asset is transferred to the customer,
generally on delivery of the goods. Borregaard also have some contracts that include volume rebates to some customers. The Group currently recognises rebates based on the most likely amount method which is also in line with IFRS 15.
Borregaard has operations in several countries and below is a summary showing the geographical breakdown of non-current operating assets, investments and number of man-years based on the geographical location of the operation. Sales revenues are based on the location of the customers.
Non-current operating assets
Investments
Number of man-years2
Sales revenues
Amounts in NOK million 2020 2019 2020 2019 2020 2019 2020 2019
Norway 3,539 3,354 476 513 755 756 275 245
Rest of Europe 89 79 5 4 111 116 2,440 2,247
Asia 3 7 1 1 54 58 1,070 1,025
America 809 885 21 65 171 173 1,389 1,383
Rest of the world - - - - - - 53 51
Total 4,440 4,325 503 583 1,091 1,103 5,227 4,951
SALES REVENUES PER PRODUCT GROUPAmounts in NOK million 2020 2019
BioSolutions 2,995 2,873
BioMaterials 1,695 1,679
Fine Chemicals 538 400
Eliminations -1 -1
Total revenues 5,227 4,951
Operating revenues consist of sales revenues and other revenues such as commissions, revenues from waste received for incineration etc.
NOTES TO THE CONSOLIDATED FINANCIAL STATEMENTSNOTES TO THE CONSOLIDATED FINANCIAL STATEMENTS

94 95
NOTE 09 PAYROLL EXPENSES AND REMUNERATION
Amounts in NOK million 2020 2019
Wages -883 -834
Share-based payments (options and discounted shares) -15 -13
Employer’s national insurance contribution -111 -106
Pension costs (Note 10) -74 -69
Remuneration to Board Members -3 -3
Payroll expenses -1,086 -1,025
Average number of man-years 1,083 1,106
REMUNERATION OF THE EXECUTIVE MANAGEMENT2020
Amounts in NOK thousand ResidenceBase
salary Bonus Pension costBenefits
in kind Total
Per A. Sørlie Fredrikstad 3,759 1,034 790 255 5,838
Tom Erik Foss-Jacobsen Sarpbsorg 2,462 281 391 210 3,344
Gisle Løhre Johansen Sarpsborg 1,929 792 282 229 3,232
Per Bjarne Lyngstad Fredrikstad 1,889 521 276 222 2,908
Ole Gunnar Jakobsen Sarpsborg 1,842 630 265 244 2,981
Kristin Misund Sarpsborg 1,659 462 235 312 2,668
Liv Longva Vestby 1,554 176 234 181 2,145
Dag Arthur Aasbø Sarpsborg 1,631 450 231 166 2,478
Sveinung Heggen Bærum 2,254 275 346 237 3,112
Total remuneration 18,979 4,621 3,050 2,056 28,706
* Liv Longva has acted as a member of the Group Executive Management in parts of 2019 during Tuva Barnholt’s absence.** Member of the Executive Management since May 2019, remuneration for entire year*** Left position and Borregaard in May 2019, remuneration is for period as part of the Executive Management
/ 1 Alternative performance measures, see page 142 for definition.
2019
Amounts in NOK thousandBase
salary Bonus Pension costBenefits
in kind Total
Per A. Sørlie 3,613 430 756 253 5,052
Tom Erik Foss-Jacobsen 2,149 285 370 216 3,020
Gisle Løhre Johansen 1,823 221 264 230 2,538
Per Bjarne Lyngstad 1,830 217 257 220 2,524
Ole Gunnar Jakobsen 1,768 211 247 172 2,398
Kristin Misund ** 1,460 191 217 153 2,021
Liv Longva * 1,256 93 140 178 1,667
Dag Arthur Aasbø 1,585 190 212 165 2,152
Sveinung Heggen 2,185 167 324 233 2,909
Tuva Barnholt * 958 190 201 222 1,571
Morten Harlem *** 1,108 - 146 109 1,363
Total remuneration 19,735 2,195 3,134 2,151 27,215
Remuneration is actual paid remuneration in the respective years and includes vacation pay on salary earned the previous year. Bonuses however is accrued bonuses the respective years to be paid the next year.
Remuneration guidelines – 2020Borregaard’s remuneration guidelines for persons in managerial positions cover base salary, pensions, annual bonus and long-term incentives (LTI).
In general, remuneration shall be competitive and simple with long-term arrangements that have appropriate flexibility. Furthermore, there should be consistency between the personal compensation elements and the Company’s goals and results. Borregaard uses recognised external job assessment systems to benchmark its remuneration programme. In addition to the executive management, a few key persons are also included in the annual bonus and LTI plan. The base salary level should be close to the median for comparable companies and positions.
The pension schemeThe pension scheme is based on a defined contribution plan for all employees in Norway. In general, the intention is that the system should give the same relative pension independent of salary level. The contribution level is 5% of salary between 0 and 7.1G and 20% of salary over 7.1G. 1G is Norwegian National Insurance Scheme’s basic amount and was NOK 101,351 as of 31.12.2020.
Annual bonusesAnnual bonuses are based on performance within financial results (ROCE1 and EBITDA1-improvement) and EHS (total recordable injuries and sick leave) in addition to specific personal goals, of which at least one goal must cover sustainability elements. Maximum annual bonus is 50% of the annual base salary. A defined “good performance level” should, over time, give a bonus of 30%. Annual bonus includes holiday payment but does not provide basis for pension contributions. If, during a period of three years after the bonus is paid out, it appears that the basis for the bonus calculation was wrong, the company has the right to make corrections in the form of reduced future bonus payments.
Share-based optionsKey employees (including Group Executive Management) receive remuneration in the form of share-based payments, whereby employees render services as consideration for equity instruments (equity-settled transactions).
The cost of share-based options is determined by the fair value at the date when the grant is made using an appropriate valuation model, further details of which are given below. That cost is recognised in employee benefits expense, together with a corresponding increase in equity (other capital reserves), over the period in which the service and, where applicable, the performance conditions are fulfilled (the vesting period). The
cumulative expense recognised for share-based options at each reporting date until the vesting date reflects the extent to which the vesting period has expired and the Group’s best estimate of the number of equity instruments that will ultimately vest. The expense or credit in the statement of profit or loss for a period represents the movement in cumulative expense recognised as at the beginning and end of that period. The share-based options are settled as part of equity and not cash.
Service and non-market performance conditions are not taken into account when determining the grant date fair value of awards, but the likelihood of the conditions being met is assessed as part of the Group’s best estimate of the number of equity instruments that will ultimately vest. Market performance conditions are reflected within the grant date fair value. Any other conditions attached to an award, but without an associated service requirement, are considered to be non-vesting conditions. Non-vesting conditions are reflected in the fair value of an award and lead to an immediate expensing of an award unless there are also service and/or performance conditions.
No expense is recognised for awards that do not ultimately vest because non-market performance and/or service conditions have not been met. Where awards include a market or non-vesting condition, the transactions are treated as vested irrespective of whether the market or non-vesting condition is satisfied, provided that all other performance and/or service conditions are satisfied. When the terms of a share-based option award are modified, the minimum expense recognised is the grant date fair value of the unmodified award, provided the original terms of the award are met. An additional expense, measured as at the date of modification, is recognised for any modification that increases the total fair value of the sharebased payment transaction, or is otherwise beneficial to the employee. Where an award is cancelled by the entity or by the counterparty, any remaining element of the fair value of the award is expensed immediately through profit or loss. The dilutive effect of outstanding options is reflected as additional share dilution in the computation of diluted earnings per share (further details are given in Note 16).
General information about the long-term incentive (LTI) scheme. The Borregaard LTI scheme is a share option scheme related to the share price and is part of an overall remuneration programme for senior management and key personnel. The share option scheme implies that employees can obtain options that entitle them to purchase a defined number of shares at a given value after a fixed period of time. In order to adapt the scheme to its objectives, allocation of new share options and opportunities for gain are subject to a number of limitations.
NOTES TO THE CONSOLIDATED FINANCIAL STATEMENTSNOTES TO THE CONSOLIDATED FINANCIAL STATEMENTS

96 97
The Board will consider on an annual basis whether to allocate options and can provide guidance for such allocation in accordance with the framework of these guidelines. The Board may decide whether the options are to be actual or synthetic. The share option scheme must be approved at Borregaard’s General Meeting. The Board and its compensation committee will ensure that the allocation of options and the administration of the scheme comply with the intentions.
The purpose of the scheme The scheme is based on two main factors:• Strengthening of the ownership perspective, in that the
development of shareholder value (share price) and investment in shares are the criteria for this remuneration.
• Providing senior managers and key employees with an incentive to make a long-term commitment to the company.
Members of the Group Executive Management team are expected, including through the share option scheme, to build up and retain a holding of Borregaard shares corresponding to two annual base salaries for the CEO and one annual base salary for the other members of the Group Executive Management.
Allocation criteriaOptions can be allocated to leading employees at certain position levels who have achieved good results and where the company recognises a particular need to ensure that they make a long-term attachment with: • The CEO and other members of the group executive
management /business area management and selected key individuals/specialists based on the following criteria:
• The employee has over time delivered good results in line with the company’s culture and values.
• The employee/position is particularly important/critical for achievement of the company’s goals.
• The employee is considered difficult to replace, and there may be a risk that he/she will leave the company.
• The scheme/rights apply only as long as the option holder is employed (in a position that has not been terminated) in the group.
• The scheme does not automatically follow a position, and one or more allocations do not entitle one to subsequent allocations.
Restrictions on allocationsThe total annual allocation of new share options may be no more than 0.8% of the company’s shares. The total number of outstanding options may be no more than 2.0% of the company’s shares.
Restrictions on gains• Share options must have a pre-defined strike price based
on a share price increase determined upon allocation, where the interest rate is part of the assessment of the strike price.
• The strike price is adjusted for dividends and other factors relevant to share capital (e.g. buy-backs, amortisation and new share issues).
The total individual pre-tax gain on exercising the option per calendar year may not exceed two annual base salaries for the CEO and one annual base salary for other employees.
Time limits• The share options will expire after five years, the vesting
period is three years and the options can be exercised during the last two years.
Requirements for the purchase of shares• Employees must use at least half of the gain (after tax)
to purchase Borregaard shares, with a lock-in period of three years. This requirement will remain in place for the Group Executive Management team until a shareholding equivalent to two annual base salaries for the CEO and one annual base salary for the other members is acquired.
ISSUED AND OUTSTANDING SHARE OPTIONS AS OF 31 DECEMBER 2020:
Year issued
Number of share
options issued
Exercised/ forfeited
share options
Number of outstanding
share optionsStrike price*
Expire date
Number of employees**
2017 364,000 76,000 288,000 94.06 17 Feb 2022 22
2018 400,000 30,000 370,000 73.45 7 Feb 2023 26
2019 400,000 30,000 370,000 77.80 6 Feb 2024 27
2020 400,000 - 400,000 102.10 13 Feb 2025 28
1,564,000 136,000 1,428,000
* The strike price has been adjusted for dividends. Strike prices were set at 10% above the share price at the time of allocation.** Including Group Executive Management.
NOTES TO THE CONSOLIDATED FINANCIAL STATEMENTS
Share-based related costs for 2020 for the Group Executive Management was NOK 7 million in total for all programs.
296,947 share options issued in 2015 and 43,000 share options issued in 2017 have been exercised in 2020.
Changes in outstanding share options for Borregaard’s employees are shown in the table below:
2020 2019Number of share options No. WAEP* No. WAEP*
Outstanding at the beginning of the year 1,384,000 74.26 1,577,000 64.26
Exercised during the year -339,947 -467,000
Granted during the year 400,000 102.10 400,000 80.10
Forfeited during the year -16,053 -126,000
Outstanding at year-end** 1,428,000 86.76 1,384,000 74.26
Exercisable options at year-end** 288,000 313,000
* Weighted average exercise price adjusted for dividend. Amounts in NOK. ** Expire dates are 17 February 2022 for 288,000 options, 7 February 2023 for 370,000 options, 6 February 2024 for 370,000 options and 13 February 2025 for 400,000 options.
Borregaard has used the Black-Scholes model when estimating the value of the options. The volatility is calculated on the basis of the average volatility the past years for Borregaard and Borregaard peers. See Note 37 for share options issued in 2021.
Assumptions 2020 2019
Expected dividend-yield (%) - -
Expected volatility (%) 27.6 37.6
Historical volatility (%) 28.0 37.6
Risk-free return (%) 1.4 1.7
Expected life of option (years) 5.0 5.0
Weighted average share price (NOK) 102.14 76.47
SHARE OPTIONS AND SHARES HELD BY GROUP EXECUTIVE MANAGEMENT AND RELATED PARTIES AS OF 31 DECEMBER
Issued 2017 Strike NOK 94.06*
Issued 2018 Strike NOK 73.45*
Issued 2019 Strike NOK 77.80*
Issued 2020 Strike NOK 102.10* Shares
No. of share options No. of share options No. of share options No. of share options No. of shares** 2020 2019 2020 2019 2020 2019 2020 2020 2019
Per A. Sørlie 60,000 60,000 60,000 60,000 60,000 60,000 60,000 163,406 157,649
Tom Erik Foss-Jacobsen 17,000 17,000 20,000 20,000 20,000 20,000 30,000 28,828 38,071
Gisle Løhre Johansen 15,000 15,000 15,000 15,000 15,000 15,000 20,000 21,312 21,055
Per Bjarne Lyngstad 17,000 17,000 20,000 20,000 20,000 20,000 20,000 60,009 56,052
Ole Gunnar Jakobsen 15,000 15,000 15,000 15,000 20,000 20,000 20,000 31,576 30,819
Kristin Misund - 12,000 10,000 10,000 - - 15,000 59,317 58,726
Liv Longva - - 15,000 15,000 - - 15,000 10,492 7,358
Dag Arthur Aasbø 15,000 15,000 15,000 15,000 15,000 15,000 15,000 53,309 50,552
Sveinung Heggen 15,000 15,000 15,000 15,000 15,000 15,000 15,000 22,317 16,560
Total 154,000 166,000 185,000 185,000 165,000 165,000 210,000 450,566 436,842
* The strike price has been adjusted for dividends.** Total share ownership including related parties.
NOTES TO THE CONSOLIDATED FINANCIAL STATEMENTS

98 99
Discounted shares for employees The Group has a programme that gives employees, including the members of the Group Executive Management, the opportunity to buy a limited number of shares at a discount in relation to the market price. In 2020, Borregaard sold a total of 239,361 shares to employees. The share price was NOK 77.95 per share including a 25% discount. Costs in 2020, including administration costs, related to the programme in 2020 amounted to approximately NOK 7 million.
Special agreements with the President and CEO and other members of the Group Executive Management If the President and CEO, Per A. Sørlie, by mutual agreement and in the best interest of the company, terminates the employment contract, the employee will receive pay for up to six months after the period of notice. 75% of any income from another permanent post during the six-month period will be deducted. The President and CEO is included in the company’s ordinary pension schemes up to the retirement age of 68 years. In addition, the employee has a pension agreement which consists of 60% of annual pay in addition to full pension contribution (20% of 100% base salary) in the 2 year period from 65 to 67 years with no deduction for income from other permanent post.
The other members of the Group Executive Management have a six-months period of notice and no severance pay agreement.
There are no loans to the members of the Group Executive Management.
There are no other special agreements with the Group Executive Management.
Remuneration of the Board of DirectorsIn the General Meeting of the Company’s shareholders in April 2020 it was determined that The Board of Directors is remunerated at annual rates for the period up to the next General Meeting in 2021:
According to a resolution at the General Meeting in 2018, shareholder-elected Board members are required to use 20% of their annual remuneration to acquire shares in the Company, until the share value reaches an amount equivalent to one year’s remuneration.
Remuneration of the Nomination CommitteeThe chair of the Nomination Committee receives NOK 60,200 per year and an additional NOK 9,700 per meeting exceeding four meetings. Other members receive NOK 42,400 per year and an additional NOK 8,000 per meeting exceeding four meetings.
For shares held by the Board of Directors, see Note 5 in the Financial Statement of Borregaard ASA.
Board of Directors
Board chair NOK 550,000 per year
Board member, shareholder-elected NOK 324,300 per year
Board member, employee-elected NOK 290,700 per year
Observer, employee-elected NOK 96,800 per year
Deputy for observer NOK 7,500 per meeting
Audit Committee
Committee chair NOK 90,700 per year
Member NOK 60,800 per year
Compensation Committee
Committee chair NOK 54,400 per year
Member NOK 42,400 per year
REMUNERATION OF EMPLOYEE-ELECTED BOARD MEMBERS2020Amounts in NOK thousand
Base salary
Board allowance
Benefits in kind/bonus Pension
Ragnhild Anker Eide 848 288 44 69
Åsmund Dybedahl* 588 143 35 21
Arundel Kristiansen* 709 145 32 41
FEES TO GROUP EXTERNAL AUDITORAmounts in NOK million 2020 2019
Statutory audit 5 5
Other attestation services 1 -
Tax consultancy services 1 1
Other non-audit services 2 1
Total fees to EY 9 7
NOTES TO THE CONSOLIDATED FINANCIAL STATEMENTSNOTES TO THE CONSOLIDATED FINANCIAL STATEMENTS
* Åsmund Dybedahl retired and was replaced by Arundel Kristiansen summer 2020. Remuneration for entire year.
NOTE 10 PENSIONS
Borregaard has a policy to use defined contribution pension plans. However, there are some defined benefit pension plans, primarily in the USA and Norway.
Defined contribution plans In the defined contribution pension plans, the company is responsible for making an agreed contribution to the employee’s pension assets. The future pension will be determined by the amount of the contributions and the return on the pension savings. Once the contributions have been paid, there are no further payment obligations attached to the defined contribution pension. As a result, there is no liability recorded in the statement of financial position. The pension costs related to defined contribution plans will be equal to the contributions to employees’ pension savings in each reporting period.
Contribution plans also comprise pension plans that are common to several companies and where the pension premium is determined independently of the demographic profile in the individual companies (multi-employer plans). The company is obligated to follow the Act on Mandatory company pensions in Norway and the company meets the requirements.
Defined benefit plans Defined benefit plans are measured at the present value of accrued future pension benefits at the end of the reporting period. Pension plan assets are measured at their fair value.
Changes in accounting estimates for defined benefit plans are recognised in other comprehensive income and the net interest costs for the period is calculated by using the discount rate for the liability at the beginning of the period on the net liability. As such, the net interest cost consists of interest on the liability and the return on the plan assets, whereas both have been calculated by using the discount rate. Changes in net pension liabilities as a result of payments of premiums and pension payments have been taken into consideration. The difference between the actual return and the accounted return is recognised continuously through other comprehensive income. The current service cost and net interest income/costs are recognised immediately. The financial part of the pension cost is recognised as part of financial items, the other part is recognised in the salary and personnel cost in the income statement. Changes in value, both in assets and liabilities, are recognised through other comprehensive income.
Gains or losses on the curtailment or settlement of a defined benefit plan are recognised through profit and loss when the curtailment or settlement occurs. A curtailment occurs when the Group decides to make a material reduction in the
number of employees covered by a plan or amends the terms of a defined benefit plan such that a considerable part of the current employees’ future earnings will no longer qualify for benefits or will qualify only for reduced benefits.
The introduction of a new defined benefit plan or an improvement to the current defined benefit plan will lead to changes in the pension liabilities. These will be charged to expenses in a straight line during the period until the effect of the change has been accrued. The introduction of new plans or changes to existing plans which take place with retroactive effect so that the employees immediately accrue a paid-up policy (or a change in a paid-up policy) are recognised in the statement of comprehensive income immediately. Gains or losses linked to curtailments or terminations of pension plans are recognised through profit and loss when they arise.
Borregaard has pension plans that are classified as funded benefit plans and unfunded benefit plans. Expected contributions for the next year, 2021, to the defined benefit plan obligation is NOK 13 million. The largest part of the benefit plans are in the USA and Norway.
USA The pension plans in the USA contain three different plans; two defined benefit plans for salaried and hourly employees and one supplemental post-retirement plan. In 2016, the defined benefit plans were closed for new employees and replaced with a contribution plan.
Norway The net pension liabilities consist of unfunded pension plans for key personnel and liabilities related to contribution-based plans for employees who earn more than twelve times the Norwegian National Insurance Scheme’s basic amount (12G). The pension plan for employees in Norway who earn more than 12G is a contribution-based plan. The sum of the accrued contributions and the return on the plan assets are presented as a pension liability in the company’s statement of financial position. The pension plan is therefore presented as a defined benefit plan.
The early retirement scheme, AFP, is recognised as a multiemployer defined contribution plan. This may change if there are sufficient reliable, consistent data to be able to recognise it as a defined benefit plan. In 2020, the premium for the early retirement scheme is 2.5% of total payments of wages between 1 and 7.1 times the average basic amount (G). All employees in Norway younger than 62 years are included, in average 783 employees in 2020, and the cost in 2020 was NOK 11 million.

100 101
Pension plan assets The pension plans with pension plan assets are located in the USA. Pension plan assets are mainly invested in bonds and shares. The estimated return will vary depending on the composition of the various classes of assets. The breakdown of pension plan assets is presented below.
Assumptions defined benefit plans Borregaard uses the covered bonds interest rate on the
Norwegian benefit plans. The discount rate is fixed at the rate on high quality corporate bonds with the same lifetime as the pension liabilities (AA-rated corporate bonds). As a rule, parameters such as wage growth, growth in G (future social security wage base) and inflation are set in accordance with recommendations on the various countries. The mortality estimate is based on up-to-date mortality tables for the various countries. Norway: K2013, USA: Pri-2012 collar base tables from 2012 projected forward using MP-2020.
ASSUMPTIONS DEFINED BENEFIT PLANS NORWAY USA2020 2019 2020 2019
Discount rate 1.7 % 2.3 % 2.6 % 3.1 %Rate of return on assets NA NA 2.6 % 3.1 %Future salary adjustment 2.0 % 2.3 % 4.0 % 4.0 %G-multiplier*/Future social security wage base 2.0 % 2.3 % 3.5 % 3.5 %Turnover 2.0 % 2.0 % 2.5 % 2.5 %Expected average remaining vesting period 11.00 11.00 1.58 2.05
* 1G is NOK 101,951 as of 31 December 2020.
BREAKDOWN OF NET PENSION COSTSAmounts in NOK million 2020 2019Contribution plans -58 -55Current service cost -16 -14Net pension costs (incl. national insurance contributions) -74 -69
BREAKDOWN OF NET PENSION LIABILITIES AS OF 31 DECEMBERAmounts in NOK million 2020 2019Present value of funded pension obligations -478 -435Pension plan assets (fair value) 478 435Net funded pension assets - - Present value of unfunded pension obligations -90 -96Capitalised net pension liabilities -90 -96
CHANGES IN THE PRESENT VALUE OF PENSION OBLIGATIONS DURING THE YEARAmounts in NOK million 2020 2019Pension obligations 1 January -531 -478Current service cost (incl. national insurance contributions) -16 -14Interest on pension obligations -17 -26Actuarial gains and losses -34 -61Benefits paid during the year 16 52Currency translations 14 -4Pension obligations 31.12 -568 -531
CHANGES IN PENSION PLAN ASSETS DURING THE YEARAmounts in NOK million 2020 2019
Pension plan assets (fair value) 1 January 435 399
Expected return on pension plan assets 14 16
Contributions and benefits paid during the year -3 -40
Actuarial gains and losses 45 56
Currency translations -13 4
Pension plan assets (fair value) 31.12 478 435
BREAKDOWN OF PENSION PLAN ASSETS (FAIR VALUE) AS OF 31 DECEMBERAs of 31 december 2020 2019
Cash and cash equivalents and money market investments 2% 1%
Bonds 37% 40%
Shares 61% 59%Total pension plan assets 100% 100%
SUMMARY OF NET PENSION LIABILITIES AND ADJUSTMENTS IN PAST FIVE YEARSAmounts in NOK million 2020 2019 2018 2017 2016
Pension obligations -568 -531 -478 -507 -484
Pension plan assets 478 435 399 422 388Net pension liabilities -90 -96 -79 -85 -96
NOTES TO THE CONSOLIDATED FINANCIAL STATEMENTSNOTES TO THE CONSOLIDATED FINANCIAL STATEMENTS
SensitivityThe above pension cost and pension liabilities related to defined benefit schemes, are based on the assumptions outlined above. The actuarial calculations are sensitive to any changes in the assumptions. A 1% increase in wage adjustment would imply a 3% increase in pension liability and 6% increase in pension cost (defined benefit schemes). A 1% increase in discount rate would imply an 8% decrease
in pension liability and 3% decrease in pension cost while a 1% reduction in discount rate would imply a 9% increase in pension liability and 3% increase in pension cost. The calculation is based on the weighted average of the defined benefit schemes. For the pension cost sensitivity shown only the service cost and interest cost on plan obligations components of cost are reported.
NOTE 11 OTHER OPERATING EXPENSES
The Borregaard Group has chosen to present its income statement based on the nature of the item of income or expense. Operating expenses have been broken down into the following main items: Cost of materials, payroll expenses, depreciation, amortisation and other operating expenses. Thus, other operating expenses comprises all operating expenses that are not related to cost of materials, employee payrolls and capital costs in the form of depreciation. The most important items have been grouped into the following main items.
Amounts in NOK million 2020 2019
External distribution costs -537 -448
Repair and maintenance costs -168 -187
Consultants, legal advisors, temporary staff, etc. -145 -132
Rental/leasing (Note 12) -56 -73
Other -283 -301
Total other operating expenses -1,189 -1,141
NOTE 12 LEASES AND LEASING
IFRS 16 sets out the principles for the recognition, measurement, presentation and disclosure of leases and requires lessees to account for all leases under a single on-balance sheet model similar to the accounting for finance leases under IAS 17.
The Group recognises right-of-use assets at the commencement date of the lease (i.e., the date the underlying asset is available for use). Right-of-use assets are measured at cost, less any accumulated depreciation and impairment losses, and adjusted for any remeasurement of lease liabilities. The cost of right-of-use assets includes the amount of lease liabilities recognised, initial direct costs incurred, and lease payments made at or before the commencement date less any lease incentives received. Right-of-use assets are depreciated on a straight-line basis over the shorter of the lease term and the estimated useful lives of the assets.
If ownership of the leased asset transfers to the Group at the end of the lease term or the cost reflects the exercise of a purchase option, depreciation is calculated using the estimated useful life of the asset.
At the commencement date of the lease, the Group recognises lease liabilities measured at the present value of lease payments to be made over the lease term. The lease
payments include fixed payments (including in substance fixed payments) less any lease incentives receivable, variable lease payments that depend on an index or a rate, and amounts expected to be paid under residual value guarantees, if any. The lease payments also include the exercise price of a purchase option reasonably certain to be exercised by the Group and payments of penalties for terminating the lease, if the lease term reflects the Group exercising the option to terminate. Variable lease payments that do not depend on an index or a rate are recognised as expenses (unless they are incurred to produce inventories) in the period in which the event or condition that triggers the payment occurs.
In calculating the present value of lease payments, the Group uses its incremental borrowing rate at the lease commencement date because the interest rate implicit in the lease is not readily determinable. After the commencement date, the amount of lease liabilities is increased to reflect the accretion of interest and reduced for the lease payments made. In addition, the carrying amount of lease liabilities is remeasured if there is a modification, a change in the lease term, a change in the lease payments (e.g., changes to future payments resulting from a change in an index or rate used to determine such lease payments) or a change in the assessment of an option to purchase the underlying asset.

102 103
Discount rates used:Machinery, vehicles and equipment: Incremental borrowing rate.
Buildings: Implicit interest rate if available
The incremental borrowing rate is based on interbank interest rate (NIBOR, EURIBOR or LIBOR) plus margin plus country risk mark-up.
The Group’s lease of buildings have lease terms that vary from 3 years to 25 years, and several agreements involve a right of renewal which may be exercised during the last period of the lease terms. The Group assesses at the commencement whether it is reasonably certain to exercise the renewal right. Group’s lease liabilities are included in interest-bearing
liabilities. See Note 27.
The standard includes two recognition exemptions for lessees – leases of ’low-value’ assets (e.g. personal computers) and short-term leases (i.e. leases with a lease term of 12 months or less) that Borregaard has adopted. Lease payments on short-term leases and leases of low-value assets are recognised as expense on a straight-line basis over the lease term.
Right-of-use assetsThe Group leases several assets such as offices and other facilities, machinery and equipment and vehicles. The Group’s right-of-use assets are categorised and presented in the table below:
NOTES TO THE CONSOLIDATED FINANCIAL STATEMENTSNOTES TO THE CONSOLIDATED FINANCIAL STATEMENTS
RIGHT-OF-USE ASSETS
Amounts in NOK million
Land, buildings and other
propertyMachinery, plant,
equipmentFixtures, fittings,
vehicles etc. Other assets Total
Balance at 01 January 2019 115 8 97 13 233
Depreciations -20 -5 -32 -4 -61
Additions 184 - 25 2 211
Adjustments to existing contracts and terminations - -3 - - -3
Balance at 31 December 2019 279 0 90 11 380
Depreciations -31 -7 -34 -5 -77
Additions 20 8 13 7 48
Adjustments to existing contracts and terminations 26 - 1 3 30
Balance at 31 December 2020 294 1 70 16 381
LEASE LIABILITIESAmounts in NOK million 2020 2019
Balance at 01 January 387 233
Additions 48 211
Adjustments to existing contracts and terminations 30 -3
Accretion of interests 22 17
Payments -89 -72
Currency translations -3 1
Balance at 31 December 395 387
LEASE LIABILITIES CONT.Amounts in NOK million 2020 2019
Maturity analysis - contractual undiscounted cash flows
Less than one year 72 71
One to two years 63 59
Two to three years 43 49
Three to four years 33 34
Four to five years 28 27
More than five years 356 349
Total undiscounted lease liabilities at 31 December 595 589
Lease liabilities included in the statement of financial position at 31 December 395 387
Current 51 53
Non-current 344 334
AMOUNTS RECOGNISED IN PROFIT OR LOSSAmounts in NOK million 2020 2019
Interest on lease liabilities -22 -17
Depreciation of right-of-use assets -77 -61
Gains (-) and losses (+) due to terminations, purchases, impairments, and other changes -1 -
Variable lease payments not included in the measurement of lease liabilities -3 -5
Expenses relating to short-term leases -48 -67
Expenses relating to leases of low-value assets, excluding short-term leases of low-value assets -5 -1
Total amount recognised in profit or loss -156 -151
Amounts in NOK million 2020
Options to extend not yet recognised, discounted liability effect 40
Recognised options to extend, discounted liability effect 36
AMOUNTS RECOGNISED IN THE STATEMENT OF CASH FLOWFigures in NOK 2020 2019
Total cash outflow for leases 145 145
The Group is committed to fulfil future cash outflows relating to leases amounting to NOK 33 million which is not recorded in the financial position as of 31 December 2020.
Extension optionsBorregaard has lease contracts that include extension
options. The Group determines the lease term as the non-cancellable term of the lease, together with any periods covered by an option to extend the lease if it is reasonably certain to be exercised. Set out below are the discounted liability effects related to extension options:

104 105
NOTE 15 TAXES
Income tax expense consists of the total of current taxes and changes in deferred tax. Current taxes are recognised in the financial statements at the amount that is expected to be paid to the tax authorities on the basis of taxable income reported for entities included in the combined financial statements. Current taxes and changes in deferred tax are taken to other comprehensive income to the extent that they relate to items that are included in other comprehensive income.
Deferred tax in the statement of financial position have been calculated at the nominal tax rate based on temporary differences between accounting and tax basis of assets and
liabilities on the statement of financial position date.
Deferred tax liability relating to goodwill has not been recognised in the statement of financial position. Deferred tax assets are continuously assessed and are only recognised in the statement of financial position to the extent it is probable that future taxable profit will be large enough for the asset to be usefully applied. Deferred tax liability and deferred tax assets are offset as far as this is possible under taxation legislation and regulations.
Interest income and interest costs on loans and receivables are calculated using the effective interest method. Commitment fees and costs related to borrowings are reported as part of interest costs. The financial element of pension costs is included in other finance costs and is disclosed in Note 10. Borrowing costs related to plant under construction are recognised in the statement of financial position together with the asset. Foreign currency gains or losses arising from operational assets and liabilities, and the hedging of such, are reported as operating revenues or operating costs. Other foreign currency gains or losses are reported as foreign exchange gain and foreign exchange loss. The foreign currency gains or losses related to net investments in subsidiaries are disclosed in Note 29.
An increase in committed return on the Group’s unfunded pension plan was recognised as other finance costs in 2019.
NOTE 14 NET FINANCIAL ITEMS
FINANCE INCOME AND FINANCE COSTSAmounts in NOK million 2020 2019
Interest income 3 8
Foreign exchange gain 518 269
Other finance income - -
Total finance income 521 277
Interest costs -79 -77
Foreign exchange loss -511 -281
Other finance costs -3 -10
Total finance costs -593 -368
Net financial items -72 -91
NOTE 13 OTHER INCOME AND EXPENSES1
Other income and expenses largely consist of material positive and negative non-recurring items, restructuring costs and any substantial write-downs of both tangible and intangible assets. The main purpose of this line is to present
material non-recurring items and items substantially relating to other periods separately to ensure that the changes in and comparability of the lines presented in EBITDA1, depreciation and amortisation are more relevant to the company.
Amounts in NOK million 2020 2019
Impairment of assets and restructuring costs mainly related to LignoTech South Africa and LignoTech Ibérica -86 -
Environmental accruals for preventive measures to reduce risk of emissions to water from former operations at the Sarpsborg site -30 -
Write-downs and costs related to discontinuation of the SenseFi project - -11
Restructuring of the German biopolymer operation - -16
Total other income and expenses1 -116 -27
NOTES TO THE CONSOLIDATED FINANCIAL STATEMENTSNOTES TO THE CONSOLIDATED FINANCIAL STATEMENTS
/ 1 Alternative performance measures, see page 142 for definition.
TAX EXPENSEAmounts in NOK million 2020 2019Profit before tax 496 467
Current tax expense -84 -100
Deferred tax expense -33 -16
Total tax expense -117 -116
Tax as % of Profit/loss before taxes 23.6 % 24.8 %
Amounts in NOK million 2020 2019
22% of profit before taxes (tax rate in Norway)
-109 -103
Foreign operations with other tax rates than 22%
5 4
Changes in tax rate 18 -
Joint venture -11 5
Permanent differences -15 -13
Other current taxes -1 -1
Correction previous years 2 -1
Other deferred taxes -6 -7
The Group's total tax expense -117 -116
Amounts in NOK million 2020 2019
Deferred tax on tax increasing/(reducing) differences
Hedging taken to comprehensive income 17 -34
Intangible assets and Property, plant and equipment 172 148
Net pension liabilities -20 -21
Gain and loss tax deferral 1 2
Other non-current items -13 -11
Total non-current items 157 84
Current receivables -1 -1
Inventories 46 40
Provisions -3 -4
Other current items -25 -18
Total current items 17 17
Losses carried forward -52 -54
Net deferred tax 122 47
Deferred tax assets, not recognised 30 22
Net deferred tax, recognised 152 69
Change in deferred tax -83 -20
Change in deferred tax taken to comprehensive income 53 3
Acquisitions/sale of companies, translation effects, etc. -3 1
Change in deferred tax income statement -33 -16
Reconciliation of the group’s tax rateIn the following table, reported taxes are reconciled with the tax charge based on the Norwegian tax rate of 22%. The main tax components are specified.
Entities in countries with tax rates other than 22% have the net effect of decreasing the tax expense.
In addition to the compilation of the tax rates in the various countries in which Borregaard operates and has taxable income, the income tax rate for the Group is also impacted by the following:
LignoTech Florida is a limited liability company (LLC) which is taxed on the owners’ hand. Profit before tax is 100% consolidated in the Borregaard Group, whereas the tax expense is calculated based on Borregaard’s 55% ownership. Consequently, profit attributable to non-controlling interests for LignoTech Florida (45%) is calculated on profit before tax.
Share of profit after tax from the joint venture, LignoTech South Africa, is accounted for as part of operating profit and profit before tax (due to IFRS 11). As such, the additional costs related to the permanently closed operation does not reduce the tax expense and thus increases the Group’s tax rate.
There are carry forward losses in the Group which will not be recognised as deferred tax assets, and hence increase the Group’s tax rate.
Deferred tax liabilitiesDeferred tax liability consists of the Group’s tax liabilities that are payable in the future. The table below lists deferred tax assets and liabilities relating to the timing differences between tax accounting and financial accounting. The table below shows the composition of the Group’s deferred tax.
There are no major differences between recognised interest income and inflow of interests. There are no major differences between recognised interest expense and outflow of interests.

106 107NOTES TO THE CONSOLIDATED FINANCIAL STATEMENTSNOTES TO THE CONSOLIDATED FINANCIAL STATEMENTS
Amounts in NOK million 2020 2019
Profit/loss for the year after non-controlling interests for continuing operations 436 417
Profit/loss/gains discontinued operations - -Profit/loss for the year after non-controlling interests 436 417
Weighted average number of shares outstanding 100 100
Estimated dilution effect option programme 0 0
Weighted average number of shares outstanding diluted 100 100
Amounts in NOK 2020 2019
Earnings per share 4.36 4.17
Earnings per diluted share 4.37 4.18
Dividend per share 2.50 2.30
NOTE 16 EARNINGS PER SHARE (EPS)
Earnings per share are calculated on the basis of profit for the year after non-controlling interests. As a result of the Borregaard Group’s option programme (see Note 9), outstanding shares may be diluted when options are exercised. In order to take into account this future increase in the number of shares outstanding, diluted earnings per share are calculated in addition to basic earnings per share. In this calculation, the average number of shares outstanding is
adjusted to take into account the estimated dilutive effect of the option programme.
The share capital consists of 100 million shares as of 31 December 2020. As of 31 December 2020, there are 99,712,283 diluted shares. There were 99,807,055 diluted shares as of 31 December 2019.
Deferred tax assets are only capitalised to the extent that it is probable that there will be sufficient future taxable profit for the tax asset to be used, either because the unit recently reported a profit or because assets with excess value have
been identified. If future profits are not likely to be sufficient to absorb the tax reducing timing differences, deferred tax assets are not recognised.
TAX REDUCING TIMING DIFFERENCES WITH CORRESPONDING DEFERRED TAX ASSETS2020
Amounts in NOK millionTax reducing
timing differences Recognised
deferred tax assetsUnrecognised
deferred tax assetsTotal
deferred tax assets
Losses carried forward by country
Spain 119 - 30 30
USA 138 8 - 8
Germany 46 14 - 14
Total 303 22 30 52
Other tax reducing timing differences 272 62 - 62
Total tax reducing timing differences 575 84 30 114
Netted deferred tax -406 -69 - -69
Net tax reducing timing differences 169 15 30 45
NET DEFERRED TAX PRESENTED IN STATEMENT OF FINANCIAL POSITIONAmounts in NOK million 2020 2019
Deferred tax 167 80
Deferred tax assets 15 11
Net deferred tax 152 69
LOSSES CARRIED FORWARD BY EXPIRY DATEAmounts in NOK million 2020 2019
Without expiry date 303 202
Total tax losses carried forward 303 202
Capitalised expenditure on internally generated or specially adapted computer programmes is presented as intangible assets. The reinvestment need of specially adapted computer programmes is similar to that of other tangible assets, and the amortisation of intangible assets are presented together with Borregaard’s other depreciation.
Research and development (R&D) expenditure is the expenses incurred by Borregaard in conducting research and development, including studies of existing or new products and production processes in order to secure future earnings. Expenditure on research is always expensed as incurred, while expenditure on development is recognised in the statement of financial position if the underlying economic factors are identifiable and represent probable future economic benefits of which Borregaard has control. Borregaard has a large number of projects in process at all times, but the number of projects that end in capitalisation is limited. This is due to the considerable uncertainty throughout the decision making process and the fact that only a small percentage of all projects culminate in commercial products. Furthermore, the portion of the total project expenses that qualify for
recognition in the statement of financial position are relatively small, as it is only from the time the decision to develop the product is made it can be capitalised, and that decisionmaking point comes at a late stage of the process. The fair value of intangible assets acquired by the company through business combinations is capitalised. Intangible assets with indefinite life will not be amortised while other intangible assets will be amortised over their useful life.
Goodwill is initially measured at cost, being the excess of the aggregate of the transferred and the amount recognised for non-controlling interest over the net identified asset acquired and liabilities assumed. If this consideration is lower than the fair value of the net assets of the subsidiary acquired, the difference is recognised in income statement.
Amortisable intangible assets are amortised on a straight line basis at the following rates: Development 20% and other intangible assets 10-15%. Development consists mainly of internal resources being involved in development projects. IT consists mainly of external costs.
NOTE 17 INTANGIBLE ASSETS
Amounts in NOK millionDevelopment and
other intangible assets IT Goodwill Total
Book value 1 January 2020 41 20 32 93
Additions 1 8 - 9
Depreciation/Amortisation -11 -7 - -18
Impairment (see Note 13) - - - -
Currency translations - - 2 2
Book value 31 December 2020 31 21 34 86
Initial cost 31 December 2020 165 161 55 381
Accumulated amortisation and impairment -134 -140 -21 -295
Book value 31 December 2020 31 21 34 86
Book value 1 January 2019 56 12 32 100
Additions 1 12 - 13
Depreciation/Amortisation -12 -4 - -16
Impairment -4 - - -4
Currency translations - - - -
Book value 31 December 2019 41 20 32 93
Initial cost 31 December 2019 164 153 55 372
Accumulated amortisation and impairment -123 -133 -23 -279
Book value 31 December 2019 41 20 32 93
In addition, Borregaard expensed NOK 100 million in 2020 in research and development costs (NOK 114 million). The
amounts include grants and other cost deductions. See Note 34.

108 109
Property, plant and equipment are tangible assets intended for production, delivery of goods or administrative purposes and have a lasting useful life. They are recognised in the statement of financial position at cost minus any accumulated depreciation and impairment. Annual major maintenance stops are capitalised as part of property, plant and equipment and depreciated over a period of 12 months. All other maintenance and repairs are expensed under operating expenses as and when the maintenance is carried out, while expenditure on replacements or improvements is added to the cost price of the assets. Borrowing costs related to the construction of the Group’s own property, plant and equipment are capitalised as part of the cost of the asset.
Property, plant and equipment are depreciated on a straight line basis over the useful life, at the following rates: buildings 2-4%, machinery, fixtures and fittings 4-20%, vehicles 15- 25% and IT equipment 15-33%. The period of depreciation is reviewed each year and if there are changes in useful life, depreciation is adjusted. If there is any indication that an asset may be impaired, the asset will be written down to the recoverable amount if the recoverable amount is lower than the carrying value. The residual value is also calculated and if it is higher than the carrying value, depreciation is stopped. This applies in particular to buildings. The Group is committed to fulfil contracts amounting to NOK 125 million which is not recorded in the statement of financial position as of 31 December 2020 (NOK 53 million as of 31 December 2019).
NOTE 18 PROPERTY, PLANT AND EQUIPMENT
Amounts in NOK million
Land, buildings and
other propertyMachinery and plants
Assets under constructions
Fixtures, fittings, vehicles, EDP, etc. Total
Book value 1 January 2020 1,284 2,338 191 39 3,852
Additions 65 128 288 12 493
Disposals - -2 - - -2
Transferred assets under construction 56 24 -81 1 -
Impairment (see Note 13) -1 - - - -1
Depreciation -77 -263 - -12 -352
Currency translation -4 -12 -1 - -17
Book value 31 December 2020 1,323 2,213 397 40 3,973
Initial cost 31 December 2020 2,432 6,757 397 223 9,809
Accumulated depreciation and impairment -1,109 -4,544 - -183 -5,836
Book value 31 December 2020 1,323 2,213 397 40 3,973
Book value 1 January 2019 1,114 1,941 530 38 3,623
Additions 95 284 182 10 571
Disposals - - - - -
Transferred assets under construction 151 367 -521 3 -
Impairment -6 - - - -6
Depreciation -72 -261 - -12 -345
Currency translation 2 7 - - 9
Book value 31 December 2019 1,284 2,338 191 39 3,852
Initial cost 31 December 2019 2,311 6,669 191 209 9,380
Accumulated depreciation and impairment -1,027 -4,331 - -170 -5,528
Book value 31 December 2019 1,284 2,338 191 39 3,852
NOTES TO THE CONSOLIDATED FINANCIAL STATEMENTSNOTES TO THE CONSOLIDATED FINANCIAL STATEMENTS
Amounts in NOK million NoteMeasurment
level
Financial instruments at fair value
through profit
and loss
Financial instruments at fair value
- hedging instruments
Financial liabilities
measured at amortised
cost
Deposits and
receivables measured at
amortised cost Total
Of this interest- bearing
Fair value
Non-current assetsNon-current financial receivables 20 2 - - - 195 195 3 195 Non-current derivatives 20, 29 2 - 165 - - 165 165 Total - 165 - 195 360 3 360
Current assetsAccounts receivable 22 - - - 763 763 - 763 Other current receivables 22 - - - 19 19 - 19 Current derivatives 22, 29 2 6 29 - - 35 - 35 Cash and cash equivalents 23 - - - 207 207 207 207 Total 6 29 - 989 1,024 207 1,024
Non-current liabilitiesNon-current financial liabilities 12, 27 2, 3 - - 1,383 - 1,383 1,381 1,383 Non-current derivatives 24, 29 2 - 29 - - 29 - 29 Total - 29 1,383 - 1,412 1,381 1,412
Current liabilitiesCurrent financial liabilities 12, 27 2 - - 623 - 623 623 623 Accounts payable 25 - - 361 - 361 - 361 Other current liabilities 25 - - 1 - 1 - 1 Current derivatives 25, 29 2 2 91 - - 93 - 93 Total 2 91 985 - 1,078 623 1,078
Total financial instruments 4 74 -2,368 1,184 -1,106 -1,794 -1,106
Total measurement level 1 - - - - - - -Total measurement level 2, assets 6 194 - 195 395 3 395 Total measurement level 2, liabilities -2 -120 -1,606 - -1,728 -1,604 -1,728 Total measurement level 3 - - -400 - -400 -400 -400
Loans, as well as trade receivables, are held to collect contractual cash flows and are expected to give rise to cash flows solely representing payments of principal and interest. The Group analysed the contractual cash flow characteristics of those instruments and concluded that they meet the criteria for amortised cost measurement under IFRS 9.
IFRS 9 requires the Group to record expected credit losses on all of its debt securities, loans and trade receivables, either on a 12-month or lifetime basis. The Group applied the simplified approach and record lifetime expected losses on all trade receivables. The Group has considered that due to the historical low level of credit losses, the loss allowance will not
NOTE 19 OVERVIEW OF FINANCIAL INSTRUMENTS
OVERVIEW OF FINANCIAL INSTRUMENTS 2020
be materially different from the current level.
Transactions in foreign currencies are recognised at the exchange rate on the date of the transaction, while monetary items in foreign currencies are presented at the exchange rate on the balance sheet date, and any gain/loss is reported in the income statement as financial items. Revenues and expenses in subsidiaries with a functional currency different from the Group’s presentation currency are translated monthly at the average exchange rate for the month and accumulated. Statement of financial position items in subsidiaries with a different functional currency are translated at the exchange rate on the balance sheet date. Translation differences are reported in comprehensive income.
The Group uses the following hierarchy for determining and disclosing the fair value of financial instruments, by valuation technique:
Level 1: Quoted market prices in an active market (that are unadjusted) for identical assets and liabilities. Level 2: Valuation techniques (for which the lowest level input that is significant to the fair value measurement is directly or indirectly observable).
Level 3: Valuation techniques (for which the lowest level input that is significant to the fair value measurement is unobservable).
The foreign exchange element in currency forward contracts is measured at observable market prices using the foreign exchange rate set by Norges Bank, Norway’s central bank. Different maturity dates add an interest rate element resulting in an estimated fair value of the currency forward contracts. There were no transfers from one level to another in the measurement hierarchy in 2019 and 2020. Borregaard has no items defined as level 1. A description of how the derivatives are measured is provided in Note 29.

110 111
Amounts in NOK million NoteMeasurment
level
Financial instruments at fair value
through profit
and loss
Financial instruments at fair value
through comprehensive
income
Financial liabilities
measured at amortised
cost
Deposits and
receivables Total
Of this interest- bearing
Fair value
Non-current assetsNon-current financial receivables 20 2 - - - 211 211 4 211 Non-current derivatives 20, 29 2 - 29 - - 29 29 Total - 29 - 211 240 4 240
Current assetsAccounts receivable 22 - - - 759 759 - 759 Other current receivables 22 - - - 27 27 - 27 Current derivatives 22, 29 2 8 19 - - 27 - 27 Cash and cash equivalents 23 - - - 147 147 147 147 Total 8 19 - 933 960 147 960
Non-current liabilitiesNon-current financial liabilities 12, 27 2, 3 - - 1,421 - 1,421 1,419 1,421 Non-current derivatives 24, 29 2 - 111 - - 111 - 111 Total - 111 1,421 - 1,532 1,419 1,532
Current liabilitiesCurrent financial liabilities 12, 27 2 - - 608 - 608 608 608 Accounts payable 25 - - 405 - 405 - 405 Other current liabilities 25 - - 3 - 3 - 3 Current derivatives 25, 29 2 4 91 - - 95 - 95 Total 4 91 1,016 - 1,111 608 1,111
Total financial instruments 4 -154 -2,437 1,144 -1,443 -1,876 -1,443
Total measurement level 1 - - - - - - -Total measurement level 2, assets 8 48 - 211 267 4 267 Total measurement level 2, liabilities -4 -202 -1,629 - -1,835 -1,627 -1,835 Total measurement level 3 - - -400 - -400 -400 -400
Amounts in NOK million 2020 2019Share investments 5 -
Non interest-bearing derivatives (Note 19) 165 29
Receivables interest-bearing (Note 19) 3 4
Receivables non interest-bearing (Note 19) 192 207
Total other assets 365 240
NOTE 20 OTHER ASSETS (NON-CURRENT)
NOTE 21 INVENTORIES AND COST OF MATERIALS
Receivables are initially recognised at fair value which is generally the original invoice amount. For trade receivables see Note 22. The interest rate element is disregarded if it is insignificant, which is the case for the majority of receivables.
For current assets and liabilities, fair value is estimated close or equal to book value. The bond is determined as measurement level 3. The fair value of the bond is deemed
to equal their booked values. The bond carry floating interest terms and the issuer’s credit quality is not considered to have changed since the bond was issued in June 2018.
Inventories are measured at the lower of cost and net realisable value. Purchased goods are measured at purchase cost according to the FIFO principle, while internally manufactured finished goods and work in progress are
measured at production cost. Deductions are made for obsolescence. Net realisable value is the estimated selling price minus selling costs.
OVERVIEW OF FINANCIAL INSTRUMENTS 2019
NOTES TO THE CONSOLIDATED FINANCIAL STATEMENTSNOTES TO THE CONSOLIDATED FINANCIAL STATEMENTS
Cash and cash equivalents are held for the purpose of meeting short-term fluctuations in liquidity rather than for investment purposes. Cash and cash equivalents consist of cash, bank deposits and current deposits with a maturity of three months or less. Company policy is to channel excess liquidity in wholly-owned subsidiaries to Borregaard’s cash pools (with DNB and Handelsbanken) or placed as deposits with Borregaard AS. In some countries, however, there are legal or technical impediments on participation in Borregaard’s cash pools or making deposits with Borregaard AS.
Bank deposits of NOK 2 million related to tax deductions from employees are restricted as of 31 December 2020. Borregaard has a bank guarantee for the majority of the tax deductions. As of 31 December 2020 the liability related to tax deductions was NOK 28 million (NOK 27 million).
Amounts in NOK million 2020 2019
Raw materials 127 137
Work in progress 53 69
Finished goods and merchandise 707 725
Total inventories 887 931
Amounts in NOK million 2020 2019
Wood costs -472 -509
Energy costs -355 -426
Other materials -1,060 -1,031
Change in work in progress and finished goods -34 76
Cost of materials -1,921 -1,890
NOTE 22 RECEIVABLES (CURRENT)
Receivables are initially recognised at the transaction price which is generally the original invoice amount. For trade receivables the Group applies a simplified approach in calculating expected credit losses. Therefore, the Group does not track changes in credit risk, but instead recognises a loss allowance based on lifetime expected credit losses at each reporting date. The Group has established a provision matrix that is based on its historical credit loss experience, adjusted for forward-looking factors specific to the debtors and the economic environment.
Current receivables are both operating receivables and interest-bearing receivables. Operating receivables are broken down into trade receivables, accrued advance payments to suppliers and other current receivables. Trade receivables are non-interest bearing and are generally on terms of 30 to 90 days.
CHANGE IN PROVISIONS FOR BAD DEBT:Amounts in NOK million 2020 2019
Provisions for bad debts 1 January 11 12
Bad debts recognised as expense (- income) -1 -1
Realised losses -1 -
Translation effects - -
Provisions for bad debts 31 December 9 11
ACCOUNTS RECEIVABLES HAVE THE FOLLOWING DUE DATES:Amounts in NOK million 2020 2019
Accounts receivable not due 669 656
Overdue receivables 1-30 days 93 100
Overdue receivables 31-60 days 4 7
Overdue receivables 61-90 days 1 2
Overdue receivables over 90 days 5 5
Accounts receivable carrying amount 31 December 772 770
Amounts in NOK million 2020 2019
Accounts receivable (Note 19) 763 759
Non interest-bearing derivatives (Note 19) 35 27
Other current receivables (Note 19) 19 27
Total financial receivables 817 813
Advance payment to suppliers/earned income 174 177
Tax receivables 60 1
Total current receivables 1,051 991
NOTE 23 CASH AND CASH EQUIVALENTS
As of 31 December 2020, there is a total write-down of inventories of NOK 1 million (NOK 16 million). There are no reversed write-downs from earlier years.
Inventories measured at net realisable value total NOK 8 million (NOK 49 million).
Amounts in NOK million 2020 2019
Cash and cash equivalents 207 147
Bank overdraft -111 -66
Net cash and cash equivalents 96 81

112 113NOTES TO THE CONSOLIDATED FINANCIAL STATEMENTS
Provisions are recognised in the financial statements in the case of onerous contracts or when restructuring measures have been adopted. Future operating losses will not be part of the provisions. In the case of restructuring provisions, there must be a detailed plan that identifies which parts of the business are to be restructured. The location and number of employees affected, and a valid expectation must have been created among those concerned that the restructuring will be carried out. In addition, it must be possible to provide a reliable estimate of the amount of the liability. It is a condition that the restructuring materially changes the size of the business or the way in which it is operated. The provision is calculated on the
basis of the best estimate of estimated expenses. If the effect is material, anticipated future cash flows will be discounted using a current pre-tax interest rate that reflects the risks specific to the provision.
Current liabilities are operating liabilities (trade accounts payable, unpaid public taxes/charges, prepaid revenues, other accruals, etc.) and financial liabilities (payable interest). All these items are interest-free borrowings. Dividend does not become a liability before it has been approved by the General Meeting.
NOTE 26 CAPITAL MANAGEMENT
Amounts in NOK million 2020 2019
Accounts payable (Note 19) 361 405
Derivatives (Note 19) 93 95
Other current liabilities (Note 19) 1 3
Total financial liabilities non interest-bearing 455 503
Value-added tax, employee taxes, etc. 67 61
Accruals 273 316
Total other liabilities 795 880
Borregaard’s financial policy shall ensure short-term and long-term financial flexibility for the Group.
Borregaard aims to maintain key financial ratios corresponding to an investment grade rated company in order to ensure access to debt capital on favourable terms and conditions. Borregaard shall manage financial risks, primarily related to currency fluctuations in a prudent manner and in accordance with established guidelines. Borregaard shall develop and maintain relationships with a core group of banks, based on long-term financing commitments.
Long-term funding In June 2018, Borregaard issued a five-year NOK 400 million bond in the Norwegian bond market. In March 2014, Borregaard entered into a EUR 40 million term loan agreement with the Nordic Investment Bank with the purpose of refinancing the then recently completed wastewater treatment plant in Sarpsborg and to fund research and development costs associated with innovation projects. The loan has a tenor of ten years with a grace
period of three years. Financial covenants are similar to those applicable for the Bank Facilities Agreements described below.
On 7 July 2020, Borregaard refinanced the current long-term revolving credit facilities with sustainability linked revolving credit facilities. The total amount of the Bank Facilities Agreements is NOK 1,500 million, with equal portions of NOK 500 million being provided by each of the three banks (Handelsbanken, DNB and SEB). The tenor of the facilities ranges from 3 to 5 years with two one-year extension options at the discretion of the bank. The facilities are linked to Borregaard’s sustainability targets and the margins can be adjusted based on the progress on three parameters: Borregaard’s 2030 target of reducing greenhouse gas emissions (scope 1 and 2) by 53 % compared with 2009 as approved by the Science Based Target Inititiative, reduction of the Group’s total recordable injuries and finally, keeping emissions of organic compounds to the Glomma river below certain levels. All outstanding loans and all other sums due and outstanding must be repaid in full on the termination
NOTE 25 OTHER LIABILITIES (CURRENT)
NOTE 24 PROVISIONS AND OTHER NON-CURRENT LIABILITIES
Amounts in NOK million 2020 2019
Pension liabilities (Note 10) 90 96
Derivatives (Note 19) 29 111
Other non-current liabilities 2 2
Environmental provisions (Note 35) 3 5
Total 124 214
NOTES TO THE CONSOLIDATED FINANCIAL STATEMENTS
date specified for each tranche under the Bank Facilities Agreements.
The Bank Facilities Agreements include the following financial covenant:
Leverage ratio1: the ratio of Net Interest-Bearing Debt1 to Consolidated EBITDA including other income and expenses, shall not exceed 3.50:1 during the life of the Agreements.
The Bank Facilities Agreements also contain restrictions i.a. on the Group companies’ ability to grant security or guarantees (negative pledge). Borregaard is in compliance with the covenants as of 31 December 2020.
Borregaard’s policy for long-term funding is for debt to have an average maturity of at least 2.5 years, with a maturity profile spread over several years. Refinancing risk shall be actively managed and the refinancing process for maturing loans shall preferably commence at least one year ahead of scheduled maturity. Borregaard shall seek to diversify its long-term funding sources, supplementing bank loans with debt capital markets and other sources, subject to availability and conditions. The company may utilise commercial paper markets and/or short-term bank loans as sources of liquidity, provided that such loans can be substituted by undrawn long-term committed loan facilities.
Partially owned companies including the joint venture or companies whose domestic legislation prevents them from entering into loan agreements with Borregaard AS, will need either to be financed on equal (pro rata) terms by the partners or will have to establish independent funding.
In June 2017, LignoTech Florida LLC entered into a USD 60 million loan agreement with SEB. The loan facility is
guaranteed 70% by The Norwegian Export Credit Guarantee Agency and has a tenor of 8.5 years from commercial completion of the plant. Furthermore, an overdraft facility of USD 15 million was established to meet short term liquidity needs. The owners of LignoTech Florida (see Note 31) will guarantee the loan and the overdraft facility on a pro rata basis. As an industrial group, Borregaard is not subject to any external capital requirements.
Liquidity and cash management As of 31 December 2020, Borregaard had a multi-currency overdraft facility of NOK 125 million linked to its international cash pool with DNB, a NOK 100 million overdraft limit linked to its cash pool (Group account system) with Handelsbanken and an intra-day facility of NOK 75 million with Nordea related to salary payments. Borregaard entered 2021 with a commercial paper debt of NOK 400 million. Group liquidity shall be managed in cash pools, with Borregaard AS as owner of top accounts and legal counterpart to relevant banks. Group companies shall participate in cash pools to the extent possible, with allocated internal credit lines. Group companies which are prevented from participating in cash pools, shall enter into deposit and/or loan agreements with Borregaard AS and shall aim at keeping locally held cash balances at a near-zero level. Excess liquidity shall primarily be used to repay debt. Alternatively, excess liquidity can be placed with relationship banks or other well-rated banks.
Partially owned companies including the joint venture or companies whose domestic legislation prevents them from entering into deposit and/or loan agreements with Borregaard AS, shall invest surplus cash in low-risk deposits and/or pay dividend.
NOTE 27 FUNDING AND INTEREST-BEARING LIABILITIES
Loans and receivables are carried at amortised cost. Thus, changes in fair value resulting from changes in interest rates during the interest rate period are not reported in the income statement. Borrowing costs related to the long-term funding are capitalised over the period of the loan facilities.
FundingBorregaard’s main sources of financing are proceeds from its bond issue of NOK 400 million, its EUR 40 million term loan with Nordic Investment Bank (maturing in 2024) and its long-term revolving loan facilities totalling NOK 1,500 million from three Scandinavian banks. The facilities, granted to
Borregaard ASA and Borregaard AS on a joint and several basis, were entered into in July 2020 and will mature in the period from 2023 to 2025. The facilities are unsecured (negative pledge), but the loan agreements contain certain financial covenants (leverage ratio– see Note 26) and some limitations on new indebtedness beside change of control and cross-default provisions.
In June 2017, LignoTech Florida entered into a USD 60 million loan agreement. Amortisation started in 2019. To meet short term liquidity needs, an overdraft facility of USD 15 million was established.
/ 1 Alternative performance measures, see page 142 for definition.

114 115NOTES TO THE CONSOLIDATED FINANCIAL STATEMENTSNOTES TO THE CONSOLIDATED FINANCIAL STATEMENTS
Book value Fair value
Amounts in NOK million 2020 2019 2020 2019
Non-current interest-bearing liabilities
Bank loans/bond 1,037 1,085 1,037 1,085
Other interest-bearing liabilities 344 334 344 334
Total non-current interest-bearing liabilities 1,381 1,419 1,381 1,419
Current interest-bearing liabilities
Bank loans/overdraft/commercial paper/bond 572 555 572 555
Other interest-bearing liabilities 51 53 51 53
Total current interest-bearing liabilities 623 608 623 608
Total interest-bearing liabilities 2,004 2,027 2,004 2,027
Interest bearing receivables
Non-current interest-bearing receivables 3 4 3 4
Cash and cash equivalents 207 147 207 147
Total interest-bearing receivables 210 151 210 151
Net interest-bearing debt 1,794 1,876 1,794 1,876
There were no drawings under the Bank Facilities Agreements as of 31 December 2020. Drawings originating from the bond issue, the commercial paper issues, the term loan with Nordic Investment Bank, and the term loan related
to LignoTech Florida amounted to NOK 1,486 million as of 31 December 2020. The maturity profiles of the Group’s interest-bearing liabilities are shown in the table below.
RECONCILIATION OF LIABILITIES ARISING FROM FINANCING ACTIVITIES
1 January 2020 Cash flowsAdditions
leases
Foreign exchange
movement
Fair value
changes 31 December 2020
Long-term borrowings 1,419 -53 9 6 - 1,381
Short-term borrowings excluding overdraft 542 -100 69 1 - 512
Overdraft 66 54 - -9 - 111
Total liabilities from financing activities 2,027 -99 78 -2 - 2,004
1 January 2019 Cash flowsAdditions
leases
Foreign exchange
movement
Fair value
changes 31 December 2019Long-term borrowings 1,115 -81 381 4 - 1,419
Short-term borrowings excluding overdraft 272 210 60 - - 542
Overdraft - 66 - - - 66
Total liabilities from financing activities 1,387 195 441 4 - 2,027
MATURITY PROFILE INTEREST-BEARING LIABILITIES AND UNUTILISED CREDIT FACILITIES
Gross interest-bearing liabilities Unutilised credit facilities
Amounts in NOK million 2020 2019 2020 2019
Maturity < 1 year 623 608 225 225
Maturity 1-3 years 651 325 500 1,500
Maturity 3-5 years 195 652 1,000 -
Maturity 5-7 years 311 165 - -
Maturity > 7 years 224 277 - -
Total 2,004 2,027 1,725 1,725
For liquidity and cash management purposes, two commercial paper issues totalling NOK 400 million and multi-
currency overdraft facilities of NOK 225 million are in place. NOTE 28 FINANCIAL RISK
(I) ORGANISATION OF FINANCIAL RISK MANAGEMENT
Borregaard operates internationally and is exposed to financial risks like currency risk, interest rate risk, commodity price risk, climate risk, liquidity risk and credit risk. Borregaard uses derivatives and other financial instruments to reduce these risks in accordance with the Group’s finance policy.
Responsibility for managing financial risk in Borregaard is divided between business areas, which manage risk related to business processesand corporate functions, which manages risk related to centralised activities like funding, interest rate management, cash management, currency risk management and credit management policy. Borregaard’s CFO and the Group’s Treasury Department are responsible for managing centralised financial risk elements.
Financial risks This section describes the most important risk factors within the Group and the management of these risks. In this context, financial risk is defined as risk related to financial instruments. These may either be hedging instruments for underlying risk, or viewed as inherently a source of risk.
Borregaard is exposed to currency risk for most of its sales, primarily in USD, but also in EUR. A substantial part of this exposure, defined as estimated net cash flow in USD or EUR, is routinely hedged on a rolling basis with a nine-month time horizon. In order to secure medium-term competitiveness, the hedging horizon may gradually be extended to three years for a EUR/NOK hedging rate in the range of 9.25-9.75 and gradually to three years for USD/NOK hedging rates in the 8.00-8.50 range. For USD/NOK exposure, hedging levels may be reduced for hedging rates below 6.00.
On the revenue side, all of Borregaard’s business segments are exposed to price risk in international markets. Borregaard is also exposed to price risk on wood, energy (heat energy and electric power) and other strategic raw materials. In 2011, Borregaard entered into a long-term hydroelectric power contract with Eidsiva Vannkraft AS for delivery of a total of 6.1 billion kilowatt hours (6.1 TWh) to be supplied in the
period 2013-2024. In 2018, Borregaard and Eidsiva Vannkraft AS entered into a new long term supply contract for electric power for a total of 2.8 TWh to be supplied to the Sarpsborg site in the period 2020 to 2029. The new contract replaces the existing contract between the parties for the period 2020 to 2024, with a gradual reduction of annual deliveries from about 420 GWh in 2020 to about 130 GWh in 2029. The agreement between Eidsiva and Borregaard secures power deliveries for Borregaard’s plants in Sarpsborg from January 2013 until December 2029. In 2019, Borregaard and E-CO Energi entered into a long-term contract for hydroelectric power for a total of 1.66 TWh to be supplied to the Sarpsborg site in the period 2022 to 2033, with annual deliveries increasing from 88 GWh to 175 GWh. In 2019, Borregaard also entered into a new long-term contract with Statkraft for delivery of renewable electric power to the Sarpsborg site. A total of 1.75 TWh will be supplied in the period 2020 to 2029, with annual deliveries of 175 GWh. This is energy to be used by Borregaard solely for production purposes. Borregaard also has a hedging strategy which enables hedging of part of its future expected power consumption. The purpose of this hedging is to reduce the risk from volatility in the power prices.
(II) CATEGORIES OF FINANCIAL RISKS FOR THE BORREGAARD GROUP
Currency riskAs NOK is the presentation currency for the Group, Borregaard is exposed to currency translation risk for net investments in foreign operations. Borregaard hedges this category of risk using currency forward contracts for USD and a mix of forward contracts and loan for EUR.
Transaction risk is hedged against each entity’s functional currency. Borregaard applies hedge accounting for most hedges of future transactions, either cash flow hedges or fair value hedges of firm commitments. The different types of hedges are described in Note 29.
The Group’s aggregated outstanding currency hedges of future transactions on the balance sheet date are shown in the tables on the next page.

116 117
MATURITY PROFILE FINANCIAL LIABILITIES 2020
Amounts in NOK millionBookValue
Contractualcash flows < 1 year 1-3 years 3-5 years 5-7 years > 7 years
Interest-bearing liabilities 2,004 2,004 623 651 195 311 224
Interest payable - 98 31 42 19 6 -
Accounts payable 361 361 361 - - - -
Gross settled derivatives* -78 - - - - - -
Inflow - -7,506 -3,650 -3,850 -2 -2 -2
Outflow - 7,428 3,709 3,719 - - -
Total 2,287 2,385 1,074 562 212 315 222
2020 Amounts in millionPurchase currency Amount
Sale currency Amount Maturity
USD 11 NOK 93 2021
USD 4 NOK 32 2022
NOK 1,190 USD 142 2021
NOK 1,177 USD 132 2022
NOK 832 USD 88 2023
EUR 4 USD 5 2021
EUR 10 NOK 108 2021
NOK 1,053 EUR 103 2021
NOK 1,067 EUR 100 2022
NOK 742 EUR 67 2023
GBP 1 NOK 14 2021
SEK 51 NOK 53 2021
2019Amounts in millionPurchase currency Amount
Sale currency Amount Maturity
USD 1 NOK 12 2020
NOK 1,147 USD 138 2020
NOK 1,190 USD 142 2021
NOK 840 USD 96 2022
EUR 3 USD 4 2020
NOK 916 EUR 93 2020
NOK 958 EUR 94 2021
NOK 647 EUR 62 2022
SEK 48 NOK 46 2020
Interest rate riskBorregaard’s interest rate risk is mainly related to the Group’s interest-bearing liabilities and assets. This risk is managed at parent level. Borregaard shall primarily follow a floating rate strategy, but may consider fixed rates for a maximum of 50% of its debt, using appropriate derivatives. As of 31 December 2020, Borregaard has the following fixed rate exposure:
Liquidity riskLiquidity risk is the risk that Borregaard is not able to meet its payment obligations. This risk is managed centrally, but in close concert with affected subsidiaries. Borregaard AS initiates measures deemed necessary to maintain a strong liquidity. Cash flow from operations, which among
other factors is affected by changes in working capital, is managed operationally at Group level, and is relatively stable. Borregaard monitors liquidity flows, short and long-term, through reporting and selected forecasting routines. Due to the aforementioned measures, the Group has limited liquidity risk.
The table below shows the maturity profile for the Group’s contractual financial liabilities, including liabilities which are not recognised in the financial position.
The amounts represent undiscounted future cash flows and may therefore deviate from recognised figures. The table also includes derivatives recognised as assets on the balance sheet date, as derivatives may include both positive and negative cash flows, and the fair value fluctuates over time. Forward prices are used to determine the future settlement amounts for electric power and currency derivatives.
FOREIGN EXCHANGE CONTRACTS LINKED TO HEDGING OF FUTURE REVENUES AND COSTS
2020Amounts in NOK million
Currency Interest-bearing debt Maturity
NOK 200 2023
USD 26 2023
* Including derivatives recognised as assets.
NOTES TO THE CONSOLIDATED FINANCIAL STATEMENTSNOTES TO THE CONSOLIDATED FINANCIAL STATEMENTS
The financial liabilities are serviced by cash flow from operations, liquid and interest-bearing assets, and, when necessary, drawings on unutilised credit facilities.
Credit risk The management of credit risk related to accounts receivable and other operating receivables is handled as part of the business risk but based on guidelines set by Borregaard AS and continuously monitored by the operating entities. There is no significant concentration of credit risk in respect of single counterparts. A credit management policy is in place. Credit losses are historically modest due to a stable and financially healthy customer base as well as stringent monitoring of trade receivables. See Note 22. For sales to countries or customers associated with high political or commercial risk, trade finance products are widely used to reduce credit risk. With these risk mitigation measures in place, the current credit risk is considered to be acceptable. See Note 8 for geographical breakdown of sales revenues.
Borregaard considers its credit risk related to other financial instruments to be low. Firstly, only relationship banks act as counterparts for financial hedge transactions. Secondly, bank accounts are mainly held with relationship banks. For deposits of liquidity with other counterparts in countries where relationship banks are not present, Borregaard has requirements relating to the bank’s credit rating.
Maximum credit risk The maximum credit exposure for the Group related to financial instruments corresponds to total gross receivables. In the hypothetical and highly unlikely event that no receivables are redeemed, this amounts to:
Commodity price riskThe Group is exposed to price risks in respect of a number of raw materials, of which electric power and wood are the most substantial. However, prices of sold products are also affected by raw material prices, and it is generally Borregaard’s policy to reduce the price risk through commercial contracts.
Climate riskClimate risk assessment comply with the Task Force on Climate-related Financial Disclosures. The short and medium-term climate risk is considered to be low. See pages 25 and 52.
Sensitivity analysisThe financial instruments of the Borregaard Group are exposed to different types of market risk which can affect the income statement or equity. Financial instruments, in particular derivatives, are applied as means of hedging both financial and operational exposure.
In the table below, Borregaard presents a partial analysis of the sensitivity of financial instruments, where the isolated effect of each type of risk on the income statement and on equity is estimated. This is done on the basis of a selected reasonably possible change in market prices/rates on the statement of financial position as of 31 December.
According to IFRS, the analysis covers only financial instruments and is not meant to give a complete overview of the Group’s market risk, for instance:
• For currency hedges of contracts entered into, changes in fair value of the hedging instrument will affect the income statement, while changes in the fair value of the underlying hedged contract offset by the hedging instrument will not be shown, as it is not a financial instrument.
Amounts in NOK million 2020 2019Cash and cash equivalents 207 147
Accounts receivable 763 759
Other current receivables 19 27
Non-current receivables 195 211
Derivatives 200 56
Total 1,384 1,200
MATURITY PROFILE FINANCIAL LIABILITIES 2019
Amounts in NOK millionBookValue
Contractualcash flows < 1 year 1-3 years 3-5 years 5-7 years > 7 years
Interest-bearing liabilities 2,027 2,027 608 325 652 165 277
Interest payable - 160 40 68 35 15 2
Accounts payable 405 405 405 - - - -
Gross settled derivatives* 150 - - - - - -
Inflow - -6,972 -3,338 -3,634 - - -
Outflow - 7,122 3,406 3,707 2 2 5
Total 2,582 2,742 1,121 466 689 182 284
* Including derivatives recognised as assets.

118 119NOTES TO THE CONSOLIDATED FINANCIAL STATEMENTS
• If one of the parameters changes, the analysis will not take account of any correlation with other parameters.
• Financial instruments denominated in the entities’ functional currencies do not constitute any currency risk and are therefore not included in this analysis. Nor is the currency exposure on translation of such financial instruments to the presentation currency of the Group included, for the same reason.
• No sensitivity analysis is performed for the power hedges as the exposure is considered immaterial.
Generally, the effect on the income statement and equity of financial instruments in the table below is expected to offset the effects of the hedged items where financial instruments are part of a hedging relationship.
SENSITIVITY FINANCIAL INSTRUMENTS2020 ACCOUNTING EFFECTS ON
Income statement of Equity of
Amounts in NOK million Increase Decrease Increase Decrease
Financial instruments in hedging relationships
Interest rate risk: 100 bp parallel shift in interest curves all currencies -14 14 - -
Currency risk: 10% change in FX-rate USD/NOK - - -233 233
Currency risk: 10% change in FX-rate EUR/NOK - - -216 -216
Currency risk: 10% change in FX-rate SEK/NOK - - 4 -4
Currency risk: 10% change in FX-rate GBP/NOK - - 1 -1
SENSITIVITY FINANCIAL INSTRUMENTS2019 ACCOUNTING EFFECTS ON
Income statement of Equity of
Amounts in NOK million Increase Decrease Increase Decrease
Financial instruments in hedging relationships
Interest rate risk: 100 bp parallel shift in interest curves all currencies -15 15 - -
Currency risk: 10% change in FX-rate USD/NOK - - -257 257
Currency risk: 10% change in FX-rate EUR/NOK - - -198 198
Currency risk: 10% change in FX-rate SEK/NOK - - 4 -4
NOTE 29 DERIVATIVES AND HEDGING
Derivatives are measured at fair value on the balance sheet date and reported as receivables or liabilities. Changes in fair value are reported in the income statement in cases where the derivative is not part of a hedge relationship that satisfies the criteria for hedge accounting. Embedded derivatives in contracts are identified and measured separately. Purchases and sales of derivatives are recognised at trade date. The Group applies IFRS 9 on its financial instruments.
Hedge accounting The Group’s existing hedge relationships designated in effective hedging relationships qualify for hedge accounting under IFRS 9.
The Group uses the following criteria for classifying a derivative or another financial instrument as a hedging instrument
Accounting effects of changes in market risk are classified to income statement and equity according to where the effect of the changes in fair value will be recognised initially. Effects
recognised in the income statement will also affect equity beyond the figures presented in the table.
NOTES TO THE CONSOLIDATED FINANCIAL STATEMENTS
DERIVATIVES AND HEDGING 2020 2019
Amounts in NOK million Assets Liabilities Assets Liabilities
Cash flow hedges
Currency forwards, currency swaps 179 102 34 185
Power hedges - - 2 -
Interest swaps - 17 - 8
Embedded derivative 7 1 - 9
Hedges of net investments
Currency forwards, currency swaps 8 - 12 -
Other derivatives - Fair value changes recognised in income statement
Currency forwards, currency swaps, options 6 2 8 4
Total derivatives 200 122 56 206
(1) the hedging instrument is expected to be highly effective in offsetting the changes in fair value or the cash flow of an identified object.(2) the hedging effectiveness can be measured reliably,(3) satisfactory documentation is established before entering into the hedging instrument, showing among other things that the hedging relationship is effective,(4) for cash flow hedges, that the future transaction is considered to be highly probable, and
(5) the hedging relationship is evaluated regularly and is considered to be effective.
The table below shows the fair value of all outstanding derivative financial instruments grouped according to treatment in the financial statements:
Calculation of fair value• Currency forwards and currency swaps are measured at
fair value using the observed forward exchange rate for contracts with a corresponding term to maturity at the balance sheet date.
• The fair value of currency options is calculated using Garman-Kohlhagen’s version of the Black-Scholes Option pricing method, and the variables are based on observed indicative market prices at the balance sheet date.
These derivative financial instruments are designated in hedge relationships as follows:
Cash flow hedges The effective part of changes in the fair value of a hedging instrument is recognised in comprehensive income and reclassified to the income statement when the hedged transaction affects profit or loss and is presented on the same line as the hedged transaction. The ineffective part of the hedging instrument is reported in the income statement. When a hedging instrument is sold, exercised or terminated, the accumulated gains and losses at this point will remain
in hedging reserve of equity and will be recognised in the income statement when the hedged transaction affects profit or loss. The Group has established a hedge ratio of 1:1 for the hedging relationship as the underlying risk of foreign exchange are identical to the hedged components. If the hedged transaction is no longer expected to occur, the accumulated unrealised gain or loss recognised in the hedging reserve of equity will be recognised in the income statement immediately. Embedded EUR derivatives in power contracts are designed as hedging instruments to hedge currency fluctuations of highly probable future sales.
In 2020, a loss of NOK 3.5 million (2019: loss of NOK 2.5 million) was recorded in the income statement as a result of hedging inefficiency. All expected cash flows which have been hedged during 2020 still qualify for hedge accounting.
Hedges of net investments in foreign currencies Currency risk on foreign net investments is hedged with currency forward contracts and currency loans. Realised and unrealised effects of the effective part of the hedging instrument are recognised through comprehensive income.

120 121
Effects from ineffective parts of the hedging instrument are recognised through profit and loss. The Group has established a hedge ratio of 1:1 as the underlying risk of the hedging instrument is identical to the hedged risk component.
A negative hedging reserve means a negative recognition in the income statement in the future. In 2020, the operating profit in Borregaard decreased with NOK 241 million (NOK 76 million) related to hedging activities. Accumulated hedging losses from cash flow hedges recognised in the equity hedging reserve as of 31 December 2020 is expected to be recycled to the income statement as follows (before tax):
2021: NOK -70 million (NOK -90 million) After 2021: NOK 136 million (NOK -76 million)
Fair value hedges Gains and losses on derivatives designated as hedging instruments in fair value hedges are reported in the income statement and are offset by changes in the value of the hedged item.
There have not been any significant fair value hedges in the period 2020-2021.
NOTE 30 EQUITY AND SHARE CAPITAL
Borregaard ASA was established on 22 August 2012 with a share capital of NOK 1 million. As part of establishing the Borregaard Group, capital transactions to increase share capital and share premium fund was made. Share capital,
share premium fund, other paid-in equity and retained earnings are presented from the establishment of the Borregaard Group in October 2012.
Date/yearNumber of
sharesNominal value
(NOK)Share capital (NOK million)
31 December 2020 100,000,000 1 100
31 December 2019 100,000,000 1 100
DEVELOPMENT IN THE EQUITY HEDGING RESERVEAmounts in NOK million 2020 2019Opening balance hedging reserve before tax -331 -327
Reclassified to P/L - operating revenues 82 58
Reclassified to P/L - operating costs 1 -1
Reclassified to P/L - net financial income 17 2
Reclassified to Balance sheet - -2
Fair value change cash flow hedges 132 -46
Change in gain/(loss) on hedges of net investments in subsidiaries 6 -15Closing balance hedging reserve before tax -93 -331
Deferred tax and tax payable hedging reserve 27 80
Closing balance hedging reserve after tax -66 -251
NOTES TO THE CONSOLIDATED FINANCIAL STATEMENTSNOTES TO THE CONSOLIDATED FINANCIAL STATEMENTS
THE 20 LARGEST SHAREHOLDERS AS OF 31 DECEMBER 2020*Shareholder Number of shares % of capital
1 NN INVESTMENT PARTNERS 8,924,092 8.92 %
2 ERIK MUST A/S 7,412,755 7.41 %
3 NORDEA BANK ABP 6,555,160 6.56 %
4 IMPAX ASSET MGT 5,748,246 5.75 %
5 ODIN FUND MGT 4,043,529 4.04 %
6 ALFRED BERG 3,971,605 3.97 %
7 FOLKETRYGDFONDET 3,814,334 3.81 %
8 SCHRODER INVESTMENT MGT 3,759,599 3.76 %
9 THE VANGUARD GROUP, INC 2,914,395 2.91 %
10 SVENSKA HANDELSBANKEN ASSET MGT 2,739,444 2.74 %
11 LANNEBO FONDER 2,500,000 2.50 %
12 PARETO GROUP 2,353,823 2.35 %
13 ALLIANZ SE 2,217,921 2.22 %
14 BLACKROCK INC 2,045,249 2.05 %
15 ARCTIC ASSET MGT 2,015,069 2.02 %
16 STOREBRAND INVESTMENTS 1,914,379 1.91 %
17 ABERDEEN STANDARD INVESTMENTS (STANDARD LIFE) 1,847,282 1.85 %
18 DIMENSIONAL FUND ADVISORS 1,689,946 1.69 %
19 T ROWE PRICE ASSOCIATES 1,647,689 1.65 %
20 STATE STREET CORPORATION 1,150,687 1.15 %
Total shares 69,265,204 69.27 %
* The list of top 20 shareholders is based on information from Orient Capital Ltd in their capacity as shareholder analysis provider. In preparing this report, Orient Capital has used data sourced from third parties. None of the third parties have been involved in the preparation of this report and do not accept any liability for its contents. The information disclosed is factual information only and is not financial product advice. Neither Borregaard, Orient Capital or any third party supplier of data accepts any responsibility for any investment decision or action taken or not taken as a result of this report.
TREASURY SHARES OWNED BY BORREGAARD ASA Nominal value
(NOK)Number of
sharesFair value
(NOK million)
1 January 2019 450,215 450,215 34
Exercise of share options in 2019 -467,000 -467,000 -
Shares to employees -297,756 -297,756 -
Purchase/Buy-back of treasury shares 681,316 681,316 -
31 December 2019 366,775 366,775 35
Exercise of share options in 2020 -339,947 -339,947 -
Shares to employees -239,361 -239,361 -
Purchase/Buy-back of treasury shares 597,211 597,211 -
31 December 2020 384,678 384,678 55
NOTE 31 NON-CONTROLLING INTERESTS
As of 31 December 2020, non-controlling interests consist of LignoTech Ibérica SA and LignoTech Florida LLC. Borregaard owns 60% of LignoTech Ibérica located in Spain and 55% of
LignoTech Florida located in USA. The entities are fully con-solidated into the Borregaard Group’s financial statements and minority interests are recognised.

122 123
NOTE 33 RELATED PARTIES
Activity within the Group is reported in the segment information disclosed in Note 7.
Borregaard has one joint venture, Umkomaas Lignin (proprietary) Limited trading as LignoTech South Africa (50%). This company is jointly owned with Sappi Southern Africa Ltd. The equity method is used for consolidation according to IFRS 11 for joint arrangements (see also Note 6). During 2020, the company has sold some of its finished goods to Borregaard subsidiaries on an arm’s length basis. In 2020, the operation at LignoTech South Africa was mothballed and later the decision to permanently close the operation was taken.
Internal trading within the Group is carried out in accordance with special agreements on an arm’s length basis, and joint expenses in Borregaard are distributed among the Group companies in accordance with distribution formulas, depending on the various types of expense. For further information on intercompany transactions, see Note 7 “Segments”.
The members of the Group Executive Management of Borregaard hold a total of 714,000 stock options in the Company. Further information regarding the Group Executive Management is disclosed in Note 9.
Other transactions with related parties are part of ordinary business operations.
NOTE 32 PLEDGES AND GUARANTEES
By virtue of the joint venture agreement with Sappi Southern Africa Ltd., Borregaard AS is liable for export accounts receivable in Umkomaas Lignin (Pty) Ltd (LignoTech South Africa). Since the decisions to first mothball the operation and later to permanently close the lignin production in South Africa were taken during 2020, there has been no sales to export customers and the receivables related to those customers are fully paid.
In 2017, LignoTech Florida LLC (55% owned by Borregaard) entered into a USD 60 million loan agreement as well as a USD 15 million overdraft facility. The owners will guarantee the loan and the overdraft facility on a pro rata basis until relevant financial conditions are met. As of 31 December 2020, USD 57.5 million of the facility was drawn. See Note 26 and 31.
Amounts in NOK million 2020 2019
Changes in non-controlling interests:
Non-controlling interests 1 January 158 198
Non-controlling interests’ share of profit/loss -57 -66
Additions of non-controlling interests 8 21
Translation differences, etc. 1 5
Non-controlling interests 31 December 110 158
As of 31 December 2020, current assets were NOK 94 million (NOK 81 million) in LignoTech Florida and non-current assets amounted to NOK 820 million (NOK 902 million). Current liabilities were NOK 151 million (NOK 127 million) and non-
current liabilities amounted to NOK 526 million (NOK 507 million). LignoTech Florida had a loss for the year of NOK -109 million in 2020 (NOK -116 million).
NOTES TO THE CONSOLIDATED FINANCIAL STATEMENTSNOTES TO THE CONSOLIDATED FINANCIAL STATEMENTS
NOTE 35 ENVIRONMENT, HEALTH AND SAFETY MATTERS
A provision is recognised when the Group has a present obligation (legal or constructive) following a past event, it is probable that an outflow of resources embodying economic benefits will be required to settle the obligation, and a reliable estimate can be made of the amount of the obligation. The amount recognised as a provision is the best estimate of the consideration required to settle the present obligation at the balance sheet date, taking into account the risks and uncertainties surrounding the obligation. When a provision is measured using the cash flows estimated to settle the present obligation, its carrying amount is the present value of the cash flows.
Environment, Health and Safety issues (EHS): Sulphur dioxide (SO2) is one of the most important chemicals used in the productions processes at Borregaard. There are several EHS regulations to secure safe operations, safe working environment and low emissions to environment. The use of SO2 has been regulated for many years, but the authorities both in the EU and in Norway have enhanced the regulations during the last years and new demands are coming. Borregaard decided to introduce new technology to substantially reduce the amount of SO2 stored at the plant in Sarpsborg in order to further improve safety. The majority of the installation was done in 2020 and will be completed in 2021. A project for increased recovery of SO2 from the ethanol plant was finished in 2020. Technology for recovering and scrubbing of emissions will be installed in different process areas during the next years, as well
as measures to reduce the exposure to SO2 in the working environment. 2020 was the first year of no exceedances of the local air quality emission limits.
Cuts in COD effluents: Borregaard has identified both short-term and long-term goals for further cuts in COD effluents. The first goal was to comply with the new water permit which applied from 2019. The next step involves R&D activities in the field of sustainable water treatment solutions as well as technological improvements that will have a positive effect on emissions of organic matter to water. Borregaard will submit an action plan to the Norwegian Environmental Authorities in 2021 with estimated cost, effect on COD and time to implement each activity.
Chlor-alkali plant: From 1949 to 1997, Borregaard used mercury-based technology for chlor-alkali production at the site in Sarpsborg. This process led to pollution of the soil in the area surrounding the plant. In 1994, a ground water barrier was built and a water monitoring programme was established. In 2015, an increased level of mercury was detected. Borregaard identified the relevant measures to improve ground water barriers to prevent further mercury leakage. The estimated cost, NOK 60 million, based on the best estimate related to cleaning, transportation and deposition at an approved landfill was accrued in 2016. The measures were approved by the Norwegian Environment Agency in 2016. The concentration of mercury in ground water wells and in the sewerage systems has decreased
NOTE 34 GOVERNMENT GRANTS
Government grants are recognised in the financial statements when there is a reasonable assurance that they will be received are presented as reduction of costs they are intended to compensate for. Government grants that relate to assets are recognised as a reduction in the acquisition cost of the asset. The grant reduces the depreciation of the asset.
Borregaard recognised NOK 118 million in government grants in 2020 (NOK 102 million)4. Of this amount, NOK 96 million was recognised as reduced costs (NOK 101 million), while NOK 22 million was recognised as a reduction of the acquisition cost of the asset concerned (NOK 1 million). The grants are provided by Norwegian government and the European Union mainly on research and development projects, environmental investments and CO2 compensation.
A consortium of European companies and research institutions, with Borregaard as lead member, was granted financial support for the development and commercialisation of Borregaard’s Exilva microfibrillar cellulose under the Horizon 2020 Flagship programme5, the EU Framework Programme for Research and Innovation. The support covered 60% of Borregaard’s project costs and made it possible to further increase business development activities in the Exilva project. The amount granted to Borregaard was EUR 25 million over a period of four years from 1 May 2016 to 30 April 2020. The grant has been presented as a reduction in operating expenses during the grant period.
/ 4 Figures in parentheses are for the corresponding period in the previous year./ 5 This project has received funding from the Bio-Based Industries Joint Undertaking (BBI) under the European Union’s Horizon 2020 research and innovation programme under grant agreement No 709746.

124 125
due to these actions, and the emissions in 2019 and 2020 were at a historical low level of 1 kg mercury. The area will continuously be monitored in close co-operation with the authorities to secure stable and acceptable mercury levels. After improving the barriers, cleaning and deposition of the polluted soil areas downstream of the ground water barrier started in 2019 and was finalised in 2020. The remaining part of the provision of NOK 60 million, NOK 16 million, was spent in 2020.
During 2020, Borregaard identified two other polluted areas. A total provision of NOK 14 million was made for cleaning and deposition. Remaining provision as of 31 December 2020 is NOK 9 million, which is the best estimate based
on current knowledge and planned actions. See Note 4. Borregaard reports progress to the Norwegian Environment Agency quarterly.
Old landfills: The permanent seal off of the Opsund landfill has been completed during 2020 and the total cost of NOK 30 million was in accordance with the accrual made in 2014. In 2020, Borregaard identified damages in soil related to a former waste disposal site on the premises in Sarpsborg which has been fallow for decades. Measures to secure the landfill will be implemented in 2021 and a total provision of NOK 16 million was recognised in 2020. Remaining provision as of 31 December 2020 is NOK 15 million. See Note 4 and 13.
NOTES TO THE CONSOLIDATED FINANCIAL STATEMENTSNOTES TO THE CONSOLIDATED FINANCIAL STATEMENTS
ENVIRONMENTAL ACCRUALS
Amounts in NOK million Chlor-alkali plant Opsund landfillFormer
waste disposal Total
Initial accrual 60 30 -
Utilised prior to 2020 -44 -28 -
Accrual 1 January 2020 16 2 0 18
Accrual related to matters identified in 2020 14 0 16 30
Utilisation in 2020 of initial accrual -16 -2 -1 -19
Utilisation of additional accrual in 2020 -5 0 0 -5
Accrual 31 December 2020 9 0 15 24
Borregaard’s site in Norway has several areas that are defined as polluted by the Norwegian Environment Agency, due to former operations. Borregaard’s future costs for environmental remediation depends on a number of uncertain factors, such as changes in regulations or approval from authorities for the extent of actions. The estimates are followed up frequently and monitoring of contaminated areas will continue to confirm that implemented measures are sufficient. Borregaard is required to submit a Baseline report according to the Industry Environmental Directive to the Norwegian Environment Agency by the end of 2022.
Due to the uncertain nature to define the exact levels of pollution and precise needs for cleanup, it is possible that estimates could be revised in the future. In addition, conditions which could require future expenditures may be determined to exist for various sites, including Borregaard’s major production facilities and warehouses.
2020 has been a challenging year for Borregaard due to the Covid-19 pandemic where focus has been on putting health and safety first in the daily operations.
Borregaard has monitored the Covid-19 situation closely in 2020 and has established emergency measures and implemented procedures to limit the risk of infection throughout the organisation. In line with the Group’s values, safety and health have been put first. The discontinued raw material supply to LignoTech South Africa and reduced demand in some biopolymers sectors and certain cellulose grades affected sales and results negatively. On the other hand, the increased sales of bioethanol to disinfectants contributed positively. Logistical and other practical challenges have been managed without significant adverse effects on deliveries and production. At the biorefinery in Norway, the annual maintenance stop has been split into several smaller maintenance stops. In total, several stops have been more expensive than having one major
annual maintenance stop, but the risk of infection from the pandemic for employees and external contractors has been reduced. Limited travel activities in 2020 have led to reduced travel costs compared to a normal year.
Borregaard’s diversified market strategy has proven its value as a safety net during difficult financial times. This strategy enables the Group to reduce its exposure to cyclical market segments through reallocation of volumes across several applications and geographical markets. Overall, there have been only minor interruptions in operations as a result of the pandemic.
Borregaard, as a global supplier of products, may be affected by possible further consequences of the Covid-19 pandemic. Borregaard will continue to focus on maintaining sufficient financial capacity to responsibly manage and mitigate any potential effects from the Covid-19 pandemic and will closely monitor the situation.
Shares to employees: As part of the employee share programme, Borregaard has sold a total of 173,383 shares to employees in February 2021. The share price was NOK 121.71 per share including a 25% discount. Costs in 2021, including administration costs, related to the employee share programme amount to approximately NOK 8 million. For more details, see notifications to the Oslo Stock Exchange on 8, 15 and 24 February 2021.
Share options issued: In February 2021, 249,000 share options at a strike price of NOK 183.20 were granted under the long-term incentive programme. The options will expire after five years, the vesting period is three years and the options may be exercised during the last two years. For more details, see notification to the Oslo Stock Exchange on 16 February 2021.
Treasury shares: From 22 February to 17 March 2021, Borregaard has purchased 250,000 shares under a programme aimed at repurchasing a total of 250,000
own shares. The total amount of treasury shares held by Borregaard as of 17 March 2021 is 455,636. See notifications to the Oslo Stock Exchange on 19 February 2021 and onwards.
As of the date of this report, the direct effects for Borregaard’s business of the coronavirus are limited. However, indirect consequences may occur in case customers are affected and have to reduce their activity. Transport and supply chain services may be disturbed and infrastructure services may become limited. To the extent that the consequences of the corona situation leads to lower growth in the world economy, Borregaard, as a global supplier of products, will be affected. However, it is not possible to quantify such effects for the time being.
There have been no events after the balance sheet date that would have had a material impact on the financial statements, or the assessments carried out.
NOTE 36 COVID-19
NOTE 37 OTHER MATTERS AND SUBSEQUENT EVENTS

Income statement .......................................................................................128
Statement of financial position .................................................................128
Statement of cash flow ..............................................................................129
Statement of changes in equity ................................................................129
Notes ..............................................................................................................130
Statement from the Board of Directors ..................................................134
Auditor’s report .............................................................................................135
BORREGAARD ASA FINANCIAL STATEMENTS

128 129BORREGAARD ASA FINANCIAL STATEMENTS 2020BORREGAARD ASA FINANCIAL STATEMENTS 2020
Signed
MARGRETHE HAUGE
Signed
RAGNHILD ANKER EIDE
Signed
PER A. SØRLIEPresident and CEO
Signed
ARUNDEL KRISTIANSEN
Signed
TOVE ANDERSEN
Signed
TERJE ANDERSEN
Signed
HELGE AASEN
Signed
JAN ANDERS OKSUM Chair
Sarpsborg, 17 March 2021The Board of Directors of Borregaard ASA
INCOME STATEMENTAmounts in NOK thousand Note 2020 2019
Other operating expenses 5, 9 -7,616 -6,213
Operating profit -7,616 -6,213
Finance income 6, 9 339,910 318,780
Finance costs 6 -11,680 -15,374
Financial items, net 6, 9 328,230 303,406
Profit/loss before taxes 320,614 297,193
Taxes 8 -70,538 -65,395
Profit/loss for the year 250,076 231,798
Proposed dividend -249,038 -229,156
STATEMENT OF FINANCIAL POSITIONAmounts in NOK thousand Note 2020 2019
Assets
Deferred tax assets 8 99 46
Shares in subsidiaries 7 1,158,347 1,158,347
Loans to Group companies 9 1,746,510 1,756,587
Non interest-bearing receivables 600 840
Non-current assets 2,905,556 2,915,820
Receivables 9 310,625 275,338
Cash, cash equivalents and deposits in Group cash pool 9 9,278 6,832
Current assets 319,903 282,170
Total assets 3,225,459 3,197,990
Equity and liabilities
Share capital 11 100,000 100,000
Treasury shares 11 -385 -367
Share premium 1,758,347 1,758,347
Other paid in equity 10,534 19,659
Retained earnings 235,701 223,440
Equity 2,104,197 2,101,079
Interest-bearing liabilities 10 400,000 400,000
Non-current liabilities 400,000 400,000
Interest-bearing liabilities 10 400,000 400,000
Dividends 249,038 229,156
Income tax payable 8 70,591 65,415
Accounts payable 9 370 20
Other liabilities 1,263 2,320
Current liabilities 721,262 696,911
Equity and liabilities 3,225,459 3,197,990
STATEMENT OF CASH FLOWAmounts in NOK thousand 2020 2019
Profit/loss before taxes 320,614 297,193
Changes in net working capital, etc. -35,754 25,822
Taxes paid -65,415 -71,684
Cash flow from operating activities 219,445 251,331
Cash flow from investing activities - -
Dividends -229,063 -224,019
Proceeds from sales of treasury shares 64,100 65,416
Buy-back of treasury shares -62,113 -60,151
Net paid to shareholders -227,076 -218,754
Change in interest-bearing liabilities - 200,000
Change in interest-bearing receivables 10,077 -225,776
Change in net interest-bearing liabilities 10,077 -25,776
Cash flow from financing activities -216,999 -244,530
Change in cash and cash equivalents 2,446 6,801
Cash and cash equivalents as of 1 January 6,832 31
Change in cash and cash equivalents 2,446 6,801
Cash and cash equivalents as of 31 December 9,278 6,832
STATEMENT OF CHANGES IN EQUITY
Amounts in NOK thousandShare
capitalTreasury
sharesShare
premiumOther
paid-in equityRetained earnings
Total equity
Equity 31 December 2018 100,000 -450 1,758,347 15,614 219,693 2,093,204
Profit/loss for the year - - - - 231,798 231,798
Proposed dividend 2018 - - - - 223,987 223,987
Actual paid-out dividend in 2019 - - - - -224,019 -224,019
Proposed dividend for 2019 - - - - -229,156 -229,156Buy-back/sales of treasury shares - 83 - 4,045 1,137 5 265
Equity 31 December 2019 100,000 -367 1,758,347 19,659 223,440 2,101,079
Profit/loss for the year - - - - 250,076 250,076
Proposed dividend 2019 - - - - 229,156 229,156
Actual paid-out dividend in 2020 - - - - -229,063 -229,063
Proposed dividend for 2020 - - - - -249,038 -249,038Buy-back/sales of treasury shares - -18 - -9,125 11,130 1,987
Equity 31 December 2020 100,000 -385 1,758,347 10,534 235,701 2,104,197
The cash flow statement has been prepared according to the indirect method and reflects cash flows from operating, investing and financing activities and explains changes in cash and cash equivalents in the reporting period.

130 131
Remuneration of the Board of DirectorsIn the General Meeting of the Company’s shareholders in June 2020 it was determined that The Board of Directors is remunerated at annual rates for the period up to the next General Meeting in 2021:
Remuneration of the Nomination CommitteeThe Chair of the Nomination Committee receives NOK 60,200 per year and an additional NOK 9,700 per meeting exceeding 4 meetings. Other members receive NOK 42,400 per year and an additional NOK 8,000 per meeting exceeding four meetings.
BORREGAARD ASA FINANCIAL STATEMENTS 2020BORREGAARD ASA FINANCIAL STATEMENTS 2020
NOTES TO THE FINANCIAL STATEMENTSNOTE 01 GENERAL INFORMATION
NOTE 05 REMUNERATION AND CONTRACTUAL ARRANGEMENTS
Borregaard ASA (“The Company”) was incorporated as a public limited liability company on 22 August 2012.
On 17 September, The Company was inserted as a holding company of Borregaard AS.
NOTE 02 ACCOUNTING PRINCIPLES
The financial statements for Borregaard ASA have been prepared and presented in accordance with the Norwegian Accounting Act and generally accepted accounting principles in Norway (Norwegian GAAP). The annual accounts give a true and fair view of assets and liabilities, financial sta¬tus and result.
All amounts are in NOK thousand unless otherwise stated. The functional currency of Borregaard ASA is NOK.
Classification of items in the financial statements An asset or liability is classified as current when it is part of a normal operating cycle, when it is held primarily for trading purposes, when it falls due within 12 months and when it consists of cash or cash equivalents on the statement of financial position date. Other items are non-current.
NOTE 03 PAYROLL AND PENSIONS
Borregaard ASA has no employees and therefore no pension plan. The executive management is employed in Borregaard AS. For matters relating to the remuneration of
the executive management, reference is made to Note 9 in the Consolidated Financial Statements.
NOTE 04 GUARANTEES
NOTE 06 FINANCE INCOME AND FINANCE COSTS
Borregaard ASA is jointly and severally liable as guarantor and as borrower for the long-term credit facilities entered into by Borregaard AS (NOK 1 500 million).
In addition, Borregaard ASA is jointly and severally liable borrower with Borregaard AS for the EUR 40 million term loan contracted with Nordic Investment Bank.
In 2017, LignoTech Florida LLC (55% owned by Borregaard) entered into a USD 60 million loan agreement as well as a USD 15 million overdraft facility. The owners will guarantee the loan and the overdraft facility on a pro rata basis until certain financial conditions being met.
FEES TO EXTERNAL AUDITORAmounts in NOK thousand 2020 2019
Statutory audit 420 413
Other attest services 726 -
Other non-audit services 87 -
Total 1,233 413
Amounts in NOK thousand 2020 2019
Group contribution 310,000 275,000
Interest income from Borregaard AS 29,858 43,689
Interest income 47 91
Foreign exchange gain 5 -
Total finance income 339,910 318,780
Interest costs -11,680 -15,371
Foreign exchange loss - -3
Total finance costs -11,680 -15,374
Financial items, net 328,230 303,406
SHAREHOLDINGS OF CEO AND MEMBERS OF THE BOARD OF DIRECTORSNumber of shares*
President & CEO
Per A. Sørlie 163,406
Shareholder-elected Board members
Jan A. Oksum 11,500
Terje Andersen 4,371
Tove Andersen 4,000
Margrethe Hauge 4,077
Helge Aasen 2,900
Employee-elected Board members
Ragnhild Anker Eide 3,436
Employee-elected Board observers
Bente Seljebakken Klausen 1,488
Roy Kåre Appelgren 1,005
Total 196,183
* Total share ownership including related parties
Board of Directors
Board chair NOK 550,000 per year
Board member, shareholder-elected NOK 324,300 per year
Board member, employee-elected NOK 290,700 per year
Observer, employee-elected NOK 96,800 per year
Deputy for observer NOK 7,500 per meeting
Audit Committee
Committee chair NOK 90,700 per year
Member NOK 60,800 per year
Compensation Committee
Committee chair NOK 54,400 per year
Member NOK 42,400 per year
MORTGAGES AND GUARANTEESAmounts in NOK thousand 2020 2019
Guarantees to subsidiaries 1,500,000 1,500,000
Total guarantee commitments 1,500,000 1,500,000

132 133
Long-term investments in subsidiaries, associated companies and other shares and bonds, which are held to maturity date, are classified as non-current assets in the balance sheet and entered at the lower of cost and market value.
Only directly owned subsidiaries are included in the below table.
The Group also has indirect ownership in the following subsidiaries and joint venture, of which the profit/loss and equity are important in the valuation of the above company.
Deferred tax assets are only capitalised to the extent that it is probable that there will be sufficient future taxable profit for the tax asset to be used, either because the unit recently reported a profit or because assets with excess value have been identified. If future profits are not likely to be sufficient to absorb the tax reducing timing differences, deferred tax assets are not recognised.
NOTE 07 SHARES IN SUBSIDIARIES
Deferred tax liabilitiesDeferred tax liability consists of the tax liabilities that are payable in the future. The table below lists deferred tax assets and liabilities relating to the timing differences between tax accounting and financial accounting.
Deferred tax shows the company’s tax liability assuming its assets and debt are realised at book value by year-end. Positive temporary differences state that book value is higher than taxable value, and vice versa for negative differences. The item Tax income/(cost) in the profit and loss statement, consists of two elements: The tax payable, and the change in deferred tax. Deferred tax/tax benefit is reflected as long-term debt/non-current assets in the balance sheet.
Amounts in NOK thousand Book valueGroup´s share
of capital
Borregaard AS, Norway 1,158,347 100%
Total 1,158,347 -
Group´s share of capital
Indirectly owned subsidiaries
Borregaard, Inc. 100%
Nutracell AS 100%
Borregaard Austria GmbH 100%
Borregaard Czech s.r.o. 100%
Borregaard UK Ltd. 100%
Borregaard Deutschland GmbH 100%
Borregaard S.E.A. Pte. Ltd 100%
Borregaard Poland sp. z.o.o. 100%
Borregaard France SarL 100%
Borregaard Ibérica, S.L. 100%
LignoTech Ibérica SA 60%
Borregaard Middle East FZE 100%
Borregaard Synthesis Inc. 100%
Borregaard USA, Inc. 100%
Borregaard North America, Inc. 100%
Borregaard Brasil LTDA 100%
Borregaard South Asia Pvt. Ltd 100%
Borregaard Shanghai Company Limited 100%
SenseFi Inc. 100%
LignoTech Florida LLC 55%
Borregaard South Africa (Pty) Ltd. 100%
Indirectly owned joint ventures
Umkomaas Lignin (Pte) Ltd 50%
NOTE 08 TAXES
TAX EXPENSE Amounts in NOK thousand 2020 2019
Profit before tax 320,614 297,193
Current tax expense -70,591 -65,415
Change in deferred tax 53 20
Total tax expense -70,538 -65,395
Tax as % of Profit/loss before taxes 22% 22%
Amounts in NOK thousand 2020 2019
Deferred tax on tax increasing/reducing differences
Provisions -99 -46
Deferred tax liabilities/assets -99 -46
This year’s change in deferred tax 53 20
Change in deferred tax income statement 53 20
Unsecured bond loan 2018-2023On 7 June 2018, Borregaard issued NOK 400 million in a new open bond issue with a tenor of 5 years and a coupon of 3 months NIBOR plus 77 basis points. Settlement of the transaction took place on 20 June 2018. Maturity is 20 June 2023.
Commercial paperOn 19 August 2020, Borregaard issued a commercial paper of NOK 200 million. Settlement of the transaction took place on 21 August 2020 with maturity date in February 2021.
On 18 November 2020, Borregaard issued a commercial paper of NOK 200 million. Settlement of the transaction took place on 23 November 2020. Maturity is 25 May 2021.
Share Capital and shareholdersInformation about the share capital and a list of the largest shareholders in Borregaard ASA is presented in Note 30 in the Consolidated Financial Statements for the Borregaard Group.
NOTE 09 RELATED PARTIES
NOTE 10 INTEREST-BEARING LIABILITIES
NOTE 11 OTHER MATTERS AND SUBSEQUENT EVENTS
INTERCOMPANY RELATIONS WITH BORREGAARD ASAmounts in NOK thousand 2020 2019
Other operating expenses (Note 5) 3,528 3,411
Group contribution 310,000 275,000
Interest income from Group companies (Note 6) 29,858 43,689
Loans to Group companies* 1,746,510 1,756,587
Current receivable Group contribution 310,000 275,000
Accounts payable - -
* The loan is interest-bearing and the interest is calculated in accordance with market conditions.
Reconciliation of total tax expense
The tax rate in Norway is 22%.
Amounts in NOK thousand 2020 2019
22% of profit before taxes -70,535 -65,382
Other non-deductible expenses -3 -13
total tax expense -70,538 -65,395
BORREGAARD ASA FINANCIAL STATEMENTS 2020BORREGAARD ASA FINANCIAL STATEMENTS 2020

134 135BORREGAARD ASA FINANCIAL STATEMENTS 2020 AUDITOR’S REPORT
We confirm that the financial statements for the period 1 January up to and including 31 December 2020, to the best of our knowledge, have been prepared in accordance with applicable accounting standards and give a true and fair view of the assets, liabilities, financial positions and profit or loss of the Company and the Group as a whole. The Board
of Directors’ report includes a fair review of the development and performance of the business and the position of the Company and the Group as a whole, together with a description of the principal risks and uncertainties that they face.
STATEMENT FROM THE BOARD OF DIRECTORS
A member firm of Ernst & Young Global Limited
Statsautoriserte revisorerErnst & Young AS
Dronning Eufemias gate 6, NO-0191 OsloPostboks 1156 Sentrum, NO-0107 Oslo
Foretaksregisteret: NO 976 389 387 MVATlf: +47 24 00 24 00
www.ey.noMedlemmer av Den norske revisorforening
INDEPENDENT AUDITOR’S REPORT
To the Annual Shareholders' Meeting of Borregaard ASA
Report on the audit of the financial statements
OpinionWe have audited the financial statements of Borregaard ASA comprising the financial statements of theparent company and the Group. The financial statements of the parent company comprise the balancesheet as at 31 December 2020, the income statement, statements of cash flows and changes in equity forthe year then ended and notes to the financial statements, including a summary of significant accountingpolicies.
The consolidated financial statements comprise the balance sheet as at 31 December 2020, the incomestatement, statements of comprehensive income, cash flows and changes in equity for the year thenended and notes to the financial statements, including a summary of significant accounting policies.
In our opinion,
► the financial statements are prepared in accordance with the law and regulations► the financial statements present fairly, in all material respects, the financial position of the parent
company as at 31 December 2020, and of its financial performance and its cash flows for theyear then ended in accordance with the Norwegian Accounting Act and accounting standards andpractices generally accepted in Norway
► the consolidated financial statements present fairly, in all material respects the financial positionof the Group as at 31 December 2020 and of its financial performance and its cash flows for theyear then ended in accordance with International Financial Reporting Standards as adopted bythe EU
Basis for opinionWe conducted our audit in accordance with laws, regulations, and auditing standards and practicesgenerally accepted in Norway, including International Standards on Auditing (ISAs). Our responsibilitiesunder those standards are further described in the Auditor’s responsibilities for the audit of the financialstatements section of our report. We are independent of the Company and the Group in accordance withthe ethical requirements that are relevant to our audit of the financial statements in Norway, and we havefulfilled our ethical responsibilities as required by law and regulations. We have also complied with ourother ethical obligations in accordance with these requirements. We believe that the audit evidence wehave obtained is sufficient and appropriate to provide a basis for our opinion.
Key audit mattersKey audit matters are those matters that, in our professional judgment, were of most significance in ouraudit of the financial statements for 2020. These matters were addressed in the context of our audit of thefinancial statements as a whole, and in forming our opinion thereon, and we do not provide a separateopinion on these matters. For each matter below, our description of how our audit addressed the matter isprovided in that context.
We have fulfilled the responsibilities described in the Auditor’s responsibilities for the audit of the financialstatements section of our report, including in relation to these matters. Accordingly, our audit included theperformance of procedures designed to respond to our assessment of the risks of material misstatementof the financial statements. The results of our audit procedures, including the procedures performed toaddress the matters below, provide the basis for our audit opinion on the financial statements.
AUDITOR´S REPORT
Sarpsborg, 17 March 2021
THE BOARD OF DIRECTORS OF BORREGAARD ASA
Signed
JAN ANDERS OKSUM Chair
Signed
MARGRETHE HAUGE
Signed
RAGNHILD ANKER EIDE
Signed
TERJE ANDERSEN
Signed
PER A. SØRLIEPresident and CEO
Signed
TOVE ANDERSEN
Signed
ARUNDEL KRISTIANSEN Signed
HELGE AASEN

136 137AUDITOR’S REPORTAUDITOR’S REPORT
2
Independent auditor's report - Borregaard ASA
A member firm of Ernst & Young Global Limited
The Group operates in an industry with inherent risk of environmental contamination. Environmentalprovisions are recognized when contamination and environment clean up obligations are identified.Estimates of future cash flows to clean up affected areas are based on management`s expectations ofthe related cost. The expected cost is uncertain as it is dependent on management expectation and onrequirements from authorities that may change over time. Further, the application of accounting standardsto recognize or release provisions requires judgement. Since environmental provisions are material andsubject to estimation uncertainty, we consider recognition and measurement of environmental provisionsto be a key audit matter.
We read correspondence with the Group's external advisors on the current situation and risks regardingenvironmental provisions and correspondence with environmental authorities to assess the recognitioncriteria and suggested measures. We assessed the estimated cash flows used as basis for theenvironmental provisions by comparing to the most recent actual cash flows for similar clean-ups, and bycomparing updated estimates with the prior years’ actual expenses. Further, we assessed key inputfactors to the calculations by comparing to data from correspondence with authorities. In addition, weinspected the Group’s litigation and compliance reports and held discussions with the Group's internalcounsel. We also held discussions with management and internal representatives responsible forenvironmental provisions.
We refer to note 4 use of estimates, note 13 other income and expenses, note 24 provisions and othernon-current liabilities, note 25 other liabilities (current) and note 35 environment, health and safetymatters.
The Group is exposed to currency risk as a significant part of sales are invoiced in foreign currencies. Aportion of future forecasted cash flows from sales are hedged using currency forward contracts.Borregaard applies hedge accounting for cash flow hedges. The use of hedge accounting requireseffective hedging relationships and supporting documentation. Accounting for cash flow hedging relatedto sales is material to Borregaard and we consider this a key audit matter.
We assessed the Group’s requirements for use of hedge accounting. We tested, on a sample basis,whether the documentation of cash flow hedging meets the requirements of IFRS as adopted by EU andthat the hedging instruments therefore are eligible for hedge accounting. We examined the assessmentsof cash flows forecasts from sales and the relationship between hedging instruments and hedged items.Furthermore, we considered the retrospective effectiveness testing to assess that the ineffective part ofthe hedge has been calculated accurately. We reconciled the outcome of the retrospective effectivenesstesting resulting in the hedge adjustment to the financial statements. We obtained external confirmationsfor unrealized forward contracts at year-end and assessed the changes in fair value of forward contractsand changes in foreign exchange for hedged items. Further, we assessed the impact on profit and loss,comprehensive income and the balance sheet.
We refer to note 28 financial risk and note 29 derivatives and hedging.
Other informationOther information consists of the information included in the Company’s annual report other than thefinancial statements and our auditor’s report thereon. The Board of Directors and Chief Executive Officer(management) are responsible for the other information. Our opinion on the financial statements does notcover the other information, and we do not express any form of assurance conclusion thereon.
In connection with our audit of the financial statements, our responsibility is to read the other information,and, in doing so, consider whether the other information is materially inconsistent with the financialstatements or our knowledge obtained in the audit, or otherwise appears to be materially misstated. If,based on the work we have performed on the other information obtained prior to the date of the auditor’s
3
Independent auditor's report - Borregaard ASA
A member firm of Ernst & Young Global Limited
report, we conclude that there is a material misstatement of this other information, we are required toreport that fact. We have nothing to report in this regard.
Responsibilities of management for the financial statementsManagement is responsible for the preparation and fair presentation of these financial statements inaccordance with the Norwegian Accounting Act and accounting standards and practices generallyaccepted in Norway for the financial statements of the parent company and International FinancialReporting Standards as adopted by the EU for the financial statements of the Group, and for such internalcontrol as management determines is necessary to enable the preparation of financial statements thatare free from material misstatement, whether due to fraud or error.
In preparing the financial statements, management is responsible for assessing the Company’s ability tocontinue as a going concern, disclosing, as applicable, matters related to going concern and using thegoing concern basis of accounting, unless management either intends to liquidate the Company or tocease operations, or has no realistic alternative but to do so.
Auditor’s responsibilities for the audit of the financial statementsOur objectives are to obtain reasonable assurance about whether the financial statements as a whole arefree from material misstatement, whether due to fraud or error, and to issue an auditor’s report thatincludes our opinion. Reasonable assurance is a high level of assurance but is not a guarantee that anaudit conducted in accordance with ISAs will always detect a material misstatement when it exists.Misstatements can arise from fraud or error and are considered material if, individually or in theaggregate, they could reasonably be expected to influence the economic decisions of users taken on thebasis of these financial statements.
As part of an audit in accordance with law, regulations and generally accepted auditing principles inNorway, including ISAs, we exercise professional judgment and maintain professional scepticismthroughout the audit. We also
► identify and assess the risks of material misstatement of the financial statements, whether due to fraud or error,design and perform audit procedures responsive to those risks, and obtain audit evidence that is sufficient andappropriate to provide a basis for our opinion. The risk of not detecting a material misstatement resulting fromfraud is higher than for one resulting from error, as fraud may involve collusion, forgery, intentional omissions,misrepresentations, or the override of internal control;
► obtain an understanding of internal control relevant to the audit in order to design audit procedures that areappropriate in the circumstances, but not for the purpose of expressing an opinion on the effectiveness of theCompany’s internal control;
► evaluate the appropriateness of accounting policies used and the reasonableness of accounting estimates andrelated disclosures made by management;
► conclude on the appropriateness of management’s use of the going concern basis of accounting and, based onthe audit evidence obtained, whether a material uncertainty exists related to events or conditions that may castsignificant doubt on the Company’s ability to continue as a going concern. If we conclude that a materialuncertainty exists, we are required to draw attention in our auditor’s report to the related disclosures in thefinancial statements or, if such disclosures are inadequate, to modify our opinion. Our conclusions are based onthe audit evidence obtained up to the date of our auditor’s report. However, future events or conditions maycause the Company to cease to continue as a going concern;
► evaluate the overall presentation, structure and content of the financial statements, including the disclosures, andwhether the financial statements represent the underlying transactions and events in a manner that achieves fairpresentation;
► obtain sufficient appropriate audit evidence regarding the financial information of the entities or businessactivities within the Group to express an opinion on the consolidated financial statements. We are responsible forthe direction, supervision and performance of the group audit. We remain solely responsible for our audit opinion.
We communicate with those charged with governance regarding, among other matters, the plannedscope and timing of the audit and significant audit findings, including any significant deficiencies ininternal control that we identify during our audit.

138 139HISTORICAL KEY FIGURESAUDITOR’S REPORT
HISTORICAL KEY FIGURESDefinitions 2020 2019 2018 2017 2016
Profit & loss
Operating revenues (mill.NOK) 5,328 5,063 4,785 4,618 4,492
EBITDA1 (mill.NOK) 1,132 1,007 903 1,055 1,021
EBITDA margin1 (%) 21.2 19.9 18.9 22.8 22.7
Depreciation and write-down (mill.NOK) -443 -418 -323 -306 -274
Amortisation intangible assets (mill.NOK) -5 -4 -4 -4 -4
Other income and expenses1 (mill.NOK) -116 -27 - -9 13
Operating profit (mill.NOK) 568 558 576 736 756
Ordinary profit before taxes (mill.NOK) 496 467 562 715 724
Profit/loss for the year (mill.NOK) 379 351 425 558 553
Cash flow
Cash flow from operating activities (mill.NOK) 886 697 558 780 1,081
Return
Return on capital employed1 (%) 11.4 % 10.5 % 12.7 % 19.1 % 21.7 %
Capital as of 31 december
Book value of total assets (mill.NOK) 7,003 6,744 5,951 5,333 4,671
Market capitalisation 1 (mill.NOK) 14,148 9,488 7,532 8,108 8,469
Equity ratio1 (%) 53.9 51.4 55.8 56.2 58.1
Net interest-bearing debt1 (mill.NOK) 1,794 1,876 1,297 845 300
Leverage ratio1 1.58 1.86 1.44 0.80 0.29
Share of floating interest-bearing liabilities 2 (%) 79 78 67 100 100
SHARES as of 31 December
Number of shares outstanding diluted (x 1,000) 99,712 99,807 99,901 99,957 100,077
Number of shares outstanding (x 1,000) 100,000 100,000 100,000 100,000 100,000
Share-related key figures
Share price at 31 December (NOK) 141.80 95.00 74.80 81.50 84.50
Earnings per share diluted 3 (NOK) 4.37 4.18 4.76 5.66 5.55
Ordinary dividend per share (proposed for 2019) (NOK) 2.50 2.30 2.25 2.00 1.75
Extraordinary dividend (NOK) 1.75
Payout ratio 4 (%) 57 55 47 35 63
Price/earnings ratio 5 32 23 16 14 15
Personell
Number of man-years at 31 December (excluding JV)2 1,091 1,103 1,097 1,065 1,008
DEFINITION: 1 Market capitalisation is calculated on the basis of number of shares outstanding x average share price at year end 2 Liabilities with remaining period of fixed interest of less than one year 3 Profit for the year after minority interests/Average number of shares outstanding diluted at year end 4 Total dividend per share/Earnings per share diluted 5 Share price/Earnings per share diluted
4
Independent auditor's report - Borregaard ASA
A member firm of Ernst & Young Global Limited
We also provide those charged with governance with a statement that we have complied with relevantethical requirements regarding independence and communicate with them all relationships and othermatters that may reasonably be thought to bear on our independence, and where applicable, relatedsafeguards.
From the matters communicated with those charged with governance, we determine those matters thatwere of most significance in the audit of the financial statements of the current period and are thereforethe key audit matters. We describe these matters in our auditor’s report unless law or regulationprecludes public disclosure about the matter or when, in extremely rare circumstances, we determine thata matter should not be communicated in our report because the adverse consequences of doing so wouldreasonably be expected to outweigh the public interest benefits of such communication.
Report on other legal and regulatory requirements
Opinion on the Board of Directors’ report and on the statements on corporategovernance and corporate social responsibilityBased on our audit of the financial statements as described above, it is our opinion that the informationpresented in the Board of Directors’ report and in the statements on corporate governance and corporatesocial responsibility concerning the financial statements, the going concern assumption and proposal forthe allocation of the result is consistent with the financial statements and complies with the law andregulations.
Opinion on registration and documentationBased on our audit of the financial statements as described above, and control procedures we haveconsidered necessary in accordance with the International Standard on Assurance Engagements (ISAE)3000, «Assurance Engagements Other than Audits or Reviews of Historical Financial Information», it isour opinion that management has fulfilled its duty to ensure that the Company's accounting information isproperly recorded and documented as required by law and bookkeeping standards and practicesaccepted in Norway.
Oslo, 19. March 2021ERNST & YOUNG AS
The auditor's report is signed electronically
Jan Wellum SvensenState Authorised Public Accountant (Norway)
/ 1 Alternative Performance Measures, see page 142 for definition./ 2 Excluding employees in the joint venture LignoTech South Africa.

140 141AUDITOR’S REPORT – GLOBAL REPORTING INITIATIVE
A member firm of Ernst & Young Global Limited
Statsautoriserte revisorerErnst & Young AS
Dronning Eufemias gate 6, NO-0191 OsloPostboks 1156 Sentrum, NO-0107 Oslo
Foretaksregisteret: NO 976 389 387 MVATlf: +47 24 00 24 00
www.ey.noMedlemmer av Den norske revisorforening
To the Board of Directors of Borregaard ASA
Independent accountant’s assurance report on Borregaard ASA’s Sustainabilityreporting for 2020We have undertaken a limited assurance engagement of the Borregaard ASA’s Sustainabilityreporting for the period from 1 January 2020 to 31 December 2020. This comprise a review ofBorregaard ASA’s 14 most material sustainability topics, presented in the annual report on page xxand is shown in the company’s overview of reporting on GRI indicators (as shown in the document“GRI Content Index Borregaard Group 2020”, available athttps://borregaard.com/Sustainability/Green-Room) (the “Sustainability reporting”).
Criteria applied by Borregaard ASAIn preparing the Sustainability reporting, Borregaard ASA applied relevant criteria from the GlobalReporting Initiative (GRI) sustainability reporting standards, “Core” option. The Criteria can beaccessed at globalreporting.org and are available to the public. Such Criteria were specificallydesigned for companies and other organizations that want to report their sustainability impacts in aconsistent and credible way. As a result, the subject matter information may not be suitable foranother purpose. We consider these reporting criteria to be relevant and appropriate to review theSustainability reporting.
Borregaard ASA’s responsibilityThe Board of Directors and the Chief Executive Officer (management) are responsible for selectingthe Criteria, and for presenting the Sustainability reporting in accordance with that Criteria, in allmaterial respects. This responsibility includes establishing and maintaining internal controls,maintaining adequate records and making estimates that are relevant to the preparation of the ofSustainability reporting, such that it is free from material misstatement, whether due to fraud orerror.
EY’s responsibilitiesOur responsibility is to express a conclusion on the presentation of the Sustainability reportingbased on the evidence we have obtained.
Our engagement was conducted in accordance with the International Standard for AssuranceEngagements on Assurance Engagements Other than Audits or Reviews of Historical FinancialInformation (‘ISAE 3000’). This standard requires that we plan and perform our engagement toobtain limited assurance about whether, in all material respects, the Sustainability reporting ispresented in accordance with the Criteria, and to issue a limited assurance report. The nature,timing, and extent of the procedures selected depend on our judgment, including an assessment ofthe risk of material misstatement, whether due to fraud or error.
We believe that the evidence obtained is sufficient and appropriate to provide a basis for our limitedassurance conclusion.
Our Independence and Quality ControlWe have maintained our independence and confirm that we have met the requirements of the Codeof Ethics for Professional Accountants issued by the International Ethics Standards Board for
AUDITOR´S REPORT GRIAUDITOR’S REPORT – GLOBAL REPORTING INITIATIVE
Independent accountant’s assurance report on Borregaard ASA’s Sustainability reporting for 2020
A member firm of Ernst & Young Global Limited
Accountants. EY also applies International Standard on Quality Control 1, Quality Control for Firmsthat Perform Audits and Reviews of Financial Statements, and Other Assurance and RelatedServices Engagements, and accordingly maintains a comprehensive system of quality controlincluding documented policies and procedures regarding compliance with ethical requirements,professional standards and applicable legal and regulatory requirements.
Description of procedures performedProcedures performed in a limited assurance engagement vary in nature and timing from, and areless in extent than for a reasonable assurance engagement. Consequently, the level of assuranceobtained in a limited assurance engagement is substantially lower than the assurance that wouldhave been obtained had a reasonable assurance engagement been performed. Our procedureswere designed to obtain a limited level of assurance on which to base our conclusion and do notprovide all the evidence that would be required to provide a reasonable level of assurance.
Although we considered the effectiveness of management’s internal controls when determining thenature and extent of our procedures, our assurance engagement was not designed to provideassurance on internal controls. Our procedures did not include testing controls or performingprocedures relating to checking aggregation or calculation of data within IT systems.
The engagement consists of making enquiries, primarily of persons responsible for preparing theSustainability reporting and related information and applying analytical and other relevantprocedures.
Our procedures included:
Review of Borregaard ASA’s process for preparation and presentation of the Sustainabilityreporting to provide us with an understanding of how sustainability is ensured in practicewithin the business
Interviewing those in charge of Borregaard ASA’s Sustainability reporting to develop anunderstanding of the process for the preparation of the Sustainability reporting
Confirming on a sample basis the information in the Sustainability reporting against sourcedata and other information prepared by Borregaard ASA
Assessed the overall presentation of Sustainability reporting against the criteria in the GRIStandards including a review of the consistency of information against the GRI index.
ConclusionBased on our procedures and the evidence obtained, we are not aware of any materialmodifications that should be made to the Sustainability reporting for 2020, in order for theSustainability reporting to be in accordance with the Criteria.
Oslo, 19. March 2021ERNST & YOUNG AS
The report is signed electronically
Jan Wellum SvensenState Authorised Public Accountant

142 143ALTERNATIVE PERFORMANCE MEASURES
In the discussion of the reported operating results, financial position and cash flows, Borregaard refers to certain measures which are not defined by generally accepted accounting principles (GAAP) such as IFRS. Borregaard management makes regular use of these Alternative Performance Measures and is of the opinion that this information, along with comparable GAAP measures, is useful to investors who wish to evaluate the company’s operating performance, ability to repay debt and capability to pursue new business opportunities. Such Alternative Performance Measures should not be viewed in isolation or as an alternative to the equivalent GAAP measure.
EBITDAEBITDA is defined by Borregaard as operating profit before depreciation, amortisation and other income and expenses. (See Note 7).
EBITDA MARGIN EBITDA margin is defined by Borregaard as EBITDA divided by operating revenues. (See page 139).
EQUITY RATIOEquity ratio is defined by Borregaard as equity (including non-controlling interests) divided by equity and liabilities. (See page 139).
EXPANSION INVESTMENTS Expansion investments is defined by Borregaard as investments made in order to expand production capacity, produce new products or to improve the performance of existing products. Such investments include business acquisitions, pilot plants, capitalised research and development costs and new distribution set-ups. (See Note 7).
OTHER INCOME AND EXPENSESOther income and expenses is defined by Borregaard as non-recurring items or items related to other periods or to a discontinued business or activity. These items are not viewed as reliable indicators of future earnings based on the business areas’ normal operations. These items will be included in the Group’s operating profit (see Note 13).
LEVERAGE RATIOLeverage ratio is defined by Borregaard as net interest bearing debt (see Note 27) divided by last twelve months’ (LTM) EBITDA. (See page 139).
NET INTEREST-BEARING DEBTNet interest-bearing debt is defined by Borregaard as interest-bearing liabilities minus interest-bearing assets (see Note 26 and 27).
CAPITAL EMPLOYED Capital employed is defined by Borregaard as the total of net working capital, intangible assets, property, plant and equipment, right-of-use assets and investment in joint venture minus net pension liabilities.
RETURN ON CAPITAL EMPLOYED (ROCE)Return on capital employed (ROCE) is defined by Borregaard as last twelve months (LTM) capital contribution (operating profit before amortisation and other income and expenses) divided by average capital employed based on the ending balance of the last five quarters. (See Note 7 and page 139).
ALTERNATIVE PERFORMANCE MEASURES
GROUP DIRECTORY
SP BORREGAARD AS Hjalmar Wessels vei 6 PO Box 162 1701 Sarpsborg, Norway T: +47 69 11 80 00 E: [email protected]
SP BORREGAARD USA, INC 100 Grand Avenue Rothschild Wisconsin 54474, USA T: +1 715 359 6544
S 1155 Dairy Ashford, Suite 804 Houston, TX 77079, USA T: +1 281 497782
P LIGNOTECH FLORIDA LLC 6 Gum Street Fernandina Beach Florida 32034, USA
SP BORREGAARD UK LTD. Clayton Road, Birchwood Warrington Cheshire WA3 6QQ, England T: +44 1925 285400 E: [email protected]
SP BORREGAARD DEUTSCHLAND GMBH LignoTech Werk Karlsruhe DEA-Scholven Strasse 9 DE-76187 Karlsruhe, Germany T: +49 721 55 99 10
IR CONTACTS
JØRN SYVERTSENDirector Investor RelationsT: +47 958 36 335E: [email protected]
LOTTE KVINLAUGInvestor Relations OfficerT: +47 922 86 909E: [email protected]
PRESS CONTACT
TONE HORVEI BREDALDirector CommunicationT: +47 924 67 711E: [email protected]
S BORREGAARD POLAND SP.ZO.O ul. Ziebicka 2 PL-60-164 Poznan, Poland T: +48 61 8615379
S BORREGAARD SHANGHAI COMPANY LIMITED RM2801, Tower 1, Grand Gateway, No. 1 Hongqiao Road, Shanghai 200030, China T: +86-21-33568200
S BORREGAARD JAPAN KDS Building, 1F 22-8, Hamamatsucho 1-chome Minato-ku, Tokyo 105-0013, Japan T: +81 3 57 77 03 65
S BORREGAARD SOUTH ASIA PVT. LTD. Plot No. A-80, T.T.C Industrial Area Thane-Belapur Road, MIDC Khairane Navi Mumbai - 400 705, Dist. Thane. (MS), India T: + 91-22-41841750/59/65
S BORREGAARD FRANCE SARL 4 rue Balzac FR-75 008 Paris, France T: +33 1 53 06 60 40
S BORREGAARD IBÉRICA, S.L. Parc de Negocis Mas Blau C/ Garrotxa, 6-8 2º C 08820.- El Prat de Llobregat, Barcelona, Spain T: +34 93 479 11 01
S BORREGAARD S.E.A. PTE. LTD. 10 Anson Road #23-07 International Plaza Singapore 079903 T: +65 6778 0008
S BORREGAARD BRASIL LTDA Rua Tito, 678 - 3º and. Cj 308 São Paulo – CEP 05051-000 Vila Romana, Brazil T: +55 11 3674 9500
P BORREGAARD CZECH S.R.O Místecká 762 739 21 Paskov, Czech Republic T: +420 558 671 741
S SALES • P PRODUCTION
HEAD OFFICE
BORREGAARD ASAPO Box 1621701 SarpsborgNorwayT: +47 69 11 80 00E: [email protected]
PRODUCTION UNITS & SALES OFFICES

Design: FÆRD.no
Borregaard ASAPO Box 162, NO-1701 Sarpsborg, Norway
Telephone: (+47) 69 11 80 00 Fax: (+47) 69 11 87 70E-mail: [email protected] www.borregaard.com