annual report - cdn.jotun.comcdn.jotun.com/images/2005-jotun-annual-report_tcm22-1142.pdf · annual...
TRANSCRIPT

1111Bildetekst1111111111111Bildetekst11112222Bildetekst222222222222Bildetekst22223333Bildetekst333333333333Bildetekst3333
Annual report20052005

2 w w w . j o t u n . c o m 3w w w . j o t u n . c o m
J O T U N W O R L D W I D E
5 GROUP KEY FIGURES
6 DIRECTORS’ REPORT
12 BALANCE SHEET
17 NOTES
4 The Jotun group
5 Group key fi gures
6 Directors’ report
11 Profi t and loss account
12 Balance sheet
14 Cash fl ow statement
15 Accounting policies
17 Notes
34 Auditor’s report
35 Jotun worldwide
35 JOTUN WORLDWIDE
Ribbon cutting during the Grand Ribbon cutting during the Grand Opening in January 2006 declared the Opening in January 2006 declared the Jotun Coatings factory in Zhangjiagang, Jotun Coatings factory in Zhangjiagang, China, officially opened. China, officially opened.
JOTUN PAINTS JOTUN COATINGS JOTUN DEKORATIV JOTUN POWDER COATINGS
Marine coatings • •
Protective coatings • •
Decorative paints • • •
Powder coatings • Middle East North East Asia Scandinavia Global Southeast Asia Americas (ex. Singapore) Europe South Africa Australia Singapore
The Jotun group consists of four business units, each with specific products and segments. Jotun Dekorativ has segment responsi bility for Jotunʼs decorative paints, stains and varnish deliveries to the trade and Do It Yourself (DIY) markets in Scandinavia.
A global leaderEighty years after being established in Norway, Jotun is today a global leader in paints and coatings.
We have 67 companies and 39 production facilities on all continents. In addition Jotun has agents,
branch offices and distributors in more than 70 countries.
Jotun Paints has segment responsibility for decorative paints in all markets outside Scandinavia. This responsibility includes marine and protective coatings for markets in the Middle East and Southeast Asia. Jotun Coatings has global segment responsibility for marine and protective coatings. This responsibility includes
decorative paints in local markets in Europe and selected markets in Asia. Jotun Powder Coatings has global segment responsibility for powder coatings. The product portfolio caters to the architectu-ral, functional and industrial market segments to protect metal surfaces from corrosion and add style to their aesthetic appearance.
contents
4 w w w . j o t u n . c o m 5w w w . j o t u n . c o m
G R O U P K E Y F I G U R E S
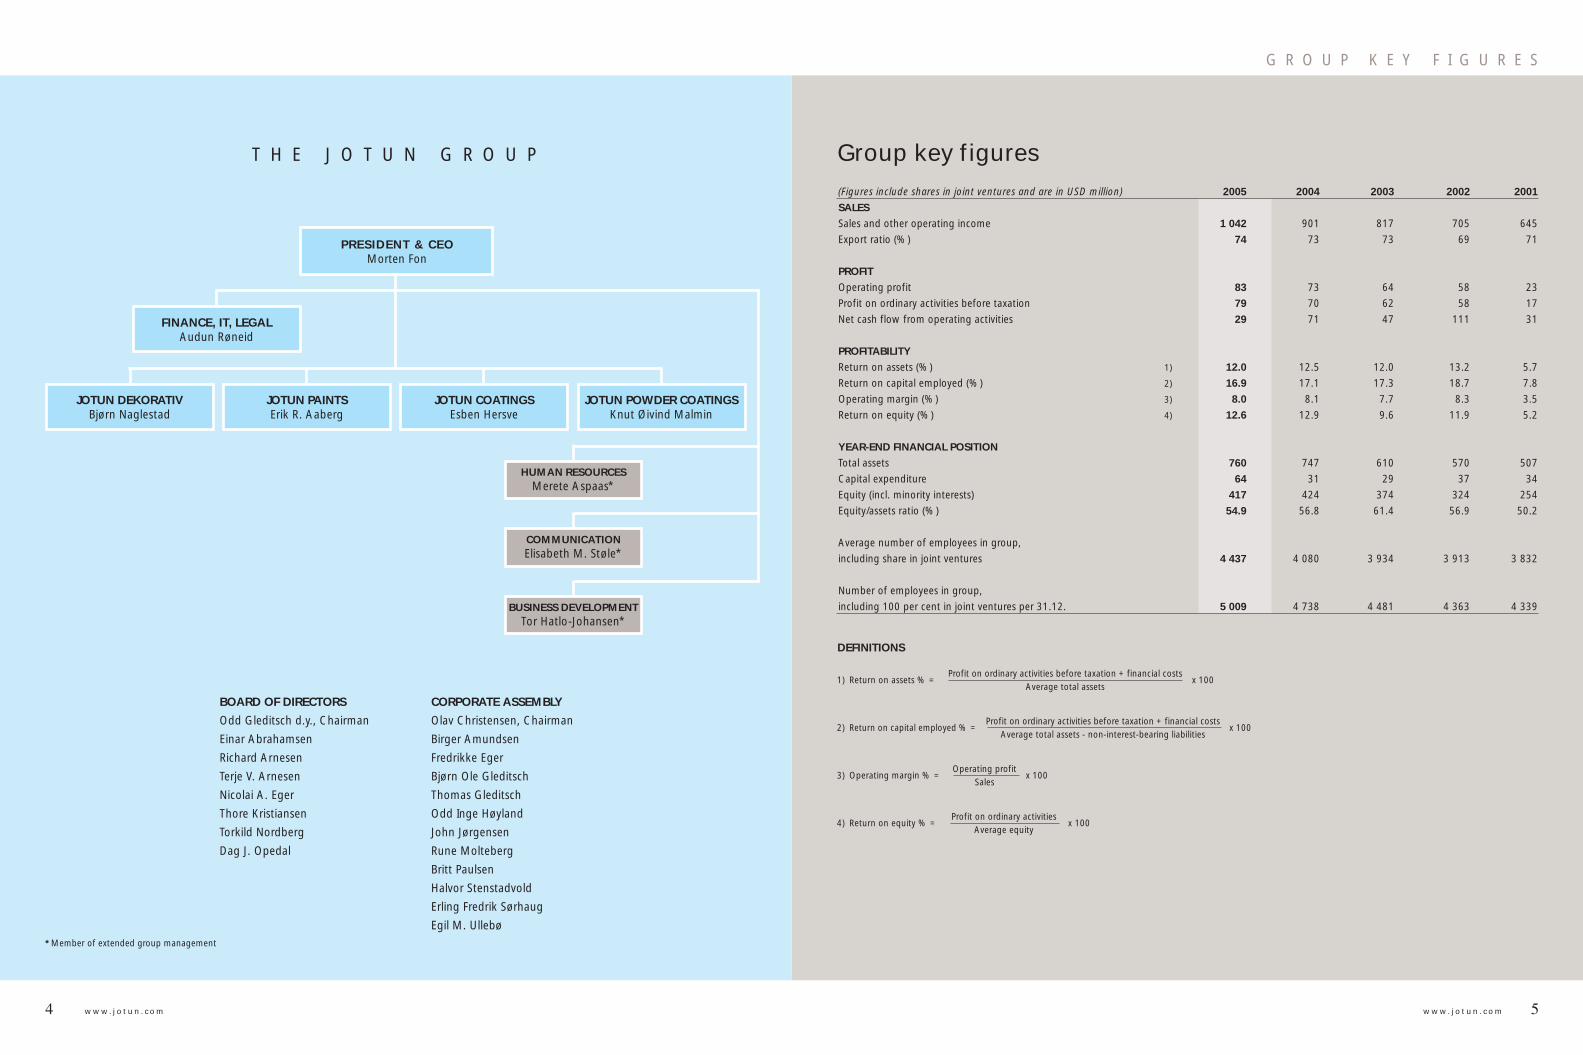
T H E J O T U N G R O U P
*Member of extended group management
BOARD OF DIRECTORS
Odd Gleditsch d.y., Chairman
Einar Abrahamsen
Richard Arnesen
Terje V. Arnesen
Nicolai A. Eger
Thore Kristiansen
Torkild Nordberg
Dag J. Opedal
CORPORATE ASSEMBLY
Olav Christensen, Chairman
Birger Amundsen
Fredrikke Eger
Bjørn Ole Gleditsch
Thomas Gleditsch
Odd Inge Høyland
John Jørgensen
Rune Molteberg
Britt Paulsen
Halvor Stenstadvold
Erling Fredrik Sørhaug
Egil M. Ullebø
PRESIDENT & CEOMorten Fon
JOTUN DEKORATIVBjørn Naglestad
JOTUN PAINTSErik R. Aaberg
JOTUN COATINGSEsben Hersve
JOTUN POWDER COATINGSKnut Øivind Malmin
HUMAN RESOURCESMerete Aspaas*
COMMUNICATIONElisabeth M. Støle*
BUSINESS DEVELOPMENTTor Hatlo-Johansen*
FINANCE, IT, LEGALAudun Røneid
(Figures include shares in joint ventures and are in USD million) 2005 2004 2003 2002 2001
SALES
Sales and other operating income 1 042 901 817 705 645
Export ratio (%) 74 73 73 69 71
PROFIT
Operating profit 83 73 64 58 23
Profit on ordinary activities before taxation 79 70 62 58 17
Net cash flow from operating activities 29 71 47 111 31
PROFITABILITY
Return on assets (%) 1) 12.0 12.5 12.0 13.2 5.7
Return on capital employed (%) 2) 16.9 17.1 17.3 18.7 7.8
Operating margin (%) 3) 8.0 8.1 7.7 8.3 3.5
Return on equity (%) 4) 12.6 12.9 9.6 11.9 5.2
YEAR-END FINANCIAL POSITION
Total assets 760 747 610 570 507
Capital expenditure 64 31 29 37 34
Equity (incl. minority interests) 417 424 374 324 254
Equity/assets ratio (%) 54.9 56.8 61.4 56.9 50.2
Average number of employees in group,
including share in joint ventures 4 437 4 080 3 934 3 913 3 832
Number of employees in group,
including 100 per cent in joint ventures per 31.12. 5 009 4 738 4 481 4 363 4 339
DEFINITIONS
x 100Return on assets % =1)Profit on ordinary activities before taxation + financial costs
Average total assets
x 100Return on capital employed % =2)Profit on ordinary activities before taxation + financial costs
Average total assets - non-interest-bearing liabilities
x 100Operating margin % =3)Operating profit
Sales
x 100Return on equity % =4)Profit on ordinary activities
Average equity
Group key figures

6 w w w . j o t u n . c o m 7w w w . j o t u n . c o m
D I R E C T O R S ’ R E P O R T
ResultsGroup operating income totalled NOK 6,710 million, against NOK 6,075 million in 2004. The group recorded pre-tax profits of NOK 490 million, against NOK 471 million in 2004. The overall tax charge for the year was NOK 151 million, against NOK 142 million in 2004. The group profit after tax but before minority interests was NOK 339 million, against NOK 329 million in 2004. The parent company – Jotun A/S – posted pre-tax profits of NOK 451 million, against NOK 372 million in 2004. After tax totalling NOK 102 million, the parent company accounts show a profit of NOK 349 million, compared with NOK 299 million in 2004. Financial position and capital structureThe group is exposed to credit, interest rate and exchange rate risks in its ordinary business operations, and active steps are taken to keep these risks at acceptable levels. In addition to credit insurance, procedures have been established to assess customer creditworthiness in order to reduce the credit risk. Net interest-bearing debt increased by NOK 328 million from net deposits of NOK 77 million to interest-bearing debt of NOK 251 million at the end of 2005. The groupʼs interest rate exposure therefore remains limited. The primary exchange rate exposure relates to the USD and USD-related curren-cies, the EUR and the TAB. Exchange rate exposure in the groupʼs balance sheet and net cash flows is hedged through currency loans, forward contracts, foreign exchange swaps and options. Group investments totalled NOK 431 million in 2005. On behalf of the group, Jotun A/S had overdraft facilities and other committed short-term and long-term lines of credit amounting to NOK 1,275 million at year-end, none of which had been utilised. At the same time, Jotun A/S had liquid reserves (committed
lines of credit, cash, bank deposits, etc.) totalling NOK 1,407 million. The groupʼs net cash flow in 2005 was NOK -183 million, against NOK 187 million in 2004. The cash flow from operations was NOK 188 million. The groupʼs equity ratio stood at 54.9 per cent at year-end, against 56.8 per cent a year earlier. Liquid reserves and the capital base are considered to be satisfactory, for both the group and the parent company.
Allocation of profitJotun A/S recorded a net profit of NOK 349,009,000 for 2005, with the proposed allocation for approval by the AGM as follows:
Provision for dividends (NOK 450 per share) NOK 153,900,000Allocation to other equity NOK 195,109,000Total allocation NOK 349,009,000
On this basis, free equity at year-end 2005
totalled NOK 2,075 million, against NOK 1,903 million a year earlier.
3. THE MARKETJotun CoatingsThe division is expanding and both sales and net profits have increased since 2004. Nevertheless, profits remain unsatisfactory, given the groupʼs long-term margin and profitability requirements. The marine and protective business segments improved their positions and increased sales in 2005. The business has benefited from the upturn in global trade and the resulting increase in demand for transport and a generally higher level of investment and maintenance activity linked to vessels and industrial plant. Systematic steps taken to implement improvements are also being reflected in higher profitability. Effective innovations developed specifi-cally to meet customer needs have contribu-ted to the improved performance. Enhanced expertise in sales and a greater focus on large and complex clients within selected core areas resulted in many new projects in 2005. Some increase in the pace of growth is expected over the next few years as a result of new and further developments in rapidly expanding markets such as Russia, Brazil, India, Turkey, the Black Sea region, South Africa and China. Jotun Coatings opened a new factory in China in January 2006. This factory repre-sents a major single investment and is designed to meet growth in China in particular and in North Asia in general. Jotun has strengthened its collaboration with the Chinese company COSCO, which has one of the worldʼs largest fleets. This venture in the marine segment will increase sales and enable a good foothold to be established locally.
Jotun PaintsJotun Paints has three business segments; decorative, marine and protective, of which decorative is the most important in terms of sales and profit. All three segments have
1. PRINCIPAL AC TIVIT IESAt the end of 2005, the Jotun group was engaged in the development, manufacture, marketing and sale of paint/coating systems and surface treatment products through four divisions: Jotun Coatings: Marine and protective coatings for industrial and offshore use in Europe, the USA, South Africa, Australia and North East Asia, and decorative products for local customers in the same regions. Jotun Paints: Decorative products in the Middle East and South East Asia, and marine
D I R E C T O R S ’ R E P O R T
and protective coatings for local customers in the same regions. Jotun Dekorativ: Decorative paints, stains and varnishes for the trade and DIY markets in Norway, Sweden, Denmark and Iceland, and the manufacture of binders. Jotun Powder Coatings: Powder coatings for industrial and decorative purposes, and corrosion protection systems for steel reinforcing rods and oil and gas pipelines.
Jotun has a global network and is represented on every continent through its various subsidiaries and joint ventures. The group
comprises 54 active legal entities spread across 35 countries, including 39 manufactu-ring plants. The parent company Jotun A/S has its head office in Sandefjord, Norway.
2. THE ACCOUNTSThe 2005 accounts have been prepared on a going concern basis. The consolidated accounts comprise the results posted by subsidiaries and all joint ventures in which Jotun A/S directly or indirectly owns a stake of 20 per cent or more, with consolidation based on the gross method.
Odd Gleditsch d.y. Chairman of the Board
Einar Abrahamsen Thore Kristiansen Nicolai A. Eger
Terje V. Arnesen Torkild Nordberg Dag J. Opedal Richard Arnesen
B o a r d o f D i r e c t o r s

8 w w w . j o t u n . c o m 9w w w . j o t u n . c o m
D I R E C T O R S ’ R E P O R T
good profitability, especially decorative in the Middle East. The division is expanding and continues to be the market leader in the central Middle East. The Multicolor concept (Jotunʼs colour-mixing system) provides Jotun with one of its competitive advantages. Further development of the concept and its applications has helped to boost distribution and establish a strong position. Steps are also being taken to strengthen sales and marketing expertise within the local companies. The division is also very active in the project market throughout the Middle East and Southeast Asia and has established a good position amongst architects and contractors who have won many large prestige projects. Jotun has achieved success by establishing an early presence in markets with growth potential. A strategic focus on marketing and organisational development has led to the establishment and reinforcement of strong positions in markets such as Saudi Arabia, the United Arab Emirates and Malaysia. Jotun Paints is continually assessing potential new markets in the light of this strategy. Strong growth has led to the need for increased production capacity. In November 2005 Jotun opened a modern new factory in Jakarta, Indonesia, and a new manufacturing facility in Yemen was completed at the end of the year. Investments are also being made to expand the groupʼs plants in Saudi Arabia and Egypt.
Jotun DekorativThe divisionʼs sales was again at a record level in 2005. Higher sales of interior paints combined with a good season for outdoor paints contributed to a satisfactory result for 2005. The year was marked by the introduction of a new ERP system, which affected deliveries to some extent during the high season. This situation was however rectified, and the division is again able to deliver
reliably and meet customer requirements. Jotun has a strong position in Norway, reflecting its good customer relations. The progress being made in sales is evident within the professional trade and in the building commodities market. Jotun has also retained its strong position within the trade market. The number of chains selling the divisionʼs products has fallen, but at the same time they have become bigger and more professional. Jotun seeks to be an attractive partner, not only by offering a sound profit on sales of its
products, but also by providing better products, services and total solutions. In Denmark, Jotun made excellent progress in sales to professional users. The progress made in Sweden was largely due to an increase in distribution to Färgtema. Jotun is now also an approved supplier to the Swedish Spektrum chain, which will broaden the customer base. Innovation is the key to Jotunʼs growth. In 2006, Demidekk Optimal will be launched
in new and practical packaging with a separate lid-opener. The Lady concept is also set for further development, with further and more obvious consumer benefits. Customer requirements are always central to the Jotun Dekorativ innovation process.
Jotun Powder CoatingsJotun Powder Coatings is the worldʼs fourth largest supplier of powder coatings for the industrial surface treatment of metal. In 2005, Jotun Powder Coatings continued to grow in terms of volume and operating income, but higher raw material prices and fierce competi-tion in existing markets led to lower margins. Jotun is responding to the increased competition by developing new products and concepts, while production capacity is being increased to enable existing plants to meet higher demand for products. Jotun Powder Coatings has recently started production in India. It is important to adapt the structure to altered markets. In 2005, the divisionʼs regional organisation was replaced by a segment-based structure with a stronger local focus. This will establish closer proximity to the markets and enable the division to be more responsive to different customers and product requirements across national boundaries. The divisionʼs competitive position is being strengthened by targeting on research and development, improved innovation processes and brand building. Expertise provides an important competi-tive advantage and this is reflected in importance that is attached to the develop-ment of professional skills. Among the groupʼs initiatives in this area is the Jotun Powder School which provides technical and sales training. This facility will also be offered to our customers to increase their understanding of powders and help them to select the most appropriate products and use them correctly. This gives added value for the customer and is part of the process of strengthening long-term relationships.
4. HEALTH, SAFET Y AND THE ENVIRONMENT (HSE)Objectives and activitiesThe world around us demands continuous work on technical and operational initiatives to safeguard health, safety and the environ-ment (HSE). In its approach to HSE, Jotun seeks to ensure that its activities satisfy both internal and external parties. Jotun aims to become more competitive through an active and responsible approach to HSE. Priority shall be given to ensuring that initiatives aimed at improving group profitabi-lity are not at the expense of HSE. The ten audits conducted by HSE personnel in 2005 revealed that most of the groupʼs factories, laboratories and ware houses meet acceptable HSE standards. However, some facilities require upgrading and action plans have been prepared for improvements.
CostsThe overall cost of HSE measures and initiatives shows a slight downward trend over the past five years, most of the decrease being due to lower operating costs related to the external environment. HSE-related operating costs were 38.7 per cent up at NOK 24 million. The increase was partly due to the costs relating to purchase of workware with antistatic and anti flame properties and higher waste management costs arising from increased production. HSE-related operating costs totalled NOK 19.5 million, against NOK 16.5 million in 2004.
Working environmentSafety has always been a priority at Jotun, and the groupʼs aim is to work continuously to safeguard the lives and health of employees. Jotun considers preventive work to be the most important tool as regards the working environment and health.
GroupThe overall incidence of sick leave within the group stood at 1.8 per cent in 2005. This
represents an increase from approximately 1.5 per cent in 2004. There is some uncer-tainty attached to these figures due to differing sick pay schemes, employment conditions and the recording of absence due to illness at the various plants. The real figure for sick leave is probably higher. A total of 872 working days were lost as a result of injuries, equivalent to 0.1 per cent of total working hours. There were 11 accidents involving damage to property in 2005. The group experienced two tragic deaths in 2005 in connection with a hotel fire. Two employees in Korea died in the fire while on a business trip. A total of NOK 11.8 million was invested in improvements to the working environment in 2005. This included the installation of dust filters, ventilation systems, first aid stations and air conditioning. The total number of lost-time injuries due to accidents was 53. The frequency of injuries resulting in absence of at least one day was 7.19 per million working hours. This is higher than is desirable and slightly above the statistical value set by the Federation of Norwegian Process Industries (PIL) for the chemical sector. The accidents related mainly to crushing injuries, cuts and burns. Initiatives aimed at reducing injuries are under continu-ous assessment.
Jotun A/SThe incidence of sick leave Jotun A/S stood at 4 per cent in 2005, against 5.1 per cent in 2004. The Board and management consider the working environment to be satisfactory.
EnvironmentEmissions to the air consist of dust from the production of powder coatings and solvents from paint production. A total of 54,100 tonnes of solvents were used in 2005, against 49,000 tonnes in 2004. The increase was mainly due to a higher production volume.
The group generated 12,400 tonnes of waste in 2005, of which 4,200 tonnes were classified as hazardous waste. The total waste volume represent 2.9 per cent of the production volume, compared with 3.6 per cent in 2004. A total of 64,300 tonnes of water-based emissions were released from production (against 83,100 tonnes in 2004). Of this, 47,300 tonnes were treated (against 63,400 tonnes in 2004). The authorities regard discharges into public sewerage systems to be a local problem at six of the groupʼs factories. A total of NOK 2.9 million was invested in measures to prevent or reduce adverse environmental effects (unchanged from 2004). These measures included equipment to reduce waste volumes and treat process water.
Future challengesThe recruitment, training and the expertise of employees are of crucial importance for realisation of the groupʼs goals and visions. Particular attention will be given to preventive maintenance of manufacturing equipment and buildings over the next few years.
5. DIVERSIT YJotunʼs success is due in no small measure to respect, understanding and adaptation to local conditions and cultural differences. Through a deliberate strategy, Jotun has developed strong management teams with a varied cultural background in the global network. A number of women hold important managerial positions within the group. At Jotun A/S, two of the nine group directors are women, and women hold 25 per cent of the positions with personnel responsibility (unchanged since 2004). 7.5 per cent of blue-collar staff and 29 per cent of white-collar staff are women (against 8 per cent and 30 per cent, respectively, in 2004).
D I R E C T O R S ’ R E P O R T

10 w w w . j o t u n . c o m 11w w w . j o t u n . c o m
P R O F I T A N D L O S S A C C O U N T
Jotun A/S Group (NOK thousand) Note 2005 2004 2005 2004
Sales and other operating income 1,2 2 052 541 1 828 671 6 710 212 6 075 394Cost of goods sold 4 1 027 121 894 086 3 563 835 3 121 784Staff costs 5,7 464 160 439 186 1 178 163 1 071 838Depreciation and amortisation 8 62 948 57 395 205 579 203 667Bad debts 3 765 153 23 444 19 865Other operating costs 6 329 630 368 241 1 204 544 1 165 489Operating profit 167 917 69 610 534 647 492 751
Dividends etc. from subsidiaries 6 168 716 195 086 - -Dividends from joint ventures 6 128 727 69 400 - -Interest receivable 31 117 21 188 17 424 15 968Other financial income 2 197 44 549 28 124 31 850Interest payable -18 516 -14 227 -41 860 -26 905Other financial costs -28 714 -13 724 -48 320 -42 923Profit on ordinary activities before taxation 451 444 371 882 490 015 470 741
Tax payable on profit on ordinary activities 14 -102 435 -72 508 -150 879 -141 960Profit on ordinary activities 349 009 299 374 339 136 328 781
Minority interests 15 - - -34 387 -34 041Net profit for the year 349 009 299 374 304 749 294 740
Distribution of profit Allocated to dividends 15 153 900 136 800 - -Other equity 15 195 109 162 574 - -Total 349 009 299 374 - -
D I R E C T O R S ’ R E P O R T
Sandefjord, 16 February 2006 The Board of DirectorsJotun A/S
Odd Gleditsch d.y. Chairman
Einar Abrahamsen Richard Arnesen Nicolai A. Eger Thore Kristiansen
Terje V. Arnesen Torkild Nordberg Dag J. Opedal
Morten Fon President & CEO
6. GROW TH AND OUTLOOKJotun has a sound market position in Scandinavia, the Middle East and Asia. The groupʼs strategy is to achieve organic growth within existing and new markets. The focus is on more and improved innova-tion of concepts and products, as well as market investments. Jotun is selective in its choice of markets, and special emphasis is given to investment in developing markets with good growth potential. Volume growth in 2005 was in line with the levels achieved in recent years and is expected to be main-tained. Jotun is investing for the future. This means investment in manufacturing facilities, research and development and the expertise and skills of the employees. Investments in 2005 were at a record level, partly due to the construction of new factories in China, Indonesia and Yemen. Further major investment is anticipated in 2006, with the upgrading and expansion of Jotunʼs manufac-turing facilities in Saudi Arabia, Egypt and Turkey. The planning of new manufacturing
units in Brazil and India is also under way. At the beginning of 2006, the world economy is experiencing strong underlying growth. The Chinese economy is still growing strongly, with good growth in the Middle East and an increasing rate of growth in Southeast Asia. The American economy is also performing well, and activity in Western Europe is increasing. Interest rates are at a record low and the price of oil is high. The USD has strengthened slightly, and the prices of most raw materials have stabilised following the sharp increase in prices during 2004 and the first six months of 2005. The prices of some metal-based raw materials have risen significantly in recent months. All these elements impact on Jotunʼs business and profits. However, it is difficult to measure the net effect of such external factors. A weakening of the USD would have an adverse impact on Jotunʼs profits in the short term. On the other hand, further volume growth is expected, which would boost profits and further strengthen Jotunʼs market positions.
Jotun has both a reputation and a tradition for operating in an ethically sound manner and for its healthy attitudes in all cultures. A common framework for ethical attitudes and group values is being systematically communicated throughout the organisation. The Jotun groupʼs breadth in terms of busi-ness areas and geographical regions makes it less vulnerable to fluctuations in individual markets. Based on experience, there is likely to be consolidation within some of our business areas. Jotun has the financial strength needed to adapt to changing market condi-tions and to expand further. In view of ongoing steps being taken to improve efficiency and given Jotunʼs strong market positions, the Board believes that the group can look forward to a satisfactory level of development in the coming years. At the same time, it should be stressed that there is scope for improvement in a number of areas and that this must be addressed as a matter of importance.

12 w w w . j o t u n . c o m 13w w w . j o t u n . c o m
Jotun A/S Group (NOK thousand) Note 31.12.05 31.12.04 31.12.05 31.12.04 ASSETS FIXED ASSETS Intangible assets Deferred tax assets 14 26 686 19 290 68 603 40 269 Intangible assets 8 63 289 52 602 147 422 153 358 Total intangible assets 89 975 71 892 216 025 193 627
Tangible fixed assets Land 8 14 469 14 469 92 003 80 852 Buildings and plant 8 157 231 165 877 692 606 516 599 Machinery, vehicles and equipment 8 138 823 163 925 601 312 545 669 Plant under construction 8 27 776 - 53 911 37 378Total tangible fixed assets 338 299 344 271 1 439 833 1 180 498 Financial fixed assets Investments in subsidiaries 9 990 746 912 661 - -Amounts owed by subsidiaries 18 796 663 598 527 - -Investments in joint ventures 10 180 137 180 137 - -Investments in shares and other interests 11 8 442 8 192 8 442 8 192Pension assets 7 56 974 53 534 77 311 74 403 Other long-term debtors 18 2 555 2 575 40 727 17 674 Total financial fixed assets 2 035 517 1 755 626 126 480 100 269
Total fixed assets 2 463 791 2 171 789 1 782 337 1 474 394 CURRENT ASSETS Stocks 4 358 968 312 236 1 209 961 1 085 779
Debtors Trade debtors 3,18 190 218 187 305 1 496 293 1 220 959 Amounts owed by subsidiaries 18 68 800 8 600 - -Other current debtors 18 196 629 142 801 230 442 174 253 Total debtors 455 647 338 706 1 726 735 1 395 212 Cash, bank deposits, etc. 132 453 356 475 402 044 584 980 Total current assets 947 068 1 007 417 3 338 740 3 065 971 Total assets 3 410 859 3 179 206 5 121 078 4 540 365
Jotun A/S Group
(NOK thousand) Note 31.12.05 31.12.04 31.12.05 31.12.04
EQUITY AND LIABILITIES EQUITY Injected equity Share capital 15,16 102 600 102 600 102 600 102 600Total injected equity 102 600 102 600 102 600 102 600 Earned equity Other equity 15 2 313 041 2 117 930 2 592 288 2 368 636Total earned equity 2 313 041 2 117 930 2 592 288 2 368 636 Minority interests 15 - - 116 054 107 104Total equity 2 415 641 2 220 530 2 810 942 2 578 340 LIABILITIES Provisions for liabilities Pension liabilities 7 75 726 74 174 118 325 107 448Other provisions for liabilities 7 662 14 817 7 960 18 067Total provisions for liabilities 83 388 88 991 126 284 125 515 Other long-term liabilities Amounts owed to credit institutions 12,17 96 787 109 721 144 086 131 828Other long-term liabilities - - 38 309 28 957Total long-term liabilities 96 787 109 721 182 395 160 785 Current liabilities Short-term loans - - 301 993 178 856Short-term loans to subsidiaries 18 124 900 126 500 - -Bank overdrafts 21 - - 206 713 196 818Trade creditors 206 531 242 365 704 478 633 742Tax payable 14 78 640 52 585 99 364 74 416Public duties payable 82 834 79 600 104 309 102 753Allocated to dividends 15 153 900 136 800 153 900 136 800Other current liabilities 13,18 168 238 122 114 430 700 352 339Total current liabilities 815 043 759 964 2 001 457 1 675 725 Total liabilities 995 218 958 676 2 310 136 1 962 025
Total equity and liabilities 3 410 859 3 179 206 5 121 078 4 540 365
B A L A N C E S H E E TB A L A N C E S H E E T
Sandefjord, 16 February 2006The Board of Jotun A/S
Odd Gleditsch d.y. Chairman
Einar Abrahamsen Richard Arnesen Nicolai A. Eger Thore Kristiansen
Terje V. Arnesen Torkild Nordberg Dag J. Opedal Morten Fon President & CEO

14 w w w . j o t u n . c o m 15w w w . j o t u n . c o m
Jotun A/S Group (NOK thousand) Note 31.12.05 31.12.04 31.12.05 31.12.04Cash flow from operating activities Net profit for the year 349 009 299 374 304 749 294 740Change in deferred tax 14 -7 396 -3 905 -28 334 -16 693Gains/losses on the sale of fixed assets -1 280 -853 -3 980 7 973Depreciation, amortisation and write-downs 8 62 948 57 395 205 579 203 667Change in stocks, trade debtors and trade creditors 19 -85 480 687 -328 779 -147 826Change in borrowing/lending via group account system -61 800 162 100 - -Change in provisions for warranty claims 13 -7 985 14 772 -7 986 37 199Change in other accrual items 19 22 420 29 951 46 592 101 113Net cash flow from operating activities 270 436 559 521 187 841 480 173 Cash flow from investing activities Sale of tangible fixed assets 3 129 2 207 12 258 13 750Purchase of tangible fixed assets 8 -69 511 -90 371 -430 833 -257 434Investments in subsidiaries and joint ventures -78 466 -101 176 - -Change in other investments and lending -201 426 -95 295 -26 199 1 394Net cash flow from investing activities -346 274 -284 635 -444 774 -242 290 Cash flow from financing activities New loans - - 357 900 211 649Loan repayments -11 384 -5 821 -192 420 -114 940Dividends paid -136 800 -102 600 -136 800 -102 600Change in minority interests 15 - - 8 950 -6 031Net cash flow from financing activities -148 184 -108 421 37 630 -11 922 Translation differences - - 36 367 -38 711Net change in cash and cash equivalents -224 022 166 465 -182 936 187 250 Cash and cash equivalents, 1 Jan. 356 475 190 010 584 980 397 730Cash and cash equivalents, 31 Dec. 132 453 356 475 402 044 584 980 Undrawn credit facilities, 31 Dec. 21 1 275 000 1 050 000 1 275 000 1 050 000
C A S H F L O W S T A T E M E N T
BASIS OF VALUATION AND CL ASSIFIC ATIONThe annual accounts for Jotun A/S and the group comprise the profit and loss account, balance sheet, cash flow statement and notes to the accounts, which have been prepared in accordance with the Companies Act (Norway), the Financial Reporting Act (Norway) and generally accepted accounting principles as of 31 December 2005. In a move to make the accounts more accessible, Jotun has prepared them so that the financial statements provide a summary of the accounting information, with the relevant figures broken down in the notes. As such, the notes form an integral part of the annual accounts. The parent company and group accounts are based on the funda-mental concepts of historic cost, comparability, going concern, congruence and prudence. Transactions are included in the accounts at the value of the payment at the time of the transaction. Income is included in the profit and loss account as it is earned, and costs are recognised in line with the income to which they relate. In the case of sales of goods and services, items are therefore normally taken to income when the goods are delivered or the service is provided. Where projects are identified as generating a loss, a provision is made to cover the entire loss. Hedging and portfolio management are taken into account. Costs that cannot be related to specific items of income are included in the accounts as they are incurred. In the case of the restructuring or termination of operations, all estimated associated costs are charged to the accounts at the time the relevant decision is taken. Where actual figures are not available at the time the accounts are prepared, generally accepted accounting principles dictate that the management should use the best possible estimates in the profit and loss account and balance sheet. Discrepancies may arise between estimated and actual figures. Assets/liabilities related to the working capital cycle and items falling due within one year of the year-end are classified as current assets/liabilities. Current assets/liabilities are valued at the lower of cost and net realisable value. Net realisable value is defined as the expected future selling price, net of selling costs. Other assets are classified as fixed assets. Fixed assets are valued at cost. Fixed assets that reduce in value are depreciated. Any drop in the value of a fixed asset that is not considered temporary results in the write-down of that fixed asset. Equivalent policies are normally applied for liabilities. In line with generally accepted accounting principles, there are a few departures from the general valuation policies above, with any such departures being commented on in the relevant notes. Importance is attached to financial realities, and not solely to legal form, when applying accounting policies and presenting transactions and other matters. Conditional losses that are both likely and quantifiable are charged to the profit and loss account. The division of the segmental information is based on the companyʼs internal management and repor-ting objectives, and on risk and earnings. Sales figures are presented
A C C O U N T I N G P O L I C I E S
for both the divisions and geographical areas, since the geographical distribution of operations is important in any assessment of the company.
CONSOLIDATION OF SUBSIDIARIES AND JOINT VENTURESThe group accounts cover the parent company and its subsidiaries (companies in which it controls more than 50 per cent of the shares directly or indirectly or otherwise has a significant influence) and joint ventures (companies over which it shares control with other share-holders under the terms of a specific agreement to this effect). Full line-by-line consolidation is used for subsidiaries and proportional line-by-line consolidation for joint ventures. The group accounts present the financial performance and position of the group as a single entity. The accounting policies are used consistently for all group companies to all intents and purposes. New subsidiaries are included in the accounts from the time a controlling influence is acquired, and companies that have been sold are included until the date of disposal. All inter-company transactions and balances have therefore been eliminated. Unrealised gains on stocks of goods etc arising from inter-company transactions are eliminated in the groupʼs stocks and operating profit figures.
ELIMINATION OF SHARES IN SUBSIDIARIES AND JOINT VENTURESThe acquisition method has been used to consolidate holdings in subsidiaries and joint ventures. This means that the cost to the parent company of shares in subsidiaries and joint ventures is offset against their equity at the time of acquisition. Any excess paid over the book value of the separable net assets acquired is assigned to the assets to which it relates and depreciated in line with these assets, with the balance included as goodwill under intangible assets in the group balance sheet. Goodwill is amortised on a straight-line basis over its estimated useful life, normally ten years in the coatings industry.
TR ANSL ATION OF THE ACCOUNTS OF SUBSIDIARIES AND JOINT VENTURESThe profit and loss accounts of foreign subsidiaries and joint ventures are translated into NOK at the average exchange rates for each month, while their assets and liabilities are translated at the exchange rates ruling at the year-end. Translation differences arising on consolidation are taken directly to equity. Income and costs from hedging the equity of foreign companies are offset against translation differences. Translation differences attributable to minority interests are included under minority interests.

16 w w w . j o t u n . c o m 17w w w . j o t u n . c o m
NOTE 1 SALES PER DIVISION AND GEOGRAPHICAL AREA
(NOK thousand) Jotun Jotun Jotun Jotun PowderDivisions Dekorativ Coatings Paints Coatings TotalSales 1 610 317 2 699 013 1 488 451 832 633 6 630 414
Middle/ RestGeographical areas Europe Far East USA of world TotalSales 3 684 932 2 512 620 84 674 348 188 6 630 414
NOTE 2 SALES AND OTHER OPERATING INCOME Jotun A/S Group(NOK thousand) 2005 2004 2005 2004Sales 1 308 807 1 202 719 6 630 414 6 003 422Sales to subsidiaries 563 136 469 371 - - Other operating income 59 249 54 532 79 798 71 972Other operating income from subsidiaries 121 348 102 049 - - Total 2 052 541 1 828 671 6 710 212 6 075 394 Other operating income comprises rental income, licence income, sundry costs invoiced on, compensation payments and gains on the sale of tangible fixed assets.
NOTE 3 BAD DEBTS Jotun A/S Group(NOK thousand) 31.12.05 31.12.04 31.12.05 31.12.04Provisions for bad debts, 1 Jan 3 150 4 550 179 617 203 369Bad debts written off and net recoveries -15 -1 553 -12 640 -43 617Year’s provisions 765 153 23 444 19 865Provisions for bad debts, 31 Dec 3 900 3 150 190 421 179 617
NOTE 4 STOCKS Jotun A/S Group(NOK thousand) 31.12.05 31.12.04 31.12.05 31.12.04Raw materials 101 566 75 387 444 869 448 470Finished goods 266 349 244 167 812 816 674 106Write-downs for obsolescence -8 947 -7 318 -47 724 -36 797Total 358 968 312 236 1 209 961 1 085 779
N O T E SA C C O U N T I N G P O L I C I E S
SUBSIDIARIES IN HIGH- INFL ATION COUNTRIESThe accounts of subsidiaries in countries with high rates of inflation – i.e. Jotun Toz Boya San. ve. Ticaret AS and Jotun Boya San. ve. Ticaret AS in Turkey – are prepared in EUR and USD respectively as their notional currency. This means that their assets and liabilities are valued on the basis of their historical cost in these currencies.
MINORIT Y INTERESTSMinority interests ̓share of after-tax profit on ordinary activities and share of equity are shown on separate lines.
FINANCIAL INSTRUMENTSFinancial instruments are used extensively to reduce exchange rate and interest rate risk at Jotun. Exchange rate instruments are carried at market value and interest rate instruments are carried at the lower of cost and market value. Jotun manages the hedging of cash flows from operating activities exposed to exchange rate risk as a portfolio on the basis of anticipated future cash flows. Contracts used for this purpose do not qualify for hedge accounting. Gains/losses are recognised under other financial income/costs, and open contracts are carried at market value. The hedging of group balance sheet items can be divided into portfolios. This exposure relates primarily to the parent companyʼs net invest-ments in foreign operations. Normally instruments used to hedge such balance sheet items qualify for hedge accounting, so realised exchange rate gains/losses are taken directly to equity and offset against translation differences. Open contracts hedging balance sheet items are carried at market value, and unrealised gains/losses are taken to equity. Where such instruments do not qualify for hedge accounting, changes in value are recognised under other financial income/costs. The interest component of a hedge is also taken to the profit and loss account under other financial income/costs. Various types of derivative are used to hedge interest rate risk on the basis of a portfolio view of the underlying items. The underlying items are primarily off balance sheet items. Since many hedges cannot be linked to specific loans, open contracts are valued at the lower of cost and market value. Gains/losses are recognised when realised under other financial income/costs.
SHARES, BONDS AND OTHER SECURITIESMarket-based shares, bonds and other financial instruments classified as current assets are valued at market value in line with § 5-8 of the Financial Reporting Act (Norway). Other securities classified as current assets are valued on a portfolio basis. The portfolio is managed as a single unit and, as such, its value is adjusted only if the total value of the portfolio falls below the total cost of the various securities it comprises. Securities classified as fixed assets are included at the lower of cost and market value.
INTANGIBLE ASSETSAll costs relating to market investments and research and development are charged to the profit and loss account on an ongoing basis. Acquired goodwill and technology are capitalised and amortised over their estimated useful life, normally five to ten years in the coatings industry.
TANGIBLE FIXED ASSETS AND DEPRECIATIONTangible fixed assets are reported at cost less accumulated deprecia-tion. Depreciation is charged against operating profit on a straight-line basis over the estimated useful life of an asset. Where the net realisable value of a fixed asset is lower than its book value, and this is attributable to causes that are not considered temporary, the fixed asset is written down to its net realisable value. Costs relating to normal maintenance and repairs are charged to the profit and loss account on an ongoing basis. Costs relating to major replacements and renewals that substantially increase the estimated useful life of a fixed asset are capitalised. Interest which relates to plant under construction is capitalised as part of the cost.
STOCKSStocks are valued at the lowest of cost, materials cost and net realisa-ble value on a first-in/first-out basis. The materials cost of semi-finished and finished goods produced internally is defined as direct materials and labour costs plus a proportion of indirect production costs. Allowances are made for obsolescence.
DEBTORS AND L IABIL IT IESDebtors and liabilities denominated in foreign currencies are translated at the exchange rates ruling at the year-end. Debtors are included in the accounts at their full value, with deductions for anticipated bad debts.
PENSIONSPensions are accounted for in line with the Norwegian Accounting Standard. Pension liabilities relating to defined benefit plans are shown at the present value of projected pension benefits at the year-end. Pension scheme assets are shown at their market value. Any scheme surpluses are included in the balance sheet only where it is likely that they can be put to use. Actuarial gains and losses of up to 10 per cent of gross liabilities/assets are not taken to the profit and loss account, while any gain or loss in excess of 10 per cent is amortised over a period of three years. The yearʼs net pension costs are included in the profit and loss account under staff costs.
TA X AND DEFERRED TA XThe tax charge relates to the accounting profit/loss for the year and comprises the sum of tax payable and the change in deferred tax liabilities and tax assets. Deferred tax is computed using the liability method on the basis of the temporary timing differences between values for tax and accounting purposes at the end of the year. The nominal tax rate is used in these calculations. Temporary positive and negative timing differences which reverse or may reverse in the same period are offset.
C ASH FLOW STATEMENTThe cash flow statement is prepared using the indirect method. Cash and cash equivalents comprise cash, bank deposits and other short-term liquid investments which can be converted to known cash amounts immediately with no material price risk.

18 w w w . j o t u n . c o m 19w w w . j o t u n . c o m
NOTE 5 STAFF COSTS, NUMBERS AND REMUNERATION
Staff costs Jotun A/S Group(NOK thousand) 2005 2004 2005 2004Salaries and wages incl. bonuses 367 412 336 293 926 756 841 065Social security 59 119 55 608 112 590 106 160Pension costs, defined-contribution 17 452 - 40 119 4 369Pension costs, defined-benefit 19 320 46 473 37 112 61 990Other benefits 857 812 61 586 58 254Total 464 160 439 186 1 178 163 1 071 838 Average number of employees, including share in joint ventures 776 800 4 437 4 080 Remuneration of Board of Directors, Corporate Assembly and President & CEO
(NOK) CEO Board Corporate assemblySalary incl. bonus* 5 201 145 Other remuneration (company car, etc.) 138 472 1 070 000 190 000Pension premiums 755 000
* Including bonus to previous President & CEO of NOK 2.4 mill.
Remuneration to the previous President & CEO is included from 1 January 2005 to 30 September 2005, plus salary for the new President & CEO from 1 October to 31 December 2005.
The President & CEO is included in a pension scheme covering all members of the company’s senior management team. The standard retirement age is set at 67 years, with either party entitled to terminate employment wholly or in part up to five years earlier (see note 7).
The President & CEO is also covered by a profit-related bonus scheme for group management with an upper limit of 20 per cent of agreed annual salary.
AuditorsAudit fees for Jotun A/S in 2005 came to NOK 928,000. A further NOK 200,000 was paid for other services.Audit fees for the group came to NOK 6,486,000 in 2005.
NOTE 6 OTHER COSTS AND FINANCE ITEMS
Common services in Jotun A/S were invoiced to subsidiaries and joint ventures in the sum of NOK 66.9 million. As a result of refinancing and restructuring in the Middle East and China, the dividends in Jotun A/S from subsidiaries and joint ventures include extraordinary dividends.
NOTE 7 PENSION COSTS
Defined contribution plansDefined contribution plans are schemes where the company pays annual contributions to the employees’ pension plans, and where the yield on the pension funds will affect the amount of the pension. Jotun closed the defined benefit pension schemes on 1 January 2005 in the Norwegian companies for employees under 57 and replaced these with defined contribution schemes. The company now pays monthly contributions to every employee’s pension account.
Defined benefit plansSchemes with net pension funds cover 189 employees and 638 pen-sioners related to the collective pension scheme in Jotun A/S. Addi-tionally, 25 employees and 73 pensioners in the remaining Norwegian subsidiaries are included in similar schemes. In the collective scheme, a future pension benefit of up to 60 per cent of the final salary is achieved, which is solely limited up to 12 times the national insur-ance basic amount (G). The scheme is co-ordinated with benefits from national insurance.
Included in the scheme with net pension obligations is defined benefit schemes for 15 employees and 23 pensioners in Jotun A/S for employees with a pensionable income exceeding 12G and defined benefit schemes for 103 employees and 134 former employees/ pensioners in Jotun’s U.K. companies. Additionally, there are pension
obligations for 153 employees in our Indonesian companies. Obliga-tions are also included for Jotun A/S and Norwegian subsidiaries from the AFP early retirement pension scheme. In addition to this are other pension obligations financed through operations, which covers agreed and executed early retirements, unsecured retirement pensions and early retirement schemes for Jotun’s senior executives in Norway.
Jotun A/S OtherRetirement pensioners in unsecured schemes 10 1 Early retirement agreements – agreed and implemented 45 6 Senior executive schemes – active 13 -Senior executive schemes – pensioners 5 -
With effect from 2002, Jotun decided to reduce the period for amortising actuarial gains and losses beyond the corridor and scheme changes for three years. The company has used an external actuary to carry out the year’s pension calculations. The market value of pension funds in Norwegian and English schemes is estimated as at 31 Decem-ber 2005. Pension obligations in the Norwegian and English schemes are estimated at actual value as at 31 December 2005. The surplus in the overfunded pension schemes has been assessed and may be used to finance future pension premiums.
N O T E SN O T E S

20 w w w . j o t u n . c o m 21w w w . j o t u n . c o m
CONTINUED NOTE 7 PENSION COSTS 2005 2004 Overfunded Underfunded Overfunded Underfunded Jotun A/S schemes schemes schemes schemes(NOK thousand) Present value of accrued pension benefits 275 070 136 769 270 520 130 758Impact of future wage growth 3 408 11 918 9 110 14 520Present value of projected pension benefits (incl impact of future wage growth) 278 478 148 687 279 630 145 278Value of scheme assets (market value) 299 700 58 589 297 960 54 343Net surplus/deficit 21 222 -90 098 18 330 -90 935Non-amortised actuarial gains/losses -35 752 -14 372 -35 204 -16 761Net book surplus/deficit 56 974 -75 726 53 534 -74 174 Year’s pension costs Present value of year’s accrued pension benefits 3 230 9 990 13 198 10 962Interest cost on accrued pension benefits 14 945 6 899 23 821 8 806Projected return on scheme assets -18 845 -3 572 -28 167 -4 229Net effect of change to defined-contribution schemes - - -15 176 -4 867 Amortised changes in pension schemes - - - 3 849Amortised actuarial gains/losses 2 787 812 22 358 9 595National insurance payable on net pension costs 784 2 290 2 522 3 801Net pension costs 2 901 16 419 18 556 27 917 Group (NOK thousand) Present value of accrued pension benefits 306 187 388 195 301 268 344 769Impact of future wage growth 3 718 12 766 9 816 15 494Present value of projected pension benefits (incl impact of future wage growth) 309 905 400 961 311 084 360 263Value of scheme assets (market value) 345 140 222 340 345 815 189 701Net surplus/deficit 35 235 -178 621 34 731 -170 562Non-amortised actuarial gains/losses -42 076 -60 296 -39 672 -63 114Net book surplus/deficit 77 311 -118 325 74 403 -107 448 Year’s pension costs Present value of year’s accrued pension benefits 3 524 17 423 14 770 17 437Interest cost on accrued pension benefits 16 632 17 993 26 731 19 028Projected return on scheme assets -21 716 -12 126 -32 508 -12 198Net effect of change to defined-contribution schemes - - -17 999 -4 867Amortised changes in pension schemes - - - 4 717Amortised actuarial gains/losses 3 624 8 546 23 193 16 933 National insurance payable on net pension costs 814 2 398 2 690 4 063 Net pension costs 2 878 34 234 16 877 45 113
The actuarial assumptions underlying the calculations are as follows:
2005 2004 Norway UK Indonesia Norway UK IndonesiaDiscount rate % 5.5 4.9 12.0 5.5 5.3 12.0Return on scheme assets % 6.5 6.3 - 6.5 6.3 -Wage growth % 3.0 3.3 10.0 3.0 3.8 10.0Inflation (prices and NI multiplier) % 3.0 2.7 10.0 3.0 2.8 10.0Pension growth % 2.0 3.3 - 2.0 3.3 -
The actuary calculations for 2005 in the Norwegian companies are based on the same financial assumptions as for 2004. In the English com-panies the changes in the financial assumptions has led to an increase in the pension obligations of NOK 15.7 million. The calculations have been made based on actual pensionable income, pension and members as at 01.01.06.
NOTE 8 TANGIBLE FIXED ASSETS AND INTANGIBLE ASSETS
Jotun A/S Goodwill Technology Other Land Buildings Machinery, Plants Total intangible & plants vehicles & under con-(NOK thousand) assets equipment struction Cost, 1 Jan. 6 725 96 495 37 521 14 469 417 563 481 517 - 1 054 290Reclassifications - - -3 244 - - - - -3 244Additions - 450 21 283 - 2 433 17 569 27 775 69 510Disposals - - - - - -7 762 - -7 762Cost, 31 Dec. 6 725 96 945 55 560 14 469 419 996 491 324 27 775 1 112 794 Accumulated depreciation, 1 Jan. 448 84 448 3 244 - 251 686 317 593 - 657 419Reclassifications - - - - - - - -Year’s depreciation charges 1 431 4 776 4 839 - 11 079 40 823 - 62 948Disposals - - -3 244 - - -5 915 -1 -9 160Accumulated depreciation, 31 Dec. 1 879 89 224 4 839 - 262 765 352 501 -1 711 207Book value, 31 Dec. 4 846 7 721 50 721 14 469 157 231 138 823 27 776 401 587 Estimated useful life Up to 5 years Up to 5 years Up to 5 years - Up to 25 years Up to 10 years - Type of depreciation Straight line Straight line Straight line - Straight line Straight line -
N O T E SN O T E S
22 w w w . j o t u n . c o m 23w w w . j o t u n . c o m
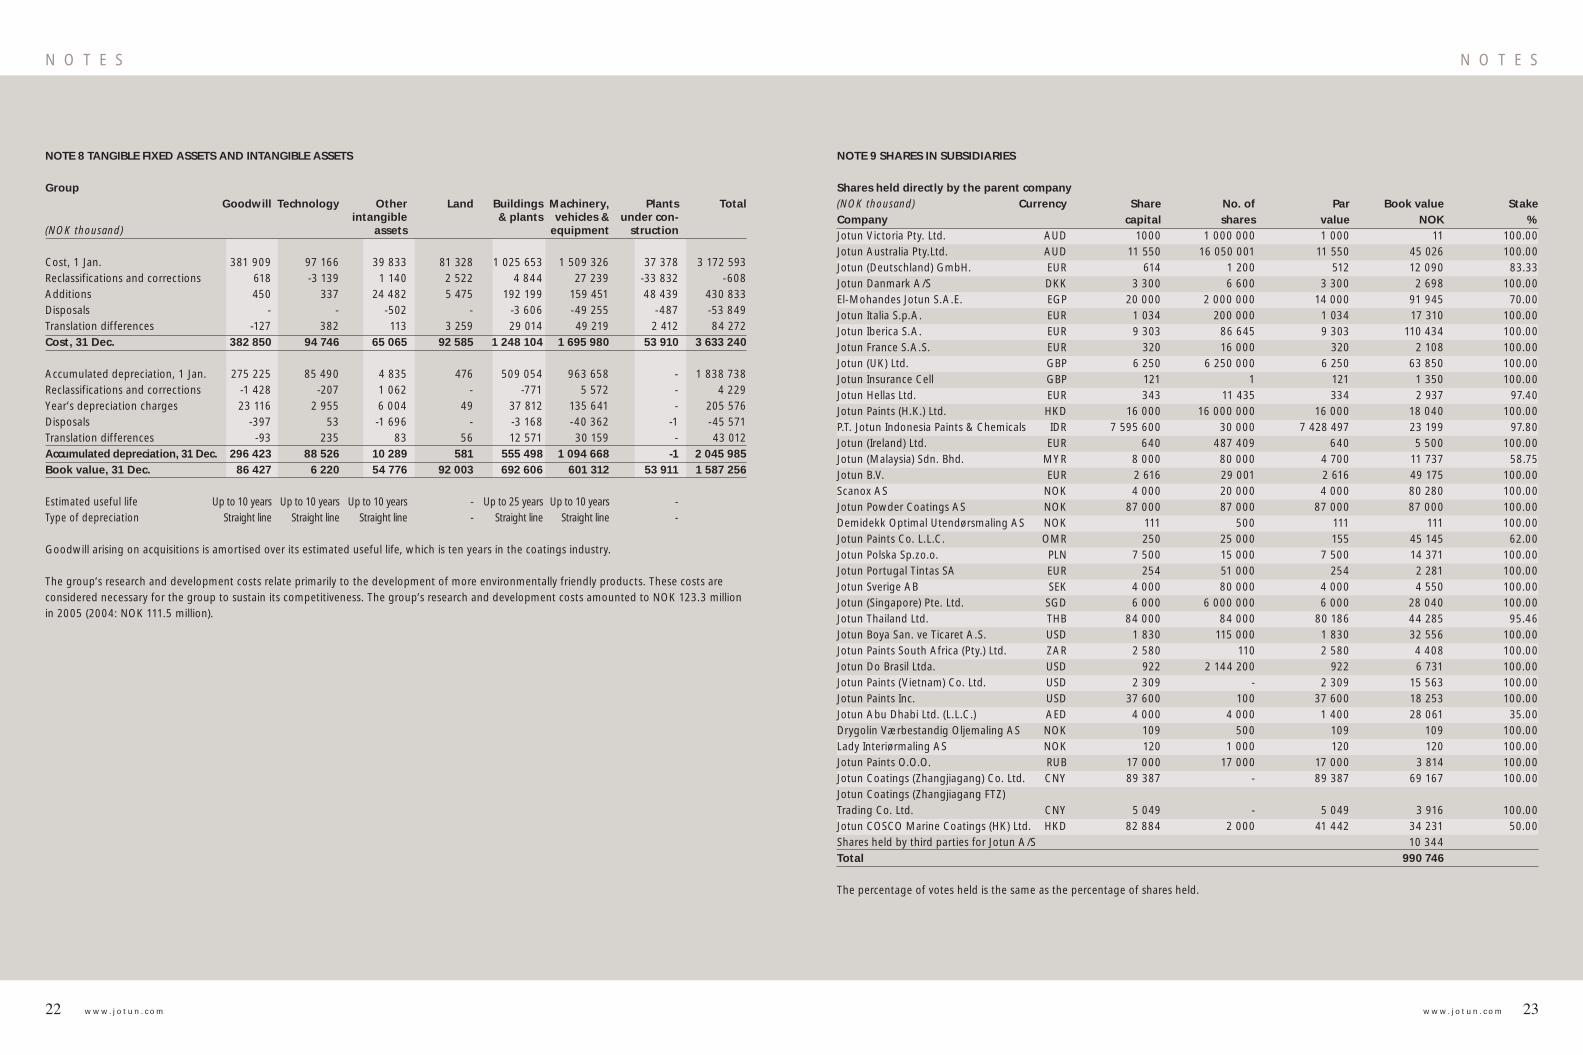
NOTE 8 TANGIBLE FIXED ASSETS AND INTANGIBLE ASSETS
Group Goodwill Technology Other Land Buildings Machinery, Plants Total intangible & plants vehicles & under con-(NOK thousand) assets equipment struction
Cost, 1 Jan. 381 909 97 166 39 833 81 328 1 025 653 1 509 326 37 378 3 172 593Reclassifications and corrections 618 -3 139 1 140 2 522 4 844 27 239 -33 832 -608Additions 450 337 24 482 5 475 192 199 159 451 48 439 430 833Disposals - - -502 - -3 606 -49 255 -487 -53 849Translation differences -127 382 113 3 259 29 014 49 219 2 412 84 272Cost, 31 Dec. 382 850 94 746 65 065 92 585 1 248 104 1 695 980 53 910 3 633 240 Accumulated depreciation, 1 Jan. 275 225 85 490 4 835 476 509 054 963 658 - 1 838 738Reclassifications and corrections -1 428 -207 1 062 - -771 5 572 - 4 229Year’s depreciation charges 23 116 2 955 6 004 49 37 812 135 641 - 205 576Disposals -397 53 -1 696 - -3 168 -40 362 -1 -45 571Translation differences -93 235 83 56 12 571 30 159 - 43 012Accumulated depreciation, 31 Dec. 296 423 88 526 10 289 581 555 498 1 094 668 -1 2 045 985Book value, 31 Dec. 86 427 6 220 54 776 92 003 692 606 601 312 53 911 1 587 256 Estimated useful life Up to 10 years Up to 10 years Up to 10 years - Up to 25 years Up to 10 years -Type of depreciation Straight line Straight line Straight line - Straight line Straight line -
Goodwill arising on acquisitions is amortised over its estimated useful life, which is ten years in the coatings industry.
The group’s research and development costs relate primarily to the development of more environmentally friendly products. These costs are considered necessary for the group to sustain its competitiveness. The group’s research and development costs amounted to NOK 123.3 million in 2005 (2004: NOK 111.5 million).
NOTE 9 SHARES IN SUBSIDIARIES
Shares held directly by the parent company (NOK thousand) Currency Share No. of Par Book value StakeCompany capital shares value NOK %Jotun Victoria Pty. Ltd. AUD 1000 1 000 000 1 000 11 100.00 Jotun Australia Pty.Ltd. AUD 11 550 16 050 001 11 550 45 026 100.00 Jotun (Deutschland) GmbH. EUR 614 1 200 512 12 090 83.33 Jotun Danmark A/S DKK 3 300 6 600 3 300 2 698 100.00 El-Mohandes Jotun S.A.E. EGP 20 000 2 000 000 14 000 91 945 70.00 Jotun Italia S.p.A. EUR 1 034 200 000 1 034 17 310 100.00 Jotun Iberica S.A. EUR 9 303 86 645 9 303 110 434 100.00 Jotun France S.A.S. EUR 320 16 000 320 2 108 100.00 Jotun (UK) Ltd. GBP 6 250 6 250 000 6 250 63 850 100.00 Jotun Insurance Cell GBP 121 1 121 1 350 100.00 Jotun Hellas Ltd. EUR 343 11 435 334 2 937 97.40 Jotun Paints (H.K.) Ltd. HKD 16 000 16 000 000 16 000 18 040 100.00 P.T. Jotun Indonesia Paints & Chemicals IDR 7 595 600 30 000 7 428 497 23 199 97.80 Jotun (Ireland) Ltd. EUR 640 487 409 640 5 500 100.00 Jotun (Malaysia) Sdn. Bhd. MYR 8 000 80 000 4 700 11 737 58.75 Jotun B.V. EUR 2 616 29 001 2 616 49 175 100.00 Scanox AS NOK 4 000 20 000 4 000 80 280 100.00 Jotun Powder Coatings AS NOK 87 000 87 000 87 000 87 000 100.00 Demidekk Optimal Utendørsmaling AS NOK 111 500 111 111 100.00 Jotun Paints Co. L.L.C. OMR 250 25 000 155 45 145 62.00 Jotun Polska Sp.zo.o. PLN 7 500 15 000 7 500 14 371 100.00 Jotun Portugal Tintas SA EUR 254 51 000 254 2 281 100.00 Jotun Sverige AB SEK 4 000 80 000 4 000 4 550 100.00 Jotun (Singapore) Pte. Ltd. SGD 6 000 6 000 000 6 000 28 040 100.00 Jotun Thailand Ltd. THB 84 000 84 000 80 186 44 285 95.46 Jotun Boya San. ve Ticaret A.S. USD 1 830 115 000 1 830 32 556 100.00 Jotun Paints South Africa (Pty.) Ltd. ZAR 2 580 110 2 580 4 408 100.00 Jotun Do Brasil Ltda. USD 922 2 144 200 922 6 731 100.00 Jotun Paints (Vietnam) Co. Ltd. USD 2 309 - 2 309 15 563 100.00 Jotun Paints Inc. USD 37 600 100 37 600 18 253 100.00 Jotun Abu Dhabi Ltd. (L.L.C.) AED 4 000 4 000 1 400 28 061 35.00 Drygolin Værbestandig Oljemaling AS NOK 109 500 109 109 100.00 Lady Interiørmaling AS NOK 120 1 000 120 120 100.00 Jotun Paints O.O.O. RUB 17 000 17 000 17 000 3 814 100.00 Jotun Coatings (Zhangjiagang) Co. Ltd. CNY 89 387 - 89 387 69 167 100.00 Jotun Coatings (Zhangjiagang FTZ) Trading Co. Ltd. CNY 5 049 - 5 049 3 916 100.00 Jotun COSCO Marine Coatings (HK) Ltd. HKD 82 884 2 000 41 442 34 231 50.00 Shares held by third parties for Jotun A/S 10 344 Total 990 746 The percentage of votes held is the same as the percentage of shares held.
N O T E SN O T E S

24 w w w . j o t u n . c o m 25w w w . j o t u n . c o m
CONTINUED NOTE 9 SHARES IN SUBSIDIARIES
Shares held directly by subsidiaries and joint ventures(NOK thousand) Currency Share No. of Par Book value Stake Company capital shares value NOK %Jotun Powder Coatings AS Jotun Powder Coatings (CZ) a.s. CZK 128 000 12 800 128 000 30 887 100.00 Jotun Powder Coatings Bulgaria Ltd. EUR 12 - 12 2 157 100.00 Jotun Powder Coatings Ltd. GBP 1 000 1 000 000 1 000 8 843 100.00 Jotun Powder Coatings LLC EGP 300 300 270 421 90.00 Jotun Powder Coatings (M) Sdn.Bhd. MYR 1 950 1 950 933 1 572 29 146 80.60 Jotun Powder Coatings (N) AS NOK 12 500 125 000 12 500 95 776 100.00 Jotun Powder Coatings (Thailand) Ltd. THB 9 000 9 000 9 000 65 000 100.00 Jotun Toz Boya San. ve. Ticaret A.S. TRL 23 600 23 600 000 23 600 75 831 100.00 Jotun Powder Coatings (Vietnam) Co. Ltd. VND 37 800 575 1 200 000 37 800 575 10 000 100.00 Jotun Powder Coatings Pakistan (Private) Ltd. PKR 60 000 6 000 000 24 000 2 934 40.00 PT Jotun Powder Coatings (Indonesia) IDR 9 669 543 45 000 9 669 543 7 404 100.00 Jotun Powder Coatings (India) Private Ltd. INR 18 600 1 860 000 18 600 2 698 100.00 Shares held by third parties for Jotun Powder Coatings AS 10 854 Total 341 951 Jotun Powder Coatings (N) AS Jotun Powder Coatings LLC EGP 300 300 30 64 10.00 Scanox AS Butinox Inne og Utemaling AS NOK 100 500 100 100 100.00 Jotun Powder Coatings U.A.E. Ltd. (L.L.C.) Jotun Powder Coatings Pakistan (Private) Ltd. PKR 60 000 6 000 24 000 2 777 40.00 Jotun B.V. Jotun (Deutschland) GmbH. EUR 614 1 200 102 2 516 16.67 Jotun Hellas Ltd. EUR 343 300 9 176 2.60 Jotun (UK) Ltd. Jotun Paints (Europe) Ltd. GBP 4 000 4 000 000 4 000 46 446 100.00 Jotun Paints Inc. PRS Delaware LLC USD 1 000 100 1 000 6 741 100.00 Jotun U.A.E. Ltd. (L.L.C.) Jotun Abu Dhabi Ltd. (L.L.C.) AED 4 000 4 000 1 600 2 937 40.00 Jotun COSCO Marine Coatings (HK) Ltd. Jotun COSCO Marine Coating (Guangzhou) Co. Ltd CNY 72 957 - 72 957 72 054 100.00 Total 475 762
The percentage of votes held is the same as the percentage of shares held.
The companies Jotun COSCO Marine Coatings (HK) Ltd. and Jotun COSCO Marine Coatings (Guangzhou) Ltd. are both controlled 50 per cent by the parent company. The companies are consolidated 100 per cent with deductions for minority interests. This is based on a total assessment of underlying agreements on the company’s operations and strategy, which means that Jotun A/S has actual control.
NOTE 10 SHARES IN JOINT VENTURES
Shares held directly by the parent company(NOK thousand) Currency Share No. of Par Book Stake Company capital shares value value NOK %Jotun U.A.E. Ltd. (L.L.C.) AED 4 000 2 000 1 660 108 930 41.50Nor-Maali OY EUR 8 10 000 3 8 180 33.40Chokwang Jotun Ltd. KRW 2 320 000 232 000 1 160 000 9 831 50.00Corro-Coat Saudi Arabia Co. Ltd. SAR 7 320 73 200 161 301 2.20Jotun Saudia Co. Ltd. SAR 9 000 9 000 3 600 17 278 40.00Red Sea Paints Co. Ltd. SAR 9 500 9 500 3 800 21 995 40.00Ratinjat Saudia Co. Ltd. SAR 13 000 13 000 5 200 13 248 40.00Jotun Yemen Paints Ltd. USD 1 000 20 000 90 675 9.00Shares held by Jotun A/S for third parties (301)Total 180 137 Shares held directly by subsidiaries and joint ventures
Currency Share No. of Par Book Stake Company capital shares value value NOK %Jotun Powder Coatings AS Jotun Powder Coatings U.A.E. Ltd. (L.L.C.) AED 3 000 3 000 1 410 66 067 47.00Corro-Coat Saudi Arabia Co. Ltd. SAR 7 320 73 200 2 035 20 000 27.80
Jotun Powder Coatings U.A.E. Ltd. (L.L.C.) Corro-Coat Saudi Arabia Co. Ltd. SAR 7 320 73 200 2 928 5 271 40.00
Jotun Saudia Co. Ltd Jotun Yemen Paints Ltd. USD 1 000 20 000 170 1 147 17.00
Jotun Paints Co. L.L.C. Jotun Yemen Paints Ltd. USD 1 000 20 000 170 1 156 17.00 Total 93 641
The percentage of votes held is the same as the percentage of shares held.
NOTE 11 SHARES AND OTHER SECURITIES
Shares held directly by the parent company(NOK thousand) Currency Share No. of Par Book Stake Company capital shares value value NOK %Cathelco Jotun Ltd., (UK) GBP 1 333 1 333 133 7 565 10.00 Other companies 877 Total 8 442
N O T E SN O T E S

26 w w w . j o t u n . c o m 27w w w . j o t u n . c o m
NOTE 12 LIABILITIES AND BONDS
Amounts falling due more than five years after the year-end: Jotun A/S Group
(NOK thousand) 31.12.05 31.12.04 31.12.05 31.12.04Secured loans 32 117 45 051 35 490 48 716Other long-term liabilities - - - 1 784Total 32 117 45 051 35 490 50 500
Loans from credit institutions - Jotun A/S Currency Average Amount Amount interest rate % in currency in NOKNOK 4.99 96 787 96 787 Repayment schedule
Year 2006 2007 2008 2009 2010 Later TotalAmount 12 934 12 934 12 934 12 934 12 934 32 117 96 787
Jotun has long-term drawing facilities that require a minimum equity/assets ratio and a maximum level of interest-bearing liabilities relative to EBITDA. Jotun was well within these limits at the year-end.
Loans from credit institutions – Group
Currency Average Amount Amount interest rate % in currency in NOKNOK 4.99 96 787 96 787Other currencies - - 47 299Total - - 144 086 Repayment schedule
Year 2006 2007 2008 2009 2010 Later TotalAmount 27 927 29 001 23 277 15 228 13 164 35 490 144 086
NOTE 13 OTHER CURRENT LIABILITIES
Provisions for liabilities included in other current liabilities Jotun A/S Group
(NOK thousand) 31.12.05 31.12.04 31.12.05 31.12.04Provisions for warranty claims 46 570 54 555 108 242 116 229Other provisions 25 751 14 200 75 363 61 478Other current liabilities 95 917 53 359 247 094 174 632Total 168 238 122 114 430 700 352 339
NOTE 14 TAX Jotun A/S Group (NOK thousand) 2005 2004 2005 2004Tax payable on year’s earnings Profit on ordinary activities before taxation 451 444 371 882 - -Permanent timing differences -79 253 -165 895 - -Change in temporary timing differences 20 877 17 510 - -Taxable income 393 068 223 497 - -Tax payable on year’s earnings (28%) 110 059 62 579 - - Breakdown of tax charge for the year Tax payable on year’s earnings 110 059 62 579 178 519 159 181Tax credits other than tax deducted at source -1 485 12 581 - -Gross change in deferred tax -7 396 -3 905 -28 334 -16 693Translation differences - - -563 -1 781Prior-year adjustments 1 257 1 253 1 257 1 253Tax charge for the year 102 435 72 508 150 879 141 960Tax payable in Norway 73 046 48 679 73 046 52 269Tax payable outside Norway 29 389 23 829 77 833 89 691 Breakdown of tax payable in the balance sheet 31.12.05 31.12.04 31.12.05 31.12.04Tax payable on year’s earnings 110 059 62 579 178 519 159 181Prepaid tax - - -47 736 -71 801Less tax deducted at source -31 419 -9 995 -31 419 -12 964Total 78 640 52 584 99 364 74 416 Breakdown of basis for deferred tax Fixed assets -6 342 62 118 69 511 160 908Current assets -13 981 14 535 -84 706 -50 219Liabilities -74 984 -145 546 -171 371 -180 461Tax loss carryforwards - - -42 811 -34 442Total -95 307 -68 893 -229 377 -104 214 Deferred tax liabilities (assets) -26 686 -19 290 -68 603 -40 269
N O T E SN O T E S
28 w w w . j o t u n . c o m 29w w w . j o t u n . c o m
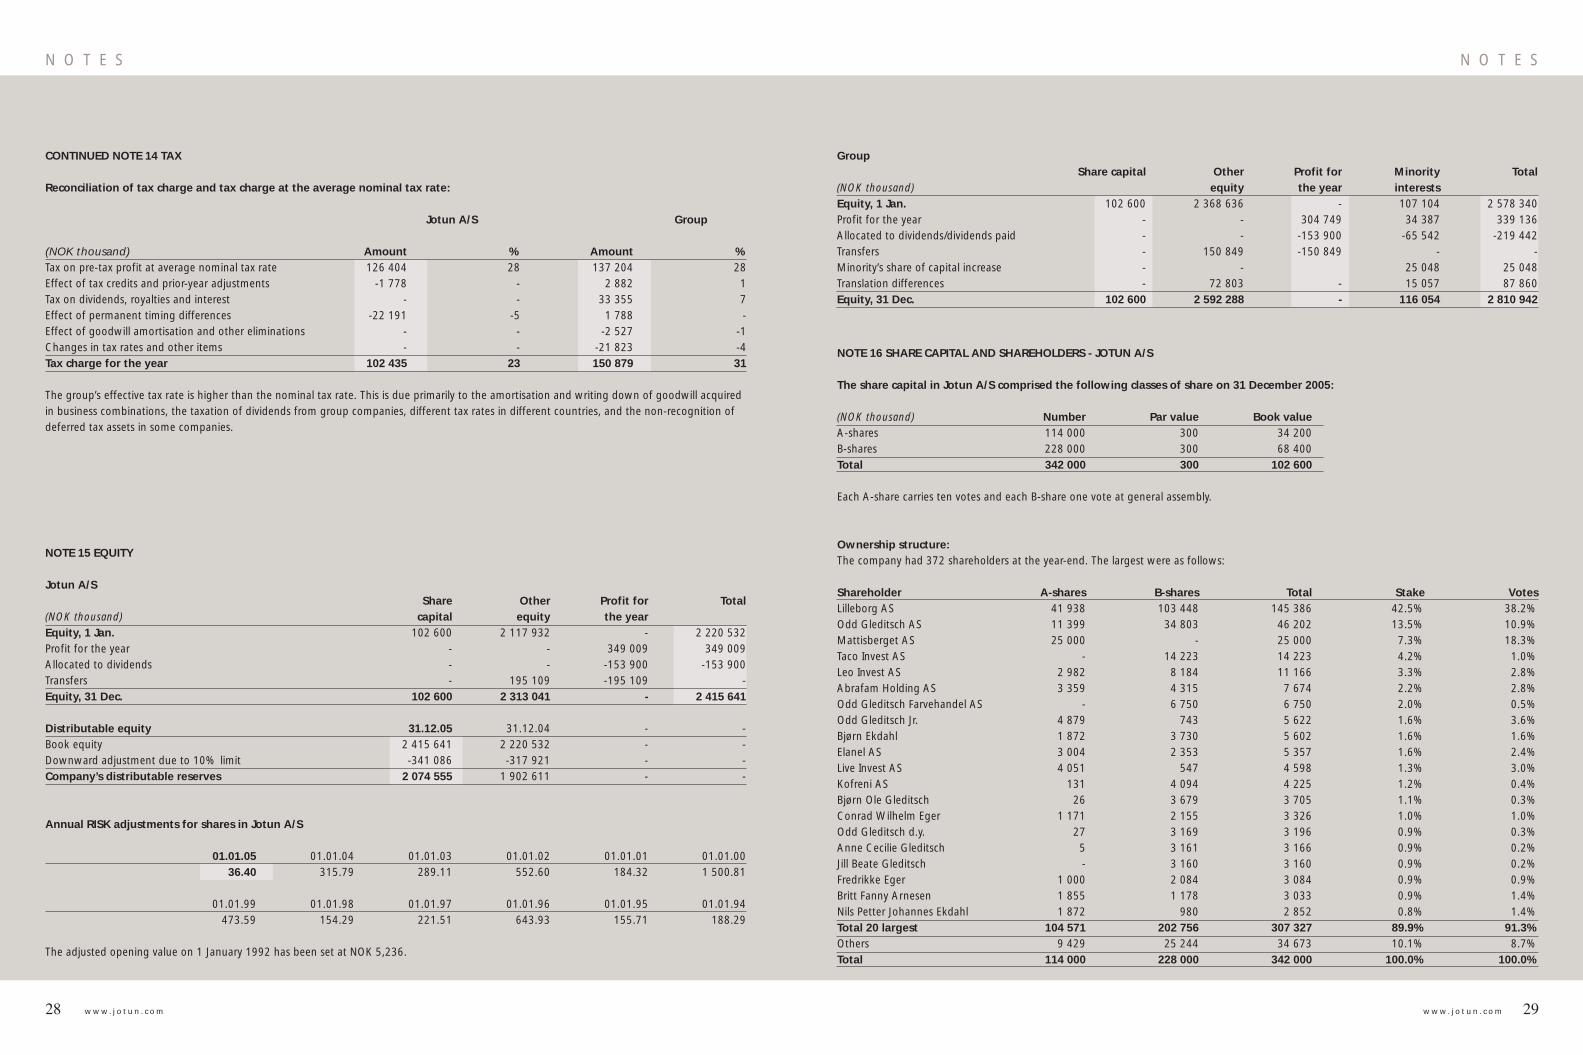
CONTINUED NOTE 14 TAX
Reconciliation of tax charge and tax charge at the average nominal tax rate: Jotun A/S Group (NOK thousand) Amount % Amount %Tax on pre-tax profit at average nominal tax rate 126 404 28 137 204 28Effect of tax credits and prior-year adjustments -1 778 - 2 882 1Tax on dividends, royalties and interest - - 33 355 7Effect of permanent timing differences -22 191 -5 1 788 -Effect of goodwill amortisation and other eliminations - - -2 527 -1Changes in tax rates and other items - - -21 823 -4Tax charge for the year 102 435 23 150 879 31
The group’s effective tax rate is higher than the nominal tax rate. This is due primarily to the amortisation and writing down of goodwill acquired in business combinations, the taxation of dividends from group companies, different tax rates in different countries, and the non-recognition of deferred tax assets in some companies.
NOTE 15 EQUITY
Jotun A/S Share Other Profit for Total(NOK thousand) capital equity the yearEquity, 1 Jan. 102 600 2 117 932 - 2 220 532Profit for the year - - 349 009 349 009Allocated to dividends - - -153 900 -153 900Transfers - 195 109 -195 109 -Equity, 31 Dec. 102 600 2 313 041 - 2 415 641 Distributable equity 31.12.05 31.12.04 - -Book equity 2 415 641 2 220 532 - -Downward adjustment due to 10% limit -341 086 -317 921 - -Company’s distributable reserves 2 074 555 1 902 611 - -
Annual RISK adjustments for shares in Jotun A/S 01.01.05 01.01.04 01.01.03 01.01.02 01.01.01 01.01.00 36.40 315.79 289.11 552.60 184.32 1 500.81
01.01.99 01.01.98 01.01.97 01.01.96 01.01.95 01.01.94 473.59 154.29 221.51 643.93 155.71 188.29
The adjusted opening value on 1 January 1992 has been set at NOK 5,236.
Group Share capital Other Profit for Minority Total(NOK thousand) equity the year interests Equity, 1 Jan. 102 600 2 368 636 - 107 104 2 578 340 Profit for the year - - 304 749 34 387 339 136Allocated to dividends/dividends paid - - -153 900 -65 542 -219 442Transfers - 150 849 -150 849 - -Minority’s share of capital increase - - 25 048 25 048Translation differences - 72 803 - 15 057 87 860 Equity, 31 Dec. 102 600 2 592 288 - 116 054 2 810 942
NOTE 16 SHARE CAPITAL AND SHAREHOLDERS - JOTUN A/S The share capital in Jotun A/S comprised the following classes of share on 31 December 2005: (NOK thousand) Number Par value Book value A-shares 114 000 300 34 200 B-shares 228 000 300 68 400 Total 342 000 300 102 600 Each A-share carries ten votes and each B-share one vote at general assembly.
Ownership structure: The company had 372 shareholders at the year-end. The largest were as follows: Shareholder A-shares B-shares Total Stake VotesLilleborg AS 41 938 103 448 145 386 42.5% 38.2%Odd Gleditsch AS 11 399 34 803 46 202 13.5% 10.9%Mattisberget AS 25 000 - 25 000 7.3% 18.3%Taco Invest AS - 14 223 14 223 4.2% 1.0%Leo Invest AS 2 982 8 184 11 166 3.3% 2.8%Abrafam Holding AS 3 359 4 315 7 674 2.2% 2.8%Odd Gleditsch Farvehandel AS - 6 750 6 750 2.0% 0.5%Odd Gleditsch Jr. 4 879 743 5 622 1.6% 3.6%Bjørn Ekdahl 1 872 3 730 5 602 1.6% 1.6%Elanel AS 3 004 2 353 5 357 1.6% 2.4%Live Invest AS 4 051 547 4 598 1.3% 3.0%Kofreni AS 131 4 094 4 225 1.2% 0.4%Bjørn Ole Gleditsch 26 3 679 3 705 1.1% 0.3%Conrad Wilhelm Eger 1 171 2 155 3 326 1.0% 1.0%Odd Gleditsch d.y. 27 3 169 3 196 0.9% 0.3%Anne Cecilie Gleditsch 5 3 161 3 166 0.9% 0.2%Jill Beate Gleditsch - 3 160 3 160 0.9% 0.2%Fredrikke Eger 1 000 2 084 3 084 0.9% 0.9%Britt Fanny Arnesen 1 855 1 178 3 033 0.9% 1.4%Nils Petter Johannes Ekdahl 1 872 980 2 852 0.8% 1.4%Total 20 largest 104 571 202 756 307 327 89.9% 91.3%Others 9 429 25 244 34 673 10.1% 8.7%Total 114 000 228 000 342 000 100.0% 100.0%
N O T E SN O T E S

30 w w w . j o t u n . c o m 31w w w . j o t u n . c o m
CONTINUED NOTE 16 SHARE CAPITAL AND SHAREHOLDERS - JOTUN A/S
Shares held by members of the Board, Corporate Assembly and the President & CEO:
Name Position A-shares B-shares Total Odd Gleditsch d.y. Chairman of the Board 27 3 229 3 256Einar Abrahamsen Board member 3 359 4 315 7 674Richard Arnesen Board member 1 862 3 671 5 533Nicolai A. Eger Board member 1 210 5 454 6 665Olav Christensen Chairman Corp. Assembly 3 004 2 353 5 357Bjørn Ole Gleditsch Corp. Ass. member 26 10 429 10 455Thomas Gleditsch Corp. Ass. member 27 2 194 2 221Fredrikke Eger Corp. Ass. member 1 144 2 361 3 505Erling Fr. Sørhaug Corp. Ass. member - 1 1Birger Amundsen Corp. Ass. member - 2 2Morten Fon President & CEO 3 - 3
No options to purchase shares have been issued.
NOTE 17 SECURED ASSETS AND GUARANTEES Jotun A/S Group(NOK thousand) 31.12.05 31.12.04 31.12.05 31.12.04 Secured balance sheet liabilities Amounts owed to credit institutions – long-term 96 787 109 721 130 768 125 010Amounts owed to credit institutions – short-term - - 27 956 6 078Total 96 787 109 721 158 725 131 088 Book value of assets put up as security for secured debt Land, buildings etc. 64 136 67 591 73 787 76 156Machinery and plant 67 346 87 470 116 161 92 440Stocks - - 1 096 31 230Trade debtors - - 3 651 630Total 131 482 155 061 194 695 200 456 Off balance sheet guarantees Guarantees for employees - - 7 283 8 074Guarantees for withholding tax 24 000 22 033 29 489 27 486Guarantees for subsidiaries 170 497 137 279 173 202 411 580Guarantees from subsidiaries - - - 1 000 000Guarantees for customers etc. and Jotun A/S 400 400 18 885 14 377Total 194 897 159 712 228 860 1 461 517 Jotun A/S has entered into a new agreement on credit facilities with its banks totalling NOK 1.2 billion. Previously submitted parent company guarantees from subsidiaries have now been removed.
Jotun A/S is the senior company for the purposes of the group’s shared bank account system and is responsible for the group’s net exposure to the bank in question. The overdraft limit on this bank account system is NOK 75 million.
NOTE 18 INTER-COMPANY BALANCES IN JOTUN A/S TOWARDS OTHER GROUP COMPANIES
Subsidiaries Joint ventures (NOK thousand) 31.12.05 31.12.04 31.12.05 31.12.04 Financial fixed assets Amounts due < 1 year - 59 853 - - Amounts due > 1 year 794 587 538 674 2 076 -Total 794 587 598 527 2 076 -
DebtorsTrade debtors 120 060 124 718 9 760 12 383 Amounts owed by subsidiaries 68 800 8 600 - - Other current debtors 162 859 87 306 - 20 542 Total 1 146 305 819 151 11 836 32 925
Subsidiaries Joint ventures (NOK thousand) 31.12.05 31.12.04 31.12.05 31.12.04Current liabilities Short-term loans to subsidiaries 124 900 126 500 - - Trade creditors 36 963 82 526 7 918 5 832Other current liabilities 14 950 10 654 61 798 40 113 Total 176 813 219 680 69 716 45 945
NOTE 19 BREAKDOWN OF ITEMS IN THE CASH FLOW STATEMENT
Jotun A/S Group(NOK thousand) 31.12.05 31.12.04 31.12.05 31.12.04Change in stocks, trade debtors and trade creditors Stocks -46 732 -88 620 -124 182 -201 947 Trade debtors -2 914 -7 798 -275 333 -59 143 Trade creditors -35 834 97 105 70 736 113 265 Total -85 480 687 -328 779 -147 826
Jotun A/S Group(NOK thousand) 31.12.05 31.12.04 31.12.05 31.12.04 Change in other accrual items Other current debtors -53 828 -21 733 -56 189 523 Tax payable 26 055 36 240 24 948 22 886 Public duties payable 3 234 1 669 1 556 4 233 Other current liabilities 54 112 8 460 86 345 82 369 Other provisions for liabilities -7 153 5 315 -10 068 -8 898Total 22 420 29 951 46 592 101 113
N O T E SN O T E S

32 w w w . j o t u n . c o m 33w w w . j o t u n . c o m
NOTE 20 CONTINGENT LIABILITIES AND OTHER OFF BALANCE SHEET LIABILITIES
Jotun is involved in a number of disputes and complaints in connection with its activities, including those discussed below. Provisions have been made for the anticipated outcome of disputes where a negative outcome is more likely and reliable estimates can be made. Anticipated insurance cover is taken into account when assessing the size of these provisions. Jotun acknowledges that the outcome of these disputes is associated with uncertainty but is of the opinion
Jotun A/S 31.12.05 31.12.04Unused part of short and long-termcommitted credit facilities 1 275 000 1 050 000
The requirement for liquidity reserves for the group rests with the parent company, which can finance, wholly or partly, subsidiaries and associated companies through internal loans. At year-end, Jotun A/S had credit facilities totalling NOK 1.2 billion. NOK 600 million of these
NOTE 21 OVERDRAFTS AND OTHER CREDIT FACILITIES
that these cases will be resolved without impacting significantly on the group’s financial position. A number of court and arbitration cases are under way in connection with operations in the USA. Customers are claiming compensation from Jotun Paints Inc. for alleged product defects and defective technology purchased from The Valspar Corporation. The cases are expected to be resolved in 2007 and 2008.
facilities fall due in 2012, while NOK 600 million is due in 2010. The latter NOK 600 million can be extended to 2012 if this is acceptable to the credit providers (extension option). No credit had been used in these facilities as at 31 December 2005. The credit facilities above include an unused, committed line to Jotun A/S of NOK 75 million in the company’s group account system. The remainder of the credit facilities in the group are mainly short-term non-committed credit that is not included in the liquidity reserve.
Jotun has the following established policy for hedging currency and interest rate exposure Currency exposure in the group balance sheet shall be hedged by 30–100 per cent where exposure is greater than NOK 25 million per currency (or currency group). Currency exposure on the parent company’s net cash flows from operations, in a future 12-month perspective, shall be hedged 30–100 per cent where exposure is greater than NOK 15 million per currency (or currency group). In the event that the aforementioned two currency exposures (balance exposure and cash flow exposure) in relation to a currency go against each other, only the net exposure exceeding NOK 15 million shall be hedged. The interest rate exposure in the group balance sheet shall be hedged 30–80 per cent in the event that the total exposure exceeds NOK 25 million per currency. All transactions are carried out based on the aforementioned guidelines and with the aim of reducing the total currency and interest rate exposure. Financial instruments are used to an extensive degree in order to reduce such risk, and this is further explained below.
Managing and controlling currency riskCurrency exposure in the group balance sheet is hedged via currency loans, currency swaps and currency options. The greatest net assets in addition to NOK are in the currencies USD, EUR and THB, as well as the USD-related currencies AED and SAR. This exposure mainly consists of the parent company’s net investments in international
NOTE 22 FINANCIAL INSTRUMENTS AND RISK MANAGEMENT
operations. Currency gains and losses on hedging transactions related to the group balance sheet are recorded directly against the equity as a contra entry to translation differences for the part that qualifies for hedging accounting. No part of this hedging accounting is reflected in the company accounts of Jotun AS. The basis for hedging accounting is assessed separately where the hedging level per currency – or valuta group is changed substantially during the year. Gains and losses on hedging transactions that do not qualify as hedging accounting, are entered in the profit and loss account under financial income and costs. Jotun’s net cash flows from operations are mainly generated in the individual group companies and the responsibility for hedging any currency exposures lies at a local level. Included in cash flows from operations of the parent company (and the subsidiaries that are included in the parent company’s group account’s system) is the dividends and licence revenues from other external companies. In order to protect the parent company from fluctuations in currency exchange rates, forward contracts are used for the most part, as well as currency swaps and options. Currency gains and losses are entered in the profit and loss acount under financial income and costs. Outstanding contracts are assessed at actual value, and non-realised currency gains and losses are entered in the profit and loss account since the hedgings are regarded as not qualifying for hedging accounting. The interest rate element in the forward rate is recorded in the profit and loss account as a financial item.
As at 31 December 2005, Jotun A/S had entered into the following forward contracts:
Currency Currency Duebought sold
NOK 429 011 USD 65 000 2006
NOK 96 034 GBP 8 350 2006
NOK 53 524 EUR 6 800 2006
NOK 33 105 SGD 8 500 2006
NOK 19 518 DKK 18 500 2006
NOK 8 528 SEK 10 000 2006
USD 7 624 AED 28 000 2006
USD 4 122 THB 170 000 2006
USD 3 994 SAR 15 000 2006
USD 3 475 KRW 3 600 000 2006
As at 31 December 2005, Jotun A/S had entered into the following option contracts:
Portfolio Type Strike Knock in Currency Due (weighted av.) (weighted av.) sold
NOK bought 1) 6.4724 7.0442 USD 21000 2006
GBP bought 2) 1.8220 1.6950 USD 3 644 2006
NOK bought 3) 0.8440 0.8800 SEK 15 000 2006
Management and control of interest rate risk
Jotun’s net interest-bearing debt is limited. The group’s interest rate risk therefore mainly arises as a result of the interest rate risk linked to currency hedging in the group balance sheet. The currency hedging has short maturity periods and is exposed to fluctuations in the interest rate difference between the floating rate of the sold currency and the currency bought. The group’s interest rate hedging is handled centrally based on measurements of interest rate exposure per
currency. Various types of derivatives such as collar, flexi-cap, dual cap, pure interest rate swaps, combined interest rate and currency swaps, as well as fixed interest rate loans are used to secure the interest rate risk. Accounting takes place according to the lowest value principle and is entered in the profit and loss account under financial income and costs, since the interest rate hedging does not generally qualify for hedging accounting.
Portfolio of outstanding currency and interest rate swapsCurrency bought Jotun receives Currency sold Jotun pays DueUSD 4 478 LIBOR 3 month THB 300 000 fixed THB 6.63% 2006
Portfolio of outstanding interest rate swapsAmount Jotun pays (weighted av.) Jotun receives DueNOK 63 520 5.97% NIBOR 3 month 2006
Portfolio of outstanding interest rate option agreementsAmount Jotun pays (weighted av.) Jotun receives DueEUR 5 000 5.2% EURIBOR 3 month 2007GBP 5 000 5.5% 1) LIBOR 3 month 2007USD 10 000 4.03% LIBOR 3 month 2007
1) Where the floating market rate on the interest due date is higher than 5.5 per cent, Jotun pays LIBOR 3 month -0.20 per cent.
1) If the spot rate on the due date is equal to or higher than knock-in, Jotun is obliged to sell up to double the USD volume at a rate that is equal to or higher than the strike rate. If the spot rate on the due date is lower than knock-in, whereby knock-in has not occurred, there is no obligation to sell.
2) If the spot rate on the due date is equal to or lower than knock-in, Jotun is obliged
to buy double the GBP volume at a rate equal to the strike rate. If the spot rate on the due date is higher than knock-in, whereby knock-in has not occurred, there is no obligation to buy.
3) If the spot rate on the due date is equal to or higher than knock-in, Jotun is obliged to sell double the SEK volume at a rate equal to 0.8400. If the spot rate on the due date is lower than knock-in, whereby knock-in has not occurred, there is no obligation to sell.
N O T E SN O T E S

34 w w w . j o t u n . c o m 35w w w . j o t u n . c o m
J O T U N W O R L D W I D EA U D I T O R ’ S R E P O R T
L = Legal A = Agent / branch / distributor / licensee
AFRICALibya AMauritius AMorocco ANamibia ASouth Africa L A
AMERICASArgentina A ABrazil LChile ACuracao APanama APeru ATrinidad AUruguay AUSA L A
ASIAAzerbaijan AChina LIndia A LIndonesia L LJapan AMalaysia L LPakistan LPhilippines A A
Singapore LSouth Korea LThailand L LVietnam L L
AUSTRALIAAustralia L L
EUROPEBulgaria A LCroatia ACyprus ACzech Republic A LDenmark L L AEstonia AFinland L AFrance LGermany LGreece L AHungary A AIceland A AIreland LItaly LLatvia ALithuania AMalta AMonaco A
Montenegro ANetherlands LNorway L L LPoland L APortugal ARomania ARussia L ASlovak Republic ASpain LSweden L L ASwitzerland A Turkey L LUkraine AU.K. L L
MIDDLE EASTBahrain AEgypt L AIran AJordan AKuwait A AOman LQatar ASaudi Arabia L LSyria AUAE L LYemen L
JOTUN COATINGS / JOTUN PAINTS JOTUN DEKORATIV JOTUN POWDER COATINGS
Production units
Text
, gra
phic
des
ign
and
prod
ucti
on: M
etro
Mer
keva
rehu
set
Text
, gra
phic
des
ign
and
prod
ucti
on: M
etro
Mer
keva
rehu
set
AS
AS
Prin
t: L
OS
Gra
fisk
AS
Phot
o: ©
Dig
ital
Vis
ion,
Met
ro M
erke
vare
huse
t
Prin
t: L
OS
Gra
fisk
AS
Phot
o: ©
Dig
ital
Vis
ion,
Met
ro M
erke
vare
huse
t A
SA
S, J
otun
A/S
Tr
ansl
atio
n: L
ionb
ridg
e, J
otun
A/S
Tr
ansl
atio
n: L
ionb
ridg
e
JOTUN A/SP.O.Box 2021 • N-3248 Sandefjord, NorwayTel. +47 33 45 70 00 • Fax +47 33 45 72 42
www.jotun.com