annual report - crane hire, travel towers, ewps, crane
TRANSCRIPT

2020Annual Report

CON
TEN
TS
01 About Boom
01 2020 Highlights
02 Chairman’s Report
04 Business Overview
06 Managing Director’s Report
14 Operating and Financial Review
20 Our Health, Safety, Environment & Quality
22 Our People & Systems
24 Board of Directors and Key Management Team
27 Directors’ Report
Annual General MeetingBoom Logistics will hold its 2020 Annual General Meeting at 11.00am on Friday, 27 November 2020.
boomlogistics.com.au
42 Auditor’s Independence Declaration
43 Consolidated Statement of Comprehensive Income
44 Consolidated Statement of Financial Position
45 Consolidated Statement of Cash Flows
46 Consolidated Statement of Changes in Equity
47 Notes to the Consolidated Financial Statements
79 Directors’ Declaration
80 Independent Audit Report
84 ASX Additional Information
87 Company Directory
ABN 28 095 466 961

AB
OU
T B
OO
M20
20
HIG
HLI
GH
TS
At BOOM, we deliver safe lifting solutions, with scale and precision, every time. Managing risk and complexity with confidence – that’s the promise we make to our customers.
20182016 20192017 2020
183.1
152.3
182.7
150.1
185.5
20182016 20192017 2020
21.1
11.2
20.1
10.6
13.3
2018 20182016 20162019 20192017 20172020 2020
11.537.3
8.3
49.2
13.236.6
6.3
45.1
16.4
19.6
Revenue $m Trading EBITDA* $m
Operating Cash Flow* $m Net Debt* $m
* non-IFRS financial measure, presented on a pre AASB16 like-for-like basis
Boom Logistics Annual Report 2020 1

The company generated solid free cash flows in FY20, increasing to $18.8 million compared to $8.8 million in FY19 (on a like for like, pre-AASB16 basis).
OPE
RAT
ING
AN
D F
INA
NCI
AL
REV
IEW
CHA
IRM
AN
’S R
EPO
RT
The company had a disappointing net loss after tax of $17.0 million for the year ended 30 June 2020 (FY20). The main reasons for the negative result were fourfold:
● COVID-19 related delays to projects and shutdown maintenance,
● One-off, $4.45 million franking deficit tax expense and the decision to defer a tax payment until FY21/22,
● $1.9 million impairment ahead of the planned sale of smaller underutilised travel tower assets, and
● $7.5 million loss on a Tasmanian wind farm project due to delays, adverse weather and reduced scope of work and provision for amounts unresolved. We are actively pursuing unresolved claims for costs. Strengthened risk management procedures and contract review processes have been implemented.
In response to the economic slowdown, the company has sought to improve management of risk, reduce debt, strengthen cash flows
Boom Logistics Annual Report 20202

250cranes in all sizes, from 5 tonne up to 750 tonne
and position the business to further diversify revenue streams in the coming years.
The loss-making Cattle Hill project was completed in March 2020. In light of this, we revised internal controls for operational management, contract risk and pricing decisions to help preserve margin and manage cost on future projects.
During the period, the company purchased 11.4 million shares via the on-market share buy-back, spending $1.7 million in FY20. Leading on from the COVID-19 crisis, Boom decided to protect its cash reserves. It deferred the interim dividend until 2 October 2020 and the board and a number of executives reduced their remuneration for the fourth quarter of FY20. We continue to monitor the impact of the pandemic.
The company has negotiated an interest free 24 month payment plan with the Australian Taxation Office to progressively repay a one-off $4.45 million tax expense over the forthcoming period.
The company generated solid free cash flows in FY20, increasing to $18.8 million compared to $8.8 million in FY19 (on a like for like, pre-AASB16 basis). This has enabled the company to reduce net debt to $19.6 million from $36.6 million. At 30 June 2020, net tangible assets per share were 27 cents, substantially above the company’s current stock exchange valuation.
We are leveraging our presence on major mining sites in central Queensland to secure work from major mine operators, mining equipment and other subcontractors on site and boost revenue in the state.
Our wind farm pipeline of construction and maintenance opportunities is supported by successful projects, such as the recent Coopers Gap wind farm and our learnings from Cattle Hill.
In Western Australia we have had a significantly improved performance following the appointment of an experienced general manager to lead a new sales team and re-open a depot in Western Australia’s north-west to expand our revenues and opportunities in the state.
Travel towers are benefiting from a more streamlined structure with management clear on its direction and accountability. We have shut depots, are continuing to
sell smaller, older, less utilised travel towers and have focus on key markets. The division is now leaner with lower overheads and since the restructure has improved performance and is well positioned to grow and improve profitability while supporting its core customers in the buoyant telecommunications and power sectors.
COVID-19 has delayed some projects, particularly in civil engineering and wind farm construction. Our readi business – the source of shut-down labour for Boom – has been most affected with social distancing requirements reducing the number of personnel allowed on sites. The federal government’s response to the economic consequences of the pandemic have reduced the impact on our operations. Access to JobKeeper support payments has helped us stay connected to our readi workforce. We expect this business to make a significant turnaround once the effects of the pandemic subside.
Across each division of the business, we have laid the foundations for Boom’s future growth underpinned by low corporate debt and strong cash flows. Our strategy to diversify operations and revenue streams, with a greater focus on maintenance work, will improve the company’s profitability over the coming years.
Finally, I thank my fellow directors for their guidance during a difficult year. I would also like to acknowledge the efforts of our team who continue to deliver a high level of service, despite the challenges the pandemic has brought to us.
We look forward to Boom capitalising on its considerable expertise and strong reputation in the markets we serve to improving returns to shareholders.
Maxwell J Findlay Chairman
27 August 2020
Boom Logistics Annual Report 2020 3

BU
SIN
ESS
OV
ERV
IEW Key Operations
● Mining maintenance services
● Engineered specialised lifts
● Shutdown, industrial and programmed maintenance services
● Major clients are in the mining sector
Key Operations ● Wind farm construction projects
● Bridge installations, rail and infrastructure construction
● Wind farm maintenance programs
Key Operations ● Major power grid interconnector
infrastructure project works
● Telecommunications – 5G installations and roll-out
● Wind farm transmission ‘string-line’ works to sub-stations
● High voltage transmission line maintenance
Key Operations ● Mining shutdown and
maintenance labour
● Oil and Gas maintenance service contracts
● Construction, heavy industry labour and specialised skills in wind farm sector
Cran
e se
rvic
esP
roje
cts
Trav
el t
ower
sre
adi
Boom Logistics Annual Report 20204

Achievements● Revenue of $94.4 million in FY20
● Central Queensland revenue increased 8% on additional work from BMA, Coronado, Glencore and Anglo American mines
● Renewed the Glencore contract, which includes Bulga in the New South Wales’ Hunter Valley and Hail Creek in Queensland
● New maintenance contract won in Western Australia
Achievements● Growth in wind farm, bridge
installation, infrastructure and construction projects
● Revenue up 8%, contributing $38.0 million
● Queensland’s Coopers Gap wind farm progressed with additional work through to May 2020, generating an additional $6 million of revenue
Achievements● Margins increased following a
restructure in FY19 to focus on larger travel tower assets
● Revenue was 8% higher to $26.8 million
● The restructure of the business delivered cost savings and improved performance in FY20
Achievements● Revenue from Boom and readi
contracts was $26.3 million
● Recruited a new general manager to drive growth
● readi’s customers include Fulton Hogan, UGL and Esso
OutlookIn FY21 we are re-establishing in the Moranbah region, where we are already seeing interest from miners. We are also expanding our service offering to our major customer at Olympic Dam in South Australia, where another major shutdown is planned.
We now expect operations in our new Port Hedland depot in north west Western Australia to start in the first quarter of FY21.
OutlookProjects cranes are targeting large civil infrastructure work around the capital cities, such as rail works and level crossing removals in Melbourne, as well as large bridge and tunnel boring projects.
The larger cranes are increasingly used on national wind farm maintenance work, a high growth area. Work has commenced on a wind farm in Victoria on an equipment hire and labour rate model for the first half.
A contract for work on the Parramatta light rail infrastructure project is expected to commence in the first quarter. The recently signed contract to support work on the Snowy 2.0 project will also boost revenues.
OutlookSolid business volumes in the telecommunications market are forecast. There is also potential for more high voltage line stringing and interconnector work over the next five years, largely due to the increase in renewable energy projects and upgrades to the electricity grid.
New high voltage transmission line works in the Pilbara region of WA commenced in August 2020.
Outlookreadi is making progress with external customer opportunities in the mining, construction and infrastructure sectors.
While COVID-19 was a challenge in the second half of FY20, we believe this business will strengthen after the pandemic. readi has stayed connected with its workforce and this will allow the business to ramp up services when the crisis subsides.
2018 2019 2020
116.2
95.6 94.4
2018 2019 2020
22.6
35.138.0
2018 2019 2020
20.1
24.926.8
2018 2019 2020
24.1
27.1 26.3
Revenue $m
Revenue $m
Revenue $m
Revenue $m
Boom Logistics Annual Report 2020 5

FY20 was a challenging year for Boom Logistics, with COVID-19 affecting several parts of our business and one-off wind farm project costs impacting trading earnings before interest, tax, depreciation and amoritisation (EBITDA) of $13.3 million1, down from $20.1 million in the previous year. Revenue increased to $185.5 million, up 1.5% from $182.7 million, reflecting the group’s strategy to broaden its revenue base.
We progressed on a number of strategic goals as we continue to diversify and target new recurring revenue streams and position the company to grow profitably in the future.
At the heart of everything we do is the safety of our customers and employees throughout our operations. We undertook a safety “reset” last year to reinforce the safety priority and behaviours, which will drive the company towards our zero-harm goal.
Our Total Recordable Injury Frequency Rate decreased to 8.0 from 8.6 the previous year.
We progressed on a number of strategic goals as we continue to diversify and target new recurring revenue streams and position the company to grow profitably in the future.
OPE
RAT
ING
AN
D F
INA
NCI
AL
REV
IEW
MA
NA
GIN
G D
IREC
TOR
’S R
EPO
RT
1 Trading EBITDA is a non-IFRS financial measure, presented on a pre-AASB16 like-for-like basis.
Boom Logistics Annual Report 20206

We undertook a safety re-set to increase the focus on safety interactions. The number of safety observations improved by 65% year-on-year. Further details of our HSEQ procedures, which are embedded in our culture, are on pages 20-21 of this report.
Strategy FocusWe continued to diversify our revenue base into infrastructure, wind energy, utilities, telecommunications and labour hire. The combined contribution of these sectors represented 53% of total revenue, with mining services contributing the balance 47% of total revenue. Diversification is supported by longer term mining services contracts together with the growth opportunity available from short term projects.
The adoption of a flexible asset rental model to fund growth assets has helped capital management, keeping capital expenditure low, while protecting the balance sheet. It has allowed progressive reduction of debt and ensures rental commitments are matched against project or contract opportunities. The business also continued to benefit from equipment sales in FY20, with $4.6 million in obsolete assets sold.
We are confident our prudent capital management strategy, together with our focus on diversification, recurring revenue streams and targeted growth markets, will lead to improved shareholder returns.
Divisions
Crane ServicesOur lifting solutions cover a diverse range of industries and activities, with mining maintenance and shutdowns the main sectors we service.
Crane Services’ revenue of $94.4 million was similar to last year, with Central Queensland providing a solid foundation. We are leveraging our reputation in the region to secure additional work from major mine operators and mining services contractors operating at the mine sites of our major clients, including BMA, Coronado, Glencore and Anglo – improving revenues by 8% on last year. In FY21 we are re-establishing in the Moranbah region, where we are already seeing interest from miners.
In New South Wales, we successfully renewed the Glencore contract which includes Bulga in the Hunter Valley and Hail Creek in Queensland. This was followed in the second half with an agreement to supply services to another major coal miner in the Hunter Valley.
In South Australia, we are expanding our service offering to our major customer at Olympic Dam where another major shutdown is being planned. This has involved
moving a new fleet of assets to our on-site facility and releasing the existing assets to service other regions.
In Western Australia, we restructured our operations in the first half, adding a new general manager and sales team. In the second half of the year, the team increased revenue by winning a new maintenance contract and project work in the south west, improving revenues by 6% on last year.
Due to COVID-19, the establishment of a new Port Hedland depot to cover the north-west was delayed, but we now expect operations there to start in the first quarter of FY21.
readiOur readi labour hire business focuses primarily on supplying skilled labour for mining shutdowns, oil and gas maintenance, and the construction and infrastructure sectors. Direct labour hire revenue from Boom and readi contracts was $26.3 million in FY20.
COVID-19 was a challenge in the second half of the year, as social distancing requirements impacted our industrial maintenance and oil and gas customers. The labour market tightened, as mine shutdowns were reduced and projects were delayed due to the coronavirus. readi is an opportunity to diversify our revenue base further and we believe this business will return in strength after the pandemic.
Travel Towers Our Travel Towers business operates primarily in the power transmission, telecommunications and wind energy sectors. The division’s margins increased during the year following its restructure at the end of FY19 and its focus on larger travel tower assets. Revenue, at $26.8 million, was 8% higher than the previous year.
The rationalisation of the travel tower business delivered significant cost savings in FY20 and asset utilisation increased from the rebalanced fleet. Boom’s results include an impairment charge of $1.9 million against 35 smaller and obsolete travel towers that will be auctioned in the first half of FY21. Further rationalisation of the travel towers business occurred with the closure of the underperforming Newcastle depot from 1 July 2020.
100travel towers, from 12 metres up to 70 metres
Boom Logistics Annual Report 2020 7

Growth is expected to continue in the telecommunications and power utility sectors. Solid business volumes in the telecommunications market are forecast to continue, with potential for more high voltage line stringing and interconnector work over the next five years, largely due to the increase in renewable energy projects and upgrades to the electricity grid.
Boom ProjectsBoom’s participation in wind farm, bridge installation, infrastructure and construction projects continues to grow. These are high-growth markets, with revenue from the sectors contributing $38.0 million, an 8% increase on FY19.
Our Queensland wind farm project at Coopers Gap progressed well throughout the year and we were awarded additional work through to May 2020. This generated an additional $6 million of revenue for the financial year.
Unfortunately, we experienced material changes, including major delays, to the Cattle Hill wind farm contract in Tasmania. The delays were caused by extreme weather conditions which resulted in lower productivity and this led to project cost increases and losses. We are actively pursuing unresolved claims for costs.
The experience with Cattle Hill has changed our approach to contracting and pricing future construction projects. We have taken steps to add further due diligence to our contract review process. We have solid wind farm project
CASE
STU
DY Western Australia: Boom powers on in the North West
Boom’s project footprint in Western Australia was consolidated last year with works supporting the construction of power transmission lines north of Perth. This has provided the opportunity for Boom to showcase its expertise on a larger project.
The company has now been contracted to provide the travel towers for the completion of a 220kv transmission line running between mines in the Pilbara region of Western Australia. Our service includes the supply of six Bronto travel towers and specialised labour. This major infrastructure project is anticipated to run for up to 12 months.
These projects in the North West illustrate our progression into high demand regions across Australia where we are increasing our profile and winning project work. We have a proven track record of delivering critical infrastructure projects in remote regions and the supply of specialised resources and assets to the utilities and resources sectors.
MA
NA
GIN
G D
IREC
TOR
’S
REP
OR
T (C
ON
TIN
UED
)
Boom Logistics Annual Report 20208

bookings through the first half of FY21, which are based on an equipment hire and labour rate model for services performed.
We are targeting large civil infrastructure work around the capital cities, such as rail works and level crossing removals in Melbourne, as well as large bridge and tunnel boring projects. The larger cranes in our fleet also assist in national wind farm maintenance work, which is increasing across the sector.
This business unit will benefit from a contract for work on the Parramatta light rail infrastructure project expected to commence in the first quarter and the recently signed contract to support work on the Snowy 2.0 project, which commenced in August 2020.
COVID-19 ResponseWe responded rapidly to the emerging COVID-19 pandemic in line with advice from the Government and World Health Organisation. This included working closely with customers to ensure all health requirements were met, while we developed an action plan to keep our people safe and manage impacts on our business.
We were early to implement travel restrictions in March and introduced stricter cleaning processes. This required sourcing cleaning and sanitation products, establishing social distancing protocols and introducing thermal scanning devices to conduct temperature checks at depots.
Boom Logistics Annual Report 2020 9

The company made a number of decisions to preserve cash, introducing additional cost controls to minimise expenditure. Major suppliers were approached to extend credit terms and employees were directed to take leave during the last quarter.
OutlookWhile challenges lie ahead, Boom is in a stable position for FY21, with strong cash flows, conservative net debt and a solid balance sheet.
We are well placed to take advantage of new revenue opportunities, such as expanding services in mining maintenance and entering new growth regions such as Western Australia’s north-west iron ore market.
The infrastructure and construction sectors look positive with solid opportunities in the pipeline across Australia. There is considerable potential for travel towers to assist with increasing power infrastructure and telecommunications work, and recurring revenue streams from the wind farm sector.
The impact of COVID-19 remains a challenge in some areas. It has disrupted our operations with border closures affecting travel between regions, temporary delays in infrastructure, wind farm projects and mining maintenance work. There is a degree of uncertainty surrounding the pandemic and we are actively monitoring the situation.
CASE
ST
UD
Y Infrastructure projects
Boom is working on a number of important infrastructure projects across Australia. Projects over the last year have included work on the Albion Bypass project south of Wollongong in New South Wales and rail level crossing removals in the Melbourne metropolitan area.
Boom is a market leader in complex engineered lifts with a reputation for working safely to tight timelines, providing lift planning expertise and specialised lifting equipment. Our Liebherr LTM-1750 hydraulic cranes, with 750 tonne lifting capacity, are perfectly suited to infrastructure projects which regularly involve a long lift radius and heavy loads.
In early 2020, Boom crews worked on three level crossing removals at Pakenham, Lyndhurst and Cheltenham in Melbourne, Victoria.
A key advantage of Boom’s choice of the LTM-1750 for these projects is its broad capability across configurations which enables placement of 60 tonne girders with the crane positioned outside the rail line. This means the crane can be set up and ready to lift before the rail line is closed.
The company’s 750 tonne mobile hydraulic cranes are servicing customers across Australia in mining and wind farms as well as infrastructure projects.
MA
NA
GIN
G D
IREC
TOR
’S
REP
OR
T (C
ON
TIN
UED
)
Boom Logistics Annual Report 202010

I would like to take this opportunity to thank all our customers, suppliers, debt providers and shareholders who have supported us through this past challenging financial year.
In conclusion, I would also like to thank and acknowledge the efforts of our people, who have shown dedication and remained focused on safety in the face of the pandemic. We have loyal and committed employees who are key to Boom’s success.
Tony Spassopoulos Managing Director
27 August 2020
SAFETY ALWAYSContinue our journey towards
zero harm
RES
PECT
For e
ach
oth
er a
nd
all s
take
hold
ers
INNOVATION
Looking for new ways to
do thingsTEAM W
ORK
Working together to
achieve
our best
DEVELO
PING O
UR
PEOPLE
Comm
ittment to our future
CUSTOMER FOCUS
Everything begins with the customer
The Boom values are an uncompromising foundation of our organisation, guiding our decisions, our behaviours and the way we do business to maximise returns for our shareholders.
Boom Logistics Annual Report 2020 11

OU
R V
ALU
E P
RO
PO
SITI
ON As a large-scale lifting specialist, we seek to deliver innovation for our
customers, build shareholder value and ensure safety excellence. We continue to build our leading reputation in the market as a trusted lifting, construction and maintenance solutions partner. Boom’s customer value proposition is based on total lifting solutions and specialised labour services.
EQUIPMENT● A comprehensive and diverse fleet aligned to customer requirements in mining
and resources, wind, energy, utilities, infrastructure, industrial maintenance and telecommunications.
● Well maintained fleet with maintenance records and Key Performance Indicator reporting for customers.
OPERATIONAL CAPABILITY● Highly experienced and trained workforce of supervisors, crane operators, riggers
and travel tower operators.
● Operational resources and infrastructure to support customers in our core markets.
● Planned and configured services involving operators, cranes, transport, travel towers and other assets to meet complex customer requirements.
● The readi labour hire business delivers an integrated labour solution to both existing and new customers. It currently supplies support to key Boom contracts and continues to focus on expanding its offering of multiple trades and skills to external customers.
ENGINEERING EXPERTISE● Pre-lift customer site survey and analysis.
● Detailed engineering lift studies to drive safety, efficiency and cost effectiveness.
● Project planning and project management.
● Wind farm construction including lifting, mechanical and electrical installation and maintenance.
SAFETY & QUALITY SYSTEMS● Cultural alignment with our customer base, with an uncompromising
safety focus.
● AS/NZS ISO 4801:2001 certification and transition to AS/NZS ISO 9001:2015 achieved.
● Investment to drive continuous improvement in our safety systems, processes and organisation.
The Group’s distinctive and comprehensive value proposition provides a solid platform for future growth to maximise returns to shareholders.
Boom Logistics Annual Report 202012

CASE
STU
DY
Powering ahead with wind farm maintenance
Boom is increasingly engaged to perform wind farm maintenance works in addition to our engineering and construction activities in the wind renewables sector. Over the past 12 months Boom has performed maintenance work across a number of wind farms.
The renewables team has been collaborating with our wind farm customers to provide engineering advice, perform critical maintenance and major component change outs on wind farms across Australia.
Successful execution of wind farm maintenance relies on a partnership approach, coupled with a strong focus on safety, engineering compliance, fit for purpose cranes and highly skilled project teams. Boom is a trusted supplier to many of the world’s leading wind turbine manufacturers.
Often under challenging weather conditions and at heights above 100 metres, our maintenance activities include removal and replacement of gear boxes, generators and blades. Boom also provides a range of travel towers and resources to support tower maintenance.
In the main pictured lift, Boom cranes and personnel removed a nacelle lid and completed a gear box exchange at a height of 110 metres, with a total under hook weight of 32.6 tonnes.
We continue to expand and diversify our service model to deliver scheduled wind farm maintenance programs.
.
Boom Logistics Annual Report 2020 13

OverviewThe Group reported a net loss after tax of $17.0 million for the year ended 30 June 2020 (FY19: net loss after tax of $5.3 million). Operating cash flow was strong in the year, delivering cash flow from operations of $28.8 million. The results for the year were disappointing with strong results in some segments overshadowed by the continued financial impact of a loss-making wind farm construction project in Tasmania, which completed in March 2020. Since the outbreak of COVID-19, deferrals in mining maintenance and shutdown programs and delays to infrastructure and wind farm projects also impacted results. The Group was nevertheless able to generate strong cash flows that enabled a material reduction in net debt over the year. Boom retained its focus on capital management with efficient equipment sourcing to match commitments with contracted businesses.
Income StatementThe FY20 year saw the adoption of the AASB16: Leases accounting standard that has had a material impact on the Group’s reported numbers. For ease of comparison to the prior year the statutory reported numbers have been reconciled to a directly comparable (pre AASB16) number to the prior year (which is not restated for the impact of AASB16).
30-Jun-20 $’m
30-Jun-20 $’m
30-Jun-19 $’m
Statutory AASB16 ADJPre AASB16
Like-for-Like
Revenue 185.5 0.7 186.2 182.7
Operating Costs (156.1) (16.8) (172.9) (162.6)
Trading EBITDA 29.4 (16.1) 13.3 20.1
Depreciation (31.9) 15.2 (16.7) (17.3)
Trading EBIT (2.5) (0.9) (3.4) 2.8
Net Borrowing Costs (4.4) 1.4 (3.0) (3.7)
Trading Net Loss Before Tax (6.9) 0.5 (6.4) (0.9)
Non-Trading Income 0.0 0.0 0.0 1.6
Non-Trading Expenses (4.1) (0.1) (4.2) (2.0)
Profit/(Loss) on Sale of Assets 0.4 0.0 0.4 (2.0)
Impairment to Property, Plant and Equipment (1.9) 0.1 (1.8) (2.0)
Net Loss Before Tax (12.5) 0.5 (12.0) (5.3)
Net Loss After Tax (17.0) 0.5 (16.5) (5.3)
Statutory EBIT (8.1) (0.9) (9.0) (1.6)
Statutory EBITDA 23.8 (16.1) 7.7 15.7
OP
ERA
TIN
G A
ND
FI
NA
NCI
AL
REV
IEW
Boom Logistics Annual Report 202014

Financial Performance
RevenueReported revenue of $185.5 million (FY19: $182.7 million) was marginally up on the prior year with Boom delivering strong revenue growth in the wind, energy and utilities sector from wind farm construction and maintenance projects and a growing portfolio of work in power projects. The mining and resources sector remained steady. The telecommunications sector was affected by bush fires. Industrial maintenance was impacted later in the year by the COVID-19 pandemic. Revenue in the infrastructure and construction segment decreased as a result of assets being deployed to wind, energy and utility projects during the first half of the year with project delays then being experienced throughout the last quarter.
EarningsStatutory earnings before interest expense, tax, depreciation and amortisation (EBITDA) was $23.8 million (FY20 on a pre AASB16 like for like basis: $7.7 million; FY19: $15.7 million). Statutory earnings before interest expense and tax (EBIT) was a loss of $8.1 million (FY20 on a pre AASB16, like for like basis: loss of $9.0 million ;FY19: loss of $1.6 million).
In terms of trading EBIT the Group reported a trading EBIT loss of $2.5 million for FY20 (FY20 trading EBIT loss of $3.4 million on a pre AASB16, like for like basis) compared with trading EBIT of $2.8 million in the prior year.
Trading EBIT is before recognising the following non-trading expenses:
● Non-trading expenses of $4.1 million comprising:
● $2.7 million relating to an onerous wind farm construction project. The contract has completed with post contract negotiations now occurring to resolve outstanding claims in dispute.
● $0.8 million of redundancy costs in relation to a reduction in support roles, largely in the corporate head office in addition to redundancies in the underperforming NSW business and the now closed Newcastle travel tower depot.
● $0.6 million relating to insurance excess payable following damage incurred to equipment.
● Impairment expense of $1.9 million comprising:
● $1.8 million to the carrying value of 35 underutilised small capacity travel towers and 25 pieces of access equipment that have
been identified as surplus to requirements and available for immediate sale.
● $0.1 million relating to the onerous lease on the property lease for the now closed Newcastle travel tower depot.
● Profit on sale of $0.4 million relating to the sale of a number of redundant crane, transport and ancillary assets during the year.
TaxationA tax expense of $4.45 million was incurred in FY20 (FY19: $nil) relating to a historic franking deficit tax liability that was allowed to crystallise at 30 June 2020. The company has negotiated an interest free repayment plan with the ATO that will allow the liability to be settled progressively over 24 monthly instalments, commencing in August 2020.
The amount of franking deficit tax to be paid is not a penalty and may be used against any future tax liability (in addition to the income tax losses carried by the company).
FY20 Review of OperationsA number of businesses within the Group had solid results for the year:
– Central Queensland – the customer base in the region is predominantly metallurgical coal and demand for services was strong. Boom continued to grow revenue and profit. The Group renewed a 3 year contract with a major customer in the region and extended its customer base through expanding operations to new mines and working with contractors on site. Outlook remains positive in the area and the Group will continue to grow operations by expanding its customer footprint into the Moranbah region.
– Western Australia – the first half of FY20 was slow but significant momentum was gained in the second half of the year following a change of local leadership and a reinvigoration of the business development resource. Profitable project work was won across the south west and a new maintenance contract was secured. The new contract will add ‘base recurring revenue’ to the existing major contracts in the south west of the state.
14Depots across Australia
Boom Logistics Annual Report 2020 15

The COVID-19 restrictions did however cause the Group to delay its planned expansion into the north-west as the movement of workers and equipment became constrained. The Group is however well advanced in its preparations and will commence operation in and around Port Hedland in the first quarter of FY21.
– Travel Towers – the restructured national travel towers business had a much improved year. The business benefitted from its reduced cost base and increased focus on business development. Significant new work was won during the year in the electricity power sector. Demand grew for assets to work on major grid upgrade projects and work connecting new renewable energy sites back to substations. This new work was an important supplement to the on-going work in the telecommunications sector that remains a focus for the business as the 5G network is rolled out.
Continued improvement from the business is expected in FY21 in the power and telecom sectors using the larger capacity assets. The fleet will be further divested of smaller assets to rationalise costs and allow the business to focus on its core markets. As such the Newcastle depot has closed (following the closure of the Newcastle crane depot in FY19). In addition 35 underutilised smaller assets across the business have been identified for sale. A $1.8 million impairment charge was recognised against these assets at 30 June 2020 as they were moved into assets held for sale. The sale of these assets will reduce on-going running costs and further improve the return on capital generated by the business.
– Coopers Gap wind farm construction project – work was successfully completed on the 123 turbine Coopers Gap wind farm. Boom successfully completed the main installation of 82 of the turbines and completed the electrical and mechanical scope on 62 of the towers.
Unfortunately these results were offset by disappointing outcomes elsewhere:
– Cattle Hill wind farm construction project – in contrast to other wind farm construction projects completed, this project located in remote Tasmania was beset with issues. Inclement weather and site delays, difficulty maintaining skilled crews and construction challenges, all impacted the project. A reduction in project scope and a requirement for additional night crews to complete the project resulted in a significant EBIT loss of circa $7.5 million in the year.
This project had a significant negative financial impact on the year. The loss making Cattle Hill wind farm project led the company to strengthen its risk management procedures and contract review processes.
The outlook for the wind farm business remains strong. Boom is contracted to a wind farm construction project in the first half of FY21 working on a schedule of rates rather than a fixed sum and the project pipeline remains solid. The Group is also increasingly turning its focus to the wind farm maintenance market and increasing the number of services it provides in this growing sector.
– New South Wales – the business in the Hunter Valley was slow to return after a period of industrial disruption in FY19. The customer base was slower to come back than expected and some clients were lost following the closure of the unprofitable Newcastle crane business in FY19. The Group did begin work for a major new customer in the Hunter Valley during the second half of FY20. The thermal coal market however remains very competitive with tight margins.
– Project delays – the second half of the year was affected by a number of project delays that impacted the reported results for FY20. A major wind farm construction project that was expected to commence around March 2020 was delayed. The infrastructure project that was scheduled for the Group’s 750t crawler crane was also delayed until the 2021 calendar year.
Whilst the timing of certain projects remains uncertain the outlook for FY21 has strengthened. The Group has secured work on the Snowy 2.0 project commencing
OPE
RAT
ING
AN
D F
INA
NCI
AL
REV
IEW
(CO
NTI
NU
ED)
Net debt down to
$19.6m
Boom Logistics Annual Report 202016
mid August and the pipeline of work in the infrastructure sector is strengthening.
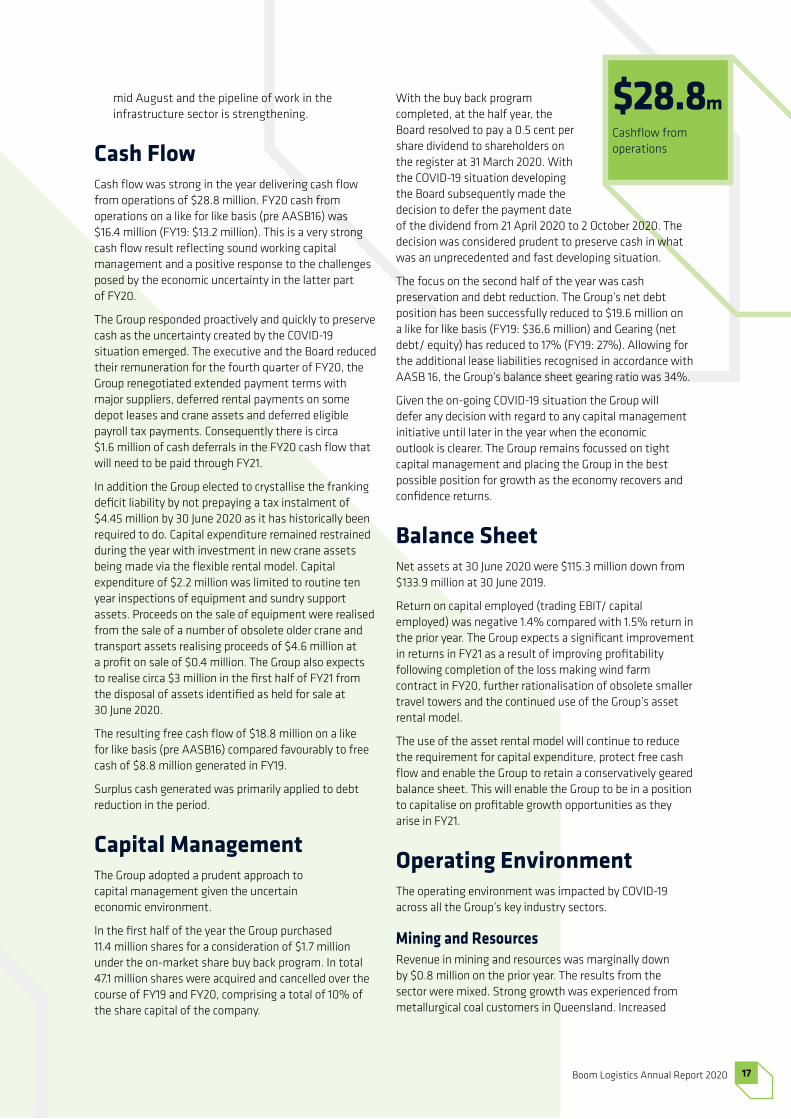
Cash FlowCash flow was strong in the year delivering cash flow from operations of $28.8 million. FY20 cash from operations on a like for like basis (pre AASB16) was $16.4 million (FY19: $13.2 million). This is a very strong cash flow result reflecting sound working capital management and a positive response to the challenges posed by the economic uncertainty in the latter part of FY20.
The Group responded proactively and quickly to preserve cash as the uncertainty created by the COVID-19 situation emerged. The executive and the Board reduced their remuneration for the fourth quarter of FY20, the Group renegotiated extended payment terms with major suppliers, deferred rental payments on some depot leases and crane assets and deferred eligible payroll tax payments. Consequently there is circa $1.6 million of cash deferrals in the FY20 cash flow that will need to be paid through FY21.
In addition the Group elected to crystallise the franking deficit liability by not prepaying a tax instalment of $4.45 million by 30 June 2020 as it has historically been required to do. Capital expenditure remained restrained during the year with investment in new crane assets being made via the flexible rental model. Capital expenditure of $2.2 million was limited to routine ten year inspections of equipment and sundry support assets. Proceeds on the sale of equipment were realised from the sale of a number of obsolete older crane and transport assets realising proceeds of $4.6 million at a profit on sale of $0.4 million. The Group also expects to realise circa $3 million in the first half of FY21 from the disposal of assets identified as held for sale at 30 June 2020.
The resulting free cash flow of $18.8 million on a like for like basis (pre AASB16) compared favourably to free cash of $8.8 million generated in FY19.
Surplus cash generated was primarily applied to debt reduction in the period.
Capital ManagementThe Group adopted a prudent approach to capital management given the uncertain economic environment.
In the first half of the year the Group purchased 11.4 million shares for a consideration of $1.7 million under the on-market share buy back program. In total 47.1 million shares were acquired and cancelled over the course of FY19 and FY20, comprising a total of 10% of the share capital of the company.
$28.8mCashflow from operations
With the buy back program completed, at the half year, the Board resolved to pay a 0.5 cent per share dividend to shareholders on the register at 31 March 2020. With the COVID-19 situation developing the Board subsequently made the decision to defer the payment date of the dividend from 21 April 2020 to 2 October 2020. The decision was considered prudent to preserve cash in what was an unprecedented and fast developing situation.
The focus on the second half of the year was cash preservation and debt reduction. The Group’s net debt position has been successfully reduced to $19.6 million on a like for like basis (FY19: $36.6 million) and Gearing (net debt/ equity) has reduced to 17% (FY19: 27%). Allowing for the additional lease liabilities recognised in accordance with AASB 16, the Group’s balance sheet gearing ratio was 34%.
Given the on-going COVID-19 situation the Group will defer any decision with regard to any capital management initiative until later in the year when the economic outlook is clearer. The Group remains focussed on tight capital management and placing the Group in the best possible position for growth as the economy recovers and confidence returns.
Balance SheetNet assets at 30 June 2020 were $115.3 million down from $133.9 million at 30 June 2019.
Return on capital employed (trading EBIT/ capital employed) was negative 1.4% compared with 1.5% return in the prior year. The Group expects a significant improvement in returns in FY21 as a result of improving profitability following completion of the loss making wind farm contract in FY20, further rationalisation of obsolete smaller travel towers and the continued use of the Group’s asset rental model.
The use of the asset rental model will continue to reduce the requirement for capital expenditure, protect free cash flow and enable the Group to retain a conservatively geared balance sheet. This will enable the Group to be in a position to capitalise on profitable growth opportunities as they arise in FY21.
Operating EnvironmentThe operating environment was impacted by COVID-19 across all the Group’s key industry sectors.
Mining and ResourcesRevenue in mining and resources was marginally down by $0.8 million on the prior year. The results from the sector were mixed. Strong growth was experienced from metallurgical coal customers in Queensland. Increased
Boom Logistics Annual Report 2020 17

volumes were also realised from work performed for other contractors on customer sites which improved returns from assets. The continued growth of the Queensland business was pleasing with further opportunities in the Moranbah market expected for FY21.
The growth in Queensland was offset by a reduction in demand from thermal coal customers in the Hunter Valley in NSW. This remains a challenging market with high labour costs and tight margins and accounts for circa 8% of Boom revenues. Work with a major new customer in the region commenced in the second half of FY20.
Revenue from Boom’s long term contract at Olympic Dam in South Australia reduced in the second half of the year as border closures and restrictions on FIFO workers impacted Boom’s operations at the site. Volumes are expected to return to normal levels as COVID-19 restrictions ease.
Revenue from the Group’s major maintenance contracts in the south west of WA were also impacted by COVID-19 restrictions with shutdown programs decreasing in size and cost cutting being undertaken by customers. These decreases were offset by the success in winning a new customer maintenance contract to build scale to the operation.
FY20 results were impacted by the delay to the Group’s planned expansion back into the north-west which was delayed due to COVID-19 travel restrictions. This is now expected to occur in FY21 as the Group returns to the important iron ore market.
The Group continued its success in tenders in the sector by renewing the major Queensland and NSW Glencore contract for a further three years, commenced work at a major new customer in Hunter Valley and won a new maintenance contract in WA.
Wind, Energy and UtilitiesSignificant revenue growth of $14.2 million was experienced in this sector in FY20. Growth in this sector is a key part of diversifying group revenue. Key sources of revenue growth were:
● Completion of two major wind farm construction projects;
● Growing revenue base from the increasing wind farm maintenance market;
● Growing revenue from electricity grid upgrade projects and high voltage line stringing projects – principally using the Group’s travel tower assets.
The Group is contracted to a wind farm construction project in the first half of FY21 working on a schedule of rates and has a number of opportunities for the second half. Growth in wind farm maintenance work will also be a focus.
The travel tower division has worked hard to diversify its revenue base and is increasingly winning work on electricity power projects. The Group will have a number of large assets deployed to the north-west throughout FY21 working on a major power line project in the region.
Infrastructure and ConstructionRevenue in this sector was down $6.5 million being impacted by COVID-19 related delays in the fourth quarter and a greater utilisation of the assets on wind farm work in the first half of the year. The NSW infrastructure market was subdued in the second half of the year and several major projects were delayed. This was partially offset by work commencing in the Melbourne market which will remain a focus in FY21 with level crossing removals and civil infrastructure projects.
The sector is improving with the Snowy 2.0 project contracted for the first half of the year commencing August 2020 and additional works on NSW and Victorian infrastructure projects targeted. The speed of recovery in this segment is however somewhat dependent on the COVID-19 outlook and resulting confidence in supply chains and project commencement dates being confirmed.
Industrial MaintenanceRevenue in this sector was down $2.7 million partly due to the non-repeat of a major shutdown in the first half of the prior year by a customer in the Latrobe Valley and partly due to a general slow down in the sector over the second half of the year. The Group’s revenue from the Esso offshore contract was particularly decreased as social distancing requirements reduced the labour required to service the contract throughout the second half.
TelecommunicationsRevenue in this sector decreased by $1.3 million. The telecommunication market is serviced mainly by the travel tower business and is an important revenue base for the business. Activity has remained solid outside of this time with 5G upgrades continuing across the network.
OPE
RAT
ING
AN
D F
INA
NCI
AL
REV
IEW
(CO
NTI
NU
ED)
Boom Logistics Annual Report 202018
Boom’s national presence is a key advantage in this market allowing customers to deal with one equipment supplier nationally as the 5G and network upgrades continue.
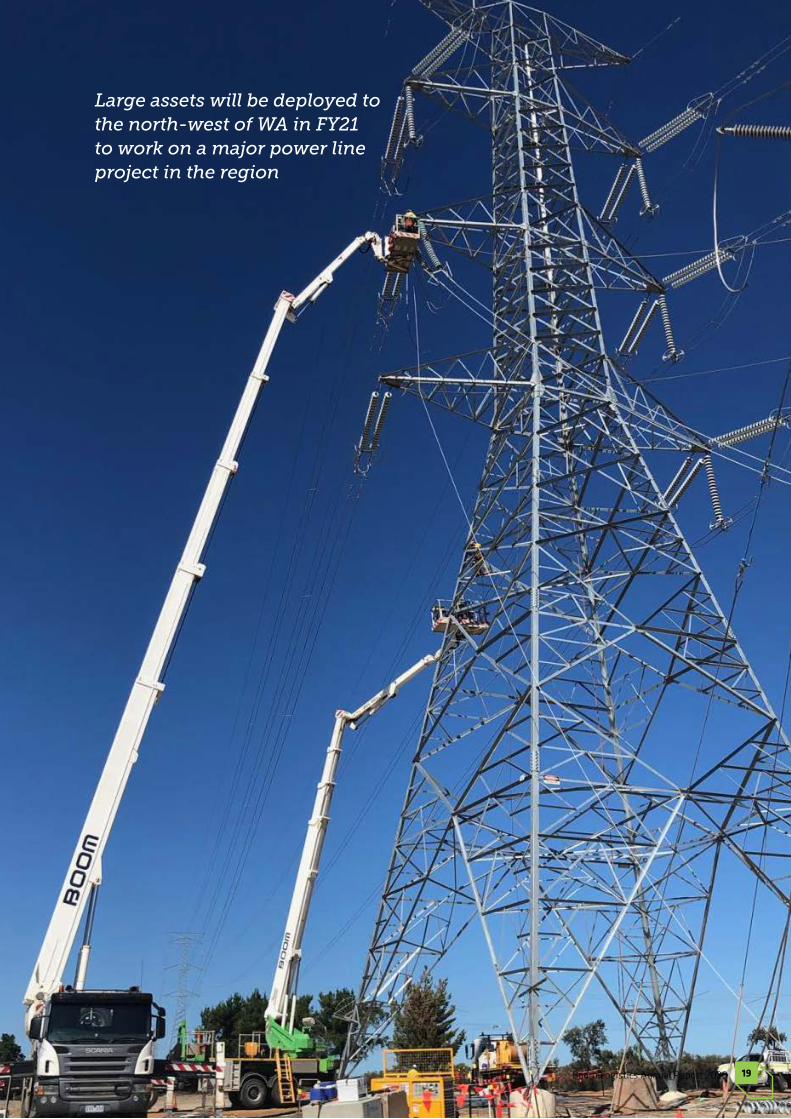
Large assets will be deployed to the north-west of WA in FY21 to work on a major power line project in the region
Boom Logistics Annual Report 2020 19

Our HSEQ GoalsBoom’s three year HSEQ strategic plan sets out the following goals for the company:
● To exceed client and other stakeholders’ HSEQ expectations by consistently providing benchmarked high quality and incident free services.
● To establish a positive and proactive safety culture with well-trained and competent people who demonstrate Boom’s values and exceptional safety leadership.
● To continue to develop and use excellent HSEQ processes and systems.
● To uphold best practice environmental standards.
Highlights● Boom reported a Total Recordable Injury Frequency Rate (TRIFR) of 8.0 at the end
of FY20.
● Boom personnel completed a Certificate IV Leadership and Management and Training course from a range of positions and vocations across the organisation.
● The company completed a National Safety Reset for all staff, including a refresher on Boom’s Lifesaving Rules and a review of all significant incidents within the business and the industry at large.
● Following a safety re-set, there was a 65% increase in the Safe Act Observation Frequency Rate (SAOFR) performance to 6,450 from 3,888 in the prior year.
● The company maintained safety standard certifications for AS/NZS 4801:2001, OHSAS 18001:2007 and ASNZS ISO 9001:2015. Boom is transitioning to the new international safety standard ISO 45001.
● Compliance with environmental management obligations continues.
HEA
LTH
, SA
FETY
, EN
VIR
ON
MEN
T A
ND
QU
ALI
TY
2018 2019 2020
4,525
3,888
6,450
2018 2019 2020
9.08.6
8.0
Total Recordable Injury Frequency Rate (TRIFR)
Safe Act Observation Frequency Rate (SAOFR)
Safety Leadership StructureThe company takes a four-tiered approach to safety leadership:
Health, Safety, Environment & Quality (HSEQ) CommitteeThe HSEQ Committee, a sub-committee of the Board, meets quarterly and considers all aspects of Boom’s safety environment. A summary of the committee’s responsibilities is set out in the Corporate Governance Statement.
Boom Logistics Annual Report 202020

Safety Leadership Team (SLT)The Safety Leadership Team is chaired by Boom’s Chief Executive Officer and includes the General Managers from each business unit, senior management and the HSEQ leadership team.
The SLT prioritises and monitors the safety environment and safety improvement activities. The SLT is supported by the Safety Management Team of safety professionals who operate nationally.
Personal CommitmentAll operational managers commit to a range of consultative and interactive activities which reinforce their personal commitment and our corporate commitment to Health and Safety.
TrainingBoom’s operational training program contains a significant safety leadership element for frontline supervisory personnel and management which works to embed good workplace safety as an operational discipline. The training emphasises the importance of sustained and visible leadership through employee engagement and safety interactions.
Key metrics are measured and recorded in the corporate HSEQ management database and included in the monthly HSEQ Report to the Board.
Measurable activities include:
● Safe Act Observations and Safety Interactions which are an informal risk management and assurance activity which generates positive safety-related discussions with employees in the field.
● HSEQ Internal Audits, which include consultation and discussion with employees.
● Involvement in consultative meetings (such as Safety Committees), delivering toolbox talks and pre-start meetings.
SafetyBoom’s safety performance continues to be a key operational focus, with emphasis on risk management, leadership and assurance. Our goal is to ensure employees, customers and the general public are free from harm when delivering lifting solutions in complex and diverse operating environments.
The company’s ongoing emphasis on safety leadership, best practice safety systems and “Safety Always” culture builds confidence and trust with our customers and employees around the predictable, reliable and consistent delivery of high value lifting solutions.
The focus of the three-year HSEQ Strategic Plans (2018-2020) is on leadership, assurance and employee wellbeing. The “One BOOM” HSEQ Management System continues to be developed and enhanced.
The HSEQ Strategic Plan actions include:
● System improvements in the areas of lifting operations, verification of competency, training, assurance, inductions and transport.
● A cultural improvement and leadership program consistent with Boom’s belief that excellent leadership improves all aspects of our business including HSEQ performance.
● A wellbeing program aimed at improving and maintaining the health of employees.
● Review of the Boom approach to sustainability and community.
● Review of the existing maintenance system documentation.
● Improved use of the hazard module in the myosh incident management software.
EnvironmentBoom continues to meet its legal and community obligations in environmental management. We comply with the National Greenhouse and Energy Reporting Act 2007.
● Boom’s environmental impact is managed through procedures mostly directed at waste management. Disposal of waste oil, batteries and tyres is undertaken by licensed disposal agents.
● Boom has procedures and equipment to manage runoff and spills. Onsite work is conducted in accordance with client procedures and regulations.
● Energy usage minimisation initiatives are in place.
● The current three-year HSEQ Strategic Plan includes a review to ensure Boom meets the expectations of ISO14001, but there is currently no plan to be certified to this standard.
QualityThe Company has continued Certification to AS/NZS ISO 9001:2015.
Boom Logistics Annual Report 2020 21

Boom’s total workforce exceeded 1,100 during FY20. We have 398 permanent employees, 80% of whom directly provide services to customers – including operators, supervisors, safety professionals, engineers and sales personnel, while the remainder comprise management and functional support to the business.
Our flexible workforce of over 700 employees engaged through readi during the year enabled the company to provide a workforce for projects and maintenance shutdowns for our clients.
A vital element of our company culture and drive for responsible growth is ensuring that Boom is a great and safe place to work. We recognise and reward performance, create opportunities for our staff to develop and provide support so they continue to thrive.
Boom recognises that people are critical to its success and continues to invest to deliver efficiencies and develop leadership capability across the organisation through internal and external training and development activities. Our workforce is well-trained and on-boarded so all employees work in a safe and professional manner to the standard and expectations of Boom and its customers.
The company invests in the development of its business leaders to maximise their management potential. Training and development of operational staff ensures operating tickets are maintained, safety standards are upheld, customer site inductions are current and verification of competency is undertaken to meet the needs of our customers.
Boom continues to invest in our people to deliver efficiencies and develop leadership across the business.
OU
R P
EOP
LE A
ND
SYS
TEM
S
1,100Employees. 398 permanent and 700 flexible workforce
Boom Logistics Annual Report 202022

Indigenous ProgramWe recognise the traditional rights of Indigenous peoples and acknowledge their right to maintain their cultures, identities, traditions and customs.
Boom will continue to support communities and its customers in developing Indigenous programs in remote locations of Australia. Our National Indigenous Employment Framework provides a basis for localised strategies to generate work opportunities and support Indigenous communities.
Training and DevelopmentThrough the year, we continued to provide Certificate IV Leadership and Management training to employees across the business. The program provided practical skills to develop strong and effective leaders for the future covering subjects including safety, client engagement, business processes and leadership.
Boom’s e-Learning Centre provides on-line induction and on-boarding through its Life Saving Rules and Compliance training. Our Employee Survey invites employees to provide candid feedback on their experience in the workplace.
Boom Logistics Annual Report 2020 23

BO
AR
D O
F D
IREC
TOR
S A
ND
K
EY M
AN
AG
EMEN
T TE
AM
Maxwell John Findlay
BEcon, FAICD (Independent, Non-executive Chairperson) (appointed 18 July 2016)Mr. Findlay was Managing Director and Chief Executive of industrial services company Programmed Group from 1990 until his retirement from executive life in 2008. Since retiring as an executive, Mr. Findlay has engaged in various non-executive roles in industrial services, engineering and government. He is currently Chairman of the Snowy Mountains Engineering Corporation and was previously Director of EVZ Limited and The Royal Children’s Hospital. During the past three years, Mr. Findlay has held ASX listed public company Directorship with EVZ Limited (2008 to 2017). Mr. Findlay is Chairperson of the Boom Logistics Risk Committee.
Tony Spassopoulos
BBus (Management), MBA (Managing Director) (appointed 20 September 2018)Mr. Spassopoulos has over 30 years experience in the equipment hire, industrial services, and the pallet/container pooling industries. Prior to joining the Company, Mr. Spassopoulos was Director/General Manager of CHEP Asia Pacific – Reusable Plastics Containers business and held other senior management positions during his 19 years in the Brambles Group. He joined the Company in 2008 and served as Director of Sales and Marketing and more recently Chief Operating Officer prior to his appointment as Managing Director. During the past three years, Mr. Spassopoulos has not held any other ASX listed public company Directorships.
Melanie Jayne Allibon
MAICD (Independent, Non-executive Director) (appointed 19 June 2019)Ms. Allibon has an extensive background in human resources and operating risk, primarily in the manufacturing, FMCG, mining and industrial services sectors. Ms. Allibon has held Non-executive Director positions with the Australian Mines and Metals Association, Melbourne Water Corporation. She is currently a member of World Vision’s Business Advisory Council, Chief Executive Women and the International Women’s Forum. Since the date of appointment, Ms. Allibon has not held any other ASX listed public company Directorships. Ms. Allibon is Chairperson of the Boom Logistics Nomination & Remuneration Committee.
Jean-Pierre Buijtels
MSc (International Business) (Non-independent, Non-executive Director) (appointed 2 June 2017)Mr. Buijtels is the portfolio manager of Gran Fondo Capital, a Dutch mutual fund. He is also involved in private equity investments at Strikwerda Investments. Since 2007 he has been investing in private equity and public equity at 3i, Gimv and Strikwerda Investments. He has been involved at board level at several companies, currently as observer at Constellation Software Netherlands Holding Coöperatief U.A (a subsidiary of Constellation Software Inc. and the indirect owner of Total Specific Solutions). During the past three years, Mr. Buijtels has not held any other ASX listed public company Directorships.
Boom Logistics Annual Report 202024

Terrence Charles Francis
DBus (hon. causa), BE (Civil), MBA, FIE Aust, FAICD, FFin (Independent, Non-executive Director) (appointed 13 January 2005)Mr. Francis has over 20 years experience as a Non-executive Director of infrastructure development companies including Infrastructure Specialist Asset Management Limited, NBN Limited, Southern and Eastern Integrated Transport Authority, Emergency Services Telecommunications Authority. He also advises business and government on infrastructure development. Previously Mr. Francis was Executive Director of Deutsche Bank Australia, and Chief Executive Officer of Bank of America in Australia. During the past three years, Mr. Francis has not held any other ASX listed public company Directorships. Mr. Francis is Chairperson of the Boom Logistics Audit Committee.
Terence Alexander Hebiton
(Independent, Non-executive Director) (appointed 22 December 2000)Mr. Hebiton commenced his commercial career in the rural sector. In 1989, he acquired various business interests associated with land and property rental developments. He is currently a Director of a number of private companies. He was a principal of Alpha Crane Hire, one of the founding entities of Boom Logistics. Mr. Hebiton was the CEO of Boom Logistics at its formation and ceased being an Executive Director in 2004. During the past three years, Mr. Hebiton has not held any other ASX listed public company Directorships. Mr. Hebiton is Chairperson of the Health, Safety, Environment & Quality Committee.
Tim Rogers
Chief Financial Officer, MArts (Hons) (Economics & Law) MPhilTim joined BOOM in July 2015. Prior to joining BOOM, Tim was the Group Chief Financial Officer for Crowe Horwath. An ASX listed Company with over 100 office locations, Crowe Horwath is the 5th largest accounting services group in Australasia. Prior to joining Crowe Horwath, Tim was the Director of Audit & Assurance at Deloitte Touche Tomatsu. Tim has a wealth of finance and strategy experience.
Malcolm Peter Ross
BBus, LLB, LLM, GradDipACG, FGIA (appointed Company Secretary 22 September 2014)Mr Ross joined the Company on 7 November 2011 as General Counsel and in addition to those responsibilities was appointed Company Secretary on 22 September 2014. Following admission as a solicitor in Victoria in 1997, he worked with Harwood Andrews and then Hall & Wilcox Lawyers. In 2002, he joined InterContinental Hotels Group Plc (FTSE-listed) based in Singapore where his final position was Vice-President and Associate General Counsel with responsibility for leading the legal function across Asia Australasia.
Boom Logistics Annual Report 2020 25

FIN
AN
CIA
L R
EPO
RT 27 Directors’ Report
30 Remuneration Report42 Lead Auditor’s Independence Declaration43 Consolidated Statement of
Comprehensive Income 44 Consolidated Statement of Financial Position 45 Consolidated Statement of Cash Flows 46 Consolidated Statement of
Changes in Equity
Notes to the Consolidated Financial Statements47 About This Report 47 COVID-19 Impact on the Group
Section A: Financial Performance49 1 Segment Reporting51 2 Revenue from Contracts with Customers52 3 Other Income and Expenses53 4 Income Tax55 5 Earnings Per Share56 6 Dividends
Section B: Operating Assets and Liabilities56 7 Property, Plant and Equipment57 8 Impairment Testing of Assets
58 9 Reconciliation of the Net Cash Flows from Operations with Net Loss After Tax
59 10 Other Provisions and Liabilities
Section C: Funding Structures59 11 Debt 61 12 Financial Risk Management 66 13 Contributed Equity
Section D: Other Disclosures67 14 Subsidiaries 67 15 Deed of Cross Guarantee 70 16 Parent Entity 70 17 Key Management Personnel 71 18 Share-based Payments 73 19 Contingencies 74 20 Auditor’s Remuneration 74 21 Subsequent Events 75 22 New Accounting Policies and Standards
79 Directors’ Declaration 80 Independent Auditor’s Report 84 ASX Additional Information
Boom Logistics Annual Report 202026

DIRECTORS’ REPORTfor the year ended 30 June 2020
Your Directors present their report on the consolidated entity (referred to hereafter as “the Group”) consisting of Boom Logistics Limited (“Boom Logistics” or “the Company”) and the entities it controlled for the financial year ended 30 June 2020.
DirectorsThe Directors of the Company at any time during or since the end of the financial year are:
Maxwell John FindlayQualifications and biographies (see previous page).
Tony SpassopoulosQualifications and biographies (see previous page).
Melanie Jayne AllibonQualifications and biographies (see previous page).
Jean-Pierre BuijtelsQualifications and biographies (see previous page).
Terrence Charles FrancisQualifications and biographies (see previous page).
Terence Alexander HebitonQualifications and biographies (see previous page).
Company Secretary
Malcolm Peter RossQualifications and biographies (see previous page).
Boom Logistics Annual Report 2020 27

DIRECTORS’ REPORTfor the year ended 30 June 2020
Directors’ Interests in the Shares and Options of the CompanyAs at the date of this report, the interests of the Directors in the shares, rights and options of Boom Logistics Limited were:
Name Shares Rights Options
M.J. Findlay 250,000 – –
T. Spassopoulos 1,500,000 1,691,758 11,505,377
M.J. Allibon 100,000 – –
J.J.A.M. Buijtelsa – – –
T.C. Francis 185,745 – –
T.A. Hebiton 547,995 – –
a Mr. Buijtels is employed by Rorema Beheer B.V., the fund manager (the Fund Manager) of the fund Gran Fondo Capital (the Fund) which holds 35,380,342 shares in Boom Logistics Limited (the Company). Mr. Buijtels' remuneration is partly linked to the performance of the Fund, which is influenced by the performance of the shares of the Company as long as the Fund holds shares in the Company. Mr. Buijtels holds a minority economic interest of less than 5% of the units of the Fund and thereby indirectly an economic interest in the Company as long as the Fund holds shares in the Company. The Fund is open-ended and Mr. Buijtels can redeem his units in the Fund against their net asset value minus redemption fee at each transaction day of the Fund. Mr. Buijtels is not a director of the Fund Manager, and does not have the power to exercise votes, control the exercise of votes, dispose of or control the disposal of the Fund's shares in the Company. However, he can influence the decision-making process of the director of the Fund Manager in his capacity as its portfolio manager.
Directors MeetingsThe number of meetings of Directors (including meetings of committees of Directors) held during the year and the number of meetings attended by each Director was as follows:
Board of Directors Audit Committee
Nomination and Remuneration
Committee
Health, Safety, Environment &
Quality Committee Risk Committee
Name of director Held Attended Held Attended Held Attended Held Attended Held Attended
M.J. Findlay 15 15 6 6 1 1 4 4 3 3
T. Spassopoulos 15 15 – – 1 1 4 4 3 3
M.J. Allibon 15 15 – – 1 1 4 4 3 3
J.J.A.M. Buijtels 15 15 – – 1 1 4 4 3 3
T.C. Francis 15 15 6 5 1 1 4 4 3 3
T.A. Hebiton 15 15 6 6 1 1 4 4 3 3
Corporate StructureBoom Logistics is a company limited by shares that is incorporated and domiciled in Australia. Boom Logistics Limited has prepared a consolidated financial report incorporating the entities that it controlled during the financial year, which are listed in note 14 to the financial statements.
Boom Logistics Annual Report 202028

Indemnification and Insurance The Company has entered into Deeds of Access, Indemnity and Insurance with each of the Directors and the Company Secretary, under which the Company indemnifies, to the extent not precluded by law from doing so, those persons against any liability they incur in or arising out of discharging their duties. No indemnity has been granted to an auditor of the Group in their capacity as auditor.
During the financial year, the Company has paid an insurance premium for the benefit of the Directors and officers of the Company in accordance with common commercial practice. The insurance policy prohibits disclosure of the liability insured and the amount of the premium.
Nature of Operations and Principal ActivitiesDuring the year, the principal activity of the Group was the provision of lifting solutions and specialised labour services.
Operating and Financial ReviewA review of Group operations and results for the financial year ended 30 June 2020 is set out in the operating and financial review section of the Annual Report and in the accompanying financial statements.
Corporate GovernanceThe Group recognises the need for the highest standards of corporate behaviour and accountability. The Directors of Boom Logistics have accordingly followed the recommendations set by the ASX Corporate Governance Council. For further information on corporate governance policies adopted by Boom Logistics Limited, refer to our website: www.boomlogistics.com.au/about-us/corporate-governance and annual reports.
Significant Changes in the State of AffairsThere have been no significant changes in the state of affairs other than that reported in the Operating and Financial Review section disclosed above.
Significant Events After the Balance DateThe Board resolved to pay an unfranked interim dividend of 0.5 cents per share on 26 February 2020 with a record date of 31 March 2020. The dividend payment date, originally scheduled for 21 April 2020, was deferred to 2 October 2020 as a prudent measure to preserve cash as a result of the uncertainty created by the COVID-19 situation at that time. The record date for the deferred payment remains 31 March 2020 and the estimated liability based on the number of ordinary shares on issue at that date is $2.1 million. The dividend has not been provided for in the 30 June 2020 year end financial statements.
The Group has entered into a twenty four month, interest free payment plan with the ATO to settle the franking deficit tax liability of $4.447 million that existed at balance date. The Group will make monthly instalments of $185,308 commencing on 24 August 2020 and completing on 25 July 2022.
On 2 August 2020, the Victorian government declared a state of disaster and announced stage 4 restrictions for Melbourne and stage 3 restrictions for regional Victoria. Given the dynamic nature of these circumstances, the economic impact on the Victorian economy is not known. However, as at the date of this report the impact on the Group is not expected to be material.
The Group operates a travel tower business in Melbourne which is a supplier to essential services, telecommunications and energy customers. This business has been able to continue trading during the stage 4 restrictions albeit at a reduced volume. The Group operates a business in the Latrobe Valley that has not been materially impacted by the stage 3 restrictions to date with major customers being designated as essential services allowing trading to continue at similar volumes to normal. Project work in the state has also continued under stage 3 restrictions throughout the period.
The impact of these restrictions will be reflected in the Group’s 2021 interim and annual financial statements.
Boom Logistics Annual Report 2020 29

DIRECTORS’ REPORTfor the year ended 30 June 2020
Likely Developments and Expected ResultsThe Directors expect performance to improve with an unprofitable contract completed in FY20 to be replaced with new profitable project work in FY21. The Group expects to grow its revenue and customer base in its core markets and expand its operations into the north west during FY21. The Group also maintains focus on its cost structure leading to improving margins.
The economic conditions created by COVID-19 remain a challenge. There is consequently a degree of uncertainty surrounding the pandemic and its impact. The Directors are vigilant to this and are actively monitoring the situation.
The Directors are cognisant of the requirement to continuously disclose material matters to the market. At this time, other than the matters addressed in this financial report there are no matters sufficiently advanced or at a level of certainty that would require disclosure.
Environmental Regulation and PerformanceThe Board confirms that the Group has adequate systems and processes in place to manage and comply with environmental regulations as they apply to the Group. This includes the National Greenhouse and Energy Reporting Act 2007 which requires the Group to report energy consumption and greenhouse gas emissions for the 12 months ended 30 June 2020 and future periods. There have been no significant known breaches of any environmental regulations to which the Group is subject.
Remuneration Report – AuditedThe Directors of Boom Logistics Limited present the Remuneration Report for the Company and the Group for financial year ended 30 June 2020 (“FY20”). This report outlines the remuneration arrangements in place for non-executive directors (“NEDs”) and the Managing Director and Senior Executives (“Executive KMP”).
Key management personnel (“KMP”) are those persons who, directly or indirectly, have authority and responsibility for planning, directing and controlling the major activities of the Company and Group.
Principles of Remuneration PracticesThe Group’s remuneration practices are designed to maintain alignment with business strategy, shareholder interests and business performance whilst ensuring remuneration is appropriate. The Executive KMP remuneration framework and KMP remuneration is reviewed annually by the Board with the assistance of the Nomination & Remuneration Committee.
In conducting the Executive KMP remuneration review, the following principles are applied:
● Monitoring against external competitiveness, as appropriate using independent market survey data comparing the Group’s remuneration levels against industry peers in terms of comparable job size and responsibility;
● Internal equity, ensuring Executive KMP remuneration across the Group is based upon a clear view of the scope of individual positions and the respective responsibilities;
● A meaningful “at risk” component with entitlement dependent on achieving Group and individual performance targets set by the Board of Directors and aligned to the Group’s strategy; and
● Reward for performance represents a balance of annual and longer term targets.
Nomination and Remuneration CommitteeThe Group is committed to ensuring remuneration is informed by market data and linked to the Group’s strategy and performance. In doing so, the Board of Directors rely on the advice provided by the Nomination and Remuneration Committee including the review and making recommendations:
● With regard to remuneration policies applicable to the Directors, Executive KMP and employees generally;
● In relation to the remuneration of Directors and Executive KMP;
● Of general remuneration principles, including incentive schemes, bonuses and share plans that reward individual and team performance;
● With regard to termination policies and procedures for Directors and Executive KMP;
● In relation to the Group’s superannuation arrangements; and
Boom Logistics Annual Report 202030

● To the Board of Directors for the inclusion of the Remuneration Report in the Group’s annual report.
The Nomination and Remuneration Committee comprises a majority of independent directors. From time to time, the Nomination and Remuneration Committee also draws upon advice and market survey data from external consultants in discharging its responsibilities.
Details of Key Management PersonnelThe tables below set out the KMP and their movements during FY20.
Key Management Personnel (Executive)
Name Title Period as a KMP
Tony Spassopoulos Chief Executive Officer & Managing Director All of FY20
Tim Rogers Chief Financial Officer All of FY20
Malcolm Ross General Counsel & Company Secretary All of FY20
Key Management Personnel (Non-executive Directors)
Committees
Name Positiona AuditNomination & Remuneration
Health, Safety, Environment
& Quality Risk
Maxwell Findlay Chairperson Member Member Member Chairperson
Melanie Allibon Non-executive Director – Chairperson Member Member
Jean-Pierre Buijtels Non-executive Director – Member Member Member
Terrence Francis Non-executive Director Chairperson Member Member Member
Terence Hebiton Non-executive Director Member Member Chairperson Member
a All non-executive directors are independent, except for Jean-Pierre Buijtels who is not independent.
Remuneration Arrangements of Executive Key Management PersonnelIn the normal course of business, remuneration comprises fixed remuneration (fixed annual reward) and variable or “at risk” remuneration incentives. The Group’s remuneration structure for the Executive KMP comprises two main components:
Fixed annual rewardThis element comprises base salary, any fringe benefits (e.g. motor vehicle allowance) and employer contributed superannuation. Executive KMP have scope to vary the components that make up their FAR and can tailor their salary package to suit individual requirements.
a) Salary sacrifice rights plan
Eligible executives will be permitted to salary sacrifice a portion of their pre-tax fixed annual remuneration to acquire equity in the form of rights to fully paid ordinary shares in the Company.
Each right is a right to acquire one ordinary share in the Company. The exact number of rights to be granted is based on the amount of salary sacrificed and the 5 day volume weighted average price prior each month. Rights do not carry any dividend or voting rights. Rights will be granted twice a year following the announcement of the half-year and full-year results or in any event, within twelve months of the Annual General Meeting (“AGM”). Rights will have a twelve month exercise restriction commencing from the relevant grant dates. The rights to ordinary shares equivalent to the amount salary sacrificed in the period from the most recent grant date will be granted following the announcement of the full-year results.
Boom Logistics Annual Report 2020 31

DIRECTORS’ REPORTfor the year ended 30 June 2020
Variable remunerationThe Group has a number of variable remuneration arrangements as follows:
b) Short term incentive plan
Eligible executives will have the opportunity to receive short term incentives subject to meeting performance hurdles over the financial year. 50% of the STIP outcome achieved for the financial year will be delivered in cash and 50% will be delivered in equity in the form of rights to ordinary shares in the Company.
Each right is a right to acquire one ordinary share in the Company. The exact number of rights to be granted is based on 50% of the STIP outcome divided by the 5 day volume weighted average price after the release of full year results. Rights do not carry any dividend or voting rights. Rights will be granted following the announcement of the full-year results or in any event, within twelve months of the AGM. Rights will have a six month exercise restriction commencing from the grant date.
The objectives of this plan are to:
● Focus Executive KMP on key annual business goals and reinforce the link between performance and reward;
● Allow scope to recognise exceptional performance through a sliding scale of reward;
● Encourage teamwork as well as individual performance in meeting annual goals; and
● Align reward with the Group's values.
c) Long term incentive plan
Eligible executives will be granted options to acquire ordinary shares in the Company, subject to performance hurdles and some or all may vest at the end of the three year period if the performance hurdles are met.
Each option is a right to acquire one ordinary share in the Company (or an equivalent cash amount) subject to payment of the exercise price. The exact number of options to be granted will be the LTIP award divided by the option valuation using a Binomial valuation methodology prior to grant date. The option exercise price is calculated based on the 5 day volume weighted average price prior to the grant date. Options do not carry any dividend or voting rights. Options will be granted within twelve months of the Annual General Meeting.
Options are subject to performance hurdles based on three independent measures comprising absolute earnings per share (“EPS”), return on capital employed and key safety performance metrics, which are measured at the end of the three year performance period. The Board of Directors retains a discretion to adjust the performance hurdles as required to ensure plan participants are neither advantaged nor disadvantaged by matters outside management’s control that materially affect the performance hurdles (for example, by excluding one-off non-recurrent items or the impact of significant acquisitions or disposals).
The following table shows the potential annual remuneration packages for Executive KMP during the financial year.
Fixed Variable
Name Title FARSTIP % of FAR
LTIP % of FAR
Tony Spassopoulos Chief Executive Officer & Managing Director 600,000 40% 50%
Tim Rogers Chief Financial Officer 339,433 30% 20%
Malcolm Ross General Counsel & Company Secretary 283,467 20% 20%
Boom Logistics Annual Report 202032

Consequences of Performance on Shareholder WealthIn considering the Group's performance and benefits for shareholder wealth, the Nomination and Remuneration Committee have regard to the following indices in respect of the current and previous financial years.
Name2020
$’0002019
$’0002018
$’0002017
$’0002016
$’000
Net loss attributable to members of Boom Logistics Limited $(16,959) $(5,330) $(1,547) $(22,630) $(30,219)
Dividends paid – – – – –
Share price at financial year end $0.11 $0.15 $0.24 $0.09 $0.08
Earnings per share $(0.04) $(0.01) $(0.00) $(0.05) $(0.06)
Return on capital employed (Trading EBIT/Capital Employed) (1.4%) 1.5% 1.6% (3.7%) (3.4%)
Remuneration ReviewThe review of KMP and general staff remuneration is conducted annually through a formal process.
KMP remuneration is reviewed by the Nomination and Remuneration Committee of the Board of Directors with input from the Chief Executive Officer (“CEO”). Market survey data combined with individual performance appraisals determine recommendations that go to the Board of Directors for approval. This process has historically occurred in June of each year. Due to the on-going market uncertainty, the timing of this process has been changed to September 2020 with any resulting remuneration adjustments from this process to take effect from the beginning of October 2020.
The Nomination and Remuneration Committee has direct responsibility for reviewing CEO performance against targets set by the Board of Directors and recommending to the Board of Directors appropriate adjustments to his remuneration package.
Staff reviews are similarly conducted by the relevant Executives and General Managers, with overview from the CEO.
CEO & Managing Director RemunerationMr. Spassopoulos has an employment contract that has no fixed term. Both the Company and Mr. Spassopoulos are entitled to terminate the employment contract on six month’s written notice, except in the case of serious misconduct or neglect of duty. Contractual arrangements relating to a redundancy event are set out below.
Mr. Spassopoulos’ remuneration package as at 30 June 2020 comprised the following components:
● FAR of $600,000 per annum, inclusive of allowances and superannuation contributions in line with the Superannuation Guarantee legislation. Mr. Spassopoulos’ FAR is reviewed annually effective 1 July each year taking into account the Group's performance, industry and economic conditions and personal performance.
● Mr. Spassopoulos has elected to salary sacrifice 20% of his FAR for rights to ordinary shares in the Company equating to an annual value of $120,000;
● Mr. Spassopoulos nominated that a 10% reduction in salary for the months of April, May and June 2020 should apply in light of the economic impact from the COVID-19 pandemic;
● STIP equivalent to 40% of his FAR upon achievement of performance conditions set by the Board of Directors on an annual basis. 50% of the STIP outcome achieved for the financial year will be delivered in cash and 50% will be delivered in equity in the form of rights to ordinary shares in the Company. The cash payment of any bonus under the STIP will take place after the annual audit of the Group’s financial report which typically occurs in the first half of the following financial year. No STIP is awarded if performance conditions are not met; and
● LTIP equivalent to 50% of his FAR is allocated in options of the Company with performance hurdles based on absolute EPS, return on capital employed and key safety performance metrics measured at the end of the three year performance period subject to shareholder approval at the Company’s Annual General Meeting.
If his employment is terminated on the grounds of redundancy or where a diminution in responsibility occurs, Mr. Spassopoulos will be entitled to receive:
Boom Logistics Annual Report 2020 33

DIRECTORS’ REPORTfor the year ended 30 June 2020
● The lesser of the maximum amount permitted by the Corporations Act and 12 months pay calculated in accordance with his FAR at the date of redundancy or diminution;
● Vested employee entitlements;
● STIP rights that have vested and if not exercised the exercise restrictions will be lifted. Where employment ceased prior to the STIP outcome being determined, the Board of Directors may at its discretion determine a pro-rated STIP based on the proportion of the performance period that has elapsed at the time of cessation. To the extent the relevant performance conditions are satisfied, the STIP award will be paid in cash and no rights will be allocated;
● LTIP options that have vested. Where employment ceased before the options vest, unvested options will continue “on-foot” and will be tested following the end of the original vesting date, and vesting to the extent that the relevant conditions have been satisfied (ignoring any service related conditions);
● In the event a termination payment is made, no payment in lieu of notice will be made.
The Board of Directors also have a broader discretion to apply any other treatment that it deems appropriate in the circumstances.
In the event that Mr. Spassopoulos was to be summarily dismissed, he would be paid for the period served prior to dismissal and any accrued leave entitlements. Mr. Spassopoulos would not be entitled to the payment of any bonus under the STIP or LTIP.
Mr. Spassopoulos is subject to restrictive covenants upon cessation of his employment for a maximum period of one year.
Other Executive KMP (standard contracts)All other Executive KMP have contracts with no fixed term. Either the Company or the Executive KMP may terminate the Executive KMP employment agreement by providing three months written notice or providing payment in lieu of the notice period (based upon the fixed component of the Executive KMP remuneration). If employment is terminated on the grounds of redundancy, in addition to the notice period, all other Executive KMP will be entitled to receive up to 12 months pay calculated in accordance with their FAR.
On termination by notice of the Company or the Executive KMP, any STIP and LTIP that have vested will be awarded. Where employment ceased prior to the STIP outcome being determined or LTIP options vest, the treatment will be the same as that disclosed in the CEO & Managing Director Remuneration section above.
The Company may terminate the contract at any time without notice if serious misconduct has occurred. Where termination with cause occurs, the Executive KMP is only entitled to that proportion of remuneration that is fixed, and only up to the date of termination. On termination with cause, any unvested STIP rights and LTIP shares or options will lapse.
Similar to the CEO, all other Executive KMP agreed to a 10% reduction in salary for the months of April, May and June 2020 in light of the economic impact from the COVID-19 pandemic.
Boom Logistics Annual Report 202034

Tota
l Rem
uner
atio
n of
Exe
cuti
ve K
MP
Det
ails
of
the
cost
to
the
Gro
up re
lati
ng t
o Ex
ecut
ive
KM
P re
mun
erat
ion
for t
he y
ear e
nded
30
June
202
0 ar
e se
t ou
t be
low
.
Shor
t Te
rmP
ost
Empl
oym
ent
Shar
e-ba
sed
Pay
men
tsb
Long
Ter
mTo
tal
Empl
oyee
B
enefi
ts
Expe
nse
Tota
l P
erfo
rman
ce
Rel
ated
Cash
Sal
ary
Cash
Bon
usO
ther
a
Supe
r-an
nuat
ion
Sala
ry
sacr
ifice
d ri
ghts
STIP
righ
tsc
LTIP
opt
ions
Ann
ual &
lo
ng s
ervi
ce
leav
ed
Exec
utiv
es
Tony
Spa
ssop
oulo
s (C
hief
Exe
cuti
ve O
ffice
r & M
anag
ing
Dire
ctor
)
2020
408
,817
2
5,00
0 2
7,82
7 2
5,00
0 1
20,0
00
25,
000
38,
404
(19,
148)
650
,900
13
.6%
2019
421
,539
2
4,00
0 2
7,827
2
5,00
0 10
5,00
0 2
4,00
0 7,
510
33,
276
668
,152
8.3%
Tim
Rog
ers
(Chi
ef F
inan
cial
Offi
cer)
2020
261
,041
2
2,91
1 1
2,26
2 2
5,00
0 3
3,27
0 2
2,91
2 (5
,305
) 2
0,52
1 3
92,6
12
10.3
%
2019
262
,321
6
,465
5
,065
2
5,00
0 3
0,88
4 6
,465
(9
,981
) (5
,805
) 3
20,4
14
0.9%
Mal
colm
Ros
s (G
ener
al C
ouns
el a
nd C
ompa
ny S
ecre
tary
)
2020
232
,003
9
,921
1
9,50
3 2
4,93
9 –
9
,922
(5
,460
) (1
2,69
5) 2
78,1
33
5.2%
2019
247
,367
11
,009
3
,001
2
4,71
4 –
11
,009
(9
,364
) 6
,591
2
94,3
27
4.3%
Tota
l Rem
uner
atio
n: E
xecu
tive
s
2020
901
,861
5
7,83
2 5
9,59
2 7
4,93
9 1
53,2
70
57,
834
27,
639
(11,
322)
1,3
21,6
45
–
2019
931
,227
4
1,474
3
5,89
3 7
4,71
4 13
5,88
4 4
1,474
(1
1,835
) 3
4,06
2 1,
282,
893
–
a
Oth
er re
pres
ents
mot
or v
ehic
le a
llow
ance
and
nov
ated
leas
e pa
ymen
ts.
b
Shar
e-ba
sed
paym
ents
repr
esen
t a
com
bina
tion
of
right
s, s
hare
s an
d op
tion
s in
Boo
m L
ogis
tics
Lim
ited
gra
nted
und
er t
he re
mun
erat
ion
stru
ctur
es. O
nly
the
expe
nse
rela
ting
to
the
perio
d ha
s be
en
reco
gnis
ed in
acc
orda
nce
wit
h th
e ac
coun
ting
pol
icy
disc
lose
d in
not
e 18
.
c
Rig
hts
awar
ded
as p
art
of t
he S
TIP
are
expe
cted
to
be g
rant
ed a
fter
the
ann
ounc
emen
t of
the
ful
l yea
r res
ults
and
not
late
r tha
n 31
Aug
ust.
d
Long
ter
m a
nnua
l lea
ve a
nd lo
ng s
ervi
ce le
ave
amou
nts
repr
esen
t th
e ne
t m
ovem
ent
in b
alan
ce s
heet
leav
e pr
ovis
ions
reco
gnis
ed in
the
sta
tem
ent
of c
ompr
ehen
sive
inco
me
durin
g th
e fi
nanc
ial y
ear.
Boom Logistics Annual Report 2020 35

DIRECTORS’ REPORTfor the year ended 30 June 2020
Non-executive Director FeesNon-executive Director fees are determined by reference to external survey data, taking account of the Group’s relative size and business complexity. No additional payments are made for serving on Board Committees. In addition, non-executive Directors have no entitlement to STIP, no equity incentives are offered and no retirement benefits are payable. The maximum aggregate sum for non-executive Director remuneration of $400,000 was approved by shareholders at the 2004 Annual General Meeting. There has been no increase to the NED fee pool since 2004.
The non-executive Directors agreed to a 20% reduction in fees for the months of April, May and June 2020 in light of the economic impact from the COVID-19 pandemic.
Details of non-executive Directors’ remuneration for the year ended 30 June 2020 are as follows:
Short TermPost
EmploymentShare-based
Payments Long Term
TotalSalary & Fees Cash Bonus OtherSuper-
annuation All
Annual & long service
leaved
Non-Executive Directors
Maxwell Findlay
2020 123,500 – – 11,733 – – 135,233
2019 128,750 – – 12,231 – – 140,981
Melanie Allibon
2020 61,780 – – 5,869 – – 67,649
2019 2,137 – – 203 – – 2,340
Jean-Pierre Buijtelsa
Terrence Francis
2020 61,750 – – 5,866 – – 67,616
2019 64,375 – – 6,116 – – 70,491
Terence Hebiton
2020 61,750 – – 5,866 – – 67,616
2019 64,375 – – 6,116 – – 70,491
Total Remuneration: Non-Executive Directors
2020 308,780 – – 29,334 – – 338,114
2019 259,637 – – 24,666 – – 284,303
Total Remuneration: Non-Executive Directors and Executives – Group
2020 1,210,641 57,832 59,592 104,273 238,743 (11,322) 1,659,759
2019 1,190,864 41,474 35,893 99,380 165,523 34,062 1,567,196
a Jean-Pierre Buijtels is not paid a Director’s fee. Instead, the Company pays for his travel and accommodation costs whilst attending Board of Director and committee meetings in Australia up to a maximum of $65,700 per financial year.
Boom Logistics Annual Report 202036

Equity Instruments Held by KMPSummary of equity instruments held by KMP at reporting date are as follows:
Name Shares SSRP Rights STIP Rights LTIP Options
Max Findlay 250,000 – – –
Tony Spassopoulos 1,500,000 1,221,827 469,931 11,505,377
Melanie Allibon 100,000 – – –
Jean-Pierre Buijtels – – – –
Terrence Francis 185,745 – – –
Terence Hebiton 547,995 – – –
Tim Rogers – 605,812 230,158 2,551,394
Malcolm Ross – – 255,808 2,147,630
Shareholdings of Directors and Executive KMP
Ordinary shares held in Boom Logistics Limited (number)
30 June 2020Balance at
Start of YearNet Changes
Other (i)Balance at
End of Year
Non-executive & Executive Directors
Maxwell Findlay 250,000 – 250,000
Tony Spassopoulos 1,500,000 – 1,500,000
Melanie Allibon – 100,000 100,000
Jean-Pierre Buijtelsa – – –
Terrence Francis (ii) 185,745 – 185,745
Terence Hebiton 547,995 – 547,995
Executives
Tim Rogers – – –
Malcolm Ross – – –
Total 2,483,740 100,000 2,583,740
(i) These amounts represent ordinary shares purchased or sold directly or indirectly by the directors and executives during the financial year. These transactions have no connection with their roles and responsibilities as employees of the Group.
(ii) Includes shares held under a nominee or a related party.
a Mr. Buijtels is employed by Rorema Beheer B.V., the fund manager (the Fund Manager) of the fund Gran Fondo Capital (the Fund) which holds 35,380,342 shares in Boom Logistics Limited (the Company). Mr. Buijtels' remuneration is partly linked to the performance of the Fund, which is influenced by the performance of the shares of the Company as long as the Fund holds shares in the Company. Mr. Buijtels holds a minority economic interest of less than 5% of the units of the Fund and thereby indirectly an economic interest in the Company as long as the Fund holds shares in the Company. The Fund is open-ended and Mr. Buijtels can redeem his units in the Fund against their net asset value minus redemption fee at each transaction day of the Fund. Mr. Buijtels is not a director of the Fund Manager, and does not have the power to exercise votes, control the exercise of votes, dispose of or control the disposal of the Fund's shares in the Company. However, he can influence the decision-making process of the director of the Fund Manager in his capacity as its portfolio manager.
Boom Logistics Annual Report 2020 37

DIRECTORS’ REPORTfor the year ended 30 June 2020
SSRP Outcomes of the Executive KMPThe following table shows the rights to ordinary shares granted to Executive KMP during the financial year under the salary sacrifice rights plan.
Name Year Grant DateGrant
Number
Fair Value per Right at
Grant Date Exercise Date Expiry Date
Value of Rights
Granted during the
Year
Tony Spassopoulos 2020 26 Feb 20 415,134 $0.1445 26 Feb 21 26 Feb 30 $60,000
2019 23 Aug 19 379,531 $0.1581 23 Aug 20 23 Aug 29 $60,000
Tim Rogers 2020 26 Feb 20 114,933 $0.1442 26 Feb 21 26 Feb 30 $16,568
2019 23 Aug 19 102,242 $0.1581 23 Aug 20 23 Aug 29 $16,163
SSRP rights are granted twice per annum during the trading window following the release of the half-year and full year results. Amounts are salary sacrificed monthly and are held until granting of rights during a trading window.
Rights to ordinary shares (number)
30 June 2020 Grant DateTony
Spassopoulos Tim Rogers Total
Salary Sacrifice Rights
Balance at start of year 427,162 388,637 815,799
Granted during year: 26 Feb 20 415,134 114,933 530,067
23 Aug 19 379,531 102,242 481,773
Balance at end of year 1,221,827 605,812 1,827,639
Number of rights not yet granted 410,575 116,136 526,711
Number of rights not yet granted shows the potential rights to ordinary shares equivalent to the amount of salary sacrificed to 30 June 2020 since the most recent granting of rights under the salary sacrifice rights plan on 26 February 2020.
Determining the STIP Outcomes of the Executive KMPFor the FY2019 STIP, the following table shows the rights to ordinary shares granted to Executive KMP during the year.
Name Year Grant DateGrant
Number
Fair Value per Right at
Grant Date Exercise Date Expiry Date
Value of Rights
Granted during the
Year
Tony Spassopoulos 2019 13 Sep 19 153,873 $0.1560 13 Mar 20 13 Sep 29 $24,000
Tim Rogers 2019 13 Sep 19 41,449 $0.1560 13 Mar 20 13 Sep 29 $6,465
Malcolm Ross 2019 13 Sep 19 70,576 $0.1560 13 Mar 20 13 Sep 29 $11,008
For the FY2020 STIP, the Nomination and Remuneration Committee conducted a review of the Executive KMP performance against their set targets which resulted in the following potential maximum STIP being awarded to the Executive KMP. The STIP will be settled 50% in cash and 50% in rights to ordinary shares in the Company after the announcement of the full year results and approval by the Board of Directors.
Boom Logistics Annual Report 202038

Name Title
Maximum STIP
$Weightinga
%
Settled in Cash
$
Settled in Rights
$Total Cost
$
Tony Spassopoulos Chief Executive Officer & Managing Director
240,000 20.8% 25,000 25,000 50,000
Tim Rogers Chief Financial Officer 101,830 45.0% 22,911 22,912 45,823
Malcolm Ross General Counsel & Company Secretary
56,693 35.0% 9,921 9,922 19,843
a Weighting represents the percentage of total STIP entitlement awarded to Executive KMPs based on their financial, safety and individual performance targets.
Rights to ordinary shares (number)
30 June 2020 Grant DateTony
Spassopoulos Tim Rogers Malcolm Ross Total
STIP Rights
Balance at start of year 316,058 188,709 185,232 689,999
Granted during year: 13 Sep 19 153,873 41,449 70,576 265,898
Balance at end of year 469,931 230,158 255,808 955,897
Determining the LTIP Outcomes of the Executive KMPSet out below are options granted to the Executive KMP under the LTIP during the year including those granted in previous years that have not yet vested.
Name YearGrant Date
Grant Number
Vesting Date
Fair Value per
Option at Grant
DateExercise
PriceExercise
DateVesting
Benchmark
Value of Options Granted
during the Year
Tony Spassopoulos 2020 29 Nov 19 6,666,667 31 Aug 22 $0.0450 $0.145 30 Sep 22 (i) $300,000
2019 28 Nov 18 4,838,710 31 Aug 21 $0.0620 $0.164 30 Sep 21 EPS > $0.03 $300,000
Tim Rogers 2020 29 Nov 19 1,508,591 31 Aug 22 $0.0450 $0.145 30 Sep 22 (i) $67,887
2019 28 Nov 18 1,042,803 31 Aug 21 $0.0620 $0.164 30 Sep 21 EPS > $0.03 $64,654
Malcolm Ross 2020 29 Nov 19 1,259,853 31 Aug 22 $0.0450 $0.145 30 Sep 22 (i) $56,693
2019 28 Nov 18 887,777 31 Aug 21 $0.0620 $0.164 30 Sep 21 EPS > $0.03 $55,042
(i) The 2020 LTIP vesting benchmark consists of three independent vesting hurdles, each of which is measured at the end of the three year performance period being 30 June 2022. The three performance hurdles are Earnings per Share of $0.04 or more (50% of eligible options), Return on Capital Employed of 10% (25% of eligible options), Safety Performance: LTIFR < 1 and SAOFR > 4,500 (25% of eligible options).
Boom Logistics Annual Report 2020 39

DIRECTORS’ REPORTfor the year ended 30 June 2020
The FY2018 options allocated to the Executive KMP did not vest as their vesting conditions were not met. In accordance with the LTIP rules, the FY2018 options were treated as lapsed at reporting date.
Options held in Boom Logistics Limited (number)
30 June 2020 Grant Date
Balance at Start of Year
Unvested Granted Lapsed
Balance at End of Year
Unvested
Tony Spassopoulos 29 Nov 19 – 6,666,667 – 6,666,667
28 Nov 18 4,838,710 – – 4,838,710
30 Nov 17 1,979,421 – (1,979,421) –
6,818,131 6,666,667 (1,979,421) 11,505,377
Tim Rogers 29 Nov 19 – 1,508,591 – 1,508,591
28 Nov 18 1,042,803 – – 1,042,803
30 Nov 17 871,346 – (871,346) –
1,914,149 1,508,591 (871,346) 2,551,394
Malcolm Ross 29 Nov 19 – 1,259,853 – 1,259,853
28 Nov 18 887,777 – – 887,777
30 Nov 17 763,414 – (763,414) –
1,651,191 1,259,853 (763,414) 2,147,630
Total 10,383,471 9,435,111 (3,614,181) 16,204,401
Share Trading PolicyThe Group Securities Trading Policy applies to all NEDs and Executive KMP. The policy prohibits KMP from dealing in the Company securities while in possession of material non-public information relevant to the Group.
Boom Logistics Annual Report 202040

Lead Auditor's Independence Declaration to the DirectorsThe auditor's independence declaration is set out on page 42 and forms part of the directors' report for the financial year ended 30 June 2020.
Non-audit ServicesThe following non-audit services were provided by KPMG Australia, the Company's auditor. The Directors are satisfied that the provision of non-audit services is compatible with the general standard of independence for auditors imposed by the Corporations Act 2001. The nature and scope of each type of non-audit service provided means that auditor independence was not compromised.
KPMG Australia received or are due to receive the following amounts for the provision of non-audit services:
Non-audit Services
Taxation services $50,848
Other assurance services $46,575
Total remuneration for non-audit services $97,423
Proceedings on the Behalf of the CompanyNo person has applied to the Court under section 237 of the Corporations Act 2001 for leave to bring proceedings on behalf of the Company, or to intervene in any proceedings to which the Company is a party, for the purpose of taking responsibility on behalf of the Company for all or part of those proceedings.
No proceedings have been brought or intervened in on behalf of the Company with leave of the Court under section 237 of the Corporations Act 2001.
RoundingThe amounts contained in this report and in the financial report are presented in Australian dollars and have been rounded to the nearest $1,000 (where rounding is applicable) under the option available under ASIC Corporations Instrument 2016/191. The Group is of a kind to which the Corporations Instrument applies.
Signed in accordance with a resolution of the Directors.
Maxwell Findlay Tony Spassopoulos Chairperson Managing Director
Melbourne, 27 August 2020
Boom Logistics Annual Report 2020 41

LEAD AUDITOR’S INDEPENDENCE DECLARATIONfor the year ended 30 June 2020
Boom Logistics Annual Report 202042

CONSOLIDATED STATEMENT OF COMPREHENSIVE INCOMEfor the year ended 30 June 2020
Note2020
$’0002019^ $’000
Revenue 2 185,535 182,722
Other income 3(a) 533 4,242
Salaries and employee benefits expense (98,013) (96,579)
Equipment service and supplies expense 3(b) (46,405) (44,446)
Operating lease expense (1,033) (11,972)
Other expenses 3(b) (14,134) (15,159)
Restructuring expense (718) (1,117)
Depreciation and amortisation expense 7 (16,515) (17,340)
Depreciation expense – Right-of-use assets 22 (15,392) –
Impairment expense 8,22 (1,902) (1,975)
Loss before financing expense and income tax (8,044) (1,624)
Financing expense 11(e) (2,835) (3,706)
Financing expense – Lease liabilities 22 (1,633) –
Loss before income tax (12,512) (5,330)
Income tax expense 4(a) (4,447) –
Net loss attributable to members of Boom Logistics Limited (16,959) (5,330)
Other comprehensive loss
Items that may be reclassified subsequently to profit or loss
Cash flow hedges recognised in equity, net of tax (86) (17)
Other comprehensive loss for the year, net of tax (86) (17)
Total comprehensive loss for the year attributable to members of Boom Logistics Limited (17,045) (5,347)
Basic losses per share (cents per share) 5 (3.9) (1.2)
Diluted losses per share (cents per share) 5 (3.9) (1.2)
^ T he Group has initially applied AASB 16 Leases at 1 July 2019 using the modified retrospective (option 2) approach. Under this approach, comparative information is not restated (refer to note 22).
The accompanying notes form an integral part of the Consolidated Statement of Comprehensive Income.
Boom Logistics Annual Report 2020 43

CONSOLIDATED STATEMENT OF FINANCIAL POSITIONas at 30 June 2020
Note2020
$’0002019^ $’000
CURRENT ASSETS
Cash and cash equivalents 2,131 1,450
Trade receivables, contract assets and other receivables 34,552 35,524
Inventories, prepayments and other current assets 3,486 5,282
Assets classified as held for sale 7 3,136 250
Income tax receivable – 4,450
Lease receivables 22 1,176 –
TOTAL CURRENT ASSETS 44,481 46,956
NON-CURRENT ASSETS
Property, plant and equipment 7 124,196 152,079
Right-of-use assets 22 22,788 –
Lease receivables 22 437 –
Deferred tax asset 4(b) 67 28
TOTAL NON-CURRENT ASSETS 147,488 152,107
TOTAL ASSETS 191,969 199,063
CURRENT LIABILITIES
Trade and other payables 11,952 13,868
Interest bearing loans and borrowings 11 4,309 5,167
Lease liabilities 22 11,592 –
Employee provisions 8,461 8,147
Other provisions and liabilities 10 7,526 4,539
Derivative financial instruments 184 –
Income tax payable 4(c) 4,447 –
TOTAL CURRENT LIABILITIES 48,471 31,721
NON-CURRENT LIABILITIES
Interest bearing loans and borrowings 11 14,166 32,709
Lease liabilities 22 11,531 –
Employee provisions 395 307
Other provisions and liabilities 10 2,083 344
Derivative financial instruments 49 110
TOTAL NON-CURRENT LIABILITIES 28,224 33,470
TOTAL LIABILITIES 76,695 65,191
NET ASSETS 115,274 133,872
EQUITY
Contributed equity 13(a) 310,327 312,057
Retained losses (197,560) (180,601)
Reserves 2,507 2,416
TOTAL EQUITY 115,274 133,872
^ The Group has initially applied AASB 16 Leases at 1 July 2019 using the modified retrospective (option 2) approach. Under this approach, comparative information is not restated (refer to note 22).
The accompanying notes form an integral part of the Consolidated Statement of Financial Position.
Boom Logistics Annual Report 202044

CONSOLIDATED STATEMENT OF CASH FLOWSfor the year ended 30 June 2020
Note2020
$’0002019^ $’000
Cash flows from operating activities
Receipts from customers 205,898 203,836
Payments to suppliers and employees (177,385) (187,269)
Interest paid (2,692) (3,333)
Interest paid – Lease liabilities 22 (1,633) –
Interest received 7 11
Interest received – Lease receivables 22 110 –
Income tax received 4,450 –
Net cash provided by operating activities 9 28,755 13,245
Cash flows from investing activities
Purchase of property, plant and equipment (2,190) (10,765)
Proceeds from the sale of property, plant and equipment 4,610 6,346
Net cash provided by / (used in) investing activities 2,420 (4,419)
Cash flows from financing activities
Payments for shares bought back (1,726) (5,978)
Proceeds from borrowings – 14,135
Repayment of borrowings (15,923) (16,959)
Repayment of borrowings – Lease liabilities (13,817) –
Receipts from finance leases as lessor 22 978 –
Payment of transaction costs related to share buy-back and borrowings (6) (244)
Net cash (used in) financing activities (30,494) (9,046)
Net increase / (decrease) in cash and cash equivalents 681 (220)
Cash and cash equivalents at the beginning of the period 1,450 1,670
Cash and cash equivalents at the end of the period 2,131 1,450
^ The Group has initially applied AASB 16 Leases at 1 July 2019 using the modified retrospective (option 2) approach. Under this approach, comparative information is not restated (refer to note 22).
The accompanying notes form an integral part of the Consolidated Statement of Cash Flows.
Boom Logistics Annual Report 2020 45

CONSOLIDATED STATEMENT OF CHANGES IN EQUITYfor the year ended 30 June 2020
Note
Contributed Equity $’000
Retained Losses $’000
Cash Flow Hedge
Reserve $’000
Employee Equity
Benefits Reserve
$’000Total Equity
$’000
At 1 July 2018 as originally presented 318,065 (174,871) (60) 2,056 145,190
Adjustment on initial application of AASB 9 – (400) – – (400)
Adjusted balance at 1 July 2018 318,065 (175,271) (60) 2,056 144,790
Loss for the year – (5,330) – – (5,330)
Other comprehensive loss – – (17) – (17)
Total comprehensive loss – (5,330) (17) – (5,347)
Transactions with owners in their capacity as owners:
Cost of share based payments 18(b) – – – 437 437
Share buy-back including transaction costs and net of tax (6,008) – – – (6,008)
At 30 June 2019^ 312,057 (180,601) (77) 2,493 133,872
Loss for the year – (16,959) – – (16,959)
Other comprehensive loss – – (86) – (86)
Total comprehensive loss – (16,959) (86) – (17,045)
Transactions with owners in their capacity as owners:
Cost of share based payments 18(b) – – – 177 177
Share buy-back including transaction costs and net of tax 13(a) (1,730) – – – (1,730)
At 30 June 2020 310,327 (197,560) (163) 2,670 115,274
^ T he Group has initially applied AASB 16 Leases at 1 July 2019 using the modified retrospective (option 2) approach. Under this approach, comparative information is not restated (refer to note 22).
The accompanying notes form an integral part of the Consolidated Statement of Changes in Equity.
Boom Logistics Annual Report 202046

NOTES TO THE CONSOLIDATED FINANCIAL STATEMENTSfor the year ended 30 June 2020
About This ReportThe financial report of Boom Logistics Limited and its subsidiaries (“the Group”) for the year ended 30 June 2020 was authorised for issue in accordance with a resolution of the Board of Directors on 27 August 2020.
Boom Logistics Limited is a company domiciled in Australia and limited by shares incorporated in Australia whose shares are publicly traded on the Australian Stock Exchange.
The Group is a for-profit entity and the nature of its operations and principal activities are described in note 1.
The financial report is a general purpose financial report which has been prepared in accordance with Australian Accounting Standards (AASBs) adopted by the Australian Accounting Standards Board (AASB) and the Corporations Act 2001. The consolidated financial report complies with International Financial Reporting Standards (IFRSs) and interpretations adopted by the International Accounting Standards Board (IASB).
The financial report has been prepared in accordance with the historical cost convention rounded to the nearest thousand dollars ($'000) in accordance with ASIC Corporations Instrument 2016/191 unless otherwise stated, except for derivative financial instruments which are measured at fair value. The financial report is presented in Australian dollars which is the Company's functional currency.
Boom’s Directors have included information in this report that they deem to be material and relevant to the understanding of the financial report. Disclosure may be considered material and relevant if the dollar amount is significant due to size or nature, or the information is important to understand the:
● Group’s current year results;
● impact of significant changes in Boom’s business; or
● aspects of the Group’s operations that are important to future performance.
Disclosure of information that is not material may undermine the usefulness of the financial report by obscuring important information.
COVID-19 Impact on the GroupThe spread of the novel coronavirus (COVID-19) was declared a public health emergency by the World Health Organisation on 31 January 2020 and upgraded to a Global Pandemic on 11 March 2020. The Australian Federal Government enacted its emergency plan on 29 February 2020 which saw the closure of Australian borders from 20 March 2020.
The speed of development of the situation and the unprecedented global reach of the emergency has created a significant level of uncertainty. The Group noted in its Half Year Report ASX Release dated 26 February 2020 that the impact of recent events relating to the coronavirus remain uncertain and that delays to projects and disruptions to supply chains were a possibility. Since that date the Group has continued to respond quickly to the emerging COVID-19 pandemic in line with advice from the Federal Government and World Health Organisation.
The Group derives the majority of its revenue from the following sectors: mining and resources; infrastructure and construction; industrial maintenance; wind, energy and utilities; and telecommunications which are designated as essential services and have continued to operate. The composition of Boom’s customer base and the geographical spread of the Group’s operations has helped to minimise the impact of the virus on Group revenues. The Group’s Melbourne travel tower business is a supplier to essential services, telecommunications and utility customers, and is able to continue trading during the stage 4 restriction imposed on businesses in the Melbourne metropolitan area from 5 August 2020.
The Group has worked closely with customers to ensure that all health requirements were met. Operating cash flow has remained solid through the period.
The Group was quick to implement a number of initiatives to safeguard the health of our employees, customers and suppliers including introducing a travel ban for all staff in March, introducing strict cleaning processes for office space and equipment, established social distancing protocols and introduced thermal scanning and temperature checks at depots.
The Group was also proactive around measures to preserve cash during the period of uncertainty:
● Additional cost controls were introduced across the business to minimise discretionary expenditure;
● Major suppliers were approached to extend credit terms;
● Financiers were approached to defer some equipment rental payments;
Boom Logistics Annual Report 2020 47

NOTES TO THE CONSOLIDATED FINANCIAL STATEMENTSfor the year ended 30 June 2020
● State payroll tax payments in the both New South Wales and Queensland were deferred in line with the support package offered by the State Governments;
● Job-keeper payments were accessed by the Group’s labour hire business in May and June 2020, providing a contribution of approximately $400k (and $200k cash) in the period. This income has been presented net of the relevant expense in the financial statements;
● Employees were required to take leave during the last quarter; and
● The Executive and Board reduced their remuneration during the last quarter.
The above measures contributed circa $1.6 million of operating cash that was deferred in FY20 and is required to be paid over the first seven months of FY21. A further $0.6 million of equipment rental payments were deferred with the rental contracts being extended for an additional three month term.
The Group also elected to crystallise the historic franking deficit that it has carried for a number of years. A payment plan was negotiated with the ATO to progressively repay the $4.5 million franking deficit tax liability over a period of twenty four months. Historically this amount would be prepaid in June and refunded on lodgement of the Group’s income tax return around November each year. Consequently the cash flow at 30 June 2020 benefitted from an additional $4.5m being the tax refund received in November 2019 that will now be repaid in interest free instalments over a twenty four month period.
Boom also made the difficult decision to defer its 0.5 cent dividend (cash cost of $2.1 million) that was to be paid in April 2020 to 2 October 2020.
COVID-19 has had the following broad impacts to the operations of the business in the period:
● Social distancing protocols required at customer sites resulted in the cancellation, delay or reduction in scope of several shutdown programs over the last quarter. Staffing levels and activity at some customer sites was reduced where social distancing could not be effectively maintained with normal crew numbers e.g. Esso offshore contract;
● Border closures restricted the use of fly in fly out workers. This was particularly relevant for the operation of the Group’s Olympic Dam contract in South Australia that relies on a large inter-state work force. These restriction limited the number of people available on site over the last quarter;
● Travel restrictions within Western Australia delayed the Group’s planned expansion of operations into the
north-west of the State. The Group is on track to begin execution on this expansion in the first quarter of FY21;
● Projects were delayed as a result of customer supply chain concerns and economic uncertainty. In particular a wind farm construction project and a number of civil infrastructure projects that the Group expected to win were delayed in the last quarter.
The uncertainty in outlook for projects persists. However the Group has been successful in mitigating this by securing work for one of its major project cranes with supporting assets on a wind farm project over the first half FY21 and has secured a contract to support work on the Snowy 2.0 project commencing in August 2020.
Going concern considerationsThe uncertain economic conditions have not materially impacted the Group’s assessment of going concern. The Group has diverse operations across all states providing a recurring revenue base largely in industries that have been designated as essential services and able to operate throughout the government restrictions.
The Group is not critically exposed to operations to any one location or any one customer or customer site. Furthermore the Group operates mobile assets that are transferable for project work across locations further mitigating geographical impacts of future virus outbreaks.
At 30 June 2020 the Group has net debt of under $20 million, low gearing at 17% (net debt to equity) and significant undrawn and immediately available bank facilities. The Group’s core debt facilities retain tenure, expiring in January 2022, and provide sufficient liquidity to fund the Group over the next 12 months with significant headroom.
As noted above the Group has deferred circa $1.6 million of operating cash payments from FY20 that will be paid over the first seven months of FY21. These deferrals are fully factored in to the cash flow projections and are offset by the circa $3 million proceeds expected from asset sales over the same period.
With the non-repeat of the loss making Cattle Hill project in FY20, the Group is forecasting improved profitability in FY21 and continued surplus operating cash flow. Furthermore the uncertainty created by COVID-19 to project timing has been mitigated to a large part by the Group securing long term contracted project work to supplement its recurring mining maintenance revenues:
● Work secured on a Victorian wind farm on a schedule of rates for the first half of FY21;
● Work commenced in August 2020 on the Snowy 2.0 project;
COVID-19 Impact on the Group (continued)
Boom Logistics Annual Report 202048

● Work on the Parramatta Light Rail project secured to commence in the first quarter of FY21;
● Work on a power transmission line project in WA commenced in August 2020.
The Group has demonstrated its ability to generate solid operating cash flows throughout the COVID-19 situation and has been quick to act to changing conditions. The Group
has forecast cash flows and bank covenant compliance for a period of 12 months from the date of this report which show surplus liquidity and a continued ability to operate as a going concern under a number of scenarios.
The directors believe that it remains appropriate to prepare the financial statements on a going concern basis.
Section A: Financial PerformanceThis section provides the information that is most relevant to understanding the financial performance of the Group during the financial year.
1. Segment Reporting
Description of operating segmentsManagement has determined the operating segments based on the reports reviewed by the Chief Operating Decision Maker (“CODM”) to make decisions about resource allocation and to assess performance. The CODM who is responsible for allocating resources and assessing performance of the operating segments is the Managing Director and CEO.
The business is considered from a product perspective and has two reportable segments:
● “Lifting Solutions”, which consists of all lifting activities including the provision of cranes, travel towers, access equipment and all associated services; and
● “Labour Hire”, which includes the provision of skilled labour with a wide range of trades, such as, electricians, boiler makers, mechanics, plus the traditional crane and travel tower operators, riggers, truck drivers.
The segment information provided to the CODM is measured in a manner consistent with that of the financial statements.
All inter-segment sales are carried out at arm’s length prices.
Segment information
Year ended 30 June 2020 Note
Lifting Solutions
$’000
Labour Services
$’000Other*
$’000Elimination
$’000Consolidated
$’000
Segment revenue
Total external revenue 184,380 1,155 – – 185,535
Inter-segment revenue – 23,585 – (23,585) –
Total segment revenue 184,380 24,740 – (23,585) 185,535
Other income 3(a) 533
Total revenue and other income 186,068
Segment result
Operating result 30,259 1,281 (5,590) – 25,950
Net profit on disposal of property, plant and equipment 416 – – – 416
Depreciation and amortisation (30,999) (53) (855) – (31,907)
Restructuring expense (305) (2) (411) – (718)
Impairment of right-of-use assets (75) – – – (75)
Impairment of assets classified as held for sale (1,827) – – – (1,827)
(Loss) / profit before net interest and tax (2,531) 1,226 (6,856) – (8,161)
Boom Logistics Annual Report 2020 49

NOTES TO THE CONSOLIDATED FINANCIAL STATEMENTSfor the year ended 30 June 2020
Year ended 30 June 2020 Note
Lifting Solutions
$’000
Labour Services
$’000Other*
$’000Elimination
$’000Consolidated
$’000
Net interest (4,303) (7) (41) – (4,351)
Income tax expense (4,447)
Loss from continuing operations (16,959)
Segment assets and liabilities
Segment assets 187,737 2,157 3,715 (1,640) 191,969
Segment liabilities 71,389 1,003 4,303 – 76,695
Additions to non-current assets 1,390 90 67 – 1,547
Year ended 30 June 2019 Note
Lifting Solutions
$’000
Labour Services
$’000Other*
$’000Elimination
$’000Consolidated
$’000
Segment revenue
Total external revenue 180,516 2,206 – – 182,722
Inter-segment revenue – 22,543 – (22,543) –
Total segment revenue 180,516 24,749 – (22,543) 182,722
Other income 3(a) 4,242
Total revenue and other income 186,964
Segment result
Operating result 26,669 1,076 (6,263) – 21,482
Net loss on disposal of property, plant and equipment (2,010) – – – (2,010)
Depreciation and amortisation (16,771) (8) (561) – (17,340)
Restructuring expense (1,117) – – – (1,117)
Employee benefit expense – retirement provision – – (675) – (675)
Impairment of property, plant and equipment (1,975) – – – (1,975)
(Loss) / profit before net interest and tax 4,796 1,068 (7,499) – (1,635)
Net interest (3,695)
Income tax expense –
Loss from continuing operations (5,330)
Segment assets and liabilities
Segment assets 191,159 1,949 7,704 (1,749) 199,063
Segment liabilities 58,492 928 5,771 – 65,191
Additions to non-current assets 12,461 – 464 – 12,925
* Other represents centralised costs including national office and shared services.
Section A: Financial Performance (continued)1. Segment Reporting (continued)
Boom Logistics Annual Report 202050

2. Revenue from Contracts with Customers
(a) Disaggregation of revenue from contracts with customersBoom Logistics Limited is domiciled in Australia and all core revenue is derived from customers within Australia. The Group derives revenue from the transfer of services over time in the following industry segments:
Industry segment
Year ended 30 June 2020 Note
Lifting Solutions
$’000
Labour Services
$’000Consolidated
$’000
Mining & resources (i) 86,466 38 86,504
Wind, energy, & utilities 48,368 17 48,385
Infrastructure & construction 17,928 309 18,237
Industrial maintenance 18,732 656 19,388
Telecommunications 11,817 – 11,817
Other 1,069 135 1,204
Total revenue from contracts with customers 184,380 1,155 185,535
Timing of revenue recognition
Services transferred over time 184,380 1,155 185,535
Year ended 30 June 2019 Note
Lifting Solutions
$’000
Labour Services
$’000Consolidated
$’000
Mining & resources 87,333 44 87,377
Wind, energy, & utilities 34,161 – 34,161
Infrastructure & construction 23,822 951 24,773
Industrial maintenance 20,896 1,200 22,096
Telecommunications 13,176 – 13,176
Other 1,128 11 1,139
Total revenue from contracts with customers 180,516 2,206 182,722
Timing of revenue recognition
Services transferred over time 180,516 2,206 182,722
(i) Under AASB 15, the Group has assessed that the rendering of services under certain contracts contained embedded lease arrangements. As the lessor, these arrangements are accounted for as operating leases and totalled $1.184 million for the year ended 30 June 2020.
(b) Contract balances
Note2020
$’0002019
$’000
Trade and other receivables 31,944 29,382
Contract assets (ii) 2,608 6,142
Total trade receivables, contract assets and other receivables 34,552 35,524
(ii) Contract assets relate to the Group’s right to consideration for work completed but not billed at the reporting date. The contract assets are transferred to trade receivables when the rights become unconditional. This usually occurs when the Group issues the invoices to the customers.
Boom Logistics Annual Report 2020 51

NOTES TO THE CONSOLIDATED FINANCIAL STATEMENTSfor the year ended 30 June 2020
Recognition and measurementRevenue from the hire of lifting/access equipment, labour and other services provided is recognised where the right to be compensated for the services can be reliably measured. This typically occurs when the job dockets or timecards are approved by the customers. If the services under a single arrangement are rendered in different reporting periods, then the consideration is allocated on a relative fair value basis.
Revenue from the installation of wind towers is recognised by using either the equipment hire and labour rate models (schedule of rates) or the stage of completion of the contract, as specified in the contracts. The stage of completion is measured by reference to work completed on each stage of a wind tower unit calculated as a percentage of the total wind towers included under the contract.
The total consideration in the services above is allocated based on their standalone selling prices. The stand-alone selling prices are determined based on the list prices at which the Group sells the services in separate transactions. The fair value and the stand-alone selling prices of both types of services are considered broadly similar.
Key estimate and judgementDetermining the stage of completion requires an estimate of the wind tower units completed to date as a percentage of the total wind tower units under the contract. Where variations and claims are made to the contract, assumptions are made regarding the probability that the customer will approve the variations and claims and the amount of revenue that will arise. Changes in these estimation methods could have a material impact on the financial statements.
3. Other income and Expenses
(a) Other income
Note2020
$’0002019
$’000
Profit on disposal of plant and equipment 465 –
Profit / (loss) on disposal of plant and equipment – Right-of-use assets (49) –
Insurance settlement – 2,589
Interest income 7 11
Interest income – Lease receivables 110 –
Legal settlement – 1,642
Total other income 533 4,242
(b) Expenses
Note2020
$’0002019
$’000
External equipment hire 10,235 10,249
External labour hire 5,194 3,895
Maintenance 8,906 9,957
Fuel 3,791 3,459
External transport 6,797 8,199
Employee travel and housing 1,760 2,275
Other reimbursable costs (on-charged to customers) 2,202 1,517
Other equipment services and supplies 7,520 4,895
Total equipment services and supplies expense 46,405 44,446
Section A: Financial Performance (continued)2. Revenue from Contracts with Customers (continued)
Boom Logistics Annual Report 202052

Note2020
$’0002019
$’000
Employee related 2,738 3,397
Insurance and compliance 4,304 3,839
IT and communications 2,727 2,633
Occupancy 1,175 1,322
Other overheads 3,190 1,958
Loss on disposal of plant and equipment – 2,010
Total other expense 14,134 15,159
4. Income Tax
(a) Income tax expense
Note2020
$’0002019
$’000
Current income tax
Current income tax expense / (benefit) 4,449 134
Adjustments in respect of current income tax of previous years – (120)
Deferred income tax
Relating to origination and reversal of temporary differences (2) (14)
4,447 –
A reconciliation between tax benefit and the accounting loss before income tax is as follows:
Note2020
$’0002019
$’000
Accounting loss before tax from continuing operations (12,512) (5,330)
At the Group's statutory income tax rate of 30% (2019: 30%) (3,754) (1,599)
Expenditure not allowable for income tax purposes 53 35
Adjustments in respect of current income tax of previous years – (120)
Current year losses for which no deferred tax asset is recognised 1,565 569
Derecognition of tax losses recognised in previous years 2,136 1,115
Franking deficit tax payable 4(c) 4,447 –
Income tax expense 4,447 –
Boom Logistics Annual Report 2020 53

NOTES TO THE CONSOLIDATED FINANCIAL STATEMENTSfor the year ended 30 June 2020
(b) Deferred income tax
Year ended 30 June 2020
Opening Balance
$’000
Recognised in Income
Statement $’000
Recognised in Equity
$’000
Closing Balance
$’000
– Employee leave provisions 2,536 121 – 2,657
– Allowance for impairment on financial assets 173 161 – 334
– Liability accruals 448 1,158 – 1,606
– Restructuring provisions 246 (234) – 12
– Tax losses 6,408 (2,136) – 4,272
– Plant and equipment (9,816) 932 – (8,884)
– Derivative financial instruments 33 – 37 70
Net deferred tax asset / (liabilities) 28 2 37 67
Year ended 30 June 2019
Opening Balance
$’000
Recognised in Income
Statement $’000
Recognised in Equity
$’000
Closing Balance
$’000
– Employee leave provisions 2,831 (295) – 2,536
– Allowance for impairment on financial assets 123 50 – 173
– Liability accruals 735 (287) – 448
– Restructuring provisions 38 208 – 246
– Tax losses 7,523 (1,115) – 6,408
– Plant and equipment (11,269) 1,453 – (9,816)
– Derivative financial instruments 26 – 7 33
Net deferred tax asset / (liabilities) 7 14 7 28
(c) Income tax payableIncome tax payable represents franking deficit tax payable. The franking deficit position at 30 June 2020 has been agreed with the ATO post balance date and will be paid in twenty four interest free equal monthly instalments commencing from August 2020. The income tax payments can be offset against future income tax liabilities.
(d) Tax lossesThe Group has total tax losses of $31.101 million tax effected (2019: $29.537 million). $4.272 million of these losses have been recognised on balance sheet and $26.829 million has not been recognised as a deferred tax asset based on an assessment of the probability that sufficient taxable profit will be available to allow the tax losses to be utilised in the near future. The unused tax losses remain available indefinitely and are in addition to the franking deficit tax payments that can also be used to offset future tax payable.
Recognition and measurementCurrent tax assets and liabilities for the current and prior periods are measured at the amount expected to be recovered from or paid to the taxation authorities. The tax rates and tax laws used to compute the amount are those that are enacted or substantively enacted by the balance sheet date.
Deferred tax is provided on all temporary differences at the balance sheet date between the tax bases of assets and liabilities and their carrying amounts for financial reporting purposes. Deferred tax assets and liabilities are recognised for all deductible / taxable temporary differences except where they arise from the initial recognition of an asset or liability in a transaction that is not a business combination and, at the time of the transaction, affects neither the accounting profit nor taxable profit or loss. The carrying amount of deferred tax assets is reviewed at each balance sheet date and reduced to the extent that it is no
Section A: Financial Performance (continued)4. Income Tax (continued)
Boom Logistics Annual Report 202054

longer probable that sufficient taxable profit will be available to allow all or part of the deferred tax asset to be utilised. Unrecognised deferred tax assets are reassessed at each balance sheet date and are recognised to the extent that it has become probable that future taxable profit will allow the deferred tax asset to be recovered.
Income taxes relating to items recognised directly in equity are recognised in equity and not in the statement of comprehensive income.
Tax consolidation legislationBoom Logistics Limited and its wholly-owned Australian controlled entities have implemented the tax consolidation legislation. The head entity, Boom Logistics Limited, and the controlled entities in the tax consolidated group have entered into tax funding and sharing agreements such that each entity in the tax consolidated group recognises the assets, liabilities, revenues and expenses in relation to its own transactions, events and balances only.
Key estimate and judgementDeferred tax assets are recognised for deductible temporary differences and unused tax losses only if it is probable that future taxable profits will be available to utilise those temporary differences and losses, and the losses continue to be available having regard to their nature and timing of origination. Judgement is required to determine the amount of deferred tax assets that can be recognised based upon the likely timing and the level of future taxable profits. Utilisation of tax losses also depends on the ability of the Group to satisfy certain tests at the time the losses are recouped.
5. Earnings Per ShareBasic earnings per share amounts are calculated by dividing net profit or loss for the year attributable to ordinary equity holders of the parent by the weighted average number of ordinary shares outstanding during the year.
Diluted earnings per share amounts are calculated by dividing the net profit or loss for the year attributable to ordinary equity holders of the parent by the weighted average number of ordinary shares outstanding during the year plus the weighted average number of ordinary shares that would be issued on the conversion of all the dilutive potential ordinary shares into ordinary shares.
The following reflects the income and share data used in the calculation of basic and diluted earnings per share:
Note2020
$’0002019
$’000
Net loss after tax (16,959) (5,330)
No. of shares
Weighted average number of ordinary shares used in calculating basic earnings per share 431,555,802 462,894,795
Effect of dilutive securities:
– employee share awards (i) – –
Adjusted weighted average number of ordinary shares used in calculating basic earnings per share 431,555,802 462,894,795
Number of ordinary shares at financial year end 427,774,207 439,193,800
(i) The total number of granted rights and options at 30 June 2020 and 30 June 2019 were excluded from the diluted weighted average number of ordinary shares calculation as their effect was anti-dilutive.
Boom Logistics Annual Report 2020 55

NOTES TO THE CONSOLIDATED FINANCIAL STATEMENTSfor the year ended 30 June 2020
6. DividendsThere were no dividends paid during the year.
Dividends proposed and not recognised as a liabilityThe Board resolved to pay an unfranked interim dividend of 0.5 cents per share on 26 February 2020 with a record date of 31 March 2020. The dividend payment date, originally scheduled for 21 April 2020, was deferred to 2 October 2020 as a prudent measure to preserve cash as a result of the uncertainty created by the COVID-19 situation at that time. The record date for the deferred payment remains 31 March 2020 and the estimated liability based on the number of ordinary shares on issue at that date is $2.1 million.
Section B: Operating Assets and LiabilitiesThis section provides information relating to the key operating assets used and liabilities incurred to support delivering the financial performance of the Group.
7. Property, Plant and Equipment
Year ended 30 June 2020 Note
Rental Equipment
$’000
Motor Vehicles
$’000
Machinery, Furniture, Fittings
& Equipment $’000
Freehold Land &
Buildings $’000
Total $’000
Opening carrying amount 145,000 4,078 1,319 1,682 152,079
Additions 1,100 32 415 – 1,547
Disposals (3,762) (686) (16) – (4,464)
Transfers (i) (8,455) (34) 38 – (8,451)
Depreciation charge for the year (14,852) (742) (801) (120) (16,515)
Closing carrying amount 119,031 2,648 955 1,562 124,196
At cost 282,670 20,103 6,263 3,120 312,156
Accumulated depreciation (163,639) (17,455) (5,308) (1,558) (187,960)
Closing carrying amount 119,031 2,648 955 1,562 124,196
Year ended 30 June 2019 Note
Rental Equipment
$’000
Motor Vehicles
$’000
Machinery, Furniture, Fittings
& Equipment $’000
Freehold Land &
Buildings $’000
Total $’000
Opening carrying amount 159,559 3,896 1,228 2,805 167,488
Additions 11,395 885 645 – 12,925
Disposals (8,642) (76) (68) – (8,786)
Transfers (676) 282 162 (1) (233)
Impairment (975) – – (1,000) (1,975)
Depreciation charge for the year (15,661) (909) (648) (122) (17,340)
Closing carrying amount 145,000 4,078 1,319 1,682 152,079
At cost 316,839 21,534 5,932 3,120 347,425
Accumulated depreciation (171,839) (17,456) (4,613) (1,438) (195,346)
Closing carrying amount 145,000 4,078 1,319 1,682 152,079
(i) Finance leased assets of $3.738 million at 30 June 2019 were reclassified to Right-of-use Assets in accordance with the new accounting standard AASB 16 Leases. Refer to note 22 for further details. At 30 June 2020, the finance leased asset balance was $3.542 million. Transfers also included $4.713 million of rental equipment assets transferred to Assets classified as held for sale pre-impairment.
Section A: Financial Performance (continued)
Boom Logistics Annual Report 202056

Property, plant and equipment with a carrying amount of $124.196 million (2019: $148.341 million) is pledged as securities for current and non-current interest bearing loans and borrowings as disclosed in note 11.
Assets classified as held for saleThe balance in the Group’s assets classified as held for sale account at 30 June 2020 is $3.136 million (2019: $0.250 million). Assets classified as held for sale consists of underutilised travel towers and access equipment that are no longer required and are targeted for sale in FY2021. Assets transferred to held for sale were subject to an impairment of $1.827 million (refer to note 8) which is reflective of the expected auction value given the large number of similar assets being disposed in a short time frame.
Recognition and measurementProperty, plant and equipment are measured at cost less accumulated depreciation and any accumulated impairment losses. Cost includes expenditure that is directly attributable to the acquisition of the asset. Land is measured at cost.
When a major overhaul is performed on an asset, the cost is recognised in the carrying amount of property, plant and equipment only if the major overhaul extends the expected useful life of the asset or if the continuing operation of the asset is conditional upon incurring the expenditure. Similarly, when each major inspection is performed, its cost is recognised in the carrying amount of property, plant and equipment as a replacement only if it is eligible for capitalisation. The cost of the day-to-day servicing or the replacement of consumable parts of property, plant and equipment is recognised in profit or loss as incurred.
Depreciation is recognised in the statement of comprehensive income on a straight line basis over the estimated useful life of each part of an item of property, plant and equipment as follows:
Buildings 20 Years
Mobile Cranes 10 to 15 Years
Travel Towers 10 to 20 Years
Access and Ancillary Equipment 10 Years
Vehicles 5 to 10 Years
Office and Workshop Equipment 3 to 10 Years
Leasehold Improvements Lease term
Computer Equipment 3 to 5 Years
Depreciation methods, useful lives and residual values are reviewed at each reporting date and at more regular intervals when there is an indicator of impairment or when deemed appropriate.
Gains or losses on sale of property, plant and equipment are included in the statement of comprehensive income in the year the asset is disposed of.
Key estimate and judgementThe Group determines the estimated useful lives of assets and related depreciation charges for its property, plant and equipment based on the accounting policy stated above. These estimates are based on projected capital equipment lifecycles for periods up to twenty years based on useful life assumptions.
Residual values are determined based on the value the Group would derive upon ultimate disposal of the individual piece of property, plant and equipment at the end of its useful life. The achievement of these residual values is dependent upon the second hand equipment market at any given point in the economic cycle.
Management will increase the depreciation charge where useful lives are less than previously estimated lives or there is indication that residual values can not be achieved.
8. Impairment Testing of Assets
Recognition and measurementThe carrying amounts of the Group’s non-financial assets, other than deferred tax assets and inventories, are reviewed at each reporting date to determine whether there is any indication of impairment. If any such indication exists then the asset’s recoverable amount is estimated.
For the purpose of impairment testing, assets are grouped together into the smallest group of assets that generates cash inflows from continuing use that are largely independent of the cash inflows from other assets or groups of assets (the “cash-generating unit”).
The recoverable amount of an asset or cash-generating unit or a group of cash-generating units is the greater of its value in use and its fair value less costs of disposal. In assessing value in use, the estimated future cash flows are discounted to their present value using a post-tax discount rate that reflects current market assessments of the time value of money and the risks specific to the asset.
An impairment loss is recognised if the carrying amount of an asset, cash-generating unit or a group of cash-generating units exceeds its recoverable amount. Impairment losses are recognised in the statement of comprehensive income. Impairment losses recognised in respect of cash-generating units are allocated first to reduce the carrying amount of any goodwill allocated to the units and then to reduce the
Boom Logistics Annual Report 2020 57
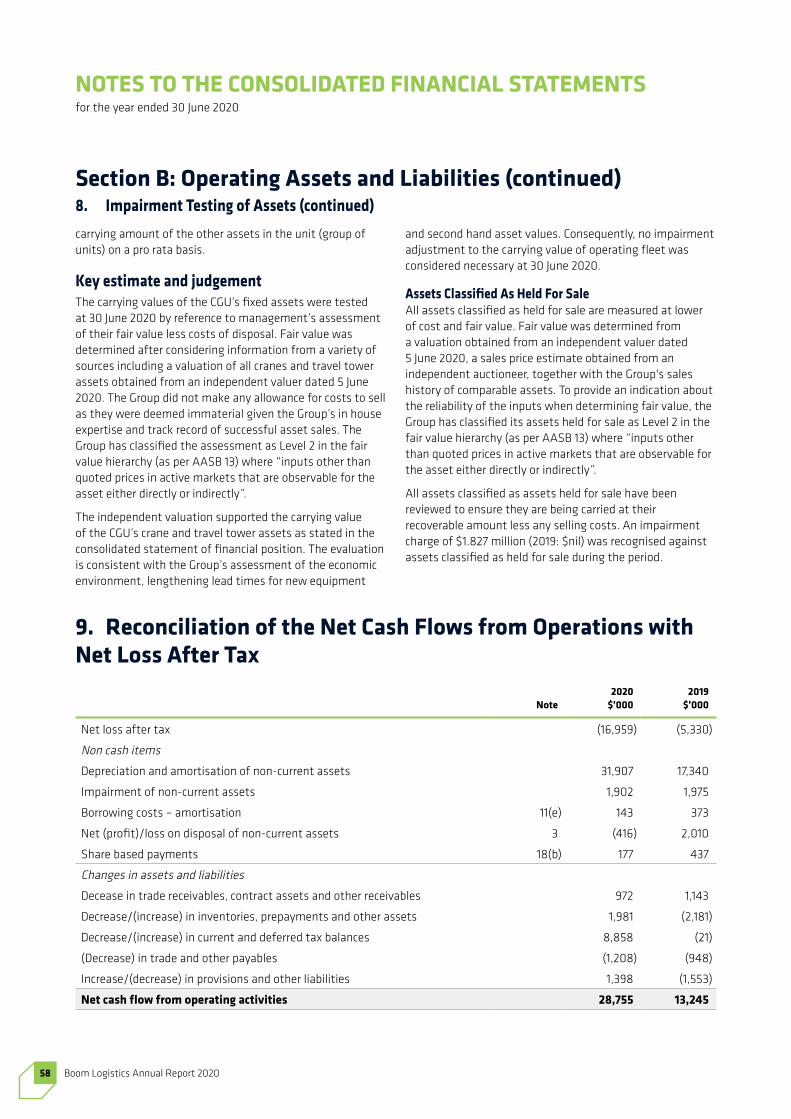
NOTES TO THE CONSOLIDATED FINANCIAL STATEMENTSfor the year ended 30 June 2020
carrying amount of the other assets in the unit (group of units) on a pro rata basis.
Key estimate and judgementThe carrying values of the CGU’s fixed assets were tested at 30 June 2020 by reference to management’s assessment of their fair value less costs of disposal. Fair value was determined after considering information from a variety of sources including a valuation of all cranes and travel tower assets obtained from an independent valuer dated 5 June 2020. The Group did not make any allowance for costs to sell as they were deemed immaterial given the Group’s in house expertise and track record of successful asset sales. The Group has classified the assessment as Level 2 in the fair value hierarchy (as per AASB 13) where “inputs other than quoted prices in active markets that are observable for the asset either directly or indirectly”.
The independent valuation supported the carrying value of the CGU’s crane and travel tower assets as stated in the consolidated statement of financial position. The evaluation is consistent with the Group’s assessment of the economic environment, lengthening lead times for new equipment
and second hand asset values. Consequently, no impairment adjustment to the carrying value of operating fleet was considered necessary at 30 June 2020.
Assets Classified As Held For SaleAll assets classified as held for sale are measured at lower of cost and fair value. Fair value was determined from a valuation obtained from an independent valuer dated 5 June 2020, a sales price estimate obtained from an independent auctioneer, together with the Group's sales history of comparable assets. To provide an indication about the reliability of the inputs when determining fair value, the Group has classified its assets held for sale as Level 2 in the fair value hierarchy (as per AASB 13) where “inputs other than quoted prices in active markets that are observable for the asset either directly or indirectly”.
All assets classified as assets held for sale have been reviewed to ensure they are being carried at their recoverable amount less any selling costs. An impairment charge of $1.827 million (2019: $nil) was recognised against assets classified as held for sale during the period.
Section B: Operating Assets and Liabilities (continued)8. Impairment Testing of Assets (continued)
9. Reconciliation of the Net Cash Flows from Operations with Net Loss After Tax
Note2020
$’0002019
$’000
Net loss after tax (16,959) (5,330)
Non cash items
Depreciation and amortisation of non-current assets 31,907 17,340
Impairment of non-current assets 1,902 1,975
Borrowing costs – amortisation 11(e) 143 373
Net (profit)/loss on disposal of non-current assets 3 (416) 2,010
Share based payments 18(b) 177 437
Changes in assets and liabilities
Decease in trade receivables, contract assets and other receivables 972 1,143
Decrease/(increase) in inventories, prepayments and other assets 1,981 (2,181)
Decrease/(increase) in current and deferred tax balances 8,858 (21)
(Decrease) in trade and other payables (1,208) (948)
Increase/(decrease) in provisions and other liabilities 1,398 (1,553)
Net cash flow from operating activities 28,755 13,245
Boom Logistics Annual Report 202058

10. Other Provisions and LiabilitiesOther provisions and liabilities include accruals for PAYG, GST, wages, superannuation and payroll tax. The balance also includes provision for make good costs on leases of $2.824 million which principally relates to shipment costs of returning leased equipment, including onshore transportation costs. The balance includes a provision for $1.157 million for the potential non-recovery of amounts claimed for work performed on a major project during the year. The claim is subject to dispute.
Recognition and measurementA provision for onerous contracts is measured at the present value of the lower of the expected cost of terminating the contract and the expected net cost of continuing with the contract. Before a provision is established, the Group recognises and impairment losses on the assets associated with that contract.
Key estimate and judgementMeasurement of an onerous contract involves the use of significant estimates of future costs to be incurred in completing the contract. These estimates can be impacted by unforeseen events such as adverse weather or project scope changes.
Section C: Funding StructuresThis section provides information relating to the Group’s funding structure and its exposure to financial risk, how they affect the Group’s financial position and performance and how the risks are managed.
11. Debt
Note2020
$’0002019
$’000
Current
Other loans 4,309 5,167
Total current interest bearing liabilities 4,309 5,167
Non current
Other loans 9,238 21,923
Secured bank loans 5,000 11,000
Prepaid borrowing costs (72) (214)
Total non-current interest bearing liabilities 14,166 32,709
Total interest bearing liabilities 18,475 37,876
(a) Debt facilitiesAt reporting date, the Group had the following debt facilities:
● $20 million, 3 year syndicated loan facility expiring on January 2022. The facility attracts a floating interest rate. The facility limit amortises by between $nil and $2.5 million at each six month period on 1 January and 1 July dependant on the earnings leverage ratio reported at the end of the preceding quarter. The Group does not expect any amortisation to apply to the facility;
● $20 million, 3 year trade receivables loan facility expiring on January 2022. The facility incurs a fixed fee and floating interest on funds drawn. There is no amortisation required over the life of this facility;
● $35 million asset finance facility, comprising finance and operating leases with varying expiry dates from August 2021 to May 2024. The facility attracts fixed interest rates and drawn amounts amortise over a period of 1 to 5 years.
Boom Logistics Annual Report 2020 59

NOTES TO THE CONSOLIDATED FINANCIAL STATEMENTSfor the year ended 30 June 2020
(b) Covenant positionThe Group was in compliance with all financial and non-financial banking covenants throughout the reporting period and as at 30 June 2020.
(c) Assets pledged as securityFixed and floating charges are held over all of the Group’s assets, including cash at bank, trade receivables, contract assets and other receivables, and assets classified as held for sale.
(d) Terms and debt repayment schedule
Currency
Weighted Average
Interest RateYears of
Maturity2020
$’0002019
$’000
Syndicated debt AUD 4.24% January 2022 5,000 11,000
Trade receivables loan AUD 8.48% January 2022 4,147 7,617
Finance leases AUD 5.98% 2023 to 2024 (i) 3,726
Finance arrangement AUD 5.98% August 2021 9,400 15,747
Prepaid borrowing costs (72) (214)
Total interest bearing liabilities 18,475 37,876
(i) Finance leases of $3.726 million at 30 June 2019 were reclassified to Lease Liabilities in accordance with the new accounting standard AASB 16 Leases. Refer to note 22 for further details. At 30 June 2020, the finance lease balance was $3.193 million.
(e) Financing expense
2020 $’000
2019 $’000
Interest expense (ii) 1,862 2,521
Borrowing costs – amortisation (non-cash) 143 373
Borrowing costs – other 830 812
Total financing expense 2,835 3,706
(ii) Interest expense of $0.208 million on finance leases reclassified to Lease Liabilities were recognised under Financing expense – Lease liabilities on the Statement of Comprehensive Income.
Section C: Funding Structures (continued)11. Debt (continued)
Boom Logistics Annual Report 202060

(f) Financing facilities availableAt reporting date, the following financing facilities had been negotiated and were available:
Note2020
$’0002019
$’000
Total facilities:
– bank overdraft 1,000 1,000
– bank loans and borrowings 75,000 75,000
76,000 76,000
Facilities drawn at reporting date:
– bank overdraft – –
– bank loans and borrowings (iii) 21,740 38,090
21,740 38,090
Facilities undrawn at reporting date:
– bank overdraft 1,000 1,000
– bank loans and borrowings (iv) 44,792 28,619
45,792 29,619
(iii) Balance at 30 June 2020 includes finance leases of $3.193 million.
(iv) $13.9 million of the $35 million asset finance facility was undrawn at reporting date. $12.6 million was drawn as disclosed above with a further $8.5 million utilised by operating leases.
In addition, the Group has an existing $10.5 million working capital facility for letters of credit, bank guarantees and credit card facilities. As at 30 June 2020, $4.381 million (2019: $7.609 million) was utilised.
Recognition and measurementAll loans and borrowings are initially recognised at fair value of the consideration received less directly attributable transaction costs. After initial recognition, interest bearing loans and borrowings are subsequently measured at amortised cost using the effective interest method.
Gains and losses are recognised in the statement of comprehensive income when the liabilities are derecognised.
The fair value of all borrowings approximates their carrying amount at reporting date as the impact of any market discounting is not significant.
12. Financial Risk ManagementThe Board of Directors has overall responsibility for the oversight of the Company’s risk management framework including the identification and management of material business, financial and regulatory risks. Management reports regularly to the Risk Committee and the Board of Directors on relevant activities.
Risk management guidelines have been further developed to identify and analyse the risks faced by the Group, to set appropriate risk limits and controls, and to monitor risks and adherence to limits. Risk management guidelines are regularly reviewed to reflect changes in market conditions and the Group’s activities.
The Group has exposure to the following risks from its use of financial instruments:
● Credit risk;
● Liquidity risk; and
● Market risk.
Boom Logistics Annual Report 2020 61

NOTES TO THE CONSOLIDATED FINANCIAL STATEMENTSfor the year ended 30 June 2020
(a) Credit riskCredit risk arises from the financial assets of the Group, which comprise cash and cash equivalents, trade receivables, contract assets and other receivables, and derivative instruments. The Group's exposure to credit risk arises from potential default of the counter party, with a maximum exposure equal to the carrying amount of these instruments. Exposure at balance date is addressed in each applicable note.
The Group's policy is to trade with recognised, creditworthy third parties. It is the Group's practice that all customers who wish to trade on credit terms are subject to credit verification procedures. In addition, receivable balances are monitored on an ongoing basis with the result that the Group's exposure to bad debts is not significant.
Trade receivables and contract assetsThe Group applies the simplified approach to measuring expected credit losses (“ECL”) which uses a lifetime expected loss allowance for all trade receivables and contract assets.
To measure the expected credit losses, trade receivables and contract assets have been grouped based on shared credit risk characteristics and the days past due. The contract assets relate to unbilled work in progress and have substantially the same risk characteristics as the trade receivables for the same types of contracts. The Group has therefore concluded that the expected loss rates for trade receivables are a reasonable approximation of the loss rates for the contract assets.
The Group established a provision matrix based on the historical credit loss experience and adjusted for forward looking factors specific to the debtors and the economic environment. The Group considers trade receivables and contract assets are at risk when contractual payments are 120 days past invoice date, subject to other internal or external information that indicate otherwise.
Collectability is reviewed on an ongoing basis. Debts which are known to be uncollectible are written off by reducing the carrying amount directly. An allowance for impairment is used when there is objective evidence that the Group will not be able to collect all amounts due according to the original terms of the receivables.
Section C: Funding Structures (continued)12. Financial Risk Management (continued)
Boom Logistics Annual Report 202062

At reporting date, the credit risk exposure on the Group’s trade receivables and contract assets using a provision matrix is as follows:
Year ended 30 June 2020 ECL Rate
Trade Receivables*
$’000
Contract Assets*
$’000Total
$’000
Loss Allowance
$’000
0 – 30 days 0.20% 17,771 2,608 20,379 37
31 – 60 days 0.25% 5,976 – 5,976 14
61 – 90 days 0.75% 5,798 – 5,798 40
91 – 120 days 7.50% 1,285 – 1,285 88
+120 days 20.00% 1,408 – 1,408 256
32,238 2,608 34,846 435
Year ended 30 June 2019 ECL Rate
Trade Receivables*
$’000
Contract Assets $’000
Total $’000
Loss Allowance
$’000
0 – 30 days 0.20% 16,055 6,142 22,197 41
31 – 60 days 0.25% 6,861 – 6,861 16
61 – 90 days 0.75% 4,151 – 4,151 28
91 – 120 days 7.50% 739 – 739 50
+120 days 20.00% 1,082 – 1,082 197
28,888 6,142 35,030 332
* Trade receivables and contract assets are net of specific transactions totalling $0.539 million (2019: $0.245 million) that have been fully provided and excluded from above general provision calculation. Refer to page 47 for the impact from COVID-19.
The movement in the allowance for impairment in respect of trade receivables and contract assets during the financial year is as follows:
Note2020
$’0002019
$’000
Balance at 1 July 577 809
Impairment loss recognised 802 257
Amounts written-off and/or written back (265) (489)
Balance at 30 June (i) 1,114 577
(i) The allowance for impairment of $1.114 million at 30 June 2020 includes an additional allowance of $0.140 million, circa 30% in excess of the allowance calculated using the provision matrix above. The additional amount is to allow for a perceived temporary increase in the risk profile as a result of the uncertain economic environment at 30 June 2020.
Recognition and measurementTrade receivables and contract assets are recognised initially at fair value and subsequently measured at amortised cost using the effective interest method, less any allowance for impairment. Trade receivables are generally due for settlement within 30 – 90 days.
The amount of the impairment loss is recognised in the statement of comprehensive income within other expenses. When a trade receivable or contract asset for which an allowance for impairment had been recognised becomes uncollectible in a subsequent period, it is written off against the allowance account. Subsequent recoveries of amounts previously written off are credited against other expenses in the statement of comprehensive income.
Boom Logistics Annual Report 2020 63

NOTES TO THE CONSOLIDATED FINANCIAL STATEMENTSfor the year ended 30 June 2020
(b) Liquidity riskLiquidity risk is the risk that the Group will not be able to meet its financial obligations as they fall due. The Group’s approach to managing liquidity is to ensure, as far as possible, that it will always have sufficient liquidity to meet its financial obligations as they fall due under both normal and stressed conditions without incurring unacceptable losses or damage to the Group's reputation. In order to meet these requirements management estimates the cash flows of the Group on a weekly, monthly and three year rolling basis.
The Group’s objective is to maintain a balance between continuity of funding and flexibility through the use of bank overdrafts, bank loans, finance leases and trade receivables loan. At 30 June 2020, the Group’s balance sheet gearing ratio was 17% (net debt / total equity) on a pre AASB 16, like for like basis (2019: 27%). Allowing for the additional lease liabilities recognised in accordance with AASB 16, the Group’s balance sheet gearing ratio was 34%.
The table below represents the undiscounted contractual settlement terms for financial liabilities based on the remaining period at the reporting date to the contractual maturity date.
Year ended 30 June 2020
Carrying Amount
$’000
Contractual Cash Flows
$’000
6 mths or less $’000
6-12 mths $’000
1-2 years $’000
2-5 years $’000
Trade and other payables 11,952 (11,952) (11,952) – – –
Derivatives 233 (233) (123) (61) (49) –
Income tax payable 4,447 (4,447) (4,447) – – –
Other loans 13,547 (14,892) (2,571) (2,571) (9,750) –
Secured bank loans 5,000 (5,383) (121) (121) (5,141) –
Lease liabilities 23,123 (26,337) (7,545) (5,978) (8,055) (4,759)
58,302 (63,244) (26,759) (8,731) (22,995) (4,759)
Year ended 30 June 2019
Carrying Amount
$’000
Contractual Cash Flows
$’000
6 mths or less $’000
6-12 mths $’000
1-2 years $’000
2-5 years $’000
Trade and other payables 13,868 (13,868) (13,868) – – –
Derivatives 110 (110) (14) (28) (46) (23)
Other loans 27,090 (30,409) (3,577) (3,577) (7,153) (16,103)
Secured bank loans 11,000 (12,186) (230) (230) (459) (11,268)
52,068 (56,573) (17,689) (3,835) (7,658) (27,394)
Recognition and measurementTrade and other payables represent liabilities for goods and services provided to the Group prior to the end of financial year which are unpaid. The amounts are unsecured and are usually payable within 60 days of recognition.
Section C: Funding Structures (continued)12. Financial Risk Management (continued)
Boom Logistics Annual Report 202064

(c) Market riskMarket risk is the risk that changes in interest rates and foreign exchange rates will affect the Group’s income or the value of its holdings of financial instruments.
Interest rate riskAt the reporting date, the interest rate profiles of the Group’s interest bearing financial instruments were:
Carrying Amount
Note2020
$’0002019
$’000
Fixed rate instruments
Financial liabilities (17,593) (19,473)
(17,593) (19,473)
Variable rate instruments
Financial assets – cash at bank and on hand 2,131 1,450
Financial liabilities (4,147) (18,617)
(2,016) (17,167)
The Group's main interest rate risk arises from short and long-term borrowings. Borrowings issued at variable rates expose the Group to cash flow interest rate risk. This risk is managed by taking into consideration the current and expected future debt profile, expectations regarding future interest rate movements, the mix between variable and fixed rate borrowings and the potential to hedge against negative outcomes by entering into interest rate swaps.
Interest rate swap contracts – cash flow hedgesThe Group has entered into an interest rate swap contract under which it is obliged to receive interest at a variable rate and to pay interest at a fixed rate.
The interest rate swap contract currently in place covers 100% of the variable loan principal outstanding. The fixed interest rate is at 1.94%. The contract is settled on a net basis and coincide with the dates on which interest is payable on the underlying debt.
All swaps are matched directly against the hedged item and as such are considered highly effective. The swaps are measured at fair value and all gains and losses attributable to the hedged risk are taken directly to equity and re-classified into profit or loss when the interest expense is recognised.
The Group will continue to monitor debt levels and assess the need to enter into further interest rate swap contracts, or other derivative instruments, based on forecast debt levels and prevailing market conditions at that time.
Foreign exchange rate riskForeign exchange risk arises when future commercial transactions and recognised liabilities are denominated in a currency that is not the entity’s functional currency. The Group has transactional currency exposures arising from operating lease of plant and equipment denominated in Euros.
In order to protect against exchange rate movements, the Group has entered into forward exchange contracts to purchase Euros. These contracts are hedging highly probable forecasted transactions and are timed to mature when payments are scheduled to be made. The forward exchange contracts are considered to be fully effective cash flow hedges and any gain or loss on the contracts is taken directly to equity.
The Group's exposure to foreign exchange rate risk at reporting date, expressed in Australian dollars, was $0.499 million (2019: $0.299 million) and the forward exchange contracts had a fair value of $0.104 million payable (2019: $0.018 million payable).
SensitivityMovements in the Australian dollar against the Euro would not result in a material difference to the balances stated in the consolidated statements of changes in equity and comprehensive income.
Boom Logistics Annual Report 2020 65

NOTES TO THE CONSOLIDATED FINANCIAL STATEMENTSfor the year ended 30 June 2020
Recognition and measurementDerivatives designated as hedging instruments are classified as cash flow hedges.
At the inception of each hedging transaction, the Group documents the relationship between the hedging instruments and hedged items, its risk management objectives and its strategy for undertaking the hedge transactions. The Group also documents its assessment, both at hedge inception and on an ongoing basis, of whether the derivatives that are used in hedging transactions have been and will continue to be highly effective in offsetting changes in fair value or cash flows of hedged items.
The effective portion of changes in the fair value of the derivatives that are designated and qualify as cash flow hedges is recognised in other comprehensive income and accumulated in the cash flow hedge reserve in equity. The gain or loss relating to the ineffective portion is recognised immediately in profit or loss.
The Group does not speculate in the trading of derivative instruments.
Derivatives are carried at fair value and categorised as level 2 in the fair value hierarchy under AASB 13 where “inputs other than quoted prices in active markets that are observable for the asset either directly or indirectly”.
13. Contributed Equity
(a) Issued and paid up capital
Note
2020 2019
No. of Shares $’000 No. of Shares $’000
Beginning of the financial year 439,193,800 312,057 474,868,764 318,065
Shares bought back on-market and cancelled (i) (11,419,593) (1,726) (35,674,964) (5,978)
Buy-back transaction costs – (6) – (44)
Tax credits recognised directly in equity – 2 – 14
End of the financial year 427,774,207 310,327 439,193,800 312,057
(i) During the financial year, Boom purchased and cancelled 11,419,593 ordinary shares (2019: 35,674,964) priced between $0.14 and $0.17 per share as a result of the on market share buy-back scheme. The total cost, including transaction costs, was $1.732 million (2019: $6.022 million). These costs were deducted from contributed equity. The share buy-back scheme has been completed.
All issued shares are fully paid. Fully paid ordinary shares carry one vote per share and carry the right to dividends.
(b) Capital managementFor the purposes of capital management, capital includes issued capital and all other equity reserves attributable to the equity holders of the parent. The primary objective of the Group’s capital management policy is to maximise shareholder value.
The Group manages its capital structure and makes adjustments in light of changes in economic conditions and the requirements of the financial covenants included in its agreements with financiers. Adjustments to the Group’s capital structure can be made subject to meeting the restrictions included in the Group’s financing agreements. These require the Group to maintain the ratio of gross debt
to trading EBITDA at less than 2.5 times with the aggregate total of distributions not exceeding $15 million over the term of the facilities (to January 2022). Further, the total value of dividends paid in any financial year must not exceed 50% of the net profit after tax earned in the prior financial year without the prior approval of the financiers.
The Group monitors capital on the basis of the balance sheet gearing ratio. This ratio is calculated as net debt divided by total equity as disclosed in note 12(b).
The Group’s capital management, amongst other things, aims to ensure that it meets its financial covenants. The Group will also manage its capital structure through returns to shareholders, as economic conditions and trading results improve.
Section C: Funding Structures (continued)12. Financial Risk Management (continued)
Boom Logistics Annual Report 202066

Section D: Other DisclosuresThis section provides additional financial information that is required by the Australian Accounting Standards and management considers relevant for shareholders.
14. Subsidiaries
Country of Incorporation
Equity Interest
2020 %
2019 %
AKN Pty Ltd Australia 100 100
Sherrin Hire Pty Ltd Australia 100 100
Shutdown Staffing Pty Ltd Australia 100 100
Boom Logistics (VIC) Pty Ltd Australia 100 100
Boom Logistics Projects Pty Ltda Australia 100 –
Boom Renewables Pty Ltda Australia 100 –
a Boom Logistics Projects Pty Ltd was incorporated on 25 May 2020 and Boom Renewables Pty Ltd was incorporated on 2 June 2020. Both companies did not trade in the period from incorporation to 30 June 2020.
Boom Logistics Limited is the ultimate parent company.
Recognition and measurementThe consolidated financial statements comprise the financial statements of Boom Logistics Limited and its subsidiaries as at 30 June each year.
Subsidiaries are entities controlled by the Group. Control exists when the Group is exposed to, or has rights to, variable returns from its involvement with the entity and has the ability to affect those returns through its power to direct the activities of the entity. The financial statements of subsidiaries are included in the consolidated financial statements from the date that control commences until the date that control ceases. The accounting policies of subsidiaries have been changed when necessary to align them with the policies adopted by the Group.
In the parent company financial statements, investments in subsidiaries are carried at cost less impairments.
The acquisition method of accounting is used to account for the acquisition of subsidiaries by the Group.
Intra-group balances, and any unrealised income and expenses arising from intra-group transactions, are eliminated in preparing the consolidated financial statements.
15. Deed of Cross GuaranteePursuant to ASIC Corporations Instrument 2016/785 (“Corporations Instrument”), the wholly owned subsidiaries listed below are relieved from the Corporations Act 2001 requirements for preparation, audit and lodgement of financial reports and Directors' report.
It is a condition of the Corporations Instrument that Boom Logistics Limited and each of the subsidiaries enter into a Deed of Cross Guarantee. The effect of the Deed is that Boom Logistics Limited guarantees to each creditor payment in full of any debt in the event of winding up of any of the subsidiaries under certain provisions of the Corporations Act 2001. The subsidiaries have also given similar guarantees in the event that Boom Logistics Limited is wound up.
The subsidiaries subject to the Deed are:
● Sherrin Hire Pty Ltd (party to the Deed on 6 December 2005);
● AKN Pty Ltd (party to the Deed on 3 November 2006 by virtue of a Deed of Assumption);
● Shutdown Staffing Pty Ltd (party to the Deed on 23 November 2007 by virtue of a Deed of Assumption); and together with Boom Logistics Limited, represent a “Closed Group” for the purposes of the Corporations Instrument.
Boom Logistics Annual Report 2020 67
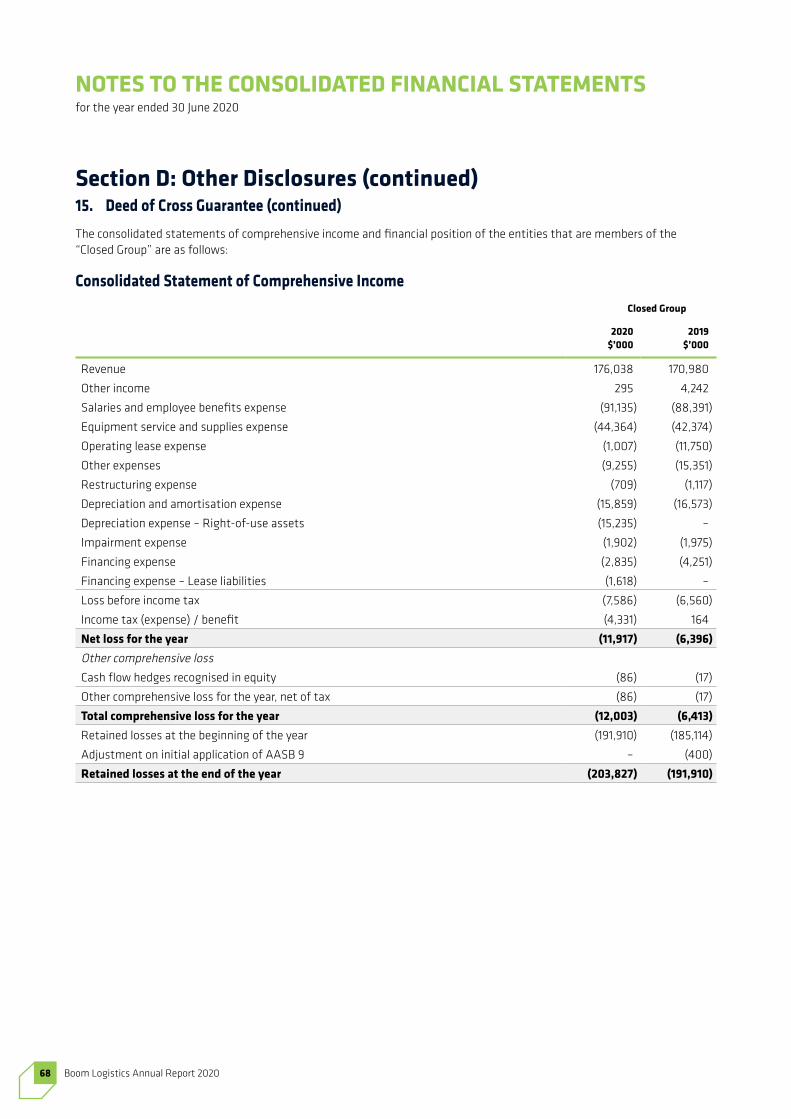
NOTES TO THE CONSOLIDATED FINANCIAL STATEMENTSfor the year ended 30 June 2020
The consolidated statements of comprehensive income and financial position of the entities that are members of the “Closed Group” are as follows:
Consolidated Statement of Comprehensive Income
Closed Group
2020 $’000
2019 $’000
Revenue 176,038 170,980
Other income 295 4,242
Salaries and employee benefits expense (91,135) (88,391)
Equipment service and supplies expense (44,364) (42,374)
Operating lease expense (1,007) (11,750)
Other expenses (9,255) (15,351)
Restructuring expense (709) (1,117)
Depreciation and amortisation expense (15,859) (16,573)
Depreciation expense – Right-of-use assets (15,235) –
Impairment expense (1,902) (1,975)
Financing expense (2,835) (4,251)
Financing expense – Lease liabilities (1,618) –
Loss before income tax (7,586) (6,560)
Income tax (expense) / benefit (4,331) 164
Net loss for the year (11,917) (6,396)
Other comprehensive loss
Cash flow hedges recognised in equity (86) (17)
Other comprehensive loss for the year, net of tax (86) (17)
Total comprehensive loss for the year (12,003) (6,413)
Retained losses at the beginning of the year (191,910) (185,114)
Adjustment on initial application of AASB 9 – (400)
Retained losses at the end of the year (203,827) (191,910)
Section D: Other Disclosures (continued)15. Deed of Cross Guarantee (continued)
Boom Logistics Annual Report 202068

Consolidated Statement of Financial Position
Closed Group
2020 $’000
2019 $’000
Current assets
Cash and cash equivalents 2,115 1,435
Trade receivables, contract assets and other receivables 33,029 34,111
Inventories, prepayments and other current assets 3,443 5,282
Assets classified as held for sale 3,136 250
Income tax receivable – 4,450
Lease receivables 1,176 –
Total current assets 42,899 45,528
Non-current assets
Investments 599 599
Deferred tax asset 552 5,350
Property, plant and equipment 118,682 145,585
Right-of-use assets 22,587 –
Lease receivables 438 –
Total non-current assets 142,858 151,534
Total assets 185,757 197,062
Current liabilities
Trade and other payables 11,323 13,515
Interest bearing loans and borrowings 4,309 5,167
Lease liabilities 11,592 –
Employee provisions 7,704 7,214
Other provisions and liabilities 7,387 4,404
Derivative financial instruments 184 –
Income tax payable 4,447 –
Total current liabilities 46,946 30,300
Non-current liabilities
Payables 1,808 10,736
Interest bearing loans and borrowings 14,165 32,709
Lease liabilities 11,336 –
Employee provisions 383 300
Other provisions and liabilities 2,064 344
Derivative financial instruments 49 110
Total non-current liabilities 29,805 44,199
Total liabilities 76,751 74,499
Net assets 109,006 122,563
Equity
Contributed equity 310,326 312,057
Retained losses (203,827) (191,910)
Reserves 2,507 2,416
Total equity 109,006 122,563
Boom Logistics Annual Report 2020 69

NOTES TO THE CONSOLIDATED FINANCIAL STATEMENTSfor the year ended 30 June 2020
16. Parent EntityThe individual financial statements for the parent entity show the following aggregate amounts:
Statement of financial position
2020 $’000
2019 $’000
Current assets 43,138 40,772
Total assets 231,990 231,430
Current liabilities 48,606 28,075
Total liabilities 108,205 127,450
Equity
Contributed equity 310,326 312,057
Reserves 2,507 2,416
Retained losses (189,048) (210,493)
Total equity 123,785 103,980
Net profit / (loss) after tax for the year 21,445 (10,815)
Total comprehensive profit / (loss) for the year 21,359 (10,832)
17. Key Management PersonnelSummary of key management personnel compensation in the following categories is as follows:
2020 $
2019 $
Short-term employee benefits 1,328,065 1,268,231
Post employment benefits 104,273 99,380
Other long term benefits (11,322) 34,062
Share based payments 238,743 165,523
Total compensation 1,659,759 1,567,196
Refer to the Remuneration Report in the Directors' Report for detailed compensation disclosure on key management personnel.
Section D: Other Disclosures (continued)
Boom Logistics Annual Report 202070
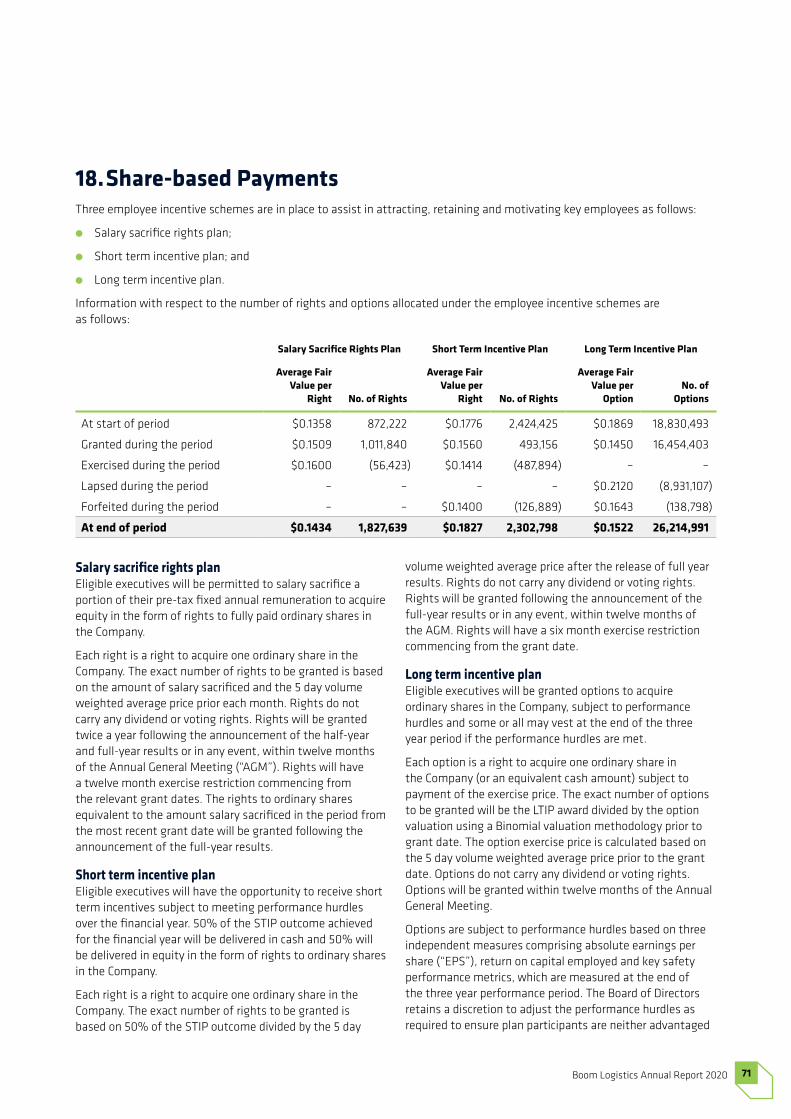
18. Share-based PaymentsThree employee incentive schemes are in place to assist in attracting, retaining and motivating key employees as follows:
● Salary sacrifice rights plan;
● Short term incentive plan; and
● Long term incentive plan.
Information with respect to the number of rights and options allocated under the employee incentive schemes are as follows:
Salary Sacrifice Rights Plan Short Term Incentive Plan Long Term Incentive Plan
Average Fair Value per
Right No. of Rights
Average Fair Value per
Right No. of Rights
Average Fair Value per
OptionNo. of
Options
At start of period $0.1358 872,222 $0.1776 2,424,425 $0.1869 18,830,493
Granted during the period $0.1509 1,011,840 $0.1560 493,156 $0.1450 16,454,403
Exercised during the period $0.1600 (56,423) $0.1414 (487,894) – –
Lapsed during the period – – – – $0.2120 (8,931,107)
Forfeited during the period – – $0.1400 (126,889) $0.1643 (138,798)
At end of period $0.1434 1,827,639 $0.1827 2,302,798 $0.1522 26,214,991
Salary sacrifice rights planEligible executives will be permitted to salary sacrifice a portion of their pre-tax fixed annual remuneration to acquire equity in the form of rights to fully paid ordinary shares in the Company.
Each right is a right to acquire one ordinary share in the Company. The exact number of rights to be granted is based on the amount of salary sacrificed and the 5 day volume weighted average price prior each month. Rights do not carry any dividend or voting rights. Rights will be granted twice a year following the announcement of the half-year and full-year results or in any event, within twelve months of the Annual General Meeting (“AGM”). Rights will have a twelve month exercise restriction commencing from the relevant grant dates. The rights to ordinary shares equivalent to the amount salary sacrificed in the period from the most recent grant date will be granted following the announcement of the full-year results.
Short term incentive planEligible executives will have the opportunity to receive short term incentives subject to meeting performance hurdles over the financial year. 50% of the STIP outcome achieved for the financial year will be delivered in cash and 50% will be delivered in equity in the form of rights to ordinary shares in the Company.
Each right is a right to acquire one ordinary share in the Company. The exact number of rights to be granted is based on 50% of the STIP outcome divided by the 5 day
volume weighted average price after the release of full year results. Rights do not carry any dividend or voting rights. Rights will be granted following the announcement of the full-year results or in any event, within twelve months of the AGM. Rights will have a six month exercise restriction commencing from the grant date.
Long term incentive planEligible executives will be granted options to acquire ordinary shares in the Company, subject to performance hurdles and some or all may vest at the end of the three year period if the performance hurdles are met.
Each option is a right to acquire one ordinary share in the Company (or an equivalent cash amount) subject to payment of the exercise price. The exact number of options to be granted will be the LTIP award divided by the option valuation using a Binomial valuation methodology prior to grant date. The option exercise price is calculated based on the 5 day volume weighted average price prior to the grant date. Options do not carry any dividend or voting rights. Options will be granted within twelve months of the Annual General Meeting.
Options are subject to performance hurdles based on three independent measures comprising absolute earnings per share (“EPS”), return on capital employed and key safety performance metrics, which are measured at the end of the three year performance period. The Board of Directors retains a discretion to adjust the performance hurdles as required to ensure plan participants are neither advantaged
Boom Logistics Annual Report 2020 71

NOTES TO THE CONSOLIDATED FINANCIAL STATEMENTSfor the year ended 30 June 2020
nor disadvantaged by matters outside management’s control that materially affect the performance hurdles (for example, by excluding one-off non-recurrent items or the impact of significant acquisitions or disposals).
Options granted have the following details and assumptions:
2020 2019 2018
Grant date 29 November 2019 28 November 2018 30 November 2017
Vesting date 31 August 2022 31 August 2021 31 August 2020
Expiry date 30 September 2022 30 September 2021 30 September 2020
Share price at grant date $0.145 $0.165 $0.200
Fair value at grant date $0.045 $0.062 $0.070
Exercise price $0.145 $0.164 $0.212
Expected life 2.8 years 2.8 years 2.8 years
Expected price volatility of Boom’s shares 47% 55% 55%
Risk-free interest rate 0.65% 2.07% 1.87%
Expected dividend yield 0% 0% 0%
(a) Carrying values
Note2020
$’0002019
$’000
Salary Sacrifice Rights Plan 753 600
Short Term Incentive Plan 798 721
Long Term Incentive Plan 1,119 1,172
Total employee equity benefits reserve 2,670 2,493
(b) Expenses arising from share-based payment transactionsTotal expenses arising from share-based payment transactions recognised during the financial year are as follows:
Note2020
$’0002019
$’000
Rights issued under employee rights plans 230 700
Options issued under employee option plan (53) (263)
9 177 437
(c) Legacy employee incentive schemesTwo existing legacy employee incentive schemes are still in place but have been discontinued with only the ordinary shares vested in previous financial years remaining in the share plans.
Section D: Other Disclosures (continued)18. Share-based Payments (continued)
Boom Logistics Annual Report 202072

(d) Employee share plan share holdingsInformation with respect to the number of ordinary shares issued and allocated under the employee share plans is as follows:
2020 Number of
Shares
2019 Number of
Shares
At start of period 1,969,131 6,196,367
– issued for nil consideration (including unallocated shares in the employee share schemes allocated during the year) 544,317 3,615,352
– sold / transferred during the year (1,033,359) (3,186,957)
– lapsed during the year – (4,655,631)
1,480,089 1,969,131
At 30 June 2020, the employee share plans also hold 7,654,098 ordinary shares (2019: 8,198,415) that are un-allocated to employees.
Recognition and measurementThe cost of these equity settled transactions with employees is measured by reference to the fair value at the date at which they are granted using an appropriate valuation model.
In valuing equity settled transactions, the performance conditions are all non-market measures and as such, are not taken into account in determining the fair values of the options.
The cost of equity settled transactions is recognised, together with a corresponding increase in equity, over the period in which the performance and/or service conditions are fulfilled, ending on the date on which the relevant employees become fully entitled to the award (the vesting period).
No expense is recognised for awards that do not ultimately vest.
19. ContingenciesContingent liabilitiesPerformance guarantees totalling $0.736 million (2019: $3.436 million) have been provided in relation to wind farm construction projects which will expire by 1 May 2022. In addition, other bank guarantees totalling $3.529 million (2019: $4.040 million) have been provided to landlords and work cover authority. There are no other contingent liabilities identified at reporting date.
Boom Logistics Annual Report 2020 73

NOTES TO THE CONSOLIDATED FINANCIAL STATEMENTSfor the year ended 30 June 2020
20. Auditor’s RemunerationDuring the year the following fees were paid or payable for services provided by KPMG Australia:
2020 $
2019 $
Audit services
– audit and review of financial statements 234,099 287,546
Taxation, due diligence and other services
– taxation services 50,848 82,778
– other assurance services 46,575 –
Total taxation and other services 97,423 82,778
Total remuneration of KPMG Australia 331,522 370,324
21. Subsequent EventsThe Board resolved to pay an unfranked interim dividend of 0.5 cents per share on 26 February 2020 with a record date of 31 March 2020. The dividend payment date, originally scheduled for 21 April 2020, was deferred to 2 October 2020 as a prudent measure to preserve cash as a result of the uncertainty created by the COVID-19 situation at that time. The record date for the deferred payment remains 31 March 2020 and the estimated liability based on the number of ordinary shares on issue at that date is $2.1 million. The dividend has not been provided for in the 30 June 2020 year end financial statements.
The Group has entered into a twenty four month, interest free payment plan with the ATO to settle the franking deficit tax liability of $4.447 million that existed at balance date. The Group will make monthly instalments of $185,308 commencing on 24 August 2020 and completing on 25 July 2022.
On 2 August 2020, the Victorian government declared a state of disaster and announced stage 4 restrictions for Melbourne and stage 3 restrictions for regional Victoria. Given the dynamic nature of these circumstances, the economic impact on the Victorian economy is not known. However, as at the date of this report the impact on the Group is not expected to be material.
The Group operates a travel tower business in Melbourne which is a supplier to essential services, telecommunications and energy customers. This business has been able to continue trading during the stage 4 restrictions albeit at a reduced volume. The Group operates a business in the Latrobe Valley that has not been materially impacted by the stage 3 restrictions to date with major customers being designated as essential services allowing trading to continue at similar volumes to normal. Project work in the state has also continued under stage 3 restrictions throughout the period.
The impact of these restrictions will be reflected in the Group’s 2021 interim and annual financial statements.
Section D: Other Disclosures (continued)
Boom Logistics Annual Report 202074

22. New Accounting Policies and Standards
(a) Changes in accounting policiesThe principal accounting policies adopted in the preparation of the financial report are consistent with those of the previous financial year, except for the adoption of the new accounting standards AASB 16 Leases. The nature and effect of the new accounting standard is disclosed below.
Standards AASB 16 Leases
Nature of change The standard removes the classification of leases as either operating leases or finance leases for the lessee, effectively treating all leases as finance leases. This will effectively move all off-balance sheet operating leases onto the balance sheet.
Effective date Mandatory for financial years commencing on or after 1 January 2019.
The Group has adopted the standard using the modified retrospective (option 2) approach which means that the cumulative impact of the adoption will be recognised in retained earnings as of 1 July 2019 and that comparatives have not been restated.
Impact Group as a lessee
The Group has commercial leases on certain plant and equipment, motor vehicles and property. These lease contracts have typically fixed terms of 1 to 5 years but may have extension options. Lease terms are negotiated on an individual basis and contain a wide range of different terms and conditions.
On adoption of AASB 16, leases are recognised as a right-of-use asset and a corresponding lease liability at the date at which the leased asset is available for use. The right-of-use asset is depreciated over the lease term on a straight-line basis. The lease payment is allocated between the lease liability and interest expense. The interest expense is charged to profit or loss over the lease term.
Right-of-use assets are measured at cost comprising the following:
● the amount of the initial measurement of lease liability;
● any initial direct costs; and
● restoration costs.
Boom Logistics Annual Report 2020 75

NOTES TO THE CONSOLIDATED FINANCIAL STATEMENTSfor the year ended 30 June 2020
Standards AASB 16 Leases
Impact (continued) Lease liabilities are measured at the present value of lease payments to be made over the lease term discounted using the interest rate implicit in the lease. If that rate cannot be determined, the Group’s incremental borrowing rate is used, being the rate that the Group would have to pay to borrow the funds necessary to obtain an asset of similar value in a similar economic environment with similar terms and conditions. The present value of lease payments include:
● fixed payments;
● variable lease payments that are based on an index or a rate;
● amounts expected to be payable under residual value guarantees;
● the exercise price of a purchase option if reasonably certain to exercise the option; and
● payments of penalties for terminating the lease.
In determining the lease term, management considers all facts and circumstances that create an economic incentive to exercise an extension option. Extension options are only included in the lease term if the lease is reasonably certain to be extended.
The impact of AASB 16 adoption at 1 July 2019 is as follows:
● Right-of-use assets increased by $26.133 million;
● Property, plant and equipment decreased by $3.738 million;
● Lease receivables increased by $0.654 million;
● Lease liabilities increased by $26.763 million;
● Interest bearing loans and borrowings decreased by $3.726 million;
● Prepayments decreased by $0.556 million;
● Surplus lease space provision decreased by $0.544 million;
● No impact on opening retained earnings;
In applying AASB 16 for the first time, the Group has used the following practical expedients permitted by the standard:
● the use of a single discount rate to a portfolio of leases with reasonably similar characteristics;
● short term leases of 12 months or less and do not contain a purchase option were excluded;
● lease contracts for which the underlying asset is of low value (circa. $10,000) were excluded;
● applied only to leases that were previously identified as leases under the previous AASB 117 and IFRIC 4 standards at 1 July 2019; and
● reliance on previous assessments on whether leases are onerous.
Section D: Other Disclosures (continued)22. New Accounting Policies and Standards (continued)
Boom Logistics Annual Report 202076

Standards AASB 16 Leases
Impact (continued) Payments associated with short-term leases and leases of low-value assets are recognised on a straight-line basis as an expense in profit or loss.
The reconciliation of operating lease commitments disclosed at 30 June 2019 to opening lease liability at 1 July 2019 is as follows:
1 July 2019 $’000
Operating lease commitments disclosed at 30 June 2019 27,885
Adjustments:
– present value using applicable discount rates at date of initial application (1,860)
– add: finance lease liabilities at 30 June 2019 3,726
– less: short-term leases recognised on a straight-line basis as expenses (595)
– less: leases contracted at 30 June 2019 but commencing after 1 July 2019 (2,393)
Lease liability recognised at 1 July 2019 26,763
The impact of AASB 16 on the financial statements for the period is as follows:
2020 $’000
Depreciation expense of right-of-use assets (15,392)
Interest expense on lease liabilities (1,633)
Interest income on sublease of right-of-use assets 110
Gains or (losses) on termination of leases (49)
Rent expense – short-term leases and leases of low value assets (1,033)
Total amounts recognised in profit or loss (17,997)
Net cash flows from operating activities 12,839
Net cash flows from financing activities (12,839)
Note
Right-of-use Assets
Lease Recei-vables $’000
Lease Liabi-lities
$’000
Rental Equip-
ment $’000
Motor Vehicles
$’000
Other Equip-
ment $’000
Land & Buil-
dings $’000
Total $’000
Opening carrying amount (i) 10,982 4,961 122 10,068 26,133 654 26,763
Additions 7,469 3,360 4 1,317 12,150 1,937 10,156
Terminations – (24) – (4) (28) – (24)
Depreciation expense (8,015) (2,660) (56) (4,661) (15,392) – –
Impairment expense – – – (75) (75) – –
Receipts / payments – – – – – (978) (13,772)
Closing carrying amount 10,436 5,637 70 6,645 22,788 1,613 23,123
(i) Right-of-use assets and Lease Liabilities include finance lease balances at 30 June 2019 reclassified from Property, Plant and Equipment and Interest Bearing Loans and Borrowings totalling $3.738 million and $3.726 million, respectively.
Boom Logistics Annual Report 2020 77

NOTES TO THE CONSOLIDATED FINANCIAL STATEMENTSfor the year ended 30 June 2020
Standards AASB 16 Leases
Impact (continued) Group as a lessor
On adoption of AASB 16, several property, plant and equipment leases that were sub-let by the Group were classified as finance leases and recognised as Lease receivables. The sub-leases have terms of between 2 to 3 years.
The maturity analysis of lease receivables showing the undiscounted lease payments to be received after the reporting date is a follows:
2020 $’000
– within one year 1,234
– after one year but not more than five years 443
Total undiscounted lease receivable 1,677
– future finance income (64)
Net lease receivable 1,613
(b) New accounting standards and interpretations not yet adoptedThere were no new standards, amendments to standards and interpretations not yet adopted that impacted the Group in the period of initial application.
Boom Logistics Annual Report 202078

DIRECTORS’ DECLARATIONfor the year ended 30 June 2020
1. In the opinion of the Directors of Boom Logistics Limited (“the Company”):
(a) the Consolidated Financial Statements and notes that are set out on pages 43 to 78, and the Remuneration Report in the Directors' Report, set out on pages 30 to 40, are in accordance with the Corporations Act 2001, including:
(i) giving a true and fair view of the Consolidated Entity's financial position as at 30 June 2020 and of its performance for the financial year ended on that date; and
(ii) complying with Accounting Standards, (including the Australian Accounting Interpretations) and Corporations Regulations 2001; and
(b) there are reasonable grounds to believe that the Company will be able to pay its debts as and when they become due and payable.
2. The Directors draw attention to page 47 to the Consolidated Financial Statements which includes a statement of compliance with International Financial Reporting Standards.
3. There are reasonable grounds to believe that the Company and the group entities identified in note 14 will be able to meet any obligations or liabilities to which they are or may become subject to by virtue of the Deed of Cross Guarantee between the Company and those group entities pursuant to ASIC Corporations Instrument 2016/785.
4. The Directors have been given the declarations required by Section 295A of the Corporations Act 2001 from the chief executive officer and chief financial officer for the financial year ended 30 June 2020.
Signed in accordance with a resolution of the Directors:
Maxwell Findlay Tony Spassopoulos Chairperson Managing Director
Melbourne, 27 August 2020
Boom Logistics Annual Report 2020 79

INDEPENDENT AUDITOR’S REPORTfor the year ended 30 June 2020
INDEPENDENT AUDITOR’S REPORTfor the year ended 30 June 2020
Boom Logistics Annual Report 202080

Boom Logistics Annual Report 2020 81

INDEPENDENT AUDITOR’S REPORTfor the year ended 30 June 2020
Boom Logistics Annual Report 202082

Boom Logistics Annual Report 2020 83

ASX ADDITIONAL INFORMATIONfor the year ended 30 June 2020
Additional information required by the Australian Stock Exchange Ltd and not shown elsewhere in this report is as follows. The information is current as at 27 July 2020.
(a) Distribution of Equity SecuritiesThe number of shareholders, by size of holding, in each class of share are:
Ordinary Shares
Number of Holders
Number of Shares
1 – 1,000 247 42,894
1,001 – 5,000 702 2,433,035
5,001 – 10,000 559 4,407,914
10,001 – 100,000 1,209 42,777,766
100,001 and over 300 378,112,598
3,017 427,774,207
The number of shareholders holding less than a marketable parcel of shares are: 822 1,842,797
ASX ADDITIONAL INFORMATIONfor the year ended 30 June 2020
Boom Logistics Annual Report 202084

(b) Twenty Largest ShareholdersThe names of the twenty largest holders of quoted shares are:
Listed Ordinary Shares
Number of Shares
Percentage of Ordinary
Shares
1 NATIONAL NOMINEES LIMITED 75,966,917 17.8%
2 J P MORGAN NOMINEES AUSTRALIA PTY LIMITED 54,186,815 12.7%
3 HSBC CUSTODY NOMINEES (AUSTRALIA) LIMITED 39,215,389 9.2%
4 GROVE INVESTMENT GROUP PTY LTD 22,097,309 5.2%
5 BNP PARIBAS NOMINEES PTY LTD <IB AU NOMS RETAILCLIENT DRP> 17,755,583 4.2%
6 HORRIE PTY LTD <HORRIE SUPERANNUATION A/C> 7,000,000 1.6%
7 HILLMORTON CUSTODIANS PTY LTD <THE LENNOX UNIT A/C> 5,143,000 1.2%
8 CPU SHARE PLANS PTY LTD <BOL EXEC REM PLAN A/C> 5,003,409 1.2%
9 HORRIE PTY LTD <HORRIE SUPERANNUATION A/C> 5,000,000 1.2%
10 TAVERNERS NO 11 PTY LTD <STONEYVILLE INVEST UNIT A/C> 4,783,507 1.1%
11 GWYNVILL TRADING PTY LTD 3,965,411 0.9%
12MORGAN STANLEY AUSTRALIA SECURITIES (NOMINEE) PTY LIMITED <NO 1 ACCOUNT> 3,773,569 0.9%
13 WALLBAY PTY LTD <THE MICHAEL ABELL S/F A/C> 3,717,457 0.9%
14 LUTON PTY LTD 3,587,005 0.8%
15 NEWECONOMY COM AU NOMINEES PTY LIMITED <900 ACCOUNT> 2,912,878 0.7%
16 S I J NOMINEES PTY LTD <THE S I J PARTNERSHIP A/C> 2,800,253 0.7%
17 STONEYVILLE PTY LTD <PETER SCANLON FAMILY SF A/C> 2,760,559 0.6%
18 BT PORTFOLIO SERVICES LIMITED <MITCHELL FAMILY SUPER A/C> 2,734,933 0.6%
19 MR BERNARD FRANCIS O'NEILL 2,707,844 0.6%
20 TARNI INVESTMENTS PTY LTD <HA & AR MORRIS FAMILY A/C> 2,687,538 0.6%
Top twenty shareholders 267,799,376 62.6%
Remainder 159,974,831 37.4%
Total 427,774,207 100.0%
Boom Logistics Annual Report 2020 85

ASX ADDITIONAL INFORMATIONfor the year ended 30 June 2020
(c) Substantial HoldersSubstantial holders in the Company are set out below:
Listed Ordinary Shares
Number of Shares
Percentage of Ordinary
Shares
Castle Point Funds Management 37,615,645 8.8%
Rorema Beheer B.V. 35,380,342 8.3%
Greig & Harrison Pty Ltd 33,823,181 7.9%
Forager Funds Management Pty Ltd 22,543,977 5.3%
Grove Investment Group Pty Ltd 22,097,309 5.2%
(d) Voting RightsAll ordinary shares (whether fully paid or not) carry one vote per share without restriction.
(e) Unquoted SecuritiesThere are 3,949,678 rights granted under the Executive Remuneration Plan outstanding held by 16 holders.
There are 26,214,991 options granted under the Executive Remuneration Plan outstanding held by 10 holders.
Boom Logistics Annual Report 202086

CORPORATE DIRECTORYfor the year ended 30 June 2020
DirectorsMaxwell J Findlay (Chairperson)Tony SpassopoulosMelanie AlibonJean-Pierre JAM BuijtelsTerrence C FrancisTerence A Hebiton
Company SecretaryMalcolm Ross
Registered OfficeSuite B Level 1,55 Southbank BoulevardSouthbank VIC 3006Telephone (03) 9207 2500Fax (03) 9207 2400
Internetwww.boomlogistics.com.au
Share RegistryComputershare Investor Services Pty Ltd452 Johnston StreetAbbotsford, Victoria, 3067Investor Enquiries 1300 850 505
Annual General MeetingBoom Logistics will hold its 2020 Annual General Meeting on Friday, 27 November 2020.
Boom Logistics Annual Report 2020 87

Boom Logistics Limited (ASX: BOL)
Suite B Level 1,55 Southbank Boulevard
Southbank VIC 3006Telephone (03) 9207 2500
Fax (03) 9207 2400
www.boomlogistics.com.au