annual report electronic heterodyne … heterodyne moire deflectometry - a method for transient and...
TRANSCRIPT

ANNUAL REPORT
July 1987
ELECTRONIC HETERODYNE MOIRE DEFLECTOMETRY - A METHOD FOR TRANSIENT AND THREE DIMENSIONAL DENSITY FIELDS
MEASUREMENTS
Josef Stricker
Technion, Israel Institute of Technology '
Haifa, Israel 32000
Prepared under the U.S. National Aeronautics and Space Administration grant No. NAGW-933.
I h A S A - C f i - l B l l S U ) ELEClBCBiIC E E l E l i U D Y N E N87-2462 1 E C X R k DEFLEClCHklbY: A BE'LECC ECK TBANSIElDT AIL TKfiEE CXflhNSJCIiAL CEBISITY IlELDS EEASUEEHEMlS Annual Rerort (1Ecbnion - Unclas I srae l I n s t - c f 9cch . ) 54 F A v a i l : NTIS 6-3/33 90113029
https://ntrs.nasa.gov/search.jsp?R=19870015198 2018-07-01T06:21:20+00:00Z

Annual Report
ELECTRONIC HETERODYNE M O I R E DEFLECTOMETRY - A METHOD FOR TRANS1 ENT AND THREE DIMENSIONAL DENSITY FIELDS MEASUREMENTS*
Josef S t r i c k e r
Technion, I s r a e l I n s t i t u t e o f Techno logy Ha i fa , I s r a e l 32000
*This p r o j e c t was sponsored by t h e U.S.A. Nat iona l Peronaut ics and Space Admin i s t ra t i on under g ran t No. NAGW-933.

-j -
ACKNOWLEDGEMENTS
The a u t h o r w o u l d very much l i k e t o t h a n k A. Decker and D. Lesco from NASA
Lewis Research Center f o r encouragment and continued i n t e r e s t t h r o u g h o u t t h i s
work.
The f inancial support f o r the present research from the U.S.A. National
Peronautics and Space Wministration i s gratefully acknowledged.

. . -1 1-
ABSTRACT -
Ef fec ts o f d i f f r a c t i o n and n o w 1 i n e a r photograph ic emulsion c h a r a c t e r i s t i c s
on t h e performance o f d e f e r r e d e l e c t r o n i c heteroayne m o i r e d e f l e c t o m e t r y a r e
i nvest igated. The d e f e r r e d a e f lec tomet ry i s used f o r measurements of
non-steaay phase o b j e c t s where i t i s d i f f i c u l t t o complete t h e a n a l y s i s o f t h e
f i e l d i n r e a l t ime . The s e n s i t i v i t y , accuracy and r e s o l u t i o n o f t h e system
a r e c a l c u l a t e d and i t i s shown t h a t t h e y are weakly a f f e c t e d by d i f f r a c t i o n
and b y non- l i nea r reco rd ing .
improved compared w i t h t h e conven t iona l deferred i n t e n s i t y m o i r e technique,
and a r e comparable w i t h t h e on - l i ne heterodyne moire.
exper imental l y b y d e f e r r e d measurements o f t h e r e f r a c t i v e i ndex g r a d i e n t s of a
weak phase o b j e c t c o n s i s t i n g o f a l a r g e KD*P c r y s t a l . T h i s was done b y photo-
graphing t h e phase o b j e c t t h rough a Ronchi g r a t i n g and a n a l y z i n g t h e t r a n s -
parency w i t h t h e e l e c t r o n i c heterodyne readout system.
compared w i t h t h e measurements performed on t h e same phase o b j e c t w i t h o n - l i n e
heterodyne mo i re d e f l ec tomet ry and w i t h heterodyne ho log raph ic i n t e r f e r o m e t r y
methods. A good agreement was observed. Some p r a c t i c a l c o n s i d e r a t i o n s f o r
systewimprovement a r e discussed.
The f e a t u r e s o f t h e system a r e s i g n i f i c a n t l y
The system was eva lua ted
The r e s u l t s a r e
I n t h e second p a r t o f t h e p r o j e c t , an a l g o r i t h m f o r r e c o n s t r u c t i o n o f 3-D
phase o b j e c t s f rom incomple te d e f l e c t i o n s data, has been developea. The
a l g o r i t h m i s based on t h e i n v e r s e Cormack t rans fo rma t ion .
t h e p resen t r e c o n s t r u c t i o n method are: 1. The measured d e f l e c t i o n s a r e r e a d i l y
used i n t h e i n v e r s i o n transform; no numerical d e r i v a t i o n s have t o be performed
l i k e i n t h e case o f i n t e r f e r a n e t r y . 2. No i t e r a t i o n s between t h e o b j e c t domain
and t h e p r o j e c t i o n domain a re necessary. The a l g o r i t h m has been eva lua ted b y
!a computer s i m u l a t i o n ; an a s y m e t r i c a n a l y t i c a l d e n s i t y f i e l d around a
c i r c u l a r opaque o b j e c t was s u c c e s s f u l l y recons t ruc ted .
The advantages o f

-i ii-
TABLE OF CONTENTS
ACKNOWLEDGEMENTS
AB STR AC T
TABLE OF CONTENTS
FIGURE CAPTIONS
PART 1: PERFORMANCE OF M O I R E DEFLECTOMETRY WITH DEFERRED
ELECTRONIC HETERODYNE READOUT
I. INTRODUCTION
A. Background
B. E l e c t r o n i c Heterodyne Method
C. T rans ien t Phase Ob jec ts
11. THEORY
A. I n t e n s i t y Transmission D i s t r i b u t i o n o f t h e Transparency
6. The M o i r e Image
C. Heterodyne Readout
D. Wvantages o f t h e Heterodyne Readout
E. S p a t i a l and Angu lar Reso lu t i on
F. Some P r a c t i c a l Considerat ions
111. EXPERIMENTAL
I V. CONCLUSIONS
Page
i
ii
iii
V
1
1
1
3
4
5
6
7
10
11
1 2
13
1 4
17

-i v-
PART 2: MEASUREMENTS OF 3-D DENSITY F IELDS WITH OPAQUE OBJECTS
BY MOIRE DEFLECTOMETRY
I. INTRODUCTION
11. THEORY
I I I . COMPUTE R S IMULAT ION
I V . CONCLUSIONS
APPEND I X
REFERENCES
FIGURES
19
19
20
23
26
27
33

-V-
FIGURE CAPTIONS -
F i g . 1. Schematics o f a convent iona l moire system. L.S. i s a p o i n t l i g h t
source (may b e a focused l a s e r beam).
and G 2 a r e Ronchi r u l i n g s and S i s a mat t r a n s p a r e n t screen.
M i s a p a r a b o l i c m i r r o r . G1
Fig. 2. Schematic o f t h e setup f o r record ing t h e phase o b j e c t . 8 i s t h e
r e f r a c t i o n angle; R ( x ) i s t h e d is tance f r o m t h e phase o b j e c t a t which
t h e r e f r a c t e d r a y seems t o emerge.
F i g . 3. Schematic o f t h e exper imenta l setup f o r p o s t a n a l y z i n g phase o b j e c t s :
G, Ronchi r u l i n g ; R.S. and T.S., re fe rence and t e s t s i g n a l s
r e s p e c t i v e l y ; G.S., g a t i n g s i g n a l .
Fig. 4. I n t e n s i t y t r a n s m i t t a n c e - exposure curves.
d ) For-. Agfa Gevaei-t lGE75 p l a t e ; +hr\ C I I C A = . r h n A U U J l l C " P I I V \ ) O b U 1 " L i s t h e t h i r d 4 r d e r
p o l y n o m i a l approximat ion, and b) For Kodak G49F p l a t e ; t h e dashed
curve i s t h e second-order polynomial approximat ion.
EL and Eo a r e r e s p e c t i v e l y t h e w i d t h o f t h e l i n e a r p o r t i o n o f t h e
curves and t h e exposure a t which t h e y s t a r t .
F i g . 5. Ca lcu la ted m o i r e i n t e n s i t y vs. phase f o r v a r i o u s v a l u e s o f f . f = 0.0,
0.02, 0.04, 0.10, 0.15, O.a, 0.25, 0 . 3 , 0.35, 0.40, 0.45, and 0.50
f o r ( a ) , ( b ) , ( c ) , ( d ) , ( e ) , ( f ) , ( g ) , ( h ) , ( i ) , d j ) , ( k ) , and ( 1 )
r e s p e c t i v e l y . I n each f i g u r e , t h e upper two curves a r e t o r
Agfa-Gevaert 10E75 p l a t e s prefogged w i t h exposure Eo = 1 2 erg/cmL
2 2 and w i t h E ' = 8 erg/cm and E ' = 18 erg/cm f o r t h e s o l i d l i n e and
dashed l i n e , r e s p e c t i v e l y .
w i t h Eo = 0 and E ' = 55 uJ/cm . The lower c u r v e i s f o r Kodak 649F p l a t e s
2

-v i-
Fig. 6: x - d e r i v a t i v e o f r e f r a c t i o n index f o r f l o w s imu la to r .
a) De fe r red heterodyne moi r e
b) On-l ine heterodyne mo i re .
x - d e r i v a t i v e o f r e f r a c t i o n index f o r f l o w s i m u l a t o r - heterodyne
ho log raph ic i n t e r f e r o m e t r y .
F ig . 8: O b j e c t f i e l d and t h e geometry o f t h e t ransform.
Fig. 9: The o b j e c t f u n c t i o n used i n t h e study o f t h e a lgo r i t hm.
f u n c t i o n s i s d e f i n e d b y Eq. 12.
F i g . 7:
The
The segment rt0.6Ro i s miss ing .

1 -1-
PART 1 PERFORMANCE OF M O I R E DEFLECTOMETRY WITH DEFERRED
ELECTRONIC HETERODYN READOUT
, I I. I NTRODUCT I O N I
- I I
M o i r e d e f l e c t o m e t r y i s a s imp le technique f o r o p t i c a l t e s t i n g o f phase
I o b j e c t s and s p e c u l a r surfaces, based on the mo i re e f fec t le4 . The method
prov ides mapping o f r a y d e f l e c t i o n s caused e i t h e r b y a phase o b j e c t o r upon
r e f l e c t i o n f r o m a sur face . From t h i s i n fo rma t ion t h e i ndex o f r e f r a c t i o n
f i e l d o f t h e phase o b j e c t o r t h e q u a l i t y o f t h e r e f l e c t i n g s u r f a c e a r e
obtained.
a r t i c l e by K a f r i and G l a t t 5 .
A summary o f p rogress th rough 1984 i s c o n t a i n e d i n t h e r e v i e w i n g
I
A. Background -
A conven t iona l mo i re de f lectometer c o n s i s t s o f t w o i d e n t i c a l Ronchi
g ra t i ngs , a c o l l i m a t e d l i g h t source and a d i f f u s i n g screen a t tached t o t h e
o u t p u t g r a t i n g . A schematic d e s c r i p t i o n o f t h e system i s shown i n F i g . 1.
The g r a t i n g s a r e shown separated by a d i s tance A and t h e i r l i n e s a r e r o t a t e d
r e l a t i v e t o each o t h e r by a sma l l a n g l e e.
passes th rough t h e g r a t i n g s a m o i r e p a t t e r n i s produced on t h e screen.
When a c o l l i m a t e d l i g h t beam
The
p a t t e r n c o n s i s t s of s t r a i g h t f r i n g e s perpend icu la r t o t h e o r i g i n a l g r a t i n g
l i n e s , separa ted b y a d i s t a n c e ' o f p "
where p i s t h e p i t c h o f t h e g r a t i n g s .
The m o i r e e f f e c t f o r ve ry smal l g r a t i n g s e p a r a t i o n d i s t a n c e c a n be
exp la ined b y pu re geomet r ica l o p t i c s . However, when g r a t i n g separa t i on
increases, d i f f r a c t i o n i n t roduces undesired e f f e c t s which l i m i t t h e
performance o f t h e To minimize these e f f e c t s , t h e d i s t a n c e A
between t h e g r a t i n g s must be e x a c t l y one o f t h e Four ie r image p lanes of t h e

-2-
g ra t i ngs namely6’’
2 A R = R - P
x R = l , 2 , 3 .... For these distances, t h e f r i n g e c o n t r a s t w i l l be maximum. M e n
t h e f r i n g e s w i l l van i sh completely. I n Eqs. ( 2 ) and ( 3 ) x i s t h e wavelength
o f t h e c o l l i m a t e d l i g h t beam.
I t t h e c o l l i m a t e d l i @ t i s r e f r a c t e d by a phase o b j e c t b e f o r e i t e n t e r s
t h e de f lec tometer , t h e o r i g i n a l s t r a i g h t p a r a l l e l mo i re f r i n g e s w i l l be
d i s t o r t e d .
r
d x ( r ) , t h e ang le o f r e f r a c t i o n i n t h e x - a i r e c t i o n a t a p o i n t
Y x,y, i s r e l a t e d t o t h e f r i n g e s h i f t sh (r) i n t h e y - a i r e c t i o n by
By measuring sh ( r ) , Q x ( r ) can be ca lcu la ted . I n t u r n , t h e x component o f Y
t h e index o f r e f r a c t i o n g r a d i e n t may be c a l c u l a t e d b y u s i n g t h e equat ion 1
o r
where z and z f a r e t h e boundar ies o f t h e phase o b j e c t a long t h e l i n e o f
s i g h t , n i s t h e i ndex o f r e f r a c t i o n which i s r e l a t e d t o t h e d e n s i t y p b y
0
n - l = G p ( 7 )

-5-
where t h e c o e f f i c i e n t G i s t h e Gladstone-Dale constant , a f u n c t i o n o f t h e 0
wavelength 1. For a i r , a t a wavelength o f x = 6328 A, G = 0.227 cm 3 / g r . n f i s
t h e index o f r e f r a c t i o n o f t h e medium surround
B. E l ec t ron i c Heterodyne Method
Recently, t h e accuracy and s e n s i t i v i t j o f
ng the o b j e c t .
he moire method, f o r o n - l i n e
r e a l t ime measurements, has been s i g n i f i c a n t l y improved b y app ly ing the
heterodyne technique f o r r e a d i n g t h e d e f l e c t i o n s o f t h e moire f r i n g e s 8-1 U . The b a s i c idea of t h e heterodyne technique i s t o measure t h e phase o f t h e
s i g n a l from a photodetector d e t e c t i n g the l i g h t t r a n s m i t t e d through a
t r a v e l l i n g mo i re f r i n g e p a t t e r n . The moving f r i n g e s may be accomplished b y
t r a n s l a t i n g t h e ou tpu t g r a t i n g G2 r e l a t i v e t o GI a t a cons tan t speed V i n
t he x -d i rec t i on . M e n t h e c o l l i m a t e d l i g h t i s n o t d i s t u r b e d by t h e phase
o b j e c t ( s t r a i g h t l i n e f r i n g e s ) , t he f i r s t harmonic o f t he photodetector s i g n a l
i s g iven by9
1 (Y,A*,t) = 7 * COS(nA*)COS[2n(t + f + t ) ] n
where A * = ~ / ( p ~ / x ) i s t he d i s tance between t h e g ra t i ngs i n Four ie r u n i t s and
x / p and y e l p a r e phase s h i f t s r e l a t e d t o the r e l a t i v e t r a n s l a t i o n and r o t a t i o n
o f t h e Konchi g ra t i ngs .
t h e t w o g -a t ings . Q i s t h e fundamental frequency
Here x i s t h e x -d i rec ted o f f s e t between t h e l i n e s o f
V Q = 2 n - P
I n d e r i v i n g Eq. 8 t h e f o l l o w i n g assumptions were maae:
1. Parax ia l approximat ion.
2.
3. S m a l l e .
4. Fresnel d i f f r a c t i o n .
Slow v a r i a t i o n s o f t he phase o b j e c t over a p i t c h scale.

-4 -
The e f f e c t o f r e f r a c t i o n by a phase ob jec t i s t o i n t roduce a phase s h i f t 9
A procedure f o r measuring t h i s phase s h i f t i s t o r e c o r d t h e e l e c t r o n i c phase
r e l a t i v e t o t h a t o f a re fe rence s i g n a l , w i t h and w i t h o u t t h e mase o b j e c t , and
s u b t r a c t i n g t h e two phases. Equations (4 ) and ( 6 ) a r e then usea t o compute
t h e p -oper t i es o f t h e phase ob jec t .
accomplished f o r b e t t e r than a degree, f r i n g e i n t e r p o l a t i o n accurac ies b e t t e r
than 1 /360 f r i n g e a r e poss ib le .
Since phase measurements can be
C. T rans ien t Phase Objects
'Men unsteady phenomena occur, i t f s d i i f i c u i t t o cui i i i j ie ie the ai ialys-is o f
t h e whole f i e l d i n r e a l t ime. I n these cases, i t i s necessary t o f reeze the
phase o b j e c t and post-analyze i t a f t e r the f a c t 11,12. f i e idea o f app ly ing
t h e e l e c t r o n i c heterodyne readout technique f o r t h e de fe r red moire f r i n g e s
readout was r e c e n t l y c~emonstrated '~.
g a t i n g (see F ig. 2 ) i s rep laced by a whotographic p l a t e .
recorded on t h e photographic p l a t e b y exposing i t t o t h e c o l l i m a t e d beam
t ransmi t ted through t h e phase o b j e c t and the f i r s t g a t i n g , thus t h e d i s t o r t e d
image o f t h e f i r s t g r a t i n g due t o r e f r a c t i o n b y t h e phase o b j e c t i s recordea.
I n t h i s case, t h e second Ronchi
The phase o b j e c t i s
Readout i s accomplished b y p l a c i n g the moving g r a t i n g immediate ly i n back o f
t he processed photographic p l a t e as shown i n F i g . 3. When t h e combinat ion i s
i l l u m i n a t e d , a t i m e v a r y i n g s i g n a l i s obta ined and analyzed by the heterodyne
technique i n a manner s i m i l a r t o t h a t descr ibea f o r t he o n - l i n e case.
The purpose o f t h i s work i s t o i nves t i ga te , b o t h a n a l y t i c a l l y and
exper imen ta l l y , t h e e f fec ts o f d i f f r a c t i o n and non-1 inear response o t t he
photographic f i l m on t h e performance o f t h e de fe r red heterodyne moire

-5-
de f lec tomet ry .
be eva lua ted and compared w i t n those o f t he r e a l - t i m e moi re d e f l e c t i o n
method.
method w i l l be discussed.
The r e s o l u t i o n , accuracy, and s e n s i t i v i t y o f t h e method w i l l
Some p r a c t i c a l cons ide ra t i ons f o r t h e most e f f i c i e n t use o f t h i s
I n t h e n e x t sec t i on , t h e t h e o r y o f t hemethod i s presented and i n Sec. I11
mapping t h e index o f r e f r a c t i o n o f a weak phase o b j e c t u s i n g t h i s method i s
demonstrated.
11. THEORY
As mentioned above t h e measurements o f t h e d e n s i t y f i e l d o f a t r a n s i e n t
phase o b j e c t i n v o l v e s t h r e e s teps: Recording, mo i re f r i n g e fo rmat ion , and
e l e c t r o n i c heterodyne readout .
g r a t i n g i s recorded on a photograph ic p l a t e when p laced i n t h e p o s i t i o n o f t h e
second g r a t i n g - Fig. 2.
pass ing th rough t h e phase o b j e c t . The photographic p l a t e i s l a t e r processed
t o a t ransparency, which l a t e r i s r e f e r r e d t o as t h e phase o b j e c t
t ransparency.
reasons :
1. R e f r a c t i o n b y t h e phase o b j e c t .
2. D i f f r a c t i o n b y t h e Ronchi g r i d .
3.
F i r s t , the d i s t o r t e d shadow o f t h e f i r s t
The g r a t i n g i s i l l u m i n a t e d w i t h t h e c o l l i m a t e d beam
The d i s t o r t i o n of t h e grooves o f G a re ma in l y caused b y t h r e e
Non-1 i n e a r response of t h e photographic emulsion.
This s tep i s repeated when t h e phase o b j e c t i s absent, t h e t ransparency
ob ta ined i s c a l l e d t h e r e f e r e n c e transparency.
t h e grooves may be d i s t o r t e d as a r e s u l t o f d i f f r a c t i o n and non- l i nea r
p h o t o g r aph i c e f f e c t s .
Even i n t h i s case t h e image o f
Next, t h e m o i r e f r i n g e s a re formed by p l a c i n g t h e shadow t ransparency i n
f r o n t o f t h e second Ronchi g ra t i ng .
moi re f r i n g e s are observed.
g r a t i n g a r e i n contac t , t h e fo rma t ion of moire f r i n g e s i s a p u r e l y geomet r i ca l
e f f e c t .
When t h e combinat ion i s i l l u m i n a t e d ,
S ince the shadow t ransparency and t h e Ronchi

-6 -
The readout s t e p i s accomplished b y t r a n s l a t i n g t h e g r a t i n g ( thus causing
t h e moire f r i n g e s t o move) and r e c o r d i n g the phase o f t h e s i g n a l o u t p u t o f t h e
photodetector (F ig . 3 ) as descr ibed f o r the o n - l i n e case.
I n t h e course o f c a l c u l a t i n g t h e output s i g n a l o f t h e photoaetector we
w i l l f o l l o w t h e t h r e e s t e p s descr ibed above.
A. I n t e n s i t y Transmission D i s t r i b u t i o n o f t h e Transparency
Assuming an i n f i n i t e Ronchi g r a t i n g w i t h square wave l i n e p r o f i l e
i l l u m i n a t e d b y an i n f i n i t e beam, and assuming Fresnel d i f f r a c t i o n , t h e
i n t e n s i t y d i s t r i b u t i o n o f t h e beam passing through t h e phase o b j e c t and t h e
Ronchi g r a t i n g a t a d i s t a n c e A (where t h e photographic p l a t e i s l o c a t e d ) i s
g iven b y : 7
m
C O S C n (2n+l )%A*] + s in [2n (2n+ l ) u t 1
( 2 n + l ) I ( u , A * , ~ ) = u{: + 2 1 n n=O
m
+ - 4 1 sin2[2n(2n+l )uQ
(2n+l n nkn 2 n n=O + s i n 2n(Zm+l)u5 cOS{nuA*[(2n+1)2- (Zm+l)']}}
where 5 = x l p , u = m- R ( x ) and R ( x ) and d x ( r ) a r e d e f i n e d i n F i g . 1. I n
d e r i v i n g Eq. (11) t h e p a r a x i a l approximat ion was assumed, which i n t h i s case
means t h a t k ( x ) >> A , X .
i n t e n s i t y i n Eq. (11) i s p r a c t i c a l l y inaependent on t h e o r i g i n of
coord inates.
o f t h e photographic p l a t e i s p r o p o r t i o n a l t o t h i s s p a t i a l l y v a r y i n g i n t e n s i t y .
Accoraing t o t h i s assumption i t i s c l e a r t h a t t h e
l a t e t h a t when no phase o b j e c t e x i s t s , u = 1. The t ransmi t tance
G e n e r a l l y i t i s assumed t h a t t h e r e i s a l i n e a r r e l a t i o n between I T 1 2 ,
t h e i n t e n s i t y t ransmi t tance o f t h e photographic p l a t e , and t h e exposure E.
However, t h e a c t u a l f T I - E curves f o r photographic m a t e r i a l s a r e always 2

-7-
nonlinear t o some degree.
Agfa-Gevaert lOE75 p l a t e and f o r a 649F Kodak p l a t e , respectively.
Figures 4a and 4b display the IT12-E curves f o r a
In the
f igure , Eo denotes the exposure a t which the 1 inear region s t a r t s and E L
denotes t h e width of t h e l i nea r portion o f t h e curve.
If t he photographic p l a t e i s uniformly prefogged by exposure E o , and
illuminated by a pa t te rn of amplitude E ' ( the t o t a l exposure i s Eo + E ' )
then a moderate portion o f the IT1 '-E curve can be approximated by a cubic
polynomial,
3 ( T I 2 = R o + R 1 ( E o + E ' ) + R 2 ( E o + E ' ) 2 + R 3 ( E o + E ' )
Figure 4a i l l u s t r a t e s t h e polynomial approximation f o r t h e Agfa-Gevaert p l a t e
with Eo = 1 2 erglcm , 0 2 2 2
E ' - < 18 erglcm , R o = 1.1847, R1 = -7.4385 x 10- -3 -r;
R = 1.5550 x 10 , and R3 = -1.0726 x 10 *. In t h i s exposure range, the t h i r d order 2 term i s small and may be neglected. The dashed curve i n Fig. 4b i s a quadrature
2 polynomial approximation f o r t h e Kodak plate; here E o = 0 , 0 < - E ' - < 5 3 d / c m ,
R o = 8.6668 x 10- , R1 = -5.3625 x 10- , and R2 = - 7.3440 x Replacing
E' i n Eq. 1 2 by I , given in E q . 11, times the in t ens i ty of t h e collimated
l i g h t beam used f o r i l lumination, IT1 may be wr i t ten as
1 3
2
where the coe f f i c i en t s ao, al, and a2 include a l l the parameters which
appear i n E q . 1 2 and the in tens i ty of t h e l i g h t beam used f o r the i l lumination.
B. The Moire Image
T h e moire image i s evaluated by multiplying t h e in t ens i ty transmittance
d is t r ibu t ion of t h e transparency and t h a t of t h e grat ing, and averaging t h e

-8 - product over a p i t c h d is tance, namely 6
where IT12 i s g iven i n Eq. 13 and G, t h e i n t e n s i t y t ransmi t tance d i s t r i b u t i o n
o f t h e g r i d i s represented by a F o u r i e r se r ies 7
where x l p and y e l p r e p r e s e n t t h e phase s h i f t s r e l a t e d t o t h e r e l a t i v e
t r a n s l a t i o n and r o t a t i o n o f t h e Ronchi grat ing. G i s n o t a f f e c t e d b y
d i f f r a c t i o n s i n c e t h e l i @ t i n t e n s i t y i s measured d i r e c t l y beh ind t h e g r a t i n g .
M e n Eqs. ( l l ) , (13) and (15 ) a r e s u b s t i t u t e d i n Eq. (14) and t h e
i n t e g a t i o n i s pertormed, we get:
C O S ( n U A q (2k+1)2-(2a+1) 2 11 d(m,n,k,a ( 2 k + l ) ( 2 a + 1 ) X
2 4a2u 2
, and 2a1u a2U 2 2
t3 2 9 E = 4
a. alu 3a2u a2U where A = - + - - - 32 , €3 = 7, C = 7, D t 2 + - 2 4
a(m,n,k,a) = si (n-rn)-(k-a)] + a[ (n-rn)-(a-k)j + 6[ (n+m)-(a+k)] - 6 [ (n-m)-(k+a+l) ]
- a[ (m-n)-(k+a+l)] - S[ (n+m)-(k-!L-l)] - s[ (n+m)-(R-k-l)], where each 6 on the
n n n n n

-9-
r i g h t hand s i d e o f t h e equat ion i s t h e Kronecker 6 .
As seen f rom Eq. 16, t h e moire image i s s t r o n g l y a f f e c t e d by d i f f r a c t i o n
(associated w i t h t h e f i r s t Ronchi g r a t i n g ) and b y n o n l i n e a r reco rd ing . S ince
t h e convent ional deferred d e f lec tomet ry suggests ana lyz ing t h e mo i re p a t t e r n
b y measuring t h e t r a n s m i t t e d intensity11912, i t i s i n t e r e s t i n g t o d i s p l a y
t h e m i r e image as c a l c u l a t e d i n Eq. 16. F igures 5a-51 i l l u s t r a t e t h e m o i r e
i n t e n s i t y v s t h e phase (x /p+ye/p ) , f o r var ious grat ing-photograpni c p l a t e
d is tances. A l l cu rves shown a r e w i t h o u t a phase o b j e c t i .e . u = 1 and
6, = 0. R
v a r i e d i n t h e range o f 0.00-0.50.
f i g u r e t h e two upper curves a r e t h e r e s u l t s f o r Agfa-Gevaert p l a t e s , prefogged
w i t h Eo = 1 2 erg lcm and exposed, through t h e g r a t i n g , b y a c o l l i m a t e d beam
w i t h E ' = 8 erg/cm and E ' = 18 erg/cm f o r t he s o l i d and dashed curves,
r e s p e c t i v e l y .
E ' = 55 pJ/cm . Exposure o f E ' = 8 ergicm f a l l s i n t h e 1 inear r e g i o n o f
t h e Agfa-Gevaert IT f - E curve, t h u s t h e E ' = 8 erg/cn? moi re i n t e n s i t y
curves e x h i b i t o n l y e f f e c t s o f d i f f r a c t i o n .
The d i s tances a re A = A + f a 1 where f i s a f r a c t i o n t h a t was
A and hl a re de f ined i n Eq. 2. I n each R
2
2 2
The lower s o l i d curves are f o r Kodak p l a t e s w i t h Eo = 0 and
2 2
The e f f e c t s o f n o n l i n e a r
reco rd ing may be observed b y conpar ing the E ' = 8 erglcm' curves w i t h the
E ' = 18 e r g / & and w i t h t h e E ' = 55 pJ/cm curves which are a f f e c t e d b o t h
b y d i f f r a c t i o n and n o n l i n e a r record ing .
2
F o r f = 0 a t r i a n g u l a r wave fo rm i s obtained, b o t h f o r t he l i n e a r and
non l i nea r cu rves (F ig . 5a). A t t h i s distance, t h e exac t dependence of t h e
moire image on t h e phase i s known, t h u s n e i t h e r d i f f r a c t i o n n o r n o n l i n e a r i t y
a f f e c t t h e accuracy and s e n s i t i v i t y o f t h e system7. As f increases, t h e
behaviour i s changed: t h e maxima and minima a r e rounded, t h e c o n t r a s t i s
reduced and h i g h e r s p a t i a l f requency waves a re superimposed on t h e t r i a n g u l a r
wave. These changes a r e more promunced i n t h e n o n l i n e a r curves, and t h u s may

-1 0-
i n t roduce higcler u n c e r t a i n t i e s i n t h e d e f l e c t i o n measurements.
t h e wave form i s again t r i a n g u l a r , b u t w i t h lower c o n t r a s t as compared t o t h a t
o f f = 0.
c o n t r a s t i s zero. These r e s u l t s a r e of p r a c t i c a l importance s i n c e
exper imen ta l l y i t i s h a r d t o a d j u s t t h e spacing between t h e Ronchi g r a t i n g and
t h e p h o t o g a p h i c p l a t e t o be e x a c t l y one o f t h e F o u r i e r image planes,
e s p e c i a l l y i n t h e case o f an a r b i t r a r y phase o b j e c t where such a s i n g l e
spacing, f o r t h e whole o b j e c t , does n o t e x i s t 6 9 7 .
A t f = 0.25
A t f = 0.50 t h e i n t e n s i t y i s independent o f t h e phase and t h e
C. Heterodyne Readout
As i n t h e case o f t h e on - l i ne heterodyne moire, t h e heterodyne readout i s
accomplished b y t r a n s l a t i n g t h e Ronchi g a t i n g r e l a t i v e t o t h e photographic
t ransparency i n t h e x -d i rec t i on .
move i n t h e y - d i r e c t i o n .
V, t h e phase o f t h e moi re image w i l l va ry w i t h t i m e as
The motion w i l l cause t h e moire f r i n g e s t o
Assuming a l i n e a r mot ion o f t he g r a t i n g w i t h speed
V where R = ~ I I - If t h e h ighe r harmonics o f t h e s i g n a l g iven b y Eq. 16 P '
a re f i l t e r e d ou t , t h e s i g n a l i s g iven by:
x y€4 @xA R MTl(r,R,A,t,@,) = cos[2n(- + - + - + - t ) ] { D C O S ( ~ U A * ) + P P P 2 n (18) . .
OD
s(m,n=o,k,a)) C O S r n U A* (h1+1 )2 ] Cos( nU A? (2k+ l )2- (2E+1 )*]I 2m+ 1 (2k+ l ) (2a+1) + E c
m,k ,a=O
The fundamental f requency component o f Eq. (16) , f o r t h e re fe rence
t ransparency i s :

I
1 1
-11-
(19) I
Comparing the transmitted s ignals w i t h and without the phase object , i t i s
seen t h a t the e f f ec t o f refract ion i s t o introduce a phase sh i f t &( r ) given
already discussed i n connection w i t h E q . 10.
mase s h i f t i s s imilar t o t h a t described for the on-line heterodyne
The procedure for measuring this
def iectmetry- y - 1 0 = . of t h e s-;gnal, ...,.19+i,,* ~ c i a b i v c t~ 5 reference signa!
is measured twice a t each point on the combination transparency-grating: once
w i t h the transparency recoraed w i t h the phase object a n d once w i t h the
transparency recorded without the phase object. The difference between the
two readings gives the absolute phase s h i f t given by Eq. 20. The reference
signal i s the o u t p u t o f a motodetector placed a t a fixed point i n part of the
fr inge pattern n o t affected by the phase object.
0. Advantages o f the Heterodyne Readout
The theoretical analysis above shows some o f the aavantages o f the
deferred e lec t ronic heterodyne readout technique over the conventional
deferred in tens i ty readout method:
1. The er rors introduced because of inaccurate p o s i t i o n i n g o f the
photographic plate precisely on one o f the Fourier planes (d i f t r ac t ion a n d
the nonlinear recoraing e f f e c t s ) a r e small compared w i t h those i n
in tens i ty measurements. This i s t rue since the electronic phase recording

-1 2-
o f the fundamental frequency signal i s insens
contrast var ia t ions and t o the f i n e structure
t i v e t o small f r inge
of t he fr inges ( s e e F i g ,
2. Variations of in tens i ty over the f r i n g e pat tern due t o opt ical
imperfections and other e f f ec t s d o n o t a f f ec t the phase measurements s
the phase i s computed a s a quotient of two in tens i ty terms’. However,
f o r i n t ens i ty measurements, th i s effect may lead t o s ign i f i can t e r rors .
The e lec t ronic heterodyne method has the a b i l i t y t o interpolate
continuously between fr inge maxima, and has computer compatibil i ty.
I n principle, by u s i n g the t h i r d harmonic term of Eq. 16 ( w i t h the time
varying phase term 3 & t ) the electronic phase of 3 ~ $ w i l l be measured,
which i s equivalent t o t r i p l i n g the sens i t iv i ty of t he system’.
3.
4.
5)
nc e
E. Spatial ana b g u l a r Resolution
Diffraction e f f ec t s , detector aperture and e lec t ronic i nstrumentation
determine t h e spa t i a l and a n g u l a r resolution of t h e system.
nonlinear photographic recordings d o not affect the resolution of the system,
t h e resu l t s of t h e spa t ia l and angular resolution obtained f o r t h e on-line
Since the
deflectometry are v a l i d f o r the present deferred case 9 . The spa t i a l resolution of t h e system is
where p * = p / p i s the dimensionless s i z e o f the detector.
The a n g u l a r resolution i s given by:
where A* = Alp.

-1 3-
I F. Some P r a c t i c a l Consiaerat ions
It i s impor tan t t o p o i n t o u t t h a t t h e f i n a l accuracy and s e n s i t i v i t y o f I I measuring phase A$ i s s t r o n g l y dependent on t h e manner i n which i t i s
p r a c t i c a l l y performed.
1. The e l e c t r o n i c processing o f t h e photographic t ransparenc ies i s performed
on a separa te bench. The procedure for measur ing A$ (Eq . 20) i s t o r e c o r d
t h e e l e c t r o n i c phase, r e l a t i v e t o t h a t o f a re fe rence s i g n a l twice: once
when t h e m a s e o b j e c t t ransparency i s p laced i n f r o n t o f t h e g r a t i n g and
once w i t h t h e r e f e r e n c e transparency i n f r o n t o f t h e g r a t i n g .
ob ta ined b y s u b t r a c t i o n o f t h e readings. It i s c l e a r t h a t t h e accuracy o f
t he system and t h e a b i l i t y t o measure smal l d e f l e c t i o n s i s dependent on
the c a p a b i l i t y t o accu ra te l y p lace the two t ransparenc ies p r e c i s e l y i n t h e
same p o s i t i o n r e l a t i v e t o t h e g r a t i n g and t o t h e de tec to rs .
misal ignments w i l l r e s u l t i n considerable e r r o r s i n t h e measurea phases
and thus i n f r i n g e d e f l e c t i o n s .
P r a c t i c a l l y t h e phase meter ou tpu t i s aependent on t h e v i s i b i l i t y o f t h e
f r i n g e s and on t h e d i s t o r t i o n s o f t h e f r i n g e p r o f i l e caused b y t h e
nonl i nea r reco rd ing .
t h e e r r o r o f phase read ing .
non l i nea r r e c o r d i n g which a f f e c t s the measurement as w e l l .
fo rming t h e transparencies, one must compromise between those two e f f e c t s .
I n t h e prev ious s e c t i o n i t was mentioned t h a t b y u s i n g t h e t h i r d harmonic
I
A$ i s then
Small
2.
I nc reas ing t h e v i s i b i l i t y , on t h e one hand, reduces
On t h e oJher hand i t increases t h e e f f e c t s o f
Thus i n
component o f t h e mo i re s i g n a l , i t i s poss ib le t o t r i p p l e t h e s e n s i t i v i t y o f
t h e system.
m a t e r i a l i z e t h i s u s e f u l f e a t u r e s i n c e the t h i r d harmonic s i g n a l i s weak ana
thus the s igna l - to -no ise r a t i o is low.
I t i s wor thwh i le t o p o i n t out t h a t p r a c t i c a l l y i t i s hard t o

-14-
I I I. EXPERIMENTAL
The de fer red e l e c t r o n i c heterodyne technique was eva lua ted b y measuring
-
smal l f r i n g e s h i f t s caused b y a weak phase o b j e c t .
a l a r g e c r y s t a l o f KD*P whose r e f r a c t i v e index d i s t r i b u t i o n c o u l d b e changed
when vo l tages a r e a p p l i e d t o t h e e lec t rodes mounted on t h e c r y s t a l .
d e t a i l e d d e s c r i p t i o n of t h i s phase o b j e c t , a so-ca l led gas-f low s imu la to r , i s
g i v e n i n Ref. 15. The f l o w s i m u l a t o r was chosen t o be t e s t e d because o f two
reasons: a. The f l o w s i m u l a t o r was p r e v i o u s l y i n v e s t i g a t e d b y t h e e l e c t r o n i c
heterodyne ho lograph ic i n t e r f e r o m e t r y and b y t h e on-1 i n e e l e c t r o n i c heterodyne
moi re d e f l e c t o m e t r y methods9910.
which serve as a comparison makes i t p o s s i b l e t o e v a l u a t e t h e system. b. The
f l o w s i m u l a t o r i s a v e r y weak phase o b j e c t which e x h i b i t s a f i n e s t r u c t u r e
c l o s e t o t h e l i m i t o f t h e angular and s p a t i a l r e s o l u t i o n o f t n e system.
a b i l i t y t o measure such a phase o b j e c t v a l i d a t e s t h e t h e o r e t i c a l p r e d i c t e d
performance.
The phase o b j e c t used was
A
The a v a i l a b i l i t y of t h e s e measurements,
The
The m o i r e setuD f o r r e c o r d i n g t h e phase o b j e c t was t h e same a s t h a t
descr ibed p r e v i o u s l y f o r t h e on-1 i n e experiment’ except t h a t t h e second
g r a t i n g was r e p l a c e d b y a photographic p la te .
p l a t e s .
kv was a p p l i e d t o t h e c r y s t a l .
c r y s t a l i n p lace, b u t w i t h o u t t h e vo l tage.
We used A g f a - k v a e r t DE75
The phase o b j e c t t ransparency was recorded when t h e h i g h v o l t a q e o f 5
The reference r e c o r d i n g was per formed w i t h t h e
Other parameters i n t h e exper iment were t h e same as t h o s e i n Ref. 9,
namely: t h e s e p a r a t i o n between t h e g r a t i n g and t h e photograph ic p l a t e was A =
32 cm, t h e g r a t i n g p i t c h was p = 0.17 mm t h u s x* = 3 . 2 7 ~ 1 0 - ~ , A* = 7, t h e
s p a t i a l r e s o l u t i o n , c a l c u l a t e d f rom Eq. 2 1 was A X = 3.1 mm and t h e angu lar
r e s o l u t i o n , f r o m Eq. 2 2 was = 1 . 5 ~ 1 0 - ~ rad.
The e l e c t r o n i c process ing o f t h e developed photographic p l a t e s was
performed on a separa te bench. The d i s t o r t e d m o i r e f r i n g e s were observed when

-15-
t h e phase o b j e c t t ransparency was p laced i n f r o n t o f t h e Ronchi g r a t i n g and
i l l u m i n a t e d b y t h e c o l l i m a t e d beam. The separa t ion between t h e f r i n g e s , i n
t h e r e g i o n away from t h e phase o b j e c t measured p ' = 4.47 mm.
was as fo l lows: w h i l e t h e g r a t i n g was i n mot ion and t h e r e f e r e n c e d e t e c t o r was
f i x e d a t one p o s i t i o n , t h e t e s t d e t e c t o r was moved i n t h e y d i r e c t i o n u n t i l
the phase meter ou tpu t covered e x a c t l y 360" i n d i c a t i n g t h a t t h e d e t e c t o r had
moved a d i s t a n c e equal t o p ' , t h e p e r i o d o f t h e m o i r e f r i n g e s .
The measurement
The f r i n g e mot ion was achieved b y engaging t h e g r a t i n g , as descr ibed i n
Ref. 10, t o an e l e c t r i c a l v i b r a t o r . The de tec to rs and t h e r e s t o f t h e
e l e c t r o n i c system were t h e same as t h o s e descr ibed i n Ref . 10. The phases
r e l a t i v e t o t h e re fe rence de tec to r , were recorded b y a t h e t e s t d e t e c t o r a long
t h e c e n t e r 1 i n e o f t h e c r y s t a l ' s image, a t s t a t i o n s separated b y 1 mm.
A t t h i s p o i n t t h e phase o b j e c t t ransparency was rep laced b y t h e re fe rence
t ransparency and phases were recorded e x a c t l y a t t h e same s t a t i o n s as be fore .
The exac t p o s i t i o n s o f t h e d e t e c t o r were determined b y an i n t e r f e r o m e t e r . A
p o i n t b y p o i n t s u b t r a c t i o n o f t h e phases, w i t h and w i t h o u t t h e phase o b j e c t ,
y i e l d t h e phase s h i f t as a f u n c t i o n o f p o s i t i o n and t h u s t h e i ndex o f
r e f r a c t i o n g rad ien t vs. p o s i t i o n .
r e s u l t s show t h a t t h e measurements were performed c lose t o t h e angular and
s p a t i a l r e s o l u t i o n l i m i t s . I nd i ces o f r e f r a c t i o n o f t h e o r d e r 2 ~ 1 0 - ~ cm-I
were measured and t h e peak s t r u c t u r e o f s p a t i a l s c a l e o f 3-7 mm was reso lved .
F i g u r e 6b d i s p l a y s t h e r e s u l t s measured w i th t h e o n - l i n e heterodyne
The r e s u l t s a r e shown i n F i g . 6a. The
def l ec tomet ry method.
i n t e r f e r o m e t r y method a r e shown f o r comparison i n F i g . 7.
t h a t w i t h i n t h e e r r o r l i m i t s , t h e r e s u l t s ob ta ined b y t h e t h r e e methods agree
v e r y w e l l . I t i s seen t h a t t h e de fe r red r e s u l t s a r e c o n s i s t e n t l y h igher ,
except a t t h e t o p of t h e t h i r d peak, than those ob ta ined b y t h e two o t h e r
The r e s u l t s obta ined w i t h t h e heterodyne ho lograph ic
The f i g u r e s show

-i6-
methods.
misalignment which could have caused a constant phase sh i f t over the whole
f i e l d .
The source o f t h i s error may r e su l t from the transparency
Reproducibility of t h e measurements was then tested on a few photographic
p la tes taken o f t he same object w i t h d i f fe ren t exposure leve ls . We f o u n d t h a t
the phase A+ was only reproducible t o w i t h i n * 4 O over the f i e l d . These errors
may be a t t r i bu ted t o mechanical misalignment of t he p l a t e s and t o con t r a s t
var ia t ions and non-1 inear recording ef fec ts .
performed i n order t o invest igate these e f fec ts .
More experimental work has t o be
For sinusoidal grat ing motion, r a the r than motion a t a constant ve loc i ty ,
t h e o u t p u t of t h e e lec t ronic phase meter does n o t vary l i n e a r l y w i t h
refract ion angle, t h u s ca l ibra t ion of t h e system i s required'.
present experiment t h e Cali bration procedure was t h e same as t h a t followed i n
the on-1 ine experiment, except t h a t i t was performed w i t h the reference
transparency i n p lace ( F i g . 3 ) ra ther t h a n w i t h t h e actual kD*P crys t ra l . Similar ca l ibra t ion curves t o those shown i n F i g . 7 of Ref. 9 were obtained.
Since t h e accuracy and s e n s i t i v i t y of the system i s l a rge ly dependent on
the transparencies alignment, a special e f fo r t was made t o p u t the reference
transparency prec ise ly i n t h e same posit ion, r e l a t i v e t o t h e Ronchi grating
and t o the detection system, a s t h a t o f the phase objec t transparency. This
was achieved by t h e following: a . The transparencies were mounted on a p l a t e
holder, f ixed t o the opt ica l bench. The use of t h e p l a t e holder ensures t h a t
the surface coordinates o f both transparencies was t h e same. b. The rotat ion
angle between the reference transparency and the grat ing was adjusted by
measuring p i , t h e separation dis tance between the moire fringes.
was varied u n t i l the value of p 1 reached the same value a s t h a t measured w i t h
t h e phase objec t transparency, namely p '=4 .47 mm. c .
photographed on b o t h transparencies, was chosen as a reference point for the
In the
The angle
A geometrical p o i n t ,

-17-
i a1 ignment procedure.
coordinates of this point were measured.
posit ion of the reference grating, i t was transversal l y moved u n t i l the x , y
coordinates of t h e reference poin t attained equal values t o those measured on
the phase objec t transparency.
Before removing the phase object transparency, the x , y
In order t o a l ign t h e transversal I
I V . CONCL USION S - I t has been shown t h a t the electronic heterodyne technique can be applied
f o r accurate and s e n s i t i v e readout of moire fringes of unsteady phase
objects .
system a r e weakly affected by diffract ion and non-linear photographic emulsion
charac te r i s t ics .
a f f ec t t h e s p a t i a l resolution of t h e system.
affected by d if f r a c t ion.
Theoretically i t was shown t h a t the accuracy and sens i t iv i ty of the
The analysis showed t h a t non-1 inear recording does not
The s p a t i a l resolution i s mainly
The system was evaluated experimentally by mapping a weak phase object.
The r e su l t s conpared favorably w i t h observations performed w i t h t h e e lec t ronic
heterodyne holographic in t e r f e romt ry and w i t h the on-1 ine heterodyne moire.
The theoret i cal analysis and t h e experimental measurements have shown t h a t t h e
performance of the the heterodyne deferred moire i s of t he same order as the
on-1 ine heterodyne moire.
The method o f f e r s many advantages: low s t a b i l i t y requirements, adjustable
s e n s i t i v i t y , no t affected by noise sources, low c o s t and computer
canpat ibi l i ty . To conclude i t can be s a i d t ha t the method is s u i t a b l e and
a t t r a c t i v e t o use f o r non-steady phase objects.
The deferred e lec t ronic heterodyne moire requires continuing research and
development. More experimental investigation i s necessary i n order t o better
understand the reasons f o r the 1 ow reproduci bi 1 i t y observed. I t i s suggested

-1 8-
t o consis tent ly study t h e e f f ec t s of photographic p l a t e s exposure levels and
developing processes on the system performance. In the present research the
only photographic emulsion used was t h e Agfa-Gevaert N E 7 5 one, no t
necessarily t h e most s u i t a b l e f o r moire.
charac te r i s t ics should be tes ted as well.
misal ignment of t he reference transparency when placed i n t he posit ion of the
phase object transparency, have t o be reduced.
including b e t t e r alignment f a c i l i t i e s on the processing bench.
t h e on-line case , t h e s i n u s o i d a l motion of t he Ronchi grating is undesirable
because of t h e need f o r calibration.
de vel oped.
Other emulsions w i t h d i f fe ren t
The e r r o r s caused by mchanical
T h i s can be achieved by
Also, a s i n
A technique f o r l i n e a r motion has t o be

-19-
PART 2: MEASUREMENTS OF 3-D DENSITY FIELDS WITH OPAQUE OBJECTS -- B Y M O I R E DEFLECTOMETRY
I . INTRODUCTION -
Tomographic reconstruction of 3-D refractive-i ndex f i e l d s from measured
ray def lect ions by moire method was demonstrated i n Ref. 16.
t h a t i f the d a t a on deflections i s complete i .e . the f i e l d i s n o t blocked by
an opaque object and deflections of 360' coverage a r e avai lable , the inverse
Radon transform 17,18 may readi ly be used f o r f i e l d reconstruction.
advantage of the deflectometry method i s t h a t the measured def lect ions a r e
d i rec t ly used in the inversion transformation.
i n terfermetry.
index of re f rac t ion and x i s the aistance coordinate along the r a y , shoula be
mathematically processea in order t o o b t a i n numerical derivatives.
process may a d d e r ro r s t o t h e reconstructed f i e l d .
I t was shown
The
This i s n o t the case with
Interferorretri c measurements, ndmeiy JiiO'jc iiiiei-e ii i s t h e
This
In sow cases i t i s desired t o use moire def l ec tme t ry f o r measuring 3-D
density f i e l d s where a n opaque object i s present i n the f i e l d .
occurs when deflectometry i s used t o s t u d y densi ty f i e l d s in compressible gas
flowing around a t e s t object o r t o study the temperature f i e l d s around heated
opaque objects , e t c .
used f o r the measurements and thus p a r t of t he d a t a i s missing.
missing d a t a i s necessary f o r evaluating t h e inverse Radon transform, the
d i r ec t use of the reconstruction technique i s impossible.
This s i tua t ion
In such cases t h e object blocks many o f t h e opt ical rays
Since the
The same problem a r i s e s when interferometric incomplete d a t a i s used f o r
f i e l d reconstruction; Zien e t a1. l9 , Vest a n d Prikryl" and Medoff e t
a1.'l proposed t o solve the problem by using algorithms based on i t e ra t ions .
For reconstruction i t i s necessary t o extrapolate the projection d a t a in to the

-a-
region of missing data.
process by transforming repeatedly between the image domain and the projection
domain, applying measured information and other c r i t e r ions a t each i te ra t ion .
Empirical s tud ies of th i s algorithm showsz0 t h a t the a lgo r i thm does n o t
converge.
number of i t e r a t ions and then diverges. A s imi la r i t e r a t ion technique was
previously used w i t h def lect ions data t o reconstruct t h e flow f i e l d around a
cone a t a n angle of attack".
encountered i n t h a t study.
The a r t i f i c i a l f ie ld evolves d u r i n g t h e i t e r a t i v e
The s tudies indicate t h a t t he f i e l d reaches a best estimate a f t e r a
The problem of a l g o r i t h m divergence was a l so
In many prac t ica l s i tua t ions the opaque object presented i n the f i e l d i s
o f c i rcu lar or e l l i p t i c a l cross-section. This occurs i n aerodynamics of
cir-culai- b o d i e s , 1 i k e c ~ e j , a t a n afig7e c f a t t a c k , ifi heat-transfer nf
c i rcu lar pipes, e tc .
Cormack transform 18923 the f i e l d can be reconstructed d i r ec t ly w i t h o u t the
need f o r i t e ra t ions . The Cormack transform i s based on c i r cu la r harmonic
decomposition of b o t h the image space and the projection space and solving the
relat ion between these deconpositions. I t i s in te res t ing t o note t h a t Cormack
transform i s an extension of Abel transform ( f o r c i r cu la r symmetric f i e l d s
Cormack transform reduces ' t o b e l transform).
For such bodies i t i s shown, t h a t by u s i n g t he inverse
A brief description of the inverse Cormack transform i s given i n Sec. 11.
I t i s shown how t h i s transform i s used w i t h deflections data.
based on Cormack transform, i s developed and evaluated i n Sec. 111. The
Appendix contains l i s t i n g of t h e computer program.
An a lgor i thm,
- 11. THEORY
Cormack's approach i s based on the f ac t t h a t f o r each r t h e object
f u n c t i o n f ( r , e ) i s periodic i n e w i t h period Z S , where r and e a re the p o l a r
coordinates defined i n F i g . 8. Therefore, f ( r ,e) can be expanded i n Fourier

-21-
Ser ies of t h e form of
where
Similarly, the interferometric projection x ( p , b ) can be expanded as
w i t h
x ( p , b ) i s defined by the l i n e integral
where the integrat ion i s performed over the i n f i n i t e plane b u t the d e l t a
function i n th i s equation has t h e e f f e c t o f reducing t h e a rea integral t o a
1 ine integral along p=rcos(e-Q), shown i n F i g . 8.
integration and p i s the distance of t h e l ine of integration from t h e o r i g i n .
Cormack transform gives t h e relationship between the Fourier coef f ic ien ts
8 i s the direct ion of
h Q ( p ) and fE ( r ) l8 :

-22-
where T ( f ) i s the Tschebycheff polynomial o f the f i r s t k i n d of order R defined
by: R
Note t h a t i f f ( r , e ) i s rotat ional symmetric, fa( ' ) i s non-zero only f o r
a=0 and i n t h i s case Eq. 6 reduces t o the Abel transform, s ince T o ( x ) = l for
a l l x .
For the reconstruction o f t he object from i t s projections, we must
determine t h e inverse Cormack transform i .e . t o express f ( r j expl ic i t ly . The
solut ion, i n one of i t s forms, i s given by :
R 18
f a ( r ) = - - 'I r n d p2-r2 '
Interesting fea tures of t h i s r e su l t are:
1. Only values of x ( p , b ) f o r p x are required t o reconstruct f ( r , e ) , thus Eq. 8
c a n d i r e c t l y be used f o r reconstructing f i e l d s around c i r cu la r objects
s ince the d a t a gap i n the region p a - i s n o t required f o r the integration. dAR(P 1
2. Tne der ivat ives -- , which appear i n E q . 8, a r e exactly the R'th d P a x ( p 6) Fourier coef f ic ien ts of t h e function -A- E ~ ' ( p , d ) . aP
f o r w a r d , s ince x ( p , d ) i s periodic i n d , x ' ( p , d ) i s a l s o per odic,
therefore can be expanded i n Fourier s e r i e s of t he form o f :
The proof i s s t ra ight -
where

-23-
by applying E q . 4, Eq. 10 may be wri t ten as
1 I t turns o u t t h a t a x ( p 9 b ) a p i s measured d i r e c t l y by def lectanetry and
therefore n o d i f f e ren t i a t ion of experimental da ta i s required prior t o the
expansion of the measured data i n Fourier s e r i e s .
111. COWUTER SIMULATION
The reconstruction procedure discussed i n t h e preceding sect ion was
evaluated by a computer simulation.
defined and t h e algorithm was used t o reconstruct t h e object from computed-
g wlerated d e f l e c t i o n s d a t a .
c i r c l e of rad ius R o , and an opaque object o f c i r c u l a r cross sect ion of
radius R c was placed i n the objec t f i e ld .
conparison o f t h e accuracy of t h e reconstruction obtained i n the present work
w i t h t ha t obtained by u s i n g an i t e r ac t ive method, we chose t o s tudy the same
object as t h a t studied by Vest i n Ref. X).
The phase ob jec t s tudied was ana ly t ica l ly
The ~ b j e c t f u n c t i ~ n was zern everywhere outs ide a
In order t o have a basis f o r
The phase objec t studied, shown i n F i g . 9 i s given by:
R < r < R c - 0 f o r
and f ( x , y ) = 0 for 0 - < r < Rc and r - > Ro.

-24-
The corrputer simulation progrm, l isted i n t h e Appendix , cons is t s of the
following s t eps :
1. Numerical generation of def lect ions data, x' (p,b) . f (x ,y) was expressed as a function of p , s , and 8 according t o t h e
coordinate transformation
For this purpose
x = pcosd - ssinb
y = psin4 + scosb
where s i s the coordinate along the ray d i rec t ion - see F i g . 8.
object function was d i f fe ren t ia ted w i t h respect t o p and numerically
integrated along s , yielding x' (p,b).
I t was assumed t h a t we have N projections spaced by equal i n t e rva l s
A ~ I = 2 . The number of da t a points a l o n g t he p ax is i s N t h u s t h e
increment i n p i s A P = ~ ~ - l .
Next, t he
Ro-Rc
2. For each p, x ' ( p , b ) i s expanded i n Fourier Ser ies i n the azimuthal
The number of terms retained i s f i m a x = ~ . d i rect ion (Eqs. 3 and 4 ) .
Equation 8 i s used t o ca l cu la t e f e ( r ) , t he Fourier coe f f i c i en t s of t h e
azimuthal expansion of the objec t f u n c t i o n .
becomes i n f i n i t e as p->r.
d i v i d i n g the in tegra l i n Eq. 8 in to t w o par t s24
3.
In Eq. 8 the integrand
The s ingular i ty a t p=r can be evaluated b y
I Ro 'T I r
d p - - r+h IT
For small values of h , the f i r s t integral i s approximated by
1 d x & r ) T (1) cosh-'(l + F)], h thus Eq. 1 4 becomes -,[7 2

-25-
The approx imat ion e r r o r i s o f t h e o r d e r o f O(h 3 /2) . 4. The o b j e c t f i e l d f u n c t i o n i s c a l c u l a t e d f r o m Eq. 1 u s i n g t h e computed
few A summary o f t h e r e c o n s t r u c t i o n r e s u l t s i s g i v e n i n T a b l e 1.
TABLE 1 Reconst ruc t ion E r r o r s Obtained b y Inverse Cormack Transform
and I t e r a t i v e Convolut ion Methods*
-
Opaque o b j e c t N M L Number of Maximum Av erag ed g r i d p o i n t s Er ro r , % Error , %
35 29 8 101 5 182.0 9.5 30 25 6 750 15.8 1.8
30 30 5 900 8.5 1.7 I t e r a t i v e convo lu t ion 19.5 1.8
C i r c l e (Rc=0.3R ) 30 25 5 7 3 8.7 1.6 0
35 11 10 . 38 5 22.0 2.7 35 16 6 560 6.5 1.3 35 16 8 560 5.4 1.3
C i r c l e (Rc=O.bRo) 35 16 10 5 a ' 2.0 0.3 30 16 io 483 5.3 0.6 30 16 5 480 8.5 1.5 I t e r a t i v e convo lu t ion 27.5 3.7
* I t e r a t i v e c o n v o l u t i o n r e s u l t s a r e f rom Ref. 20.
I n t h e t a b l e t h e maximum e r r o r i s de f ined as t h e maximum v a l u e o f t h e
d i f fe rences b e t w e n computed and a c t u a l va lues of t h e o b j e c t f u n c t i o n a t each
p o i n t , d i v i d e d b y t h e maximum va lue o f t h e f u n c t i o n t h a t occurs i n t h e o b j e c t

-26-
domain. The average e r r o r i s defined as the average of t he absolute values of
the e r ro r s over the whole grid.
i t e r a t i v e convolution method a r e shown in the Table as well.
i t can be seen t h a t f o r t h i s example, the inverse Cormack transform i s
considerably more accurate than t h e i te ra t ion method; maximum e r r o r s f o r
For comparison, t h e e r r o r s calculated by the
From t h e Table,
Rc=0.3R0 and f o r Rc=0.6Ro a r e 8.5% and 2,O%respectively a s compared
t o errors of 19.5% and 27.5%obtained from t h e i t e r a t i v e convolutin method,
r es p ec t i ve 1 y .
- I V. CON CLUSlO NS
The s e r i e s expansion approach used i n o u r investigation yielded a f a i r l y
e f f i c i e n t reconstruction code. i t was s h o ~ i i t h a t t h e use ef t h e i n v e r s e
Cormack transform f o r reconstruction of f i e l d s with c i r c u l a r missing
deflections da ta i s q u i t e accurate and convenient f o r use. The accuracy of
t h e algorithm was t e s t e d by applying i t t o da ta generated by nunerical
simulation. The r e l a t i v e l y h i g h accuracy found i s mainly due t o the f a c t t h a t
n o i t e r a t ions are necessary.
Our study was limited i n t h i s project t o asymmetric f i e l d s around c i r c u l a r
cross sectional opaque objects.
algorithm f o r e l l i p t i c a l cross-section opaque Dodies (which of ten occur i n
aeronautics, when c i r c u l a r bodies a r e a t an angle of a t t a c k ) and f o r general
I t i s important t o continue and expand t h e
shaped bodies.
t h e eff ic iency of t he algorithm.
Also more analyt ical studies have t o be done i n r e l a t i o n t o
I t has t o be emphasized t h a t i n t h e present study we have not made any
e f f o r t t o reduce corrputational time. The principal f a c t o r in determining
computational time i s the number of g r i d points and the number of terms
retained i n t h e Fourier se r ies . T h u s b y using t h e Fast Fourier Transform
technique the computational t iine may be considerably reduced.

-27-
APPEN) I X
LISTING OF THE COMPUTER RECONSTRUCTION PROGRAM
KF = Number o f F o u r i e r c o e f f i c i e n t s i n t h e s e r i e s expansion.
NP = Number o f d a t a p o i n t s along p ax i s .
NFI = Number o f p r o j e c t i o n s .
RCRO = Rc /Ro .
DFI = The i n t e r v a l i n p r o j e c t i o n angle.
DP = Increment i n p.
I M P L I C I T R E A L * 8 I A - H 0-Z 1 I N T E G E R I E R E X T E R N A L Fa RFF AIFF 1 FCIU 9 FOU‘I 0 1 MENS1 OiJ P (39) 8 F I ( 6 0 ) ,RDi \ i ( 60 8 30 1 9RLMD 3 0 1 A I L M D ( 30 9 Ri3( 6 0 ) D I M E N S I O N D I M E N S I O N XX(5O),YV(6O),FX(4),FY(4),C(4,31 D I M E N S I O N RF(60,30),AIF160,30) COM4ON/FM/SP, S!\1,CSsPF? 9 P C S p P S N COMMON/RFMl / R L M D , A I L M D 3 NP C O M Y O N / R F M 2 / P , R , H S ~ , I R C O M M O N / A A A / R D , F I 8EIFIP C O M M O N / B S H / L H , N F I
F I D ( 60) p R A F ( 30,601 1 R I A F (30 6 0 ) 3 R R E A L ( 6 0 9 30 1 9 R A I M (60 g 3
D E F I N I T I O N O F T H E D E N S I T Y F U N C T I O N T D R E R E C O N S T R U C T E D 4- & 4. * 4.4. ..- d- 4. * .. & ..- .c. 0. -.- ... -.- ..- ..- -.- ... -.. 4. * 4.4. d. ..- * 4- *- * .c * -.- ... * 4. a. * * *..- .- .& c a. * * ... c-r p ... -.. ... -e V-r -.--.- 0. .&
.r -,.-.- - C T -.- P -.- .r .C -.- ..- -c.r -,- -r -.- -.- e- -#.-.--.--e -r P P -.--e --.--,* -e -. -r -..*-.- -+-.- -.-r P
C A L L P Y C = 3 0 1 4 1 5 9 2 6 5 3 5 8 9 7 9 C R = 6 . 3 / 1 7 4 0 0 C t i = O 0 0 1 A E H R Z O o F A E i ? f . ( = O o KO= 1.00 KF= 10
IJERSET ( 0, L E V C L r ) 1

-23-
1 0 I I
11
7 0
13
12
1 9
53 50 54 51
RCRO= 6 R E R H = 0 1 FRERRzOo 01 NP=l 1 SRO=RO**2 RC=RCRO*RO NFi=25 NFIP=NFI+I TTL =NF I *NP OF1 =Z.*PYE/NFL O F 1 D= 360 /NFI NPMzNP- 1 DP= (RD-RC) /NPM 00 10 M=l,NP AMM=M- 1 P{M) = R C + D P + A M M CONTINUE DO 11 N=l,NFIP AMMZN- 1 FI ( N )=DFI*A#M
CONT I NU€ FXD(N)=DFIOIA#M
WRL T E ! 5 5 701 E?F! j NP j U F j C H I TTL FORMAT(~X,'NFI,,NP,,KF,,C~,,TTL',~(~X,I~),~XD~FI~.~)
CALCULATION OF T H E DEFLECTION PROJECTIQNS (INTEGQAL) OF T H E GIVEN FUNCTION P E X P ( X , Y ) FOR THE DEFINED
VALUES FI AND 2 h"ICH WE CALL R i 3 N ( P H I , P ) * * * * * * 3% * ** * * + 8 ** * *:>* * 3 * * *$ ::: 4 $* * 8 :: 8 $ :> * * * * *:: * * * 1 $8 *::
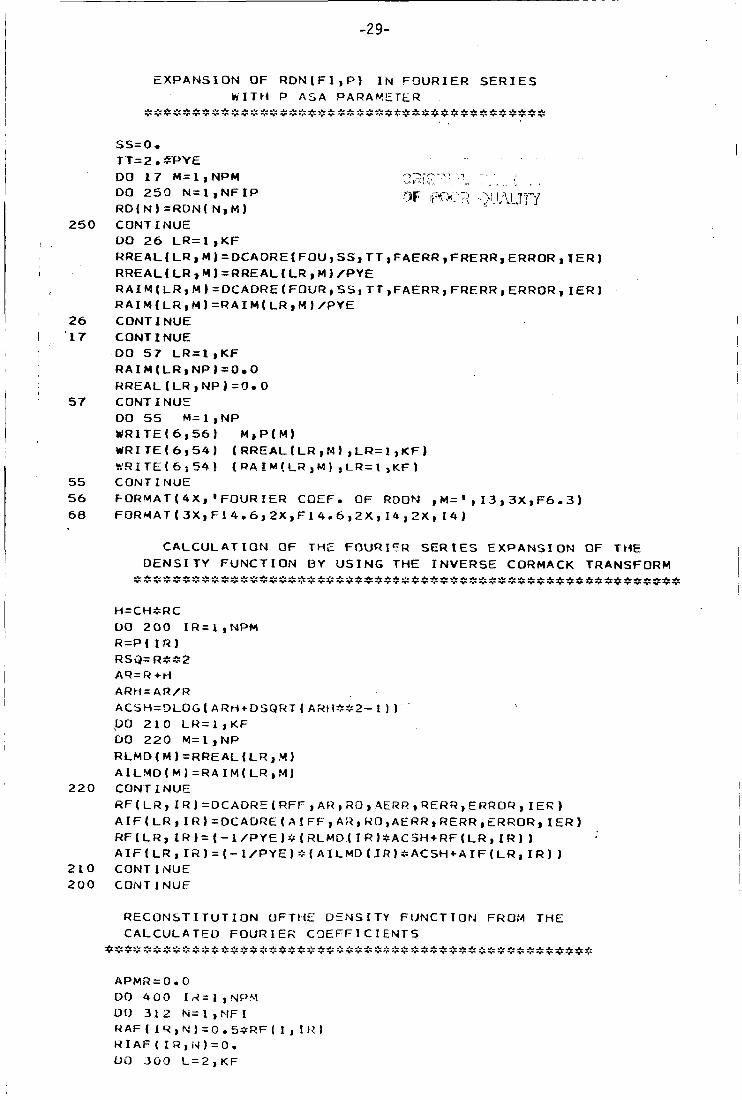
-29-
250
I
26 I ' 1 7
57
' 55 56 68
220
210 200
ss=o* 7T=2 .-E DO 1 7 M=l,NPM - 7 - n - 7 7 1
" " \ L - 8
DO 250 N=l,NFIP rJP wP:-'-? )y;\lJ-y R D I N 1 =RDN( N, N ) CONT I NU€ 00 26 LR=I ,KF RREALl L R 8 M )=OCADRE( FOU, S S , TT 8 FAERRsFRERR, ERROR a TER) RR€AL(LR,M)=RREAL(LR,M)~fYE R A I M ( L R , N ) = O C A D R E ( F O U R , ~ S ~ T T ~ F A E R R ~ F R ~ R R ~ E R R O R ~ I € R ) RAIM( LR,M) =RAIM( LR , Y 1 /PYE CONTINUE CONTINUE 00 57 LR=l,KF RAI M (LR, NP 1 = O 0 HREAL (LR 3 NP) =Om 0 CONT I NUE DO 55 M=l,NP YRI TE ( 6,561 WRITE(6954) (RREAL(LR,MIjLR=l,KF) W R I T E ! 6 ; 5 4 ! !n4IM!La;M!:LR=l,KFl
M J P ( M )
CONTINUE FORMAT~~XJ'FOURIER COEF. OF R D O N , H = ' , 1 3 ~ 3 X , F 6 . 3 ) FORMAT ( 3 x 1 F14.63 2 X , F14.6,ZX 9 I 4 J 2X 9 1 4 )
RECONSTITUTION OFTHE DENSITY FtJNCTlON FROM THE CALCULATED FOURIER CCIEFFICIENTS
c-..*.c 4.4. .L.c * .* .I_ J. * ... ... * *.a. * 4. & 4. *-.- .*. ... .& -% .L.C *.I_ A **A -I_*& a. * .r -.--r-.- -,-* P z -c P -.- v *& & & 4. ***a. -.- P 3. -.- P-c P -.- v -.- -c P .r I- -r-* -c P -.- P -C P 4 -,-- v-r z -r P -e P -r -e -.- c -C

-30-

-31-
I 30
31
30
41
I 22 2
F3~0.0 DF3~0.0 E F 4 = ( T + O e 3 6 + 1 . 2 * t P S N + S C S ) ) / 9 IF (DABS(EF4).GTm29.0) GO TO 40 . F4=0.5*DEXP(-6.0*EF4) D F ~ = - ~ . O ~ F ~ = ( ( ~ . = P M + ~ D ~ * S N ) + ~ . ~ P M * E F ~ ) / Q GO TO 41 F4=0.0 O F 4 = 0 * 0 -
CONTINUE F=DFi +OF2+OF3+DF4 - - --
GO TO 222
CONTINUE RETURN END .
FUNCTION FOU(X1 IMPLI CI T DIMENSION FI(60),RD(60) COUMON/AAA/RDaFI , N F I P COHMON/BBB/CR, NFX CALL LLLZLR-1 FOU=YY*DCOS(LLL*X) RETURN END
FUNCTION FOUR(X)
Fz0.0
=331311==3*33=$~=3=3~331~~~1~1~
REAL*8 (A-H, 0-2 1
F INTER ( N F I P a F I, R D X 9 YY 1 -
~ ~ ~ 1 ~ ~ 1 ~ = 1 = = 3 ~ 1 = 3 5 = 1 = ~ * 3 = 1 ~ * = = =
IMPLlCI T REALe8 (A-H,O-Z 1 DIMENSION FI(601aR0(60) COMMON/AAA/RD,FI,NFIP COMMON/BOB/LR,NFI CALL FINTER(NFIP,FI,RD,X,YY) LLL=LR-1 FOUR=YY*OSIN[LLL+X) RETURN END .
FUNCTION RFF(X1 IMPLICIT REAL$8(A-H,O-Z) OIMENSION P(30)~RLMD(3O),AILMD(30) C O M M O N / R F M l / R L M D , A I L M D , N P COMMON/RFMZ/P,R,RSQ, If? COMMON/BBB/LR,NFI LL-LR-1
&*&&&**&*a,*&&& *&*.&********&**& - , - ~ - b - ~ v . W . # . V . ~ W . v . W 4 +*.e,, - r * t C I I * r * I C I I
MM=NP XR=X/R CALL FINTEH(#M,P,QLMD,X,YY) ~ F F = ~ Y ~ ~ C O S H ( L L ~ O L O G ( X R + O S Q R l ~ X R ~ ~ 2 - ~ ~ ) ~ / D S Q R l ( X ~ ~ 2 - R S Q ~ RETURN EN0
' . \ . .. .. ~ . .
_.

-32-
I 8
7
4 5
3

-33-
R E FERE NC E S
0 . Kafri, "Noncoherent Method f o r Mapping Phase Objects", Opt. Lett. - 5, 1.
555 (1980).
2. E. Bar-Ziv, S. Sgulim, 0. Kafri and E. Keren, "Tenperature Mapping i n
Flames by Moire Deflectometry", Appl. O p t . 22, 698 (1983).
3. J. S t r icker and 0. Kafri, "New Method f o r Density Gradient Measurements i n
Compressible Flows", AIAA J. - 20, 820 (1982).
4. 0. Kafri and A. Livnat, "Reflective Surface Analysis Using Moire
Deflectometry", Appl. O p t . - 20, 3099 (1981).
5. 0. Kafri and I . Gla t t , "Moire Deflectometry: A Ray Deflection Approach t o
Optical Testing", O p t . Eng. - 24, 944 (1985). I I I
5. E. ! k e n and 0. Kafri, "Diffraction Effects i n Moire Deflectometry", J.
O p t . SOC. An. A - 2, 111 (1985). I
7. E. Bar-Ziv, "Effect of Diffraction on the Moire Image. I. Theory", J . O p t .
SOC. An. A - 2, 371 (1985).
8. J. Str icker , "Electronic Heterodyne Readout of Fringes i n Moire
Def lectometry", O p t . Lett. - 10, 247 (1985).
9. J. S t r i c k e r , "Diffraction Effec ts and Special Advantages in Electronic
Heterodyne Moire Def lectometry", Appl. O p t . - 25, 895 (1986).
10. A.J. Decker and J. Str icker , "A Comparison of Electronic Heterodyne Moire
Def lectometry and Electronic Heterodyne Holographic Interferometry for
Flow Measurements", SAE Publication No. 851896 14-17 Oct. 1985, Long Beach
Convention Center, CA.
11. D.B. Rhodes, J.M. Franke, S.B. Jones and B.D. Leighty, "Moire
Deflectmetry with Deferred Pnalysis", Appl. O p t . - 22, 652 (1983).
12. J. S t r i c k e r and J. Politch, "Holographic Moire Deflectometry - a Method
f o r S t i f f Density Fields Pnalysis", Appl. phys. Lett. - 44, 723 (1984).

-34-
13. J . S t r i c k e r , "Mo i re Def l ec tomet ry w i t h Deferred E l e c t r o n i c Heterodyne
Readout", Appl. Opt. - 24, 2298, (1985).
14. See f o r exarrple Technical I n fo rma t ion - Agf a-Gevaert, on Photographic
M a t e r i a l s f o r Holography, Aug. 1969. Agfa-Gevaert, Inc . 275 N. S t ree t ,
Teterboro, N. J. 07608.
15. D. Weimer, "Pocke ls -Ef fec t C e l l f o r Gas-Fl ow Simulat ion" , NASA TP-2007
(1982).
16. J. S t r i c k e r , "Ana lys i s of 3-0 Phase Objects b y Moi re Def lectometry" , Appl.
Opt. 23, 3657 (1984).
17. S.R. Deans, The Radon Transform and Some o f i t s A p p l i c a t i o n s , (Wi ley, New
York, 1983).
LO. 7 0 I I n.11. u Barrett and W e Swindel l , Rad io log ica l Imaging, The Theory o f Image
Formation, Detec t ion , and Processing, Vol . 2, Chap. 7 (Pcademic Press, New
York, 1981).
19. T.F. Z ien and W.C. Ragsdale, " Q u a n t i t a t i v e A p p l i c a t i o n s o f Holographic
I n t e r f e r o m e t r y t o Wind-Tunnel Testing", Repor t NOLTR 74-96, Naval Ordance
Laboratory, (19 74) . 20. C.M. Vest and I. P r i k r y l , "Tomography b y I t e r a t i v e Convolut ion: Emp i r i ca l
Study and A p p l i c a t i o n t o In te r fe romet ry " , Appl . Opt. - 23, 2433, (1984).
21. B.P. Medoff, W.R. Brody, M. Nassi and A. Macovski, ' ' I t e r a t i v e Convolut ion
Backp ro jec t i on A lgor i thm f o r Image Reconstruct ion f rom L im i ted Data", J.
Opt. SOC. Am., - 73, 1493, (1983).
22. J. S t r i c k e r , "Mapping o f 3-D Densi ty F i e l d s i n Flows Around Opaque
Objects", Annual Report, Technion Res. and Development P r o j e c t 161-495
(1986). (Was n o t p u b l i s h e d i n t h e l i t e r a t u r e . )

~ -35-
23. A.M. brmack, "Representation o f a Function by i t s Line In tegra ls with ~
Some Radiological Appl icationsll, J. App. Phys. - 34, 2722 (1963); J. Appl.
Phys. - 35, 2908 (1964).
24. E. Bar-Ziv, S. Sgulim, 0. Kafri and E. Keren, "Tenperature Mapping i n
Flames by Moire Def lectometry", Appl. O p t . - 22, 698 (1983).

L.S.
I \ I
I
C O L L l MATED BEAM
P
I I t-- I 6
'HASE OBJECT
F i g . 1: Schematics of a conventional moire system. L.S. i s a point l i g h t source (may be a focused l a se r beam). and G2 are Ronchi rul ings and S i s a mat transparent screen.
M i s a parabolic mirror. ti1

h
X Y
a
I
t t N
J 0 0
m

r PHOTODETECTOR
He
PHASE PLATE-
- 7
- T. S. - G. S.
COLLIMATED BEAM
4 s IGNAL a POWER GENERATOR
SUPPLY
I
Fig. 3: Schematic of the experimental setup for postanalyzing phase objects: G , Ronchi ru l ing ; R.S. a n d T.S., reference a n d t es t s igna ls respectively; G.S., gating signal.

c 0, t 1D Y
0 0 Y
0
a Y
a
N
0 '4 9 0 0
? 0
9 - 111 ' 3 3 N W l l l W S N W U l A l I S N 3 1 N I
2
CI
0 Y
10 t- W
0 I- K W
> W (3
a
I
i? (3 a
E 0 \ 3
x - W
W
3 v) 0
X W
.I
a
n
0 - w
0 N
0 e 0
0 IC)
0 * I I I I I I I 1 lo
0 - N
0 0 0 0 '? ? s
0 0 ? '9 0 0
- N E 0 \
F a W
W a 3 v) 0 & X w
Y
.I
0
11 ~ ' 3 3 N V l l l W S N V ~ l ' A l I S N 3 1 N I a

' 3 1- Agfa-Gevaert 10E75
I " " " " ' I " " " " ' I " " " " ' I I I I , I I I I 8 I " " ' . . "
0 0 -
-I
Kodak 649F /'
0.30
- 0.20
+ z
0 .3 -f
, . . . . . . . . . . . . . . . . . . . . . . . . . . , . , , i
OQ-].., , . .
-3
0.101 ( c ) f = 0.04
, I , I , I I I I I 1 1 1 1 I I I I I I I I I I I I I I " " " "0"" I " I 0.00 4 0.0 0.2 0.4 0.6 0.8 1 .o
PHASE
o ' lo { ( b ) f = 0.02
0.00 p , , , , I , I , ) , , I ( , , , I 1 1 , 1 1 ( , , , , 1 , 1 , 1 1 , ~
0.0 0.2 0.4 0.6 0.8 1 .o PHASE
0.3 1 I
( d ) f = 0.10 O.1° i
0.0 0.2 0.4 0.6 0.8 1 .o PHASE
Fig. 5: Calculated moire intensi ty vs. phase for various values o f f . f igure , the upper two curves are for A fa-Gevaert 1GE75 plates prefogged with exposure Eo = 12 erg/cm and with E'=8 erglcrnz a n d E'=18 erg/cm2 for the solid l i n e a n d dashed l i n e , respectively. The lower curve i s tor Koaak 649F plates with Eo=O and E ' A 5
I n each
U J / C G .

0'3 3
( e ) f = 0.15 0.10 1 O . l O { ( f ) f =I 0.20
0.0 0.2 0.4 0.6 0.8 1 .o 0 .0 0.2 0.4 0.6 0.8 1 .o
PHASE
0.3 4
PHASE
0.3 3
0.0 0.2 0.4 0 . 6 0 .8 1 .o
PHASE
Fig. 5: Ca lcu la ted moire i n t e n s i t y v s . phase (cont inued)

0 . 3
0.2
+ z 0.1
0 .0
~
0.40
+ 030 z - 0.20
0.10
0.00
1 (i) f = 0.35
, , , , , , , 1 1 , 1 1 1 1 1 - , 1 , , 1 1 , , , 1 1 ( 1 1 1 , 1 1 1 1 , 1 ~ 1 1 ~
0.0 0.2 0.4 0.6 0.8 1 .o PHASE
0.3 1
i
0.40
0.30 1 1 4 - 0.20
0.10 1 (k) f = 0.45
0.0 0.2 0 4 0.6 0.8 1 .o PHASE
0.0
0.40
""i (j) f = 0.40
I~""~~"i'"'' 0.00 4
0.0 0.2 0.4 0 .6 0.a 1 .o PHASE
0.3 -I
0.2 1
0.30 0'401 - 0.20
'.lei (1) f = 0.50
0.0 0.2 0.4 0.6 0.a 1 .o
PHASE
Fig. 5: Calculated moire intensity vs . phase (continued)

I
4
3
2
I
0
P Deferred h e t e r o dyne mo i r e
I 1 I I 1
On-1 i n e heterodyne moi re
F i g . 6: x - a e r i v a t i v e o f r e f t a c t i o n i naex f o r f l o w s imu la to r .

5
4
d I
V E
3 3- d
x
I 2 4:
1
0 00 O P
0 0 0 0
0 10 20 30 40 50 X, mm
F i g . 7: x - d e r i v a t i v e o f r e f r a c t i o n index f o r f l o w s imu la to r - heterodyne ho log raph ic i n t e r f e r o m e t r y .

\ \ \
L I N E OF INTEGRATION
F i g . 8: Object f i e l d and the geometry o f the transform.

Fig. 9: The o b j e c t f u n c t i o n used i n the s tudy of t h e a l g o r i t h m .
f u n c t i o n s i s d e f i n e d b y Eq. 12.
The
The segment r<0.6R0 i s miss ing .