annual report: fiscal year 2018 · 2019-05-21 · record sales led to $722.5 million in transfers...
TRANSCRIPT

State of Illinois
Department of the Lottery
ANNUAL REPORT: FISCAL YEAR 2018

Table of Contents Letter from Acting Director Harold Mays 1. Sales Performance Total Sales by Game
o Table 1A – FY18 Total Sales by Game o Table 1B – Total Sales by Game FY16 – FY18
iLottery Performance o Table 1C – Total iLottery Sales by Game by Year o Table 1D – Online Sales by Year (single ticket purchases) o Table 1E – Total Online Subscriptions Sales by Year
2. Transfers to Good Causes Where the Money Goes
o Table 2A – Total Expenses Paid in FY18 (in $ millions) Common School Fund Transfers
o Table 2B – Yearly CSF Transfers (in $ millions) Capital Projects Fund Transfers
o Table 2C – Yearly CPF Transfers (in $ millions) Specialty Ticket Transfer
o Table 2D – Yearly Specialty Ticket Transfers Financial Statement Report Independent Auditors’ Report Basic Financial Statements
o Statement of Net Position (Deficit) o Statement of Revenues, Expenses, and Changes in Net Position (Deficit) o Statement of Cash Flows o Notes to Basic Financial Statements
Supplementary Information o Combining Schedule of Net Position (Deficit) o Combining Schedule of Revenues, Expenses, and Changes in Net Position (Deficit)

Letter from Acting Director Harold Mays The Illinois Lottery’s mission is to maximize revenue to the state to benefit schools, capital projects and specialty causes in an ethical and socially responsible manner. Amid monumental business and operational changes during Fiscal Year 2018, we were able to fulfill that mission in dramatic fashion by setting a sales record of a little more than $2.9 billion, topping the previous year by 2.9 percent. Instant ticket sales of almost $1.9 billion represented 64 percent of total sales in FY18 but remained relatively flat over the previous year. Draw-based game sales led the way with sales increases being recognized by all games, except Lucky Day Lotto and the St. Patrick’s Day Millionaire Raffle. The Lottery’s sales leader continues to be Pick 3 with Fireball. That game alone accounted for $278 million in sales in FY18 and represented well over 9 percent of total sales. Record sales led to $722.5 million in transfers to good causes. The Common School Fund, which helps fund K-12 public education in Illinois, received about $718.7 million, the highest transfer we’ve ever made to the fund. Another $3.6 million was transferred to special causes the Lottery supports through sales of specialty instant tickets. Those causes include Illinois veterans’ assistance, breast cancer awareness, HIV/AIDS awareness, multiple sclerosis research and Special Olympics training programs. Our players also benefited from record sales, with more than $1.9 billion in prizes and claims paid, a 5 percent increase over the previous year. We saw 55 new millionaires made in calendar year 2018. Change was the optimal word in FY18, starting with the Illinois Lottery’s change to a new private manager after seven years with the Northstar Lottery Group. After a two-year bidding and award process, a new contract with Camelot Illinois was signed in October 2017, ushering in a new set of ideals and concepts on how the Illinois Lottery can reach its true potential. Camelot Illinois is a subsidiary of Camelot Lottery Solutions (formerly Camelot Global Services), which is a leader in lottery management in Europe. As private manager, Camelot Illinois will help manage the key revenue drivers for the Illinois Lottery, including sales, marketing and retailer management. The remainder of FY18 was spent largely transitioning those key business functions to Camelot Illinois, as well as beginning preparations for much-needed technology changes. In FY19, Camelot will introduce a new website and iLottery platform, as well as facilitate one of the largest technology transitions ever undertaken by a U.S. lottery. This transition will include a new central gaming system, all new retail terminals, equipment and vending machines. This new technology will enable our players to interact with us in much more user-friendly way and will encourage responsible play at the same time. Another significant change in FY18 was the change to the Mega Millions game. A new $2 price point was introduced in October 2017, up from $1, with a higher starting jackpot of $40 million. This aligned the game more closely with Powerball and should enable much higher jackpots and more attractive secondary prizes. Even though the change happened during the second quarter, we saw a sales increase of 27 percent over the previous year, and it was a contributing factor in achieving records sales in FY18. The positive story about sales is tempered slightly by a notable increase in expenses during FY18. Our 2.9 percent increase in overall sales was countered with a 5 percent increase in the total cost of sales (prize expense, retail commissions and bonuses). Administrative expenses increased by 44 percent because of Northstar disentanglement and residual value costs and Camelot private manager transition costs. The impact of those expenses resulted in a ~10 percent decrease in operating income for the year. FY18 was challenging yet rewarding. FY19 promises to be the same as we complete our technology transition. We are encouraged that our 45th year will bring forth the excitement of a new beginning and a renewed focus on delivering products our players want and enjoy, educating and encouraging players to play responsibly and giving players a lottery that they can believe in and feel good about. With close to $21 billion in contributions to the state since our humble beginning, we look forward to increasing that number during the journey ahead.

1. Sales Performance Total Sales by Game (in $ millions)
Table 1A – FY18 Total Sales by Game Instant tickets remained the biggest part of our sales in FY18 at 64 percent. However, draw-based game sales are responsible for our record success in FY18. Sales increases were recognized by all draw games, except Lucky Day Lotto and the St. Patrick’s Day Millionaire Raffle. The Lottery’s sales leader continues to be Pick 3 with Fireball, with more than 9 percent of total sales. Powerball had a strong year and was fueled by two jackpot runs of more than $500 million. Mega Millions’ change to $2 during the second quarter contributed to higher than normal sales for the year. Total Sales by Game 3-year Comparison (in $ millions)
Table 1B – Total Sales by Game FY16 – FY18 Instant ticket sales were almost $1.9 billion in FY18 but remained relatively flat over the previous year. Pick 3 and Pick 4 both performed well over the previous year at 6 and 9 percent increases, respectively. A 26 percent increase for Mega Millions was due, in part, to the price increase but also strong jackpot performance.

iLottery Sales Table 1C – Total iLottery Sales by Game by Year
Total iLottery sales combine online purchases of single-draw tickets with that of multi-draw subscriptions. At $43.5 million in FY18 sales, iLottery represents 1.5 percent of our total sales for the year, and 4.2 percent of total draw-based game sales. iLottery sales increased by 28 percent in FY18.
Table 1D – Online Sales by Year (single ticket purchases) Lotto, Mega Millions and Powerball are jackpot games that can be bought online via a single ticket purchase or a multi-draw subscription. Mega Millions saw a 74 percent increase in online single ticket sales largely due to change in price from $1 to $2 in FY18, as well as jackpot performance. Lotto and Powerball also saw nominal increases of 35 percent and 23 percent, respectively, due to jackpot performance.
Table 1E – Total Online Subscriptions Sales by Year Our daily draw games Pick 3, Pick 4 and Lucky Day Lotto can be sold online only via a subscription purchase. Subscription sales can be influenced by high jackpot amounts. However, player habits are the biggest driver. Pick 3 and Pick 4 online subscriptions saw increases of 41 percent and 56 percent, respectively in FY18. Lucky Day Lotto remained relatively flat.

2. Transfers to Good Causes Where the Money Goes
Table 2A – Total Expenses Paid in FY18 (in $ millions) In FY18, sales topped $2.9 billion, with roughly 25 percent - or $722 million - going to good causes. Common School Fund Transfers
Table 2B – Yearly CSF Transfers (in $ millions)
Capital Projects Fund Transfers
Table 2C – Yearly CPF Transfers (in $ millions)
Specialty Ticket Transfers
Table 2D – Yearly Specialty Ticket Transfers
V E T E R A N S B R E A S T C A N C E R
S P E C I A L O L Y M P I C S
M U L T I P L E S C L E R O S I S
H I V / A I D S
$727,000 $540,000 $602,000 $514,000 $1,015,000
$728,000 $540,000
$525,000 $548,000
$332,000
$1,022,000 $526,000 $960,000 $613,000
$456,000
FY16 FY17 FY18
STATE OF ILLINOIS DEPARTMENT OF THE LOTTERY
Financial Statement Report
For the Year Ended June 30, 2018
As Reported in the Financial Statement Audit Performed by KPMG as Special Assistant Auditors for the Auditor General, State of
Illinois
Table of Contents
Page
Financial Statement Report:
Independent Auditors’ Report 3
Basic Financial Statements:
Statement of Net Position (Deficit) 6
Statement of Revenues, Expenses, and Changes in Net Position (Deficit) 7
Statement of Cash Flows 8
Notes to Basic Financial Statements 10
Supplementary Information:
Combining Schedule of Net Position (Deficit) 34
Combining Schedule of Revenues, Expenses, and Changes in Net Position (Deficit) 35
KPMG International Cooperative (“KPMG International”), a Swiss entity.
KPMG LLP Aon Center Suite 5500 200 E. Randolph Street Chicago, IL 60601-6436
Independent Auditors’ Report
Honorable Frank J. Mautino Auditor General State of Illinois
Report on the Financial Statements As Special Assistant Auditors for the Auditor General, we have audited the accompanying basic financial statements of the State of Illinois, Department of the Lottery as of and for the year ended June 30, 2018, and the related notes to the financial statements, which collectively comprise the State of Illinois, Department of the Lottery’s basic financial statements as listed in the table of contents.
Management’s Responsibility for the Financial Statements Management is responsible for the preparation and fair presentation of these financial statements in accordance with U.S. generally accepted accounting principles; this includes the design, implementation, and maintenance of internal control relevant to the preparation and fair presentation of financial statements that are free from material misstatement, whether due to fraud or error.
Auditors’ Responsibility Our responsibility is to express an opinion on these financial statements based on our audit. We conducted our audit in accordance with auditing standards generally accepted in the United States of America and the standards applicable to financial audits contained in Government Auditing Standards, issued by the Comptroller General of the United States. Those standards require that we plan and perform the audit to obtain reasonable assurance about whether the financial statements are free from material misstatement.
An audit involves performing procedures to obtain audit evidence about the amounts and disclosures in the financial statements. The procedures selected depend on the auditors’ judgment, including the assessment of the risks of material misstatement of the financial statements, whether due to fraud or error. In making those risk assessments, the auditor considers internal control relevant to the entity’s preparation and fair presentation of the financial statements in order to design audit procedures that are appropriate in the circumstances, but not for the purpose of expressing an opinion on the effectiveness of the entity’s internal control. Accordingly, we express no such opinion. An audit also includes evaluating the appropriateness of accounting policies used and the reasonableness of significant accounting estimates made by management, as well as evaluating the overall presentation of the financial statements.
We believe that the audit evidence we have obtained is sufficient and appropriate to provide a basis for our audit opinion.
KPMG LLP is a Delaware limited liability par3tnership and the U.S. member firm of the KPMG network of independent member firms affiliated with
4
Opinion In our opinion, the financial statements referred to above present fairly, in all material respects, the respective financial position of the State of Illinois, Department of the Lottery as of June 30, 2018, and the respective changes in financial position and cash flows for the year then ended in accordance with U.S. generally accepted accounting principles.
Emphasis of Matters As discussed in Note 2(b), the financial statements of the State of Illinois, Department of the Lottery are intended to present the financial position, the changes in financial position and, where applicable, cash flows of only that portion of the business-type activities of the State of Illinois that are attributable to the transactions of the State of Illinois, Department of the Lottery. They do not purport to, and do not, present fairly the financial position of the State of Illinois as of June 30, 2018, and the changes in its financial position or, where applicable, its cash flows for the year then ended in accordance with U.S. generally accepted accounting principles. Our opinion is not modified with respect to this matter.
The Department adopted GASB Statement No. 75, Accounting and Financial Reporting for Postemployment Benefits Other Than Pensions, during the year ended June 30, 2018. Statement No. 75 established standards for recognizing and measuring liabilities, deferred outflows of resources, deferred inflows of resources, expenses and expenditures. The adoption of this statement required the Department to restate net position by $(64,782) thousand at July 1, 2017.
Other Matters Required Supplementary Information
Management has omitted management’s discussion and analysis and related pension information that accounting principles generally accepted in the United States of America require to be presented to supplement the basic financial statements. Such missing information, although not a part of the basic financial statements, is required by the Governmental Accounting Standards Board who considers it to be an essential part of financial reporting for placing the basic financial statements in an appropriate operational, economic, or historical context. Our opinion on the basic financial statements is not affected by this missing information.
Supplementary and Other Information
Our audit was conducted for the purpose of forming an opinion on the financial statements that collectively comprise the State of Illinois, Department of the Lottery’s basic financial statements. The accompanying supplementary information, as listed in the table of contents, is presented for purposes of additional analysis and is not a required part of the basic financial statements.
The accompanying supplementary information, as listed in the table of contents, is the responsibility of management and was derived from and relates directly to the underlying accounting and other records used to prepare the basic financial statements. Such information has been subjected to the auditing procedures applied in the audit of the basic financial statements and certain additional procedures, including comparing and reconciling such information directly to the underlying accounting and other records used to prepare the basic financial statements or to the basic financial statements themselves, and other additional procedures in accordance with auditing standards generally accepted in the United States of America. In our opinion, the accompanying supplementary information, as listed in the table of contents, is fairly stated, in all material respects, in relation to the basic financial statements as a whole.

5
Other Reporting Required by Government Auditing Standards In accordance with Government Auditing Standards, we have also issued our report dated December 21, 2018 on our consideration of the State of Illinois, Department of the Lottery’s internal control over financial reporting and on our tests of its compliance with certain provisions of laws, regulations, contracts, and grant agreements and other matters. The purpose of that report is solely to describe the scope of our testing of internal control over financial reporting and compliance and the results of that testing, and not to provide an opinion on the effectiveness of the State of Illinois, Department of the Lottery’s internal control over financial reporting or on compliance. That report is an integral part of an audit performed in accordance with Government Auditing Standards in considering the State of Illinois, Department of the Lottery’s internal control over financial reporting and compliance.
Chicago, Illinois December 21, 2018

6
S
STATE OF ILLINOIS
DEPARTMENT OF THE LOTTERY
Statement of Net Position (Deficit)
June 30, 2018
(in thousands of dollars)
Assets and Deferred Outflows of Resources
Current assets:
Cash and cash equivalents $ 32,564 Cash equity in State Treasury 67,863 Investments, short-term 22,692 Accounts receivable, net of allowance of $21,157 29,357 Other receivables 1 Due from other State funds 368
Total current assets 152,845
Noncurrent assets:
Investments 244,703 Capital assets being depreciated, net 83
Total noncurrent assets 244,786
Deferred outflows of resources:
Deferred outflows of resources - pension 17,933 Deferred outflows of resources - OPEB 1,272
Total deferred outflows of resources 19,205
Total assets and deferred outflows of resources
416,836
Liabilities and Deferred Inflows of Resources
Current liabilities:
Prizes payable 74,002 Accounts payable and accrued liabilities 42,376 Due to other Government – Federal 60 Due to other State funds 832 Unearned revenue 1,803 Other liabilities 1,042 Current portion of long-term annuity prizes payable 21,589 Current portion of leases payable 22
Total current liabilities 141,726
Noncurrent liabilities:
Noncurrent portion of long-term annuity prizes payable 232,120 Noncurrent portion of leases payable 35 Due to other State funds 89,045 Net pension liability 83,979 Net OPEB liability 58,928 Noncurrent other 664
Total noncurrent liabilities 464,771
Deferred inflows of resources:
Deferred inflows of resources - pension 5,187 Deferred inflows of resources - OPEB 9,040
Total deferred inflows of resources 14,227
Total liabilities and deferred inflows of resources
620,724
Net Position (Deficit)
Invested in capital assets 26 Unrestricted (203,914)
Total net position (deficit) $ (203,888)
The accompanying notes to the financial statements are an integral part of these statements.
7
kkkkk
STATE OF ILLINOIS
DEPARTMENT OF THE LOTTERY
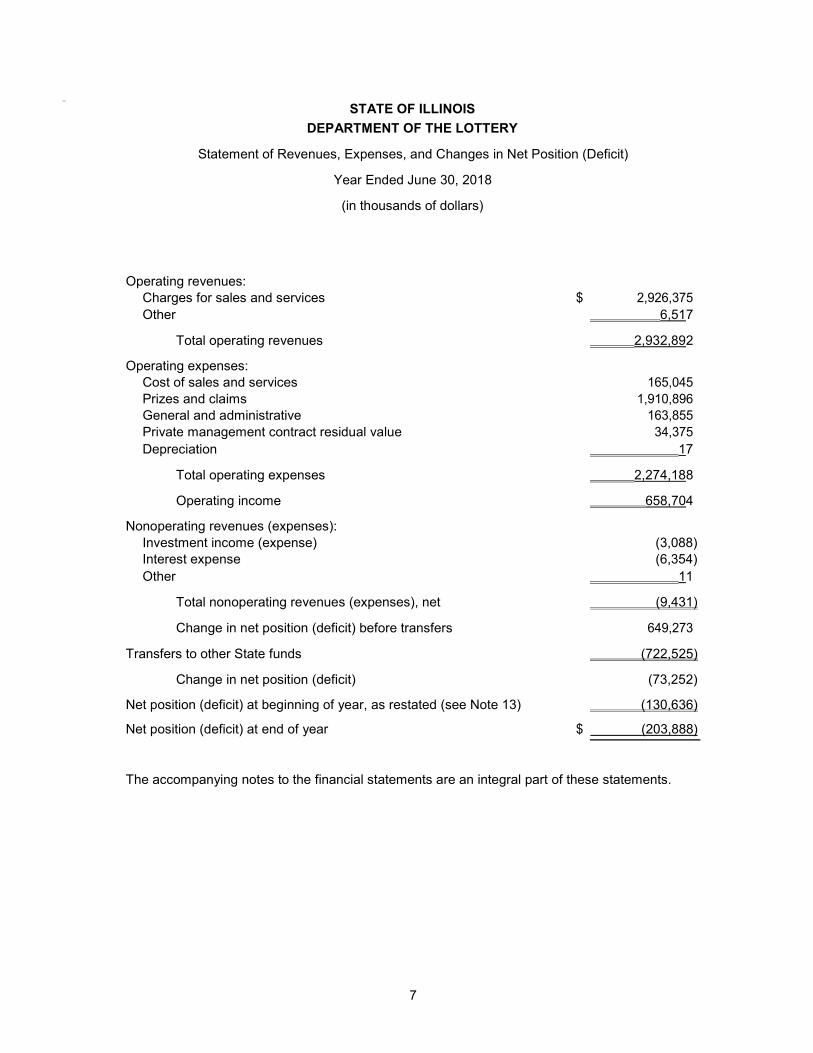
Statement of Revenues, Expenses, and Changes in Net Position (Deficit)
Year Ended June 30, 2018
(in thousands of dollars)
Operating revenues:
Charges for sales and services $ 2,926,375 Other 6,517
Total operating revenues 2,932,892
Operating expenses:
Cost of sales and services 165,045 Prizes and claims 1,910,896 General and administrative 163,855 Private management contract residual value 34,375 Depreciation 17
Total operating expenses 2,274,188
Operating income 658,704
Nonoperating revenues (expenses):
Investment income (expense) (3,088) Interest expense (6,354) Other 11
Total nonoperating revenues (expenses), net (9,431)
Change in net position (deficit) before transfers 649,273
Transfers to other State funds (722,525)
Change in net position (deficit) (73,252)
Net position (deficit) at beginning of year, as restated (see Note 13) (130,636)
Net position (deficit) at end of year $ (203,888)
The accompanying notes to the financial statements are an integral part of these statements.

STATE OF ILLINOIS
DEPARTMENT OF THE LOTTERY
Statement of Cash Flows
Year Ended June 30, 2018
(in thousands of dollars)
Cash flows from operating activities:
Cash received from sales and services $ 2,923,272 Cash receipts from other operating activities 6,555 Cash payments for commissions and bonuses (165,045) Cash payments for general and administrative expenses (136,159) Cash payments for lottery prizes (1,906,591)
Net cash provided by operating activities 722,032
Cash flows from noncapital financing activities:
Cash transfers – out to other funds (731,818)
Net cash used in noncapital financing activities (731,818)
Cash flows from capital and related financing activities:
Principal payments under capital lease obligation (6)
Net cash used in capital and related financing activities (6)
Cash flows from investing activities:
Interest and dividends on investments (297) Purchase of investments (6,820) Proceeds from investment maturities 24,197 Cash paid for long-term annuity prizes payable (24,494)
Net cash used in investing activities (7,414)
Net decrease in cash and cash equivalents (17,206)
Cash and cash equivalents at beginning of year 117,633
Cash and cash equivalents at end of year $ 100,427
Reconciliation of cash and cash equivalents to the statement of
net position (deficit): Total cash and cash equivalents per the statement of
net position (deficit) $ 32,564 Add cash equity in State Treasury 67,863
Cash and cash equivalents at end of year $ 100,427
The accompanying notes to the financial statements are an integral part of these statements.
8 (Continued)

9
STATE OF ILLINOIS
DEPARTMENT OF THE LOTTERY
Statement of Cash Flows
Year Ended June 30, 2018
(in thousands of dollars)
Reconciliation of operating income to net cash provided by
operating activities: Operating income $ 658,704 Adjustments to reconcile operating income to net cash
provided by operating activities: Depreciation 17 Provision for uncollectible accounts 1,960 Changes in assets and liabilities:
Decrease in accounts receivable 19,006 Increase in due from other funds (367) Decrease in deferred outflows of resources 3,787 Decrease in prizes payable (2,515) Increase in accounts payable and accrued liabilities 29,396 Decrease in intergovernmental payables (1) Increase in due to other State funds 80 Increase in unearned revenues 258 Decrease in other liabilities (10) Increase in long-term annuity prizes payable 6,820 Increase in deferred inflows of resources 10,939 Increase in net pension liability 1,279 Decrease in net OPEB liability (7,321)
Net cash provided by operating activities $ 722,032
Noncash investing, capital and financing activities:
Cost of capital asset acquisitions financed by capital leases $ 63 Increase in unrealized gains on investments 9,128 Interest accreted on investments 6,337 Interest accretion on long-term annuity prizes payable (6,337) Use of resources to pay long-term annuity prizes payable 5
The accompanying notes to the financial statements are an integral part of these statements.
STATE OF ILLINOIS DEPARTMENT OF THE LOTTERY
Notes to Basic Financial Statements
June 30, 2018
10 (Continued)
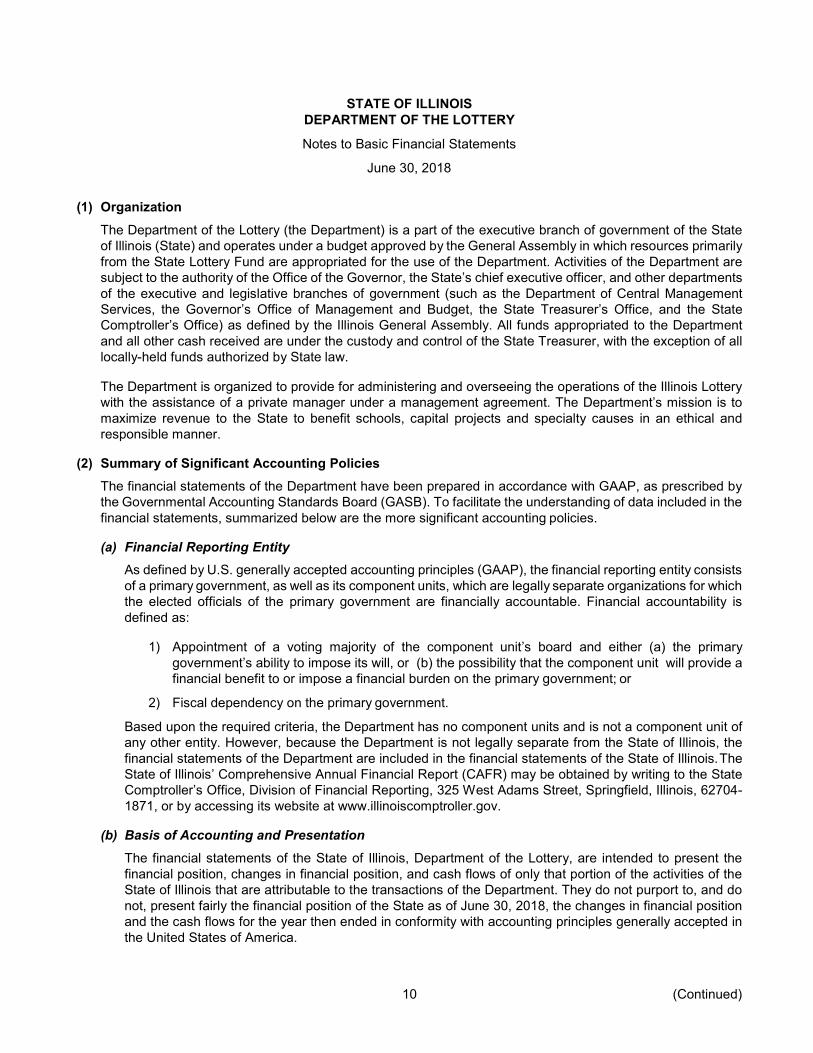
(1) Organization
The Department of the Lottery (the Department) is a part of the executive branch of government of the State of Illinois (State) and operates under a budget approved by the General Assembly in which resources primarily from the State Lottery Fund are appropriated for the use of the Department. Activities of the Department are subject to the authority of the Office of the Governor, the State’s chief executive officer, and other departments of the executive and legislative branches of government (such as the Department of Central Management Services, the Governor’s Office of Management and Budget, the State Treasurer’s Office, and the State Comptroller’s Office) as defined by the Illinois General Assembly. All funds appropriated to the Department and all other cash received are under the custody and control of the State Treasurer, with the exception of all locally-held funds authorized by State law.
The Department is organized to provide for administering and overseeing the operations of the Illinois Lottery with the assistance of a private manager under a management agreement. The Department’s mission is to maximize revenue to the State to benefit schools, capital projects and specialty causes in an ethical and responsible manner.
(2) Summary of Significant Accounting Policies
The financial statements of the Department have been prepared in accordance with GAAP, as prescribed by the Governmental Accounting Standards Board (GASB). To facilitate the understanding of data included in the financial statements, summarized below are the more significant accounting policies.
(a) Financial Reporting Entity
As defined by U.S. generally accepted accounting principles (GAAP), the financial reporting entity consists of a primary government, as well as its component units, which are legally separate organizations for which the elected officials of the primary government are financially accountable. Financial accountability is defined as:
1) Appointment of a voting majority of the component unit’s board and either (a) the primary
government’s ability to impose its will, or (b) the possibility that the component unit will provide a financial benefit to or impose a financial burden on the primary government; or
2) Fiscal dependency on the primary government.
Based upon the required criteria, the Department has no component units and is not a component unit of any other entity. However, because the Department is not legally separate from the State of Illinois, the financial statements of the Department are included in the financial statements of the State of Illinois. The State of Illinois’ Comprehensive Annual Financial Report (CAFR) may be obtained by writing to the State Comptroller’s Office, Division of Financial Reporting, 325 West Adams Street, Springfield, Illinois, 62704- 1871, or by accessing its website at www.illinoiscomptroller.gov.
(b) Basis of Accounting and Presentation
The financial statements of the State of Illinois, Department of the Lottery, are intended to present the financial position, changes in financial position, and cash flows of only that portion of the activities of the State of Illinois that are attributable to the transactions of the Department. They do not purport to, and do not, present fairly the financial position of the State as of June 30, 2018, the changes in financial position and the cash flows for the year then ended in conformity with accounting principles generally accepted in the United States of America.

STATE OF ILLINOIS DEPARTMENT OF THE LOTTERY
Notes to Basic Financial Statements
June 30, 2018
11 (Continued)
The basic financial statements provide information about the Department’s proprietary (enterprise) fund. Proprietary fund financial statements are reported using the economic resources measurement focus and the accrual basis of accounting. Revenues are recorded when earned and expenses are recorded at the time liabilities are incurred, regardless of when the related cash flow takes place.
The Department accounts for operations of the State Lottery in which a statutorily defined amount of the net income is used for the support of the State’s Common School Fund. Any net income remaining after the required transfers to the Common School Fund is transferred to the State’s Capital Projects Fund. Certain ticket sales are dedicated for other State funds prior to the determination of the net income available for transfers to the Common School Fund or the Capital Projects Fund.
(c) Cash and Cash Equivalents
Cash equivalents are defined as short-term, highly liquid investments readily convertible to cash with maturities of less than 90 days at time of purchase. Cash and cash equivalents include cash on hand and cash in banks for locally held funds.
(d) Investments
Investments are reported at fair value based on quoted market prices. The Department holds investments pursuant to statutory authority for locally held funds.
(e) Fair Value of Financial Instruments
The Department follows guidance for fair value measurements that defines fair value as the exchange price that would be received for an asset or paid to transfer a liability (an exit price) in the principal or most advantageous market for the asset or liability on the measurement date. The guidance establishes a hierarchy of inputs used to measure fair value that prioritizes the inputs into three categories that maximizes the use of observable inputs and minimizes the use of unobservable inputs by requiring that observable inputs be used when available.
Observable inputs are inputs that market participants would use in pricing the asset or liability based on market data obtained from independent sources. Unobservable inputs reflect assumptions that market participants would use in pricing the asset or liability based on the best information available in the circumstances. The hierarchy is broken down into three levels based on the transparency of inputs as follows:
Level 1 – Quoted prices are available in active markets for identical assets or liabilities as of the measurement date.
Level 2 – Observable inputs other than quoted prices in active markets for identical assets and liabilities, quoted prices for identical or similar assets or liabilities in inactive markets, or other inputs that are observable or can be corroborated by observable market data. These inputs are either directly or indirectly observable as of the measurement date.
Level 3 – Unobservable inputs for the asset or liability as of the measurement date. These securities are measured using management’s best estimate of fair value, where the inputs into the determination of fair value are not observable and require significant management judgment or estimation.

STATE OF ILLINOIS DEPARTMENT OF THE LOTTERY
Notes to Basic Financial Statements
June 30, 2018
12 (Continued)
A financial instrument’s level within the fair value hierarchy is based on the lowest level of any input that is significant to the fair value measurement. The following describes the valuation methodologies used to measure the Department’s financial instruments at fair value. There have been no changes in the methodologies used at June 30, 2018 when compared to June 30, 2017.
U.S. Treasury bonds—U.S. Treasury bonds are valued using prices quoted in active markets for those securities. These assets are classified as Level 1 assets.
Annuities—Annuities are valued at fair value and are comprised of insurance policies not traded on the open market. These assets are classified as Level 3 assets.
(f) Allowances and Provisions The allowance for doubtful accounts at June 30, 2018 is based on an analysis of the historical collection experience for accounts receivable, which considers the age of the receivable and current economic conditions.
(g) Interfund Transactions
The Department has the following types of interfund transactions between Department funds and funds of other State agencies:
Services provided and used—Sales and purchases of goods and services between funds for a price approximating their external exchange value. Interfund services provided and used are reported as revenues in seller funds and expenditures or expenses in purchaser funds. Unpaid amounts are reported as interfund receivables and payables in the Statement of Net Position (Deficit).
Transfers—Flows of assets (such as cash or goods) without equivalent flows of assets in return and without a requirement for repayment. Transfers are reported after nonoperating revenues and expenses.
(h) Capital Assets Capital assets, which consist of equipment and automobiles, are reported at historical cost. Contributed assets are reported at acquisition value at the time received. Capital assets are depreciated using the straight-line method. The capitalization threshold for capital assets is $5,000 and the estimated useful lives range from 5 to 15 years.
(i) Compensated Absences
The liability for compensated absences reported in the Statement of Net Position (Deficit) consists of unpaid, accumulated vacation and sick leave balances for Department employees. The liability has been calculated using the vesting method, in which leave amounts for both employees who currently are eligible to receive termination payments and other employees who are expected to become eligible in the future to receive such payments upon termination are included. The liability has been calculated based on the employees’ current salary level and includes salary related costs (e.g., Social Security and Medicare tax).
Legislation that became effective January 1, 1998 capped the paid sick leave for all State Employees’ Retirement System (SERS) members at December 31, 1997. Employees continue to accrue twelve sick days per year, but will not receive monetary compensation for any additional time earned after December 31, 1997. Sick days earned between January 1, 1984 and December 31, 1997 (with a 50% cash value) would only be used after all days with no cash value are depleted. Any sick days earned and

STATE OF ILLINOIS DEPARTMENT OF THE LOTTERY
Notes to Basic Financial Statements
June 30, 2018
13 (Continued)
unused after December 31, 1997, will be converted to service time for purposes of calculating employee pension benefits.
(j) Net Position (Deficit)
In the Statement of Net Position (Deficit), equity is displayed in three components as applicable:
Invested in Capital Assets – This consists of capital assets, net of accumulated depreciation, reduced by the outstanding balances of borrowings attributable to the acquisition of those assets.
Restricted – This consists of net position (deficit) that is legally restricted by outside parties or by law through constitutional provisions or enabling legislation. When both restricted and unrestricted resources are available for use, generally it is the State’s policy to use restricted resources first, then unrestricted resources when they are needed. There is no restricted net position (deficit) as of June 30, 2018.
Unrestricted – This consists of net position (deficit) that does not meet the definition of “restricted” or “invested in capital assets.”
(k) Classification of Revenues and Expenses
The Department classifies its revenues and expenses as either operating or nonoperating in the Statement of Revenues, Expenses, and Changes in Net Position (Deficit) according to the following criteria:
Revenue
Operating revenues, such as sale of lottery tickets, result from exchange transactions associated with the principal activity of the fund. Nonoperating revenues, such as investment income, result from nonexchange transactions or ancillary activities.
Expenses
All expenses are classified as operating, except for interest expense and losses on disposal of capital assets which are classified as nonoperating.
(l) Lottery Revenue
Draw Games
Revenue from ticket sales for Mega Millions, Powerball, Lotto, Pick 3, and other draw games is recognized when the related drawing takes place. Receipts from subscription sales and other ticket sales for future drawings are recorded as unearned revenue and will not be recognized as revenue until the related drawing takes place.
Instant Games
Revenue from instant games is recognized based on the dollar value of the total books of tickets settled. Tickets are available for sale upon being activated at the retailer locations.
(m) Prizes and Claims – Instant Ticket Expense
Prize expense is accrued for instant game sales at a percentage equivalent to the total prizes included in all tickets printed for each game. Prize expense and prizes payable are reduced for an estimate of prizes that will go unclaimed and are increased if amounts claimed exceed the amounts accrued (i.e., early

STATE OF ILLINOIS DEPARTMENT OF THE LOTTERY
Notes to Basic Financial Statements
June 30, 2018
14 (Continued)
redemption expense). Instant games are closed at the end of the final redemption period and any remaining net payable accrued in prior periods is reversed and recorded as a reduction to prize expense.
(n) Estimates
The preparation of financial statements in conformity with GAAP requires management to make estimates and assumptions that affect the reported amounts of assets and liabilities and disclosure of contingent assets and liabilities at the date of the financial statements and the reported amounts of revenues and expenses during the reporting period. Actual results could differ from those estimates.
(o) Pension
For purposes of measuring the net pension liability, deferred outflows of resources, deferred inflows of resources, pension expense and expenditures associated with the Department’s contribution requirements, information about the fiduciary net position of the State Employees Retirement System (SERS) and additions to/deductions from the SERS’ fiduciary net position have been determined on the same basis as they are reported within the separately issued SERS financial statements. For this purpose, benefit payments (including refunds of employee contributions) are recognized when due and payable in accordance with terms of the plan. Investments are reported at fair value.
The net pension liability is calculated as the difference between the actuarially calculated value of the projected benefit payments attributed to past periods of service and the plans’ fiduciary net position. The total pension expense is comprised of the service cost or actuarial present value of projected benefit payments attributed to the valuation year, interest on the total pension liability, plan administrative expenses, current year benefit changes, and other changes in plan fiduciary net position less employee contributions and projected earnings on plan investments. Additionally, the total pension expense includes the annual recognition of outflows and inflows of resources due to pension assets and liabilities.
(p) Post-Employment Benefits Other Than Pensions (OPEB)
The Department provides health, dental, vision and life insurance benefits for certain retirees and their dependents through the State Employees Group Insurance Program (SEGIP). The total OPEB liability, deferred outflows of resources, deferred inflows of resources, expense, and expenditures associated with the program have been determined through an actuarial valuation using certain actuarial assumptions as applicable to the current measurement period.
For purposes of measuring the net OPEB liability, deferred outflows of resources, deferred inflows of resources, expense and expenditures associated with the Department’s contribution requirements, information about fiduciary net position of the SEGIP OPEB plan and additions to/deductions from the plan’s fiduciary net position have been determined on the same basis as they are reported within the separately issued plan financial statements. For this purpose, benefit payments are recognized when due and payable in accordance with the terms of the plan. Investments are reported at fair value.
(q) New Accounting Pronouncements
Effective for the year ended June 30, 2018, the Department adopted GASB Statement No. 75, Accounting and Financial Reporting for Postemployment Benefits Other Than Pensions, which establishes standards for measuring and recognizing liabilities, deferred outflows of resources, deferred inflows of resources, expenses, and expenditures and identifies the note disclosure requirements. The statement requires the Department to report a liability on the face of the financial statements for the other postemployment benefits (OPEB) it provides and identifies the methods and assumptions that are required to be used to project

STATE OF ILLINOIS DEPARTMENT OF THE LOTTERY
Notes to Basic Financial Statements
June 30, 2018
15 (Continued)
benefit payments, discount projected benefit payments to their actuarial present value and attribute that present value to periods of employee service. The implementation of this statement significantly impacted the Department’s financial statements and footnote disclosures with the recognition of an OPEB liability, deferred outflows of resources, and deferred inflows of resources on the Statement of Net Position (Deficit) and general and administrative expenses on the Statement of Revenues, Expenses, and Changes in Net Position (Deficit). Information regarding the Department’s OPEB plans is disclosed in Note 9. Additionally, the requirements of this statement resulted in the restatement of beginning net deficit, as detailed in Note 13.
Effective for the year ended June 30, 2018, the Department adopted GASB Statement No. 81, Irrevocable Split-Interest Agreements, which improves accounting and financial reporting for irrevocable split-interest agreements by providing recognition and measurement guidance for situations in which a government is a beneficiary of the agreement. The implementation of this statement had no impact on the Department’s financial statements.
Effective for the year ended June 30, 2018, the Department adopted GASB Statement No. 85, Omnibus 2017, which addresses practice issues that have been identified during implementation and application of certain GASB statements. This statement addresses a variety of topics including issues related to blending component units, goodwill, fair value measurement and application and postemployment benefits (pensions and other postemployment benefits). The implementation of this statement had no impact on the Department’s financial statements.
Effective for the year ended June 30, 2018, the Department adopted GASB Statement No. 86, Certain Debt Extinguishment Issues, which improves consistency in accounting and financial reporting for in- substance defeasance of debt by providing guidance for transactions in which cash and other monetary assets acquired with only existing resources – resources other than the proceeds of refunding debt – are placed in an irrevocable trust for the sole purpose of extinguishing debt. This statement also improves accounting and financial reporting for prepaid insurance on debt that is extinguished and notes to financial statements for debt that is defeased in substance. The implementation of this statement had no impact on the Department’s financial statements.
(r) Future Adoption of GASB Statements Effective for the year ending June 30, 2019, the Department will adopt GASB Statement No. 83, Certain Asset Retirement Obligations, which establishes criteria for determining the timing and pattern of recognition of a liability and a corresponding deferred outflow of resources for asset retirement obligations. The Department currently has no asset retirement obligations.
Effective for the year ending June 30, 2020, the Department will adopt GASB Statement No. 84, Fiduciary Activities, which improves guidance regarding the identification of fiduciary activities for accounting and financial reporting purposes and how those activities should be reported.
Effective for the year ending June 30, 2021, the Department will adopt GASB Statement No. 87, Leases, which was established to better meet the information needs of financial statement users by improving accounting and financial reporting for leases by governments.
Effective for the year ending June 30, 2019, the Department will adopt GASB Statement No. 88, Certain Disclosures Related to Debt, Including Direct Borrowings and Direct Placements, which improves the information that is disclosed in notes to government financial statements related to debt, including direct borrowings and direct placements. The Department currently has no debt.

STATE OF ILLINOIS DEPARTMENT OF THE LOTTERY
Notes to Basic Financial Statements
June 30, 2018
16 (Continued)
The Department has not yet determined the impact, if any, on its financial statements as a result of adopting these statements.
(3) Deposits and Investments
The State Treasurer is the custodian of the Department’s deposits and investments for funds maintained in the State Treasury. These amounts are classified as “Cash equity in State Treasury” on the Statement of Net Position (Deficit). The Department independently manages deposits and investments maintained outside the State Treasury.
(a) Deposits
Deposits in the custody of the State Treasurer of approximately $68 million as of June 30, 2018, are pooled and invested with other State funds in accordance with the Deposit of State Moneys Act of the Illinois Compiled Statutes (15 ILCS 520/11). Funds held by the State Treasurer have not been categorized as to credit risk because the Department does not own individual securities. Details on the nature of these deposits and investments are available within the State’s CAFR.
Bank deposits for the enterprise funds held outside of the State Treasury of approximately $33 million as of June 30, 2018, are held in Federal Deposit Insurance Corporation (FDIC) insured depository institutions. The Department has an agreement under which one of these institutions insures balances in excess of FDIC insurance limits from loss by pledging securities as collateral. The collateral amount exceeded the deposited amount of $8 million at June 30, 2018. The Department has not incurred any losses on deposits exceeding the value of pledged securities and considers the risk minimal.
(b) Investments
As of June 30, 2018, the Department had the following investments outside of the State Treasury:
Fair value (thousands)
Weighted average maturity
(years) Annuities $ 222 2.393 U.S. Treasury bonds 267,173 7.143
Total $ 267,395
Interest Rate Risk: The Department does not have a formal investment policy that limits investment maturities as a means of managing its exposure to fair value losses arising from increasing interest rates.
Credit Risk: The Department is limited to investing in direct obligations of the United States of America or backed by the full faith and credit of the United States of America. The Department’s investments in annuities are not rated.

STATE OF ILLINOIS DEPARTMENT OF THE LOTTERY
Notes to Basic Financial Statements
June 30, 2018
17 (Continued)
(4) Fair Value Measurements
The following table presents assets (amounts expressed in thousands) measured at fair value on a recurring basis at June 30, 2018:
Level 1 Level 2 Level 3 Total
Annuities $ — — 222 222 U.S. Treasury bonds 267,173 — — 267,173
Total assets at fair value $ 267,173 — 222 267,395
The change in assets measured at fair value using Level 3 inputs for the year ended June 30, 2018 is as follows:
2018
Balance, beginning of the year $ 276 Change in value of annuities (54)
Balance, end of the year $ 222
(5) Interfund Balance and Activity
(a) Balance Due from/to Other Funds The following balance (amounts expressed in thousands) at June 30, 2018, represents amounts due from other State funds.
Due from
Other Fund State funds 2018 Description/Purpose
Lottery
SERS $ 367
Refund for recertification of FY 2018 Other State Funds 1 employer contribution rate and
$ 368 Problem Gambler services.
The following balance (amounts expressed in thousands) at June 30, 2018, represents amounts due to other State funds.
Due to
Other Fund State funds 2018 Description/Purpose
Lottery
Capital Projects $ 89,045
Due to other State funds for Other State funds 832 allocation of lottery proceeds
$ 89,877 and for administrative expenses.
The $89.045 million due to the Capital Projects Fund as of June 30, 2018, is not expected to be repaid within one year.

STATE OF ILLINOIS DEPARTMENT OF THE LOTTERY
Notes to Basic Financial Statements
June 30, 2018
18 (Continued)
(b) Transfers to Other Funds
The Department reports transfers out in the Statement of Revenues, Expenses, and Changes in Net Position (Deficit), for the amounts required by statute to be transferred to the Common School Fund, Capital Projects Fund, and other State funds for lottery games designated for special purposes. The following balances (amounts expressed in thousands) for the year ended June 30, 2018 represent amounts transferred to other State funds:
Transfers out to
Fund
Other State funds
2018
Description/Purpose
Lottery Common School $ 718,750
Transfers to Common School Other State funds 3,713 fund and other State funds Deferred Prize Winners Other State funds 62 pursuant to statutory requirements.
$ 722,525
(6) Capital Assets
Capital asset activity (amounts expressed in thousands) for the year ended June 30, 2018 was as follows:
Balance June 30, 2017
Additions
Deletions
Net transfers
Balance June 30, 2018
Capital assets being depreciated: Equipment
$ 1,018
63
334
—
747 Less accumulated depreciation (981) (17) (334) — (664)
Total capital assets, net $ 37 46 — — 83

STATE OF ILLINOIS DEPARTMENT OF THE LOTTERY
Notes to Basic Financial Statements
June 30, 2018
19 (Continued)
(7) Long-Term Obligations
(a) Changes in Long-Term Obligations Changes in long-term obligations (amounts expressed in thousands) for the year ended June 30, 2018 were as follows:
Obligations to Lottery prize
Total long-term obligations $ 414,532 9,325 26,398 397,459 21,733
(b) Obligations to Lottery Prize Winners
The Department has obligations to certain lottery prize winners for awards payable in annual installments ranging from 19 years to the life of the prize winner, with the first payment made shortly after the claim is presented for payment.
For certain prize winners, annuities (group contracts) were purchased in the name of the Department for which the Department has retained the rights of ownership. The present value of these annuities and the related liability installments owed to prize winners were as follows at June 30, 2018:
Present value of investment annuities and related prize liabilities (in thousands)
Fiscal year Current Long-term Total
2019 $ 62 — 62 2020 — 62 62 2021 — 62 62 2022 — 50 50
Total future prize payments 62 174 236
Less present value adjustments (2) (12) (14)
Present value at June 30, 2018 $ 60 162 222
Balance June 30,
2017
Additions
Deletions
Balance June 30,
2018
Amounts Due within one year
Leases payable $ —
57
—
57
22 Compensated absences Obligations to Lottery prize
winners – group contracts
834
276
1,169
—
1,217
54
786
222
122
60
winners – annuities 264,473 6,820 17,806 253,487 21,529 Net pension liability 82,700 1,279 — 83,979 — Net OPEB liability 66,249 — 7,321 58,928 —

STATE OF ILLINOIS DEPARTMENT OF THE LOTTERY
Notes to Basic Financial Statements
June 30, 2018
20 (Continued)
Effective July 30, 1985, State law provides that the State Treasurer, with the consent of the Director of the Lottery, may contract to invest in securities, which provide payments corresponding to the Department’s obligation to these winners. The Department has provided for other payments corresponding to the Department’s obligation to other prize winners through the purchase of direct obligations of the federal government, primarily in the form of United States Treasury zero coupon bonds. As established by State law, such securities shall be maintained separate and apart from all public money or funds of the State. These investments are purchased in amounts to provide for annual annuity payments to the prize winner(s) of each qualifying individual drawing.
The fair value of the investments approximated $267 million at June 30, 2018. Interest rates range from 1.3% to 7.7% and prizes payable are scheduled annually through 2044 as follows (amounts expressed in thousands):
Fiscal year Current Long-term Total 2019 $ 23,117 — 23,117 2020 — 22,890 22,890 2021 — 24,981 24,981 2022 — 22,340 22,340 2023 — 23,478 23,478 2024-2044 — 217,030 217,030
Total future prizes 23,117 310,719 333,836
Adjustments to present value (1,588) (78,761) (80,349)
Present value of future prizes 21,529 231,958 253,487
Adjustments to fair value 1,103 12,583 13,686
Fair value of future prizes at June 30, 2018
$ 22,632
244,541
267,173
The amortized discount on the prizes payable reflects the interest rates earned by the investments held to fund the related liabilities. The amortization of discount is recorded as interest expense in the Statement of Revenues, Expenses, and Changes in Net Position (Deficit) and amounted to approximately $6 million for the year ended June 30, 2018.
(c) Leases Payable
The Department has entered into a lease agreement as lessee for financing the acquisition of office equipment. The lease agreement qualifies as a capital lease for accounting purposes, and therefore, has been recorded at the present value of the future minimum lease payments as of the inception date in the capital assets account. Information regarding operating leases is included in Note 12(a).
Assets under the capital lease amounted to $63 thousand, and the related accumulated depreciation amounted to $9 thousand as of June 30, 2018.
STATE OF ILLINOIS DEPARTMENT OF THE LOTTERY
Notes to Basic Financial Statements
June 30, 2018
21 (Continued)
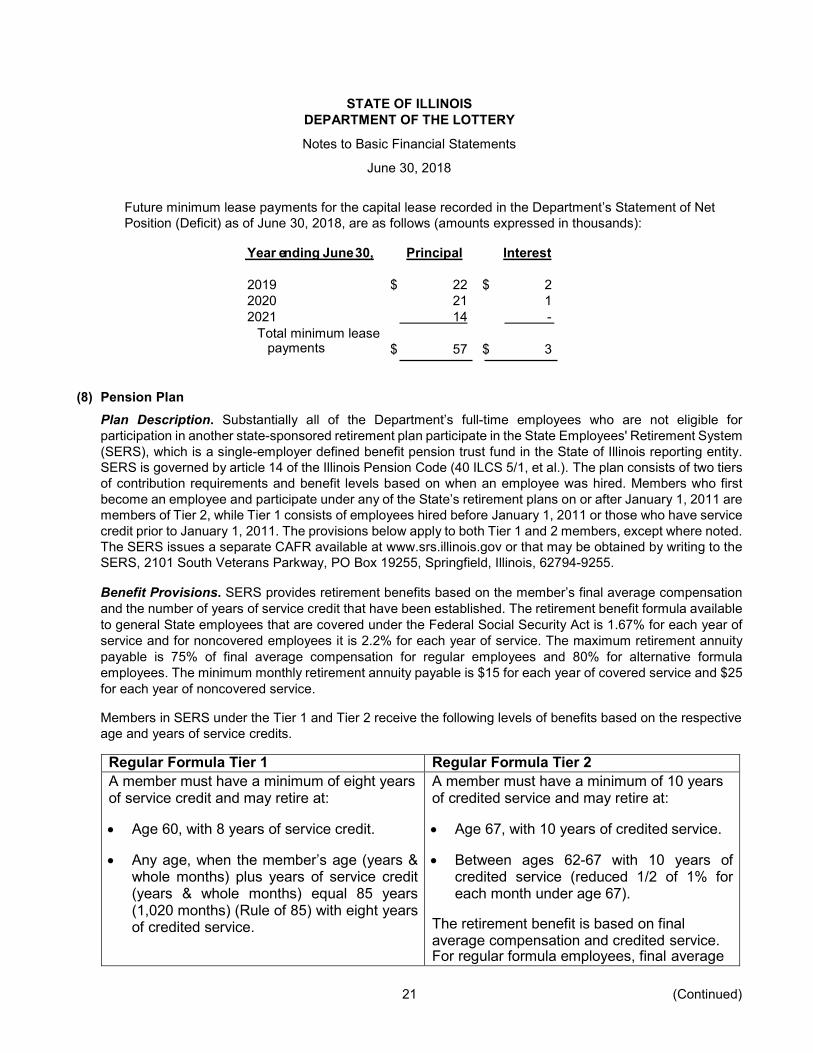
Future minimum lease payments for the capital lease recorded in the Department’s Statement of Net Position (Deficit) as of June 30, 2018, are as follows (amounts expressed in thousands):
Year ending June 30, Principal Interest
2019 $ 22 $ 2 2020 21 1 2021 14 -
Total minimum lease payments $ 57 $ 3
(8) Pension Plan
Plan Description. Substantially all of the Department’s full-time employees who are not eligible for participation in another state-sponsored retirement plan participate in the State Employees' Retirement System (SERS), which is a single-employer defined benefit pension trust fund in the State of Illinois reporting entity. SERS is governed by article 14 of the Illinois Pension Code (40 ILCS 5/1, et al.). The plan consists of two tiers of contribution requirements and benefit levels based on when an employee was hired. Members who first become an employee and participate under any of the State’s retirement plans on or after January 1, 2011 are members of Tier 2, while Tier 1 consists of employees hired before January 1, 2011 or those who have service credit prior to January 1, 2011. The provisions below apply to both Tier 1 and 2 members, except where noted. The SERS issues a separate CAFR available at www.srs.illinois.gov or that may be obtained by writing to the SERS, 2101 South Veterans Parkway, PO Box 19255, Springfield, Illinois, 62794-9255.
Benefit Provisions. SERS provides retirement benefits based on the member’s final average compensation and the number of years of service credit that have been established. The retirement benefit formula available to general State employees that are covered under the Federal Social Security Act is 1.67% for each year of service and for noncovered employees it is 2.2% for each year of service. The maximum retirement annuity payable is 75% of final average compensation for regular employees and 80% for alternative formula employees. The minimum monthly retirement annuity payable is $15 for each year of covered service and $25 for each year of noncovered service.
Members in SERS under the Tier 1 and Tier 2 receive the following levels of benefits based on the respective age and years of service credits.
Regular Formula Tier 1 Regular Formula Tier 2 A member must have a minimum of eight years of service credit and may retire at:
• Age 60, with 8 years of service credit.
• Any age, when the member’s age (years & whole months) plus years of service credit (years & whole months) equal 85 years (1,020 months) (Rule of 85) with eight years of credited service.
A member must have a minimum of 10 years of credited service and may retire at:
• Age 67, with 10 years of credited service.
• Between ages 62-67 with 10 years of credited service (reduced 1/2 of 1% for each month under age 67).
The retirement benefit is based on final average compensation and credited service. For regular formula employees, final average

STATE OF ILLINOIS DEPARTMENT OF THE LOTTERY
Notes to Basic Financial Statements
June 30, 2018
22 (Continued)
• Between ages 55-60 with 25-30 years of service credit (reduced 1/2 of 1% for each month under age 60).
The retirement benefit is based on final average compensation and credited service. Final average compensation is the 48 highest consecutive months of service within the last 120 months of service.
Under the Rule of 85, a member is eligible for the first 3% increase on January 1 following the first full year of retirement, even if the member is not age 60. If the member retires at age 60 or older, he/she will receive a 3% pension increase every year on January 1, following the first full year of retirement.
If the member retires before age 60 with a reduced retirement benefit, he/she will receive a 3% pension increase every January 1 after the member turns age 60 and has been retired at least one full year. These pension increases are not limited by the 75% maximum.
compensation is the average of the 96 highest consecutive months of service within the last 120 months of service. The retirement benefit is calculated on a maximum salary of $106,800. This amount increases annually by 3% or one-half of the Consumer Price Index, whichever is less.
If the member retires at age 67 or older, he/she will receive a pension increase of 3% or one- half of the Consumer Price Index for the preceding calendar year, whichever is less, every year on January 1, following the first full year of retirement. The calendar year 2017 rate is $112,408.
If the member retires before age 67 with a reduced retirement benefit, he/she will receive a pension increase of 3% or one-half of the Consumer Price Index for the preceding calendar year, whichever is less, every January 1 after the member turns age 67 and has been retired at least one full year. These pension increases are not limited by the 75% maximum.
Additionally, the Plan provides an alternative retirement formula for State employees in high-risk jobs, such as State policemen, fire fighters, and security employees. Employees qualifying for benefits under the alternative formula may retire at an earlier age depending on membership in Tier 1 or Tier 2. The retirement formula is 2.5% for each year of covered service and 3.0% for each year of non-covered service. The maximum retirement annuity payable is 80% of final average compensation as calculated under the alternative formula.
SERS also provides occupational and nonoccupational (including temporary) disability benefits. To be eligible for nonoccupational (including temporary) disability benefits, an employee must have at least 18 months of credited service with the System. The nonoccupational (including temporary) disability benefit is equal to 50% of the monthly rate of compensation of the employee on the date of removal from the payroll. Occupational disability benefits are provided when the member becomes disabled as a direct result of injuries or diseases arising out of and in the course of State employment. The monthly benefit is equal to 75% of the monthly rate of compensation on the date of removal from the payroll. This benefit amount is reduced by Workers’ Compensation or payments under the Occupational Diseases Act.
Occupational and nonoccupational death benefits are also available through the System. Certain nonoccupational death benefits vest after 18 months of credited service. Occupational death benefits are provided from the date of employment.

STATE OF ILLINOIS DEPARTMENT OF THE LOTTERY
Notes to Basic Financial Statements
June 30, 2018
23 (Continued)
Contributions. Contribution requirements of active employees and the State are established in accordance with Chapter 40, section 5/14-133 of the Illinois Compiled Statutes. Member contributions are based on fixed percentages of covered payroll ranging between 4.00% and 12.50%. Employee contributions are fully refundable, without interest, upon withdrawal from State employment. Tier 1 members contribute based on total annual compensation. Tier 2 members contribute based on an annual compensation rate not to exceed $106,800 with limitations for future years increased by the lessor of 3% or one-half of the annual percentage increase in the Consumer Price Index. For 2018, this amount was $113,645.
The State is required to make payment for the required departmental employer contributions, all allowances, annuities, any benefits granted under Chapter 40, Article 5/14 of the ILCS and all administrative expenses of the System to the extent specified in the ILCS. State law provides that the employer contribution rate be determined based upon the results of each annual actuarial valuation.
For fiscal year 2018, the required employer contributions were computed in accordance with the State’s funding plan. This funding legislation provides for a systematic 50-year funding plan with an ultimate goal to achieve 90% funding of the plan’s liabilities. In addition, the funding plan provided for a 15-year phase-in period to allow the State to adapt to the increased financial commitment. Since the 15-year phase-in period ended June 30, 2010, the State’s contribution will remain at a level percentage of payroll for the next 35 years until the 90% funded level is achieved. For fiscal year 2018, the employer contribution rate was 47.342%. The Department’s contribution amount for fiscal year 2018 was $4.782 million.
Pension liability, deferred outflows of resources, deferred inflows of resources and expense related to pensions. At June 30, 2018, the Department reported a liability of $83.979 million for its proportionate share of the State’s net pension liability for SERS on the Department’s Statement of Net Position (Deficit). The net pension liability was measured as of June 30, 2017 (current year measurement date), and the total pension liability used to calculate the net pension liability was determined by an actuarial valuation as of that date. The Department’s portion of the net pension liability was based on the Department’s proportion of employer contributions relative to all employer contributions made to SERS during the year ended June 30, 2017. As of the current year measurement date of June 30, 2017, the Department’s proportion was 0.2552%, which was an increase of 0.013% from its proportion measured as of the prior year measurement date of June 30, 2016.
For the year ended June 30, 2018, the Department recognized pension expense of $11.552 million. At June 30, 2018, the Department reported deferred outflows and deferred inflows of resources related to the pension liability, as of the measurement date of June 30, 2017, from the following sources (amounts expressed in thousands):
Deferred Outflows of Resources
Deferred Inflows of Resources
Differences between expected and actual experience $ 50 $ 2,660 Changes of assumptions 8,662 1,751 Net difference between projected and actual investment earnings
on pension plan investments 73 - Changes in proportion 4,366 776 Department contributions subsequent to the measurement date 4,782 -
Total $ 17,933 $ 5,187

STATE OF ILLINOIS DEPARTMENT OF THE LOTTERY
Notes to Basic Financial Statements
June 30, 2018
24 (Continued)
The Department reported $4.782 million of deferred outflows of resources related to pensions resulting from Department contributions subsequent to the measurement date. These will be recognized as a reduction of the net pension liability in the year ending June 30, 2019. Other amounts reported as deferred outflows and deferred inflows of resources related to pensions will be recognized as pension expense (credit) as follows (amounts expressed in thousands):
Year ended June 30,
2019 $ 3,384 2020 2,956 2021 2,020 2022 (396)
Total $ 7,964
Actuarial Methods and Assumptions. The total pension liability was determined by an actuarial valuation as of June 30, 2017, using the following actuarial assumptions, applied to all periods included in the measurement:
Mortality: 105 percent of the RP 2014 Healthy Annuitant mortality table, sex distinct, with rates projected to 2015; generational mortality improvement factors were added.
Inflation: 2.75%
Investment Rate of Return: 7.00%, net of pension plan investment expense, including inflation.
Salary increases: Salary increase rates based on age related productivity and merit rates plus inflation.
Post-retirement benefit increases of 3.00%, compounded, for Tier 1 and the lessor of 3.00% or one-half of the annual increase in the Consumer Price Index for Tier 2
Retirement Age: Experience-based table of rates specific to the type of eligibility condition. Table was last updated for the June 30, 2014, valuation pursuant to an experience study of the period July 1, 2009 to June 30, 2013.
The long-term expected real rate of return on pension plan investments is determined using the best estimates of geometric real rates of return for each major asset class. These returns are combined to produce the long- term expected rate of return by weighting the expected future real rates of return by the target asset allocation percentage and by adding expected inflation. For each major asset class that is included in SERS’ target asset allocation, calculated as of the measurement date of June 30, 2017, the best estimates of geometric real rates of return are summarized in the following table:

STATE OF ILLINOIS DEPARTMENT OF THE LOTTERY
Notes to Basic Financial Statements
June 30, 2018
25 (Continued)
Long-Term
Target Expected Real Asset Class Allocation Rate of Return
U.S. Equity
23% 5.50% Developed Foreign Equity 13% 5.30% Emerging Market Equity 8% 7.80% Private Equity 7% 7.60% Intermediate Investment Grade Bonds 14% 1.50% Long-term Government Bonds 4% 1.80% TIPS 4% 1.50% High Yield and Bank Loans 5% 3.80% Opportunistic Debt 8% 5.00% Emerging Market Debt 2% 3.70% Core Real Estate 5.5% 3.70% Non-core Real Estate 4.5% 5.90% Infrastructure 2% 5.80%
Total 100%
Discount Rate. A discount rate of 6.78% was used to measure the total pension liability as of the measurement date of June 30, 2017 as compared to a discount rate of 6.64% used to measure the total pension liability as of the prior year measurement date. The June 30, 2017 single blended discount rate was based on the expected rate of return on pension plan investments of 7.00% and a municipal bond rate of 3.56%, based on an index of 20-year general obligation bonds with an average AA credit rating as published by the Federal Reserve. The projection of cash flows used to determine this single discount rate assumed that plan member contributions will be made at the current contribution rate and that contributions will be made based on the statutorily required rates under Illinois law. Based on these assumptions, the pension plan’s fiduciary net position and future contributions will be sufficient to finance the benefit payments through the year 2073. As a result, the long-term expected rate of return on pension plan investments was applied to projected benefit payments through the year 2073, and the municipal bond rate was applied to all benefit payments after that date.

STATE OF ILLINOIS DEPARTMENT OF THE LOTTERY
Notes to Basic Financial Statements
June 30, 2018
26 (Continued)
Sensitivity of the Net Pension Liability to Changes in the Discount Rate. The Department’s proportionate share of net pension liability for the plan was calculated using the stated discount rate, as well as what the net pension liability would be if it were calculated using a discount rate that is one-percentage point lower or one- percentage point higher than the current rate as shown below (amounts expressed in thousands):
1%
Decrease Discount
Rate 1%
Increase 5.78% 6.78% 7.78%
Department's proportionate share of the net pension liability
$ 101,616
$ 83,979
$ 69,544
Payables to the pension plan. At June 30, 2018, the Department reported a payable of $247 thousand to SERS for the outstanding amount of contributions to the pension plan required for the year ended June 30, 2018.
Due from other state funds. At June 30, 2018, the Department reported a due from other state funds of $368 thousand from SERS for the overpayment of contributions to the pension plan for the rate change in January 2018 from 54.013 to 47.342 per Public Act 100-0023, that was retroactive to July 1, 2017. See Note 5(a).
(9) Post-Employment Benefits Other Than Pensions (OPEB)
Plan description. The State Employees Group Insurance Act of 1971 (Act), as amended, authorizes the Illinois State Employees Group Insurance Program (SEGIP) to provide health, dental, vision, and life insurance benefits for certain retirees and their dependents. Substantially all of the Department’s full-time employees are members of SEGIP. Members receiving monthly benefits from the General Assembly Retirement System (GARS), Judges Retirement System (JRS), State Employees’ Retirement System of Illinois (SERS), Teachers’ Retirement System (TRS), and State Universities Retirement System of Illinois (SURS) are eligible for these other post-employment benefits (OPEB). The eligibility provisions for each of the retirement systems are defined within the State’s CAFR.
The Department of Central Management Services administers these benefits for annuitants with the assistance of the public retirement systems sponsored by the State (GARS, JRS, SERS, TRS and SURS). The State recognizes SEGIP OPEB benefits as a single-employer defined benefit plan. The plan does not issue a stand- alone financial report.
Benefits provided. The health, dental, and vision benefits provided to and contribution amounts required from annuitants are the result of collective bargaining between the State and the various unions representing the State’s and the university component units’ employees in accordance with limitations established in the Act. Therefore, the benefits provided and contribution amounts are subject to periodic change. Coverage through SEGIP becomes secondary to Medicare after Medicare eligibility has been reached. Members must enroll in Medicare Parts A and B to receive the subsidized SEGIP premium available to Medicare eligible participants. The Act requires the State to provide life insurance benefits for annuitants equal to their annual salary as of the last day of employment until age 60, at which time, the benefit amount becomes $5,000.
Funding policy and annual other postemployment benefit cost. OPEB offered through SEGIP are financed through a combination of retiree premiums, State contributions and Federal government subsidies from the Medicare Part D program. Contributions are deposited in the Health Insurance Reserve Fund, which covers both active State employees and retirement members. Annuitants may be required to contribute

STATE OF ILLINOIS DEPARTMENT OF THE LOTTERY
Notes to Basic Financial Statements
June 30, 2018
27 (Continued)
towards health and vision benefits with the amount based on factors such as date of retirement, years of credited service with the State, whether the annuitant is covered by Medicare, and whether the annuitant has chosen a managed health care plan. Annuitants who retired prior to January 1, 1998, and who are vested in the State Employee’s Retirement System do not contribute toward health and vision benefits. For annuitants who retired on or after January 1, 1998, the annuitant’s contribution amount is reduced five percent for each year of credited service with the State allowing those annuitants with twenty or more years of credited service to not have to contribute towards health and vision benefits. All annuitants are required to pay for dental benefits regardless of retirement date. The Director of Central Management Services shall, on an annual basis, determine the amount the State shall contribute toward the basic program of group health benefits. State contributions are made primarily from the General Revenue Fund on a pay-as-you-go basis. No assets are accumulated or dedicated to funding the retiree health insurance benefit and a separate trust has not been established for the funding of OPEB.
For fiscal year 2018, the annual cost of the basic program of group health, dental, and vision benefits before the State’s contribution was $10,926.24 ($6,145.92 if Medicare eligible) if the annuitant chose benefits provided by a health maintenance organization and $14,939.04 ($5,165.04 if Medicare eligible) if the annuitant chose other benefits. The State is not required to fund the plan other than the pay-as-you-go amount necessary to provide the current benefits to retirees.
Total OPEB liability, deferred outflows of resources, deferred inflows of resources and expense related to OPEB. The total OPEB liability, as reported at June 30, 2018, was measured as of June 30, 2017, with an actuarial valuation as of June 30, 2016. At June 30, 2018, the Department recorded a liability of $58.928 million for its proportionate share of the State’s total OPEB liability. The Department’s portion of the OPEB liability was based on the Department’s proportion of employer contributions relative to all employer contributions made to the plan during the year ended June 30, 2017. As of the current year measurement date of June 30, 2017, the Department’s proportion was 0.1426%, which was a decrease of 0.0097% from its proportion measured as of the prior year measurement date of June 30, 2016.
The Department recognized OPEB expense for the year ended June 30, 2018, of $3.167 million. At June 30, 2018, the Department reported deferred outflows and deferred inflows of resources, as of the measurement date of June 30, 2017, from the following sources (amounts expressed in thousands):
Deferred Outflows of Resources
Deferred Inflows of Resources
Differences between expected and actual experience $ 19 $ - Changes of assumptions - 5,595 Changes in proportion and differences between employer
contributions and proportionate share of contributions - 3,445 Department contributions subsequent to the measurement date 1,253 -
Total $ 1,272 $ 9,040
The $1.253 million reported as deferred outflows of resources related to OPEB resulting from Department contributions subsequent to the measurement date will be recognized as a reduction to the OPEB liability in the year ended June 30, 2019. Other amounts reported as deferred outflows and deferred inflows of resources related to OPEB will be recognized in OPEB expense (credit) as follows (amounts expressed in thousands):

STATE OF ILLINOIS DEPARTMENT OF THE LOTTERY
Notes to Basic Financial Statements
June 30, 2018
28 (Continued)
Year ended June 30,
2019 $ (2,028) 2020 (2,028) 2021 (2,028) 2022 (2,028) 2023 (909)
Total $ (9,021)
Actuarial methods and assumptions. The total OPEB liability was determined by an actuarial valuation using the following actuarial assumptions, applied to all periods included in the measurement unless otherwise specified. The actuarial valuation for the SEGIP was based on GARS, JRS, SERS, TRS, and SURS active, inactive, and retiree data as of June 30, 2016, for eligible SEGIP employees, and SEGIP retiree data as of June 30, 2016.

STATE OF ILLINOIS DEPARTMENT OF THE LOTTERY
Notes to Basic Financial Statements
June 30, 2018
29 (Continued)
Valuation Date June 30, 2016
Measurement Date June 30, 2017
Actuarial Cost Method Entry Age Normal
Inflation Rate 2.75%
Projected Salary Increases* 3.00% - 15.00%
Discount Rate 3.56%
Healthcare Cost Trend Rate:
Medical (Pre-Medicare) 8.0% grading down 0.5% in the first year to 7.5%, then grading down 0.01% in the second year to 7.49%, followed by grading down of 0.5% per year over 5 years to 4.99% in year 7
Medical (Post-Medicare) 9.0% grading down 0.5% per year over 9 years to 4.5% Dental 7.5% grading down 0.5% per year over 6 years to 4.5% Vision 3.00%
Retirees' share of benefit-related costs Healthcare premium rates for members depend on the date of retirement and the years of service earned at retirement. Members who retired before January 1, 1998, are eligible for single coverage at no cost to the member. Members who retire after January 1, 1998, are eligible for single coverage provided they pay a portion of the premium equal to 5 percent for each year of service under 20 years. Eligible dependents receive coverage provided they pay 100 percent of the required dependent premium. Premiums for plan year 2017 and 2018 are based on actual premiums. Premiums after 2018 were projected based on the same healthcare cost trend rates applied to per capita claim costs but excluding the additional trend rate that estimates the impact of the Excise Tax.
* Dependent upon service and participation in the respective retirement systems. Includes inflation rate listed.
Additionally, the demographic assumptions used in the this OPEB valuation are identical to those used in the June 30, 2016 valuations for GARS, JRS, SERS, TRS, and SURS as follows:

STATE OF ILLINOIS DEPARTMENT OF THE LOTTERY
Notes to Basic Financial Statements
June 30, 2018
30 (Continued)
Retirement age experience study^
Mortality^^
GARS
July 2012 - June 2015
RP-2014 White Collar Total Healthy Annuitant mortality table, sex distinct, set forward 1 year for males and set back 1 year for females and
generational mortality improvements using MP-2014 two-dimensional mortality improvement scales
JRS July 2012 - June 2015
RP-2014 White Collar Total Healthy Annuitant mortality table, sex distinct, set forward 1 year for males and set back 1 year for females and
generational mortality improvements using MP-2014 two-dimensional mortality improvement scales
SERS July 2009 - June 2013
105 percent of the RP 2014 Healthy Annuitant mortality table, sex distinct, with rates projected to 2015; generational mortality improvement factors
were added
TRS July 2011 - June 2014
RP-2014 with future mortality improvements on a fully generational basis using projection table MP-2014
SURS July 2010 - June 2014
RP-2014 White Collar, gender distinct, projected using MP-2014 two dimensional mortality improvement scale, set forward one year for male and
female annuitants
^ The actuarial assumptions used in the respective actuarial valuations are based on the results of actuarial experience studies for the periods defined. A modified experience review w as completed for SERS for the 3-year period ending June 30, 2015. Changes w ere made to the assumptions regarding investment rate of return, projected salary increases, inflation rate, and mortality based on this review . All other assumptions remained unchanged.
^^ Mortality rates are based on mortality tables published by the Society of Actuaries' Retirement Plans Experience Committee.
Discount rate. Retirees contribute a percentage of the premium rate based on service at retirement. The State contributes additional amounts to cover claims and expenses in excess of retiree contributions. Because plan benefits are financed on a pay-as-you-go basis, the single discount rate is based on a tax-exempt municipal bond rate index of 20-year general obligation bonds with an average AA credit rating as of the measurement date. A single discount rate of 2.85% at June 30, 2016, and 3.56% at June 30, 2017, was used to measure the total OPEB liability.
Sensitivity of total OPEB liability to changes in the single discount rate. The following presents the Department’s total OPEB liability, calculated using a Single Discount Rate of 3.56%, as well as what the plan’s total OPEB liability would be if it were calculated using a Single Discount rate that is one percentage point higher (4.56%) or lower (2.56%) than the current rate (amounts expressed in thousands):

STATE OF ILLINOIS DEPARTMENT OF THE LOTTERY
Notes to Basic Financial Statements
June 30, 2018
31 (Continued)
1%
Decrease
Current Single Discount Rate Assumption
1%
Increase (2.56%) (3.56%) (4.56%)
Department's proportionate share of total OPEB liability
$ 66,853
$ 58,928
$ 51,047
Sensitivity of the total OPEB liability to changes in the healthcare cost trend rate. The following presents the Department’s total OPEB liability, calculated using the healthcare cost trend rates as well as what the plan’s total OPEB liability would be if it were calculated using a healthcare cost trend rate that is one percentage point higher or lower, than the current healthcare cost trend rates (amounts in table expressed in thousands). The key trend rates are 8.0% in 2018 decreasing to an ultimate trend rate of 4.99% in 2025, for non-Medicare coverage, and 9.0% decreasing to an ultimate trend rate of 4.5% in 2027 for Medicare coverage.
Department's proportionate share of
1% Decrease (a)
Current Healthcare Cost
Trend Rates Assumption 1% Increase (b)
total OPEB liability $ 50,353 $ 58,928 $ 66,007
(a) One percentage point decrease in healthcare trend rates are 7.00% in 2018 decreasing to an ultimate trend rate of 3.99% in 2025, for non-Medicare coverage, and 8.00% in 2018 decreasing to an ultimate trend rate of 3.50% in 2027 for Medicare coverage. (b) One percentage point increase in healthcare trend rates are 9.00% in 2018 decreasing to an ultimate trend rate of 5.99% in 2025, for non-Medicare coverage, and 10.00% in 2018 decreasing to an ultimate trend rate of 5.50% in 2027 for Medicare coverage.
(10) Risk Management The Department is exposed to various risks of loss related to torts; theft of, damage to, and destruction of assets; errors and omissions; workers’ compensation; and natural disasters. The State retains the risk of loss (i.e., self-insured) for these risks.
The Department’s risk management activities are financed through appropriations to the Illinois Department of Central Management Services and are accounted for in the general fund of the State. The claims are not considered to be a liability of the Department; and accordingly, have not been reported in the Department’s financial statements for the year ended June 30, 2018.
(11) Private Management Agreement
(a) Northstar Lottery Group, LLC The State (acting through the Department) and in compliance with the Illinois Lottery Law 20 ILCS 1605/ entered into a 10-year private management agreement (PMA) with Northstar Lottery Group, LLC (Private Manager) effective January 18, 2011, for the purpose of providing all equipment, services, and functions necessary to operate the Lottery for the State, except for those specifically retained by the State as defined within the PMA. Under the terms of the PMA, the compensation to be paid is comprised of the reimbursement of operating expenses and incentive compensation payments. Incentive compensation is subject to annual adjustments in accordance with the PMA. For the year ended June 30, 2018, total
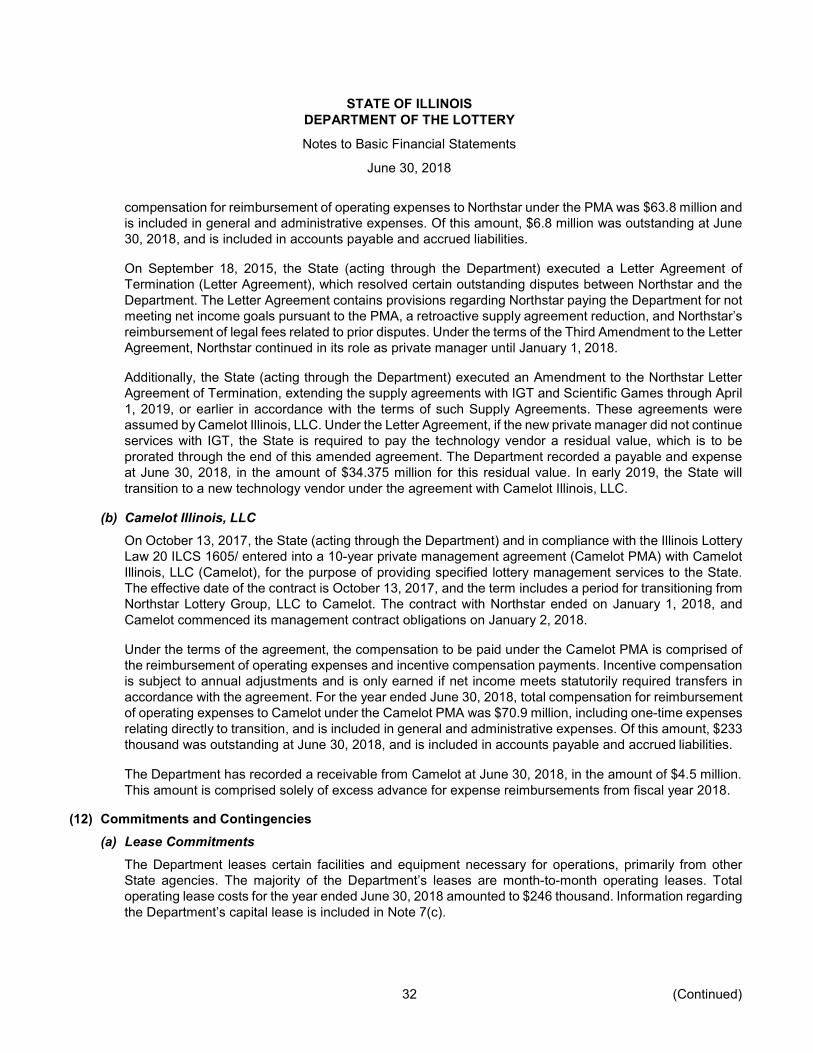
STATE OF ILLINOIS DEPARTMENT OF THE LOTTERY
Notes to Basic Financial Statements
June 30, 2018
32 (Continued)
compensation for reimbursement of operating expenses to Northstar under the PMA was $63.8 million and is included in general and administrative expenses. Of this amount, $6.8 million was outstanding at June 30, 2018, and is included in accounts payable and accrued liabilities.
On September 18, 2015, the State (acting through the Department) executed a Letter Agreement of Termination (Letter Agreement), which resolved certain outstanding disputes between Northstar and the Department. The Letter Agreement contains provisions regarding Northstar paying the Department for not meeting net income goals pursuant to the PMA, a retroactive supply agreement reduction, and Northstar’s reimbursement of legal fees related to prior disputes. Under the terms of the Third Amendment to the Letter Agreement, Northstar continued in its role as private manager until January 1, 2018.
Additionally, the State (acting through the Department) executed an Amendment to the Northstar Letter Agreement of Termination, extending the supply agreements with IGT and Scientific Games through April 1, 2019, or earlier in accordance with the terms of such Supply Agreements. These agreements were assumed by Camelot Illinois, LLC. Under the Letter Agreement, if the new private manager did not continue services with IGT, the State is required to pay the technology vendor a residual value, which is to be prorated through the end of this amended agreement. The Department recorded a payable and expense at June 30, 2018, in the amount of $34.375 million for this residual value. In early 2019, the State will transition to a new technology vendor under the agreement with Camelot Illinois, LLC.
(b) Camelot Illinois, LLC
On October 13, 2017, the State (acting through the Department) and in compliance with the Illinois Lottery Law 20 ILCS 1605/ entered into a 10-year private management agreement (Camelot PMA) with Camelot Illinois, LLC (Camelot), for the purpose of providing specified lottery management services to the State. The effective date of the contract is October 13, 2017, and the term includes a period for transitioning from Northstar Lottery Group, LLC to Camelot. The contract with Northstar ended on January 1, 2018, and Camelot commenced its management contract obligations on January 2, 2018.
Under the terms of the agreement, the compensation to be paid under the Camelot PMA is comprised of the reimbursement of operating expenses and incentive compensation payments. Incentive compensation is subject to annual adjustments and is only earned if net income meets statutorily required transfers in accordance with the agreement. For the year ended June 30, 2018, total compensation for reimbursement of operating expenses to Camelot under the Camelot PMA was $70.9 million, including one-time expenses relating directly to transition, and is included in general and administrative expenses. Of this amount, $233 thousand was outstanding at June 30, 2018, and is included in accounts payable and accrued liabilities.
The Department has recorded a receivable from Camelot at June 30, 2018, in the amount of $4.5 million. This amount is comprised solely of excess advance for expense reimbursements from fiscal year 2018.
(12) Commitments and Contingencies (a) Lease Commitments
The Department leases certain facilities and equipment necessary for operations, primarily from other State agencies. The majority of the Department’s leases are month-to-month operating leases. Total operating lease costs for the year ended June 30, 2018 amounted to $246 thousand. Information regarding the Department’s capital lease is included in Note 7(c).

STATE OF ILLINOIS DEPARTMENT OF THE LOTTERY
Notes to Basic Financial Statements
June 30, 2018
33
(b) Litigation
As discussed in Note 11(a), the Letter Agreement resolved outstanding disputes in connection with Northstar and its suppliers. The Department is routinely involved in a number of legal proceedings and claims that cover a wide range of matters.
The Department does not believe the outcome of these matters will have any material adverse effect on the financial position or results of operations of the Department.
(13) Restatement
In accordance with the Department’s adoption of GASB Statement No. 75, Accounting and Financial Reporting for Postemployment Benefits Other Than Pensions, the net OPEB liability, deferred outflows of resources, deferred inflows of resources and OPEB expense have been recognized in the financial statements. See Note 9. As part of the adoption, the financial statements have been restated as of July 1, 2017, as follows (amounts expressed in thousands):
Net Deficit, June 30, 2017, as previously reported $ (65,854) Restatement – deferred outflow of resources – OPEB 1,467 Restatement – net OPEB liability (66,249) Net Deficit, July 1, 2017, as restated $ (130,636)

34
STATE OF ILLINOIS DEPARTMENT OF THE LOTTERY
Combining Schedule of Net Position (Deficit) June 30, 20 18
(in thousands of dollars)
Deferred
Lottery
Prize Security State Lottery Winners Deposits
Assets and Deferred Outflows of Resources (0711) (0978) (1309) Eliminations Total
Current assets:
Cash and cash equivalents $ 31,716 — 848 — 32,564 Cash equity in State Treasury 65,972 1,891 — — 67,863 Investments, short-term 60 22,632 — — 22,692 Accounts receivable, net of allowance of $21,157 29,357 — — — 29,357 Other receivables 1 — — — 1 Due from other Department funds 1,830 — — (1,830) — Due from other State funds 368 — — — 368
Total current assets 129,304 24,523 848 (1,830) 152,845
Noncurrent assets:
Investments 162 244,541 — — 244,703 Capital assets being depreciated, net 83 — — — 83
Total noncurrent assets 245 244,541 — — 244,786
Deferred outflows of resources:
Deferred outflows of resources - pension 17,933 — — — 17,933 Deferred outflows of resources - OPEB 1,272 — — — 1,272
Total deferred outflows of resources 19,205 — — — 19,205
Total assets and deferred outflows of resources
148,754
269,064
848
(1,830)
416,836
Liabilities and Deferred Inflows of Resources
Current liabilities:
Prizes payable 74,002 — — — 74,002 Accounts payable and accrued liabilities 42,376 — — — 42,376 Due to other Government – Federal 60 — — — 60 Due to other Department funds — 1,830 — (1,830) — Due to other State funds 832 832 Unearned revenue 1,803 — — — 1,803 Other liabilities 122 72 848 — 1,042 Current portion of long-term annuity prizes payable 60 21,529 — — 21,589 Current portion of leases payable 22 — — — 22
Total current liabilities 119,277 23,431 848 (1,830) 141,726
Noncurrent liabilities:
Noncurrent portion of long-term annuity prizes payable 162 231,958 — — 232,120 Noncurrent portion of leases payable 35 — — — 35 Due to other State funds 89,045 — — — 89,045 Net pension liability 83,979 — — — 83,979 Net OPEB liability 58,928 — — — 58,928 Noncurrent other 664 — — — 664
Total noncurrent liabilities 232,813 231,958 — — 464,771
Deferred inflows of resources:
Deferred inflows of resources - pension 5,187 — — — 5,187 Deferred inflows of resources - OPEB 9,040 — — — 9,040
Total deferred inflows of resources 14,227 — — — 14,227
Total liabilities and deferred inflows of resources
366,317
255,389
848
(1,830)
620,724
Net Position (Deficit)
Invested in capital assets 26 — — — 26 Unrestricted (217,589) 13,675 — — (203,914)
Total net position (deficit) $ (217,563) 13,675 — — (203,888)
See accompanying independent auditors’ report.

35
STATE OF ILLINOIS DEPARTMENT OF THE LOTTERY
Combining Schedule of Revenues, Expenses, and Changes in Net Position (Deficit)
Year Ended June 30, 2018
(in thousands of dollars)
Deferred
Prize State Lottery Winners (0711) (0978) Eliminations Total
Operating revenues:
Charges for sales and services $ 2,926,375 — — 2,926,375 Other 6,517 — — 6,517
Total operating revenues 2,932,892 — — 2,932,892
Operating expenses:
Cost of sales and services 165,045 — — 165,045 Prizes and claims 1,910,896 — — 1,910,896 General and administrative 163,855 — — 163,855 Private management contract residual value 34,375 — — 34,375 Depreciation 17 — — 17
Total operating expenses 2,274,188 — — 2,274,188
Operating income 658,704 — — 658,704
Nonoperating revenues (expenses):
Investment income (expense) (297) (2,791) — (3,088) Interest expense (17) (6,337) — (6,354) Other (18) 29 — 11
Total nonoperating revenues (expenses), net (332) (9,099) — (9,431)
Change in net position (deficit) before transfers 658,372 (9,099) — 649,273
Transfers from other State funds (33) — 33 —
Transfers to other State funds (722,463) (29) (33) (722,525)
Change in net position (deficit) (64,124) (9,128) — (73,252)
Net position (deficit), July 1, 2017 (as restated) (153,439) 22,803 — (130,636)
Net position (deficit), June 30, 2018 $ (217,563) 13,675 — (203,888)