annual report for the year ended 31 december 2016 · 2017-05-29 · annual report for the year...
TRANSCRIPT


02
Annual Report for the year ended 31 December 2016
Contents
1. Corporate Information 3
2. Notice of Annual General Meeting 4
3. Company Overview
o MD’s Foreword 5
o About Us 6
o Our History 7
8-9o Our People
o Mission & Vision 10
o Parent Company 11
o Property Showcase 12 - 13
4. Financial Highlights 14 - 15
5. Chairman's Report 16 - 17
6. Corporate Governance Report 18 - 22
7. Report of the Independent Consultant on the appraisal of the Board 23
8. Financials
o Directors' Report 24 - 26
o Statement of Directors' Responsibilities 27
o Audit Committee Report 28
o Independent Auditor's Report 29 - 32
o Consolidated and Separate Statements of Profit or
Loss and Other Comprehensive Income 33
o Consolidated and Separate Statements of Financial Position 34
o Consolidated and Separate Statements of Changes In Equity 35 - 36
o Consolidated and Separate Statements of Cash Flows 37
o Notes To The Financial Statements 38 - 111
Other Financial Information:
o Value Added Statements 112
o Five-Year Financial Summary 113 - 114
9. Proxy 115
10. List of Unclaimed Dividend 119

Directors Hon. Justice George Oguntade (Rtd JSC), (CFR,CON) Mr Wale Odutola Mr. Kola Ashiru-Balogun Mr. Deji Alli (OFR) Mr. Bode Olaibi Mrs. Chioma Okigbo Mr. Dafe Akpedeye (SAN, OFR) Arc. Eddy Eguavoen Mr. Daniel Font (Spanish)
Registered office 8 Kasumu Ekemode Street Off Saka Tinubu Street Victoria Island P.O. Box 52290 Ikoyi Lagos
Auditors KPMG Professional Services (Chartered Accountants) KPMG Tower Bishop Aboyade Cole Street Victoria Island PMB 40014, Falomo Lagos. www.ng.kpmg.com
Company Secretary ARM Trustees Limited 1 Mekunwen Road Off Oyinkan Abayomi Drive P.O. Box 52290 Ikoyi Lagos
Registrars Africa Prudential Registrars Plc 220B Ikorodu Road Palmgrove Lagos
Bankers Access Bank Plc. Guaranty Trust Bank Plc. United Bank for Africa Plc. Zenith Bank Plc. First Bank of Nigeria
RC No. 645036
03
Annual Report for the year ended 31 December 2016
Corporate Information

Annual Report for the year ended 31 December 2016
Notice of Annual General Meeting
04
NOTICE IS HEREBY GIVEN that the 9th Annual General Meeting of Mixta Real Estate Plc. (the “Company”) will be held at Darlington Hall, Plot CDE, Ilupeju, Lagos, Nigeria on, Tuesday, June 6, 2017 at 11.00 a.m. to transact the following businesses:
Ordinary Business
1. To receive the Audited Financial Statements for the year ended December 31, 2016 and the Reports of the Directors and Auditors thereon.
2. To declare a Dividend.3. To re-elect Directors. 4. To authorize the Directors to fix the Remuneration of
the Auditors.5. To elect members of the Audit Committee.
Dated May 11, 2017
By Order of the Board
ARM Trustees LimitedCOMPANY SECRETARY
NOTES
ProxyA member of the Company entitled to attend and vote at the Annual General Meeting is entitled to appoint a proxy in his stead. All instruments of proxy should be completed and deposited at the office of the Company's Registrars, Africa Prudential Registrars Plc, 220B, Ikorodu Road, Palmgrove, Lagos not later than 48 hours before the time of holding the meeting.
A proxy need not be a member of the Company. A proxy form is printed at the back of the Audited Financial Statements.
DividendThe Board recommends a dividend of 18 kobo per
ordinary share of 50 kobo each which will be subject to withholding tax at the appropriate rate.
Dividend WarrantsIf the dividend proposed by Directors is approved by members at the Annual General Meeting, dividend warrants will be distributed to Shareholders whose names appear in the Company's Register of Members at the close of business on Monday May 22, 2017
Closure of Register & Transfer BooksNOTICE IS HEREBY GIVEN that the Register of Members and Transfer Books of the Company will be closed on Tuesday May 23, 2017.
Audit CommitteeAs stipulated by Section 359(5) of the Companies and Allied Matters Act, Cap C20, LFN, 2004, any member may nominate a Shareholder for election to the Audit Committee by giving notice in writing of such nomination to the Company Secretary at least 21 days before the Annual General Meeting.
Audited Financial StatementsCopies of the Audited Financial Statements of the Company shall be available at www.mixtanigeria.com and the under listed locations:
i. Africa Prudential Registrars Plc, 220B, Ikorodu Road, Palmgrove, Lagos;
ii. ARM Investment Center, 86 Adeniran Ogunsanya, Surulere, Lagos;
iii. ARM Investment Center, 68C Coker Road, Ilupeju, Lagos;
iv. ARM Investment Center, 139 Murtala Mohammed Way, Onitsha;
v. Asset & Resource Management Holding Company Limited, 129 Adetokunbo Ademola Crescent Abuja; and
vi. Asset & Resource Management Holding Company Limited 12 Circular Road Presidential Estate, GRA Phase II, Port Harcourt.

It gives me great pleasure to welcome all our highly esteemed shareholders to the Company's 9th Annual General Meeting.
2016 was the start of our campaign towards ensuring the delivery of value across all our stakeholder levels. Amidst a challenging business and operating environment, we gained significant strides towards achieving our goals for the year.
We commenced our fund-raising exercise for the Group, streamlined our product offerings to focus on affordable housing, focused on building strategic partnerships for business expansion, and we also intensified sales and marketing efforts for all our products.
We remain confident in our capabilities to continually identify unique opportunities that will set us apart in the industry and further strengthen our business model.
We thank you for your continued support and belief in Mixta Real Estate Plc, and look forward to a successful 2017.
Kola Ashiru-BalogunManaging Director
Annual Report for the year ended 31 December 2016
MD’s Foreword
05

Mixta Real Estate Plc (“Mixta Nigeria”), formerly ARM Properties Plc, is a leading real estate development company in Nigeria. The company has a strong track record and diverse real estate portfolio, with operations spanning the residential, commercial, and retail sectors of the Nigerian real estate industry.
Established in 2006, Mixta Nigeria has successfully delivered close to 3,000 real estate assets, comprising homes, plots and retail outlets to end-buyers. Our success is built on the strength of our asset base-Mixta Nigeria has a Net Asset Value of over N61 billion, one of the largest in its sector in Nigeria.
Mixta Nigeria executes medium to large scale real estate development projects. By carefully and strategically selecting our real estate projects, we are able to contribute to viable community developments and bring about sustainable transformation of the real estate sector.
Mixta Nigeria is a subsidiary of Mixta Africa, an ARM company.
Annual Report for the year ended 31 December 2016
About Us
06

07
Key Milestones
Mixta Real Estate Plc commenced operations in February 2006 as a real estate investment fund promoted by Asset & Resource Management Holding Company Limited (ARM), (an established asset management company headquartered in Lagos, Nigeria), to leverage ARM's advisory experience in real estate and capitalize on emerging opportunities in the fast growing Nigerian real estate market.
In 2006, ARM Real Estate Investment Plc was established. The name of the company was subsequently changed to ARM Properties Plc on the 9th of October 2007, as a result of operational and tax limitations encountered due to current legislation governing real estate investment funds in Nigeria. The Company successfully raised N5.675 billion by private placement in August 2008.
In 2015, ARM acquired Mixta Africa, an Africa-focused large scale property development company headquartered in Spain with subsidiary operations in several countries across North and sub-Saharan Africa. The integration of ARM Properties and Mixta Africa gave rise to Mixta Real Estate Plc, with Mixta Nigeria as the brand.
Going forward, Mixta Nigeria aims to leverage on the strong development expertise of its new parent company, as well as its own substantial land bank to scale up its delivery of homes and expand its focus to the affordable segment, thus cementing its position among the leading developers in the Nigerian real estate market.
Nigeria is ready for a global standard real estate company able to deliver on the huge needs of the market. Mixta Nigeria is already poised to face the challenge head on and take advantage of the remarkable opportunities that exist in the real estate market.
Annual Report for the year ended 31 December 2016
Our History
ARM commenced advisory mandates and transaction structuring services in real estate.
ARM embarked on small scale real estate development projects.
ARM commenced the development of larger scale projects, with the commencement of its first major development, Fara Park Estate
Restructured as a separate business from ARM with incorporation of ARM Properties Plc.
ARM began the process of acquiring a 100% stake in Mixta Africa
Carried out a capital raising exercise, raising circa N5.7bn.
ARM Properties Plc was merged with Mixta Africa and rebranded as Mixta Nigeria, and became a separate operating entity.
1996 20042000 2006 2008 2014 2015

Annual Report for the year ended 31 December 2016
Our People
08
“We chose the theme “Delivering value” for this report as it's the core of our operations. We recognize that we will stop being in business the minute we stop delivering value to our stakeholders – our shareholders, our customers, our people, and the communities in which we operate.
To our shareholders, we continue to outpace our competitive set by differentiating our business model. We have over the years
successfully, solidified our asset-base which is critical for building a stronger company and allows us to immediately respond to
different economic challenges. You will see our stellar performance this year in the body of this report. To our customers, we strive to surpass their expectations by consistently offering products that fit their lifestyles and investment needs. We have process-driven units that spend significant time in planning our developments before execution, and monitor construction progress with the objective of delivering our products at higher quality
levels.
We take a vested interest in the development of our people especially during these tougher economic cycles. We constantly
provide training and ensure our compensation is at par, or better with our competitors so we can continue to retain our talent. We utilize
an open-door policy that enables individual contributions regardless of the level of staff. We treat our people like real people and not just employees. Apart from actively engaging the stakeholders in our communities, we ensure that our developments are provided in a contextually appropriate framework which speak to the present and future needs and aspirations of our society. Our developments are designed and implemented considering the impact to our future generations.”
Kola Ashiru-BalogunManaging Director, Mixta Real Estate Plc.
“Delivering value to our esteemed clients lies at the very core of what we do. From design to construction and fit outs, we constantly feel the pulse of our clients by delivering world class environmentally friendly properties at very attractive prices. Our team of design and Construction professionals ensure very high quality construction standards. Health, Safety and environmental standards are also strictly adhered to in our project delivery.”
Udo Ukpai AsoHead of Technical Services, Mixta Real Estate Plc.

Annual Report for the year ended 31 December 2016
Our People
09
“Mixta's corporate existence is anchored on value delivery. We deliver value to our shareholders and investors by ensuring that the financial statements of the company is easily accessible and it contains the requisite information that the investors need to know about the operations and the financial status of the company.We also deliver value by ensuring that Client's investments in Mixta's properties today is worth a lot more in two to three years. The value we deliver is depicted in the amount of presales we receive on virtually all our projects.”
Bukola OyeboadeSenior Reporting Associate, Mixta Real Estate Plc.
“We are driven by the need to add value in the real estate sector. Our team ensures that accurate and appropriate information required by all stakeholders to commence projects financing are available, effectively disseminated and managed. We deliver value by engaging vendors and consultants to provide specified services as required for meeting projects which translates to client's satisfaction.”
Juliet Nzelu Project Support Officer, Mixta Real Estate Plc
“For me, this means the creation of long-term value for ourstakeholders by developing products which meet the aspirations of our customers, are competitively specified and priced for the markets we operate in, and which crucially, do not compromise our brand standards.”
Lantana ElhassanTeam Lead – Design & Construction Standards.

10
VisionMixta Nigeria's vision is to be Nigeria's foremost real estate developer
MissionCreating value for our clients by delivering innovative solutions
Mission & Vision
Annual Report for the year ended 31 December 2016

Mixta Africa is a leading real estate company with operations in North and Sub-Saharan Africa, specializing in the development of affordable residential properties.
With headquarters in Barcelona, Spain, Mixta Africa has existing subsidiary operations in 6 countries: Nigeria, Morocco, Tunisia, Senegal, Cote d'Ivoire and Mauritania, as well as past real estate developments in Algeria and Egypt.
Since its inception in 2005, Mixta Africa has successfully delivered close to 10,000 housing units, plots and retail outlets, and 2 hotels across Africa and currently boasts a land bank of approximately 20 million square metres.
The Company plans to expand into other countries in the medium term, and has a vision to be Africa's foremost real estate developer, creating value for clients through the delivery of innovative solutions.
Group Structure
ARM Holding Company Ltd.
Mixta Africa SA
Mixta Morocco
Adiva Properties Ltd.
Cross Town Mall Properties Ltd.
Oluwole Urban Mall Property Ltd.
Oakland PropertiesLtd.
Toll Systems Development Company Ltd.
Summerville Golf Club Ltd.
Garden City Golf Estate Development Ltd.
Mixta Tunisia
Mixta Senegal
Mixta Nigeria
Mixta Côte d’Ivoire
Mixta Mauritania
Mixta Hospitality & Retail
Asset & Resource Management Holding Company Limited.
Mixta Africa SA
Mixta Morocco
Adiva Properties Ltd.
Cross Town Mall Properties Ltd.
Oluwole Urban Mall Property Ltd.
Oakland PropertiesLtd.
Toll Systems Development Company Ltd.
Summerville Golf Club Ltd.
Garden City Golf Estate Development Ltd.
Mixta Tunisia
Mixta Senegal
Mixta Nigeria
Mixta Côte d’Ivoire
Mixta Mauritania
ARMHospitality & RetailMauritius
Geographical Footprint
Annual Report for the year ended 31 December 2016
Parent Company
11

Lakowe Lakes Golf and Country Estate is an exclusive, secure and serene haven. The development occupies a land area of roughly 308 hectares, and overlooks a 55 hectare man-made l a k e , w h e n c o m p l e t e d , t h e development will have over 1000 h o m e s l o c a t e d i n d i f f e r e n t neighborhoods. The gated community comprises a championship standard 18-hole golf course with a clubhouse and other leisure facilities. The golf course opened in 2012 and currently has over 400 active members.
The Village is an exclusive 18 home development which features two distinctly styled homes (the Palm and Baobab) for residents who prefer a more private experience within Lakowe Lakes.
The Enclave is the first neighbourhood to be developed on the Lakowe Lakes Golf & Country Estate.
It features a collection of lofts, flats, terraces and villas in a range of 1 – 4 bedroom units. Delivery to commence from second quarter of 2017.
12
Lakowe Lakes Golf &
Country Estate, Lagos
Annual Report for the year ended 31 December 2016
Property Showcase
The Village at Lakowe
The Enclave at Lakowe

Garden City Golf Estate is a proposed 18-hole world class championship golf course and residential estate that will offer premium accommodation in the heart of Greater Port Harcourt City. Located five minutes from the Port Harcourt International Airport and within the Igwurutta-Alli/Aluu/Omagwa community of Ikwerre LGA, the golf estate property spans a total area of over 195.64 hectares. , and will present some of the most breathtaking views in Port Harcourt city.
Residence de la Paix (RDP) is modelled after the successfully executed RDP development by Mixta Senegal, and is the first affordable housing development in Mixta Nigeria's portfolio. The development comprises 2 and 3 bedroom ready-to-move-in flats, and the first phase will deliver 608 units. The development was introduced in 2016, and delivery is scheduled to commence from fourth quarter 2017.
In Fara Park II, we have created an exclusive, beautiful, new community that is modelled after our Fara Park. Fara Park II is located in a secure, gated neighbourhood with wide, paved roads, just behind Fara Park. Other amenities include power and exclusive water supply systems, as well as recreational facilities and commercial areas.
13
Garden City Golf Estate,
Port Harcourt
Residence de la Paix
Fara Park II
Annual Report for the year ended 31 December 2016
Property Showcase

Annual Report for the year ended 31 December 2016
Financial Highlights
Financial Statement Dec-16 Dec-15 Dec-14 Feb-14 Dec-13
Caption (Billion) (Billion) (Billion) (Billion) (Billion)
Gross Revenue 7.6 5.4 8.1 2.7 1.1
Profit After tax 1.0 1.1 1.0 1.7 0.4
Shareholders' Funds 28.7 28.1 27.4 30.0 36.8
Dividend per share 18.0 23.0 20.0 17.0 12.0
Total Assets 118.6 118.0 112.6 80.4 77.5
14
Gross Revenue ( 7.6 Billion)N
7.6
5.4
8.1
2.7
1.1
Dec-16Dec-15Dec-14Feb-14Dec-13
Shareholders’ Fund (N28.7 billion)
28.7 28.1 27.4
30.0
36.8
Dec-16Dec-15Dec-14Feb-14Dec-13
Profit After Tax (N1.0 billion)
1.0
1.1
1.0
1.7
0.4
Dec-16Dec-15Dec-14Feb-14Dec-13
Dividend Per Share (18 Kobo)
18.0
23.0
20.0
17.0
12.0
Dec-16Dec-15Dec-14Feb-14Dec-13
Total Assets (N118.6 billion)
118.6 118.0 112.6
80.4 77.5
Dec-16Dec-15Dec-14Feb-14Dec-13

Annual Report for the year ended 31 December 2016
Financial Highlights
In thousands of Naira
Dec-16 Dec-15 Dec-14 Feb-14 Dec-13
000 000 000 000000
Gross Revenue 5,416,632 8,118,196 2,694,342 1,120,6627,565,581
Profit Before tax 1,370,344 1,454,364 2,100,929 591,9721,257,001
Taxation 299,725 477,138 371,438 205,705 291,566
Profit After Tax 1,070,619 977,226 1,729,491 386,267965,435
Transfer to retained Earnings 607,191 891,557 1,274,308 347,731 754,070
Shareholders' Funds 28,126,831 27,392,923 30,004,276 36,819,88628,705,048
Basic Earnings Per Share (kobo) 35 53 76 23 45
Dividend Per Share (kobo) 23 20 17 12 18
Dividend paid 336,711 286,205 202,027 202,027 387,218
Housing Units Delivered 67 606 - - 292
15

My Fellow Shareholders,I am pleased to welcome you to the 9th Annual
General Meeting of our Company and present our
financial results and operating performance for the
financial year ended 31st December 2016, in the
context of the operating environment.
For the first time in 25 years, our country experienced
a recession. Reduced oil revenues, tight capital
controls, and currency volatility combined to make
2016 a challenging year for Nigeria. With the
economic uncertainty looming, the real estate
industry also felt increased pressure as reduced
production capacity fuelled increased demand for
imported products.
However, the situation is not all bleak as indirect real
estate opportunities, increased budget allocation
geared towards infrastructure, and a government-
planned social housing programme of which Mixta
Nigeria is at the forefront of, are only but a few
indicators that the market though currently
suppressed, is still showing positive signals for a
turnaround in the coming years.
Review of the 2016 Operating EnvironmentThe global economy continued to grow at a
disappointing pace, with growth held back by a
lackluster performance in advanced economies and
quite a number of political shocks across the globe.
The UK's surprise vote to leave the EU leading to the
resignation of Prime Minister David Cameron,
followed by the election of Donald Trump to the US
presidency in November are events that will continue
to have ramifications well beyond the global borders
in 2017 and beyond.
In 2016, global growth fell to 2.3%, the weakest
performance since the global financial crisis.
Advanced economies continued to struggle with
subdued growth and low inflation due to increased
uncertainty about policy direction, tepid investments,
and sluggish productivity growth. As growth
projections continue to be downgraded for both
advanced and emerging economies, a moderate
recovery is however expected in 2017 amid
heightened uncertainty.
In our local terrain, the situation was not any better.
The Nigerian economy plunged into recession as the
nation's GDP contracted and yearly GDP growth rate
fell to -1.6%. The sharp contractions were largely
attributable to oil production woes amongst other
macro-economic factors. The non-oil sector on the
other hand sustained robust growth of 5.4% during
the year which helped in ensuring resilience in overall
output growth. The Country is however expected to
exit its recessionary period by the 2nd quarter of 2017
due to anticipated stabilization in oil production and
improvements in agricultural output.
The Real Estate IndustryAmidst rising inflation, declining GDP growth, a
weakening currency, and an official recession
declaration, 2016 was without a doubt, a year of
further depression for the Nigerian real estate sector.
Growth in the industry declined drastically to -1.51%
in 2016 from 2.79% in 2015. Due to the country's
Annual Report for the year ended 31 December 2016
Chairman’s Report
16

Annual Report for the year ended 31 December 2016
Chairman’s Report (cont’d)
heavy dependence on oil and imports, as
exchange rates increased in 2016, the price of
goods, building materials inclusive sky rocketed,
causing a decline in the contribution and
activities of the construction and real estate
sectors.
The impact of the Nigeria Mortgage Refinance
Company (NMRC) is yet to be felt across the
industry. Since it began operations in 2014, the
Company has till date only managed to refinance
a low volume of mortgages, and as a result not
yet achieved the anticipated ripple effect of
increased activities in the housing sector.
Our Performance Our primary focus for 2016 was the completion
and delivery of projects. We successfully recorded
over 75% of pre-sales activities across all our
projects and over 50% construction on all project
sites. In 2016, we sold a total of 458 units, a
255% increase from the previous year as a result
of intensified marketing efforts.
Mixta Nigeria completed the shelf registration of
a N30billion Bond programme, and successfully
tapped N4.2billion in the first tranche of the
Programme. We also successfully registered a
N10billion Commercial Paper Programme.
However, prevailing adverse market conditions
have negatively impacted the issuance of the
notes and we hope to close out on all our fund-
raising drives by mid-2017.
During the year, we continued to focus on
building key strategic alliances and partnerships
required for business expansion and technical
capacity building. To this end, we successfully
executed a bilateral agreement with the China
Aerospace Construction Group Corporation to
provide contractor financing to the tune of
US$300million to finance a number of our
projects in Nigeria.
I am pleased to report that despite the
cha l leng ing loca l , mic ro and macro
environments, the Group achieved revenues of
N4.9billion and profit after tax of N937million in
the financial year ended 31st December, 2016.
Company OutlookIt is without question that we continue to operate
in a challenging micro and macro environment.
Our resolve however is to ensure that Mixta
Nigeria keeps its head afloat by consistently
seeking out exciting and unique opportunities
centered on the attainment of our goals. With
our proposed participation in the Federal
Government's social housing scheme aimed at
providing a million affordable housing units
around the country, this initiative together with
the execution of our other planned projects will
be sure to positively impact our performance in
the coming year.
Hon. Justice George Oguntade (Rtd.), (CON, CFR)Chairman
17

Annual Report for the year ended 31 December 2016
Corporate Governance Report
18

Annual Report for the year ended 31 December 2016
Corporate Governance Report
19

Annual Report for the year ended 31 December 2016
Corporate Governance Report
20

Annual Report for the year ended 31 December 2016
Corporate Governance Report
21

Annual Report for the year ended 31 December 2016
Corporate Governance Report
22

Annual Report for the year ended 31 December 2016
Report of the Independent Consultanton the appraisal of the Board
23
May 9, 2017
REPORT OF THE EXTERNAL CONSULTANTS ON THE PERFORMANCE OF THE BOARD OF DIRECTORS OF MIXTA REAL
ESTATE PLC ("MIXTA") FOR THE YEAR ENDED 31 DECEMBER 2016
DCSL Corporate Services Limited was engaged by the ARM Group to undertake an appraisal of the Board of Directors of
Mixta Real Estate Plc ("Mixta"), a subsidiary of the Group, for the year-ended 31st December 2016. Our appraisal entailed a
review of the Company's corporate and statutory documents, the Minutes of Board and Committee meetings, policies in
place and other ancillary documents made available to us. We also administered Questionnaires, Board and Peer Review
Surveys to the Directors.
The essence of the review was to ascertain the level of the Board's compliance with corporate governance practices, with
particular reference to the provisions of the Securities and Exchange Commission (SEC) Code of Corporate Governance 2011
(SEC Code) and international best practices, and covered the following seven key corporate governance themes:
1. Board Structure and Composition 2. Strategy and Planning 3. Board Operations and Effectiveness 4. Measuring and Monitoring of Performance 5. Risk Management and Compliance 6. Corporate Citizenship; and 7. Transparency and Disclosure.
Following the conclusion of the evaluation exercise, we can confirm that the Board sufficiently complied with the provisions
of the SEC Code and that the activities of the Board and the Company are in sync with corporate governance best practice. In
our opinion, the Directors displayed significant commitment to enhancing the Company's growth and achieving
improvement in its performance.
The above notwithstanding, we have advised the need for the Board to define a selection criteria for appointment unto the
Board as stipulated in Section 13.2 of the SEC Code, and a clear-cut framework for the delegation of Board authority as
required under Section 2.4 of the SEC Code.
We also recommend that the Board should consider appointing an additional Executive Director to provide some balance on
the Board.
Details of other key findings and recommendations are contained in our Report.
Yours faithfully, For: DCSL Corporate Services Ltd
Bisi Adeyemi Managing Director

Annual Report for the year ended 31 December 2016
Director’s Report
The Directors have the pleasure of presenting their report on the affairs of Mixta Real Estate Plc formerly "ARM Properties Plc" (“Mixta Real Estate” or "the Company") and its subsidiary companies (together “the Group”) together with the financial statements and auditor's report for the year ended 31 December 2016.
Principal activity
The Group provides property development and investment services. The Group undertakes real estate development projects with the aim of outright sale or lease of the properties to meet the needs of individuals and corporate bodies. The Company makes equity and debt investments in property development entities as part of its investment strategy. There have been no material changes to the nature of the Group's business from prior periods.
Legal form and business review
ARM Properties was initially incorporated as ARM Real Estate Investment Plc. on 6 February, 2006. Its name was changed to ARM Properties Plc on December 21, 2007. The name ARM Properties Plc was then changed to Mixta Real Estate Plc on 29 September 2015.
The Company currently has six (6) subsidiaries; Crosstown Mall Properties Limited (99.9%), Adiva Properties Limited (99.9%), Oluwole Urban Mall Property Limited (70%), Oakland Properties Limited (99.9%), Toll System Development Company Limited - TSD (88%) and Summerville Golf Club Limited (67.9%). The Company also has joint control and owns 51% of the interest in a joint arrangement, Garden City Golf Estate Development Limited ("Garden City"). Garden City is a Limited Liability Company whose primary business activity is the development of golf courses and ancillary amenities.
Operating results
The following is a summary of the Group and the Company’s operating results for the year:
Group Group Company Company In thousands of naira 31 Dec 2016 31 Dec 2015 31 Dec 2016 31 Dec 2015
Profit before income tax 1,370,344 326,340 1,257,001 102,560 Income tax expense (299,725) (104,451)(291,566) (35,917)
Profit for the year 1,070,619 221,889 965,435 66,643 Non-controlling interest (463,428) – (211,365) –
Profit attributable to shareholders 607,191 221,889 754,070 66,643
Basic and diluted earnings per share (kobo) 36k 13k45k 4k
Dividend per share - DPS in kobo 23k 23k18k 18k
24

25
Annual Report for the year ended 31 December 2016
Director’s Report
The directors have recommended the payment of N303 million as dividend representing 18kobo per share on
the issued share capital of 1,683,558,000 shares of 50kobo each for the year ended 31 December 2016
(December 2015: 23k).
Directors and their interests:
The directors who served during the year were:
Hon. Justice George Oguntade (JSC Rtd) (CFR, CON) - Chairman
Mr Kola Ashiru-Balogun - Managing Director
Mr Bode Olaibi - Executive Director
Mr. Wale Odutola - Non-Executive Director
Mr. Deji Alli (OFR) - Non-Executive Director
Mrs. Chioma Okigbo - Non-Executive Director
Mr. Dafe Akpedeye (SAN) (OFR) - Non-Executive Director (Independent)
Arc. Eddy Eguavoen - Non-Executive Director (Independent)
Mr. Daniel Font (Spanish) - Non-Executive Director (Independent)
The direct interests of Directors in the issued share capital of the Company as recorded in the register of
Directors shareholding and for the purposes of section 275 of the Companies and Allied Matters Act are as
follows:
Names December 2016 December 2015
Hon. Justice George Oguntade Nil Nil
Mr. Wale Odutola 2 2
Mr. Kola Ashiru-Balogun 40,000 40,000
Mr. Deji Alli 2 2
Mrs. Chioma Okigbo 300,000 300,000
Mr. Bode Olaibi Nil Nil
Mr. Dafe Akpedeye Nil Nil
Mr. Daniel Font Nil Nil
Arc. Eddy Eguavoen Nil Nil
The Directors have not notified the Company of any indirect interests they hold in the shares of the Company for
the purpose of sections 275 and 276 of the Companies and Allied Matters Act of Nigeria.
Director's interest in contracts
For the purpose of section 277 of the Companies and Allied Matters Act, none of the existing directors had
direct or indirect interests in contracts or proposed contracts with the Company during the period.
Substantial interest in shares
According to the register of members as at 31 December 2016, no shareholder held more than 5% of the
issued share capital of the Company except the following:

26
Annual Report for the year ended 31 December 2016
Director’s Report
31 December 2016 31 December 2015
Number of Percentage of Number of Percentage of
Shareholders shares held Shareholding shares held Shareholding
Mixta Africa 644,009,407 38.25% 644,009,407 38.25%
Watford Properties Limited 409,784,975 24.34% 409,784,975 24.34%
Vetiva Capital Management Limited 239,818,025 14.24% 239,818,025 14.24%
ARM Nominees Limited* 108,277,577 6.43% 108,277,577 6.43%
* holds in trust shares on behalf of various investors
Property and equipment
Information relating to changes in property and equipment is given in note 19 to the financial statements.
Health safety and welfare at work including employment of disabled persons
The Group enforces health and safety rules and practices at the work environment, which are reviewed and tested regularly. The Company retains top-class private hospitals where medical facilities are provided for staff and their immediate families at the Company's expense. Fire prevention and fire-fighting equipment are installed in strategic locations within the Company's premises.
The Group operates a Group Personal Accident Insurance cover for the benefit of its employees. It also operates a contributory pension plan in line with the Pension Reform Act 2014.
Applications from suitably qualified disabled persons are welcomed by the Group. Where an employee becomes disabled, every effort is made to ensure continued employment. At present, the Group has no disabled employee.
Subsequent event
There were no subsequent events which could have had a material effect on the state of affairs of the Company and Group as at 31 December 2016 or the profit for the year ended on that date, which have not been adequately provided for or disclosed.
Auditors
Messrs. KPMG Professional Services, having satisfied the relevant corporate governance rules on their tenure in office have indicated their willingness to continue in office as auditors to the Company. In accordance with Section 357 (2) of the Companies and Allied Matters Act of Nigeria therefore, the auditors will be re-appointed at the next annual general meeting of the Company without any resolution being passed.
BY ORDER OF THE BOARD
ARM Trustees Limited
Company Secretary
1, Mekunwen Road,
Off Oyinkan Abayomi Drive,
Ikoyi, Lagos.
31 March 2017

Annual Report for the year ended 31 December 2016
The Directors accept responsibility for the preparation of the annual financial statements
that give a true and fair view in accordance with International Financial Reporting
Standards (IFRS) and in the manner required by the Companies and Allied Matters Act, Cap
C.20, laws of the Federation of Nigeria, 2004 and Financial Reporting Council of Nigeria
Act, 2011.
The Directors further accept responsibility for maintaining adequate accounting records as
required by the Companies and Allied Matters Act of Nigeria, Cap C.20, laws of the
Federation of Nigeria, 2004 and for such internal control as the directors determine is
necessary to enable the preparation of the financial statements that are free from material
misstatement whether due to fraud or error.
The Directors have made an assessment of the Group and Company’s ability to continue as
a going concern and have no reason to believe the Company will not remain a going
concern in the year ahead.
SIGNED ON BEHALF OF THE BOARD OF DIRECTORS BY:
Hon. Justice George Oguntade (Rtd JSC), (CFR,CON) Kola Ashiru- Balogun
FRC/2013/NBA/00000003886 FRC/2016/IODN/00000015616
Chairman Managing Director
31 March 2017 31 March 2017
to the Financial Statements
Statement of Directors’ Responsibilities in Relation
27

Annual Report for the year ended 31 December 2016
Audit Committee Report
To the members of Mixta Real Estate Plc
In accordance with the provisions of Section 359 (6) of the Companies and Allied Matters Act, Cap C.20, laws of
the Federation of Nigeria, 2004 the members of the Audit Committee of Mixta Real Estate Plc hereby report on
the financial statements for the year ended 31 December 2016 as follows:
- We have exercised our statutory functions under Section 359 (6) of the Companies and Allied Matters Act,
Cap C.20, laws of the Federation of Nigeria, 2004, and acknowledge the co-operation of management and
staff in the conduct of these responsibilities.
- We are of the opinion that the accounting and reporting policies of the Company and Group are in
accordance with legal requirements and agreed ethical practices and that the scope and planning of both
the external and internal audits for the period ended 31 December 2016 were satisfactory and reinforce the
Group's internal control systems.
- We have deliberated on the findings of the external auditors, who have confirmed that necessary
cooperation was received from management in the course of their statutory audit and we are satisfied with
management's responses thereon to the external auditor's recommendations on accounting and internal
control.
Mrs. Adenike Ogunlana
FRC/2015/ICAN/00000011613
Chairman, Audit Committee
23 March 2017
Members of the audit committee are:
1 Mrs. Adenike Ogunlana Chairman
2 Mr. Deji Alli Director
3 Mrs. Chioma Okigbo Director
4 Mr. Ralph Osayameh Member
5 Mr. Esan Ogunleye Member
6 Mr. Wale Odutola Director
7 Mr. Kola Ashiru-Balogun Ex-officio member
28

KPMG Professional ServicesKPMG TowerBishop Aboyade Cole StreetVictoria IslandPMB 40014, FalomoLagos
To the Members of Mixta Real Estate Plc.
Report on the Audit of the Consolidated and Separate Financial Statements
Opinion
We have audited the consolidated and separate financial statements of Mixta Real Estate Plc ("the Company") and its subsidiaries (together with the Company, "the Group"), which comprise the consolidated and separate statements of financial position as at 31 December 2016, and the consolidated and separate statements of profit or loss and other comprehensive income, the consolidated and separate statements of changes in equity, and the consolidated and separate statements of cash flows for the year then ended, and a summary of significant accounting policies and other explanatory information, as set out on pages 33 to 111.
In our opinion, the accompanying consolidated and separate financial statements give a true and fair view of the consolidated and separate financial position of the Company and its subsidiaries as at 31 December 2016, and of its consolidated and separate financial performance and its consolidated and separate cash flows for the year then ended in accordance with International Financial Reporting Standards (IFRSs) and in the manner required by the Companies and Allied Matters Act, Cap C.20, Laws of the Federation of Nigeria, 2004 and the Financial Reporting Council of Nigeria Act, 2011.
Basis for OpinionWe conducted our audit in accordance with International Standards on Auditing (ISAs). Our responsibilities under those standards are further described in the Auditor's Responsibilities for the Audit of the consolidated and separate Financial Statements section of our report.
An audit involves performing procedures to obtain audit evidence about the amounts and disclosures in the financial statements. The procedures selected depend on the auditor's judgment, including the assessment of the risks of material misstatement of the financial statements, whether due to fraud or error. In making those risk assessments, the auditor considers internal control relevant to the entity's preparation of financial statements that give a true and fair view in order to design audit procedures that are appropriate in the circumstances, but not for the purpose of expressing an opinion on the effectiveness of the entity's internal control. An audit also includes evaluating the appropriateness of accounting policies used and the reasonableness of accounting estimates made by the directors, as well as evaluating the overall presentation of the financial statements.
We believe that the audit evidence we have obtained is sufficient and appropriate to provide a basis for our audit opinion.
Key Audit MattersKey audit matters are those matters that, in our professional judgment, were of most significance in our audit of the consolidated and separate financial statements of the current year. These matters were addressed in the context of our audit of the consolidated and separate financial statements as a whole, and in forming our opinion thereon, and we do not provide a separate opinion on these matters.
The following Key Audit Matter applies to the consolidated and separate financial statements:
Measurement of trading propertiesProperties acquired for resale of properties under construction for the purpose of sale in the ordinary course of business, are
Abiola F. BadaAdewale K. AjayiAyobami L. SalamiJoseph O. TegbeOladimeji I. SalaudeenOluwafemi O. Awotoye
Adebisi O. LamikanraAjibola O. OlomolaChibuzor N. AnyanechiKabir O. OkunlolaOlanike I. JamesOluwatoyin A. Gbagi
Adekunle A. ElebuteAyodele A. SoyinkaGoodluck C. ObiMohammad M. AdamaOlumide O. OlayinkaOguntayo I. Ogungbenro
Adetola P. AdeyemiAyodele H. OthihiwaIbitomi M. AdepojuOladapo R. OkubadejoOlusegun A. SowandeVictor U. Onyenkpa
KPMG
Associate Partners:Nneka C. Eluma Temitope A. Onitiri

classified as trading properties by the Group and Company and are measured at the lower of cost and net realizable value. Net realizable value is determined based on current selling price of similar properties and on estimated selling prices for properties under construction.
The determination of the net realizable value involves estimation uncertainties and judgment in assessing whether the trading properties were carried at the lower of cost and net realizable value.
Our response:Our audit procedures included:
Assessment of the reasonableness of the net realizable value per management with independent market information for similar properties.
Assessment of the net realizable value of landed property in trading properties, which was derived from the professional valuation report of similar investment property within the Group’s property portfolio. We evaluated the qualification of the external expert engaged by management to determine if they are appropriately qualified to carry out the valuation exercise.
Refer to page 55 (Group accounting policies), page 73 (critical accounting policies) and page 93 (trading property)
The following Key Audit Matter applies to the consolidated financial statements only:
Valuation of investment propertyThe Group has investment in landed property, which is classified as investment property and is carried at fair value. The determination of the fair value involves management's estimate and exercise of significant judgment, which requires key subjective inputs and assumptions. The level of judgment involved in the determination of the fair value, makesInvestment Property an area of significance in our audit.
Our response:Our audit procedures included:
Evaluation of the qualification of the external experts engaged by management to ensure that they were qualified to carry out the valuation.
Assessment of the valuation results by the external expert engaged by management by comparing it to relevant independent property price information.
Evaluation of the reasonableness of the assumptions made for the valuation of the investment property of the Group.
Refer to page 55 (Group accounting policies), page 73 (critical accounting policies) and page 83 (investment properties)
Information Other than the Financial Statements and Audit Report thereon
The Directors are responsible for the other information.
The other information comprises the Directors' report, Statement of Directors' responsibilities, Report of the Audit Committee, value added statement, financial summary, which we obtained prior to the date of this report, and the Annual
KPMG

Report, which is expected to be made available to us after that date. Other information does not include the consolidated financial statements and our auditor's report thereon.
Our opinion on the consolidated and separate financial statements does not cover the other information and we do not express any form of assurance conclusion thereon.
In connection with our audit of the consolidated financial statements, our responsibility is to read the other information and, in doing so, consider whether the other information is materially inconsistent with the consolidated financial statements or our knowledge obtained in the audit, or otherwise appears to be materially misstated. If, based on the work we have performed on the other information obtained prior to the date of this auditor's report, we conclude that there is a material misstatement of this other information, we are required to report that fact. We have nothing to report in this regard.
When we read the outstanding reports, if we conclude that there is a material misstatement therein, we are required to communicate the matter to those charged with governance.
Responsibilities of the Directors for the Consolidated Financial StatementsThe directors are responsible for the preparation of financial statements that give a true and fair view in accordance with International Financial Reporting Standards (IFRS) and in the manner required by the Companies and Allied Matters Act Cap C.20, Laws of the Federation of Nigeria, 2004 and the Financial Reporting Council (FRC) of Nigeria, 2011, and for such internal control as the directors determine is necessary to enable the preparation of financial statements that are free from material misstatement, whether due to fraud or error.
In preparing the consolidated financial statements, the directors are responsible for assessing the group's ability to continue as a going concern, disclosing, as applicable, matters related to going concern and using the going concern basis of accounting unless the directors either intend to liquidate the group or to cease operations, or have no realistic alternative but to do so.
Auditor's Responsibilities for the Audit of the Consolidated Financial StatementsOur objectives are to obtain reasonable assurance about whether the consolidated financial statements as a whole are free from material misstatement, whether due to fraud or error, and to issue an auditor's report that includes our opinion. Reasonable assurance is a high level of assurance, but is not a guarantee that an audit conducted in accordance with ISAs will always detect a material misstatement when it exists. Misstatements can arise from fraud or error and are considered material if, individually or in the aggregate, they could reasonably be expected to influence the economic decisions of users taken on the basis of these consolidated financial statements.As part of an audit in accordance with ISAs, we exercise professional judgment and maintain professional skepticism throughout the audit. We also:
• Identify and assess the risks of material misstatement of the consolidated financial statements, whether due to fraud or error, design and perform audit procedures responsive to those risks, and obtain audit evidence that is sufficient and appropriate to provide a basis for our opinion. The risk of not detecting a material misstatement resulting from fraud is higher than for one resulting from error, as fraud may involve collusion, forgery, intentional omissions, misrepresentations, or the override of internal control.
• Obtain an understanding of internal control relevant to the audit in order to design audit procedures that are appropriate in the circumstances, but not for the purpose of expressing an opinion on the effectiveness of the Group's internal control.
KPMG

• Evaluate the appropriateness of accounting policies used and the reasonableness of accounting estimates and related disclosures made by the directors.
• Conclude on the appropriateness of the directors' use of the going concern basis of accounting and based on the audit evidence obtained, whether a material uncertainty exists related to events or conditions that may cast significant doubt on the group's ability to continue as a going concern. If we conclude that a material uncertainty exists, we are required to draw attention in our auditor's report to the related disclosures in the consolidated financial statements or, if such disclosures are inadequate, to modify our opinion. Our conclusions are based on the audit evidence obtained up to the date of our auditor's report. However, future events or conditions may cause the group to cease to continue as a going concern.
• Evaluate the overall presentation, structure and content of the consolidated financial statements, including the disclosures, and whether the consolidated financial statements represent the underlying transactions and events in a manner that achieves fair presentation.
• Obtain sufficient appropriate audit evidence regarding the financial information of entities or business activities within the Group to express an opinion on the consolidated financial statements. We are responsible for the direction, supervision and performance of the audit group. We remain solely responsible for our audit opinion.
We communicate with the directors regarding, among other matters, the planned scope and timing of the audit and significant audit findings, including any significant deficiencies in internal control that we identify during our audit.
We also provide the audit committee with a statement that we have complied with relevant ethical requirements regarding independence, and to communicate with them all relationships and other matters that may reasonably be thought to bear on our independence, and where applicable, related safeguards.
From the matters communicated with the audit committee, we determine those matters that were of most significance in the audit of the consolidated financial statements of the current period and are therefore the key audit matters. We describe these matters in our auditor's report unless law or regulation precludes public disclosure about the matter or when, in extremely rare circumstances, we determine that a matter should not be communicated in our report because the adverse consequences of doing so would reasonably be expected to outweigh the public interest benefits of such communication.
Report on Other Legal and Regulatory Requirements
Compliance with the requirements of Schedule 6 of the Companies and Allied Matters Act of Nigeria
In our opinion, proper books of account have been kept by the Company, so far as appears from our examination of those books and the Company's statement of financial position and statement of profit or loss and other comprehensive income are in agreement with the books of accounts.Signed:
Kabir O. Okunlola FRC/2012/ICAN/00000000428For: KPMG Professional Services Chartered Accountants18 May 2017Lagos, Nigeria
KPMG

Annual Report for the year ended 31 December 2016
33
Consolidated and Separate Statements of Profit or Lossand Other Comprehensive Income
In thousands of Naira Group CompanyGroup Company Notes 31 Dec 2015 31 Dec 201531 Dec 2016 31 Dec 2016
Revenue-sales of trading properties 9 3,683,410 - 4,923,515 1,024,631 Cost of sales- trading properties 10 (2,244,396) - (3,251,370) (718,213)
Profit on sale of trading properties 1,439,014 - 1,672,145 306,418
Fair value gain on investment property 11 976,420 - 1,884,400 - Interest income 12 586,448 935,497 536,934 942,256 Other income 13 170,354 528,435 220,732 582,016
Other operating income 1,733,222 1,463,932 2,642,066 1,524,272
Net impairment (loss)/reversal on financial assets 14 (105,816) 16,073 (83,137) (9,937) Personnel expenses 15 (216,476) (196,396)(290,561) (290,561)Depreciation 19 (223,241) (7,631)(239,180) (25,900) Operating expenses 16 (577,409) (448,675) (625,038) (501,112)
Total expenses (1,122,942) (636,629)(1,237,916) (827,510)
Operating profit before finance costs 2,049,294 827,303 3,076,295 1,003,180
Finance costs 17 (649,389) (500,963)(1,840,303) (900,620)
Share of profit /(loss) of equity-accounted investment 22(c) (29,561) –21,009 –
Profit before income tax 1,370,344 326,3401,257,001 102,560
Income tax expense 30(b) (299,725) (104,451)(291,566) (35,917)
Profit for the year 1,070,619 221,889965,435 66,643
Other comprehensive income - -- -
Other comprehensive income net of tax - -- -
Total comprehensive income for the year 1,070,619 221,889965,435 66,643
Profit attributable to:
Equity holders 607,191 221,889 754,070 66,643 Non-controlling interests 463,428 -211,365 -
1,070,619 221,889 965,435 66,643
Total comprehensive income attributable to: Equity holders 607,191 221,889 754,070 66,643 Non-controlling interests 463,428 -211,365 -
1,070,619 221,889 965,435 66,643 Basic and Diluted Earnings per share for profit attributable to the equity holders of the Company during the year (expressed in kobo per share):– Basic and Diluted Earnings per share (in kobo)18 36k 13k 45k 4k
The accompanying notes form an integral part of the financial statements.

Annual Report for the year ended 31 December 2016
34
Consolidated and Separate Statements of Financial Position
In thousands of naira Group CompanyGroup Company Notes 31 Dec 2016 31 Dec 2016 31 Dec 2015 31 Dec 2015Non-current assetsProperty and equipment 19 12,335,978 98,144 11,612,648 101,924 Investment property 20 55,589,800 - 57,575,884 - Investment in subsidiaries 21 - 31,608,026 - 31,608,026 Equity-accounted investment 22 2,476,789 2,505,100 2,497,798 2,505,100 Loans to related entities 23 165,635 7,457 - -
Total non-current assets 70,568,202 34,218,727 71,686,330 34,215,050
Current assetsLoan to related entities 23 5,039,017 8,891,337 4,988,251 9,764,896 Trading properties 24 32,179,040 4,566,445 32,961,970 4,496,283 Debtors and prepayments 25 9,317,543 7,627,301 8,333,064 14,133,133 Cash and cash equivalents 26 848,438 713,296 656,838 522,463
Total current assets 47,384,038 21,798,37946,940,123 28,916,775
Total assets 117,952,240 56,017,106 118,626,453 63,131,825
Non-current liabilitiesBorrowings 29 5,963,421 152,322 15,796,409 3,243,445 Deferred tax liabilities 27 5,510,525 9,763 5,701,756 12,554 Deposit for shares 28 31,856,738 31,606,738 31,855,488 31,606,738
Total non-current liabilities 43,330,684 31,768,82353,353,653 34,862,737
Current liabilitiesBorrowings 29 14,299,251 2,784,9689,370,098 2,834,012 Current income tax liability 30 2,344,456 640,463 2,179,277 414,371 Other liabilities and accruals 31 19,871,368 15,243,180 15,216,852 18,838,960 Deferred revenue-deposit from customers 32 9,012,103 126,7877,467,146 882,519 Provisions 33 967,547 - 2,334,379 166,916
Total current liabilities 46,494,725 18,795,39836,567,752 23,136,778
Total liabilities 89,825,409 50,564,221 89,921,405 57,999,515
EquityShare capital 34 841,779 841,779 841,779 841,779 Share premium 35 5,819,185 5,819,185 5,819,185 5,819,185 Common control acquisition deficit 36(a) (2,920,407) (2,156,000)(2,920,407) (2,156,000) Retained earnings 36(b) 17,743,510 947,92118,110,362 627,346
21,484,067 5,452,885 21,850,919 5,132,310
Non-controlling interest 37 6,642,764 - 6,854,129 -
Total equity 28,126,831 5,452,885 28,705,048 5,132,310
Total liabilities and equity 117,952,240 56,017,106 118,626,453 63,131,825
SIGNED ON BEHALF OF THE BOARD OF DIRECTORS BY:
Hon. Justice George Oguntade (Rtd.), (CON,CFR) Kola Ashiru- Balogun Rahman AkinwonmiFRC/2013/NBA/00000003886 FRC/2016/IODN/00000015616 FRC/2013/ICAN/00000002759 Chairman Managing Director Chief Financial Officer
Approved by the Board of Directors on 31 March 2017
The accompanying notes form an integral part of the financial statements.

Annual Report for the year ended 31 December 2016
35
Consolidated and Separate Statements of Changesin Equity
GROUP For the year ended 31 December 2016 Common control Non Share Share Retained acquisition controlling TotalIn thousands of naira capital premium earnings deficit Interest equity Balance at 1 January 2016 841,779 5,819,185 17,743,510 (2,920,407) 6,642,764 28,126,831 Total comprehensive income for the year:Profit for the year - - 754,070 - 211,365 965,435
Other comprehensive income, net of tax - - - - - -
- - 754,070 - 211,365 965,435Transactions with equity holdersDividend paid - - (387,218) - - (387,218)
- - (387,218) - - (387,218)
Balance at 31 December 2016 841,779 5,819,185 18,110,362 (2,920,407) 6,854,129 28,705,048
For the year ended 31 December 2015 Common control Non Share Share Retained acquisition controlling TotalIn thousands of naira capital premium earnings deficit Interest equity
Balance at 1 January 2015 841,779 5,819,185 17,473,030 (2,920,407) 6,179,336 27,392,923
Total comprehensive income for the year:Profit for the year - - 607,191 - 463,428 1,070,619 Other comprehensive income, net of tax - - - - - - - - 607,191 - 463,428 1,070,619
Transactions with equity holdersDividend paid - - (336,711) - - (336,711)
- - (336,711) - - (336,711)
Balance at 31 December 2015 841,779 5,819,185 17,743,510 (2,920,407) 6,642,764 28,126,831

Annual Report for the year ended 31 December 2016
36
Consolidated and Separate Statements of Changesin Equity
COMPANY
For the year ended 31 December 2016 Common control Share Share Retained acquisition TotalIn thousands of naira capital premium earnings deficit equity
Balance at 1 January 2016 841,779 5,819,185 947,921 (2,156,000) 5,452,885
Total comprehensive income for the year:Profit for the year - - 66,643 - 66,643
- - 66,643 - 66,643 Transactions with equity holdersDividend paid - - (387,218) - (387,218)
Balance at 31 December 2016 841,779 5,819,185 627,346 (2,156,000) 5,132,310
For the year ended 31 December 2015 Common control Share Share Retained acquisition TotalIn thousands of naira capital premium earnings deficit equity
Balance at 1 January 2015 841,779 5,819,185 1,062,743 (2,156,000) 5,567,707
Total comprehensive income for the year:Profit for the year - - 221,889 - 221,889
- - 221,889 - 221,889 Transactions with equity holdersDividend paid - - (336,711) - (336,711)
- - (336,711) - (336,711)
Balance at 31 December 2015 841,779 5,819,185 947,921 (2,156,000) 5,452,885

Annual Report for the year ended 31 December 2016
Consolidated and Separate Statements of Cash Flows
37
In thousands of naira Group CompanyGroup Company Notes 31-Dec-15 31-Dec-1531-Dec-16 31-Dec-16 Operating activities: Profit for the year 1,070,619 221,889 965,435 66,643 Income tax expense 30(b) 299,725 104,451 291,566 35,917
Profit before income tax 1,370,344 326,3401,257,001 102,560 Adjustments to reconcile profit before taxation to net cash flow from operating activities:Depreciation 19 223,241 7,631239,180 25,900 Net impairment loss/(reversal) in financial assets 14 105,816 (16,073) 83,137 9,937 Fair value gain on investment property 11 (976,420) -(1,884,400) - Interest income earned 12 (586,448) (935,497)(536,934) (942,256) Interest expense incurred 17 642,165 499,3331,817,627 898,387 Provision 38(f) 967,548 -1,366,832 166,916 Exchange loss/(gain) 13/16 36,030 2,14637,790 (10,127) Share of (profit)/loss of equity-accounted investment 22((c(I)) 29,561 -(21,009) -
Net cash flow from operating activities before changes in operating assets and liabilities 1,811,837 (116,120) 2,359,224 251,317
Changes in:- Loan to related entities 38(a) (240,148) 3,312,754742,097 (1,252,328) Trading properties 38(b) (3,207,381) (1,230,000) 1,062,094 70,162 - Debtor and prepayments 38(c) (696,802) (3,485,454) 900,651 (5,293,536) - Other liabilities and accruals 38(d) 1,772,121 2,320,114 (4,685,512) 3,602,586 - Deposit for shares - - (1,250) - - Deferred revenue- customer deposits 38(e) (1,171,385) 42,278(1,544,957) 755,732
(1,731,758) 843,572 (1,167,653) (1,866,067)
Interest received 33,200 126,535 11,998 116,376 Income tax paid 30(a) (50,000) (50,000) (265,514) (259,218) VAT paid (15,309) (15,309) (6,806) (6,806) Interest paid 29(d) - (23,717) (818,409) (284,202)
Net cash (used in)/generated from operating activities (2,482,165) 881,081 (2,246,384) (2,299,917)
Investing activities:Additional investment in investment properties 20b - - (101,684) - Acquisition of property and equipment 19 (106,074) (105,775) (29,980) (29,680)
Net cash used in investing activities (106,074) (105,775) (131,664) (29,680)
Financing activities:Dividend paid (336,711) (336,711) (387,218) (387,218) Proceeds from borrowings 29(d) 1,665,859 50,000 3,015,444 2,575,982 Repayment of borrowings 29(d) - - (441,779) (50,000)
Net cash generated from /(used in) financing activities 1,329,148 (286,711) 2,186,447 2,138,764
Net (decrease) /increase in cash and cash equivalents (1,259,091) 488,595 (191,601) (190,833) Cash and cash equivalent as at beginning of the year 26 2,107,529 224,701 848,438 713,296
Cash and cash equivalent as at year end 26 848,438 713,296 656,838 522,463

Annual Report for the year ended 31 December 2016
Notes to the Consolidated and Separate Financial Statements
38
1 Reporting entity
Mixta Real Estate Plc is a Company domiciled in Nigeria. The registered address of the Company’s office is 8 Kasumu Ekemode Street, Off Saka Tinubu Street, Victoria Island, Lagos. The consolidated financial statements of the Company as at and for the year ended 31 December 2016 includes the Company and its subsidiaries (together, referred to as the “Group” and individually as “Group entities”). The Group offers real estate services to meet clients’ needs.
Mixta Real Estate Plc is a subsidiary of Mixta Africa Group, which is the parent Company. Mixta Africa Group is primarily involved in residential construction, and the purchase, development and sale of land. The address of Mixta Africa's registered office is Calle Tavern 40, Barcelona Spain
2 Statement of compliance
The financial statements have been prepared in accordance with the International Financial Reporting Standards issued by the International Accounting Standards Board and in the manner required by CAP C 2.0 Laws of the Companies and Allied Matters Act of Nigeria, and the Financial Reporting Council of Nigeria Act, 2011.
3 Basis of preparation
(a) Functional and presentation currency
These consolidated and separate financial statements are presented in Naira, which is the Company's functional currency. Except otherwise indicated, financial information presented in Naira have been rounded to the nearest thousands.
(b) Basis of measurement
These consolidated and separate financial statements are prepared on the historical cost basis except for:
i) investment property which is measured at fair value
ii) trading properties measured at the lower of cost and net realizable value.
iii) loans and receivables and other financial liabilities measured at amortized cost using the effective interest rate.
(c) Use of estimates and judgments
The preparation of the consolidated and separate financial statements in conformity with IFRS requires management to make judgments, estimates and assumptions that affect the application of accounting policies and reported amounts of assets and liabilities, income and expenses. Actual results may differ from these estimates.
The estimates and associated assumptions are based on historical experience and various other factors that are believed to be reasonable under the circumstances, the results of which form the basis of making the judgments about carrying values of assets and liabilities that are not readily apparent from other sources.
The estimates and underlying assumptions are reviewed on an ongoing basis. Revisions to accounting estimates are recognized in the period in which the estimate is revised, if the revision affects only that period, or in the period of the revision and future periods, if the revision affects both current and future periods. Judgments made by management in the application of IFRSs that have significant effect on the financial statements and estimates with a significant risk of material adjustment are discussed in the note 8 to the account.
(d) New standards and interpretations not yet
adopted
A number of new standards, amendment to standards and interpretations are effective for annual periods beginning after 1 January 2017 and earlier application is permitted; however, the Group and Company have not applied the following new or amended standards in preparing these consolidated and separate financial statements. The Group and Company do not plan to early adopt these standards. These will be adopted in the period that they become mandatory unless otherwise indicated:

Annual Report for the year ended 31 December 2016
Notes to the Consolidated and Separate Financial Statements
39
Those which may be relevant to the Group and Company are set out below.
Standard/Interpretation Date issue Effective date Summary of the requirements and
by IASB Periods beginning assessment of impact
on or after
Amendments January 2016 1 January 2017 The amendments provide for disclosures that to IAS 7 Early adoption enable users of financial statements to Disclosure Initiative is permitted evaluate changes in liabilities arising from
financing activities, including both changes
arising from cash flow and non-cash changes.
This includes providing a reconciliation
between the opening and closing balances
arising from financing activities.
The Group will adopt the amendments for the
year ending 31 December 2017.
Amendments to January 2016 1 January 2017 The amendments provide additional guidance IAS 12 Early adoption is on the existence of deductible temporary Recognition of Deferred permitted differences, which depend solely on a Tax Assets for Unrealised comparison of the carrying amount of an asset Losses and its tax base at the end of the reporting period, and is not affected by possible future
changes in the carrying amount or expected
manner of recovery of the asset.
The amendments also provide additional
guidance on the methods used to calculate
future taxable profit to establish whether a
deferred tax asset can be recognised.
Guidance is provided where an entity may
assume that it will recover an asset for more
than its carrying amount, provided that there
is sufficient evidence that it is probable that
the entity will achieve this.
Guidance is provided for deductible temporary
differences related to unrealised losses are not
assessed separately for recognition. These are
assessed on a combined basis, unless a tax law
restricts the use of losses to deductions
against income of a specific type
The amendment is not expected to have any
significant impact on the (consolidated)
financial statements of the Group.
The Group will adopt the amendments for the
year ending 31 December 2017.

Annual Report for the year ended 31 December 2016
Notes to the Consolidated and Separate Financial Statements
40
Standard/Interpretation Date issued Effective date Summary of the requirements and
by IASB Periods beginning assessment of impact
on or after
IFRS 15 May 2014 1 January 2018 This standard replaces IAS 11 Construction Revenue from contracts with Early adoption is Contracts, IAS 18 Revenue, IFRIC 13 Customer customers permitted Loyalty Programmes, IFRIC 15 Agreements for
the Construction of Real Estate, IFRIC 18
Transfer of Assets from Customers and SIC-31
Revenue – Barter of Transactions Involving
Advertising Services.
The standard contains a single model that
applies to contracts with customers and two
approaches to recognizing revenue: at a point
in time or over time. The model features a
contract-based five-step analysis of
transactions to determine whether, how much
and when revenue is recognized.
This new standard will most likely have a
significant impact on the Group, which will
include a possible change in the timing of
when revenue is recognized and the amount of
revenue recognized.
The Group is yet to carry-out an assessment to
determine the impact that the initial
application of IFRS 15 could have on its
business; however, the Group will adopt the
standard for the year ending 31 December
2018.
IFRS 9 July 2014 1 January 2018 On 24 July 2014, the IASB issued the final IFRS 9 Financial Instruments Early adoption is Financial Instruments Standard, which replaces permitted earlier versions of IFRS 9 and completes the
IASB’s project to replace IAS 39 Financial
Instruments: Recognition and Measurement.
IFRS 9 includes revised guidance on the
classification and measurement of financial
instruments, a new expected credit loss model
for calculating impairment on financial assets,
and new general hedge accounting
requirements. It also carries forward the
guidance on recognition and derecognition of
financial instruments from IAS 39.
The Group is yet to carry-out an assessment to
determine the impact that the initial
application of IFRS 9 could have on its
business; however, the Group will adopt the
standard for the year ending 31 December
2018.

Annual Report for the year ended 31 December 2016
Notes to the Consolidated and Separate Financial Statements
41
Standard/Interpretation Date issued Effective date Summary of the requirements and
by IASB Periods beginning assessment of impact
on or after
IFRS 16 January 2016 1 January 2019 IFRS 16 IAS 17 IFRIC 4 replaces Leases, Determining Early Adoption is whether an Arrangement contains a Lease, SIC-15 permitted only Operating Leases- Incentives and SIC-27 for entities that Evaluating the Substance of Transactions adopt IFRS 15 Involving the Legal form of a Lease. Revenue from contracts with The standard set out the principles for the customers, at or recognition, measurement, presentation and
disclosure of leases for both parties to a contract,
i.e. the customer ('lessee') and the supplier
('lessor'). IFRS 16 eliminates the classification of
leases as operating leases or finance lease as
required by IAS 17 and introduces a single lessee
accounting model. Applying the model, a lessee is
required to recognize: a) assets and liabilities for all leases with a term of
more than 12 months, unless the underlying asset
is low value and b) depreciation of lease assets separately from
interest on lease liabilities in the profit or loss
For the lessor, IFRS 16 substantially carries forward
the lessor accounting requirements of IAS 17.
Accordingly, a lessor continues to classify its leases
as operating lease or finance leases, and to
account for these two types of leases differently.
The Group is yet to carry out an assessment to
determine the impact that the initial application
of IFRS 16 could have on its business; however,
the Group will adopt the standard for the year
ending 31 December 2019.
IFRIC 22 December 1 January 2018 The amendments provide guidance on theForeign currency transactions 2016 Early adoption is transaction date to be used in determining the and advance consideration permitted exchange rate for translation of foreign currency transactions involving an advance payment or
receipt.
The amendments clarifies that the transaction
date is the date on which the Company initially
recognises the prepayment or deferred income
arising from the advance consideration. For
transactions involving multiple payments or
receipts, each payment or receipt gives rise to a
separate transaction date.

Annual Report for the year ended 31 December 2016
Notes to the Consolidated and Separate Financial Statements
42
Standard/Interpretation Date issued Effective date Summary of the requirements and
by IASB Periods beginning assessment of impact
on or after
The interpretation applies when a Company: • pays or receives consideration in a foreign
currency; and • recognises a non-monetary asset or liability – eg.
non-refundable advance consideration – before
recognising the related item.
The Group/Company will adopt the amendments
for the year ending 31 December 2018.
Amendments December 1 January 2018 The IASB has amended the requirements of IAS 40 to IAS 40 2016 Early adoption Investment Property on when a Company should is permitted transfer a property to, or from, investment
property.Transfers of Investment The amendments state that a transfer is made Property when and only when there is a change in use – i.e.
an asset ceases to meet the definition of
investment property and there is evidence of a
change in use. A change in management intention
alone does not support a transfer.
A company has a choice on transition to apply:
• the prospective approach – i.e. apply the
amendments to transfers that occur after the date
of initial application – and also reassess the
classification of property assets held at that date;
or • the retrospective approach – i.e. apply the
amendments retrospectively, but only if it does not
involve the use of hindsight.
The Group will adopt the amendments for the year
ending 31 December 2018.
(e ) The following new or amended standards are not expected to have a significant impact on the Group's consolidated financial statements.
Accounting for Acquisition of Interests in Joint Operations (Amendments to IFRS 11) Clarification of Acceptable Methods of Depreciation and Amortisation (Amendments to IAS 16 and IAS 38) Equity Method in Separate Financial Statements (Amendments to IAS 27) Annual Improvements to IFRSs 2012–2014 Cycle – various standards Investment Entities: Applying the Consolidation Exception (Amendments to IFRS 10, IFRS 12 and IAS 28) Disclosure Initiative (Amendments to IAS 1)
4 Changes in accounting policies
There has been no changes in the accounting policies of the Group during the year ended 31 December 2016 as the amendments to IFRS in 3(e) above which became effective for annual period beginning on 1 January 2016 had no impact on the Group's reporting.

Annual Report for the year ended 31 December 2016
Notes to the Consolidated and Separate Financial Statements
43
5 Significant accounting policies
The Group consistently applied the following accounting policies presented in the financial statements.
(a) Basis of consolidation
(I) Subsidiaries
The Group consolidates the annual financial statements of investees which it controls. The Group controls an investee when:
• it has power over the investee; • has exposure or rights to variable returns from its involvement with the investee; and • has the ability to use its power to affect the returns from its involvement with the investee.
The annual financial statements of the investee are consolidated from the date on which the group acquires control up to the date that control ceases. Control is assessed on a continuous basis.
The proportion of comprehensive income and changes in equity allocated to the group and non-controlling interests are determined on the basis of the group's present ownership interest in the subsidiary.
Investments in subsidiaries are accounted for at cost less accumulated impairment losses (where applicable) in the separate financial statements. The carrying amounts of these investments are reviewed annually and impaired when necessary.
(ii) Business combinations
The Group applies IFRS 3 Business Combinations in accounting for business combinations.
Business combinations are accounted for using the acquisition method as at the acquisition date, which is the date on which control is transferred to the Group.
The consideration transferred in the acquisition is generally measured at fair value, as are the identifiable net assets acquired. Any goodwill that arises is tested annually for impairment. Any gain on bargain purchase is recognized in profit or loss immediately.
The Group measures goodwill at the acquisition date as the total of: - the fair value of the consideration transferred, which is generally measured at fair value; plus - the recognized amount of any non-controlling interests in the acquiree; plus if the business combination
is achieved in stages, the fair value of the existing equity interest in the acquiree; less - the net recognized amount (generally fair value) of the identifiable assets acquired and liabilities
assumed. Subsequent to initial recognition, goodwill is measured at cost less accumulated impairment losses.
The consideration transferred does not include amounts related to the settlement of pre-existing relationships. Such amounts are generally recognized in profit or loss.
Transactions costs related to the acquisition, other than those associated with the issue of debt or equity securities, that the Group incurs in connection with a business combination are expensed as incurred.
Any contingent consideration payable is measured at fair value at the acquisition date. If the contingent consideration is classified as equity, then it is not re-measured and settlement is accounted for within equity. Otherwise, subsequent changes in the fair value of the contingent consideration are recognized in profit or loss.
In the separate financial statements of the Company, investments in subsidiaries are accounted for at cost.

Annual Report for the year ended 31 December 2016
Notes to the Consolidated and Separate Financial Statements
44
(iii) Transactions eliminated on consolidation
Intra-group transactions, balances and any unrealized incomes and expenses on transactions between companies within the Group (except for foreign currency transactions gains or losses) are eliminated in preparing the consolidated financial statements. Unrealised losses are also eliminated in the same manner as unrealized gains, but only to the extent that there is no evidence of impairment. Accounting policies of subsidiaries have been changed where necessary to ensure consistency with the policies adopted by the Group.
(iv) Transactions with non-controlling interests
Transactions with non-controlling interests that do not result in the gain or loss of control, are accounted for as transactions with equity holders of the group. For purchases of additional interests from non-controlling interests, the difference between the purchase consideration and the group's proportionate share of the subsidiary's additional net asset value acquired is accounted for directly in equity.
Gains or losses on the partial disposal (where control is not lost) of the group's interest in a subsidiary to non-controlling interests are also accounted for directly in equity.
(v) Common control transactions
Common control transactions, in which the Company is the ultimate parent entity both before and after the transaction, are accounted for at book value.
The assets and liabilities acquired are recognized at the carrying amounts recognized previously in the Group controlling shareholder's consolidated financial statements. The components of equity of the acquired entities are added to the same components within Group equity and any gain/loss arising is recognized directly in a capital reserve account in equity called common control acquisition deficit.
(vi) Non controlling interests (NCI)
NCI are measured at their proportionate share of the acquiree's identifiable net assets at the acquisition date.
NCI is subsequently measured at the initial recognised amount plus the share of profit and other comprehensive income attributable to the non-controlling shareholders.
(vii) Loss of control
When the Group loses control over a subsidiary, it derecognizes the assets and liabilities of the subsidiary and any related NCI and other components of equity. Any resulting gain or loss is recognized in profit or loss. Any interest retained in the former subsidiary is measured at fair value when control is lost. Subsequently, that retained interest is accounted for as an equity-accounted investee or as an available for sale financial asset depending on the level of influence retained.
(viii) Joint ventures
A joint venture is a type of joint arrangement whereby the parties that have joint control of the arrangement have rights to the net assets of the joint venture. Joint control is the contractually agreed sharing of control of an arrangement, which exists only when decisions about the relevant activities require unanimous consent of the parties sharing control for strategic financial and operating decisions. The considerations made in determining joint control are similar to those necessary to determine control over subsidiaries
The Group's investments in joint ventures are accounted for using the equity method. Under the equity

Annual Report for the year ended 31 December 2016
Notes to the Consolidated and Separate Financial Statements
45
method, the investment in a joint venture is initially recognized at cost. The carrying amount of the investment is adjusted to recognize changes in the Group's share of net assets of joint venture since the acquisition date. Goodwill relating to the joint venture is included in the carrying amount of the investment and is neither amortized nor individually tested for impairment.
The income statement reflects the Group's share of the results of operations of the joint ventures. Any change in OCI of those investees is presented as part of the Group's OCI. In addition, when there has been a change recognized directly in the equity of the joint ventures, the Group recognizes its share of any changes, when applicable, in the statement of changes in equity. Unrealised gains and losses resulting from transactions between the Group and the joint ventures are eliminated to the extent of the interest in the joint ventures.
The financial statements of the joint ventures are prepared for the same reporting period as the Group. When necessary, adjustments are made to bring the accounting policies in line with those of the Group.
After application of the equity method, the Group determines whether it is necessary to recognize an impairment loss on its investment in joint ventures. At each reporting date, the Group determines whether there is objective evidence that the investment in the joint ventures is impaired. If there is such evidence, the Group calculates the amount of impairment as the difference between the recoverable amount of the joint ventures and its carrying value, then recognizes the loss in the profit or loss.
Investments in joint venture is carried at cost in the separate financial statements.
(b) Foreign currency transactions
Transactions denominated in foreign currencies are recorded in Naira at the rate of exchange ruling at the date of each transaction. Any gain or loss arising from a change in exchange rates subsequent to the date of the transaction is included in the statement of profit/(loss).
Monetary assets and liabilities denominated in foreign currencies are translated into the functional currency at the exchange rate at the reporting date. Non-monetary assets and liabilities that are measured at fair value in a foreign currency are translated into the functional currency at the exchange rate when the fair value was determined. Non-monetary items that are measured based on historical cost in a foreign currency are translated at the exchange rate at the date of the transaction. Foreign currency differences are generally recognised in profit or loss.
However, foreign currency differences arising from translation of available-for-sale equity investments (except on impairment, in which case foreign currency differences that have been recognised in OCI are reclassified to profit or loss) are recognised in OCI.
(c) Interest income and expense
Interest Income is made up of interest income on loans to related entities and cash and cash equivalent while interest expense is made up of interest on borrowings. Interest income and expense are recognized in the statement of comprehensive income using the effective interest rate method. The effective interest rate is the rate that exactly discounts the estimated future cash payments and receipts through the expected life of the financial asset or liability (or, where appropriate, a shorter period) to the carrying amount of the financial asset or liability. The effective interest rate is established on initial recognition of the financial asset and liability and is not revised subsequently.
The calculation of the effective interest rate includes all fees and points paid or received, transaction costs, and discounts or premiums that are an integral part of the effective interest rate. Transaction costs are incremental costs that are directly attributable to the acquisition, issue or disposal of a financial asset or liability.
Annual Report for the year ended 31 December 2016
Notes to the Consolidated and Separate Financial Statements
46
(d) Borrowing costs
Borrowing costs directly attributable to the acquisition or construction of an asset that necessarily takes a substantial period of time to get ready for its intended use or sale are capitalized as part of the cost of the asset. All other borrowing costs are expensed in the period in which they occur. Borrowing costs consist of interest and other costs that an entity incurs in connection with the borrowing of funds.
Interest is capitalized as from the commencement of the development work until the date of practical completion, i.e., when substantially all of the development work is completed. The capitalization of finance costs is suspended if there are prolonged periods when development activity is interrupted.
Investment income earned on the temporary investment of specific borrowings pending their expenditure on qualifying assets is deducted from the borrowing costs eligible for capitalization. All other borrowing costs are recognized in profit or loss in the period in which they are incurred.
(e) Income Recognition
Revenue is recognised to the extent that it is probable that the economic benefits will flow to the group and the revenue can be reliably measured, regardless of when the payments is being made. Revenue is measured at the fair value of the consideration received or receivable taking into account contractually defined terms of payment and excluding taxes or duty. The Group has concluded that it is the principal in all of its revenue arrangement since it is the primary obligor in most of the revenue arrangements, it has pricing latitude and is also exposed to inventory and credit risks.
The specific recognition criteria described below must also be met before revenue is recognised.
Sale of trading properties Revenue from the sale of trading properties is recognized by the entity where an insignificant risk of
ownership is retained i.e.; i) when a significant portion of the risks and rewards of ownership have been transferred to the customer ii) all managerial responsibilities and control are completely devolved to the customer ii) where the costs and income on sale can be measured reliably. iv) all significant performance obligations have been met. Risks and rewards are transferred when the legal title or possession is passed to the customer.
Rental income Rental income from property leased out under an operating lease is recognized in the profit or loss on a
straight-line basis over the term of the lease.
Services fees Revenue from services rendered (such as project and development management) is recognized in the
profit or loss in proportion to the stage of completion of the transaction at the reporting date. The stage of completion is assessed by reference to surveys of work performed. No revenue is recognized if there are significant uncertainties regarding recovery of the consideration due.
Dividends Income is recognised when the Group's right to receive the payment is established, which is generally
when shareholders approve the dividend.
Other income Other income represents income generated from sources other than rental income, sale of trading
properties, services fees and dividend. It includes income realized from legal fees charged by the company
Annual Report for the year ended 31 December 2016
Notes to the Consolidated and Separate Financial Statements
47
on the sale of real estate products to third party customers. Income is recognized when the right to receive income is established.
(f) Income tax expense
Income tax expense comprises current and deferred tax. Income tax expense is recognized in the profit or loss except to the extent that it relates to items recognized directly in OCI or equity, in which case it is recognized in Other Comprehensive Income or equity respectively.
Current tax Current tax is the expected tax payable on taxable income for the year, using tax rates enacted or
substantively enacted at the balance sheet date, and any adjustment to tax payable in respect of previous years.
The current taxes include: Company Income Tax at 30% of taxable profit; Tertiary education tax at 2% of assessable profit; Capital Gain Tax at 10% of chargeable gains.
The Company is subject to the Companies Income Tax Act (CITA). Total amount of tax payable under CITA is determined based on the higher of two components namely Company income tax (based on taxable income (or loss) for the year; and Minimum tax (determined based on the sum of the highest of 0.25% of revenue of N500,000, 0.5% of gross profit, 0.25% of paid up share capital and 0.5% of net assets and 0.125% of revenue in excess of N500,000). Taxes based on taxable profit for the period are treated as current income tax in line with IAS 12; whereas taxes which is based on gross amounts is outside the scope of IAS 12 and therefore are not treated as current income tax.
Where the minimum tax is higher than the Company Income Tax (CIT), a hybrid tax situation exists. In this situation, the CIT is recognized in the income tax expense line in the profit or loss and the excess amount is presented above income tax line as minimum tax.
Additional income taxes that arise from the distribution of dividends are recognized at the same time as the liability to pay the related dividend is recognized.
Deferred tax Deferred tax is provided using the balance sheet method, providing for temporary differences between the
carrying amounts of assets and liabilities for financial reporting purposes and the amounts used for taxation purposes. Deferred tax is not recognized for the following temporary differences: the initial recognition of goodwill, the initial recognition of assets or liabilities in a transaction that is not a business combination and that affects neither accounting nor taxable profit, and differences relating to investments in subsidiaries to the extent that they probably will not reverse in the foreseeable future. Deferred tax is measured at the tax rates that are expected to be applied to the temporary differences when they reverse, based on laws that have been enacted or substantively enacted by the reporting date.
A deferred tax asset is recognized only to the extent that it is probable that future taxable profits will be available against which the asset can be utilized. Deferred tax assets are reviewed at each reporting date and are reduced to the extent that it is no longer probable that the related tax benefit will be realized.
Deferred tax assets and liabilities are offset when there is a legally enforceable right to offset deferred tax assets against deferred tax liabilities and when the deferred tax assets and liabilities relate to income taxes levied by the same taxation authority on either the taxable entity or different taxable entities where there is an intention to settle the balances on a net basis.

Annual Report for the year ended 31 December 2016
Notes to the Consolidated and Separate Financial Statements
48
For the purposes of measuring deferred tax liabilities and deferred tax assets for investment property held for sale that are measured using the fair value model, the carrying amount of such properties are presumed to be recovered entirely through the sale unless the presumption is rebutted. The presumption is rebutted when the investment property held for sale is depreciable and is held within a business model whose objective is to consume substantially all of the economic benefits embodied in the investment property over time, rather than through sale.
Management has reviewed the Group's investment property held for sale portfolio and concluded that none of the Group's investment property held for sale are held under a business model whose objective is to consume substantially all of the economic benefits embodied in the investment property over time, rather than through sale. Management has also determined that the 'sale' presumption set out in the amendments to IAS 12 is not rebutted. The Group has elected to recognize deferred tax on changes in fair value of the investment property held for sale as the Group is subject to capital gains taxes on disposal of its investment property.
(g) Financial assets and liabilities
Classification The Group classifies cash and cash equivalents, debtors and receivables and loans to related parties as
loans and receivables financial assets. Deposit for shares, borrowings and other liabilities are classified as other financial liabilities.
Recognition The Group initially recognizes financial assets and liabilities on the trade date at which the Group becomes
a party to the contractual provisions of the instrument except for loans and advances and long term borrowing which are recognized on the date that they are originated.
De-recognition The Group derecognizes a financial asset when the contractual rights to the cash flows from the asset
expire, or it transfers the rights to receive the contractual cash flows on the financial asset in a transaction in which substantially all the risks and rewards of ownership of the financial asset are transferred, or has assumed an obligation to pay those cash flows to one or more recipients, subject to certain criteria. Any interest in transferred financial assets that is created or retained by the Group is recognized as a separate asset or liability.
The Group derecognizes a financial liability when its contractual obligations are discharged or cancelled or expire. The Group enters into transactions whereby it transfers assets recognized on its balance sheet, but retains either all risks and rewards of the transferred assets or a portion of them. If all or substantially all risks and rewards are retained, then the transferred assets are not derecognized from the balance sheet. In transactions where the Group neither retains nor transfers substantially all the risks and rewards of ownership of a financial asset, it derecognizes the asset if control over the asset is lost.
The rights and obligations retained in the transfer are recognized separately as assets and liabilities as appropriate. In transfers where control over the asset is retained, the Group continues to recognize the asset to the extent of its continuing involvement, determined by the extent to which it is exposed to changes in the value of the transferred asset.
Initial measurement A financial asset or financial liability is measured initially at fair value plus, for an item not at fair value
through profit or loss, transaction costs that are directly attributable to its acquisition or issue.

Annual Report for the year ended 31 December 2016
Notes to the Consolidated and Separate Financial Statements
49
Subsequent measurement(i) Loans and receivables Loans and receivables are non-derivative financial assets with fixed or determinable payments that are not
quoted in an active market, other than those classified by the Group as at fair value through profit or loss or available-for-sale.
Loans and receivables are measured at amortized cost using the effective interest rate method, less any impairment losses. Transaction costs that are integral to the effective rate are capitalized to the value of the loan and amortized through interest income as part of the effective interest rate. All of the Group's advances are included in the loans and receivables category.
Loans and receivables - Shareholders loan is a debt-like form of financing provided by shareholders. There are usually no stated terms of repayment. This complicates the measurement of the loan if it is not clear when repayment will take place, what the value of such repayment will be and what the term of the loan is. In such cases, they are considered repayable on demand, classified as current and measured at face value because it expects to realise the asset in its normal operating cycle.
(ii) Financial liabilities The Group classifies its financial liabilities as measured at amortized cost. Borrowings are recognized initially at fair value, net of transaction costs incurred. Borrowings are
subsequently stated at amortized cost; any difference between the proceeds (net of transaction costs) and the redemption value is recognized as finance cost over the period of the borrowings using the effective interest method.
Borrowings are classified as current liabilities unless the Group has an unconditional right to defer settlement of the liability for at least 12 months after the date of the statement of financial position.
Deposit for shares are monies paid in by subscribers for subscription to the equity shares of the Group. Deposit for shares are recognised as financial liabilities as the Group has an obligation to deliver equity or the cash amounts deposited by the counterparties.
Deposit for shares can only be classified as capital if it is certain that the depositors have relinquished their rights to withdraw their application and the Group has allotted shares to such depositors for an amount equivalent to the value deposited. Also, any regulatory requirements in respect of allotment should have been fulfilled before any deposit for shares can be classified as capital. The Group has classified deposit for shares as non-current liabilities as the conversion and issuance of shares would not take place within 12 months. Deposit for shares is measured at carrying amount.
(iii) Amortized cost measurement The amortized cost of a financial asset or liability is the amount at which the financial asset or liability is
measured at initial recognition, minus principal repayments, plus or minus the cumulative amortization using the effective interest rate method of any difference between the initial amount recognized and the maturity amount, minus any reduction for impairment.
(iv) Fair value measurement ‘Fair value' is the price that would be received to sell an asset or paid to transfer a liability in an orderly
transaction between market participants at the measurement date in the principal or, in its absence, the most advantageous market to which the Group has access at that date. The fair value of a liability reflects its non-performance risk.
When available, the Group measures the fair value of an instrument using the quoted price in an active

Annual Report for the year ended 31 December 2016
Notes to the Consolidated and Separate Financial Statements
50
market for that instrument. A market is regarded as active if transactions for the asset or liability take place with sufficient frequency and volume to provide pricing information on an ongoing basis.
If there is no quoted price in an active market, then the Group uses valuation techniques that maximizes the use of relevant observable inputs and minimize the use of unobservable inputs. The chosen valuation technique incorporates all of the factors that market participants would take into account in pricing a transaction.
The best evidence of the fair value of a financial instrument on initial recognition is the transaction price, i.e. the fair value of the consideration paid or received. If the Group determines that the fair value at initial recognition differs from the transaction price and the fair value is evidenced neither by a quoted price in an active market for an identical asset or liability nor based on a valuation technique that uses only data from observable markets, then the financial instrument is initially measured at fair value, adjusted to defer the difference between the fair value at initial recognition and the transaction price.
Subsequently, that difference is recognized in profit or loss on an appropriate basis over the life of the instrument but no later than when the valuation is wholly supported by observable market data or the transaction is closed out.
If an asset or a liability measured at fair value has a bid price and an ask price, the Group measures the assets and long positions at a bid price and liabilities and short positions at an ask price.
Portfolios of financial assets and financial liabilities that are exposed to market risk and credit risk are managed by the Group on the basis of the net exposure to either market or credit risk. The net exposure is measured on the basis of a price that would be received to see a net long position (or paid to transfer a net short position) for a particular exposure. Those portfolio-level adjustments are allocated to the individual assets and liabilities on the basis of the relative risk adjustment of each of the individual instruments in the portfolio.
The Group recognizes transfers between levels of fair value hierarchy as of the end of the reporting period during which the change has occurred.
(v) Identification and measurement of impairment Assets carried at amortized cost The Group assesses at each reporting date whether there is objective evidence that a financial asset or
group of financial assets is impaired. A financial asset or a group of financial assets is impaired and impairment losses are incurred if, and only if,
there is objective evidence of impairment as a result of one or more events that occurred after the initial recognition of the assets (a 'loss event'), and that loss event (or events) has an impact on the estimated future cash flows of the financial asset or group of financial assets that can be reliably estimated.
The following factors are considered in assessing objective evidence of impairment: • whether the customer is more than 90 days past due; • the Group consents to a restructuring of the obligation, resulting in a diminished financial obligation
demonstrated by a material forgiveness of debt or postponement of scheduled payments; or • there is an observable data indicating that there is a measurable decrease in the estimated future cash
flows of a group of financial assets, although the decrease cannot yet be identified with specific individual financial assets.
The Group assesses whether objective evidence of impairment exists individually for financial assets that are individually significant. If the Group determines that no objective evidence of impairment exists for an

Annual Report for the year ended 31 December 2016
Notes to the Consolidated and Separate Financial Statements
51
individually assessed financial asset, whether significant or not, the Group concludes that no collective allowance is required because all possible risks have been considered in the individual impairment tests.
If there is objective evidence that an impairment loss on a loan and receivable asset has been incurred, the amount of the loss is measured as the difference between the asset's carrying amount and the present value of estimated future cash flows (excluding future credit losses that have not been incurred), discounted at the asset's original effective interest rate. The carrying amount of the asset is reduced through the use of an allowance account and the amount of the loss is recognized in profit or loss.
The calculation of the present value of the estimated future cash flows of a collateralized financial asset reflects the cash flows that may result from foreclosure, less costs for obtaining and selling the collateral, whether or not foreclosure is probable.
To the extent that a loan is irrecoverable, it is written off against the related allowance for loan impairment.
Such loans are written off after all the necessary procedures have been completed and the amount of the loss has been determined. Subsequent recoveries of amounts previously written off decrease the amount of the allowance for loan impairment in profit or loss. If, in a subsequent period, the amount of the impairment loss decreases and the decrease can be related objectively to an event occurring after the impairment was recognized (such as an improvement in the debtor's credit rating), the previously recognized impairment loss is reversed by adjusting the allowance account. The amount of the reversal is recognized in profit or loss.
Amounts reported as other assets are tested for impairment on an individual basis at the reporting date. In testing for impairment, the Group assess whether there is objective evidence that a loss event has occurred. If it is established that a loss event has occurred and the loss event has an impact on the recoverable amount of the asset, an impairment charge is taken against the asset's carrying amount.
(h) Offsetting financial instruments
Financial assets and liabilities are set off and the net amount presented in the statement of financial position when, and only when, the Group has a legal right to set off the amounts and intends either to settle on a net basis or to realize the asset and settle the liability simultaneously.
Income and expenses are presented on a net basis only when permitted by accounting standards, or for gains and losses arising from a group of similar transactions.
(I) Cash and cash equivalents Cash and cash equivalents include notes and coins in hand, unrestricted balances held with Deposit Money
Banks and highly liquid financial assets with original maturities of less than three months, which are subject to insignificant risk of changes in their fair value, and are used by the Group in the management of its short-term commitments.
Cash and cash equivalents are carried at amortized cost in the statement of financial position.
(j) Property and equipmentI Recognition and measurement Items of property and equipment are carried at cost less accumulated depreciation and impairment losses.
Cost includes expenditures that are directly attributable to the acquisition of the asset. When parts of an item of property or equipment have different useful lives, they are accounted for as separate items (major components) of property and equipment.

Annual Report for the year ended 31 December 2016
Notes to the Consolidated and Separate Financial Statements
52
ii Subsequent costs The cost of replacing part of an item of property or equipment is recognized in the carrying amount of the
item if it is probable that the future economic benefits embodied within the part will flow to the Group and its cost can be measured reliably. The costs of the day-to-day servicing of property and equipment are recognized in profit or loss as incurred.
iii Depreciation Depreciation is recognized in profit or loss on a straight-line basis over the estimated useful lives of each
part of an item of property and equipment. Leased assets are depreciated over the shorter of the lease term and their useful lives. Depreciation begins when an asset is available for use and ceases at the earlier of the date that the asset is derecognized or classified as held for sale in accordance with IFRS 5 Non-current Assets Held for Sale and Discontinued Operations.
The estimated useful lives for the current and comparative period are as follows:
Leasehold land Over the unexpired lease term Building 50 years Golf course improvements 50 years Motor vehicles 4 years Plant & Machinery 5 years Furniture & fittings 5 years Computer and office equipment 5 years Leasehold Improvements 5 years
Depreciation methods, useful lives and residual values are reassessed at each reporting date.
iv De-recognition An item of property and equipment is derecognized on disposal or when no future economic benefits are
expected from its use or disposal. Any gain or loss arising on de-recognition of the asset (calculated as the difference between the net disposal proceeds and the carrying amount of the asset) is included in profit or loss in the year the asset is derecognized.
v Other requirements Construction cost and improvements in respect of offices is carried as capital work-in-progress. On
completion of construction or improvements, the related amounts are transferred to the appropriate category of property and equipment. Payments in advance for items of property and equipment are included as prepayments in "other assets" and upon delivery and availability for use, are classified as additions in the appropriate category of property and equipment.
(k) Investment property
Property that is held for long-term rental yields or for capital appreciation or both, and that is not occupied by the companies in the consolidated Group, is classified as investment property. Investment property also includes property that is being constructed or developed for future use as investment property.
Investment property is measured initially at its cost, including related transaction costs and where applicable borrowing costs (see Note 5 (d) ). After initial recognition, investment property is carried at fair value. Investment property under construction is measured at fair value if the fair value is considered to be reliably determinable.

Annual Report for the year ended 31 December 2016
Notes to the Consolidated and Separate Financial Statements
53
Investment property under construction for which the fair value cannot be determined reliably, but for which the Company expects that the fair value of the property will be reliably determinable when construction is completed, are measured at cost less impairment until the fair value becomes reliably determinable or construction is completed - whichever is earlier. Fair value is based on active market prices, adjusted, if necessary, for differences in the nature, location or condition of the specific asset. If this information is not available, the Group uses alternative valuation methods, such as recent prices on less active markets or discounted cash flow projections.
Valuations are performed as of the reporting date by professional valuers who hold recognized and relevant professional qualifications and have recent experience in the location and category of the investment property being valued. These valuations form the basis for the carrying amounts in the consolidated financial statements.
Investment property that is being redeveloped for continuing use as investment property or for which the market has become less active continues to be measured at fair value. The fair value of investment property reflects, among other things, rental income from current leases and other assumptions market participants would make when pricing the property under current market conditions.
Subsequent expenditure is capitalized to the asset's carrying amount only when it is probable that future economic benefits associated with the expenditure will flow to the Group and the cost of the item can be measured reliably. All other repairs and maintenance costs are expensed when incurred. When part of an investment property is replaced, the carrying amount of the replaced part is derecognized. Changes in fair values are recognized in profit or loss. Investment property are derecognized when they have been disposed.
Where an investment property undergoes a change in use, evidenced by commencement of development with a view to sale, the property is transferred to inventories. A property's deemed cost for subsequent accounting as inventories is its fair value at the date of change in use.
(l) Impairment of non-financial assets
At each reporting date, the Group reviews the carrying amounts of its non-financial assets (other than investment property, deferred tax assets and trading property) to determine whether there is any indication of impairment. If any such indication exists, then the asset's recoverable amount is estimated. Goodwill is tested annually for impairment.
An impairment loss is recognized if the carrying amount of an asset or its cash-generating unit exceeds its recoverable amount. A cash-generating unit is the smallest identifiable asset group that generates cash flows that largely are independent from other assets and groups. Impairment losses are recognized in profit or loss. Impairment losses recognized in respect of cash-generating units are allocated first to reduce the carrying amount of any goodwill allocated to the units and then to reduce the carrying amount of the other assets in the unit (group of units) on a pro rata basis.
The recoverable amount of an asset or cash-generating unit is the greater of its value in use and its fair value less costs to sell. In assessing value in use, the estimated future cash flows are discounted to their present value using a pre-tax discount rate that reflects current market assessments of the time value of money and the risks specific to the asset.
An impairment loss in respect of goodwill is not reversed. In respect of other assets, impairment losses recognized in prior periods are assessed at each reporting date for any indications that the loss has decreased or no longer exists. An impairment loss is reversed if there has been a change in the estimates used to determine the recoverable amount. An impairment loss is reversed only to the extent that the

Annual Report for the year ended 31 December 2016
Notes to the Consolidated and Separate Financial Statements
54
asset's carrying amount does not exceed the carrying amount that would have been determined, net of depreciation or amortization, if no impairment loss had been recognized. Reversals of impairment losses are recognized in profit or loss.
(m) Leases
Group is the lessee
(i) Operating lease Leases in which a significant portion of the risks and rewards of ownership are retained by another party,
the lessor, are classified as operating leases. Payments, including prepayments, made under operating leases (net of any incentives received from the lessor) are recognised in profit or loss on a straight-line basis over the period of the lease. When an operating lease is terminated before the lease period has expired, any payment required to be made to the lessor by way of penalty is recognised as an expense in the period in which termination takes place.
(n) Provisions
A provision is recognized if, as a result of a past event, the Group has a present legal or constructive obligation that can be estimated reliably, and it is probable that an outflow of economic benefits will be required to settle the obligation. Provisions are determined by discounting the expected future cash flows at a pre-tax rate that reflects current market assessments of the time value of money and, where appropriate, the risks specific to the liability.
A provision for restructuring is recognized when the Group has approved a detailed and formal restructuring plan, and the restructuring either has commenced or has been announced publicly. Future operating costs are not provided for. A provision for onerous contracts is recognized when the expected benefits to be derived by the Group from a contract are lower than the unavoidable cost of meeting its obligations under the contract. The provision is measured at the present value of the lower of the expected cost of terminating the contract and the expected net cost of continuing with the contract. Before a provision is established, the Group recognizes any impairment loss on the assets associated with that contract.
(o) Contingent liability
Contingent liability is a possible obligation that arises from past events and whose existence will be confirmed only by the occurrence or non-occurrence of one or more uncertain future events not wholly within the control of the entity; or a present obligation that arises from past events but is not recognized because it is not probable that an outflow of resources embodying economic benefits will be required to settle the obligation; or the amount of the obligation cannot be measured with sufficient reliability.
Contingent liability is disclosed unless the possibility of an outflow of resources embodying economic benefit is remote. A provision for the part of the obligation for which an outflow of resources embodying economic benefits is probable is recognized, except in the extremely rare circumstances where no reliable estimate can be made.
Contingent liabilities are assessed continually to determine whether an outflow of economic benefit has become probable.
(p) Share capital and reserves
(I) Share issue costs Incremental costs directly attributable to the issue of an equity instrument are deducted from the initial
measurement of the equity instruments. All other share issue costs are expensed.

Annual Report for the year ended 31 December 2016
Notes to the Consolidated and Separate Financial Statements
55
(ii) Dividend on ordinary shares Dividends on the ordinary shares are recognized in equity in the period in which they are paid or, if earlier,
approved by the shareholders.
(iii) Share premium The excess of the issue price proceeds over the nominal par value from the issue of shares are reported in
share premium reserve. (iv) Retained earnings Retained earnings comprise the undistributed profits from previous periods which have not been
reclassified to any specified reserves.
(v) Common control acquisition deficit This represents the difference between the consideration paid and the capital of the company acquired
under common control acquisitions whereby the Company and the investee entity remain under control of the ultimate parent entity both before and after the transaction.
(vi) Treasury shares Where the Company or any member of the Group purchases the Company's shares, the consideration paid
is deducted from the shareholders' equity as treasury shares until they are cancelled. Where such shares are subsequently sold or reissued, any consideration received is included in shareholders' equity.
(vii) Earnings per share The Group presents basic and diluted earnings per share (EPS) data for its ordinary shares. Basic EPS is
calculated by dividing the profit or loss attributable to ordinary shareholders by the weighted average number of ordinary shares outstanding during the period. Diluted EPS is determined by adjusting the profit or loss attributable to ordinary shareholders and the weighted average number of ordinary shares outstanding for the effects of all dilutive potential ordinary shares.
(q) Trading properties
(i) Property acquired or being constructed for sale in the ordinary course of business, rather than to be held for rental or capital appreciation, is held as trading property.
Where there is a change in use of investment property evidenced by the commencement of development with a view to sale, a reclassification is made to trading properties at their deemed cost which is the fair value at the date of reclassification. This would normally comprise expenditure incurred in acquiring the properties, production or conversion costs and other costs incurred in bringing them to their existing location and condition.
Trading properties acquired or being constructed for sale are initially recognised at cost. Trading properties are subsequently measured at the lower of cost and net realizable value. Net realizable value is the estimated selling price in the ordinary course of business, less the estimated costs of completion and selling expenses.
The cost of trading property recognized in profit or loss on disposal is determined with reference to the carrying amount of such property at the date of disposal.
(ii) Provisions: This relates to cost of further works which may be required or performed on real estate already
delivered to the buyer. The amount recognized as a provision represents the best estimate of the expenditure required to settle the present obligation at the end of the reporting period. Provision is

Annual Report for the year ended 31 December 2016
Notes to the Consolidated and Separate Financial Statements
56
reviewed at the end of each reporting period and adjusted to reflect the current best estimate. If it is no longer probable that an outflow of resources embodying economic benefits will be required to settle the obligation, the provision shall be reversed.
(r) Employee benefits
(I) Short-term benefits Short-term benefits consist of salaries, accumulated leave allowances, profit share, bonuses and any non-
monetary benefits. Short-term employee benefits are measured on an undiscounted basis and are expensed as the related
services are provided.
A liability is recognized for the amount expected to be paid under short-term cash benefits such as accumulated leave and leave allowances if the Group has a present legal or constructive obligation to pay this amount as a result of past services provided by the employee and the obligation can be measured reliably.
(ii) Post-employment benefits The Group has a defined contribution plan. A defined contribution plan is a pension plan under which the
Group pays fixed contributions into a separate entity. The Group has no legal or constructive obligations to pay further contributions if the fund does not hold sufficient assets to pay all employees the benefits relating to the employee service in the current and prior periods. For defined contribution plans, the Group makes contributions on behalf of its employees to a mandatory scheme under the provisions of the Pension Reform Act. The Group has no further obligations once the contributions have been paid.
The contributions are recognized as employee benefit expenses when they are due. Prepaid contributions are recognized as an asset to the extent that a cash refund or deduction in the future payment is available. For entities operating in Nigeria, the contribution by employees and the employing entities are 8% and 10% respectively of the employee's basic salary, housing, and transport allowances. Entities operating outside Nigeria contribute in line with the relevant pension laws in their jurisdictions.
(iii) Termination benefits The Group recognizes termination benefits as an expense when the Group is demonstrably committed,
without realistic possibility of withdrawal, to a formal dedicated plan to either terminate employment before the normal retirement date, or to provide termination benefits as a result of an offer made to encourage voluntary redundancy. The Group settles termination benefits within twelve months and are accounted for as short-term benefits.
(s) Operating expense
Expenses are decreases in economic benefits during the accounting period in the form of outflows, depletion of assets or incurrence of liabilities that result in decrease in equity, other than those relating to distributions to equity participants.
Expenses are recognized on an accrual bases regardless of the time of spending cash. Expenses are recognized in the income statement when a decrease in future economic benefit related to a decrease in an assets or an increase of a liability has arisen that can be measured reliably.
Expenses are measured at historical cost except for fair value changes which represents the movement in fair value of investment property. Assets are recorded at the amount of cash or cash equivalents paid or their fair value of consideration given. Liabilities are recorded at the amount of proceeds received in exchange for the obligation. Only the portion of cost of a previous period that is related to the income earned during the reporting period is recognized as an expense. Expenses that are not related to the

Annual Report for the year ended 31 December 2016
Notes to the Consolidated and Separate Financial Statements
57
income earned during the reporting period, but expected to generate future economic benefits, are recorded in the financial statement as assets. The portion of assets which is intended for earning income in the future periods shall be recognized as an expense when the associated income is earned.
(t) Related party transactions
Parties are considered to be related if one party has the ability to control the other party or exercise influence over the other party in making financial and operational decisions, or one other party controls both. The definition includes subsidiaries, associates, joint ventures as well as key management personnel.
Transactions between the Group and its subsidiaries meet the definition of related party transactions. These transactions are eliminated on consolidation and not disclosed in the consolidated financial statements.
In general, transactions with related parties are accounted for in accordance with the standards applicable to such transactions.
6 Financial risk management
(a) Introduction
Mixta Real Estate Plc continues to transform its business model to align with the changing real estate development landscape, while positioning itself to best take advantage of future opportunities, as it seeks to attain a leadership role within the industry.
As the African continent continues to experience socio-political advancement, Mixta Real Estate Plc, in the financial year ending December 2015, became a part of a property development Group with footprints in some African countries. Having become part of a Group that has positioned itself as an African player, seeking to bridge the housing gap that exists within Nigeria and across a number of other African countries, Mixta Real Estate Plc seeks to act as a growth catalyst in the Nigerian housing development landscape.
As we evolve towards attaining a leadership position within the Nigerian and, as a Group, the African real estate development landscape, we recognize that a variety of business risks is introduced into our operations. Therefore, we have built our business around sound risk management practices, so that as we actively seek opportunities to create value for our clients and stakeholders, we equally take a deliberate, concerted effort to preserve value.
A culture of risk management permeates all that we do and is applied across all business functions. A disciplined approach to risk taking ensures that we seek to understand our products and markets before taking investment decisions. Therefore, business decisions go through defined approval processes, including a thorough assessment of the risk-return trade-off.
With a strong risk management culture, we are building an enduring business model. One that will serve our ambition of delivering housing and other commercial real estate needs to Nigeria, while delivering optimal value to our shareholders.
(b) Objectives of Risk Management
Risk Management practices at Mixta Nigeria centre around building a sustainable business where acceptable risk profile is maintained. Therefore, our approach is driven by the following key objectives.
This represents resiliency over time. It involves our organisation's ability to survive Business Sustainability:significant internal and external shocks.
This represents our organisation's and business manager's obligations to account for our Accountability:activities, accept responsibility for them, and to disclose the results in a transparent manner.

Annual Report for the year ended 31 December 2016
Notes to the Consolidated and Separate Financial Statements
58
This represents our ability to deliver services in the most cost-effective manner Operational Efficiency:possible while maintaining the highest feasible quality standards.
This is an optimization concept that seeks to achieve maximum possible return Risk/Reward Alignment:for each unit of risk taken.
(c) Key Developments in 2016
The Group took certain decisions in the course of the 2016 financial year that were aimed at improving our risk profile, while also positioning our business for sustainable future growth. Below are some of these decisions:
• Loan Acquisition of N2.5billion from First Bank of Nigeria to fund execution of new and existing projects
• Institution of a robust process to raise funds through the issuance of corporate bonds. The first phase was concluded in January 2017 with a total of N4.5billion raised
(d) Key & Emerging Risk Factors
Below are some risks that could adversely affect the Group. The Group has employed different measures in addressing these risks; however, this summary should not be regarded as a complete and comprehensive statement of all potential risks and uncertainties.
1 The Group actively pursues development opportunities; hence, unsuccessful developments or a slowdown in development activities could adversely impact the Group's reputation, revenue growth and profitability.
2 Inadequate market demand for the Group's products – commercial and residential real estate - would result in higher inventory of home units; and would impact the Group's revenues and profitability.
3 The challenge of securing long-term borrowing that could match investment in medium to long-term projects and assets remains, as we continue to see shortage of long-term liquidity and minimal financing participation from local banks.
4 Difficulties in obtaining long-term funding would negatively impact corporate growth, speed of project execution, could result in increased cost of funds, and ultimately reduced profitability.
5 As deposit for home purchases is a key financing source, the inability or unwillingness of property buyers to meet their instalmental payment obligations for properties they have committed to purchase could significantly impact completion timelines, project cost and quality, corporate revenues, and ultimately profitability.
6 As a result of significant holdings in a number of strategic, long-term assets, the Group carries a liquidity gap in its books.
7 Adverse changes in regulatory or government policies could significantly affect the Group's businesses.
8 In the light of current macro-economic uncertainties, we expect that demand for luxury homes would remain subdued, thereby, impacting the Firm's high-end real estate product offering.
9 Due to the illiquid nature of real estate investments, the Group could be unable to alter the investment portfolio at an acceptable return in response to changes in economic conditions.
10 The value of the Group's real estate asset could be impacted by factors that could drive property prices within locations where these assets exist.
11 Loss of talents could result in an inability to operate efficiently and to deliver the required level of service that is promised to our clients. The Group continues to adopt different strategies to attract and retain quality personnel.
12 Given that we are a real estate development company, there is the risk that inadequacies or failures of project contractors would adversely impact project completion timelines, project cost and project quality.

Annual Report for the year ended 31 December 2016
Notes to the Consolidated and Separate Financial Statements
59
13 The Group is exposed to various operational risks such as failed or inadequate processes, controls, systems, and the risk that its staff, vendors or other third party business partners may deliberately seek to breach established controls or to act in ways that are inconsistent with the Group's guidelines. In the event that any of the major risks should crystallize, it could adversely impact the Group's reputation and, hence, customer loyalty.
The Group reviews its strategic business risks on a continuous basis. The key risks are monitored and presented to Management and the Board Audit & Risk Committee from time to time. This process assists business managers in understanding the possible impact of each risk event and in defining mitigating actions relevant to each. In assessing possible impact, the Group considers both quantitative and qualitative outcome of a risk event, including possible reputational damage.
(e ) Risk Management Framework
The Group's risk management framework is built around core components such as Governance, Strategy and Policies, on the one hand, and Systems, Tools and People, on the other. The framework allows for the Group's risk exposure to be proactively managed through a continuous process of identification, evaluation, monitoring and reporting.
Our governance structure defines the responsibilities for managing, monitoring and reporting risks. An independent Risk Management function, which monitors risk exposures across the Group, works closely with business managers in identifying and addressing risks in a timely manner and within acceptable corporate risk profile.
In order to sufficiently capture the interrelationships among the various risk exposures, our risk management approach fits in an encompassing Enterprise Risk Management (ERM) framework which addresses the risks we assume while conducting our business, in broad risk categories as summarized below:
Risk Type Risk Description Loss Characteristics
Market & Investment Risk The risk of loss due to unfavourable This could result in loss of value to movements in the value of assets. the Firm's property investment
holdings
Project Risk The risk of a negative impact on This could result in significant project project quality, cost and/or cost overruns; thereby resulting in completion timelines arising from eroded profit margins on such failed or inadequate pre-defined projects scope, unexpected changes in project schedule or inadequate project resources.
Liquidity Risk The risk that the Firm will not be This could result in significant able to meet its financial obligations business disruption, delays in project as they fall due. completion or could hinder normal
operations of the Firm
Operational Risk The risk of loss arising from This could result in business inadequate or failed internal processes, disruption, litigation costs and/or people, systems and external events. regulatory penalties

Annual Report for the year ended 31 December 2016
Notes to the Consolidated and Separate Financial Statements
60
Risk Type Risk Description Loss Characteristics
Compliance Risk The risk of loss arising from This could result in adverse reputational violations of, or non-conformance impact, significant financial losses arising with laws & regulations from regulatory penalties; and in severe cases, loss of business licence
Credit Risk The risk of loss arising from This could result in impairment in the counterparty's inability or Group's credit assets and could invariably unwillingness to fulfill contractual affect its short to long-run liquidity obligations to the Group. needs.
Strategic Risk The risk of loss due to adverse This could result in a significant loss or improper implementation of of market share. business decisions, or lack of responsiveness to industry changes.
Reputational Risk The risk of brand damage due to This could result in a significant loss of the failure to meet stakeholders' market share; loss of key employees and expectations with respect to the costly litigation. Firm's performance and behaviour.
6.1 Market Risk and Investment Risk
Market risk is the risk of loss from unfavourable changes in the fair values of financial instruments caused by adverse moves in market variables, such as foreign exchange rates, interest rates, equity prices, commodity prices, credit spreads and implied volatilities of the market rates.
The Group is exposed to Market and investment risk due to possible fluctuations in factors such as foreign exchange rates and interest rates, and in changes in property value.
The objective of market risk management is to ensure that exposures are kept within acceptable limits, while optimizing returns. The Group's market and investment risk management practice seeks to achieve this through identifying the appropriate balance between risk and return in its investment decisions.
herefore, investment decisions go through different levels of authorization before execution, and only after Tenhanced risk assessments and due diligence exercises.
6.1.1 Interest rate risk
Interest rate risk is the risk of loss to Net Interest Income (NII) arising from changes in market interest rates on rate sensitive assets and liabilities. The Group carries some interest rate sensitive assets and liabilities which are priced with fixed rates, but reprice at varying frequencies.
The analysis below describes reasonably possible movements in interest rates with all other variables held constant, showing likely impact of the gap between interest sensitive assets and liability:
(a) Repricing period of financial assets and liabilities The table below analyses the Group's interest rate risk exposure on financial assets and liabilities. The financial
assets and liabilities are included at carrying amount and categorised by the earlier of contractual repricing or maturity dates.

Annual Report for the year ended 31 December 2016
Notes to the Consolidated and Separate Financial Statements
61
Group
As at Dec 31, 2016
In thousands of naira
Interest bearing instruments Non-interest Carrying Up to 3 4 - 6 7 - 12 Over 12 bearing Note Amount months months months months instruments
Cash and cash equivalents 26 656,838 656,838 - - - - Loans to related entities 23 4,989,011 4,262,377 559,927 166,707 - -
5,645,849 4,919,215 559,927 166,707 - -
Borrowings 29 25,166,507 2,513,073 5,302,117 1,561,428 15,789,889 -
Gap (19,520,658) 2,406,142 (4,742,190) (1,394,721) (15,789,889) -
Cumulative Gap 2,406,142 (2,336,048) (3,730,769) (19,520,658)
Interest Rate Shock 1% 24,061 (23,360) (37,308) (195,207) 2% 48,123 (46,721) (74,615) (390,413) -1% (24,061) 23,360 37,308 195,207 -2% (48,123) 46,721 74,615 390,413
As at Dec 31, 2015
In thousands of naira
Interest bearing instruments Non-interest Carrying Up to 3 4 - 6 7 - 12 Over 12 bearing Note Amount months months months months instruments
Cash and cash equivalents 26 848,438 654,978 - - - 193,460 Loans to related entities 23 5,204,652 - 1,066,892 - 4,137,760 -
6,053,090 654,978 1,066,892 - 4,137,760 193,460
Borrowings 29 20,262,672 7,057,753 2,584,171 3,165,211 7,455,537 -
Gap (14,209,582) (6,402,775) (1,517,279) (3,165,211) (3,317,777) 193,460
Cumulative Gap (6,402,775) (7,920,054) (11,085,265) (14,403,042) (14,209,582)
Interest Rate Shock 1% (64,028) (79,201) (110,853) (144,030) 2% (128,056) (158,401) (221,705) (288,061) -1% 64,028 79,201 110,853 144,030 -2% 128,056 158,401 221,705 288,061

Annual Report for the year ended 31 December 2016
Notes to the Consolidated and Separate Financial Statements
62
Company
As at Dec 31, 2016
In thousands of naira
Interest bearing instruments Non-interest Carrying Up to 3 4 - 6 7 - 12 Over 12 bearing Note Amount months months months months instruments
Cash and cash equivalents 26 522,463 522,463 - - - - Loans to related entities 23 9,764,896 8,437,877 1,327,019 - - -
10,287,359 8,960,340 1,327,019 - - -
Borrowings 29 6,077,457 2,540,405 188,140 105,468 3,243,444 -
Gap 4,209,902 6,419,935 1,138,879 (105,468) (3,243,444) -
Cumulative Gap 6,419,935 7,558,814 7,453,346 4,209,902
Interest Rate Shock 1% 64,199 75,588 74,533 42,099 2% 128,399 151,176 149,067 84,198 -1% (64,199) (75,588) (74,533) (42,099) -2% (128,399) (151,176) (149,067) (84,198)
As at Dec 31, 2015
In thousands of naira
Interest bearing instruments Non-interest Carrying Up to 3 4 - 6 7 - 12 Over 12 bearing Note Amount months months months months instruments
Cash and cash equivalents 26 713,296 604,457 - - - 108,839 Loans to related entities 23 8,898,794 - 1,066,892 - 7,831,902 -
9,612,090 604,457 1,066,892 - 7,831,902 108,839 Borrowings 29 2,937,290 - 2,540,661 244,308 152,321 -
Gap 6,674,800 604,457 (1,473,769) (244,308) 7,679,581 108,839
Cumulative Gap 604,457 (869,312) (1,113,620) 6,565,961 6,674,800
Interest Rate Shock 1% 6,045 (8,693) (11,136) 65,660 2% 12,089 (17,386) (22,272) 131,319 -1% (6,045) 8,693 11,136 (65,660) -2% (12,089) 17,386 22,272 (131,319)
6.1.2 Foreign Exchange Risk Foreign exchange risk is the risk of loss due to adverse movements in the exchange rates applicable to foreign
currency denominated assets and liabilities. These are assets and liabilities which are denominated in a currency other than the Group's functional currency, Naira.
An adverse movement in applicable exchange rate would result in losses in foreign currency denominated assets, and increased exposures in unmatched foreign currency denominated liabilities. In addition, a foreign exchange liquidity mismatch could arise as a result of a mismatch in the maturity profile or liquidation timing of obligations or assets denominated in a foreign currency.

Annual Report for the year ended 31 December 2016
Notes to the Consolidated and Separate Financial Statements
63
The Group's exposure to foreign exchange risk arises from its debt obligations denominated in US Dollars (Note 29b(v & viii)). Foreign exchange risk exposure also arises from foreign currency obligations due to project contractors, consultants and other vendors from time to time.
- Foreign Currency Concentration Risk The table below shows the Group and Company's structural foreign currency exposures for the period/year.
Group As at Dec 31, 2016
In thousands of naira Naira USD GBP Total Cash and cash equivalents 651,335 5,503 - 656,338 Loans to related entities 4,989,366 - - 4,989,366 Debtors and receivables 8,673,734 - - 8,673,734
14,314,435 5,503 - 14,319,938
In thousands of naira Naira USD GBP Total Deposit for shares 31,855,488 - - 31,855,488 Borrowings 23,421,502 1,745,005 - 25,166,507 Other liabilities 14,498,352 - - 14,498,352
67,775,342 1,745,005 - 71,520,347
Net open position (55,460,907) (1,739,502) - (57,200,409)
Sensitivity analysis: Foreign Exchange 10% - (173,950) - 20% - (347,900) - -10% - 173,950 - -20% - 347,900 -
As at Dec 31, 2015
In thousands of naira Naira USD GBP Total Cash and cash equivalents 794,962 53,476 - 848,438 Loans to related entities 5,204,652 - - 5,204,652 Debtors and receivables 9,618,870 - - 9,618,870
15,618,484 53,476 - 15,671,960
In thousands of naira Naira USD GBP Total Deposit for shares 31,856,738 - - 31,856,738 Borrowings 19,240,697 1,021,975 - 20,262,672 Other liabilities 19,564,563 - - 19,564,563
70,661,998 1,021,975 - 71,683,973
Net open position (55,043,515) (968,499) - (56,012,902)
Sensitivity analysis: Foreign Exchange 10% - (96,850) - 20% - (193,700) - -10% - 96,850 - -20% - 193,700 -

Annual Report for the year ended 31 December 2016
Notes to the Consolidated and Separate Financial Statements
64
Company As at Dec 31, 2016
In thousands of naira Naira USD GBP Total Cash and cash equivalents 518,958 3,505 - 22,463 Loans to related entities 9,764,896 - - 9,764,896 Debtors and receivables 14,185,244 - - 14,185,244
24,469,097 3,505 - 24,472,602 Deposit for shares 31,606,738 - - 31,606,738 Borrowings 6,039,199 38,258 - 6,077,457 Other liabilities 18,219,309 - - 18,219,309
55,865,246 38,258 - 55,903,504
Net open position (31,396,149) (34,753) - (31,430,902)
Sensitivity analysis: Foreign Exchange
10% - (3,475) - 20% - (6,951) - -10% - 3,475 - -20% - 6,951 - Company
As at Dec 31, 2015
In thousands of naira Naira USD GBP Total Cash and cash equivalents 659,820 53,476 - 713,296 Loans to related entities 8,898,794 - 8,898,794 Debtors and receivables 7,560,601 - 7,560,601
17,119,215 53,476 - 17,172,691 Deposit for shares 31,606,738 - - 31,606,738 Borrowings 2,937,290 - - 2,937,290 Other liabilities 14,973,123 - - 14,973,123
49,517,151 - - 49,517,151
Net open position (32,397,936) 53,476 - (32,344,460) Sensitivity analysis: Foreign Exchange
10% - 5,348 - 20% - 10,695 - -10% - (5,348) - -20% - (10,695) -
6.2 Credit Risk Credit Risk is the risk of loss arising from a counterparty's inability or unwillingness to fulfill contractual
obligations to the Group. The Group is exposed to credit risk through the following transactions; Credit risk arises from cash and cash equivalents, deposits and placement with banks and other financial institutions as well as loans to related entities and receivables.

Annual Report for the year ended 31 December 2016
Notes to the Consolidated and Separate Financial Statements
65
Credit risk from balances with banks and financial institutions is managed in accordance with the Group's Counterparty policy. Investments of surplus funds are made only with approved counterparties and within credit limits assigned to each counterparty.
The Group’s maximum exposure to credit risk is provided below: Other receivables In thousands of naira Cash and cash equivalents Loans to Related Entities (excluding Prepayment)
Dec 2015 Dec 2015 Dec 2015 Dec 2016 Dec 2016 Dec 2016 Carrying amount 848,438 5,204,652 8,772,437 656,838 4,988,251 8,673,734
Assets at amortised cost Neither past due nor impaired 848,438 5,204,652 8,772,437 656,838 4,988,251 8,673,734 Impaired - 760 429,523 - 760 512,661
Gross amount 848,438 5,204,412 9,201,960 656,838 4,989,011 9,186,395 Allowance for impairment (individual) - (760) (429,523) - (760) (512,661)
Carrying amount 848,438 5,204,652 8,772,437 656,838 4,988,251 8,673,734
The maximum exposure to credit risk the Company has is as follows:
Other receivables In thousands of naira Cash and cash equivalents Loans to Related Entities (excluding Prepayment)
Dec 2015 Dec 2015 Dec 2015 Dec 2016 Dec 20156 Dec 2016 Carrying amount 713,296 8,898,794 7,560,601 522,463 9,764,896 14,185,244
Assets at amortised cost Neither past due nor impaired 713,296 8,898,794 7,560,601 522,463 9,764,896 14,185,244 Impaired - - 183,419 - - 193,356
Gross amount 713,296 8,898,794 7,744,020 522,463 9,764,896 14,378,600 Allowance for impairment (individual) - - (183,419) - - (193,356)
Carrying amount 713,296 8,898,794 7,560,601 522,463 9,764,896 14,185,244
Management believes that the neither past due nor impaired amounts are still collectible in full based on
historical payment behaviour and extensive analysis of customer credit risk, including underlying customers' credit ratings if they are available.
6.2.1 Credit Concentration The table below breaks down the Group's main credit exposure at their carrying amounts, as categorized by
the geographical region as at 31 December 2016 and 31 December 2015. For this table the Group has allocated exposure to regions based on the region of the of domiciliation of the counterparties.

Annual Report for the year ended 31 December 2016
Notes to the Consolidated and Separate Financial Statements
66
Group Other receivables In thousands of naira Cash and cash equivalents Loans to Related Entities (excluding Prepayment)
Dec 2015 Dec 2015 Dec 2015Dec 2016 Dec 2016 Dec 2016 In Nigeria
South-west 848,438 1,341,208 8,883,508656,838 472,439 8,341,975 South-south - 3,864,204 279,815 - 4,171,633 303,478 Rest of West Africa - - 22,911 - - 22,911 Europe - - 15,726 - 344,939 637,595
Gross amount 848,438 5,205,412 9,201,960 656,838 4,989,011 9,305,959 Allowance for specific impairment - (760) (429,523) - (760) (440,564)
Carrying amount 848,438 5,204,652 8,772,437 656,838 4,988,251 8,865,395
Company Other receivables In thousands of naira Cash and cash equivalents Loans to Related Entities (excluding Prepayment)
Dec 2015 Dec 2015 Dec 2015 Dec 2016 Dec 2016 Dec 2016
In Nigeria
South-west 713,296 5,034,590 6,004,259 522,463 5,248,324 13,261,583 South-south - 3,864,204 279,815 - 4,171,633 303,478 Rest of West Africa - - 1,421,091 - - 22,911 Europe - - 38,855 - 344,939 637,595
Gross amount 713,296 8,898,794 7,744,020 522,463 9,764,896 14,225,567 Allowance for specific impairment - - (183,419) - - (193,356)
Carrying amount 713,296 8,898,794 7,560,001 522,463 9,764,896 14,032,211
6.3 Liquidity Risk Management Liquidity Risk is the risk that the Group will be unable to efficiently meet both expected and unexpected
current and future cash flow and collateral obligations as they fall due.
Prudent liquidity risk management includes maintaining a stock of high quality liquid assets, while at the same time securing long-term funding to ensure the availability of adequate funds to meet the Group's obligations as they fall due.
Liquidity Risk Profile The key measure used in monitoring liquidity risk is the Maturity Gap Ratio, which is calculated as the ratio of
maturity gap to maturing liabilities, across all currencies of exposure. The maturity gap is the difference between maturing assets and maturing liabilities within each maturity band.
The Maturity Gap Ratio displays the extent of mismatch between maturing assets and maturing liabilities. We review our Maturity Gap Ratio on a monthly basis, with closer attention to the 30-day gap.

Annual Report for the year ended 31 December 2016
Notes to the Consolidated and Separate Financial Statements
67
In assigning maturing liabilities to each maturity band, the Group allocates a significant portion of its maturing liabilities to the earliest possible period in which such liabilities could be called. We believe that this is a more conservative approach to liquidity management which better prepares us for a stress situation. However, the actual experience is such that these liabilities have longer effective maturity, in some instances, greater than 12 months, such that should the maturity gap below be assessed using these effective maturity profiles, positive gaps would be observed in the short term, up to 12months. Therefore, in a normal business condition, and under a mild stress scenario, where market liquidity tightens and it is more difficult to raise short to medium term funds, the firm remains well able to meet its obligations as and when due.
Of note also is a significant financial liability item of N31.87b in Deposit for Shares, which represents amount to be converted to preference shares (See Note 29a(i)). Given this intent, therefore, an exclusion of this single financial liability item from the liquidity risk analysis would improve overall maturity gap in both the Company and Group's positions, resulting in overall gap of (N25bn) and (N0.74bn) in the Group and Company respectively.
The Group continues to adopt a number of strategies in managing short-term liquidity position, while also implementing activities aimed at improving long-term balance sheet structure.
The tables below analyzes the Group's and Company's financial liabilities and assets into relevant maturity groupings.
Group 31 December 2016
In thousands of naira Gross
Nominal Carrying (outflow) Up to 3 4 - 6 7 - 12 Amount /inflow months months months 1 - 5 years Deposit for shares 31,856,738 (31,856,738) - - - (31,856,738) Borrowing 25,166,503 (25,166,303) (2,513,073) (5,302,117) (1,561,424) (15,789,889) Other liabilities and accruals 14,498,352 (14,343,945) (306,293) - (3,698,096) (10,339,556)
Total Financial Liabilities 71,521,593 (71,367,186) (2,819,366) (5,302,117) (5,259,520) (57,986,183) Assets held for managing liquidity risk
In thousands of naira Gross Nominal Carrying (outflow) Up to 3 4 - 6 7 - 12 Amount /inflow months months months 1 - 5 years Loan to related entities 4,989,366 4,993,028 - 822,155 4,170,873 - Debtors 8,673,734 6,949,123 745,997 210,809 1,972,947 4,019,370 Cash and cash equivalent 656,838 656,838 656,838 - - -
Total assets held for managing liquidity risk 14,319,938 12,598,989 1,402,835 1,032,364 6,143,820 4,019,370
Net liquidity (Gap)/Surplus (57,201,655) (58,768,197) (1,416,531) (4,269,153) 884,300 (53,966,813)
Cumulative Liquidity (Gap)/Surplus (1,416,531) (5,685,684) (4,801,384) (58,768,197)

Annual Report for the year ended 31 December 2016
Notes to the Consolidated and Separate Financial Statements
68
31 December 2015
In thousands of naira Gross
Nominal Carrying (outflow) Up to 3 4 - 6 7 - 12 Amount /inflow months months months 1 - 5 years Deposit for shares 31,856,738 (31,856,738) (31,856,738) Borrowing 20,262,672 (20,262,672) (8,523,125) (2,584,171) (3,159,249) (5,996,127) Other liabilities and accruals 19,564,563 (19,564,563) (121,864) (2,031,314) (17,411,385)
Total Financial Liabilities 71,683,973 (71,683,973) (8,644,989) (2,584,171) (5,190,563) (55,264,250) Assets held for managing liquidity risk
In thousands of naira Gross Nominal Carrying (outflow) Up to 3 4 - 6 7 - 12 Amount /inflow months months months 1 - 5 years Loan to related entities 5,204,652 5,204,652 - 1,066,132 - 4,138,520 Debtors 8,772,437 9,318,054 224,535 70,762 5,113,775 3,908,981 Cash and cash equivalent 848,438 848,438 848,438 - - -
Total assets held for managing liquidity risk 14,825,527 15,371,144 1,072,973 1,136,894 5,113,775 8,047,501
Net liquidity (Gap)/Surplus (56,858,447) (56,312,830) (7,572,016) (1,447,277) (76,788) (47,216,749)
Cumulative Liquidity (Gap)/Surplus (7,572,016) (9,019,293) (9,096,081) (56,312,830)
Company 31 December 2016
In thousands of naira Gross Nominal Carrying (outflow) Up to 3 4 - 6 7 - 12 Amount /inflow months months months 1 - 5 years Deposit for shares 31,606,738 (31,606,738) (31,606,738) Borrowings 6,077,457 (6,077,457) (2,540,405) (188,140) (105,468) (3,243,444) Other liabilities and accruals 8,219,309 (18,219,309) - - (18,219,309) -
Total Financial Liabilities 55,903,504 (55,903,504) ( ) (188,140) (18,324,777) (34,850,182)2,540,405
In thousands of naira Gross Nominal Carrying (outflow) Up to 3 4 - 6 7 - 12 Amount /inflow months months months 1 - 5 years Loans and receivables 9,764,896 9,764,896 - 1,327,019 8,437,877 - Debtors 14,185,244 10,409,213 893,038 19,064 5,399,150 4,097,961 Cash and cash equivalents 522,463 522,463 522,463 - - -
Total assets held for managing liquidity risk 24,472,603 20,696,572 1,415,501 1,346,083 13,837,027 4,097,961
Net liquidity (Gap)/Surplus (30,430,901) (35,206,932) (1,124,904) 1,157,943 (4,487,750) (30,752,221)
Cumulative Liquidity (Gap)/Surplus (1,124,904) 33,039 (4,454,711) (35,206,932)

Annual Report for the year ended 31 December 2016
Notes to the Consolidated and Separate Financial Statements
69
. 31 December 2015
Financial Liabilities In thousands of naira Gross Nominal Carrying (outflow) Up to 3 4 - 6 7 - 12 Amount /inflow months months months 1 - 5 years Deposit for shares 31,856,738 (31,608,026) (31,608,026) Borrowings 2,937,290 (3,140,430) (398,700) (2,291,904) (290,726) (159,100) Other liabilities and accruals 14,973,123 (14,973,123) (71,190) (77,676) (189,094) (14,635,163)
Total Financial Liabilities 49,767,151 (49,721,579) (469,890) (2,369,580) (479,820) (46,402,289)
In thousands of naira Gross Nominal Carrying (outflow) Up to 3 4 - 6 7 - 12 Amount /inflow months months months 1 - 5 years Loans and receivables 8,898,794 13,259,951 116,309 - 11,810 13,131,832 Debtors 7,560,601 9,733,589 2,975,137 19,345 3,876,915 2,862,192 Cash and cash equivalents 713,296 713,296 713,296 - - -
Total assets held for managing liquidity risk 17,172,691 23,706,836 3,804,742 19,345 3,888,725 15,994,024
Net liquidity (Gap)/Surplus (32,594,460) (26,014,743) 3,334,852 (2,350,235) 3,408,905 (30,408,265)
Cumulative Liquidity (Gap)/Surplus 3,334,852 984,617 4,393,522 (26,014,743)
6.4 Operational Risk Operational risk is the risk of loss arising from inadequate or failed internal processes, people, systems and
external events. Operational risk could result from erroneous transactions, fraudulent acts, performance failure of vendors, or business disruption, which could result in financial losses and/or reputational damage to the Group.
Mixta Real Estate manages operational risk using a well-established control framework, and tools such as Risk and Control Self Assessment (RCSA), Internal Loss Data Collection (LDC), Issues Management and Whistleblowing. The Company uses a bespoke system, Operation Risk Manager, as well as other excel based templates for collecting, managing, monitoring and reporting operational risk.
Operational risk loss events are escalated and managed using a four level escalation matrix depending on the amount of loss that may occur.
The Internal Loss Data Collection is the process with which the Group collects data on operational risk losses as they occur. This data collection is facilitated with the use of an Operational Risk System that has been tailored to the Group's operations, The OpRisk Manager. Risk events can be identified by any member of staff at any location within the Group. Once identified, the risk event is assigned to a member of staff with sufficient knowledge and authority to perform a causal analysis; and to recommend remedial actions.
RCSA is a forward looking evaluation of both potential and current risks faced within the Group on a daily basis. It also involves assessing the controls implemented to prevent, detect or mitigate the occurrence of the risks; as well as recommending actions for improving deficiencies, or designing new controls within the process. It is conducted in a workshop attended by business experts within the Group.
An issue is an observed gap, which has not necessarily resulted in a risk event, but has the potential to. Possible issues could include process flaws, control deficiencies, system deficiencies, observed misconducts

Annual Report for the year ended 31 December 2016
Notes to the Consolidated and Separate Financial Statements
70
of vendors and/or employees, lack of knowledge of relevant policies and procedures by staff, amongst others. Issue Management, therefore, is a proactive process of identifying, assessing, managing and monitoring issues that have a potential to result in risk events within the Group. The objective is to resolve these issues before they result in actual losses. The Risk Management team identifies and assesses issues; while staff members are trained on an on-going basis on the ability to identify risk issues and proffer possible solutions to mitigate or eliminate any observed issue. Risk issues are monitored until they are addressed and closed out.
Our Whistleblowing system enables anonymous as well as confidential reporting of observed misconduct within the Group. Stakeholders such as Regulators, Shareholders, Clients and Staff can make use of the Whistleblowing portal on the corporate website or call the Whistleblowing hotline for seamless reporting of misconducts. All information obtained via the Whistleblowing channels are thoroughly investigated, and disciplinary actions are applied when necessary. In addition to the benefit of early identification of misconducts, the Whistleblowing system serves as a preventive control for fraud, bribery and other forms of misconduct within the Group.
Overlaying these forward looking, as well as event specific approach in managing operational risk is an active action management approach aimed at preventing occurrence, reducing possibility of occurrence, as well as mitigating the impact of operational risk events. Actions are assigned to risk owners or to delegated officers, known as Action Owners, who have sufficient knowledge and the authority to perform such remedial actions, within specified timelines. Action completion status is constantly monitored by the Risk Management Unit and reported to Unit Heads.
Reports generated from data collected from these operational risk management processes provide business managers, Executive Management and the Board with information to help maintain operational risk at appropriate levels within each business line.
The ultimate aim of the operational risk management activities is to improve operational efficiency as well as the quality of service delivery to clients through:
• Improved processes and operational guidelines • Minimising occurrence of avoidable risk events • Creating Group-wide risk awareness that guides behaviours and creates a careful approach to transaction
handling and execution
6.5 Strategic and Reputational Risk Strategic Risk is the risk of loss to earnings or capital arising from adverse business decisions, improper
implementation of decisions, or lack of responsiveness to industry changes. Some strategic risk factors that the Group is exposed include: activities of competitors, political terrain; the economy; laws and regulations; changes in customer preferences and strategic business decisions.
Reputational Risk is the risk of loss to earnings or capital arising from damage to the Group's reputation. This damage could be as a result of poor communication; crisis mismanagement; poor service delivery; regulatory non-compliance; poor financial performance; poor corporate governance & leadership; inadequate Corporate Social Responsibility; or a lack of a strong workplace culture.
The Group's Strategic & Reputational Risk is managed closely with the Corporate Strategy Unit and the Marketing & Corporate Communication Unit respectively.
6.6 Capital Management Our capital management objective is to maintain a strong capital base that is backed with high quality assets
with stable valuations in a manner that sustains future development of business activities and creates sustainable value to our Shareholders.

Annual Report for the year ended 31 December 2016
Notes to the Consolidated and Separate Financial Statements
71
In doing this, we focus on optimising the use of available capital, and in ensuring proper capital allocation amongst the different businesses, according to the Group's business and investment strategy, but in consideration of the level of risk, and return expectation from each business area. Our focus is to safeguard Shareholders' funds and to ensure that it is not jeopardised through unguarded risk taking.
The capital of the group is managed with a view of maintaining a controlled relationship between equity and debt in order to maintain an optimal capital structure which reduces the cost of capital.
The Gearing Ratio for the Group and the Company as at 31 December 2015 is shown below: In thousands of naira Group Company 31 Dec 2015 31 Dec 2015 31 Dec 2016 31 Dec 2016 Borrowings (current and non-current) 20,262,672 2,937,290 25,166,507 6,077,457 Total Equity 28,126,831 5,452,885 28,705,048 5,132,310 Gearing Ratio 72.04% 53.87% 87.67% 118.42%
7 Financial assets and liabilities The table below sets out the classification of each class of financial assets and liabilities. It does not include
information on fair values as the carrying amounts are reasonable approximation of the fair values.
Group
31 December 2016 Loans and Other financial Total carrying
In thousands of naira Note receivables liabilities amount
Cash and cash equivalents 26 656,838 - 656,838 Loans to related entities 23 4,988,251 - 4,988,251 Debtors and receivables 25 8,673,734 - 8,673,734
14,318,823 - 14,318,823 Deposit for shares 28 - 31,855,488 31,855,488 Borrowings 29 - 25,166,507 25,166,507 Other liabilities 31 - 14,498,352 14,498,352
- 71,520,347 71,520,347
31 December 2015 Loans and Other financial Total carrying Note receivables liabilities amountIn thousands of naira
Cash and cash equivalents 26 848,438 - 848,438 Loans to related entities 23 5,204,652 - 5,204,652 Debtors and receivables 25 9,618,870 - 9,618,870
15,671,960 - 15,671,960 Deposit for shares 28 - 31,856,738 31,856,738 Borrowings 29 - 20,262,672 20,262,672 Other liabilities 31 - 19,564,563 19,564,563
- 71,683,973 71,683,973

Annual Report for the year ended 31 December 2016
Notes to the Consolidated and Separate Financial Statements
72
Company
31 December 2016
Loans and Other financial Total carrying
In thousands of naira Note receivables liabilities amount
Cash and cash equivalents 26 522,463 - 522,463
Loans to related entities 23 9,764,896 - 9,764,896
Debtors and receivables 25 14,185,244 - 14,185,244
24,472,603 - 24,472,603
Deposit for shares 28 - 31,606,738 31,606,738
Borrowings 29 - 6,077,457 6,077,457
Other liabilities 31 - 18,219,309 18,219,309
- 55,903,504 55,903,504
Loans and Other financial Total carrying 31 December 2015
In thousands of naira Note receivables liabilities amount
Cash and cash equivalents 26 713,296 - 713,296
Loans to related entities 23 8,898,794 - 8,898,794
Debtors and receivables (excluding
prepayments and deposit for land) 25 7,560,601 - 7,560,601
17,172,691 - 17,172,691
Deposit for shares 28 - 31,606,738 31,606,738
Borrowings 29 - 2,937,290 2,937,290
Other liabilities 31 - 14,973,123 14,973,123
- 49,517,151 49,517,151
8 Critical accounting estimates and judgement.
The Company makes estimates and assumptions that affect the reported amounts of assets and liabilities within the next financial year. Estimates and judgements are continually evaluated and based on historical experience and other factors, including expectations of future events that are believed to be reasonable under the circumstances.
(a) Critical judgements in applying the Group's accounting policies
In the process of applying the Group's accounting policies, management has made the following judgements, which have the most significant effect on the amounts recognized in the consolidated financial statements:
(i) Determination of significant influence over investees
Management applies its judgement to determine whether the control indicators set out in Note 5(a) indicate that the Group controls an entity. According to IAS 28, a 20% or more interest in an investee leads to a rebuttable presumption that the investor has significant influence over the investee.
The Group holds an indirect interest of 29.3% in Lakowe Lakes Golf Club Limited ("Lakowe"). (i.e. Mixta Real Estate Plc has an 88% stake in Toll Systems Development Company which in turn holds a 33.3% stake in Lakowe). However, having considered the fact and circumstances, including the non-representation of Mixta

Annual Report for the year ended 31 December 2016
Notes to the Consolidated and Separate Financial Statements
73
Real Estate Plc on the board of Lakowe, management has concluded that the Group does not have significant influence over Lakowe and the entity is not an associate of Mixta Real Estate Plc.
(ii) Classification of property
The Group determines whether a property is classified as investment property or trading property (inventory).
Investment property comprises land that is not for sale in the ordinary course of business, but are held primarily to earn capital appreciation.
Trading properties comprises properties that are held for sale in the ordinary course of business. Principally, this is residential property that the Group develops and intends to sell before or on completion of construction.
Management has classified the land bank held by Toll Systems Development Company Limited as investment property as it is primarily being held for capital appreciation and for investment in new subsidiaries through exchange for equity interest and/or debt finance.
(iii) Considerations on joint arrangement
The Group acquired a 51% equity interest in Garden City Golf Estate Development Limited ("Garden City"). Garden City is a structured separate vehicle established as a Limited Liability Company to carry on business generally as developers of golf courses and ancillary amenities.
The Group has (after considering the structure and form of the arrangement, the terms agreed by the parties in the executed memorandum of understanding, and the Group's rights and obligations arising from the subsequent acquisition from ARM Company from the arrangement) classified its interests as joint ventures and accounted for the acquisition in line with the policies disclosed in note 5(a)(viii).
(iv) Revenue recognition
Revenue is recognized to the extent that it is probable that the economic benefits will flow to the Group and the revenue can be reliably measured, regardless of when the payment is being made.
On the sale of trading properties, revenue is recognised when Mixta Real Estate Plc retains only an insignificant risk of ownership and it meets significant performance obligations due to the customer.
The Group recognises revenue on customers who have made deposits equal to or more than 70% of the value of the property or when it transfers to the buyer, control and the significant risks and rewards of ownership of the property. It however, retains the legal title to the property solely to protect the collectibility of the balance outstanding.
In addition, when Mixta Real Estate Plc has met significant performance obligations, it may be required to perform further work on real estate already delivered to the buyer. In such cases, it recognises a liability and an expense in accordance with its revenue policy.
(b) Critical accounting estimates and assumptions
Management makes estimates and assumptions concerning the future. The resulting accounting estimates will, by definition, seldom equal the related actual results. The estimates, assumptions and management judgements that have a significant risk of causing a material adjustment to the carrying amounts of assets and liabilities within the next financial year are outlined below.

Annual Report for the year ended 31 December 2016
Notes to the Consolidated and Separate Financial Statements
74
(i) Fair value of financial instruments
The Company's policy on fair value measurements is discussed under note 5(g)(iv).
The Company measures fair values using the following fair value hierarchy that reflects the significance of the inputs used in making the measurements:
Level 1 : Quoted market price(unadjusted) in an active market for an identical instrument.
Level 2 : Valuation techniques based on observable inputs, either directly - i.e. , as prices - or indirectly - i.e. derived from prices. This category includes instruments valued using: quoted market prices in active markets for similar instruments; quoted prices for identical or similar instruments in markets that are considered less than active; or other valuation techniques where all significant inputs are directly or indirectly observable from market data.
Level 3 : Valuation techniques using significant unobservable inputs. This category includes all instruments where the valuation technique includes inputs not based on observable data. Unobservable inputs are those not readily available in an active market due to market illiquidity or complexity of the product. These inputs are generally determined based on inputs of a similar nature, historic observations on the level of the input or analytical techniques.
The Group did not have any financial instruments measured and carried at fair value as at the end of the reporting period.
The financial instruments were not analyzed by the level in the fair value hierarchy into which each fair value measurement is categorised because the carry amounts of these instruments are reasonable approximation of fair value.
(ii) Investment property
Investment property is measured at fair value in line with the Group's accounting policy disclosed in note 5(k). The Group's investment property is valued at each reporting date by independent professionally qualified valuers who hold a recognised relevant professional qualification and have recent experience in the locations and segments of the investment property valued. For all investment property, their current use equates to the highest and best use.
Management reviews the valuations performed by the independent valuers for financial reporting purposes. Discussions of valuation processes and results are also held with the independent valuers to:
- verify all major inputs to the independent valuation report;
- assesses property valuation movements when compared to the prior year valuation report.
Further details of the judgements and assumptions made in the valuation of investment property are disclosed in note 20(d)
.
(iii) Estimation of net-realisable value for trading properties
Trading properties are stated at the lower of cost and net realisable value (NRV).
NRV for completed trading property is assessed by reference to market conditions and prices existing at the reporting date and is determined by the Group, based on comparable transactions identified by the Group for properties in the same geographical market serving the same real estate segment.
NRV in respect of trading property under construction is assessed with reference to market prices at the reporting date for similar completed property, less estimated costs to complete construction, estimated costs to complete construction and an estimate of the time value of money to the date of completion.

Annual Report for the year ended 31 December 2016
Notes to the Consolidated and Separate Financial Statements
75
(iv) Impairment losses on loans
Loans to related parties accounted for at amortized cost are evaluated for impairment on a basis described in note 5(g)(v).
The Group reviews its outstanding loan balances to assess impairment on an annual basis. In determining whether a specific impairment loss should be recorded in profit or loss, the Group makes judgements as to whether there is any observable data indicating an impairment trigger. The trigger may include observable data indicating that the borrower is unable to fulfil the repayment obligations as per contractual terms e.g. significant financial difficulty being experienced by the borrower, occurrence of default/delays in interest or principal repayments, restructuring of the credit facilities by giving extraordinary concessions to borrower etc.
The specific component of the total allowances for impairment applies to facilities evaluated individually for impairment and is based upon management's best estimate of the present value of the cash flows that are expected to be received. In estimating these cash flows, management makes judgements about a debtor's financial situation and the net realisable value of any underlying collateral. Each impaired facility is assessed on its merits, and the workout strategy and estimate of cash flows considered recoverable are independently approved by the risk management function.
9 Revenue-sales of trading properties
Group Company Group Company In thousands of naira 2015 20152016 2016 Sales of trading properties 3,683,410 -4,923,515 1,024,631
3,683,410 -4,923,515 1,024,631
10 Cost of sales- trading properties
Group Company Group Company In thousands of naira 2015 20152016 2016
Carrying value of land sold (see note (24(b)) 2,244,396 -2,379,250 551,297 Provision for future Cost - -872,120 166,916
2,244,396 -3,251,370 718,213
11 Fair value gain on investment property
Group Company Group Company In thousands of naira 2015 20152016 2016
Gain on fair valuation of investment property 1,884,400 - 976,420 -
1,884,400 - 976,420 - The total gains for the year which has been included in profit or loss is attributable to the increase in the fair
value of investment property held at the end of the reporting period (see note 20(b).

Annual Report for the year ended 31 December 2016
Notes to the Consolidated and Separate Financial Statements
76
12 Interest income
Group Company Group Company In thousands of naira 2015 20152016 2016
Interest income on instruments measured at amortized cost Loans to related entities (see note 24(b)) 553,248 933,497524,936 930,258 Cash and cash equivalents 11,998 11,998 33,200 -
Total income 536,934 942,256 586,448 935,497 (a) The following are the sources of the interest income from related entities: Group Company Group Company In thousands of naira 2015 20152016 2016
Farapark Properties Limited* 5,470 5,470- - Summerville Golf Club Limited - 436,120- 404,122 Oceanwinds Hospitality* 171,139 171,139145,215 145,215 Oakland Properties Limited - 30,394- - Adiva properties limited - - - 28,014 Oluwole Urban Malls Property Limited - 55 - - ARM Investment Managers Limited - - 9,219 - Beachwood Properties Development Company* 634 -818 - Lakowe Lakes Golf Club Limited* 85,166 1,48017,316 539 Mixta Africa S.A - -44,939 44,939 Garden City Golf Estate Development Limited* 290,839 290,839307,429 307,429
524,936 930,258 553,248 935,497
* represents entities that are not controlled by the Group
13 Other income Group Company Group Company In thousands of naira 2016 2016 2015 2015 Management fee (see (a) below) 74,022 334,618 92,819 353,415 Development fee (see (b) below) - - 106,920 106,920 Other income (see (b) below) 73,664 64,229 162,708 108,559 Rental Income (see (d) below) 22,668 22,668 2,995 2,995 Exchange (loss)/gain - - (37,790) 10,127
Total income 220,732 582,016 170,354 528,435
a Management fee This represents fees earned with respect to the provision of overall project supervision for management of real
estate construction projects ("The Village" and "Enclave") being undertaken by Summerville Golf Club Limited ("Summerville") as well as the "Garden City Golf Estate" project being undertaken by Garden City Golf Estate Development Limited ("Garden City").
A flat fee is charged monthly for the provision of overall project supervision for management of real estate construction projects ("The Village" and "Enclave") being undertaken by Summerville Golf Club Limited

Annual Report for the year ended 31 December 2016
Notes to the Consolidated and Separate Financial Statements
77
("Summerville") while a fee of 1% of the overall project cost is charged on project being undertaken by Garden City Golf Estate Development Limited ("Garden City").
b Development fee This represents fees earned with respect to the provision of overall project supervision for the development of real
estate construction projects ("The Village" and "Enclave") being undertaken by Summerville. A flat fee is charged monthly for the provision of overall project supervision for management of real estate construction projects ("The Village" and "Enclave") being undertaken by Summerville Golf Club Limited ("Summerville"). Development fee is eliminated on consolidation.
c Other income This represents income realised from legal fees charged by the Company on the sale of real estate products to
third party customers. The Company engages the services of the Legal Unit of ARM Investment Limited to provide necessary legal services with respect to these sales. The portion of the overall legal fees not used for the execution of title deed is recognized as income while the remaining is used to fund title documentation of such properties sold.
d Rental Income This represents income earned with respect to sub- lease of office space This income however does not form part
of the Group's revenue in its ordinary course of business.
14 Net impairment loss/(reversal) on financial assets Allowance for losses comprise:
Group Company Group Company In thousands of naira 2015 20152016 2016
Loans from related parties
Impairment charge/(credit) on loans to
related parties (Note 23 (c)) - - (75,217) -
- - (75,217) -
Debtors and Prepayments
Specific impairment charge for doubtful
receivables (Note 25(d)) 105,816 62,862 80,854 9,937
Allowance for unsubstantiated bank balance - -2,283 -
Write back during the period (Note 25 (d)) - (3,718) - -
105,816 59,144 83,137 9,937
Total 105,816 (16,073)83,137 9,937
15 Personnel expenses Group Company Group Company In thousands of naira 2015 20152016 2016 Wages and salaries 194,861 175,037 254,701 254,701 Contributions to defined contribution plans 15,518 15,267 20,657 20,657 Other staff costs 6,097 6,092 15,203 15,203
216,476 196,396 290,561 290,561

Annual Report for the year ended 31 December 2016
Notes to the Consolidated and Separate Financial Statements
78
ii The number of employees of the Company other than directors, who received emoluments in the following ranges (excluding pension contributions) were:
Group Company Group Company 2015 20152016 2016 Number NumberNumber Number Below N2,000,000 2 2 2 2 N2,000,001 - N4,000,000 2 2 17 17 N4,000,001 - N6,000,000 - - 7 7 N6,000,001 - N8,000,000 3 3 4 4 N8,000,001 - N10,000,000 2 2 4 4 Above N10,000,000 5 5 6 6
14 14 40 40
iii The average number of persons employed by the Group/Company during the period was as follows:
Group Company Group Company 2015 20152016 2016 Number NumberNumber Number Management staff 4 4 4 4 Senior staff 3 3 6 6 Non-management staff 7 7 30 30
14 1440 40 (b) DirectorsI. Directors' remuneration was paid as follows:
Group Company Group Company In thousands of naira 2015 20152016 2016 Short-term benefits: - Executive compensation 18,364 18,364 13,773 13,773 - Other allowances 56,368 56,368 42,477 42,477 Sitting allowances 4,150 4,150 7,100 7,100 Other fees and allowances 5,650 5,650 5,650 5,650
84,532 84,532 69,000 69,000
i Directors' remuneration shown above (excluding pension contributions and certain benefits) includes:
Group Company Group Company In thousands of naira 2015 20152016 2016
Chairman 2,000 2,0002,000 2,000
Highest paid director 2,000 2,000 2,000 2,000 ii The emoluments of all other directors were within the following ranges as follows:
Group Company Group Company In thousands of naira 2015 20152016 2016
N100,000 - N600,000 - - - - N600,001 - N1,100,000 - - - - N1,100,001 - N1,500,000 - - - - N1,500,001 - N2,000,000 2 2 2 2

Annual Report for the year ended 31 December 2016
Notes to the Consolidated and Separate Financial Statements
79
16 Operating expenses:
(a) Operating expenses comprise: Group Company Group Company In thousands of naira 2016 2016 2015 2015 139,258 139,258 Management fee expenses (see (b) below) 174,500 174,500 Audit fees 22,443 14,000 24,628 14,000 Professional fees 120,770 87,541 105,047 66,897 Travel and accommodation costs 20,902 20,48626,313 25,633 Advertising costs 8,427 7,767 32,332 32,203 Subscriptions 4,594 2,239 2,898 1,701 Operating lease expense (see (c) below) 56,097 54,43170,423 70,423 Insurance 7,544 6,834 13,089 12,785 Repairs and maintenance 15,576 6,787 19,760 17,148 Computer and telecommunication expenses 10,896 10,89640,164 30,320 Directors Expenses 9,903 9,903 7,818 7,818 AGM Expense 4,641 4,641 6,540 6,540 Business promotions and gifts 20,992 20,992 8,192 6,893 Utility 8,112 7,920 18,269 16,494 Transportation Expenses 3,689 3,37920,934 20,453 Security expenses 18,066 - 33,119 - Administrative expenses 34,227 14,213 50,693 28,801 General expenses - - 5,561 3,745 Exchange loss 36,030 2,146 - -
Total operating expenses 577,409 448,675625,038 501,112
(b) Management fee expenses represent expenses incurred for administrative support services provided by Mixta Africa S.A. The Company's share was based on the Management Service Agreement ("MSA") dated 31 December 2015. The services detailed in the Management Service Agreement includes:
(I) Development and monitoring of specific real estate projects
(ii) Administrative, financial, legal, tax and accounting services This covers human resource functions particularly in the area of staff training, legal support services,
internal audit, financial and accounting services
It also covers the provision of regular economic and market research required for the Company for its day-to-day operations particularly investment activities and general advisory services.
( c) Operating lease expense represents rent expense incurred by the Company. The Company entered into a 5year lease agreement with ARM Life Plc for use of the office premises located at 8 Kasumu Ekemode Street, off Saka Tinubu Street Victoria Island Lagos. The lease commenced on the 1st of June 2015 and the Company is to expire on 30th May 2020. During the year, the Company paid rent for six(6) months for five(5) and there maining six(6)months was paid on floors for three(3) floors. This caused the total to be N70 million as opposed to the N93million per the agreement.
As at 31 december, the future minimum lease payments under non-cancellable leases were payable as follows
Group CompanyGroup Company In thousands of naira 2015 20152016 2016 Less than one year 93,311 93,311 91,911 91,911 Between one and five years 373,244 373,244214,459 214,459 More than five years - -
466,555 466,555 306,370 306,370

Annual Report for the year ended 31 December 2016
Notes to the Consolidated and Separate Financial Statements
80
17 Finance costs
Finance costs comprise: Group CompanyGroup Company In thousands of naira 2015 20152016 2016
Borrowings (See note 29(b) below) 642,165 499,333 1,817,627 898,387 Bank charges 7,224 1,630 4,015 2,233 Others 18,661
Total interest expense 649,389 500,9631,840,303 900,620
The following are the sources of interest on borrowings:
Group CompanyGroup Company In thousands of naira 2015 20152016 2016
ARM Trustees * 1,046 1,046 5,732 5,732 Townsville Properties Limited * 44,978 23,394 65,828 27,681 Beachwood Property Development Company Limited* 49,020 -68,774 - Oluwole Urban Mall Limited - 269 - - Oakland Properties Limited - 114 - - Adiva Properties Limited - 34,176 - - First Bank Merchant* - - 394,646 394,646 MODD Family* - - 4,829 4,829 Hospitality and Retail Fund* - - 132 132 Shelter Afrique* 89,226 - - - ARM Investment Managers Limited* 451,680 440,334 1,194,277 465,367 Others 6,215 -83,409 -
642,165 499,333 1,817,627 898,387
* represents entities that are not controlled by the Group.
18. Earnings and Dividend per share
(a) Earnings per share (EPS) Basic and diluted earnings per share has been computed based on profit after taxation and the number of
ordinary shares of 1,683,558,000 (2015: 1,683,558,000) in issue during the year.
Group CompanyGroup Company In thousands of naira 2015 20152016 2016 Profit attributable to Group shareholders 607,191 221,889 754,070 66,643
Number of ordinary shares in issue at year end 1,683,558 1,683,5581,683,558 1,683,558
Earnings per share - EPS in kobo 36k 13k45k 4k
The Group does not have any dilutive potential ordinary shares. Therefore, Basic EPS and Diluted EPS are the same for the Group.
(b) Dividend per share (DPS) Dividend per share has been computed based on the dividend proposed and the number of ordinary shares of
1,683,558,000 (2015:1,683,558,000) in issue during the year.
Dividend proposed 387,218 387,218303,040 303,040
Dividend per share - DPS in kobo 23k 23k18k 18k

Annual Report for the year ended 31 December 2016
Notes to the Consolidated and Separate Financial Statements
81
19
(a)P
rop
ert
y a
nd
eq
uip
me
nt
G
roup
In
thousa
nds
of
Nai
ra
Com
pute
r
Leas
ehold
Golf C
ours
e Pl
ant
and
M
oto
r Fu
rnit
ure
an
d O
ffic
e W
ork
In
Land
Build
ing
Im
pro
vem
ents
M
achin
ery
Veh
icle
&
Fit
ting
s E
quip
men
t P
rog
ress
To
tal
Bal
ance
at
1 J
anuar
y 2
01
5
7,3
19
,79
3
27
7,8
91
5
,08
7,2
65
2
0,6
14
2
1,5
25
2
7,6
12
3
32
4
0,5
71
1
2,7
95
,60
3
A
dd
itio
ns
-
-
-
-
1,4
91
9
4,7
39
9
,84
4
-
10
6,0
74
Rec
lass
ific
atio
n f
rom
tra
din
g p
rop
erti
es
-
4
7,2
08
-
-
-
-
-
47
,20
8
Bal
ance
at
31
Dec
emb
er 2
01
5
7,3
19
,79
3
27
7,8
91
5
,13
4,4
73
2
0,6
14
2
3,0
16
1
22
,35
1
10
,17
6
40
,57
1
12
,94
8,8
85
Bal
ance
at
1 J
anuar
y 2
01
6
7,3
19
,79
3
27
7,8
91
5
,13
4,4
73
2
0,6
14
2
3,0
16
1
22
,35
1
10
,17
6
40
,57
1
12
,94
8,8
85
T
ransf
ers
40
,75
7
61
,57
7
10
,51
0
24
,21
0
81
0
(40
,57
1)
9
7,2
93
A
dd
itio
ns
-
-
-
30
0
6,8
50
1
5,7
97
7
,03
3
-
29
,98
0
Rec
lass
ific
atio
n t
o t
rad
ing
pro
per
ties
(5
38
,26
2)
-
-
-
-
-
-
-
(53
8,2
62
)
Bal
ance
at
31
Dec
emb
er 2
01
66
,78
1,5
31
2
77
,89
1
5,1
75
,23
0
82
,49
1
40
,37
6
16
2,3
58
1
8,0
19
-
12
,53
7,8
96
A
CC
UM
ULA
TED
DEPR
EC
IATI
ON
Bal
ance
at
1 J
anuar
y 2
01
5
16
4,4
90
1
1,1
16
2
03
,49
0
-
3,8
52
6
,71
8
-
-
38
9,6
66
C
har
ge
for
the
year
8
2,2
45
5
,55
8
10
2,6
93
1
1,4
01
6
,34
6
14
,34
0
65
8
-
22
3,2
41
Bal
ance
at
31
Dec
emb
er 2
01
5
24
6,7
35
1
6,6
74
3
06
,18
3
11
,40
1
10
,19
8
21
,05
8
65
8
-
61
2,9
07
Bal
ance
at
1 J
anuar
y 2
01
62
46
,73
5
16
,67
4
30
6,1
83
1
1,4
01
1
0,1
98
2
1,0
58
6
58
- 6
12
,90
7
Tr
ansf
er
1,8
97
6
1,5
77
1
0,5
12
2
2,5
64
8
01
-
97
,35
1
C
har
ge
for
the
year
8
2,2
45
5
,55
0
10
2,6
93
9
,17
9
7,7
70
2
8,8
92
2
,85
1
-
23
9,1
80
R
ecla
ssific
atio
n t
o t
rad
ing
pro
per
ties
(2
4,1
91
)
(2
4,1
91
)
Bal
ance
at
31
Dec
emb
er 2
01
63
04
,78
9
22
,22
4
41
0,7
73
82
,15
7
28
,48
0
72
,51
4
4,3
10
- 9
25
,24
7
N
et b
ook
valu
e at
31
Dec
emb
er 2
01
5
7,0
73
,05
8
26
1,2
17
4
,82
8,2
90
9
,21
3
12
,81
8
10
1,2
93
9
,51
8
40
,57
1
12
,33
5,9
78
N
et b
ook
valu
e at
31
Dec
emb
er 2
01
6
6
,47
6,7
42
2
55
,66
7
4,7
64
,45
7
33
4
11
,89
6
89
,84
4
13
,70
9
- 1
1,6
12
,64
8
In
clud
ed in lea
sehold
lan
d is
the
golf c
ours
e p
arce
l of
land
mea
suri
ng
15
0 h
ecta
res
loca
ted
at
Km
35
Lek
ki E
pe
Exp
ress
way
Lak
ow
e, Ib
eju L
ekki
, La
gos
bei
ng
d
evel
op
ed b
y Su
mm
ervi
lle G
olf C
lub
Lim
ited
("S
um
mer
ville
").
Th
is lan
d h
as b
een p
led
ged
as
colla
tera
l fo
r th
e N
5 B
illio
n t
erm
loan
ob
tain
ed b
y Su
mm
ervi
lle f
rom
Acc
ess
Ban
k Pl
c (S
ee n
ote
29
).
Th
ere
wer
e no c
ontr
actu
al c
om
mit
men
ts f
or
the
acq
uis
itio
n o
f p
rop
erty
and
eq
uip
men
t as
at
31
Dec
emb
er 2
01
6 (
20
15
: n
il)

Annual Report for the year ended 31 December 2016
Notes to the Consolidated and Separate Financial Statements
82
19(b) Property and equipment
Company In thousands of Naira Computer Furniture Office Motor Hardware- Others & Fittings Equipment Vehicles Total COST
Balance at 1 January 2015 - - - - - Additions 4,218 94,739 5,328 1,490 105,775
Balance at 31 December 2015 4,218 94,739 5,328 1,490 105,775
Balance at 1 January 2016 4,218 94,739 5,328 1,490 105,775 Additions 3,802 15,797 3,231 6,850 29,680 Disposal - - - - -
Balance at 31 December 2016 8,020 110,536 8,559 8,340 135,455
ACCUMULATED DEPRECIATION
Balance at 1 January 2015 - - - - - Charge for the year 128 6,394 422 687 7,631
Balance at 31 December 2015 128 6,394 422 687 7,631
Balance at 1 January 2016 128 6,394 422 687 7,631 Charge for the year 1,039 20,862 1,647 2,352 25,900 Disposal - - - - -
Balance at 31 December 2016 1,167 27,256 2,069 3,039 33,531
Net book value at 31 December 2015 4,090 88,345 4,906 803 98,144
Net book value at 31 December 2016 6,853 83,280 6,490 5,301 101,924
There were no contractual commitments for the acquisition of property and equipment as at 31 December 2016 (2015 : nil)

Annual Report for the year ended 31 December 2016
Notes to the Consolidated and Separate Financial Statements
83
20 Investment property
(a) Investment property comprises
Group CompanyGroup Company In thousands of naira 2015 20152016 2016
Land at Lakowe Village, Lekki (see note ( C) below) 55,589,800 - 57,575,884 -
55,589,800 - 57,575,884 -
(b) The movement in investment property is as follows:
Group CompanyGroup Company In thousands of naira 2015 2015 2016 2016
Balance, beginning of year 54,613,380 - 55,589,800 - Unrealized fair value gain (See note 11) 976,420 - 1,884,400 -
Additions during the year - - 101,684 -
Balance, end of year 55,589,800 -57,575,884 -
( c) This represents 941.61 hectares of land bank held by Toll Systems Development Company Limited (TSD). The land bank is held for the capital appreciation and for the purpose of investing in Special Purpose Vehicles in exchange for equity and quasi equity in those entities The land bank is located at Lakowe Village, Lekki, Lagos. The property is carried at fair value.
(d) Valuation techniques used for fair valuation of investment property
Investment property is stated at fair value and has been determined based on valuations performed by Messrs Ubosi Eleh & Co., Estate Surveyors and Valuers (FRC/2013/NIESV/0000000/1493) as at 31 December 2016.
The fair value is supported by market evidence and represents the amount that would be received to sell the properties in an orderly transaction between market participants at the measurement date in the principal market to which the Group has access at the date of valuation, in accordance with standards issued by the International Valuation Standards Committee. Valuations are performed on an annual basis and the fair value gains and losses are reported in profit or loss. The profits or losses on disposal are also reported in profit or loss as they occurred.
The fair values of the Group's investment property are categorized into Level 3 of the fair value hierarchy.

Annual Report for the year ended 31 December 2016
Notes to the Consolidated and Separate Financial Statements
84
Loca
tion o
f p
rop
erti
esV
aluat
ion
(N'0
00)
Val
uat
ion t
echniq
ue
Prop
erty
des
crip
tion
Sig
nific
ant
unob
serv
able
in
put
Land
ban
k at
Lak
ow
e V
illag
e,
Lekk
i
57,5
75,8
84
Sale
s co
mp
aris
on: Th
e b
asis
of
valu
atio
n is
the
Mar
ket
Val
ue
that
is,
the
price
, w
hic
h a
n inte
rest
in
a p
rop
erty
mig
ht
reas
onab
ly b
e ex
pec
ted
to
real
ize
in a
sal
e b
y Pr
ivat
e Tr
eaty
ass
um
ing
: a.
a
will
ing
buye
r; b
. a
reas
onab
le p
erio
d w
ithin
w
hic
h t
o n
egoti
ate
the
sale
tak
ing
into
acc
ount
the
nat
ure
of
the
pro
per
ty
and
the
stat
e of
the
mar
ket;
c.
valu
es w
ill
rem
ain s
tati
c th
roug
hout
the
per
iod
; d
. th
e p
rop
erty
will
be
free
ly
exp
ose
d t
o t
he
mar
ket;
e.
no a
ccount
is t
o b
e ta
ken
of
an a
dd
itio
nal
bid
by
a sp
ecia
l p
urc
has
er; f.
no
acco
unt
is t
o b
e ta
ken o
f ex
pen
ses
of
real
izat
ion,
whic
h m
ay a
rise
in t
he
even
t of
a d
isp
osa
l.
The
pro
per
ty c
onsi
sts
of
a la
rge
exp
anse
of
und
evel
op
ed lan
d,
surr
ound
ed b
y d
isti
nct
and
ad
join
ing
sc
hem
es n
amel
y La
kow
e La
kes,
Golf
and
Countr
y Est
ate
to t
he
Wes
t, A
div
a Pl
ain f
ield
s an
d A
div
a Eas
t to
the
Nort
hEas
t an
d T
ow
nsv
ille
to t
he
Eas
t.
Site
: Th
e si
te, w
hic
h is
slig
htl
y ir
reg
ula
r in
shap
e, a
pp
ears
lev
el a
nd
wel
l d
rain
ed. It
has
a t
ota
l ar
ea o
f ap
pro
xim
atel
y 9
41
. 6
1hec
tare
s.
Situ
atio
n: A
cces
s to
the
pro
per
ty is
vid
e th
e Le
kki-
Ep
e Exp
ress
way
, w
hic
h
take
s it
s ro
ute
fro
m L
ekki
fir
st
round
about
and
ter
min
ates
at
Ep
e La
gos
Stat
e.
Pric
e p
er
squar
e m
eter
Sale
s p
rice
per
sq
uar
e m
eter
+/-
10%
S
ensi
tivi
ty o
n m
anag
emen
t's e
stim
ates
Im
pac
t Lo
wer
Im
pac
t H
igher
Est
imat
e
(N'0
00)
(N'0
00)
5,5
58,9
80
20
(d)
The
det
ails
of
valu
atio
n t
echniq
ues
and
sig
nific
ant
ob
serv
able
inp
uts
use
d in d
eter
min
ing
the
fair
val
ue
of
inve
stm
ent
pro
per
ty a
re p
rese
nte
d b
elow
:
The
fair
val
ues
of
the
Gro
up
's inve
stm
ent
pro
per
ty a
re c
ateg
ori
zed
into
Lev
el 3
of
the
fair
val
ue
5,5
58,9
80

Annual Report for the year ended 31 December 2016
Notes to the Consolidated and Separate Financial Statements
85
21 Investment in subsidiaries (a) Investment in subsidiaries all of which are measured at cost comprise: Group Company Group Company In thousands of naira 2015 2015 2016 2016
Adiva Properties Limited - 10 - 10
Cross Town Mall Limited - 10 - 10
Oluwole Urban Mall Property Limited - 7 - 7
Oakland Properties Limited - 10 - 10
Toll System Development Company Limited 31,606,739 - 31,606,739
Summerville Golf Club Limited - 1,250 - 1,250
- 31,608,026 - 31,608,026 (b) The subsidiary companies' country of incorporation, nature of business, percentage equity holding and year
consolidated with Mixta Real Estate Plc is as detailed below:
Country of Nature of Percentage HoldingSubsidiaries Incorporation Business Year end 31 Dec 2015 31 Dec 2016
Adiva Properties Limited Nigeria Real estate 31 December 99.9% 99.9%
Cross Town Malls Properties Limited Nigeria Real estate 31 December 99.9% 99.9%
Oluwole Urban Mall Property Limited Nigeria Real estate 31 December 70.0% 70.0%
Oakland Properties Limited Nigeria Real estate 31 December 99.9% 99.9%
Toll System Development Company Limited Nigeria Real estate 31 December 88.0% 88.0%
Summerville Golf Club Limited Nigeria Real estate 31 December 67.9% 67.9%

Annual Report for the year ended 31 December 2016
Notes to the Consolidated and Separate Financial Statements
86
( c)
Th
e co
nd
ense
d f
ina
nci
al
da
ta o
f th
e co
nso
lid
ate
d e
nti
ties
are
as
foll
ow
s:
C
onden
sed p
rofit
or
loss
3
1 D
ecem
ber
2016
Gro
up
Elim
inat
ion
Mix
ta R
eal
Ad
iva
Cro
ss
Olu
wole
O
akla
nd
To
ll Sy
stem
s Su
mm
ervi
lle
Est
ate
Plc
Prop
erti
es T
ow
n M
all U
rban
Mal
l Pr
op
erti
es D
evel
op
men
t G
olf C
lub
Li
mit
ed
Prop
erti
es
Prop
erty
Li
mit
ed
Com
pan
y Li
mit
ed
In
thousa
nds
of
Nai
ra
Lim
ited
Li
mit
ed
Li
mit
ed
G
ain o
n s
ale
of
trad
ing
pro
per
ties
1
,67
2,1
45
1
01
,51
7
30
6,4
18
-
-
-
-
- 1,2
64,2
10
Fa
ir v
alue
gai
n o
n inve
stm
ent
pro
per
ty
1,8
84
,40
0
-
-
-
-
-
1,8
84,4
00
-
In
tere
st inco
me
53
6,9
34
(4
32
,02
4)
9
42
,25
6
7,1
19
-
3,3
93
-
-
16,1
90
O
ther
inco
me
22
0,7
32
(4
15
,43
3)
5
82
,01
6
19
9
140
21,2
51
-
30,7
99
1,7
60
N
et im
pai
rmen
t (loss
)/cr
edit
on f
inan
cial
ass
ets
(83
,13
7)
-
(9,9
37
) -
-
(7
0,8
14)
(2,2
83)
-
(104)
O
per
atin
g e
xpen
ses
(1,1
54
,77
9)
47
,70
5
(8
17
,57
3)
(4
2,7
97
) (
3,0
04)
(9,6
24)
(1,5
97)
(38,9
02)
(288,7
86)
Fi
nan
ce c
ost
s (1
,84
0,3
03
) 2
7,9
02
(9
00
,62
0)
(8
6,2
39
) (
1)
(18,6
94)
(40)
(4
8,6
72)
(813,9
39)
Sh
are
of
pro
fit
of
equit
y-ac
counte
d inve
stm
ent
21
,00
9
21
,00
9
-
-
-
-
- -
-
Profit/
(loss
) b
efore
inco
me
tax
1,2
57
,00
1 (
64
9,5
25
) 1
02
,56
0
(12
1,7
18
) (2
,865)
(74,4
88)
(3,9
20)
1,8
27,6
25
179,3
31
In
com
e ta
x ex
pen
se
(29
1,5
66
) -
(3
5,9
17
)
(3,1
00
) -
-
-
(188,4
40)
(6
4,1
09)
Profit/
(loss
) fo
r th
e ye
ar9
65
,43
5 (
64
9,5
25
) 6
6,6
43
(1
24
,81
8)
(2,8
65)
(74,4
88)
(3,9
20)
1,6
39,1
85
115,2
22
C
onden
sed f
inan
cial
posi
tion
3
1 D
ec 2
016
Gro
up
Elim
inat
ion
Mix
ta R
eal
Ad
iva
Cro
ss
Olu
wole
O
akla
nd
To
ll Sy
stem
s Su
mm
ervi
lle
Est
ate
Plc
Prop
erti
es T
ow
n M
all U
rban
Mal
l Pr
op
erti
es D
evel
op
men
t G
olf C
lub
Li
mit
ed
Prop
erti
es
Prop
erty
Li
mit
ed
Com
pan
y Li
mit
ed
In
thousa
nds
of
Nai
ra
Lim
ited
Li
mit
ed
Li
mit
ed
Pr
op
erty
and
eq
uip
men
t 1
1,6
12
,64
8
-
10
1,9
24
-
-
-
-
-
11,5
10,7
24
In
vest
men
t p
rop
erty
5
7,5
75
,88
4
-
-
-
- -
-
5
7,5
75,8
84
-
In
vest
men
ts in s
ub
sid
iaries
-
(31
,60
9,2
76
) 31
,60
8,0
26
-
-
-
-
1,2
50
-
Eq
uit
y ac
counte
d inve
stm
ent
2,4
97
,79
8
(8,5
52
)
2,5
05
,10
0
- -
-
-
1,2
50
-
Lo
ans
to r
elat
ed e
nti
ties
-
(1
69
,36
8)
-
1
69
,36
8
-
-
-
- -
To
tal non-c
urr
ent
asse
ts
71
,68
6,3
30
(3
1,7
87
,19
6)
34
,21
5,0
50
1
69
,36
8
- -
-
57,5
78,3
84
11,5
10,7
24
Lo
ans
to r
elat
ed e
nti
ties
4
,98
8,2
51
(5
,07
6,5
87
)
9,7
64
,89
6
-
-
- -
-
299,9
42
Tr
adin
g p
rop
erti
es
32
,96
1,9
70
(1
,80
7,6
97
)
4,4
96
,28
3 2
,60
9,0
29
4
39
,871
112,5
01
470,1
38
-
26,6
41,8
45
D
ebto
rs a
nd
pre
pay
men
ts
8,3
33
,06
4 (1
6,9
44
,88
4)
14
,13
3,1
33
2,1
04
,32
5
-
23,9
55
39,7
39
6,5
31,4
86
2,4
45,3
10
C
ash a
nd
cas
h e
quiv
alen
ts
65
6,8
38
-
5
22
,46
3
22
,05
3
494
39,3
63
-
(1,1
24)
73,5
89
To
tal cu
rren
t as
sets
4
6,9
40
,12
3 (2
3,8
29
,16
8)
28
,91
6,7
75
4
,73
5,4
07
4
40
,365
175,8
19
509,8
77
6,5
30,3
62
29,4
60,6
86
To
tal as
sets
1
18
,62
6,4
53
(5
5,6
16
,36
4)
63
,13
1,8
25
4,9
04
,77
5
44
0,3
65
175,8
19
509,8
77
64,1
08,7
46
40,9
71,4
10

Annual Report for the year ended 31 December 2016
Notes to the Consolidated and Separate Financial Statements
87
Gro
up
Elim
inat
ion
Mix
ta R
eal
Ad
iva
Cro
ss
Olu
wole
O
akla
nd
To
ll Sy
stem
s Su
mm
ervi
lle
Est
ate
Plc
Prop
erti
es T
ow
n M
all U
rban
Mal
l Pr
op
erti
es D
evel
op
men
t G
olf C
lub
Li
mit
ed
Prop
erti
es
Prop
erty
Li
mit
ed
Com
pan
y Li
mit
ed
In
thousa
nds
of
Nai
ra
Lim
ited
Li
mit
ed
Li
mit
ed
Borr
ow
ing
s 1
5,7
96
,40
9
-
3,2
43
,44
5
-
-
-
-
- 1
2,5
52,9
64
D
efer
red
tax
lia
bili
ties
5
,70
1,7
56
-
1
2,5
54
-
-
-
-
5,6
89,2
02
-
D
eposi
t fo
r sh
ares
3
1,8
55
,48
8
(2,3
00
,10
3)
31
,60
6,7
38
-
-
-
-
-
2,5
48,8
53
To
tal non-c
urr
ent
liab
iliti
es
53
,35
3,6
53
(2
,30
0,1
03
) 3
4,8
62
,73
7
-
-
-
-
5,6
89,2
02
15,1
01,8
17
Borr
ow
ing
s 9
,37
0,0
98
(5
,24
5,7
06
)
2,8
34
,01
2
75
9,6
65
-
-
-
316,1
68
10,7
05,9
59
C
urr
ent
inco
me
tax
liab
ility
2
,17
9,2
77
(
2)
4
14
,37
1
36
7,7
29
1
21
106,5
91
-
1,1
50,1
66
140,3
00
O
ther
lia
bili
ties
1
5,2
16
,85
2 (
14
,25
8,7
98
) 18
,83
8,9
60
2,5
54
,39
8
53
6,1
71
97,2
37
824,7
04
11,2
02
6,6
12,9
78
D
efer
red
rev
enue-
dep
osi
t fr
om
cust
om
ers
7,4
67
,14
6
-
88
2,5
19
1
11
,49
0
27
,669
40,9
15
29,9
04
-
6,3
79,6
49
Pr
ovi
sion
2,3
34
,37
9
49
6,3
93
1
66
,91
6
-
-
-
-
- 1
,671,0
70
To
tal cu
rren
t lia
bili
ties
3
6,5
67
,75
2 (1
9,0
08
,11
3)
23
,13
6,7
78
3
,79
3,2
82
5
63
,961
244,7
43
849,6
08
1,4
77,5
36
25,5
09,9
56
To
tal lia
bili
ties
8
9,9
21
,40
5 (2
1,3
08
,21
6)
57
,99
9,5
15
3
,79
0,1
82
5
63
,961
244,7
43
849,6
08
7,1
66,7
38
40,6
11,1
73
Sh
are
cap
ital
8
41
,77
9
(5
,79
0)
8
41
,77
9
10
1
0
10
10
2,0
00
3,7
50
S
har
e p
rem
ium
5
,81
9,1
85
(1
,60
7,0
96
)
5,8
19
,18
5
- -
-
-
1,6
07,0
96
-
C
om
mon c
ontr
ol ac
quis
itio
n d
efic
it
(2,9
20
,40
7)
(7
64
,40
7)
(2,1
56
,00
0)
-
-
-
-
-
-
Ret
ained
ear
nin
gs
18
,11
0,3
62
(3
8,2
88
,59
2)
62
7,3
46
6
15
,09
0
(12
3,6
06)
(68,9
34)
(339,7
41)
55,3
32,9
12
355,8
87
N
on c
ontr
olli
ng
inte
rest
s 6
,85
4,1
29
6
,85
4,1
29
-
To
tal eq
uit
y 2
8,7
05
,04
8 (
33
,81
1,7
56
) 5
,13
2,3
10
6
15
,10
0
(12
3,5
96)
(68,9
24)
(339,7
31)
56,9
42,0
08
359,6
37
To
tal lia
bili
ties
and
eq
uit
y 1
18
,62
6,4
53
(55
,11
9,9
71
) 6
3,1
31
,82
5 4
,40
8,3
82
4
40
,365
175,8
19
509,8
77
64,1
08,7
46
40,9
71,4
10

Annual Report for the year ended 31 December 2016
Notes to the Consolidated and Separate Financial Statements
88
C
onden
sed p
rofit
or
loss
3
1 D
ecem
ber
2015
Gro
up
Elim
inat
ion
Mix
ta R
eal
Ad
iva
Cro
ss
Olu
wole
O
akla
nd
To
ll Sy
stem
s Su
mm
ervi
lle
Est
ate
Plc
Prop
erti
es T
ow
n M
all U
rban
Mal
l Pr
op
erti
es D
evel
op
men
t G
olf C
lub
Li
mit
ed
Prop
erti
es
Prop
erty
Li
mit
ed
Com
pan
y Li
mit
ed
Lim
ited
Li
mit
ed
Li
mit
ed
In
thousa
nds
of
Nai
ra
G
ain/(
loss
) on s
ale
of
trad
ing
pro
per
ties
1
,43
9,0
14
1
58
,48
0
-
-
- -
(
93,5
45)
-
1,3
74,0
79
Fa
ir v
alue
gai
n o
n inve
stm
ent
pro
per
ty
97
6,4
20
-
-
-
-
-
-
976,4
20
-
In
tere
st inco
me
58
6,4
48
(
72
3,4
04
)
93
5,4
97
2
15
,84
9
-
42,5
46
5,5
53
27,4
76
82,9
31
O
ther
inco
me
17
0,3
54
(3
67
,51
6)
52
8,4
35
1
,54
4
-
1,2
00
3
-
6,6
88
N
et im
pai
rmen
t (loss
)/cr
edit
on f
inan
cial
ass
ets
(10
5,8
16
) (
78
,93
5)
16
,07
3
-
-
(42,9
54)
-
-
-
O
per
atin
g e
xpen
ses
(1,0
17
,12
6)
(1
4,9
21
)
(65
2,7
02
) (
48
,57
8)
(840)
(3
,364)
(2
,301)
(19,3
78)
(2
75,0
42)
Fi
nan
ce c
ost
s (6
49
,38
9)
2
03
,05
8
(5
00
,96
3)
(1
35
,77
2)
(4
5,5
45)
(2
2,1
98)
(101,5
49)
(41,0
38)
(5
,382)
Sh
are
of
loss
of
equit
y-ac
counte
d inve
stm
ent
(29
,56
1)
(2
9,5
61
) -
-
-
-
-
-
-
Pro
fit/
(lo
ss)
befo
re in
com
e t
ax
1,3
70,3
44
(852,7
99)
326,3
40
33,0
43
(46,3
85
)
(24
,77
0)
(1
91
,83
9)
94
3,4
80
1
,18
3,2
74
In
com
e ta
x ex
pen
se
(2
99
,72
5)
-
(1
04
,45
1)
(2
1,4
16
) -
(
25)
-
(97,6
42)
(7
6,1
91)
Pro
fit/
(lo
ss)
for
the y
ear
1,0
70,6
19
(852,7
99)
221,8
89
11,6
27
(46,3
85
) (
24
,79
5)
(1
91
,83
9)
8
45
,83
8
1,1
07
,08
3
C
onden
sed f
inan
cial
posi
tion
3
1 D
ecem
ber
2015
Gro
up
Elim
inat
ion
Mix
ta R
eal
Ad
iva
Cro
ss
Olu
wole
O
akla
nd
To
ll Sy
stem
s Su
mm
ervi
lle
Est
ate
Plc
Prop
erti
es T
ow
n M
all U
rban
Mal
l Pr
op
erti
es D
evel
op
men
t G
olf C
lub
Li
mit
ed
Prop
erti
es
Prop
erty
Li
mit
ed
Com
pan
y Li
mit
ed
In
thousa
nds
of
Nai
ra
Lim
ited
Li
mit
ed
Li
mit
ed
Pr
op
erty
and
eq
uip
men
t 1
2,3
35
,97
8
-
98
,14
4
- -
-
-
-
12,2
37,8
34
In
vest
men
t p
rop
erty
5
5,5
89
,80
0
-
-
-
- -
-
5
5,5
89,8
00
-
In
vest
men
ts in s
ub
sid
iaries
-
(31
,60
9,2
76
) 3
1,6
08
,02
6
-
-
- -
1,2
50
-
Eq
uit
y ac
counte
d inve
stm
ent
2,4
76
,78
9
(2
9,5
61
) 2
,50
5,1
00
-
-
-
-
1,2
50
-
Lo
ans
to r
elat
ed e
nti
ties
1
65
,63
5
4,4
68
7
,45
7
-
-
- -
-
153,7
10
To
tal n
on
-cu
rren
t ass
ets
70,5
68,2
02 (
31,6
34,3
69)
34,2
18,7
27
-
-
-
- 5
5,5
92
,30
0 1
2,3
91
,54
4
Lo
ans
to r
elat
ed e
nti
ties
5
,03
9,0
17
(5
,23
8,4
44
)
8,8
91
,33
7
95
2,3
69
-
291,8
99
33,9
35
-
107,9
21
Tr
adin
g p
rop
erti
es
32
,17
9,0
40
(1
,13
7,5
79
)
4,5
66
,44
5 2
,54
1,3
17
4
39
,871
112,5
01
470,1
38
-
25,1
86,3
47
D
ebto
rs a
nd
pre
pay
men
ts
9,3
17
,54
3
(8,2
29
,59
9)
7
,62
7,3
01
1
,12
8,6
82
2
6,2
43
335,6
38
48,9
48
6,6
73,2
08
1,7
07,1
22
C
ash a
nd
cas
h e
quiv
alen
ts
84
8,4
38
2
9,8
15
7
13
,29
6
9,3
12
4
93
1,2
47
2,4
63
(1,1
24)
92,9
36
To
tal cu
rren
t ass
ets
47,3
84,0
38 (
14,5
75,8
07) 2
1,7
98,3
79 4
,631,6
80
466,6
07
7
41
,28
5
55
5,4
84
6
,67
2,0
84
27
,09
4,3
26
To
tal ass
ets
117,9
52,2
40 (
46,2
10,1
76)
56,0
17,1
06 4
,631,6
80
466,6
07
7
41
,28
5
55
5,4
84
6
2,2
64
,38
4 3
9,4
85
,87
0
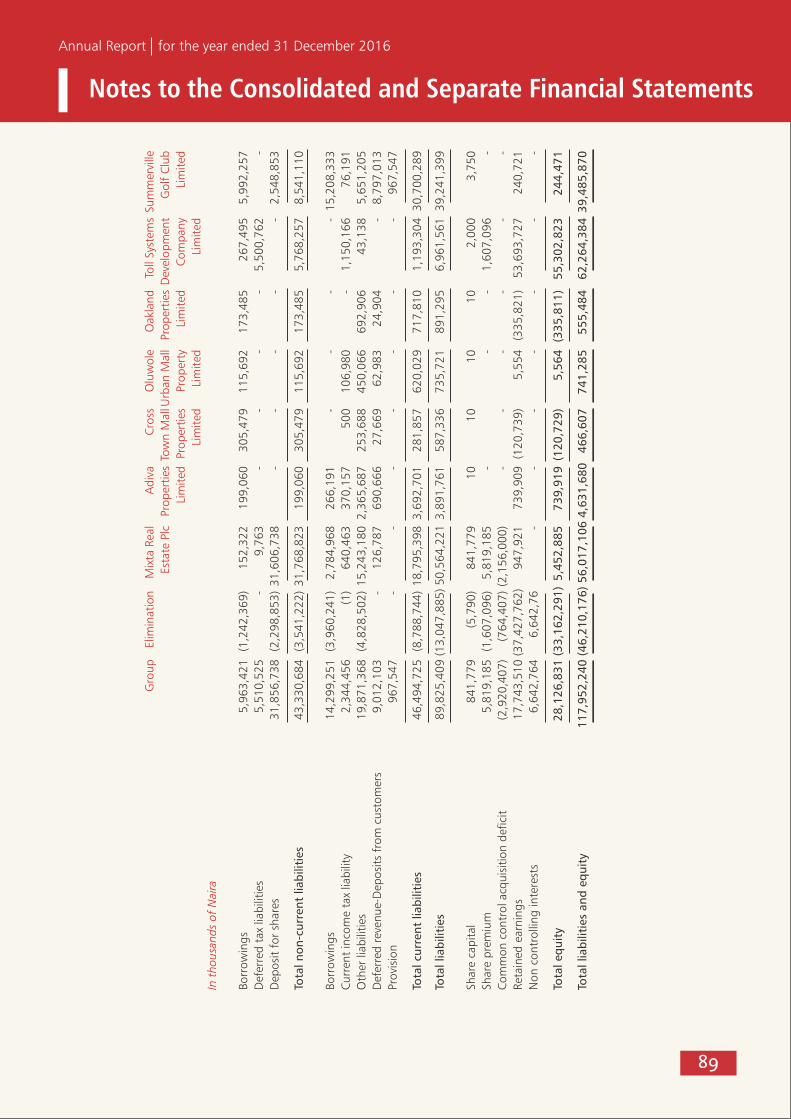
Annual Report for the year ended 31 December 2016
Notes to the Consolidated and Separate Financial Statements
89
Gro
up
Elim
inat
ion
Mix
ta R
eal
Ad
iva
Cro
ss
Olu
wole
O
akla
nd
To
ll Sy
stem
s Su
mm
ervi
lle
Est
ate
Plc
Prop
erti
es T
ow
n M
all U
rban
Mal
l Pr
op
erti
es D
evel
op
men
t G
olf C
lub
Li
mit
ed
Prop
erti
es
Prop
erty
Li
mit
ed
Com
pan
y Li
mit
ed
Lim
ited
Li
mit
ed
Li
mit
ed
In
thousa
nds
of
Nai
ra
Borr
ow
ing
s 5
,96
3,4
21
(1
,24
2,3
69
) 1
52
,32
2
19
9,0
60
3
05
,479
115,6
92
173,4
85
267,4
95
5,9
92,2
57
D
efer
red
tax
lia
bili
ties
5
,51
0,5
25
-
9
,76
3
-
-
- -
5,5
00,7
62
-
D
eposi
t fo
r sh
ares
3
1,8
56
,73
8
(2,2
98
,85
3)
31
,60
6,7
38
-
-
-
-
-
2,5
48,8
53
To
tal n
on
-cu
rren
t lia
bili
ties
43
,33
0,6
84
(3
,54
1,2
22
) 3
1,7
68
,82
3
19
9,0
60
3
05,4
79
115,6
92
173,4
85
5,7
68,2
57
8,5
41,1
10
Borr
ow
ing
s 1
4,2
99
,25
1
(3,9
60
,24
1)
2
,78
4,9
68
2
66
,19
1
-
-
-
- 1
5,2
08,3
33
C
urr
ent
inco
me
tax
liab
ility
2
,34
4,4
56
(1
)
64
0,4
63
3
70
,15
7
500
106,9
80
-
1,1
50,1
66
76,1
91
O
ther
lia
bili
ties
1
9,8
71
,36
8
(4,8
28
,50
2)
15
,24
3,1
80
2
,36
5,6
87
2
53
,688
450,0
66
692,9
06
43,1
38
5,6
51,2
05
D
efer
red
rev
enue-
Dep
osi
ts f
rom
cust
om
ers
9,0
12
,10
3
-
12
6,7
87
6
90
,66
6
27
,669
62,9
83
24,9
04
-
8,7
97,0
13
Pr
ovi
sion
96
7,5
47
-
-
- -
-
-
-
967,5
47
To
tal cu
rren
t lia
bili
ties
46
,49
4,7
25
(8
,78
8,7
44
) 1
8,7
95
,39
8 3
,69
2,7
01
2
81,8
57
620,0
29
717,8
10
1,1
93,3
04
30,7
00,2
89
To
tal lia
bili
ties
89
,82
5,4
09
(1
3,0
47
,88
5)
50
,56
4,2
21
3,8
91
,76
1
58
7,3
36
735,7
21
891,2
95
6,9
61,5
61
39,2
41,3
99
Sh
are
cap
ital
8
41
,77
9
(5,7
90
) 8
41
,77
9
10
10
10
10
2,0
00
3,7
50
Sh
are
pre
miu
m
5,8
19
,18
5
(1,6
07
,09
6)
5
,81
9,1
85
-
- -
1,6
07,0
96
-
C
om
mon c
ontr
ol ac
quis
itio
n d
efic
it
(2,9
20
,40
7)
(7
64
,40
7)
(2,1
56
,00
0)
-
-
-
-
-
-
Ret
ained
ear
nin
gs
17
,74
3,5
10
(3
7,4
27
,76
2)
9
47
,92
1
73
9,9
09
(1
20
,739)
5,5
54
(335,8
21)
53,6
93,7
27
240,7
21
N
on c
ontr
olli
ng
inte
rest
s 6
,64
2,7
64
6
,64
2,7
6
-
-
- -
-
-
-
To
tal eq
uit
y 28,1
26,8
31 (
33,1
62,2
91)
5,4
52,8
85
739,9
19 (
120,7
29
)
5,5
64
(3
35
,81
1)
5
5,3
02
,82
3
24
4,4
71
To
tal lia
bili
ties
an
d e
qu
ity
117,9
52,2
40 (
46,2
10,1
76)
56,0
17,1
06 4
,631,6
80
466,6
07
7
41
,28
5
55
5,4
84
6
2,2
64
,38
4 3
9,4
85
,87
0

Annual Report for the year ended 31 December 2016
Notes to the Consolidated and Separate Financial Statements
90
22 Equity-accounted investment(a) The movement in equity accounted investees during the year is as follows:
Group Company Group Company In thousands of naira 2015 20152016 2016
Balance, beginning of year 2,506,350 2,505,1002,476,789 2,505,100 Share of profit/(loss) of equity accounted investee (29,561) - 21,009 -
Balance, end of year 2,476,789 2,505,100 2,497,798 2,505,100
(b) Investment in equity accounted investee companies is analysed below:
Group Company Group Company 2015 20152016 2016 Garden City Golf Estate Development Limited (See (I)) 2,475,539 2,505,100 2,496,548 2,505,100 Lakowe Lakes Limited (See (ii)) 1,250 - 1,250 -
2,476,789 2,505,1002,497,798 2,505,100
(I) Garden City Golf Estate Development Limited ("Garden city") was incorporated in Nigeria as a Limited Liability Company. The primary business activity of Garden City is to carry on business generally as developers of golf courses and ancillary amenities. As at the reporting date, Mixta Real Estate Plc had joint control with Greater Portharcourt Development Authority and is entitled to 51% residual interest in the net assets of Garden City.
(ii) This represents the cost of the Group's investment in Lakowe Lakes Golf Club Limited ("Lakowe"). Management has not equity accounted for its interest in Lakowe based on its conclusion that the Group does not have significant influence over the entity.
( c) Summary of financial information for equity-accounted investees is as follows: The following table summarizes the financial information of Garden City as included in its own financial
statements, adjusted for fair value adjustments at acquisition amounting to N5.4 billion.
(I) Statement of Profit or Loss Garden City Golf Estate Development Limited
In thousands of naira 20152016
Percentage ownership interest 51%51% Income 352 82,893 Expenses (58,315)(41,699)
Profit/(loss) for the year (57,963)41,194
Share of profit/(loss) for the year (29,56121,009
(ii) Statement of financial position
In thousands of naira 201 2016 5 Percentage ownership interest 51%51% Current assets (see note (iii) below) 14,611,917 15,548,048 Non-current assets 16,276 12,665 Current liabilities (2,101,293) (9,685,053) Non-current liabilities (7,222,434)-
Net Assets 5,304,466 5,875,660
Share of net assets 2,705,2782,996,587
(iii) Included in the current assets is N5.4 billion representing fair value gain obtained on acquisition of investment in Garden City.
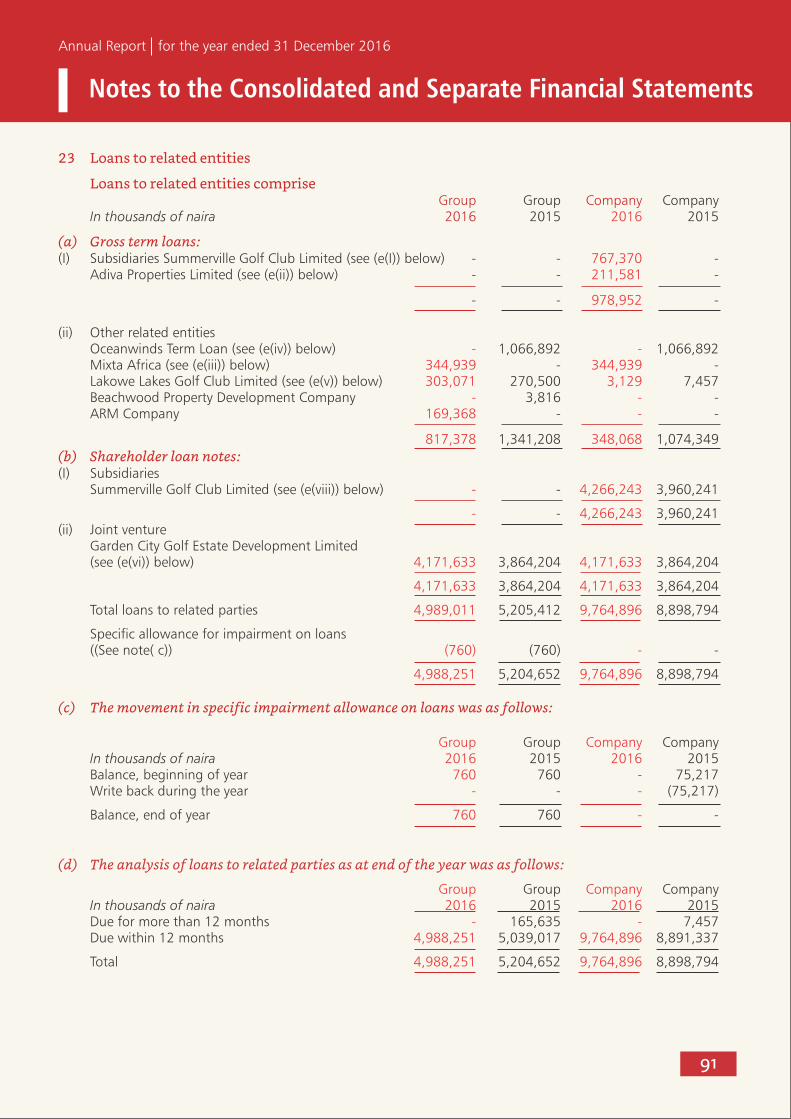
Annual Report for the year ended 31 December 2016
Notes to the Consolidated and Separate Financial Statements
91
23 Loans to related entities
Loans to related entities comprise Group Company Group Company In thousands of naira 2015 20152016 2016
(a) Gross term loans:(I) Subsidiaries Summerville Golf Club Limited (see (e(I)) below) - - -767,370 Adiva Properties Limited (see (e(ii)) below) - - - 211,581
- - - 978,952
(ii) Other related entities Oceanwinds Term Loan (see (e(iv)) below) 1,066,892 1,066,892 - - Mixta Africa (see (e(iii)) below) - -344,939 344,939 Lakowe Lakes Golf Club Limited (see (e(v)) below) 270,500 7,457303,071 3,129 Beachwood Property Development Company 3,816 - - - ARM Company - - 169,368 -
1,341,208 1,074,349817,378 348,068
(b) Shareholder loan notes:(I) Subsidiaries Summerville Golf Club Limited (see (e(viii)) below) - 3,960,241 - 4,266,243
- 3,960,241 - 4,266,243 (ii) Joint venture Garden City Golf Estate Development Limited (see (e(vi)) below) 3,864,204 3,864,204 4,171,633 4,171,633
3,864,204 3,864,204 4,171,633 4,171,633
Total loans to related parties 5,205,412 8,898,7944,989,011 9,764,896
Specific allowance for impairment on loans ((See note( c)) (760) - (760) -
5,204,652 8,898,7944,988,251 9,764,896
(c) The movement in specific impairment allowance on loans was as follows:
Group Company Group Company In thousands of naira 2015 20152016 2016 Balance, beginning of year 760 75,217 760 - Write back during the year - (75,217) - -
Balance, end of year 760 -760 -
(d) The analysis of loans to related parties as at end of the year was as follows:
Group CompanyGroup Company In thousands of naira 2015 20152016 2016 Due for more than 12 months 165,635 7,457 - - Due within 12 months 5,039,017 8,891,337 4,988,251 9,764,896
Total 5,204,652 8,898,7944,988,251 9,764,896

Annual Report for the year ended 31 December 2016
Notes to the Consolidated and Separate Financial Statements
(e) Details of the facilities advanced to related entities are as follows:
Counterparty Type Purpose Interest Value Maturity Restructured Updates rate date date /New/existing
(I) Summerville Golf Unsecured Construction Floating 28-Apr-16 27-Apr-17 New Not applicable Club Limited commercial of residential interest paper estate and rate amenities at Lakowe Village, Ibeju Lekki, Lagos.
(ii) Adiva Properties Unsecured Construction of Floating 12-Apr-16 11-Apr-17 New Not applicable Limited commercial lockup shops at interest paper Iju Shopping rate Mall Lagos.
(iii) Mixta Africa, S.A Unsecured To augment Floating 8-Apr-16 7-Apr-17 New Not applicable commercial working capital interest paper of the Company rate
(iv) Oceanwinds Term loan Construction of a 18% 18-Apr-15 30-Sep-16 Restructured Outstanding principal and interest Hospitality Limited hotel along the (Fixed 17 April, balance of N1,212,106,033 as at Lekki expressway, interest 2015 30 September 2016 was Lagos rate) converted to deposit for shares in
Oceanwinds Hospitality Limited
(v) Lakowe Lakes Golf Unsecured To augment 18% 1-Apr-14 3-Apr-17 Existing Not applicable Club Limited commercial working (Fixed paper capital of the interest Company rate)
vi) Beachwood Unsecured To augment 18% 1-Apr-14 3-Apr-17 Existing Not applicable Property commercial working capital (Fixed Development paper of the Company interest Company Limited
(vii) Garden City Golf Unsecured Debt capital 10% 22-Aug-13 Not Existing Not applicable Estate loan notes finance (Fixed applicable Development interest Limited rate)
(viii) Summerville Golf Unsecured Debt capital 19.5% 11-Mar-08 Not Existing Not applicable Club Limited loan notes finance (Fixed applicable interest rate)
(ix) ARM Investment Unsecured To augment 18% 7-Oct-16 6-Oct-17 New Not applicable Managers Limited commercial working capital (fixed) paper of the Company
92

Annual Report for the year ended 31 December 2016
Notes to the Consolidated and Separate Financial Statements
93
24 Trading properties
(a) This represents the cost of real estate apartments and land designated for resale
Group Company Group Company
In thousands of naira 2015 20152016 2016
Land (See (I) below) 4,389,433 4,233,552 4,319,269 4,163,390
Residential apartments (See (ii) below) 160,000 160,000 160,000 160,000
Retail shops (See (iii) below) 693,196 172,893693,196 172,893
Trading properties under development (See (iv) below) 26,936,411 - 27,789,505 -
32,179,040 4,566,445 32,961,970 4,496,283
In thousands of naira
Group Company Group Company
Category Description 2015 20152016 2016
(I) Land This represents the cost of 75 hectares of 3,003,552 3,003,552 2,872,866 2,894,240 land situated at Lakowe village, Ibeju Lekki
area of Lagos State and Shapati village,
Ibeju Lekki area of Lagos State purchased by
the Company for the purpose of developing
residential estates. The Company has
earmarked 25 hectares of the land situated
at Shapati village for sale as Townsville
Estate Extension. 20 hectares for sale as
Adiva East and 30 Hectares for sale as RDP.
This represents the cost of 12.17 hectares of 1,230,000 1,230,000 1,230,000 1,230,000 undeveloped land situated in Ajayi Apata
Royal Estate Sango-tedo off Lekki-Epe
expressway, Lagos state.
This represents cost of undeveloped 112,501 - 112,501 -
19,400sqm of land Located at Central
Business District, Lagos for construction
of Oluwole phase 2
This represents Cost of undeveloped 43,380 - 43,380 - land sizeof1,138 sqm located at Iju, Lagos.
This represents cost of Beechwood land - - 60,522 39,150
4,389,433 4,233,552 4,319,269 4,163,390
(ii) Residential This represents cost of 4units of unfurnished 160,000 40,000160,000 160,000
apartments 5-bedroom detached apartments with
2-bedmaids' unit located at Raymond Njoku
Street, on the Farapark Estate Layout.
160,000 40,000160,000 160,000
(iii) Retail shops This represents the cost of 4 retail shop 53,235 53,235 53,235 53,235 sat Oluwole Urban Market, Central
Business District, Lagos. The Oluwole
Urban Market is a fully integrated retail
and commercial complex
This represents the cost of 141 retail shops 639,961 119,658 639,961 119,658 at Oakland Shopping Plaza.
693,196 172,893 693,196 172,893

Annual Report for the year ended 31 December 2016
Notes to the Consolidated and Separate Financial Statements
94
In thousands of naira Group Company Group Company 2015 20152016 2016
(iv) Property This represents cost incurred to date on 439,871 - 439,871 - under construction of Alaba Shopping Complex construction on 12,600 sqm of land at Alaba, Lagos. It includes legal/title document, government consent, construction cost, interest and charges attributable to the property.
This represents cost incurred to date on 1,246,771 - 702,454 -construction 18units of homes at the
"Village"residential scheme
This represents cost incurred to date on 7,000,525 - 5,084,871 -construction of 206units of homes at
the "Enclave" residential scheme
This represents cost of outstanding 2,541,316 - 2,609,028 - inventory in Adiva Plain fields Estate on 631,132sqm of land located at Lakowe, Ibeju-Lekki, Lagos. It includes cost incurred on legal/title document, government consent, construction cost, professional fees, interest and other charges directly attributable to the property.
This represents cost of 1,075,266sqm 17,145,969 15,707,928 of land at Lakowe, Ibeju-Lekki, and other development costs incurred to date on the development of the Summerville residential scheme.
New Zone B - - 1,291,823 -This represents cost of 136,212sqm of
land at Lakowe, Ibeju-Lekki,and other development costs incurred to date on the development of the Summerville residential scheme.
Roman Villa - - 515,489 -This represents cost of 30,000sqm of
land at Lakowe, Ibeju-Lekki, and other development costs incurred to date on the development of the Summerville residential scheme.
26,936,411 - 27,789,505 -
32,179,040 4,446,44532,961,970 4,496,283

Annual Report for the year ended 31 December 2016
Notes to the Consolidated and Separate Financial Statements
95
(b) The movement in trading properties during the year was as follows:
Group Company Group Company
In thousands of naira 2015 20152016 2016
Balance, beginning of year 27,678,398 3,096,787 32,179,040 4,566,445
Cost capitalized 4,174,568 - 1,278,006 441,985
Interest & charges capitalized 1,220,470 - 1,330,953 -
Disposals (see note 10) (2,244,396) - (2,379,250) (551,297)
Acquisition of land 1,230,000 1,230,000 39,150 39,150
Reclassifications from PPE (see note 38 (b)) 120,000 239,658 514,071 -
Balance, end of year 32,179,040 4,566,445 32,961,970 4,496,283
25 Debtors and prepayments
Debtors and prepayments comprise: Group Company Group Company In thousands of naira 2015 20152016 2016
Due from related entities (see (a) below) 6,833,110 4,685,6943,386,691 9,282,679 Other receivables (see (b) below) 1,421,091 208,193 838,065 473,340 Prepayments and other assets (see ( c) below 1,492,865 2,916,833 4,620,969 4,570,470
Gross debtors and prepayments 9,747,066 7,810,7208,845,725 14,326,489
Specific allowance for impairment on doubtful receivables (see note (d) below) (429,523) (183,419)(512,661) (193,356)
9,317,543 7,627,301 8,333,064 14,133,133
(a) Due from related entities:
(i) Subsidiaries Summerville Golf Club Limited - 2,760,535 - 4,086,186 Toll Systems Development Company - - - - Oluwole Properties Limited - 169,747- 8,227 Adiva Properties Limited - 837,706 - 863,265
Cross Town Mall Limited - -- 335,182 Oakland properties Limited - 621,379- 754,859
- 4,389,367 - 6,047,719
(ii) Joint Venture Garden City Golf Estate Development Limited 8,280 8,28031,943 31,943 ,
31,943 31,9438,280 8,280

Annual Report for the year ended 31 December 2016
Notes to the Consolidated and Separate Financial Statements
96
Group Company Group Company
In thousands of naira 2015 20152016 2016
(iii) Other related entities Townsville Properties Limited 1,673 673 2,397 1,397 Asset & Resource Management Company Limited 3,210,448 - 122,548 3,134 84 Watford Properties Limited 3,281,250 -2,179,532 2,179,532 New Towns Development project 20,312 19,509 21,767 19,510 Due from Financial Advisers 5664 64 56 ARM Life Limited 12,525 12,525 17,244 17,244
MIXTA Africa S. A. 146,035 117,640637,595 637,595 MIXTA Cote d'Voire 22,911 22,911 22,911 22,911 Hospitality and Retail Fund - - 80,142 80,142 Farapark Properties Limited 6,872 6,820 1,820 1,820 New Town receivable 61,802 59,545 60,348 59,545 Lakowe Lakes Golf Club Limited 27,971 27,971 159,225 160,297 Beechwood Property Development Company 20,313 20,313 - - Oceanwinds Hospitality - -1,600 - Corporate Lodge Home stead 12,661 - 47,555 19,826 6,824,830 288,047 3,354,748 3,203,017
Total 6,833,110 4,685,694 3,386,691 9,282,679
(b) Other receivables Management fee receivables (see note (I) below) 1,382,236 126,761 6,232 406,821 Other receivables - 55,626 769,441 55,716 Sundry debtors 38,855 25,80662,392 10,803
1,421,091 208,193 838,065 473,340
(i) This represents amounts due from customers from the sale of trading properties and outstanding project income fees
(c) Prepayments and other assets: Deposit for land (see note (I) below) 36,000 36,000 36,000 36,000 Prepayments 42,315 18,278 44,568 20,992 WHT recoverable 48,045 48,045 104,562 104,562 PAYE 377 377 - - VAT 37,459 - 22,861 15,691 Due from Ropeway Transport Limited 276,328 - - - Construction vendor advance 416,910 -654,162 157,418 Subscription for investment (See note (ii) below) 545,617 2,794,367 1,757,723 4,006,473
Other assets (See note (iii) below) 89,814 19,7662,001,093 229,334
1,492,865 2,916,8334,620,969 4,570,470
Gross debtors and prepayments 9,747,066 7,810,7208,845,725 14,326,489
(i) The amount represents deposits made by the Group for the acquisition of lands for real estate development.
(ii) Subscriptions for investment represents investment in the following related entities:

Annual Report for the year ended 31 December 2016
Notes to the Consolidated and Separate Financial Statements
97
Group Company Group Company
In thousands of naira 2015 20152016 2016
Oceanwinds Hospitality Limited 274,082 274,0821,486,188 1,486,188
Summerville Golf Club Limited - 2,248,750 - 2,248,750
Garden City Golf Estate Development Limited 271,535 271,535271,535 271,535
1,757,723 4,006,473 545,617 2,794,367
(iii) Other assets is majorly made up of client accounts receivable which represents receivables from customers who have taken possession of trading properties
(d) The movement in the specific allowance for impairment on doubtful receivables was as follows:
Group Company Group Company
In thousands of naira 2015 20152016 2016
Balance, beginning of year 323,707 124,275429,523 183,419
Additions during the year (see note 14) 105,816 62,862 80,854 9,937
Allowance for unsubstantiated bank balance (see note 14) - -2,283 -
Write back during the year - (3,718) - -
Balance at end of year 429,523 183,419 512,661 193,356
26 Cash and cash equivalents
Group Company Group Company
In thousands of naira 2015 20152016 2016
Cash at bank 193,460 108,839 161,503 83,080
Placements with financial institutions 604,457 604,457439,383 439,383
Short term investments (see note (a) below) 50,521 - 55,952 -
Cash and Bank balance 848,438 713,296656,838 522,463
(a) This amount relates to investments made by the Group in approved fund schemes ("Funds") with Assets & Resource Management Company (ARM). These fund schemes are approved by the Securities and Exchange Commission (SEC) Nigeria and amounts invested are repayable on demand. Investments in these Funds are also available to meet short term cash commitments of the Group. Interest accrued on the investments at a range of 11% to 13% during the year.
27 Deferred tax liabilities
(a) The movement in deferred tax liabilities during the year was as follows:
Group Company Group Company
In thousands of naira 2015 20152016 2016
Balance, beginning of year 5,403,120 - 5,510,525 9,763
Charge during the year (see note 30 (b)) 107,405 9,763 191,231 2,791
Balance, end of year 5,510,525 9,763 5,701,756 12,554

Annual Report for the year ended 31 December 2016
Notes to the Consolidated and Separate Financial Statements
98
(b) Recognized deferred tax liabilities are attributable to the following:
Group Company Group Company
In thousands of naira 2015 20152016 2016
Investment property 5,500,762 -5,689,202 -
Property and equipment 9,763 9,76312,554 12,554
5,510,525 9,7635,701,756 12,554
(c) Unrecognized deferred tax assets
Significant management judgement is required to determine the amount of deferred tax that can be recognized, based upon the likely timing and the level of future taxable profits together with the future tax planning strategies.
The Company's deferred tax assets relates to timing difference in the recognition of depreciation and capital allowance on property, plant and equipment are not recognized in these financial statements. This is due to uncertainty about availability of future taxable profits against which deferred tax can be utilized.
The unrecognized deferred tax asset during the year is attributable to the following:
Group Company Group Company
In thousands of naira 2015 20152016 2016
Summerville Golf Club Property and
Limited equipment 1,160,000 - 179,800 -
1,160,000 - 179,800 -
28 Deposit for shares
(a) Deposit for shares comprises:
Group Company Group Company
In thousands of naira 2015 20152016 2016
Due to Asset & Resource Management CompanyLimited (see (I) below) 15,803,369 15,803,369 15,803,369 15,803,369
Due to Gairloch Limited (see (I) below) 16,053,369 15,803,36915,803,369 15,803,369
Due to Clad Limited - -248,750 -
31,855,488 31,606,738 31,856,738 31,606,738
(I) Deposit for shares represents liabilities due to Asset & Resource Management Company Limited and Watford Properties Limited which were designated as deposit for shares through the approval of the Board of Directors of the Company on 24 February 2011.
The Board at its meeting held on 20 March 2012 approved the conversion of the deposit for shares to equity, subject to approval by the Securities and Exchange Commission (SEC). The members of the company at the Annual General Meeting (AGM) held on Friday August 7,2015 was authorized to issue share sin respect of the transferred asset giving rise to the deposit for shares. As at the date of this financial statements, the process for regulatory approval (Securities and Exchange Commission) is still ongoing.

Annual Report for the year ended 31 December 2016
Notes to the Consolidated and Separate Financial Statements
99
29 Borrowings
Borrowings comprise: Group Company Group Company
In thousands of naira 2015 20152016 2016
(a) Due from related entities
(I) Subsidiaries - - - -
(ii) Other related entities
ARM Trustees Limited (see note (e)(I) below) 6,892 6,892 8,133 8,133
Townsville Properties Limited (see note (e)(ii) below) 441,966 152,322523,361 180,007
Farapark Properties Limited (see note (e)(iii) below) 32,994 - 38,991 -
338,253 - 397,820 -
ARM Investment Managers Limited (see note (e)(v) below) 9,662,623 2,778,076 11,112,890 3,243,445
Hospitality and Retail Fund (see note (e)(xii) - - 38,257 38,257
10,482,728 2,937,290 12,119,452 3,469,842
(b) Other term borrowings
Shelter Afrique ( see note (e)(vi)below) 222,679 - - -
Shareholder loan (See note (e) (xiii) below) 1,465,372 - 1,578,904 -
Summerville Notes (NGN) 14% (see note (e)(vii) below) 2,115,645 - 1,788,767 -
Preferred Notes of $100, 8% USD (see note (e)(viii) below 799,296 - ) 1,441,303 -
Secured bank loan (see note (e)(ix) below) 5,176,952 - 5,630,466 -
Secured bank loan (see note (e)(x) below) - - 2,502,147 2,502,147
MODD Family (see note (e )(xi) - - 105,468 105,468
9,779,944 - 13,047,055 2,607,615
20,262,672 2,937,290 25,166,507 6,077,457
(c) The analysis of borrowings as at end of the year was as follows:
Group CompanyGroup Company
In thousands of naira 2015 20152016 2016
Due for more than 12 months 5,963,421 152,322 15,796,409 3,243,445
Due within 12 months 14,299,251 2,784,9689,370,098 2,834,012
Total 20,262,672 2,937,290 25,166,507 6,077,457
(d) The movement on borrowings during the year is as follows:
Group CompanyGroup Company
In thousands of naira 2015 20152016 2016
Balance, beginning of year 17,452,476 3,376,255 20,262,672 2,937,290
Proceeds from borrowings 1,665,859 50,0003,015,444 2,575,982
Interest expense (See note 17) 642,165 499,333 1,817,627 898,387
Interest capitalised (See note 24) 1,220,470 - 1,330,953 -
Exchange difference - - 29,846 -
Interest repayments during the year (718,298) (23,717) (818,409) (284,202)
Principal repayments during the year - - (594,546) (50,000)
Other settlement - (964,581) 122,920 -
Balance, end of year 20,262,672 2,937,29025,166,507 6,077,457

Annual Report for the year ended 31 December 2016
Notes to the Consolidated and Separate Financial Statements
100
(e) Details of the facilities obtained by the Group are as follows: Counterparty Type Currency Purpose Interest Value Maturity Pledged Updates rate date date Collateral
(i) ARM Trustees Term Loan Naira To augment working 18% 21-Nov-14 23-Nov-17 None Outstanding Principal and Limited capital of the accrued interest balance due of Company N7,993,491 as at 23 November 2016 was rolled over at same
rate of 18% for a year.
(ii) Townsville Unsecured Naira To finance real 18% 1-Apr-14 3-Apr-17 None Not applicable Properties Limited commercial estate development paper projects
(iii) Farapark Properties Unsecured Naira To finance real 18% 1-Apr-14 3-Apr-17 None Not applicable Limited commercial estate development paper projects
(iv) Beechwood Property Unsecured Naira To finance real 18% 1-Apr-14 3-Apr-17 None Not applicable Development commercial estate development Company Limited paper projects
(v) ARM Investment Short Term Naira To augment working 17% - 1-Apr-14 3-Apr-17 None All outstanding Principal and Managers Limited Loan capital and finance 21% accrued interest balance due real estate were rolled over at a development harmonised rate of 17% for projects two years.
(vi) Shelter Afrique Term Loan USD To finance development of 9% 6-Aug-10 5-Aug-15 Access Bank Repaid during the year 376 different types Guarantee of houses and 251 serviced plots together with ancillary facilities and related infrastructure on Phase 1 of the Adiva Plainfields Estate
(vii) Summerville Golf Unsecured Naira To augment working 14%- 23-May-14 29-Apr-17 None Not applicable Club Limited Loan Loan Notes capital and finance 14.25% Note Holders real estate develop- ment projects
(viii) Summerville Golf Unsecured USD To augment working 7%-8% 1-May-10 19-Sep-17 None Not applicable Club Limited Loan Notes capital and finance Preffered Loan Note real estate develop- ment project
(ix) Access Bank Plc Term Loan Naira Completion of 21.0% 29-Apr-15 28-Apr-20 Tripartite legal mortgage Not applicable infrastructure works on all the parcel of land on the Enclave Homes measuring 150 hectares at Lakowe Lakes Golf located at KM 35 Lekki- and Country Estate Epe Expressway earn- marked for the proposed Summerville Lakowe Lakes Golf and Country Estate.
(x) First Bank Plc Term Loan Naira To service part of its Floating 7-Apr-16 6-Apr-17 Equitable Mortgage on Not applicable existing liabilities undeveloped parcel of land Comfort: measuring 61.94 hectares within the Adiva Plainfields Estate off Beechwood Estate,
(xi) MODD Family Unsecured Naira To augment working 17.0% 21-Sep-16 19-Sep-17 None Not applicable Loan Notes capital and finance real estate development projects
(xii) Hospitality and Retail Unsecured USD To augment working 3.5% 23-Nov-16 23-Feb-17 None Not applicable Fund Loan Notes capital and finance real estate development projects
(xiii) Watford Properties Unsecured Naira Debt capital finance 19.5% 11-Mar-08 N/A None Not applicable Limited Loan Notes

Annual Report for the year ended 31 December 2016
Notes to the Consolidated and Separate Financial Statements
101
30 Current income tax liability(a) The movement on this account during the year was as follows: Group Company Group Company In thousands of naira 2016 2016 2015 2015
Balance, beginning of year 2,202,136 595,775 2,344,456 640,463 Charge for the year (see note (b) below) 192,320 94,688 100,335 33,126 Payments during the year (50,000) (50,000) (265,514) (259,218)
Balance at end of year 2,344,456 640,4632,179,277 414,371
(b) The income tax expense comprises: Group CompanyGroup Company In thousands of naira 2015 20152016 2016
Company income tax 156,795 87,999 91,069 30,469 Tertiary education tax 35,525 6,689 9,266 2,657
192,320 94,688 100,335 33,126
Deferred tax charge (see note 27 (a) ) 107,405 9,763191,231 2,791
299,725 104,451 291,566 35,917
Reconciliation of effective tax rate Group Group
In thousands of naira % % 20152016
Profit before income tax 1,370,3441,258,416 Income tax using the domestic corporation tax rate (30%) 30% 30% 411,103377,100 Impact of tax treatments in subsidiaries 0% 10% 142,164 - Non-deductible expenses 0% 5% 74,996 2,492 Non-taxable income -8% -27% (364,063) (97,292) Tertiary education tax(2%) 1% 3% 35,525 9,266
Total income tax expense in comprehensive income 23% 22% 299,725 291,566
Company Group
In thousands of naira % % 20152016
Profit before income tax 326,34035,917 Income tax using the domestic corporation tax rate (30%) 30% 30% 97,902 30,768 Non-taxable income 0% 0% (286)- Non-deductible expenses 2% 0% 146 2,492 Tertiary education tax (2%) 3% 2% 6,6892,657
Total income tax expense in comprehensive income 35% 32% 104,45135,917
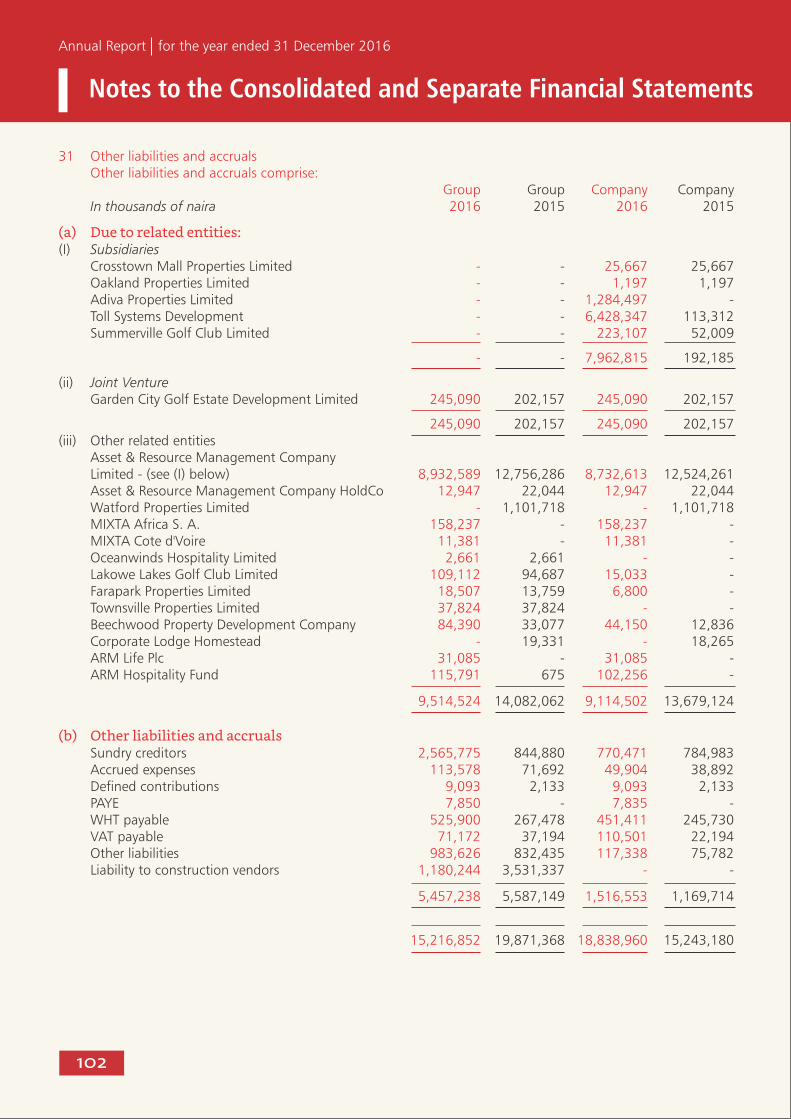
Annual Report for the year ended 31 December 2016
Notes to the Consolidated and Separate Financial Statements
102
31 Other liabilities and accruals Other liabilities and accruals comprise: Group Company Group Company In thousands of naira 2016 20162015 2015
(a) Due to related entities:(I) Subsidiaries Crosstown Mall Properties Limited - 25,667 - 25,667 Oakland Properties Limited - 1,197 - 1,197 Adiva Properties Limited - - - 1,284,497 Toll Systems Development - 113,312 - 6,428,347 Summerville Golf Club Limited - 52,009- 223,107
- 192,185 - 7,962,815
(ii) Joint Venture Garden City Golf Estate Development Limited 202,157 202,157245,090 245,090
202,157 202,157245,090 245,090 (iii) Other related entities Asset & Resource Management Company Limited - (see (I) below) 12,756,286 12,524,261 8,932,589 8,732,613 Asset & Resource Management Company HoldCo 22,044 22,044 12,947 12,947 Watford Properties Limited 1,101,718 1,101,718 - - MIXTA Africa S. A. - - 158,237 158,237 MIXTA Cote d'Voire - -11,381 11,381 Oceanwinds Hospitality Limited 2,661 -2,661 - Lakowe Lakes Golf Club Limited 94,687 - 109,112 15,033 Farapark Properties Limited 13,759 - 18,507 6,800 Townsville Properties Limited 37,824 - 37,824 - Beechwood Property Development Company 33,077 12,836 84,390 44,150 Corporate Lodge Homestead 19,331 18,265 - - ARM Life Plc - - 31,085 31,085 ARM Hospitality Fund 675 - 115,791 102,256
14,082,062 13,679,124 9,514,524 9,114,502
(b) Other liabilities and accruals Sundry creditors 844,880 784,983 2,565,775 770,471 Accrued expenses 71,692 38,892 113,578 49,904 Defined contributions 2,133 2,1339,093 9,093 PAYE - - 7,850 7,835 WHT payable 267,478 245,730 525,900 451,411 VAT payable 37,194 22,194 71,172 110,501 Other liabilities 832,435 75,782 983,626 117,338 Liability to construction vendors 3,531,337 - 1,180,244 -
5,587,149 1,169,714 5,457,238 1,516,553
19,871,368 15,243,180 15,216,852 18,838,960

Annual Report for the year ended 31 December 2016
Notes to the Consolidated and Separate Financial Statements
103
32 Deferred revenue-deposit from customers The balance represents advance instalments (pre-sale deposits) received from clients for purchased homes, land
and other products. Pre-sale deposits are recognized as liabilities until the Company performs its promised
obligations stated in the agreements with the customers after which revenue is recognized. Clients are
obligated to complete payments for the properties before title is passed on to them or will forefeit a percentage
of the total value if they cancel the contract.
Group Company Group Company In thousands of naira 2016 20162015 2015
Balance as at year end 9,012,103 126,787 7,476,873 882,519
33 Provisions This relates to cost of further works which may be required or performed on real estate already delivered to the
buyer. The amount recognized as a provision represents the best estimate of the expenditure required to settle
the present obligation at the end of the reporting period. Provision is reviewed at the end of each reporting
period and adjusted to reflect the current best estimate. if it is no longer probable that an out flow of resources
embodying economic benefits will be required to settle the obligation, the provision shall be reversed.
Group Company Group Company In thousands of naira 2015 20152016 2016
Provisions 967,547 - 2,334,379 166,916
34 Share capital Group Company Group Company In thousands of naira 2016 2016 2015 2015
(a) Authorized- 4,830,512,000 Ordinary shares of 50k each 2,415,256,000 2,415,256,000 2,415,256,000 2,415,256,000 169,488,000 preference shares of 50k each 84,744,000 84,744,00084,744,000 84,744,000
2,500,000,000 2,500,000,000 2,500,000,000 2,500,000,000
(b) Issued and fully paid share capital Group Company Group Company In thousands of naira 2016 2016 2015 2015 Issued and fully paid 1,683,557,140 ordinary shares of 50k each 841,779 841,779 841,779 841,779
The holders of ordinary shares are entitled to receive dividends as declared from time to time and are entitled to
one vote per share at meetings of the Company. All shares rank equally with regard to the Company's residual
assets.
35 Share premium The balance on share premium account was as follows: Group Company Group Company In thousands of naira 2016 2016 2015 2015
Balance, beginning and end of year 5,819,185 5,819,185 5,819,185 5,819,185

Annual Report for the year ended 31 December 2016
Notes to the Consolidated and Separate Financial Statements
104
36(a) Common control acquisition deficit
This represents the accumulated losses incurred on acquisition of companies under common control.
36(b) Retained earnings Retained earnings are the carried forward recognised income net of expenses plus current year profit
attributable to shareholders
37 Non controlling interests
(a) The entities accounting for the non-controlling interest balance is shown below:
Group CompanyGroup Company In thousands of naira 2015 20152016 2016
Toll System Development Company Limited 6,636,339 - 6,833,041 - Oluwole Urban Mall Property Limited (9,147) - (20,677) - Summerville Golf Club Limited 15,572 - 114,080 -
6,642,764 - 6,926,444 -
(b) The following table summarizes the information relating to the Group's subsidiaries that have material NCI
31 Dec 2016 Toll System Oluwole Summerville Development Urban Mall Golf Club Company Property Limited In thousands of naira Limited Limited
NCI percentage 12% 30% 32%
Total assets 64,108,746 175,819 40,971,410 Total liabilities (7,166,738) (244,743) (40,611,773)
Net assets 56,942,008 (68,924) 359,637
6,833,041 (20,677) 114,080
Toll System Oluwole Summerville Development Urban Mall Golf Club Company Property Limited In thousands of naira Limited Limited
NCI percentage 12% 30% 32%
Gross income 1,915,199 24,644 1,383,680 Profit 1,639,185 (74,488) 115,222
Profit allocated to NCI 196,702 (22,346) 37,009

Annual Report for the year ended 31 December 2016
Notes to the Consolidated and Separate Financial Statements
105
Toll System Oluwole Summerville Development Urban Mall Golf Club Company Property Limited In thousands of naira Limited Limited
NCI percentage 12% 30% 32% Total Assets 62,264,384 718,477 39,353,889 Total Liabilities (6,961,561) (748,967) (39,280,869) Net assets 55,302,823 (30,490) 73,020
Carrying amount of NCI 6,636,339 (9,147) 15,572
Gross income 27,476 43,746 1,528,633 Profit/(loss) 840,439 (44,850) 1,170,705
Profit allocated to NCI 100,853 (13,455) 376,030
38 Reconciliation notes to consolidated and separate statement of cash flows
(a) Loans to related entities Group Company Group Company In thousands of naira 2015 20152016 2016
Balance at the start of the year 4,812,002 11,860,698 5,204,652 8,898,794 Specific impairment reversal/ (loss) on loans - 75,217760 - Interest income earned on loans 553,248 935,497 524,936 930,258 Interest income received - (126,535)- (104,378) Loan settlement through trading property (120,000) (239,658) - - Loan offset against liabilities - (9,884) - - Loan offset against borrowings - (3,041)- - Reclassifications to debtors and receivables (280,746) (280,746) - (1,212,106) Balance at the end of the year 5,204,652 8,898,7944,988,251 9,764,896
Cash inflow / (outflow) (240,148) 3,312,754 742,097 (1,252,328)
(b) Trading properties Group Company Group Company 2015 2015In thousands of naira 2016 2016
Balance at the start of the year 27,678,398 3,096,787 32,179,040 4,566,445 Interest on borrowings capitalised 1,220,470 - 1,330,953 - Reclassification to trading properties 120,000 239,658 514,071 - Reclassifications from trading properties (47,208) - - - Balance at the end of the year 32,179,040 4,566,44532,961,970 4,496,283
Cash inflow/ (outflow) (3,207,381) (1,230,000) 1,062,094 70,162
(c) Debtor and prepayments Group Company Group Company 2015 2015In thousands of naira 2016 2016
Balance at the start of the year 8,769,518 4,906,648 9,747,066 7,810,720 Reclassification from loans to related parties 280,746 280,746 - 1,212,106 Receivables offset against borrowings - (824,506) - - Receivables offset against liabilities - (34,169) - - Exchange gain - - - 10,127 Other non-cash adjustments (3,453) (689) - Balance at the end of the year 9,747,066 7,810,7208,845,725 14,326,489
Cash inflow/ (outflow) (696,802) (3,485,454)900,651 (5,293,536)

Annual Report for the year ended 31 December 2016
Notes to the Consolidated and Separate Financial Statements
106
(d) Other liabilities and accruals
Group Company Group Company 2015 2015In thousands of naira 2016 2016
Balance at the start of the year 18,078,526 12,846,699 19,871,368 15,243,180 Liabilities offset against loans - 9,884 - - Liabilities offset against debtors - 34,169 - - Exchange loss (36,030) (2,146)(37,790) - VAT Paid 15,309 15,3096,806 6,806 Other non-cash adjustments - (133,583) (12) - Balance at the end of the year 19,871,368 15,243,180 15,216,852 18,838,960
Cash (outflow)/ inflow 1,772,121 2,320,114 (4,685,512) 3,602,586
(e) Deferred Revenue - Customer deposits Group Company In thousands of naira 28 Feb 2014 2016 7,467,146 882,519 2015 9,012,103 126,787
Change 2016 (1,544,957) 755,732
2015 9,012,103 126,788 2014 10,183,488 84,510
Change 2015 (1,171,385) 42,278
(f) Provisions Group Company In thousands of naira 28 Feb 2014 2016 2,334,379 166,916 2015 967,547 -
Change 2016 1,366,832 166,916
2015 967,547 - 2014 - -
Change 2015 967,547 -

Annual Report for the year ended 31 December 2016
Notes to the Consolidated and Separate Financial Statements
107
40 Related party transactions
During the year, the Company transacted business such as the provision of real estate manage ment services with certain companies that are regarded as related entities. The gross income derived from these related party transactions during the year ended 31 December 2016 amounted to N1,343,800,000 (31 December 2015: N1,916,792,867).
The related parties and balances for the year ended 31 December 2016 are listed below:
Group Company
Related entities Relationship Nature of transactions Note 31 Dec 2016 31 Dec 2016
Due (to)/from Due (to)/from
N'000 N'000
ARM Company Limited Affiliate Receivable from entity 25(a) 122,548 3,134
Payable to entity 31(a) (8,932,589) 8,732,613
Payable to entity 31(a) (12,947) 12,947
Loan from entity 29(a) (11,112,890) 3,243,445
Loan from entity 29(a) - -
Loan from entity 29(a) - -
Deposit for shares 28(a) (15,803,369) (15,803,369)
Oakland Properties Plc Subsidiary Loan to entity 23(a) - -
Receivable from entity - 754,859
Interest income 12 - -
Interest expense 17 - -
Payable to entity 31(a) - (1,197)
Cross Town Mall Properties Subsidiary Payable to entity 31(a) - (25,667)
Limited Receivable from entity 25(a) 335,182
Oluwole Urban Mall Property Subsidiary Receivable from entity 25(a) - 8,227
Limited Interest expense 17 - -
Interest income 12 - -
Loan to entity 23(a) - -
Adiva Properties Limited Subsidiary Receivable from entity 25(a) - 863,265
Payable to entity 31(a) (1,284,497)
Loan to entity 23(a) 211,581
Interest income 12 - (28,014)
Toll Systems Development Subsidiary Payable to entity 31(a) - (6,428,347)
Company Receivable from entity -
New Towns Development project Affiliate Receivable from entity 25(a) 21,767 19,510
Summerville Golf Club Limited Subsidiary Loan to entity 23(a) - 767,370
Loan to entity 23(a) - 4,266,243
Receivable from entity 25(a) - 4,086,186
Interest income 12 - (404,122)

Annual Report for the year ended 31 December 2016
Notes to the Consolidated and Separate Financial Statements
108
Payable to entity 31(a) - 223,107
Management fee income 13 - (260,596)
Development fee 13 - (106,920)
Subscription for Investment 25((c(iii)) - 2,248,750
Garden City Golf Estate Joint Loan to entity 23(b) 4,171,633 4,171,633
Development Limited venture Interest income 12 (307,429) (307,429)
Management fee income 13 (45,450) (45,450)
Receivable from entity 25(a) 31,943 31,943
Payable to entity 31(a) (245,090) (245,090)
Subscription for Investment 25((c(iii)) 271,535 271,535
ARM Trustees Limited Affiliate Loan from entity 29(a) (8,133) (8,133)
Receivable from entity - -
Payable from entity - -
Interest expense 18 5,732 5,732
ARM Life Plc Affiliate Receivable from entity 25(a) 17,244 17,244
Payable to entity 31(a) 31,085 31,085
Mixta Africa Affiliate Receivable from entity 25(a) 637,595 637,595
Payable to entity 31(a) (158,237) (158,237)
Loan to entity 23(b) 344,939 344,939
Interest income 12 (44,939) (44,939)
MIXTA Cote d'Voire Affiliate Receivable from entity 25(a) 22,911 22,911
Payable to entity 31(a) (11,381) (11,381)
Hospitality Management Company Affiliate Receivable from entity - - -
Hospitality Management Company Affiliate Payable to entity 31(a) (115,791) 102,256
Hospitality and Retail Fund Loan from entity 29(a) (38,257) (38,257)
Receivable from entity 31(a) 80,142 80,142
Oceanwinds Hospitality Limited Affiliate Loan to entity 23(a) - -
Interest income 12 (145,215) (145,215)
Subscription for Investment 25(c(iii)) 1,486,188 1,486,188
Payable to entity 31(a) 2,661 -
Farapark Limited Affiliate Receivable from entity 25(a) 1,820 1,820
Loan from entity 29(a) (38,991) -
Interest income 12 - -
Payable to entity 31(a) 18,507 6,800
Lakowe Lakes Golf Club Limited Affiliate Loan to entity 23(a) 303,071 3,129
Interest income 12 (17,316) (539)
Payable to entity 31(a) (109,112) (15,033)
Receivable from entity 25(a) 159,225 160,297
Gairloch Limited Affiliate Deposit for shares 28(a) (15,803,369) (15,803,369)
CLAD Limited Affiliate Deposit for shares 28(a) (248,750) -
Payable to entity 31(a) - -
Loan from entity 29(b) (1,578,904) -
Receivable from entity 25(a) 2,179,532 2,179,532

Annual Report for the year ended 31 December 2016
Notes to the Consolidated and Separate Financial Statements
109
Townsville Properties Limited Affiliate Receivable from entity 25(a) 2,397 1,397
Interest expense 17 65,828 27,681
Loan from entity 29(a) (357,847) (180,007)
Payable to entity 31(a) (37,824) -
New Town Receivable Affiliate Receivable from entity 25(a) 60,348 59,545
Beechwood Property Affiliate Loan to entity 23(a) - -
Development Company Receivable from entity 25(a) - -
Interest income 12 (818) -
Interest expense 17 68,774 -
Payable to entity 31(a) (84,390) (44,150)
Loan from entity 29(a) (397,820) -
Group Company
Related entities Relationship Nature of transactions Note 31 Dec 2015 31 Dec 2015
Due (to)/from Due (to)/from
N'000 N'000
ARM Company Limited Affiliate Receivable from entity 26(a) 3,210,448 84
Payable to entity 32(a) (12,756,286) (12,524,261)
Payable to entity 32(a) (22,044) (22,044)
Loan from entity 30(a) (9,656,662) (2,778,076)
Loan from entity 30(a) - -
Loan from entity 30(a) (5,961) -
Deposit for shares 29(a) (15,803,369) (15,803,369)
Asset & Resource Management
Company HoldCoy Payable to entity 32(a) (22,044) (22,044)
Oakland Properties Plc Subsidiary Loan to entity 24(a) - -
Interest income 13 - (30,394)
Interest expense 18 - 114
Payable to entity 32(a) - (1,197)
Cross Town Mall Properties Limited Subsidiary Payable to entity 32(a) - (25,667)
Oluwole Urban Mall Property Subsidiary Receivable from entity 26(a) - 169,747
Limited Interest expense 18 - 269
Interest income 13 - (55)
Loan to entity 24(a) - -
Adiva Properties Limited Subsidiary Receivable from entity 26(a) - 837,706
Interest expense 18 - 34,176
Toll Systems Development Company Subsidiary Payable to entity 32(a) - (113,312)
New Towns Development project Affiliate Receivable from entity 26(a) 19,509
Summerville Golf Club Limited Subsidiary Loan to entity 24(a) - -
Loan to entity 24(a) - 3,960,241
Receivable from entity 26(a) - 2,760,535
Interest income 13 - (436,120)
Payable to entity 32(a) - (52,009)
Management fee income 14 - (260,596)
Development fee 14 - (106,920)
Subscription for
Investment 26(c(iii)) - 2,248,750
The related parties and balances for the year ended 31 December 2015 are listed below:

Annual Report for the year ended 31 December 2016
Notes to the Consolidated and Separate Financial Statements
110
Group Company Related entities Relationship Nature of transactions Note 31 Dec 2015 31 Dec 2015 Due (to)/from Due (to)/from
Garden City Golf Estate Joint Loan to entity 24(b) 3,864,204 3,864,204 Development Limited venture Interest income 13 (290,839) (290,839) Management fee income 14 (74,022) (74,022) Payable to entity 32(a) (202,157) (202,157) Subscription for Investment 26(c(iii)) 271,535 271,535
ARM Trustees Limited Affiliate Loan from entity 30(a) (6,892) (6,892) Interest expense 18 1,046 1,046
ARM Life Plc Affiliate Receivable from entity 26(a) 12,525 12,525
Mixta Africa Affiliate Receivable from entity 26(a) 15,726 15,726
MIXTA Cote d'Voire Affiliate Receivable from entity 26(a) 22,911 22,911
Hospitality Management Company Affiliate Receivable from entity 26(a) 130,309 101,914
Hospitality Management Company Affiliate Payable from entity 32(a) (675) -
Oceanwinds Hospitality Limited Affiliate Loan to entity 24(a) 1,066,892 1,066,892 Interest income 13 (171,139) (171,139) Subscription for Investment 26(c(iii)) 274,082 274,082 Payable to entity 32(a) (2,661) -
Farapark Limited Affiliate Receivable from entity 26(a) 6,872 6,820 Loan from entity 30(a) (32,994) - Interest income 13 (5,470) (5,470) Payable to entity 32(a) (13,759) -
Lakowe Lakes Golf Club Limited Affiliate Loan to entity 24(a) 270,500 7,457 Interest income 13 (85,166) (1,480) Payable to entity 32(a) (94,687) (18,265) Receivable from entity 26(a) 27,971 27,971
Watford Properties Limited Affiliate Deposit for shares 29(a) (16,053,369) (15,803,369) Payable to entity 32(a) (1,101,718) (1,101,718) Loan from entity 30(b) (1,465,372) - Receivable from entity 26(a) 3,281,250 -
Townsville Properties Limited Affiliate Receivable from entity 26(a) 1,673 673 Interest expense 18 44,978 23,394 Loan from entity 24(a) (441,966) (152,322) Payable to entity 32(a) (37,824) -
New Town Receivable Affiliate Receivable from entity 26(a) 61,802 59,545
Beechwood Property Affiliate Loan to entity 23(a) 3,816 - Development Company Receivable from entity 26(a) 20,313 20,313 Interest income 13 (634) - Interest expense 18 49,020 - Payable to entity 32(a) (33,077) - Loan from entity 30(a) (338,253) (12,836)
The above receivables result from expenses incurred by the Company on behalf of the above related parties. Payables result from funds received by the Company on behalf of the related parties.

Annual Report for the year ended 31 December 2016
111
Notes to the Consolidated and Separate Financial Statements
41. Contingent liabilities
The Group is presently involved in 8 (December 2015: 6) litigation suits in the ordinary course of business. The
total amount claimed in the cases against the Group is estimated at N630,886,875 (December
2015:N64,282,206). The actions are being contested and the Directors are of the opinion that none of the
aforementioned cases is likely to have a material adverse effect on the Group. The Directors are also not aware of
any other pending or threatened claims and litigations.
42. Subsequent events
The directors have recommended the payment of 18Kobo per shares as dividend on the issued share capital of
1,683,558,000 shares of 50 kobo each for the year ended 31 December 2016 (December 2015: 50 kobo).
There are no subsequent events which could have had a material effect on the financial position of the Company
as at 31 December 2016 and the profit for the year ended on that date which have not been adequately provided
for or disclosed.

Annual Report for the year ended 31 December 2016
112
OTHER NATIONAL DISCLOSURES Value Added Statement
Group
31 December31 December
In thousands of naira 2015 % 2016 %
Gross earnings 3,172,2364,314,211
Bought in goods and services (1,226,798)(2,465,341)
Specific impairment allowance on financial assets (105,816) (83,137)
Share of profit/(loss) of equity-accounted investment (29,561)21,009
1,810,061 1,786,742
DISTRIBUTION
Employees cost 216,476 12.0 290,561 16.3
GOVERNMENT
Tax expense 104,451 17.0 291,566 16.3
RETAINED IN THE BUSINESS
Assets Replacement (Depreciation) 223,241 12.0239,180 13.4
Non-controlling interest 463,428 26.0 211,365 11.8
To pay proposed dividend 387,218 21.0 303,040 17.0
To augment reserves (219,973) 12.0451,030 25.2
1,810,061 100.01,786,742 100.0
Company
31 December 31 December
In thousands of naira 2015 %2016 %
Gross earnings 1,463,9321,830,690
Bought in goods and services (949,638)(1,401,732)
Specific impairment allowance on financial assets 16,073 (9,937)
530,367419,021
DISTRIBUTION
Employees cost 196,396 37.0 290,561 69.3
GOVERNMENT
Tax expense 104,451 19.7 35,917 8.6
RETAINED IN THE BUSINESS
Asset Replacement (Depreciation) 7,631 1.425,900 6.2
To pay proposed dividend 387,218 73.0 303,040 72.3
To deplete reserves (165,329) 31.2(236,397) 56.4
530,367 100.0419,021 100.0

Annual Report for the year ended 31 December 2016
113
Five - Year Financial Summary - Group
Group
Group Group Group GroupGroup
In thousands of naira 31 Dec 2015 28 Feb 2014 28 Feb 2013 28 Feb 201231 Dec 2016
Assets
Property and equipment 12,335,978 12,405,937 - - 11,612,648
Investment property 55,589,800 54,613,380 53,671,770 52,010,00057,575,884
Trading properties under development - - - 7,759,190 -
Equity-accounted investment 2,476,789 2,506,350 - - 2,497,798
Loans to related entities 5,204,652 4,812,002 3,780,671 4,114,6434,988,251
Trading properties 32,179,040 27,678,398 11,245,416 3,464,09132,961,970
Debtors and prepayments 9,317,543 8,445,811 10,712,701 8,724,3608,333,064
Cash and cash equivalent 848,438 2,107,529 999,578 1,452,701656,838
117,952,240 112,569,407 80,410,136 77,524,985 118,626,453
Liabilities
Deferred tax liabilities 5,510,525 5,403,120 5,308,959 5,142,782 5,701,756 Deposit for shares 31,856,738 31,856,738 16,948,980 16,948,98031,855,488
Borrowings 20,262,672 17,452,476 1,241,162 1,375,57425,166,507
Current income tax liability 2,344,456 2,202,136 1,833,255 1,782,0902,179,277
Other liabilities and accruals 19,871,368 18,078,526 19,782,497 10,549,17715,216,852
Deferred revenue-deposit from customers 9,012,103 10,183,488 5,291,007 4,906,496 7,467,146
Provisions 967,547 - - 2,334,379
Total liabilities 89,825,409 85,176,484 50,405,860 40,705,099 89,921,405
Net assets 28,126,831 27,392,923 30,004,276 36,819,886 28,705,048
Capital and reserves
Share capital 841,779 841,779 841,779 841,779 841,779
Share premium 5,819,185 5,819,185 5,819,185 5,819,185 5,819,185
Common control acquisition deficit (2,920,407) (2,920,407) - - (2,920,407)
Retained earnings 17,743,510 17,473,030 16,867,678 15,516,35818,110,362
Non-controlling interest 6,642,764 6,179,336 6,475,634 14,642,5646,854,129
Shareholders' funds 28,126,831 27,392,923 30,004,276 36,819,886 28,705,048
Group Group Group Group Group
10 months 12 months
In thousands of naira 31 Dec 2015 31 Dec 2014 28 Feb 2014 28 Feb 201331 Dec 2016
Total revenue 5,246,278 8,028,074 2,473,730 1,079,1667,344,849
Profit before income tax 1,370,344 1,454,364 2,100,929 550,4761,257,001
Profit for the year 1,070,619 977,226 1,729,491 344,771965,435
Transfer to retained earnings 607,191 891,557 1,274,308 347,731754,070
Earnings per share - Basic and diluted 36k 53k 76k 21k45k
Dividend per share 23k 20k 17k 12k18k

Annual Report for the year ended 31 December 2016
114
Five - Year Financial Summary - Company
Company
Company Company Company Company Company
In thousands of naira 31 Dec 2015 31 Dec 2014 28 Feb 2014 28 Feb 201331 Dec 2016
Assets
Property and equipment 98,144 - - -101,924
Investment in subsidiaries 31,608,026 31,608,026 31,606,776 23,264,26231,608,026
Equity-accounted investment 2,505,100 2,505,100 - -2,505,100
Loans to related entities 8,898,794 11,860,697 4,380,068 4,651,9519,764,896
Trading properties 4,566,445 3,096,787 3,352,091 3,352,0914,496,283
Debtors and prepayments 7,627,301 4,782,373 4,031,689 3,099,13314,133,133
Cash and cash equivalent 713,296 224,701 713,727 102,685 522,463
56,017,106 54,077,684 44,084,351 34,470,122 63,131,825
Liabilities
Deferred tax liabilities 9,763 - - -12,554
Deposit for shares 31,606,738 31,606,738 16,948,980 16,948,98031,606,738
Borrowings 2,937,290 3,376,255 1,084,176 860,6346,077,457
Current income tax liability 640,463 595,775 460,482 459,977414,371
Other liabilities and accruals 15,243,180 12,931,209 17,641,933 8,449,32418,838,960
Provisions - - - -166,916
Deferred revenue-deposit
from customers 126,787 84,510 117,500 44,533 882,519
Total liabilities 50,564,221 48,509,977 36,253,071 26,763,448 57,999,515
Net assets 5,452,885 5,567,707 7,831,280 7,706,674 5,132,310
Capital and reserves
Share capital 841,779 841,779 841,779 841,779 841,779
Share premium 5,819,185 5,819,185 5,819,185 5,819,1855,819,185
Common control acquisition deficit (2,156,000) (2,156,000) - - (2,156,000)
Retained earnings 947,921 1,062,743 1,170,316 1,045,710627,346
Shareholders' funds 5,452,885 5,567,707 7,831,280 7,706,674 5,132,310
Company Company Company Company Company
10 months 12 months
In thousands of naira 31 Dec 2015 31 Dec 2014 28 Feb 2014 28 Feb 201331 Dec 2016
Total revenue 935,497 915,351 729,620 925,8121,966,887
Profit before income tax 326,340 328,021 481,234 476,297102,560
Profit for the year 221,889 178,632 326,633 303,42466,643
Transfer to retained earnings 221,889 178,632 326,633 303,42466,643
Earnings per share - Basic and diluted 13k 11k 19k 18k4k
Dividend per share 23k 20k 17k 12k18k

MIXTA REAL ESTATE PLC RC.NO:645036
9th Annual General Meeting to be held at 11:00amon Tuesday June 6, 2017 at Darlington Hall, Plot CDE, Ilupeju, Lagos State
being a member/members of MIXTA REAL ESTATE PLC
Do hereby appoint
*
Or failing him the Chairman of the Meeting as my/our Proxy to vote on my/our behalf at the General Meeting of the Company to be held on Tuesday June 6, 2017
Dated the _______ day of __________ 2017 Shareholder's signature
MIXTA REAL ESTATE PLC.
Annual General Meeting admission
Please admit
To the 9th Annual General Meeting of Mixta Real Estate Plc which will be held at Darlington Hall, Plot CDE, Ilupeju, Lagos State.
IMPORTANT NOTICE:
1. The admission card must be presented by the Shareholder or his proxy in order to obtain entrance to the Annual General Meeting.
2. Shareholders or their proxies are requested to sign the admission card in the appropriate place before attending the Meeting.
ARM TRUSTEES LIMITEDCompany Secretary
THE ANNUAL GENERAL MEETING TO BE HELD AT 11:00 AM ON TUESDAY, JUNE 6, 2017 AT DARLINGTON HALL, PLOT CDE, ILUPEJU, LAGOS STATE
I/We ____________________________________* being a Shareholder/Shareholders of MIXTA REAL ESTATE PLC. hereby
appoint ____________________________________* of ____________________________________or failing him the
Chairman of the Meeting as my/our proxy to act and vote for me/us at the Annual General Meeting of Mixta Real Estate Plc.
to be held on Tuesday, June 6, 2017
Dated this ________ day of ___________, 2017
Signature ____________________________________ * Kindly fill in CAPITAL LETTERS.
Please indicate with an “X” in the appropriate column, how you wish your votes to be cast on the resolutions set out above.
PROXY FORM
ADMISSION FORM

Back of Proxy Form

RESOLUTIONS For Against
ORDINARY BUSINESS
1. To receive the Audited Financial Statements for the year ended December 31, 2016 and the Reports of the Directors and Auditors thereon.
2. To declare a Dividend.
3. To re-elect Directors.
4. To authorize the Directors to fix the Remuneration of the Auditors.
5. To elect members of the Audit Committee.
Please indicate with an “X” in the appropriate column, how you wish your votes to be cast on the resolutions set out above.
This proxy form should NOT be completed and sent to the registered office of the Registrar if the member would be attending the Meeting in person.
NOTES
1. A member (shareholder) who is unable to attend an Annual General Meeting is allowed to vote by proxy. This proxy
form has been prepared to enable you exercise your vote if you cannot personally attend. All proxy forms should be
deposited at the registered office of the Registrar (as stated in the notice) not later than 48 hours before the meeting.
2. Provision has been made on this form for the Chairman of the Meeting to act as your proxy, but if you wish you may
insert in the blank space on the form (marked *) the name of any person, whether a member of the Company or not,
who will attend the Meeting and vote on your behalf instead of the Chairman of the Meeting.
3. In the case of joint shareholders, any of them may complete the form, but the names of all joint shareholders must be
stated.
4. If executed by a corporation, the proxy form should be sealed with the common seal or under the hand of some officers
or an attorney duly authorized.
5. The proxy must produce the Admission form sent with the Report and Accounts to obtain entrance at the Meeting.
IF YOU ARE UNABLE TO ATTEND, PLEASE DO THE FOLLOWING:
a. Write the name of your proxy (if any) where marked *
b. Ensure that the form is signed by you
c. Tear the proxy Form along the perforated lines and post so as to reach the registered office of the Registrar not later than
48 hours before the time of holding the Meeting.

Back of Proxy Form

Annual Report for the year ended 31 December 2016
MIXTA REAL ESTATE PLC - List of Unpaid Dividend
1 (ADMORS TO THE ESTATE OF ADEBANJO ADENIYI OLAIDE OLAIDE
ESTATE OF ADEBANJO ADENIYI OLAIDE
2 ABAMIC RESERVES LIMITED
3 ABAYOMI OKURIYIKE AJOSE-ADEOGUN
4 ABDUL GANIYU ATANDA SAKA
5 ABDULAZEEZ ADEMOLA TAIWO OYEDELE
6 ABDULHAREEM EKHA AILEOBINI
7 ABF RESOURCES AND INVESTMENT LTD
8 ABHULIMEN OHIKU
9 ABIEYUWA IMASEKHA
10 ABIMBOLA JANET DADA
11 ABIMBOLA ODUMOSU
12 ABIODUN ADELOWO ADESOLA
13 ABIODUN SOSAN NIGEL
14 ABIOYE ADELEKAN
15 ABISOLA KAMSON
16 ADA OKWUOSA
17 ADEALAFIA JIBOWU
18 ADEBAYO ADELOWO ADEMILUYI
19 ADEBAYO ADETUNJI ADELEKE
20 ADEBISI FLORA AJAYI
21 ADEBISI JOSEPHINE SOLA-ADEYEMI
22 ADEBISI OLABISI
23 ADEBOLA ADEFOPE
24 ADEBOWALE OMOTAYO MORGAN
25 ADEBOYE TAIWO ONIWINDE
26 ADEBUKOLA ADEKEYE
27 ADEDEJI OLUWASEUN AGBOADE
28 ADEDOTUN OLUWATOSIN ADEFOPE
29 ADEDOYIN APINKE COKER
30 ADEGBOYEGA ADEBAJO
31 ADEKUNLE SHODUNKE
32 ADEKUNLE SHODUNKE
33 ADENIKE BOLANLE AKINSEYE
34 ADEOLA ABOSEDE AJIBADE
35 ADEOLA ADEYI
36 ADEREMI ALABI OJO
37 ADERONKE OLUWATOBI ADEBISI
38 ADERONKE OYEYEMI ADEYEMI
39 ADESINA MOFOLUWASO & TITILOPE
119

Annual Report for the year ended 31 December 2016
List of Unpaid Dividend
40 ADESOLA MAMUKUYO
41 ADESOLA OLUWASEUN AKINOLA
42 ADESUA OMOLEGHO ADEWOLE
43 ADETOKUNBO AYOOLA ADETOLA
44 ADETOLA ADEWALE AKINSULIRE
45 ADEYEMI MISBAU SUARA
46 ADEYEMO CUDJOE ALAKIJA
47 ADEYOJU PETER AIKU
48 ADIC INSURANCE PLC
49 ADIGUN ADEMOLA
50 AFOLABI ISRAEL ANIBABA
51 AFOLABI OGUNTADE
52 AGHARINMA EHIEDU
53 AHAMEFULA IGBOKWE
54 AHMED ADESEGUN SULE
55 AHMED JODA
56 AISHA SHAMSUNA AHMED
57 AKHERE PHILIP OMONFOMAN
58 AKINOLA AFOLABI AKINBOBOYE
59 AKINPELU ASALU
60 AKINWALE GBENGA OGUNLEYE
61 AKPIFO ONOME OHWOVORIOLE
62 ALBERT OLUMIDE LAWSON
63 ALICE .O. KAY
64 ALICE OLORUNYOMI
65 ALOY CHIFE
66 AMINAT ADEBUNKUNOLA ADAMS
67 AMINAT GBAJABIAMILA
68 AMOKE ONITIJU
69 ANANABA IBEABUCHI
70 ANGEL PARIOLA
71 ANGELA EZINWANYI CHIKE-DIKE
72 ANTHONIA O. DUROJAIYE
73 ANULIKA EDE
74 ARIT O ANNAM (MINOR)
75 ASMAU GOGO ONIYANGI
76 ATOLOYE OLOLADE
77 AUGUSTINE & OLUSOLA OKERE
78 AUGUSTINE OKOCHA
79 AXIAL NIGERIA LTD
80 AYANWOLE SIKIRU ALLI
120

Annual Report for the year ended 31 December 2016
List of Unpaid Dividend
81 AYOBOLA OLUWAFEMI ABIOLA
82 AYODEJI OLADUNNI
83 AYODEJI OMOTOSO
84 AYODELE KOFI SAGOE
85 AYODELE PATRICK AKINWUNMI
86 AYOKUNLE EBENEZER ADESINA
87 AYOOLA ADISA
88 AYUBA RAMADAN
89 AZUKA ANDRE ONIANWA
90 BABAJIDE AYOBAMI BABALOLA
91 BABAJIDE OLUSOLA OGUNTOLA
92 BABAMAYOWA AMOO
93 BABATOPE AYODELE OMODELE
94 BABATOPE GBENGA OGUNNOWO
95 BABATUNDE OPEYEMI OJO
96 BABATUNDE SALAMI AKINDELE
97 BABATUNDE SOTUNDE
98 BABATUNDE TIJANI FOLAWIYO
99 BALOGUN GAFAR OLOLADE ERINFOLAMI
100 BANJI OLANIYAN
101 BANKOLE SAIDI
102 BARNABAS INYAWEBOWE ARASTUS
103 BASHIR GBOLAGADE ADEBAYO
104 BASHIR UMAR SULE
105 BENSON AJAYI
106 BERNARD CHIDOZIE EJIM
107 BIMSUKA INVESTMENTS LTD
108 BIODUN EBUN ADEFILA
109 BISIKE OBIOHA UBA
110 BLESSING AONDONA-ATE
111 BLUESTONE CAPITAL NIG LTD
112 BOLARINWA OLUGBENGA OSIYALE
113 BOLUTIFE OLUBUKOLA FOLASADE ADEFEHINTI
114 BOMMO INTERNATIONAL NIG LTD
115 BOSE OTUFOWORA
116 BOSEDE ABIODUN FAGBOYEGUN
117 BROWNSON OBARIDOA OBELE
118 BUNMI ALABI
119 BUNMI ALLINSON
120 CAPGEMINI INVESTMENTS LIMITED
121 CASMIR ANYANWU
121

Annual Report for the year ended 31 December 2016
List of Unpaid Dividend
122 CHARLES AKUNNA
123 CHIBUEZE F NDUDIRIM
124 CHIBUZO IVENSON
125 CHIDIEBERE VICTOR OKPARA
126 CHIEDOZIEM NDUDIRIN
127 CHIJI OKORONKWO
128 CHIMEZIE ANOCHIE
129 CHINEDU DESMOND OZOEKWO
130 CHINEDU JEFFREY OKPALLA
131 CHINEDU OREOLUWA ALAKE
132 CHINEDUM CHIKA EWUZIE
133 CHINENYE NWAOGO CHUKWU EJIM
134 CHINNEZE THOMAS ORAGWU
135 CHINYERE BEATRICE IWUAJOKU
136 CHINYERE DOZIE
137 CHRISTIAN CHUKWUEMEKA OKALLA
138 CHRISTIAN OKECHUKWU EBBI
139 CHRISTOPH ETIM
140 CHRISTOPHER ANUNAGBA
141 CHRISTOPHER OGBONNAYA UKAH
142 CHUKA NZEKA
143 CHUKWUDI PHILIP UME-EZEOKE
144 CHUKWUEMEKA AKINTOMIDE ALAKE
145 CHUKWUEMEKA CHIAGOZIE ELUCHIE
146 CHUKWUEMEKA PATRICK NGENE
147 CHUKWUNOMNSO EDMOND IWUALA
148 CHUKWUNONSO ANGELINA UME-EZEOKE
149 CHUX UGWUEGEDE
150 CLEMENT OBINWANNE CHUKWU
151 COOPLAG/ OLANIYAN OLAYINKA SHELL
152 COSMAS OKECHUKWU EZEANOWAI-OBIEZU
153 D.E. ODIBA
154 DAISY OMOYEMWEN EBE
155 DANIEL CHINEDUM ILO
156 DANIEL U ANNAM (MINOR)
157 DAVID OLALEKAN SOMORIN
158 DAVID OLUWANIYI BAMISHILE-RICHARDS
159 DAVID OYEH EGBEJULE
160 DEBO DINA
161 DEBORAH AJOKE OLAGUNJU
162 DEJI TUNDE-ANJOUS
122

Annual Report for the year ended 31 December 2016
List of Unpaid Dividend
163 DIVINE NOBLE FAITH VENTURES
164 DOKPE OHONMOIME AKELE
165 DONALD OKORIE ONUOHA
166 DONNA OSASUMWEN AIMIUWU
167 DORIS OMERESAN BAJAH
168 DOYIN OLAJIDE
169 E.O. OLAWALE
170 EBENEZER OLUFEMI IDOWU
171 EHINMIGBAI OTOIDE OHIWEREI
172 EKAETTE KINGS ITUEN
173 EKENE NDIDI OMALIKO
174 EKUNDAYO OLUROTIMI AYORINDE
175 ELAM ENOCH
176 EMEKA AKUNYIBA
177 EMEKA OLATUNJI AJAYI
178 EMILY GREEN-NWODIM
179 EMMANUEL ADEGBITE
180 EMMANUEL AKOMAYE
181 EMMANUEL EZE
182 EMMANUEL OKECHUKWU ANYANWU
183 EMMANUEL OLUFEMI ADEWALE
184 EMMANUEL ROBSON
185 ENIOLA OLUFISAYO FATOGUN
186 ENITAN ONABAMIRO
187 ESURU AHANEKU
188 EUNICE NWOWU
189 EVELYN EGHOGHO EMUH
190 EYITAYO DAN-MUSA
191 EYITAYO JNR ILORI
192 F.M. IBIROGBA
193 FADIPE AYODELE BABATUNDE
194 FATAI LANRE TIJANI
195 FELIX ADEOLU AKINSANYA
196 FEMI OLADEHIN
197 FEYI OLUSANYA
198 FLORENCE OGECHI OKOLI
199 FOLASADE RANDLE
200 FRIDAY NOSA OMOREGIE
201 FUNKE PETERS
202 FUNLOLA KUPOLATI
203 FUNSHO GBOLAHAN
123

Annual Report for the year ended 31 December 2016
List of Unpaid Dividend
204 GABRIEL ADETOLA OKUNUBI
205 GABRIEL CHIDIEBERE CHUKWUKERE
206 GANIAT ADETUTU SIYANBOLA
207 GANIYU AMOO KOLAWOLE
208 GARBA FATIMA ALIYU
209 GENESIS 1 SCULPTURE ENT
210 GENITY LTD
211 GEORGE IKECHUKWU NWANKWO
212 GEORGE OLUMUYIWA ABOABA
213 GHEYSEN REAL LIMITED
214 GIDEON OLUWASEGUN ADEGBITE
215 GODSON ODITA
216 GOLDEN UMBRELLA GLOBAL SERVICES LTD
217 GOSEN INTERNATIONAL AGENCIES LTD
218 GRACE AWANI ALELE-WILLIAMS
219 GREGORY ONYEBUCHI OCHADA
220 GREGOWA GOUCHOEKPON
221 HABEEBULLAH OLORUNNISHOLA MUTAIRU
222 HAFSATU ABDULLAHI
223 HALIMA NYAKO
224 HALITA ALIYU
225 HARLEQUIN INVESTMENTS LIMITED
226 HAWKSWORTH INVESTMENT LIMITED
227 HEINEKEN LOKPOBRI
228 HENRY CHIDI IKPA
229 IBIKUNLE JOSEPH MARINHO
230 IBITROKO S-DOUGLAS
231 IBIYOSOLA OLADUNKE OGUNDAIRO
232 IBUKUN OLUGBENGA OPEODU
233 IDORENYIN OBOT
234 IFEANYI OBUA
235 IFEDEYI OLA-SHODUNKE
236 IFEJESUDAMISI EBUNJESU DAPO-MAKANJUOLA
237 IFEJOLAADE OLA-SHODUNKE
238 IFEYINWA MAUREEN ANOCHIE
239 IGHOJOVBE WINIFRED OGHENEKARO
240 IGNATIUS ODO EZEJA
241 IJEOMA ONWUKA
242 IKECHUKWU BONIFACE OZOH
243 IKECHUKWU EZEKIEL OKOLI
244 IKONMWOSA CLARA OKORO
124

Annual Report for the year ended 31 December 2016
List of Unpaid Dividend
245 INA ROSE EBONG
246 INAM AKPADIAHA MR WILSON
247 INIOLUWA OLA-SHODUNKE
248 INNOCENT EZE
249 ISAAC OLUWOLE SHONGOTOLA
250 ISAIAH ADEBAYO OKUNLOLA
251 ISIOMA LAWAL
252 ISYAKU UMAR
253 IYABO MOHAMMED
254 IYABO ODUTOLA
255 J.O. OYEFESO
256 JACOB ESAN
257 JAMILA MOMODU-MUSA
258 JESUTOFUNMI ADEYEMI
259 JOHA GLOBAL SOLUTION
260 JOHN IKIMALO
261 JOHN IRONTA
262 JONATHAN AYO SANYAOLU
263 JOSEPH MOTUNRAYO OGUNSANWO
264 JOSEPH ONUORA ESEKA
265 JOSEPH OSUNTOLA ILORI
266 JOSEPH OYETUNDE OYEWOLE
267 JOSHUA OKIREMUTE OGBIMI
268 JUDE EDEMA AWANI
269 JULIET OGECHUKWU NNOKA
270 JUMOKE OGUNDARE
271 JUMOKE OLUYEMISI ODUNSI
272 JUMOKE OSHOSANYA
273 JUSTICE MUSA GARBA
274 KALU ABOSI
275 KAMAR AZEEZ
276 KAREEM ADISA AGODI
277 KAYLOPE COY LTD
278 KAYODE AKINKUGBE
279 KAYODE ODETOLA
280 KAYODE ODUWOLE
281 KAYODE OLADELE FALOLA
282 KEHINDE ADETOLA AKINSANYA
283 KEHINDE MULIKAT OMOLABAKE MUSA
284 KEHINDE OLUSEGUN ONIWINDE
125

Annual Report for the year ended 31 December 2016
List of Unpaid Dividend
285 KEHINDE OYELEKE
286 KEHINDE PAUL LASISI
287 KEMI ADENIRAN
288 KEMI OLUWASHINA
289 KIKELOMO CHRISTY AKINLUYI
290 KIRTAP (HOLDINGS) LIMITED
291 KOFOWOROLA ADEDAMOLA MAJEKODUNMI
292 KOLAWOLE FRANCIS AREGBESOLA
293 KOTHARI VASANT
294 KUNLE-SALAMI AYOBAMBO & SALAMI OLOLADE
295 LARRY CHIEDU NWABUDIKE
296 LASAT ENTERPRISES
297 LATEEF ADELEKE OYEWUMI
298 LATEEF OGUNSOLA
299 LAWAL DANLADI YARO
300 LEAD CAPITAL LIMITED
301 LEKE BABATUNDE AKINROWO
302 LENBOROGGH BUSINESS CONCERN LTD
303 LILLIAN CHIDI-EZIRIM
304 LION BUILDINGS LIMITED
305 LOLA AKINLEYE
306 LOVE ONYEJIZURU UTOMI
307 LOVETH ADANNA AGUWA
308 MABEL EHIOSU EDENARU
309 MADUEKE CECILIA
310 MALLAM MIKAIL SHEHU
311 MANNIRA BUHARI
312 MARGARET NWAKANMA MONYEH
313 MARKSON TARIBO
314 MARY KEHINDE LADEJO
315 MARYAM SULEIMAN
316 MASTERMINDS GLOBAL RESOURCES LTD
317 MATTHEW OKPERE
318 MAYOWA OLATOYE
319 MELIE NNAMDI
320 MG RESOURCES LTD
321 MICHAEL FATUNBI
322 MICHAEL OGBONNAYA OJI
323 MICHAEL OGUNBIYI
324 MICHEAL OLUTAYO ABAYOMI
325 MIKE TYONONGU KOHOL
126

Annual Report for the year ended 31 December 2016
List of Unpaid Dividend
326 MODUPE & BABATUNDE OKOH
327 MODUPEOLA IRELE
328 MOHAMMED AGEFU YAHAYA
329 MOHAMMED KUDU SANTURAKI
330 MOHAMMED LAWAL ALIYU
331 MOHAMMED SANI ALHASSAN
332 MOJISOLA FOLUKE EDUN
333 MORAYO MAKANJUOLA
334 MOSHOOD OLUSEGUN MOGAJI
335 MR& MRS V.O.DANIA
336 MURTALA USMAN
337 MUSTAPHA OLUSOLA OLADUNJOYE
338 MUTIU ADEMOLA BALOGUN
339 N EUCHARIA NDUDIRIM
340 NAJEEM KAYODE ADEWUYI
341 NAOMI AMARACHUKWU EMMANUEL IKE
342 NASIRU SHEHU SIDI
343 NATHANIEL OYINKURO OPUZI
344 NDIDI EDOZIEN
345 NDUBUISI ALUGWE
346 NGONZI NWANKWO
347 NGOZI HELEN CHUKELU
348 NGOZICHUKWUKA ANDREW OBURO
349 NICHOLAS NWALOZIE NNEJI
350 NIKE OLOWOKANDE
351 NJIDEKA ROSEMARY NWOSU
352 NKECHI ROSEMARY IWEGBU
353 NKERIRUKA FAVOUR EZE
354 NKIRU OGOCHUKWU OBINMA
355 NNAMDI CHARLES OKORO
356 NNAMDI CYRIACUS ONYEBUCHI
357 NOBLE FAITH CATERERS
358 NOJEEM OLALEKAN POPOOLA
359 NOSAKHARE EHIGIE
360 NSE / CSCS MULTI PURPOSE CO-OPERATIVE
SOCIETY
361 NSE-ABASI OLUGBENGA
362 O. OGUN
363 OBAFEMI AWOYEMI
364 OBERHIRI EREME THERESA
365 OBIANUJU NADINE EZENACHUKWU
127

Annual Report for the year ended 31 December 2016
List of Unpaid Dividend
366 OBINNA AYODIPUPO ALAKE
367 OBINNA BENJAMIN OMOEJE
368 OBISESAN LEWIS OGUNLEYE
369 OGO AGUSIOBO
370 OGOCHUKWU SYLVIA EKEZIE
371 OKIEMUTE GLORIA OHIWEREI
372 OLABISI NURUDEEN GINIGBIH
373 OLADAPO AKINRO
374 OLADAPO OLUSOLA AKINSANYA
375 OLADEJO ADEBOLA FABOLUDE
376 OLADIPO BABATUNDE BAJO
377 OLADIPO FOLABI OSENI
378 OLAEISI ADEDIGBA
379 OLAFEMI ESTHER AGBOOLA
380 OLAIDE OLUWATOYIN OLUSOJI-OKE
381 OLAITAN ODUNUGU OMOLOLA
382 OLAKUNLE OLUKAYODE AROMIRE
383 OLALEKAN OLADIPUPO FAGBUYI
384 OLAMIDE OLUWATOSIN OLOWU
385 OLANIKE TOLULOPE ADEDIRAN
386 OLANIYI ADENIYI
387 OLANIYI AKINADE AKINOLA
388 OLANIYI OLAJIDE
389 OLANREWAJU BAMIDELE OYEWOLE
390 OLANREWAJU FATAI IBRAHIM
391 OLANREWAJU OLUBUKOLA FAGBIRE
392 OLATAYO DOLAPO TALABI
393 OLATUNBOSUN AYOTUNDE OKE
394 OLATUNDE BAYO BALOGUN
395 OLATUNDE SHONEKAN
396 OLAYINKA MODUPE ONASANYA
397 OLISAELOKA EMMANUEL EZENACHUKWU
398 OLOYEDE FAGBEMI
399 OLUBAYODE ABIMBOLA AGBI
400 OLUBUNMI MAMUKUYO
401 OLUBUNMI OLUYEMISI ADELEYE
402 OLUDOTUN BABATUNDE FADIPE
403 OLUFEMI POPOOLA
404 OLUFUNKE ESTHER AMOS
405 OLUGBENGA AKINTUNDE AKINYOMBO
406 OLUGBENGA DAIRO
128

Annual Report for the year ended 31 December 2016
List of Unpaid Dividend
129
407 OLUGBENGA OLADIPUPO ISMAIL
408 OLUGBENGA OLUROTIMI SADIPE
409 OLUKEMI ADENIJI
410 OLUKEMI SUSAN SOWEMIMO
411 OLUMIDE AKINTERINWA
412 OLUMUYIWA OYEWOLE
413 OLUREMI OLORUNYOMI
414 OLUSEGUN ABEL AKINBODE
415 OLUSEGUN OSIFO AKPATA
416 OLUSEGUN OYEKANMI VETIVA NOMINEE
417 OLUSESAN AYODELE ALAKE
418 OLUSEUN ODUWOLE
419 OLUSHOLA ISMAIL
420 OLUSHOLA OMOWUNMI ADEWUNMI
421 OLUSOLA OLURANTI OGUNNOWO
422 OLUTOSIN CHARLES LADEJO
423 OLUTUNDE ADEYANJU FADAIRO
424 OLUWABUNKUNMI AKINSEYE
425 OLUWAFEMI ABIODUN ADEWOYE
426 OLUWAFEMI FRANCIS DANIEL OGUUNBI
427 OLUWAKEMI ADETOUN POPOOLA
428 OLUWAKEMI FARINDE
429 OLUWAMODUPE EBENEZER FAMUREWA
430 OLUWAPELUMI OSIBEMEKUN
431 OLUWASEUN FALEYE
432 OLUWASEUN SUNDAY POPOOLA
433 OLUWASEYI SOLOMON OWO
434 OLUWATOFUNMI AMINU
435 OLUWATOSIN LAWANI
436 OLUWATOSIN OPEYEMI ATOBATELE
437 OLUWATOYIN VICTORIA IRIABE
438 OLUWOLE ADEGORIOYE ADEDIRAN
439 OLUWOLE JEREMIAH TOKODE
440 OLUYEMI BABATUNDE SONEYE
441 OMOBAYODE OLUWASEUN KETIKU
442 OMOLARA EBELE ANUWE
443 OMOLEGHO OJEIKERE
444 OMOLOLA ELENITOLA-JOHNSON
445 OMOLOLA OLUWABUNMI OMOTOLA
446 OMOSALEWA MORIAMO AJIBOLA
447 OMOTOPE ODUNAYO OGUNNOWO

Annual Report for the year ended 31 December 2016
List of Unpaid Dividend
130
448 OMOWONUOLA.O & BABAJIDE .T ALABI
449 OMOWUNMI GANIAT MAFOLABOMI
450 OMOWUNMI OYINKANSOLA MAJEKODUNMI
451 ONABANJO S ONASANYA
452 ONIWINDE OLUYOMI
453 ONUBOGU MOSES ONOH
454 ONYEMACHI MICHAEL ONYENWENU
455 ONYEN ADEJO ALICE
456 OPE OLOMO
457 OPEYEMI HELEN ADEWUNMI
458 ORITSEWEYIMI ANDREW ESISI
459 OSAGHAE COLLINS AKHABUE
460 OSAGIE ESEOGHENE HARRISON IMASUEN
461 OSAHON OGEIMUDIA
462 OSAMWONYI EMMANUEL EHIGIE
463 OSASUMWEN EZEKIEL
464 OSAYUWARE EREBOR
465 OSEMENKHIAN CYNTHIA ONYECHERE
466 OWHOLOGBO DANIEL EMEKENE
467 OWOLABI BUSHURA OLOKO
468 OWOLABI HAKEEM AIBANA
469 OYEWOLE TIMOTHY ADUNOYE
470 OYEYEMI JULIUS SHODIMU
471 OYINKAOSOLA SONUGAOYE
472 PATRICK IYAMABO
473 PAUL IJIOMA TARIBO
474 PAULINUS CHIKWENDU OJUKWU
475 PAULKER EMMANUEL
476 PETER MMADUABUCHI EZEONYE
477 PROFESSOR A.BABATUNDE OBILANA
478 RAHMAT AZUMI MUSA
479 RASAQ ADEAGBO ADELE-ADEWOLE
480 RASHEED ORIYOMI ARIJE
481 RASHEED TAIRU
482 RASHEED YUSUF
483 RASHEEDAH BOLARINWA OBA
484 REIM BODUNRIN
485 REMI KAY
486 REX OKORIE OKIKE
487 RILWAN ABIODUN ADELAKUN

Annual Report for the year ended 31 December 2016
List of Unpaid Dividend
131
488 ROLI MAY AROMIRE
489 ROTIS NIGERIA LIMITED
490 SADIQ MOHAMMED
491 SAIDI OLADIMEJI RAJI
492 SALAG LIMITED
493 SAMSON OLUSEGUN PASTOR OLAGOKE
494 SAMUEL ABAYOMI AKINSETE
495 SAMUEL AGBESE AGBESE
496 SARAH CHINWENDU IKE
497 SEBATIAN NDULUE NWOSU
498 SEGUN OKUBANJO
499 SHAMSUDEEN ADEMOLA GIWA
500 SHARFUDDEEN ZUBAIR MAHOUD
501 SIMON PETER OGOCHUKWU EBOH
502 SIMPLEX SYSTEMS ENTERPRISES
503 SODY PETERSIDE
504 SOLA ALIU
505 SOLOMON N CHUKWUEBUKA
506 STANLEY OFONAGORO
507 STANLEY OWORUA OLOGE
508 STELLA ITEMIMIE EZENACHUKWU
509 STEPHEN ABAYOMI ALABI
510 STOCKOGEST NIG. LTD
511 SUNDAY ALADE
512 SUNDAY YUSUF
513 SUNNY ANOSIKE
514 TAIWO ADEWALE ADELEYE
515 TAIWO ADEWUNMI ONIWINDE
516 TAIWO MAYUKU
517 TAIWO OLUDAMILARE SHITTU
518 TAIWO OMOTAYO
519 TAJUDEEN OLAWALE RABIU
520 TAOFEEK TAIWO GIDADO
521 TEMITAYO ADEPOJU
522 TEMITOPE WAHEED OSHIKOYA
523 TERRY OMATSOLA OKORODUDU
524 THEOPHILUS AYO JAMES OGUNBIYI
525 THEOPHILUS OYEBISI ADEGBOYE
526 THERESA NWEDE AGBABUNE

Annual Report for the year ended 31 December 2016
List of Unpaid Dividend
527 THOMPSON J OBI
528 TITILAYO SHOLUMADE
529 TOKUNBO OLORUNSHOLA OLUMEYAN
530 TOLU ADETUGBO
531 TOLULOPE OLAMIDE OLAJUMOKE ONAJIN
532 TOSIN ODUNSI
533 UCHE AZUBUIKE
534 UCHE CHIWETALU
535 UCHENNA JOSEPH OHAGWU
536 UCHENNA VIVIAN OKOLO
537 UFUOMA ADASEN
538 UKEJE MR & MRS
539 UTO IHEKWUMERE
540 UZOAMAKA ZEBLON NWAEJI
541 UZOHO MAUDLINE
542 UZOMA NNAEMAKA CHUKWUEMEKA
543 UZONDU MARCELLINIUS UGOCHUKWU
544 VALETINE CHUKWUEBUKA AMADI
545 VETIVA NOMINEES A/C IMPACT INVESTMENT CLUB
546 VETIVA NOMINEES A/C VIMP 1083
547 VETIVA NOMINEES A/C VIMP 1143
548 VGARDEN INVESTMENT LTD
549 VICTORIA OLUDAMILOLA OTUDERO
550 VIRGINUS BAKEL
551 VITALIS CHUKWUEMEKA DURU
552 VIVIAN A IKEM
553 VIVIAN CHIOMA IKEOKWU
554 WASIU AKOLAWOLE BELLO
555 WASIU BABATUNDE ADEJARE
556 WILLIAMS CHIDOZIE OLUGHU
557 WURAOLA OLAWUMI SALAMI
558 YEKINI OLAREWAJU AJADI
559 YEMI ADEGBOYE
560 YETUNDE OLAJUMOKE AKINLOYE
561 YINKA OGUNSULIRE
562 YINKA ONIWINDE
563 YUNUS OLALEKAN SALIU
564 ZAID AYODEJI KOLAWOLE
565 ZUBIEDAT BOLARIN BIOBAKU
132

At Mixta, we are
building communities
across Nigeria where
you and your loved ones
can live, work, and play.
www.mixtafrica.com