annual report - heijmans
TRANSCRIPT

01Heijmans Annual Report 2020
PROFILE
A N N U A L R E P O R T

It is one of the busiest bus routes in Eindhoven: the Montgomerylaan. To solve problems at the crossroads, Heijmans constructed a grade separated intersection, complete with a light artwork to act as a landmark. Together with Signify and Heijmans, designer Frank Tjepkema built ‘the Swarm’, a flock of 700 birds taking flight that travel along with the road users.
A N N U A L R E P O R T
ANNUAL REPORT

Reinforcement of the Lauwersmeerdijk (dyke), Friesland

Operationalisation & resultKPIs for eight themes, reporting | Secondary indicators (mandatory)
Inpu
tO
utpu
tO
utco
me
Bus
ines
s m
odel
Feedback loop
About Heijmans Mission | Vision | Executive Board | Key figures | The Heijmans share
Market analysisTrends in the market | Stakeholder analysis | Material aspects | Value creation
ImpactContribution Sustainable Development Goals
Strategic operationalisationStrategy 2023: three pillars, eight themes
Better Foundation
Smarter Differentiating potential
Sustainable License to operate
• Safety • Risk management &
process improvement • Quality of the
organisation
• Digitalisation• Production
technology
• Energy • Materials• Space
Embe
ddin
g Co
rpor
ate
gove
rnan
ce &
risk
man
agem
ent
HEIJMANS AT A GLANCE

1. Foreword 06 2. Profile Heijmans 12 3. The management 16
4. Key figures 20
5. The Heijmans share 26
6. Sector developments and trends 34
7. In dialogue with stakeholders 42
8. Material aspects 48 9. Value creation 54 10. Strategy 58 10.1 Better 59 10.2 Smarter 71 10.3 Sustainable 74
11. The year in review per business area 82
12. Financial results 96
13. Sustainable Development Goals 110 14. Corporate Governance 114 14.1 Report of the Supervisory Board 114 14.2 Corporate governance 122 14.3 Conduct and integrity 125 14.4 Risk management 128
15. Financial statements 139
16. Appendices 222 16.1 Appropriation of result 223 16.2 Statement by the Executive Board 224 16.3 Risk matrix 225 16.4 Independent auditor’s report 233 16.5 Assurance report by the independent auditor 240 16.6 Remuneration report 243 16.7 Other appendices 251 16.7.1 Heijmans Share Administration Trust 251 16.7.2 The Heijmans Preference Share Trust 254 16.7.3 Reporting methodology 255 16.7.4 KPI table 256 16.7.5 GRI Standards: general disclosures 261 16.7.6 Management Approach 262 16.7.7 GRI Standards: specific disclosures 264 16.7.8 EU Directive 265 16.7.9 Sustainable Development Goals 266 16.7.10 Human rights 270 16.7.11 Fiscal policy 270 16.7.12 Heijmans BIM ladder 273 16.7.13 Heijmans bold statements 274 16.7.14 Overview legal structure 274 16.7.15 Glossary of terms 275 16.7.15 Abbreviations 277
The Report of the Executive Board as referred to in Part 9 of Book 2 of the Dutch Civil Code comprises sections 3. The Management, 4. Key figures, 5. The Heijmans share, 8. Material aspects, 9. Value creation model, 10. Strategy, 11. The year in review per business area, 12. Financial results, 14. Corporate Governance and appendices 16.1, 16.2, 16.7.8 and 16.7.10.
CONTENTS
06 Heijmans Annual Report 2020
FOREWORD
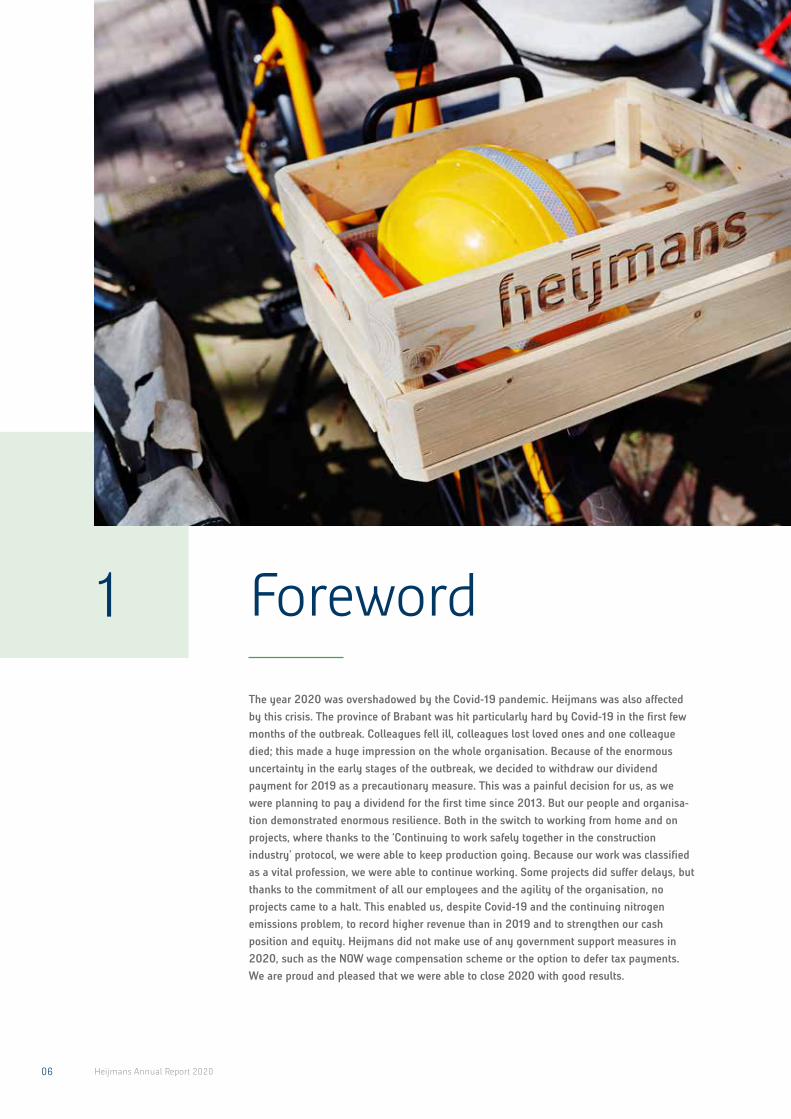
1 ForewordThe year 2020 was overshadowed by the Covid-19 pandemic. Heijmans was also affected by this crisis. The province of Brabant was hit particularly hard by Covid-19 in the first few months of the outbreak. Colleagues fell ill, colleagues lost loved ones and one colleague died; this made a huge impression on the whole organisation. Because of the enormous uncertainty in the early stages of the outbreak, we decided to withdraw our dividend payment for 2019 as a precautionary measure. This was a painful decision for us, as we were planning to pay a dividend for the first time since 2013. But our people and organisa-tion demonstrated enormous resilience. Both in the switch to working from home and on projects, where thanks to the ‘Continuing to work safely together in the construction industry’ protocol, we were able to keep production going. Because our work was classified as a vital profession, we were able to continue working. Some projects did suffer delays, but thanks to the commitment of all our employees and the agility of the organisation, no projects came to a halt. This enabled us, despite Covid-19 and the continuing nitrogen emissions problem, to record higher revenue than in 2019 and to strengthen our cash position and equity. Heijmans did not make use of any government support measures in 2020, such as the NOW wage compensation scheme or the option to defer tax payments. We are proud and pleased that we were able to close 2020 with good results.

07Heijmans Annual Report 2020
FOREWORD
It is not a given that this will continue, as a lot will depend on how the situation develops in the Netherlands. The nitrogen emissions issue is still causing delays, mainly in tenders for major infrastructure projects. Delays in the execution of our projects have so far been limited. In addition to the nitrogen emissions problem, Covid-19 is expected to remain an external factor that will affect our sector in 2021; it will be some time before we can return to normal. Covid-19 makes great demands on society as a whole, and we are also seeing how this is affecting our own people.
We have managed to bring our projects much more under control in recent years. Our appointment of a Chief Risk Officer is paying off and we have seen a sharp increase in risk awareness in our project teams. Thanks to Heijmans’ robust financial performance, we are now seen in the market as a reliable partner and an attractive employer.
Safety Heijmans continues to devote attention to safety. In 2020, the number of accidents we recorded was the same as in the previous year. However, with 50 accidents in the first half of the year and 35 in the second half, we believe we have turned a corner, partly thanks to our safety policy. The IF figure rose from 3.3. to 3.7. Our ambition remains 0 accidents and safety remains our first priority. Our employees know the rule: ‘We work safely or we don’t work’ and the Safety Ladder is now embedded at every level of the organisation. All business units are at step three and a large part of Infra is already at step four. At step four, people think proactively about safety, and the rest of the organisation will have to take that step in the coming years. The GO! (‘No Accidents) Compass helps to clarify parameters and individual roles in our discussions with employees.
When safety is your number one priority, it is even more painful when things go very wrong. The accident with the construction crane in Katendrecht in February had a major impact on everyone involved. The crane operator's uncertainty about the little boy who waved at him every
Our mission is to create a healthy living environment. We do this by working better, smarter and more sustainably every day, with a long-term view.
day from a bay window and whom he no longer saw after the accident was indescribable. Fortunately, there were no physical injuries, although there was a lot of material damage and it had a huge impact on those involved. It was a very serious situation and a number of people were unable to enter their own homes for a prolonged period. We devoted a great deal of attention and energy to our efforts to help local residents, keep them informed and allay their fears of further disasters.
Calling each other out Heijmans stands for a healthy living and working environment. Everyone who works for us must feel safe and secure. We see society as a whole becoming increasingly individualistic and harsh, which manifests itself in things like bullying and intolerance. There is no place for this at Heijmans. We are result-oriented, but we believe cooperation and trust are essential elements on this front. This is why an open culture, one in which we can call each other to account for our actions is essen-tial, and we devoted extra attention to this over the past year. It is only when we can call each other out that we

08 Heijmans Annual Report 2020
FOREWORD
know what is going on and we can change things. In these times when we see each other much less, it is a major challenge to maintain the feeling of working together and being together. One of my biggest concerns is that we are losing social cohesion. In response to Covid-19, we saw the rapid emergence of new forms of working, and they were successful. Working from home is now commonplace for many. The downside is that a lot of nuance and body language is lost in online interactions. It is important to remain aware of this, also in the future.
Portfolio development Our mission is to create a healthy living environment. We do this by working better, smarter and more sustainably every day, with a long-term view. In recent years, Heijmans has implemented a number of internal changes and made some clear choices, which meant the company was in good shape at the start of the year. After a year of hard work, we can look back with satisfaction on our achievements in 2020.
The main impact of Covid-19 was that it became more difficult to obtain materials and recruit workers from outside the Netherlands, and this put pressure on our closely interlinked logistics processes. We saw the greatest impact in non-residential projects; the delivery of the NACH (New Amsterdam Court House) project was delayed and this will now take place later this year. Nevertheless, the major consequences for Heijmans were limited, and we were able to continue our work on all projects.
In January 2021, the first hearings will take place in the court case against Tennet. A judgement is expected later in 2021. The contract for the Zuidasdok project has been cancelled and our clients have decided to take a different approach - the project will be split into sub-packages. This should make the project more manageable and improve the spread of risks.
Tangible realisation Heijmans strategy Last year, we also saw the launch of new initiatives. At the end of 2020, Heijmans opened Hive. This is the Heijmans innovation centre next to our head office in Rosmalen, where business developers, innovation and data specialists from right across the organisation work together to share knowledge and accelerate innovations. I can now safely say that the terms innovation, smart, nature-inclusive, climate-adaptive and circular are terms we use every day at Heijmans. Based on our strategy, we are taking a clear lead in making our industry more sustainable and anticipating new legislation on nitrogen and CO2 emissions. For instance, we are making our equipment fleet more sustainable. And our bold statements for 2023, cited in last year’s annual report, are still leading. We are actively seeking partners we can team up with to accelerate developments. Together with BAM, Heijmans has set up AsfaltNu, to take the next step towards making asphalt more sustainable.
All of this is driven by our mission to build a healthy living environment. And our work is appreciated. For example, the Fenix I mixed-use building in Rotterdam, which combines apartments, businesses and culture, won several awards last year. Another important development in our positioning is that we are getting involved in planning processes at an increasingly early stage, so we can provide advice on area development with an eye for nature, people and health. This gives us an opportunity to have an even greater impact on our mission: creating a healthy living environment. My colleague Hans Janssen, CFO and member of the Executive Board, recently announced that he will be leaving Heijmans following the General Meeting of Shareholders of 15 April 2021. Both the Supervisory Board and I regret his departure but respect his decision. We are grateful to Hans for the pleasant working relationship and his contribution to the development and strengthening of Heijmans over the past three and a half years.

09Heijmans Annual Report 2020
FOREWORD
The Supervisory Board has started the process of appointing a new CFO.
I am immensely proud of all the people in our organisa-tion. Work continues, at home and at our various projects across the country, often in difficult circum-stances. We see and are grateful for the enormous efforts that are made. Looking ahead, we can see challenges in our market and in the economy as a whole, and it is still unclear how quickly we will recover from the impact of Covid-19. However, thanks to our proven resilience, our agility and our healthy order book, we are optimistic about the future.
Ton HillenChairman of the Executive Board Heijmans N.V.19 februari 2021

The Swarm, Eindhoven


12 Heijmans Annual Report 2020
2
Heijmans focuses on the creation of a healthy living environment. On top of this, as a trendsetting construction company, Heijmans wants to play a leading role in making the construction sector more sustainable.
Heijmans is a Dutch construction and development company, founded by Jan Heijmans in 1923. Heijmans was an innovator even back then, as it was one of the first companies to use bituminous road surfacing. In the post-war reconstruction boom, the company found plenty of opportunities for growth in the repair and laying of roads and airfields. Heijmans has been listed on the Amsterdam stock exchange since 1993. Heijmans focuses on the Dutch market and that is also why the vast majority of its partners in joint project are from the Netherlands. The market for raw materials and products is a combined Dutch and European market. We operate on a global market for only a small proportion of the basic raw materials we use. Our key suppliers are subcontractors (labour) and the suppliers of building materials. Our key sales segments are private individuals (residential), housing
Profile Heijmans: Builders of a healthy living environment

13Heijmans Annual Report 2020
PROFILE
corporations, network companies, but primarily (national) public authorities. Heijmans focuses on three areas of the Dutch market: property development and residential building, non-residential building and infrastructure. Heijmans’ activities are divided into the business areas Property Development, Building & Technology and Infra.
Our mission: creating a healthy living environment Our mission: creating a healthy living environment Heijmans has one ultimate goal that lies at the heart of everything we do: creating a healthy living environment. That is what we are working towards and that is what we stand for. Everyone wants to breathe healthy air, live in a pleasant neighbourhood, enjoy beautiful nature, use energy sustainably, work in a good workplace, get from A to B safely and return home healthy at the end of the day. For Heijmans, a healthy living environment also means healthy and sustainable operations, with fit colleagues who work safely and with pleasure. Heijmans sees providing a safe working environment for our employees and partners as a fundamental requirement.
Our vision: it is all about end-usersIf we want to do well for our clients, we must do well for end-users. That is why we focus on end-users in everything we develop, build and maintain.
We look very deliberately through the eyes of users, whether these are tenants or home buyers, employees, visitors, patients, entrepreneurs or road users. Because we are convinced that doing well by them helps us to create the greatest added value for our principals.
Our core values: ownership, result-focused and collaboration Our good reputation is determined by the quality of our work and how we execute it. Our three core values of ownership, result-focus and collaboration drive the conduct we need to be a leader in the fields of sustainabil-ity, profitability and quality. The power of our success rests with all Heijmans employees.
Our strategy: better, smarter, sustainableAs a leading player in our sector, Heijmans wants to take its responsibility as a director of the construction chain. We want to lead the way by becoming ever better, smarter and more sustainable internally and by making full use of opportunities for process standardisation. Armed with innovative ideas, products and services, we offer smart solutions that help to solve the major social issues of today and tomorrow. Our ultimate goal is to no longer be a drain on the living environment, but rather a net contributor to it, and by doing so create sustainable value.
Group Board
Heijmans N.V.Executive Board
Property Development
Building & Technology Infra
ProcurementCommunication & IR
FacilitiesFinances
HRM
Information technology
Quality & Safety
Risk management
Legal

14 Heijmans Annual Report 2020
PROFILE
Our methods: integratedOver the past 10 years, Heijmans’ strategic course has been sharply focused on creating added value on the basis of close collaboration between all our business units. Heijmans offers its clients an integrated proposition by combining various specialisations, construction activities and development activities. What sets Heijmans apart is that we get involved in the design process to devise solutions in collaboration with our partners and realise and maintain these solutions on the basis of integrated know-how and expertise. From idea to realisation, maintenance and management, from buildings and roads to area development. We generally do this digitally, as part of our strategy to continue to come up with smarter ways of working and smarter solutions.
Our organisation: collaboration and directionThe creation of a healthy living environment requires an integrated view. This is why Heijmans sees collaboration and direction based on an integrated agenda as strategi-cally important. We target this via our two-person Executive Board and our group board. The group board is responsible for day-to-day operational management. The group board comprises the members of the Executive Board, together with the chairs of the three business areas, the Chief Risk Officer (CRO) and the Chief Human Resources Officer (CHRO).
Property Development Heijmans Property Development focuses on area development and the property development of projects in inner-city and out-of-town areas. We act as the initiator, developer and seller of residential properties and commercial property, such as shopping centres and offices. We direct these activities from three offices and a centrally managed commercial property development department. This is an effective response to the need for an integrated vision of area development and the transformation of promising areas. Our ambition is to collaborate with housing corporations, (local) authorities, companies and residents to realise total solutions that give areas a sustainable quality boost and can result in healthy living environments.
Building & Technology In this business area we have combined our know-how and expertise in the fields of residential, non-residential building, multi-functional high-rise residential construc-tion and services. The importance of maintenance and management – both in terms of building construction and technical installations – is increasing. Monitoring buildings and data-driven services are a growing component of our activities, and we have combined these in Services. We aim for long-term collaboration with our principals. Smart data analysis provides us with effective insight into the use of our principals’ assets and we can use this information to provide them with the best possible advice on implementation and preventative maintenance.
The Residential Building activities consist of new-build projects and the redevelopment and renovation of existing homes. This includes the transformation of buildings that have been assigned a new function. We differentiate ourselves through our integrated approach to building and installation technology. We have also developed innovative residential concepts such as Heijmans ONE, Huismerk and Wenswonen.
Our Residential Building business area also targets multi-functional high-rise residential construction. On this front, we focus on complex inner-city new-build projects and buildings with highly mixed functions. This activity requires a combination of expertise and specific know-how, which translates into a single nationally operating business unit with fixed teams.
Non-residential designs, constructs and maintains buildings with high-quality electrical and mechanical installations. We focus on the care market, education, commercial property for private parties and (semi) governmental institutions, industry, data centres and leisure.
InfraHeijmans Infra's activities focus on the laying, mainte-nance and upgrading of infrastructure, with an emphasis on mobility, water and energy. We are also active in the design and construction of public spaces (including installations and technology, such as lighting, camera and reference systems) and the realisation of civil engineering projects, such as viaducts, tunnels, cables, pipelines, energy supplies, locks and water purification systems. We design, realise, manage and maintain the structures and buildings, as well as their technical installations. Data-driven solutions and services are also playing a growing role in the overall portfolio of Infra’s activities.

15Heijmans Annual Report 2020
FOREWORD
Work planner Bas Sanders at the Apeldoorn-Azelo A1 project: “To complete your project on schedule and within budget, your main task is to manage the workflow outside. And spend as little time as possible in front of your computer”.

16 Heijmans Annual Report 2020
THE MANAGEMENT
Executive Board
Mr. A.G.J. (Ton) Hillen (1961), Chair of the Executive Board, CEO
Dutch. Mr. Hillen was appointed as a member of the Executive Board of Heijmans N.V. on 18 April 2012, reappointed on 13 April 2016 and appointed as CEO on 1 December 2016. He has held various positions at Heijmans since 1992 and was appointed Director of Property Development and Residential Building at Heijmans in 2008. Prior to joining Heijmans, Mr. Hillen was employed at BAM and Anton Obdeijn Projectontwikkeling. Additional position: Member of the Supervisory Council of the Noord Brabants Museum.
Mr. J.G. (Hans) Janssen (1967), member of the Executive Board, CFO
Dutch. Mr. Janssen was appointed as a member of the Executive Board / CFO of Heijmans N.V. on 30 October 2017. Prior to joining Heijmans, Mr. Janssen was CFO at Mediq B.V. and held various financial positions at Unilever N.V. Additional position: Member of the Supervisory Board of the TIAS Business School.
3 The management

17Heijmans Annual Report 2020
THE MANAGEMENT
Supervisory Board
Mr. Sj.S. (Sjoerd) Vollebregt (1954) Chair
Dutch. Mr. Vollebregt was formerly Chairman of the Executive Board of Stork B.V. and Fokker Technologies B.V. Prior to that, Mr. Vollebregt was employed at companies including Exel, Ocean, Intexo Holding and Royal Van Ommeren. He was appointed as a member of the Supervisory Board of Heijmans N.V. in April 2015 and appointed as Chairman in 2016 and reappointed in 2019. He is due to step down in 2023. Principal additional positions: member of the Supervisory Board of Fugro N.V., Chairman of the Economic Board of Drechtsteden and Lead Independent Director at Joulz.
Mr. R. (Ron) Icke (1957), vice-chair, chair of the audit committee
Dutch. Mr. Icke was formerly Chairman of the Executive Board of USG People N.V. He was appointed as a member of the Supervisory Board of Heijmans N.V. in April 2008. He was reappointed in 2012, 2016 and 2020, and is due to step down in 2022. Principal additional positions: Chairman of the Supervisory Board of DPA Group N.V., Chairman of the Supervisory Board of ORMIT B.V., member of the Supervisory Board of VvAA Groep B.V., member of the Supervisory Boards of VGZ, V.O. and the Zee Share Administration Trust.
Mrs. M.M. (Martika) Jonk (1959)
Dutch. Ms. Jonk qualified as a lawyer in 1986 and is a lawyer/partner with CMS Derks Star Busmann. She was appointed as a member of the Supervisory Board of Heijmans N.V. in December 2018 for a term of more than four years. She is due to step down in 2023. Principal additional positions: member of the Supervisory Board N.V. Nederlandse Gasunie, member of the Supervisory Council of Catharina hospital in Eindhoven.
Ms. J.W.M. (Ans) Knape-Vosmer (1962)
Dutch. Vice-president HR&O global Operations & Sales | HR Asia at ASML. Appointed member of the Supervisory Board of Heijmans N.V. in April 2020. She is due to step down in 2024. Principal additional positions: member of the Supervisory Board of Royal Douwe Egberts B.V.
Mr. G.A. (Gerrit) Witzel (1951)
Dutch. Member of the Heijmans Executive Board in the period 2008 through 2012, including as Chairman for the last two years. Prior to that, Mr. Witzel worked for Strukton and Ballast Nedam. Appointed as member of the Supervisory Board of Heijmans N.V. in April 2020. He is due to step down in 2024. Principal additional positions: Chairman of the Advisory Board of G. Wijma & Zonen in Kampen, Chairman of the Board of Supervision of St. Anna Zorggroep in Geldrop and Chairman of the Supervisory Board of Heembouw Holding B.V. in Roelofarendsveen.

Staying connected in Leusden
In the Maanwijk project, we are combining all the knowledge and expertise we have developed in various places within Heijmans for the very first time. Developer Joost Ruiterkamp says this this pooling of knowledge and expertise is a first. “Maanwijk is the perfect example of a healthy living environment; a new residential neighbourhood that is providing answers to the social challenges we face today and those we will face in the future. And we can only do this is if we are aware of the challenges or problems of that particular location”. This new neighbourhood is rising at the tip of Leusden-South, a somewhat ‘aged’ neighbourhood, where half of the people live alone. Joost: “This is why we are putting the emphasis on connections in the development of Maanwijk. Connections between people and nature, between people and technology, but primarily between people and other people. Technology and green areas help to create connections. And Heijmans will maintain a strong connection with Maanwijk in the first few years after delivery ".
Joost RuiterkampDeveloper
Read the interview at heijmans.nl/en

20 Heijmans Annual Report 2020
0 500
1.000 1.500 2.000 2.500 3.000 3.500 4.000
0
500
1.000
1.500
2.000
2.500
3.000
3.500
0
2.000
4.000
6.000
8.000
10.000
12.000
-6,0%
-4,0%
-2,0%
0,0%
2,0%
4,0%
6,0%
-100
-50
0
50
100
-5,0% -6,0%
-4,0% -3,0% -2,0% -1,0% 0,0% 1,0% 2,0% 3,0%
0
200
400
600
800
1.000
1.200
-40,0%
-30,0%
-20,0%
-10,0%
0,0%
10,0%
20,0%
0
100
200
300
400
500
5%
15%
25%
35%
45%
-100
-80
-60
-40
-20
0
20
40
60
2016 2011 2012 2013 2014 2015 2017 2018 2019 2020
2016 2011 2012 2013 2014 2015 2018 2017 2019 2020
2011 2012 2013 2014 2015 2016 20182017 2019 2020
2016 2011 2012 2013 2014 2015 20182017 2019 2020
2017 2016 2011 2012 2013 2014 2015 2018 2019 2020
2011 2012 2013 2014 2015 2016 2017 2018 2019 2020
2011 2012 2013 2014 2015 2016 2017 2018 2019 2020
2017 2011 2012 2013 2014 2015 2016 2018 2019 2020
2016 2011 2012 2013 2014 2015 2017 2018 2019 2020
2011 2012 2013 2014 2015 2016 2017 2018 2019 2020
2016 2011 2012 2013 2014 2015 2017 2018 2019 2020
Revenue (in € x million) Result after tax (in € x million)
Order book (in € million)
Average number of employees
Operating result (in € million)
Operating margin (in %)
Net margin (in %)
Average capital invested (in € million)
Return on average capital invested (in %)
Equity (in € million)
Solvency rate based on guarantee capital (in %)
4 Key figures

21Heijmans Annual Report 2020
KEY FIGURES
Key figures 2011 2012 2 2013 3 2014 2015 2016 4 2017 2018 2019 2020
Result in € millions
Revenue 2.361 2.318 2.001 1.868 1.979 1.884 1.487 1.579 1.600 1.746
Operating result -35,7 -87,2 11,9 -63,5 -29,0 -94,0 45,3 22,6 29,2 55,7
Result after tax -37,6 -87,7 1,9 -47,3 -27,3 -110,5 19,5 20,5 30,1 40,1
Capital in € millions
Assets 1.554 1.366 1.203 1.205 1.190 1.056 771 776 898 931
Average invested capital 636 541 423 372 318 293 202 161 196 240
Equity capital 416 315 313 259 266 142 162 149 178 226
Net debt 103 149 66 31 10 146 -14 -31 30 -37
Cash flow in € millions
Operating -6 -45 -10 46 10 -68 21 27 42 128
Investment 42 -26 -3 -10 -9 -22 91 -10 4 -33
Financing -19 8 8 -23 51 43 -116 -3 -26 -29
Cash flow 17 -63 -5 13 52 -47 -4 14 20 66
Ratios in %
Return on average capital -5,6 -16,1 2,8 -17,1 -9,1 -32,1 22,5 14,1 14,8 23,2
Result after tax:
- as % of equity -9,0 -27,8 0,6 -18,3 -10,2 -77,8 12,0 13,8 16,9 17,7
- as % of revenue -1,6 -3,8 0,1 -2,5 -1,4 -5,9 1,3 1,3 1,9 2,3
Solvency rate based on guarantee capital
31,0% 27,9% 31,5% 27,0% 26,1% 17,7% 26,9% 25,0% 24,8% 28,8%
No. of shares x 1.000
At year-end 16.956 17.328 19.349 19.461 21.407 21.407 21.409 21.409 21.409 21.933
Average 16.917 17.191 18.111 19.420 20.661 21.407 21.408 21.409 21.409 21.715
Data per share 1 x € 1
Equity 24,53 18,32 17,28 13,34 12,87 6,63 7,57 6,96 8,31 10,41
Operating result -2,11 -5,07 0,66 -3,27 -1,40 -4,39 2,12 1,06 1,35 2,56
Result after tax -2,22 -5,10 0,10 -2,44 -1,32 -5,16 0,91 0,96 1,40 1,85
Dividend 0,35 0,25 0,15 - - - - - - 0,73
Share price information x € 1
At year-end 8,19 7,05 10,51 8,95 8,18 5,52 9,71 8,00 7,50 9,33
High price 23,90 9,68 10,78 14,20 13,36 9,20 10,87 12,92 11,52 9,67
Low price 6,58 5,25 6,85 7,83 5,77 4,59 6,02 7,44 7,12 4,47
Other data
Order book (* in € millions)
2.192 2.026 1.643 2.287 2.094 1.863 1.898 2.014 2.124 1.946
Employees (average number of FTEs)
8.384 8.242 7.617 7.198 6.808 6.412 4.520 4.483 4.565 4.678
1. The data per share is expressed in terms of the weighted average number of ordinary shares. Dividend per share is based on the number of ordinary shares at year-end.
2. After adjustment due to a change in accounting policy for defined benefit plans (see the financial statements). 3. After adjustment due to a change in accounting policy for joint arrangements (see the financial statements). 4. The figures from the statement of profit or loss are for all activities (including terminated activities). The figures in the statement of financial position are
before the reclassification of sold entities to entities held for sale, with the exception of the total of assets. Net debt and order book are after reclassification of sold entities to entities held for sale.

22 Heijmans Annual Report 2020
KEY FIGURES
0 500
1.000 1.500 2.000 2.500 3.000 3.500 4.000
0
500
1.000
1.500
2.000
2.500
3.000
3.500
0
2.000
4.000
6.000
8.000
10.000
12.000
-6,0%
-4,0%
-2,0%
0,0%
2,0%
4,0%
6,0%
-100
-50
0
50
100
-5,0% -6,0%
-4,0% -3,0% -2,0% -1,0% 0,0% 1,0% 2,0% 3,0%
0
200
400
600
800
1.000
1.200
-40,0%
-30,0%
-20,0%
-10,0%
0,0%
10,0%
20,0%
0
100
200
300
400
500
5%
15%
25%
35%
45%
-100
-80
-60
-40
-20
0
20
40
60
2016 2011 2012 2013 2014 2015 2017 2018 2019 2020
2016 2011 2012 2013 2014 2015 2018 2017 2019 2020
2011 2012 2013 2014 2015 2016 20182017 2019 2020
2016 2011 2012 2013 2014 2015 20182017 2019 2020
2017 2016 2011 2012 2013 2014 2015 2018 2019 2020
2011 2012 2013 2014 2015 2016 2017 2018 2019 2020
2011 2012 2013 2014 2015 2016 2017 2018 2019 2020
2017 2011 2012 2013 2014 2015 2016 2018 2019 2020
2016 2011 2012 2013 2014 2015 2017 2018 2019 2020
2011 2012 2013 2014 2015 2016 2017 2018 2019 2020
2016 2011 2012 2013 2014 2015 2017 2018 2019 2020
Revenue (in € x million) Result after tax (in € x million)
Order book (in € million)
Average number of employees
Operating result (in € million)
Operating margin (in %)
Net margin (in %)
Average capital invested (in € million)
Return on average capital invested (in %)
Equity (in € million)
Solvency rate based on guarantee capital (in %)
1%
2%
3%
4%
5%
25
50
75
100
125
10
20
30
40
50
60
5
10
15
20
25
30
10
20
30
40
50
60
2016 2011 2012 2013 2014 2015 20182017 2019 2020
2016 2014 2015 20182017 2011 2012 2013 2019 2020
2016 2011 2012 2013 2014 2015 20182017 2019 2020
2016 2011 2012 2013 2014 2015 20182017 2019 2020
2016 2011 2012 2013 2014 2015 20182017 2019 2020
Absenteeism (in %) Number of accidents (incl. sub-contractors) *
CO2-emissions scope 1 + 2 (in tonnes) *
Total amount of residual material (in tonnes) *
Procurement spend preferred suppliers (in %) *
0 500
1.000 1.500 2.000 2.500 3.000 3.500 4.000
0
500
1.000
1.500
2.000
2.500
3.000
3.500
0
2.000
4.000
6.000
8.000
10.000
12.000
-6,0%
-4,0%
-2,0%
0,0%
2,0%
4,0%
6,0%
-100
-50
0
50
100
-5,0% -6,0%
-4,0% -3,0% -2,0% -1,0% 0,0% 1,0% 2,0% 3,0%
0
200
400
600
800
1.000
1.200
-40,0%
-30,0%
-20,0%
-10,0%
0,0%
10,0%
20,0%
0
100
200
300
400
500
5%
15%
25%
35%
45%
-100
-80
-60
-40
-20
0
20
40
60
2016 2011 2012 2013 2014 2015 2017 2018 2019 2020
2016 2011 2012 2013 2014 2015 2018 2017 2019 2020
2011 2012 2013 2014 2015 2016 20182017 2019 2020
2016 2011 2012 2013 2014 2015 20182017 2019 2020
2017 2016 2011 2012 2013 2014 2015 2018 2019 2020
2011 2012 2013 2014 2015 2016 2017 2018 2019 2020
2011 2012 2013 2014 2015 2016 2017 2018 2019 2020
2017 2011 2012 2013 2014 2015 2016 2018 2019 2020
2016 2011 2012 2013 2014 2015 2017 2018 2019 2020
2011 2012 2013 2014 2015 2016 2017 2018 2019 2020
2016 2011 2012 2013 2014 2015 2017 2018 2019 2020
Revenue (in € x million) Result after tax (in € x million)
Order book (in € million)
Average number of employees
Operating result (in € million)
Operating margin (in %)
Net margin (in %)
Average capital invested (in € million)
Return on average capital invested (in %)
Equity (in € million)
Solvency rate based on guarantee capital (in %)
1%
2%
3%
4%
5%
25
50
75
100
125
10
20
30
40
50
60
5
10
15
20
25
30
10
20
30
40
50
60
2016 2011 2012 2013 2014 2015 20182017 2019 2020
2016 2014 2015 20182017 2011 2012 2013 2019 2020
2016 2011 2012 2013 2014 2015 20182017 2019 2020
2016 2011 2012 2013 2014 2015 20182017 2019 2020
2016 2011 2012 2013 2014 2015 20182017 2019 2020
Absenteeism (in %) Number of accidents (incl. sub-contractors) *
CO2-emissions scope 1 + 2 (in tonnes) *
Total amount of residual material (in tonnes) *
Procurement spend preferred suppliers (in %) *
* We do not have data going back 10 years for these key figures. We are reporting these figures for the years for which data is available. Any changes in definitions in the reporting period are explained in more detail in the KPI table in the appendices.

23Heijmans Annual Report 2020
FOREWORD
Renovation at Laan van Zuid, Rotterdam

Read the interview at heijmans.nl/en/news/future-heijmans/

Barry Advokaat (26)work planner
After completing my mechanical engineering degree, I was absolutely convinced I wanted to pursue a career in that field, but I also had ambitions on the bookkeeping front. At Heijmans, I could do both. Certainly at Civil Specialisms, a great club that offers many possibilities. I feel the ownership of an entrepreneur, but under Heijmans’ wings. For instance, a while back I designed a machine to turn 80,000-kilo reels. I was given a lot of freedom to do this, and I learned a huge amount”.
“ I was given so much freedom, I learned a huge amount”.

26 Heijmans Annual Report 2020
The share capital Heijmans N.V.’s share capital at 31 December 2020 can be broken down as follows:
Authorised share capital Issued capital
Shares (x 1,000) 2020 2019 2020 2019
Ordinary shares 35.100 35.100 21.933 21.409
Cumulative financing preference shares B
7.000 7.000 4.510 4.510
Protective preference shares
8.000 8.000 - -
50.100 50.100 26.443 25.919
5 The Heijmans share

27Heijmans Annual Report 2020
THE HEIJMANS SHARE
Ordinary shares The shares are held by the Heijmans Share Administration Trust (SA Trust). The face value per ordinary share is € 0.30. The SA Trust had issued 21,933,470 depositary receipts for shares as at 31 December 2020, and these shares are listed on the NYSE Euronext stock exchange in Amsterdam. The voting rights on ordinary shares are vested in the SA Trust. Each ordinary share entitles the holder to 30 votes. Holders of depositary receipts for shares wishing to vote at a shareholders’ meeting are granted an unconditional proxy by the SA Trust.
The movements in the number of ordinary shares and depositary receipts for shares, together with a summary of the key figures per ordinary share/depositary receipt, are presented in the table below.
Heijmans N.V. is listed on Euronext Amsterdam. The data relevant to the stock market listing are presented in the table below:
Cumulative financing preference shares BOn 28 June 2002, Heijmans issued 6,610,000 cumulative financing preference shares B at a price of € 10 per share. As at 18 September 2015, there were 4,510,000 cumulative financing preference shares B outstanding. The face value per ordinary share is € 0.21. These shares are not quoted on a stock exchange and no depositary receipts are issued for them. The dividend is revised every five years, most recently as of 1 January 2019. From that moment until the next review date
Shares (x 1,000) 2020 2019 2018 2017 2016
In issue on 1 January 21.409 21.409 21.409 21.407 21.407
Issue of share capital 524 - - - -
Stock dividend - - - - -
Matching shares Share Matching Plan - - - 2 -
In issue on 31 December 21.933 21.409 21.409 21.409 21.407
Average in issue for the year 21.671 21.409 21.409 21.408 21.407
Earnings per share* (in €) 1,85 1,40 0,96 0,91 -5,16
Dividend per share (in €) 0,73 - - - -
Pay-out ratio % 40% - - - -
* Per average issued share
Heijmans market listing 2020 2019 2018 2017 2016
Closing price (in €) 9,33 7,50 8,00 9,71 5,52
High price (in €) 9,67 11,52 12,92 10,87 9,20
Low price (in €) 4,47 7,12 7,44 6,02 4,59
Dividend yield at closing price (in %) 7,8 3,7 - 0,0 0,0
Market capitalisation at year-end (in € millions) 205 161 171 118 118
Average daily turnover (in no. of shares) 158.183 122.598 138.608 171.892 171.892

28 Heijmans Annual Report 2020
THE HEIJMANS SHARE
(1 January 2024), a dividend of 7.21% has been agreed, payable each year within 14 days after the Annual General Meeting of Shareholders (AGM). In the interim, this yield will be reduced by 100 base points (1%) as soon as the outstanding capital in cumulative financing preference shares B is halved compared with the amount that was outstanding at year-end 2018, this being € 45,100,000. The company has the right to repurchase or cancel these financing preference shares B at any time. Redemption elements are applicable under certain circumstances during the newly agreed review period. Information about specific agreements and associated terms and conditions is available in section 6.21 of the financial statements in this annual report.
Issued share capital and equity holdings The issued share capital and associated voting rights were last changed in 2020, as a result of an issue of (depositary receipts for) shares related to the payment of compensation on the cumulative financing preference shares B in the form of (depositary receipts for) ordinary shares. A payment was also made from the share premium reserve for the amount of the dividend coupon, reducing the value per share from €10 to €9.279. Following this, the voting rights ratio as per 30 June 2020 was reduced accordingly. For the background to these payments and adjustments, please see section 6.21 of the financial statements in this annual report. One cumulative financing preference share B entitles the holder to 1,186 votes. Ordinary shares entitle holders to 30 votes per share. The composition of the issued capital and associated voting rights as at 31 December 2020 was as follows:
Issued capital (Potential) Voting right (%)
Number% (based on nominal
value) Number %
Ordinary shares 21.933.477 87,4% 658.004.310 99,2%
For which depositary receipts issued 21.933.470 87,4% 658.004.100 99,2%
For which no depositary receipts issued 7 0,0% 210 0,0%
Depositary receipts 21.933.470 87,4% 658.004.100 99,2%
Cumulative preference shares 4.510.000 12,6% 5.348.860 0,8%
Total year-end 26.443.477 100% 663.353.170 100%

29Heijmans Annual Report 2020
THE HEIJMANS SHARE
To the best of Heijmans’ knowledge, and also based on the WMZ (Dutch Major Holdings in Listed Companies Disclosure Act) register maintained by the Dutch Financial Markets Authority (AFM), the following investors held an interest of 3% or more in Heijmans as at 31 December 2020:
Based on the information provided by banks and custodians and information services, the distribution of share ownership can be broken down as follows:
*Figures are indicative as at August 2020
In the year under review, the (estimated) shareholdings of institutional investors probably declined to 40% (2019: 47%).
An estimated 17% of the depositary receipts for ordinary shares are held by institutional investors in the Netherlands. This figure is lower than at year-end 2019 (25% in the Netherlands). An estimated majority of the depositary receipts for ordinary shares held by private investors are held in the Netherlands.
Holdings in Heijmans
31 December 2020 31 December 2019
Capital (%)Potential voting
right (%) Capital (%)Potential voting
right (%)
Kempen Capital Management N.V. 6,3% 0,4% 6,4% 0,4%
NN Group N.V. 6,3% 0,4% 6,4% 0,4%
ASR Vermogensbeheer 5,4% 6,1% 5,5% 6,2%
Quaero Capital SA 4,9% 5,5% 4,3% 4,9%
Gustav Zech Stiftung 4,4% 5,0% <3% <3%
Acadian Asset Management LLC 3,5% 4,0% 3,5% 4,0%
Dimensional Fund Advisors LLP 3,6% 4,1% 3,5% 4,0%
River and Mercantile Asset Management LLP 2,3% 2,7% 3,4% 3,8%
Unionen 3,2% 3,6% 3,3% 3,7%
39,9% 31,8% 36,3% 27,6%
Other holdings 60,1% 68,2% 63,7% 72,4%
Total 100,00% 100,00% 100,00% 100,00%
4%
24%19%
9%
13% 18%
17%
35%
21%
40%Institutional
Retail
Broker & Custodian
Other investors
Netherlands
United Kingdom
United States
Switzerland
Germany
Rest of Europe
Rest of the world <1%

30 Heijmans Annual Report 2020
THE HEIJMANS SHARE
Share price development The closing price for the ordinary share was € 9.33 at year-end 2020. This represents an increase of 24.4% compared with the closing price for the 2019 financial year (€7.50). This was a better performance than that of the AScX Index, which increased by 12.2% in the same period. The share price increased sharply from mid-May until late October. The figure below shows the price movements of Heijmans shares in 2020, compared with the AScX Index, the AEX and the AMX and with the other listed Dutch construction company, BAM.
Financial calendar 2021
Heijmans has set the following (publication) dates for 2021:
Date Event Time
14 April 2021 General Meeting of Shareholders 14.00 hrs
30 April 2021 Trading update Pre-market
20 August 2021 Publication interim results 2021 Pre-market
3 November 2021 Trading update Pre-market
0,7
0,9
1,1
1,3
1,5
1,7
1,9
Movements in Heijmans share relative to AScX index and BAM
Relatieve koersontwikkeling aandeel Heijmans t.o.v. AscX en peers, waarbij:- Slotkoers 2016 = 100%- Koers VWS, relatieve koers t.o.v. Heijmans vanaf introductiekoers 12-5-2017
0,5
Heijmans BAM AscX AEX AMX
Dec-18
Jan-19Fe
b-19
Mar-19
Apr-19
May-19
Jun-19
Jul-1
9Aug-19
Sep-19
Oct-19
Nov-19
Dec-19

31Heijmans Annual Report 2020
FOREWORD
Roos Godefrooij works as a data and business developer and uses data as a toolbox to solve clients’ challenges.

Don’t hide, but actOn 10 February 2020, a Heijmans pile-driving rig fell against an adjacent apartment complex on Sumatraweg on the Katendrecht, Rotterdam. Luckily, a thorough inspection revealed that nobody had been killed or physically injured in the accident. However, the collapsed rig had caused a lot of damage to homes and a parked car. Developer Frank Sijlaar: “This was a pretty bad accident, because we had quite literally fallen into someone’s home. But right from the outset, we had no intention of hiding from our responsibility.” Heijmans set up a crisis team and offered the affected residents as much help as we could. These residents will be returning to their homes shortly. Anouk: “I hope the residents will soon feel safe in their homes again. They deserve that".
Anouk BoersenArea manager
Read the interview at heijmans.nl/en/news/dont-hide-act/

34 Heijmans Annual Report 2020
As a leading company in our sector, we follow what is going on in the market, so we can match our propositions as closely as possible to the needs of principals and end-users. Below is a brief outline of the developments we have identified and how we are responding to them.
Healthy living environment Our mission - to create a healthy living environment - ties in with a broader movement that has been visible in society for some time. The Dutch government also wants 'health' to be explicitly included in the development of spatial policy, and in 2020 it issued the national memorandum on health policy 2020-2024. Municipalities will have to put users first and encourage a healthy lifestyle. Meeting people in public spaces must also be made easier and safety has to be improved.
6 Sector developments and trends

35Heijmans Annual Report 2020
SECTOR DEVELOPMENTS AND TRENDS
Long-term commitment To actually create a healthy living environment, our work does not stop after the completion of a project. We want to stay involved, generate and monitor data to gain a better understanding of the influence of the living environment on people’s health. We use the resultant insights and results to make the living environment ever healthier and smarter in the future. We do this together with partners such as the RIVM (National Institute for Public Health and the Environment), the Lung Fund and the Hogeschool Utrecht college. Heijmans is striving for a 'healthy living label'. Such a label should be supported nationally and could provide insight into the extent to which a new-build district meets aspects that contribute to people’s health.
It is our goal to create a healthy living environment for all people, regardless of their budget. In doing so, we respond optimally to the current wishes of residents, users, businesses, public authorities and other organisations. We want our area developments to contribute to local social challenges, such as increasing self-reliance, combating loneliness and improving air quality.
Healthy living indoors and outdoors In the new 'Maanwijk' residential area in Leusden, for example, residents are given access to Hoplr, an online neighbourhood platform. Using this app, residents can connect easily for a job around the house, or just for a chat. We are also implementing smart innovations in the field of infrastructure. For example, lampposts are dimmed when there is no movement, and thanks to sensors at a zebra crossing, lights come on precisely when a pedestrian or cyclist wants to cross.
In new-build projects, we pay special attention to the indoor climate, which is essential for ensuring a healthy living environment. For example, at Maanwijk we are starting a pilot that will enable residents to monitor the air quality and CO₂ emissions in their own homes. The accompanying app can then provide residents with tips and information based on the data collected. Heijmans has also set up a partnership with the Dutch Lung Fund. Together, we are investigating whether we can develop a quality label focused on the air quality of an environ-ment, with the aim of always being able to work to a certain standard.
Smart solutions Traditional instruments are no longer enough to tackle the challenges of the future. A smart approach and intelligent solutions are needed to manage health in areas that are becoming increasingly urbanised and densely populated, while at the same time continuing to
deal responsibly with our natural capital. Heijmans has experience and expertise on the Smart City front, and we want to be a valued partner for municipalities, corpora-tions and investors with transition issues, both in various sub-areas of Smart City, and integrally in new area developments and transformation areas.
We enrich the 'physical world' with data-driven solutions and technology. We are moving from 3D to 4D. Through the smart use of data and digital applications, we optimise the comfort, safety, efficient use of space and sustainability of cities and areas. Obviously taking into account the privacy, autonomy and dignity of residents and users. This enables residents and users to get the most out of their healthy living environment.
DigitalisationInformation technology is a game changer in society and vitally important to the entire economy. Digitalisation allows us to improve and accelerate our production processes. And smart analysis of big data is making the management and maintenance of existing objects more efficient and safer. Technology is also helping us to increase the safety awareness of our professionals, for example through training with Virtual Reality applica-tions. Through the 'digital construction site', they see and experience what practice looks like. And the end of digital development is nowhere in sight. We are increasingly working with BIM (building information model: a digital model of an object to be built) and Digital Twins - a virtual version of an object to be built - which we can use to conduct extensive tests even before physical production starts. And this continues to run throughout the life cycle long after delivery. The products we deliver are also generating more and more smart data.
Heijmans uses applications that digitalise the design and construction process. The result: faster and more efficient work and a reduction in the number of errors. One example is an application for the design process of earthworks. By linking data sources and software packages and by using powerful algorithms, the application offers the user a range of design solutions in one go. Thanks to parametric design, with the right information, you can make better choices more quickly.
Pressure on the housing market We are seeing persistently strong demand on the housing market. There is confidence in the housing market in the longer term, but demand is shifting, partly due to the ageing population. The number of single and two-person households is increasing. On the other hand, the supply is declining, primarily because of insufficient planning

36 Heijmans Annual Report 2020
SECTOR DEVELOPMENTS AND TRENDS
capacity. Due to a lack of locations and delays in production - as a result of slower permit procedures - there is too little planned supply. At municipal level, it is difficult to get new plans on the agenda. We need direction at a national level, together with the designation of large-scale locations, to boost housing supply.
Due to the high demand and declining supply, prices are rising. Construction costs have also risen as a result of ever increasing additional regulations and higher quality demands. Since the crisis of 2008, 100,000 people have left our sector and two-thirds of them have not returned. This enormous shortage of personnel is also leading to higher costs. Overall construction costs have also increased. The high demand and higher prices have made it difficult for starters to enter the housing market, which has an impact on the housing market as a whole; we are also seeing less movement in the more expensive segments, and this is again pushing up prices. The affordability of homes has now been under pressure for some time.
As a company, we would like to help break the impasse on the housing market and increase planning capacity on a structural basis. After all, greater supply will restore balance to the market. With further standardisation and industrialisation, it should be possible to make produc-tion processes more efficient and in turn make homes more affordable. Heijmans offers a growing number of housing concepts that constitute a response to increasing housing shortages, but also to changing demand and affordability issues. However, consistent policy and regulations remain a basic prerequisite. It will take a considerable effort to bring supply and demand back into balance. Nevertheless, the outlook for the housing market is positive and demographic developments offer enor-mous opportunities for our company. Heijmans is continuing its dialogue with (local) authorities, principals and the media to keep the debate on this subject on the agenda.
Koningsoord, Berkel-Enschot

37Heijmans Annual Report 2020 37
SECTOR DEVELOPMENTS AND TRENDS
38 Heijmans Annual Report 2020
SECTOR DEVELOPMENTS AND TRENDS
Climate and environment Government measures, but also growing demand from our stakeholders, are making the switch to sustainable energy and materials increasingly urgent. The Paris climate goals provide the framework for this, while the Dutch Energy Transition Progress Act has even made the development and construction of new homes without gas compulsory in the Netherlands. On 1 January 2021, the existing standard for the energy performance of a home (the Energy Performance Coefficient: EPC) will be replaced by the BENG (nearly energy neutral building) standard, which includes higher ambitions for new buildings. Energy efficiency requirements are being tightened up at an accelerated pace, which is putting pressure on both designers and builders.
In 2019, we set up Heijmans Energie B.V. to pool our knowledge and experience in the field of energy and develop new solutions for the decentralised generation and supply of sustainable energy. We can have the greatest impact when we move beyond the object level (individual homes) and provide sustainable energy at neighbourhood and/or district level, based on an integrated area approach. This applies not only to new buildings, but also to existing buildings or complexes that require large-scale renovation and restructuring. This is perhaps where the greatest challenge lies for the sustainability of the built environment.
Energy transition In addition to the transition to gas-free construction, we are seeing other major shifts in the energy landscape. The emergence of e-mobility, for example, requires adjust-ments to infrastructure, and we will need to replace local networks to secure energy supplies in the future. This type of project requires an integrated approach, in which we deploy knowledge from the various business areas within Heijmans.
Nitrogen and PFASThe government’s nitrogen emissions plan continues to raise concerns. It may bring relief for residential building, but the current proposal does not solve the problem for the construction of large-scale infrastructure projects. After all, a permit is still required for emissions in the in-use phase and the government has so far failed to create enough room for those ‘in-use’ nitrogen emissions. Construction sector umbrella organisation Bouwend Nederland is calling on the government to focus on a significant reduction in nitrogen emissions at source. This would create the required room for the in-use phase of infrastructure projects and for new economic develop-ments. We believe this is also the only way to give a
structural boost to the natural environment. Mobility from A to B is a major asset in our society. That mobility will continue to require maintenance and sometimes the new construction of roads in the smartest and most sustainable way possible. Untangling the nitrogen emissions problem is crucial on this front. The construc-tion sector is joining forces in initiatives such as the ENI (emissions-free network infrastructure). If we want to keep the economy going, we need to avoid backlogs at (local) government level. Despite the low percentage of nitrogen emissions generated by the construction sector (0.6%), we are making every effort to accelerate the reduction of emissions, in cooperation with public sector partners. This is true for both nitrogen and PFAS. This drive will require both effort and inventiveness.
CircularityCircular construction is one of the avenues we can take to protect the climate and the environment. Preventing waste and recycling materials are a major priority on this front, as material flows become material cycles. This has major consequences for the construction industry. The switch to circular thinking requires a change in mindset and a great deal of effort. Genuine circular thinking encompasses the entire lifecycle of an object to be built: from design for reuse to life-extending maintenance and the collection and reuse of residual materials. Another trend that may also make a significant contribution to circularity is the switch that an increasing number of companies are making from producer to service provider. This is no longer about selling products, but about offering products as 'as a service', where the client pays for the use of a product. We are also seeing the first signs of this shift in the construction sector, and we too are exploring the opportunities this creates, including the legal and financial consequences. Our moveable Heijmans ONE home is just one example of a concept that has all the features that will make it possible to offer the home 'as a service' at some point in the future.
Need for mobility Mobility continues to be a major requirement in the Netherlands, and this is creating a constant need to resolve bottlenecks and improve overall capacity. We are also seeing a growing desire to find a way to align these solutions with the need to protect the environment, in terms of both landscape and ecological requirements. New developments, such as mobility-related data collection and the increase in the number of electric cars, are also raising new issues. These include the increase in the number of central charging stations and the construc-tion of charging points in cities. Heijmans is responding to this demand and plays a role in the construction and

39Heijmans Annual Report 2020
SECTOR DEVELOPMENTS AND TRENDS
exploitation of charging points. The rise of hydrogen as a fuel may also result in increased activity in the field of cables and pipelines.
New types of contract The industry has seen too many setbacks in larger infrastructure projects in recent years, and what we are seeing now, after the resultant losses on these projects, is that contractors have become reluctant to take on large, complex projects. The risks have been borne primarily by contractors in recent years, but the revenues have not grown accordingly. In addition, price has been the leading factor in tenders for far too long. This development is obviously not good for the sector, whether you are a contractor or a principal. This is why it is good that both parties are now considering how we can revitalise the infrastructure sector, which is also of major importance to society.
Of course principals want bids that are in line with the market and that are subject to healthy competition, but at the same time, clients also have an interest in a vital infrastructure sector. Market players want a better balance between risk acceptance and earning capacity. At a time when much remains uncertain, they cannot commit to a fixed price or a tight schedule. The market is willing to take risks, but must be able to influence them so they can control or mitigate these risks. For any proper discussion of this problem, all the parties involved need to understand each other's position and each other's interests. Transparency and openness are needed to set change in motion.
In the cooperation between private parties and a number of public sector clients, such as the Dutch Ministry of Public Works and Waterways (Rijkswaterstaat - RWS) and water boards, we have seen a number of significant developments that have led to improvements in contracts and a better distribution of risks and opportunities. Based on a study by McKinsey, the Ministry of Public Works and Waterways is planning to divide large-scale projects, or parts of these projects, into two phases.
First, there will be a brief tender phase to arrive at the selection of a party. Together with the client, this party will then work out the basic principles of the project up to and including a final design. The major advantage of this working method is that the final design gives all parties involved a much better picture of the risks and costs before the contract is awarded. This reduces the chances of cost overruns during execution.
Another change in tender policy is the clustering of similar contracts. In the coming years, rail operator ProRail wants to make all crossings at different levels. This will require the construction of viaducts or under-passes in many places in the Netherlands. ProRail is issuing contracts for this in clusters of 10 or 15 projects. As a result, the contracted party will be able to develop specific expertise and come up with innovative solutions for the realisation of the projects.
Another example is the Schiphol maintenance contract, a long-term cooperation agreement that stimulates joint innovation. The expectation is that the government will use this type of contract on a larger scale. In the short term, this will lead to some delays in the planning, due to the fact that all the parties involved will have to gain experience with this working method. However, we see this development as a significant improvement and a boost for both standardisation and innovation in the longer term.
Available labour Achieving a good match between our business activities and the available labour with the right competencies is crucial if we are to continue to execute our projects and services effectively. This ratio is constantly changing and a construction company has to build a healthy balance between directly deployable in-house employees and a flexible shell of temporary workers. The nature of the work is also gradually changing. The implementation of our strategic agenda makes technology more important and this also applies to more specialist roles, such as those in the field of energy, software and sustainability.

BIM is a new digital world, a world in which my manager gives me all the freedom I need to do the things that benefit the project. I see myself as crossing point. Designers and site managers need each other, and I’m in between with my digital models and everything that comes with them. I no longer have to explain why BIM is important. Foremen come to me to tell me what they need. If we don’t have it yet, I arrange it for them. My work only has value if I can help others to do their work better”.
" Digital building helps colleagues to do their work better".
Read the interview at heijmans.nl/en/news/future-heijmans/

Shira de Koning (32)BIM manager

42 Heijmans Annual Report 2020
As a company active in Property Development, Building & Technology and in the Infra sector, we deal with a broad playing field of principals and clients, employees, shareholders and other capital providers, suppliers and subcontractors. But obviously, we also deal with the industry as a whole, public sector bodies, think tanks and educational institutions, social groups and end-users. We interact intensively with all of these groups to maintain a connection with the market and to hear the views of specific stakeholders on what they consider important.
Our stakeholder interaction is a fully continuous process we conduct using a range of instruments and meetings. In 2020, the Executive Board took an active part in talks with various stakeholders, including the works council, clients, employees, shareholders, lenders and analysts. In the year under review, we organised various stakeholder meetings to discuss our strategy and a number of material issues. Examples of these include consulta-tions with principals and peers in our sector on the Concrete accord, talks with entrepre-neurs and clients during our Sustainability Day (Dag van de Duurzaamheid) and during the
7 In dialogue with stakeholders

43Heijmans Annual Report 2020
IN DIALOGUE WITH STAKEHOLDERS
Toekomstperspectief (future perspective) event in Den Bosch, the consultations with public sector bodies and principals in the Physical Living Environment Consultation Body (Overlegorgaan Fysieke Leefomgeving) of the Ministry of Infrastructure and Waterways, plus the same ministry’s Top Sector consultations together with the Dutch Ministry of Public Works and Waterways.
It is clear from the discussions that the themes of health, safety and sustainability are playing an ever greater role in society as a whole. Sustainability is moving up the agenda among our stakeholders and we are seeing a growing willingness to foster circularity and energy-neu-tral construction. Heijmans promotes circularity by reducing the amount of packaging material, using reusable materials and deploying sustainable equipment, among other things. We are also closely involved in the continued development of the circularity index for the construction industry. This is an industry-wide tool to index the use of materials, the retention of value and the impact on the environment - with sustainability as its ultimate goal.
In the field of safety, we play a part in sector-wide initiatives, such as the Governance Code on safety in the construction industry, but also in the creation of the Generic Gate Instructions and the ViA (safety in tenders) initiative.
• Client contacts and evaluations We are in constant touch with our clients in the course of our activities, from the tender phase through to delivery and the after-care phase, and in the maintenance and management stages of our projects. We also devote considerable attention to the evaluation of our work with clients.
• Roadshows and conferencesHeijmans maintains contact with its shareholders and potential shareholders at various moments throughout the year. These contacts are not confined to our Annual General Meeting and other regular meetings with our
major shareholders, as we also have individual discus-sions and meetings with existing and new shareholders at a number of conferences and trade fairs. Due to the Covid-19 situation, these conversations and meetings were mainly held in a digital format in the year under review.
• Analyst meetings Heijmans has regular meetings with analysts who follow our share and the company. We organised analyst meetings for the presentation of the annual and interim results and held analyst calls when we published our trading updates in the spring and autumn. Those interested can follow the full-year and interim analyst meetings live and interactively via a webcast.
• Works Council meetings Heijmans Executive Board members hold regular talks with the company’s Works Council. Employee representa-tives maintain a broad dialogue via a number of fixed Works Council committees on specific themes: Safety, Health, Welfare and the Environment, as well as commu-nications, social affairs, strategy and finance. Any insights these meetings generate are subsequently shared with the Executive Board.
• Online mediaClients, stakeholders and other interested parties can obtain information about Heijmans via the company’s website. This information ranges from project updates and Heijmans’ view on relevant themes in society to the financial calendar and press releases. Heijmans is also active on a daily basis on YouTube, Twitter, Facebook, Instagram and LinkedIn. This combination of appealing and current content has the greatest number of social media followers in the Dutch construction sector.
• Capital providers and insurers Heijmans maintains intensive contacts with its capital providers and frequently explains the financial results to these parties. Heijmans also maintains contacts with credit insurers and guarantors.
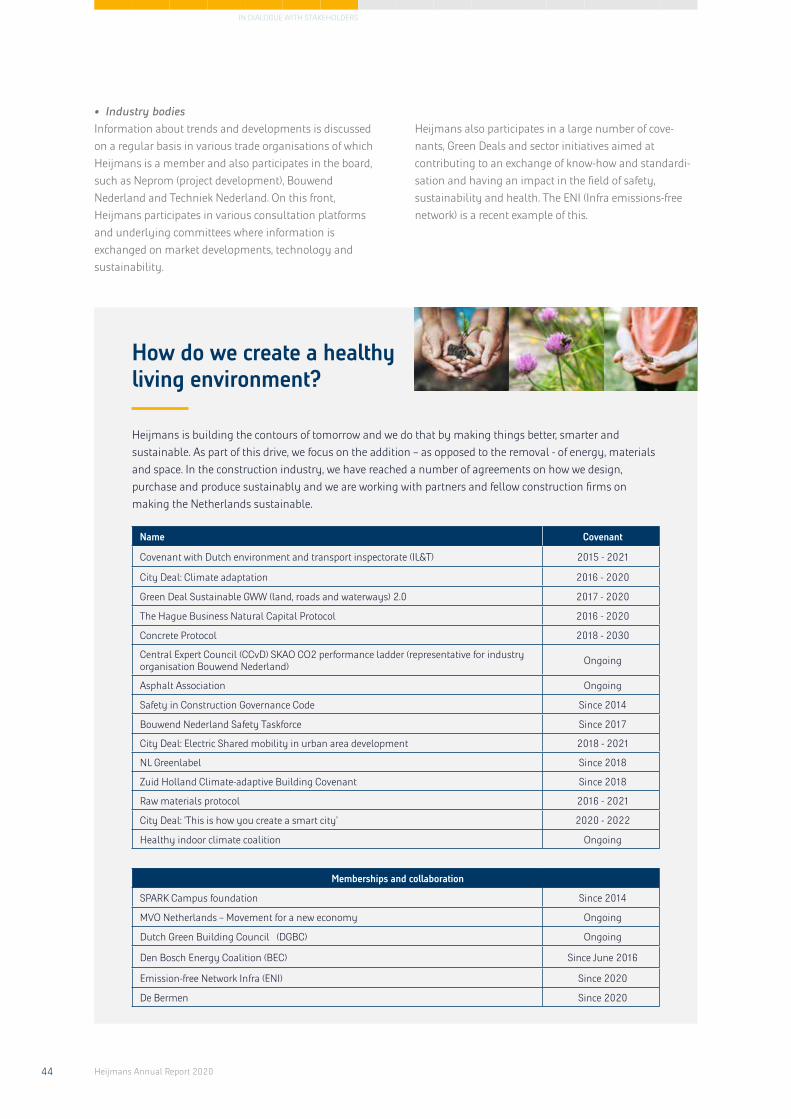
44 Heijmans Annual Report 2020
IN DIALOGUE WITH STAKEHOLDERS
• Industry bodies Information about trends and developments is discussed on a regular basis in various trade organisations of which Heijmans is a member and also participates in the board, such as Neprom (project development), Bouwend Nederland and Techniek Nederland. On this front, Heijmans participates in various consultation platforms and underlying committees where information is exchanged on market developments, technology and sustainability.
Heijmans also participates in a large number of cove-nants, Green Deals and sector initiatives aimed at contributing to an exchange of know-how and standardi-sation and having an impact in the field of safety, sustainability and health. The ENI (Infra emissions-free network) is a recent example of this.
How do we create a healthy living environment?
Heijmans is building the contours of tomorrow and we do that by making things better, smarter and sustainable. As part of this drive, we focus on the addition – as opposed to the removal - of energy, materials and space. In the construction industry, we have reached a number of agreements on how we design, purchase and produce sustainably and we are working with partners and fellow construction firms on making the Netherlands sustainable.
Name Covenant
Covenant with Dutch environment and transport inspectorate (IL&T) 2015 - 2021
City Deal: Climate adaptation 2016 - 2020
Green Deal Sustainable GWW (land, roads and waterways) 2.0 2017 - 2020
The Hague Business Natural Capital Protocol 2016 - 2020
Concrete Protocol 2018 - 2030
Central Expert Council (CCvD) SKAO CO2 performance ladder (representative for industry organisation Bouwend Nederland) Ongoing
Asphalt Association Ongoing
Safety in Construction Governance Code Since 2014
Bouwend Nederland Safety Taskforce Since 2017
City Deal: Electric Shared mobility in urban area development 2018 - 2021
NL Greenlabel Since 2018
Zuid Holland Climate-adaptive Building Covenant Since 2018
Raw materials protocol 2016 - 2021
City Deal: ‘This is how you create a smart city’ 2020 - 2022
Healthy indoor climate coalition Ongoing
Memberships and collaboration
SPARK Campus foundation Since 2014
MVO Netherlands – Movement for a new economy Ongoing
Dutch Green Building Council (DGBC) Ongoing
Den Bosch Energy Coalition (BEC) Since June 2016
Emission-free Network Infra (ENI) Since 2020
De Bermen Since 2020
Hoe creëren we een gezonde leefomgeving?
Heijmans bouwt aan de contouren van morgen en doet dat door te verbeteren, verslimmen en
verduurzamen. Daarbij ligt de focus op het toevoegen van energie, materialen en ruimte – in
plaats van onttrekken. In de bouwsector maken we afspraken over hoe we duurzaam ontwerpen,
inkopen en produceren en zo werken we samen met partners en collega-bedrijven aan een
duurzaam Nederland.
Naam Looptijd Contactpersoon
Convenant met inspectiedienst voor leefomgeving en transport (IL&T)
2015 - 2021 Martin Schotman
Klimaat adaptatie City Deal 2016 - 2020 Hans Diender
Green Deal Duurzaam GWW 2.0 2017 - 2020 Stefan Daamen
Den Haag Business Akkoord Natuurlijk Kapitaal (Natural Capital Protocol)
2016 - 2020 Heleen Herbert Jolande Baudet
Beton Akkoord 2018 - 2030 Maarten van Santvoort
Centraal College van Deskundigen (CCvD) CO2 prestatieladder SKAO
(vertegenwoordiger namens Bouwend Nederland)
Doorlopend Stefan Daamen
VBW Asfalt Doorlopend Stefan de Munck
Governance Code Veiligheid in de Bouw Sinds 2014 Werner van Eck
Taskforce Veiligheid Bouwend Nederland Sinds 2017 Werner van Eck
City Deal Elektrische Deelmobiliteit in
Stedelijke gebiedsontwikkeling 2018 - 2021 Esther Fleers
NL Greenlabel Sinds 2018 Harwil de Jonge
Convenant Klimaatadaptief Bouwen
Zuid Holland Sinds 2018 Esther Fleers
Grondstoffenakkoord 2016 - 2021 Maarten van Santvoort
City Deal ‘Een slimme stad zo doe je dat’ 2020 - 2022 Shahid Talib
Coalitie Gezond Binnen Doorlopend Shahid Talib
Stichting SPARK Campus Sinds 2014 Heleen Herbert
MVO Nederland Doorlopend Robert Koolen
Dutch Green Building Counsel (DGBC) Doorlopend Robert Koolen
Bossche Energie Coalitie (BEC) Sinds juni 2016 Heleen Herbert
Emissieloos Netwerk Infra (ENI) Sinds 2020 Stefan Daamen
De Bermen Sinds 2020 Robert Roelofsen
Lidmaatschappen en samenwerking
Hoe creëren we een gezonde leefomgeving?
Heijmans bouwt aan de contouren van morgen en doet dat door te verbeteren, verslimmen en
verduurzamen. Daarbij ligt de focus op het toevoegen van energie, materialen en ruimte – in
plaats van onttrekken. In de bouwsector maken we afspraken over hoe we duurzaam ontwerpen,
inkopen en produceren en zo werken we samen met partners en collega-bedrijven aan een
duurzaam Nederland.
Naam Looptijd Contactpersoon
Convenant met inspectiedienst voor
leefomgeving en transport (IL&T)2015 - 2021 Martin Schotman
Klimaat adaptatie City Deal 2016 - 2020 Hans Diender
Green Deal Duurzaam GWW 2.0 2017 - 2020 Stefan Daamen
Den Haag Business Akkoord Natuurlijk Kapitaal (Natural Capital Protocol)
2016 - 2020 Heleen Herbert Jolande Baudet
Beton Akkoord 2018 - 2030 Maarten van Santvoort
Centraal College van Deskundigen (CCvD) CO2 prestatieladder SKAO
(vertegenwoordiger namens Bouwend Nederland)
Doorlopend Stefan Daamen
VBW Asfalt Doorlopend Stefan de Munck
Governance Code Veiligheid in de Bouw Sinds 2014 Werner van Eck
Taskforce Veiligheid Bouwend Nederland Sinds 2017 Werner van Eck
City Deal Elektrische Deelmobiliteit in Stedelijke gebiedsontwikkeling
2018 - 2021 Esther Fleers
NL Greenlabel Sinds 2018 Harwil de Jonge
Convenant Klimaatadaptief Bouwen Zuid Holland Sinds 2018 Esther Fleers
Grondstoffenakkoord 2016 - 2021 Maarten van Santvoort
City Deal ‘Een slimme stad zo doe je dat’ 2020 - 2022 Shahid Talib
Coalitie Gezond Binnen Doorlopend Shahid Talib
Stichting SPARK Campus Sinds 2014 Heleen Herbert
MVO Nederland Doorlopend Robert Koolen
Dutch Green Building Counsel (DGBC) Doorlopend Robert Koolen
Bossche Energie Coalitie (BEC) Sinds juni 2016 Heleen Herbert
Emissieloos Netwerk Infra (ENI) Sinds 2020 Stefan Daamen
De Bermen Sinds 2020 Robert Roelofsen
Lidmaatschappen en samenwerking

45Heijmans Annual Report 2020
IN DIALOGUE WITH STAKEHOLDERS
Service technician Jaryd Bakker at the University of Amsterdam, where Heijmans is responsible for maintenance and energy performance.

Read the interview at heijmans.nl/en/news/courage-has-been-rewarded/
Courage has been rewarded The Fenix I residential complex on the Katendrecht peninsular in Rotterdam won no less than 17 prizes in 2020: from the Rotterdam Architecture Prize to the ULI Europe Award for Excellence and BNA Best Building of the year award, in the Liveability and Social Cohesion category. Developer Christiaan Cooiman: “The avalanche of prizes that Fenix I has won is a reward for the courage Heijmans has shown on the Katendrecht peninsular. As a developer, you form a relationship with an area and you feel attached and responsible. This is why Heijmans has stayed on Katendrecht, even when it got difficult. The Fenix I project was more than just the redevelopment of a beautiful old warehouse; we were at the birth, if you like, of the revival of the whole Katendrecht area. And Fenix I is just one of the many gems on the necklace we are threading on Katendrecht. The ‘Cape’ is far from finished”.
Christiaan CooimanHeijmans developer


48 Heijmans Annual Report 2020
As part of our strategy process, in 2020 we reassessed the previously conducted materiality analysis. On the basis of desk research, we took stock of the aspects that are material to Heijmans. As part of this assessment, we took into account trends in the sector and the issues relevant to clients, investors and other players in the construction sector. We subsequently invited a number of these stakeholders to discuss these aspects in concrete terms and to score them in terms of relevance. The selection of stakeholders is based on the extent to which we work together with the various stakeholder groups in the value creation model. As such, clients, collaborative partners, employee representatives and producers/suppliers are always included in the various dialogues.
We also asked a larger group of internal stakeholders to assign a score to these aspects via a survey. We asked them to assess the social impact Heijmans has on a number of material aspects. Finally, the outcome of the process was discussed in the group board and subse-quently adopted by the Executive Board. The result of this analysis is shown in the materiality matrix on the next page. The Executive Board is also involved in the manage-ment and control of material aspects, for instance by putting them on the agenda for consultations with the group board.
8 Material aspects

49Heijmans Annual Report 2020
MATERIAL ASPECTS
Heijmans has embraced the 'creation of a healthy living environment' as its key ambition and we therefore see this as our most important contribution to society. This is also recognised externally, which is reflected in how highly this aspect is valued. Since this is an aspect in which we are seeing numerous new developments, we remain alert to the tightening of our business propositions and the right performance indicators.
# ASPECT
01 Healthy living environment
02 Working safely
03 Building energy-neutral solutions
04 Circular building
05 Climate-adaptive and nature-inclusive building
06 Use of smart technology
07 Know-how development and retention
08 Being financially healthy
09 Transparent communications
10 Training and development of employees
# ASPECT
11 Reducing company’s own emissions (such as CO2)
12 Co-creation with chain partners
13 Client-centric services
14 Human rights
15 Recruitment of diverse talents
16 Employee engagement
17 Working fairly and ethically
18 Risk management
19 Privacy and cybersecurity
High
Hig
h
Low Heijmans’ impact
Rele
vanc
e fo
r sta
keho
lder
s 12
14 05
04
06
01
10
16
11
07
13
09
08
15
17
18
19
03
02
MATERIALITY MATRIX AND MOST MATERIAL ASPECTS
The first six items are considered the most material aspects and are included in the Management Approach section in the appendices to this annual report.

50 Heijmans Annual Report 2020
MATERIAL ASPECTS
Heijmans recognises the aspect of ‘working safely’ as one of its top priorities right across the company. In addition to the existing SCC (Dutch: VCA) certification and the Safety Ladder for the entire organisation, we set up a large-scale safety improvement programme: the Heijmans GO! programme. In recent years, we have developed various innovative solutions within this programme, such as the GO! app and the underlying system for reporting unsafe situations. The current programme focuses on continuous cultural change within the organisation, but also on active participation in sector initiatives to improve safety throughout the chain.
In terms of the ‘energy-neutral building solutions’ aspect, we used to look at the Energy Performance Coefficient (EPC) for buildings. This standard for the energy efficiency of buildings provided a good indication of the extent to which buildings are moving towards being energy-neu-tral (EPC=0). In 2021, the government is planning to launch a new system for measuring the energy perfor-mance of buildings: BENG. This is not entirely compara-ble with the EPC. However, both indicators have a building’s CO2 emissions as their underlying indicator, and this makes them comparable. In this report, we are using CO2 emissions to reflect this.
The ‘climate-adaptive and nature-inclusive construction’ aspect takes many shapes at Heijmans. In some projects, such as dyke raising or water storage, climate proofing is the explicit goal of the contract. But we also pay attention to climate proofing in all other projects, for example in the rainwater drainage of buildings. Our aim is for all our new area developments to meet the requirements of NL Greenlabel A.
The subject of 'circular building' is one of the strategic spearheads of Heijmans' strategy. In the design and selection of materials for new products, we now take explicit account of detachability and recyclability. In addition to initiatives in our own business operations, we are also talking to suppliers about developing circular initiatives, using alternatives to existing products and reducing packaging materials in the building chain.
The ‘deployment of smart technology’ aspect has increased significantly in importance since the previous analysis. We are recognising this development, in part because the rate at which industrialisation and digitalisa-tion are becoming part of the operational construction processes is accelerating, which justifies the higher ranking of this aspect.
Based on the dialogue with our stakeholders, the ‘financial health’ and ‘risk management’ aspects do not score highly in the matrix. However, Heijmans’ manage-ment is always fully aware of the crucial importance of risk management and financial control to the continuity of the company as a project-based operation. These aspects will therefore continue to be a high priority for the Executive Board and we will continue to focus closely on the related KPIs.
In the most recent Transparency Benchmark of the Ministry of Economic Affairs and Climate Change - a biennial study into the transparency of reporting of the 500 largest companies in the Netherlands - Heijmans came in at a very worthy 12th place last year. This means we scored the highest rating in the Construction & Maritime category and the highest ever ranking for Heijmans in this benchmark.
Financial control is crucial to the continuity of our organisation. Chapters 12 (Financial results), 15 (Financial statements) and Appendix 16.7.4 (KPI table) include the KPIs and notes that can be used to deduce Heijmans’ financial health.
You will find additional details and the performance on the material aspects in sections 10 (Strategy) and 12 (Financial results) of this annual report. These subjects are also included in the KPI table in Appendix 16.7.4 of this report.

51Heijmans Annual Report 2020
MATERIAL ASPECTS
In the future, construction firms will be the masters of material flows, says Thijs Huijsmans, circular buildings advisor at Heijmans. He is helping Heijmans to realise its ambition to build in a fully circular manner in 2023.

PROFILE
Many companies promise room for self-development, but I never expected to grow so much in just three years. This summer, I completed my HBO (higher professional education) plus training. Heijmans encouraged me to do this by saying: ‘We see that you’re growing rapidly and we want to help you. What do you want to do?’ I think that’s great. In In exchange, you do have to prove yourself”.
“ I never expected to grow so much".
Read the interview at heijmans.nl/en/news/future-heijmans/

Dwight Sichtman (32)Work planner

54 Heijmans Annual Report 2020
Heijmans does more than create value for its stakeholders, as we also focus on making a positive contribution to society as a whole. Our value creation model illustrates that long-term value creation.
The value creation model can be explained as follows:
Business ModelOperationalising our 'Creating a Healthy Living Environment' strategy is our highest priority. By realising our strategy, we are putting our mission to create healthy living environments into action. The most important pillars in this are the concepts of ‘better, smarter and sustainable’. We do this with an organisation whose core values are Result orientation, Ownership and Collaboration.
Input and outputThe input of the value creation model consists of various forms of capital and where we deploy these (from human capital to natural capital). We provide examples for each category. The output consists of our results, products and services, which are shown - with examples - in the same division of categories.
9 Value creation

55Heijmans Annual Report 2020
VALUE CREATION
Impact Heijmans used a Sustainable Development Goal (SDG) impact analysis to determine the 169 sub-goals we have the greatest impact on. To do this, we conducted desk research and interviewed various people inside and outside of Heijmans. In recent years, we have formulated KPIs for our various non-financial ambitions. Heijmans uses the performance indicators included to measure the current status in relation to value creation, with a view to continuous improvement, but also to measure the negative impact (emissions). The most important positive impact from the point of view of the value
creation model is the creation of living space, non-resi-dential buildings to work in, but also the facilitation of mobility and facilities to mitigate climate change (dykes, water storage). The main negative impacts are emissions (such as CO2 and nitrogen), raw material consumption and waste. In the KPI table in Appendix 16.7.4, we show how this relates to the goals in our strategy, to our material aspects and to the SDGs that we have selected. In doing so, we also indicate the impact we are creating in society.
Financial capital
Produced capital
Intellectual capital
Natural capital
Social capital
Land, buildings and material
INPUT
Innovation and knowledge recorded in systems
Raw materials and materials such as concrete, steel, timber and asphalt
Suppliers, subcontractors and business partners
Assets and capital invested
Committed and professional employees
Human capital
# homes sold
OUTPUT
expenditure on innovation
% reduction CO2 footprint
% revenue preferred suppliersClient appreciation:# Dutch Ministry of
Public Works and Water Management
# ProRail# private residential
building
€ EBITDA
# accidents% absenteeism
Connect
Live Work
Housing demand
Mobility demand
Availabilityof labour
Digitalisation Energy transition
Circularity
BUSINESS MODEL
Result-orientated
Ownership
Collaboration
Better Smarter
Sustain
able
Build
ing a healthy living environment
VALUE CREATION MODEL
Financial capital
Produced capital
Intellectual capital
Natural capital
Social capital
Human capital
IMPACT

Risk management is human labour
Read the interview at heijmans.nl/en/stories/five-questions-for-roland-de-waal/
‘How can we increase risk awareness at Heijmans, starting with the intake of new projects?’ This was the assignment given to Roland de Waal when he started in his new role as Chief Risk Officer. Roland saw that this would require a culture change right across the organisation. Learning to escalate issues in time and having the confidence to discuss problems were part of this shift in culture. “Entrepreneurship means taking risks, but you need to be aware of the risks and whether you can bear them, both at project level and at company level. That cultural shift is ongoing. In the meantime, our attitude has changed: we as Heijmans no longer find certain risks acceptable. I see much more risk awareness in our organisation. It is our communications and our transparency on the risk awareness front that will also help us to remain a healthy company in the future”.
Roland de WaalChief Risk Officer


58 Heijmans Annual Report 2020
Heijmans is working on the creation of a healthy living environment. Our ambition is to leave every location where we work better than how we found it. What this means is that all the activities in every project and department must ultimately contribute to this effort. Our three pillars of ‘better, smarter and sustainable’, subdivided into eight spearheads, give direction to achieving our objectives. The strength of our organisation lies in the professional skills and expertise of all our colleagues. As makers with extensive expertise and professional skills, we make the difference.
Despite the extraordinary circumstances in 2020, we continued to target our objectives and spearheads. There was no need for a major overhaul of the strategy. However, we did update some of our goals and targets. We also achieved a number of goals and formulated some new ones. The explanations of these changes are described in the relevant sections of this chapter. In total, we now have 22 concrete goals. See appendix 16.7.13 for a complete overview of these goals.
In the past year, we also moved towards greater integration between our various disciplines. By combining our in-house knowledge and experience - and innovations - even more efficiently, we can match the wishes and needs of the customer even more effectively. Standardisation and digitalisation are also resulting in greater efficiency, more scope for learning and higher safety levels. This also benefits our clients.
10 Strategy

59Heijmans Annual Report 2020
STRATEGY
Embedding the strategyThe Executive Board monitors the progress of the strategic agenda, together with the group board, which is responsible for the day-to-day operational management of the company. In addition, we have appointed officers within the organisation who are responsible for strategic spearheads. We measure our results not only in terms of financial key figures, but also in terms of progress on realising strategic, non-financial objectives, such as safety and sustainability. Appendix 16.7.4 includes an overview of all our financial and non-financial key performance indicators. This chapter only covers the performance indicators that we can report in quantitative terms and that are directly linked to our concrete goals.
10.1 Better As a developer and builder, with projects still the main driver of our business, Heijmans needs to maintain a clear focus on risks and actively steer risk management and contract management. This pillar is therefore first and foremost the internal foundation for a healthy and stable company. In addition to this, safety, quality and reliable processes also contribute to the predictability of the services we provide our clients.
10.1.1 SAFETY: WE WORK SAFELY OR WE DO NOT WORK AT ALL! Concrete goals: 1. We will not be satisfied until we record 0 accidents 2. IF < 1 in 2023 3. In 2023, the entire organisation will have reached step four on the Safety Ladder In terms of the first two objectives, we have seen stagnation in accident numbers over the years and it is proving
difficult to force a breakthrough on this front. We have the instrumental measures in place. Increasing safety is now mainly a question of behaviour. This is also the reason why we have added the third objective: the Safety Ladder not only measures the results, but also reflects the culture and behaviour of the people in the organisation. At Infra, a large part of the organisation has already achieved step four.
Key Performance Indicator Score 2020 Score 2019
Number of accidents: total incl. Subcontractors 85 84
Number of fatal accidents 0 1
Accident incidence (IF) figure 3,7 3,3
BETTER
SMARTER
SUSTAINABLE
• Safety• Risk management & process improvement• Quality of the organisation
• Digitalisation• Production technology
• Energy• Materials• Space

60 Heijmans Annual Report 2020
STRATEGY
Working continuously on safety improvement We are not satisfied with the safety results for 2020. Despite all our efforts, we saw no improvement in the figures compared with 2019. We have set the bar high, our ambitions are far-reaching, but we know why we are doing it. As an organisation, it is our responsibility to ensure that everyone works safely every single day and arrives home in good health. This is why we are firmly committed to changing from a primarily reactive to a more proactive safety culture. This requires commitment from Heijmans as an employer and principal, but it certainly also requires an active role from our people. The starting point is always: 'We work safely or we do not work at all'. We are convinced that companies that work continuously to improve safety are also the most pleasant to work for, because working safely means we think about risks at an earlier stage, there is more predictability, there are fewer failure costs, we improvise less and we therefore deliver what we stand for faster and with higher quality. A large part of the Infra organisation has achieved step four on the Safety Ladder. The goal for the entire company is still to work from step three to step four and achieve zero accidents. The IF figure increased slightly last year, due to a discontinuity in measurement. In 2019, postponed absenteeism was not included, but it is included from 2020 onwards.
N
Z
OW
YOUR ROLE OURAGREEMENTS
I set a good example and take responsibility for my own safety and that of others. I support and appreciate everyone who works safely.
I initiate discussions about safety, make dilemmas discussable and share good examples
I have read the plan and abide by work instructions
I make sure I’m aware of the risks, take appropriate measures and always conduct an LMRA when starting new activities
I call colleagues out when I see them working unsafely and appreciate other people talking to me
I report unsafe situations, so everyone can learn from these, and I invite others to give me feedback on my own safety behaviour
We take a positive and and proactive approach to safety
We take the time for safety
We always work according to plan
We are aware of risks and take measures to manage risks
We never look away and we call each other out
We improve continuously
GO! Compass
61Heijmans Annual Report 2020
STRATEGY
GO! programme in our DNAHeijmans launched the Safety programme GO! in 2013 in an effort to realise safe working conditions and zero accidents (GO = Geen Ongevallen, or no accidents). We have taken major steps on this front through the development of various resources and programmes within GO!. Despite these efforts, the reduction of the number of accidents has stagnated. In 2019, we developed a new Plan of Action to accelerate the embedding of proactive safety in our DNA. This plan has two spearheads: GO! as part of our Heijmans identity and the development of proactive safety leadership.
This resulted in the development of the GO! Compass - which records Heijmans’ safety agreements and specifies the role/responsibilities of the employee – and the inclusion of GO! (moments) in our standard working procedures. For instance, to make sure safety is embedded in our routines, we have made good conversation about safety the norm. We also explicitly connect stakeholders to our GO! ambitions. In the period 2020-2023, we are working on four objectives:
1. From a reactive to a proactive safety culture (the entire Heijmans organisation achieves step four on the Safety Ladder).2. Safety is part of the DNA of every single employee.3. We aim for zero accidents on our building sites, and to reduce the number of accidents by 20% each year compared with
the previous year. 4. We want to be leaders and trendsetters on the safety front.
The attitude and conduct of people at every single level of the organisation are crucial in this process. At Heijmans, everyone has a role to play in safety, regardless of their role, position or working relationship. Increasing awareness of everyone’s own role in and understanding of proactive safety is an ongoing process. This is why we have made the GO! programme a part of the onboarding programme for new employees. Finally, we also target clients, educational institutions and subcontractors to motivate them to make choices that boost safety in projects.
Survey Our objective is clear, but it is impossible to record progress unless you know your current status. In 2020, we conducted a survey among 2,300 employees to take stock of our current status on the safety front. The outcome provided a number of points for future development, primarily for the ‘Leaders in Safety’ programme. This is why in this training process for managers, we will focus more strongly on showing appreciation and improving feedback around safety themes.
GO! Compass The development of the GO! Compass added more depth to the GO! programme. Using the GO! Compass, employees basically live the core value: "We work safely, or we do not work at all". Four proactive behaviours are leading in this: make yourself heard, never look away, invite others and keep improving. Increasing ownership and awareness of everyone’s own role is indispensable in this culture change. The programme opts for providing resources and giving advice, rather than imposing and prescribing the only correct working method. The GO! Compass shows who Heijmans wants to be and how we work, plus what those agreements mean for our employees. This also applies to our subcontractors and suppliers. The introduction of the GO! Compass was planned for the national Safety Day in March, but unfortunately this event was called off due to Covid-19. An organisation-wide introduction via e-learning followed in September. At that time, the GO! Compass had already been implemented in phases and made recognisable.
Good examples will be followedIf we are to realise the desired proactive safety culture, we will need commitment and exemplary behaviour from managers. The starting point is clear: time and money never take priority over safety. Yet, in practice, our behaviour does not always reflect this. In addition to this awareness, caring, open discussions and providing room to learn from mistakes are very important. As is rewarding and appreciating good and safe behaviour. Following on from middle and senior management in 2019, another 1,300 executives were supposed to attend the 'Leaders in Safety' workshops in 2020. So that site managers, chief mechanics and foremen could also be more proactive in managing a safe working environment. These workshops were postponed because live meetings have more impact than digital ones. They are now scheduled for 2021. We hope that these efforts will help us realise a collective shift within the organisation. The GO! Compass is not only a tool, but also leading in terms of how we work. In September, managers were given an explanation and guidance on the use of the GO! Compass.

62 Heijmans Annual Report 2020
STRATEGY
VR TrainingOur drive to improve the current safety levels is strong, which is why we introduced an additional tool in 2020. Based on the conviction that innovations are necessary for real improvement, we developed three VR safety training courses. On a virtual construction site, employees must recognise potentially dangerous situations involving scaffolding or aerial work plat-forms. They also practice working with an aerial work platform through VR. The 3D setting not only appears to make a much greater impression on the consciousness of our employees; it also makes safety fun. Colleagues are encouraged to call each other out on potentially dangerous situations. The impact of these training sessions appears to be greater than traditional training sessions, and the initial reactions have been positive. In the coming year, we will be expanding the VR options with training in the area of tidiness at the construction site. The target for 2021 is for everyone on the construction site to follow this training, including our subcontractors.
Working Together Safely protocol This year, Covid-19 added an extra dimension to the theme of safe working. As a builder, we belong to the vital sectors of our society. So we did not and could not stop our work. However, the health of our employees, subcontractors, suppliers and clients comes first. Heijmans therefore follows the applicable guidelines of the RIVM public health institute and works according to the ‘Working Together Safely’ protocol drawn up with sector umbrella organisations Bouwend Nederland and Techniek Nederland, plus the government and trade unions. We do everything we can to create the safest and healthiest possible workplace for everyone. We consult regularly with Bouwend Nederland, fellow construction companies and sector organisations. Together, we ensure that work can continue as far as possible in a positive and safe manner.
Collaboration Heijmans and 15 other companies and organisation have worked together to improve safety in the sector since 2014. Under the Safety in Construction Governance Code (GVCB), we are working towards a standard safety policy in the sector. Heijmans plays an active role in the GVCB, both in the CEO vanguard group and in the various working groups. For example, Heijmans is leading the development of the Policy on the reduction of vehicle collision risks. Together with other initiatives, such as the generic gate instructions (Generieke Poort Instructie - GPI) and the uniform reporting application (Uniforme Meld Applicatie - UMA) and safety in tenders (Veiligheid in Aanbestedingen - ViA), this should contribute to a safe living and working environment, maximum safety awareness and attitude, effective cooperation and chain integration.
Safety in tenders (ViA)Tenders and contracts in the construction sector these days include a mandatory safety component, something we see as a positive development. As of 2021, the signatories to the Governance Code Safety in Construction (GCVB) use the Safety Ladder to make the safety awareness of organisations measurable, transparent and comparable. The Safety Ladder is already the guiding principle at Heijmans. A large part of our Infra organisation has already achieved step four on the Safety Ladder. Building & Technology are currently at step three. The main difference between step three and step four is the shift from a primarily reactive safety culture to a more proactive safety culture. Heijmans aims to raise the safety culture across the entire organisation to step four. To achieve this, we will encourage a proactive attitude among all Heijmans colleagues, but we will also foster this kind of culture at our subcontractors.
Chain responsibility Heijmans outsources 70% to 80% of its work to subcontractors. This makes us dependent to a considerable extent on our partners to achieve our safety ambitions. We therefore critically assess suppliers and subcontractors on their safety performance. Where do they rank on the Safety Ladder? From 2022, Heijmans will use the Safety Ladder as a selection criterion in our chain. This means that we will only work with companies that are at least level two certified and will encourage them to progress to level three. However, we have noticed that this subject is not at the top of everyone’s agenda. Only some of our subcontractors are working on self-certification. For us, this is a reason to continue to actively involve our preferred partners in the GO! Programme.
Education Because prevention can make the difference, we continue to work with middle (MBO) and higher (HBO) vocational colleges to embed safety in education. This enables us to ensure that future employees start their careers with the right basic knowledge and attitude for their role in the field of safety. We have developed teaching materials and give guest lectures for the likes of the Civil Engineering course at Avans Den Bosch and Avans Tilburg, the Architecture course and the minor in Architecture at the Rotterdam University of Applied Sciences.

63Heijmans Annual Report 2020
STRATEGY
Looking ahead and prevention An important key to structurally embedding safety in our DNA also lies in the way we gather and use management information. We tend to look only at indicators - such as the number of incidents and the IF figure - that show what is going wrong. Of course these indicators provide important insights, but we must realise that we then manage based on what has happened and not on indicators that may predict the future. In addition to looking at the existing management information, we want to focus on matters we do not see as a direct result, but that do contribute to a safer working environment. How often do you talk about safety before an incident? How many safety training sessions do you organise? Is safety a part of all Project Start-Ups and management observation rounds? This will help us steer more towards preventing unsafe situations from a positive perspective.
10.1.2 RISK MANAGEMENT AND PROCESS IMPROVEMENT: ALL PROJECTS ARE PREDICTABLE AND CONTRIBUTE TO OUR PROFIT!
Concrete goals: 4. In 2023, we are predictable because all larger projects (categories 2 and 3) end within the initial bandwidth. 5. In 2023, all projects make a positive contribution to our profit.
We have replaced the GRIP and LEAN objectives with the two new ones above. We successfully completed the imple-mentation of GRIP. We have sharply reduced the number of surprises in projects thanks to a wide range of initiatives. We have completed the GRIP programme and incorporated it into our regular operations by establishing the Risk Office, the implementation of a uniform risk language and the risk database, and improvements in the acquisition process. We have embedded LEAN as an improvement method in our basic processes. We will continue to focus on the learning culture in our company in the coming years. The new objectives provide us with measurable results of the initiatives we have implemented.
Categorise and standardise The categorisation of projects into three different risk classes using a standardised process and an unambiguous risk language has now become common practice. Category 1 is the least risky. Category 3 projects are the most risky, which is why the Executive Board and the Chief Risk Officer are always involved in the acquisition and planning of such projects. In order to arrive at the right risk class, we use the so-called weighting model, to determine which risk category a project falls into, based on a defined set of characteristics. The weighting model also helps us to assign projects with new components, such as innovations and software components, something we have less experience in and which may involve a raised risk profile, to a higher risk category. Each category comes with a workflow for the tender process that immediately makes clear the responsibilities, decision-making authorities, roles and tasks of everyone involved in the process. We document the tender process in a digital system in a traceable and transparent manner in accordance with the relevant risk category.
Company-wide improvements It always takes some time for people to get used to new working methods with new forms and new agreements. However, our people quickly grew to appreciate the uniformity and clarity of our new document management system and see the method as a major benefit. And the greater comparability of projects provides us with valuable insights. In addition to uniformity, the formats and the weighting model still offer room for specific interpretations per business area.
Corporate Communications has introduced a better system for real-time monitoring of social media sentiment and Heijmans' reputation. In addition, we have switched to a better system for the publication of financial press releases.
In Procurement, last year we worked on a purchasing system that will allow us to better predict and bundle the need for the most relevant product groups in various projects. With more insight into the demand for a certain product (when and how much) for the entire company, we can make better choices in terms of availability, price, sustainability and logistics. This should lead to more efficiency, sustainability and increase the predictability of projects.

64 Heijmans Annual Report 2020
STRATEGY
Our website includes an overview of our ambitions in the field of Socially Responsible Procurement.
Raising our products and services to a higher level requires commitment from and cooperation with other parties. On the basis of long-term partnerships with preferred parties, we are in a much better position to improve and become more sustainable working together. In long-term partnerships, you do not have to figure out everything from scratch for each project and you can optimise the process together more quickly.
Risk awareness and database In 2020, we completed our risk database and put it into operation. This database safeguards accumulated risk intelligence. We can take risks from the database and make these project-specific. The risk manager of a project can use this knowledge in any phase of a new project. And by using the available knowledge, we can create a good risk dossier more quickly. We evaluate risks that have arisen and, as a result, we can add to and enrich our existing risk intelligence. This adds new learning experiences to the database on a continuous basis. We have already implemented the database in the Infra business unit, while our other business units are still in the early phase of using the database.
Training Heijmans has several training programmes in the area of risk management. To continue to increase risk awareness within the organisation, all Heijmans employees follow an e-learning course. This training is mandatory for everyone and ensures that everyone knows how Heijmans views risk management. In addition, we are currently training 100 project controllers in risk management and their role in identifying and reporting risks, particularly in the early stages of a project. They also get to discuss the new rules for the evaluation of opportunities and risks and modified tools. We will start the risk management course for project management, senior project managers and design managers in 2021. In addition to the usual theory element, the focus is on risk awareness. This is another next step towards creating a more transparent and open culture within Heijmans.
On the road to an improvement culture In 2020, we continued to roll-out LEAN working methods across the organisation. In addition, we completed the GRIP programme and embedded this in process consultations. However, a structural improvement of processes will also require a change in culture. In the past, people were reluctant to talk about things that had gone wrong and there was a tendency to go on the defensive, but we now face a growing need for transparency. We need open discussions about what went wrong in projects, so we can prevent this happening the next time. We do this, for instance, during the monthly Status Update Projects (SUP). During an SUP, the project manager reports on the project to the Executive Board and the Chief Risk Officer. By communicating openly, without any emphasis on accountability, we can identify any issues and resolve them at an early stage.
Report, embed and learn Our internal processes, working methods and all the associated tools are now uniform and aligned. We have tightened the rules for the evaluation of opportunities and threats. We have secured knowledge in the risk database and because we have standardised formats and documents we all speak the same language. This prevents errors in the process and makes risk management more efficient and effective. Reports provide clear insights that we can use to manage risks. In 2020, we also perfected CRO reporting. Every quarter, the Chief Risk Officer assesses Heijmans’ risk profile on the basis of 10 keys – 10 points of attention - and discusses this with the group board, the Executive Board and the Supervisory Board. Supplying the required data is now a fixed process for all departments. Consistent reporting assigns meaning to the figures and makes trends more visible. This makes the risk profile of the entire organisation visible in a single report.
Quality figures and client appreciation Our aim is to improve continuously and we use our own criteria to achieve this ambition. But our clients also assess us. Clients acknowledge and appreciate that we are focused on improvement and being more transparent ourselves improves the cooperation with our clients.
65Heijmans Annual Report 2020
STRATEGY
Happiness is an internal programme that focuses on optimising the experience for buyers of our homes. As part of this, since 2018 we have made the entire purchase process more personal and friendly, with personal housing consultants and the opportunity for buyers to digitally visualise their housing choices and options for their future homes. In line with this effort, Heijmans Property Development opted to measure quality and client satisfaction via its own survey system from 2020 onwards. This allows us to measure satisfaction more frequently and more accurately, and to zoom in on specific parts of our contacts with clients. This gives us more flexibility to conduct more targeted research. This new method has the additional advantage that it is easier to report internally via dashboards, so we can inform the employees involved about details and conclusions more easily.
Performance assessments Ministry of Public Works and Waterways (Rijkswaterstaat) and ProRail (8.7 and 7.6)In the performance assessments of these two major Infra principals, Heijmans scored an 8.7 and a 7.6 respectively. Heijmans’ own target is to score a minimum of 8.5 in terms of client appreciation from our focus clients, the same target we set in 2019.
This target shows that Heijmans considers a high level of client satisfaction to be important. Compared with the previous year, we saw a strong improvement in the score given by the Ministry of Public Works and Waterways (RWS) (7.5 in 2019), while ProRail’s score dropped slightly (7.9 in 2019). In RWS client assessments, we saw an encouraging improvement across the quarters in 2020. We are currently in talks with ProRail about potential improvements.
Quality checks at clients The construction of the new office for the European Medicines Agency, a joint venture between Dura Vermeer and Heijmans and one of Heijmans' biggest projects in recent years, was judged very positively by the client, the Dutch government’s Real Estate Agency (Rijksvastgoedbedrijf). Their assessment method looks primarily at attitude and behaviour elements. The agency was particularly positive on our professionalism and commitment, combined with the high quality of the end result and safe delivery within schedule. The measuring points cooperation, systematic work, expertise and quality received an average score of 9.4, on a scale of 10. Safety and health came in at 8.8, taking the Past Performance Total Score to 9.2.
10.1.3 QUALITY OF THE ORGANISATION: WE ARE THE NUMBER ONE EMPLOYER IN THE CONSTRUCTION SECTOR!
Concrete goals: 6. We reduce the number of colleagues that leave at their own request by 50% each year. 7. We reduce the costs associated with absenteeism by 5% each year. 8. In 2021, we have a higher employee engagement score than in 2019.
We have removed the bold statement 'By 2020, all managers have participated in a leadership training programme' from the list and – in connection with Covid-19 - the final training courses are scheduled for 2021. Under ‘Unwanted departure’, we measure the percentage of our colleagues who chose to leave the company despite a good evaluation. We consider their departure a loss for the organisation and want to reduce this form of employee turnover in the f uture. The ambition of a 50% reduction per year is ambitious, but reflects our ambition to engage and retain high- performing employees. With regards to absenteeism, since 2020 we have focused on reducing the absolute numbers rather than the associated salary costs, because we want to combat absenteeism equally at all levels. We measure employee engagement every other year, so we have no progress to report on this statement in 2020.
Key performance Indicator Score 2020 Score 2019
Staff turnover (%) at own request 4,6% 5,4%
Total absenteeism 4,7% 4,4%
Number of managers who have participated in a leadership training course (%)
79% 47%

66 Heijmans Annual Report 2020
STRATEGY
Kade Zuid, Noorderhaven, Zutphen

67Heijmans Annual Report 2020
STRATEGY

68 Heijmans Annual Report 2020
STRATEGY
Creating a healthy living environment was more relevant than ever in 2020, both for our clients and for our own people. The dominant question in 2020 was: how do we help our employees to continue their work in a healthy and safe manner, despite Covid-19? We have fully committed to this by implementing various (preventive) measures, communicating intensively through various channels and giving people personal attention wherever possible. Thanks to the 'Working Together Safely' protocol - and the accompanying safety measures – we were able to continue working on location. But our office-based employees who were able to work from home also faced a major change. With a high percentage of employees working from home, we put a great deal of focus on counteracting social isolation and maintaining connections with people.
HR continued to professionalise its operations and working methods in 2020. The key elements in this drive were the development of uniform working methods, the deployment and expansion of the Workday HR platform and the focus on a number of clear targets. Uniform management and improved cooperation within the department are accelerating innovati-ons. This is helping to drive a shift in attention from operational activities to longer-term opportunities and risks right across the organisation. By continuing to develop the back-office functionalities, we are creating room for our HR managers to shift towards a more advisory role, supporting our management.
The spearheads defined in consultation with the business areas are: HR Transformation, Recruitment, Learning & Educating, Talent development and Vitality. All of these areas have room for long-term development. In 2020, we worked out the first requirements of internal clients in more detail.
Time through transition Many day-to-day HR-related tasks are labour-intensive. As part of our professionalisation of HR, we are improving processes and working towards a single Heijmans-wide HR system. Following the introduction of Workday in 2018, we implemented that system right across the organisation in early 2020. In the course of the year, we subsequently set up and linked up the case management in the Verzuimsignaal (absenteeism signal) system. We then continued to develop the function within Workday that supports the annual salary review. The new salary module gives managers real-time insight into the room we have to increase salaries and the underlying statistics. All of this together, gives us the option of focusing on specific target groups, giving the salary review more tactical significance for managers. HR also recruited a data analyst to set up the basis we can use to develop action plans and future policies on a more factual basis.
Vitality In the first phase of the Covid-19 pandemic, we were confronted with a very high level of absenteeism, which required extra guidance from the HR department and our Occupational Health and Safety Service. Despite this, we finished the year with absenteeism figures that were only slightly higher than in 2019. This means that we failed to meet our target for improve-ment, but bearing Covid-19 in mind, we still ended up at an acceptable level in 2020. Once we had provided adequate protection, instructions and disinfectants, we were able to continue working safely at our building sites. Anyone showing symptoms of the virus, or anyone sharing a home with someone who is ill, has to stay at home. Many colleagues were able to continue their work from home. For project-related staff, this was often not possible; they were sometimes not allowed to go to work even though they did not feel ill. They account for their hours using a new code for time registration: 'Covid-19 - not sick'. This provides insight into a new form of unproductivity due to Covid-19. These reports are not counted in the absenteeism numbers. To prevent situations in which people sit at home in uncertainty for a long time, Heijmans purcha-sed vouchers for Covid-19 tests. Approximately 250 colleagues made use of this form of waiting list mediation.
There are major differences in absenteeism within the Heijmans organisation. During prevention and absenteeism meetings, managers, in cooperation with our Occupational Health and Safety Service Centre (ASC), look for early signs of absenteeism and the specific patterns of absenteeism within a department. We also dedicated a great deal of attention to the vitality of our employees. During last year’s Vitality Week, we organised webinars and lunchtime walks everyone could sign up for. This is a subject that is very much front of mind among our employees.
Targeted recruitment In the year under review, we processed 700 vacancies. We recruited people for new projects, but also to replace people who retired or left for other reasons. Following the expansion of our recruitment team, HR is now less dependent on external secondment agencies. Over the past year, HR has developed a targeted approach for three strategic target groups: electrical engineers, project leaders/project managers and campus recruitment for higher vocational (HBO) and university (WO)

69Heijmans Annual Report 2020
STRATEGY
students. Last year, we also set our sights firmly on targeted recruitment by referral; employees themselves recruit new colleagues. And with a good deal of success: 20% of new employees joined Heijmans via referrals from exiting Heijmans employees. On top of this, in 2020 we made a start on the development of a new employer brand. This will enable us to profile Heijmans in the labour market in a recognisable manner in 2021.
Reference date 31 December 2020
Attention for diversity: celebrating differences Heijmans still has work to do in terms of diversity and making the most of differences. It is important that, as an employer, we become more appealing to groups that are currently underrepresented in our organisation, such as women and people with a non-Western migration background. Not only because we will then be able to attract more people in a (very) tight labour market, but also because we will be able to do our work even more effectively if the organisation is a good reflection of society as a whole. Our ambition to become more diverse applies across the company and at every level of the organisati-on, from operations to the Executive Board and Supervisory Board. In 2020, we translated this policy into concrete operatio-nal targets for three types of diversity: gender, age and cultural diversity. The proportion of women in our workforce is growing steadily, but too slowly. To raise awareness and provide tools to bridge differences, we organised a webinar on female leadership. In order to attract young talent, we once again recruited large groups of apprentices and trainees in 2020, which led to a further drop in the average age of Heijmans employees. We also recruited 13 (former) asylum seekers with residence permits in 2020. They were recruited with the help of the UAF (the foundation for refugee students) and will first spend a year working at Temphory, where they will receive guidance and extensive professional training before joining Heijmans. Running parallel to this process, Heijmans has launched a buddy initiative within the company. By training colleagues and making them aware of their own cultural programming, we are working towards a culture in which we recognise and make the most of differences. We celebrate differences!
Focus on talent We ran our annual fleet review along uniform lines in the year under review. This led to valuable insights and good conversations about both talents and the necessary organisational and leadership development in the various parts of the company. We started or continued leadership development processes in all business areas in 2020, focusing on personal skills, team performance and joint focus. In terms of talent development, we need to broaden this to include a wider range of skills and competencies. High potentials are still developing too narrowly within their own discipline and working environ-ment in the course of their careers. As a result, we are left with more specialists than all-round managers and we still need to recruit from outside the company to fill leadership positions. Our goal for 2021 is to fill 60% of key positions from within the company.
Personnel numbers 2020 2019
Employees aged up to 24 150 120
Employees aged 25 through 39 1.393 1.373
Employees aged 40 through 54 2.136 2.123
Employees aged 55 and up 1.154 1.158
Total 4.833 4.774
Inflow and outflow 2020 2019
Inflow 509 497
Outflow 450 435
Absenteeism 2020 2019
Absenteeism 4,7% 4,4%
Diversity 2020 Man Vrouw
Numbers male/female 4.215 618
Ratio male-femaleHeijmans total
87% 13%

70 Heijmans Annual Report 2020
THE MANAGEMENT
Carpenter Peter van Sloun at a renovation project in Sittard, where we are working in face masks and gloves for the safety of both colleague and local residents. After all, renovations generally involve a lot more work inside buildings.

71Heijmans Annual Report 2020
STRATEGY
Learning and development At Heijmans, we attach a great deal of value to training. The Heijmans Academy processes many thousands of training requests every year. Unfortunately, due to Covid-19, we were not able to run all training courses last year. We did manage to continue the majority of our training courses on substantive themes and mandatory (re)certification, often in digital form, which ensured we could continue our operations outside the company. However, skills training in particular requires physical meetings. Where possible, we chose to reschedule in smaller groups, but we have now reached the limit in terms of how effective this training is. As long as group training is not possible, we will be selective in terms of starting new courses.
Modern employership Our way of working is set to change permanently as a result of Covid-19. In the expectation that employees will continue to work (partly) from home, we made home work stations available to every employee at the end of 2020. At the same time, we announced that a number of schemes and allowances would be adjusted in 2021, to support changing working patterns.
The results of a benchmark review performed by employers’ organisation AWVN in 2020 are set to lead to adjustments that will improve Heijmans' competitiveness in a tight labour market. Greater flexibility in terms of employment conditions and regulations could also improve employee satisfaction and increase Heijmans’ attractiveness as a modern employer. We will do our utmost to achieve this in 2021. Specific attention for diversity and inclusion and sustainable employability will help us to achieve our goal of making full use of everyone's talents.
10.2 Smarter The built environment is becoming increasingly interactive thanks to intelligent systems that generate data. Such data helps us to serve customers more effectively and to add more value to our products. These times call for integrated solutions to complex issues and digitalisation will help us come up with those solutions. Heijmans' ambition is to continue to play a leading role in the design, realisation and management of the built environment, and by doing so play a part in making the chain smarter.
10.2.1 DIGITALISATION: DIGITAL BUILDING IS AS IMPORTANT TO US AS PHYSICAL BUILDING!
Concrete goals: 9. All the projects we work on will have a digital twin in 2023 10. We launch five new data-driven services in the market each year 11. The number of subscriptions based on data-driven services in the in-use phase increases by 50% each year
In 2019 and 2020, we successfully launched six data-driven services on the market. These included five Beyond Eyes-related services (BE Equipped, BE Clean, BE Energized, BE Safe and BE Vital) at Building & Technology and one at Infra: artwork monitoring, based on Heijmans’s predictive maintenance expertise. Our first target for data- driven services ran until 2020; we have now replaced this with targets 10 and 11, to lay down our growth targets for the coming years. We want to develop new services and highlight the scalability of digital services. In many of our projects, we are already designing and building digitally first to identify problems at an early stage, and we will continue this development.
Key Performance Indicator Score 2020 Score 2019
New data-driven services successfully launched on the market 4 2

72 Heijmans Annual Report 2020
STRATEGY
Digitalisation is developing rapidly in the building industry. Step by step, we are expanding the use of digital applications within Heijmans. This increases the safety and predictability of our work. But it also enables us to work in an increasingly sustainable, circular and energy-neutral way. In 2020, we made solid progress in our ongoing digital transformation, both internally and externally. We are using new technology and concepts to make more and more connections between the physical and digital worlds. All our products run on a central platform. Bringing all the data together in one place gives us more insight, improves efficiency and helps us to create new applications.
Digital twinsA couple of years back, we developed a methodology for our digital twins project, with a common language and the BIM ladder as benchmarks. Over the past year, we have translated and implemented this method uniformly for all our business areas. As part of this, we set different ambitions for large, medium-sized and small projects. This means that we now determine the ambition level for each project using the BIM ladder. This indicates the extent to which we use BIM & GIS during the development, design, construction and maintenance processes of the project. We then draw up quarterly reports on whether we are realising these ambitions. We have many tools and resources that we can use to achieve the right ambition level, and we have shared a lot of knowledge on this front, especially within Infra. Thanks to these efforts, more people now know about the tools and use them. They have also become a differentiating factor in our tenders.
Digital design With the help of digitalisation, we have also made further progress in the optimisation of our design process. An umbrella programme controls the design software. This quickly shows changes in premises or information, so we can adjust the design immediately or automatically. The automation of the data flow in the design process has led to a shift in the work of calculators and designer: from preparing calculation files to quality assurance on the calculations and the evaluation of the results. The automation of the design process not only results in direct returns in production; it also gives designers the freedom to investigate more and accelerates the entire process.
Digital tools To ensure we are well prepared for the execution of a project, we use a number of digital tools in the preparation stages. This provides insight into numerous areas of a project, so we can make adjustments in time. We map out the soil (geophysical measuring technologies) and the surrounding area (use of drones) in 3D, design the construction site and simulate the building process. In the execution, we use user-friendly applications to make our quality registrations as effective as possible.
Data-driven services Our goal was to successfully launch 10 data-driven services in the period through 2020, with the focus on services we could deploy in various projects and at various clients. In 2020, we successfully launched six data-driven services. These included five Beyond Eyes-related services (BE Equipped, BE Clean, BE Energized, BE Safe and BE Vital) at Building & Technology and one at Infra: artwork monitoring, based on Heijmans’s predictive maintenance expertise. For Schiphol, we developed a system to monitor the use and behaviour of the so-called ‘avioduct’ (aircraft bridge) over the A4 motorway. We measure the movement of the avioduct in micrometres, which gives us valuable information about its lifespan and the optimum frequency of maintenance.
In addition to these six data-driven services, which we have deployed at several projects and clients, we have a number of other data-driven services for which we have launched pilots and signed the first subscription deals, such as asphalt monitoring and e-mobility. These services, such as the remote monitoring of asphalt processing and traffic flows, are also based on Heijmans’ predictive maintenance expertise. Data processing and data analysis are now core activities at Infra and Heijmans' own software/data engineers are constantly alert to new opportunities.

73Heijmans Annual Report 2020
STRATEGY
SmartLiving becomes HealthyLivingSince 2015, we have applied the SlimWonen (smart living) package in some 50 projects involving hundreds of homes. This practical system enables residents to control and monitor lighting, blinds, heating and security. The next step is sensoring: measuring air quality, CO2 and nitrogen levels in and around the house. And all this data can be linked to an alarm system. This enables our clients to make better choices for a healthy living environment: HealthyLiving. In 2021, we will develop this concept further.
10.2.2 PRODUCTION TECHNOLOGY: WE WILL WORK MORE FREQUENTLY ON THE BASIS OF STANDARDISED PROCESSES AND PRODUCTS!
Concrete goals: 12. In 2025, we will have transferred 50% of our hours - compared with 2020 - from on-site to off-site.
This target replaces the 'in 2023 we will build 50% conceptually' target, as the latter proved very difficult to measure for a number of business areas. In 2021, we will make this new target measurable and establish the benchmark. The shift from on-site hours to off-site is a measure of the industrialisation and standardisation we envisage. These are necessary to achieve objectives related to safety, sustainable employability, quality of the delivered products and value for the customer and the reduction of failure costs.
From thinking in in terms of unique projects, we are moving rapidly towards the standardisation of our share of processes, projects and products. We will build conceptually, build on a modular basis and use smart logistics and technology on and around the building site. On this 'production technology' front, we once again applied new initiatives to projects in 2020. By optimising concepts and technology - more standard, but with a high degree of flexibility - we will be able to meet our clients’ wishes more closely. In addition to this, we are conducting research into innovative materials - for example, wood construction and circular materials - and working closely with specialist parties in the market.
Concept homes Heijmans develops and builds affordable concept homes with a high degree of standardisation. And thanks to the various types of homes and the numerous add-on options, we can offer our clients both variety at the benefits of standardisation. Demand from the market is growing now that the results of our research and development are becoming visible and tangible. On the sales side, we developed the Residential Configurator: buyers can choose from various options and their wishes are translated directly into planning and production in the system. In 2020, we completed and delivered 846 concept homes (in 2019: 738). Since 2013, we have delivered 3,780 concept homes. In addition, our compact XS home and the Heijmans ONE are perfect solutions for the persistently tight housing market.
Smart logistics Smart City Logistics is aimed at emission-free inner city transport of materials and equipment for building maintenance. In the future, all suppliers of materials will share at an early stage what is needed, when it is needed and in which part of the city it is needed and then deliver their materials to a hub on the edge of the city. In that hub, we will cluster all materials per project and deliver them to the building site with the minimum number of transport movements. Two years ago, we launched this system to reduce building-related traffic in the city, which currently accounts for more than a third of total traffic. In addition, inner city projects often have limited room around the building site. The smarter we use space, the better and safer we can work. With Smart City Logistics, we never have unnecessary materials and equipment on the building site.
Key performance Indicator Score 2020 Score 2019
Concept homes - delivered 846 738

74 Heijmans Annual Report 2020
STRATEGY
10.3 Sustainable AAs a trendsetting player in the construction sector, we want to play a leading role in improving the sustainability of our living environment. The ultimate goal is to no longer extract energy, materials and space, but instead add to the living environment and by doing so create value. That applies not only to materials, but also to the use of space and energy. We are convinced that buildings should not be without energy; they should actually generate energy via the use of smart applications. We are working hard on realising that objective. The contours of tomorrow are on the drawing board today.
10.3.1 ENERGY: OUR PRODUCTION IS CO2 NEUTRAL AND WE CREATE ENERGY-NEUTRAL SOLUTIONS FOR OUR CLIENTS!
Concrete goals: 13. From 2023, Heijmans is CO2 neutral. Any residual value is offset. 14. In 2023, we can produce emissions-free, and in 2030 we do so on all our projects. 15. In 2023, we can deliver 100% energy-neutral solutions for our clients.
We have already made considerable progress in reducing CO2 emissions and we will continue to do so. We have also noted that in different markets, clients are moving at different paces on this front. We added target 14 because we want to look beyond just CO2, partly in response to the developments surrounding PAS and PFAS (nitrogen emissions). With the target of CO2-neutral production by 2023, Heijmans would more than meet the projected science-based target of COP21, which calls for a linear reduction in CO2 emissions of more than 4.2% per year. By 2020, we had not yet delivered any energy-neutral projects. However, we have submitted several tenders on this front – including the recent innovation section of the A58 motorway. We are seeing increasing client demand on this front and we are already actively offering clients solutions that would enable us to team up to meet this challenge.
In order to achieve CO2-neutral production, we have drawn up an Energy Management Plan. This plan includes various measures to reduce CO2 emissions resulting from the company's activities in the coming years. The most important categories in this respect are increasing the sustainability of our construction sites, equipment, offices and mobility (vehicle fleet). Examples of projects in this context include our investments in emission-free equipment and the installation of solar panels at offices and in the chain, including our head office in Rosmalen.
Another mechanism we added to the budget process last year, aimed at a further reduction of emissions, was internal CO2 pricing. This creates a fund to promote additional investments in sustainability. Heijmans has certified its business activities to the highest level of the CO2 performance ladder of SKAO (foundation for climate-friendly procurement and business). Heijmans also reports its emissions as part of the international Carbon Disclosure Project. This helps to map trends and developments in the area of climate change.
Sector responsibility Heijmans is taking its responsibility to move the infrastructure sector forward with regards to reducing emissions. Together with our peers GMB and De Vries & van de Wiel, Heijmans set up the Emission-Free Network Infra (ENI), with the aim of accelerating the energy transition in the infrastructure sector by four years. In doing so, we are anticipating the ambition set out in the Green Deal to become climate neutral and circular by 2030. So far, 35 parties have joined this effort. Thanks to the pooling of knowledge, we can make a huge jump in scale. And clients are also noting our efforts: ENI played a role in our acquisition of an innovative tender for the Sterke Lekdijken dyke reinforcement project.
Key performance Indicators Score 2020 Score 2019
Absolute CO2 emissions scope 1+2 (tonnes) 42.507 45.543
Average EPC of homes delivered 0,33 0,40
Average CO2 emissions of homes (kilos) 1.409 -

75Heijmans Annual Report 2020
STRATEGY
Heijmans Energie BVThe development of the energy transition is clearly visible in the market. This involves the construction of subsystems, but also and more specifically the integrated energy system in which the various components function optimally in conjunc-tion with each other on a daily basis for end users. Heijmans already supplies various energy subsystems, including a new installation and service related to charging infrastructure added in 2020. We also have the ambition to design, build and operate integrated energy systems. To this end, we set up Heijmans Energie BV, the place where we combine all our efforts in the field of energy. We are starting with energy systems for Heijmans' own developments and, parallel to this, we are already active in the market.
10.3.2 MATERIALS: WE ARE TARGETING 100% CIRCULAR CONSTRUCTION IN ALL NEW PROCESSES IN 2023!
Concrete goals: 16. All our quotes include a calculation of the environmental performance. In 2023, we will include that as standard
in all our quotes to clients. 17. In 2021, all packaging in our construction projects will be 100% reusable or recyclable. 18. In 2023, all the houses we deliver to our customers will be 100% circular. In 2030, this will also apply to
apartment buildings. 19. In 2023, we will use circular asphalt and concrete; in 2030, we will build 100% of our projects using these materials.
We tell our customers not only what they get in terms of functionality and price, but also the environmental performance of the product delivered. How we do this varies according to the common standards in the sector. In larger Infra projects, it is usually the MKI value (environmental cost indicator), in housing projects the MPG value (Environmental performance indicator), while non-residential projects use the MPG value or BREEAM score. We have fine-tuned and rolled out the methodology the various business areas apply to work towards our ambition level at their own pace. We use the CPG score (circular performance) for the circularity of our homes. By separating layers and applying light inner walls to houses, we managed to improve their CPG score to 8.5 in 2020. The concept houses we sold in 2020 had an average CPG score of 7.8.
We want to meet our clients’ requirements with solutions that have the minimum impact on the environment. That means that we think about the materials we use and reuse, about the optimum life of our building works, and about renovation rather than new-build. And that starts at the drawing board. We are helping to increase awareness on this front, but we are also taking concrete steps. For instance, we plan to make our standard products, including our concept homes, circular. But we also want to reduce the impact of pollutants – such as asphalt, concrete and steel – on a continuous basis, and eventual-ly replace these materials with cleaner alternatives, and we will use our influence in the chain to achieve this ambition. For instance, by rejecting packaging or making it recyclable, and by choosing logistical solutions that avoid unnecessary transport movements.
Matching MaterialsHeijmans developed 'Matching Materials' to promote the reuse of raw materials and building materials. This online platform is used to trade raw materials and building materials when they become available. It is important to find existing materials and reintroduce them into the production process. Within Heijmans, building materials such as asphalt and sand are already finding a new destination via this platform. In the coming period, the platform will be expanded to accommo-date the supply and demand of building materials, as well as raw materials. We are also planning to open the platform up to the supply and demand of other players in the market. Matching Materials is now an independent B.V. and ready to find its place in the sector independently of Heijmans. As the founder of this initiative, Heijmans will of course remain active as a client on the platform.

76 Heijmans Annual Report 2020
STRATEGY
From ownership to lease The constant change of ownership is a hurdle in making sustainability possible. We are investigating models in which the producer retains ownership of materials and remains responsible for taking them back, with Heijmans setting requirements on aspects such as return logistics and circularity. An example of this is circular industrial clothing. In 2021, we will launch a market call for tenders based on the principle that work clothing remains the property of the supplier. The supplier takes the clothing back and it can then be used to make new clothing. Leasing is already common practice for IT equipment and cars, for example, although sustainability requirements are not always imposed in those areas. For a building façade or a window frame, for example, this is more complicated. Nevertheless, we are also investigating whether we can arrive at a different system of ownership for materials of that kind.
Packaging The implementation of Heijmans’ sustainable packaging policy is progressing well. In line with the 2020 target, the requirement for fully recyclable packaging has now become standard in all relevant contracts. The next steps are to enforce this requirement and to dispose of packaging in a circular manner by 2023. We are experiencing a great deal of goodwill and cooperation from the market on this front. To monitor our progress, we have developed a measurement methodology and set up a uniform reporting system. The market is showing great interest in our approach and we are more than happy to share our ideas and insights.
Tooling and methods We take part in the CB23 (Circular Construction23) platform, a joint initiative involving the government, major clients, consultants and other construction companies. Together, we are developing a uniform language for a more effective transition to circular construction. At Heijmans, we are anticipating this by frequently including calculations of environ-mental costs in our tenders.
We do this using the LCA (Life Cycle Analysis) score, for example. The idea is that we not only tell our clients what they are getting in terms of functionality and price, but also the environmental performance of the product we deliver. The way this is done depends on what is customary in the relevant part of the sector. In (larger) Infra projects, this is usually the MKI value. At Residential building, we use the MPG value, while at Non-residential building we use the MPG value or BREEAM score. We have fine-tuned and rolled out the method the various business areas will use to work towards the ambition level at their own pace.
AsphaltLast year, we entered into a partnership with BAM to enable us to achieve our goals in the field of circular asphalt. As of 31 December 2020, our asphalt plants have been merged into the new company AsfaltNu. We are pooling our knowledge, expertise and investments in the field of asphalt production to make the asphalt chain more sustainable and improve efficiency. AsfaltNu will not only work for Heijmans and BAM, but will also serve third parties in the asphalt market. As an asphalt producer, until recently Heijmans purchased the raw materials. Now that Heijmans has set up a new independent asphalt company with BAM, the situation is changing: instead of buying the raw materials, Heijmans will now buy the end product. This means that from now on, we will have to include our sustainability and circularity principles and require-ments in our purchasing process. This also mean we will manage our meeting of this target in a different way, focusing more on the realisation of circular road construction than on circular asphalt alone.
To counteract any future inconvenience caused due to increased rainfall and ever-higher temperatures, adjustments will have to be made to the urban environment in the coming years. As a trial, we fitted a street in Breda with KlimaFlex. This climate-adaptive asphalt is a first in the Netherlands. The advantage of KlimaFlex is that water is retained longer in the asphalt ‘package’, which has a cooling effect on the environment. In addition, it reflects sunlight off the road surface, which keeps the temperature of the road surface lower. Both the asphalt and the foundation store water. Both sections have a high percentage of hollow space, so rainwater flows more slowly via the asphalt and the rubble beneath into the subsoil.

77Heijmans Annual Report 2020
STRATEGY
Concrete With our target of 100% circular concrete by 2023 in mind, we started several initiatives in the year under review. In a number of sub-programmes, we are conducting research into different mixtures and alternative raw materials for concrete. Since the origins of our materials are becoming increasingly important, mutual openness and transparency are essential. This is resulting in a shift in the parties we work with, but also in the way we work together. In 2020, we built a test section in Zwolle at the Hessenpoort industrial estate, part of the Hermelenpad cycle path. We used concrete consisting of 100% recycled gravel, 50% recycled sand and 15% recycled cement for this cycle path. This reduces the environmental impact by 35% compared to a concrete mixture containing 30% concrete granulate. These high-grade raw materials are retrieved from existing concrete using the SmartCrusher concept. This involves new collaborations but also a different way of working together, which contributes to making concrete 100% circular. For 2021, we are planning at least two more projects in which we will continue to develop this concept.
Heijmans also participates in the Concrete innovation desk. This is an initiative of principals and market parties to increase the speed at which innovative concrete and concrete products are used. In effect, we are helping new developments to find their way to the market more quickly.
Hazardous substances In the context of safety and sustainability, it is very important that we minimise the use of hazardous substances and that we actively seek alternatives. We have set up a working group consisting of those responsible in relevant parts of the organisation to identify how we at Heijmans can improve the storage and handling of hazardous substances that arise during our work. Thanks to these efforts, we have taken to major steps in the registration and monitoring of the use of hazardous substances. The Safety Department and the working group will take the next steps in 2021 and beyond to systematically reduce our use of hazardous substances.
10.3.3 SPACE: OUR DEVELOPMENTS ARE BLUE, GREEN AND SAFE!
Concrete goals: 20. From 2020, all our new area developments are awarded a Greenlabel A rating. 21. In 2023, all our interventions in the built environment result in an improvement in local biodiversity, climate
adaptation and safety. 22. We apply our latest solutions in three project each year, and these will then become new showcases of a healthy
living environment.
We have chosen the Greenlabel as our benchmark because it is easily quantifiable and is widely used in the market. We have adjusted our target to a Greenlabel A rating for all new area developments (2019: in 2023, all area developments will score Greenlabel A). We do also look at current area developments to see how we can get as far as possible towards Greenlabel certification, but it is difficult to adjust the ambitions for area developments that have been in existence for some time. We also take a proactive approach to objective 21: for example, if we lay asphalt somewhere, we discuss with the client whether we can also realise a form of water storage. We have extended the last target and this now relates to all business areas and not just to blue, green and safe, but to a healthy living environment. The intention is that our focus on a healthy living environment will eventually no longer be a showcase, but structurally embedded in our way of working.
Our ambition goes beyond the creation of a healthy living environment. Our goal is to leave the environment, in all the places where we develop and build, better than we found it. To this end, we apply our knowledge and experience in the fields of ecology and water management. The Netherlands must be better protected against flooding, heat and drought due to climate change. Clean air and sufficient green and blue spaces are also prerequisites for a healthy living environment. At the same time, we are working on creating a safe living environment, both physically and socially. This is why we continue to develop smart solutions for healthy and safe neighbourhoods and residential areas and safe traffic.

78 Heijmans Annual Report 2020
STRATEGY
All new area developments that we develop on our own or acquire must achieve a Greenlabel A rating. We set this require-ment for ourselves and encourage our clients to do the same. We will also do our best to achieve this label retroactively for existing developments. Greenlabel A will become our standard. This requires an integrated approach to area development. We develop an appropriate plan based on a comprehensive analysis of the opportunities and challenges of an area. To do this, we draw on a wide range of measures and solutions - existing and new - that make the area green, sustainable, biodiverse, nature-inclusive and climate-adaptive, but also healthy and safe. Although each project is unique, in every project everything is always interlinked. This is why it is important to bring all wishes and ideas together at an early stage. This enables us to develop an integrated design and an efficient area-specific approach.
Partner in discussions with municipalities As an organisation with an integrated vision, we increasingly find ourselves at the table with municipalities as discussion partners. We join them early in the process to discuss and share ideas on how they will meet the challenge of preparing their town or city for the future. This goes beyond products and projects, and includes the strategic sharing of know-how. Municipalities are looking for solutions and ideas that are scalable. Thanks to our experience in area development, we can add innovations to the process.
Our vision of area development is expressed in the Smart City concept: an integrated approach to creating healthy living environments, by connecting smart products and allowing multiple technological solutions to communicate with each other. This requires a different way of looking at a project and different discussions with clients. It also means that we are involved in a project for a longer period of time. At the front end as consultants and after delivery as providers of data-driven services in the field of insight, maintenance and service.

79Heijmans Annual Report 2020
STRATEGY
Tower crane operator Roy Viveen took this photograph of the sunrise over the Greenville project in Leidsche Rijn, Utrecht.

Read the interview at heijmans.nl/en/news/future-heijmans/

Tansu Yigit (28)Buyers assistant
In the projects I assist on, I can see that Heijmans wants to go further than simply meeting the project requirements. What’s great about Heijmans is that colleagues are open to change if it helps improve our work. For instance, I suggested changing the design of our buyers-options drawings. We didn’t have a uniform approach and neither I nor the buyers understood the codes in the drawings. If my colleagues hadn’t agreed to this change, I would have accepted it. But now we have a new system that is clearer for everyone”.
" We are open to change"

82 Heijmans Annual Report 2020
We look back on a year like no other, in which, apart from the PAS/PFAS emissions issue, Covid-19 in particular had a huge impact and required extra efforts from everyone. Nevertheless, knowing what we know now, we can look back on 2020 with some satisfaction. Our financial results are good and our health and safety spearheads proved more relevant than ever. Both for our own people and in our ambition to create a healthy living environment.
Resilience and agilityFor a large part of the year, the majority of our office staff worked at home, using Microsoft Teams. Apart from the home situation, this demanded a lot of extra energy from everyone. More and more of our people are feeling the lack of social contact with colleagues, especially now that the virus is continuing to mutate and vaccines are only available on a limited scale for the time being.
Our organisation also proved to be sufficiently agile. Where work was lost in whole or in part, new requests and contracts were added and we were able to respond flexibly to the new situation.
The speed of economic recovery is relevant to our medium-term prospects. We are an organisa-tion with a solid foundation in the submarkets in which we operate and we are building on the
11 Year in review per business area

83Heijmans Annual Report 2020
YEAR IN REVIEW PER BUSINESS AREA
solid foundation of recent years. We actively aim for predictable results and strive to be operationally and financially in control, on all projects in every phase. However, it is just as important that we use each and every project to take the biggest step we can towards realising that healthy living environment.
Working Together Safely protocol The construction industry was able to continue work during the Covid-19 outbreak, thanks in part to the ‘Working Together Safely’ protocol, which was drawn up in collabora-tion with the sector organisation Bouwend Nederland. Nevertheless, the situation did have a major impact on the work at our building sites. Especially in the early stages, the introduction of 1.5-metre distancing rule required a wide range variety of necessary measures: one-way traffic on the building site, different break times and extra spaces, hygiene measures and special coaches to supervise distancing. It required a lot of adaptability from everyone and it did result in extra costs. But securing the safety and health of our people working on our projects was and remains our top priority. Thanks to everyone’s efforts, we managed to continue work successfully within the prevailing parameters.
Integrated approach In recent years, the organisation has developed and changed and our integrated approach is now very firmly centre stage. We have taken major steps in all business areas when it comes to process improvement. Standardisation, digitalisation and greater uniformity enable us to better connect people and knowledge. We collect, share and secure information centrally. We are increasing the predictability of projects. Automating processes is creating room for the human added value that makes the difference: our professional skills. All in all, this enables Heijmans to offer integrated solutions and services. We work together across business area boundaries, share knowledge and expertise and accelerate innovations. This strengthens our differentiating potential in the market. The launch of Heijmans Energie and Heijmans Hive was also based on the shift to an integrated approach.
Heijmans Energie B.V.We founded Heijmans Energie in 2019 as a link between external demand and internal supply in the field of energy. From design, implementation to maintenance and operation. This team connects all Heijmans' business areas: from Residential Building and Non-residential Building to Infrastructure, Technology to Property Development. Our Energy team focuses primarily on heating, cooling and electricity. This includes thermal storage and heat pumps, but also solar panels and charging stations for eMobility
purposes. We have invested a significant amount of time in this internally over the past year: we tightened the long-term strategy, we built the team from within the business areas and we have set clear parameters. We have also drawn up a roadmap describing how we are working towards our goal of being able to offer our clients ener-gy-neutral solutions by 2023.
Heijmans Energie is now also working for clients. In Zutphen, we have started on two projects in the Noorderhaven area development. At Kade Zuid, collective geothermal energy and individual heat pumps will provide sustainable heating and cooling for the apartment building. And in 2021, we will see the launch of the Veld 21 project. In this project, 77 houses will be equipped with an individual geothermal energy system and a heat pump. Heijmans has also signed letters of intent for several projects, and we will take further steps on these projects in 2021.
All of these projects will involve the development, realisa-tion and operation of a sustainable energy system. Via the integration of heating systems with solar panels and charging infrastructure in the coming years, we are working towards the realisation of smart grids and energy-neutral areas. For some time now, we have been providing services and carrying out projects in the field of infrastructure for heat and electricity, such as heating networks and combined heat and power (CHP) systems.
Heijmans HiveCreating healthy living environments requires smart solutions. Heijmans set up the 'Hive' in Rosmalen to pool knowledge and accelerate innovation. This has been set up in a separate building and acts as a physical 'hub' in which experts from right across the organisation come together to share knowledge about digitalisation, data, sensors and production technology. They also work together on organisation-wide issues and innovations. The Hive is an inspiring community with a single goal: accelerating innovation. Initiatives from various parts of Heijmans are brought together in the Hive, and new ideas will be worked out in the concrete form of future propositions and concepts, and then put into practice as part of our Smart City concept.
Builders of the healthy living environment of the future These efforts are our investment in the future. From 3D to 4D: the combination of technology and physical construc-tion is creating new opportunities for Heijmans. With our foundations in place, we will reap the benefits of this in the coming years. We want to lead the way in technological construction, with an eye to the future and value for society. We as creators, with our professional skills in technology, construction and design, make the difference together every

84 Heijmans Annual Report 2020
YEAR IN REVIEW PER BUSINESS AREA
single day. Below, we highlight a few of the striking results each business area recorded in 2020. Property Development At Property Development, one of the areas we focused on was health and safety plans. As a designer, we determine to a large extent whether a design can be executed and operated safely as early as the design phase itself. We take our role in this very seriously. Parallel to a design, therefore, we draw up a plan to map out the safety risks. How can we safely install a glass façade at height? And how can it be cleaned safely after completion? In each phase, we take into account the environment and its users. We already have this knowledge, but we can and must use it more intelligently. We have invested a lot of time and attention in increasing internal awareness of our role in safe design. We make these plans not just because we have to, but because we can make a difference; we do it better, more consciously and more carefully. Home sales now also digital We gave our Business-to-Customer process a major overhaul in 2020 to make sure we listen more carefully to our customers and respond to their wishes and needs. We had already set up the Happiness programme, with various digital tools to optimise our contact with customers. In addition to the planned introduction of the Residential Configurator home customisation tool, Covid-19 gave another boost to the ongoing digitalisation of our sales process. The sales launch for several projects was entirely digital. And it was successful: developers showed great creativity and buyers also proved to be highly flexible. Building site visits also had to be digital. Although this was not part of our original plans, from now on this digital approach will be part of our fixed working method. Because we have digitalised the entire Business-to-Consumer process, all documentation is now secured centrally. This system also enables us to sell some of our homes ourselves, without the intervention of an estate agent. The implemen-tation of this new system required a lot of effort and capacity within Property Development. But the result was very encouraging: the initial reactions have been positive.
Heijmans WoonconceptHeijmans develops and builds concept homes with a high degree of standardisation. At the same time, we also make maximum use of our library of variations, so we can respond quickly and affordably to project-specific require-ments, such as appearance and buyers' wishes. Our 'free enhancers’, as we called these in one of our Heijmans Huismerk projects. This helps us to achieve an attractive mix of variation and affordability.
By the end of 2020, we had completed a total of almost 3,800 concept homes. Last year, 40% of the homes we built were Heijmans Huismerk homes for the rental market and 60% were for the private market. The Koningsoord new-build project in Berkel-Enschot had two firsts: the introduction of a new house type and the ‘Home configurator’ home customisation tool. Buyers put together their own home online, within the parameters of the house type. This is also directly compiled in the architectural 3D model, which then automatically generates a contract drawing with all the selected options so the contractor can continue with the work preparation. Thanks to the extensive digitalisation of the process, this Home configurator gives an extra impulse to the faster and cheaper development and realisation of concept homes. All the homes in the Koningsoord project have now been sold.
Less is moreWe see a great future for our compact XS home and the Heijmans ONE as solutions to the persistently tight housing market and the growing need for affordable homes for one-person and two-person households. The XS house is a terraced house from 3.60 metres wide and is ideal for starters. In Vathorst, Amersfoort, we built and delivered 10 of these homes in 2020. In Leusden, we are building 14 XS homes in the Maanwijk district as part of the area develop-ment. Another of our concept homes, the Heijmans ONE, is moveable. This is a complete and comfortable 39-m2 house suitable for a one- or two-person household. The house is made of sustainable materials and can be used in a circular way. Over the past year, we improved the concept in a number of ways to tailor it more for the target group. This is Heijmans’ way of providing a high-quality and comfortable response to the growing demand for temporary housing. This enables municipalities, housing corporations and investors to quickly realise new supply and meet growing demand. We received a number of new orders in 2020, and the first 60 new Heijmans ONEs will be delivered after the summer of 2021. Heijmans is also investigating the possibilities of continuing the development of this product.
Integrated approach to area development In more and more places around the country, we are developing complex but promising areas in cooperation with municipalities and other players, including housing corporations. The goal is to transform such neighbourhoods and make them more diverse, climate-proof and future-proof. We are doing this increasingly with a specific focus on social cohesion. In The Hague, we are developing the Dreven, Gaarden and Zichten neighbourhoods together with housing corporation Staedion and the local authorities. The goal: a neighbourhood with prospects for everyone. The project includes the renovation of 2,000 Staedion homes

85Heijmans Annual Report 2020
YEAR IN REVIEW PER BUSINESS AREA
and the addition of 3,500 extra homes. In addition to improving the housing stock, we are also devoting attention to redesigning public spaces and expanding educational and other social, cultural and commercial amenities. In effect, we are increasing the quality of life and social cohesion of the neighbourhood.
The Purmerend municipal authority has selected Heijmans as its partner in the role of area developer for the develop-ment of the station area in the town centre. The aim is to make the area an extension of the town centre in the coming 10 years. Other examples of integrated area development are Hart van Zuid in Rotterdam and the new Leeuwenkuil in Rotterdam and Blaarthem near Eindhoven projects. In all of these projects, we are helping to transform areas, creating more liveable and healthy living environments.
In the spotlight: Smart CityAs far as Heijmans is concerned, integrated area develop-ment goes much further than the above. We have been working on the Smart City concept for some time, but this idea was given a real boost in 2020. Smart City is about a combination of solutions for themes such as air quality, mobility, energy monitoring, safety and health. Being 'connected' to the internet is also important. In the context of the Heijmans strategy, we have identified three showcase projects in which we are combining all our knowledge and expertise and where we can apply our integrated approach optimally: Smart City showcases. These are Maanwijk in Leusden, Park Vijfsluizen in Vlaardingen and Feyenoord City in Rotterdam. Of course, we are not doing this alone. We are working closely with local authorities, knowledge institutions, market players, local entrepreneurs and citizens. And in addition to our own expertise, we work with partners who contribute the highest levels of knowledge and expertise. This includes expertise in the fields of (landscape) architecture and ecology, social design, sustainable energy and smart mobility. In a network of parties and stakeholders, the role of director and connector is tailor-made for us. Because only together we can realise our ambition for a healthy living environment in a tangible form. Of course, we also use the knowledge we gain from these three projects elsewhere. For example, we are already using the Homies Alarm app in Culemborg and we have started a shared mobility pilot in The Hague.
Maanwijk, LeusdenAs a 'neighbourhood of the future', Maanwijk is a fine example of how housing, nature and innovation can go hand in hand. The design of the neighbourhood reinforces the relationship between inside and outside and invites people to meet each other.
The complex includes three small courtyards with seating areas and several communal gardens. Here you can meet friends or neighbours at one of the picnic tables, borrow the neighbourhood ladder from the collective storage area, or pick apples in the communal orchard. Our cooperation with NL Greenlabel and De Groene Belevenis (the green experience) ensures that the green area meets a varied range of requirements. An asset for biodiversity and climate adaptation, but above all as pleasant meeting and playing areas.
We are using new technologies to promote social cohesion in Maanwijk, thus contributing to sustainable, comfortable and safe living. An excellent digital infrastructure means everyone has a perfect internet connection. Heijmans uses the GezondWonen (healthy living) app in every home. This enables everyone to monitor and control air quality, CO2 emissions and energy consumption themselves, and receive regular tips via the app. To make sure we develop this concept properly, Heijmans has formed an alliance with TNO, the Lung Fund, Philips, Velux and VLA (sector organisation for air installation technologies). We also use the Homies Alarm app, a detection system that warns both those involved and the neighbourhood network of fire and burglary when resident(s) are absent. Maanwijk is also connected to its surroundings, physically, socially and digitally. The activities of the Leusden ZeT neighbourhood association give the residents of Maanwijk, Leusden-Zuid and Tabaksteeg the opportunity to get to know each other. We offer digital proximity by using the online neighbour-hood platform Hoplr to bring residents of all three neighbourhoods together. Thanks to our cooperation with We Drive Solar, facilities and social amenities in the wider region are all within easy reach via shared electric cars and bicycles.
Maanwijk will feature 120 homes, including eight starter homes and 36 government-regulated social rental homes. There is a lot of interest in the homes of the future: the sales process launched successfully in November 2020.
Park VijfsluizenThe Park Vijfsluizen project is comparable to Maanwijk. In this project in Vlaardingen, we demonstrate how you can develop a green oasis in the midst of an inner city network, a place where you can live and spend leisure time in a healthy and pleasant manner. The project, built in a former sports park, will include 350 homes. Just like in Maanwijk, the Park Vijfsluizen project has a NL Greenlabel A. Sales are set to start in early 2021.

86 Heijmans Annual Report 2020
Smart Health & Well Being Among other things through:
Intelligent buildings which self-manage comfort, air quality, security and energy use
Monitoring air quality viasensors in public space
(Online) Stimulating of vitality (BeFit) and interaction (neighbourhood parties, cycling groups etc.)
Safety through neighbourhood prevention via apps
Smart BuildingAmong other things through:
Smart GovernanceAmong other things through:
Smart buildings with predictive maintenance through the use of Beyond Eyes
‘Healthy Living’ – concept: Smart and healthy homes
Heijmans ONE – Movable homes, full electric and including a solar roof
The ‘Circular Home concept’: A sustainable home with sustainable materials
Smart Energy Among other things through:
Smart MobilityAmong other things through:
A collective energy system (with alternative energy generation) for sharing at district level
Connecting equipment: separate insight into use and for preventive maintenance
Solar roofs and vertical solar façade with connection to collective energy system
Energy-neutral homes and dynamic LED-lighting in public space
Sensor-based traffic safety system for pedestrians and cyclists (BikeScout)
MaaS: Mobility hub with electric shared cars, bicycles and cargo bikes
DaeS: Traffic flows through dynamic traffic information and parking assistance system
Tyre pressure metre through sensors in the road surface, which immediately pass on the actual tyre pressure via a roadside sign
Smart Infrastructure Among other things through:
Dynamic, sensor-based managementof bridge and lock doors
Predictive maintenance through sensors which monitor traffic and pressure on infrastructure
Underground smart grid which organises and directs data, energy and circular residual material flows
Standard WIFI in all homesand buildings
Online Neighbourhood platform for the neighbourhood and surrounding area (collaboration with Hoplr)
Neighbourhood coaches via online platform
Real-time area management partlybased on generated data
Create economic added value by connecting local entrepreneur via apps
Smart Environment Among other things through:
Smart connection of green to smart rain water harvesting and distribution system
Urban farming / Roof fields on the roof incl. picking and vegetable garden and rain water harvesting
Public space with great biodiversity and climate adaptive playing areas
Detection to prevent heat stress and flooding
Everyone wants to breathe clean air, live in a pleasant neighbourhood, enjoy beautiful nature, work in a good workplace, get from A to B safely and return home healthy at the end of the day. Heijmans realises such a healthy living environment on the basis of 9 themes, through an integrated approach of living, working, staying and connecting. A physical world with spatial, social and natural elements, which, following our 7 ‘Smart City’ pillars, is enriched, improved and strengthened with an extra virtual and digital dimension through the use of data-driven solutions and technology. This way, residents and users can get the most out of their healthy living environment now and in the future.
Heijmans’ visionof Smart City Heijmans’ vision of the Smart City

87Heijmans Annual Report 2020
Smart Health & Well Being Among other things through:
Intelligent buildings which self-manage comfort, air quality, security and energy use
Monitoring air quality viasensors in public space
(Online) Stimulating of vitality (BeFit) and interaction (neighbourhood parties, cycling groups etc.)
Safety through neighbourhood prevention via apps
Smart BuildingAmong other things through:
Smart GovernanceAmong other things through:
Smart buildings with predictive maintenance through the use of Beyond Eyes
‘Healthy Living’ – concept: Smart and healthy homes
Heijmans ONE – Movable homes, full electric and including a solar roof
The ‘Circular Home concept’: A sustainable home with sustainable materials
Smart Energy Among other things through:
Smart MobilityAmong other things through:
A collective energy system (with alternative energy generation) for sharing at district level
Connecting equipment: separate insight into use and for preventive maintenance
Solar roofs and vertical solar façade with connection to collective energy system
Energy-neutral homes and dynamic LED-lighting in public space
Sensor-based traffic safety system for pedestrians and cyclists (BikeScout)
MaaS: Mobility hub with electric shared cars, bicycles and cargo bikes
DaeS: Traffic flows through dynamic traffic information and parking assistance system
Tyre pressure metre through sensors in the road surface, which immediately pass on the actual tyre pressure via a roadside sign
Smart Infrastructure Among other things through:
Dynamic, sensor-based managementof bridge and lock doors
Predictive maintenance through sensors which monitor traffic and pressure on infrastructure
Underground smart grid which organises and directs data, energy and circular residual material flows
Standard WIFI in all homesand buildings
Online Neighbourhood platform for the neighbourhood and surrounding area (collaboration with Hoplr)
Neighbourhood coaches via online platform
Real-time area management partlybased on generated data
Create economic added value by connecting local entrepreneur via apps
Smart Environment Among other things through:
Smart connection of green to smart rain water harvesting and distribution system
Urban farming / Roof fields on the roof incl. picking and vegetable garden and rain water harvesting
Public space with great biodiversity and climate adaptive playing areas
Detection to prevent heat stress and flooding
Everyone wants to breathe clean air, live in a pleasant neighbourhood, enjoy beautiful nature, work in a good workplace, get from A to B safely and return home healthy at the end of the day. Heijmans realises such a healthy living environment on the basis of 9 themes, through an integrated approach of living, working, staying and connecting. A physical world with spatial, social and natural elements, which, following our 7 ‘Smart City’ pillars, is enriched, improved and strengthened with an extra virtual and digital dimension through the use of data-driven solutions and technology. This way, residents and users can get the most out of their healthy living environment now and in the future.
Heijmans’ visionof Smart City

88 Heijmans Annual Report 2020
YEAR IN REVIEW PER BUSINESS AREA
Feyenoord CityRotterdam city council adopted the Feyenoord City zoning plan in December 2020. This means that the project is still on schedule to receive definitive zoning approval in 2021. Heijmans has been closely involved with the Stichting Gebiedsontwikkeling aan de Maas (foundation for area development on the Maas) since 2018. This foundation was set up to coordinate the land exploitation, the acquisitions and the issuing of plots for, among other things, housing, a hotel and other commercial functions in the area, including the construction-ready land for the new stadium. BNG Bank is financing the area development. Heijmans is working closely with other parties to draw up the proposals for the development and the realisation of the various projects within the area.
Building & Technology The Building & Technology business area comprises four core activities: Residential Building (new-build, restoration and renovation), Services (maintenance and management), Non-residential projects (integrated approach to construc-tion and installation technology), multi-functional high-rise residential construction (complex inner-city new-build projects and buildings with a highly mixed range of functionalities).
Residential Building Heijmans’ Residential Building works closely with Property development on the realisation of residential real estate projects. In 2020, we saw a continued growth in orders from housing corporations. Our way of working and our range of concept homes are increasingly differentiating and decisive factors in tenders. A very recent new assignment is for SGE (Eindhoven urban region), in which nine municipalities and 13 housing corporations in the Eindhoven region have combined the demand for affordable rental homes for the coming years into one call for tenders.
Huismerk On the basis of Heijmans Huismerk concept, we and our co-makers can offer affordable variation. This gives Heijmans, the cooperating housing associations and the municipality continuity and certainty. We expect housing corporations to increasingly work together in this way when faced with high levels demand for homes. For example, we have already been working successfully in the chain with the ZoWonen housing corporation in Sittard-Geleen for some time and this year we were selected for the chain cooperation with Alwel in Etten-Leur. In addition to new-build projects, we are seeing a particularly sharp increase in contracts for renovation and maintenance projects. In 2020, we carried out and delivered the renova-tion of 180 apartments in the Vinkhuizen phase 1 project for the De Huismeesters housing corporation in Groningen. The renovation was carried out while the apartments were
occupied, taking into account the Covid-19 measures. In 2020, Heijmans also signed a letter of intent with a number of housing corporations for the renovation of 425 homes. We use the ‘b-'woond’ (lived in) plan approach in all renovation projects. This is a tool that Heijmans developed to guide corporations and residents through the entire process.
MaterialsHeijmans believes that the future lies in a smart mix of various materials and construction methods. That is why we are investigating opportunities for efficiency in the field of prefabrication, digitalisation, safety, sustainability, speed and affordability. A core team at Heijmans analyses developments in the market and works with a number of specialised partners. This is how we are working on the new products and innovations of tomorrow. In the Vathorst residential area in Amersfoort, for example, we realised a variation on an existing concept. We built eight XS homes using ROCKWOOL's new circular building system, Rockzero. The building system consists of complete walls and roofs made from non-flammable rock wool.
Timber is also seen as a bio-based material that can make a significant contribution to the circularity of buildings. The use of more certified timber contributes to the preservation of forests and biodiversity, and helps to combat climate change. Sustainably produced timber comes with the guarantee that the forest the timber comes from is managed and that this takes into account social, ecological and economic aspects.
Great results We continue to improve in the area of inner-city area development. We will continue on the path we have chosen on this front. After all, this is where we can combine and capture all the know-how and expertise in our organisation. For instance, we delivered 464 apartments on the HAGA site in The Hague. This is a complex project because it is being built next to a hospital. There are plans for other housing and commercial facilities in this area. In Amsterdam, last year saw the start of the first phase of Vertical, a project in the Sloterdijk district, where we are building a total of 168 homes, shared living spaces and more than 800 m2 of commercial space. By designing smarter and making optimal use of small building sites, we can continue to respond to market developments. We expect further growth in this market segment.
Appreciation Last year, we won the Amsterdamse Nieuwbouwprijs, the public prize for new-build projects in Amsterdam, for our project in Eerste Oosterparkstraat. We recreated an almost one hundred metre long facade from 1890 exactly as it was. This included traditional Amsterdam masonry and

89Heijmans Annual Report 2020
YEAR IN REVIEW PER BUSINESS AREA
pointing, cast-iron ornaments, natural stone, decorative cornices, French balcony railings and hoisting beams. With modern homes behind the facade. This was a perfect example of pure craftsmanship, and we are proud of the public appreciation for this project.
The Fenix warehouses in Rotterdam have received a huge number of prizes. The project was another example of how we carry out renovations with respect for the rich history of the building and its surroundings. While the raw, nautical character of the former warehouse has been preserved, the residential floors are actually light and high: both in construction and in perception. This project has given the area a real boost and fosters social cohesion. The jury of the BNA Building of the Year Award: "The distinctive architec-ture and the exceptional residential product that Fenix I offers attracts residents and users with a similar mindset. The Fenix residents form an inclusive community where people live and share lives. The jury is impressed by the rough concrete construction, the bold modern intervention and the way Fenix I gives a powerful impulse to an emerging neighbourhood".
Fenix I has now won:- BNA Best Building of the Year 2020- Winner Liveability & Social Cohesion - Architecture MasterPrize 2020 (USA)- Winner Heritage Architecture- Architectenweb Awards 2020- Winner Residential building of the year - German Design Awards 2021 (Germany)- Special Mention Excellent Architecture- Iconic Awards for Innovative Architecture 2020 (Germany)- Best of Best National Steel award 2020- Winner Residential building ULI Europe Awards for Excellence 2020 (USA)
- Winner Rotterdam Architecture award 2019- Winner Jury award Rotterdam Architecture award 2019- Winner Audience award MIPIM/AR Future Project Award 2019 (UK)
- Winner Old&New
Heijmans is proud of what we achieved with the Fenix warehouses and the role the building plays in the neigh-bourhood. The transformation of Katendrecht, to which Heijmans made a significant contribution, is a highly successful example of area development and of the creation of a healthy living environment.
Non-residential projects In Rotterdam-South, we are working with Property Development on the Hart van Zuid project. This is a good example of how Heijmans approaches integrated area development. This project includes the construction of
homes with plenty of green space, schools and shopping facilities nearby. In addition, the area will receive an economic, social and cultural boost. In 2020, we completed the RACC (Rotterdam Ahoy Convention Centre) and Theater Zuidplein, and in the coming years, we will also be building a cinema, restaurants and a car park next to Ahoy.
Government Real Estate Agency The Dutch government’s Real Estate Agency (Rijksvastgoedbedrijf) was once again a key client for Heijmans in 2020. After an intensive process, we are set to complete the unique new building of the New Amsterdam Court House (NACH), in the capital city’s Zuidas business district in 2021. This is the project where Heijmans felt the consequences of Covid-19 most clearly, as we had to deal with the impact of the pandemic during the construction phase. Sick employees, limited availability of foreign labour and delayed availability and delivery of materials such as natural stone and lifts from abroad led to several months of delays and higher costs. Heijmans will enter a new phase following the completion of this major project. This is because NACH is a Design, Build, Finance, Maintain and Operate (DBFMO) contract. Within the NACH consortium, Heijmans and Facilicom are the combination that have designed and built the court house and, once this is in use, will operate the court for a period of 30 years.
The Real Estate Agency also awarded Heijmans a contract for the restructuring of the former tax office on Laan op Zuid in Rotterdam – according to a design by OTH architects – into offices for five government departments. This was a project that included constructional tours de force and a number of logistical challenges. From 2021, this spectacular building will be home to the Tax and Customs Administration (Belastingdienst), Customs, the Ministry of Public Works and Waterways (Rijkswaterstaat), the Education Executive Agency (Dienst Uitvoering Onderwijs), the Immigration and Naturalisation Service (Immigratie- en Naturalisatiedienst) and the Council for Child Protection (Raad voor de Kinderbescherming).
Building for the future In 2020, we continued to focus on the construction of data centres. This is a market that does not publicise its activities much. We see this specialist sector as a growth market in the coming years. In January 2021, Heijmans won the contract to build 735 student homes and communal areas on the grounds of Eindhoven University of Technology. We also won the contract for the new building for the Faculty of Mathematics and Natural Sciences on the Science Campus in Leiden. This sustainable, flexible building includes a distinctive entrance, new laboratories and lecture halls, and is due to be completed at the end of 2023.
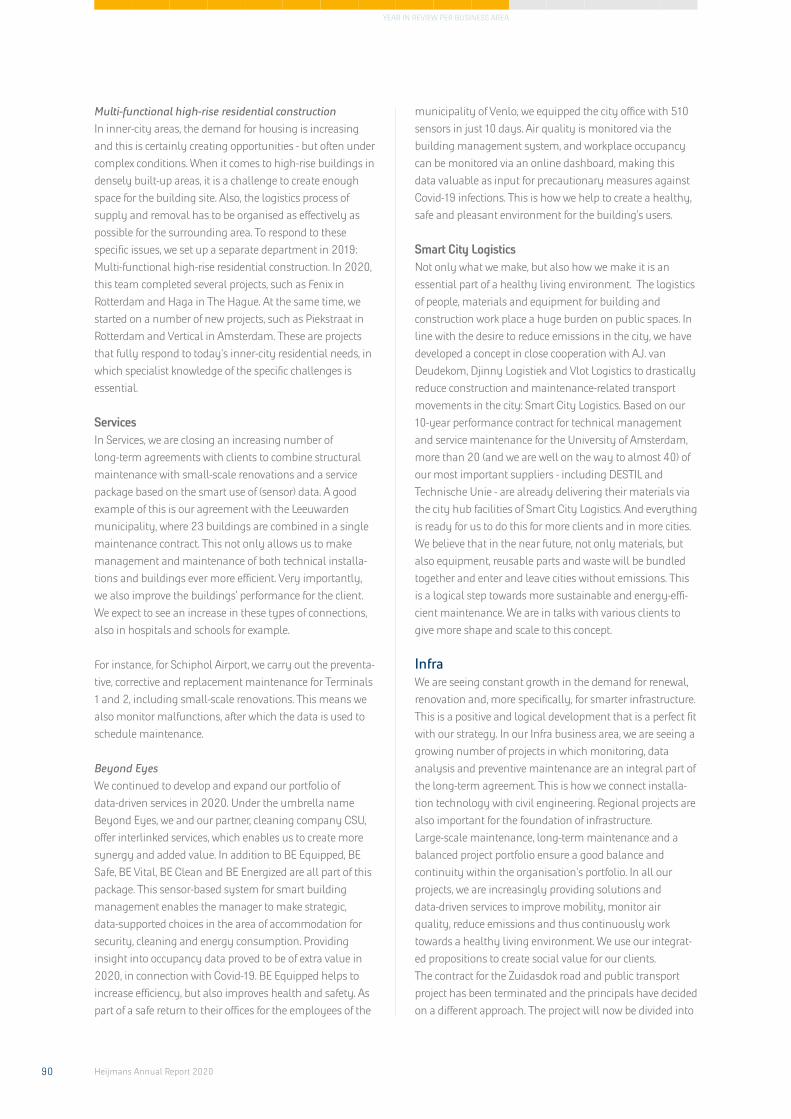
90 Heijmans Annual Report 2020
YEAR IN REVIEW PER BUSINESS AREA
Multi-functional high-rise residential construction In inner-city areas, the demand for housing is increasing and this is certainly creating opportunities - but often under complex conditions. When it comes to high-rise buildings in densely built-up areas, it is a challenge to create enough space for the building site. Also, the logistics process of supply and removal has to be organised as effectively as possible for the surrounding area. To respond to these specific issues, we set up a separate department in 2019: Multi-functional high-rise residential construction. In 2020, this team completed several projects, such as Fenix in Rotterdam and Haga in The Hague. At the same time, we started on a number of new projects, such as Piekstraat in Rotterdam and Vertical in Amsterdam. These are projects that fully respond to today's inner-city residential needs, in which specialist knowledge of the specific challenges is essential.
ServicesIn Services, we are closing an increasing number of long-term agreements with clients to combine structural maintenance with small-scale renovations and a service package based on the smart use of (sensor) data. A good example of this is our agreement with the Leeuwarden municipality, where 23 buildings are combined in a single maintenance contract. This not only allows us to make management and maintenance of both technical installa-tions and buildings ever more efficient. Very importantly, we also improve the buildings’ performance for the client. We expect to see an increase in these types of connections, also in hospitals and schools for example.
For instance, for Schiphol Airport, we carry out the preventa-tive, corrective and replacement maintenance for Terminals 1 and 2, including small-scale renovations. This means we also monitor malfunctions, after which the data is used to schedule maintenance.
Beyond EyesWe continued to develop and expand our portfolio of data-driven services in 2020. Under the umbrella name Beyond Eyes, we and our partner, cleaning company CSU, offer interlinked services, which enables us to create more synergy and added value. In addition to BE Equipped, BE Safe, BE Vital, BE Clean and BE Energized are all part of this package. This sensor-based system for smart building management enables the manager to make strategic, data-supported choices in the area of accommodation for security, cleaning and energy consumption. Providing insight into occupancy data proved to be of extra value in 2020, in connection with Covid-19. BE Equipped helps to increase efficiency, but also improves health and safety. As part of a safe return to their offices for the employees of the
municipality of Venlo, we equipped the city office with 510 sensors in just 10 days. Air quality is monitored via the building management system, and workplace occupancy can be monitored via an online dashboard, making this data valuable as input for precautionary measures against Covid-19 infections. This is how we help to create a healthy, safe and pleasant environment for the building’s users.
Smart City LogisticsNot only what we make, but also how we make it is an essential part of a healthy living environment. The logistics of people, materials and equipment for building and construction work place a huge burden on public spaces. In line with the desire to reduce emissions in the city, we have developed a concept in close cooperation with A.J. van Deudekom, Djinny Logistiek and Vlot Logistics to drastically reduce construction and maintenance-related transport movements in the city: Smart City Logistics. Based on our 10-year performance contract for technical management and service maintenance for the University of Amsterdam, more than 20 (and we are well on the way to almost 40) of our most important suppliers - including DESTIL and Technische Unie - are already delivering their materials via the city hub facilities of Smart City Logistics. And everything is ready for us to do this for more clients and in more cities. We believe that in the near future, not only materials, but also equipment, reusable parts and waste will be bundled together and enter and leave cities without emissions. This is a logical step towards more sustainable and energy-effi-cient maintenance. We are in talks with various clients to give more shape and scale to this concept.
InfraWe are seeing constant growth in the demand for renewal, renovation and, more specifically, for smarter infrastructure. This is a positive and logical development that is a perfect fit with our strategy. In our Infra business area, we are seeing a growing number of projects in which monitoring, data analysis and preventive maintenance are an integral part of the long-term agreement. This is how we connect installa-tion technology with civil engineering. Regional projects are also important for the foundation of infrastructure. Large-scale maintenance, long-term maintenance and a balanced project portfolio ensure a good balance and continuity within the organisation's portfolio. In all our projects, we are increasingly providing solutions and data-driven services to improve mobility, monitor air quality, reduce emissions and thus continuously work towards a healthy living environment. We use our integrat-ed propositions to create social value for our clients.The contract for the Zuidasdok road and public transport project has been terminated and the principals have decided on a different approach. The project will now be divided into

91Heijmans Annual Report 2020
YEAR IN REVIEW PER BUSINESS AREA
sub-projects, which will make it more manageable. Heijmans is pleased that there is now clarity on this project and no longer includes the contract in its order book (€ 134 million). The principals will put out a new call for tenders for the project, and Heijmans can decide to submit a new tender for the sub-projects.
Three markets The Infra business area is active in three markets: urban areas, energy and transport and mobility. We always work together, with our clients, suppliers and other parties. This allows us to standardise and automate more. And that is necessary. We are seeing increasing labour shortages in the infrastructure market. In the coming years, the energy transition and maintenance of existing infrastructure will be two major tasks, for which there will be a pressing shortage of professionals. By automating and digitalising processes, we are safeguarding our expertise within the organisation and we can do more with fewer people. We use digital platforms, for example, to carry out parametric and automated designs. Our digital services also create other revenue models we can use to enter into long-term agreements. This allows us to keep an even better grip on our earning potential.
Urban areas: innovations for the future Heijmans has long-term maintenance contracts with various municipalities. Municipalities are also increasingly looking for solutions to problems that arise as a result of growing congestion, urbanisation and climate change. We are able to offer these solutions with a range of innovations such as sensor technology combined with smart use of data to increase traffic flows and safety. Our research project with TU Aachen and BMW, MeBeSafe, is a good example of this. In this project, we used a specific smart mobility project in Eindhoven to demonstrate that we could slow down road traffic speeds by between 5% and 40% based on smart nudge technology. This has an enormous impact on traffic flows and on road safety.
Minimise impact To minimise our own impact on the environment during construction, we use a wide range of digital tools based on BIM. This enables us to work more efficiently and safely, even on small construction sites in the middle of the city. We use tools such as Point Cloud, a process in which drones take photographs at 3D coordinates, with all the photos together mapping the location in great detail, which enables us to create a digital twin of the project site. In this twin environment, we can digitally lay out the construction site in 3D, simulate the building process and map the soil. This increases efficiency and safety on the real building site.
We look at the possibilities for sustainable housing and energy supply during our projects. We have carried out various pilot projects to test the use of more sustainable generators, such as a solar generator for a cables and pipelines project in Nijmegen. Others include a generator that runs on formic acid at the Eindhoven Technical University and a Green Battery for a multi-year contract for asphalt maintenance for and in the municipality of Amsterdam. For the future, we are investigating the possibilities of a generator running on biogas. We also use solar panels and an Esaver to achieve maximum savings, as we did on the De Reede construction site in Veenendaal.
In October, the municipality of Amsterdam awarded Heijmans the contract for the demolition, remediation and preparation for construction of three plots in the Buiksloterham district. We won this contract thanks in part to the high score for our combined quality plans, in particular the well thought-out logistics (partly over water), the manner in which we collaborate and the optimum management of risks. On top of this, we were challenged to minimise CO2 emissions.
Improving sustainability In line with Heijmans’ strategy to increase sustainability, we focus on aspects such as climate adaptability, circular building, energy and biodiversity. Our efforts include the development of new materials and nature-inclusive building. Climate-adaptive building should lead to less flooding, less heat stress, fewer adverse effects of prolonged drought and subsidence and more biodiversity. In Breda, Heijmans has a world first with a pilot for an innovative half-open asphalt mixture on a water-permeable founda-tion. We developed this Klimaflex asphalt for inner-city use to combat heat stress in the environment and soil dehydration.
Circularity is also a challenge at Infra. The system of material and energy use all revolves around chain cooperation: closing the circle close to your project by working with local parties. A good example of this is the use of circular asphalt in the expansion of the A1 motorway near Twello. The original plan was to use ZOAB (highly porous asphalt concrete) overlays with 0% to 40% recycled ZOAB. That eventually became 60%. This DZOAB (Sustainable ZOAB) is one of our own innovations we can be proud of. We need to increase the supply of circular building materials if Heijmans is to make its construction activities 100% circular by 2023. This will make integrated chain management very important. The Matching Materials online platform Heijmans developed should help us achieve this target.

92 Heijmans Annual Report 2020
YEAR IN REVIEW PER BUSINESS AREA
Energy transition The energy transition will demand a significant amount of effort in the coming years and this will go hand in hand with digitalisation, the use of space, climate adaptation and material use. This will have an impact on every part of our company. A great deal of existing infrastructure will have to be adapted, because the transition from fossil to renewable energy will demand a lot from the energy network. For example, electricity consumption will increase and the demand for natural gas will decline in the future. This means that in the coming years, energy networks will have to be adapted in many places to keep the available capacity up to standard.
Energy: large-scale replacement and local networks Heijmans will be responsible for the design and implemen-tation of work for grid manager Liander in the coming four years, including work on the main grid and home connec-tions for gas and electricity in Amsterdam North and Amsterdam Centre. Another Liander assignment is the connection of Windpark Wieringermeer to the national electricity grid. This 20-kV infrastructure will enable the grid manager to upgrade and expand the wind farm into one of the largest onshore wind farms in the Netherlands in the near future. As one of TenneT's nine preferred suppliers, Heijmans is involved in the expansion and renovation of 360 high-voltage substations. We will be working closely with Dynniq Energy on this project. Work will start in 2021 and the framework agreement has an initial term of 11 years.
Heijmans eMobility Electric vehicles will be an important part of the energy transition. Via Heijmans eMobility, we offer complete solutions for electric transport for the private, business and public sectors. From the supply and connection of a single charging station to the complete set-up and management of an advanced charging network. We are working on this with parties including energy company Vattenfall. Together, we have installed thousands of smart charging stations in Amsterdam, Limburg and Brabant in recent years.
Mobility: replacement task and emission-free building As part of the Innovation partnership that includes the Infra Emission-Free Network (ENI) partners GMB and De Vries & van de Wiel, Heijmans will work on reinforcing the Lek dyke as part of a contract awarded by the De Stichtse Rijnlanden water board. The ‘Strong Lek dyke’ project covers a length of 55 kilometres from Amerongen to Schoonhoven and is part of the national high water protection programme (Hoogwaterbeschermingsprogramma - HWBP). The water board is responsible for the safety of its dykes, but also has
significant ambitions in the field of sustainability and innovation. The Innovation partnership will help the water board to realise these ambitions. All three partners share the water board’s sustainability ambition to make the reinforcement of the Lek dyke emission-free using smart technologies and working methods. The ‘Strong Lek Dyke’ project aims to demonstrate that it is possible to apply sustainability ambitions on a large-scale in dyke reinforce-ment projects. For the Wetterskyp Fryslân water board, Heijmans will reinforce 4.4 kilometres of the Lauwersmeer dyke in the coming years. This too is part of the national high water protection programme.
Delivered Heijmans completed the new connecting road on the route between the Apeldoorn-Zuid section of the A1 motorway and the Beekbergen interchange. The project was tendered according to Best Economic Value Procurement principles. The basic premise: the most value for a realistic price. Heijmans did not submit the lowest tender amount, but scored the highest on all Best Economic Value Procurement criteria for this project: risk management, environmental management and nuisance reduction. We will add an extra lane to a total of 55 km of motorway, replace a cloverleaf interchange with a new connecting road, including a viaduct over the A50. And an extra lane for merging and exiting traffic will improve traffic flow.
Heijmans also delivered its part of the Gaasperdammer-tunnel project in 2020. Heijmans carried out this complex megaproject as part of IXAS consortium and it includes five tunnel tubes, five lanes per direction of travel and an alternating lane. The logistics of construction and installa-tion were challenging, but with the help of smart solutions and new working methods, the project was completed successfully. The tunnels are now equipped with sensors, ventilators, light boxes with LED lighting, cameras and emergency response units. Light-reflecting asphalt and LED lighting provide significant energy and therefore cost savings. Another 5,500 solar panels will be installed on the tunnel roof. We feed the power generated back into the grid, as the tunnel cannot be dependent on solar power. The proceeds of the solar power are offset against the costs of the tunnel’s use. For the next twenty years, the consortium will be responsible for the maintenance of the tunnel and the motorway.
Heijmans designed and implemented the N629-A27 road project near Oosterhout in close cooperation with its client, the province of North Brabant. The most important part of the contract was the widening of a one-and-a-half kilometre stretch of the N629 provincial road and the improvement of its connection to the A27 motorway. During the execution

93Heijmans Annual Report 2020
YEAR IN REVIEW PER BUSINESS AREA
of the project, Heijmans took into account the underlying road network, the landscape, ecology and water management.
For the widening of the road, we built a completely new viaduct on the south side of the existing viaduct over the A27. The highlight of this project was the construction of the middle pillar in a single weekend, to limit inconvenience in the surrounding area. The project is an excellent example of what we can achieve when the various disciplines across our organisation work effectively together.
Eindhoven North WestTo improve access to Eindhoven Airport and the Goederen Dienstencentrum (goods service centre) Achtse Heide, Heijmans teamed up with Ploegam to work out a new primary infrastructure in close consultation with our client, the municipality of Eindhoven. This included a number of optimisations to improve traffic flow and accessibility. The project is currently at the halfway stage and we expect to complete it at the end of 2021. Heijmans is building various ‘artworks’ within this project, including extremely slender viaducts and various specially designed bridges.
A9 Badhoevedorp-HolendrechtIn 2020, Heijmans entered into a partnership with Spanish builder FCC for the A9 Badhoevedorp-Holendrecht project, on which we are responsible as a subcontractor for the asphalt and noise barriers. The project will add an alterna-tive lane as part of the widening and extension of this section of the motorway. The A9 will be sunk over a length of 1.6 kilometres and 14 kilometres of noise barriers will be placed along the Ouderkerk aan de Amstel and Amstelveen stretch of the motorway. We will also be laying extra quiet asphalt.
Design & Construct for SchipholOn behalf of Schiphol Airport, we have started on the doubling of the width of the Quebec taxiway system. This is a Design & Construct contract with a contract value of almost €50 million. The Quebec taxiway system is located on the south side of Schiphol Airport between the Kaag runway and the Zwanenburg runway. In this stretch, taxiing aircraft currently have to make do with one taxiway. By adding a second taxiway, Schiphol wants to increase safety, reduce waiting times for taxiing aircraft and simplify the situation for air traffic control. Heijmans will construct a new viaduct to double the number of taxiways. This viaduct has a length of 250 metres, is sixty metres wide and spans the A4 motorway. We will also be installing a patented BENG monitoring system on this viaduct, which will allow us to monitor the settlement and the conditions of the viaduct in real time over the long term.
Ecology and biodiversityAnd finally, in addition to all our digital innovations, at Heijmans we always have an eye for nature. Because without ecology and biodiversity, there can be no healthy living environment. Our ambition is to leave an area better than we found it. Sometimes this is already mandatory, as in the case of special building blocks for swifts and bats used in new-build projects. In large area developments, we look for opportunities to build in a nature-inclusive way. In doing so, we want to expand the on-site flora and fauna. Some other examples are:
Dordrecht frog poolBecause we were working for Tennet near the Merwede river at Alblasserdam - Dordrecht, the groundwater had to be drained away via so-called infiltration pits. This provided a good opportunity to add a bit of nature through a minor intervention. The municipality expressed the wish and the permit coordinator, ecologist and the construction team made it possible: we created a frog pool in less than three hours. A good example of how you can boost nature with a sympathetic extra step.
Optimising fauna tunnel Fauna tunnels play an important role in connecting nature areas - so-called defragmentation. For the Monnikenberg fauna tunnel (at the A27/A1 motorway junction), we are drawing up a monitoring plan that will enable us to analyse its functionality and make proposals for optimising its management. The more frequently the tunnel is used and the more species it accommodates, the more the habitat improves.
Nature-inclusive sound barriers The last barriers on the Apeldoorn - Azelo section of the A1 motorway near Bathmen are being fitted with integrated soil improvement measures, so plants and trees at that location can grow to their full potential. In addition, we have installed climbing wires so that the climbing plants can be guided upwards. This is the best way to make sound barriers nature-friendly.

The ultimate level of collaboration
From right to left: Els van Grol (HDSR), Edwin van der Poel (GMB Civiel), Bart Müller (Heijmans) and Toine Tillemans (De Vries & van de Wiel)
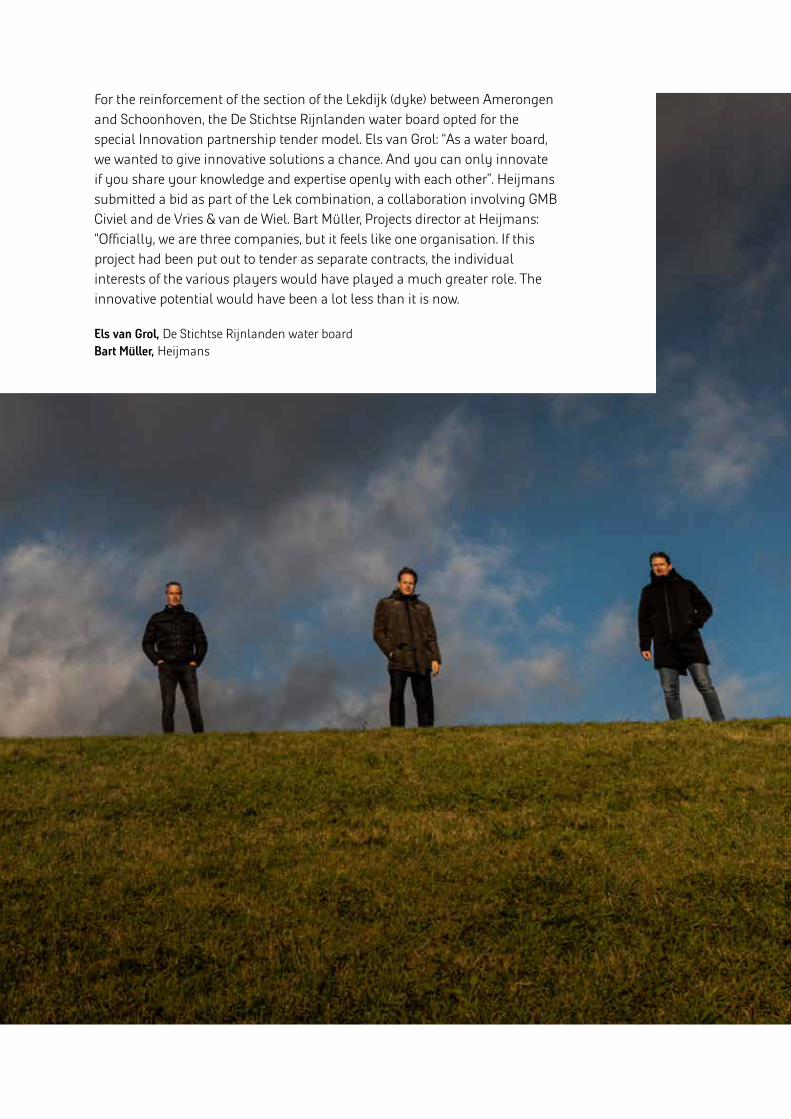
For the reinforcement of the section of the Lekdijk (dyke) between Amerongen and Schoonhoven, the De Stichtse Rijnlanden water board opted for the special Innovation partnership tender model. Els van Grol: “As a water board, we wanted to give innovative solutions a chance. And you can only innovate if you share your knowledge and expertise openly with each other”. Heijmans submitted a bid as part of the Lek combination, a collaboration involving GMB Civiel and de Vries & van de Wiel. Bart Müller, Projects director at Heijmans: “Officially, we are three companies, but it feels like one organisation. If this project had been put out to tender as separate contracts, the individual interests of the various players would have played a much greater role. The innovative potential would have been a lot less than it is now.
Els van Grol, De Stichtse Rijnlanden water boardBart Müller, Heijmans

96 Heijmans Annual Report 2020
Summary Heijmans recorded a net result of € 40 million in 2020, a rise of 33% on the previous year’s result. While 2020 was very much overshadowed by Covid-19 in general, this also had an impact on Heijmans operations in particular, but the impact on our financial results remained limited. What is more, revenue and underlying EBITDA increased by 9% in 2020 compared with the previous year. We were able to continue work on projects, taking into consideration amended health and safety requirements. Our people delivered an excellent performance, responding with flexibility to the major challenge that came with the change in circumstances. Some larger projects were impacted by the poor availability of deliveries and personnel (particularly from abroad). We also noted higher absenteeism at some stages, which was particularly troublesome in projects that were in a critical phase. However, there were positive aspects, too. For instance, in the case of the renovation of an office building, where the building site became more transparent because the clients’ employees were all working from home.
Revenue came in higher at € 1,746 million in 2020 (2019: € 1,600 million). Volume was higher than in the previous year, especially in the first six months of the year. All sectors contributed to this revenue growth and revenue was well distributed across the projects within the sectors.
12 Financial results

97Heijmans Annual Report 2020
FINANCIAL RESULTS
Heijmans Property Development and Residential Building activities benefited from the persistent high demand for homes. We sold a slightly higher number of homes, while revenues were boosted by price increases driven by persistent shortages and rising costs. Due to the lack of sufficient new development locations, the complexity of building within cities and the increased regulatory pressure, we are faced with a continued imbalance between supply and demand for the time being. Finding a structural solution to the growing shortage of homes will require more national guidance. The national ambition to build 75,000 new-build homes per year was once again not achieved in 2020 and the housing shortage increased on the back of persistent high migration levels. At Property Development, revenue increased to €482 million in 2020, from € 459 million in 2019, and the number of homes sold increased to 2,265 (2019: 2,128). Of the total number of homes sold, 1,023 were transactions with corporations and investors (2019: 895). Sales to private buyers remained stable. The EBITDA margin increased slightly to 6.2%, from 5.7%, on the back of higher volume.
The new order intake (projects where the start of construc-tion has been approved) and the rest of our pipeline give us a positive perspective for the coming years. Thanks to large-scale developments on our own land holdings in Zutphen, Uden and Amersfoort and other locations, in combination with large development rights in locations such as Rotterdam-Zuid, Feyenoord City, Nieuw Kralingen in Rotterdam, The Hague South West, Leidsche Rijn and Almere, our outlook for the coming years remains good. Although the Covid-19 crisis has had a major macro-eco-nomic impact, the overall outlook for the housing market remains positive, due to persistently low interest rates and the housing shortage, which we expect to continue to grow in the coming years. It is important in this context that consumer confidence and mortgage lending remain at the required levels and that home sales continue to rise as a result.
In December 2020, the Purmerend municipality selected Heijmans as its partner in the role of area developer for the development of the station area in the city centre. The aim is to make the area an extension of the city centre over the next 10 years. The Hague-based housing corporation Staedion has chosen Heijmans as its partner to transform and renew the Dreven, Gaarden and Zichten neighbourhoods, together with the municipality of The Hague. A substantial increase in the supply of housing - from 2,000 to approximately 5,500 homes – is set to go hand in hand with the strengthening of the quality of life, the local economy, social cohesion, health and the design of the mobility and energy transition.
At Building & Technology, the picture was mixed. Volume and performance were good across the board, especially at Residential Building and Services. On the Non-residential front, we delivered several large projects, including the Zuidplein Theatre and Library (Kunstenpand) and the International Conference Centre (near Ahoy) as part of the area development and metamorphosis of Hart van Zuid in Rotterdam. We also completed the renovation of Huize Westerlicht, a national monument in Alkmaar. Other (sub)deliveries included the government offices on Laan op Zuid (Rotterdam) and the Duineveld project in Noordwijk aan Zee.
Infra had a particularly strong year due to solid volumes combined with excellent project results. Revenue rose to € 662 million from € 619 million in 2019. The change of course on the project management front and a more differentiated project portfolio paid off last year. Problematic projects from the past, such as the Gaasperdammer tunnel on the A9 motorway and the Wilhelmina lock reached essential milestones in a controlled manner and the contract for the Zuidasdok was terminated in consultation with the Ministry of Public Works and Waterways (Rijkswaterstaat).
With respect to the Wintrack II project, we expect the outcome of the arbitration to be known in the course of 2021. The problematic projects of the past have now given way to a well-distributed order book, with project results showing substantial improvements in terms of predicta-bility. We achieved the highest volume on the A1 Azelo project, which is on schedule and which Heijmans expects to complete in the first half of 2021. In recent years, we have exercised greater caution in recognising opportuni-ties and risks in projects and increased our focus on core competencies. Partly as a result of this, the EBITDA margin continued to increase and came in at 5.6% in 2020, compared with 4.8% in 2019, bringing it into line with our long-term ambition level sooner than expected.
Net profit, cash flow and dividendWe recorded another increase in net profit for the full year 2020, as this came in at € 40 million, 33% higher than the € 30 million reported in 2019. Net profit was significantly higher last year due to the increase in EBITDA and the low tax rate as result of the valuation of previously unrecognised losses from previous years we were able to offset against profits. Cash flow also showed a strong positive development. In addition to Heijmans’ solid performance, operational cash flow was driven by a strong capital development, in which the rapid collection of receivables and the continued strong work in progress positions (pre-financing of projects) were particularly noteworthy. Net debt improved by € 67 million to a net

98 Heijmans Annual Report 2020
FINANCIAL RESULTS
cash position of € 37 million over the course of 2020. Due to our strong operating cash flow, Heijmans made no use of the syndicated loan in the year under review. Heijmans' solvency has increased in recent years, despite the introduction of IFRS 15, IFRS 16 and the buy-in of the pension fund, and stood at 28.8% at year-end 2020. Without these effects, solvency would have been around 36%. Heijmans also extended funding facilities on improved terms and at robust levels last year. In the light of these improved balance sheet ratios, Heijmans has decided to propose a dividend of € 0.73 per share for 2020. This corresponds to 40% of realised net profit and is therefore in line with the intended pay-out ratio of the dividend policy. Shareholders will be offered the choice between payment in the form of stock dividend or a cash dividend.
RevenueThe composition of income divided per sector in 2020 was as follows:
Underlying EBITDA Heijmans recorded an overall revenue increase of over 9% to € 1,746 million in 2020 (2019: € 1,600 million). This increase was visible in all sectors, while Infra delivered a particularly solid performance. Underlying EBITDA also improved by 9% to € 85 million in 2020 (2019: € 78 million). At our Property Development and Residential Building operations, this was primarily due to increased volume. Infra also had an excellent year in terms of both volume and margin development. In recent years, we have increasingly managed to make sure we are in control of projects. The impact of Covid-19 on our costs was largely manageable.
Underlying EBITDA in € million 2020 2019
Property Development 30 26
Building & Technology 25 30
Infra 37 30
Group -7 -8
Total underlying EBITDA* 85 78
Our Property Development and Residential Building activities once again made a significant contribution to Heijmans’ underlying EBITDA in 2020. Revenue at Property Development was up 5% compared with the previous year. Residential Building recorded a stable year with a slight improvement in both volume and result. The availability and affordability of suppliers and people remains a point of attention. We continue to focus on efficiency, further prefabrication and standardisation, the reduction of failure costs and quality.
At Building & Technology, the picture was mixed. Volume and performance were good across the board, especially at Residential Building and Services. However, the result of Non-residential projects was depressed by delays and additional costs in the New Amsterdam Court House (NACH) project in Amsterdam. This project was hampered by the Covid-19 outbreak, which manifested itself in the form of increased absenteeism and delayed deliveries due to temporary lockdowns in neighbouring countries. As a result, critical materials and resources were not always available on time, which had a major impact on the logistical processes and led to delays in execution. We will complete this project in the first quarter of this year. The lower result on this project was offset by solid perfor-mances on our other non-residential projects.
Infra had a particularly strong year due to solid volumes combined with excellent project results. Revenue increased by 7% to € 662 million from € 619 million in 2019. Infra also made the largest contribution of all sectors to our underlying EBITDA. The change of course on the project management front and a more differentiat-ed project portfolio paid off last year. In recent years, we have exercised greater caution in terms of recognising opportunities and risks in projects and increased our focus on core competencies. Partly as a result of this, the EBITDA margin continued to increase and came in at 5.6% in 2020, compared with 4.8% in 2019, bringing it into line with our long-term ambition level sooner than expected.Strengthened risk management has resulted in a more
Revenue in € mln. 2020 2019 Difference
Property Development 482 459 5%
Building & Technology 920 817 13%
Infra 662 619 7%
Elimination -318 -295
Total revenue 1.746 1.600

99Heijmans Annual Report 2020
FINANCIAL RESULTS
selective acquisition policy. This in turn has led to a change in the revenue mix, with a greater focus on regional activities and Management & Maintenance / asset management contracts. Heijmans still considers Design & Build contracts as a core activity, provided these contracts fit into our core competencies, the risks are well managed and they have a healthy earnings potential. The construction sector remains a sector where the overall potential is determined to a large extent by operational excellence, or the absence of material project losses.
Operating result The operating result (EBIT) came in at € 56 million in 2020 (2019: € 29 million). The operating result was influenced to a limited extent by restructuring costs (€ 4 million), movements in in the valuation of property investments and land holdings (on balance minus € 2 million) and one-off sales results (on balance € 1 million) that were related to the sale of the company’s equity interest in Heijmans Capital and the transfer of the asphalt activities to AsfaltNu, the joint venture with BAM. Heijmans Capital was a holding company that held shareholdings in four PPP projects. The sale price of this interest was more than € 7 million and the sale proceeds were limited. The operating result can be broken down as follows:
Value adjustment Heijmans regularly evaluates its real estate and land holdings based on the applicable reporting guidelines. In 2020, this resulted in value adjustments of € 2 million. Restructuring costs Following some limited adjustments to the organisation, the restructuring costs came in at € 4 million in 2020 (2019: € 3 million). These costs were primarily related to qualitative adjustments to the organisation.
Book results sales In 2020, Heijmans Nederland B.V. sold its 20% interest in Heijmans Capital to fellow shareholder 3i, which was already a participant via its infrastructure fund. Heijmans Capital comprises shareholdings in four PPS projects (NMM Soesterberg, IXAS/A9, A1/A27 and A12). The sales proceeds were more than € 7 million, while the impact on the book result was limited. Following the decision to hive off the asphalt activities together with BAM, we estab-lished the AsfaltNu joint venture in December 2020. All the asphalt production plants and associated laboratories have now been transferred to the joint venture and we realised a marginal book profit on this transaction. As the asphalt plants were largely written off, the impact on the consolidated statement of financial position was otherwise limited.
Financial income and expenses The financial income and expenses can be broken down as follows:Operating result
in € million2020 2019
Underlying EBITDA 85 78
Correction EBITDA result of joint ventures 10 -8
Write-down of real estate and land holdings
-2 -5
Restructuring costs -4 -3
Soil remediation 0 -1
Result divestments 1 1
EBITDA 90 62
Depreciation / amortisation -34 -33
Operating result 56 29
Financial income and expenses in € million
2020 2019
Interest income 1 1
Financial income 1 1
Other interest expense -8 -8
Interest expense -8 -8
Balance -7 -7
Capitalised interest 2 2
Financial income and expenses * -5 -4
* Due to rounding up, the balance deviates from the sum of parts.
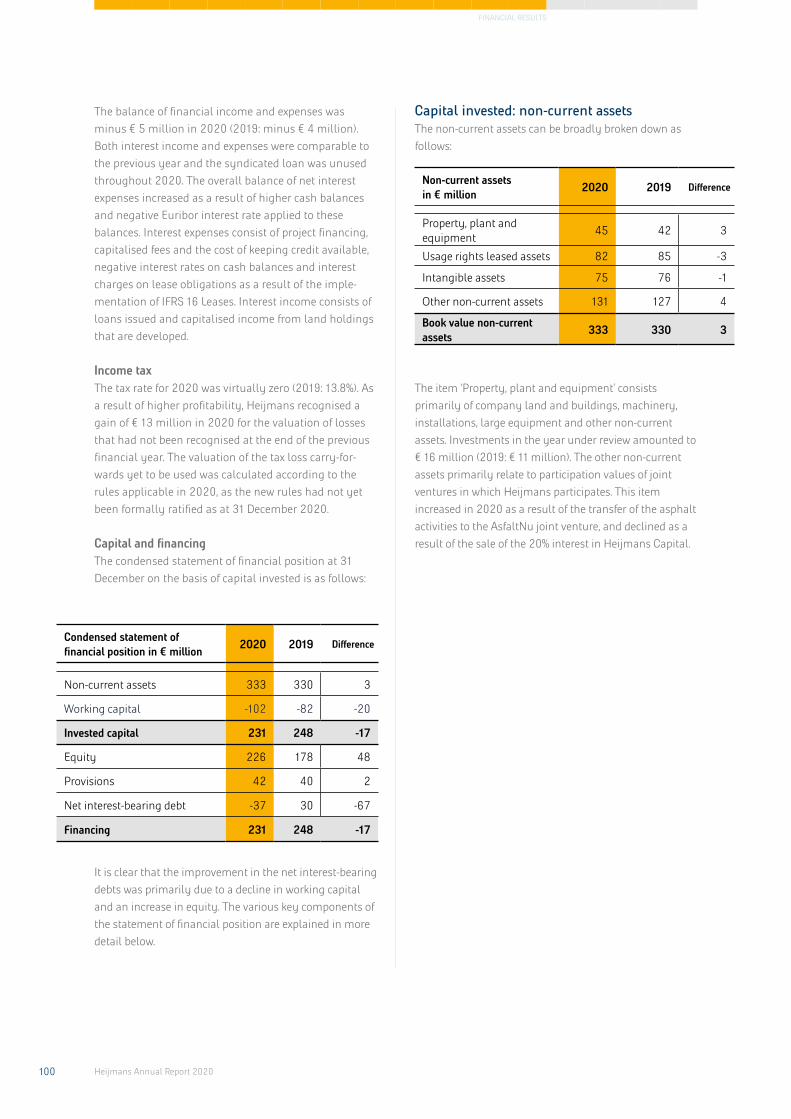
100 Heijmans Annual Report 2020
FINANCIAL RESULTS
The balance of financial income and expenses was minus € 5 million in 2020 (2019: minus € 4 million). Both interest income and expenses were comparable to the previous year and the syndicated loan was unused throughout 2020. The overall balance of net interest expenses increased as a result of higher cash balances and negative Euribor interest rate applied to these balances. Interest expenses consist of project financing, capitalised fees and the cost of keeping credit available, negative interest rates on cash balances and interest charges on lease obligations as a result of the imple-mentation of IFRS 16 Leases. Interest income consists of loans issued and capitalised income from land holdings that are developed.
Income tax The tax rate for 2020 was virtually zero (2019: 13.8%). As a result of higher profitability, Heijmans recognised a gain of € 13 million in 2020 for the valuation of losses that had not been recognised at the end of the previous financial year. The valuation of the tax loss carry-for-wards yet to be used was calculated according to the rules applicable in 2020, as the new rules had not yet been formally ratified as at 31 December 2020.
Capital and financing The condensed statement of financial position at 31 December on the basis of capital invested is as follows:
It is clear that the improvement in the net interest-bearing debts was primarily due to a decline in working capital and an increase in equity. The various key components of the statement of financial position are explained in more detail below.
Capital invested: non-current assets The non-current assets can be broadly broken down as follows:
The item ‘Property, plant and equipment’ consists primarily of company land and buildings, machinery, installations, large equipment and other non-current assets. Investments in the year under review amounted to € 16 million (2019: € 11 million). The other non-current assets primarily relate to participation values of joint ventures in which Heijmans participates. This item increased in 2020 as a result of the transfer of the asphalt activities to the AsfaltNu joint venture, and declined as a result of the sale of the 20% interest in Heijmans Capital.
Condensed statement of financial position in € million
2020 2019 Difference
Non-current assets 333 330 3
Working capital -102 -82 -20
Invested capital 231 248 -17
Equity 226 178 48
Provisions 42 40 2
Net interest-bearing debt -37 30 -67
Financing 231 248 -17
Non-current assets in € million
2020 2019 Difference
Property, plant and equipment
45 42 3
Usage rights leased assets 82 85 -3
Intangible assets 75 76 -1
Other non-current assets 131 127 4
Book value non-current assets
333 330 3

101Heijmans Annual Report 2020
FINANCIAL RESULTS
Capital invested: working capital At year-end 2020, working capital stood at -/- € 102 million (2019: -/- € 82 million). The composition of working capital can be broadly broken down as follows:
Working capital fluctuates significantly over the course of the year, although in recent years Heijmans has succeeded in making its activities and the associated impact on working capital less volatile and less sensitive to seasonal influences. Heijmans working capital requirements are highly project-specific and related to the payment schemes of principals. The construction sector has a seasonal pattern, with higher levels of activity in the second and fourth quarters, as well as a raised level of notarial transfers and claim settlements/supplementary work settlements immediately prior to reporting dates.
Higher working capital requirements in the course of the year result in greater capital utilisation, which Heijmans primarily finances through the use of a revolving credit facility, which it did not use at all in 2020.
Receivables, payables and work in progressThe working capital utilisation of Heijmans’ building activities (in other words, the non-property development activities) is determined primarily by the rate of invoic-ing, as well the rate at which outgoing and incoming invoices are paid. The invoice rate can be derived from the item ‘work in progress’, which is recognised on both the assets and liabilities sides of the statement of financial position. If this shows a credit position on balance, this means projects are pre-financed by principals on a Heijmans-wide basis. This is one of our specific aims on the order intake front, and this balance showed a pre-financed position throughout 2020. In recent years, we have considerably reduced the average term for receivables, and this effect continued in 2020. The negative Euribor rate on bank balances is expected to play a role in this, as clients increasingly pay earlier than their agreed payment terms.
Inventory position Property Development In our Property Development activities, working capital utilisation is affected significantly by our land holdings, including land in development, which are recognised under inventories. Total inventories at Property Development increased in 2020. Strategic land holdings increased to € 52 million, from € 28 million in 2019, due to the fact that Heijmans acquired the full ownership rights of a number of land holdings in which it already held a 50% participation (previously in the item partici-pations). The land in operation declined slightly to € 74 million, from € 82 million, largely due to the solid progress booked in developments in Zutphen, Berkel Enschot and Uden. In addition to the inventories, Heijmans Property Development has also added various land rights, or new land holdings, to its portfolio, which can be divided into contingent and unconditional liabilities. As a result of the transfer of various positions to the item ‘own development’, this item declined to € 136 million in 2020, from € 156 million in 2019, with €33 million of this in unconditional liabilities. The vast majority of contingent liabilities will have only a limited cash impact upon realisation. This pertains primarily to obligations to purchase land at the moment a building permit has been granted and/or a sales percentage has been realised.
Working capital in € million
2020 2019 Verschil
Strategic land holdings 126 110 16
Residential properties in preparation and under construction
72 85 -13
Other inventory 17 10 7
Work in progress -104 -85 -19
Accounts receivable 141 185 -44
Payables -354 -387 33
Working capital -102 -82 -20
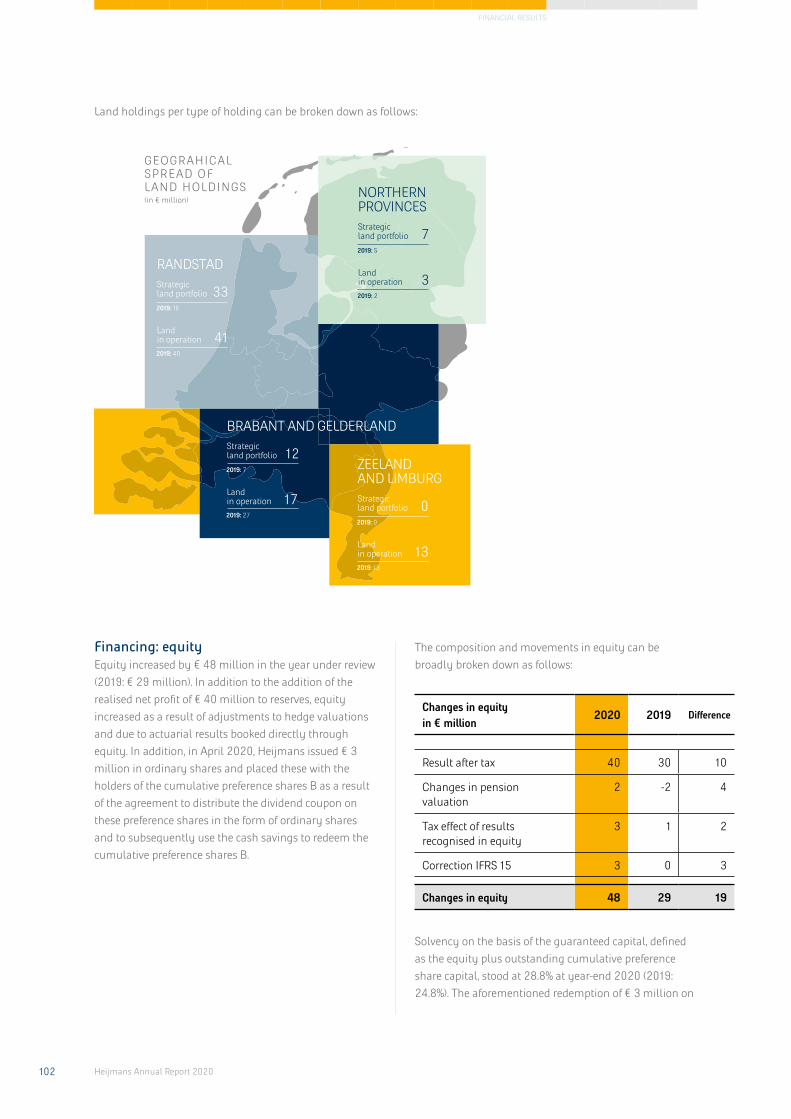
102 Heijmans Annual Report 2020
FINANCIAL RESULTS
Land holdings per type of holding can be broken down as follows:
GEOGRAHICALSPREAD OFLAND HOLDINGS (in € million)
NORTHERN PROVINCESStrategic land portfolio
Land in operation
2019: 5
7
32019: 2
RANDSTADStrategic land portfolio
Land in operation
2019: 16
33
412019: 40
BRABANT AND GELDERLANDStrategic land portfolio
Land in operation
12
172019: 27
2019: 7 ZEELAND AND LIMBURGStrategic land portfolio
Land in operation
2019: 0
0
132019: 13
Financing: equity Equity increased by € 48 million in the year under review (2019: € 29 million). In addition to the addition of the realised net profit of € 40 million to reserves, equity increased as a result of adjustments to hedge valuations and due to actuarial results booked directly through equity. In addition, in April 2020, Heijmans issued € 3 million in ordinary shares and placed these with the holders of the cumulative preference shares B as a result of the agreement to distribute the dividend coupon on these preference shares in the form of ordinary shares and to subsequently use the cash savings to redeem the cumulative preference shares B.
The composition and movements in equity can be broadly broken down as follows:
Solvency on the basis of the guaranteed capital, defined as the equity plus outstanding cumulative preference share capital, stood at 28.8% at year-end 2020 (2019: 24.8%). The aforementioned redemption of € 3 million on
Changes in equity in € million
2020 2019 Difference
Result after tax 40 30 10
Changes in pension valuation
2 -2 4
Tax effect of results recognised in equity
3 1 2
Correction IFRS 15 3 0 3
Changes in equity 48 29 19

103Heijmans Annual Report 2020
FINANCIAL RESULTS
the cumulative preference shares B meant that the guaranteed capital was € 42 million higher than the shareholders’ equity reported at year-end 2020. The balance sheet total increased to € 931 million from € 898 million, primarily due to an increase in cash and cash equivalents. The introduction of IFRS 16 had a significant impact of € 80 million on the balance sheet, since agreements previously recognised as operational leases and rentals had an off balance sheet character.
For 2020, Heijmans proposes to pay € 0.73 per share from its profit in the form of an optional dividend. This means that we have resumed dividend payments at a pay-out ratio of approximately 40%.
Financing: net interest-bearing debt The net cash position had improved to € 37 million at year-end 2020, compared with € 30 million net debt at year-end 2019, thus a net improvement of € 67 million. Apart from the cumulative preference shares B and a number of project financing agreements, Heijmans had virtually no loans outstanding at year-end 2020.
The so-called recourse net cash position (see section 6.21 of the financial statements for an explanation), which is also the basis for Heijmans’ agreements with its banks, stood at € 165 million at year-end 2020 (2019: € 127 million). This increase of € 38 million was higher than the improvement in the net cash position due to the fact that the cash balances of non-consolidated joint ventures (which are included in the calculations for the covenants) were relatively high.
Syndicated loan In August 2020, Heijmans and the syndicate of banks, consisting of ABN Amro, ING and Rabobank, decided to extend the existing syndicated loan by one year on the same terms. This financing agreement was originally set to expire in mid-2022, and in such cases it is customary to refinance no later than mid-2021. Prompted by the - initially – severe reaction of the capital markets to the Covid-19 crisis, Heijmans decided to extend the financing by one year in the interim. This has created a larger time horizon to arrange a more structural refinancing, which puts Heijmans in a better position to choose the right moment for this, given the volatility in the capital markets. The agreements applicable to the syndicated loan include the following:• The agreement has an end date in mid-2023.• The total commitment of the facility is € 121 million.• The interest margin depends on the performance in
terms of the financial covenants, and currently stands at 2.25%, and is expected to remain unchanged throughout 2021. Based on additional performance agreements, this can improve to 1.65%.
• Heijmans has agreed a security package with the banks. This includes a pledge of the bank accounts (100%), intellectual property rights, receivables, materials, a pledge of the proceeds from divestments, as well as a first right of mortgage on land holdings with a total carrying amount of around € 48 million at year-end 2020.
Amounts in € million 2020 2019 Difference
Equity 226 178 48
Cumulative preference shares
42 45 -3
Guaranteed capital 268 223 45
Total assets 931 898 33
Solvency 29% 25%
Interest-bearing debt in € million.
2020 2019 Difference
Non-current 115 115 0
Current 23 24 -1
Gross debt 138 139 -1
Cash and cash equivalents -175 -109 -66
Net debt -37 30 -67

104 Heijmans Annual Report 2020
FINANCIAL RESULTS
In terms of financial covenants, the following agreements apply:• The Interest Cover Ratio must be measured every
quarter at a minimum level of 4.• The Leverage Ratio must be measured every six
months at a maximum level of 3.• The Average Leverage Ratio must be measured every
quarter at a maximum level of 1.• The Solvency Ratio is measured at the end of each
year on the basis of the guaranteed capital and must be at least 22.5%. These calculations can be corrected for the recent impact of IFRS 15 and 16.
Heijmans operated well within the bandwidth of these covenants in 2020. With respect to the score relating to the covenants, we refer to section 6.21 for a breakdown of the calculation method and the comparable figures.
Cumulative preference shares BIn its financing structure, Heijmans N.V. uses € 41.8 million in cumulative preference financing shares B, placed with the investment fund De Zonnewijser and Nationale Nederlanden Levensverzekering Maatschappij N.V.
The agreement with the holders of the cumulative preference shares stipulates a review of the dividend coupon every five years. As of 1 January 2019, the annual dividend, payable upon adoption by the Annual General Meeting, stands at 7.21% of the principal sum.
There is no contractual repayment obligation attached to the cumulative preference financing shares B, except in the following instances:• As soon as Heijmans resumes dividend payments on
ordinary shares, half the amount paid out on ordinary shares will be paid as a repayment of the share premium reserve on the cumulative preference financing shares B;
• Heijmans will ask the General Meeting of Shareholders each year to authorise Heijmans’ Executive Board to issue a maximum of 10% of the outstanding (ordinary) share capital, in line with recent years. Using this mandate, Heijmans will pay out the newly agreed dividend coupon on cumulative preference shares in the form of ordinary shares at market price, with the resultant cash savings to be used to repay the outstanding capital of the cumulative preference shares B. The repayment element will therefore not impact the guaranteed capital and will have no net cash impact. For example, if shares were issued at the 2020 closing share price of € 9.33, this would result in the issuance of a rounded off 1.5 % of the share capital in 2020.
• As soon as the solvency based on the guaranteed capital exceeds 30% (as reported in the annual report in each future year) and Heijmans elects to pay a dividend in respect of the relevant year, Heijmans will make an additional repayment in the form of a repayment of share premium reserve on the cumula-tive preference shares B in the amount of the dividend coupon payable from the previous year.
In the event that the total repayments exceed 50% of the current issued capital of the cumulative preference shares B (i.e. the issued capital is reduced to below € 22,550,000) as at 1/1/2019, an automatic discount of 100 bps will apply to the dividend coupon. In other words, the annual dividend coupon will be reduced to 6.21%.
In the event of the above-mentioned repayments, each year on 30 June, the voting rights of the cumulative preference shares B will be adjusted to reflect the pro rata impact on capital ratios.
Based on the above agreements, Heijmans made a 7.21% repayment of the original capital of € 45.1 million in April 2020 in the form of a repayment on the share premium reserve. As a result, the outstanding capital is € 41.8 million and the voting ratio has been adjusted (for a more detailed explanation, see The Heijmans Share chapter).
Based on the dividend proposal for the 2020 financial year and conditional on the AGM approving the dividend proposal and the share issue mandate, Heijmans expects the cumulative preference shares B to decline by € 11 million in 2021, with € 3 million of this decline the result of the repayment ensuing from the issue mandate and € 8 million the result of 50% of the dividend proposal of € 0.73 per share.
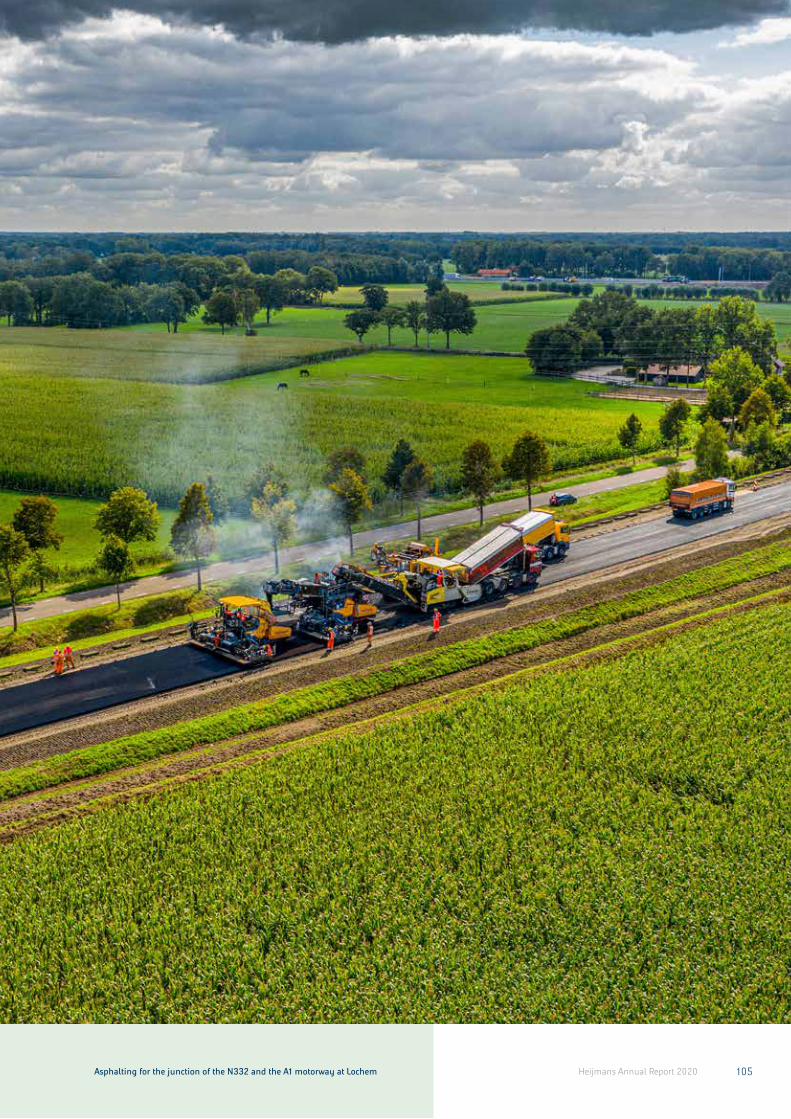
105Heijmans Annual Report 2020
THE MANAGEMENT
Asphalting for the junction of the N332 and the A1 motorway at Lochem

106 Heijmans Annual Report 2020
FINANCIAL RESULTS
Cash flow The condensed statement of cash flows, based on the indirect method, is as follows:
Order book The order book for the Heijmans groups as a whole stood at € 1,946 million at year-end 2020 (year-end 2019: € 2,124 million). The order book remained stable in the fourth quarter. The order book did decline slightly in the course of the year, due to high production and the contract termination of the Zuidasdok project, which accounted for €134 million in the order book at year-end 2019. As Heijmans is now focusing less on large, integrated projects, the structure of the order book has become somewhat more short-cyclical in recent years. As a result, the perspective in the order book for the years after 2021 has diminished somewhat. In January 2021, we added several substantial new projects to the order book, including the construction of 735 student homes in Eindhoven (€ 60 million), a large project on the campus of Leiden University (€ 71 million), approximately 500 standardised rental homes in Eindhoven (€ 60 million) and a complex with 95 apartments in Zutphen (€ 28 million).
Cash flow in € million 2020 2019 Verschil
EBITDA – underlying 85 78
Restructuring expense -2 -3
Interest paid/received -3 -7
Income tax - -
Movement in working capital and other 48 -26
Cash flow from operations 128 42 86
Investments in property, plant and equipment -12 -
Investments in intangible assets -16 -11
Proceeds from sale of property, plant and equipment
1 8
Capital issued/repaid and loans granted to jointventures and associates
-6 7
Investment cash flow -33 4 -37
Dividend paid 0 0
Correction due to transfer into new collaboration
-7 -
Correction IFRS 16 -21 -107
Movement in net debt 67 -61 128
Order book in € million 31-12-2020 30-06-2020 31-12-2019
Property Development 540 492 454
Building & Technology 1.101 1.172 1.268
Infra 731 704 791
Eliminations -426 -396 -389
Order book 1.946 1.972 2.124

107Heijmans Annual Report 2020
FINANCIAL RESULTS
OutlookHeijmans is in good shape for 2021. Although the ongoing nitrogen emissions problem and the Covid-19 crisis have led to more uncertainty about clients' spending patterns, the outlook in our sectors remains good. While the demand for retail and office space is expected to decline in the coming years, the demand for housing and more sustainable solutions is only increas-ing. The outlook for the maintenance market is also good, specifically in infra, where at a national level we are facing major replacement work on tunnels and bridges, as well as work related to the energy transition or the high-tide protection programme.
Based on entrepreneurship, innovation and agility, in combination with adherence to our selective acquisition policy, we are looking to the future with confidence. Heijmans believes its revenue for 2021 may be slightly lower - due to temporarily lower revenue from Non-residential projects - while profitability is expected to remain at least at the same level.
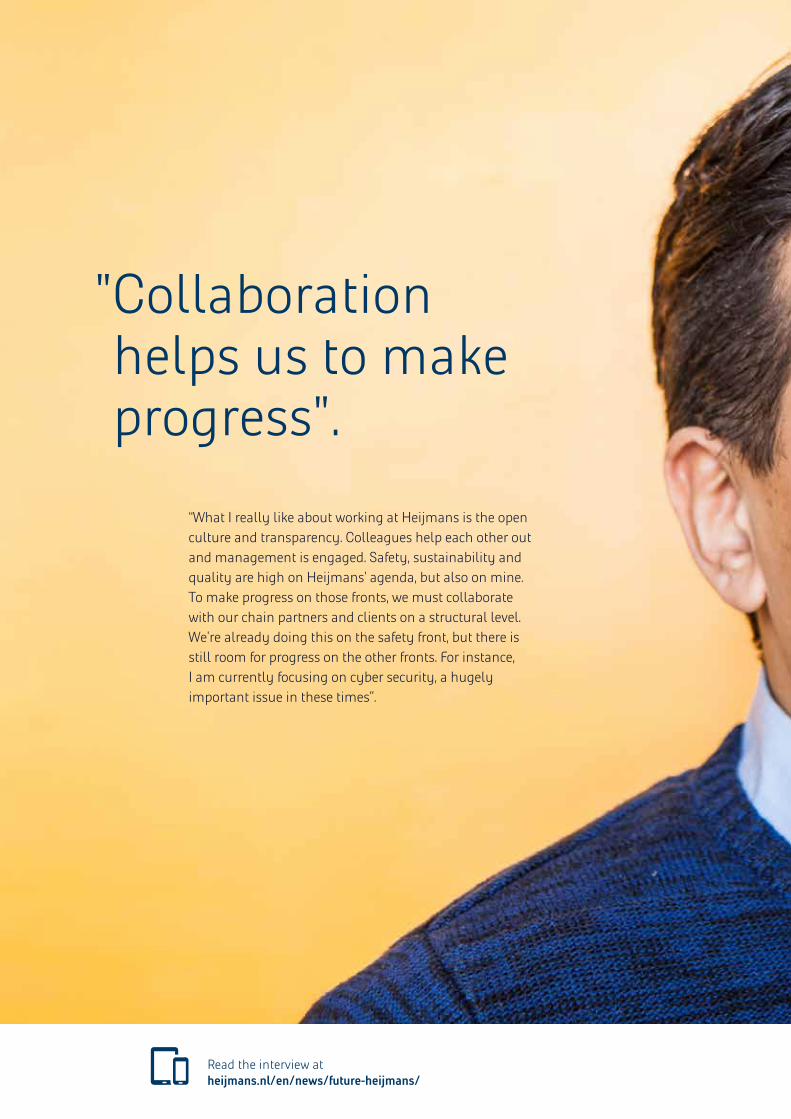
“What I really like about working at Heijmans is the open culture and transparency. Colleagues help each other out and management is engaged. Safety, sustainability and quality are high on Heijmans’ agenda, but also on mine. To make progress on those fronts, we must collaborate with our chain partners and clients on a structural level. We’re already doing this on the safety front, but there is still room for progress on the other fronts. For instance, I am currently focusing on cyber security, a hugely important issue in these times”.
" Collaboration helps us to make progress".
Read the interview at heijmans.nl/en/news/future-heijmans/

Bram Pattinaja (32)Quality & Safety Coordinator

110 Heijmans Annual Report 2020
Through our mission and our activities, we actively contribute to achieving the United Nations’ Sustainable Development Goals (SDGs). In 2018, we conducted an impact analysis of the SDGs to see which ones are most relevant to our organisation so we can focus on them. We conducted the impact analysis on all 17 SDGs and 169 sub-targets. We looked at them on the basis of two criteria:
• Contribution: does Heijmans make a (positive or negative) contribution to the realisation of this sub-goal through its operations, activities and/or investments?
• Potential: does Heijmans have a lot of potential, average potential or little or no potential to have an impact on the realisation of this sub-goal?
We then discussed and scored the various goals and subsequently put the outcome to a panel of experts and senior management in the organisation. In appendix 16.7.9, we explain why we chose certain SDGs and our role in each sub-target in more detail. In appendix 16.7.4, we show how our KPIs and material aspects relate to the SDGs.
13 Sustainable Development Goals

111Heijmans Annual Report 2020
SUSTAINABLE DEVELOPMENT GOALS
The top SDGs for Heijmans in order of importance: 1. SDG 7. Affordable and sustainable energy2. SDG 8. Decent work and economic growth3. SDG 9. Industry, innovation and infrastructure4. SDG 11. Sustainable cities and communities5. SDG 12. Responsible consumption and production
High
LowAverage
Impact
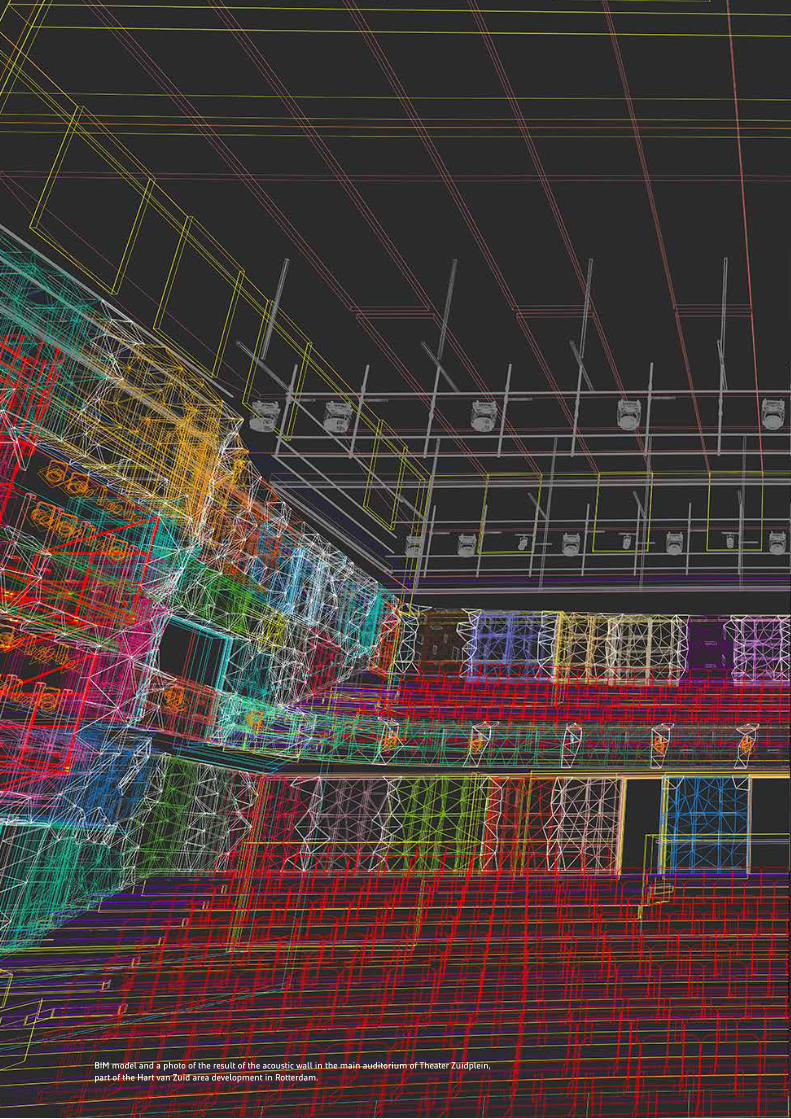
BIM model and a photo of the result of the acoustic wall in the main auditorium of Theater Zuidplein, part of the Hart van Zuid area development in Rotterdam.


114 Heijmans Annual Report 2020
14.1 Report of the Supervisory BoardThe Supervisory Board has taken note of the report of the Executive Board for the 2020 financial year. The financial statements have been audited by EY (Ernst & Young Accountants LLP) and the latter issued an unqualified auditor’s report on 19 February 2021. The auditor's report has been added to the financial statements as appendix 16.4 to the Heijmans 2020 annual report. We recommend that the General Meeting of Shareholders adopt the 2020 financial statements and discharge the members of the Executive Board for their management of the company. We approve Executive Board’s proposal to pay out a dividend of € 0.73 per (depositary receipt for) ordinary share for 2020.
Position and key developments 2020
Role and powers of the Supervisory Board The Supervisory Board supervises the strategy of the Executive Board and the general course of business at the Company and its affiliated enterprise and provides the Executive Board with advice. The Supervisory Board also focuses on the effectiveness of the Company’s internal risk management and control systems and the integrity and quality of its financial reporting.
14 Corporate Governance

115Heijmans Annual Report 2020
CORPORATE GOVERNANCE
In the performance of its duties, the Supervisory Board acts in the interests of the Company and its affiliated companies and in doing so takes into account the legitimate interests of the Company’s stakeholders. The Supervisory Board also takes into account the social aspects of business operations that are relevant to the Company. The Articles of Association of Heijmans N.V. and the Regulations for the Supervisory Board of Heijmans N.V. include rules with respect to board meetings and decision making. Both of these documents are available on the Heijmans N.V. website under the heading ‘Corporate Governance: Codes, Articles of Association and Regulations’.
Specific areas of supervision The Supervisory Board’s supervision of the Executive Board includes aspects such as how the Executive Board executes the strategy with a view to value creation, the realisation of objectives, the risks associated with business activities, the structure and operation of the internal risk management and control systems, the process of financial reporting, compliance with legislation and regulations, shareholder relations (see, for example, chapter 14, section 14.2 ‘Corporate Governance’ of this annual report), the activities of the Executive Board with respect to the culture within the company, the operation of the reporting procedures related to abuses and irregularities and the social aspects of business opera-tions that are relevant to the Company.
Accents and activities in 2020
Covid-19In early 2020, the world was suddenly caught up in the outbreak of the Covid-19 virus. It was impossible to predict just how much impact the Covid-19 outbreak would have in early 2020, for the Netherlands but also for companies. The Executive Board and the Supervisory Board discussed the situation extensively. We devoted attention not only to the financial consequences, but more specifically the impact on the health and safety of Heijmans' employees and those of its subcontractors who continued to work on our projects, in the office and from home. The Supervisory Board determined that the primary focus of the Executive Board in 2020 should be to arm the Company and its employees as robustly as possible against the conse-quences of this outbreak.
Because 2019 was a financially good year for Heijmans, the company decided at the beginning of 2020 to start paying dividends again, for the first time since 2013. However, as a result of the Covid-19 outbreak, that
intention was cast in a completely different light. After intensive deliberation between the Executive Board and the Supervisory Board, Heijmans decided at the end of March 2020 to withdraw the dividend proposal because the outlook at that time was very uncertain and it was not clear to what extent and for how long Covid-19 would affect the Company.
It is now clear that Heijmans has weathered the Covid-19 crisis well. However, the long-term effects are uncertain. In view of the financial results for 2020, the Executive Board has proposed paying a dividend of €0.73 per share on ordinary shares. The Supervisory Board has agreed with this proposal.
Result development In 2020, the Executive Board continued to build on the foundations laid in previous years to reduce debt and improve capital ratios. The Supervisory Board monitored and supported the Executive Board's efforts. The Supervisory Board also continued to devote constant attention to the ‘focus, discipline and excellence' pro-gramme. The 'margin over volume policy', the continued professionalisation of the organisation and improvements to the company’s internal processes were also discussed extensively in the meetings of the board. The Executive Board also frequently consulted the Supervisory Board regarding the reduction of the risk profile of a number of large projects while maintaining a healthy entrepreneuri-al spirit.
FinancingHeijmans has gradually strengthened its balance sheet to a robust level in recent years, putting the company in a good position to deal with the uncertain market condi-tions. Both the Executive Board and the Supervisory Board saw this as a reason to enter into consultations with its syndicate of banks regarding the €121 million syndicated loan that was originally due to expire on 30 June 2022. As a result of these consultations, this agreement has been extended by one year, until 30 June 2023, under the same terms. As a result, Heijmans has further consolidated its financing relationships and is less sensitive to possible fluctuations in the capital markets in light of the current economic conditions. In the course of the year, the Supervisory Board and Executive Board frequently discussed the results in relation to the company’s financing requirements.
StrategyIn line with good governance practice, in 2020 the Executive Board reviewed the long-term strategy 'Better, Smarter, Sustainable' developed in 2018. This not only

116 Heijmans Annual Report 2020
CORPORATE GOVERNANCE
involved using KPIs to assess the progress made on the strategic goals, but also a portfolio recalibration that led to a tightening up of a number of objectives. The Supervisory Board monitors the implementation of the strategy, and it discusses various strategic themes at every meeting with the Executive Board. The Supervisory Board also took note of the progress made in areas including safety, compliance & risk, renewal and innovation, including through presentations given by a number of experts during meetings with the Supervisory Board and the Executive Board.
Corporate governanceThe Supervisory Board was kept abreast of the develop-ments in the field of Corporate Governance, including the Corporate Governance Code and relevant new regulations, such as draft legislation on diversity (the assimilation quota for members of the supervisory board and sub-senior management), the draft legislation pertaining to the statutory cooling off period for listed companies and the draft legislation on management and supervi-sion. For more information, we refer to section 14.2 ‘Corporate Governance’ of this annual report.
Frequency of meetings and attendanceIn 2020, the Supervisory Board held seven scheduled meetings and four extra meetings in the presence of the Executive Board. The regular meetings were preceded by internal consultations within the Supervisory Board. A number of these meetings were held entirely digitally as a result of Covid-19 and some meetings took place in a hybrid format. Ms. Boumeester was unable to attend the meetings up to her resignation in mid-April 2020. She made use of the option to discuss the items on the agenda with the Chair prior to the meeting and was given the opportunity to express her views. All members of the Remuneration committee and the Selection and Appointments committee attended all meetings of said committees or there were prior telephone consultations. The members of the Audit committee attended all meetings of said committee.
The Supervisory Board normally visits a large project during its June meeting. However, the joint project visit did not take place in the year under review due to the Covid-19 outbreak. Some of the Supervisory Board members did visit a number of projects individually, taking all safety measures into account.
The Company’s external auditor attended the meeting in which the financial statements for 2019 were discussed. In 2020, the Supervisory Board was represented at several consultation meetings of the Works Council. Members of
the Supervisory Board regularly consult with members of the Executive Board, depending on their specific tasks. This is particularly true for the Chair of the Supervisory Board and the Chairs of the Board’s committees, i.e. the remuneration and appointments committee and the audit committee and risk committee.
Resolutions The important resolutions of the Supervisory Board in 2020 included the following:
• Approval of the revised portfolio strategy• Approval of the decisions of the Executive Board to
adopt and change the operational and financial objectives of the Company;
• Approval of the 2020 business plan and budget of Heijmans N.V., which outlines the parameters of the strategic principles of the policy;
• Approval of the specification of the criteria for the short-term and long-term variable bonuses of the members of the Executive Board;
• The decision to put the remuneration policy for the Executive Board and Supervisory Board, on the agenda for the General Meeting of Shareholders of 15 April 2020;
• The decision to nominate Mr G.A. Witzel as a member of the Supervisory Board at the General Meeting of Shareholders on 15 April 2020;
• The decision to nominate Mr R. Icke for reappointment as a member of the Supervisory Board at the General Meeting of Shareholders on 15 April 2020;
• The proposal to reappoint Mr A.G.J. Hillen as member and chairman of the Executive Board after the General Meeting of Shareholders on 15 April 2020;
• Approval of the Executive Board’s proposal for the appropriation of the result of Heijmans N.V. for the financial year 2019, comprising a payment of dividend on ordinary shares;
• Approval of the Executive Board's proposal to withdraw the dividend proposal for the 2019 financial year due to the Covid-19 outbreak.
• Approval of the Executive Board’s decision to extend the syndicated financing for one year through to 30 June 2023.
• Approval of the Executive Board’s resolution to issue ordinary shares by way of dividend payment to the holders of cumulative financing preference shares B.
Executive BoardThe Executive Board has two members. Their areas of attention are as follows:• Mr. A.G.J. (Ton) Hillen, CEO: General affairs, Property
Development, Building & Technology, Infra,
117Heijmans Annual Report 2020
CORPORATE GOVERNANCE
Sustainability, HR & Management Development, Procurement and Innovation;
• Mr. J.G. (Hans) Janssen, CFO: Finance & Tax, Risk office, Investor relations, IT, Legal Affairs, PR & Communications, Pensions and Facilities.
In early 2021, Mr Janssen stated that he will be leaving Heijmans as of 15 April 2021. The Supervisory Board has started the process to arrive at the appointment of a new CFO.
Self-assessment Supervisory BoardOne of the principles of the Dutch Corporate Governance code is that supervisory boards are collectively responsi-ble for their own performance, with self-assessment being defined as a best practice. In 2020, the Supervisory Board, together with the Executive Board, devoted considerable attention to ensuring the improvement measures they jointly defined remain effective. The self-evaluation for 2020 was carried out on the basis of an extensive questionnaire that was completed by all members of the Supervisory Board and, in parts, by the members of the Executive Board. The resulting report was discussed extensively at the Supervisory Board meeting in January 2021. The evaluation for 2020 showed that the previously formulated points for improvement had been retained, but that there was room for tightening up on certain points. It was agreed that extra attention would be paid to these specific points in 2021.
DiversityThe composition of the Heijmans Supervisory Board is diverse in terms of gender, background and experience. Pursuant to the Dutch Management and Supervision Act, larger companies are obliged to strive for a composition of at least 30% female and 30% male members on the Supervisory Board, insofar as the seats on the board are filled by natural persons. Two of the five members of the current Heijmans Supervisory Board are female, repre-senting 40% of the total. For further background informa-tion about the members of the Supervisory Board, see chapter 3 ‘Management’ of this annual report. The diversity policy applicable to the Executive Board and Supervisory Board is included in the Corporate Governance statement, which is referred to in chapter 14, section 14.2 ‘Corporate Governance’ of this annual report.
CommitteesThe Supervisory Board has appointed two committees: the Audit and Risk committee, and the Remuneration and Appointments committee. The Board has drawn up Regulations for each committee, establishing the role of the committee in question, their composition and how
they carries out their tasks. These regulations are only available in Dutch on the Dutch Heijmans website in the section ‘Corporate Governance: Codes, statuten en reglementen’.
Audit and Risk committeeThe Audit committee comprises three members of the Supervisory Board and its tasks cover a number of financial areas, and well as risk management. The discussions of items in the Audit and Risk committee serve as preparation for the discussion of these items by the full Supervisory Board. These subjects include the interim report, the financial statements, the budget, the reports of the external auditor, other financial reporting, the functioning of internal risk and control systems, the relationship with and the evaluation of the external auditor, the pension plans and the development of the financing requirements and debt position, as well as the relationship with the company’s financiers.The Audit and Risk committee also discussed the valuation of land holdings, the functioning of the SAP ERP system, the company’s tax position and the issue list. In addition, the committee discussed integrity and compliance, Risk & Audit Management and the reports provided by the Risk & Audit Manager, cybersecurity and privacy/implementation of the GDPR.
Until 15 April 2020, the members of the Audit and Risk committee were Mr. R. Icke (Chair), Mr. R. van Gelder, and Mr. M.M. Jonk. From that date, the members were Mr. R. Icke (Chair), G.A. Witzel and Mrs. M.M. Jonk. The committee met with the Executive Board on four occasions in 2020. The external auditor also attended a number of meetings. The committee also consulted the auditor in the absence of the Executive Board.
When relevant, managers with responsibility for finance, auditing, risks and compliance attended the meetings of the Audit and Risk committee, together with the CEO and the CFO. Relevant items requiring approval from the full Supervisory Board were submitted to the full Board together with a recommendation from the Audit and Risk committee.
Remuneration and Appointment committee Until 15 April 2020, the Remuneration committee consisted of Mrs. P.G. Boumeester, Mrs. M.M. Jonk and Mr. R. van Gelder (Chair). As from 15 April 2020, this commit-tee, which merged with the Selection and Appointment committee as of the same date to form the Remuneration and Appointment committee, consists of Mrs. M.M. Jonk (Chair), and Mrs. J.W.M. Knape-Vosmer. In preparation for the Supervisory Board, the committee focuses on the

118 Heijmans Annual Report 2020
CORPORATE GOVERNANCE
remuneration of the members of the Executive Board and draws up the selection criteria and appointment proce-dure for members of the Supervisory Board and the Executive Board. At least once a year, the committee also assesses the performance of the members of the Executive Board and draws up a succession planning for the Executive Board. In this context, the committee conducts individual performance interviews with the members of the Executive Board at least once a year.
RemunerationThe committee held six meetings in the year under review, nearly all of which were held virtually due to Covid-19. The members also consulted with each other regularly in the course of the year. The discussions on the remuneration of the Executive Board members are based on the remuneration policy adopted by the General Meeting of Shareholders on 15 April 2020. In view of the recent adoption of the policy, the committee recommended that this would not be reviewed in the run-up to 2021.
In its meetings, the committee discussed the remunera-tion of the Executive Board members. The remuneration for 2020 was in line with the aforementioned remunera-tion policy, for which we refer to the 2020 remuneration report in appendix 16.6 ‘Remuneration policy’ of this annual report.
The committee also discussed and advised the Supervisory Board on subjects including the targets set in the context of the variable remuneration, the variable remuneration itself, the Bonus Investment Share Matching Plan and the fixed remuneration of the Executive Board members in 2021.
The committee also drew up the 2020 Remuneration report and discussed same with the Executive Board and the Supervisory Board.
Reappointments The term of Mr J.G. Janssen, CFO and member of the Executive Board as of October 2017, expires in October 2021. In order to have a next appointment term run parallel with the regular General Meeting in April 2021, the Committee entered into discussions with him after the summer of 2020 about a new term as of April 2021. Based on the outcome of that discussion, the Supervisory Board decided to proceed with reappointment after the General Meeting on 14 April 2021. However, in early 2021, Mr Janssen indicated that he would be leaving Heijmans as of 15 April 2021. The Supervisory Board therefore initiated the procedure to fill the vacancy for CFO/
Member of the Executive Board that had arisen as a result. In April 2020, Mr R. Icke, Supervisory Board member and Chairman of the Audit and Risk committee, was reap-pointed for a term of two years. In the summer of 2020, the Supervisory Board decided to start timely recruitment for the vacancy that would arise after Mr. Icke stands down, so it would be able to submit a nomination for a new Supervisory Board member with the finance profile at the General Meeting of Shareholders in April 2021. The committee set to work on this assignment and has drawn up a recruitment profile.
After a careful procedure, the Supervisory Board made its choice in January 2021 and, subject to the support of the Works Council, decided to nominate Mr. A.E. Traas for appointment to the Supervisory Board for a four-year term at the General Meeting of Shareholders on 14 April 2021. The Supervisory Board is of the opinion that based on his extensive knowledge and experience, Mr Traas fits the desired profile exceptionally well. An appointment as of April 2021 would allow for an ample induction period and give Mr. Icke the opportunity to hand over his work effectively.
Composition of Supervisory Board The Supervisory Board currently has five members. In accordance with the retirement schedule, Mr. R. van Gelder, Mr. R. Icke and Mrs. P.G. Boumeester were due to retire in 2020. Mr. R. Icke was reappointed for a fourth term, of two years, at the General Meeting of Shareholders of 14 April 2020. In the spring, the Supervisory Board provided its reasons the nomination for reappointment, which is in deviation from the Code, with reference to safeguarding the continuity in the Supervisory Board and the desire to arrive at a more balanced retirement schedule. Mrs. J.W.M. Knape-Vosmer and Mr. G.A. Witzel were also nominated for appointment during said General Meeting of Shareholders, both for a four-year term, to fill the profiles of Human Capital and Building/Infra respectively. The Heijmans Works Council supported all nominations and the General Meeting appointed all three nominated Supervisory Board members.
You will find the current composition of the Supervisory Board, together with the particulars of the members and principal and other positions they hold in chapter 3, Management, of this annual report. All Supervisory Board members qualify as independent, as meant in Article 2.1.8 of the Dutch Corporate Governance Code.
119Heijmans Annual Report 2020
CORPORATE GOVERNANCE
In conclusion Despite the Covid-19 outbreak, Heijmans succeeded in continuing to work on its strategic objectives and has further strengthened the foundations of the company. Both the Supervisory Board and the Executive Board continued to focus fully on the strategic objectives and on a strict selection policy, optimal cost structure, safety and strengthening of capital ratios, in short on improving the results in a broad sense. In addition to Covid-19, the company is still facing the nitrogen emissions problem for which no structural solutions have been found. This will continue to make undiminished demands on the Company’s flexibility and its innovative potential. The basis for structural success lies in a solid organisational structure and competent employees. This is why the Supervisory Board and the Executive Board in 2020 once again considered at length the further development of the HR policy aimed at developing human capital in all its facets.
Both the Supervisory Board and the Executive Board are aware that the continued drive to make Heijmans stronger and more sustainable requires a huge effort and commitment from all employees within Heijmans. In the past year, the Covid-19 outbreak made a huge demand on the resilience and agility of all employees. Some employees continued to work on our building sites under difficult circumstances, while other employees were forced to work from home, with all the associated problems of combining work, family and home schooling. And as long as the Covid-19 outbreak continues, the pressure on all employees will remain high. The Supervisory Board therefore has a great deal of respect not only for the way in which the company pulled itself through 2020, but certainly for all employees.The Supervisory Board wishes to express its gratitude to the Works Council, all employees and the Heijmans Executive Board for their significant contributions in the year under review.
Rosmalen, 19 February 2021
Sjoerd S. Vollebregt, Chair Ron Icke RA, Vice Chair Mrs. Martika M. JonkMrs. Ans J.W.M. Knape-Vosmer Gerrit A. Witzel

120 Heijmans Annual Report 2020
CORPORATE GOVERNANCE
The Amsterdam Court House under construction

121Heijmans Annual Report 2020
CORPORATE GOVERNANCE

122 Heijmans Annual Report 2020
CORPORATE GOVERNANCE
14.2 Corporate governance
Generally speaking, corporate governance is about sound management of a company, the supervision of that management and how the execution of the strategy is reported to all the company’s stakeholders. These stakeholders include shareholders, employees, clients and society in general. Factors that play a role in this include the strategy and the achievement of the company’s business objectives, the corporate culture and how the company meets its reporting and transparency obligations.
Open corporate culture A disciplined and unified corporate culture is a prerequi-site for the success of our strategy ‘Better, Smarter, Sustainable’. Continuous improvement remains of vital importance to Heijmans to maintain a sound basis, and by continuing to improve, we continue to build on the principles of the previous strategic programme ‘Focus, Discipline and Excellence’. We recognise the importance of good corporate governance and a code of conduct for the achievement of our business objectives and the realisa-tion of the related corporate culture. To this end, we continue to focus on communicating the core values that are vital to the realisation of this strategy. These core values are ownership, result-orientation and collabora-tion. A more detailed explanation of our corporate culture programmes is available in the section ‘Non-financial results’.
Heijmans strives to maintain the highest possible standards, which means that we respect and comply with legislation, and observe and initiate guidelines that apply either to the company specifically or to the industry in general. Additionally, this means that we also strive to achieve the highest possible levels of integrity and transparency in our actions and any decision-making that affects our stakeholders. We also strive to conduct a continuous dialogue with stakeholders and to distribute information simultaneously and accessibly.
For more detailed information on how governance and supervision are organised at Heijmans, see the Corporate Governance Statement (as meant in Sections 2(a) in conjunction with sections 3 through 3(b) of the Decree Adopting Further Provisions Regarding the Content of Annual Reports (Vaststellingsbesluit nadere voorschriften inhoud jaarverslag) and including the information required under the Decree implementing Article 10 of the Dutch Takeover Directive). This statement is available (in Dutch) on the Heijmans website in the ‘Corporate Governance: Codes, statuten en reglementen’ section.
Organisation of the corporate governanceThe basic premises for Heijmans’ corporate governance structure are: good business conduct, integrity, reliability, client focus, openness and transparent dealings by the management, as well as the proper supervision of same. After all, we attach a great deal of importance to achieving an equitable balance between the interests of our various stakeholders. Heijmans endorses the principle of the Dutch Corporate Governance Code to the effect that the Company is a long-term alliance of the various stakehold-ers of the company.
SharesDepositary receipts for Heijmans shares are issued through the Heijmans Share Administration Trust, or SA Trust (Stichting Administratiekantoor Heijmans). The purpose of this vehicle is to prevent resolutions being adopted by a shareholders meeting through a random majority. The depositary receipts for shares are freely exchangeable for ordinary shares.
Employee representationEmployees are represented at Heijmans via the Works Council. Heijmans has a single Works Council at the level of Heijmans Nederland B.V. There are also a number of committees, each with its own focus area, such as finance, social policy and communications, comprising both members and non-members of the Works Council. In 2020, the Works Council held 11 works council meetings, six of which were consultative meetings. The latter are meetings at which the chairman of the Executive Board is present. One of the consultative meetings was attended by two members of the Supervisory Board. In the course of 2020, the Works Council dealt with eight requests for approval and 13 requests for advice.
The Dutch Corporate Governance Code: Compliance and deviations from the codeThe current Dutch Corporate Governance Code was published in the Government Gazette on 8 December 2016. This Code is embedded in Dutch law by virtue of Section 2:391(5) of the Dutch Civil Code in conjunction with Section 2 of the Decree on the Content of Management Reports.
Heijmans endorses the underlying principles of the Dutch Corporate Governance Code and has incorporated these principles as such in the company’s corporate governance structure. To this end, we have also amended the regulations of the Executive Board, of the Supervisory Board and of the committees of the Supervisory Board.

123Heijmans Annual Report 2020
CORPORATE GOVERNANCE
In the year under review, we deviated from the recommen-dations of the Code with respect to two best practices: 4.4.3 en 2.2.2.
• Deviation from best practice 4.4.3 Best practice 4.4.3 stipulates that a director may be appointed to the board of the SA Trust for two four-year terms, after which they may be appointed for two terms of two years each. The report of the board of the SA Trust provides grounds for any reappointments after a term of eight years. The Articles of Association of the SA Trust in effect until 9 July 2018 included a provision that stated that members of the SA Trust board were appointed for a maximum term of four years, and could be re-appoint-ed twice for a further term of four years, therefore taking the total to 12 years. It also provided the option of deviating from this maximum in exceptional circumstances. In accordance with said Articles of Association, in March 2017, Mr. W.M. van den Goorbergh was appointed for a period of four years for the fourth time. This decision took into account the importance of continuity within the board, partly in relation to the phase Heijmans is in and in combination with the terms of the other board members. The Articles of Association of the SA Trust have since been amended and brought into line with the Code.
• Deviation from best practice 2.2.2 This provision relates to the number of terms of appointment for supervisory directors. A supervisory director is appointed for a period of four years and can then be reappointed once for a period of four years. The supervisory director may thereafter be reappointed for a term of two years, which term may be extended for a maximum of two years. In deviation from this provision and following nomina-tion by the Supervisory Board, the General Meeting of Shareholders on 15 April 2020 reappointed Mr. R. Icke, member of the Supervisory Board of Heijmans since April 2008, for a term of two years. The Supervisory Board decided to nominate him in view of the desire to ensure continuity in the Supervisory Board and to create a more balanced retirement schedule. In view of the fact that in April 2020, two supervisory directors stepped down and a third was appointed relatively recently, the Supervisory Board is of the opinion that a new term of two years for Mr. Icke is in line with the pursuit of both continuity and the arrangement of a more balanced retirement schedule. In connection with the scheduled retirement of Mr. Icke in April 2022, the
Supervisory Board decided to temporarily expand the Board to six members. Mr A.E. Tras will be nominated for appointment as a supervisory director at the General Meeting of shareholders to be held on 14 April 2021.
Corporate Governance Statement The Corporate Governance Statement as referred to in section 2(a) in conjunction with sections 3 through 3(b) of the Decree Adopting Further Provisions Regarding the Content of Annual Reports (Vaststellingsbesluit nadere voorschriften inhoud jaarverslag) and including the information required under the Decree implementing Article 10 of the Dutch Takeover Directive (Overname richtlijn) is available in Dutch on the Dutch Heijmans website in the section ‘Corporate Governance: Codes, statuten en reglementen’. This statement should be considered inserted and repeated here.
Special aspects
Dividend policy The holders of ordinary shares or depositary receipts for ordinary shares are entitled to the pay-out of a dividend. Heijmans N.V.’s dividend policy includes a pay-out ratio, barring exceptional circumstances, of approximately 40% of the profit from ordinary business operations after tax. The remaining 60% is added to the reserves in accordance with Article 31 (5) of Heijmans N.V.’s Articles of Association.
Heijmans Preference Share Trust The Heijmans Preference Share Trust has been given a call option, which gives the Trust the right to obtain preference shares in the capital of Heijmans N.V. The purpose of the Trust is to protect the interests of the company and all its stakeholders. The Trust also aims to limit any impact that may impede the independence and/or continuity and/or identity and/or strategy of the company. The purpose of issuing protective preference shares is to provide the company with the opportunity and the time to effect the protection of the above-men-tioned interests in the event that the company finds itself in a potentially undesirable situation.
Powers of the shareholders meeting and the rights of the shareholders According to principle 4.1 of the Code, good corporate governance assumes full participation by shareholders in the decision-making at the General Meeting. The Supervisory Board and the Executive Board also consider this important. The notice of convocation, agenda and

124 Heijmans Annual Report 2020
CORPORATE GOVERNANCE
documentation to be dealt with at a shareholder meeting are all published on the company’s website at least 42 days in advance of the meeting. As far as possible, the Company gives shareholders the opportunity to vote remotely and to communicate with all other sharehold-ers. Holders of (depositary receipts for) shares who cannot attend a shareholders’ meeting can issue a proxy and voting instructions to a third party designated by the Company, which third party will vote in accordance with their voting instructions.
According to the Heijmans Articles of Association, any resolutions by the Executive Board that involve a significant change to the identity or character of the Company or its business are subject to approval by a shareholders meeting. The shareholders meeting also has a number of other significant powers, including the adoption of the financial statements, the appropriation of the result, the discharge of the members of the Executive Board and the Supervisory Board, the adoption of the remuneration policy for the Executive Board and the remuneration of the members of the Supervisory Board, resolutions to amend the Articles of Association or to dissolve the Company, the appointment of the external auditor and the designation of the Executive Board as the body authorised to acquire (buy) and issue shares.
Limitation on the transfer of shares There is no limitation in the Articles of Association or contractually on the transfer of shares or depositary receipts for shares issued with the cooperation of the Company, except for the block on transfer and delivery of financing preference shares B laid down in the Articles of Association. Article 11 of the Company’s Articles of Association stipulates that the Company’s Executive Board must approve any transfer of financing preference shares B.
Substantial shareholdings in HeijmansHolders of shares and depositary receipts for shares that, as far as the Company is aware, held an interest of more than 3% in Heijmans as at 31 December 2020, according to the Register of Substantial Shareholdings of the Dutch Financial Markets Authority (AFM), are listed in the section entitled ‘The Heijmans Share’.
Protective measures (special controlling rights; limitation of voting rights)• The shares into which the authorised share capital of
the Company is divided do not endow the holders with any special controlling rights.
• The Company does not have any employee participa-tion plan or employee share option plan.
• There are no limitations of voting rights attached to ordinary shares or the depositary receipts for ordinary shares.
• The number of votes conferred by a financing preference share B with a face value of €0.21 is contractually restricted to 1,186 votes.
• The Company’s Articles of Association include the usual provisions related to registration as a recognised party entitled to attend and to vote at a shareholders meeting.
• Article 6 of the Company’s Articles of Association states that the Executive Board, with the Supervisory Board’s approval, is designated by the General Meeting of Shareholders as the body authorised to issue shares or depositary receipts for shares. The scope and duration of this power is determined by the General Meeting of Shareholders.
Agreements with shareholders that may limit the transfer of (depositary receipts for) shares or limit voting rightsThe Company is not aware of any agreement involving a shareholder that may result in• limitation of the transfer of ordinary shares;• limitation of the issuance of (depositary receipts for)
ordinary shares with the cooperation of the Company; or
• the limitation of voting rights.
Amendment of the articles of Association A resolution to amend the Articles of Association can only be passed by a majority of at least two-thirds of the votes cast at a General Meeting of Shareholders at which at least half the issued capital is represented, unless the motion for such a resolution comes from the Executive Board, acting with the approval of the Supervisory Board. If a motion for a resolution stems from the Executive Board acting with the approval of the Supervisory Board, the resolution can then be passed by a simple majority of the votes, regardless of the capital represented.

125Heijmans Annual Report 2020
CORPORATE GOVERNANCE
Authorisation of the Executive Board with respect to the issuance of shares and the acquisition of sharesIn accordance with the Articles of Association, on 15 April 2020, the General Meeting of Shareholders designated the Executive Board, with the approval of the Supervisory Board and for a period of 18 months commencing on 15 April 2020, as the body authorised to:• issue shares and/or grant rights to acquire shares. The
mandate to issue ordinary shares is limited to 10% of the issued share capital on 15 April 2020, plus an additional 10% if the issue takes place as part of a merger or takeover, or in the context of forging a strategic alliance;
• to limit or exclude the pre-emptive right to ordinary shares in the event that these shares are issued making use of the above-mentioned right to acquire shares.
Furthermore, the General Meeting of Shareholders of 15 April 2020 gave the Executive Board the authority - for a period of 18 months commencing on 15 April 2020 and subject to the approval of the Supervisory Board – to decide that the Company will acquire ordinary and financing preference shares B in its own capital, by purchasing same in the market or by other means. This authorisation is limited to 10% of the issued share capital and the company may only purchase the treasury shares at a price between their face value and 110% of the average closing prices over the last five trading days prior to the date the ordinary shares are purchased, and between the face value and 110% of the issue price for financing preference shares B.
Consequences of a public bid for important contracts The agreement with the banking consortium includes a change-of-control clause with respect to the facility of € 121 million (at year-end 2020). This clause states that the consortium must be informed of any change of control, and must then be given the option to demand early repayment. Change-of-control clauses may also appear in joint venture agreements to which subsidiaries are party.
Payment to members of the Executive Board upon termination of their employment following a public bid The agreements with the members of the Executive Board provide for a payment upon termination of the employ-ment contract and/or management agreement following a public bid as meant in section 5:70 of the Dutch Financial Supervision Act.
14.3 Conduct and integrity
Culture and structureHeijmans attaches a great deal of importance to integrity. Openness is a key condition for this. We encourage an open working attitude by having the Executive Board and senior management set an example. We also discuss integrity issues in the Executive Board meetings and group board meetings and hold review meetings with project directors. This is how we try to embed our open culture in the organisation as much as possible. We have also introduced a structure for the reporting of issues related to conduct and integrity. If necessary, the reported issue will be investigated and action can be taken.
At the end of 2016, Heijmans formulated new core values, which are being disseminated right across the organisa-tion and which fleshed out Heijmans’ strategic pro-gramme at the time: ‘Focus, discipline and excellence’. These values are ownership, result-orientation and collaboration. Heijmans implemented this programme in the course of 2017 under the header ‘IK!’. These core values remain fully in force within the parameters of Heijmans’ new strategy.
Compliance officerHeijmans has appointed a compliance officer who acts as the central contact and reporting point for integrity issues. The system safeguards the anonymity of any reports, and the compliance officer reviews the action necessary in each individual case, taking into account the applicable rules. In many cases, issues are resolved on the shop floor, for instance in consultation between the employee and their supervisor.
Integrity Committee The task of the Integrity Committee is to advise the Executive Board on integrity-related matters. The Integrity Committee discusses integrity-related issues, dilemmas and themes and all related matters. On the basis of these discussions, the committee then issues policy recommen-dations, such as the need to initiate training courses. The Executive Board establishes the policy and decides which actions are to be taken in this context. The committee is chaired by the CEO. The other core members of the Committee are the Compliance Officer, the Procurement Director, the HRM Director, the Chair of the Works Council and a representative from Property Development responsible for integrity-related matters. The committee discussed a range of subjects on various occasions in the year under review, such as how to keep the subject of integrity permanently top of mind for all employees and if and how it might be possible to improve the reporting

126 Heijmans Annual Report 2020
CORPORATE GOVERNANCE
structure at Heijmans. Heijmans attaches great impor-tance to its employees operating with integrity and to a culture in which employee feel safe to report abuses. The campaign announced in 2019 to bring integrity to the attention of employees by means of physical dialogue sessions in which colleagues enter into a dialogue with each other has been moved to mid-2021 due to Covid-19. The campaign will be adapted to what is possible under the then prevailing Covid-19 measures.
Heijmans Code of Conduct The Heijmans Code of Conduct was revised at the end of 2020 and complemented with subjects that are demand-ing greater attention today. We sent the send the Code of Conduct to all employees in February 2021, with a message in which the Executive Board stressed the importance of attitude and conduct, as well as the importance of a safe working and reporting environment. The Code of Conduct will form the basis of the dialogue sessions to be held in mid-2021.
Dilemmas and conduct Heijmans is convinced that how we behave has a significant impact on the quality of the company’s work and financial performance. One example is the impact of conduct in the field of safety, which can make a real difference in the construction industry.
Heijmans continues to face integrity and conduct issues. Not everyone has the same opinion of what is and is not acceptable. A considerable proportion of the reported issues are related to the following dilemmas:
Should you call someone to account or not Calling each other to account in the event of unaccept-able behaviour, in line with the standards we strive to maintain, actively encourages more openness and, in the end, more acceptable conduct. Calling each other to account is a form of ownership and taking responsibility. Examples include the wearing of safety clothing, the separation of waste at building sites, or the deliberate submission of incorrect expense sheets, the use of company property for personal purposes and unaccept-able behaviour towards third parties. To make it easier for employees to call each other to account in cases of unacceptable behaviour, we organise dilemma discussion groups, provide toolboxes and regularly put the subject of integrity and conduct on the agenda of works consulta-tions. Employees can use these consultations to discuss issues or certain conduct openly and freely.
Acceptable versus unacceptable behaviour It is sometimes difficult to define the fine line between acceptable and unacceptable behaviour, but it is crucial for the culture on the shop floor. Heijmans considers a safe working environment - where everyone is treated with respect – a prerequisite on this front. We do not accept unacceptable behaviour. We take appropriate measures whenever necessary.
Self-determined rules versus applicable rules Not everyone complies with the rules laid down in our code of conduct. This could apply to the likes of submit-ting expense sheets, payments or the use of company equipment. It can be difficult for (new) employees to go against the flow and to remind colleagues of the actual rules.
Compliance In 2020, 13 integrity issues were reported to the compli-ance officer and/or confidential counsellors, slightly fewer than in the previous year. The anonymous tip line was not used. Heijmans encourages its employees to report suspected or actual abuses and has several options available for them to do so. The Compliance Officer also takes an active approach on this front. The Compliance Officer regularly sends out requests to management and HRM for reports. The Executive Board believes it is important that employees feel free to file reports and know that their reports will be taken seriously. In 2021, we will appoint more confidential counsellors, distributed across the company both in terms of geography and the various layers, to give employees more choice.
The reports in 2020 included not following internal procedures and unacceptable and/or unprofessional conduct on the part of employees in various positions.The first consideration in each case was the seriousness of the incident, and this was then followed by an investiga-tion into the facts in all cases. The reports led to written (final) warnings, or dismissal in a few cases. All reports were also discussed at Executive Board meetings and subsequently evaluated by management with those involved.

127Heijmans Annual Report 2020
CORPORATE GOVERNANCE
Integrity and conduct The integrity and conduct Heijmans expects from its employees are laid down in a number of regulations and guidelines:
• Dossier statement: this statement is drawn up for each tender issued. In this statement, the responsible manager explicitly declares that there was no anti-competitive conduct in the preparation of the tender. From early 2021, the statement will no longer be drawn up as a separate document but a statement to the same effect will be included on the so-called final sheet. This is the calculation of the tender price that is signed off by the management and the board.
• Integrity-sensitive positions: Heijmans has a ‘Procedure for integrity-sensitive positions’. Integrity-sensitive positions include members of the Executive Board, members of the group board, members of the senior management and a number of specifically defined positions. Screening is mandatory for these functions. Employees in integrity-sensitive positions and applicants applying for such positions are asked to provide a Personal Statement of Judicial Records and are also asked to submit a Certificate of Good Conduct.
• Reviews: the Executive Board discusses integrity issues and shares these, anonymously, with the manage-ment teams. In consultation with the Integrity Committee, the Executive Board makes sure that reports and issues are translated into appropriate policies.
• Heijmans Code of Conduct: the Heijmans Code of Conduct provides tools and directions for positive cooperation with each other and about compliance with laws and (internal) rules. The Code deals with matters such as dealing with each other respectfully, safety, integrity, honesty and following rules. The Code applies to everyone who works for or via Heijmans. The Code of Conduct is linked to a sanctions policy. Managers are asked to set an example through their personal conduct. The Code of Conduct is an integral part of the employment contract with permanent and temporary personnel, and also applies to any self-employed contractors with whom Heijmans works.
• Integrity is a fixed item in job interviews and onboard-ing programmes.
• To encourage integrity in its project development activities, Heijmans Property Development set up a Transaction Register in 2009 in accordance with the NEPROM Code of Conduct, in addition to its quality management system and the Heijmans Code of Conduct. The Transaction Register is used to
investigate, record and document the relevant details of every business-to-business property transaction in advance, making it possible to check transactions for correctness, integrity and lawfulness after the fact. This is also endorsed and incorporated in Heijmans' procurement policy.
• Procurement: New suppliers are asked to sign a sustainability statement, which includes rules with respect to improving social aspects, working condi-tions, health & safety and the environment.
Fighting corruption and bribery The trust our clients and partners, as well as our share-holders and employees, have in the company is crucial to our licence to operate. That trust will be damaged if Heijmans or its employees are found guilty of corruption and/or bribery. Fighting corruption and bribery is therefore an integral part of Heijmans’ general compli-ance programme. Heijmans’ code of conduct applies to the employment contract of every employee. It states that Heijmans expects employees to avoid all actual or apparent conflicts of interest between personal and business interests. Employees are not allowed to accept or offer any gifts or invitations that call into question their independence. Offering such gifts could also endanger the independence of either Heijmans or the purported recipient of said gifts or invitations. Heijmans and its employees must strictly abide by all legal rules and generally accepted norms applicable to business operations and that are expressed in Heijmans’ own guidelines, such as the Transaction register used within Heijmans Property Development. We impose the application of our code of conduct or an equivalent code on the subcontractors and partners with whom we do business.
If an employee can, by the nature of his or her position, find themselves in a situation where they may encounter corruption or bribery, the company will devote specific attention to this situation, forinstance by organising special training. This applies to Procurement in particular. Heijmans has taken measures at this department to minimise the risk of bribery and corruption. For instance, the department is centrally organised, which increases the level of direct supervision. Preferred suppliers are also chosen and evaluated centrally and very carefully. Procurement has a clearly defined segregation of tasks and procedures that are subject to the ‘four eyes principle’. The department uses standard contracts that are exchanged digitally. In early 2018, Heijmans introduced a transparent evaluation system for suppliers. This ensures that suppliers who fail to comply with Heijmans’ standards are excluded from

128 Heijmans Annual Report 2020
CORPORATE GOVERNANCE
our list of preferred suppliers. This approach has proven highly successful. The indicators related to this theme are ‘Procurement spend with preferred suppliers’ and ‘Procurement spend with preferred suppliers with framework contract with signed sustainability statement’, as included in the KPI table in the appendices.
Compliance We have appointed a number of confidential counsellors for the business areas and at holding company level. These confidential counsellors can give advice on dilemmas encountered by employees in the course of their daily activities. Heijmans requires its suppliers and subcontractors to endorse the Heijmans Code of Conduct, the Bouwend Nederland (Dutch construction industry employers’ group) and NEPROM codes of conduct or their own (industry) code. Heijmans' subsidiaries are included in the register of the Foundation for Evaluating the Integrity of the Building industry (SBIB). Every two years, we file a report with the SBIB on any breaches of the Heijmans Code of Conduct, together with an account of how Heijmans dealt with said breaches.
Additional and separate regulations In some cases, values from the Code of Conduct have been laid down in additional and separate regulations:
• Internal reporting procedure For those situations in which it is difficult to find a solution within the scope of daily workplace activities, some time ago Heijmans introduced an internal reporting procedure, which defines the steps to be taken when submitting a report of an abuse. It also describes how such reports are investigated, and defines the role of management in this procedure. This internal reporting procedure offers employees the opportunity to report an abuse orally or in writing to the compliance officer or a confidential counsellor, without endangering their legal position under employment law. Employees can also report abuses anonymously via the SpeakUp system.
• Heijmans N.V. Insider Trading Regulations These regulations contain provisions that apply to the officers named by law and to other Heijmans employees. The regulations were amended following the implementation of the EU Market Abuse Regulation in mid-2016.
• Private investments regulations Heijmans has a set of regulations that apply to personal investments by members of the Executive Board and the Supervisory Board. The Chairman of
the Executive Board is the compliance officer for transactions in shares, depositary receipts for shares and options on shares. The Chairman of the Supervisory Board acts as the compliance officer for the Chairman of the Executive Board.
Dutch Human Environment & Transport InspectorateIn early 2014, Heijmans was the first contractor to sign a declaration of intent with the Dutch Human Environment & Transport Inspectorate (IL&T) as a preliminary to a compliance covenant related to the enforcement of the (extremely extensive) set of regulations that fall within the remit of the Inspectorate. The IL&T supervises enforce-ment of the regulations in several domains, including soil, transport and hazardous substances. In mid-2019, the IL&T notified Heijmans it intended to terminate the compliance covenant with Heijmans as per 31 December 2021, as a result of amended policies on the basis of which the IT&L’s inspection capacity will be used in higher-risk areas. In anticipation of this, Heijmans has taken measures to safeguard the positive effects the covenant has had in the internal organisation.
14.4 Risk management
In 2020, Heijmans profitability and cash generation continued to improve and the balance sheet is robust. Heijmans did not use its credit facility at all in the year under review. In view of the uncertainty created by the Covid-19 outbreak, Heijmans decided to extend the existing credit facility on the same terms by one year until mid-2023.
The Covid-19 crisis has shown that Heijmans is highly agile and can respond effectively to changing circum-stances. We have proven able to mitigate the effects of this crisis. At the same time, we remain alert. The economic consequences of the Covid-19 crisis may still appear, and we take this into account in our market positioning. We have, for example, intensified our cooperation with housing corporations and are putting more focus on seizing the opportunities arising from the energy transition. In other parts of our business, too, we are placing more emphasis on markets that will be less affected by a possible economic crisis.The role of the Chief Risk Officer (CRO) and his Risk Office remains very important. Should the market deteriorate in the future, the pressure on the order book may increase. We are very watchful to ensure we avoid increasing our risk appetite in tenders, and in doing so, create problems for the future.

129Heijmans Annual Report 2020
CORPORATE GOVERNANCE
This section of the annual report describes the risk profile and risk management of the company, the associated risk factors, the actions taken to mitigate these risks and the risk management priorities for 2021.
Heijmans’ main risks are:• Strategic risks
– economic downturn – macro-economic and political risks such as the
Nitrogen emission problem and Covid-19
• Market risks – availability of labour, services and materials – price risk (in particular procurement risk) – availability and potential for development of land – affordability of homes
• Operational risks, the most relevant to Heijmans being:
– control of project risks in acquisition and execution – control of corporate risks, such as continuity in the
order book, personnel and exploitation contracts – safety – retention and recruitment of personnel
• Financial risks, the most relevant to Heijmans being: – insufficient liquidity – capital ratios that hinder the execution of the
strategy – insufficient capacity bank guarantees – inadequate financial health of partners
• Legal and compliance risks: – new forms of cooperation and contracts – increasing importance of other (legal) aspects such
as cyber security and GDPR – disputes and legal proceedings
This risk section also describes the main items of attention in the management letter from the external auditor. Before exploring the specific risks and mitigating measures, we will first describe the company’s risk profile and general risk management measures.
Risk profile and risk appetite Heijmans is active in construction and infrastructure projects, including management, maintenance and/or services, and additionally in property development and in integrated area developments. Through digitalisation, we create data-driven services, and software is therefore part of our products and services. Clients set specific require-ments for cyber security in buildings.
The distinction between construction and infrastructure, property development and projects for area development, and the increasing level of digitalisation has an impact on the risk profile.
Risk appetite In the assessment of the risk appetite, we have categorised the project risks. This includes the annual revenue of a project in relation to the company revenue, the contract form, the client, the competence 'fit' and the risk profile of the chosen solution. Based on the above, each project is assigned a risk category (1 through 3). This classification is based on the principle that the higher the risk profile, the higher the authorisation in the organisation, the higher the return requirements and the more frequent the project monitoring.
In addition, Heijmans aims for a good balance in the revenue mix within all business areas. At Infra, where the ratio of large projects on the one hand and regional projects, specialist activities and asset management on the other is developing in favour of the second category. At Building & Technology, we are aiming for a balanced ratio of non-residential projects, residential building, non-residential multi-functional high-rise residential construction and services. In Property Development, we focus on the ratio between development from own positions, tenders/price competitions and direct awards. Our preference is for development from our own position and direct awards, and we use tenders to supplement the portfolio if necessary. We also see new revenue models emerging, such as data-driven services.
Finished products The risk profile of finished products such as asphalt is primarily determined by the scale of the necessary production capacity. To ensure capacity can be adapted even more effectively to demand, Heijmans and BAM have combined their existing asphalt plants in the Netherlands in a new, joint asphalt company. Heijmans and BAM set up the AsfaltNu joint venture to pool their knowledge, expertise and investments in the field of asphalt production. This will help to make the asphalt chain more sustainable and improve efficiency. AsfaltNu, which became operational on 31 December 2020, will not only work for Heijmans and BAM, but will also serve third parties in the asphalt market. Further sustainability of the asphalt chain is an important objective, from reducing CO2 emissions to circularity and reuse of raw materials and sub-products. In addition, joining forces offers us opportunities to optimise our business operations in the field of asphalt.

130 Heijmans Annual Report 2020
CORPORATE GOVERNANCE
Data-driven services, software development and technolo-gy in our products and services
We use digitalisation to create data-driven services and increasingly use software development and technology as part of our products and services. In addition, a growing number of principals include explicit Cybersecurity requirements in projects. This has an impact on our risk profile. These risks include aspects such as:
• Disputes relating to intellectual property ownership of software and algorithms.
• Quality and liability of digital products and services: – Functional operation, maintainability and digital
security. – Safety impact if the technology has a direct impact
on the physical world. • Fines and liability in the area of GDPR, if the data
includes personal information.• Certifications: missing out on contracts due to a lack of
the correct certifications, such as ISO 27001. • Operational impact on our business operations as a
result of cyber incidents, such as ransomware attacks;• Missing out on revenue and possible claims as a result
of unclear ownership of data and rights of third parties (database rights).
Heijmans has a vision in which cyber security is integrat-ed in our business operations, products, projects and project results. Heijmans wants to achieve this by seeking cooperation in the chain, both internally and externally, and by focusing on the responsibility of each party in that chain, or those chains. On the one hand, Heijmans chooses measures that have added value and, on the other hand, we weigh risks on the basis of transparency and ownership of data and systems. Heijmans is solution-oriented on this front and seeks a balance between investments in technical solutions and employ-ee awareness and knowledge. We have translated this into a multi-year Cybersecurity roadmap, ‘Secure@Heijmans’, which we review annually.
Construction and infra projects Target margin: EBITDA of 4-6%. Moderate risk profile focused on a profitable business model and low invested capital. This margin is higher than the 3-4% we quoted in previous years. This is due in part to the implementation of IFRS 16, but also because Heijmans has become more predictable and reduced the number of loss-making projects. The construction and infrastructure projects, including services, are based on contracts that Heijmans executes, with a large part of the work to be executed outsourced to third parties. These activities are marked by relatively low operating profit margins. Heijmans targets operating profit margins of 4-6% for these activities. The business model for these types of activity is profitable when projects involve – on average - negative working capital, which effectively results in little or no investment of capital. Infra activities generally involve slightly less negative working capital than construction or installation projects, partly due to the greater use of the company’s own equipment. This makes it essential to devote a great deal of attention to the management of risks. After all, if these do indeed materialise, these risks can quickly result in unprofitable activities when working with low operat-ing profit margins. The flip side to avoiding these risks is that Heijmans may sometimes have to deliberately turn down potential opportunities. To achieve a profitable business model, Heijmans therefore strives for a moderate risk profile on this front.
Property development Target margin: EBITDA of 6-8%. Moderate risk profile focused on stimulating the turnover rate of capital.
The property development activities require a higher level of invested capital, which in turn requireshigher returns. The capital employed depends to a great extent on the terms at which Heijmans can acquire and sell development positions. Strategic development positions can have a long investment horizon, while exercising development rights acquired may have a short investment horizon. In these markets, Heijmans aims to achieve an operating profit margin of 6-8%. The time factor is an important component of the risk profile for these activities. For instance, capital is frequently utilised for longer periods of time to generate higher returns. Heijmans invests only in new real estate and land holdings if these can be developed within the next five years. Heijmans has shifted the focus in this context from land ownership to development rights.
131Heijmans Annual Report 2020
CORPORATE GOVERNANCE
General risk management measures The premise of Heijmans' approach to risk management is the structural, integrated and timely identification and monitoring of key opportunities and risks based on the above-mentioned risk profile. The objective is to effectively anticipate and mitigate uncertainties and threats, but also to take advantage of any opportunities. Heijmans has designed its risk management in line with the principles of the COSO-ERM framework, assigning a prominent role to the risk management of projects. The activities in the control model have been divided into 1st, 2nd and 3rd lines of defence.
The 1st line is the operation responsible for the execution and compliance with agreed procedures and the manage-ment of the associated risks, both in the business operations and specific project risks.
The 2nd line of defence includes the Risk Office, Legal and Compliance, and analyses and assesses the risk profile in terms of substance, develops and improves management measures and ensures these are implemented in the first line.
The 3rd line (Audit) uses an Audit programme to monitor the correct compliance and effectiveness of the manage-ment measures and reports periodically to the Group Board and the Audit committee.
Risk management is embedded in a management model marked by centrally organised business areas with short lines of communication to the Executive Board. In addition, the execution of the strategy is effected via a number of improvement processes aimed at the optimisa-tion of the company’s operational core processes and the promotion of a culture that, in addition to openness and transparency, also incorporates taking responsibility and ownership. For more information on this, see chapters 10. ‘Strategy’ and 14. ‘Corporate Governance’ of this annual report.
Procedural measures Key aspects within the control framework are:• Management regulations and instructions for the
management of operating companies/business units related to authorities, the acquisition of projects, entering into investment commitments, and reporting and accountability obligations.
• Conduct-related instruments such as the Heijmans Code of Conduct and the Transaction register at Heijmans Property Development - see chapter 14. ‘Corporate Governance’ for more information on this.
• An accounting manual with rules for internal and
external financial reporting and related procedures.• Business process systems for the primary and
secondary processes of the infra, construction and property development operations, including risk management systems, with the aim of achieving uniform processes across the group. This includes a uniform SAP/ERP system across the entire organisa-tion and the new HR system (Workday) implemented in 2019.
• A register of statements as an extra safeguard for the integrity of senior management and specific positions. This includes the Certificate of Good Conduct and Personal Statement of Judicial Records.
Heijmans’ control mechanisms include:• A planning and control cycle, with monthly reporting
by operational management on matters such as the trends in relevant markets, opportunities & risks, the financial situation relative to the budget, the financial and operational status of projects and safety.
• Tender guidelines, tender board, GO/NO GO proce-dures and gate reviews for tenders, with all category 3 tenders requiring the approval of the Executive Board. For each category 3 tender, the CRO supervises the production of an independent risk review, which is reported to the Executive Board.
• Regular project reviews: all projects are divided into various risk categories (1, 2 and 3). The Executive Board discusses risk category 3 projects at least once each quarter.
• Monthly Status Update Projects, in which projects recently taken into development and/or projects with a higher risk profile are discussed with the Executive Board and the CRO.
• Regular review meetings between the Executive Board and the business areas.
• The daily monitoring of movements in the liquidity position of business units and specific projects in relation to weekly updated liquidity forecasts.
• Audit programme aimed at compliance with control measures in the context of project-specific risks, and the control of group-wide operating process risks.
The control framework consists of various formal procedural and organisational measures that are applied right across the group. Heijmans’ culture, in which ownership plays a prominent role, also makes a major contribution to the management of risks. In addition, Heijmans uses a number of control mecha-nisms, including the planning and control cycle, reviews and reporting, which are embedded in the organisation. These control mechanisms are explained below.

132 Heijmans Annual Report 2020
CORPORATE GOVERNANCE
Organisation and Chief Risk Officer (CRO)The Executive Board determines Heijmans’ strategy and its related risk appetite. Heijmans has an organisational structure under which the business areas are managed centrally with short lines of communication to the Executive Board. The central management teams of the business areas, the Executive Board and the staff departments are located in the head office in Rosmalen. This promotes an open and informal culture, which in turn makes the exchange of information both swift and efficient. The aim of the Chief Risk Officer (CRO) is to take risk management and a risk-aware culture to a higher level sustainably, at every level and across the entire breadth of the organisation. The Risk Office department, which operates under the CRO, provides the 2nd line of risk management within the organisation. Risk Officers are senior staff members with a background in the three business areas (Property Development, Building & Technology and Infra), control and legal affairs. Risk Officers are involved in the categorisation of projects for pre-qualification and project selection. They issue an independent opinion on the risk profile of all category 3 tenders. They are deployed in both the substantive shaping of the 2nd line of risk management and the substantive execution of independent risk reviews of tenders and projects in realisation. They also assess the effectiveness of our primary operating processes.
In 2020, we continued to professionalise integrated CRO reporting across the entire Heijmans group, which increasingly involves input from the business areas. This report is drawn up every quarter with the aim of monitor-ing how Heijmans’ risk profile is developing. In this context, we assess our project portfolio, legal claims, the development of our real estate and land holdings, and other internal and external risks that may have an impact on the company. This provides us with an impression of the impact, should these risks materialise.
In terms of digitalisation / data analysis to promote risk awareness, we fleshed out a number of measures in more concrete terms in 2020:
• We have a risk database incorporating both standard risks and specific risks, based on the lessons learned from problematic projects in the past.
• We use specific tooling to produce quarterly analyses of the financial SAP data relating to both maximum values and expectation values of the opportunities and risks, the project risk provisions, quality or order intake, etc.
• The third measure is enriching all historical financial data of category 3 projects with various project characteristics such as, for instance, the required competencies, principal, type of contract, so we can use these characteristics to gain rapid insight into future project risk profiles.
• In 2020, we embedded the GRIP improvement programme in various process consultations in the field of risk management and control that overarch the business areas. The purpose of the process consultations is the continuous implementation of improvements and the structural embedding of the improvement cycle in the processes. These (pro-cess-targeted) improvement aspects are items on the agenda of the various process consultations.
• Process improvements are discussed with the correct stakeholders (process owners), both within the business units and across Heijmans as a whole.
• Boosting the exchange of know-how within Heijmans.
Culture Heijmans believes that the culture of the organisation is a significant factor in the management of risks. Due to the risks inherent in projects, they entail a certain level of unpredictability, and this cannot be mitigated entirely with guidelines and procedures. These require a certain level of flexibility and an open and action-oriented culture, in which people display sufficient ownership to solve any problems that may arise. The example set by the management is crucial to this, as is the willingness to call each other to account in the event of a failure to honour agreements, but also to point out items that have gone well. The use of conduct-related instruments, such as the Heijmans Code of Conduct and the GO! Compass - see the ‘Corporate Governance’ chapter for more information – provides employees with practical guidance on what Heijmans expects from them in terms of behaviour and what behaviour is deemed unacceptable.
Internal guidelines and proceduresThe Executive Board determines the operational parame-ters of the directors and management of the business areas. The powers related to project acquisition, entering into investment commitments and reporting and accountability obligations are embedded in management regulations and instructions to the management of the business areas.
Rules for internal and external reporting are laid down in the Accounting Manual, including related procedures, such as the procedure for investments. The operating

133Heijmans Annual Report 2020
CORPORATE GOVERNANCE
process system includes descriptions of the primary and secondary processes of the construction and property development operations, including risk management systems used to monitor and control project-related risks. This increases the uniformity of the process for the entire group. The Heijmans-wide SAP-based ERP platform is steadily increasing this uniformity. Heijmans has also designed tender process-related procedures that prevent the company from taking on any projects with irresponsi-ble levels of risk.
Planning and control cycle The Executive Board consults with the management of the business areas and project managers on a regular basis and on an ad hoc basis if this is deemed necessary. In these meetings, the Executive Board and the manage-ment review matters such as the developments in relevant markets, the financial situation in relation to the budget, the financial and operational status of projects and safety on the basis of monthly and quarterly reports. Projects in progress with a high risk profile (primarily category 3 projects) are subject to separate regular project reviews with the Executive Board and the CRO, in the presence of the project manager in charge of the project. The monitoring of actual and estimated future liquidity movements is based on three reporting lines:
• Net debt is reported on a daily basis, such on a consolidated basis and per business area. This pertains to an overview of both all bank balances and the (project) financing facilities. The movement is then compared with the forecast. Inadequate liquidity is a key early warning criterion and is discussed immedi-ately with the management in question.
• A liquidity forecast for the next thirteen weeks is drawn up on a weekly basis. Every two weeks, the manage-ment of the business areas are interviewed to discuss these forecasts and the potential impact of individual projects on said forecasts. This reporting line is used to, among other things, gain a better understanding of the current liquidity movements and to gain advance insight into the sensitivities in said liquidity movements.
• A liquidity forecast for the next 12 months is drawn up each year. This is then used to assess whether the available financing facilities will be sufficient to meet the company’s cash requirements. This forecast is also used to allocate each business area its own limit on in-house bank funding.
Statements from managementThe managers responsible for a tender have to sign a dossier statement for every quote submitted. In this statement, they declare that the preparation of the quote did not involve any anti-competition practices. When joining the company, members of the senior manage-ment team and employees in specific positions are asked to provide a Personal Statement of Judicial Records and a Certificate of Good Conduct (verklaring omtrent gedrag - VOG) issued by their local council, as an extra safeguard for integrity. The submission of these statements is recorded in a register. The statements are also saved in the personnel file of the employee in question. The employees in question provide a new personal statement every three years. Upon the publication of the interim and annual results, the management of the business areas submit a confirmation letter, in which they affirm, among other things, that all relevant information is accurate and has been incorporated in full in the figures, and that it has been explained in sufficient detail in the reports of the business areas concerned.
AuditsHeijmans has an internal risk and audit manager, whose primary task is to initiate and conduct sufficient opera-tionally focused audits, including clear feedback reporting to the management in question. In 2020, in addition to the norm audits and external audits, the risk and audit manager oversaw around 100 risk audits. The key findings of these audits were shared with the Group Board and the Supervisory Board’s Audit committee on a quarterly basis. Any suggested improvements as a result of these audits are recorded in improvement registers. These registers are used to monitor the follow-up on the improvement measures. In 2020, we once again tight-ened the improvement process and the monitoring of the follow-up on improvement measures. For the coming year, the risk and audit manager has identified a number of focal points for the audit pro-gramme in consultation with the Executive Board. The focus of the audit programme in 2021 will be on items that are vital to (financially) successful projects: the investment process, cyber security, measurement of Opportunities & Risks, user organisation finance & control and the GDPR. Heijmans’ external auditor EY will audit the annual financial statements. With respect to combina-tions in which Heijmans operates, in some instances EY relies on information from other public auditors.

134 Heijmans Annual Report 2020
CORPORATE GOVERNANCE
Risks and mitigating measures Strategic risks have an impact in the medium to long term or the long term. Generally, these risks manifest gradually over time. Heijmans sees the main risks in this category as failing to respond effectively enough to the need to create differentiating potential, failing to operate sustainably and failing to be innovative. In addition to these risks, there is also the question of whether the company’s scale in a particular market segment is appropriate and offers sufficient perspective. Important considerations in this respect are having the knowledge and expertise required, and ensuring the correct deploy-ment of people and equipment.
In principle, the Executive Board monitors strategic risks. The Executive Board continuously analyses and evaluates the development of the operational activities in relation to the attractiveness and development of markets and market segments. The board also initiates actions with the aim of turning identified risks into opportunities. In 2020, Heijmans continued to implement its strategy, which in addition to continuous improvement – ‘better’ - defines ‘smart’ and ‘sustainable’ as strategic pillars (see also chapter 10. ’Strategy’).
Appendix 16.3 to this annual report includes a more detailed overview of the strategic, operational, financial, legal and compliance risks and associated mitigating measures. In this overview, we indicate whether the risk is high, moderate or low for Heijmans and how it is developing by indicating whether the risk has become smaller, greater or stayed the same compared with the previous year.
Risk statement In 2020, Heijmans focused on compliance and the effectiveness of the additional risk-mitigating measures introduced in 2019. These included:• Guidelines for entering into combinations.• More uniform and more cautious assessment of
opportunities and risks in projects.• The functioning of process consultations with the
appointed process owners and those responsible for optimisations and embedding.
• Continued development of the GRC (Governance-Risk-Compliance) model in line with the COSO model to identify any GAPs and priorities.
Partly in view of the above, the Executive Board can state that, given the current situation, it was justified to prepare the financial statements on the assumption that Heijmans will continue as a going concern and that the risk and control systems generally functioned properly. With respect to financial reporting risks, Heijmans’ internal risk and control systems provide a reasonable level of certainty that the financial reporting as shown in the financial statements for 2020 (pages 139 through 221) do not, to our knowledge, contain any material misstatements.
However, it is not possible to provide absolute certainty. Heijmans can therefore not guarantee the absence of material errors, fraud or the violation of legal regulations. This annual report includes an explanation of the material risks and uncertainties relevant to the expecta-tion that the Company will continue as a going concern for a period of twelve months after this report was prepared.
The optimisation and monitoring of the functioning of the internal risk management and control systems remains a key priority for the Executive Board. In the year under review, the Executive Board and the audit committee, as well as the entire Supervisory Board, discussed the structure and operation of the internal risk management and control systems intensively and frequently. In the year under review, there were no integrity issues that had an impact on the company’s risk profile.
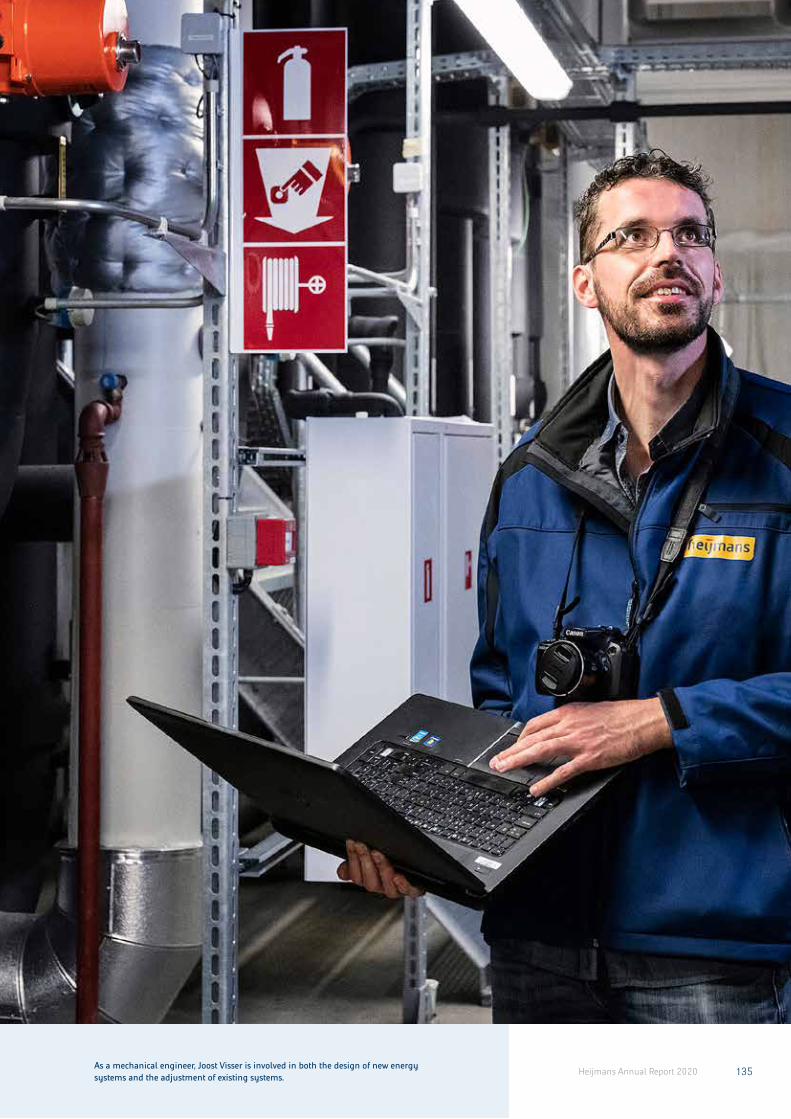
135Heijmans Annual Report 2020
THE HEIJMANS SHARE
As a mechanical engineer, Joost Visser is involved in both the design of new energy systems and the adjustment of existing systems.


Gasthuiskwartier, Den Bosch

138 Heijmans Annual Report 2020
SECTOR DEVELOPMENTS AND TRENDS

139Heijmans Annual Report 2020
FINANCIAL STATEMENTS
Financial statements 2020
CONTENTS
1. Consolidated statement of profit or loss 140
2a. Consolidated statement of comprehensive income 141
2b. Consolidated statement of changes in equity 142
3. Consolidated statement of financial position 143
4. Consolidated statement of cash flows - indirect method 145
5. Accounting policies 146
6. Notes related to the consolidated financial statements 157
6.1 Segment reporting 1576.2 Revenue 1616.3 Other operating income 1626.4 Staff costs, depreciation, and research
and development expenses 1636.5 Other operating expenses 1646.6 Finance income and expense 1646.7 Income tax 165
6.8 Income tax receivables and payables 1666.9 Property, plant and equipment 1676.10 Leases 1686.11 Intangible assets 1706.12 Joint ventures and associates 1736.13 Loans granted to joint ventures 1746.14 Deferred tax assets and liabilities 1756.15 Inventories 1776.16 Work in progress 1796.17 Trade and other receivables 1816.18 Cash and cash equivalents 1816.19 Equity 1826.20 Earnings per share 1826.21 Interest-bearing loans and
other financing liabilities 1836.22 Employee benefits 1886.23 Provisions 1926.24 Trade and other payables 1946.25 Financial risks and risk management 1956.26 Investment commitments 2026.27 Contingent liabilities 2036.28 Related parties 2046.29 Management estimates and judgements 210
7. Subsidiaries and joint operations 212
8. Company financial statements 213

140 Heijmans Annual Report 2020
FINANCIAL STATEMENTS
Consolidated statement of profit or loss
x € 1.000x € 1.000
2020 2019
6.2 Revenue 1.746.468 1.600.235
Cost of sales -1.547.144 -1.425.337
Gross profit 199.324 174.898
6.3 Other operating income 3.081 3.807
Selling expenses -40.012 -38.753
6.4 Administrative expenses -105.720 -109.744
6.5 Other operating expenses -1.021 -1.030
Operating result 55.652 29.178
6.6 Finance income 1.397 1.472
6.6 Finance expense -6.251 -6.163
6.12 Results of joint ventures and associates -10.760 10.368
Result before tax 40.038 34.855
6.7 Income tax 110 -4.799
Result after tax 40.148 30.056
The entire result after tax is attributable to the shareholders of the parent company
Earnings per share (in €)
6.20 Earnings per ordinary share after tax 1,85 1,40
6.20 Earnings per ordinary share after tax and dilution effects 1,85 1,40
Dividend distributed per ordinary share in the financial year 0,00 0,00
1. Consolidated statement of profit or loss

141Heijmans Annual Report 2020
FINANCIAL STATEMENTS
Consolidated statement of comprehensive income
x € 1.000
2a. Consolidated statement of comprehensive income
2020 2019
1. Result after tax 40.148 30.056
Other comprehensive income that after initial recognition is possibly reclassified to the statement of profit or loss:
Effective portion of changes in the cash flow hedges for joint ventures 666 -452
Other comprehensive income that is never reclassified to the statement of profit or loss:
Changes in actuarial results on defined-benefit plans 1.884 -2.238
Tax effect on changes in actuarial results on defined-benefit plans -471 556
Tax effect relating to defined benefit pension plans in connection with rate change 2.921 901
Other comprehensive income (after tax) 5.000 -1.233
Comprehensive income 45.148 28.823
The entire comprehensive income is fully attributable to the shareholders of the parent company.
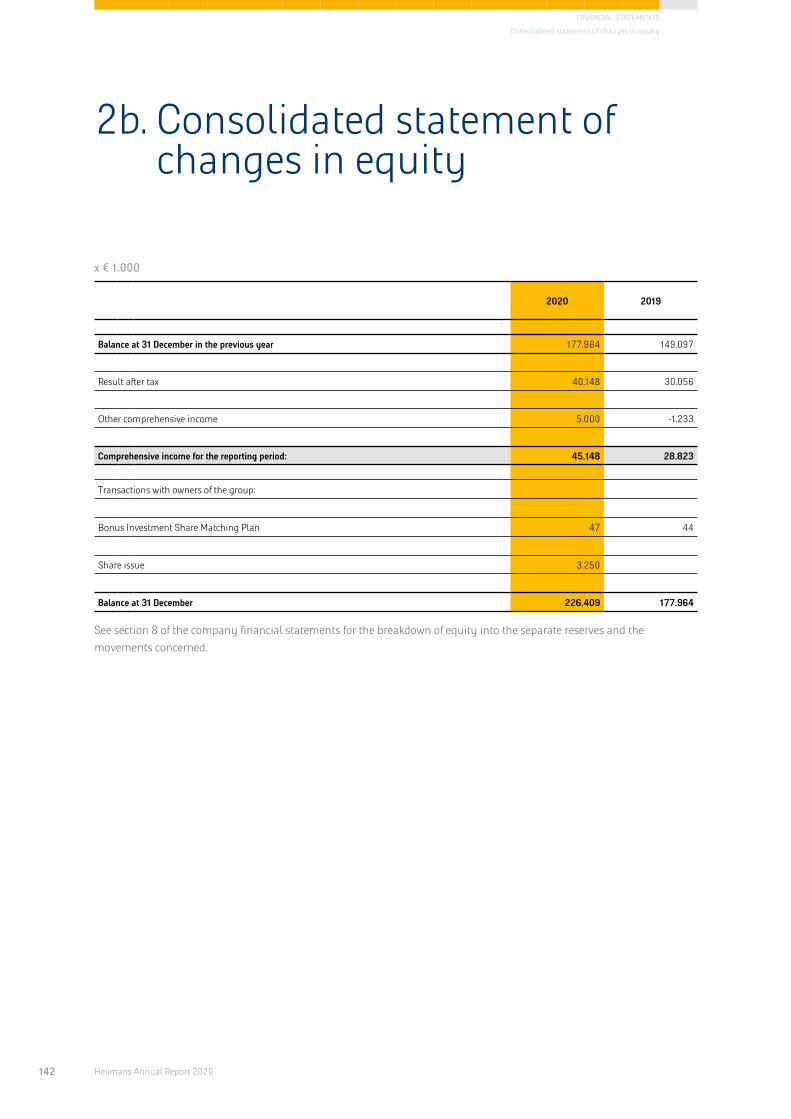
142 Heijmans Annual Report 2020
FINANCIAL STATEMENTS
Consolidated statement of changes in equity
x € 1.000
2b. Consolidated statement of changes in equity
2020 2019
Balance at 31 December in the previous year 177.964 149.097
Result after tax 40.148 30.056
Other comprehensive income 5.000 -1.233
Comprehensive income for the reporting period: 45.148 28.823
Transactions with owners of the group:
Bonus Investment Share Matching Plan 47 44
Share issue 3.250
Balance at 31 December 226.409 177.964
See section 8 of the company financial statements for the breakdown of equity into the separate reserves and the movements concerned.

143Heijmans Annual Report 2020
FINANCIAL STATEMENTS
Consolidated statement of financial position
x € 1.000
3. Consolidated statement of financial position
ASSETS 31 december 2020 31 december 2019
Non-current assets
6.9 Property, plant and equipment 45.206 41.966
6.10 Right-of-use assets 81.596 85.059
6.11 Goodwill 68.390 68.390
6.11 Other intangible assets 6.220 7.241
6.12 Joint ventures and associates 73.272 64.254
6.13 Loans granted to joint ventures 23.380 31.296
6.14 Deferred tax assets 34.705 31.991
332.769 330.197
Current assets
6.15 Strategic land holdings 126.415 110.028
6.15 Other inventories 88.972 94.543
6.16 Work in progress assets 66.240 68.802
6.8 Income tax assets 200 0
6.17 Trade and other receivables 140.979 185.453
6.18 Cash and cash equivalents 175.063 109.372
597.869 568.198
Total assets 930.638 898.395

144 Heijmans Annual Report 2020
FINANCIAL STATEMENTS
Consolidated statement of financial position
x € 1.000
EQUITY AND LIABILITIES 31 december 2020 31 december 2019
Equity
2b Issued capital 6.580 6.423
2b Share premium 245.773 242.680
2b Reserves -11.432 -13.379
2b Retained earnings from prior financial years -54.660 -87.816
1 Result for the year after tax 40.148 30.056
226.409 177.964
Non-current liabilities
6.21 Interest-bearing loans and other non-current financing liabilities1 53.663 49.947
6.10 Lease liabilities 61.425 65.403
6.22 Employee benefits 15.791 16.514
6.23 Provisions 26.387 22.779
6.14 Deferred tax liabilities
157.266 154.643
Current liabilities
6.21 Interest-bearing loans and other current financing liabilities1 3.103 3.300
6.10 Lease liabilities 19.698 21.199
6.24 Trade and other payables 326.375 359.314
6.16 Work in progress credit 170.297 153.660
6.8 Income tax liabilities 108 334
6.22 Employee benefits 575 1.657
6.23 Provisions 26.807 26.324
546.963 565.788
Total equity and liabilities 930.638 898.395
1 Interest-bearing loans include cumulative financing preference shares B totalling €41.8 million, of which €3.1 million is included in current liabilities (2019: €45.1 million which €3.3 million in current liabilities).

145Heijmans Annual Report 2020
FINANCIAL STATEMENTS
Consolidated statement of cash flows - indirect method
x € 1.000
4. Consolidated statement of cash flows - indirect method
2020 2019
Operating result 55.652 29.178
Adjustments for:
6.3 Gain on sale of non-current assets and property investments -1.316 -1.8356.9 Depreciation of property, plant and equipment 9.195 9.2416.10 Depreciation of right-of-use assets 23.883 22.4876.11 Amortisation of intangible assets 1.021 1.030
6.15 Adjustment of valuation of property investments and land portfolios, excluding joint ventures 2.499 5.400
Change in working capital and long-term provisions 40.713 -17.016Operating result after adjustments 131.647 48.485
Interest paid -4.420 -7.888Interest received 1.397 1.472Income tax paid -479 0
Cash flow from operating activities 128.145 42.069
6.9 Investments in property, plant, and equipment -16.368 -11.008
6.9 Sale of property, plant and equipment 1.289 5.599
6.11 Disposal of intangible assets 0 2.000
Disposals of interest in joint ventures and associates 5.504 0
Acquisition/expansion of interest in joint ventures and associates1 -18.072 0
6.12 Capital contributions to joint ventures and associates -26.158 -1.582
Capital repayments from joint ventures and associates 10.582 8.411
Dividends received from joint ventures and associates 1.253 9.629
Loans granted to joint ventures and associates -2.603 -10.814
Loans repaid by joint ventures and associates 11.252 2.154
Cash flow from investing activities -33.321 4.389
6.10 Principal portion of lease payments -25.897 -20.986
6.21 Interest-bearing loans drawn down 86 1.022
6.21 Interest-bearing loans repaid -3.322 -6.054
Cash flow from financing activities -29.133 -26.018
Net cash flow in the period 65.691 20.440
6.18 Cash and cash equivalents at 1 January 109.372 88.932
6.18 Cash and cash equivalents at 31 December 175.063 109.372
1 Relates to the cash-out from entering into the AsfaltNu joint venture (€6 million) and the expansion of the 50% interest in a property development joint venture with land holdings to 100% (€12 million).

146 Heijmans Annual Report 2020
FINANCIAL STATEMENTS
Accounting principles
Heijmans N.V. (referred to as the “Company”) has its registered office in the Netherlands. The Company’s consolidated financial statements for the 2020 financial year include the Company and its subsidiaries (collecti-vely referred to as the ‘Group’) and the Group’s invest-ments in associates and interests in jointly controlled entities. The Group carries on construction and develop-ment activities in the Netherlands. The address of its headquarters is Graafsebaan 65, Rosmalen.
The Executive Board prepared the financial statements on 19 February 2021. These will be submitted for adoption by the General Meeting of Shareholders on 14 April 2021.
(1) Statement of Compliance
The consolidated financial statements for 2020 were prepared in accordance with the International Financial Reporting Standards as adopted by the European Union (EU-IFRS) and with Part 9 of Book 2 of the Dutch Civil Code.
(2) Basis of preparation
The financial statements are presented in thousands of euros. The financial statements are based on historical cost, unless otherwise stated.
The preparation of the financial statements in accordance with EU-IFRS requires management to make judgements, estimates and assumptions that affect the reported amounts of assets and liabilities and of revenue and expenses. The estimates and their underlying assumpti-ons are based on experience and other factors that are considered reasonable. The estimates form the basis for calculating the carrying amounts of assets and liabilities that cannot easily be derived from other sources. Actual results could differ from these estimates. See also note 6.29, Management estimates and judgements.
The estimates and underlying assumptions are continu-ally reassessed. Revised estimates are recognised in the period in which the estimate was revised, provided that the revision only affects that period. Revisions are
recognised in the reporting period and future periods if the revision also affects future periods.
The accounting policies described below have been consistently applied to all periods presented in these consolidated financial statements and to all entities in the Group.
(3) Implications of new standards
The amendments to IFRS 3, IFRS 7, IFRS 9, IAS 1 and IAS 8 and the Amendments to References to the Conceptual Framework in IFRS standards adopted by the EU and applicable to reporting periods commencing on or after 1 January 2020 do not have any material effect on the consolidated financial statements. There are no new standards that are not yet mandatory which have a material effect upon the consolidated financial statements.
(4) Accounting policies used for consolidation
(4a) Subsidiaries (full consolidation)A subsidiary is an entity over which the Group has direct or indirect control. Control exists if the Group: a) has power over the entity; b) is exposed or has rights to variable returns because of
its involvement with the entity; andc) can use its power over the entity to affect the size of
these returns.Each of these three criteria has to be satisfied to establish that the Group has control over a company in which it owns an interest. The financial statements of subsidiaries are included in the consolidated financial statements from the date that control commences to the date that control ceases. Business combinations are recognised according to the acquisition method, as from the date on which control is transferred to the Group. The transaction cost of an acquisition is recognised at fair value, as are the net identifiable assets acquired. Any resulting goodwill is tested every year for impairment. Any gain from a
5. Accounting policies

147Heijmans Annual Report 2020
FINANCIAL STATEMENTS
Accounting principles
favourable purchase is recognised directly in profit or loss. Transaction costs are recognised when these are incurred, unless they relate to the issue of debt or equity instru-ments. The transfer sum includes no amount for settling existing account balances. Such amounts are generally recognised in the statement of profit or loss. The fair value of a contingent payment is recognised on the date of acquisition. If this conditional payment is classified as equity, it is not subsequently remeasured. Instead, the settlement figure is recognised in equity. In other cases, adjustments after initial recognition are recognised in profit or loss. In a step acquisition of an interest that does not qualify as a company, the existing interest is not remeasured to fair value.
(4b) Joint ventures and associates (equity method)A joint venture is a joint arrangement in which the Group has joint control together with other parties, and has a right to the net assets of the joint venture. The parties involved have agreed contractually that control is shared and that decisions concerning relevant activities require unanimous approval from the parties having joint control over the joint venture. A joint venture is recognised from the date on which the Group shares control until the date on which this ceases. An associate is an entity over which the Group has significant influence, but cannot exercise control. Significant influence is presumed to exist when the Group holds 20% or more of the voting rights. An associate is recognised from the date on which the Group has significant influence until the date on which this ceases. Joint ventures and associates are recognised in accor-dance with the equity method and are initially recognised at acquisition cost. The investments of the Group include the goodwill determined during acquisition. The consoli-dated financial statements include the Group’s proportio-nate share of the comprehensive income determined in accordance with the Group’s accounting policies. If the Group’s share of the losses is greater than the value of the interest in a joint venture or associate, the value of the interest is written down to nil. No further losses are then recognised except insofar as the Group has made a commitment or intends to recognise the losses.
(4c) Joint operations (proportional consolidation)Joint operations are arrangements over which the Group
exercises control jointly with third parties. For its share in a joint operation, the Group recognises its assets (inclu-ding its share of the assets held jointly), liabilities (including its share of the liabilities incurred jointly), revenue (including its share of the revenue from the output of the joint operation) and expenses (including its share of the expenses incurred jointly). In practice, the method for recognising joint operations is comparable to that used for proportional consolidation.
(4d) Elimination of transactions on consolidationIntragroup balances and any unrealised income and expense arising from intragroup transactions are eliminated when preparing the consolidated financial statements.
Unrealised income from transactions with associates, joint ventures and joint operations are eliminated in proportion to the Group’s interests in the entities concerned.
(5) Transactions in foreign currencyTransactions in foreign currency are translated into euros at the exchange rate prevailing on the transaction date. Foreign currency balances, as well as assets acquired and liabilities paid in foreign currencies, are translated at the corresponding exchange rates prevailing on the reporting date. Foreign currency differences resulting from transla-tion are recognised in the statement of profit or loss.
(6) Revenue from contracts with customersRevenue is recognised if the Group has entered into a contract with a customer in which the performance obligations can be identified and the terms of the transaction are clear and where the contract is of undeniable economic importance. It must also be probable that the customer will pay. Revenue is recog-nised on each individual contract. Revenue from portfolios of contracts with similar features is recognised on a portfolio basis if the result is not materially different from the revenue measured on an individual basis. If a contract involves several performance obligations, revenue is separately attributed to the performance obligations concerned based on relatively stand-alone

148 Heijmans Annual Report 2020
FINANCIAL STATEMENTS
Accounting principles
selling prices. Revenue is recognised at the time when the customer takes control of the fulfilled performances. Variable consideration is only recognised if it is highly probable that a significant revenue reversal will not occur:• Revenue from additional work is included in the
overall contract revenue if the client has accepted the sum involved in any way.
• Claims and incentives are recognised in the amount for work in progress where they derive from enforcea-ble rights, it is highly probable that they will lead to revenue and can be reliably measured.
• Unless it is highly unlikely that a penalty will be applied, the amount of any penalties will be deducted from the revenue.
If the results from a contract cannot be determined reliably, contract revenue is only recognised insofar as it is probable that the costs incurred can be covered by revenue. If a contract contains a significant financing component, the Group adjusts the revenue accordingly. This is not done if the time between the fulfilment of the perfor-mance obligation and the payment of the consideration is less than one year.
Expected contract losses are recognised immediately in the statement of profit or loss. In measuring the amount of provisions for losses, the Group proceeds on the basis of the economic benefits expected to be received compared with the attributable costs of the contract (see also 24d concerning onerous contracts).
(6a) Sales of goods - mainly landRevenue from the sale of goods - mainly land - is recog-nised at the agreed consideration or attributed considera-tion where the transfer of title to the land forms part of a combined purchase/construction contract in the case of residential projects. The revenue from the land is recog-nised at the time of legal conveyance.
(6b) Work in progress - projectsThe revenue relating to work in progress is recognised in the statement of profit or loss when control is transferred to the client. Since the Group executes projects on land owned by the client, the client obtains control by accession according to progress made in completion of the project. The stage of completion is assessed by reference to the proportion of costs recorded in relation to the total expected costs to the extent that the costs incurred are representative of the progress made in the transfer of goods/services to the client. Inefficiencies are disregarded in determining the stage of completion.
(6c) ServicesRevenue from the provision of services - mainly servicing and maintenance activities - is recognised in the state-ment of profit or loss in proportion to the work performed, since the client receives the benefits from and has use of the services at the same rate. The stage of completion is determined from assessments of the work already carried out.
(7) Other operating income Gains on the sale of assets and entities disposed of and gains on the contribution of assets to newly established joint arrangements are accounted for as other operating income. On contribution of assets to joint arrangements, any gains are eliminated in proportion to the Group’s interest in the arrangement.
(8) Costs
(8a) Cost of salesThe cost of sales is made up of the carrying amount of goods sold and the costs allocated to the fulfilled performance obligations, including the expected losses on projects that are recognised immediately in the state-ment of profit or loss in accordance with 24d.
(8b) Selling expensesSelling expenses are the costs of sales activities that are not charged to projects.
(8c) Administrative expensesThe administrative expenses represent general expenses that are not costs of sales and are not charged to projects.
(8d) Finance income and expenseNet financing costs comprise interest payable on borrowings and lease commitments, dividends on cumulative financing shares B and interest receivable on funds invested.
Financing expenses that can be directly allocated to the acquisition, construction or production of a qualifying asset are capitalised as part of the costs of that asset during the period that the asset is under development.
The interest component of the lease payments is recognised in the statement of profit or loss and is calculated using the effective interest method.

149Heijmans Annual Report 2020
FINANCIAL STATEMENTS
Accounting principles
(9) Income tax
Deferred tax assets and liabilities are recognised in respect of available tax loss carryforwards and temporary differences between the carrying amounts of assets and liabilities for financial reporting purposes, and the values used for taxation purposes. A deferred tax asset or liability is not recognised for non-deductible goodwill, assets and liabilities whose initial recognition does not affect accoun-ting or taxable profit, or differences relating to investments in subsidiaries to the extent that these will probably not reverse in the foreseeable future. The amount of the deferred tax assets and liabilities is based on the manner in which the expected asset and liability carrying amounts will be realised or settled, based on the income tax rates that have been enacted or substantively enacted on the reporting date.
Deferred tax assets and liabilities are set off against each other if there is a right enforceable by law to set them off, and if these tax assets and liabilities are associated with income tax levied by the same tax authority on the same taxable entity, or on different taxable entities that intend to set them off or that will be realising the tax assets at the same time as the tax liabilities.
Income tax recognised in the statement of profit or loss during the financial year comprises the income tax owed or refundable over the reporting period and the deferred income tax. The income tax is recognised in the statement of profit or loss, except to the extent that it relates to items recognised in other comprehensive income. In that case, the relevant portion of the income tax is recognised in other comprehensive income.
The income tax owed or refundable over the financial year is the expected tax payable on the taxable income for the financial year, using tax rates enacted or substantively enacted on the reporting date, as well as adjustments to tax payable in respect of previous years.
A deferred tax asset (net of any deferred tax liability) is recognised only to the extent that it is probable that future taxable profits will be available that can be utilised towards realising the deferred asset. The amount of the deferred tax asset is reduced to the extent that it is no longer probable that the related tax benefit will be realised.
Additional income tax that arises from the distribution of dividends is recognised at the same time as the liability to pay the related dividend is recognised.
(10) Property, plant and equipment
(10a) Assets in ownershipItems of property, plant and equipment are measured at cost or estimated cost less accumulated depreciation (see below) and impairments (see accounting policy 20). Cost includes costs that can be directly allocated to the acquisition of the asset. The cost of self-constructed assets includes the cost of materials, direct labour costs, financing costs and any other costs that can be directly allocated to making the asset ready for use, as well as any costs of dismantling and removing the asset and restoring the site where the asset is located. The costs of self-constructed assets and acquired assets include (i) the initial estimate at the time of installation of the costs of dismantling and removing the assets and restoring the site on which the assets are located and (ii) changes in the measurement of existing liabilities recognised in relation to the costs identified in (i) above.
(10b) Expenses after initial recognitionThe Group includes the cost of replacing part of an asset in the carrying amount of items of property, plant and equipment when the cost is incurred. This occurs if it is likely that the future economic benefits of the asset will accrue to the Group and the cost price of the asset can be reliably determined. All other expenses are taken to the statement of profit or loss when these are incurred.
(10c) Depreciation of property, plant and equipmentDepreciation is recognised in the statement of profit or loss using the straight-line method over the estimated useful life of each part of an item of property, plant or equipment. The residual values are reassessed on an annual basis. Depreciation is not applied to land. The estimated useful lives are as follows:• Buildings: main building structures and roofs: 30
years • Buildings: technical equipment: 15 years• Buildings: interior walls: 10 years• Office equipment: 3 - 10 years• Machines: 5 - 10 years• Installations: 5 - 10 years• Large-scale equipment and other capital assets:
3 - 10 years
(10d) Investment propertyGiven its marginal importance, investment property (property held for its rental income and/or increase in value) is recognised under property, plant and equipment. Investment property is measured at cost, less accumula-ted depreciation and impairment losses. Cost includes costs that can be directly allocated to the acquisition of

150 Heijmans Annual Report 2020
FINANCIAL STATEMENTS
Accounting principles
the asset. The cost of self-constructed assets includes the cost of materials, direct labour costs, financing costs and any other costs that can be directly allocated to making the asset ready for use, as well as any costs of dismant-ling and removing the asset and restoring the site where the asset is located.
(11) Right-of-use assets
On the commencement date (the date on which the asset concerned becomes available for use), the Group recogni-ses a corresponding right-of-use asset. The right-of-use asset is measured at cost less depreciation and impair-ment, adjusted for any revaluation of the lease liability. Cost is made up of the recognised amount of the lease liability, initial direct costs and lease instalments paid prior to the commencement date, less lease incentives received. Unless the Group is reasonably certain that it will acquire ownership of the underlying asset at the end of the lease period, the right-of-use asset is depreciated on a straight-line basis from the commencement date to the earlier of the following two dates: the end of the period of use or the end of the lease period. Improvements made to leased assets are depreciated over a period that is shorter than or the same as the period used for the leased asset concerned. Right-of-use assets are subject to impairment testing.
Non-lease components, specifically amounts for maintenance and fuel that are included in the lease instalments, are not recognised if these amounts are readily determined and are material. In practice, this applies to the non-lease payments for cars. For the other leases, use is made of the practical expedient of treating the non-lease components in the same manner as lease components.
The Group makes use of the practical expedient of not recognising short-term leases (with a lease period of less than 12 months and no purchase option) and the same applies to leases where the new value of the underlying asset is low (less than €5,000). The lease instalments for such leases are accounted for in the operating expenses over the period concerned.
The lease period relates to the non-cancellable period of the lease together with the periods covered by a renewal option if it is reasonably certain that the Group will exercise this option and periods covered by a termination option if it is reasonably certain that the Group will not exercise this option.
(12) Intangible assets
(12a) GoodwillAll business combinations are recognised using the acquisition method. Goodwill is the amount that arises from the acquisition of subsidiaries. Goodwill represents the excess of the cost of the acquisition over the net fair value of the identifiable assets and liabilities at the time of acquisition. An impairment test is carried out every year (see accounting policy 20).
Negative goodwill arising from an acquisition is recog-nised directly in the statement of profit or loss.
(12b) Other intangible assetsIntangible assets acquired by the Group that have finite useful lives are measured at cost less accumulated amortisation and accumulated impairments.
(12c) Amortisation Regarding goodwill, an impairment test is systematically performed every year at the reporting date to determine whether there are any impairments. The other intangible assets are amortised through the statement of profit or loss on a straight-line basis over the expected useful lives of the intangible assets, and undergo periodic impairment testing (see accounting policy 20). The estimated useful lives of the intangible asset categories are as follows:• Customer base: 5 - 20 years • Order book: 4 years• Sand quarry concession: 5 - 15 years• Brand: 5 - 10 years
(12d) Expenses after initial recognitionExpenditure on intangible assets, other than goodwill, is only capitalised after initial recognition if it is expected to increase the future economic benefits that are inherent in the specific asset to which the expenditure relates. All other items of expenditure are recognised as costs in the statement of profit or loss when these are incurred.
(13) Financial instrumentsA financial instrument is a contract that leads to a financial asset or financial liability for the Group.
(13a) Financial assetsThe Group’s main financial assets are:• Loans granted (see accounting policy 14)• Trade and other receivables (see accounting policy 17)• Cash and cash equivalents (see accounting policy 18) Financial assets are classified as assets that are:
151Heijmans Annual Report 2020
FINANCIAL STATEMENTS
Accounting principles
a. carried at amortised cost after initial recognition, or b. carried at fair value with gains and losses included in
the other components of comprehensive income, orc. carried at fair value with gains and losses accounted for
in profit or loss.This classification is based on the Group’s business model for the management of the financial assets and the features of the contractual cash flows from the financial asset. The financial assets are to be carried at amortised cost (a) if both of the following conditions are satisfied: i. the financial asset is held as part of a business model aimed at holding financial assets for the purpose of receiving contractual cash flows, and ii. the contractual terms of the financial asset give rise on certain dates to cash flows exclusively concerning repayments of principal and interest payments on the outstanding amount. Both conditions are satisfied in the case of the above financial assets. The financial assets are carried at amortised cost. On initial recognition, the amount of financial assets carried at amortised cost is measured using the effective interest method and is subject to impairment. Gains and losses are recognised in profit or loss when the asset matures, is settled, is revised or is subject to impairment. Financial assets are recognised less a provision for expected credit losses. The amount of this provision is measured as the amount of the expected credit losses over the coming 12 months, based on the credit rating of the client. Subsequently, as long as there is no significant deterioration in the credit risk, the credit loss provision continues to be measured at the amount of the 12-month expected credit losses. If, however, a significant increase in the credit risk occurs, on either an individual or a collective basis, the amount of the expected credit loss provision is measured as the expected credit losses over the entire term to maturity of the instrument. In the case of trade receivables and work in progress assets, the simplified approach permitted by IFRS 9, involving consistent recognition of a loss allowance at an amount equal to lifetime expected credit losses, has been used.
(13b) Financial liabilitiesThe Group has the following financial liabilities:• Cumulative financing preference shares (see account-
ing policy 22a)• Interest-bearing loans (see accounting policy 22b)• Trade and other payables (see accounting policy 25)These liabilities are carried at amortised cost after initial recognition, using the effective interest method. When a financial liability (or a part thereof) is eliminated or expires, it ceases to be recognised.
Swapping of debt instruments involving the same lender on substantially different terms is treated as a settlement of the original financial liability and recognition of a new financial liability. The same applies when the terms of an existing financial liability are substantially altered. The difference between the carrying amount of a financial liability (or part thereof) that is redeemed or is transferred to a third party and the amount paid, including any transfer of assets other than cash and cash equivalents or assumed liabilities, is recognised in profit or loss.
(13c) Netting of financial assets and liabilitiesFinancial assets and financial liabilities are netted off and presented as a net amount in the statement of financial position if• the Group has a legally enforceable right to net the
amounts off, and• the Group intends to settle the liability on a net basis
or to realise the asset simultaneously with the settlement of the liability.
(14) Loans granted
Loans granted form part of the financial assets (see accounting policy 13). Loans granted that do not meet both conditions cited in accounting policy 13 are carried at fair value with gains and losses accounted for in profit or loss. Loans granted that meet both conditions referred to are measured at amortised cost using the effective interest method, less impairments..
(15) Inventories
(15a) Strategic land holdingsThe strategic land holdings represent the reported land holdings that are managed centrally in the Company’s strategic land portfolio. These holdings are acquired and held for future property development. The interest and development costs for land holdings that are under development are capitalised. The land holdings are measured at the lower of cost and net realisable value.
(15b) Other inventoriesOther inventories includes unsold residential property in preparation and under construction (including planning and building consents), raw materials and consumables finished products (including land and premises for sale).

152 Heijmans Annual Report 2020
FINANCIAL STATEMENTS
Accounting principles
Inventories is measured at cost, or at net realisable value if lower. The net realisable value is the estimated selling price in the ordinary course of business less the estimated costs of completion and the estimated costs necessary to make the sale. The cost of inventories includes expendi-ture incurred in acquiring the inventories, the production or conversion costs, and the other costs incurred in bringing the inventories to its current location and current condition. The cost of inventories includes an appropriate share of production overheads based on normal operating capacity, as well as the attributable financing expenses. For fungible inventories the first-in, first-out (FIFO) principle applies.
Land and premises for sale concerns land and premises that have been technically delivered as developed but which on the reporting date were not sold to third parties. The inventories of land and premises for sale is valued at cost (including interest and allocated overhead costs), less any write-downs relating to a lower net realisable value as a consequence of the risk of inability to sell or rent.
(16) Work in progress assets
Work in progress assets concern the right to consideration in respect of work on projects carried out and transferred to the client. In practical terms, the item is made up of the revenue (see also accounting policy 6) in proportion to the progress in fulfilling the performance obligation less invoiced instalments. Total expected project losses, if any, are directly recognised as expenses in the relevant period and are accounted for on the balance sheet in provisions (see also 24d). Work in progress assets are measured taking account of expected credit losses in a way similar to the method used for trade and other receivables (see accounting policy 17).
(17) Trade and other receivables
Trade and other receivables form part of the financial assets (see accounting policy 13). Trade and other receivables are carried at amortised cost less a provision for expected credit losses. In measuring the amount of the provision for expected credit losses, use is made of the simplified approach involving consistent recognition of an allowance at an amount equal to lifetime expected credit losses. Amounts still to be invoiced on concluded projects are recognised under trade and other receivables.
(18) Cash and cash equivalents
Cash and cash equivalents form part of the financial assets (see accounting policy 13). Cash and cash equiva-lents comprise cash and bank balances and other call deposits. Current account overdrafts that are repayable on demand and form an integral part of the Group’s cash management are included as a component of cash and cash equivalents in the statement of cash flows.
(19) Assets held for sale and discontinued operations
Non-current assets (or groups of assets and liabilities that are to be disposed of), for which it is expected that the carrying amount will probably be realised within one year mainly by means of a sale transaction and not through continued use, are classified as held for sale (or held for distribution), after it is established that the relevant conditions have been met. Immediately preceding this classification, the assets (or the components of a group of assets to be disposed of) are measured again in accordance with the Group’s accounting policies. The assets or group of assets to be disposed of are generally measured at the carrying amount or the fair value less sale costs, if lower. Any impairment loss on a group of assets held for sale is first allocated to goodwill and then pro rata to the remaining assets and liabilities, subject to the restriction that impairment losses are not allocated to inventories, financial assets, deferred tax assets or employee benefits, all of which are measured in accordance with the Group’s accounting policies. Impairment losses arising from the initial classification as held for sale or distribution and gains or losses on revaluation arising after initial recogni-tion are recognised in the statement of profit or loss. If the gain concerned exceeds the accumulated impairment loss, the difference is not recognised.
A discontinued operation is an element of the Group’s operations that represents a separate significant business activity or separate significant geographical business area that has been disposed of or is held for sale or distribu-tion, or a subsidiary that has been acquired solely for the purpose of resale. Classification as a discontinued operation occurs upon disposal, or when the operation meets the criteria for classification as held for sale, if earlier. If an operation is designated as a discontinued operation, the comparative figures in the statement of profit or loss are restated as if the operation had been discontinued from the beginning of the comparative period.

153Heijmans Annual Report 2020
FINANCIAL STATEMENTS
Accounting principles
(20) Impairments
The carrying amounts of the Group’s non-financial assets, excluding work in progress assets (see accounting policy 16), inventories (see accounting policy 15) and deferred tax assets (see accounting policy 9), are reviewed each reporting date to determine whether there is any indication of impairment. If there are such indications, an estimate is made of the recoverable amount of the asset concerned.
For goodwill, intangible assets with an unlimited useful life, and intangible assets that are not yet ready for use, the recoverable amount is estimated at the reporting date. An impairment loss is recognised whenever the carrying amount of an asset or its cash-generating unit exceeds its recoverable amount. Impairment losses are recognised in the statement of profit or loss.
Impairment losses recognised in respect of cash-generating units are allocated first to reduce the carrying amount of any goodwill allocated to the units, and then to reduce the carrying amount of the other assets in the unit (or group of units) on a pro rata basis.
(20a) Determination of recoverable amountThe recoverable amount of an asset is equal to the higher of its net selling price and its value in use. To determine the value in use, the discounted value of the estimated future cash flows is calculated using a discount rate that reflects current market rates as well as the specific risks associated with the asset. For any asset that does not generate cash inflows and is largely independent of other assets, the recoverable amount is determined on the basis of its cash-generating unit.
(20b) Reversal of impairmentsImpairment losses in respect of goodwill are never reversed.
In respect of other assets, impairments recognised in other periods are reversed if there is an indication that the impairment no longer exists or has decreased and if there has been a change in the estimates used to determine the recoverable amount.
An impairment is reversed only to the extent that the asset’s carrying amount does not exceed the carrying amount that would have been determined, net of depreciation or amortisation, if no impairment had been recognised.
(21) Share capital
(21a) Costs of issuing ordinary sharesCosts directly attributable to the issuing of ordinary shares are charged to equity, after deduction of any tax effects.
(21b) Repurchase of own sharesIf shares representing capital that is recognised as equity in the statement of financial position are repurchased, the amount of the consideration paid, including directly attributable costs, is recognised as a deduction from equity. Repurchased shares are classified as treasury shares and are presented as a deduction from total equity.
(21c) DividendDividends are recognised as a liability in the period in which these are declared.
(22) Interest-bearing liabilities
Interest-bearing loans form part of the financial liabilities (see accounting policy 13), except for lease liabilities (see accounting policy 22c).
(22a) Financing preference share capitalPreference share capital is classified as a liability because the dividend payments are not discretionary. Dividends on preference share capital are recognised as interest expense in the statement of profit or loss..
(22b) LoansInterest-bearing loans are initially recognised at fair value less attributable transaction costs. Any difference between the amortised cost and the redemption amount calcula-ted by the effective interest method is recognised in the statement of profit or loss over the term of each such loan.
(22c) Lease liabilitiesOn the commencement date of the lease, the Group measures the liability at the net present value of the fixed lease payments that have not yet been made as at that date. These include lease payments (including in-substance fixed lease payments) less lease incentives still to be received, variable lease payments depending on an index or rate and amounts expected to be payable under residual value guarantees. The lease payments also include the purchase option price if it is reasonably certain that the Group will exercise this option. The lease payments also include the penalties for termination of the lease if the lease period reflects the exercise by the

154 Heijmans Annual Report 2020
FINANCIAL STATEMENTS
Accounting principles
Group of an option to terminate the lease. Variable lease payments not depending on an index or rate are expensed in the period in which the event or circumstance giving rise to these payments occurs. In calculating the net present value of the lease pay-ments, the Group makes use of the incremental bor-rowing rate if the interest rate implicit in the lease cannot be readily determined. After the commencement date, the liability is increased in respect of interest and reduced by the lease payments made. The Group re-measures the liability in the event of a change in the lease agreement, an adjustment of the lease period, a review of an in-substance fixed lease payment or a change in the assessment thereof or use is made of a purchase option.
(23) Employee benefits
(23a) Defined-contribution plansCommitments for contributions to defined-contribution pension plans are recognised as an expense in the statement of profit or loss when they are due.
(23b) Defined-benefit plansThe Group’s net obligation in respect of defined-benefit pension plans is calculated separately for each plan by estimating the amount of future pension benefit that employees have earned in return for their service in the reporting period and in previous periods. The discounted present value of these pension benefits is determined, and is reduced by the fair value of the plan assets. The discount rate is the yield at the reporting date on high-quality corporate bonds that have terms to maturity approximately the same as the terms of the Group’s liabilities. The calculation is performed by a qualified actuary using the projected unit credit method. This method takes into account future salary increases resulting from employee career opportunities and general salary increases, including adjustments for inflation.
If the entitlements under a plan are changed, or a plan is curtailed, the resulting change in entitlements relating to past service, or the gain or loss on the closure, as the case may be, is recognised directly in the statement of profit or loss.
Actuarial gains and losses are recognised directly as other comprehensive income that will never be reclassified to the statement of profit or loss.
If the result of the calculation is a potential asset for the Group, recognition of the asset is limited to the present value of the economic benefits available as possible future
refunds from the plan or lower future contributions. When calculating the present value of the economic benefits, possible minimum financing obligations that apply are taken into account.
(23c) Long-term employee benefitsThe Group’s net liability in respect of long-term employee benefits, other than pension plans, is the amount of future benefits that employees have accrued in return for their service in the reporting period and in previous periods, such as long-service payments, bonuses and incentives. The liability is calculated using the projected unit credit method and is discounted to determine its present value. The discount rate is the yield at the reporting date on high-quality corporate bonds that have terms to maturity approximately the same as the terms of the Group’s liabilities. Actuarial gains and losses on these benefits are recognised in the statement of profit or loss.
(23d) Severance paymentsSeverance payments are recognised as an expense if the Group has shown that it is committed to terminating the employment contract of an employee or group of employees before the normal retirement date, by producing a detailed, formal plan, without there being a realistic option of the plan being withdrawn.
(24) Provisions
A provision is recognised in the statement of financial position if the Group has a present legal or actual liability that is the result of a past event and it is probable that its settlement will require an outflow of funds. Provisions are determined by discounting the expected future cash flows at a pre-tax discount rate that reflects current market assessments of the time value of money and, where necessary, the risks specific to the liability. The accrued interest on provisions is treated as a financing charge.
(24a) WarrantiesA provision for warranties is recognised after the underly-ing products or services have been sold and delivered. The provision is made for costs that must be incurred to correct deficiencies that appear after delivery but during the warranty period.
(24b) RestructuringA restructuring provision is recognised (i) when the Group has approved a detailed and formal restructuring plan and (ii) the restructuring has either commenced or been publicly announced.
155Heijmans Annual Report 2020
FINANCIAL STATEMENTS
Accounting principles
(24c) EnvironmentA provision for restoration of contaminated land is formed in accordance with the Group’s environmental policy and applicable legal requirements.
(24d) Onerous contractsA provision for onerous contracts is recognised if the economic benefits (i.e. the probable revenues) that the Group expects to receive from a contract are lower than the costs of meeting the contractual obligations, unless the net costs of terminating the contract are lower. For contracts concerning the execution of works, these costs are the costs attributable to the outstanding performance obligations. Where appropriate, the Group recognises impairment losses on any assets associated with the contract prior to forming the provision.
(25) Trade and other payables
Trade and other payables form part of the financial liabilities (see accounting policy 13). Trade and other payables are recognised at amortised cost.
(26) Work in progress credit
Work in progress liabilities relates to work yet to be performed for clients on projects for which the Group has received a consideration from the client (or the client owes an amount). In practical terms, the item comprises the invoiced instalments less the revenue in proportion to the progress in fulfilling the performance obligation (see also accounting policy 6). Total expected project losses, if any, are directly recognised as expenses in the relevant period and are accounted for in the statement of financial position in provisions (see also accounting policy 24d).
(27) Statement of cash flows
The statement of cash flows is prepared using the indirect method. The liquidity item in the statement of cash flows comprises cash and cash equivalents after deduction of current-account overdrafts that are repayable on demand.
(28) Segment reporting
A segment is a clearly distinguishable operation of the Group. The segments are identified in accordance with the classification used by the Executive Board when taking operational decisions. The Group distinguishes the following segments: Property Development, Building & Technology and Infra.

156 Heijmans Annual Report 2020
FINANCIAL STATEMENTS
Accounting principles
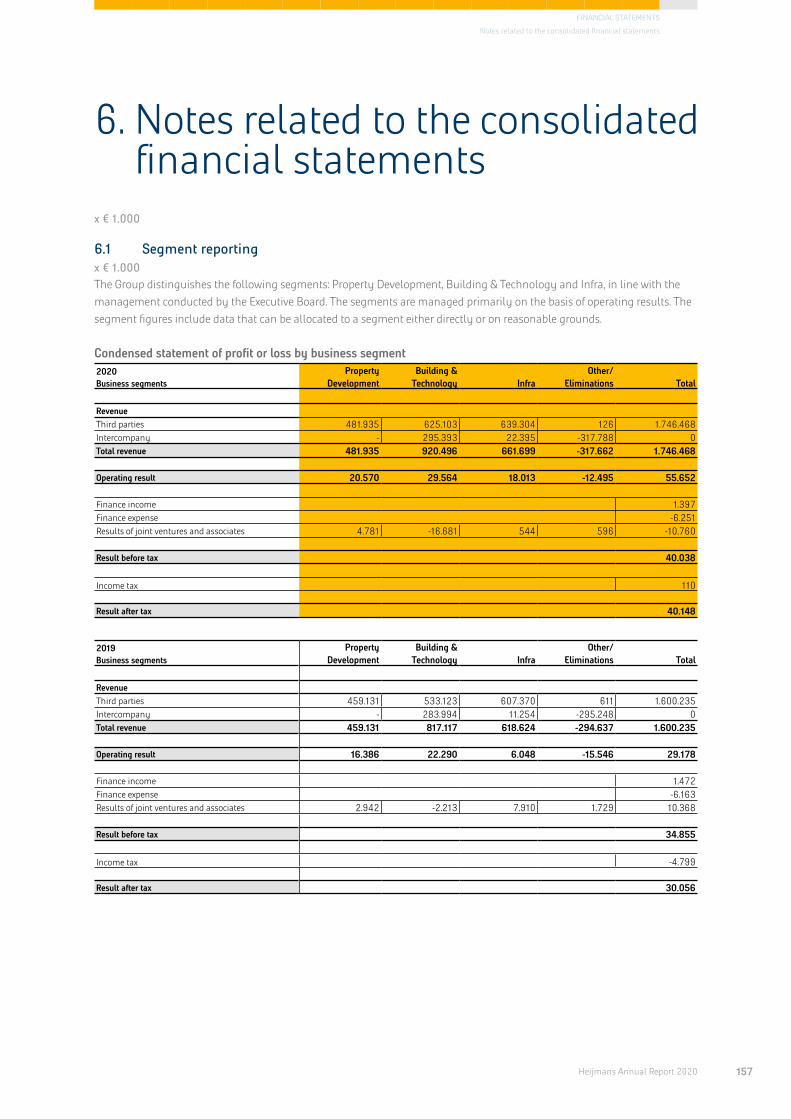
157Heijmans Annual Report 2020
FINANCIAL STATEMENTS
Notes related to the consolidated financial statements
x € 1.000
x € 1.000
6.1 Segment reporting
The Group distinguishes the following segments: Property Development, Building & Technology and Infra, in line with the management conducted by the Executive Board. The segments are managed primarily on the basis of operating results. The segment figures include data that can be allocated to a segment either directly or on reasonable grounds.
Condensed statement of profit or loss by business segment2020Business segments
Property Development
Building & Technology Infra
Other/Eliminations Total
RevenueThird parties 481.935 625.103 639.304 126 1.746.468Intercompany - 295.393 22.395 -317.788 0Total revenue 481.935 920.496 661.699 -317.662 1.746.468
Operating result 20.570 29.564 18.013 -12.495 55.652
Finance income 1.397Finance expense -6.251Results of joint ventures and associates 4.781 -16.681 544 596 -10.760
Result before tax 40.038
Income tax 110
Result after tax 40.148
2019Business segments
Property Development
Building & Technology Infra
Other/Eliminations Total
RevenueThird parties 459.131 533.123 607.370 611 1.600.235Intercompany - 283.994 11.254 -295.248 0Total revenue 459.131 817.117 618.624 -294.637 1.600.235
Operating result 16.386 22.290 6.048 -15.546 29.178
Finance income 1.472Finance expense -6.163Results of joint ventures and associates 2.942 -2.213 7.910 1.729 10.368
Result before tax 34.855
Income tax -4.799
Result after tax 30.056
6. Notes related to the consolidated financial statements
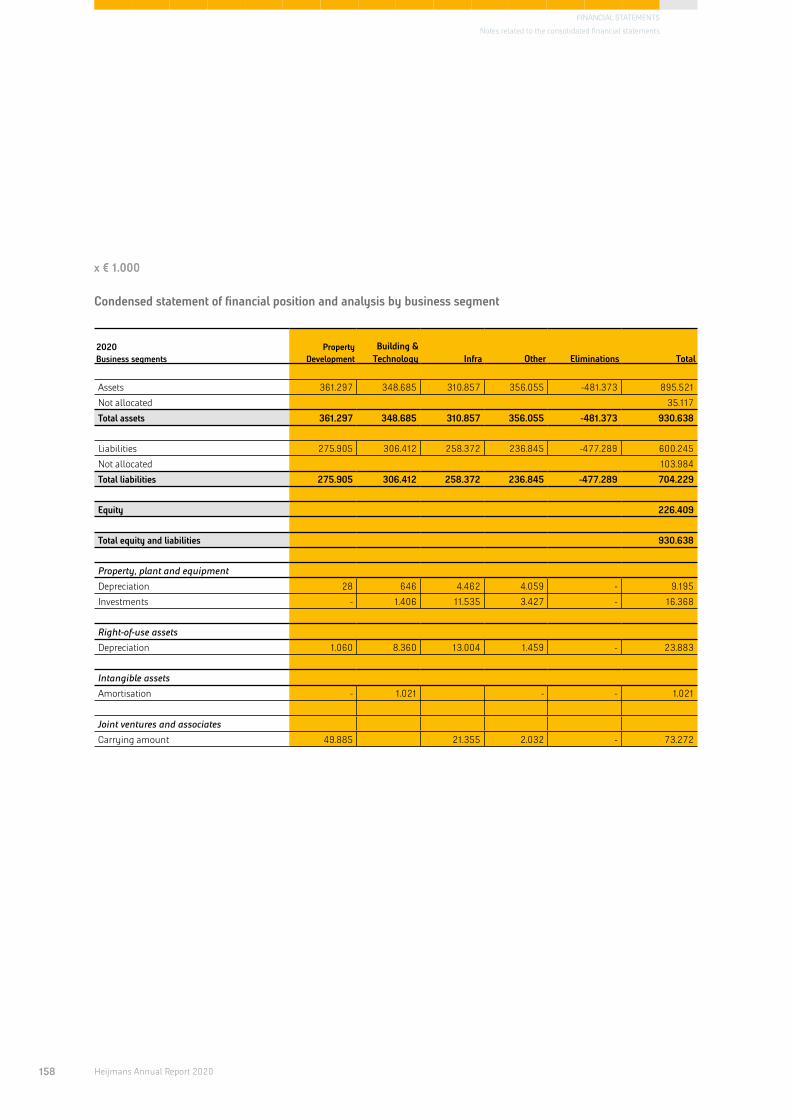
158 Heijmans Annual Report 2020
FINANCIAL STATEMENTS
Notes related to the consolidated financial statements
x € 1.000x € 1.000
Condensed statement of financial position and analysis by business segment
2020Business segments
Property Development
Building & Technology Infra Other Eliminations Total
Assets 361.297 348.685 310.857 356.055 -481.373 895.521
Not allocated 35.117
Total assets 361.297 348.685 310.857 356.055 -481.373 930.638
Liabilities 275.905 306.412 258.372 236.845 -477.289 600.245
Not allocated 103.984
Total liabilities 275.905 306.412 258.372 236.845 -477.289 704.229
Equity 226.409
Total equity and liabilities 930.638
Property, plant and equipment
Depreciation 28 646 4.462 4.059 - 9.195
Investments - 1.406 11.535 3.427 - 16.368
Right-of-use assets
Depreciation 1.060 8.360 13.004 1.459 - 23.883
Intangible assets
Amortisation - 1.021 - - 1.021
Joint ventures and associates
Carrying amount 49.885 21.355 2.032 - 73.272

159Heijmans Annual Report 2020
FINANCIAL STATEMENTS
Notes related to the consolidated financial statements
x € 1.000
2019Business segments
Property Development
Building & Technology Infra Other Eliminations Total
Assets 385.348 348.907 273.049 257.433 -399.782 864.955
Not allocated 33.440
Total assets 385.348 348.907 273.049 257.433 -399.782 898.395
Liabilities 320.449 315.712 240.453 140.536 -399.781 617.369
Not allocated 103.062
Total liabilities 320.449 315.712 240.453 140.536 -399.781 720.431
Equity 177.964
Total equity and liabilities 898.395
Property, plant and equipment
Depreciation 92 283 4.148 4.718 - 9.241
Investments - 1.260 6.876 2.872 - 11.008
Right-of-use assets
Depreciation 810 7.788 12.453 1.436 - 22.487
Intangible assets
Amortisation - 1.021 9 - - 1.030
Joint ventures and associates
Carrying amount 57.499 - 4.073 2.682 - 64.254
Transactions between business segments are conducted on arm’s length terms that are comparable to those for transacti-ons with third parties. Assets not allocated mainly concern deferred tax assets. Unallocated liabilities mainly concern interest- bearing loans and other financing commitments.
By the nature of its operations, the Infra segment is highly dependent on public sector contracts.
Revenue in 2020 and in 2019 was generated entirely in the Netherlands.
The non-current assets (PP&E) are chiefly located in the Netherlands.

160 Heijmans Annual Report 2020
FINANCIAL STATEMENTS
Notes related to the consolidated financial statements
x € 1.000
Underlying EBITDA by business segment
2020In € million
Property Development
Building & Technology Infra Other Total
Underlying EBITDA 29,7 24,7 36,7 -5,9 85,2
EBITDA of joint ventures -5,8 16,2 -0,2 -0,4 9,8
Write-down on property assets -2,2 -0,2 -2,4
Restructuring costs -1,1 -2,0 -0,4 -3,5
Result on contribution of assets to joint arrangement 1,0 -0,3 0,7
Total exceptional items -8,0 14,9 -1,2 -1,1 4,6
EBITDA 21,7 39,6 35,5 -7,0 89,8
Depreciation and amortisation -1,1 -10,0 -17,5 -5,5 -34,1
Operating result 20,6 29,6 18,0 -12,5 55,7
Write-downs on property assets related to the net effect of write-downs on certain land holdings and the profit on sale of a property.
2019In € million
Property Development
Building & Technology Infra Other Total
Underlying EBITDA 26,5 29,6 29,8 -7,6 78,3
EBITDA of joint ventures -3,7 3,0 -7,5 0,3 -7,9
Write-down on property assets -5,4 0,0 -5,4
Restructuring costs -0,1 -1,2 -1,2 -0,5 -3,0
Soil remediation -1,4 -1,4
Settlement sold subsidiaries 1,5 -0,1 1,4
Total exceptional items -9,2 1,8 -7,2 -1,7 -16,3
EBITDA 17,3 31,4 22,6 -9,3 62,0
Depreciation and amortisation -0,9 -9,1 -16,6 -6,2 -32,8
Operating result 16,4 22,3 6,0 -15,5 29,2
By underlying EBITDA, the Group is referring to earnings before interest, tax, depreciation and amortisation (equal to the operating result before depreciation/amortisation) including EBITDA of joint ventures and adjusted for any property write-down, restructuring costs, gains and losses on the sale of subsidiaries, any impairment losses on goodwill, release of pension indexation provisions and other non-operating results considered exceptional by the Group that are relevant in the above statement. The underlying EBITDA is also used as the basis of calculation for covenant reporting to the bank consortium.

161Heijmans Annual Report 2020
FINANCIAL STATEMENTS
Notes related to the consolidated financial statements
x € 1.000
6.2 Revenue
The disaggregation of revenue into categories that reflect the nature, the amount, the timing and the uncertainty of revenues and cash flows are affected by economic factors runs along the lines of the segment information by sector:
Revenue 2020 2019
Property Development 481.935 459.131
Building & Technology 920.496 817.117
Infra 661.699 618.624
Eliminations -317.662 -294.637
1.746.468 1.600.235
Property Development revenue mainly relates to revenue from residential and investment property projects developed by Heijmans for private buyers, of €296 million (approx. €283 million in 2019), and for property investors and housing associations together, of approximately €186 million (approx. €176 million in 2019), in general involving the delivery of both the land and the buildings. Projects for private buyers are usually not started until at least 70% has been sold. Invoicing of private buyers is according to the schedule adopted by the SWK (Stichting Waarborgfonds Koopwoningen - Owner-Occupied Housing Guarantee Fund) that is linked to predefined stages. The first installment is invoiced when title to the land is transferred. Construction work on projects for property investors and housing associations does not start before the sale has been completed. The invoicing schedule is agreed with each client and, as in the case of private buyers, is generally linked to the completion of stages, the first installment being invoiced upon conveyance of the land. The revenue from the land is recognised at the time of legal conveyance whereas the revenue from the buildings is recognised during the course of the construction period.
The revenue generated by Building & Technology mainly relates to the construction of housing and non-residential buildings and related installation work on behalf of clients in the private sector and the public or semi-public sector, amounting to approximately €657 million (approx. €596 million in 2019). Invoicing is according to a stage-based schedule, which may differ from one contract to another. Revenue is recognised during the course of the construction period. Other work involves service activities on clients’ buildings and installations. Revenue from these activities, of approximately €263 million (approx. €221 million in 2019), is recognised as and when this service and maintenance work takes place. A major client for the construction of residential property is Heijmans Property Development, representing internal sales that are eliminated. Construction only commences when orders have been confirmed.
The revenue generated by Infra mainly relates to the construction of roads and other civil engineering works on behalf of public authorities, of approximately €609 million (approx. €576 million in 2019). Construction only commences when orders have been confirmed. Invoicing is according to a stage-based schedule, which may differ from one contract to another. Revenue is recognised during the course of the construction period. Other work involves service and maintenance activities on pieces of infrastructure. Revenue from these activities, of approximately €47 million (approx. €39 million in 2019), is recognised as and when this service work takes place. Supplies of asphalt are also made to third parties, the revenue from which, of approximately €6 million (€4 million in 2019), is recognised at the time of delivery.

162 Heijmans Annual Report 2020
FINANCIAL STATEMENTS
Notes related to the consolidated financial statements
In 2020, revenue totalling €154 million (2019: €142 million) was recognised and this amount was included in work in progress liabilities as at 1 January.
In 2020, revenue totalling €2 million (2019: €1 million) was recognised relating to performance obligations fulfilled in earlier periods.
The amount of the transaction price that has been attributed to performance obligations that have not been fulfilled (in whole or in part) is approximately €1.9 billion (2019: €1.9 billion). Of this, approximately 56% will be fulfilled in 2021, 22% in the period 2022 and 2023 and 22% in 2024 and beyond (2019: approximately 54% in 2020, 25% in the period 2021 and 2022 and 21% in 2023 and beyond). The disclosed amounts concern contracted revenue and do not include any revenue that is not highly probable. Revenue generated by contracts for which the unit price but not the volumes has been agreed have been included in the disclosed amounts. The Group has not made use of the practical posibility of not disclosing performance obligations forming part of a contract with an originally expected completion date of 12 months or less.
The Group has not adjusted revenue for significant financing components partly because the period between fulfilment of the performance obligations and payment by the client is less than one year.
6.3 Other operating income
Other operating income 2020 2019
Gain on sale of non-current assets 1.316 1.835
Miscellaneous 1.765 1.972
3.081 3.807
The gain on the sale of non-current assets relates to the sale of plant and equipment. This also relates to the gains of €1.1 million realised on the contribution of asphalt plants and other assets to the newly established joint venture AsfaltNu, in which the Group has a 50% interest. Miscellaneous includes fees for managing sold subsidiaries where the Group is, temporarily or permanently, still performing administrative activities.
x € 1.000x € 1.000

163Heijmans Annual Report 2020
FINANCIAL STATEMENTS
Notes related to the consolidated financial statements
6.4 Staff costs, depreciation, and research and development expenses
Staff costs included in the statement of profit or loss are broken down as follows:
Staff costs 2020 2019
Wages and salaries -312.427 -297.140
Compulsory social insurance contributions -46.331 -44.550
Defined-contribution plans -34.874 -31.649
Defined-benefit plans and long-service payments -1.027 -1.425
-394.659 -374.764
The statement of profit or loss includes an amount of approximately €3 million (2019 €3 million) relating to reorganisation provisions.
The number of employees at year-end 2019 was 4,833 (2019: 4,775).
The staff costs are included in the cost of sales and administrative expenses.
Depreciation and amortisation recognised in the statement of profit or loss is broken down as follows:
Depreciation 2020 2019
Depreciation of property, plant and equipment -9.195 -9.241
Depreciation of right-of-use assets -23.883 -22.487
Amortisation of intangible assets -1.021 -1.030
-34.099 -32.758
Depreciation of property, plant and equipment and right-of-use assets is included in the cost of sales and administrative expenses. Amortisation of intangible assets is recognised under other operating expenses.
The costs for research and development recognised in the statement of profit or loss are:
Research & development costs 2020 2019
-10.381 -5.831
Project work also involves research and development activities, which are reflected in the cost of sales. The costs relating to these activities are not included in the figures stated above.Research and development expenses increased as a result of the strategic deployment of innovation.
x € 1.000

164 Heijmans Annual Report 2020
FINANCIAL STATEMENTS
Notes related to the consolidated financial statements
x € 1.000
6.5 Other operating expenses
Other operating expenses are broken down as follows:
Other operating expenses 2020 2019
Amortisation of intangible assets -1.021 -1.030
-1.021 -1.030
The amortisation of intangible assets mainly concerns the amortisation of the customer base.
6.6 Finance income and expense
The net financing income and expense is broken down as follows:
Finance income and expense 2020 2019
Interest income 1.397 1.472
Finance income 1.397 1.472
Interest expense -5.359 -5.501
Interest expense on lease liabilities -2.488 -2.357
Capitalised financing costs 1.596 1.695
Finance expense -6.251 -6.163
-4.854 -4.691
The net finance expense for 2020 amounts to €4.9 million, which is €0.2 million higher than the €4.7 million for 2019. Although the syndicated loan facility was not utilised at all during the year, commitment fees still applied. For a summary of the interest rates, see note 6.21.
The interest and development costs for land holdings that are under development are capitalised. The applicable interest rate that is used for capitalisation is 3.0% for 2020 (2019: 3.0%). No interest has been capitalised on projects under construction.

165Heijmans Annual Report 2020
FINANCIAL STATEMENTS
Notes related to the consolidated financial statements
x € 1.000
6.7 Income tax
Recognised in profit or loss 2020 2019
Current tax charges or credits
Current financial year -17 0
Prior financial years -137 0
-154 0
Deferred tax charges or credits
Relating to temporary differences -2.161 -207
Relating to tax loss carryforwards 2.425 -4.592
Relating to the write-off of a deferred tax asset (charge) or to the reversal of a write-off (credit) 0 0
264 -4.799
Total tax charge in the statement of profit or loss 110 -4.799
The tax charges by country are as follows:
2020 2019
Netherlands 242 -5087
Belgium -17 -
Germany -115 288
110 -4.799

166 Heijmans Annual Report 2020
FINANCIAL STATEMENTS
Notes related to the consolidated financial statements
x € 1.000
Analysis of the effective tax rate2020 2019
% € % €
Result before tax 40.038 34.855
Based on local tax rate 25,0% -10.010 25,0% -8.714
Non-deductible interest 1,9% -773 2,3% -813
Non-deductible expenses, other 0,9% -377 1,2% -435
Non-taxable revenue in results of investees 7,1% -2.857 -5,1% 1.773
Losses not recognised in current financial year and other deferred tax assets and the reversals thereof 0,3% -111 1,1% -374
Effect of changes in the tax rate -2,7% 1.089 -3,6% 1.251
Effect of recognising previously unrecognised losses -33,4% 13.390 -7,5% 2.597
Effect of foreign tax rates/ miscellaneous 0,6% -241 0,2% -84
Overall tax burden -0,3% 110 13,8% -4.799
The effective tax rate for 2020 is 0.3% negative (2019: 13.8%).
The main differences between the effective tax rate and the local tax rate in the Netherlands concern the non-deductible interest expense relating to the cumulative preference financing shares B, the general restrictions on the deductibility of expenses in the various jurisdictions, the tax exempt results from investees and the non-recognition of current-year losses (chiefly outside the Netherlands) coupled with the recognition of previously unrecognised losses of the Dutch tax group.
6.8 Income tax receivables and payables
31 december 2020 31 december 2019
Geographical segment Receivables Payables Receivables Payables
Netherlands 200 0 0 0
Belgium 0 0 0 225
Germany - 108 - 109
200 108 0 334
Income tax receivables relate to outstanding income tax claims for financial years that have not yet been settled and for which excessive provisional assessments were paid. Income tax payables relate to outstanding income tax payments for financial years that have not yet been settled, supplemental to income tax assessments already paid, and taking account of applicable loss relief rules.

167Heijmans Annual Report 2020
FINANCIAL STATEMENTS
Notes related to the consolidated financial statements
x € 1.000
6.9 Property, plant and equipment
Land & buildings
Machinery, installations
and large-scale equipment
Other capital assets
Assets under construction Total
Cost
Balance at 1 January 2019 54.330 74.558 43.423 1.924 174.235
Investments 2.127 5.363 3.050 468 11.008
Disposals -1.993 -6.979 -2.697 0 -11.669
Reclassifications 0 131 405 -536 0
Balance at 31 December 2019 54.464 73.073 44.181 1.856 173.574
Balance at 1 January 2020 54.464 73.073 44.181 1.856 173.574
Investments 2.420 7.772 2.937 3.239 16.368
Disposals -934 -22.641 -2.362 0 -25.937
Reclassifications 20 -206 108 -357 -435
Balance at 31 December 2020 55.970 57.998 44.864 4.738 163.570
Depreciation and impairment losses
Balance at 1 January 2019 38.327 59.804 32.142 0 130.273
Depreciation 1.775 3.318 4.148 0 9.241
Disposals -482 -6.323 -1.101 0 -7.906
Balance at 31 December 2019 39.620 56.799 35.189 0 131.608
Balance at 1 January 2020 39.620 56.799 35.189 0 131.608
Depreciation 1.789 3.636 3.770 0 9.195
Disposals 0 -19.895 -2.073 0 -21.968
Reclassifications -7 -512 48 0 -471
Balance at 31 December 2020 41.402 40.028 36.934 0 118.364
Carrying amount
At 1 January 2019 16.003 14.754 11.281 1.924 43.962
At 31 December 2019 14.844 16.274 8.992 1.856 41.966
At 1 January 2020 14.844 16.274 8.992 1.856 41.966
At 31 December 2020 14.568 17.970 7.930 4.738 45.206
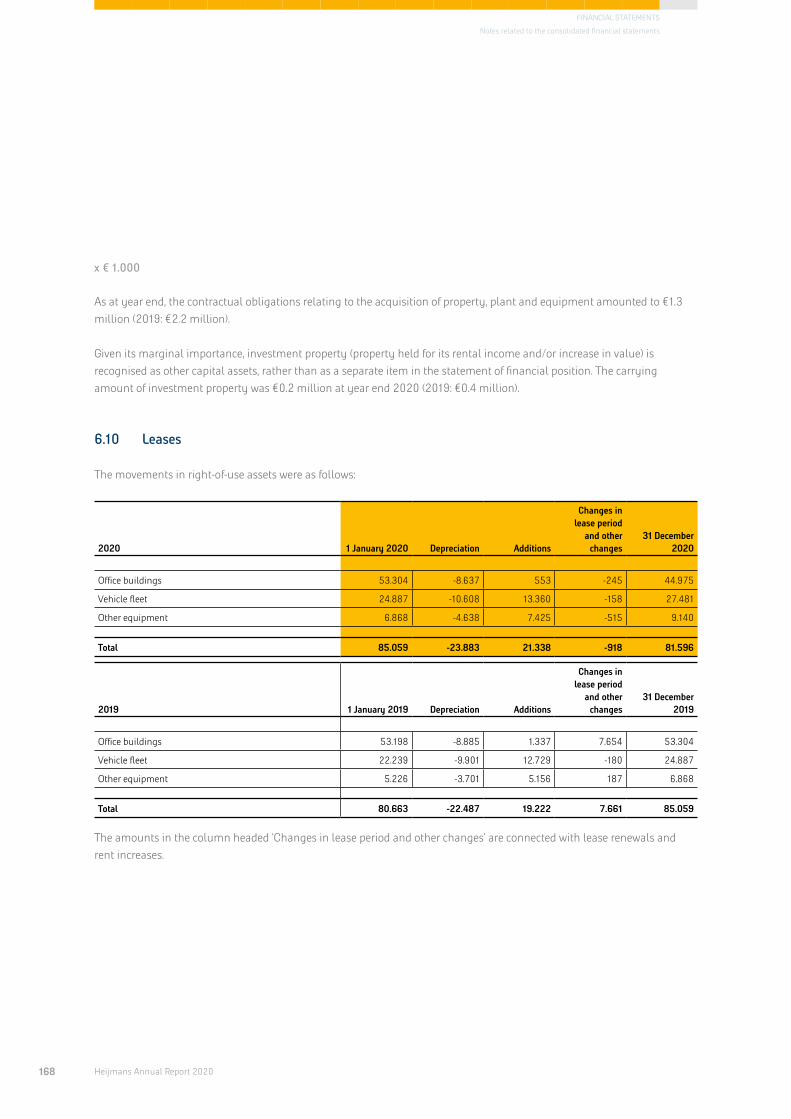
168 Heijmans Annual Report 2020
FINANCIAL STATEMENTS
Notes related to the consolidated financial statements
x € 1.000
As at year end, the contractual obligations relating to the acquisition of property, plant and equipment amounted to €1.3 million (2019: €2.2 million).
Given its marginal importance, investment property (property held for its rental income and/or increase in value) is recognised as other capital assets, rather than as a separate item in the statement of financial position. The carrying amount of investment property was €0.2 million at year end 2020 (2019: €0.4 million).
6.10 Leases
The movements in right-of-use assets were as follows:
2020 1 January 2020 Depreciation Additions
Changes in lease period
and other changes
31 December 2020
Office buildings 53.304 -8.637 553 -245 44.975
Vehicle fleet 24.887 -10.608 13.360 -158 27.481
Other equipment 6.868 -4.638 7.425 -515 9.140
Total 85.059 -23.883 21.338 -918 81.596
2019 1 January 2019 Depreciation Additions
Changes in lease period
and other changes
31 December 2019
Office buildings 53.198 -8.885 1.337 7.654 53.304
Vehicle fleet 22.239 -9.901 12.729 -180 24.887
Other equipment 5.226 -3.701 5.156 187 6.868
Total 80.663 -22.487 19.222 7.661 85.059
The amounts in the column headed ‘Changes in lease period and other changes’ are connected with lease renewals and rent increases.

169Heijmans Annual Report 2020
FINANCIAL STATEMENTS
Notes related to the consolidated financial statements
x € 1.000
The movement in the lease liabilities was as follows:
2020 1 January 2020 AdditionsLease
payments Interest
Changes in lease period
and other changes
31 December 2020
Office buildings 54.649 553 -12.375 1.494 -446 43.875
Vehicle fleet 25.191 13.360 -10.955 694 -330 27.960
Other equipment 6.762 7.425 -5.055 300 -144 9.288
Total 86.602 21.338 -28.385 2.488 -920 81.123
2019 1 January 2019 Additions Repayments Interest
Changes in lease period
and other changes
31 December 2019
Office buildings 53.458 1.337 -9.267 1.467 7.654 54.649
Vehicle fleet 22.059 12.729 -10.215 618 0 25.191
Other equipment 4.964 5.156 -3.861 272 231 6.762
Totaal 80.481 19.222 -23.343 2.357 7.885 86.602
The maturity of the lease liabilities (based on due dates of the lease instalments) per category of underlying asset can be analysed as follows:
31 december 2020
Total lease instalments
payable < 1 year 1-5 years > 5 year
Office buildings 49.043 6.737 26.476 15.830
Vehicle fleet 29.078 10.487 18.460 131
Other equipment 10.009 3.898 5.454 657
Total 88.130 21.122 50.390 16.618
31 december 2019
Total lease instalments
payable < 1 year 1-5 years > 5 year
Office buildings 62.518 9.587 30.856 22.075
Vehicle fleet 26.207 9.501 16.620 86
Other equipment 7.161 3.921 3.056 184
Total 95.886 23.009 50.532 22.345
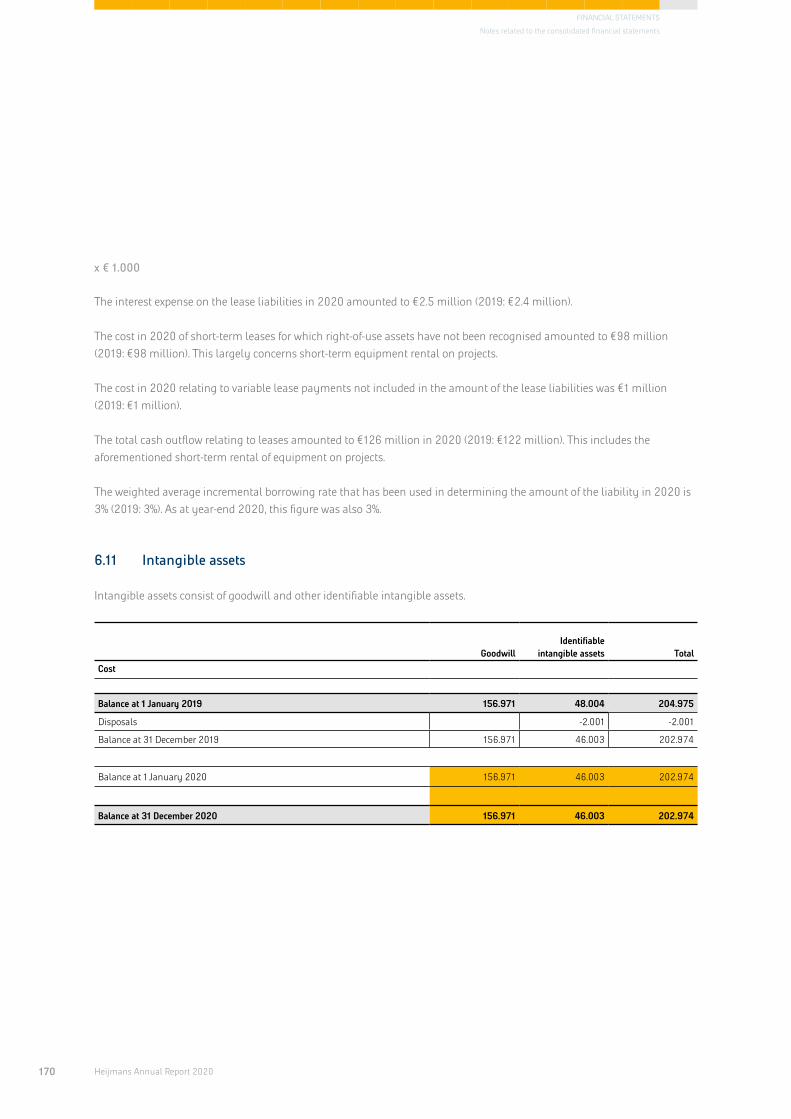
170 Heijmans Annual Report 2020
FINANCIAL STATEMENTS
Notes related to the consolidated financial statements
x € 1.000
The interest expense on the lease liabilities in 2020 amounted to €2.5 million (2019: €2.4 million).
The cost in 2020 of short-term leases for which right-of-use assets have not been recognised amounted to €98 million (2019: €98 million). This largely concerns short-term equipment rental on projects.
The cost in 2020 relating to variable lease payments not included in the amount of the lease liabilities was €1 million (2019: €1 million).
The total cash outflow relating to leases amounted to €126 million in 2020 (2019: €122 million). This includes the aforementioned short-term rental of equipment on projects.
The weighted average incremental borrowing rate that has been used in determining the amount of the liability in 2020 is 3% (2019: 3%). As at year-end 2020, this figure was also 3%.
6.11 Intangible assets
Intangible assets consist of goodwill and other identifiable intangible assets.
GoodwillIdentifiable
intangible assets Total
Cost
Balance at 1 January 2019 156.971 48.004 204.975
Disposals -2.001 -2.001
Balance at 31 December 2019 156.971 46.003 202.974
Balance at 1 January 2020 156.971 46.003 202.974
Balance at 31 December 2020 156.971 46.003 202.974

171Heijmans Annual Report 2020
FINANCIAL STATEMENTS
Notes related to the consolidated financial statements
x € 1.000
Impairment losses and amortisation GoodwillIdentifiable
intangible assets Total
Balance at 1 January 2019 88.581 37.732 126.313
Amortisation - 1.030 1.030
Balance at 31 December 2019 88.581 38.762 127.343
Balance at 1 January 2020 88.581 38.762 127.343
Amortisation - 1.021 1.021
Balance at 31 December 2020 88.581 39.783 128.364
Carrying amountGoodwill
Identifiable intangible assets Total
At 1 January 2019 68.390 10.272 78.662
At 31 December 2019 68.390 7.241 75.631
At 1 January 2020 68.390 7.241 75.631
At 31 December 2020 68.390 6.220 74.610
The composition of the carrying amount for goodwill and other intangible assets at year-end 2020 is as follows:
Acquisition
2020 2019
GoodwillIdentifiable
intangible assets GoodwillIdentifiable
intangible assets
IBC (Nl-2001) 21.207 - 21.207 -
Burgers Ergon (Nl-2007) 31.107 6.220 31.107 7.241
Other 16.076 - 16.076 -
Carrying amount at 31 December 68.390 6.220 68.390 7.241
Other mainly refers to the Infra as cash-generating unit (€13 million). The remaining amortisation term for the intangible asset that was part of the Burgers Ergon acquisition is 6 years.
The amortisation of the other intangible assets is recognised in the statement of profit or loss under other operating expenses.
Goodwill is tested annually for impairment, based on the relevant cash-generating unit. For an explanation of the calcula-tion of the recoverable amount, reference is made to the accounting policies.

172 Heijmans Annual Report 2020
FINANCIAL STATEMENTS
Notes related to the consolidated financial statements
x € 1.000
The impairment tests are based on the value in use calculated by means of the discounted cash flow method. The pre-tax WACC (weighted average cost of capital) used for this calculation amounts to 10.3% (2019: 11.4%), corresponding to a discount rate after tax of 7.8% (2019: 8.8%). The WACC figure used has been arrived at in the same way as it was prior to IFRS 16. The cash flows are unaffected by IFRS 16. In calculating the carrying amount of the cash-generating unit, IFRS 16 has likewise been disregarded.
The value in use of the cash-flow generating business units is based on their expected future cash flows. The period adopted to determine the present value of cash flows is indefinite. In the determination of future cash flows, the medium-term planning for the relevant cash-flow generating unit is used. The assumptions underlying the medium-term planning are partly based on historical experience and external information sources. The medium to long-term planning generally covers a period of 5 years. Cash flows after 5 years are extrapolated using a growth rate of 0% (2019: 1.5%).
The recoverable amount calculated for the impairment test depends among other things on the growth rate used and the period over which the cash flows are realised. Other important variables are the expected revenue growth, probable margins and working capital requirements.
The expected cash flows are discounted using a pre-tax WACC of 10.3%. If the pre-tax WACC were 1 percentage point higher, this would not result in an impairment. Cash flows beyond 5 years are extrapolated without growth percentages. Changes that can reasonably be expected in key variables, including possible uncertainties arising from Covid-19 and the nitrogen problem, do not result in an impairment.
In 2020, the cash-flow generating unit to which the goodwill and other intangible assets of Burgers Ergon and the IBC goodwill were allocated was changed from the Non-Residential business unit to the Building & Technology segment. Previously, segmentation was according to Non-Residential and Residential. These two segments were combined to Building & Technology as from the beginning of 2018. The goodwill and other intangible assets referred to are monitored at segment level. The increasing integration of these business segments as from 2020 means that long-term cash flow projections are now only made at Building & Technology level. The cash-flow generating unit has accordingly been changed to Building & Technology for the goodwill impairment test.

173Heijmans Annual Report 2020
FINANCIAL STATEMENTS
Notes related to the consolidated financial statements
x € 1.000
6.12 Joint ventures and associates
The interests in joint ventures and investments in associates included in the statement of financial position breaks down as follows:
2020 2019
Joint ventures 69.263 60.069
Associates 4.009 4.185
73.272 64.254
Joint venturesThe reconciliation of the Group’s interests in joint ventures, as recognised in the statement of financial position, including equity is shown below.
2020 2019
Interest in the capital of Property Development joint ventures 49.885 57.500
Interest in the capital of other joint ventures 12.342 -2.330
62.227 55.170
Negative asset values recognised in other provisions 7.036 4.899
69.263 60.069
The amounts presented below are the Group’s shares in the results of joint ventures:
2020 2019
Share of the net result of Property Development joint ventures 4.781 2.952
Share of the net result of other joint ventures -15.921 6.917
-11.140 9.869
Much of the loss was project losses in joint ventures. These losses were largely made up by capital contributions.
The property development joint ventures in which the Group participates achieved revenue of €42 million in 2020 (2019: €36 million). In total, they have inventories of €83 million (2019: €98 million), mainly in the form of a land holding. The aforementioned amounts relate to the Group’s share. ‘Other joint ventures’ include projects carried out on a consortium basis and in addition an asphalt joint venture (AsfaltNu). In a number of joint ventures, there are limits on the payout of dividends, often depending on the preference specified for repayment of the debts of the joint ventures concerned.

174 Heijmans Annual Report 2020
FINANCIAL STATEMENTS
Notes related to the consolidated financial statements
x € 1.000
The Group has undertaken commitments to joint ventures totalling €1 million (2019: €3 million) relating to the granting of subordinated loans if certain conditions are met. Apart from the commitments and contingent liabilities disclosed in notes 6.21, 6.26, 6.27 and 6.28, the Group has no commitments or contingent liabilities relating to joint ventures.
AssociatesThe amounts shown below concern the interests of the Group in the equity and results of associates:
2020 2019
Interests in the equity of associates 4.009 4.185
Interests in the net results of associates 380 499
6.13 Verstrekte leningen aan joint ventures
2020 2019
Loans granted to joint ventures 22.661 30.986
Other long-term lending 719 310
Balance at 31 December 23.380 31.296
An amount of €0 million (2019: €3 million) of the loans granted falls due within 1 year, €1 million between 1 and 5 years (2019: €7 million) and €22 million maturing after more than 5 years, including those with indefinite maturity (2019: €21 million). The weighted average interest rate is approximately 2.2% (2019: 2.6%). The loans are repayable and are secured by pledged assets and by cash flows from projects being carried on by the joint ventures concerned. An appraisal has been made of the expected credit losses on the loans granted. There were no implications for the carrying amounts.

175Heijmans Annual Report 2020
FINANCIAL STATEMENTS
Notes related to the consolidated financial statements
x € 1.000
6.14 Deferred tax assets and liabilities
The net amount of the deferred tax assets and liabilities relating to temporary differences between the carrying amounts for tax purposes and for reporting purposes of items in the statement of financial position, together with recognised tax-loss carryforwards, can be broken down as follows:
Receivables31 december
Payables31 december
Net amount31 december
2020 2019 2020 2019 2020 2019
Property, plant and equipment 493 267 0 493 267
Right-of-use assets 21.014 19.376 20.399 19.036 615 340
Intangible assets - - 1.543 1.594 -1.543 -1.594
Employee benefits 3.377 3.370 0 3.377 3.370
Provisions 45 315 - - 45 315
Recognised tax-loss carryforwards 31.718 29.293 - - 31.718 29.293
Deferred tax assets and liabilities 56.647 52.621 21.942 20.630 34.705 31.991
Set-off of deferred tax assets and liabilities -21.942 -20.630 -21.942 -20.630 - -
Net deferred tax assets and liabilities 34.705 31.991 0 0 34.705 31.991
The movement in the statement of financial position of the deferred tax assets and liabilities in 2020 breaks down as follows:
Net amount at 31 December 2019
Recognised in income tax
Recognised in other comprehensive
income Net amount at 31
December 2020
Property, plant and equipment 267 226 - 493
Right-of-use assets/lease liabilities 340 275 615
Intangible assets -1.594 51 - -1.543
Employee benefits 3.370 -2.443 2.450 3.377
Other items 315 -270 - 45
Recognised tax-loss carryforwards 29.293 2.425 - 31.718
Total 31.991 264 2.450 34.705

176 Heijmans Annual Report 2020
FINANCIAL STATEMENTS
Notes related to the consolidated financial statements
x € 1.000
The movement in the statement of financial position of the deferred tax assets and liabilities in 2019 breaks down as follows:
Net amount at 31 December 2018
Recognised in income tax
Recognised in other comprehensive
income Net amount at 31
December 2019
Property, plant and equipment -146 413 - 267
Right-of-use assets/lease liabilities 0 340 340
Intangible assets -1.829 235 - -1.594
Employee benefits 2.973 -1.060 1.457 3.370
Other items 445 -130 - 315
Recognised tax-loss carryforwards 33.890 -4.597 - 29.293
Total 35.333 -4.799 1.457 31.991
Measurement of deferred tax assetsAt year-end 2020, the recognised loss carry forward was €32 million (2019: €29 million), which relates to the loss carryfor-ward of the Dutch tax group. The utilisation of tax loss carryforwards is expected to change and it will become possible to carry forward all losses indefinitely. In future, it will be possible to set off losses indefinitely against up to 50% of taxable profits over €1 million. As the legislative process for these rules on the future treatment of tax losses was not considered finalised as at 31 December 2020, they have not been reflected in the losses recognised as at 31 December 2020. Under the new loss relief rules, it has only been possible from the financial year 2022 to utilise 50% of profits above €1 million against past losses and this is having a short-term adverse impact on the cash outflow related to corporate income tax. Against this, from the financial year 2022 it will be possible under the new loss relief rules to carry forward all losses against future profits indefinitely and in the long term this will have a net positive effect on the cash outflow related to corporate income tax.
Under the existing rules, the Dutch tax group’s currently recognised tax losses from prior years are subject to a loss carryforward period of 9 years. A deferred tax asset is recognised to the extent that it is probable, based on forecasts, that sufficient future taxable profits will be available that can be utilised towards realising the deferred asset. The losses in 2016 and prior years relate to a relatively small number of large, problem projects. Measures have been taken to prevent such losses in future. Most of the activities perform according to plan. The forecasts are based on the order book, the 2021 business plan, and the long-term forecast. These also underlie the measurement of the recoverable amount of goodwill (impairment tests). For the long-term forecast, the average EBIT margin of the Dutch tax group is assumed to grow to approximately 3% of revenue (2019: approx. 3%). The remaining period of 9 years in which the tax losses can be utilised extends beyond the current forecast period of 3 years: 2021–2023 (2019: 3 years). A factor inherent in the measurement of the deferred tax assets is that the utilisation of losses depends on the realisation of the 2021 business plan and the long-term forecasts, which are the Group’s best estimates. The medium-term planning reflects possible uncertainties arising from Covid-19 and the nitrogen problem.

177Heijmans Annual Report 2020
FINANCIAL STATEMENTS
Notes related to the consolidated financial statements
x € 1.000
6.15 Inventories
31 december 2020 31 december 2019
Strategic land holdings 126.415 110.028
Residential property in preparation and under construction 72.271 84.620
Raw materials and consumables 8.868 8.735
Finished products 7.833 1.188
Total 215.387 204.571
Carrying amount of inventories pledged as security 58.537 66.494
Based on the projected results for the years 2021-2023 and the current and future tax rate of 25%, there will be sufficient taxable profits over the next few years to enable the tax asset recognised as at 31 December 2020 to be realised.
Part of the impact of the change in tax in the Netherlands rates has been accounted for in the income statement and part through other comprehensive income, depending on the way in which specific items were recognised in previous years.
Measurement of deferred tax liabilities For determining the amount of the deferred tax liabilities, the value for tax purposes of the construction work in progress in the Netherlands (including residential building projects) is treated as being equal to the value under IFRS. Deferred tax assets or liabilities are recognised for any temporary differences originating at subsidiaries, joint operations or joint ventures. No deferred tax assets or liabilities have been recognised for temporary differences arising from investments in associates in view of their relative insignificance.
The majority of the deferred tax liabilities have a term of more than one year.
Tax losses not recognised in the statement of financial positionAt year-end 2020, the tax-deductible losses of the Heijmans NV tax group amounted to €163.4 million (2019: €220.5 million). €2.4 million relates to 2014, €43.1 million to 2015, and €117.9 million to 2016. Out of the total, €35.9 million (2019: €88.8 million) has not been recognised. At year-end 2020, the other tax losses not recognised in the statement of financial position amounted to €42.1 million (2019: €41.6 million). These relate primarily to one German and two Belgian subsidiaries that conduct no operations.

178 Heijmans Annual Report 2020
FINANCIAL STATEMENTS
Notes related to the consolidated financial statements
x € 1.000
Strategic land holdingsThe strategic land holdings are measured at cost or net realisable value if lower. The net realisable value of these holdings may be either the direct realisable value or the indirect realisable value. The net realisable value depends on the expected manner and time horizon of realisation and in most cases, therefore, is measured using an indirect realisable value method. The indirect realisable value is the estimated selling price in the ordinary course of business less the estimated costs of completion and the estimated costs necessary to make the sale, the expected cash flows usually being discounted to net present value using a discount rate of 5% unless a different rate has been agreed, for example on the basis of favourable financing arrangements available within a joint undertaking. In fixing the discount rate, account is taken of the expected capital structure, operational risks and specific circumstances affecting Heijmans or the project concerned.
Determining the indirect realisable value involves the use of judgements and estimates. The strategic land holdings are affected by several elements of uncertainty, such as demographic changes, location and details and implementation of development plans and administrative decisions, with as local a focus as possible. This provides a location-specific forecast of developments in land and house prices and other variables, which ultimately determine the indirect revenue value of the land holdings. The Group makes a comprehensive internal assessment of the value of its land holdings twice a year.
In general, the risk of deviations from the judgements and estimates is greater for strategic land holdings without planning permission than for those with. Moreover, this risk keeps increasing the longer the expected delay is before the start of development.
The net realisable value of the strategic land holdings was calculated in 2020 and compared with the carrying amount. This led to a write-down of €2.5 million (2019: write-downs totalling €5.4 million). The decreases in value are partly due to specific local conditions that have adversely affected the success of projects, time to completion, expected margins and the number of homes completed.
In principle, the strategic land holdings and the residential property in preparation and under construction have terms of more than 12 months after the reporting date (mostly 2 to 10 years). The other items in principle have a term of less than 12 months.
For more information on the pledging of land holdings in connection with the financing agreements, refer to note 6.21.
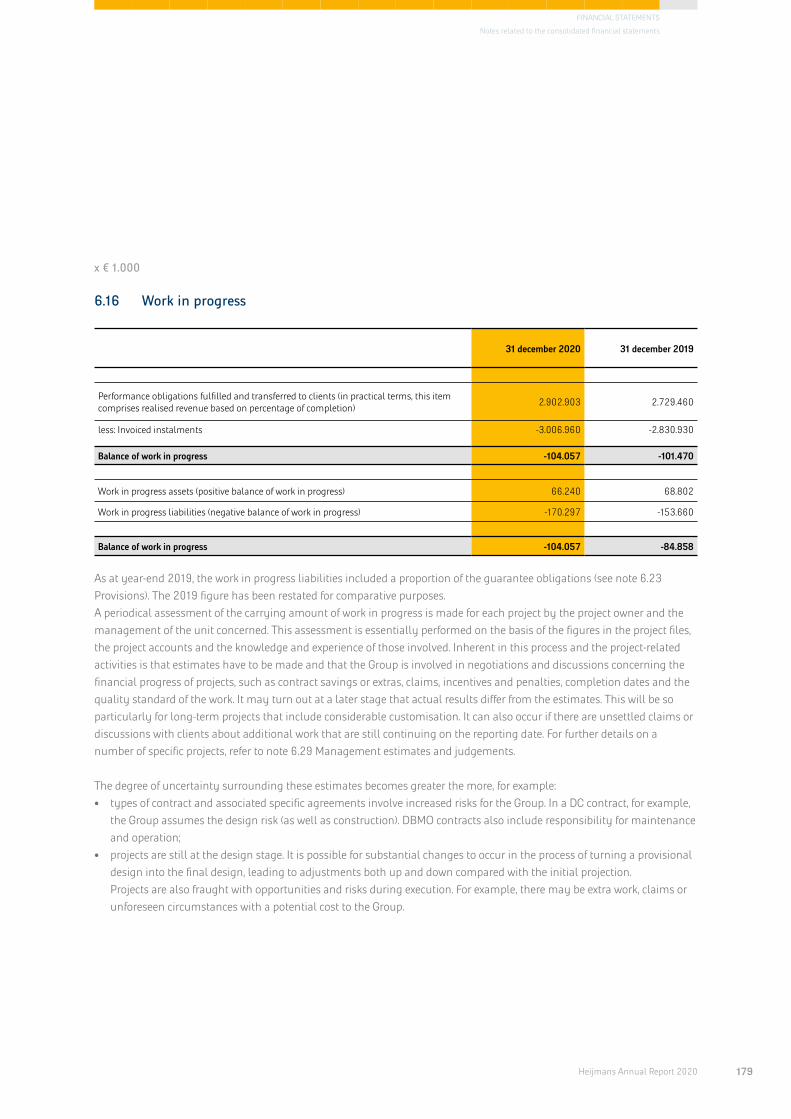
179Heijmans Annual Report 2020
FINANCIAL STATEMENTS
Notes related to the consolidated financial statements
x € 1.000
6.16 Work in progress
31 december 2020 31 december 2019
Performance obligations fulfilled and transferred to clients (in practical terms, this item comprises realised revenue based on percentage of completion) 2.902.903 2.729.460
less: Invoiced instalments -3.006.960 -2.830.930
Balance of work in progress -104.057 -101.470
Work in progress assets (positive balance of work in progress) 66.240 68.802
Work in progress liabilities (negative balance of work in progress) -170.297 -153.660
Balance of work in progress -104.057 -84.858
As at year-end 2019, the work in progress liabilities included a proportion of the guarantee obligations (see note 6.23 Provisions). The 2019 figure has been restated for comparative purposes.A periodical assessment of the carrying amount of work in progress is made for each project by the project owner and the management of the unit concerned. This assessment is essentially performed on the basis of the figures in the project files, the project accounts and the knowledge and experience of those involved. Inherent in this process and the project-related activities is that estimates have to be made and that the Group is involved in negotiations and discussions concerning the financial progress of projects, such as contract savings or extras, claims, incentives and penalties, completion dates and the quality standard of the work. It may turn out at a later stage that actual results differ from the estimates. This will be so particularly for long-term projects that include considerable customisation. It can also occur if there are unsettled claims or discussions with clients about additional work that are still continuing on the reporting date. For further details on a number of specific projects, refer to note 6.29 Management estimates and judgements.
The degree of uncertainty surrounding these estimates becomes greater the more, for example:• types of contract and associated specific agreements involve increased risks for the Group. In a DC contract, for example,
the Group assumes the design risk (as well as construction). DBMO contracts also include responsibility for maintenance and operation;
• projects are still at the design stage. It is possible for substantial changes to occur in the process of turning a provisional design into the final design, leading to adjustments both up and down compared with the initial projection. Projects are also fraught with opportunities and risks during execution. For example, there may be extra work, claims or unforeseen circumstances with a potential cost to the Group.
180 Heijmans Annual Report 2020
FINANCIAL STATEMENTS
Notes related to the consolidated financial statements
x € 1.000
Variable consideration is only recognised if it is highly probable that a significant revenue reversal will not occur:• Revenue from additional work is included in the overall contract revenue if the client has accepted the sum involved in
any way. • Claims and incentives are recognised in the amount for work in progress where they derive from enforceable rights, it is
highly probable that they will lead to revenue and can be reliably measured. • Unless it is highly unlikely that a penalty will be applied, the amount of any penalties will be deducted from the
revenue. Bonuses are recognised as revenue from work in progress if the project is far enough advanced and it is highly probable that the performance indicators specified will be met (and it is highly probable that no significant reversal will occur), and the bonus amount can be reliably determined. If the bonus can only be received after expiry of a predetermined period following completion of the project, then that bonus is only recognised when it is highly probable that the bonus will be received (and it is highly probable that no significant reversal will occur). Work in progress assets concern the right to consideration in respect of work on projects carried out and transferred to the client. As at year-end 2020, this item amounted to €66 million (2019: €69 million). Amounts in respect of expected credit losses have not been deducted.
Work in progress liabilities concerns the obligation to carry out work on projects for clients for which the Group has received a consideration from the client (or the client owes that amount). This means that in practice the invoiced instalments run ahead of the project revenue, so on balance the work is funded in advance by the client. As at year-end 2020, this item amounted to €170 million (2019: €154 million). The increase is mainly due to the fact that the level of this advance funding was relatively high on a number of projects as at year-end 2020.
Work in progress assets and liabilities generally have a term of less than 12 months. Work in progress assets and liabilities do not include any items of a material nature relating to marginal costs for securing or fulfilling a contract.

181Heijmans Annual Report 2020
FINANCIAL STATEMENTS
Notes related to the consolidated financial statements
x € 1.000
6.17 Trade and other receivables
31 december 2020 31 december 2019
Trade receivables 103.130 138.861
Amounts still to be invoiced on concluded projects 5.956 12.715
Receivables from joint operations 10.011 13.111
Prepayments 8.342 4.260
Other receivables 13.540 16.506
Total trade and other receivables 140.979 185.453
Trade and other receivables are presented after deduction of impairment losses. No impairment losses have been deducted from the amounts still to be invoiced on concluded projects. The write-down for expected bad debts is recognised in the statement of profit or loss under administrative expenses. At year-end 2020, a provision of €4.2 million was formed for impairment of trade receivables (2019: €2.7 million). For an analysis of the movements in this provision, see note 6.25 ‘Financial risks and risk management’.
Trade and other receivables are mainly short-term.
6.18 Cash and cash equivalents
31 december 2020 31 december 2019
Bank balances 173.129 106.674
Cash in hand 0 0
Funds in blocked accounts 1.934 2.698
Total cash and cash equivalents 175.063 109.372
Of the total cash and cash equivalents, €21 million (2019: €35 million) is held by joint ventures. These cash and cash equivalents are exclusively available in consultation with the joint venture partners concerned.
The funds in blocked accounts mainly relate to the obligatory G accounts (guarantee accounts) under the Dutch Wages and Salaries Tax and Social Security Contributions (Liability of Subcontractors) Act.
Cash is utilised to reduce the Group’s financing to the extent contractually and practically permitted, for example, by making the balances concerned part of notional cash pool arrangements.

182 Heijmans Annual Report 2020
FINANCIAL STATEMENTS
Notes related to the consolidated financial statements
x € 1.000
6.20 Earnings per share
Basic earnings per ordinary share The basic earnings per share in 2020 amounted to €1.85 (2019: €1.40). The calculation is based on the result after tax attributable to the holders of ordinary shares or depositary receipts for ordinary shares and the weighted average number of ordinary shares that were outstanding during 2020.
Result attributable to holders of ordinary shares (all operations) 2020 2019
Result attributable to holders of ordinary shares after tax 40.148 30.056
Weighted average number of ordinary shares
In thousands of shares 2020 2019
Ordinary shares outstanding on 1 January 21.409 21.409
Effect of share issue in May 2020 306
Weighted average number of ordinary shares at 31 December 21.715 21.409
6.19 Equity
Paid-up and called-up share capital
In thousands of ordinary shares 2020 2019
Outstanding at 1 January 21.409 21.409
Shares issued in May 2020 524 -
Outstanding at 31 December 21.933 21.409
Refer to statement 2b for disclosures on the changes in equity, and to the Company financial statements for disclosures on the authorised share capital, the statutory reserve for investees, the hedging reserve, the appropriation of results and other figures.
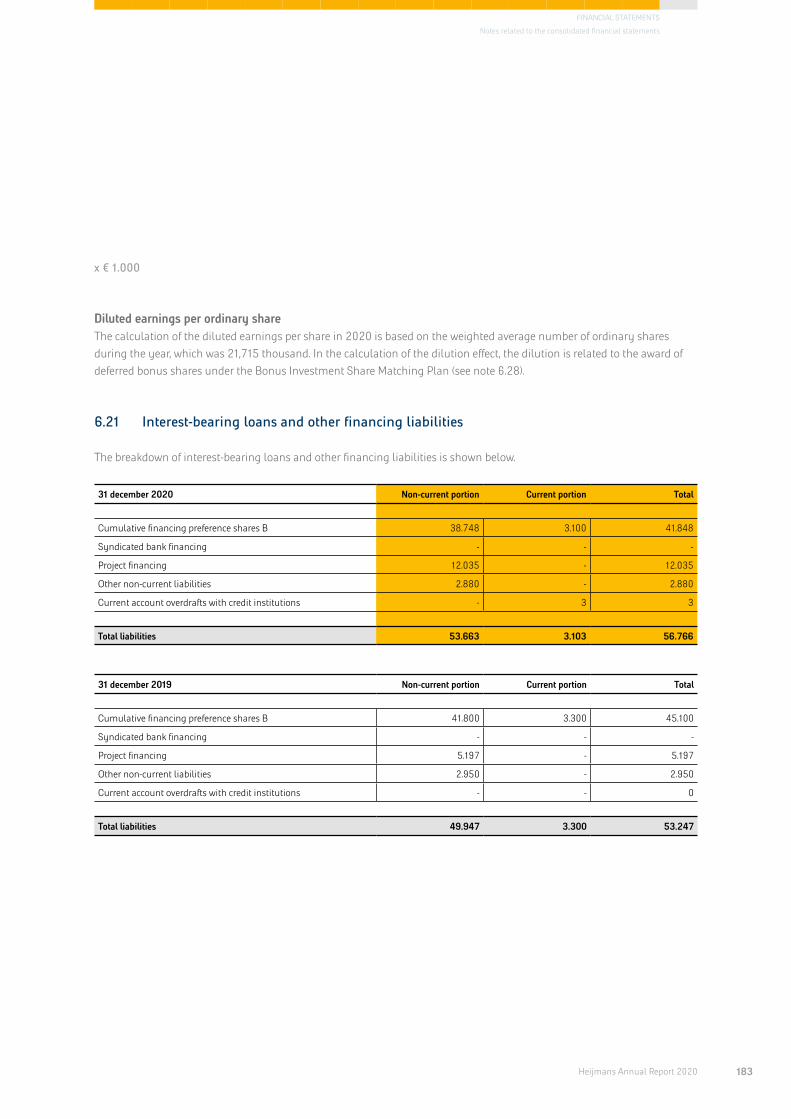
183Heijmans Annual Report 2020
FINANCIAL STATEMENTS
Notes related to the consolidated financial statements
x € 1.000
6.21 Interest-bearing loans and other financing liabilities
The breakdown of interest-bearing loans and other financing liabilities is shown below.
31 december 2020 Non-current portion Current portion Total
Cumulative financing preference shares B 38.748 3.100 41.848
Syndicated bank financing - - -
Project financing 12.035 - 12.035
Other non-current liabilities 2.880 - 2.880
Current account overdrafts with credit institutions - 3 3
Total liabilities 53.663 3.103 56.766
31 december 2019 Non-current portion Current portion Total
Cumulative financing preference shares B 41.800 3.300 45.100
Syndicated bank financing - - -
Project financing 5.197 - 5.197
Other non-current liabilities 2.950 - 2.950
Current account overdrafts with credit institutions - - 0
Total liabilities 49.947 3.300 53.247
Diluted earnings per ordinary share The calculation of the diluted earnings per share in 2020 is based on the weighted average number of ordinary shares during the year, which was 21,715 thousand. In the calculation of the dilution effect, the dilution is related to the award of deferred bonus shares under the Bonus Investment Share Matching Plan (see note 6.28).
184 Heijmans Annual Report 2020
FINANCIAL STATEMENTS
Notes related to the consolidated financial statements
x € 1.000
Cumulative financing preference shares BAs at year-end 2020, there were 4,510,000 cumulative financing preference shares B in issue with a nominal value of €0.21 per share, excluding €9.07 share premium per share. This share capital, totalling €41.8 million, has been issued to Beleggingsfonds De Zonnewijser and Nationale-Nederlanden Levensverzekering Maatschappij N.V. The Group has the right to repurchase or cancel these preference shares before their maturity date in case of an interest rate change or at any other time subject to payment of compensation. Under the agreement with the holders of the cumulative preference shares, the annual coupon rate is reviewed every five years. With effect from 1 January 2019, the rate is 7.21%. The coupon payment becomes payable each year 14 days after the AGM. Repayment of the cumulative financing preference shares B only becomes applicable in the following cases:• As and when Heijmans resumes dividend payments on ordinary shares, half of the amount that is paid on ordinary
shares will be repaid on the cumulative preference shares B by way of repayment of share premium.• As in recent years, Heijmans will ask the AGM each year to authorise the Heijmans Executive Board to issue shares up to
a maximum of 10% of the outstanding ordinary share capital. Using this mandate, Heijmans will pay out the dividend coupon owed in the form of ordinary shares at market price, with the resultant cash saving used to repay the outstand-ing capital of the cumulative preference shares B. This repayment element will therefore not reduce the capital base and will have no net cash impact. For example, if shares were issued at the 2020 closing share price of €9.33, this would result in the issue of 1.5% (rounded) of the share capital in 2020.
• As soon as the solvency ratio in terms of the capital base exceeds 30%, as reported in the annual report for each future year, and Heijmans elects to pay a dividend in respect of the relevant year, an extra repayment will be made in the form of a repayment of the share premium originally paid in on the cumulative preference shares B equal to the amount of the dividend payable for the preceding year.
In the event that the total repayments result in a reduction of the outstanding share capital of the cumulative preference shares B to less than €22,550,000, there will be an automatic reduction of 100 basis points in the coupon rate, i.e. to 6.21%. In the event of the above-mentioned repayments, on 30 June each year, the voting rights conferred by the cumulative preference shares B will be adjusted to reflect the pro rata impact on capital ratios. Based on the above and provided the AGM approves the dividend proposal and share issue mandate, it is expected that the amount of the cumulative preference shares B will decline by €11.1 million, with €3.0 million being repaid in the form of ordinary shares and €8.1 million from 50% of the proposed dividend of €0.73 per share.
Syndicated bank financingThe syndicated bank facility amounted to €121.4 million as at year-end 2020. This amount is fully committed up to 30 June 2023 and is made up of an overdraft facility of €25 million with ING and a revolving credit facility of €96.4 million with ABN AMRO, ING and Rabobank. The facility was extended for another year in 2020, without any changes to the amount or the other terms and conditions. The facility was not used at all during 2020.
The amount of the interest margin depends on the performance agreements, and lies in the range 1.65% to 3%. Based on the average debt/equity ratio, the rate for the whole of 2020 was 2.25%, and this rate is also expected to apply for the year ahead.
Collateral has been provided for the facility. This is predominantly in the form of pledging of trade receivables and bank balances as well as a first mortgage on land holdings recognised at a combined carrying amount of approximately €48 million.

185Heijmans Annual Report 2020
FINANCIAL STATEMENTS
Notes related to the consolidated financial statements
x € 1.000
The syndicated facility is subject to financial covenants. If these covenants are not met, the facility is in default. A solvency ratio of 22.5% as at year-end 2020 and subsequent years is required. This ratio is measured only once a year and the effects in the statement of financial position resulting from IFRS 15 and from IFRS 16 (together approximately 4 percentage points) have to be eliminated for the purposes of the calculation. The solvency ratio calculation involves dividing the capital base by total assets, the capital base being made up of equity plus the cumulative financing preference shares B. An interest cover ratio also applies, calculated at the end of each quarter, the minimum value being 4. In addition, a leverage ratio is to be calculated twice a year (30 June and 31 December), which must not exceed 3, and a maximum average leverage ratio of 1.0 calculated quarterly. Satisfying the covenants is actively monitored within Heijmans. Based on the 2021 business plan, together with the actual quarterly figures in 2020, the Group expects to be able to continue operating comfortably within the covenants in the year ahead, the key parameters here being the development in EBITDA and net debt. Changes in the net debt position are a function of fluctuations in working capital, behind which lie seasonal effects and fluctuations due to specific projects. The working capital requirement is generally higher during the course of the year than at year-end, and this can lead to an increase in net debt by as much as €25-27 million. The cash position together with the syndicated loan, which was not drawn on at all in 2020, is available to fund fluctuations in working capital.
The interest cover ratio is calculated as EBITDA divided by net interest expense. The leverage ratio is obtained by dividing net debt by EBITDA (earnings before interest, tax, depreciation and amortisation). The definitions of these items include several adjustments to the reported figures, as agreed with the bank consortium in the credit agreement. The main adjustments compared with the net debt for accounting purposes are an increase in respect of the net debt from joint ventures and a decrease in respect of the outstanding amount of the cumulative financing preference shares B and certain specific project financing arrangements where there is no recourse against Heijmans. The main adjustments compared with the accounting EBITDA concern the capitalised interest, results relating to business units that have been sold off, fair value adjustments, restructuring costs, EBITDA results from joint ventures and the depreciation of right-of-use assets. The main adjustments to the reported net interest expense concern the exclusion of interest expense on non-recourse project finan-cing, cumulative financing preference shares B and interest expense on the lease liabilities. Heijmans operated within the agreed covenants throughout the year.
Reconciliation between the underlying results, EBITDA, net debt and net interest expense as reported and in accordance with the definitions agreed with the bank consortium, and the calculation of the 2020 ratios, is presented below.

186 Heijmans Annual Report 2020
FINANCIAL STATEMENTS
Notes related to the consolidated financial statements
x € 1.000
x € 1.000
Amounts x €1 million note 2020 2019
Interest-bearing debt 6.21 56,8 53,2Lease liabilities (IFRS 16 Leases) 3. 81,1 86,6Cash and cash equivalents 6.18 -175,1 -109,4Net debt -37,2 30,4
Adjustments for:IFRS 16 Leases -81,1 -86,6Net debt of joint ventures 33,6 51,3Non-recourse net debt for project financing -40,3 -79,6Cumulative financing preference shares B 6.21 -41,8 -45,1Other 1,9 2,7Covenant net debt (A) -164,9 -126,9
Reported EBITDA 6.1 89,8 62,0EBITDA of joint ventures 6.1 -9,8 7,9Exceptional items 6.1 5,2 8,4Underlying EBITDA 85,2 78,3
Adjustments for:Correcties IFRS 15 -1,1 -0,6Correcties IFRS 16 -25,4 -23,9Capitalised interest 6.6 1,6 1,7EBITDA for project with non-recourse financing -1,4 -1,4Other 0,1 -1,6Covenant EBITDA (B) - Interest Cover 59,0 52,5
EBITDA attributable to disposals - -
Covenant EBITDA (C) - leverage Ratio 59,0 52,5
Net interest expense 4,9 4,7
Adjustments for:Capitalised interest 1,6 1,7Joint venture net interest expense 0,6 0,7Adjustment for IFRS 16 Leases -2,5 -2,4Non-recourse project financing interest expense -2,3 -2,5Interest on cumulative financing preference shares B 6.21 -3,1 -3,3Other -0,3 -0,3Net covenant interest expense (D) -1,1 -1,4
Equity 2. 226,4 178,0Cumulative financing preference shares B 6.21 41,9 45,1Reported capital base 268,3 223,1
Adjustments for:IFRS 15 adjustments 1,0 0,9Capital base covenants (E) 269,3 224,0
Total assets 930,6 898,4Adjustments for:IFRS 16 Leases -81,1 -86,6IFRS 15 adjustments -29,9 -36,3Total assets covenants (F) 819,6 775,5
Leverage ratio (A/C) <3 -2,8 -2,4
Interest cover ratio (B/D) >4 (if interest charges are negative, not applicable) n.v.t. n.v.t.
Average leverage ratio <1 -2,0 -0,9
Solvency ratio (E/F) >22,5% 32,9% 28,9%

187Heijmans Annual Report 2020
FINANCIAL STATEMENTS
Notes related to the consolidated financial statements
x € 1.000
x € 1.000
Project financingProject financing arrangements have been entered into in connection with specific real estate and other projects. This item includes the financing of a joint venture producing asphalt. The project financing repayment schedules are usually related to the progress on projects. Project financing generally expires no later than the date of completion and/or sale of the projects. Recourse is limited to project assets only, including future positive cash flows from these projects, as well as the contracts and mortgage collateral related to the project / project company in most cases. Heijmans N.V. has guaranteed the repayment of principal and/or payment of interest up to an amount of €5,3 million (2019: €5,2 million) of the total project financing.
Other liabilitiesThe other liabilities concern financing arrangements provided by related parties in a number of specific land holdings. As security for these financing arrangements, amounting to €2.9 million (2019: €3,0 million), Heijmans has provided guarantees in respect of repayments/payment of interest.
Average interest rate 2020 2019
Cumulative financing preference shares B 7,2% 7,2%
Syndicated bank financing* - 2,5%
Project financing 0,1% 0,9%
Other bank financing - 3,4%
Other non-current liabilities 2,5% 3,5%
* The disclosed percentage is exclusive of amortised refinancing costs and fees.
Movements in interest-bearing liabilitiesThe movements in the interest-bearing liabilities were as follows:
Net amount at 31 December 2019 Borrowed
Contributed to joint
arrangement Redeemed Net amount at 31
December 2020
Cumulative financing preference shares B 45.100 - - -3.252 41.848
Syndicated bank financing 0 - - - 0
Project financing 5.197 83 6.755 12.035
Other non-current liabilities 2.950 - - -70 2.880
Current account overdrafts with credit institutions 0 3 - - 3
Total 53.247 86 6.755 -3.322 56.766
Net amount at 31 December 2018 Borrowed Redeemed
Net amount at 31 December 2019
Cumulative financing preference shares B 45.100 - - 45.100
Syndicated bank financing 0 - - 0
Project financing 4.245 952 - 5.197
Other non-current liabilities 7.769 - -4.819 2.950
Current account overdrafts with credit institutions 1.165 - -1.165 0
Total 58.279 952 -5.984 53.247

188 Heijmans Annual Report 2020
FINANCIAL STATEMENTS
Notes related to the consolidated financial statements
x € 1.000
6.22 Employee benefits
Movement in the liability for defined-benefit plans and long-service payments
Liability Fair value of assets
Net liabilities relating to defined-benefit rights and
long-service payments
2020 2019 2020 2019 2020 2019
Balance at 1 January 256.635 414.574 238.464 397.512 18.171 17.062
Recognised in profit or loss
Service cost 298 272 - - 298 272
Interest expense/income 2.143 6.327 1.991 6.055 152 272
Settlements and curtailments - - - - - -
Actuarial result on long-service payment liabilities 529 551 - - 529 551
Administrative and other expenses - - -48 -330 48 330
Recognised in other comprehensive income
Actuarial result, experience -5.793 -2.044 - - -5.793 -2.044
Actuarial result, life expectancy - - - - - -
Actuarial result, indexing -2.056 - - - -2.056 -
Actuarial result, discount rate 20.019 74.894 - - 20.019 74.894
Actuarial result, return on investments - - 14.054 70.612 -14.054 -70.612
Contributions and benefits
Employer contributions - - 948 2.554 -948 -2.554
Pension and long-service payments -9.732 -13.995 -9.732 -13.995 - -
Settlements -13.557 -223.944 -13.557 -223.944 - 0
Total at 31 December 248.486 256.635 232.120 238.464 16.366 18.171
The pension and long-service payments in 2021 will amount to approximately €10 million. Over the next few years, this amount should not change significantly.
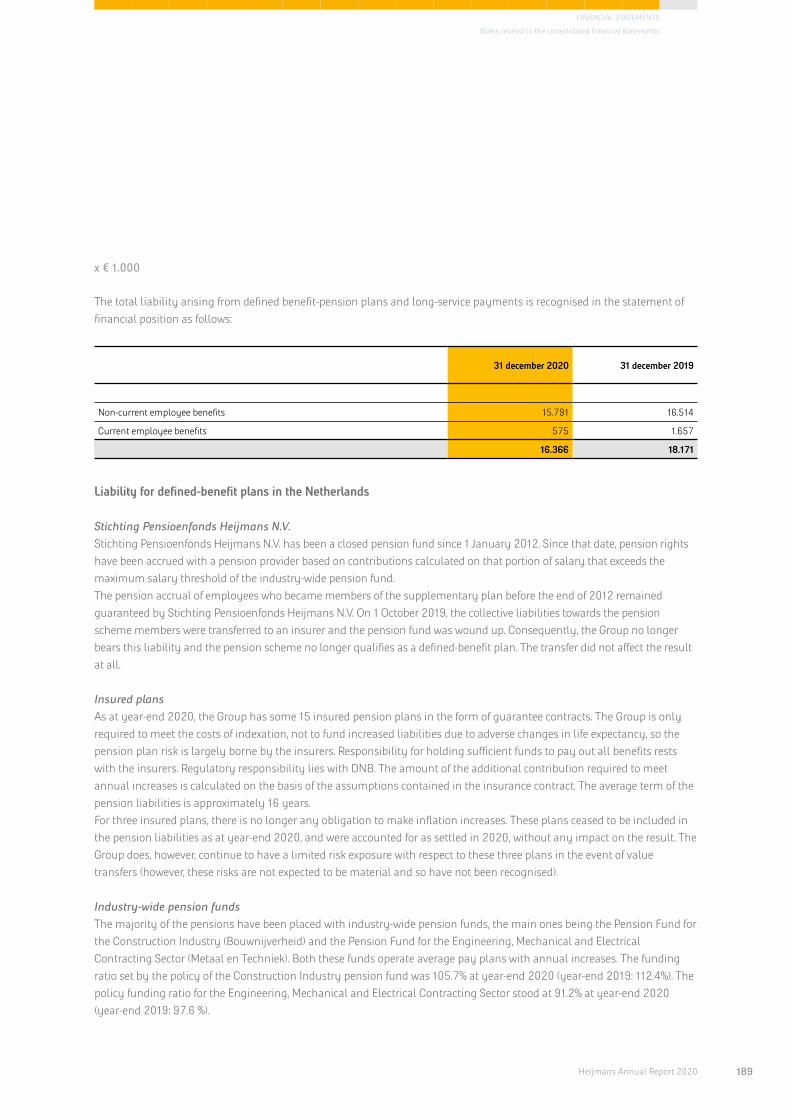
189Heijmans Annual Report 2020
FINANCIAL STATEMENTS
Notes related to the consolidated financial statements
x € 1.000
The total liability arising from defined benefit-pension plans and long-service payments is recognised in the statement of financial position as follows:
31 december 2020 31 december 2019
Non-current employee benefits 15.791 16.514
Current employee benefits 575 1.657
16.366 18.171
Liability for defined-benefit plans in the Netherlands
Stichting Pensioenfonds Heijmans N.V.Stichting Pensioenfonds Heijmans N.V. has been a closed pension fund since 1 January 2012. Since that date, pension rights have been accrued with a pension provider based on contributions calculated on that portion of salary that exceeds the maximum salary threshold of the industry-wide pension fund. The pension accrual of employees who became members of the supplementary plan before the end of 2012 remained guaranteed by Stichting Pensioenfonds Heijmans N.V. On 1 October 2019, the collective liabilities towards the pension scheme members were transferred to an insurer and the pension fund was wound up. Consequently, the Group no longer bears this liability and the pension scheme no longer qualifies as a defined-benefit plan. The transfer did not affect the result at all.
Insured plansAs at year-end 2020, the Group has some 15 insured pension plans in the form of guarantee contracts. The Group is only required to meet the costs of indexation, not to fund increased liabilities due to adverse changes in life expectancy, so the pension plan risk is largely borne by the insurers. Responsibility for holding sufficient funds to pay out all benefits rests with the insurers. Regulatory responsibility lies with DNB. The amount of the additional contribution required to meet annual increases is calculated on the basis of the assumptions contained in the insurance contract. The average term of the pension liabilities is approximately 16 years.For three insured plans, there is no longer any obligation to make inflation increases. These plans ceased to be included in the pension liabilities as at year-end 2020, and were accounted for as settled in 2020, without any impact on the result. The Group does, however, continue to have a limited risk exposure with respect to these three plans in the event of value transfers (however, these risks are not expected to be material and so have not been recognised).
Industry-wide pension fundsThe majority of the pensions have been placed with industry-wide pension funds, the main ones being the Pension Fund for the Construction Industry (Bouwnijverheid) and the Pension Fund for the Engineering, Mechanical and Electrical Contracting Sector (Metaal en Techniek). Both these funds operate average pay plans with annual increases. The funding ratio set by the policy of the Construction Industry pension fund was 105.7% at year-end 2020 (year-end 2019: 112.4%). The policy funding ratio for the Engineering, Mechanical and Electrical Contracting Sector stood at 91.2% at year-end 2020 (year-end 2019: 97.6 %).

190 Heijmans Annual Report 2020
FINANCIAL STATEMENTS
Notes related to the consolidated financial statements
x € 1.000
These funding ratios have been calculated on the basis of the actuarial assumptions used by the various industry-wide pension funds, in accordance with the Pensions Act and the Financial Assessment Framework. Since their funding ratios have a marginal effect on the contribution adjustments, these plans qualify as defined-benefit pension plans. Despite this, they are treated as defined-contribution plans because the administration of the industry pension funds is not designed to supply the required information. With regard to these plans, the Group is only required to pay the predetermined contributions. The Group has no obligation to make up any deficit, other than through future contribution adjustments. The Group has no claim to any surplus in the funds.
Long-service paymentsThe long-service payments are a month’s salary, or a portion thereof, for employment periods of 25 and 40 years.
Income and expense items recognised in connection with defined-benefit plans and long-service payments
2020 2019
Service cost -298 -272
Interest expense -2.143 -6.327
Expected return on assets 1.991 6.055
-450 -544
Administrative and other expenses -48 -330
Settlements and curtailments - -
Actuarial result on long-service payment liabilities -529 -551
Total expense and income for defined-benefit plans and long-service payments -1.027 -1.425
The principal actuarial assumptions as at year-end are:
31 december 2020 31 december 2019
Discount rate 0,35% 0,85%
Expected return on plan assets 0,35% 0,85%
Future wage inflation 2,25% 2,25%
Future pay increases 0-1,5% 0-1,5%
Future annual increase 0-0,85% 0-1,00%
Staff turnover 7,0-16,0% 7,0-16,0%
Life expectancy Projection table AG 2020 0/0 Projection table AG 2018 0/0

191Heijmans Annual Report 2020
FINANCIAL STATEMENTS
Notes related to the consolidated financial statements
x € 1.000
The discount rate is based on high-quality corporate bonds adjusted for the term of the payment obligation. This also applies to the expected yield. The future annual increase is based on the increase that is expected to be granted by the industry-wide pension fund for the Construction Industry (Bouwnijverheid)..
Financing liability for defined-benefit plans and long-service payments 31 december 2020 31 december 2019
Fully funded defined-benefit plans 243.003 251.307
Long-service payments (unfunded) 5.483 5.328
Liability for defined-benefit plans and long-service payments at 31 December 248.486 256.635
Breakdown of plan assets as a percentage of the total 31 december 2020 31 december 2019
Equities 0% 0%
Fixed-income securities 0% 0%
Liquid assets 0% 0%
Other/insured plans 100% 100%
Reasonably possible changes in one of the relevant actuarial assumptions on the reporting date, with the other assumpti-ons remaining unchanged, could potentially affect the liabilities associated with the vested pension rights to the extent shown below.
x €1 million 2020 2019
Stijging Daling Stijging Daling
Change of 0.5%-points in the discount rate -19,5 22,2 -19,7 22,4
Change of 0.25%-points in wage and price inflation and rate of annual increase 10,7 -3,8 10,9 -3,9
Change of 1 year in life expectancy 12,8 -12,8 12,2 -12,2
The above effects were determined by the actuary who performed the calculations. The combined effect of changes to more than one of the assumptions can be different from the sum of the corresponding individual effects owing to interactions. The effects presented apply only to the liabilities and not to the fair value of the investments. For a plan in the form of an insurance contract, the guarantee provided by the insurer means that the effects of these changes are largely mitigated by an equal effect on the plan assets.

192 Heijmans Annual Report 2020
FINANCIAL STATEMENTS
Notes related to the consolidated financial statements
x € 1.000
The Group expects to contribute approximately €1 million to its defined pension plans in 2021 and approximately €35 million to defined contribution plans. The expected contributions in subsequent years are likely to be in line with those expected for 2021, depending on changes in the above-mentioned actuarial assumptions and other factors.
6.23 Provisions
GeneralProvisions for such things as losses on work in progress, warranty obligations, restructuring costs and environmental risks are recognised if Heijmans has an existing obligation and it is probable that an outflow of resources will occur. The amount of each provision can be reliably estimated. The provisions are stated at face value, unless the time value of money is material.
31 december 2019
Reversal of unused amounts
Additions to provisions Provisions used 31 December 2020
Work in progress losses 19.516 -891 17.772 -20.811 15.586
Warranty obligations 18.882 -414 9.158 -3.757 23.869
Restructuring costs 1.003 -573 3.451 -1.655 2.226
Environmental risks 2.951 0 0 -326 2.625
Provision for loss-making interests 4.899 0 18.334 -16.197 7.036
Other provisions 1.852 0 978 -978 1.852
Total provisions 49.103 -1.878 49.693 -43.724 53.194
As at year-end 2019, a proportion of the guarantee obligations (€15 million) were included as part of work in progress liabilities in the statement of financial position. The 2019 figure has been restated for comparative purposes.
Ageing of provisions 31 december 2020 31 december 2019
Non-current portion 26.387 22.779
Current portion 26.807 26.324
Total 53.194 49.103
Work in progress losses If a contract with a client for the execution of a project shows a loss, the entire amount of the loss is immediately recognised in the statement of profit or loss and included as a provision for losses on work in progress in the provisions in the state-ment of financial position. The projects to which these losses relate will be completed within two years.

193Heijmans Annual Report 2020
FINANCIAL STATEMENTS
Notes related to the consolidated financial statements
x € 1.000
Provision for warranty obligations The provisions relate to complaints and deficiencies that become apparent after the delivery of projects and that fall within the warranty period. The magnitude of the costs provided for is dependent partly on the estimated allocation of the claim to the related construction partners. It is expected that most of the obligations will materialise in the next two years.
Provision for restructuring costs The provision for restructuring costs relates to the expected severance costs related to organisational changes. Most of the provision will be used in 2021.
Provision for environmental risks This item represents possible site reinstatement costs. The costs have been estimated by site, based on government regulations concerning the clean-up method and soil investigation. The periods within which restoration needs to take place vary by site. In the event that the restoration does not have to take place for another few years, there is an obligation to monitor the pollution. The expected monitoring costs have also been included in the provision.
Provision for loss-making interests The provision for loss-making interests relates to joint ventures in which the Group’s share is negative.
Other provisions The other provisions as at year-end 2020 were largely made up of a provision for year-two sick pay.

194 Heijmans Annual Report 2020
FINANCIAL STATEMENTS
Notes related to the consolidated financial statements
x € 1.000
6.24 Trade and other payables
Trade and other payables 31 december 2020 31 december 2019
Suppliers and subcontractors 165.120 189.689
Invoices due for work in progress 20.220 17.365
Invoices due for work completed 31.968 33.405
Pension obligations 2.068 2.452
Staff costs payable 20.257 19.873
VAT payable 47.108 49.480
Wage tax and social security contributions payable 15.083 13.686
Administrative expenses and costs of sales payable 7.119 8.979
Interest payable 4.394 4.701
Payables to partnerships 8.393 14.285
Other liabilities 4.645 5.399
Total trade and other payables 326.375 359.314
The trade and other payables are predominantly of a short-term nature.

195Heijmans Annual Report 2020
FINANCIAL STATEMENTS
Notes related to the consolidated financial statements
x € 1.000
6.25 Financial risks and risk management
General In the normal course of business, Heijmans is exposed to various financial risks, including credit, liquidity, market, price and interest-rate risks. This section describes the degree to which these risks manifest themselves, the objectives set regarding the risks and the policy and procedures for measuring and managing them, as well as the management of capital.The risk policy is focused on the identification and analysis of the risks to which the Group is exposed and the setting of acceptable limits.
The risk policy and systems are assessed on a regular basis and then modified if necessary for changes in market conditi-ons and the operations of the Group. The objective is to create a disciplined and constructive approach to risk management, with the aid of training, standards and procedures whereby all employees are aware of their roles and responsibilities.
The Audit Committee periodically reviews the risk management policy and procedures. In addition, the Committee reviews the risk policy used in the light of the risks to which the Group is exposed.
Credit risk Credit risk is the risk that the Group will be exposed to financial loss if a party against which Heijmans has a claim fails to meet its contractual obligations. Credit risks arise primarily from receivables due from customers and consortium partners.
The credit risk associated with residential property development is limited, as future residents can only take possession of the new home once they have met all their obligations and there is pre-financing during the construction stage. Creditworthiness is assessed in transactions involving the development of commercial property, construction contracts and infrastructure projects, with additional collateral possibly being requested. Additional forms of security are particularly important in the case of turnkey projects (paid for on completion), although normally there is pre-financing of transactions in the ‘business to business’ segment as well. Especially within Infra and and non-residential construction, Heijmans carries out many assignments for public authorities, for which the credit risk is considered extremely limited. In these areas of the business, Heijmans will be part of consortiums working on various large-scale, integrated projects. The more specific the expertise of a consortium partner, the greater the importance that is attached to the creditworthiness of that partner. In such cases, a poor credit rating is grounds for not entering into partnership, since financial guarantees are not worth anything if essential know-how is lost.
The assessment of creditworthiness is part of the standard procedure, and involves using company-specific reports produced by rating agencies. Credit risk is mitigated by pre-financing arrangements and payments in instalments. Risks are insured with a credit insurer if considered necessary.
The large number of clients, a substantial proportion of which are private individuals and public authorities, means there is no concentration of credit risk.
The cash and cash equivalents are held at different banks that are assessed as regards creditworthiness. The credit risk is further mitigated by concentrating the cash as far as possible in cash pools, the cumulative balance of which is predomi-nantly negative over the year.
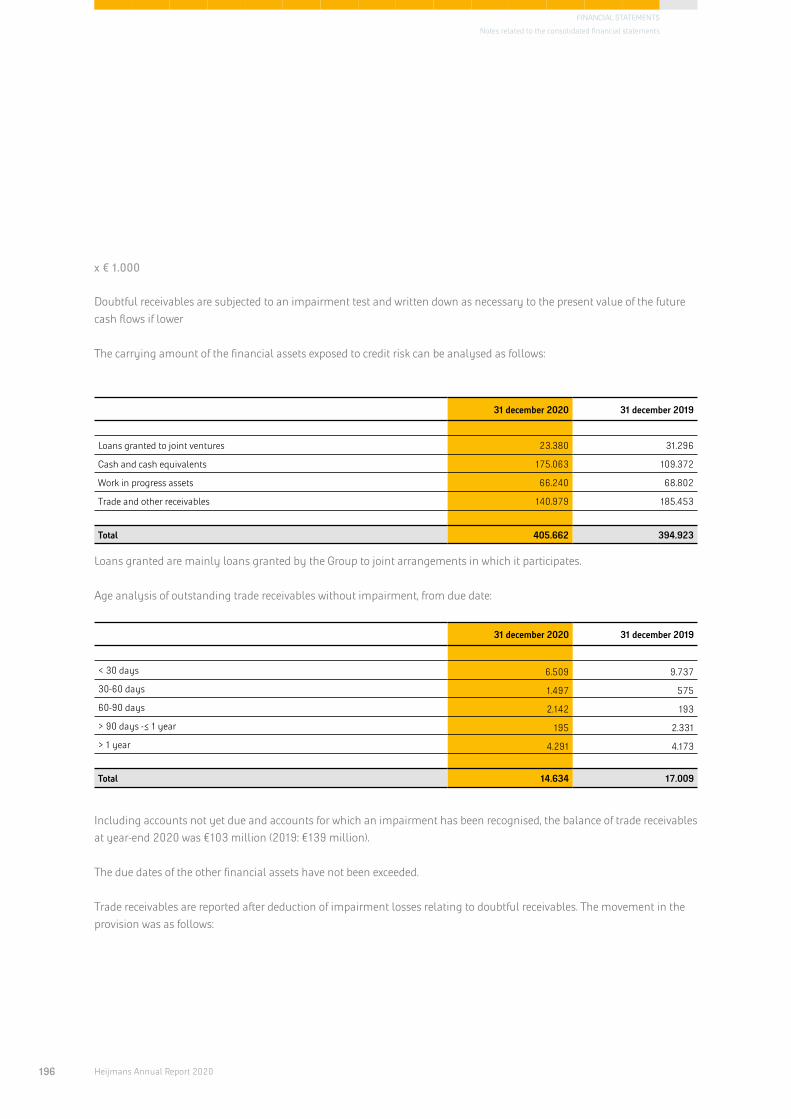
196 Heijmans Annual Report 2020
FINANCIAL STATEMENTS
Notes related to the consolidated financial statements
x € 1.000
Doubtful receivables are subjected to an impairment test and written down as necessary to the present value of the future cash flows if lower
The carrying amount of the financial assets exposed to credit risk can be analysed as follows:
31 december 2020 31 december 2019
Loans granted to joint ventures 23.380 31.296
Cash and cash equivalents 175.063 109.372
Work in progress assets 66.240 68.802
Trade and other receivables 140.979 185.453
Total 405.662 394.923
Loans granted are mainly loans granted by the Group to joint arrangements in which it participates.
Age analysis of outstanding trade receivables without impairment, from due date:
31 december 2020 31 december 2019
< 30 days 6.509 9.737
30-60 days 1.497 575
60-90 days 2.142 193
> 90 days -≤ 1 year 195 2.331
> 1 year 4.291 4.173
Total 14.634 17.009
Including accounts not yet due and accounts for which an impairment has been recognised, the balance of trade receivables at year-end 2020 was €103 million (2019: €139 million).
The due dates of the other financial assets have not been exceeded.
Trade receivables are reported after deduction of impairment losses relating to doubtful receivables. The movement in the provision was as follows:

197Heijmans Annual Report 2020
FINANCIAL STATEMENTS
Notes related to the consolidated financial statements
x € 1.000
2020 2019
Balance at 1 January 2.741 3.211
Additions 1.769 271
Withdrawals -21 -236
Release -262 -505
Balance at 31 December 4.227 2.741
Liquidity risk Liquidity risk is the risk that the Group cannot meet its financial obligations at the time it is required to do so. See also note 6.21, Interest-bearing loans. The liquidity-risk management assumption is that sufficient liquidity levels will be maintained to meet current and future financial obligations, in both normal and exceptional circumstances, without incurring unac-ceptable risks and without endangering the reputation of the Group.
Weekly 3-month rolling and monthly 12-month rolling liquidity forecasts are among the tools used to determine whether the Group has sufficient liquidity available. In addition, the availability of credit, including in the form of headroom available from credit insurers or providers of guarantees, is continuously monitored by regularly making projections of the score in relation to financial covenants and engaging in an active dialogue with all financial stakeholders. Based on this forecast, the Group considers that sufficient liquidity is available to conduct operations.
To secure the availability of financial resources for both the long term and the short term, Heijmans has access to the following facilities:• €42 million in cumulative financing preference shares B;• (year-end 2020) €121 million committed syndicated bank financing, €25 million of which is in the form of a committed
overdraft facility linked to a cash pool;• project financing for which committed financing is available for most of the anticipated principal sum and duration of
the project in question; and• leases.
In order to satisfy clients’ requirements for bank guarantees, Heijmans has access to guarantee facilities with various institutions. These facilities are uncommitted. Every month, a projection is made of the use of the available bank guarantee facilities, based on current tenders and expectations regarding the discharge of existing bank guarantees. Based on these projections, Heijmans believes that the present size of the facilities is adequate.
At year-end 2020, the bank guarantee facilities totalled €303 million (2019: €293 million) provided by a total of 10 parties. As at year-end 2020, almost €1 million in guarantees was outstanding relating to the international activities that were disposed of in 2017, with the rest exclusively concerning guarantees for projects associated with operations in the Netherlands.
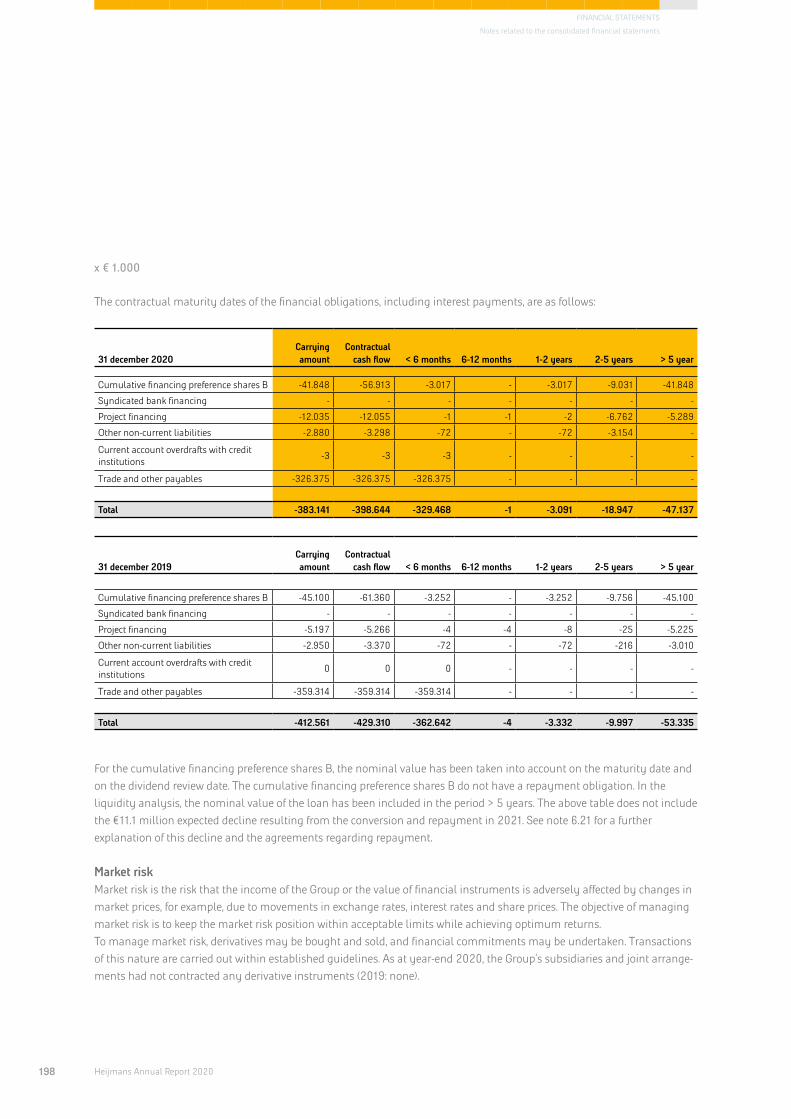
198 Heijmans Annual Report 2020
FINANCIAL STATEMENTS
Notes related to the consolidated financial statements
x € 1.000
The contractual maturity dates of the financial obligations, including interest payments, are as follows:
31 december 2020Carrying amount
Contractual cash flow < 6 months 6-12 months 1-2 years 2-5 years > 5 year
Cumulative financing preference shares B -41.848 -56.913 -3.017 - -3.017 -9.031 -41.848
Syndicated bank financing - - - - - - -
Project financing -12.035 -12.055 -1 -1 -2 -6.762 -5.289
Other non-current liabilities -2.880 -3.298 -72 - -72 -3.154 -
Current account overdrafts with credit institutions -3 -3 -3 - - - -
Trade and other payables -326.375 -326.375 -326.375 - - - -
Total -383.141 -398.644 -329.468 -1 -3.091 -18.947 -47.137
31 december 2019Carrying amount
Contractual cash flow < 6 months 6-12 months 1-2 years 2-5 years > 5 year
Cumulative financing preference shares B -45.100 -61.360 -3.252 - -3.252 -9.756 -45.100
Syndicated bank financing - - - - - - -
Project financing -5.197 -5.266 -4 -4 -8 -25 -5.225
Other non-current liabilities -2.950 -3.370 -72 - -72 -216 -3.010
Current account overdrafts with credit institutions 0 0 0 - - - -
Trade and other payables -359.314 -359.314 -359.314 - - - -
Total -412.561 -429.310 -362.642 -4 -3.332 -9.997 -53.335
For the cumulative financing preference shares B, the nominal value has been taken into account on the maturity date and on the dividend review date. The cumulative financing preference shares B do not have a repayment obligation. In the liquidity analysis, the nominal value of the loan has been included in the period > 5 years. The above table does not include the €11.1 million expected decline resulting from the conversion and repayment in 2021. See note 6.21 for a further explanation of this decline and the agreements regarding repayment.
Market risk Market risk is the risk that the income of the Group or the value of financial instruments is adversely affected by changes in market prices, for example, due to movements in exchange rates, interest rates and share prices. The objective of managing market risk is to keep the market risk position within acceptable limits while achieving optimum returns. To manage market risk, derivatives may be bought and sold, and financial commitments may be undertaken. Transactions of this nature are carried out within established guidelines. As at year-end 2020, the Group’s subsidiaries and joint arrange-ments had not contracted any derivative instruments (2019: none).

199Heijmans Annual Report 2020
FINANCIAL STATEMENTS
Notes related to the consolidated financial statements
x € 1.000
Price risk Price risk associated with the purchase of raw materials and consumables as well as with outsourced work, is mitigated by making price indexation agreements with clients, or where possible by making price agreements with suppliers at an early stage. If necessary, derivatives may be used occasionally to hedge the price risk of procuring raw materials.
Interest-rate risk The interest rate policy at Heijmans is directed towards limiting the impact of changes in interest rates on the Group’s results. The interest rate on the cumulative financing preference shares B is reviewed every 5 years and fixed for 5 years. For the majority of the project financing arrangements, fixed interest rates are preferred, giving greater certainty with respect to results on the various projects. Where the syndicated loan is used, financing is at a floating rate. Since this involves financing of working capital, which is generally not required at the end of the year, Heijmans currently sees no benefits for fixing interest rates for longer periods. The present negative Euribor rate is another factor here. This policy is subject to constant evaluation.
If the interest rate for 2020 had been 2 percentage points higher on average, the result before tax based on the average level of debt (including the credit balance at the bank) would have been approximately €2.3 million higher (2019: approx. the same). The effect of a 2 percentage point difference in interest rates on the Group’s equity (assuming all other variables remained constant) would have been €1.7 million higher (2019: nil).
The table below shows the periods in which interest rates for interest-bearing financial assets and financial liabilities are reviewed:
31 december 2020
Note Total0–6
months6–12
months1–2
years2–5
years> 5
years
Loans granted 6.13 23.380 11.951 643 600 - 10.186
Cash and cash equivalents 6.18 175.063 175.063 - - - -
Cumulative financing preference shares B 6.21 -41.848 - - - -41.848 -
Syndicated bank financing 6.21 - - - - - -
Project financing 6.21 -12.035 -6.753 - - - -5.282
Other non-current liabilities 6.21 -2.880 - - -2.880
Current account overdrafts with credit institutions 6.21 -3 -3 - - - -
Total 141.677 180.258 643 600 -44.728 4.904
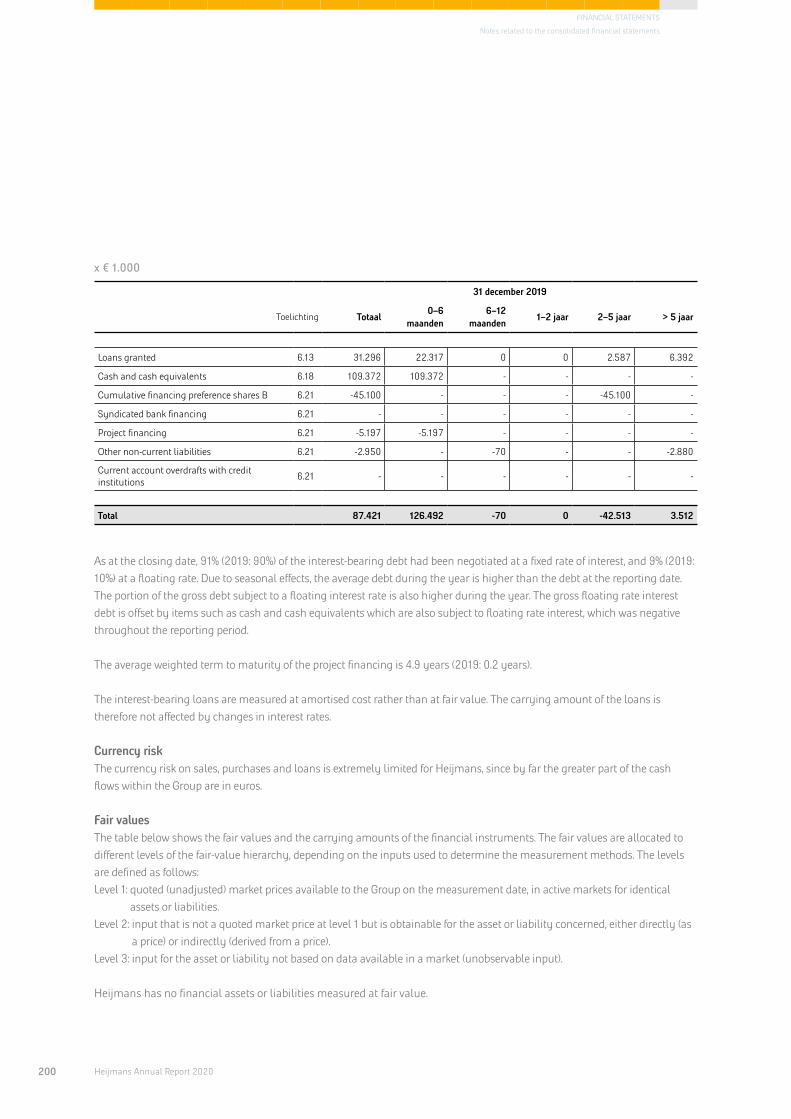
200 Heijmans Annual Report 2020
FINANCIAL STATEMENTS
Notes related to the consolidated financial statements
x € 1.000
31 december 2019
Toelichting Totaal0–6
maanden6–12
maanden1–2 jaar 2–5 jaar > 5 jaar
Loans granted 6.13 31.296 22.317 0 0 2.587 6.392
Cash and cash equivalents 6.18 109.372 109.372 - - - -
Cumulative financing preference shares B 6.21 -45.100 - - - -45.100 -
Syndicated bank financing 6.21 - - - - - -
Project financing 6.21 -5.197 -5.197 - - - -
Other non-current liabilities 6.21 -2.950 - -70 - - -2.880
Current account overdrafts with credit institutions 6.21 - - - - - -
Total 87.421 126.492 -70 0 -42.513 3.512
As at the closing date, 91% (2019: 90%) of the interest-bearing debt had been negotiated at a fixed rate of interest, and 9% (2019: 10%) at a floating rate. Due to seasonal effects, the average debt during the year is higher than the debt at the reporting date. The portion of the gross debt subject to a floating interest rate is also higher during the year. The gross floating rate interest debt is offset by items such as cash and cash equivalents which are also subject to floating rate interest, which was negative throughout the reporting period.
The average weighted term to maturity of the project financing is 4.9 years (2019: 0.2 years).
The interest-bearing loans are measured at amortised cost rather than at fair value. The carrying amount of the loans is therefore not affected by changes in interest rates.
Currency risk The currency risk on sales, purchases and loans is extremely limited for Heijmans, since by far the greater part of the cash flows within the Group are in euros.
Fair values The table below shows the fair values and the carrying amounts of the financial instruments. The fair values are allocated to different levels of the fair-value hierarchy, depending on the inputs used to determine the measurement methods. The levels are defined as follows: Level 1: quoted (unadjusted) market prices available to the Group on the measurement date, in active markets for identical
assets or liabilities.Level 2: input that is not a quoted market price at level 1 but is obtainable for the asset or liability concerned, either directly (as
a price) or indirectly (derived from a price). Level 3: input for the asset or liability not based on data available in a market (unobservable input).
Heijmans has no financial assets or liabilities measured at fair value.

201Heijmans Annual Report 2020
FINANCIAL STATEMENTS
Notes related to the consolidated financial statements
x € 1.000
31 december 2020 31 december 2019
Carrying amount
Fair valueCarrying amount
Fair value
Note Level Loans and receivables
6.13 2 Loans granted 23.380 24.359 31.296 32.807
6.17 * Trade and other receivables 140.979 140.979 185.453 185.453
6.18 * Cash and cash equivalents 175.063 175.063 109.372 109.372
6.21 * Current account overdrafts with credit institutions -3 -3 - -
6.21 2 Cumulative financing preference shares B -41.848 -45.275 -45.100 -45.100
6.21 2 Syndicated bank financing - - - -
6.21 2 Project financing -12.035 -11.582 -5.197 -5.197
6.21 2 Other non-current liabilities -2.880 -3.030 -2.950 -3.074
6.24 * Trade and other payables -326.375 -326.375 -359.314 -359.314
-43.719 -45.864 -86.440 -85.053
* The carrying amount is a reasonable approximation of the fair value.
The above values are based on the present value of future cash flows. The loans with a fixed interest rate are discounted using the yield curve for 31 December 2020, plus the relevant risk mark-up. Because of the agreed change in the interest rate on the cumulative financing preference shares B coming into effect on 1 January 2019, the fair value has been taken as equal to the carrying amount for 2019.
All loans with a variable interest rate are assumed to have a fair value equal to their carrying amount.
Capital managementThe policy has been designed to achieve a sound capital position with sufficient availability of credit to be able to ensure continuity for stakeholders. A sound long-term capital structure is based on operating with sufficient headroom within the limits of the covenants, in particular the leverage ratio. This means net interest-bearing debt after deduction of cumulative financing preference shares B plus non-recourse finance divided by EBITDA not exceeding 3.0, an average leverage ratio not exceeding 1.0 and an interest cover ratio of at least 4.0 (see also note 6.21 for a description of the financial ratios in the conditions agreed with the banks).

202 Heijmans Annual Report 2020
FINANCIAL STATEMENTS
Notes related to the consolidated financial statements
x € 1.000
6.26 Investment commitments
31 december 2020 31 december 2019
Contractual commitments for:
- acquisition of property, plant and equipment 1.262 2.199
- acquisition of land 8.027 16.897
9.289 19.096
There are no Group guarantees for the capital expenditure commitments (2019: none). In general, the contractual commitments to purchase land will materialise in 1 to 10 years. No investment commitments have been entered into by joint operations in which Heijmans participates (2019: €1 million). The amount presented is Heijmans’ share of the commitments undertaken by the joint operations. The joint ventures in which Heijmans participates have undertaken investment commitments of €25 million (2019: €9 million), this amount being Heijmans’ portion. This mainly concerns the acquisition of land for the construction of housing projects shortly after acquisition.

203Heijmans Annual Report 2020
FINANCIAL STATEMENTS
Notes related to the consolidated financial statements
x € 1.000
6.27 Contingent liabilities
GeneralContingent liabilities are potential liabilities resulting from events prior to the reporting date. The liabilities are potential because the outflow of economic resources depends on the occurrence of uncertain events in the future.
Contingent liabilities can be divided into bank guarantees, Group guarantees and other contingent liabilities.
Bank and Group guarantees 31 december 2020 31 december 2019
Bank guarantees relating to:
Execution of projects 116.307 131.200
Tenders 4.411 250
Other 3.675 11.246
124.393 142.696
Group guarantees relating to:
Execution of projects 316.661 320.956
Contingent liabilities 0 0
Credit and bank guarantee facilities 20.658 23.788
337.319 344.744
Total 461.712 487.440
The Group guarantees associated with financing facilities have been provided in connection with project financing, bank guarantees and credit facilities applying to subsidiaries, joint operations and joint ventures. Heijmans has guaranteed its share of the debt of various joint operations and property joint ventures, which amounts to €21 million (2019: €24 million). The Group does not expect to incur credit losses on this.
The Group guarantees issued for divested operations (Leadbitter) are not included in the above table. They amount to €39 million (2019: €42 million). With regard to work completed and work in progress, the guarantees will be taken over by the buyer if possible. Where this is not possible, the buyer has provided a bank or corporate guarantee.
Other contingent liabilitiesThe other contingent liabilities with a significant cash impact as at year-end 2020 amount to €29 million (2019: €28 million) and those with a limited cash impact €62 million (2019: €87 million), making a total of €91 million (2019: €115 million). Of the total amount, €5 million (2019: €12 million) is recognised under joint operations. This relates mainly to commitments to acquire land when the building permit is obtained and/or a certain sales percentage is achieved. No Group guarantees were issued in respect of this in 2020 (2019: none).

204 Heijmans Annual Report 2020
FINANCIAL STATEMENTS
Notes related to the consolidated financial statements
x € 1.000
At year-end 2020, the joint ventures in which Heijmans participates had no contingent liabilities with significant cash impact (2019: €1 million) but had contingent liabilities with a limited cash impact amounting to €12 million (2019: €14 million), making a total of €12 million (2019: €15 million). This relates mainly to commitments to acquire land when the building permit is obtained and/or a certain sales percentage is achieved. The aforementioned amounts relate to Heijmans’ share in the joint ventures.
6.28 Related parties
Related parties for Heijmans can be divided into subsidiaries, associates, joint arrangements (joint ventures and joint operations), the members of the Supervisory Board and the members of the Executive Board. Transactions with related parties are conducted at arm’s length, on terms comparable to those for transactions with third parties.
Transactions with subsidiaries, associates, joint ventures and joint operationsHeijmans undertakes a number of operating activities together with related parties, including in the form of joint arrange-ments. Significant transactions in this context are the contribution of land holdings to joint arrangements and/or their financing. In addition, large and complex projects are carried out in partnership with other companies.
There are no transactions with the organisation’s management, with the exception of the remuneration discussed below. For information on the relationships with joint ventures and associates, see note 6.12.
The Group’s share in the revenue and total assets of joint operations is analysed by segment below:

205Heijmans Annual Report 2020
FINANCIAL STATEMENTS
Notes related to the consolidated financial statements
x € 1.000
2020Business segments In € million
Property Development
Building & Technology Infra Eliminations Total
Revenue 37,0 56,6 56,2 -33,8 116,0
Costs -33,9 -54,5 -45,4 33,8 -100,0
Non-current assets 1,3 0,0 0,3 1,6
Current assets 41,5 26,3 14,1 81,9
Total assets 42,8 26,3 14,4 0,0 83,5
Non-current liabilities 5,3 0,6 0,4 0,0 6,3
Current liabilities 6,8 17,2 14,9 38,9
Total liabilities 12,1 17,8 15,3 0,0 45,2
Equity 30,7 8,5 -0,9 0,0 38,3
2019Business segments In € million
Property Development
Building & Technology Infra Eliminations Total
Revenue 35,5 138,0 61,0 -33,6 200,9
Costs -32,5 -128,4 -57,7 33,6 -185,0
Non-current assets 3,9 0,0 0,2 4,1
Current assets 46,9 39,7 21,7 108,3
Total assets 50,8 39,7 21,9 0,0 112,4
Non-current liabilities 5,2 0,0 5,2
Current liabilities 12,1 36,6 17,1 65,8
Total liabilities 17,3 36,6 17,1 0,0 71,0
Equity 33,5 3,1 4,8 0,0 41,4
Company pension fundUp to the end of September 2019, the Group was associated with Stichting Pensioenfonds Heijmans N.V. In 2020, nil (2019: approximately €0.5 million) was paid to this pension fund in the form of pension contributions. At the beginning of October 2019, the liabilities towards the members were collectively transferred to an insurer and the pension fund was wound up. The Group will have no pension contribution liability in 2020 and subsequent years.

206 Heijmans Annual Report 2020
FINANCIAL STATEMENTS
Notes related to the consolidated financial statements
x € 1.000
Remuneration of Supervisory DirectorsAll Supervisory Directors receive a fixed annual fee that is not dependent on the results in any single year. They also receive a fixed or variable expense allowance. They have not been allocated any options or depositary receipts for shares. As at year-end 2020, the members of the Supervisory Board owned a total of 18,162 depositary receipts for Heijmans shares (2019: 12,500). Mr Vollebregt holds 12,500 shares (2019:12,500) and Mr Witzel (member of the Supervisory Board with effect from 15 April 2020) holds 5,662 shares. None of the Supervisory Directors has any other business links to Heijmans from which they could derive personal gain.
The total payments granted to Supervisory Directors in 2020 and 2019 were as follows:
in € 2020 2019
Sj.S. Vollebregt – voorzitter* 60.000 60.000
Drs. P.G. Boumeester** 14.064 46.750
Ing. R. van Gelder BA*** 15.860 52.750
R. Icke RA**** 54.378 53.000
Mr. M.M. Jonk***** 54.078 49.000
Drs. S. van Keulen****** - 13.500
J.W.M. Knape-Vosmer MBA******* 45.571 -
G.A. Witzel******** 33.630 -
Total 277.581 275.000
* Supervisory Director since 15 April 2015 and Chairman since 13 April 2016
** Supervisory Director from 28 April 2010 to 15 April 2020*** Supervisory Director from 1 July 2010 to 15 April 2020**** Supervisory Director since 9 April 2008***** Supervisory Director since 6 December 2018
****** Supervisory Director from 18 April 2007 to 10 April 2019******* Supervisory Director since 15 April 2020. The recognised amount
includes remuneration of €11,029 in respect of the induction period from January to mid-April 2020
******** Supervisory Director since 15 April 2020

207Heijmans Annual Report 2020
FINANCIAL STATEMENTS
Notes related to the consolidated financial statements
x € 1.000
Remuneration of members of the Executive Board
Fixed and variable remuneration paid to members of the Executive BoardThe amounts paid out in 2019 and 2020 and the amounts payable in 2021 in respect of fixed and variable remuneration for the members of the Executive Board are as follows:
in €
Gross fixed remuneration Variable remuneration Total remuneration
Payable in 2021
Paid in 2020
Paid in 2019
Payable in 2021
Paid in 2020
Paid in 2019
Payable in 2021
Paid in 2020
Paid in 2019
A.G.J. Hillen 550.000 500.000 500.000 606.534 498.461 437.500 1.156.534 998.461 937.500
J.G. Janssen 123.958 425.000 425.000 515.554 423.692 212.500 639.512 848.692 637.500
673.958 925.000 925.000 1.122.088 922.153 650.000 1.796.046 1.847.153 1.575.000
The variable remuneration payable in 2021 includes the long-term variable remuneration for the period 2018-2020 (see below). The variable remuneration paid to Mr Janssen in 2019 did not include any long-term remuneration in respect of the period 2016-2018 since he did not join the Board until the end of October 2017. Mr Hillen’s gross fixed remuneration payable in 2021 takes into account the salary increase from April 2021 (see the Remuneration Report in the directors’ report for further details). Mr Janssen’s gross fixed remuneration payable in 2021 reflects his retirement on 15 April 2021.
Charges recognised in the statement of profit or loss relating to the remuneration of the members of the Executive BoardThe composition of the remuneration paid to each member of the Executive Board is as follows:
* Chairman of the Executive Board since 1 December 2016 and member of the Executive Board since 18 April 2012 ** Member of the Executive Board since 30 October 2017
in €Gross fixed
remuneration
Short term variable
remunera-tion
Long-term variable
remunerationPension
contributions
Expense allowances including reimburse-
ment of car expenses, compulsory social
insurance contributi-ons and costs of the
Share Matching Plan Total
A.G.J. Hillen*2020 500.000 325.284 281.250 203.086 109.115 1.418.735
2019 500.000 242.211 256.250 202.052 79.117 1.279.630
J.G. Janssen**2020 425.000 276.491 26.563 88.000 41.717 857.771
2019 425.000 205.879 217.813 88.000 70.037 1.006.729
Total 2020 925.000 601.775 307.813 291.086 150.832 2.276.506
2019 925.000 448.090 474.063 290.052 149.154 2.286.359

208 Heijmans Annual Report 2020
FINANCIAL STATEMENTS
Notes related to the consolidated financial statements
x € 1.000
The members of the Executive Board were awarded a short-term variable bonus for 2020 of 65% of the basic salary due to the targets achieved in 2020. For the period 2017-2020, long-term variable remuneration of 56% of basic pay was awarded, following achievement of the targets for this period. For more information, refer to the remuneration report in the directors’ report.
Heijmans has reserved €250,000 for variable remuneration for the members of the Executive Board relating to the periods 2019-2021 and 2020-2022 (2019: €462,500 for the periods 2018-2020 and 2019-2021); €250,000 has been reserved for Mr Hillen (2019: €250,000) but none has been reserved for Mr Janssen in view of his retirement on 15 April 2021 (2019: €212,500).
In order to bind directors to the Company for the long term and to encourage a focus on long-term value creation, with effect from 2010 a Bonus Investment Share Matching Plan has been applicable under which directors can opt to use part of their variable short-term remuneration to purchase Heijmans shares.
In April 2018, Mr. Hillen acquired 5,000 depositary receipts for Heijmans shares with 12% of the awarded short-term bonus for 2017. In the context of the Share Matching Plan, a conditional depository receipt was granted for each share acquired. The depository receipts granted conditionally are vested after 3 years, after which they are subject to a mandatory lock-up period of two years. The total charge associated with the granting of the shares is calculated at the time the shares are awarded and is recognised on a time-weighted basis in the statement of profit or loss during the period in which the awarded shares are vested. In the statement of profit or loss for 2020, Heijmans recognised an amount of €16,375 (2019: €16,375) as a charge related to the shares granted in April 2018. In April 2019, Mr Hillen and Mr Janssen, exercising 30% and 23%, respectively, of the short-term bonus awards for 2018, purchased 7,500 and 5,000 depositary receipts for Heijmans shares. In the context of the Share Matching Plan, a conditio-nal depository receipt was granted for each share acquired. These conditionally granted depositary receipts for shares become vested after three years. The depositary receipts conditionally granted to Mr Janssen have lapsed in view of his retirement on 15 April 2021. The total charge associated with the granting of the shares is calculated at the time the shares are awarded and is recognised on a time-weighted basis in the statement of profit or loss during the period in which the awarded shares are vested. In the statement of profit or loss for 2020, Heijmans recognised an amount of €13,819 (2019: €27,639) as a charge related to the shares granted in April 2019. In April 2020, Mr Hillen and Mr Janssen, exercising 30% and 24%, respectively, of the short-term bonus awards for 2019, purchased 13,000 and 8,700 depositary receipts for Heijmans shares. In the context of the Share Matching Plan, a conditio-nal depository receipt was granted for each share acquired. These conditionally granted depositary receipts for shares become vested after three years. The depositary receipts conditionally granted to Mr Janssen have lapsed in view of his retirement on 15 April 2021. The total charge associated with the granting of the shares is calculated at the time the shares are awarded and is recognised on a time-weighted basis in the statement of profit or loss during the period in which the awarded shares are vested. In the statement of profit or loss for 2020, Heijmans recognised an amount of €16,380 (2019: nil) as a charge related to the shares granted in April 2020.
The pension scheme for Mr Hillen pertains to the pension scheme of the industry-wide pension fund and a defined-contribution plan. Mr. Hillen also receives an annual compensation of €36,857 (2019: €36,134), adjusted for possible

209Heijmans Annual Report 2020
FINANCIAL STATEMENTS
Notes related to the consolidated financial statements
x € 1.000
collective labour agreement salary increases, for the lapse of the early retirement pension scheme. Mr. Hillen also received compensation of €95,523 in 2020 (2019: €96,140) for the loss of pension accrual on his salary over and above €100,000, plus a compensation of €50,232 (2019: €50,232) for the loss of the indexation in the Delta Lloyd average salary scheme. Mr Janssen received a fixed fee, before pension contributions, of €88,000 in 2020 (2019: €88,000).
The pension charge is calculated in accordance with accounting policy 23.
As at year-end 2020, the members of the Executive Board owned a total of 51,171 depositary receipts for Heijmans shares. The ownership of these shares is partly a consequence of the Share Matching Plan as described above and partly the result of the purchase of shares by members of the Executive Board. The ownership of depositary receipts for Heijmans shares by the individual members of the Executive Board at year-end 2020 is as shown below:
Shares owned on 31 December 2020
A.G.J. Hillen - Chairman 37.471
J.G. Janssen 13.700
Total 51.171
Remuneration of former members of the Executive BoardAn amount of €32,250 has been recognised in the statement of profit or loss for 2020 (2019: €283,000) in respect of the fees that Mr Witzel, a former member of the Executive Board, receives under his management agreement. Mr Witzel’s duties continued to the end of February 2020 and involved consultancy work and the management of major projects.
210 Heijmans Annual Report 2020
FINANCIAL STATEMENTS
Notes related to the consolidated financial statements
6.29 Management estimates and judgements
The accounting information in the financial statements is partly based on estimates and assumptions. The Group makes these estimates and makes assumptions about future developments, based on factors such as experience and expectations about future events that may reasonably be expected to occur given the current state of affairs. These estimates and assumptions are continually reassessed.
Revisions of estimates and assumptions, or differences between estimates and assumptions and actual outcomes, may lead to material adjustments to the carrying amounts of assets and liabilities.
Supplementary to the estimates already described in the accounting policies (section 5) and the explanatory notes (6.1 to 6.28), the key elements of estimation uncertainty are explained below.
Covid-19 The impact of Covid-19 on the Group’s financial results in 2020 was relatively limited. Largely because the Group is active solely in the Netherlands, where there has been no cessation of work on construction projects. The main problem for the Group stemmed from greater difficulties with obtaining materials and labour from outside the Netherlands, which disrup-ted our tightly organised logistics processes. For the years ahead, results will depend to some extent on the economic impact of Covid-19. It is currently unclear what impact the virus will have on the spending patterns of both public-sector and private-sector clients and on consumer confidence. The effects are being constantly monitored by the Executive Board. The prospects for the Group in the years ahead are good, given the orders on the books and the leeway afforded by the financing facilities among other factors.
Nitrogen problem (PAS) The nitrogen problem had only a limited effect on the Group’s financial results in 2020. It created delays in tenders for large infrastructure projects. The delays in carrying out our projects are currently limited. The prospects for the Group in the years ahead are good, given the orders on the books and the leeway afforded by the financing facilities among other factors.
Measurement of projects For more information on the key assumptions used in the measurement of projects, see note 6.16, Work in progress. A higher estimation uncertainty applies in the case of the Wintrack project. This contract, with an agreed price of €250 million, concerned the construction of pylons on two new high- voltage transmission lines, Eemshaven-Vierverlaten and Borssele- Rilland, to be carried out by a consortium made up of Heijmans (60%) and Europoles (40%). Early September 2018 the client TenneT has dissolved (‘ontbonden’) or alternatively terminated (‘opgezegd’) the agreements. The various parties have filed considerable claims and counterclaims with regard to the agreed price. This matter has gone to arbitration. The Group has not recognised a provision because, based on detailed analysis and supported by external legal advice, it believes it unlikely that the matter will lead to an outflow of resources. If a decision goes against the Group, there may well be a considerable outflow of resources.
x € 1.000

211Heijmans Annual Report 2020
FINANCIAL STATEMENTS
Notes related to the consolidated financial statements
The Group has not recognised an asset in respect of its claim because the criteria for doing so are not satisfied in view of the complexity of the case. In 2018, the Group wrote off approximately €10 million, mainly in respect of unpaid invoices and costs incurred, as well as the settlement of obligations to which it is already committed. As a consequence, the Group has not recognised any amounts relating to this cancelled project on the face of the statement of financial position.
Financing Note 6.21 discloses the conditions attached to the financing in greater detail. An important condition involves satisfying the banking covenant ratios, specifically the interest cover ratio, the leverage ratio, the average leverage ratio and the solvency ratio. Proper management of project risks (see above) is crucial to meeting the ratios. The same applies to the achievement of the 2021 business plan and longer-term projection.
Pensions The key actuarial assumptions for the calculation of the pension obligations are outlined in note 6.22.
Deferred tax assetsFor more information on the key assumptions used in the measurement of deferred tax assets, refer to note 6.14 ‘Deferred tax assets and liabilities’.
Strategic land holdingsFor more information on the key assumptions used in the measurement of the strategic land holdings, refer to note 6.15 ‘Inventories’.
Intangible assetsFor the main principles used in the annual determination of the recoverable amount of intangible assets, see note 6.11 ‘Intangible assets’.
x € 1.000

212 Heijmans Annual Report 2020
FINANCIAL STATEMENTS
Subsidiaries and joint operations
x € 1.000
The following entities were included in the consolidation in 2020. Wholly-owned entities are subsidiaries. The remaining entities are joint operations. For practical reasons, entities of only minor significance are not included in this list. A complete list of the subsidiaries included in the consolidation is deposited with the Trade Register at the Chamber of Commerce in Eindhoven.
31 december 2020 31 december 2019
Heijmans Nederland B.V., Rosmalen 100% 100%
Heijmans Vastgoed B.V., Rosmalen 100% 100%Heijmans Vastgoed Deelnemingen B.V. Rosmalen 100% 100%V.O.F. Oosterlinge 2 50% 50%Westergouwe V.O.F. 50% 50%
Heijmans Woningbouw B.V., Rosmalen 100% 100%Heijmans Huizen B.V., Huizen 100% 100%Bouwcombinatie Gasthuiskwartier V.O.F., Rosmalen 50% 50%Bouwcombinatie HoogDalem V.O.F., Rosmalen 50% 50%
Heijmans Utiliteit B.V., Rosmalen 100% 100%Heijmans Utiliteit Metaal B.V., Rosmalen 100% 100%Hart van Zuid V.O.F., Nieuwegein 50% 50%Bouwcombinatie EMA V.O.F., Cruquius 50% 50%
Heijmans Infrastructuur B.V., Rosmalen 100% 100%
Heijmans Infra B.V., Rosmalen 100% 100%Sas van Vreeswijk V.O.F., Barendrecht 33% 33%ZuidPlus V.O.F., Amstelveen 15% 15%Combinatie Heijmans - Gebroeders Pol - Van Voskuilen Woudenberg V.O.F., Rosmalen 50% 50%
Heijmans Facilitair Bedrijf B.V., Rosmalen 100% 100%
Heijmans Materieel Beheer B.V., Rosmalen 100% 100%
7. Subsidiaries and joint operations

213Heijmans Annual Report 2020
FINANCIAL STATEMENTS
Company financial statements
x € 1.000
8.1 General
The company financial statements are part of the 2020 financial statements of Heijmans N.V.
Please refer to the notes to the consolidated statement of profit or loss and statement of financial position for items in the company statement of profit or loss and statement of financial position for which no additional explanations are provided.
8.2 Accounting policies for measuring assets and liabilities and the determination of results
For determining the accounting policies to use for measuring the assets and liabilities and the determination of results of its separate financial statements, Heijmans N.V. makes use of the option provided in Section 362(8) of Book 2 of the Dutch Civil Code. This means that the basis for measuring assets and liabilities and the determination of results (accounting policies) applied in the separate financial statements of Heijmans N.V. are the same as those applied in the consolidated EU-IFRS financial statements. Investees over which significant control is exercised are recognised using the equity method. Any impairment of the receivables from group companies relating to expected credit losses is eliminated in the recognised amounts and consequently does not affect the statement of profit or loss or the statement of financial position in any way.
Heijmans N.V. is registered with the Chamber of Commerce under number 16004309.
The share in the result of investees consists of the share of Heijmans N.V. in the result of these investees. Results from transactions where there is a transfer of assets and liabilities between Heijmans N.V. and its investees or between investees themselves are not recognised insofar as they can be deemed to be unrealised.
For details of the remuneration of the members of the Supervisory Board and the Executive Board, see note 6.28 to the consolidated financial statements.
8. Company financial statements
x € 1.000
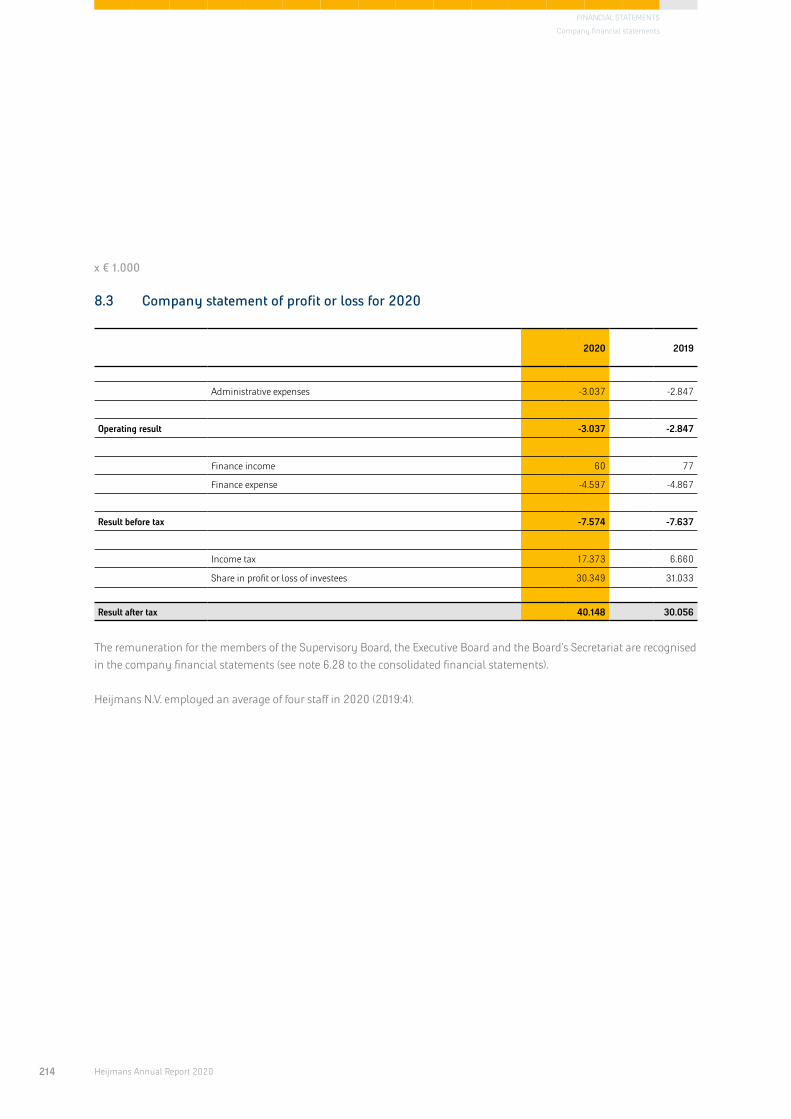
214 Heijmans Annual Report 2020
FINANCIAL STATEMENTS
Company financial statements
x € 1.000
8.3 Company statement of profit or loss for 2020
2020 2019
Administrative expenses -3.037 -2.847
Operating result -3.037 -2.847
Finance income 60 77
Finance expense -4.597 -4.867
Result before tax -7.574 -7.637
Income tax 17.373 6.660
Share in profit or loss of investees 30.349 31.033
Result after tax 40.148 30.056
The remuneration for the members of the Supervisory Board, the Executive Board and the Board’s Secretariat are recognised in the company financial statements (see note 6.28 to the consolidated financial statements). Heijmans N.V. employed an average of four staff in 2020 (2019:4).

215Heijmans Annual Report 2020
FINANCIAL STATEMENTS
Company financial statements
x € 1.000
8.4 Company statement of financial position at 31 December 2020 (before appropriation of result)
Assets 31 december 2020 31 december 2019
Non-current assets
Intangible assets 21.207 21.207
Financial assets 69.868 67.699
91.075 88.906
Current assets
Receivables 495.628 466.331
Cash and cash equivalents 47.179 0
542.807 466.331
633.882 555.237
Equity and liabilities 31 december 2020 31 december 2019
Equity
Issued capital 6.580 6.423
Share premium 245.773 242.680
Hedging reserve 0 -666
Reserve for actuarial results -55.635 -59.969
Reserve for Bonus Investment Share Matching Plan 344 297
Statutory reserve for investees 43.859 46.959
Retained earnings -54.660 -87.816
Result after tax for the current financial year 40.148 30.056
226.409 177.964
Non-current liabilities 38.748 41.800
Current liabilities 368.725 335.473
633.882 555.237

216 Heijmans Annual Report 2020
FINANCIAL STATEMENTS
Company financial statements
x € 1.000
8.5 Notes to the company statement of financial position
Intangible assets (goodwill) 2020 2019
Carrying amount
Balance at 1 January 21.207 21.207
Balance at 31 December 21.207 21.207
Financial assets 2020 2019
Investments in Group companies 38.150 38.406
Deferred tax asset 31.718 29.293
Total financial assets 69.868 67.699
Investments in Group companies
Balance at 1 January -48.512 -78.312
Share in results of investees after tax 30.349 31.033
Dividends received from investees 0 0
Capital contributions 0 0
Changes in cash flow hedges 666 -452
Changes in actuarial results relating to employee benefits 4.334 -781
Balance at 31 December -13.163 -48.512
Set off against receivables from Group companies -51.313 -86.918
Recognised under financial assets 38.150 38.406
The share in results of investees after tax includes the gains on the sale of investees. The investments in Group companies are direct or indirect interests in them. The principal Group companies are listed on page 76.
Deferred tax assetsDeferred tax assets relate to losses of the Heijmans N.V. tax group which have been recognised but not yet utilised. The movements in the financial year were as follows:

217Heijmans Annual Report 2020
FINANCIAL STATEMENTS
Company financial statements
x € 1.000
2020 2019
Balance at 1 January 29.293 33.890
Effect of changes in the tax rate 3.632 1.995
Charge for the financial year -14.597 -9.189
Recognition of previously unrecognised losses 13.390 2.597
Balance at 31 December 31.718 29.293
See note 6.14 to the consolidated financial statements for details of the deferred tax asset relating to losses of the Heijmans N.V. tax group which have not yet been utilised.
Receivables 31 december 2020 31 december 2019
Group companies 495.559 465.768
Other receivables 69 563
495.628 466.331
The receivables are due within one year.
Cash and cash equivalentsCash balances are at the free disposal of the Company.
Equity
2020 Issued capital
Share premium
reserve
Reserve for actuarial
resultsHedging reserve
Reserve for Bonus
Investment Share
Matching Plan
Statutory reserve for
investees Retained earnings
Result for the year after tax Total Equity
Balance at 1 January 6.423 242.680 -59.969 -666 297 46.959 -87.816 30.056 177.964
Share issue 157 3.093 0 0 0 0 0 0 3.250
Reclassification 0 0 0 0 0 -3.100 3.100 0 0
Bonus Investment Share Matching Plan 0 0 0 0 47 0 0 0 47
Appropriation of result for 2019 0 0 0 0 0 0 30.056 -30.056 0
Comprehensive income 0 0 4.334 666 0 0 0 40.148 45.148
Balance at 31 December 6.580 245.773 -55.635 0 344 43.859 -54.660 40.148 226.409
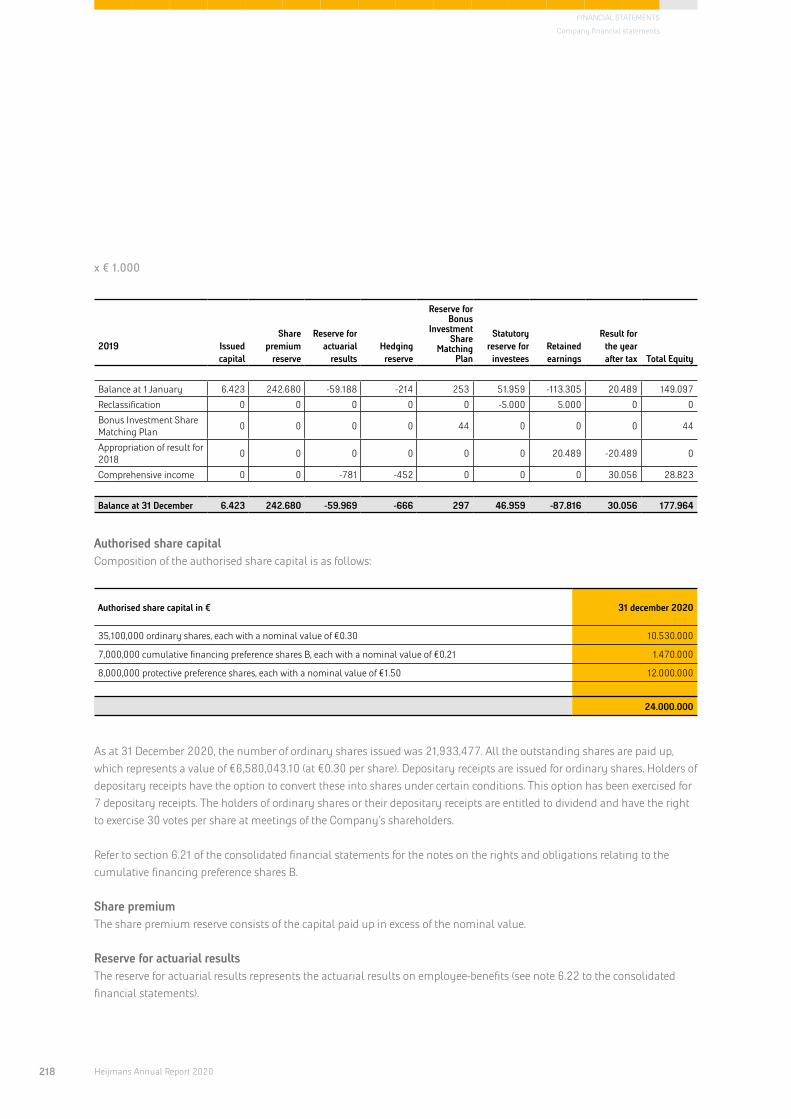
218 Heijmans Annual Report 2020
FINANCIAL STATEMENTS
Company financial statements
x € 1.000
Authorised share capital Composition of the authorised share capital is as follows:
Authorised share capital in € 31 december 2020
35,100,000 ordinary shares, each with a nominal value of €0.30 10.530.000
7,000,000 cumulative financing preference shares B, each with a nominal value of €0.21 1.470.000
8,000,000 protective preference shares, each with a nominal value of €1.50 12.000.000
24.000.000
As at 31 December 2020, the number of ordinary shares issued was 21,933,477. All the outstanding shares are paid up, which represents a value of €6,580,043.10 (at €0.30 per share). Depositary receipts are issued for ordinary shares. Holders of depositary receipts have the option to convert these into shares under certain conditions. This option has been exercised for 7 depositary receipts. The holders of ordinary shares or their depositary receipts are entitled to dividend and have the right to exercise 30 votes per share at meetings of the Company’s shareholders.
Refer to section 6.21 of the consolidated financial statements for the notes on the rights and obligations relating to the cumulative financing preference shares B.
Share premiumThe share premium reserve consists of the capital paid up in excess of the nominal value.
Reserve for actuarial results The reserve for actuarial results represents the actuarial results on employee-benefits (see note 6.22 to the consolidated financial statements).
2019 Issued capital
Share premium
reserve
Reserve for actuarial
resultsHedging reserve
Reserve for Bonus
Investment Share
Matching Plan
Statutory reserve for
investees Retained earnings
Result for the year after tax Total Equity
Balance at 1 January 6.423 242.680 -59.188 -214 253 51.959 -113.305 20.489 149.097
Reclassification 0 0 0 0 0 -5.000 5.000 0 0
Bonus Investment Share Matching Plan 0 0 0 0 44 0 0 0 44
Appropriation of result for 2018 0 0 0 0 0 0 20.489 -20.489 0
Comprehensive income 0 0 -781 -452 0 0 0 30.056 28.823
Balance at 31 December 6.423 242.680 -59.969 -666 297 46.959 -87.816 30.056 177.964

219Heijmans Annual Report 2020
FINANCIAL STATEMENTS
Company financial statements
x € 1.000
Hedging reserveThe hedging reserve represents the effective portion of the cumulative net change in the fair value of the cash flow hedging instruments relating to hedged transactions that have not yet occurred. This reserve is not freely distributable.
Reserve for Bonus Investment Share Matching PlanFor information on the reserve for the Bonus Investment Share Matching Plan, see note 6.28 to the consolidated financial statements.
Reserve for investeesThe statutory reserve for investees represents the difference between the retained earnings and the direct changes in equity as calculated using the parent company’s accounting policies on the one hand and that portion for which the parent company can determine distribution on the other hand. The statutory reserve is determined for each investee individually. This reserve is not freely distributable.
Appropriation of resultIt is proposed to distribute 40% of the result after tax as dividend on ordinary shares of their depository receipts and to add the remainder, of approximately €30 million, to the reserves, as stated in appendix 16.1 of the report.
Payables 31 december 2020 31 december 2019
Non-current liabilities
Financing preference shares 38.748 41.800
Syndicated bank financing 0 0
38.748 41.800
Current liabilities
Group companies 362.097 253.216
Dividend payable on financing preference shares 3.093 3.252
Banks 0 74.954
Syndicated bank financing 0 0
Financing preference shares 3.100 3.300
Other liabilities 435 751
368.725 335.473

220 Heijmans Annual Report 2020
FINANCIAL STATEMENTS
Company financial statements
x € 1.000
8.6 Liabilities not disclosed in the statement of financial position
Contingent liabilities 31 december 2020 31 december 2019
Bank guarantees 124.393 142.696
Group guarantees to clients 316.661 320.956
Group guarantees to credit institutions 20.658 23.788
461.712 487.440
For information on the guarantees, see note 6.27 to the consolidated financial statements.
Joint and several liability and guarantees With the exception of Heijmans Deutschland B.V., Heijmans Technology B.V, Brabotech Metselwerken B.V, Heijmans Management Deelnemingen B.V., Heijmans Management Gebiedsontwikkeling a/d Maas B.V, Heijmans Infra A27/A1 B.V, Heijmans Energie B.V. and Matching Materials B.V., statements of joint and several liability as referred to under Section 403(1)(f) of Book 2 of the Dutch Civil Code have been filed with the Trade Register of the respective Chambers of Commerce for all the Dutch wholly owned subsidiaries included in the consolidated figures.
Tax group Together with its Dutch subsidiaries, Heijmans N.V. forms a tax group for the purposes of corporate income tax and value added tax. In accordance with the standard applicable conditions, each company is jointly and severally liable for the tax liabilities of every company that is part of the tax group.
Share in results of investees This is the company’s share in the results of its investees, all of which are Group companies.
Movements in financing preference shares 2020 2019
Opening balance 45.100 45.100
Redeemed -3.252 0
Closing balance 41.848 45.100

221Heijmans Annual Report 2020
FINANCIAL STATEMENTS
Company financial statements
x € 1.000x € 1.000
Auditors’ fees The following fees for Ernst & Young Accountants LLP have been charged to the Company, its subsidiaries and other companies included in the consolidated figures. These are disclosed in accordance with the provisions in Section 382a Book 2 of the Dutch Civil Code.
x € 1.000 2020
Ernst & Young Accountants LLP
Other EY network firms
Total EY
Examination of the financial statements 1.741 - 1.741
Other audit engagements 96 10 106
Tax consultancy services - - 0
Other non-audit services 26 - 26
1.863 10 1.873
In addition to performing the audit of the financial statements required by law, Ernst & Young Accountants LLP provided the following permitted services: assurance report relating to the sustainability information contained in the directors’ report, in particular agreed activities with respect to the ‘Compliance Certificate’ for the banking group and various specific declarati-ons concerning revenue, key figures and projects. The costs relating to the examination of the financial statements for the foreign subsidiaries are billed directly by Ernst & Young Accountants LLP.
x € 1.000 2019
Ernst & Young Accountants LLP
Other EY network firms
Total EY
Examination of the financial statements 1.695 - 1.695
Other audit engagements 99 9 108
Tax consultancy services - - 0
Other non-audit services - - 0
1.794 9 1.803
Events after balance dateIn the period prior to signing, no significant events occurred that would have an effect on these financial statements other than those explained in the consolidated financial statements.
Rosmalen, 19 February 2021
the members of the Executive Board A.G.J. HillenJ.G. Janssen
the members of the Supervisory BoardSj.S. VollebregtR. IckeM.M. JonkJ.W.M. Knape-Vosmer G.A. Witzel

16 Appendices16.1 Appropriation of result 22316.2 Statement by the Executive Board 22416.3 Risk matrix 22516.4 Independent auditor’s report 23316.5 Assurance report by the independent auditor 24016.6 Remuneration report 24316.7 Other appendices 25116.7.1 Heijmans Share Administration Trust 25116.7.2 The Heijmans Preference Share Trust 25416.7.3 Reporting methodology 25516.7.4 KPI table 25616.7.5 GRI Standards: general disclosures 26116.7.6 Management Approach overview 26216.7.7 GRI Standards: specific disclosures 26416.7.8 EU Directive Non-Financial Information and
Diversity information reference table 26516.7.9 Sustainable Development Goals 26616.7.10 Human rights 27016.7.11 Tax policy 27016.7.12 Heijmans BIM ladder 27316.7.13 Heijmans bold statements 27416.7.14 Overview legal structure 27416.7.15 Glossary of terms 27516.7.16 Abbreviations 277

223Heijmans Annual Report 2020
APPENDICES
16.1 Result appropriation
In accordance with Article 31 of the Articles of Association, profit is distributed as follows:• subject to the approval of the Supervisory Board, the
Executive Board transfers as much of the profit to the reserves as it deems necessary;
• in so far as the profit is not transferred to the reserves, it is available to the General Meeting of Shareholders in whole or in part for transfer to the reserves or in whole or in part for distribution to the holders of ordinary shares in proportion to the number of ordinary shares held.
Subject to approval by the Supervisory Board, the Executive Board has decided to pay out 40% of the result after tax, amounting to € 40 million, as dividend on the (depository receipts for) ordinary shares and to add the remainder to the reserves.
Dividend policyHeijmans N.V. maintains a dividend policy whereby, except in special circumstances, the pay-out ratio amounts to 40% of the profit from ordinary business operations after tax.

224 Heijmans Annual Report 2020
APPENDICES
16.2 Statement by the Executive Board
To fulfil their legal obligation pursuant to Section 2:101(2) of the Dutch Civil Code and Section 5: 25c(2)(c) of the Dutch Financial Supervision Act (Wft), each member of the Executive Board states that to the best of their knowledge:
• the financial statements give a true and fair view of the assets, the liabilities, the financial position and the results of the Company and the companies included in the consolidation;
and:
• the annual report provides a true and fair view of the situation as at 31 December 2020 and the develop-ments at the Company and its affiliated companies during the 2020 financial year, and of the data presented in its financial statements, and that the annual report describes the material risks the issuing institution faces.
Supplementary to the above, each member of the Executive Board states that, to the best of their knowledge:
• the report provides sufficient insight into any deficiencies in the effectiveness of the Company’s risk management and control systems (see chapter 14.4 Risk management and appendix 16.3 Risk matrix);
• the above-mentioned systems provide a reasonable level of assurance that the financial reporting does not contain any material inaccuracies (see chapter 14.4 Risk management and appendix 16.3 Risk matrix);
• that on the basis of the current state of affairs it is justified that the financial reporting was prepared on the basis of a going concern (see chapter 15. Financial statements – explanatory notes);
and:
• the report cites the material risks and uncertainties that are relevant in terms of the expectations regard-ing the continuity of the Company for the period of twelve months after the preparation of the report (see chapter 6. ‘Sector developments and trends’, chapter 12. Financial results – Outlook, chapter 14.4 Risk management and appendix 16.3 Risk matrix).
Rosmalen, 19 February 2021
A.G.J. HillenJ.G. Janssen

225Heijmans Annual Report 2020
APPENDICES
16.3 Risk matrix
Strategic risks Impact Risk Trend Control measures
Economic downturn
Covid-19
PAS/PFAS nitrogen
Property development and Residential building
Non-residential
Infra
H ↓ The Covid-19 crisis has a major impact on economic growth.
In the event of a prolonged Covid-19 outbreak, in which many people lose their jobs, this could have an impact on consumer confidence. These signals, such as the demand for homes, have so far been limited. However, it is not possible to rule out that this sales climate will change to some extent.
Covid-19 has pushed issues that arose in 2019, such as PAS and PFAS, to the background somewhat. The government seems to have defined workable thresholds for PFAS. However, it has not yet found a workable solution for the nitrogen emissions problem, which could have a major impact on infrastructure projects.
Property development and construction are cyclical, so an economic upturn results in rising input and output prices, while an economic downturn results in a drop in demand and falling input prices.
The impact on non-residential projects is greater than on residential project. However, for Heijmans, these segments are traditionally lesser focus areas.
Heijmans’ infra activities are late-cyclical and less sensitive to economic upturns and downturns, as they largely depend on government spending, which is fairly stable in terms of volume. In addition, government stimulus measures can sometimes compensate for economic downturns.
• Maintaining sufficient room in financing facilities to absorb impact of a downturn.
• Impact analyses and control measures at project level. • Maintaining a balanced portfolio of large and small projects in
both new-build and service activities within Infra and Building.• Active knowledge exchange across the business areas.• Proactive search for innovative solutions.• The construction of property development projects only starts
if pre-sale targets have been met.• Heijmans aims for a healthy balance between home sales to
private buyers and home sales to the likes of housing corporations and investors.
• Heijmans was the co-initiator of Stichting Emissieloos Netwerk Infra (foundation for an emission-free network infra sector) with the aim of moving towards emission-free working in the construction industry.
Additional focus 2021:• Active knowledge exchange with national and local
government authorities, via industry organisations, etc.• Accelerated investments in improving the sustainability of
materials.
Risk matrix legend
Risk impact on key figures H High risk M Medium riskL Low risk
Trend compared with 2019 Improved Deteriorated= Unchanged
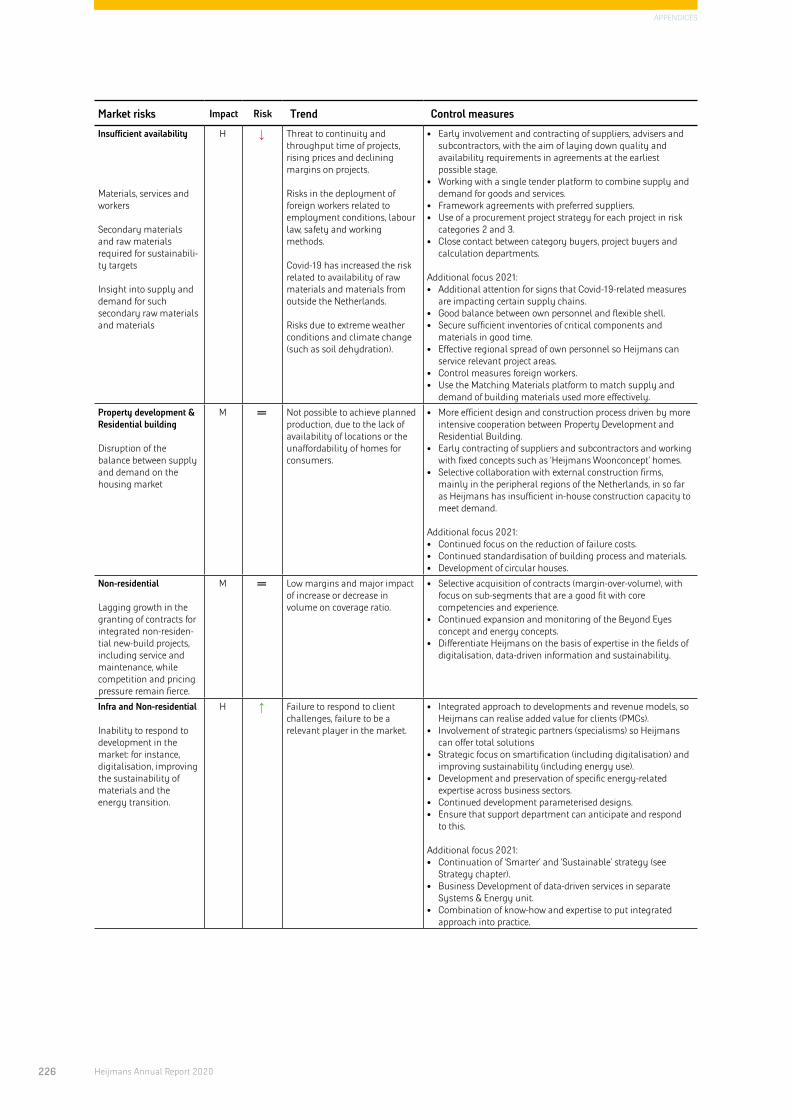
226 Heijmans Annual Report 2020
APPENDICES
Market risks Impact Risk Trend Control measures
Insufficient availability
Materials, services and workers
Secondary materials and raw materials required for sustainabili-ty targets
Insight into supply and demand for such secondary raw materials and materials
H ↓ Threat to continuity and throughput time of projects, rising prices and declining margins on projects.
Risks in the deployment of foreign workers related to employment conditions, labour law, safety and working methods.
Covid-19 has increased the risk related to availability of raw materials and materials from outside the Netherlands.
Risks due to extreme weather conditions and climate change (such as soil dehydration).
• Early involvement and contracting of suppliers, advisers and subcontractors, with the aim of laying down quality and availability requirements in agreements at the earliest possible stage.
• Working with a single tender platform to combine supply and demand for goods and services.
• Framework agreements with preferred suppliers. • Use of a procurement project strategy for each project in risk
categories 2 and 3.• Close contact between category buyers, project buyers and
calculation departments.
Additional focus 2021:• Additional attention for signs that Covid-19-related measures
are impacting certain supply chains. • Good balance between own personnel and flexible shell.• Secure sufficient inventories of critical components and
materials in good time.• Effective regional spread of own personnel so Heijmans can
service relevant project areas.• Control measures foreign workers.• Use the Matching Materials platform to match supply and
demand of building materials used more effectively.
Property development & Residential building
Disruption of the balance between supply and demand on the housing market
M ═ Not possible to achieve planned production, due to the lack of availability of locations or the unaffordability of homes for consumers.
• More efficient design and construction process driven by more intensive cooperation between Property Development and Residential Building.
• Early contracting of suppliers and subcontractors and working with fixed concepts such as ‘Heijmans Woonconcept’ homes.
• Selective collaboration with external construction firms, mainly in the peripheral regions of the Netherlands, in so far as Heijmans has insufficient in-house construction capacity to meet demand.
Additional focus 2021:• Continued focus on the reduction of failure costs.• Continued standardisation of building process and materials.• Development of circular houses.
Non-residential
Lagging growth in the granting of contracts for integrated non-residen-tial new-build projects, including service and maintenance, while competition and pricing pressure remain fierce.
M ═ Low margins and major impact of increase or decrease in volume on coverage ratio.
• Selective acquisition of contracts (margin-over-volume), with focus on sub-segments that are a good fit with core competencies and experience.
• Continued expansion and monitoring of the Beyond Eyes concept and energy concepts.
• Differentiate Heijmans on the basis of expertise in the fields of digitalisation, data-driven information and sustainability.
Infra and Non-residential
Inability to respond to development in the market: for instance, digitalisation, improving the sustainability of materials and the energy transition.
H ↑ Failure to respond to client challenges, failure to be a relevant player in the market.
• Integrated approach to developments and revenue models, so Heijmans can realise added value for clients (PMCs).
• Involvement of strategic partners (specialisms) so Heijmans can offer total solutions
• Strategic focus on smartification (including digitalisation) and improving sustainability (including energy use).
• Development and preservation of specific energy-related expertise across business sectors.
• Continued development parameterised designs.• Ensure that support department can anticipate and respond
to this.
Additional focus 2021:• Continuation of ‘Smarter’ and ‘Sustainable’ strategy (see
Strategy chapter).• Business Development of data-driven services in separate
Systems & Energy unit. • Combination of know-how and expertise to put integrated
approach into practice.
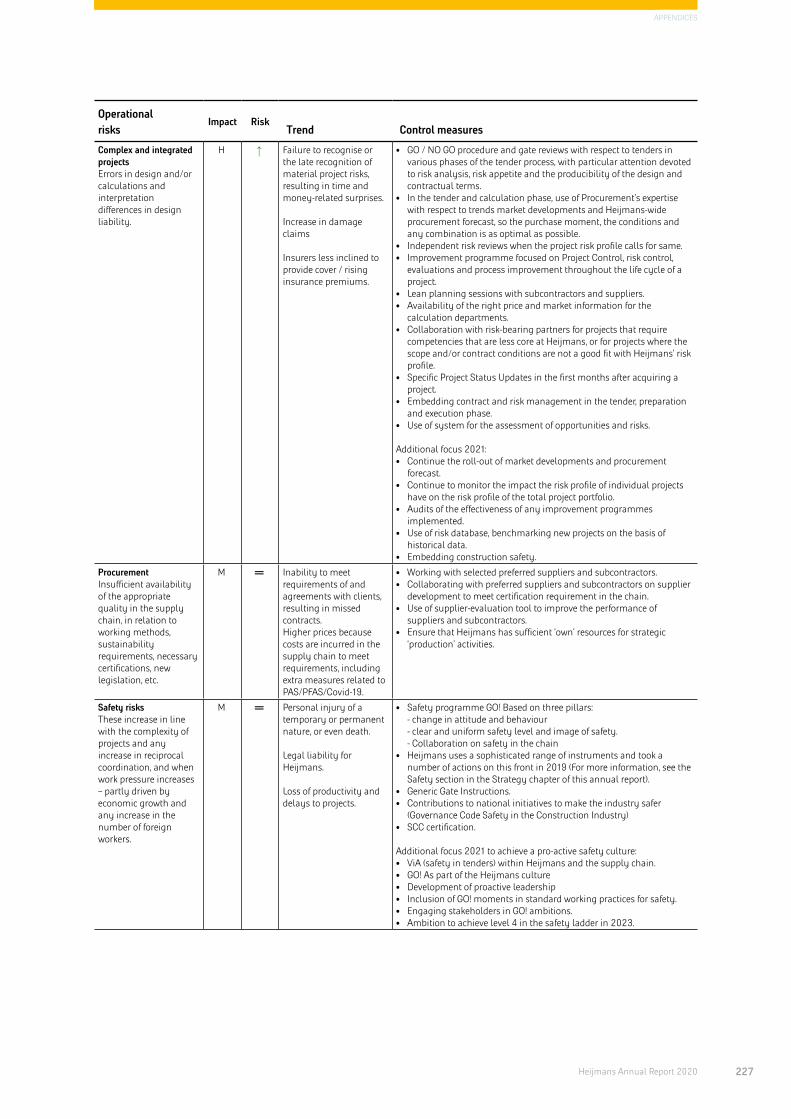
227Heijmans Annual Report 2020
APPENDICES
Operational risks
Impact Risk Trend Control measures
Complex and integrated projectsErrors in design and/or calculations and interpretation differences in design liability.
H ↑ Failure to recognise or the late recognition of material project risks, resulting in time and money-related surprises.
Increase in damage claims
Insurers less inclined to provide cover / rising insurance premiums.
• GO / NO GO procedure and gate reviews with respect to tenders in various phases of the tender process, with particular attention devoted to risk analysis, risk appetite and the producibility of the design and contractual terms.
• In the tender and calculation phase, use of Procurement’s expertise with respect to trends market developments and Heijmans-wide procurement forecast, so the purchase moment, the conditions and any combination is as optimal as possible.
• Independent risk reviews when the project risk profile calls for same.• Improvement programme focused on Project Control, risk control,
evaluations and process improvement throughout the life cycle of a project.
• Lean planning sessions with subcontractors and suppliers.• Availability of the right price and market information for the
calculation departments.• Collaboration with risk-bearing partners for projects that require
competencies that are less core at Heijmans, or for projects where the scope and/or contract conditions are not a good fit with Heijmans’ risk profile.
• Specific Project Status Updates in the first months after acquiring a project.
• Embedding contract and risk management in the tender, preparation and execution phase.
• Use of system for the assessment of opportunities and risks.
Additional focus 2021:• Continue the roll-out of market developments and procurement
forecast.• Continue to monitor the impact the risk profile of individual projects
have on the risk profile of the total project portfolio.• Audits of the effectiveness of any improvement programmes
implemented.• Use of risk database, benchmarking new projects on the basis of
historical data.• Embedding construction safety.
ProcurementInsufficient availability of the appropriate quality in the supply chain, in relation to working methods, sustainability requirements, necessary certifications, new legislation, etc.
M ═ Inability to meet requirements of and agreements with clients, resulting in missed contracts.Higher prices because costs are incurred in the supply chain to meet requirements, including extra measures related to PAS/PFAS/Covid-19.
• Working with selected preferred suppliers and subcontractors.• Collaborating with preferred suppliers and subcontractors on supplier
development to meet certification requirement in the chain.• Use of supplier-evaluation tool to improve the performance of
suppliers and subcontractors. • Ensure that Heijmans has sufficient ‘own’ resources for strategic
‘production’ activities.
Safety risks These increase in line with the complexity of projects and any increase in reciprocal coordination, and when work pressure increases – partly driven by economic growth and any increase in the number of foreign workers.
M ═ Personal injury of a temporary or permanent nature, or even death.
Legal liability for Heijmans.
Loss of productivity and delays to projects.
• Safety programme GO! Based on three pillars: - change in attitude and behaviour - clear and uniform safety level and image of safety. - Collaboration on safety in the chain
• Heijmans uses a sophisticated range of instruments and took a number of actions on this front in 2019 (For more information, see the Safety section in the Strategy chapter of this annual report).
• Generic Gate Instructions. • Contributions to national initiatives to make the industry safer
(Governance Code Safety in the Construction Industry)• SCC certification.
Additional focus 2021 to achieve a pro-active safety culture:• ViA (safety in tenders) within Heijmans and the supply chain.• GO! As part of the Heijmans culture• Development of proactive leadership• Inclusion of GO! moments in standard working practices for safety.• Engaging stakeholders in GO! ambitions. • Ambition to achieve level 4 in the safety ladder in 2023.

228 Heijmans Annual Report 2020
APPENDICES
Operational risks
Impact Risk Trend Control measures
Environmental and health risks
L ═ Construction sometimes requires physical exertion and is often outdoors. Heijmans works with hazardous substances and produces industrial waste in the normal course of its business operations. In addition, these operations may result in environmental emissions, such as nitrogen, PFAS or dust particles.
• Extensive employment terms policy and improvement programmes focused on working conditions.
• Prevention team with specialists and representatives from the organisation.
• Heijmans has an ISO 14.001 certified environmental management system that identifies and assesses environmental risks and ensures that measures are taken when necessary.
• Measures vary from physical interventions (containment tanks, filters) to organisational measures (procedures, inspections, audits, training courses).
• Use of Toxic for the registration of hazardous substances.• Heijmans sets requirements for the use of hazardous substances by
subcontractors and the deliveries from suppliers.• Heijmans actively searches for less hazardous/non-hazardous and
more sustainable alternatives.
Climate risks L ═ Accelerating climate change will exacerbate the impact of extreme weather conditions. In addition, we may see more extremely hot summers and this may restrict the transhipment of raw materials by water.
• Measures at building sites to prevent damage as a result of weather conditions (covering/securing).
• Heat protocol and the inclusion of heat-resistant clothing in the clothing package.
• Adjustment of working hours and planning. • The development of climate-neutral buildings and the design of
buildings with adequate water drainage.• For more detailed information, see the public information on the
Carbon Disclosure Project. • When selecting subcontractors, Heijmans takes into account their
transport methods for raw materials and other materials to reduce the risk of any loss in continuity.
Real estate and land holdings:
Risk of deviations from assessments and estimates.
M ═ This risk is generally greater for land holdings without a zoning plan than land holdings with a zoning plan.
Local policies with respect to PAS and PFAS interpretations, which make it more difficult to estimate the develop-ment potential of land holdings.
• Heijmans uses strict procedures to manage risks arising from investments in land holdings or from entering into long-term commitments, with explicit approval from the Executive Board required for all larger investments. In accordance with the policy on this front, Heijmans only invests in land holdings that can be developed within five years.
• When determining the indirect realisable value takes, Heijmans takes into account uncertainties related to strategic land holdings, such as demographic developments, location, the design and working up of development plans and (local) government decision-making, and does this as location-specifically as possible. This provides a location-specific forecast of developments in land and house prices and other variables, which ultimately determine the indirect realisable value of the land holdings. Heijmans conducts twice-yearly internal assessments of the valuation of its entire portfolio of land holdings.
Infra and Non-residential
Range of contract types in the market, contract types that impose increasing levels of responsibility on Heijmans.
H ═ Responsibilities for issues in areas where Heijmans has insufficient in-house expertise, or in the absence of insight into or influence on the related risks. This can lead to unacceptable risks.
• Alignment with clients to achieve a balanced distribution of risks, in line with McKinsey analysis for RWS (Ministry of Public Works and Waterways). Across the entire portfolio, Heijmans increasingly selects and pre-sorts projects on the basis of building teams/alliance contracts with a two-phase structure.
• Selective acquisition policy, with particular attention for the type of tender, the acquisition process, as well as the procurement, project and contract management.
• Tender board and independent risk review. • Professional contract management.• Guidelines for the accurate pricing of risks with an appropriate profit
margin.• Increased interaction between Risk Management, Risk Office, Contract
management, Project Management, Legal Affairs and Procurement disciplines.
• Contracting of suppliers and subcontractors in line with the liabilities assumed.
• Strategic partnering with clear parameters and premises, working methods and reporting lines laid down in Consortium Guidelines.
• Consortium Guidelines includes checklist for relevant actions taken in the various phases of a consortium.
• Focus on risk awareness, attitude and behaviour via corporate culture programmes and improvement programme to increase the predictability and risk-awareness of projects and to stress each party’s role in said projects.

229Heijmans Annual Report 2020
APPENDICES
Operational risks
Impact Risk Trend Control measures
Retention and recruitment of personnel
Risks on this front are increasing as a result of the tightness of the labour market and the sector’s relative lack of competitiveness on specific professional fields (such as e-technicians)
H ═ Having continued access to qualified and motivated personnel is a prerequisite for the execution of the company’s core activities in a professional manner.
1. Engaging and retaining qualified personnel through: - Good onboarding. - Action plans in response to engagement scans in the business
areas. - Adequate follow-ups to fleet review and execution of the strategic
personnel plan. - Management development and talent development policy. - Concrete efforts to foster diversity and inclusion across the entire
organisation and for all positions. - Continuous trainee programmes. - Active recruitment of students. - Regular benchmarking of employment terms and conditions. - Making employment terms and condition more flexible. 2. Active promotion referrals (Heijmans’ own personnel suggest new
colleagues).3. Professionalisation of labour market communications: use of newly
developed employer brand in targeted recruitment campaigns for strategic target groups.
Financial risks Impact Risk Trend Control measures
Liquidity risks H ↑ The liquidity risk pertains to the chance that the company’s financing needs are at some point greater than the available financial leeway provided by the financing facilities made available.Heijmans’ liquidity position has improved substantially in recent years, driven by improved working capital management. Thanks to this, Heijmans made no use of its financing facility in 2020.
The potential impact of a legal limitation on the payment terms to small and mid-sized companies to 30 days from the current 60 days, is a risk vis-à-vis the current working capital position.
• Active monitoring of liquidity movements on the basis of daily and weekly cash reports.
• Weekly testing to check whether liquidity forecasts are still up-to-date, 13-week rolling forecast.
• Monthly cash reviews with the financial directors of the business areas to discuss assumptions and map out risks for the period ahead.
• Liquidity movements are included in the quarterly reviews. • Specific cash themes to keep the focus on cash and cash flows
constantly updated. • The GO / NO GO criteria for new projects and the monitoring of
existing projects put emphasis on the need for effective financing schedules.
• Following the extension of the syndicated loan (through to mid-2023) and current agreement with the holders of the cumulative preference financing shares B, which runs to 2024, Heijmans has secured its financing facilities for the coming years.
Additional focus 2021:• Active monitoring and anticipation of potential limitation payment
terms to 30 days. • Monitoring of sales tempo of unsold homes under construction.• Continued improvement of management information through more
effective use of the treasury management system.
Solvency risk H ↑ Clients / suppliers may decide to exclude Heijmans from certain tenders or require additional bank guarantees for compliance with execution obligations if Heijmans fails to meet minimum solvency requirements. In addition, limited solvency reduces the chances of buying from suppliers on credit, and can also limit access to credit from financiers.
• Heijmans’ solvency has steadily improved in recent years thanks to four consecutive years of net profit, and profit retention has strengthened the company’s capital position. The company has further optimised its balance sheet by reducing invested capital and using the proceeds to reduce borrowings.
• This more than offset the negative impact of around € 80 mln on the solvency of the extended balance sheet due to the introduction IFRS 16 Leases.
• Heijmans will continue to focus on strict working capital manage-ment. The average days outstanding remains low and work in progress is still at a good level.
• Taking a more conservative approach to the determination of deferred tax positions has made Heijmans less vulnerable to downward value adjustments in times of economic downturn, which has in turn made the company’s solvency more robust.
• The reinsurance of the pension fund in 2018, which meant a deferred pension claim was no longer capitalised, also resulted in a more robust asset valuation. This also did away with the risk of any additional contributions to the pension fund.
• Clear agreements and information sent to other financial stakehold-ers to limit the risk of credit-limiting measures by guarantors and credit insurers.

230 Heijmans Annual Report 2020
APPENDICES
Financial risks Impact Risk Trend Control measures
Availability of bank guarantees
M ↑ The withdrawal of bank guarantee facilities may result in a situation in which Heijmans no longer has access to new bank guarantees, which may in turn mean that it cannot meet its contractual requirements in project tenders. A (too negative) change in the terms could lead to more stringent conditions, which could in turn damage Heijmans’ competitive position.
• Heijmans has a guarantee policy, which includes a detailed description of which conditions are set per type of guarantee, terms, amounts guaranteed, etc.
• Treasury tests all guarantee requests against the guarantee policy and these are then submitted to the various guarantors.
• For the issuance of new guarantees, Heijmans has five bank guarantee facilities. The available exposure on these bank guarantees is more than enough to meet any requests.
• Heijmans closely monitors the headroom (which stood at a very comfortable level of 60% at year-end 2020) in the guarantee facilities by drawing up a monthly Heijmans-wide overview that both estimates the status of issued guarantees and the need for new guarantees on the basis of current tender processes and projects.
• Intensive stakeholder management with bilateral financiers. In other words, keeping guarantors up-to-date on the financial situation and the importance of current exposure.
Creditworthiness of partners
M ═ If a partner is unable to meet its obligations, it is possible that Heijmans, as co-partner in the consortium formed for the project (usually a general partnership (V.O.F) or private limited liability company (B.V.)), could become liable for the execution of the entire scope of the project. This would render Heijmans financially and operationally responsi-ble for precisely that part of the scope for which Heijmans had sought a partner.
• It is standard procedure to test the creditworthiness of partners in advance. If this is considered inadequate, Heijmans seeks additional assurances. This can take the form of a financial guarantee, or Heijmans might explore the possibility of accruing sureties at the level of the consortium, such as the retention of consortium-based pre-financing reserves or safeguarding specific expertise and assets in the project company.
• Apart from the financial assurances, delivery security is also of great importance, certainly in collaborations in which the partner contributes very specific expertise or products. If this is deemed necessary, Heijmans considers in advance how this expertise or these products can be specifically attached to the project or contributed to the project in an alternative manner.
• The parties involved also sign a consortium agreement before submitting a tender quote. This includes a detailed demarcation of the respective obligations.
• In recent years, Heijmans has had a more selective approach to project acquisitions at Infra and Building & Technology. This includes submitting bids for projects that are a better fit with our core competencies and relatively fewer bids for large integrated projects. As a result of this approach, the proportion of projects Heijmans carries out as a part of a consortium has declined.
Legal and Compliancerisks
Impact Risk Trend Control measures
New business models are resulting in new forms of cooperation and new partners
M ═ The manner of the cooperation and the intended goal are insufficiently defined and/or the need to do so is recognised too late, which means that Heijmans interests are inadequately safeguarded.
• There is a growing recognition of the need to think about the manner of the cooperation and to lay down agreements related to same at an early stage.
• In line with a model drawn by the Risk Office, Heijmans’ management teams, Legal Affairs, Contract management, the Insurances department and Procurement are all involved at an early stage when entering into alliances.
• A collaboration is supposed to be more than the sum of its parts (1+1=3). This means that when drawing up a contract and in the contract management phase, we need to devote attention to the roles of the parties to the contract and their relative strengths and weaknesses.
• Existing knowledge is made as widely available as possible internally and whenever possible Heijmans draws up model agreements. Heijmans organises training courses to increase the depth of knowledge on this front.
• Heijmans has selected external experts to provide support whenever necessary.
Additional focus 2021: • In 2019 and 2020, Heijmans deepened and expanded in-house
expertise in IT and IP law, Circular Building and the energy transition. These areas are changing rapidly, so we will continue with these efforts in the years ahead.

231Heijmans Annual Report 2020
APPENDICES
Legal and Compliancerisks
Impact Risk Trend Control measures
New business models and social developments, for instance on the sustainability front, imply an increase in the importance of legal fields outside our traditional legal fields, such as intellectual property law, IT law, cyber security, the energy transition and environmental developments.
H ═ Due to a lack of knowledge and involvement, Heijmans might reach agreements (or fail to reach agreements) that do not serve Heijmans’ best interests.
Due to inadequate knowledge or inadequate cyber security with respect to data-driven services and software development and technology as a part of our products and services, there is a risk of data breaches, legal conflicts regarding ownership, guarantee and liability issues, supply chain liability and the consequences of hacks. Insufficient legal expertise may limit the innovative potential of the business areas.
• The Legal Affairs, Contract management and Insurance departments have improved and deepened their knowledge in this field.
• Heijmans employees know which internal experts to approach if they have any questions. Heijmans increasingly works at a group-wide level on this front.
• Procurement has a number of IT experts. • Heijmans does its utmost to preserve the value of know-how. How the
company handles intellectual property is subject to careful analysis.• Intellectual property rights are administered centrally. The
administration is kept up to date and Heijmans responds adequately to any infringements.
• In addition, Heijmans has contracted several external advisers to provide support. Among other things, this means we have effective and practical standard statements and agreements.
• Implementation of the long-term roadmap ‘Secure@Heijmans’.• The embedding of cyber security in the entire production process of
projects and products and services from the start, including working methods that provide tools throughout the entire lifecycle.
• Embedding cyber security as a subject in risk management.• Awareness and behaviour change for the entire organisation.
Additional focus 2021:• Heijmans will continue to work on increasing and deepening its
expertise in this field. Lawyers are the group-wide contact point at Heijmans. In close cooperation with the business, they will keep their expertise up to date and make it accessible within the organisation.
• Improving legal expertise related to the revenue models emerging from the energy transition (such as the Dutch Heating Act).
• Working in multi-disciplinary teams, so any developments are approached from a variety of angles.
(Long-running) disputes and legal procedures
H ↑ Disputes and legal procedures can have a major financial impact. If a dispute arises during a project in progress, this can have serious consequences for the execution and progress of a project (both time-wise and financially).
• In the tender phase, certainly for larger, more complex projects, Heijmans carries out intensive contract assessments (according to a fixed format).
• The tender team shares these assessments with Procurement, so these risks can also be weighed and included in contracts with suppliers and subcontractors.
• Heijmans makes sure contracts with various parties are harmonised by, whenever possible, using standard contracts, ensuring effective transition from tender to execution phase, and by limiting any changes in a project team.
• The insurance policy is tailored as much as possible to the business operations. Insurability is a major attention point in the tender phase.
• Heijmans is alert to so-called early warnings, such as delays, poor liquidity, cost overruns and bad atmosphere, and acts upon these warnings.
• In the event of (potential) disputes, Heijmans frequently puts together inter-disciplinary teams, who come together according to a standard procedure, providing the right knowledge, expertise and commitment to arrive at a good final result. If it proves impossible to prevent a legal procedure, Heijmans devotes careful consideration to which lawyer, expert and/or mediator it would be best to deploy.
• Initiation of alternative dispute mediation, ideally before there is an actual concrete dispute.
• Via the Heijmans Academy, Heijmans organises training courses on standard terms and conditions in the construction industry, such as the UAV and UAV-GC (uniform administrative conditions).
Additional focus 2021:• Heijmans will continue to strengthen the role of Contract
Management in the execution phase.• Heijmans will intensify the insurance assessment process in tenders.

232 Heijmans Annual Report 2020
APPENDICES
Legal and Compliancerisks
Impact Risk Trend Control measures
Compliance with the European General Data Protection Regulation (GDPR)
M ↑ From 25 May 2018, Heijmans’ business operations must be in compliance with the GDPR. Failure to comply could result in heavy fines.
• GDPR compliance is embedded in the organisation through the appointment of GDPR officers in the business areas, with second-line advice from privacy officers at group level.
• Model processing agreement is agreed with suppliers and subcontractors.
• Heijmans has drawn up a privacy policy and communicated this to all employees.
• Heijmans has drawn up a privacy code of conduct and communicated this to all employees.
• Reporting Procedure Data Breaches.• Heijmans has established and maintains a data processing register.• All employees are required to take an e-learning course in Cyber
security and Privacy. The e-leaning course are repeated for existing employees.
Additional focus in 2021:• Continuous focus on raising internal awareness via various means,
such as training, introduction and intranet messages.• GDPR year plan• Additional training for GDPR privacy officers.
Heijmans fails to abide by laws and (internal) regulations
H = The failure to abide by laws and regulations may result in material and immaterial damage to Heijmans.
• Heijmans has embedded monitoring and control mechanisms in operational processes.
• All employees are bound by the Heijmans Code of Conduct. The revised code will be published in early 2021, to coincide with an awareness campaign.
• Lawyers and other specialists identify and implement legal or regulatory changes. When necessary, Heijmans informs relevant staff and/or runs pilot projects and conducts audits. Heijmans’ member-ship of various industry organisations and working groups, and effective cooperation across the business areas generally makes it possible to identify developments at an early stage.
• The Compliance Officer initiates compliance consultations (with all relevant disciplines), in which the parties involved discuss compliance in the broadest sense and anticipate any developments.
• For specific subjects, Heijmans has semi-permanent basic pro-grammes to support adequate follow-up.
• The imposition of legislation and measures related to subcontracting (including the WAS (Act on sham (employment) arrangements) and WAV (Act on the use of foreign workers) labour regulations and the GDPR)
• Continuous embedding and audits of compliance with respect to HR-related risks pursuant to the WAS, the Act on Chain Liability (WKA), freelance employment regulations, the use of foreign workers and the protection of personal data.
Additional focus 2021:• Heijmans will continue to closely monitor culture and behaviour with
respect to laws and regulations. • Updating legal expertise related to the revenue models emerging from
the energy transition (i.e. Heating Act).• Integrity and conduct awareness campaign.• Monitoring the impact of health-related and environmental
legislation.
233Heijmans Annual Report 2020
APPENDICES
16.4 Independent auditor’s report
To: the shareholders and Supervisory Board of Heijmans N.V.
Report on the audit of the 2020 financial statements included in the annual report
Our opinionWe have audited the financial statements for the year ending on 31 December 2020 of Heijmans N.V., based in Rosmalen. The financial statements include the consoli-dated financial statements and the company financial statements.
In our opinion:• the consolidated financial statements included in this
annual report give a true and fair view of the financial position of Heijmans N.V. as at 31 December 2020, and of its result and its cash flows for the year then ended in accordance with International Financial Reporting Standards as adopted by the European Union (EU-IFRS) and with Part 9 of Book 2 of the Dutch Civil Code;
• the company financial statements included in this annual report give a true and fair view of the financial position of Heijmans N.V. as at 31 December 2020, and of its result for 2020 in accordance with Part 9 of Book 2 of the Dutch Civil Code.
The consolidated financial statements comprise:• the consolidated statement of financial position as at
31 December 2020;• the following statements for 2020: the consolidated
income statement, the consolidated statements of comprehensive income, the consolidated statements of changes in equity and the consolidated statements of cash flows;
• the notes, comprising a summary of the significant accounting policies and other explanatory information.
The company financial statements comprise:• the company balance sheet as at 31 December 2020;• the company profit and loss account for 2020;• the notes comprising a summary of the accounting
policies and other explanatory information.
Basis for our opinionWe conducted our audit in accordance with Dutch law, including the Dutch Standards on Auditing. Our responsi-bilities under those standards are further described in the ‘Our responsibilities for the audit of the financial state-ments’ section of our report.
We are independent of Heijmans N.V. in accordance with the EU Regulation on specific requirements regarding the statutory audit of the financial statements of public-interest entities, the ‘Wet toezicht accountantsorganisa-ties’ (Wta, Audit firms supervision act), the ‘Verordening inzake de onafhankelijkheid van accountants bij assu-rance-opdrachten’ (ViO, Code of Ethics for Professional Accountants, a regulation with respect to independence) and other relevant independence regulations in the Netherlands. Furthermore, we have complied with the ‘Verordening gedrags- en beroepsregels accountants’ (VGBA, Dutch Code of Ethics for the Auditing sector).
We believe the audit evidence we have obtained is sufficient and appropriate to provide a basis for our opinion.
Our audit approach
Our understanding of Heijmans N.V.Heijmans N.V. is a stock exchange-listed company that combines property development, building & technology and infra activities in the business areas property development, residential building, non-residential building and infrastructure. The group structure consists of various operational segments and we focused our audit on these. In our audit, we devoted specific attention to a number of subjects on the basis of the group’s activities and our own risk analysis.
We start by determining the materiality and identifying and estimating the risk that the financial statements contain material misstatements as a result of fraud, the failure to comply with legal and regulatory requirements or errors, in order to determine the audit procedures that are responsive to those risks to obtain audit information that is sufficient and appropriate to form the basis of our opinion. The risk of not detecting a material misstatement resulting from fraud is higher than for one resulting from error, as fraud may involve collusion, forgery, intentional omissions, misrepresentations, or the override of internal controls.

234 Heijmans Annual Report 2020
APPENDICES
Materiality
Materiality € 13 million (2019: € 11.5 million)
Benchmark applied
0.75% of the turnover for the financial year
Explanation On the basis of our professional judgement, we consider a benchmark based on activities the most appropri-ate basis for determining materiality. In view of the current market conditions, we consider revenue a stable and suitable basis, also in view of the insight this provides into the size and performance of the compa-ny. The percentage of revenue applied is in the middle of the accepted bandwidth. This is the same as in the previous financial year.
We have also taken into account misstatements and/or possible misstatements that in our opinion are material for the users of the financial statements for qualitative reasons.
We agreed with the supervisory board that misstatements in excess of € 650,000 identified during the audit would be reported to them, as well as smaller misstatements that in our view are relevant on qualitative grounds.
Scope of the group audit Heijmans N.V. is at the head of a group of entities. The financial information of this group is included in the consolidated financial statements of Heijmans N.V.
Because we are ultimately responsible for the opinion, we are also responsible for directing, supervising and performing the group audit. For this purpose, we deter-mined the nature and extent of the audit procedures to be carried out for group entities. Decisive in this respect were the size and/or the risk profile of the group entities or operations. On this basis, we selected group entities for which an audit or review had to be carried out on the complete set of financial information or specific items. Our group audit focused primarily on the operating segments. We performed the audit procedures at those segments via a number of centrally-managed EY teams. We also used the work of other EY and non-EY auditors when auditing a number of Heijmans’ partnerships with third parties. In cases where we used the work of other auditors, we provided instructions and were closely involved during the execution of the audit and reporting by these auditors.
In the aggregate, these audit procedures are close to representing the group’s entire revenues, results and assets.
By performing the procedures mentioned above at (group) entities, together with additional procedures carried out at group level, we were able to obtain sufficient and appropriate audit evidence about the group’s financial information to provide an opinion on the consolidated financial statements.
Our audit approach with respect to risks of fraud and the failure to comply with legal and regulatory requirements
Our responsibilityAlthough we are not responsible for the prevention of fraud or the failure to comply with legal and regulatory requirements and we cannot be expected to discover all failures to comply with any legal or regulatory require-ments, it is our responsibility to obtain a reasonable level of assurance that the financial statements as a whole do not contain any material misstatements as a result of errors or fraud.
The failure to comply with legal or regulatory require-ments can lead to fines, legal cases or other consequences for the company, which could have a material impact on the financial statements.
Our audit approach with respect to risks of fraud To identify and estimate the risks of material misstate-ments that are the result of fraud, we gained an under-standing of the company and its environment, including internal controls that are relevant for the audit, with the aim of selecting audit procedures that are appropriate in the circumstances. As in all our audits, we take into account the risk that management can override internal control measures. We review the internal controls not with the aim of expressing an opinion on the effectiveness of the company’s internal controls.
We considered the available information and requested additional information from the members of the Executive Board, other members the management (including legal affairs, compliance officer and segment directors) and the Supervisory Board. As part of the audit of the financial statements, we organised a workshop together with our forensic specialists in the presence of key officers. This was to increase awareness and to facilitate a dialogue on potential fraud risks and the measures taken.

235Heijmans Annual Report 2020
APPENDICES
As part of our process for the identification of fraud risks, we considered fraud risk factors with respect to fraudulent financial reporting and misstatements that arise from the misappropriation of assets. In our risk analysis, we considered the potential impact of the Executive Board’s variable bonus. In addition, we considered the risk of bribery and corruption.
As part of our process for the identification of fraud risks, we considered whether the Covid-19 pandemic resulted in specific fraud risks, due to the fact that remote working potentially rendered internal controls less effective as well as an increased level of cyber security risks.
We evaluated the design and implementation of control measures aimed at the mitigation of fraud risks and, insofar as we deemed necessary for the purposes of our audit approach, assessed the operation of these measures. In addition, we assessed estimates for tendencies, with the primary focus on material areas that require an opinion and significant estimated items, as explained in note 6.29 in the financial statements. We also used data analysis to detect and assess bookkeeping entries with a heightened risk.
We incorporate an element of unpredictability in our audit. We evaluated the outcome of other audit procedu-res and considered whether these gave any indication of fraud or the failure to comply with legal and regulatory requirements. If there was any evidence of same, we re-evaluated our assessment of the fraud risk and the consequences of same for our audit procedures.
Our audit approach with respect to the risk of failure to comply with legal and regulatory requirements We assessed factors related to the risk of failure to comply with legal and regulatory requirements, when there was a reasonable expectation that this could have a material impact on the financial statements, on the basis of our experience in the sector, by liaising with the Executive Board, by reading minutes, reading the reports of the compliance officer and by carrying out data-driven procedures focused on transaction flows, items in the financial statements and disclosures. We also have read lawyers letters and correspondence with regulatory bodies and remained alert to any indications of (poten-tial) failure to comply with legal and regulatory require-ment during the audit. Finally, we obtained written confirmation that we have been informed of all known instances of non-compliance with legal and regulatory requirements.
Going concernWe performed procedures to identify and evaluate the risks related to going concern and to conclude whether the assumption of going concern used by the Executive Board is acceptable. The Executive Board performed a specific evaluation of the company’s potential to continue as a going concern and to continue its activities for at least the coming 12 months. We discussed this evaluation with the Executive Board and evaluated same with professional scepticism.
On the basis of the audit evidence obtained we consider whether there have been any events or circumstances that could cast significant doubt on the company’s ability to continue as a going concern. If we conclude that a material uncertainty exists, we are required to draw attention in our auditor’s report to the relevant related disclosures in the financial statements. If such disclosures are inadequate, we are obliged to modify our opinion.
Our conclusions are based on the audit evidence obtained up to the date of our auditor’s report. However, future events or conditions may occur that render the company unable to continue as a going concern.
General audit procedures Our audit also included: • performing audit procedures and obtaining audit
evidence that serves as a sufficient and appropriate basis for our opinion in response to the estimated risks;
• evaluating the appropriateness of accounting policies used and evaluating the reasonableness of accounting estimates made by the Executive Board and the disclosures related to same included in the financial statements;
• evaluating the presentation, structure and content of the financial statements, including the disclosures included in same;
• evaluating whether the financial statements constitute a fair representation of the underlying transactions and events.

236 Heijmans Annual Report 2020
APPENDICES
Our key audit mattersKey audit matters are those matters that, in our profes-sional judgment, were of most significance in our audit of the financial statements. We communicated the key audit matters to the Supervisory Board, but the key audit matters do not reflect everything we discussed.
When compared with the previous year, we did not make any changes in the nature of the key audit matters of our audit.
We determined our audit procedures with respect to these key audit matters in the context of our audit of the financial statements as a whole. Our findings on individual key audit matters should be viewed in that context and not as separate opinions on these key audit matters.
Recognition of project results and the valuation of work in progress (see notes 6.16 and 6.29)
Risk The valuation of work in progress is affected to a large degree by subjective elements, such as estimates of costs yet to be incurred and expected higher or lower revenue, the technical progress and (potential) claims and fines. This is partly due to the nature of the operations, which may involve large and complex projects and developments during the realisation of a project. The process of recognising revenue and result, the valuation of additional work and (potential) claims, as well as the completeness of the obligations and provisions related to the projects, requires significant estimates on the part of the Executive Board, which results in complexity and inherent uncertainty. In addition to this, the impact of the Covid-19 pandemic and the nitrogen emissions matter increases the uncertainty of the estimated results, and the impact can differ for each segment and each project. In view of the uncertainty of any estimates, the risk has a significant impact on our audit.
Our audit approach
We performed a critical evaluation and audit procedures with respect to the project management and estimates related to project results, including the expected costs and revenue on the basis of the contractual conditions and (potential) claims and disputes. We also performed substantive audit procedures with respect to project calculations and performed on-site visits to a number of projects. We discussed these estimates with various officers and audited the underlying support. We also assessed the outcome of previous estimates. Finally, we evaluated the disclosure related to work in progress and the estimates related to same. We devoted specific attention to the explanation of the ongoing arbitration case related to the prematurely terminated Wintrack project in 2018, due to the increased uncertainty of estimates with respect to the claims filed by both parties against each other.
Significant observations
It is our opinion that the Executive Board has chosen reasonable accounting policies for the recognition of project results and that these have been applied adequately. We determined that the assumptions and estimates used by the Executive Board are within the acceptable bandwidth and that the disclosure provided is adequate.
Valuation of strategic land holdings and land in-use (see note 6.15)
Risk The valuation of strategic land holdings and land in-use is strongly affected by developments in the Dutch housing market and other external and/or internal subjective elements. Land holdings are generally only developed after a prolonged period of time, largely due to (policy) changes on the provincial or municipal level, and this is therefore inherently uncertain. The company conducts an impairment test on these assets. This test is significant for our audit, given the nature of the activities, the complexity of the estimation process, the assumptions used in these estimates and the level of subjectivity in same. The potential impact of the Covid-19 pandemic on the housing market and the impact of the nitrogen emissions matter on realisation increase the uncertainty of the net realisable value. This value is based on the expected future cash flows, which depend among other things on the chance of realisation, the expected timing of the realisation and the estimated sales prices and building costs. This valuation is substantiated using qualitative descriptions and key figures.

237Heijmans Annual Report 2020
APPENDICES
Valuation of strategic land holdings and land in-use (see note 6.15)
Our audit approach
We performed a critical evaluation and audit procedures with respect to the reasonableness of the estimates used and made use of our own valuation specialists for this evaluation. We focused primarily on the assumptions that have the greatest impact on the determination of the net realisable value, such as the design and execution of development plans and expected developments in land and house prices. We also included the outcome of previous estimation processes in the determination of our detailed auditing procedures. We also assessed whether the explanations given were sufficient and provide sufficient insight into the assumptions chosen for the valuation.
Significant observations
It is our opinion that the Executive Board’s estimates with respect to potential impairments are adequate and that the parameters and expectations they used are within the acceptable bandwidth. We also determined that the disclosure provided is adequate.
Valuation of deferred tax assets (see note 6.14)
Risk Deferred tax assets are recognised for deductible tax losses, in so far as it is probable that there will be sufficient future taxable profit to settle against said losses. The assessment of same is significant for our audit, because the estimation process is complex and is affected by Executive Board estimates. These estimates are based, among other things, on expected operational and fiscal results that are partly based on assumed future economic and market developments. The potential impact of the Covid-19 pandemic and the nitrogen emissions matter increase the uncertainty of the estimated results. In view of this uncertainty, this risk is significant for our audit.
Our audit approach
We performed audit procedures with respect to the reasonableness of the assumptions in the forecasts that have the greatest impact on the fiscal result, such as EBIT and non-deductible or deferred items. The 2021 Business Plan drawn up by the Executive Board and the long-term forecast included in same are also partly based on these forecasts. We also evaluated the realisation of the 2020 Business Plan, as this provides an indication of the quality of the estimates. When performing our procedures, we made use of our own tax experts, also in the determination of the impact and applicability of changes in tax legislation. We also assessed whether the disclosures were sufficient and provided sufficient insight into the uncertainty and the choice of the assumptions made for the valuation.
Significant observations
It is our opinion that the Executive Board applied the accounting policies for the valuation of deferred tax assets in an adequate fashion. We determined that the assumptions and estimates used by the Executive Board are within the acceptable bandwidth and that the disclosure provided is adequate.
Valuation of intangible fixed assets (see note 6.11)
Risk The intangible fixed assets are largely comprised of goodwill. The Executive Board conducts an annual impairment test on these assets. This test is largely based on the Executive Board’s expectations and estimates with respect to future results and cash flows, which results in complexity and inherent uncertainty. The potential impact of the Covid-19 pandemic and the nitrogen emissions matter increase the uncertainty of the estimated results and cash flows. The goodwill related to the business areas Building & Technology and Infra are the most significant due to the size. The testing is significant for our audit, in view of the complexity of the estimation process, including the potential developments on a number of significant projects. The realisable value is based on the cash value of future cash flows.
Our audit approach
We performed a critical evaluation of and audit procedures on the expected results and cash flows, as these are included in the 2021 Business Plan drawn up by the Executive Board and the long-term forecasts included in same. We also evaluated the realisation of the 2020 Business Plan, as this gives an indication of the quality of the estimates used. Assisted by our own valuation experts, we focused our work primarily on the parameters that have the greatest impact on the determination of the realisable amount of goodwill, such as the discount rate, revenue volume and EBIT margin. We assessed the classification of Building & Technology (previously Non-residential and Residential building) as a single cash-generating unit according to the relevant criteria for same.
We evaluated whether the disclosures were sufficient and provide sufficient insight into the chosen assumptions and the sensitivity of the valuation.
Significant observations
It is our opinion that the Executive Board’s estimates with respect to potential impairments are adequate and the parameters and expectations they use are within the acceptable bandwidth. We also determined that the disclosure provided is adequate.

238 Heijmans Annual Report 2020
APPENDICES
Report on other information included in the annual report
In addition to the financial statements and our auditor’s report thereon, the annual report contains other informa-tion, which consists of:• Report of the Executive Board• Remuneration Report• Other information shown in the list of contents,
namely the Report of the Supervisory Board and result appropriation.
On the basis of the procedures stated below, we consider that the other information:• is consistent with the financial statements and
contains no material misstatements;• includes all the information required by Part 9 of Book
2 of the Dutch Civil Code and sections 2.135b and 2.145, sub-section 2 of the Dutch Civil Code.
We have read the other information and on the basis of on our knowledge and understanding obtained through our audit of the financial statements or otherwise, we have considered whether the other information contains any material misstatements. By performing these procedures, we comply with the requirements of Part 9 of Book 2 of the Dutch Civil Code, article 2.135b, sub-section 7 of the Dutch Civil Code and the Dutch Standard 720. These procedures are not as in-depth as those performed in our audit of the financial statements.
The Executive Board is responsible for preparation of the other information, including the Report of the Executive Board and other information in accordance with Part 9 of Book 2 of the Dutch Civil Code and the remuneration report in accordance with sections 2.135b and 2.145, sub-section 2 of the Dutch Civil Code.
Report on other legal and regulatory requirements
EngagementWe were engaged by the Supervisory Board as the auditor of Heijmans N.V. on 30 April 2014 as of the audit for the 2014 financial year and have operated as external auditor since that financial year.
No prohibited non-audit servicesWe have not provided any prohibited non-audit services as referred to in Article 5(1) of the EU Regulation on specific requirements regarding mandatory audits of public-interest entities.
Description of responsibilities for the financial statements
Responsibilities of the Executive Board and the Supervisory Board for the financial statementsThe Executive Board is responsible for the preparation and fair presentation of the financial statements in accordance with EU-IFRS and Part 9 of Book 2 of the Dutch Civil Code. Furthermore, the Executive Board is responsible for such internal controls as the Executive Board deems necessary to enable the preparation of financial statements that are free from material misstatement, whether due to fraud or error.
As part of the preparation of the financial statements, the Executive Board is responsible for assessing the com-pany’s ability to continue as a going concern. Based on the above-mentioned financial reporting frameworks, the Executive Board should prepare the financial statements using the going-concern basis of accounting, unless the Executive Board either intends to liquidate the company or to cease operations, or has no realistic alternative but to do so. The Executive Board should disclose events and circumstances that may cast significant doubt on the company’s ability to continue as a going concern in the financial statements.
The Supervisory Board is responsible for overseeing the company’s financial reporting process.
Our responsibilities for the audit of the financial statementsOur responsibility is to plan and perform the audit engagement in a manner that allows us to obtain sufficient and appropriate audit evidence for our opinion.
Our audit has been performed with a high, but not absolute, level of assurance, which means we may not have detected all material errors and fraud.
Misstatements can arise from fraud or error and are considered material if, individually or in the aggregate, they could reasonably be expected to influence the economic decisions of users taken on the basis of these financial statements. The materiality affects the nature, timing and extent of our audit procedures and the evaluation of the effect of identified misstatements on our opinion.
We maintained professional scepticism during the performance of our audit and where relevant exercised professional judgement, in accordance with Dutch Standards on Auditing, ethical requirements and

239Heijmans Annual Report 2020
APPENDICES
independence requirements. The section ‘Our audit approach’ above includes a summary of our responsibili-ties and the procedures performed that serve as a basis for our opinion.
CommunicationWe communicate with the Supervisory Board regarding, among other matters, the planned scope and timing of the audit and significant audit findings, including any significant shortcomings in internal control that we identify during our audit.
In this respect, we also submit an additional report to the audit committee in accordance with Article 11 of the EU Regulation on specific requirements regarding manda-tory audit of public-interest entities. The information included in this additional report is consistent with our audit opinion in this auditor’s report.
We provide the Supervisory Board with a statement that we have complied with relevant ethical requirements regarding independence. We also communicate with them regarding all relationships and other matters that may reasonably be thought to bear on our independence, and the related measures to safeguard our independence.
We determine the key matters of our audit of the financial statements on the basis of all the matters we discuss with the Supervisory Board. We describe these key matters in our auditor’s report, unless this is prohibited by legal and regulatory requirements or, in extremely rare circumstan-ces, when not communicating these matters is in the public interest.
Rotterdam, 19 February 2021
Ernst & Young Accountants LLP
Signed by W.P. de Pater
240 Heijmans Annual Report 2020
APPENDICES
16.5 Assurance report of the independent auditor
To: the shareholders and the Supervisory Board of Heijmans N.V.
Our conclusionWe have reviewed the sustainability information annual report for the year 2020 of Heijmans N.V. in Rosmalen. A review is aimed at obtaining a limited level of assurance.
Based on our review, we have no reason to believe that the sustainability information does not present, in all material respects, a reliable and adequate view of:• the policy and business operations with regard to
corporate social responsibility;• the events and performance on that front for the year
2020;in accordance with the Sustainability Reporting Standards (option Core) of the Global Reporting Initiative (GRI) and additional reporting criteria as disclosed in the Reporting Criteria section.
The sustainability information consists of the following chapters of the annual report:2. About Heijmans 3. The Executive Board6. Sector developments and trends 7. In dialogue with stakeholders8. Material aspects9. Value creation model10. Strategy 11. Annual overview business areas 13. Sustainable Development Goals 14.3 Conduct and integrity
Basis for our conclusionWe have performed our review of the sustainability information in accordance with Dutch law, including Dutch Standard 3810N, Assurance engagements relating to sustainability reports (Assurance-opdrachten inzake maatschappelijke verslagen). We have described our responsibilities under this standard in the section ‘Our responsibilities for the review of the sustainability information’.
We are independent of Heijmans N.V. as required by the Code of Ethics for Professional Accountants (Verordening inzake de onafhankelijkheid van accountants bij assu-rance-opdrachten - ViO), a regulation with respect to independence, and other relevant independence regulati-ons in the Netherlands. Among other things, this means that we do not perform any procedures that could conflict with our independent assurance engagement. In addition, we have complied with the Dutch Professional Code of Ethics of Auditors (Verordening gedrags- en beroepsregels accountants’ - VGBA).
We believe that the assurance evidence we have obtained is sufficient and appropriate to provide a basis for our conclusion.
Reporting criteriaThe sustainability information needs to be read and understood in conjunction with the reporting criteria. Heijmans N.V. is responsible for selecting and applying these reporting criteria, taking into account applicable legal and regulatory requirements related to reporting.
The reporting criteria used for the preparation of the sustainability information are the Sustainability Reporting Standards of the Global Reporting Initiative (GRI – Core option) and the applied supplemental reporting criteria as disclosed in the appendices ‘Reporting Methodology’ and ‘KPI Table’ of the annual report.
The lack of established practices for the evaluation and measurement of sustainability information offers the possibility of using various, acceptable measurement methods. This can have an impact on the comparability of entities in terms of reciprocity and over time.
Limitations to the scope of our reviewThe sustainability information includes forward-looking information such as ambitions, strategy, plans, expectati-ons, estimates and risk assessments. Inherent in forward-looking information is that the actual future results are uncertain. We do not provide any assurance on the assumptions and achievability of the targets or estimates in forward-looking information in the sustainability information.

241Heijmans Annual Report 2020
APPENDICES
The references to external sources or websites in the sustainability information are not part of the sustainabi-lity information we reviewed. We do not therefore provide assurance on this information.
Responsibilities of the Executive Board and the Supervisory Board for the sustainability informationThe Executive Board is responsible for the preparation of the sustainability information in accordance with the reporting criteria as explained in the Reporting criteria section, including the identification of stakeholders and the definition of material aspects. The choices made by the Executive Board regarding the scope of the sustainabi-lity information and the reporting policy are summarised in the appendices ‘Reporting Methodology’ and ‘KPI Table’ of the annual report.
The Executive Board is also responsible for such internal controls as the Executive Board deems necessary to enable the preparation of the sustainability information that is free from material misstatements, whether due to fraud or error.
The Supervisory Board is responsible for overseeing the reporting process of Heijmans N.V.
Our responsibilities for the review of the sustainability informationOur responsibility is to plan and perform the assurance engagement with a limited level of assurance in a manner that allows us to obtain sufficient and appropri-ate assurance evidence for our conclusion.
Procedures performed to obtain a limited level of assurance are aimed at determining the plausibility of information and vary in nature and timing from and are less extensive than for an engagement aimed at obtaining a reasonable level of assurance. The level of assurance obtained in a review is therefore substantially lower than the assurance obtained in an audit.
We apply the Regulations for Quality management systems (Nadere voorschriften kwaliteitssystemen – NVKS). This gives us a cohesive system of quality controls, including documented guidelines and procedu-res regarding compliance with ethical requirements,
professional standards and other relevant legal and regulatory requirements.
We performed this review with professional scepticism with a multi-disciplinary team and, where applicable, exercised professional judgement, in accordance with Dutch assurance standards, ethical requirements and independence requirements.
Our review included:• performing an analysis of the external environment
and obtaining an understanding of relevant social themes and issues, and the characteristics of the company;
• evaluating the appropriateness of the reporting criteria used, the consistent application of same and related disclosures in the sustainability information. This included the evaluation of the results of the stakehold-ers’ dialogue and the reasonableness of estimates made by the Executive Board;
• gaining an understanding of the reporting processes for the sustainability information, including gaining a general understanding of internal control measures relevant to our review;
• identifying areas of the sustainability information with a higher risk of misleading or unbalanced information or material misstatements, whether due to fraud or error. Designing and performing further assurance procedures aimed at determining the plausibility of the sustainability information respon-sive to this risk analysis. These additional review procedures included but were not limited to:
– interviewing members of the management and relevant staff responsible for the sustainability strategy, policy and results;
– interviewing relevant staff members responsible for providing the information for, carrying out internal control procedures on, and consolidating the data in the sustainability information;
– obtaining assurance information to the effect that the sustainability information reconciles with the underlying records of the company;
– reviewing, on a limited test basis, relevant internal and external documentation;
– performing an analytical review of the data and trends.

242 Heijmans Annual Report 2020
APPENDICES
• reconciling the relevant financial information with the financial statements;
• evaluating the consistency of the sustainability information with the information in the annual report that is not included in the scope of our review;
• evaluating the overall presentation, structure and content of the sustainability information;
• weighing whether the sustainability information as a whole, including the disclosures included in same, reflects the purpose of the reporting criteria used.
We communicate with the Supervisory Board regarding, among other matters, the planned scope and timing of the review and significant findings that we identify during our review.
Rotterdam, 19 February 2021
Ernst & Young Accountants LLP
J. Niewold RA

243Heijmans Annual Report 2020
APPENDICES
16.6 Remuneration report
This report, which should be considered a report in the sense of article 2:135b of the Dutch Civil Code and in the sense of principle 3.4 of the Dutch Corporate Governance Code, explains the execution of the remuneration policy for the Executive Board and the remuneration policy for the Supervisory Board, as adopted by the Annual General Meeting of Shareholders (hereinafter: AGM) on 15 April 2020 and as these applied in that year. The remuneration policy for the Executive Board and the remuneration policy for the Supervisory Board have been published on company’s website and shall be briefly explained below.
This report comprises the following sections:
1. Principles of the remuneration policy for the Executive Board and Supervisory Board
2. Highlights of remuneration policy for the Executive Board
3. Implementation of the remuneration policy for Executive Board in 2020
4. Highlights of the remuneration policy for the Supervisory Board
5. Implementation of the remuneration policy for the Supervisory Board in 2020
6. Evaluation of the remuneration policy and plans for 2021
7. Advisory vote General Meeting of Shareholders
1. Principles of the remuneration policy for the Executive Board and Supervisory Board
Heijmans’ mission is to create a healthy living environ-ment. The company wants to be leading on the innovation front and is building a healthy living environment on the basis of its distinctive vision and in-depth knowledge and expertise. Heijmans’ strategy is focused on Better and Smarter operating processes and on corporate social responsibility to increase sustainability. This will enable Heijmans to create long-term value creation for all its stakeholders, and for society as a whole, in the form of sustainable homes, sustainable building processes and a significant contribution to employment and the economy.To formulate and execute this strategy, Heijmans has to be in a position to recruit, motivate and retain high-calibre executive directors and supervisory directors with the right expertise. The remuneration policy serves as a basis for this and is therefore instrumental in the realisation of the strategy and value creation.Heijmans endorses the principles and best practice provisions of the Dutch Corporate Governance Code with respect to the remuneration of members of the Executive
Board and the Supervisory Board and complies with these provisions in its policies and in this report.
2. Highlights of the remuneration policy for the Executive Board of Heijmans N.V.
2.1 Remuneration level Heijmans offers the members of the Executive Board a remuneration package that is balance and fair, both from an internal perspective, in the sense that the salary reflects the required competencies and responsibilities compared with other function levels, and from an external perspective in the sense that the remunerations is comparable to what comparable companies pay for comparable executive positions. The Supervisory Board uses both internal and external reference points to determine the remuneration level. The internal reference point is determined specifically by the remuneration level of the management layer below the Executive Board. The internal reference point is taken into account in the sense that there is a link between the targets for variable remuneration that apply for the members of the Executive Board and for the members of the management layer below the Executive Board.
When formulating the remuneration policy, the Supervisory Board performs scenario analyses and takes these into consideration.
2.2 Remuneration package • An annual salary;• A contribution to the accrual of a pension;• variable short-term bonus awarded on an annual
basis for on-target performance; • variable long-term bonus awarded for on-target
performance over a period of three years;• the option to participate in the Bonus Investment
Share Matching Plan, which acts as an incentive to accumulate shares and underlines commitment to the company.
In addition, each member of the Executive Board receives an expense allowance and insurance contributions and a lease car is made available.
2.3 Variable bonus Both the variable short-term bonus and long-term bonus are paid out in cash. Each of the short-term bonus and long-term bonus amounts to 50% of the annual salary for an on-target performance in the year in question. If a board member exceeds the targets, the bonus can increase to a maximum of 75%. If a board member’s performance falls below a previously agreed minimum, the bonus is zero.

244 Heijmans Annual Report 2020
APPENDICES
Conditions for awarding a variable bonus:• If the company records a net loss in the year for which
the variable is to be awarded, the unconditional award is postponed. If the company once again records a net loss in the subsequent year, the right to a variable bonus lapses;
• The Supervisory Board is entitled to a final assessment of any award of a bonus with respect to its reasonable-ness and fairness and may adjust the award;
• The entire variable remuneration is subject to a claw back clause, to the effect that any variable remunera-tion that has been awarded may be reclaimed if it turns out after the fact that this was awarded on the basis of incorrect information.
2.4 Long term Share Matching Plan Members of the Executive Board may choose to partici-pate in the Bonus Investment Share Matching Plan, the aim of which is to incentivise the directors in the longer term and gain their commitment to the company. In the context of this plan, they can invest 50% of (the net equivalent of) their short-term variable remuneration that they are awarded in any year in (depositary receipts for) Heijmans shares. Provided that they hold these deposi-tary receipts for three year and they are still employed at the company at the end of this period, the company awards one bonus depositary receipt, a so-called matching share, for every depositary receipt the director has taken. These matching shares are blocked for two years after the award. For more information (in Dutch) on the Remuneration policy, go to: www.heijmans.nl/nl/over-heijmans/corporate- governance/codes-statuten-en-reglementen/
3. Implementation of the remuneration policy for the Executive Board in 2020
Until 15 April 2020, the Remuneration committee comprised Mrs. P.G. Boumeester, Mrs. M.M. Jonk and Mr. R. van Gelder (chair). From 15 April 2020 onwards, this committee, which was from that date combined with the Selection and Appointment Committee to form the Remuneration and Appointment Committee, consisted of Mrs. M.M. Jonk (chair) and Mrs. J.W.M. Knape-Vosmer. The committee met six times in 2020, and dealt with the usual annual items, such as the remuneration of the members of the Executive Board, the targets related to the variable bonus, the variable bonus itself and the Bonus Investment Share Matching Plan. In view of the change in regulations, the committee devoted a great deal of attention to the remuneration report.
In the application of the remuneration policy for the Executive Board in 2020, the Remuneration and Appointment Committee assessed how the Executive Board had performed in the execution of the company’s strategic and financial targets. The committee also devoted a good deal of attention to the challenging circumstances in which this happened, in particular the Covid-19 outbreak and the impact this had on the economy in general and Heijmans in particular. It also took into account the nitrogen emissions and PFAS problem, which, although in fact beyond the company’s control, could have a significant impact. When setting the ambitious performance targets in the first weeks of 2020, the situation was already uncertain and it was clear that the outbreak would have serious and prolonged consequences, even though it was impossible to estimate those consequences at that point. In view of this, when setting the short-term targets the Supervisory Board judged that the Executive Board’s primary focus in 2020 should be on equipping the company as effectively as possible to deal with the (financial) consequences of the outbreak. In the meantime, we have been forced to conclude that our suspicion that Covid-19 would have an unprecedented impact was correct. The supervisory Board took the resultant exceptional situation into account in its assessment of both the short-term and long-term target for 2020. The Remuneration and Appointment Committee determined that the company had performed strongly in these challenging circumstances, partly thank to the efforts of all the company’s employees, who in extremely difficult circumstances continued to work outside or almost fully from home. The company provided employees with exceptional levels of help and support on this front. Revenue, operating result and the order book all remained stable and the company made solid progress on its strategic objectives.
During the AGM on 15 April 2020, the explanation for the reappointment of Mr. A.G.J. Hillen referred to the most important elements of his agreement with Heijmans. The Supervisory Board was planning to adjust the agreed fixed salary as per the date of the reappointment to € 550,000 gross per annum, in line with the benchmark. The fact that the financial impact of the Covid-19 crisis was still unclear at that time created an exceptional situation. In amicable consultation, Mr. Hillen understood this completely and it was decided not to go ahead with the salary increase. The Supervisory Board indicated at the time that it would return to this issue at a later date to look for a suitable solution. On the basis of the good results for 2020, in early 2021 the Supervisory Board found it was justified in making this adjustment after all.

245Heijmans Annual Report 2020
APPENDICES
Therefore, in early 2021 the Supervisory Board decided to make this adjustment as per April 2021 and to apply this increase to the remaining three years of the appointment term.
3.1 Table with an overview of remuneration by componentThe gross fixed and variable remuneration paid out to the members of the Executive Board in 2019 and 2020 and the amounts to be paid out in 2021 are as follows:
The expenses per member can be specified as follows:
*chair of the Executive Board with effect from 1 December 2016 and member of the Executive Board with effect from 18 April 2012
**member of the Executive Board with effect from 30 October 2017 For a more detailed explanation of the table above, see section 6.28 of Heijmans’ 2020 financial statements.
3.2 Fixed remuneration In 2020, the agreed annual salaries of the two members of the Executive Board remained the same as in 2019. The accrual of Mr. A.G.J. Hillen’s retirement pension, dependants pension and orphans pension is in line with the conditionally indexed average salary scheme of the industry pension fund, under which pension is accrued on the gross fixed salary up to € 62,520, and which comes into effect at 67 years of age. This board member participates in a defined contribution scheme for his salary above this amount, and up to € 110,111. Mr. Hillen also receives compensation for the loss of pension accrual on the part of his salary above € 110,111. In deviation from the above, Mr. J.G. Janssen receives a fixed remuneration for the accrual of his own pension provision. Heijmans does not have any early retirement pension schemes.The expense allowances, including the reimbursement of car expenses, social premiums and the costs of the Share Matching Plan, are shown in the table below section 3.1. For
additional information, see the ‘Related parties’ section of the notes to the financial statements for 2020.
3.3 Variable remuneration The variable remuneration recognises at-target performance in the year under review or over a period of three years. Fifty percent of both the short-term and long-term variable remuneration depends on quantitative financial targets that are essential to the execution of the strategy, while the remaining fifty percent depends on qualitative targets that reflect the progress in the execution of the strategy. At the start of each year, the Supervisory Board sets a minimum, at-target and maximum level for the various targets. The targets for 2020 were drawn up before the remuneration policy in accordance with SRD II was adopted by the AGM. In deviation from the policy that was adopted thereafter, the targets set for 2020 included four score levels, rather than the three levels cited in the new policy. After the end of each year or after the end of the three-year period
in €
Gross fixed remuneration Variable remuneration Total fixed and variable remuneration
To be paid in 2021
Paid in 2020
Paid in 2019
To be paid in 2021
Paid in 2020
Paid in 2019
To be paid in 2021
Paid in 2020
Paid in 2019
A.G.J. Hillen 550.000 500.000 500.000 606.534 498.461 437.500 1.156.534 998.461 937.500
J.G. Janssen 123.958 425.000 425.000 515.554 423.692 212.500 639.512 848.692 637.500
673.958 925.000 925.000 1.122.088 922.153 650.000 1.796.046 1.847.153 1.575.000
in € Gross fixed remuneration
Short-term variable
remuneration
Long-term variable
remuneration Pension costs
Expense allowances including car costs,
social security contributions and share
matching plan costs TotalRatio fixed/
variable
A.G.J. Hillen*2020 500.000 325.284 281.250 203.086 109.115 1.418.735 57 / 43
2019 500.000 242.211 256.250 202.052 79.117 1.279.630 61 / 39
J.G. Janssen**2020 425.000 276.491 26.563 88.000 41.717 857.771 65 / 35
2019 425.000 205.879 217.813 88.000 70.037 1.006.729 58 / 42
Totaal 2020 925.000 601.775 307.813 291.086 150.832 2.276.506
2019 925.000 448.090 474.063 290.052 149.154 2.286.359

246 Heijmans Annual Report 2020
APPENDICES
respectively, the Supervisory Board determines the extent to which those targets have been met and the amount to be awarded. The Supervisory Board chooses the financial performance criteria that are the most relevant criteria at that moment from a list of four criteria included in the remuneration policy. The board defines the targets in hard amounts or percentages. The qualitative criteria are derived from Heijmans’ strategic ambition - Better, Smarter, Sustainable - and are determined in consultation with the Executive board, in which the Supervisory Board indicates the ambition level of the progress and what they use as the minimum and the maximum.
3.3.1 Short-term variable remuneration (annual bonus)For the year under review, the Supervisory Board chose underlying EBITDA and average net debt as the most relevant short-term financial targets. The target levels are included in accompanying table, which shows that Heijmans easily met its EBITDA target, as this came in between on-target and high, while the company achieved the maximum for average net debt, which on balance results in a pay-out of 33.85% on the financial targets.The short-term qualitative targets are focused on the execution of Heijmans’ strategy – Better, Smarter, Sustainable – with the simultaneous need to deal as effectively as possible with the impact of the Covid-19 outbreak on the company, more specifically with the impact on the likes of the order book, revenue, working capital, financing and employees.
The Supervisory Board assessed the targets as follows. The Executive Board managed the Covid-19 crisis by, among other things, organising more daily crisis team meetings and intensive internal communications. Regular reports, video messages and small gifts helped to keep the motivation and engagement of employees high. The company quickly drew up and implemented protocols for working safely in Covid-19 conditions. The transition to virtual working was very smooth. In addition, the company introduced weekly monitoring with respect to Covid-19-related costs and developed leading indica-tors. Extra monitoring of working capital paid off and the company once again increased its cash position. Heijmans agreed a social plan in preparation for any reorganisations. The order book remained at a healthy level, which means the outlook for 2021 is good. All the business areas recorded a rise in revenues. With a view to the uncertain financial markets, Heijmans extended the credit facility by a year on the same terms. The company also initiated an active dialogue with the government to ensure that the construction and infra activities were not brought to a halt. Finally, the Supervisory Board notes that the company continued the implementation of the Better, Smarter, Sustainable strategy.
In the light of the above-mentioned performance levels and challenging circumstances in which the company had to achieve these performances in 2020, the Supervisory Board finds these performances to be above the target ambition, which results in a pay-out of 31.3% of the fixed annual salary.
The financial and qualitative performances result in a total pay-out percentage of 65.15% of the annual salary.
Short-term target
Weighting Minimum On target High Maximum Realisation Pay out%
Underlying EBITDA 25% -8% € 76 mln +14% +32% € 85 mln 15,1%
Average net debt 25% +13% € 69 mln -16% -38% € 16 mln 18,75%
Qualitative (SB opinion) 50% Reasonable
progress In line with ambition Above ambition Well above
ambition Above ambition 31,3%
Total 100% 65,15%
Note: if the score comes in between the various levels, the bonus is calculated using the straight line method. Underlying EBITDA includes IFRS 16. Net debt is the average over four measurement points as per the end of a quarter and also includes IFRS 16. The pay-out percentage is expressed as the percentage of the on-target performance, so if targets are met in full (on-target) = 100%, which entitles the board member to the award of 50% of their salary.

247Heijmans Annual Report 2020
APPENDICES
3.3.2 Long-term variable remuneration (three-year bonus)
Award 2018-2020The targets for the long-term variable remuneration for the period 2018 through 2020 are assessed after the end of said period.
The financial targets for 2020 in the above-mentioned three-year period were: • an underlying operating result (EBIT) of at least 3% on
revenue of > € 1.6 billion;• solvency of more than 30%, excluding the effects of
IFRS 16 Leases. Both targets were realised on target, which on balance results in a pay-out of 12.5% on each target, thus a total of 25% on the financial targets.
The awarding of a pay-out on the qualitative targets over the three-year period is based on three criteria:
• Stable development of the company with steady growth in revenue and net result;
• Effective execution of the Better, Smarter and Sustainable strategy;
• A position on the labour market as an attractive employer with rising employee satisfaction.
The Supervisory Board finds that the targets exceeded the ambition level set. Heijmans has over the past three year become a stable company with steady and predictable growth in revenue and result. The Better, Smarter and Sustainable strategy is now fully embedded in day-to-day practice and has also been communicated externally, including long-term targets. The strategic targets have also been fully incorporated in the yearly target setting for the senior management. Employee satisfaction had risen on almost all fronts in the most recent measure-ment (2019). Heijmans is still able to recruit sufficient numbers of employees with the right skill sets even in the current competitive market, and employee turnover is relatively low and falling (4.6%). The above results, on balance, in a pay-out on the qualitative targets of 31.1% of the fixed annual salary.
Long-term target Weighting Minimum On target High Maximum Realisation Pay out%
Underlying EBIT margin 25% n.a. 3% of revenue n.a. n.a. 3% 12,5%
Solvency 25% n.a. 30% n.a. n.a. 30%* 12,5%
Qualitative (SB opinion) 50% Reasonable
progress In line with ambition Above ambition Well above
ambition High 31,3%
Total 100% 56,3%
* Solvency excluding the effects of IFRS 16 Leases
The targets cited in the above table were drawn up before the remuneration policy according to SRD II was adopted by the AGM. The Supervisory Board sets the on-target level for each target and the extent to which these targets were or were not met is determined at the discretion of the Supervisory Board. This methodology does not change the composition of the long-term variable remuneration: this can be a maximum of 75% of the agreed fixed salary and the financial and qualitative targets each still account for 50% of the overall target.
3.4 Bonus investment Share Matching Plan In the context of the Bonus Investment Share Matching Plan, the members of the Executive Board are given the opportunity to use up to a maximum of 50% of their awarded short-term bonus to purchase (depository receipts) for Heijmans N.V. shares. These so-called matching shares are awarded after three years, if the participant is still employed by the company at that moment. The two members of the Executive Board have participated in this plan since they joined the company and first invested in 2018 and 2019 respectively.
Date of investment
Number of depositary receipts purchased
A.G.J. Hillen J.G. Janssen
Datematching
April 2018 5.000 n.v.t. April 2021
April 2019 7.500 5.000 April 2022
April 2020 13.000 8.700 April 2023
Following the unconditional granting of the matching shares, these are then subject to a lock-up period of two years. Matching shares were last granted in April 2017. The lock-up period for these shares expired in April 2019.
Otherwise, at year-end 2020 the participants did not have any matching shares subject to a lock-up period.

248 Heijmans Annual Report 2020
APPENDICES
3.5 Pay ratios and result development The table below shows the information in accordance with article 2:135b, section 3, sub e of the Dutch Civil Code.
Fixed and variable remuneration
In € 2020 2019 2018 2017 2016
Underlying EBITDA (incl IFRS 16) € 85 mln € 78 mln
Underlying EBITDA (excl IFRS 16) € 54 mln € 43 mln € 30 mln € -46 mln
a Average remuneration employees 58.035 56.823 52.797 52.553 52.421
b Average fixed remuneration Executive Board members 462.500 462.500 462.500 462.500 451.907
A.G.J. Hillen 1 Gross fixed remuneration 500.000 500.000 500.000 500.000 414.470
2 Short-term variable remuneration 325.284 242.211 250.000 345.868
3 Long-term variable remuneration 281.250 256.250 437.500 -102.050 -95.780
4 Severance payment
5 Pension costs 203.086 202.052 201.141 200.273 116.917
6 Expense allowances including car costs, social security con -tributions, anniversary reservation and share matching plan costs. 109.115 79.117 57.252 43.483 45.048
Total 1.418.735 1.279.630 1.445.893 987.574 480.655
J.G. Janssen 1 Gross fixed remuneration 425.000 425.000 425.000 74.053
2 Short-term variable remuneration 276.491 205.879 212.500
3 Long-term variable remuneration 26.563 217.813 212.500
4 Severance payment
5 Pension costs 88.000 88.000 88.000 14.867
6 Expense allowances including car costs, social security con -tributions, anniversary reservation and share matching plan costs. 41.717 70.037 48.801 9.059
Total 857.771 1.006.729 986.801 97.979 0
L.J.T. van der Els
1 Gross fixed remuneration 115.954 496.906
2 Short-term variable remuneration -98.753
3 Long-term variable remuneration -246.882
4 Severance payment
5 Pension costs 28.671 102.160
6 Expense allowances including car costs, social security con -tributions, anniversary reservation and share matching plan costs. 14.892 47.123
Total 0 0 0 159.517 300.554
M.C. van den 1 Gross fixed remuneration 68.209 406.907
Biggelaar 2 Short-term variable remuneration -79.132
3 Long-term variable remuneration -197.831
4 Severance payment
5 Pension costs 11.870 73.059
6 Expense allowances including car costs, social security con -tributions, anniversary reservation and share matching plan costs. 9.372 53.512
Total 0 0 0 89.451 256.515
R.F Majenburg 1 Gross fixed remuneration 331.409 386.903
2 Short-term variable remuneration 248.557
3 Long-term variable remuneration -64.484 64.484
4 Severance payment 404.563
5 Pension costs 72.822 85.135
6 Expense allowances including car costs, social security con -tributions, anniversary reservation and share matching plan costs. 34.304 40.445
Total 0 0 0 1.027.171 576.967
Total 1 Gross fixed remuneration 925.000 925.000 925.000 1.089.625 1.705.186
2 Short-term variable remuneration 601.775 448.090 462.500 594.425 -177.885
3 Long-term variable remuneration 307.813 474.063 650.000 -166.534 -476.009
4 Severance payment 0 0 0 404.563 0
5 Pension costs 291.086 290.052 289.141 328.503 377.271
6 Expense allowances including car costs, social security con -tributions, anniversary reservation and share matching plan costs. 150.832 149.154 106.053 111.110 186.128
Total 2.276.506 2.286.359 2.432.694 2.361.692 1.614.691
a. 2016 determined by means of interpolation:1. Fixed agreed annual salary2. Short-term variable annual remuneration in accordance with the remuneration policy as described in section 2.3 of this report.3. Long-term variable 3-year remuneration in accordance with the remuneration policy as described in section 2.3 of this report. 5. Please see section 3.2 of this report for an explanation of pension costs. 6. Please see section 3.4 of this report for an explanation of the Share Matching Plan.

249Heijmans Annual Report 2020
APPENDICES
Pay Ratio In accordance with best practice 3.4.1 sub iv of the Dutch Corporate Governance Code, the Supervisory Board includes a description of the pay ratio between the Executive Board and other employees within the company. This was calculated on the basis of the fixed agreed salary, including holiday allowance, on the reference date 30 November 2020. The average fixed agreed remuneration of the members of the Executive Board employed on the reference date was compared with the reference group, consisting of all employees with an employment contract with the company (Heijmans N.V.), or one of its subsidiaries in the Netherlands on the reference date. The average fixed salary of the members of the Executive Board amounted to € 462,500 (2019: € 462,500) on the reference date, compared to an average fixed salary of € 58,034 (2018: € 56,823) for the reference group. On the basis of the above, the pay ratio can be expressed as a ratio of 8 to 1 (2019: 8 to 1).
The Remuneration committee takes this pay ratio into account in any proposals they submit to the Supervisory Board regarding the remuneration of the individual members of the Executive Board.
4. Highlights of the remuneration policy for the Heijmans N.V. Supervisory Board
The remuneration policy for the Supervisory Board, as this applied in the 2020 financial year, was adopted by the Extraordinary General Meeting of Shareholders (EGM) held on 15 April 2020. The aim of the remuneration policy is to enable Heijmans to recruit experienced and expert supervisory directors. This requires remuneration in line with market rates. In accordance with best practice 3.3.1 of the Dutch Corporate Governance Code, the remuneration of supervisory directors should also reflect the time commitment and the responsibilities of the position. With a view to the independent position of supervisory directors, their remuneration does not depend on the company’s results and internal pay ratios are not relevant.To tailor the remuneration to commitment in time and responsibilities:• the chair and vice-chair of the Supervisory Board
receive a higher fixed basic remuneration than (ordinary) members;
• supervisory directors receive remuneration for the work they do in committees, on top of the basic remuneration paid to all members;
• committee chairs receive a higher committee remuneration than the members of those committees.
In accordance with the remuneration policy adopted on 15 April 2020, the supervisory directors are paid the following amounts with effect from 2020:
Per annum in euro
Chair of Supervisory Board 61.560
Vice-chair of Supervisory Board 46.170
Member of Supervisory Board 41.040
Chair of Audit and Risk Committee 8.208
Member of Audit and Risk Committee 6.156
Chair of Remuneration, Selection and Appointment Committee 7.182
Members of Remuneration, Selection and Appointment Committee 5.130
This remuneration is adjusted annually on 1 January on the basis of the CBS consumer price index (CPI) for all spending.For additional information (in Dutch) on the Remuneration policy for the Supervisory Board see: www.heijmans.nl/nl/over-heijmans/corporate- governance/codes-statuten-en-reglementen/
5. Implementation remuneration policy Supervisory Board 2020
In the financial year 2020, the members of the Supervisory Board received a remuneration in accordance with the policy described in section 4 of this report. The division of tasks was as follows in 2020:• Mr. Sj.S. Vollebregt, chair.• Mr. R. lcke, vice-chair Supervisory Board and chair
Audit and Risk committee.• Mr. R. van Gelder, stepped down as per 15 April 2020,
up to that date: member Supervisory Board, chair Remuneration committee, chair Remuneration committee, member Selection and appointment committee, member Audit and Risk committee.
• Mrs. P.G. Boumeester, stepped down as per 15 April 2020, up to that date: member Supervisory Board, chair Selection and appointment committee, member Remuneration committee.
• Mrs. M.M. Jonk, member Supervisory Board, member Audit and Risk committee. Until 15 April 2020, member Remuneration committee and member Selection and appointment committee. From 15 April 2020, chair combined Remuneration, Selection and Appointment committee.
• Mrs. J.W.M Knape-Vosmer, appointed on 15 April 2020 and from that date: member Supervisory Board, and member combined Remuneration, Selection and Appointment committee.
• Mr. G.A. Witzel, appointed on 15 April 2020 and from that date: member Supervisory Board, and member Audit and Risk committee.

250 Heijmans Annual Report 2020
APPENDICES
6. Evaluation of Remuneration policy and plans for 2021
In April 2020, the Remuneration, Selection and Appointment committee evaluated the remunerations policies for the Executive Board and the Supervisory Board approved by the AGM and found these to be effective and balanced. The Supervisory Board accepted the advice to leave the policy unchanged in 2021. In accordance with article 2:135a of the Dutch Civil Code BW, a new policy will be submitted to the AGM for approval no later than the meeting to be held in 2024.
The committee also evaluated the level of remuneration of the Executive Board. In accordance with the policy, the remuneration for the Supervisory Board was adjusted on the basis of the CBS consumer price index (CPI) for all spending.
The Remuneration, Selection and Appointment commit-tee determined the performance criteria for the variable remuneration from the choices offered by the remunera-tion policy for the Executive Board. In 2021, short-term financial targets will be set for underlying EBITDA and average net debt. The short-term qualitative performances will be set on the basis of a number of specific targets related to Heijmans’ Better, Smarter, Sustainable strategy.
The financial target for the period 2021-2023 is related to earnings per share (EPS). The long-term qualitative performances will be assessed on the basis of the extent to which Heijmans realises a number of strategy-related bold statements. The performance levels that the Supervisory Board has set for each of these targets are considered competition sensitive and will be disclosed after the fact once bonuses have been awarded unconditionally.
7. Advisory vote General Meeting of Shareholders report previous financial year
In accordance with article in article 2:135b of the Dutch Civil Code, the Supervisory Board presented the 2019 remuneration report to the AGM on 15 April 2020 for an advisory vote, with the proposal that the AGM approve the 2019 remuneration report. The AGM subsequently approved the 2019 remuneration report by 91.1% of the votes cast. In accordance with article 135b section 2 of the Dutch Civil Code Conform, the company took this outcome into account when producing the current remuneration report, in the sense that the Board deduced from said outcome that the remuneration report met requirements and that it noted that there were no questions or comments about the report during the AGM.
Rosmalen, 19 February 2021
In the years 2016 through 2020, the members of the Supervisory Board were paid the following amounts:
in € 2020 2019 2018 2017 2016
1 Sj.S. Vollebregt, chair 60.000 60.000 60.000 47.723 43.973
2 Drs. P.G. Boumeester 14.064 46.750 46.000 37.723 37.723
3 Ing. R. van Gelder BA 15.860 52.750 52.000 42.723 42.723
4 R. Icke RA 54.378 53.000 53.000 37.723 37.723
5 Ms M.M. Jonk 54.078 49.000 3.333
6 Drs. S. van Keulen 13.500 54.000 42.723 42.723
7 J.W.M. Knape-Vosmer MBA 45.571
8 A.A. Olijslager 13.390
9 G.A. Witzel 33.630
Total 277.581 275.000 268.333 208.615 218.255
1 Supervisory Director from 15 April 2015, chair from 13 April 20162 Supervisory Director from 28 April 2010 to 15 April 20203 Supervisory Director from 1 July 2010 to 15 April 20204 Supervisory Director from 9 April 20085 Supervisory Director from 6 December 20186 Supervisory Director from 18 April 2007 to 10 April 20197 Supervisory Director from 15 April 20208 Supervisory Director from 18 April 2007 to 13 April 20169 Supervisory Director from 15 April 2020

251Heijmans Annual Report 2020
APPENDICES
16.7 Other appendices
16.7.1 Heijmans Share Administration Trust
The following report is presented in line with the best practice provision 4.4.6 in conjunction with provision 4.4.7 of the Dutch Corporate Governance Code.
Methods To emphasise the independence of the Heijmans Share Administration Trust (hereinafter referred to as ‘the SA Trust’), its Board of Trustees first meets in the absence of the members of the Company’s Executive Board. The members of the Executive Board and the Chairman of the Supervisory Board then join the meeting.
Number of shares for which depositary receipts have been issuedThe SA Trust has issued depositary receipts for ordinary shares of Heijmans N.V. with the Company’s cooperation. The SA Trust is an independent legal entity, as defined in Section 5:71 (1)(d) of the Financial Supervision Act.
As at 31 December 2020, the SA Trust had depositary receipts for ordinary shares with a nominal value of €6,580,041 in administration, for which 21,933,470 bearer depositary receipts with a nominal value of €0.30 had been issued.
Number of meetings of the Board of Trustees and most important agenda itemsThe Board of Trustees of the SA Trust met on three occasions during the year under review.
Meeting of 16 March 2020 The following subjects were discussed during this regular meeting of the Board: • The 2019 annual report of Heijmans N.V. and the
full-year press release of 20 February 2020; • Discussion of the items on the agenda for the General
Meeting of Shareholders of Heijmans N.V. to be held on 15 April 2020;
• The annual report related to the financial reporting of the SA Trust for 2019;
• The evaluation of the Meeting of Depositary Receipt Holders of 15 November 2019;
• The reappointment of a trustee.
During the meeting, the SA Trust Board made a number of comments and asked questions of the chairman of the Executive Board with respect to subjects including: • The question as to whether and if so how much the
PFAS and nitrogen emissions issue is a problem for Heijmans;
• The impact of the Covid-19 outbreak on Heijmans;• The broadening of the market for infrastructure, due
among other things to climate measures and dyke monitoring, and the opportunities in this for Heijmans Infra;
• The resumption of dividend payments as put on the agenda for the General Meeting of Shareholders;
• The valuation of land holdings.
In the spring of 2020, one trustee stepped down. The trustee in question was Mr. R.H. Hooghoudt. The Meeting of Depositary Receipt Holders of 15 November 2019 did not submit a recommendation for the filling of this vacancy. The Board reappointed Mr. Hooghoudt for a second term of four years. The Board took into considera-tion the importance of continuity within the Board, partly in view of the terms in office of the other board members.
Meeting of 14 October 2020Subjects discussed in this regular meeting included:• Heijmans N.V.’s 2020 interim results; • The resolution to hold a Meeting of Depositary Receipt
Holders on 15 November 2020, to be held digitally due to Covid-19 measures;
• The composition of the Board: Mr. W.M. van den Goorbergh will step down as of the spring meeting of 2021. He is not eligible for reappointment. The board decided to open up a vacancy and to give the Meeting of Depositary Receipt Holders of 20 November the opportunity to nominate candidates.
During the meeting, the SA Trust Board made a number of comments and asked questions of the chairman of the Executive Board and the chairman of the Supervisory Board on subjects including: • The consequences of the nitrogen and PFAS problem
for Heijmans and Heijmans’ view of the continued absence of any amended legislation on this front;
• The impact of the Covid-19 outbreak on Heijmans’ long-term order book;
• The Executive Board’s view of the resumption of a dividend pay-out.

252 Heijmans Annual Report 2020
APPENDICES
Meeting of 20 November 2020This board meeting focused on the preparations for the Meeting of Depositary Receipt Holders of 20 November 2020.
Meeting of Depositary Receipt Holders 20 November 2020On 4 November 2020, the SA Trust Board convened a meeting to be held on 20 November 2020. The convoca-tion and agenda for this meeting were, as usual, publis-hed on the Heijmans website. In view of the Covid-19-related measures, the board decided to hold this meeting in a digital format. In accordance with the procedure cited in the convocation, no depositary receipt holders registered for the meeting.
At the Meeting of Depositary Receipt Holders, the board noted that no depositary receipt holders had registered for the meeting and that it had not received any recom-mendations for the vacancy created by the resignation of Mr. W.M. van den Goorbergh in the spring of 2021. The board did not report on the Trust’s activities at the meeting and referred to the 2020 report, which was drawn up in accordance with best practice provision 4.4.6. in conjunction with provision 4.4.7. of the Dutch Corporate Governance Code and which will be published on the Heijmans website.
Participation SA Trust Board in the General Meeting of Shareholders of 15 April 2020The board of the SA Trust was represented via a proxy at the General Meeting of Shareholders on 15 April 2020, which was held in a hybrid form due to Covid-19-related measures. At the end of the meeting, after hearing the explanations of the Executive Board and the Supervisory Board, the board of trustees voted in favour of all the agenda items put to a vote.
The board of the SA Trust did not make use of its right to submit questions during the meeting, as the questions submitted in writing and answered at the meeting corresponded with those prepared by the board of the SA Trust.
The SA Trust granted authorisation to holders of depositary receipts who attended the General Meeting of Shareholders in person or who were represented by a third party, to vote independently on the number of depositary receipts for shares reported prior to the meeting, with due observance of the Articles of Association and Trust Conditions.
As was the case in 2010 through 2019, in its convocation for the 2020 General Meeting of Shareholders, the board of the SA Trust offered holders of depositary receipts who were unable to attend the shareholders meeting in person the opportunity to express their views on certain issues via e-mail or otherwise in writing. The board of the SA Trust is then able to take these views into consideration when determining how it will cast its vote. Once again, the board did not receive any response to this offer.
Votes cast at the General Meeting of Shareholders of 15 April 2020Of the 21,409,162 (depositary receipts for) shares SA Trust had issued as per 15 10 April 2020, 4,370,086 (depositary receipts for) shares were registered as present at the meeting (approximately 20%; 2019: approximately 30%). No holders of (depositary receipts for) shares were present at the meeting. The holders of 4,346,688 (depositary receipts for) shares issued voting instructions to ABN AMRO. The SA Trust therefore represented 17,062,119 (depositary receipts for) shares, or approximately 79%, at the AGM.
ActivitiesThe activities related to the administration of the shares or depositary receipts for shares are carried out by the administrator for the SA Trust, IQ EQ Netherlands N.V. in Amsterdam.
Costs The costs associated with the activities of the SA Trust are primarily related to the costs of administration (which are charged by IQ EQ) and the fees charged by the auditor EY for the audit of the financial statements. Other expenses relate to the remuneration of the trustees (see the section Board of Trustees and Remuneration below).
External adviceThe Board did not seek any external advice in the 2020 reporting year.

253Heijmans Annual Report 2020
APPENDICES
Board of Trustees and RemunerationThe Board of Trustees of the SA Trust consists of:W.M. van den Goorbergh (Chair)H. HooghoudtP.W. MoerlandJ.J.G.M. Sanders
W.M. van den Goorbergh is a member of the board of Stichting Administratiekantoor Financiële Instellingen (NLFI). Until 2002, Mr. Van den Goorbergh was Vice-Chairman and CFO of the Executive Board of Rabobank Nederland. Mr. van den Goorbergh was appointed as a trustee of the SA Trust on 22 February 2005.
P.W. Moerland is Chairman of the Supervisory Board of Enexis N.V., Chairman of Stichting Berenschot Beheer. Prior to this, in the period 2003 to October 2013, he was a member of the Executive Board of Rabobank Nederland, for the last four years as Chairman. In the years 1980 to 2013, Mr. Moerland was Professor of Business Administration at the Royal University of Groningen and Professor of Business Finance, and from 1999 also Professor of Corporate Governance, at the University of Tilburg. Mr Moerland was appointed as a trustee of the SA Trust on 25 March 2015.
H. Hooghoudt is a member of the Supervisory Board of IBS Capital Management B.V. and a member of the Supervisory Board of IBS Fund Management B.V. He has been a lawyer since 1975 and in 1990 joined NautaDutilh, where he currently acts as an adviser. Mr. Hooghoudt was appointed as trustee of the SA Trust on 23 March 2016.
J.J.G.M. Sanders is Chairman of the Supervisory Board of Bolsius N.V., Chairman of the Supervisory Board of Nemo Healthcare B.V., Chairman of the Board of Supervision of the Catharina Hospital in Eindhoven, Chairman of the Stichting Evenementen Liliane Fonds and member of the Advisory Committee of Voedselbank Eindhoven. From 2010 to mid-2014, Mr. Sanders was Managing Director of PSV N.V., and prior to this he spent 16 years at FrieslandCampina, for the last eight years as Chairman of the Executive Board. Mr. Sanders was appointed as a trustee of the SA Trust on 26 March 2014.
The remuneration of the Board of Trustees in 2020 amounted to €12,000 for the Chairman and €10,000 for each other trustee.
Contact information Heijmans Share Administration TrustHeijmans N.V.Attn. Ms. N. SchaefferGraafsebaan 655248 JT Rosmalene-mail: [email protected]

254 Heijmans Annual Report 2020
APPENDICES
16.7.2 The Heijmans Preference Share Trust
The Heijmans Preference Share Trust (hereinafter: ‘the Trust’) is an independent legal entity as defined in Section 5:71 (1)(c) of the Dutch Financial Supervision Act.
As stated in its articles of association of 10 October 2018, the purpose of the Trust is:• To promote the interests of Heijmans N.V. (the
Company) and of the business that is maintained by the Company and the companies affiliated with the Company in a group, in such a way that the interests of the Company and of that business and of all those involved are optimally safeguarded, and in such a way that influences that could compromise the independ-ence and/or continuity and/or the identity and/or the strategy of the Company and of those businesses contrary to those interests, are defended against to the greatest extent possible, as well as to take any action connected with or possibly conducive to the above;
• The Trust endeavours to attain its goal by, among other things, acquiring and managing shares, in particular preference shares, in the capital of the Company and by exercising - in court proceedings or elsewhere - the rights granted to it pursuant to the law, articles of association or by virtue of agreement; and
• The Trust may dispose of the shares it has acquired or may pledge them, provided that the voting rights associated with the shares in question do not transfer to the pledgee, or may otherwise encumber these shares, on the understanding that the Company’s approval is necessary for any disposal of shares.
The Trust has the right (a call option) to acquire prefe-rence shares in the capital of Heijmans N.V. up to a maximum of (close to) 100% of the nominal value of the capital issued in ordinary shares and financing preference shares B.
The Trust was granted the right of inquiry in 2008.
During the board meeting of 2 April 2020, Mr. F.J.G.M. Cremers was reappointed as a trustee for a term of four years. This appointment made use of the option laid down in the articles of association to deviate from the maximum number of terms for a trustee.
The composition of the Board of Trustees is as follows:
Mr. S.C.J.J. Kortmann Mr. F.J.G.M. CremersMr. B. Van der Veer

255Heijmans Annual Report 2020
APPENDICES
16.7.3 Reporting methodology
ScopeHeijmans’ operations are concentrated in the Netherlands and it reports key figures for these activities in this annual report. Unless specifically mentioned, combined projects have not been included in the non-financial information of this annual report, with the exception of safety-related information, for which Heijmans reports in line with SCC (Dutch: VCA) definitions. The IF figure for 2020 includes deferred absenteeism. An impact analysis showed that this led to a figure higher in 2020 when compared with the figure for 2019.
Information gathering and verificationThose involved in preparing the content and design of this report held regular consultations during the year. They organised a kick-off session in October at which they shared experiences from the previous year, together with targets and ambitions. At this session, those involved reached agreements regarding content, ambition and planning. These agreements formed the basis for the underlying report. The data used originate from the various administrations, systems and databases in the Heijmans organisation, including a number of manage-ment systems and the registration data on operating processes they produce. Examples include Workday for HRM-related aspects, energy management systems, as well as the likes of IRES for accident statistics. Information is also derived from other sources, such as the ERP systems and information from suppliers, including those supplying the company’s vehicle fleet, companies providing timber, and waste processing and energy companies.
Finally, reporting also includes data originating from the certified management systems ISO 14001, ISO 9001, SCC (Dutch: VCA) and SKAO. Although Heijmans has imple-mented various procedures for the reporting of incidents and the fact that we have actually received reports of incidents, Heijmans cannot be entirely certain that every incident has been reported.
Reporting methodologySustainability-related disclosures have been prepared in accordance with the Global Reporting Initiative (GRI Standards, Core option). Heijmans also applies the GRI supplement for the construction sector. Where possible, Heijmans uses the same terminology used in ISO 26000 and the Integrated Reporting Framework of the International Integrated Reporting Council. This report covers the reporting period 1 January 2020 through 31 December 2020.
Heijmans used the Greenhouse Gas Protocol for the disclosure of CO2 emissions. Heijmans commissioned EY Accountants LLP to provide limited assurance. The scope of the assurance covers chapters 1,3, 6 through 11, 13 and 14. The assurance report they issued has been added to this report.

256 Heijmans Annual Report 2020
APPENDICES
16.7.4 KPI table
Key Performance indicator Concrete targets ≥ 2021
Material aspect
SDG Qualitative / quantitative
Score 2019
Target 2020
Score 2020
Target 2021, and beyond
Explanation/definition Sources/reference
BETTER
Financial
1 Revenue (x € bn) 8 8 Quantitative 1,6 1,7Income from realisation of projects (in proportion to the progress of the projects) and sales of goods (mainly homes and land). Financial statements
2 Order book (x € bn) 8 8 Quantitative 2,1 1,9The total portion of works in progress not yet completed and projects acquired but not yet in progress at reporting date. Finance & control
3 Underlying EBITDA exclusive IFRS 16 (x € mln) 8 8 Quantitative 78 85
Underlying EBITDA is the operating result before depreciation and including the EBITDA from joint ventures, excluding revaluation of real estate and land, reorganisation expenses, book profits on the sale of entities and other non-opera-tional results that the groups considers exceptional.
Financial statements
4 Solvency 8 8 Quantitative 25% 29% Capital base (equity plus the cumulative preference share capital) compared to total assets. Financial statements
Safety
5 Number of accidents: total incl.at subcontractors 1, 2 2 8 Quantitative 84 -20% 85 -20% Total number of accidents on Heijmans projects according to SCC definitions. IRES
6 Number of fatal accidents 1, 2 2 8 Quantitative 1 0 0 0 Total number of fatal accidents on Heijmans projects (including subcontractors). IRES
7 Incident frequency (IF figure) 1, 2 2 8 Quantitative 3,3 < 1,0 3,7 < 1,0 IF: number of accidents resulting in absenteeism of at least one day per million hours worked according to SCC definitions. IRES
8 Safety ladder 3 2, 10 8 Qualitative External methodology by stichting NEN (the Royal Netherlands Standardization Institute). 10.1.1 Safety
Risk management & process improvement
9 Homes delivered without snagging items - 13, 18 8 Quantitative 37% 100% 54% 100% Percentage of total number of homes delivered with zero snagging items in reporting year. SMILE
10 Client appreciation Rijkswaterstaat - 13 8 Quantitative 7,5 > 8,5 8,2 > 8,5 Score by RWS consisting of a weighted average of Q1-Q4 2020, based on a methodology validated by them. RWS
11 Client appreciation ProRail - 13 8 Quantitative 7,9 > 8,5 7,6 > 8,5 Score by ProRail, consisting of a weighted average of Q4 2019 to Q3 2020, based on a methodology validated by them. ProRail
12 Client appreciation Private residential building - 13 8 Quantitative 7,1 > 7,5 7,3 > 7,5 Average score from surveys sent by Heijmans. The underlying methodology has been changed compared to last year. GrowPromotor
13 Purchasing spend subcontractors with valid SCC certificate - 12, 14, 17,
18 8 Quantitative 100% 100% 98% 100% Percentage of total procurement spend with subcontractors with a valid SCC certification. Procurement spend on combination projects has not been included. ESIZE/SAP
14 Purchasing spend preferred suppliers - 12, 18 8 Quantitative 53% > 50% 52% > 55% Percentage of procurement spend with preferred suppliers in 2020, not including the category non-procurement. Procurement spend on combination projects has not been included. ESIZE/SAP
15 Implementation GRIP - 18 8 Qualitative Item has been implemented in the regular process. Due to the new bold statements as of 2021, this KPI will not be included anymore as of next year’s report.
10.1.2 Risk management and process improvement
16 lmplementation LEAN - 18 8 Qualitative Item has been implemented in the regular process. Due to the new bold statements as of 2021, this KPI will not be included anymore as of next year’s report.
10.1.2 Risk management and process improvement
17 Privacy and cyber security - 18, 19 8 Qualitative 14.4 Risk management
Quality of the organisation
18 Staff turnover (%) at own request 6 7 8 Quantitative 5,4% 4,6%The number of employees that leaves on their own initiative in proportion to the average number of employees (excl. interns) over a period of one year. Workday
19 Total absenteeism 7 1, 2 8 Quantitative 4,4% < 4,0% 4,7% < 4,0% Number of absentee days compared to available number of calendar days. Health and Safety Service guidelines for measuring absenteeism rates. VerzuimSignaal
20 Number of managers who participated in leadership training (%) - 10, 15 8 Quantitative 47% 79%
Item has been implemented in the regular process. Due to the new bold statements as of 2021, this KPI will not be included anymore as of next year’s report. Pluspoort
21 Training costs (x mln) - 7, 10 8 Quantitative 2,8 2,9 Training costs in accordance with registration Heijmans Academy. Pluspoort
22 Employee engagement 2021 > 2019 8 15, 16 8 Qualitative 10.1.3. Quality of the organisation
23 Diversity: % women - 15 8 Quantitative 12% 13%The percentage of women in proportion to the total number of employees (excl. interns) on the final day of the reporting period. Workday
SMARTER
24 Spending on innovation (x € mln.) - 6 8 Quantitative 5,8 10,4 Spending on innovation group and business areas in EUR mln. SAP
Digitalisation
25BIM: Projects (cat.3) which, according to BIM-plan, achieve target stars in the realisation phase (prognosis) (%)
9 6 8 QualitativeBuilding Information Model (BIM): part of cat. 3 projects started in 2020, expected to achieve the number of BIM stars upon delivery, according to the multi-year BIM-plan. A maximum of 25 stars to be achieved, spread over five user levels.
10.2.1 Digitalisation
26 New data-driven services successfully launched in the market 10 6 8 Quantitative 2 4 Number of data-driven services successfully launched in the market. Finance & control

257Heijmans Annual Report 2020
APPENDICES
16.7.4 KPI table
Key Performance indicator Concrete targets ≥ 2021
Material aspect
SDG Qualitative / quantitative
Score 2019
Target 2020
Score 2020
Target 2021, and beyond
Explanation/definition Sources/reference
BETTER
Financial
1 Revenue (x € bn) 8 8 Quantitative 1,6 1,7Income from realisation of projects (in proportion to the progress of the projects) and sales of goods (mainly homes and land). Financial statements
2 Order book (x € bn) 8 8 Quantitative 2,1 1,9The total portion of works in progress not yet completed and projects acquired but not yet in progress at reporting date. Finance & control
3 Underlying EBITDA exclusive IFRS 16 (x € mln) 8 8 Quantitative 78 85
Underlying EBITDA is the operating result before depreciation and including the EBITDA from joint ventures, excluding revaluation of real estate and land, reorganisation expenses, book profits on the sale of entities and other non-opera-tional results that the groups considers exceptional.
Financial statements
4 Solvency 8 8 Quantitative 25% 29% Capital base (equity plus the cumulative preference share capital) compared to total assets. Financial statements
Safety
5 Number of accidents: total incl.at subcontractors 1, 2 2 8 Quantitative 84 -20% 85 -20% Total number of accidents on Heijmans projects according to SCC definitions. IRES
6 Number of fatal accidents 1, 2 2 8 Quantitative 1 0 0 0 Total number of fatal accidents on Heijmans projects (including subcontractors). IRES
7 Incident frequency (IF figure) 1, 2 2 8 Quantitative 3,3 < 1,0 3,7 < 1,0 IF: number of accidents resulting in absenteeism of at least one day per million hours worked according to SCC definitions. IRES
8 Safety ladder 3 2, 10 8 Qualitative External methodology by stichting NEN (the Royal Netherlands Standardization Institute). 10.1.1 Safety
Risk management & process improvement
9 Homes delivered without snagging items - 13, 18 8 Quantitative 37% 100% 54% 100% Percentage of total number of homes delivered with zero snagging items in reporting year. SMILE
10 Client appreciation Rijkswaterstaat - 13 8 Quantitative 7,5 > 8,5 8,2 > 8,5 Score by RWS consisting of a weighted average of Q1-Q4 2020, based on a methodology validated by them. RWS
11 Client appreciation ProRail - 13 8 Quantitative 7,9 > 8,5 7,6 > 8,5 Score by ProRail, consisting of a weighted average of Q4 2019 to Q3 2020, based on a methodology validated by them. ProRail
12 Client appreciation Private residential building - 13 8 Quantitative 7,1 > 7,5 7,3 > 7,5 Average score from surveys sent by Heijmans. The underlying methodology has been changed compared to last year. GrowPromotor
13 Purchasing spend subcontractors with valid SCC certificate - 12, 14, 17,
18 8 Quantitative 100% 100% 98% 100% Percentage of total procurement spend with subcontractors with a valid SCC certification. Procurement spend on combination projects has not been included. ESIZE/SAP
14 Purchasing spend preferred suppliers - 12, 18 8 Quantitative 53% > 50% 52% > 55% Percentage of procurement spend with preferred suppliers in 2020, not including the category non-procurement. Procurement spend on combination projects has not been included. ESIZE/SAP
15 Implementation GRIP - 18 8 Qualitative Item has been implemented in the regular process. Due to the new bold statements as of 2021, this KPI will not be included anymore as of next year’s report.
10.1.2 Risk management and process improvement
16 lmplementation LEAN - 18 8 Qualitative Item has been implemented in the regular process. Due to the new bold statements as of 2021, this KPI will not be included anymore as of next year’s report.
10.1.2 Risk management and process improvement
17 Privacy and cyber security - 18, 19 8 Qualitative 14.4 Risk management
Quality of the organisation
18 Staff turnover (%) at own request 6 7 8 Quantitative 5,4% 4,6%The number of employees that leaves on their own initiative in proportion to the average number of employees (excl. interns) over a period of one year. Workday
19 Total absenteeism 7 1, 2 8 Quantitative 4,4% < 4,0% 4,7% < 4,0% Number of absentee days compared to available number of calendar days. Health and Safety Service guidelines for measuring absenteeism rates. VerzuimSignaal
20 Number of managers who participated in leadership training (%) - 10, 15 8 Quantitative 47% 79%
Item has been implemented in the regular process. Due to the new bold statements as of 2021, this KPI will not be included anymore as of next year’s report. Pluspoort
21 Training costs (x mln) - 7, 10 8 Quantitative 2,8 2,9 Training costs in accordance with registration Heijmans Academy. Pluspoort
22 Employee engagement 2021 > 2019 8 15, 16 8 Qualitative 10.1.3. Quality of the organisation
23 Diversity: % women - 15 8 Quantitative 12% 13%The percentage of women in proportion to the total number of employees (excl. interns) on the final day of the reporting period. Workday
SMARTER
24 Spending on innovation (x € mln.) - 6 8 Quantitative 5,8 10,4 Spending on innovation group and business areas in EUR mln. SAP
Digitalisation
25BIM: Projects (cat.3) which, according to BIM-plan, achieve target stars in the realisation phase (prognosis) (%)
9 6 8 QualitativeBuilding Information Model (BIM): part of cat. 3 projects started in 2020, expected to achieve the number of BIM stars upon delivery, according to the multi-year BIM-plan. A maximum of 25 stars to be achieved, spread over five user levels.
10.2.1 Digitalisation
26 New data-driven services successfully launched in the market 10 6 8 Quantitative 2 4 Number of data-driven services successfully launched in the market. Finance & control

258 Heijmans Annual Report 2020
APPENDICES
Key Performance indicator Concrete targets ≥ 2021
Material aspect
SDG Qualitative / quantitative
Score 2019
Target 2020
Score 2020
Target 2021, and beyond
Explanation/definition Sources/reference
Production technology
27 Concept homes delivered 12 6 8, 11 Quantitative 738 846 Number of concept homes delivered in 2020. Concept-team
28 New production technology-related initiatives applied in projects 12 6 8, 9 Qualitative 10.2.2 Production
technology
29 Conceptual building 12 6 8, 9 Qualitative 10.2.2 Production technology
SUSTAINABLE
Energy
30 Absolute CO2 emissions scope 1+2 in tons 13 1, 11 7 Quantitative 45.543
CO2-neutraal in 2023
42.507 CO2-neutral in 2023 Total CO2 emissions Scope 1+2. SKAO CO2 performance ladder, GHG protocol. SAP
31 Average EPC of homes delivered - 1, 3, 11 7 Quantitative 0,40 0,33 EPC of the homes delivered in 2020. EPC-software
32 Average CO2 emissions of homes delivered (kilo) 15 1, 3, 11 7 Quantitative - 1.409 Average CO2 emission of homes delivered in 2020. In kilogrammes CO2. EPC and BENG software
33 Energy-neutral projects 15 1, 3, 11 7 Qualitative 10.3.1 Energy
Materials
34 Total quantity of residual materials - 1, 4 12 Quantitative 22.500 24.915ENCORD Construction Waste Measurement Guide for definitions (including operational waste, no excavations ), measured in tonnes.
Sum of data waste service providers
35 Separation of residual materials building site - 1, 4 12 Quantitative 75% > 75% 71% > 75% ENCORD Construction Waste Measurement Guide for definitions (including operational waste, no excavations ),
measured in tonnes. Sum of data waste service providers
36 Reuse of residual materials after removal - 1, 4 12 Quantitative 90% > 90% 89% > 90%
Sustainable reuse is defined as raw material for the generation of green energy. On the basis of waste profile Renewi; incl. quantity Sita and other waste processors. On the basis of tonnage. Landfill waste and plus grey electricity excepted.
Sum of data waste service providers
37Procurement spend with preferred suppliers with framework agreements with signed sustainability statement
- 1, 4, 12, 14 12 Quantitative 98% 100% 93% 100% Percentage of total procurement spend with preferred suppliers with a framework contract with a signed sustainability
statement. Purchasing spend combination projects has not been included. ESIZE
38 Offers cat. 3 with score on environmen-tal performance (%) 16 1, 4 12 Qualitative 10.3.2 Materials
39 Verpakkingen herbruikbaar of recyclebaar 17 1, 4 12 Qualitative 10.3.2 Materials
40 CPG score GGB homes - (1-10) 18 1, 4 11, 12 Qualitative 10.3.2 Materials
41 Asphalt recycling 19 1, 4 12 Qualitative 10.3.2 Materials
42 Concrete recycling 19 1, 4 12 Qualitative 10.3.2 Materials
43Heijmans Raw materials: Transaction volume traded via Matching Materials (tonnes)
- 1, 4 12 Qualitative 10.3.2 Materials
Space
44 New area developments withGreenlabel A (%) 20 1, 5 11 Qualitative 10.3.3 Space
45Projects where initiatives with regards to climate adaptation and biodiversity have been applied (#)
21 1, 5 11 Qualitative Chapter 11
46Propositions with regards to climate adaptation and biodiversity that have been developed and are to be applied
21 1, 5 11 Qualitative 10.3.3 Space
47Showcases - supergezonde leefomgev-ing (Leusden, Vlaardingen, Feyenoord City)
22 1, 5 11 Qualitative Chapter 11: In the spotlight: Smart City
Other
48 Score transparency benchmark - 9, 17 - Quantitative 12 12 Ranking in the transparency benchmark of the Dutch Economic Affairs Ministry. Ministry website
259Heijmans Annual Report 2020
APPENDICES
Key Performance indicator Concrete targets ≥ 2021
Material aspect
SDG Qualitative / quantitative
Score 2019
Target 2020
Score 2020
Target 2021, and beyond
Explanation/definition Sources/reference
Production technology
27 Concept homes delivered 12 6 8, 11 Quantitative 738 846 Number of concept homes delivered in 2020. Concept-team
28 New production technology-related initiatives applied in projects 12 6 8, 9 Qualitative 10.2.2 Production
technology
29 Conceptual building 12 6 8, 9 Qualitative 10.2.2 Production technology
SUSTAINABLE
Energy
30 Absolute CO2 emissions scope 1+2 in tons 13 1, 11 7 Quantitative 45.543
CO2-neutraal in 2023
42.507 CO2-neutral in 2023 Total CO2 emissions Scope 1+2. SKAO CO2 performance ladder, GHG protocol. SAP
31 Average EPC of homes delivered - 1, 3, 11 7 Quantitative 0,40 0,33 EPC of the homes delivered in 2020. EPC-software
32 Average CO2 emissions of homes delivered (kilo) 15 1, 3, 11 7 Quantitative - 1.409 Average CO2 emission of homes delivered in 2020. In kilogrammes CO2. EPC and BENG software
33 Energy-neutral projects 15 1, 3, 11 7 Qualitative 10.3.1 Energy
Materials
34 Total quantity of residual materials - 1, 4 12 Quantitative 22.500 24.915ENCORD Construction Waste Measurement Guide for definitions (including operational waste, no excavations ), measured in tonnes.
Sum of data waste service providers
35 Separation of residual materials building site - 1, 4 12 Quantitative 75% > 75% 71% > 75% ENCORD Construction Waste Measurement Guide for definitions (including operational waste, no excavations ),
measured in tonnes. Sum of data waste service providers
36 Reuse of residual materials after removal - 1, 4 12 Quantitative 90% > 90% 89% > 90%
Sustainable reuse is defined as raw material for the generation of green energy. On the basis of waste profile Renewi; incl. quantity Sita and other waste processors. On the basis of tonnage. Landfill waste and plus grey electricity excepted.
Sum of data waste service providers
37Procurement spend with preferred suppliers with framework agreements with signed sustainability statement
- 1, 4, 12, 14 12 Quantitative 98% 100% 93% 100% Percentage of total procurement spend with preferred suppliers with a framework contract with a signed sustainability
statement. Purchasing spend combination projects has not been included. ESIZE
38 Offers cat. 3 with score on environmen-tal performance (%) 16 1, 4 12 Qualitative 10.3.2 Materials
39 Verpakkingen herbruikbaar of recyclebaar 17 1, 4 12 Qualitative 10.3.2 Materials
40 CPG score GGB homes - (1-10) 18 1, 4 11, 12 Qualitative 10.3.2 Materials
41 Asphalt recycling 19 1, 4 12 Qualitative 10.3.2 Materials
42 Concrete recycling 19 1, 4 12 Qualitative 10.3.2 Materials
43Heijmans Raw materials: Transaction volume traded via Matching Materials (tonnes)
- 1, 4 12 Qualitative 10.3.2 Materials
Space
44 New area developments withGreenlabel A (%) 20 1, 5 11 Qualitative 10.3.3 Space
45Projects where initiatives with regards to climate adaptation and biodiversity have been applied (#)
21 1, 5 11 Qualitative Chapter 11
46Propositions with regards to climate adaptation and biodiversity that have been developed and are to be applied
21 1, 5 11 Qualitative 10.3.3 Space
47Showcases - supergezonde leefomgev-ing (Leusden, Vlaardingen, Feyenoord City)
22 1, 5 11 Qualitative Chapter 11: In the spotlight: Smart City
Other
48 Score transparency benchmark - 9, 17 - Quantitative 12 12 Ranking in the transparency benchmark of the Dutch Economic Affairs Ministry. Ministry website
260 Heijmans Annual Report 2020
APPENDICES
Explanation KPI table:• The total amount of residual material is a material
aspect and is therefore reported in the annual report. It has proven impossible to link this with concrete reduction targets in past years, due to the high level of dependence on the nature of the projects offered (including or excluding demolition). Via its activities in the field of LEAN design and circular construction, Heijmans does target the minimisation of waste and high-grade processing of residual material flows in the design phase. Heijmans also actively targets the reduction of the amount of packaging materials.
• Since 2018, Heijmans has used EBITDA as the definition of result.
• Safety: the IF figures for 2020 include combined projects calculated pro rata.
• CO2 measurement: to measure and report on CO2 emissions, Heijmans uses the division into scopes of the Green House Gas (GHG) protocol. Scope 1 covers the emissions from fuels we purchase and consume ourselves (mainly gas, petrol and diesel). Scope 2 covers CO2 emissions resulting from the use of electricity (we do not cause these CO2 emissions, as they are generated by the power company) and business traffic. Scope 3 (which is not reported on in this annual report) covers the CO2 emissions from commuter traffic and public transport (which is relevant for SKAO).
• CO2 measurement: Heijmans applies the conversion factors taken from the www.CO2emissiefactoren.nl website. These are updated every four years in the reporting method that Heijmans uses.
• In the sub-administration of the EPC score, 0.4 has been taken as a proxy for the result, which can result in minor deviations when compared with the actual calculated EPC score. Inherent in the use of the EPC score is that this is always the same or lower than the currently legally required norm of 0.4.
• CO2 measurement: the 2019 and 2020 reports showed the EPC score of the homes heijmans delivered. In 2021, the Dutch government introduced amended legislation (BENG). Both the EPC and the BENG can be converted to the same indicator (average CO2 emission of the delivered homes). This guarantees continuity in the measurements.
• CO2 measurement: the CO2 emissions amounted to 42,507 tonnes (41,536 tonnes of which were scope 1 and 971 tonnes were scope 2). This includes some compensation for the purchased electricty. Without this compensation, the total amount would have been 53,097 tonnes.
• The stated amounts of residual materials are provided by residuial material processors. This covers the period from January through November 2020 and the figures for December are an estimate.

261Heijmans Annual Report 2020
APPENDICES
16.7.5 GRI Standards: general disclosures
GRI Content Index Heijmans – CoreSRS Disclosure Reference RemarkGRI 102: GENERAL DISCLOSURES 2016 1. Organizational profile102-1 Name of the organization Title page
102-2 Activities, brands, products, and services Foreword
102-3 Location of the organization's headquarters Foreword
102-4 Number of countries operating Foreword
102-5 Nature of ownership and legal form Corporate Governance and The Heijmans share
102-6 Markets served Profile
102-7 Scale of the reporting organizationKey figures Employee numbers Financial results
102-8 Information on employees and other workers Quality of the organisation A more detailed breakdown is currently seen as too detailed in relation to materiality.
102-9 Supply chainProfile StrategyValue creation model
102-10 Significant changes to the organization and its supply chain
Financial resultsForewordHeijmans Energie B.V.Risk management and process improvement
102-11 Precautionary Principle or approach Risk management
102-12 External initiativesReporting methodologyHuman rightsSector organisations
102-13 Memberships of associations Alliances
2. Strategy102-14 Statement from senior decision-maker Alliances3. Ethics and integrity
102-16Values, principles, standards, and norms of behavior
Open business culture
4. Governance
102-18 Governance structure Embedding corporate governance
5. Stakeholder Engagement
102-40 List of stakeholder groups In dialogue with stakeholdersMaterial aspects
102-41 Collective bargaining agreements Quality of the organisation Close to 100% of Heijmans’ employees are covered by a collective bargaining agreement
102-42 Identifying and selecting stakeholders In dialogue with stakeholders
102-43 Approach to stakeholder engagement In dialogue with stakeholders
102-44 Key topics and concerns raised Material aspects In dialogue with stakeholders
6. Reporting practice
102-45 Entities included in the consolidated financial statements
Financial statements Reporting methodology
102-46 Defining report content and topic Boundaries Reporting methodologyManagement Approach
102-47 List of material topics Material aspectsManagement Approach
102-48 Restatements of information There have been no significant restatements
102-49 Changes in reporting Material aspects
102-50 Reporting period Reporting methodology
102-51 Date of most recent report February 2020
102-52 Reporting cycle Reporting methodology
102-53 Contact point for questions regarding the report Colophon
102-54 Claims of reporting in accordance with the GRI Standards Reporting methodology
102-55 GRI content indexManagement Approach GRI Standards general disclosuresGRI Standards specific disclosures
102-56 External assuranceReporting methodologyAssurance report of the independent auditor

262 Heijmans Annual Report 2020
APPENDICES
16.7.6 Management Approach overview
Management Approach The management approach section describes the most important clustered material aspects, together with two aspects important to Heijmans.
Material aspect Explanation material aspect Scope and limitations Control of processes Evaluation of processes
Healthy environment Heijmans takes into account continuing urbanisation in its construction projects by designing safe and healthy neighbourhoods and road systems. These aspects also play a role in the company’s own working environment.
Heijmans has various KPIs linked to this material aspect. From safety numbers to absenteeism and more externally focused KPIs, such as CO2 emissions and area-focused sustainability labels.
The ambitions on this front are a part of the regular process of defining the Programme of Requirements and are managed via the processes in the manage-ment system.
If the ambitions are stated in the Programme of Requirements, the realisation of same is mostly evaluated and assessed by clients following the completion of the project. The evaluation of more internal KPIs has already been described in the other – more specific – aspects, such as safety in the workplace.
Safety in the workplace
A safe workplace is one of Heijmans’ key policy priorities. Employees are one of our most important stakeholders. Moreover, many construction activities are by nature dangerous due to large masses and numerous vehicles.
Heijmans operates exclusively in the Netherlands, which means that Dutch labour legislation governs the creation of a safe and healthy working environment. In addition, subcontractors play a significant role on building sites due to their own responsibility for safety.
Within Heijmans, employees are trained according to SCC methods. Subcontractors are also expected to have SCC or comparable certification. Heijmans also takes physical precautions on building sites to promote safety. Finally, Heijmans has a semi-internal health and safety service (ASC).
Evaluation is part of the SCC system. A range of indicators are also measured by the specific organisation of Quality & Safety. KPIs include the number of accidents, subcontractors’ SCC certification and the IF.
Building energy- neutral solutions
Heijmans’ core competency is the design and construc-tion of objects in the built environment (homes, non-residential structures, infrastructure projects, etc.). Heijmans can contribute to the energy transition by using its know-how and expertise to make sure these objects operate in an energy-neutral manner.
Due to the fact that Heijmans is not always responsible for the design, the company is often dependent on a client’s tender and ambitions. In addition, not all energy-relat-ed objects are comparable (a house uses the most energy once it is complete, a road when it is being built).
There are methods laid down in laws and regulation for the measurement of the energy performance of various objects. Heijmans has a certified system to control and improve its own emissions (SKAO and ISO 14001).
The evaluation of processes is an integral part of the aforementioned SKAO and ISO 14001 management systems. In addition, a performance evaluation is frequently incorporated in the delivery documents as laid down in laws and regulations.
Circular construction Heijmans reduces the environmental impact of material flows by building with reusable materials and by minimising waste or reusing said materials as efficiently as possible.
Materials are subject to innovation. Functional requirements (strength, bearing capacity) are often limiting factors. The market for waste materials can also be a limiting factor.
Heijmans has reached agreements on the separation of materials at building sites and with processors on how waste is processed. This is monitored on a monthly basis.
Heijmans uses an ISO 90001/14001-certified management system to evaluate performance on this front, together with workplace reports.
Climate adaptive and nature-inclusive construction
Buildings and structures are more than just functional (living working/connecting); they can also make a positive contribution to biodiversity and climate change.
Many design requirements are based on laws and regulations. In addition, Heijmans frequently makes an extra effort to adapt its projects to the natural environment,
Design requirements are included in Programmes of Requirements and then controlled in Heijmans’ quality management systems. Heijmans has various sustainability performance measurement methods, depending on the type of building or structure.
Heijmans uses an ISO 90001/14001-certified management system to evaluate performance on this front, as well as specific sustainable construction KPIs.

263Heijmans Annual Report 2020
APPENDICES
Material aspect Explanation material aspect Scope and limitations Control of processes Evaluation of processes
Use of smart technology
Digitalisation and the use of new production technologies are leading trends in the construction industry. Heijmans is responding to this trend with specific programmes for BIM and the development of conceptual building.
Digitalisation will impact the entire construction chain (from sales processes and production processes to management and maintenance processes). New production technology goes beyond robotification to the industrialisation of the construction process.
Heijmans has developed programmes to make progress on the digitalisation front and has drawn up KPIs to measure this progress. In addition to this, Heijmans maximises the integration of these developments in its standard operating processes.
Heijmans uses regular audits of the integrated process within the company’s management system to evaluate performance on this front, together with specific KPIs in reports to the Executive Board.
Being financially healthy
Stakeholders have indicated that a good price/quality ratio is essential. This also adds economic value, which in turn provides employment and continuity.
Scope is the Dutch market, in which Heijmans is often dependent on public tenders to win contracts. Many activities are also framed by legislation and regulations.
In its annual report, Heijmans reports extensively on the financial values and management processes within Heijmans related to economic performance.
Evaluation by internal audit, external auditor, annual reporting and reporting to AGM.
Reduction of CO2 emissions from own operations
Heijmans takes measures to minimise the CO2 footprint of its own operations.
The measures Heijmans takes to reduce CO2 emissions focus on scope 1 and scope 2 emissions. Heijmans does take measures to influence scope 3 emissions, for instance via its sustainable procurement policy.
Clients and the government have expressed a desire for more sustainability. Heijmans expresses this in targets for our own business operations and those of our chain partners.
Heijmans uses ISO 90001/14001-certified management systems to evaluate performance on this front.
264 Heijmans Annual Report 2020
APPENDICES
16.7.7 GRI Standards: specific disclosures
GRI Content Index Heijmans – Core
SRS Disclosure Reference Remark
Topic Specific Standards
1. Healthy living environment
Heijmans Employee absenteeism, amount and percentage of waste separated
KPI table
2. Safe working environment (GRI 403: OCCUPATIONAL HEALTH AND SAFETY 2018)
403-1 Occupational health and safety management system
SafetyVitality
403-2 Hazard identification, risk assessment, and incident investigation
Collaboration Heijmans has an extensive system for the identification and assessment of risks.It also has a digital reporting system (GO app) and an extensive follow-up process.
403-3 Occupational health services Safety Heijmans has its own Occupational Health and Safety Service, which provides guidance.
403-4 Worker participation, consultation, and communi-cation on occupational health and safety
SafetyResearch
Heijmans has appointed prevention officers from within the organisation, in dialogue with the Works Council, and also has an active Safety, Health, Welfare and the Environment committee.
403-5 Worker training on occupational health and safety SafetyVR training
403-6 Promotion of worker health Heijmans only operates in the Netherlands, where the entire population has access to high-quality care through compulsory basic insurance.
403-7 Prevention and mitigation of occupational health and safety impacts directly linked by business relationships
Safety in tendersChain responsibilityEducation
403-9 Work related injuries SafetyKPI table
3. Creating energy-neutral solutions
Heijmans Energy Performance Coefficient (EPC) of newly built homes
KPI table
4. Circular construction (GRI 306: WASTE 2020)
306-2 Management of significant waste-related impacts MaterialsKPI table
5. Climate-adaptive and nature-inclusive construction
Heijmans New area development with Greenlabel A (%) KPI table In addition to these indicators, we are developing three more indicators on which we wish to report next year.
6. Utilising smart technology
Heijmans BIM projects category 3, number of new data-driven services
KPI table

265Heijmans Annual Report 2020
APPENDICES
16.7.8 EU Directive Non-Financial Information and Diversity information reference table
Topic SubtopicIncluded (yes/no)
Business model Yes About Heijmans and Value creation model
Relevant social and personnel matters (e.g. HR, safety etc.)
A description of the policies pursued, including due dilligence.
Yes Value creation model and Strategy
The outcome of those policies. Yes Non-financial results
Principle risks in own operations and within value chain.
Yes Risk management
How risks are managed. Yes Risk management
Non-financial key performance indicators.
Yes Strategy and KPI table
Relevant Environmental maters (e.g. climate-related impacts)
A description of the policies pursued, including due dilligence.
Yes Strategy
The outcome of those policies. Yes Strategy
Principle risks in own operations and within value chain.
Yes Risk management and Strategy
How risks are managed. Yes Risk management and Strategy
Non-financial key performance indicators.
Yes Strategy and KPI table
Relevant matters with respect for human rights (e.g. labour protection)
A description of the policies pursued, including due dilligence.
Yes Strategy and Human rights
The outcome of those policies. Yes Strategy and Human rights
Principle risks in own operations and within value chain.
Yes Strategy, Human rights and Risk management
How risks are managed. Yes Strategy, Human rights and Risk management
Non-financial key performance indicators.
Yes Strategy, Human rights and Risk management
Relevant matters with respect toanti-corruption and briberya
A description of the policies pursued, including due dilligence.
Yes Corporate Governance and Ethical conduct and dilemmas
anti-corruption and briberya Yes Corporate Governance and Ethical conduct and dilemmas
Principle risks in own operations and within value chain.
Yes Corporate Governance and Ethical conduct and dilemmas
How risks are managed. Yes Corporate Governance and Ethical conduct and dilemmas
Non-financial key performance indicators.
No Corporate Governance and Ethical conduct and dilemmas
Insight into the diversity (executive board and the supervisory board)
A description of the policies pursued.
Yes Strategy and direct reference to the 2019 Corporate Governance sstatement on Heijmans’ website
Insight into the diversity (executive board and the supervisory board)
Yes Strategy and direct reference to the 2019 Corporate Governance sstatement on Heijmans’ website
Description of how the policy is implemented
Yes Strategy
Results of the diversity policy Yes Strategy

266 Heijmans Annual Report 2020
APPENDICES
16.7.9 Sustainable Development Goals
Chapter 13 includes a description of the process used to arrive at the most relevant SDGs for Heijmans. In this section, we describe these goals and the most significant sub-goals and indicate the role Heijmans plays in contributing to the achievement of these goals in order to have an impact. The KPI table in appendix 16.7.4 shows which SDGs are linked to specific KPIs to manage results and progress.
The top SDGs for Heijmans1. SDG 7. Affordable and clean energy 2. SDG 8. Decent work and economic growth 3. SDG 9. Industry, innovation and infrastructure4. SDG 11. Sustainable cities and communities5. SDG 12. Responsible consumption and production
High
LowAverage
Impact
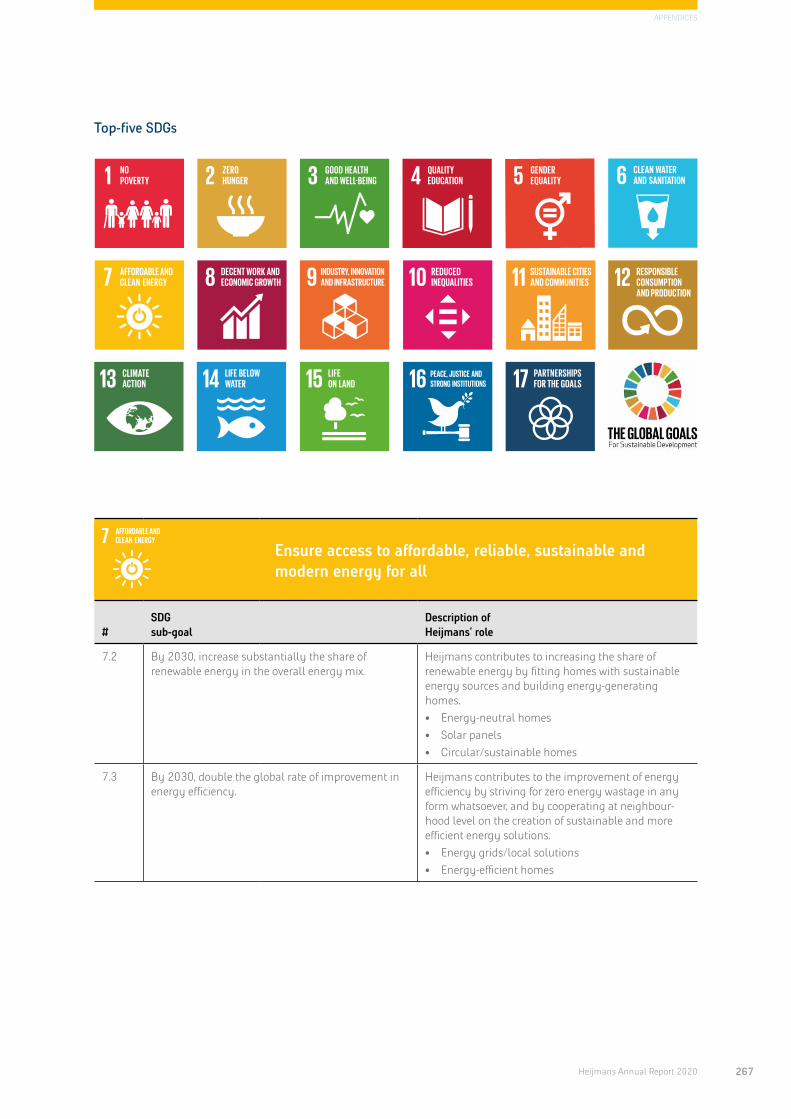
267Heijmans Annual Report 2020
APPENDICES
Top-five SDGs
Ensure access to affordable, reliable, sustainable and modern energy for all
#SDG sub-goal
Description of Heijmans’ role
7.2 By 2030, increase substantially the share of renewable energy in the overall energy mix.
Heijmans contributes to increasing the share of renewable energy by fitting homes with sustainable energy sources and building energy-generating homes.• Energy-neutral homes • Solar panels • Circular/sustainable homes
7.3 By 2030, double the global rate of improvement in energy efficiency.
Heijmans contributes to the improvement of energy efficiency by striving for zero energy wastage in any form whatsoever, and by cooperating at neighbour-hood level on the creation of sustainable and more efficient energy solutions.• Energy grids/local solutions • Energy-efficient homes

268 Heijmans Annual Report 2020
APPENDICES
Promote continued, inclusive and sustainable economic growth, full and productive employment and decent work for all
#SDG sub-goal
Description of Heijmans’ role
8.2 Achieve higher levels of economic productivity through diversification, technological modernisation and innovation, also by focusing on sectors with high added value and labour-intensive sectors.
Heijmans generates economic productivity in the construction industry through its own operations and by setting an example in terms of innovation, digitalisation and technological modernisation.• Digitalisation • Industrialisation • Production technology
8.8 Protect labour rights and promote safe and healthy working environments for all workers, including migrant workers, in particular women migrants, and those in precarious employment.
Heijmans ensures safe and healthy working environ-ments for employees, subcontractors and other parties. Heijmans also provides an inspiring and motivating workplace that keeps employees engaged.• Safety • Training and development of employees • Engagement of employees
Build resilient infrastructure, promote inclusive and sustainable industrialisation and stimulate innovation
#SDG sub-goal
Description of Heijmans’ role
9.1 Build high-quality, reliable, sustainable and resilient infrastructure, including regional and trans-border infrastructure, to support economic development and human well-being, with a focus on affordable and equitable access for all.
Heijmans develops high-quality infrastructure that is reliable, sustainable and resilient.
9.4 By 2030, modernise infrastructure and retrofit industries to make them sustainable, with increased efficiency in the use of resource and greater adoption of cleaner and environment-friendly technologies and industrial processes, with all countries taking the action required according to their respective capabilities.
Heijmans plays a role in the modernisation and increased sustainability of infrastructure as the ‘director of the construction chain’.• Circular construction • Chain partner• Environment-friendly technologies.

269Heijmans Annual Report 2020
APPENDICES
Make cities inclusive, safe, resilient and sustainable
#SDG sub-goal
Description of Heijmans’ role
11.1 By 2030, ensure access for all to adequate, safe and affordable housing and basic services and upgrade slums.
Heijmans contributes to adequate, safe and affordable housing by developing various residential concepts and increasing the availability of homes in the Netherlands.• Sufficient homes • High-quality homes • Affordable homes • Conceptual construction
11.3 By 2030, enhance inclusive and sustainable urbanisation and capacity for participatory, integrated and sustainable human settlement planning and management in all countries.
Heijmans develops sustainable (urban) areas, while devoting attention to the needs of end-users and trends and developments.• High-quality living environment • Urbanisation • Circularity of homes • Local energy networks • Climate adaptation and biodiversity
Ensure sustainable consumption and production patterns
#SDG sub-goal
Description of Heijmans’ role
12.2 By 2030, achieve the sustainable management and efficient use of natural resources.
Heijmans contributes to the sustainable management and efficient use of natural resources via its own business operations.• Sustainable procurement of natural resources • Reduction of CO2 emissions • Efficient use of natural resources in• the products/services Heijmans delivers
12.5 By 2030, substantially reduce waste generation through prevention, reduction, recycling and reuse.
Heijmans limits its own waste production via prevention, reduction, recycling and reuse.• Separation of residual materials at building sites • Reuse of residual materials after removal • Reuse of packaging

270 Heijmans Annual Report 2020
APPENDICES
16.7.10 Human rights
Companies can have a direct and indirect impact on human rights in the Netherlands and the rest of the world via their operations. Heijmans endorses the general premises of the Guiding Principles related to companies and human rights laid down in UN resolution 17/4 on 16 June 2011. These describe the exceptional obligation of companies to comply with all relevant legislation, to respect human rights, and to take appropriate, effective measures if rights or obligations are infringed. Heijmans realises that it can also have a positive impact by, for example, drawing up fair collective labour agreements, procuring sustainable materials, and collaborating with partners that ¬¬adhere to these same principles. A significant proportion of the human rights aspects that are relevant to Heijmans apply to the entire construction sector. A significant risk-limiting factor is the fact that Heijmans does not carry out any construction activities outside the Netherlands. However, the supply chain is exposed to such risks.
Daily attention When we talk about human rights, it is often in terms of violations, yet many of the issues related to this theme receive daily attention from management and are a standard part of the active management of safety, HR and the procurement policies. This involves issues such as safeguarding healthy working conditions, freedom of association (trade unions), applying fair and equal pay policies, and taking into consideration sustainability aspects in procurement. In addition, Heijmans has attitude and behaviour rules based on a number of basic human rights principles (the so-called ‘Kr8 van Heijmans’). These are an integral part of the employment contracts of all Heijmans employees. In addition, Heijmans has various reporting mechanisms and a whistle blower scheme.
Chain responsibility Chain responsibility and purchasing require a material analysis of the risks associated with the procured products and a discussion with stakeholders on the reach and depth of monitoring. Heijmans involves its suppliers and subcontractors in this dialogue. Human rights are an integral part of Heijmans’ Sustainable procurement policy and the selection of suppliers (preferred suppliers) and account management aimed at ensuring compliance with purchasing agreements. The implementation of the actions Heijmans has undertaken pursuant to the Act on Sham Employment Arrangements (WAS) also plays a role on this front.
Heijmans offers internal and external stakeholders the opportunity to report infringements in the chains. This is how Heijmans fulfils its responsibility throughout the chain.
16.7.11 Fiscal policy
Introduction In this section, Heijmans explains its policy with respect to taxes. Heijmans believes that transparency with respect to its fiscal position and a reasonable application of fiscal laws and regulations are appropriate in the context of the governing codes of conduct within Heijmans. The Executive Board considers taxes (and that means all the taxes we are faced with at Heijmans) as an important topic, both for Heijmans itself and its stakeholders, and believes that a consistent and responsible approach to all relevant fiscal matters is a part of corporate social responsibility. On the basis of Heijmans’ group policy, approved by the Executive Board, the Fiscal Affairs department is responsible for the execution and promo-tion of the tax policy within the organisation. In the performance of its tasks, the Fiscal Affairs department maintains regular contact with other departments within the organisation (such as the Shared Service Centre, the procurement department, HR department and Fleet management). The Fiscal Affairs department defines the tax strategy and the related tax policy and provides the Executive Board with advice and support on fiscal matters.
Heijmans tax policy is expressed in the Fiscal Guidelines applicable within the group. These Fiscal Guidelines are part of the accounting manual that is available in a digital format to every employee involved in the application of fiscal laws and regulations. The Fiscal Affairs department communicates the tax policy within Heijmans and informs the employees involved regarding any new laws and regulations. To safeguard the correct application of fiscal laws and regulations and to supervise the execution of the tax policy, the Fiscal Affairs depart-ment (with or without the help of external parties) conducts periodic audits. In addition to this, the Fiscal Affairs department organises courses for the employees involved if this proves necessary and/or desirable.
Twice a year, the Fiscal Affairs department informs the audit committee regarding Heijmans’ overall fiscal position and other relevant fiscal matters.

271Heijmans Annual Report 2020
APPENDICES
Relationship with the tax authorities Heijmans believes that transparency is part of corporate social responsibility. This means Heijmans always operates with full transparency vis-à-vis the Dutch Tax Authorities (Belastingdienst) and always shares all facts clearly and completely with said Tax Authorities. This also applies to the intended fiscal outcome of any potential points of discussion. In January 2020, the Tax Authorities informed Heijmans about the decision of the Tax Authorities to change the structure of the horizontal supervision for the 100 largest and most complex organisations of the Netherlands from 2020. This takes the shape of an annual individual supervision plan (Individueel Toezichtsplan – ITP), which replaces the existing covenant between the Tax Authorities and Heijmans. Both the Tax Authorities and Heijmans attach great importance to a working relations-hip with attention for each other’s interests, transparency and constructive communications. The Tax Authorities sent the ITP to Heijmans in early 2021. The ITP is a constantly evolving document that can be amended to the latest circumstances at any time. Heijmans and the Tax Authorities will work out the ITP in more detail in 2021.
Fiscal planningNational tax laws, international treaties and known jurisprudence lay down which income is taxed and which costs are deductible. Individual taxable entities have no choice in this. Heijmans puts a high priority on compli-ance with laws and regulations and applies these rules fairly in its business operations. Heijmans prefers to avoid aggressive and/or fiscally driven transactions and therefore chooses not to test the boundaries of what is permissible. The fair application of laws, regulations and jurisprudence is explicitly not aimed at artificially reducing the effective tax rate.
A term such as ‘fair application of the law’ is obviously always open to discussion. Because what one considers fair does not go far enough for another. Heijmans will take into consideration prevailing laws and regulations and existing jurisprudence when making definitive fiscal choices that involve potential discussion points and consult with the Tax Authorities in advance if it deems this necessary.
Heijmans is frequently involved in alliances and complex projects that may result in complex financial transactions. These projects and/or transactions may be difficult to comprehend and the fiscal consequences can be
substantial for the parties involved, depending on the interpretation of certain facts. In these projects or transactions, Heijmans’ policy is to always act in line with the purpose or spirit of the prevailing fiscal legislation. This means therefore that certain legally intended fiscal benefits are realised in such projects and/or transactions. However, Heijmans will not cooperate in transactions with the purpose of realising tax savings that are contrary to fiscal regulations.
Policy with respect to principals and/or subcontractors Heijmans believes that its principals and/or subcontrac-tors are responsible for their fiscal decisions. We expect our principals and/or subcontractors to act in an ethical manner. Heijmans will never consciously cooperate in the setting up of fiscal structures that are contrary to the purpose and spirit of the law to realise fiscal savings.
What is Heijmans’ position in the discussion regar-ding the tax policy of multinationals? Heijmans is not operationally active in any developing countries and/or countries with favourable tax rates. Heijmans therefore has no fiscal structures via developing countries and/or countries with favourable tax rates that reduce the tax it pays.
There is growing public attention for both the national and international tax policy of multinationals. Multinationals use so-called fiscal planning to seek out the boundaries of laws and regulations. They use a variety of structures to route their profits to countries with friendly tax rates, all in a legal manner. However, despite the legality of these constructions, they have prompted a broad social debate in the media about the tax planning of multinationals. This has resulted in various legislative initiatives at both national and international levels. Heijmans recognises the importance of open and constructive discussion of tax ethics. Current laws and regulations and generally applicable and accepted principles of international tax law should be the basic premise in this discussion. Heijmans believes that transparent communications, consideration of the intent of the legislator and a consistent application of the current tax policy should form the basis for this public discussion.
Heijmans occasionally signs tax settlement agreements with the Tax Authorities to obtain assurance in advance on certain specific positions. However, Heijmans has not closed any long-term tax rulings with the Tax Authorities

272 Heijmans Annual Report 2020
APPENDICES
regarding the allocation of certain income and/or costs.Moreover, Heijmans uses no artificial or abnormal constructions to lower its effective tax rate and/or to avoid taxes. Nor does Heijmans make use of any so-called tax havens with the aim of artificially lowering the tax rate within the group. In view of the above, Heijmans considers its fiscal risk appetite as moderate.
Tax rate (income tax) The tax rate as shown in Heijmans’ financial statements only refers to income tax, including Dutch corporate income tax. The nominal tax rate in the Netherlands is 25% (in 2020). In the first half of 2017, Heijmans sold its operational activities in Belgium and Germany. The remaining entities in Belgium and Germany are so-called sleeping entities that generate virtually no profit. The income tax referred to in the financial statements therefore pertains almost exclusively to Dutch income tax.Fiscal profits result in the payment of corporate income tax. Tax losses also have value provided certain conditions are met. These losses can be offset against fiscal profits from other years. In some instances, tax losses therefore may result in an asset. This asset is, in principle, recog-nised in Heijmans’ statement of financial position. Heijmans incurred such losses in previous years, which can be offset against future profits.
Explanation corporate income tax Heijmans’ financial statements are drawn up in line with IFRS. However, there are numerous differences between IFRS accounting principles and local tax regulations that apply to the calculation of the fiscal result. The differences between the various principles clearly have a significant impact on the income taxes Heijmans is liable to pay. These rules are often prescribed and it is therefore not possible for a taxable entity to make choices in this regard. For instance, certain types of income are tax exempt under local fiscal legislation. And there are also operating expenses that are not tax-deductible. Heijmans aims for full transparency and therefore explains its tax position extensively in its financial statements. The profit shown in Heijmans’ annual financial state-ments relates to all activities of the group (including therefore its foreign activities). Heijmans files income tax statements in all the countries where it has operations. The fiscal policy premises are the same in all these countries.
This means there is no direct connection between the corporate income tax that Heijmans pays in the Netherlands and the group result stated in the financial statements.
Other taxes The effective tax rate included in the financial statements pertains only to income taxes. In addition to income tax, Heijmans also pays other taxes, such as payroll tax, property transfer tax, value added tax (turnover tax), insurance tax and various municipal taxes.
Heijmans has virtually no activities that are exempt from value added tax. This means that virtually all input tax can be settled against the value added tax Heijmans is due to pay. The amount of value added tax that cannot be offset is therefore very small.

273Heijmans Annual Report 2020
APPENDICES
16.7.12 Heijmans BIM ladder
Heijmans has defined five levels with respect to the application of the Building Information Model (BIM):
It is possible to achieve five stars per level. These define in concrete terms which BIM activities or output should be delivered, in line with the desired ambition level.
Ambition level A1-star: Presence of 3D Model of all (minimum of four) design disciplines through DO phase (geometry)2-star: Presence of Integrated Model of all design disciplines through UO phase, with information according to BIM specifications 3-star: Presence of a minimum of three production models4-star: Use of Common Data Environment (CDE) 5-star: each separate object has an owner
Ambition level B1-star: Building site design is part of the Integrated Model2-star: (A part of) the construction phasing is simulated 3-star: (A part of) the execution process is simulated 4-star: lnformation for logistics processes is derived from the lntegrated Model and/or the COE5-star: use of scenario analyses for the optimisation of the execution process
Ambition level C1-star: Quantity of values extracted from the Integrated Model in an automated fashion for calculation and/or procurement 2-star: Information from the Integrated Model is used for work planning 3-star: Information from work planning is added to the Integrated Model
4-star: The Integrated Model comprises a minimum of four production models 5-star: Asset information is derived from the lntegrated Model
Ambition level D1-star: The Integrated Model and any extracts are available at the building site via Mobile Devices2-star: Application of Digital Approval 3-star: Execution records As-Built information (geometric and object features) in the Integrated Model4-star: Automatic (or semi-automatic) monitoring via the likes of laser scans/images 5-star: The Integrated Model generates task-oriented execution information
Ambition level E1-star: Requirements are verified using the Integrated Model2-star: Application of design calculations or simulation based on the 3D model3-star: 3D models are created parametrically (minimum of three components) 4-star: Minimum of two external information sources regarding the user phase of the system (for instance, a building, tunnel, object, etc.) are linked to objects in the Integrated Model5-star: Digital Twin 2.0; the Integrated Model is part of a comprehensive information system that manages information exchange and building controls
Calculation and analysis
Design optimisation through use of BIM parametric design Level EBIM (model and information) is made accessible at the building site. Information from execution process is recorded in the BIM
BIM2Field& BIM2Maintain Level D
Information from the BIM is used by work planners
Work preparation & calculation Level C
Building planning / phasing is simulatedBuilding logistics Level BUse of 3D coordination model
Integrated & coordinated 3D model Level A
BIM
USE
LEVE
LS

274 Heijmans Annual Report 2020
APPENDICES
16.7.13 Heijmans bold statements
1. We will not be satisfied until we record 0 accidents.2. IF < 1 in 2023.3. In 2023, the entire organisation will have reached step
four on the Safety Ladder.4. In 2023, we are predictable because all larger projects
(categories 2 and 3) end within the initial bandwidth.5. In 2023, all projects make a positive contribution to
our profit. 6. We reduce the number of colleagues that leave at their
own request by 50% each year. 7. We reduce the costs associated with absenteeism by
5% each year. 8. In 2021, we have a higher employee engagement
score than in 2019.9. All the projects we work on will have a digital twin in
2023.10. We launch five new data-driven services in the market
each year.11. The number of subscriptions based on data-driven
services in the in-use phase increases by 50% each year.
12. In 2025, we will have transferred 50% of our hours - compared with 2020 - from on-site to off-site.
13. From 2023, Heijmans is CO2 neutral. Any residual value is offset.
14. In 2023, we can produce emissions-free, and in 2030 we do so on all our projects.
15. In 2023, we can deliver 100% energy-neutral solutions for our clients.
16. All our quotes include a calculation of the environ-mental performance. In 2023, we will include that as standard in all our quotes to clients.
17. In 2021, all packaging in our construction projects will be 100% reusable or recyclable.
18. In 2023, all the houses we deliver to our customers will be 100% circular. In 2030, this will also apply to apartment buildings.
19. In 2023, we will use circular asphalt and concrete; in 2030, we will build 100% of our projects using these materials.
20. From 2020, all our new area developments are awarded a Greenlabel A rating.
21. In 2023, all our interventions in the built environment result in an improvement in local biodiversity, climate adaptation and safety.
22. We apply our latest solutions in three project each year, and these will then become new showcases of a healthy living environment.
16.7.14 Overview legal structure
Heijmans Vastgoed B.V.
Heijmans Utiliteit B.V.
Heijmans Infrastructuur B.V.
Heijmans Woningbouw B.V.
Heijmans N.V.
HeijmansNederland B.V.
HeijmansInternational B.V.

275Heijmans Annual Report 2020
APPENDICES
16.7.15 Glossary
BENG standards Standards that set the criteria for the energy performance of a building and express this performance on the basis of three indicators: energy requirements, primary energy use and share of renewable energy.
Building Information Model (BIM)A single central, digital platform that combines all relevant information during the construction process and that is used by all the parties involved to arrive at a single interpretation and enables the smooth running of the construction process. This results in a digital (3D) model of what will be realised.
Carbon Disclosure Project (CDP)The CDP is a UK-based organisation that supports businesses and cities in the publication of the environ-mental impact of major companies. The CDP wants to make environmental reporting and risk management standard and stimulates insight into and action for a sustainable economy.
Chain integration Cooperation within and between the successive links within an organisation or business column, from suppliers right through to the client.
Climate adaptationClimate adaptation combats the effects of climate change and could help the Netherlands become resistant to climate change. Adaptation is made possible by setting climate buffers.
CMR substancesCarcinogenic (can cause cancer), mutagenic (can cause genetic mutations), and reprotoxic (can have an adverse effect on fertility and on offspring) substances.
CO2 emissions CO2 (carbon dioxide) emissions measured over a certain period.
Combination Guideline This is an internal document that Heijmans drew up to lay down clear parameters, premises, working methods and reporting lines for working in combinations. These are projects that Heijmans executes in a collaborative effort with partners.
Core values and culture programme IK!This is an internal programme that is aimed at actively embedding and communicating core values and behaviour. This programme is based on the core values of ownership, result-focused and collaboration.
CustodiansFinancial parties that hold shares.
DBFMO-contractDBFMO stands for Design, Build, Finance, Maintain and Operate, a type of contract where the contractor is responsible for both the design and building of the project, as well as financing and total maintenance. It often concerns long-term, large infrastructural projects in ground, road and waterway construction (such as roads, locks and bridges) and property development.
Generic Gate Instructions (Dutch - GPI)This is a uniform set of safety instructions followed by everybody who enters a building site: this is mandatory at all Dutch building sites from 1 April 2019.
GO!An improvement programme designed to eliminate accidents and improve safety and safety awareness in the organisation.
Green dealGreen deals are agreements between organisations, citizens and public sector bodies to provide space for innovative initiatives from society to accelerate the transition to a sustainable economy.
Greenhouse Gas ProtocolThis is a protocol initiated by the World Business Council for Sustainable Development and the World Resources Institute, together with a number of NGOs, including the WWF and a number of companies, including Royal Dutch/Shell. The aim is to develop procedures and instruction manuals for the calculation and reporting of greenhouse gas emissions.
GRIPThis is an internal improvement programme that prioritises ‘no surprises in projects’ and which is aimed at project and risk management and increasing the predictability of projects.
Heijmans HuismerkThis is a concept home with a high level of standardisa-tion, intended for the rental market, commissioned by housing corporations and investors. The production process is largely industrialised. Prefab sections are assembled at the building site.
Heijmans ONEThese are moveable one-person homes for specific target groups that are poorly served in the current housing market, such as starters, people in urgent need of a home and people with residence permits.
Heijmans WenswonenThese are concept homes that combine the benefits of standardisation and affordability with a range of options, intended as owner-occupier homes for private buyers. The production process is largely industrialised. Prefab sections are assembled at the building site.

276 Heijmans Annual Report 2020
APPENDICES
Integrated Reporting FrameworkThis is integrated reporting in which organisations indicate how sustainably they operate and how strategy, governance, performance and outlook deliver (social) value in the shorter and longer term.
KPIKey performance indicators, or KPIs, are variables used to analyse the performance of companies.
LCA scoreThe Life Cycle Assessment score expresses the impact of products and human activity on the environment. LCA is a method used to look at the entire lifecycle of a product or activity, from the extraction of raw materials through to waste processing.
LEANLEAN is a business methodology designed to increase efficiency. Application of the LEAN methodology is used primarily to develop flexible working practices, driven by customer demand and the maximum elimination of waste.
Nature-inclusive construction Nature-inclusive construction is an approach – tailored to the area due to be developed - that combines the design of the construction project with the strengthening of the natural green areas. The aim is to create a healthy, future-proof living environment for both people and animals.
PASThis the Dutch government’s Programmatic Approach to Nitrogen launched in 2015 that created room for the granting of building permits in Natura2000 conservation areas.
PFASPoly- and perfluoroalkylated substances is the collective term for more than 6,000 substances that combine, among other things, fluorinated compounds and alkyl groups.
PMCsProduct market combinations.
Procurement Procurement is the process of finding, agreeing on terms and acquiring goods, services or works from external parties.
Procurement spend The annual spend on suppliers.
RoadshowThis is a series of presentations in which a company explains the financial-economic and strategic aspects of its business with the aim of increasing the awareness of the shares in that company and by doing so supporting its share price.
SDGsSustainable Development Goals (SDGs): 17 sustainable development goals with 169 sub-goals, formulated by the United Nations, with the aim of eliminating poverty, inequality and climate change in 2030. The goals constitute an international agenda for governments, companies, NGOs and knowledge institutes.
Smart City showcasesIn the context of Heijmans’ strategy we have identified three model projects where we bring together all our knowledge and skills and we can make optimum use of our integrated approach: Maanwijk in Leusden, Park Vijfsluizen in Vlaardingen and Feyenoord City in Rotterdam. These three ‘Smart City showcases’ are new residential neighbourhoods which will be offering the ideal mix of living pleasure, safety, smart energy use, nature inclusive building and social cohesion.
Smartification This is the application of smart technologies so buildings and areas can generate data that enables the more effective management of resources.
SpeakUp systemThis is a procedure with a related system to make anonymous reports regarding abuses within the company by telephone or online via a website. Both the procedure and the system run via an external, independ-ent and specialised party that Heijmans has hired for this purpose.
Value creation model This is a schematic visualisation of how a company creates value for its stakeholders and society as a whole. The model provides insight into capital flows, business model and concrete results as output and the impact and broad-based value that is created for society.

277Heijmans Annual Report 2020
APPENDICES
16.7.16 Abbreviations
ACM Autoriteit Consument & MarktAGM Annual General Meeting of Shareholders Arbo Arbeidsomstandigheden (wet)ASC Arbo Service CentreAscX Euronext Amsterdam Small Cap IndexAVG Algemene Verordening
Gegevensbescherming or General Data Protection Regulation
BIM Bouw Informatie ModelBREEAM-score Building Research Establishment Environmental Assessment MethodCEO Chief Executive OfficerCDE Common Data EnvironmentCFO Chief Financial OfficerCO2 KoolstofdioxideCOSO Committee of Sponsoring Organizations
of the Treadway Commission EB Executive BoardERM Enterprise RiskmanagementCRO Chief Risk OfficerDZOAB Duurzaam Zeer Open Asfalt BetonEBIT Earnings Before Interest and TaxesEBITDA Earnings Before Interest, Taxes,
Depreciation and AmortizationEMA Europees Geneesmiddelen AgentschapENI Emission-free Network InfraEPC Energie Prestatie CoëfficiëntERP Enterprise Resource PlanningFSC Forest Stewardship CouncilGHG Greenhouse Gas ProtocolGIS Geographic Information System GO! Geen Ongevallen!GPI Generieke PoortinstructieGRC Governance-Risico-ComplianceGRI Global Reporting InitiativeGCVB Governance Code Veiligheid in de BouwHBO Hoger beroepsonderwijsHRM Human Resource ManagementHWBP HoogWaterBeschermingsProgrammaICT Informatie- en communicatietechnologieIF Injury FrequencyIFRS International Financial Reporting
StandardsIL&T Inspectie Leefomgeving en Transport
ILO International Labour OrganizationISO Internationale Organisatie voor
StandaardisatieIT InformatietechnologieKPI Kritieke Prestatie IndicatorLCA-score Life Cycle AnalysisMKI-value Environmental costs indicatorMPG-value Environmental Performance BuildingsNACH New Amsterdam Court HouseNOW- Temporary Emergency Bridging Measure compensation for Sustained EmploymentNYSE New York Stock ExchangePAS Programma Aanpak StikstofPFAS Poly- en perfluoralkylstoffen PPS Publiek Private SamenwerkingRACC Rotterdam Ahoy Convention CentreRIVM National Institute for Public Health and
EnvironmentRWS RijkswaterstaatSAP Systems, Applications and Products for
data processingSCC Safety Certificate ContractorsSDG’s Sustainable Development GoalsSA Trust Heijmans Share Administration Trust (Stichting Administratie Kantoor)SBIB Stichting Beoordeling Integriteit
BouwnijverheidSKAO Stichting Klimaatvriendelijk Aanbesteden
& OndernemenSUP Status Update ProjectenUAV Uniforme Administratieve VoorwaardenUAV-GC Uniforme Administratieve Voorwaarden
Geïntegreerde ContractenUMA Uniforme Meld Applicatie, or Report Unanimously ApplicationVAT Value-added taxViA Veiligheid in AanbestedingVOG Verklaring Omtrent Gedrag, or Certificate of ConductVR Virtual RealityWas Wet aanpak schijnconstructiesWav Wet arbeid vreemdelingenWmz Wet melding zeggenschapZOAB Zeer Open Asfalt Beton

278 Heijmans Annual Report 2020
APPENDICES
UPDATE
Colophon Heijmans’ Annual Report 2020 can be found on Heijmans’ website, www.heijmans.nl/en
Contacts:Marjolein Boer -Siero ([email protected])Robert Koolen ([email protected])
Publishing date: 19 February 2021
This annual report is published in Dutch and English. In case of differences between the Dutch and the English version, the first shall prevail.