annual report - j. lauritzen a/sstatic.j-l.com/imce/r2012_final_uk_lores.pdfkls grafisk hus a/s,...
TRANSCRIPT

www.j-lauritzen.com
2012Annual Report

J. Lauritzen a/S · AnnuAl RepoRt 20122
DiScLaimerthis Annual Report contains forward-looking statements about Jl’s future financial position. Such statements are subject to risks and uncertainties as various factors, many of which are beyond the control of Jl, may cause actual developments and actual results to differ materially from expectations contained in the Annual Report. Accordingly, forward-looking statements should not be relied upon as a prediction of actual results.
this report is available in Danish and english. In the event of any discrepancy between the two versions, the Danish version shall pre-vail.
J. lAuRItzen at a gLanceJ.lauritzen (Jl) was founded in 1884 and is owned by the lauritzen Foundation. We have grown and developed our operations consider-ably during the last decade and thus remain one of Denmark’s leading shipping companies.
part of our strategy is to spread risks across the different business areas. today we have four busi-ness units with different growth drivers and cycles and each specifically positioned to their respec-tive markets.
We operate a modern, diversified fleet of bulk car-
riers, gas carriers, product tankers and dynami-cally positioned support vessels for the offshore industry that are all engaged in operations world-wide.
We continuously strive to have a client-oriented approach to the way we do business and our op-erations are conducted by highly skilled staff at sea and ashore.
Jl is headquartered in Copenhagen with overseas offices in China, Japan, philippines, Singapore, Spain and uSA.
pRInteD by: KlS gRAFISK huS A/S, DenmARKS moSt gReen gRAphIC houSe

J. Lauritzen a/S · AnnuAl RepoRt 2012 3
boARD & eXeCutIVe mAnAgement StAtement 4CompAny IntRoDuCtIon 6gRoup Key FIguReS 8hIghlIghtS 2012 AnD outlooK 2013 10lAuRItzen bulKeRS 18lAuRItzen KoSAn 26lAuRItzen tAnKeRS 34lAuRItzen oFFShoRe 40FInAnCe AnD InVeStoR RelAtIonS 42RISK mAnAgement 46CoRpoRAte goVeRnAnCe 50CoRpoRAte ReSponSIbIlIty 54oRgAnISAtIon AnD people 56FInAnCIAl ReVIeW 58boARD oF DIReCtoRS 60mAnAgement 62ACCountS 64mAnAgement StAtement 100InDepenDent AuDItoRS’ RepoRt 101oVeRAll gRoup StRuCtuRe 102lISt oF gRoup CompAnIeS 103
tAble oF contentS

J. Lauritzen a/S · AnnuAl RepoRt 20124
boARD & eXeCutIVe mAnAgementStatementthe business environment for the shipping indus-try has changed substantially during the past few years.
Characterised by oversupply in major shipping markets, surplus shipbuilding capacity, low eco-nomic growth and tight credit conditions, 2012 brought plummeting asset values, with the baltic Freight Index at a 25 year low and further defaults among shipping companies.
Jl was obviously influenced by these circum-stances and with a net loss of uSD (350)m our 2012 result was very unsatisfactory.
In this challenging environment, we continued to develop our different business activities and we made a number of important decisions during the year. of special importance was the joint venture with hitecVision, norway, in the promising off-shore market, the formation of Axis offshore pte. ltd. and the following order for a modern semi-submersible ASV (Accommodation and Support Vessel) for delivery in 2015.
lauritzen bulkers increased its focus on long-term cargo contract business and related market activi-ties.
Capesize bulk carriers left without contract cover due to defaults were sold.
All business units were engaged in an energy sav-ings programme launched in collaboration with classification society DnV (Det norske Veritas).
group finances were further strengthened with a new corporate bond issuance and the bonds were listed on oslo Stock exchange.
In connection with the approval of Jl’s Annual Re-port for 2012, the lauritzen Foundation decided to convert two subordinated loans equivalent to
uSD 160m into equity, thereby increasing Jl’s sol-vency ratio from 37% at year-end 2012 to 44%.
Difficult trading conditions are expected to con-tinue in 2013 as a multitude of risk factors contin-ue to impact global shipping. Surplus capacity will influence most markets during the year. however, we expect global economic growth to gradually strengthen. At the same time, high scrappings and declining deliveries will reduce fleet growth and set the scene for the beginning of a modest recovery towards the end of the year.
more than anything else, Jl stands for accounta-bility. our well-qualified staff will continue to de-liver the services which through our 128 years of history have enabled us to build strong relations with customers, partners and other stakeholders globally no matter which market conditions we have been operating in.
After more than 14 years as president and Ceo, torben Janholt will retire with the release of Jl’s 2012 annual accounts. Jan Kastrup-nielsen, who has been with Jl since 2000 and a member of Jl’s executive management since 2009, will become the new president and Ceo.
Bent Østergaard Chairman of the Board
torben JanholtPresident & CEO 1998-2013
Jan Kastrup-nielsenPresident & CEO2013-

J. Lauritzen a/S · AnnuAl RepoRt 2012 5
From left: Torben Janholt, Bent Østergaard and Jan Kastrup-Nielsen

J. Lauritzen a/S · AnnuAl RepoRt 20126 J. Lauritzen a/S · AnnuAl RepoRt 20116
lAuRItzen BuLKerSDry bulk operations started in the late 1970s when the focus was on handysize bulk carriers/lakers (lakers are special ocean-going vessels capable of also serving the great lakes in north America). today lauritzen bulkers is a major owner and op-erator of bulk carriers engaged in all dry bulk seg-ments.
operations comprise a combined fleet of more than 100 handysize, handymax, panamax and capesize bulk carriers including short-term char-ters.
lAuRItzen KoSanWith the acquisition of Kosan tankers in 1989, Jl entered the market for smaller gas carriers, and today lauritzen Kosan is a leading carrier of liquefied gases, including petrochemical gasses such as ethylene and propylene.
At year-end 2012, lauritzen Kosan controlled a combined fleet of 45 semi-refrigerated/ethylene and fully pressurised gas carriers in the 3,000-10,000 m3 segment.
CompAny introDuction

J. Lauritzen a/S · AnnuAl RepoRt 2012 7
lAuRItzen tanKerSestablished in 2004 with the acquisition of Quan-tum tankers, lauritzen tankers is a provider of medium range (mR) product tankers for ocean transport of oil products ranging from vegetable oils to petroleum products, fuel oils and chemi-cals.
lauritzen tankers controlled 18 modern, medium range product tankers at year-end 2012.
lAuRItzen offShoreoperations started in 2008 with the conversion of a product tanker into a dynamically positioned shuttle tanker. the offshore operation today com-prises three shuttle tankers and part-ownership in the offshore accommodation segment.
In 2012, Axis offshore was established as a 50:50 joint venture with hitecVision to focus on high-end semi-submersible accommodation units also capable of serving clients in the north Sea. the joint venture builds on Jl’s expertise in the off-shore accommodation sector and our first accom-modation unit Dan Swift was transferred to the new operation.
J. Lauritzen a/S · AnnuAl RepoRt 20128
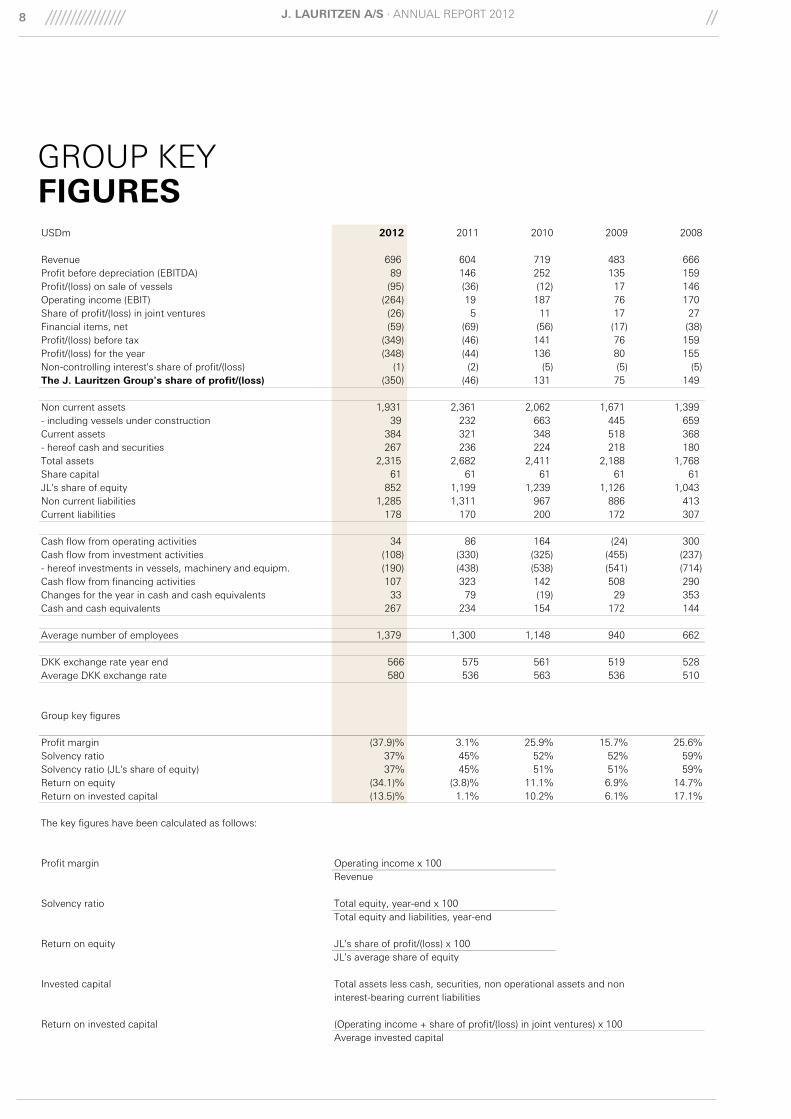
gRoup Key figureSUSDm 2012 2011 2010 2009 2008
Revenue 696 604 719 483 666Profit before depreciation (EBITDA) 89 146 252 135 159Profit/(loss) on sale of vessels (95) (36) (12) 17 146Operating income (EBIT) (264) 19 187 76 170Share of profit/(loss) in joint ventures (26) 5 11 17 27Financial items, net (59) (69) (56) (17) (38)Profit/(loss) before tax (349) (46) 141 76 159Profit/(loss) for the year (348) (44) 136 80 155Non-controlling interest's share of profit/(loss) (1) (2) (5) (5) (5)The J. Lauritzen Group's share of profit/(loss) (350) (46) 131 75 149
Non current assets 1,931 2,361 2,062 1,671 1,399- including vessels under construction 39 232 663 445 659Current assets 384 321 348 518 368- hereof cash and securities 267 236 224 218 180Total assets 2,315 2,682 2,411 2,188 1,768Share capital 61 61 61 61 61JL's share of equity 852 1,199 1,239 1,126 1,043Non current liabilities 1,285 1,311 967 886 413Current liabilities 178 170 200 172 307
Cash flow from operating activities 34 86 164 (24) 300Cash flow from investment activities (108) (330) (325) (455) (237)- hereof investments in vessels, machinery and equipm. (190) (438) (538) (541) (714)Cash flow from financing activities 107 323 142 508 290Changes for the year in cash and cash equivalents 33 79 (19) 29 353Cash and cash equivalents 267 234 154 172 144
Average number of employees 1,379 1,300 1,148 940 662
DKK exchange rate year end 566 575 561 519 528 Average DKK exchange rate 580 536 563 536 510
Group key figures
Profit margin (37.9)% 3.1% 25.9% 15.7% 25.6%Solvency ratio 37% 45% 52% 52% 59%Solvency ratio (JL's share of equity) 37% 45% 51% 51% 59%Return on equity (34.1)% (3.8)% 11.1% 6.9% 14.7%Return on invested capital (13.5)% 1.1% 10.2% 6.1% 17.1%
The key figures have been calculated as follows:
Profit margin Operating income x 100Revenue
Solvency ratio Total equity, year-end x 100Total equity and liabilities, year-end
Return on equity JL's share of profit/(loss) x 100JL's average share of equity
Invested capital Total assets less cash, securities, non operational assets and noninterest-bearing current liabilities
Return on invested capital (Operating income + share of profit/(loss) in joint ventures) x 100Average invested capital
J. Lauritzen a/S · AnnuAl RepoRt 2012 9
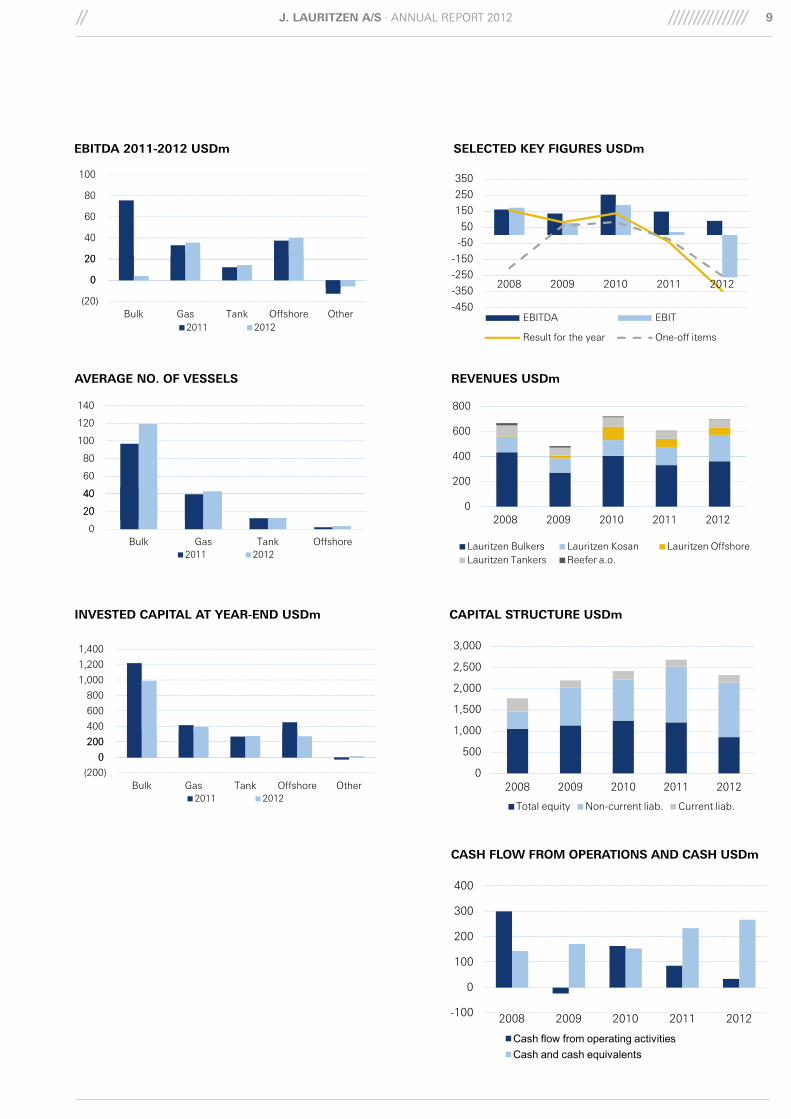
caPitaL Structure uSDm
reVenueS uSDm
SeLecteD KeY figureS uSDm
caSh fLoW from oPerationS anD caSh uSDm
eBitDa 2011-2012 uSDm
aVerage no. of VeSSeLS
inVeSteD caPitaL at Year-enD uSDm
-450
-350
-250
-150
-50
50
150
250
350
2008 2009 2010 2011 2012
EBITDA EBIT
Result for the year One-off items
0
200
400
600
800
2008 2009 2010 2011 2012
Lauritzen Bulkers Lauritzen Kosan Lauritzen OffshoreLauritzen Tankers Reefer a.o.
0
500
1,000
1,500
2,000
2,500
3,000
2008 2009 2010 2011 2012
Total equity Non-current liab. Current liab.
-100
0
100
200
300
400
2008 2009 2010 2011 2012
Cash flow from operating activitiesCash and cash equivalents
0
20
40
60
80
100
(20)
0
20
Bulk Gas Tank Offshore Other2011 2012
20
40
60
80
100
120
140
0
20
40
Bulk Gas Tank Offshore2011 2012
0
200
400
600
800
1,000
1,200
1,400
(200)
0
200
Bulk Gas Tank Offshore Other2011 2012

J. Lauritzen a/S · AnnuAl RepoRt 201210
hIghlIghtS 2012 anD outLooK 2013
figure 1: reSuLt for the Year uSDm
-300
-200
-100
0
100
-400
-300
200
Bulk Gas Tank Offshore
Result before tax Tax a.o. Result for the year
2011 2012
In a year characterised by sustained world eco-nomic decline, generally depressed shipping mar-kets and substantial deliveries of new tonnage to major shipping segments, Jl’s result was uSD (349.7)m compared to uSD (46.2)m in 2011, cf. Figure 1.
the result for 2012 was significantly impacted by one-off items with a net effect of uSD (254.4)m (2011: uSD (25.2)m) comprising write-downs, sale of claims and sales of vessels due to counter-party defaults or strategic initiatives. Adjusted for one-off items, Jl’s result was uSD (95.4)m, down from uSD (21.0)m in 2011 mainly due to income lost as a consequence of counterparty defaults and to the weaker bulk markets.
Return on invested capital was (13.5)% compared to 1.1% in 2011.
the result was in line with expectations stated in our stock exchange announcement to oslo børs in December 2012 but considerably below our ex-pectations at the beginning of the year. the result is regarded as very unsatisfactory.
the BuSineSS enVironment2012 was a very difficult year for practically all shipping markets apart from offshore. the Clark-Sea Index, representing a weighted average of earnings in the bulk, gas, container and product tanker markets declined by 23% in 2012 com-pared to 2011, cf. Figure 2, and was - adjusted for rises in operational costs - at its lowest since 1990. Some markets such as gas carriers wit-nessed periods with acceptable earnings but the trend for most markets was downwards, and for shorter or longer periods heading towards operat-ing costs.
A number of unexpected economic and political factors contributed to reduce growth in world trade in 2012 to a meagre 2.8% with only the bulk market among Jl’s shipping businesses enjoying higher growth in demand, although with supply outpacing bulk demand growth.
the year opened with fairly difficult credit condi-tions which had a detrimental effect, particularly on demand for bulk carriers. tight monetary poli-
cies in China during the first half of 2012 and the increased turmoil in financial markets mainly in the euro zone during the second quarter damp-ened economic growth and limited world trade. tightening sanctions against Iran was another factor that hampered trade in petrochemical gas-es for example.
the following characterized Jl’s main markets in 2012:
• the dry bulk market posted yet another year of unsatisfactory developments in rates and prices with the average baltic Freight Index (bFI) declining by 40% compared to 2011 reaching at its lowest for 25 years. Spot rates were down by 30% on average for handysize and handymax and 50% for cape-size compared to 2011. period rates fell by 20% for capesize and 30% or more for all other segments. After a dismal opening of the year, an im-provement set in for handysize and handy-max in February which ended in August. the normal strengthening for handysize and handymax after the harvest season did not occur. Capesize spot earnings were at very low levels save for a couple of months to-wards the end of the year. Second-hand prices declined by 20-30% de-pending on vessel segment.
• period rates for smaller gas carriers declined slightly to about uSD 540,000 per month for ethylene carriers and uSD 265,000 per month for 3,200 m3 semi-refrigerated carri-ers.

J. Lauritzen a/S · AnnuAl RepoRt 2012 11
SouRCe: Jl buSIneSS AnAlySIS bASeD on DAtA eXtRACt FRom ImF WebSIte
figure 2: cLarKSea inDex 2010-2012 uSD/DaY
Spot rates for ethylene gas carriers were sta-ble throughout the year with spot rates for fully pressurised gas carriers rising in the sec-ond half of 2012. Spot market rates for semi-refrigerated gas carriers in the 3,200-6,500 m3 segment start-ed falling at the beginning of Q2 and declined quite strongly for the balance of the year. Second-hand tonnage prices declined by 5% during the year.
• the product tanker market had a disappoint-ing spot market which saw the three key routes down by 20% for mR product tankers. period markets for mR product tankers lev-elled out at uSD/day 13,500. Second-hand prices for tonnage were down by 5% for a five year-old mR product tanker.
• offshore markets for specialized tonnage in general had another busy year. however, with only a limited number of long-term con-tracts signed, the shuttle tanker market was an exception to this. orders for rigs and other specialized tonnage for the offshore industry continued at a high level.
other commodity shipping markets did not fare better. As a result, demolition increased by about 40% to approximately 60m dwt from 2011 to 2012. Demolition of dry bulk tonnage increased by almost 50% to approximately 35m dwt, where-as demolition of mR products tankers and smaller gas carriers fell to even lower levels than in 2011. Four shuttle tankers were scrapped in 2012 com-pared to one unit in 2010 and 2011.
Contracting for new vessels was down by almost 50% in dwt terms compared to 2011.
International shipping is in the midst of a large supply crisis. heavy deliveries during the past years have lowered the average age of the world merchant fleet in most segments. Additionally, major ship building capacity has been established which current order levels are far from matching. thus, shipyards saw their order books recede by a third in dwt terms from year-end 2011 to year-end 2012. Shipyards’ forward cover is now estimated to be slightly less than two years, implying con-tinuing pressure on newbuilding prices.
JL grouPJl continued developing its business areas and a number of important decisions were taken during the year.
of special importance was the joint venture with hitecVision, norway, in the promising offshore market, the formation of Axis offshore pte. ltd. and the following order for a modern semi-sub-mersible ASV (Accommodation and Support Ves-sel) for delivery in 2015.
lauritzen bulkers increased its focus on long-term cargo contract business and related market activi-ties.
Capesize bulk carriers left without contract cover due to defaults were sold.
0
4000
8000
12000
16000
20000
2010-01 2010-07 2011-01 2011-07 2012-01 2012-07

J. Lauritzen a/S · AnnuAl RepoRt 201212
All business units were engaged in an energy sav-ings programme launched in collaboration with DnV (Det norske Veritas).
group finances were further strengthened with a new corporate bond issuance and the bonds were listed on oslo Stock exchange.
During the year, Jl took delivery of seven new-buildings, including three bulk carriers, one fully pressurized gas carrier, two product tankers and one shuttle tanker. In addition, four bulk carriers, two gas carriers and one product tanker were tak-en on long-term charter. At year-end 2012, Jl had four vessels on order.
During the year, six long-term time-chartered ves-sels were redelivered according to plan.
During 2012, Jl controlled a combined average fleet of 178 vessels compared to 151 vessels in 2011, cf. Figure 3, of which 59 were owned ves-sels (48 in 2011)
total vessel days amounted to 65,073 in 2012 compared to 54,945 days reported in 2011.
Due to our fleet renewal and expansion efforts in recent years, we own a modern, efficient fleet of bulk carriers with an average age of 2.3 years, gas
0
30
60
90
120
150
180
210
2011 2012
Own Part owned Chartered Shared charter Other
z
figure 3: aVerage no. of VeSSeLS

J. Lauritzen a/S · AnnuAl RepoRt 2012 13
figure 4: traDeD Price (noK) for J. Lauritzen noK 700m BonD 2011-2012
SouRCe: oSlo StoCK eXChAnge
carriers 8.6 years, product tankers 3.6 years and shuttle tankers 5.3 years.
aSSetS anD SoLVencYDuring 2012, investments in vessels amounted to uSD 190m compared to uSD 435m in 2011. Sale of vessels totalled uSD 80m compared to uSD 33m in 2011. total invested capital was uSD 1,960m at year-end 2012, down from uSD 2,344m at year-end 2011.
the total book value of vessels amounted to uSD 1,702m, down uSD 267m on 2011 primarily due to sale of assets and write-downs. brokers’ valua-tions of vessels totalled uSD 1,312m down 16% on 2011. the value in use of the vessels, taking contract coverage into account was higher than total book value.
At the end of 2012, Jl’s newbuilding portfolio comprised four owned vessels, three product tankers and one bulk carrier for delivery in 2013
and represented outstanding capital expenditure of uSD 103.9m.
on the final trading day at oslo Stock exchange (29 December 2012), Jl’s unsecured bonds ma-turing in 2015 were trading at noK 102 (noK 100.6 at year-end 2011), cf. Figure 4, and Jl’s un-secured bonds issued in october 2012 (2017 ma-turity) were listed on oslo Stock exchange on 16 January 2013.
At year-end 2012, Jl’s solvency ratio was 37% compared to 45% at year-end 2011.
after Year-enD eVentSIn connection with the approval of Jl’s Annual Re-port for 2012, the lauritzen Foundation decided to convert two subordinated loans of originally DKK 850m into equity. At year-end 2012, the loans in-cluding accrued interest amounted to a total of DKK 903.1m, equivalent to uSD 159.6m. the con-version increases Jl’s solvency ratio from 37% at year-end 2012 to 44%.
95
97
99
101
103
105
107
109
111
2011/01 2011/04 2011/07 2011/10 2012/01 2012/04 2012/07 2012/10

J. Lauritzen a/S · AnnuAl RepoRt 201214
outLooK for 20132013 opened with very low spot earnings in all dry bulk markets, a slight improvement in the market for smaller semi-refrigerated gas carriers and firmness for fully pressurised gas carriers. the stronger spot market for mR product tankers re-corded in late 2012 continued. We expect eco-nomic growth to be somewhat subdued during the first half of 2013. A number of indicators sug-gest that economic growth will strengthen as the year progresses. once economic growth rises, we expect to see inventories rebuilding which will contribute to seaborne trade growth.
Scheduled deliveries of merchant vessels amount to about 175m dwt in 2013. Due to cancellations and slippage which are expected to continue as a result among other things of the tight credit and lending situation in the shipping industry, actual deliveries are likely to be 25% below scheduled deliveries. Dry bulk deliveries are anticipated to fall by about a third to around 70m dwt in 2013. Deliveries of mR product tankers are expected to be of the same order as in 2012, whereas smaller gas carriers are in for a sizeable rise in deliveries. A total of 19 shuttle tankers are scheduled for de-livery in 2013, however with possible delays for a number of these.
Demolition is poised for another record surpass-ing the approximately 60m dwt reported in 2012. bulk carriers will the biggest contributor for the third consecutive year.
on average, the dry bulk market is expected to be below 2012, but with some relief towards the sec-ond half of 2013 when demand growth is expect-ed to exceed supply growth. Smaller gas carriers are forecast to see the spot market weaken slight-ly in 2013 compared to 2012 due to the relatively strong supply growth. the outlook for mR product tankers is unpromising with only modest improve-ments in average spot market rates.
the result for 2013 is anticipated to remain unsat-isfactory with an expected loss of uSD (75-100)m (2012: uSD (350)m).
ebItDA is expected to be in the range of uSD 60–80m (2012: ebItDA of uSD 88.7m). taking the sale of the Accommodation and Support Vessel Dan Swift to the Axis offshore pte. ltd. and one-off items included in the 2012 ebItDA amounting to uSD 33.7m into account, the expectations for 2013 are slightly up compared to 2012. the im-provement primarily relates to lauritzen bulkers’ redelivery of time-charter vessels and increase of lauritzen tankers’ operational fleet.

J. Lauritzen a/S · AnnuAl RepoRt 2012 15
Depreciations are expected to be approximately 10% down compared to 2012 primarily as a con-sequence of the 2012 write-down’s and sale of as-sets.
Income from joint ventures is anticipated to be unsatisfactory but up on 2012. the expected in-come from Axis offshore pte. ltd. will not off-set the forecast loss from other joint ventures.
net finance is expected to be in line with the result in 2012. Currency and interest rate fluctuations may affect the result. tax is expected to be limited and minorities’ share of the result is expected to decrease.
During 2013, Jl will take delivery of the last four vessels on the current newbuilding program, three mR product tankers and one handysize bulk carrier. A part-owned handysize bulk carrier new-building will also be added to the fleet and three mR product tanker newbuildings will enter the fleet on long-term time-charter.
Capital expenditure including dockings amounts to uSD 123m to be financed by at-delivery financ-ing and own funds.


J. Lauritzen a/S · AnnuAl RepoRt 201218
lAuRItzen BuLKerSIn 2012, lauritzen bulkers’ result amounted to uSD (294.5)m compared to uSD (24.7)m in 2011, cf. table 1. the result was significantly impacted by one-off items with a net effect of uSD (200.3)m (2011: uSD (27.7)m) comprising write-downs, sale of claims and sales of vessels due to counter-party defaults. Adjusted for one-off items, the re-sult was uSD (94.2)m, down from uSD 3.0m in 2011 due to the weaker bulk markets and income lost as a consequence of counterparty defaults.
the result was very unsatisfactory.
BuSineSS moDeL anD riSK managementlauritzen bulkers (lb) controls a fleet of more than 100 handysize, handymax, panamax and capesize bulk carriers with a low average age. the fleet comprises a portfolio of owned, part-owned, and time-chartered vessels as well as vessels committed by partners. Active fleet portfolio man-agement via the sale, purchase and time-charter in/out of vessels is an important element of the business model.
the handysize operation, which is lb’s largest business activity, comprises a significant fleet of homogeneous vessels, ensuring economies of scale, operational optimisation and extensive cus-tomer service. 2012 marked a strategic change as focus on long-term cargo contracts was added to
the existing strategy based on spot and short to medium-term cargo contracts.
the handymax fleet is managed similarly to the handysize vessels, whereas most of the fleet of capesize and panamax bulk carrier fleet is em-ployed on long-term time-charter.
the main business risks are market and counter-party risks.
Counterparty risks are managed through continu-ous monitoring and evaluation of charterers’ sub-stance and performance. lower contract cover for the handysize and handymax operations means exposure to short-term market volatility which is to some extent evened out by the size of the controlled fleet. this risk is mitigated by book-ing cargoes for shorter periods (typically up to six months) or longer on affreightment contracts.
main eVentSFleet renewal continued with the aim of building a modern, fuel-efficient, versatile fleet and in 2012 the controlled fleet increased by 15 newbuildings, of which three were owned.
During the year, three long-term time-chartered and four pool vessels were redelivered as planned.

J. Lauritzen a/S · AnnuAl RepoRt 2012 19
2012 2011
Revenue 361.1 330.9 EBITDA 4.0 75.8 Depreciations and write-downs (150.7) (37.9) Profit/(loss) on sale of vessels etc. (96.6) (38.6) Operating income (243.2) (0.7) Share of profit in joint ventures (28.6) 2.3 Finance net (25.0) (18.4) Profit/(loss) before tax (296.8) (16.8) JL's share of profit/(loss) (294.5) (24.7) Invested capital (average) 1,108.3 1,121.5 Return on invested capital (24.5)% 0.1%Average no. of employees 590 493
taBLe 1: KeY figureS uSDm
20
40
60
80
100
120
140
0
20
40
2011 2012
Own Part owned Chartered Shared charter Other
figure 5: aVerage no. of VeSSeLS
the handysize fleet increased by 12 newbuildings, of which three were owned and four were taken on long-term time-charter. pool partners contrib-uted five additional handysize newbuildings and six second-hand handysize bulk carriers to the controlled fleet.
the handymax fleet grew by three newbuildings on long-term time-charter.
lb was severely affected by counterparty defaults with subsequent sales of two capesize bulk carri-ers due to strategic considerations. the risk man-agement desk and risk management procedures were further enhanced during the year, and a car-go desk was established focusing on medium to long-term cargo contracts.
earnings from the handysize operations yet again
outperformed the bhSI (baltic handysize Index). this was achieved through a combination of serv-ing existing and new customers and exploitation of short-term trading opportunities.
towards the end of the year, Island View Shipping announced its withdrawal from the handysize pool, meaning that 14 handysize vessels will leave the pool in the first half of 2013. the withdrawal will not impact the critical mass of lb’s handysize operations.
lb was the runner-up as “Ship operator of the year” in lloyd’s list Awards Asia 2012.
fLeetIn 2012, the total number of ship-days reached 43,539 with 119 vessels on average, 23% up on the figure reported in 2011, cf. Figure 5.
the operational fleet of handysize bulk carriers av-eraged 80 vessels compared to 65 vessels in 2011. At year-end 2012, the controlled handysize fleet comprised 90 vessels.
on average, the handymax fleet comprised 22 vessels in 2012 compared to 14 vessels in 2011, with a further 4 panamax vessels (four in 2011) and 8 capesize vessels (seven in 2011).
At year-end 2012, lb had 43 vessels on long-term time-charter (including two newbuildings for de-livery in 2014), with purchase options for 9 of these.
the owned fleet comprised 25 vessels at the end of 2012 (24 in 2011) with part ownership of a fur-ther 18 vessels (21 in 2011).
At the end of 2012, the average age of the owned fleet was 2.3 years.
fLeet managementtechnical management, including crewing for owned bulk carriers, was undertaken by new Century overseas management Inc., manila, Fleet management ltd., hong Kong and Synergy maritime pte., Singapore.

J. Lauritzen a/S · AnnuAl RepoRt 201220
our technical department works closely with ex-ternal providers on all aspects of achieving safe, cost-effective and reliable vessel operations.
three scheduled dry dockings were completed in 2012. unscheduled off-hire for lb’s owned fleet came to 0.29 % in 2012 (0.31 % in 2011).
hSeeQour in-house technical department monitors overall fleet safety performance and energy effi-ciency in order to comply with applicable national and international rules and regulations as well as increasing client requirements.
We constantly endeavour to minimize risks asso-ciated with our operations. In 2012, we enrolled with ship vetting specialists RightShip’s rating programme and the average risk rating of the owned fleet was 4.9 on the RightShip vetting scale (with 5.0 as best rating) in mid-December 2012.
During 2012, we developed a range of different initiatives to support our ongoing efforts to reduce fuel oil consumption and reduce emissions of Sox, nox and Co2. our specific initiatives are list-ed in Jl’s Corporate Responsibility report 2012 p. 16-17.
gLoBaL marKet DeVeLoPmentSthe period market for bulk carriers had another difficult year with capesize 12 month period rates down by 20% and handysize/handymax down by 30% compared to 2011. panamax bulk carriers suffered even more. the period market decline was due to deteriorating market imbalances which saw second-hand tonnage prices falling by 20% or more from year-end 2011 to year-end 2012.
2012 started with a very weak spot market for all segments, with handysize and handymax recov-ering from end February and peaking in late July. Capesize had stronger markets from September onwards, as did panamax, but the rise could not be sustained. Compared to 2011, the spot market fell by approximately 30% for handysize and handymax in 2012, cf. Figure 6.
DemanD for BuLK carrierSDemand for bulk carriers is estimated to have grown by around 6% in 2012 compared to 7.5% in 2011, cf. Figure 7. many factors contributed to the fairly high, albeit lower than generally expected, demand growth.

J. Lauritzen a/S · AnnuAl RepoRt 2012 21
figure 6: SPot marKet rateS 2010-2012 uSD/DaY
SouRCe: ClARKSon ReSeARCh SeRVICeS
figure 7: DemanD for DrY BuLK carrierS 2003-2012 DWtm
SouRCe: lb buSIneSS AnAlySIS bASeD on DAtA DeRIVeD FRom mSI ltD.
figure 8: SuPPLY of DrY BuLK carrierS 2003-2012 (Beginning of Year) DWtm
SouRCe: lb buSIneSS AnAlySIS bASeD on DAtA DeRIVeD FRom ClARKSon ReSeARCh SeRVICeS
400
500
600
0
100
200
300
003 04 05 06 07 08 09 10 11 12
Iron Coal Grain+Soya Minor Bulks
500
600
700
800
0
100
200
300
400
003 04 05 06 07 08 09 10 11 12
Capesize Panamax Handymax Handysize
2000
3000
4000
5000
18000
24000
30000
36000
0
1000
2000
0
6000
12000
2010/01 2010/07 2011/01 2011/07 2012/01 2012/07
Average of the 6 T/C Routes for the Baltic Handysize IndexAverage of the 6 T/C Routes for the Baltic Handysize IndexAverage of the 6 T/C Routes for Baltic Supramax IndexBaltic Exchange Dry Index (1st November = 1334) - RHS

J. Lauritzen a/S · AnnuAl RepoRt 201222
60.0%
80.0%
100.0%
120.0%
0.0%
20.0%
40.0%
Handysize Handymax Panamax Capesize
25 years or more 15-24 years 0-14 years Order book
SouRCe: lb buSIneSS AnAlySIS bASeD on DAtA DeRIVeD FRom ClARKSon ReSeARCh SeRVICeS
figure 9: BuLK carrier age ProfiLe anD orDer BooK at Year-enD 2012 (% of exiSting fLeet)
uncertainty in credit markets as well as fairly tight monetary policies in for example China in early 2012 led commodity consumers and traders to keep inventories low in many parts of the world, or to actually reduce them. During the following months, economic uncertainties in europe in-creased with negative repercussions for econom-ic growth for the remainder of the year.
A combination of reduced economic activity in mature economies and economic policies to curb inflationary pressures in China led to lower fixed investment growth which in turn reduced growth in imports of iron ore and other minerals.
Coal, mainly steam coal, was the biggest contrib-utor to demand growth for bulk carriers in 2012. Falling prices for coal due to ample supplies in combination with rising electricity production in-creased power plants’ demand for steam coal. this demand was further increased by droughts and high prices for natural gas in europe.
grain shipments were at higher levels during the first half 2012 than in 2011 but due to crop failures in various parts of the world, prices increased to levels that made consumers postpone purchases which had a detrimental impact on demand in late Q3 and Q4, affecting particularly handysize and handymax.
SuPPLY of BuLK carrierSAt the beginning of 2012, the world fleet of bulk carriers amounted to 616m dwt. Deliveries and demolitions both increased in 2012 compared to 2011, leading to net fleet growth of 10.5% (14.7% in 2011) with the world bulk fleet at 680m dwt at year-end 2012, cf. Figure 8.
Fleet growth in the handymax, panamax and capesize segments was 10%, 13% and 12% re-spectively whereas the handysize fleet only in-creased by 2%.
orders for bulk carriers declined for the second consecutive year, and as a result of the heavy de-livery schedule which was characterised by less slippage than expected, the order book was down to approximately 20% of the existing fleet at year-end 2012.
Demolition of bulk carriers amounted to approxi-mately 35m dwt compared to 23.2m dwt in 2011 due to the poor market, low probability of employ-ment and high costs of maintenance.
At year-end 2012, the orderbook for panamax stood at 30% of the existing fleet and 15-18% for the three other segments. taking into consider-ation the age profile and the demand outlook by segment, it would appear that handysize is in a comparatively well-balanced situation.
At year-end 2012, the average age of the world bulk fleet was slightly over 11 years compared to 12.5 years at year-end 2011. there are huge aver-age age differences across segments, cf. Figure 9.
after Year-enD eVentS peter borup took up his position as president of lauritzen bulkers on 1 February 2013.
outLooK for 2013We expect the very low spot market rates charac-terising the end of 2012 to continue into the first part of 2013, partly due to the low level of eco-nomic activity as well as uncertainty in many parts of the world, partly due to continued high delivery schedules in the first part of 2013.
however, 2013 is expected to witness a decelera-tion in supply growth as deliveries are forecast to fall from about 100m dwt in 2012 to about 65-70m dwt in 2013. Demolitions are expected to in-crease slightly from 35m dwt in 2012. Fleet growth is thus projected to fall from 10.5% in 2012 to about 6% in 2013.

J. Lauritzen a/S · AnnuAl RepoRt 2012 23
As in 2012, coal is expected to be a key driver of demand together with iron ore, as fiscal stimulus in China and strengthening economic activity in mature economies gather pace during the year. grain shipments are expected to rise in the sec-ond half of 2013 as crops are expected to return to normal levels. minor bulks are also poised for con-tinued growth. overall, an increase in demand growth is expected for 2013 compared to 2012, particularly in the second half of the year.
We expect the above to stop the decline in the spot market during 2013 with some improve-ments in the second half. With large surplus ship-building capacity, tonnage prices may continue their decline into 2013.


J. Lauritzen a/S · AnnuAl RepoRt 201226
lAuRItzen KoSanthe result was uSD 8.9m, up from uSD 6.5m in 2011 mainly due to improved trading conditions in the first half of 2012 and a larger average fleet of fully pressurised gas carriers, cf. table 2. the result included uSD 1.8m in gains from the sale of vessels, down from uSD 2.3m in 2011.
the result was in line with expectations and ac-ceptable taking the market conditions into consid-eration.
BuSineSS moDeL anD riSK managementlauritzen Kosan (lK) controls a modern fleet of 43 gas carriers with an average age of 8.7 years. the fleet comprises owned, part-owned, chartered vessels and vessels committed by partners. Ac-tive fleet portfolio management via cargo and pe-riod cover and the sale and purchase of vessels constitute key elements in the business model.
Strict health, safety and environmental standards and stringent client requirements are achieved through close in-house collaboration between the technical and commercial departments. Continu-ous improvements through education, innovation and careful implementation of procedures en-hance operational flexibility and higher fleet utili-zation.
As a leading tonnage supplier to the large petro-chemical and oil companies, lK continuously en-
ters into affreightment contracts, seeking to maxi-mise effective fleet cover.
While these contracts provide protection against short-term market fluctuations, due to their struc-ture they do entail some scheduling risks. these risks are connected with the flexibility provided by the affreightment contracts in terms of charterers’ right to manage their flows in accordance with the business cycle and their specific operations.
main eVentSlK took delivery of the last of a series of six 3,600 m3 fully pressurised gas carriers from yangzhou Kejin Shipyard in China designed for the growing Asian gas industry.
two 3,500 m3 fully pressurised gas carrier new-buildings were taken on long-term time-charter from Japanese owners.
A 3,500 m3 fully pressurised gas carrier was sold to Korean interests.
lK moved into its own premises in manila in 2012. the offices will be used for crew-related matters such as training and briefing/debriefing senior of-ficers.
2012 saw the launch of project ReJuICe, a major initiative to reduce fuel consumption and emis-sions.

J. Lauritzen a/S · AnnuAl RepoRt 2012 27
2012 2011
Revenue 210.3 143.2 EBITDA 35.7 33.2 Depreciations and write-downs (27.2) (26.4) Profit/(loss) on sale of vessels etc. 1.8 2.3 Operating income 10.3 9.1 Share of profit in joint ventures 0.7 2.2 Finance net (1.9) (3.7) Profit/(loss) before tax 9.1 7.7 JL's share of profit/(loss) 8.9 6.5 Invested capital (average) 408.3 423.4 Return on invested capital 2.7% 2.7%Average no. of employees 505 403
taBLe 2: KeY figureS uSDm
0
10
20
30
40
50
2011 2012
Own Part owned Chartered Shared charter Other
figure 10: aVerage no. of VeSSeLS
fLeettotal ship-days reached 15,617 for 42.8 vessels on average compared to 14,366 days for the aver-age of 39.4 vessels reported in 2011, cf. Figure 10.
lK’s fleet comprised 35 owned, part-owned and chartered vessels at year-end 2012. the average age of the company’s owned fleet was 8.6 years compared to 8.1 years at year-end 2011. At year-end 2012, the average age of the ethylene fleet was 4.6 years (3.6 years at year-end 2011), with the semi-refrigerated fleet at 16.7 years (15.7 years in 2011) and the fully pressurised fleet at 6.7 years (7.0 years in 2011).
the operated fleet consisted of 29 semi-refrigerat-ed/ethylene gas carriers on average (28 vessels in 2011) and 14 fully pressurized gas carriers (11 in 2011) with a combined capacity of about 221,950 m3 (212,650 m3 in 2011).
fLeet managementDuring the year, lauritzen Kosan Fleet manage-ment (lKFm) handled the technical management for the ethylene and semi-refrigerated gas carri-ers. part-owned Star management Associates, tokyo, handled the technical management for the fully pressurised vessels, although one Fp vessel was moved to lKFm towards the end of the year.
Six scheduled dry-dockings were completed dur-ing 2012 (six in 2011). unscheduled off-hire came to 3.0% in 2012 (2.3% in 2011). technical fleet management is based on health, safety, security, environmental and technical poli-cies to ensure efficient vessel operations in order to comply with international rules and regulations as well as stringent client expectations.
A total of 156 client vetting inspections were per-formed in 2012 (143 in 2011) in order to maintain pertinent client approvals of the vessels. on aver-age, 5.4 observations were received (6.2 in 2011). We focused especially on industry-standard SIRe inspections in which 4.8 observations were re-corded on average per inspection (5.4 in 2011). So-called crew-related observations, which could have been prevented by the crew, continued to decline (2.4 in 2012; 2.8 in 2011). Crew-related observations in SIRe inspections fell from 2.6 in 2011 to 2.3 in 2012.
Vessel crews are in the front line and their perfor-mance and attitude are essential in delivering the expected service. lKFm follows a strategy of training and education combined with perfor-mance incentives. training operations in manila were expanded and for the first time courses were given in bilbao to Spanish and Cuban seafarers. to support our activities in manila, lKFm person-nel moved into the newly established lauritzen Kosan offices in makati.
A new incentive scheme was successfully intro-duced in 2012 for captains and chief engineers in which performance is assessed and rewarded ac-cording to a set of key performance indicators for the vessel under their command. the scheme will be expanded in 2013 to include all officers on board.

J. Lauritzen a/S · AnnuAl RepoRt 201228
hSSeQhealth and safety is about protecting people and our focus on improving the safety culture for all employees is essential for us. During the past years, a broad range of safety initiatives were launched and we will continue to focus on strengthening our culture of embracing safety.
the focus for the 2012 safety campaign was on work routines and factors relating to the preven-tion of fatigue. Fatigue is recognized in the indus-try as a significant contributory factor in breaches of safety. our focus targeted implementation of new user-friendly software, interviews with crew members, changing procedures and responsibili-ties, analyses of work routines and discussions on work and watch schedules. efficient planning and on board resource utilization for our shipboard management are regarded as offering the poten-tial for increased performance. the yardstick for our efforts and ambitions is for zero harm inflicted by lK on any employee.
piracy and robbery unfortunately remain a threat to seafarers although there was a significant de-crease in attacks and hijackings during 2012. Rec-ognising our seafarers as our most important as-sets, lK continues to use private armed security teams on board our vessels operating in high risk areas.
efforts to protect the environment continued in 2012. lKFm maintains ISo 14001 certification with continuous improvement projects.
gLoBaL marKet DeVeLoPmentS After opening on a fairly strong note, the spot market weakened for smaller semi-refrigerated gas carriers from Q2. Smaller fully pressurised gas carriers enjoyed a rising trend throughout the year, whereas ethylene gas carriers witnessed a fairly flat market, cf. Figure 11.
period markets for 2012 were down by about 5% for most types of smaller gas carriers.
Second-hand prices declined marginally, whereas resale and newbuilding prices declined by 5-15% respectively during the year.
DemanD for gaS carrierSDemand for smaller gas carriers almost stagnated in 2012 on a cbm-mile basis after having posted strong growth during 2010 and 2011. petrochemi-cal gases made a negative contribution to de-mand growth with primarily lpg making a posi-tive contribution. transport of ammonia is not a significant part of demand for small gas carriers, and hence provided limited support in 2012, cf. Figure 12.
the key drivers for rising demand for lpg in small-er gas carriers were latin America and parts of Asia. Increased availability of lpg in north Ameri-ca and in Africa with stagnant supplies in the mid-dle east in combination with rising demand both from the household sector and the petrochemical industry were behind the rise in demand for small-er gas carriers transporting lpg.
pRoJeCtreJuiceIn 2012, lauritzen Kosan launched the project ReJuICe, a major initiative focusing on reducing fuel consumption and the environmental impact of our gas carrier operations. Specific initiatives for change have been brought in after a study of current operational practices, such as trim and ballast management, hull cleaning, improved regulation of power consumers and optimization of fleet utilization. together, these initiatives are expected to give a significant reduction in our carbon footprint in the form of emissions.

J. Lauritzen a/S · AnnuAl RepoRt 2012 29
figure 11: SPot marKet rateS 2010-2012 uSD ‘000/month
SouRCe: lK buSIneSS AnAlySIS bASeD on DAtA FRom FeARnley’S
figure 12: DemanD for SmaLLer gaS carrierS 2003-2012 BY ProDuct (miLL tonS)
SouRCe: lK buSIneSS AnAlySIS bASeD on DAtA FRom VIAmAR AS
figure 13: SuPPLY of SmaLer gaS carrierS 2003-2012 BY tYPe in cBmm
SouRCe: lK (23,000 Cbm) buSIneSS AnAlySIS bASeD on DAtA FRom VIAmAR AS
0
100
200
300
400
500
600
700
2010/01 2010/07 2011/01 2011/07 2012/01 2012/07
East (F/P) coaster West (S/R) coaster 6500 S/R 10000 ETH
25
30
35
5
10
15
20
-03 04 05 06 07 08 09 10 11 12
Ethylene Propylene Butadiene VCM LPG Ammonia
3
3.5
4
4.5
5
0 5
1
1.5
2
2.5
3
0
0.5
03 04 05 06 07 08 09 10 11 12
S/R vessels F/P vessels
J. Lauritzen a/S · AnnuAl RepoRt 201230
overall, there was a slight decline in transport of petrochemical gases in 2012 with VCm and ethyl-ene declining, and propylene and butadiene growing. the worsening economic climate, par-ticularly in europe but also in parts of Asia, led to a reduction in demand growth for plastics and thus in petrochemical gases. the production of ethyl-ene in China in 2012 is estimated to have been about 2% below 2011 with production of primary plastics up by 6% during the first 11 months of 2012. this has led to a strong increase in demand for ethylene imports into China.
the severe tightening of sanctions on Iran for pet-rochemical exports with effect from may 2012 af-fected smaller gas carriers severely, as Iran is a key exporter of ethylene, and the disappearance of Iran as a supplier had a detrimental effect on ethylene transportation mileage.
transportation of butadiene benefitted strongly from demand in Asia, whereas movements with propylene increased due to deficits emerging in the uS, partly due to feedstock becoming lighter with the increased use of ethane as feedstock and strongly growing demand in Asia.
SuPPLY of gaS carrierS the fleet of smaller gas carriers in the 3,200-22,999 m3 segment increased by an estimated 4% in 2012 which marked a decline in the growth rate compared to the past five years. At year-end 2012, the fleet was estimated to be slightly above 4.5m m3, cf. Figure 13. total deliveries were estimated at 0.2m m3 with deletions in the order of 0.05m m3
in 2012.
Fully pressurised gas carriers accounted for near-ly two thirds of all deliveries continuing a period of high deliveries, whereas deliveries of semi-refrig-erated and fully-refrigerated carriers declined.
the current order book including options amounts to 0.6m m3 equal to 13% of the existing fleet, of which 85% is semi-refrigerated tonnage. new or-ders increased in 2012 fivefold to almost 0.4m m3 compared to 2011. About 50% of orders in 2012 were for ethylene carriers. All orders are for deliv-ery in 2013-14, including those ordered in 2012. the schedule for delivery is almost evenly spread over the coming two years.

J. Lauritzen a/S · AnnuAl RepoRt 2012 31
figure 14: SmaLLer gaS carrierS age ProfiLe anD orDer BooK at Year-enD 2012 (% of exiSting fLeet)
SouRCe: lK buSIneSS AnAlySIS bASeD on DAtA DeRIVeD FRom ClARKSon ReSeARCh SeRVICeS
total deletions amount to approximately 0.05m m3, equal to 1.5%, with the majority being semi-refrigerated in the 5-15,000 m3 segment. this is the second year with a comparatively low demoli-tion figure which could be ascribed to the firm market with limited fleet growth.
At year-end 2012, the average age of the world fleet of semi-refrigerated gas carriers (including both ethylene and fully-refrigerated units) was 13.8 years and the order book represented 15,6% of the existing fleet. the average age of fully pres-surised gas carriers was 10,6 years and the order book was equal to 9,2% of the existing fleet, cf. Figure 14.
outLooK for 2013Various factors have the potential to keep demand growth for trade in petrochemical gases and en-suing demand for smaller gas carriers low in the first half of 2013 with improvements as the year progresses. these include the continuation of sanctions against Iran, the poor short-term eco-nomic outlook particularly in europe and the pos-sibility of major petrochemical capacity coming on stream in China.
Supply growth before demolitions is estimated at around 6%. Whereas the age profile suggests the potential for higher demolitions in 2013, we ex-pect a net supply growth of 3%. this will be of the same order as forecast demand growth, although with demand growth lagging during the first half of 2013.
60.0%
80.0%
100.0%
120.0%
0.0%
20.0%
40.0%
Semi-Refrigerated Fully-pressurised
25 years or more 15-24 yeas 0-14 years Order book25 years or more 15 24 yeas 0 14 years Order book


J. Lauritzen a/S · AnnuAl RepoRt 201234
lAuRItzen tanKerSIn 2012, lauritzen tankers’ result amounted to uSD (50.6)m compared to uSD (4.0)m in 2011, cf. table 3. the result was significantly impacted by write-downs and other one-off items with a net ef-fect of uSD (46.5)m (2011: uSD 2.5m). Adjusted for one-off items, the result was uSD (4.0)m, up from uSD (6.6)m in 2011.
the result was unsatisfactory.
BuSineSS moDeL anD riSK managementlauritzen tankers (lt) controls a fleet of 18 mod-ern mR product tankers with an average age of 3.6 years. the controlled fleet comprises owned, part-owned, and time-chartered vessels as well as vessels committed by partners.
Vessels employed in the spot market or on CoA are commercially and operationally managed by the mR pool of part-owned hafnia management, Copenhagen. pooling the spot business reduces lt’s market risk, inasmuch as the coverage ob-tained by the pool in terms of meeting customer requirements and being spread across many mar-kets provides better protection against adverse market movements. In 2012, lt remained the largest tonnage provider to this pool.
lt uses its market access to charter in/out ton-nage from/to first class charterers, providing fixed income with limited risk. In addition, sale and pur-
chase of vessels is an integrated part of the busi-ness model.
technical management responsibilities have been outsourced to external service providers.
main eVentStwo 53,500 dwt mR product tanker newbuildings were delivered to the fleet in 2012 and they were both employed on long-term time-charter.
one 50,000 dwt mR product tanker built in 2010 was taken on long-term time-charter with delivery mid-2012 and placed in the hafnia management’s mR pool. fLeetIn 2012, total ship-days reached 4,646 with 12.7 vessels on average compared to the 4,405 days with 12.1 vessels on average reported in 2011, cf. Figure 15.
At year-end 2012, lt controlled a fleet of 18 mR product tankers.
fLeet managementtechnical management of owned ships is provid-ed by Wallem Shipmanagement in hong Kong and bergen as well as mmS in Singapore and lt’s technical department works closely with both suppliers on all aspects of achieving safe, cost-ef-fective, responsible vessel operations.

J. Lauritzen a/S · AnnuAl RepoRt 2012 35
2012 2011
Revenue 61.0 62.0 EBITDA 14.3 12.2 Depreciations and write-downs (55.3) (6.3) Profit/(loss) on sale of vessels etc. - 0.0 Operating income (40.9) 5.9 Share of profit in joint ventures (1.1) 0.2 Finance net (7.6) (5.8) Profit/(loss) before tax (49.5) 0.4 JL's share of profit/(loss) (50.6) (4.0) Invested capital (average) 274.8 222.7 Return on invested capital (15.3)% 2.7%Average no. of employees 154 121
taBLe 3: KeY figureS uSDm
0
2
4
6
8
10
12
14
2011 2012
Own Part owned Chartered Shared charter Other
figure 15: aVerage no. of VeSSeLS
there were zero dry-dockings in 2012 (zero in 2011). the unscheduled off-hire for lt’s owned fleet was 0.8% (1.3% in 2011).
In 2012, seven owned vessels were inspected 23 times by oil majors. During the year, our special focus was on improving vessel performance against the oil Companies International marine Forum’s (oCImF) Ship Inspection Report pro-gramme (SIRe). Accordingly we undertook addi-tional onboard training and development for our vessels and offices. our goals were met by achiev-ing an average of 3.9 observations per vetting, which is better than industry average of 5.7. Crew-related observations accounted for an average of 2.7 of total observations. the remaining 1.2 obser-vations related to our offices and vessel construc-tion.
We continue to engage and encourage crewing by experienced, responsible multinational seafar-ers. Crews are selected for their skills in order to match our business profile and this is done in close collaboration between our external techni-cal management service providers and our tech-nical and operational departments, ensuring good dialogue and mutual understanding.
hSSeQWe are committed to a strict focus on health, safety, security and environmental protection. this is being achieved by comprehensive safety procedures, a focus on security and by maintain-ing energy-efficient operations. We thus work closely with external technical managers and monitor their performance. Consistent dialogue with these providers enables us to meet client ex-pectations for safe and efficient operations.
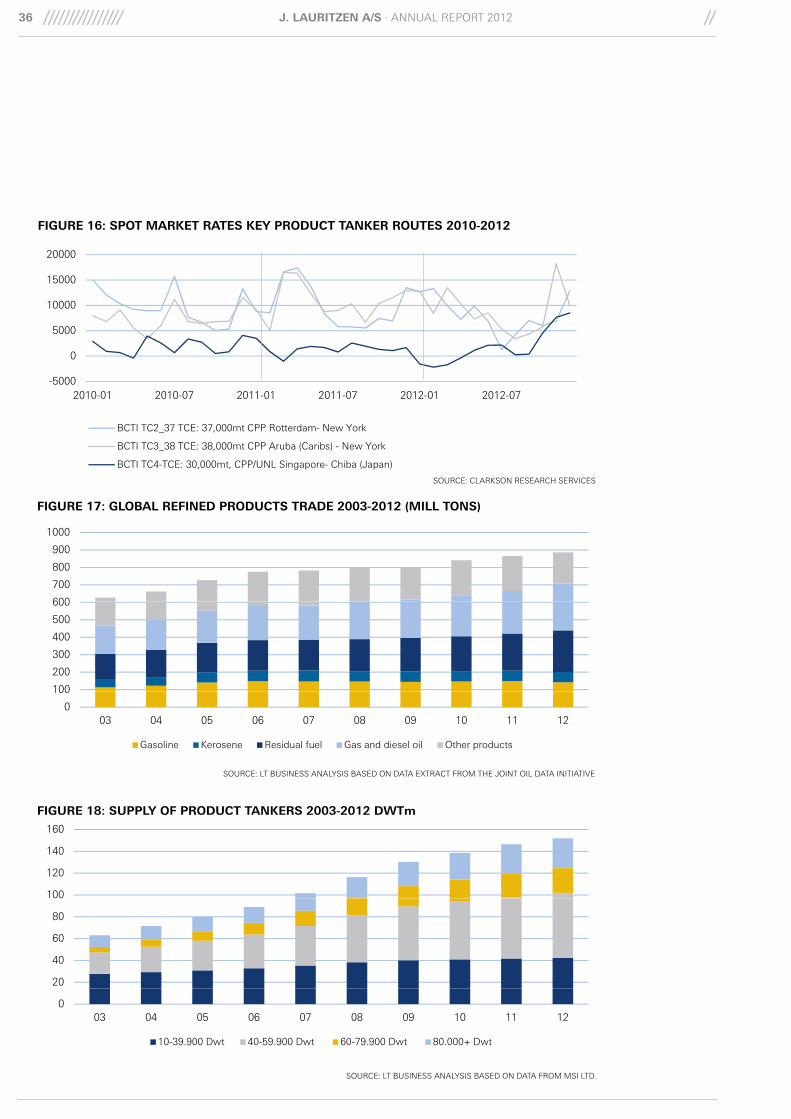
gLoBaL marKet DeVeLoPmentSAverage spot earnings on the three key mR prod-uct tanker routes were down by 20% compared to 2011, cf. Figure 16. unsatisfactory refining mar-gins towards the end of 2011 led refineries to re-duce output which dampened demand for prod-uct tankers in early 2012, mainly in the Far east. Increased economic uncertainty in europe during the summer contributed to depressing the Atlan-tic spot market during Q2 and Q3 before some seasonal strength was noted in Q4.
twelve month period rates for mR product tank-ers were on average at the same level of approxi-mately uSD/day 13,500 in 2012 as in 2011, whereas period rates for lR1 product tankers fell slightly. tonnage prices have fallen since the end of 2011; for a five year-old mR product tanker by almost 5%.
During the first months of 2012, oil prices reached their highest level since 2008 in part due to uncer-tainty relating to the sanctions against Iran, which eventually led Saudi Arabia and Qatar to increase production. With libya resuming production and Iraq steadily increasing its production, oil prices declined slightly during Q3 and then stabilised at approximately uSD 110 per barrel in Q4.
DemanD for ProDuct tanKerSglobal oil consumption grew considerably less than expected due to higher oil prices, but mainly due to less vigorous economic growth than ex-
J. Lauritzen a/S · AnnuAl RepoRt 201236
figure 16: SPot marKet rateS KeY ProDuct tanKer routeS 2010-2012
SouRCe: ClARKSon ReSeARCh SeRVICeS
figure 17: gLoBaL refineD ProDuctS traDe 2003-2012 (miLL tonS)
SouRCe: lt buSIneSS AnAlySIS bASeD on DAtA eXtRACt FRom the JoInt oIl DAtA InItIAtIVe
600
700
800
900
1000
100
200
300
400
500
600
0
100
03 04 05 06 07 08 09 10 11 12
Gasoline Kerosene Residual fuel Gas and diesel oil Other products
figure 18: SuPPLY of ProDuct tanKerS 2003-2012 DWtm
SouRCe: lt buSIneSS AnAlySIS bASeD on DAtA FRom mSI ltD.
100
120
140
160
20
40
60
80
003 04 05 06 07 08 09 10 11 12
10-39.900 Dwt 40-59.900 Dwt 60-79.900 Dwt 80.000+ Dwt
10000
15000
20000
-5000
0
5000
2010-01 2010-07 2011-01 2011-07 2012-01 2012-07
BCTI TC2_37 TCE: 37,000mt CPP Rotterdam- New York
BCTI TC3_38 TCE: 38,000mt CPP Aruba (Caribs) - New York
BCTI TC4-TCE: 30,000mt, CPP/UNL Singapore- Chiba (Japan)

J. Lauritzen a/S · AnnuAl RepoRt 2012 37
0.0%
20.0%
40.0%
60.0%
80.0%
100.0%
MR (40-60.000dwt) LR1 (60-80.000dwt)
25 years or more 15-24 years 0-14 years Order book
figure 19: ProDuct tanKerS age ProfiLe anD orDer BooK at Year-enD 2012 (% of exiSting fLeet)
SouRCe: lt buSIneSS AnAlySIS bASeD on DAtA DeRIVeD FRom ClARKSon ReSeARCh SeRVICeS
pected. According to the International energy Agency world oil consumption was up by only 1.1% on 2011.
Consequently, seaborne trade in oil products is estimated to have grown by a modest 2.2% in 2012, similar to the growth in 2011, cf. Figure 17.
trading patterns continued to change in 2012. most notably, uS imports of refined products con-tinued to decline, having fallen by one third in the course of only four years. During the same period, uS exports of refined products almost doubled, leading to net exports of some 0.8m barrels per day in 2012.
europe experienced a slight decline in imports, whereas mature economies in the pacific contrib-uted to rising seaborne trade, partly reflecting the dismantling of old refineries. the same applies to emerging markets in both Asia and in latin Amer-ica.
SuPPLY of ProDuct tanKerSby year-end 2012 the fleet of product tankers (in-cluding chemical/oil tankers) amounted to 152m dwt, up by almost 4% on 2011. the mR segment (40-60,000 dwt) increased by 6% in both 2012 and 2011, whereas the supply of lR1 product tankers (60-80,000 dwt) increased by 4% in 2012 compared to 9% in 2011, cf. Figure 18.
Deliveries of mR product tankers amounted to 3.7m dwt in 2012, similar to deliveries noted in 2011 whereas scrapping fell to 0.2m dwt from 0.5m dwt in 2011.
In general, contracting of product tankers in-creased by 35% in 2012. Contracts for mR prod-uct tankers increased by 15% to 2.6m dwt com-pared to 2011.
At year-end 2012, the average age of mR product tankers was 7.8 years (lR1 6.5 years) and the or-der book for mR product tankers amounted to 10% of the existing fleet (lR1 9%), cf. Figure 19.
outLooK for 2013A combination of weak economic growth and high prices will continue to limit growth in oil con-sumption, whilst at the same time, natural gas is making inroads into markets normally supplied by oil. In 2013 world oil consumption is thus forecast to be another year of low growth of the order of 1%.
this implies the risk of another year of low growth for product tankers in general, however with up-side potential in terms of refinery closures in ma-ture economies that could lift demand due to ad-ditional ton-miles.
For 2013, we expect that the product tanker fleet will only increase by a couple of percent, however with fleet growth of the mR segment expected to be higher.
this suggests that only a minor improvement in the market balance for mR products tankers is to be expected in 2013.


J. Lauritzen a/S · AnnuAl RepoRt 201240
lAuRItzen offShoreIn 2012, lauritzen offshore’s result amounted to uSD 8.8m, up from uSD 3.7m in 2011, cf. table 4. earnings for 2012 were significantly impacted by the formation of Axis offshore including a one-off transaction loss of uSD 7.5m. Adjusted for the one-off transaction loss, the result in 2012 was uSD 16.3m, up from uSD 3.7m in 2011. the in-crease was mainly due to the two shuttle tanker newbuildings delivered late 2011 and early 2012.
the result was in line with expectations and re-garded as acceptable.
BuSineSS moDeL our offshore activities comprise technologically advanced, dynamically positioned Accommoda-tion and Support Vessels (ASV) and shuttle tank-ers for employment in the offshore exploration and production sector. ASV operations are devel-oped as a joint venture whereas the shuttle tanker business is wholly-owned.
As our shuttle tankers are employed on long-term contracts, business risks relate to counterparty risk and the renewal/alternative employment op-tions. We continuously monitor risks and new business opportunities.
main eVentSDan Sabia, a 59,000 dwt shuttle tanker newbuild-ing, was delivered from Cosco nantong Shipyard, China, in early January 2012. on delivery, the ves-sel commenced a 12-year bareboat contract for transpetro, a wholly-owned subsidiary of petro-bras.
Due to growing market potential, a 50/50 joint venture with hitecVision, norway, was estab-lished in the ASV segment with effect from 30 June 2012. the new company, Axis offshore pte. ltd. initially comprises Jl’s monohull ASV Dan Swift currently on long-term contract to the brazil-ian oil major petrobras.
In September 2012, Axis offshore announced an order for a Semi-Submersible accommodation vessel at Cosco Qidong offshore, China, for deliv-ery during the first quarter of 2015 to meet strin-gent north Sea operating requirements. Read more at www.axisoff.com
fLeet managementhigh quality fleet management is vital in the off-shore industry and all issues relating to crewing, health, safety and the environment are managed by in-house experts, providing assurance for com-pliance with the requirements laid down in appli-cable national and international rules and regula-tions.
there were zero dry-dockings 2012 (two in 2011). unscheduled off-hire for the shuttle tanker fleet was zero in 2012 (also zero in 2011).
of the three owned shuttle tankers, only Dan ea-gle had a vetting under the Ship Inspection Report programme (SIRe) in 2012. Four minor observa-tions were made. three were immediately recti-fied but the last related to vessel design. the two shuttle-tankers Dan Cisne (2011) and Dan Sabia (2012) have both been lined up for future SIRe in-spections during the year.
Crew are regarded as a vital resource, so all offi-cers for offshore vessels are selected carefully. Where ratings are concerned, close collaboration with skilled and proven crew managers continued in 2012 to ensure a high level of retention. off-shore is a highly competitive segment for crewing

J. Lauritzen a/S · AnnuAl RepoRt 2012 41
2012 2011
Revenue 60.1 66.2 EBITDA 40.4 37.6 Depreciations and write-downs (16.8) (20.7) Profit/(loss) on sale of vessels etc. (7.5) - Operating income 16.1 16.9 Share of profit in joint ventures 2.7 - Finance net (10.8) (11.6) Profit/(loss) before tax 7.9 5.3 JL's share of profit/(loss) 8.8 3.7 Invested capital (average) 364.6 464.0 Return on invested capital 5.1% 3.6%Average no. of employees 58 126
taBLe 4: KeY figureS uSDm
and so a lot of resources are used to constantly keep officers and ratings updated with specialized courses and training in order to meet our clients’ expectations.
hSSeQlauritzen offshore (lo) is committed to providing safe working conditions in a markedly diverse multicultural and multilingual working environ-ment. We have management systems certified to inter-national standards in place to ensure the well-be-ing of staff, third party contractors and others who may be affected by our activities, in an effort to minimize any impacts.
In 2012, lo continued to implement our health, safety and environment strategy. Results included
a lost time Injury Frequency (ltIF) of zero and a total Recordable Case Frequency (tRCF) of 5.2. gLoBaL marKet DeVeLoPmentSunlike the two previous years, 2012 was a some-what quiet year in terms of new projects being tendered by operators. A 15-year contract for two Suezmaxes in the north Sea was signed, and the market also saw two shuttle tankers obtaining contract extensions.
the huge expansion in the market for shuttle tank-ers in the past couple of years has boosted the or-der book to 35% of the existing fleet. part of the fleet is growing fairly old but we expect that a market for older vessels will develop in Africa and South east Asia, as new and modern Dp2 or Dp3 vessels come on stream.
Including orders (two of which are options), the world fleet comprises almost 100 units. Average vessel age is decreasing, cf. Figure 20. only nine shuttle tankers of the total fleet are less than 60,000 dwt, with seven between 60,000 dwt and 99,000 dwt, with the balance between 100,000 and 165,000 dwt.
outLooK for 2013nineteen shuttle tankers are scheduled for deliv-ery in 2013, of which 15 units are considered firm with the balance possibly subject to delay. With oil prices continuing at uSD 100/ barrel or more in 2013, an increasing number of new deepwater offshore projects are forecast to be initiated with subsequent higher demand for shuttle tankers.
10
11
12
13
40
60
80
100
120
Ave
rag
e ag
e
No. of
vess
els
8
9
10
0
20
40
60
2011 2012 2013 2014 2015
Ave
rag
No. of
v
<<< Fleet <<< Orderbook Average age >>>
figure 20: gLoBaL ShuttLe tanKer fLeet anD age ProfiLe (Beginning of Year)
SouRCe: lAuRItzen oFFShoRe (oWn ReSeARCh)

J. Lauritzen a/S · AnnuAl RepoRt 201242
FInAnCe AnD inVeStor reLationSmaintaining strong and open relations with bond investors and lenders enables Jl to benefit from having access to a range of resources to finance our business activities.
financingReflecting the fact that our business operations are capital intensive, the financing for Jl’s assets comes from different financial resources and our financial policy has three main objectives:
• Secure the necessary liquidity.• Secure the lowest possible cost of debt capi-
tal taking market terms and conditions into consideration.
• maintain financial independency through prudent financial risk management and a di-versified funding base.
Jl’s board of Directors has approved a financial strategy including a set of guidelines for group solvency ratio, liquidity target and policies for fi-nancing debt, including:
• group solvency ratio of at least 35% and pref-erably not less than 40%.
• group liquidity (cash and cash equivalents) of at least uSD 50m plus a buffer to withstand a severe crisis.
• Debt financing for newbuildings to be drawn down at or after delivery of vessels.
• CApeX to be paid out of the group’s cash
holdings (during the construction phase of newbuildings).
• no single bank to contribute more than 25% of total debt.
Jl’s owned fleet is financed with a mix of debt and own funds.
our remaining newbuilding program of owned vessels is fully financed. At year-end 2012, CApeX remaining under the newbuilding program amounted to uSD 104m and committed funding totalled uSD 63m. the newbuilding program comprises four vessels.
Debt financinglong-term debt is generally held by J. lauritzen A/S but in some instances subsidiaries J. laurit-zen Singapore pte. ltd. or lauritzen Shuttletank-ers Singapore pte. ltd. are borrowers of long-term debt.
bank facilities account for the majority of the debt financing. At year-end 2012, bank facilities (amor-tizing term loans and revolving facilities) account-ed for 83% of total debt excluding subordinated loans. bank facilities are secured by mortgages on the vessels being financed. of the 83% bank facilities, 21% percentage points were eCA (ex-port Credit Agency) backed facilities at year-end 2012, cf. Figure 21.

J. Lauritzen a/S · AnnuAl RepoRt 2012 43
Issuer J. Lauritzen A/S J. Lauritzen A/S
ISIn no 001 0572381 no 0010 661846
type Senior unsecured bond Senior unsecured bond
Coupon p.a. Fixed 10.5% Floating rate 8.25% + nIboR 3mths
Issue date 05 may 2010 24 october 2012
maturity date 05 may 2015 24 october 2017
Amount noK 700m noK 500m
Interest payment Annual Quarterly
listing oslo Stock exchange oslo Stock exchange (As from 16 January 2013)
existing term loans (amortizing loans with a bal-loon payment at maturity) mature in 2016 and 2017. existing eCA backed term loans (fully amor-tizing loans) mature in 2021 and 2022. Revolving facilities (partially amortizing credits with a bal-loon payment at maturity) mature between 2014 and 2017.
Jl’s existing bank facilities include covenants on the mortgaged vessels relevant to the ordinary conduct of business. bank facilities also include minimum value requirements (e.g. minimum re-quirements relating to a ratio between the fair market value of the security and outstanding debt in the particular facility) between 100% and 130%. Finally, facilities include financial covenants on Jl’s value-adjusted (taking e.g. vessels at broker valuation) consolidated solvency ratio (minimum 30%), Jl’s consolidated liquidity (minimum uSD
500
750
1000
1250
1500
0
250
500
2013 2014 2015 2016 2017
Term Loan Term Loan ECA backed Revolving
Subordinated Loan Bond UnsecuredSubordinated Loan Bond Unsecured
figure 21: forecaSt outStanDing DeBt Year-enD uSDm
taBLe 5: JL’S corPorate BonD iSSue
50m) and Jl’s consolidated working capital ratio (to be 1:1 or better).
Jl was in compliance with all bank loan and bond debt covenants at year-end 2012.
At year-end 2012, corporate bonds accounted for a further 17% of outstanding debt excluding sub-ordinated loans. Issued bonds include financial covenants on Jl’s consolidated solvency ratio (minimum 30%) and consolidated liquidity (mini-mum uSD 50m).
our strategy is to have approximately uSD 300m or the equivalent in other currencies in outstand-ing debt on a rolling basis, based on corporate bond issuance. the first step was taken in may 2010 with the issuance of noK 700m in corporate bonds (ISIn no0010572381) with maturity in may 2015. the next step was taken in october 2012 when Jl issued noK 500m in a new corporate bond (ISIn no0010661846) with maturity in oc-tober 2017, cf. table 5. We expect to continue to issue additional corporate bonds in the future.
no bank or bond debt requires refinancing until mid-2014, cf. figure 22.

J. Lauritzen a/S · AnnuAl RepoRt 201244
200
250
300
350
400
0
50
100
150
200
2013 2014 2015 2016 2017Bullit Subordinated loan Bullit Bond Bullit Term Loan Repayment
figure 22: rePaYment ProfiLe of outStanDing DeBt
equityJl is a private (non-listed) company owned by the lauritzen Foundation. As a non-listed company Jl has no direct market access to equity.
however, Jl benefits from having an owner with a long-term vested interest in shipping and we have received the following subordinated loans from our owner:
• DKK 600m on 1 April 2009 with an original maturity on 1 April 2014. however, in may 2012 the owner agreed to extend the maturi-ty on this subordinated loan by an additional eight years to 1 April 2022.
• DKK 250m on 7 January 2010 with maturity on 31 January 2015.
early 2013, the lauritzen Foundation decided to convert the two subordinated loans into equity. At year-end 2012, the loans including accrued inter-est amounted to a total of DKK 903.1m, equiva-lent to uSD 159,6m. the conversion increases Jl’s solvency ratio from 37% to 44%.
Joint ventures and part-ownershipJl considers joint-ventures an attractive way to providing access to new markets or increasing our fleet with a view to gaining economies of scale in particular markets or market segments.
Some of the handysize bulk carrier vessels oper-ated by lauritzen bulkers are part-owned vessels,
Note: Bullet payments on existing bank facilities are normally refinanced on or before maturity
by way of pledging the particular financed vessels in a new facility and using proceeds to re-
deem the existing facility.

J. Lauritzen a/S · AnnuAl RepoRt 2012 45
StoCK eXChAnge announcementS 2012the following Stock exchange announcements were made in calendar 2012 via oslo Stock ex-change.
announcement no. 1:Financial report for 2011, 23 February 2012
announcement no. 2:Further strengthening of funding and revised outlook for 2012, 10 may 2012
announcement no. 3:J. lauritzen establishes joint venture with hitecVision, 4 July 2012
announcement no. 4: Interim financial report for the first half of 2012, 14 August 2012
announcement no. 5 :J. lauritzen contemplates bond issue, 10 october 2012
announcement no. 6:J. lauritzen successfully completes noK 500m bond issue, 11 october 2012
announcement no. 7:Kastrup-nielsen will take over as Ceo after Janholt in February 2013, 14 november 2012
announcement no. 8 :lower ebItDA and write-down as result of impairment, 21 December 2012
with lauritzen bulkers having co-ownership. Sim-ilarly a part of lauritzen Kosan’s fleet of ethylene gas carriers is co-owned together with a joint ven-ture partner and operated by lauritzen Kosan.
In 2012, lauritzen offshore formed the AXIS off-shore joint venture together with our norwegian partner, hitecVision, with a view to growing its presence in the offshore accommodation and support vessel segment.
inVeStor reLationSAs mentioned above, an integral part of our finan-cial strategy is to be a recurring issuer of corpo-rate bonds and since may 2010, Jl has had cor-porate bonds listed on oslo Stock exchange. Relations with the investor community are thus important for us.
Jl’s objective is for the market price of securities we issue to fairly reflect the Jl group’s financial performance, our actual and forecast ability to create value and our ability to repay our obliga-tions as they fall due. In doing so, we strive to pro-vide timely, precise and relevant information on Jl group strategy, our business, results and expecta-tions and other matters which affect the percep-tion and assessment of the securities we issue.
Jl seeks to maintain an open dialogue with cur-rent and potential investors, analysts and other market professionals and to provide them with easy and equal access to information from us.
Jl held several investor meetings and conference calls in 2012. presentations from these meetings are available on our website where all announce-ments and financial reports issued by Jl are also available. Investor relations activities in 2012 fo-cused on keeping the investor community updat-ed on developments at Jl but also on exploring our opportunities for issuing further corporate bonds. on the back of these efforts, we success-fully launched and sold a second corporate bond in october 2012.
In order to align Jl’s financial reporting with the standards of other issuers, we will begin releasing quarterly interim financial reports from Q1/2013.
Future investor relations activities are expected to remain at the same level as in 2012.

J. Lauritzen a/S · AnnuAl RepoRt 201246
RISK management
As a cyclical, global industry, shipping is exposed to a large number of diverse risk factors with the potential to heavily impact on the way business is conducted.
the purpose of risk management is to ensure that risks affecting Jl’s operations are identified, moni-tored and dealt with according to the risk toler-ance set for each type of risk.
Jl as a group has identified, monitors and man-ages four main types of risk: business Risks (e.g. freight rates, fuel oil prices, asset values and oper-ating costs), Financial Risks (e.g. interest rates, currencies and liquidity), Credit Risks (e.g. credit rating of counterparties) and operational Risks (e.g. safety, insurance, It and piracy). Risk man-agement is an integral part of Jl’s corporate gov-ernance, see p. 50-53.
As a shipping company we create value by taking calculated risks relating to our core businesses. For operational risks, our risk tolerance is in prin-ciple zero and risks relating to operations, safety, environment and It systems are reduced as much as possible. We have a low risk tolerance related for financial risks and these are managed closely and minimised in order to support our strategy. policies on risk management and risk limitation are approved by the board of Directors. Key risk factors both at group level and for individual busi-ness units are regularly assessed and prioritised
based on how likely they are to occur and their potential impact. the group and individual busi-ness units also have procedures in place to ensure consistent day-to-day risk management.
BuSineSS riSKSbusiness risks relate primarily to volatility in freight rates and asset values. global economic cycles and economic growth are key drivers for all shipping markets as world trade and seaborne trade both depend on economic growth. Further, the demand for seaborne transport depends on the geographical location of production com-pared to where the goods are being used. Jl’s four business units all have market-specific de-mand drivers and are responsible for identifying and monitoring risks relating to their individual markets.
Volatility in Jl’s earnings is in part managed by op-erating a diversified business portfolio and differ-ent vessel segments within the individual busi-ness units and in part by securing a deliberate combination of open and covered vessel days (in-cluding FFAs).
Instructions regarding charter obligations are de-fined by Jl’s board of Directors.
Some segments are characterised by long-term contracts whereas others are characterized by an-nual contracts and a high level of repeat clients. long-term period charters and very long cargo

J. Lauritzen a/S · AnnuAl RepoRt 2012 47
figure 23: coVerage 2013
contracts are approved by the board of Directors. We constantly monitor market trends and adjust our coverage to market expectations on an ongo-ing basis, cf. Figure 23.
Jl operates a young, cost-efficient, diversified fleet comprising owned and part-owned as well as time-chartered and pool vessels, giving us a high degree of flexibility in adjusting the fleet to market changes.
Risks associated with fluctuations in asset values are assessed inter alia by using a model incorpo-rating forecast economic/physical service lives, shipping cycles and average costs per fleet unit.
Due to a significant drop in vessel values in the first half of 2012, cash totalling uSD 22m was paid into pledged accounts to support fulfilment of minimum value clauses embedded in financing facilities. A further uSD 8m cash is expected to be pledged during Q1/2013. Should vessel values drop further a 10% during 2013, Jl will be expect-ed to pay an additional uSD 8m into pledged ac-counts.
business strategies, comprising policies for con-tract coverage by vessel segments and overall limits for off-balance sheet exposure (such as chartered tonnage) are approved by Jl’s board of Directors and reporting on these is an integral part of our reporting routines.
Bunker oil price riskbunker oil is a significant cost element for Jl, al-though oil price risk only relates to contracted cargo volumes not covered by bAF (bunker Ad-justment Factor). At present, most of the fleet is
employed either in the spot market, re-let or on time-charter or employed under CoA with bAF and hence bunker oil price risk is limited.
reputational riskJl enjoys strong brand recognition and loyalty and has for many years been a quality shipowner with high standards in all aspects of safety and corporate governance. however, any incident or accident could have an impact on the company to the detriment of our image and brand loyalty. guarding against this type of risk is difficult and can only be achieved by extensive preventive work and complete transparency should an inci-dent or accident nevertheless occur.
financiaL riSKSFinancial risks relate to capital management risks, see the chapter Finance and Investor relations on p. 42ff and to the financial markets in general (cur-rency exchange rates and interest rates).
currency riskJl’s operating and reporting currency is uSD and thus all amounts are recorded and reported in uSD. matching income and expenses and assets and liabilities minimises the net currency risk, leaving net positions to be focused on.
Currency exposure relates to our operational, fi-nancial and investment cash flows.
the most important non-uSD operating cost cur-rency is DKK arising mainly from head office costs and Danish crew expenses. Currency risk from non-uSD investments in ships relates to Jpy. Cur-rency risk from non-uSD interest bearing debt re-lates to Jpy (uSD 86.1m), noK (uSD 212.5m) and DKK (uSD 161.8m).
our policy is to use derivative instruments to hedge currency risks relating to net non-uSD cash flows from operating activities, investments and financing. general hedging policy is approved by the board of Directors.
interest rate riskspart of Jl’s loan portfolio is subject to floating in-terest rates, meaning that we are exposed to fluc-tuations in these.
our policy is to hedge risks associated with changes in interest rates to limit the financial ef-
50%
75%
100%
0%
25%
pes
ize
dym
ax
dys
ize
P L
PG
R L
PG
e LP
G
anke
rs
anke
rs
Cap
Han
d
Han
d
F/ S/R
Eth
ylen
Shu
ttle
Ta
Pro
duc
t Ta

J. Lauritzen a/S · AnnuAl RepoRt 201248
fects of adverse changes in interest rates by con-verting variable interest rates to fixed interest rates. net interest rate risk may be hedged via for-ward rate agreements, interest rate swaps and related instruments if felt advantageous. general hedging policy is approved by the board of Direc-tors.
At year-end 2012, 59% of Jl’s debt was in fixed rate loans (47% at year-end 2011).
During 2012, we further increased lines relating to derivatives with financial counterparties, thus sig-nificantly reducing the risk of margin calls.
creDit riSKCredit risk is the risk of incurring financial loss if a client or a counterpart fails to fulfil its contractual obligations.
Jl rates clients for creditworthiness based on his-torical trading and payment records, input from rating agencies as well as industry knowledge and client reputation. large counterparties are monitored and rated, with fixed exposure limits. Further, clients and counterparties are only ac-cepted when fulfilling general requirements. In certain cases contracts are guaranteed by parent companies or the like.
large contracts and long-term commitments are reviewed and approved by the executive manage-ment and in certain cases by the board of Direc-tors.
on a group basis, our ten largest clients account-ed for 20.5% of total revenues in 2012 (22.8% in 2011).
Risks relating to financial counterparties, financial instruments, bonds and cash funds are minimised by trading only with financial institutions with a long-term investment grade credit rating from moody’s and by defined limits on deposits for each financial partner.
please see note 16 of the financial statements for further details on financial and credit risks.
oPerationaL riSKSoperational risks refer to potential losses resulting from inadequate systems, accidents and piracy.
SafetyCasualties from ship operations can have serious consequences and so merchant shipping is one of the most heavily regulated industries in the world and was among the first to adopt and widely im-plement international safety standards. Further, many clients have implemented additional re-quirements relating to safety, environmental pro-tection, etc.
Any accident could have serious consequences for our crews or personnel, the environment and our financial position due to personel injury, loss of income, repair costs, claims and damages and consequential loss of client satisfaction.
Jl recognises the risks and potential hazards in-volved in owning, operating and managing a large, diversified fleet of ships worldwide. one major prerequisite for handling these risks is to ensure that all ships under our control comply with comprehensive internal management sys-tems that are in line with or exceed the require-ments of the International Safety management (ISm) code. management systems and reporting practices are regularly revised so as to communi-cate best practice across the fleet, thus avoiding or minimizing the risk of incidents, accidents and time loss.
ongoing training of crews is the key to reducing risks relating to ship and cargo handling opera-tions.
Piracy and violent crimethe fight against piracy, violent crime and associ-ated risks continue to be at the top of the global shipping agenda, hence also for Jl.
the risk to our crews and clients’ cargo due to pi-racy or violent crime-related activity in certain parts of the world has our strictest attention. We adhere to recommendations and best manage-ment practices from relevant national and interna-tional bodies as set out in our corporate security guidelines.
Jl supports the use and dispatch of armed secu-rity teams aboard our vessels. the necessity for engaging armed security teams on vessels oper-ating in high risk regions is assessed on the basis of voyage-specific risk assessments. this is sup-
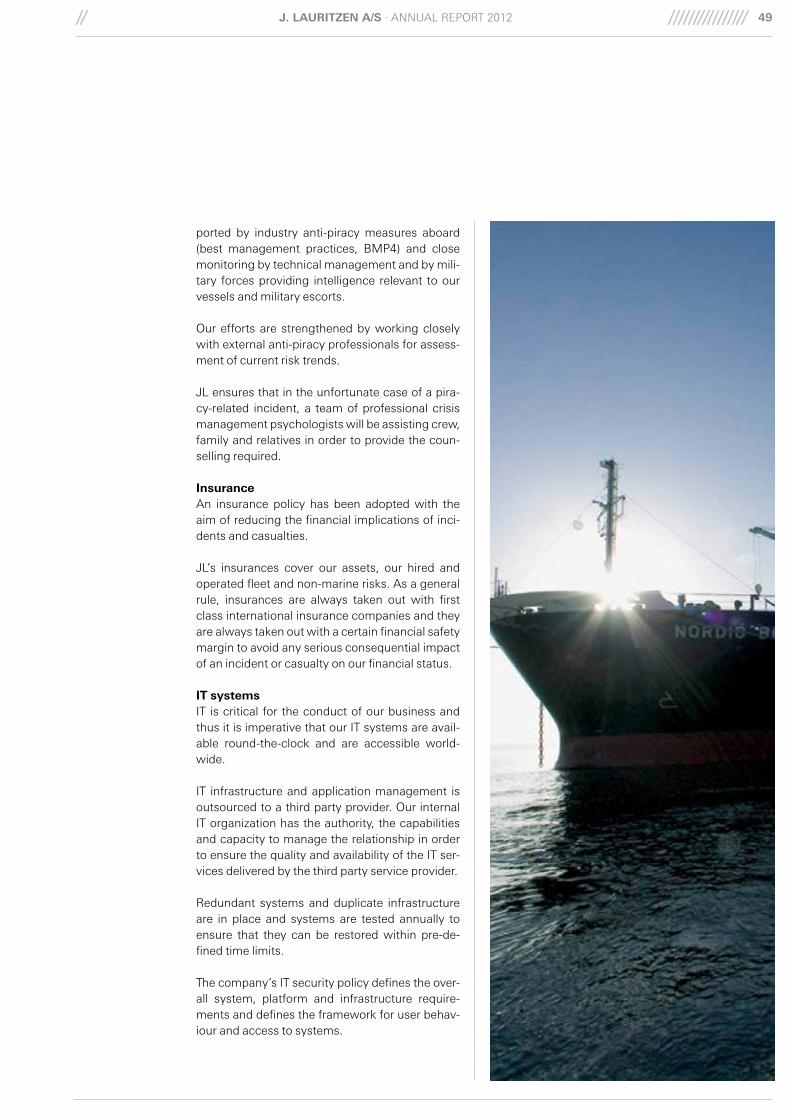
J. Lauritzen a/S · AnnuAl RepoRt 2012 49
ported by industry anti-piracy measures aboard (best management practices, bmp4) and close monitoring by technical management and by mili-tary forces providing intelligence relevant to our vessels and military escorts.
our efforts are strengthened by working closely with external anti-piracy professionals for assess-ment of current risk trends.
Jl ensures that in the unfortunate case of a pira-cy-related incident, a team of professional crisis management psychologists will be assisting crew, family and relatives in order to provide the coun-selling required.
insurance An insurance policy has been adopted with the aim of reducing the financial implications of inci-dents and casualties.
Jl’s insurances cover our assets, our hired and operated fleet and non-marine risks. As a general rule, insurances are always taken out with first class international insurance companies and they are always taken out with a certain financial safety margin to avoid any serious consequential impact of an incident or casualty on our financial status.
it systems It is critical for the conduct of our business and thus it is imperative that our It systems are avail-able round-the-clock and are accessible world-wide.
It infrastructure and application management is outsourced to a third party provider. our internal It organization has the authority, the capabilities and capacity to manage the relationship in order to ensure the quality and availability of the It ser-vices delivered by the third party service provider.
Redundant systems and duplicate infrastructure are in place and systems are tested annually to ensure that they can be restored within pre-de-fined time limits.
the company’s It security policy defines the over-all system, platform and infrastructure require-ments and defines the framework for user behav-iour and access to systems.

J. Lauritzen a/S · AnnuAl RepoRt 201250
CoRpoRAte goVernanceJl’s approach and day-to-day work with the group’s corporate governance is based on the three core pillars of commitment, governance and control.
Jl’s corporate governance procedures are based on the Danish Companies Act, the fundamental principles and recommendations of the Danish Committee on Corporate governance, the com-pany’s Articles of Association, the board of Direc-tors’ Rules of procedure and its guidelines to the executive management. the procedures reflect the fact that Jl is a private (non-listed) company with a sole owner but with several bond holders.
please visit the group’s corporate website to see the group’s statutory report on Corporate governance for the financial year at http://www.j-lauritzen.com/upload/jl_answer _cguk_2012.pdf.
commitmentthe group’s business foundation builds on Jl’s core values of competence, respect, entrepreneur-ship, accountability, team spirit and enthusiasm and being owned by a foundation that emphasis-es promoting and developing the Danish shipping industry in general and supporting charitable in-stitutions, Jl has always focused on long-term value creation.
our business foundation makes us agile and en-sures our ability to adapt to increasing regulation. We thus continually increase our transparency whilst engaging with a growing number of stake-holders.
goVernanceownershipJl is a private (non-listed) company incorporated in Denmark and is owned by the lauritzen Foun-
CORE VALUES
GLOBAL COMPACT
TRANSPARENCY
EXTERNAL GUIDELINES & REGULATIONS
GOVERNANCECOMMITMENT CONTROL
FINANCIAL MANAGEMENT
RISK MANAGEMENT
INTERNAL CONTROL
AUDIT PROCESSES
OWNERS THE LAURITZEN FOUNDATION
BOARD OF DIRECTORSand committees
EXECUTIVE MANAGEMENT
EXECUTIVE COMMITTEE
ORGANISATION
“AS the SoLe owner of J. LAurItzen, we hAve Supported the deveLopment of the buSIneSS pLAtform thAt hAS tAken pLAce over the pASt coupLe of yeArS, And when the gLobAL crISIS IS over we See JL AS A Strong contender to further deveLop ItS
mArket preSence”
Jens Ditlev Lauritzen, Chairman, Lauritzen Foundation.

J. Lauritzen a/S · AnnuAl RepoRt 2012 51
lAuRItzen founDationJ. lauritzen A/S was founded in 1884 and has been a leading provider of ocean transport for more than 125 years. the lauritzen Foundation was established in 1945 and since then has had full ownership of Jl. the lauritzen Foundation is a commercial foundation and as such is a self-governing institution in Danish law and is regu-lated by the Danish Act on Commercial Founda-tions. the Foundation is also overseen by the Danish ministry of Justice and the Danish minis-try of business and growth.
the lauritzen Foundation supports Jl’s prudent dividend policy, taking account of the continued existence and development of Jl. Further, its policy is to ensure the independence of the com-panies it owns.
In addition to its ownership of Jl and its control-ling interest in DFDS A/S (36% holding), the lau-ritzen Foundation has holdings via wholly-owned lF Investment ApS (100% holding) in the oil anal-ysis, measuring equipment, software, biotech-nology and real estate sectors.
the board of Directors consists of eight members, five elected by the general meeting and three elected by the employees. the members elected by the general meeting serve for one year and may stand for re-election. In 2012 all five mem-bers were re-elected at the general meeting.
pursuant to the Danish Companies Act, three board members are elected by the employees for a period of four years, last election was in 2009.
At the turn of 2012, the average length of service of the board of Directors was eight years and their average age was 55. three of the board members (niels heering, peter poul lauritzen bay and mari-anne Wiinholt) elected by the general meeting are independent, as defined in the recommendations from the Danish Committee on Corporate gover-nance.
dation. According to its charter, the Foundation is strongly committed to developing the shipping industry. Further, the Foundation’s strong values and heritage provide daily inspiration and support for Jl’s market profile, with our focus on long-term value creation combined with the agility to meet outside demands and developments.
the annual general meeting was in 2012 held on 27 march.
management structureJl has a two-tier management structure consist-ing of two separate bodies; a non-executive board of Directors and an executive management. the board of Directors is the central, supreme govern-ing body. Day-to-day management is conducted by the executive management in line with the rules and procedures laid down by the board of Directors.
Board of Directorsthe core task of the board of Directors’ is to en-sure that Jl’s overall business strategy is consis-tent and the group’s capital structure is appropri-ate. Focus is on risk management and internal control and the board of Directors ensures that an annual strategic plan and budget are drawn up and approved and that monthly and quarterly re-ports are submitted.
In 2012 the board met eight times, including an annual mid-year strategy meeting. between meetings, recommendations were submitted to the board for written resolution.
the board of Directors is supported by two per-manent committees: An Audit Committee and a nomination and Remuneration Committee.
The Lauritzen Foundation
J. Lauritzen A/S100%
LF Investment ApS100 %
DFDS A/S 36%
Lauritzen Bulkers
Lauritzen Kosan
Lauritzen Tankers
Lauritzen Offshore

J. Lauritzen a/S · AnnuAl RepoRt 201252
the board is broadly composed of members with diverse, extensive experience, knowledge and know-how in relation to the global shipping indus-try, international leadership, finance and strategy development.
committee work in 2012Jl’s Audit Committee held six meetings in 2012 and supported the board of Directors in monitor-ing the financial controls and reporting process, risk management systems and the audit process.
the nomination and Remuneration Committee supports the board of Directors in the ongoing process of establishing and maintaining appropri-ate succession plans for the board of Directors and executive management as well as ensuring that the group has a market conform remunera-tion policy. the committee held two meetings in 2012.
executive managementthe executive management is appointed by the board of Directors and consists of torben Janholt, president & Ceo, birgit Aagaard-Svendsen, eVp & CFo and Jan Kastrup-nielsen, eVp & Coo (as per 26 February 2013, appointed president & Ceo of Jl). extraordinary or major dispositions may only be implemented by the executive manage-ment on the basis of specific authorization grant-ed by the board.
the executive Committee functions as the coordi-nating forum for the day-to-day management of the Jl group.
the executive Committee consists of executive management together with peter borup (presi-dent, lauritzen bulkers as from 1 February 2013), thomas Wøidemann (president, lauritzen Kosan), erik Donner (president, lauritzen tankers and lauritzen offshore), erik bierre (Senior Vice presi-dent, business Control) and John m. Jørgensen (Senior Vice president, treasury).
increased focus on diversityJl has signed operation Chain Reaction, a Danish government initiative that strives to motivate companies to increase diversity with the focus on gender.
A policy and action plan for diversity was adopted in 2012 and applies for all management levels. Jl defines diversity in terms of gender, cultural width, extensive experience and new inspiration.
the board composition was unchanged in 2012 and thus the diversity profile of the board mem-bers elected by the annual general meeting re-mained with 20% female and 40% being citizens from elsewhere than Denmark.

J. Lauritzen a/S · AnnuAl RepoRt 2012 53
In 2012, Jl succeeded in strengthening the diver-sity at management level both at head office and in Singapore in corporate positions, chartering and operation.
For additional information on nationality, age pro-file and the composition of the executive manage-ment, please visit our website at www. j-lauritzen.com.
Principles of remunerationDuring 2012, Jl’s policy and principles for remu-neration were updated and disclosed on the group’s website. the principles of remuneration include the board of Directors, executive man-agement and employees in Jl in general. Remu-neration in Jl reflects personal performance and achievements as well as market conditions in comparable companies.
members of the board of Directors receive fixed compensation at a level which reflects the scope and character of duties as a Director and is on par with fees in comparable companies. members of the Audit Committee and the nomination and Re-muneration Committee receive additional fees. no pension contributions are payable on board member fees and neither are board members cov-ered by incentive programmes. Fees are disclosed in Jl’s annual report, see p. 60-61.
For additional information on Jl’s principles of re-muneration, please visit our website at www.j-lauritzen.com.
controLAn important part of Jl’s approach and day-to-day work with governance relates to risk manage-ment, financial control and management and au-dit processes. the board of Directors and executive management routinely defines and re-views policies and control procedures to support the business, risk management, financial man-agement and reporting and benchmarks these against generally accepted international practice.
Activities relating to day-to-day business are dele-gated insofar as possible to individual business units, subject to well-defined financial and risk limits.
operational efficiency is supported by centralized, shared corporate services such as business con-trol, human resources, It, legal and insurance, procurement, cash management and corporate communication.
It infrastructure and application management, technical management in some business areas and services relating to control functions have been outsourced to third party providers, which are selected on the basis of thorough due dili-gence.
A whistleblower system was implemented in 2010. So far, no incidents have been reported.
financial management, reporting and internal controlJl’s financial management comprises long-term financial projections and rolling two-year fore-casts followed up by quarterly and monthly re-porting. long-term projections are revised at least twice a year or whenever required. During 2012, forecasts were revised several times.
effective, transparent reporting requires well-de-fined levels of authorisation, the segregation of duties and common adopted reporting structures. the group’s It-systems promote requisite knowl-edge-sharing and transparency.
Statutory reporting and internal management re-porting are based on common policies, shared databases and a standardised reporting system.
Jl’s business Control is responsible for the group’s financial management, reporting and the internal financial control of business units and subsidiaries.
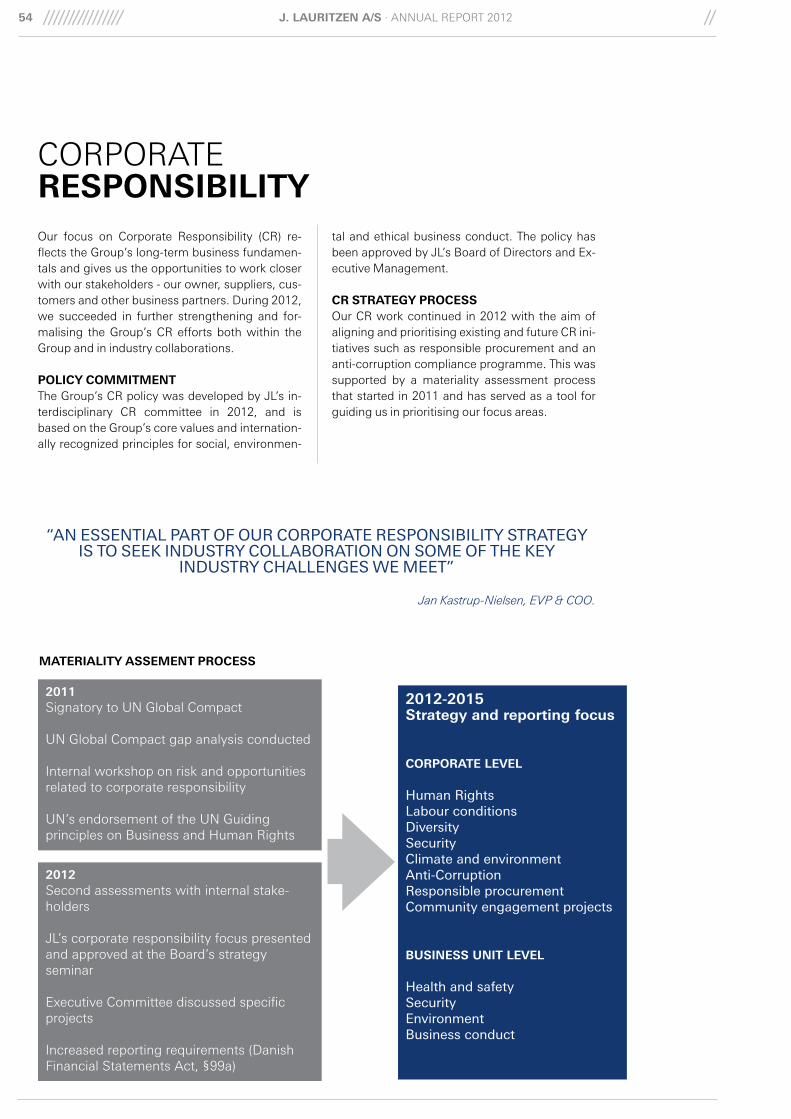
J. Lauritzen a/S · AnnuAl RepoRt 201254
CoRpoRAte reSPonSiBiLitYour focus on Corporate Responsibility (CR) re-flects the group’s long-term business fundamen-tals and gives us the opportunities to work closer with our stakeholders - our owner, suppliers, cus-tomers and other business partners. During 2012, we succeeded in further strengthening and for-malising the group’s CR efforts both within the group and in industry collaborations.
PoLicY commitmentthe group’s CR policy was developed by Jl’s in-terdisciplinary CR committee in 2012, and is based on the group’s core values and internation-ally recognized principles for social, environmen-
tal and ethical business conduct. the policy has been approved by Jl’s board of Directors and ex-ecutive management. cr StrategY ProceSSour CR work continued in 2012 with the aim of aligning and prioritising existing and future CR ini-tiatives such as responsible procurement and an anti-corruption compliance programme. this was supported by a materiality assessment process that started in 2011 and has served as a tool for guiding us in prioritising our focus areas.
materiaLitY aSSement ProceSS
2011Signatory to un global Compact
un global Compact gap analysis conducted
Internal workshop on risk and opportunities related to corporate responsibility
un’s endorsement of the un guiding principles on business and human Rights
2012Second assessments with internal stake-holders
Jl’s corporate responsibility focus presented and approved at the board’s strategy seminar
executive Committee discussed specific projects
Increased reporting requirements (Danish Financial Statements Act, §99a)
2012-2015 Strategy and reporting focus
corPorate LeVeL
human rightsLabour conditionsdiversitySecurityclimate and environmentAnti-corruptionresponsible procurementcommunity engagement projects
BuSineSS unit LeVeL
health and safetySecurityenvironmentbusiness conduct
“An eSSentIAL pArt of our corporAte reSponSIbILIty StrAtegy IS to Seek InduStry coLLAborAtIon on Some of the key
InduStry chALLengeS we meet”
Jan Kastrup-Nielsen, EVP & COO.

J. Lauritzen a/S · AnnuAl RepoRt 2012 55
KeY initiatiVeS in 2012the following main initiatives and actions were taken during the year:
• Completion of a responsible procurement programme together with another Danish shipowner.
• As part of our anti-corruption compliance programme, we conducted awareness ses-sions and published internal information ma-terial.
• ongoing participation in the maritime Anti-Corruption network.
• Implementation of our group energy efficien-cy project, which aims to enhance fuel-effi-ciency and cut emissions whilst achieving savings on costs.
• Introduction of the greenhouse gas protocol (ghgp), the most widely-used international environmental accounting tool for green-house gas emissions.
• Climate partnership with Dong energy for our head office in Copenhagen.
aDDitionaL informationRead more on our CR efforts in the group’s statu-tory Corporate Responsibility report which has been prepared in accordance with the Danish Fi-nancial Statements Act (§99a) and the un global Compact’s requirements for communication on progress on http://www.j-lauritzen.com/upload/jlcr_report_2012.pdf.

J. Lauritzen a/S · AnnuAl RepoRt 201256
oRgAnISAtIon AnD PeoPLeAmbitious and competent employees, who re-spect and adhere to the business ethics and cul-tural heritage on which Jl is founded, are playing a more vital role than ever and are essential for our continuing growth and development.
comPetencY DeVeLoPmentDuring the year, Jl’s first candidates embarked on a two-year commercial shipping programme de-veloped in conjunction with other major Danish shipping companies and the Danish Shipowners’ Association. the programme is conducted in eng-lish which makes it possible to include employees from our overseas offices.
the very first nanyang technological university student who is studying in the maritime pro-gramme of ntu in Singapore, received the schol-arship established last year by the lauritzen Foun-dation and J. lauritzen Singapore. the scholarship provides financial support to young talented can-didates who do not have the funds to complete their studies. Apart from experiencing financial
difficulties, the applicants must also show sound academic results, be active in community service or other voluntary activities with a positive social impact.
During 2012, Jl employees had seats on national and international committees and advisory boards, where they were able to influence their fields of interest. Jl employees were invited to speak at conferences in Denmark and abroad, for example on implementing corporate strategy, fi-nancial management, governance and CR in the maritime industry, lng as alternative marine fuel and industry-specific topics.
recruitmentSthe number of recruitments was at a modest level in 2012, and the majority concerned replace-ments of employees who had left either the Dan-ish organisation or one of our overseas offices. Jl experienced no problems in recruiting well-quali-fied candidates for all vacancies.
AmbItIouS And competent empLoyeeS, who reSpect And Adhere to the buSIneSS ethIcS And cuLturAL herItAge on
whIch JL IS founded, Are pLAyIng A more vItAL roLe thAn ever And Are eSSentIAL for our contInuIng growth And
deveLopment.

J. Lauritzen a/S · AnnuAl RepoRt 2012 57
Seagoing Head office Overseas offices Site teams
figure 25: DiStriBution of WorKforce Year-enD 2012
0
200
400
600
800
1,000
1,200
1,400
2010 2011 2012
Seagoing Head office Overseas offices Site teams
figure 24: totaL WorKforce at 2010-2012 Year-enD
emPLoYee DeVeLoPmentAt year-end 2012, Jl’s total headcount was 1,341 compared to 1,384 in 2011, with a total of 166 working at head office in Copenhagen, 55 in the overseas offices, 4 in site teams, and 1,116 at sea, cf. Figures 24-25.
In 2012, staff turnover was 14.5% compared to 14.3% in 2011. the staff turnover has mainly been caused by employees transferring to Axis off-shore pte. ltd. and a considerably turnover among our student employees in part-time posi-tions.
Average years of service decreased to 9.2 in 2012 compared to 9.3 years in 2011, and average age remained 44.3 years in 2012.

J. Lauritzen a/S · AnnuAl RepoRt 201258
FInAnCIAl reVieWJl’s result was uSD (349.7)m compared to uSD (46.2)m in 2011. the result was significantly im-pacted by one-off items with a net effect of uSD (254.4)m (2011: uSD (25.2)m) comprising write-downs, sale of claims and sale of vessels due to counterparty defaults or strategic initiatives. Ad-justed for one-off items, Jl’s normalized result was uSD (95.4)m, down from uSD (21.0)m in 2011 cf. table 6.
the decrease of the normalized result was mainly caused by the weaker bulk markets and income lost as a consequence of counterparty defaults.
the same factors also had a significant impact on revenues, but due to an 18% increase of the fleet and due to changed employment from time char-ters to cargo contracts and spot trading, revenues increased from uSD 604.3m in 2011 to uSD 695.6m in 2012.
hire of chartered vessels amounted to uSD 266.1m, up from uSD 229.6m in 2011 mainly caused by an increasing fleet of time-chartered bulk carriers.
operating costs for owned and bareboat char-tered vessels totaled uSD 62.1m, up from uSD 54.4m in 2011 due to delivery of newbuildings during 2011 and 2012.
other operating costs including bunkers, port ex-penditures and other voyage-related costs amounted to uSD 171.5m compared to uSD 68.8m in 2011 reflecting the increasing fleet and the changed employment pattern.
office and fleet staff costs and other sales and ad-ministrative costs totaled uSD 120.9m, down from uSD 122.3m in 2011 mainly due to transfer of staff to the Axis offshore joint venture.
ebItDA amounted to uSD 88.7m (normalized uSD 72.0m), down from uSD 146.0m in 2011 (normalized uSD 126.5m). the decrease in nor-malized ebItDA related to lauritzen bulkers. the other business units reported ebItDA up on 2011.
In 2012, net losses from the sale of vessels and other assets totaled uSD (102.4)m, mainly related to the sale of two capesize bulk carriers due to counterparty default, and Dan Swift and other as-
sets being transferred to Axis offshore. one gas carrier was also sold with a profit of uSD 1.8m. For comparison, 2011 saw the disposal of three gas carriers and two bulk carriers, including one capesize bulk carrier sold due to counterparty de-fault, with a net loss of uSD (36.2)m.
Depreciation and write-downs totaled uSD 250.0m compared to uSD 91.2m in 2011. Write-downs on bulk carriers and product tankers amounted to uSD 148.7m (2011: nil). Deprecia-tion was up by uSD 10.0m as a result of the ex-panding fleet of owned vessels.
Share of profit in joint ventures totaled uSD (26.2)m, down from uSD 4.7m in 2011. the decrease was mainly related to bulk joint ventures and write-downs on part-owned vessels.
net financial costs of uSD 59.5m fell from uSD 69.2m in 2011 as increasing interest charges on at-delivery financing of newbuildings were off-set by increased currency exchange rate net gains and by costs for refinancing in 2011 not repeated in 2012.
Result before tax was uSD (349.2)m, down from uSD (45.9)m in 2011. Income tax amounted to uSD 0.8m down from uSD 1.9m in 2011.
the result of uSD (348.4)m was considerably be-low our expectations at the beginning of the year but in line with expectations stated in our stock exchange announcement to oslo børs in Decem-ber 2012. the result is regarded as very unsatis-factory.
BaLance SheetAt year-end 2012, total assets amounted to uSD 2,315.4m down uSD 366.5m on 2011 due to the sale of vessels, depreciations and write-downs and transfer of Dan Swift to Axis offshore, partly off-set by investment in newbuildings.
the total book value of vessels amounted to uSD 1,701.9m, down uSD 266.8m on 2011, whereas brokers’ valuations totaled uSD 1,312.1m. the calculated value in use of the vessels, taking con-tract coverage into account, was higher than the total book value.
Vessels under construction amounted to uSD
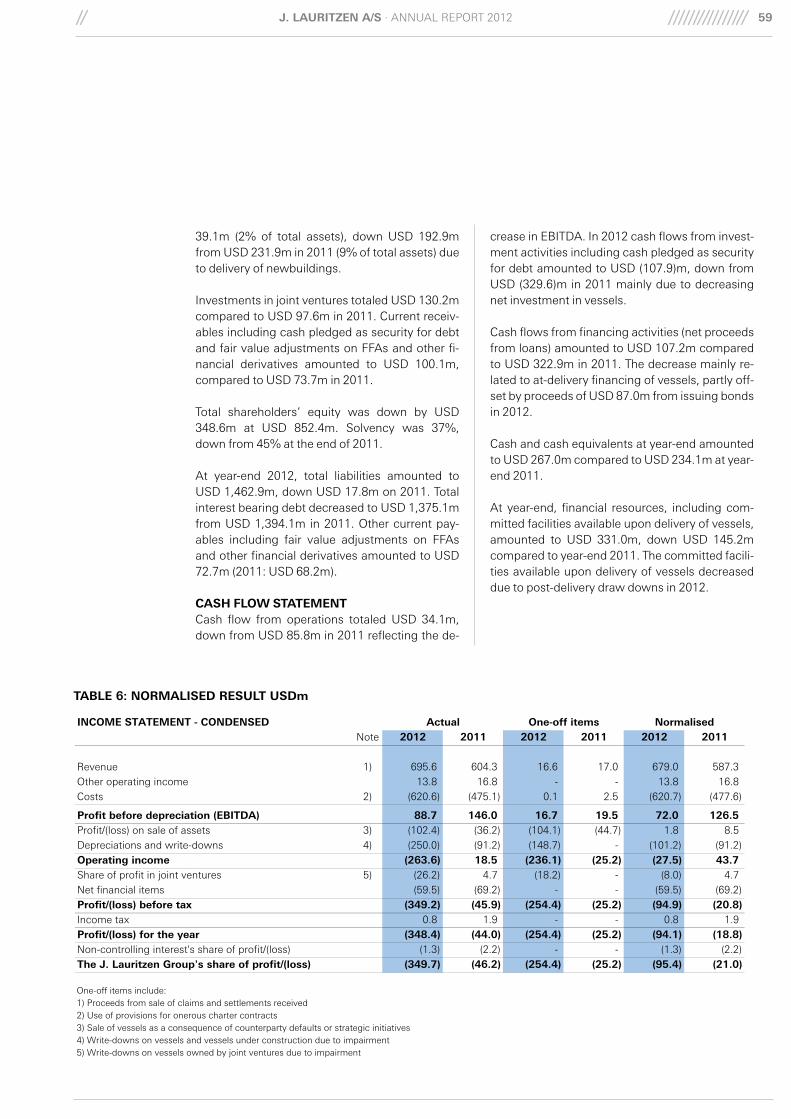
J. Lauritzen a/S · AnnuAl RepoRt 2012 59
39.1m (2% of total assets), down uSD 192.9m from uSD 231.9m in 2011 (9% of total assets) due to delivery of newbuildings.
Investments in joint ventures totaled uSD 130.2m compared to uSD 97.6m in 2011. Current receiv-ables including cash pledged as security for debt and fair value adjustments on FFAs and other fi-nancial derivatives amounted to uSD 100.1m, compared to uSD 73.7m in 2011.
total shareholders’ equity was down by uSD 348.6m at uSD 852.4m. Solvency was 37%, down from 45% at the end of 2011.
At year-end 2012, total liabilities amounted to uSD 1,462.9m, down uSD 17.8m on 2011. total interest bearing debt decreased to uSD 1,375.1m from uSD 1,394.1m in 2011. other current pay-ables including fair value adjustments on FFAs and other financial derivatives amounted to uSD 72.7m (2011: uSD 68.2m).
caSh fLoW StatementCash flow from operations totaled uSD 34.1m, down from uSD 85.8m in 2011 reflecting the de-
crease in ebItDA. In 2012 cash flows from invest-ment activities including cash pledged as security for debt amounted to uSD (107.9)m, down from uSD (329.6)m in 2011 mainly due to decreasing net investment in vessels.
Cash flows from financing activities (net proceeds from loans) amounted to uSD 107.2m compared to uSD 322.9m in 2011. the decrease mainly re-lated to at-delivery financing of vessels, partly off-set by proceeds of uSD 87.0m from issuing bonds in 2012.
Cash and cash equivalents at year-end amounted to uSD 267.0m compared to uSD 234.1m at year-end 2011.
At year-end, financial resources, including com-mitted facilities available upon delivery of vessels, amounted to uSD 331.0m, down uSD 145.2m compared to year-end 2011. the committed facili-ties available upon delivery of vessels decreased due to post-delivery draw downs in 2012.
INCOME STATEMENT - CONDENSED Actual One-off items NormalisedNote 2012 2011 2012 2011 2012 2011
Revenue 1) 695.6 604.3 16.6 17.0 679.0 587.3 Other operating income 13.8 16.8 - - 13.8 16.8 Costs 2) (620.6) (475.1) 0.1 2.5 (620.7) (477.6)
Profit before depreciation (EBITDA) 88.7 146.0 16.7 19.5 72.0 126.5 Profit/(loss) on sale of assets 3) (102.4) (36.2) (104.1) (44.7) 1.8 8.5 Depreciations and write-downs 4) (250.0) (91.2) (148.7) - (101.2) (91.2) Operating income (263.6) 18.5 (236.1) (25.2) (27.5) 43.7 Share of profit in joint ventures 5) (26.2) 4.7 (18.2) - (8.0) 4.7 Net financial items (59.5) (69.2) - - (59.5) (69.2) Profit/(loss) before tax (349.2) (45.9) (254.4) (25.2) (94.9) (20.8) Income tax 0.8 1.9 - - 0.8 1.9 Profit/(loss) for the year (348.4) (44.0) (254.4) (25.2) (94.1) (18.8) Non-controlling interest's share of profit/(loss) (1.3) (2.2) - - (1.3) (2.2) The J. Lauritzen Group's share of profit/(loss) (349.7) (46.2) (254.4) (25.2) (95.4) (21.0)
One-off items include:1) Proceeds from sale of claims and settlements received2) Use of provisions for onerous charter contracts3) Sale of vessels as a consequence of counterparty defaults or strategic initiatives4) Write-downs on vessels and vessels under construction due to impairment5) Write-downs on vessels owned by joint ventures due to impairment
taBLe 6: normaLiSeD reSuLt uSDm

J. Lauritzen a/S · AnnuAl RepoRt 201260
boARD oF DirectorS
chairmanBent ØStergaarDmember since 2003 // Remuneration: DKK 850,000Chairman of the nomination and Remuneration Committee
president,lF Investment ApS & lauritzen Fonden
chairman of the board of directors of:DFDS A/SKayxo A/SFrederikshavn maritime erhvervspark A/Snanonord A/SCantion A/S
board member of:Comenxa A/SDesmi A/Smama mia holding A/Smeabco A/SRoyal Arctic line A/SWith FondenDurisol uK
Vice chairmaningar SKaugmember since 1998 // Remuneration: DKK 500,000member of the Audit Committeemember of the nomination and Remuneration Committee
chairman of the board of directors of:bery maritime A/SRagni Invest A/SCenter for Creative leadership
board member of:berg-hansen Reisebureau ASDFDS A/Smirospetroleum geo-Servicesperformance leadership AS
BoarD memBernieLS heeringmember since 2001 // Remuneration: DKK 450,000Chairman of the Audit Committeemember of the nomination and Remuneration Committee
chairman of the board, partnergorrissen Federspiel
chairman of the board of directors of:Jeudan A/SntR holding A/S (+subsidiary company)ellos A/Sthrane & thrane A/Shelgstrand Dressage A/Snesdu A/SStæhr holding A/S (+ subsidiary company)Stæhr Invest II A/SCiv. Ing. n.t. Rasmussens Fond
board member of:Scandinavian private equity partners A/Sole mathiesen A/Shenning Stæhr A/S15. juni Fonden (Vice Chairman)lise og Valdemar Kählers FamiliefondDirector of CCKn holding ApS(+ two subsidiaries)
BoarD memBerPeter PouL Lauritzen BaYmember since 2003 // Remuneration: DKK 300,000member of the Audit Committee
management consultantAccenture

J. Lauritzen a/S · AnnuAl RepoRt 2012 61
*Elected by the employees
auDit committeeniels heering (Chairman)Ingar Skaug (member)peter poul lauritzen bay (member)
nomination &remuneration committeebent Østergaard (Chairman)Ingar Skaug (member)niels heering (member)
BoarD memBermarianne WiinhoLtmember since June 2011 // Remuneration: DKK 250,000
Senior vice president/head of corporate finance, Dong energy A/S
board member of:KnI A/S, DK-3911 Sisimiut, greenland
BoarD memBerSØren Berg*member since 2005 // Remuneration: DKK 250,000
project manager, lauritzen Kosan A/S
board member of:De Forenede Sejlskibe
BoarD memBeruLriK DanStrØm*member since 2009 // Remuneration: DKK 250,000
vice president, lauritzen bulkers A/S
BoarD memBerPer gommeSen*member since 2009 // Remuneration: DKK 250,000
captain, lauritzen offshore Services A/S
Resigned as of 29 January 2013

J. Lauritzen a/S · AnnuAl RepoRt 201262
other memBerS of executiVe committee
peter borup*president - lauritzen bulkers A/S
thomAS wøIdemAnnpresident - lauritzen Kosan A/S
erIk donnerpresident - lauritzen tankers A/S &lauritzen offshore Services A/S**
torben JAnhoLtpresident & ceo
board member of:Danish Shipowners’ Association (DSA)(Chairman of DSA 2005-09)A/S united Shipping & trading ltdpost norden Ab european Community Shipowners’ Associations (eCSA)
President of Lauritzen Bulkers from July 2012 through
January 2013
Resigned as President and CEO as from 26 February
2013
mAnAgement
erIk bIerreSenior Vice president - J. lauritzen A/Sgroup business Control
John JørgenSen Senior Vice president - J. lauritzen A/Sgroup treasury
* From 1 February 2013
** From July 2012
bIrgIt AAgAArd-SvendSen executive vice president & cfo
chairman of the board of directors of:Committee on Corporate governance (Komitéen for god Selskabsledelse)Danish Society for education and business (DSeb)
board member of:metroselskabet I/Sthe West of england Ship owners mutual Insurance Association (luxembourg)
JAn kAStrup-nIeLSenexecutive vice president & coo
President and CEO as from 26 February 2013
executiVe management & executiVe committee

J. Lauritzen a/S · AnnuAl RepoRt 2012 63
From left: Peter Borup,Torben Janholt, Erik Donner, Jan Kastrup-Nielsen, Thomas Wøidemann, Birgit Aagaard-Svendsen, John Jørgensen and Erik Bierre

J. Lauritzen a/S · AnnuAl RepoRt 201264
grouP accountS
Income StAtement 66
StAtement of comprehenSIve Income 66
StAtement of fInAncIAL poSItIon 67
equIty StAtement 68
cAShfLow StAtement 69
noteS 70
note 1 ACCountIng eStImAteS & JuDgementS 70
note 2 Segment InFoRmAtIon 72
note 3 StAFF CoStS, oFFICe & Fleet 74
note 4 ReVenue 74
note 5 StAFF CoStS oFFICe & Fleet 74
note 4 otheR SAleS & ADmInIStRAtIVe CoStS 74
note 5 DepReCIAtIonS & WRIte DoWnS 74
note 6 FInAnCIAl InCome 74
note 7 FInAnCIAl eXpenSeS 74
note 8 tAX 74
note 9 VeSSelS, pRopeRty & eQuIpment 75
note 10 InVeStmentS In JoInt VentuReS 76
note 11 otheR ReCIeVAbleS 76
note 12 pRepAymentS 76
note 13 eQuIty 76
note 14 pRoVISIonS 76
note 15 long-teRm boRRoWIngS 77
note 16 FInAnCIAl InStRumentS & FInAnCIAl RISKS 78
note 17 ADJuStmentS to CASh FloW 81
note 18 ChAnge In WoRKIng CApItAl 81
note 19 SAle oF ContRollIng InteReSt In SubSIDIARIeS 81
note 20 moRtAgeS 81
note 21 ContIngent lIAbIlItIeS 81
note 22 opeRAtIng leASeS oF VeSSelS 82
note 23 ContRACtuAl CommItmentS 83
note 24 RelAteD pARtIeS 83
note 25 eVentS AFteR the bAlAnCe Sheet 83
note 26 ACCountIng polICIeS 83
mAnAgement StAtement 100
Independent AudItorS’ report 101
ACCountS

J. Lauritzen a/S · AnnuAl RepoRt 2012 65
Parent comPanY accountS
Income StAtement 88
StAtement of comprehenSIve Income 88
StAtement of fInAncIAL poSItIon 89
equIty StAtement 90
cAShfLow StAtement 91
noteS 92
note 1 StAFF CoStS 92
note 2 otheR SAleS & ADmInIStRAtIVe CoStS 92
note 3 FInAnCIAl InCome 92
note 4 FInAnCIAl eXpenSeS 92
note 5 tAX 92
note 6 mAChIneRy, toolS & eQuIpment 92
note 7 InVeStmentS In SubSIDARIeS 93
note 8 otheR ReCIeVAbleS 93
note 9 eQuIty 93
note 10 long-teRm boRRoWIngS 94
note 11 FInAnCIAl InStRumentS & FInAnCIAl RISKS 95
note 12 moRtAgeS 98
note 13 ContIngent lIAbIlItIeS 98
note 14 RelAteD pARtIeS 98
note 15 eVentS AFteR the yeAR bAlAnCe Sheet 98
note 16 ACCountIng polICIeS 98
note 17 ACCountIng eStImAteS AnD JuDgementS 99
mAnAgement StAtement 100
Independent AudItorS’ report 101

J. Lauritzen a/S · AnnuAl RepoRt 201266
InCome Statement
USD '000 2012 2011
Profit/(loss) for the year (348,447) (44,015)
Other comprehensive income
Exchange differences on translating foreign operations 144 4
Fair value adjustment of hedging instruments during the year (9,284) (20,481)
Defered gains/(loss) on hedging instruments transferred to financial expenses 11,008 5,594
Fair value adjustment of shares available for sale 818 21,245
Other comprehensive income net of tax 2,685 6,362
Total comprehensive income for the year (345,762) (37,653)
Total comprehensive income attributable to:
The J. Lauritzen Group (347,058) (39,848)
Non-controlling interests 1,296 2,195 (345,762) (37,653)
StAtement oF comPrehenSiVe income
grouP
USD '000 Note 2012 2011
Revenue 2 695,558 604,265
Other operating income 13,825 16,834
Income 709,383 621,099
Hire of chartered vessels (266,067) (229,620)
Operating costs of vessels (62,146) (54,390)
Other operating costs (171,537) (68,821)
Staff costs, office and fleet 3 (98,591) (96,676)
Other sales and administrative costs 4 (22,304) (25,586)
Costs (620,644) (475,092)
Profit before depreciation (EBITDA) 88,738 146,006
Profit/(loss) on sale of vessels (94,801) (36,251)
Profit/(loss) on sale of subsidiaries 19 (7,545) -
Profit/(loss) on sale of other assets (11) 3
Depreciations and write-downs 5 (249,958) (91,241)
Operating income (263,576) 18,518
Share of profit in joint ventures 10 (26,203) 4,708
Financial income 6 13,749 4,848
Financial expenses 7 (73,201) (74,014)
Profit/(loss) before tax (349,230) (45,941)
Income tax 8 783 1,926
Profit/(loss) for the year (348,447) (44,015)
Profit attributable to:
The J. Lauritzen Group (JL result) (349,743) (46,210)
Non-controlling interests 1,296 2,195
(348,447) (44,015)

J. Lauritzen a/S · AnnuAl RepoRt 2012 67
StAtement oF financiaL PoSition
grouP
USD '000 Note 2012 2011
ASSETS
Vessels, property and equipment 9 1,752,449 2,214,841
Investments in joint ventures 10 130,247 97,619
Deferred tax assets 8 655 2,707
Shares available for sale 16 26,010 24,788
Receivables from joint ventures 21,985 20,746
Non-current assets 1,931,346 2,360,702
Bunkers 16,755 11,212
Trade receivables 5,250 18,706
Other receivables 11 74,037 29,600
Prepayments 12 19,714 24,578
Current tax receivables 8 1,117 833
Securities 157 2,103
Cash at hand and in bank 267,000 234,132
Current assets 384,030 321,164
Total assets 2,315,376 2,681,865
LIABILITIES
Share capital 60,633 60,633
Retained earnings 806,670 1,156,413
Reserves (15,235) (17,920)
JL's share of equity 852,069 1,199,126
Non-controlling interests 371 1,956
Equity 13 852,440 1,201,082
Long-term borrowings 15 1,284,709 1,310,843
Non-current liabilities 1,284,709 1,310,843
Current portion of long-term borrowings 15 90,387 83,240
Trade payables 14,740 16,034
Other payables 72,723 68,160
Provisions 14 18 1,037
Prepayments 359 1,469
Current liabilities 178,227 169,940
Total liabilities 1,462,936 1,480,783
Total equity and liabilities 2,315,376 2,681,865

J. Lauritzen a/S · AnnuAl RepoRt 201268
USD '000
Equity 1/1 2011 60,633 (18,505) - (5,777) (24,282) 1,202,623 1,238,974 4,761 1,243,735
Profit/(loss) for the year - - - - - (46,210) (46,210) 2,195 (44,015)
Other comprehensive income:
Exchange differences on translating foreign -
operations - - - 4 4 - 4 - 4
Deferred (gain)/loss on hedging instruments
transferred to financial expenses - 5,594 - - 5,594 - 5,594 - 5,594
Fair value adjustment of shares available for sale - - 21,245 21,245 - 21,245 - 21,245
Fair value adjustment of hedging instruments during the period - (20,481) - - (20,481) - (20,481) - (20,481) Total other comprehensive income - (14,886) 21,245 4 6,362 - 6,362 - 6,362 Total comprehensive income - (14,886) 21,245 4 6,362 (46,210) (39,848) 2,195 (37,653) Transactions with owners:
Paid dividend - - - - - - (5,000) (5,000) Total transactions with owners - - - - - - - (5,000) (5,000) Equity 31/12 2011 60,633 (33,391) 21,245 (5,773) (17,920) 1,156,413 1,199,126 1,956 1,201,082
Profit/(loss) for the year - - - - - (349,743) (349,743) 1,296 (348,447)
Other comprehensive income:
Exchange differences on translating foreign
operations - - - 144 144 - 144 - 144
Deferred (gain)/loss on hedging instruments
transferred to financial expenses - 11,008 - - 11,008 - 11,008 - 11,008
Fair value adjustment of shares available for sale - - 818 - 818 - 818 - 818
Fair value adjustment of hedging instruments during the period - (9,284) - (9,284) - (9,284) - (9,284) Other comprehensive income - 1,724 818 144 2,685 - 2,685 - 2,685 Total comprehensive income 1 724 818 144 2 685 (349 743) (347 058) 1 296 (345 762)
Hedging instrument
Sharecapital
Shares available
for saleTranslation
gain/lossRetained earnings Total Total
Non-controlling
interestsReservesHedging
instrumentShare
capital
Shares available
for saleTranslation
gain/lossRetained earnings Total Total
Non-controlling
interestsReserves
Total comprehensive income - 1,724 818 144 2,685 (349,743) (347,058) 1,296 (345,762) Transactions with owners:
Paid dividend - - - - - - (2,881) (2,881) Total transactions with owners - - - - - - - (2,881) (2,881)
Equity 31/12 2012 60,633 (31,668) 22,063 (5,630) (15,235) 806,670 852,068 371 852,440
eQuIty Statement
grouP

J. Lauritzen a/S · AnnuAl RepoRt 2012 69
USD '000 Note 2012 2011
Operating income (263,576) 18,518
Depreciations and write-downs carried back 5 249,958 91,241
Adjustments 17 101,337 (4,449)
Change in working capital 18 3,906 34,994
Cash flow from operations before financial items 91,625 140,303
Ingoing financial payments 3,481 4,848
Outgoing financial payments (63,565) (54,180)
Cash flow from ordinary operations 31,541 90,970
Paid corporate tax 8 2,517 (5,220)
Cash flow from operating activities 34,059 85,750
Investments in vessels 9 (8,540) (16,907)
Payments on vessels under construction 9 (181,090) (417,931)
Investments in land and buildings 9 - (234)
Investments in machinery and equipment 9 (225) (3,035)
Investments in joint ventures 10 (65,055) (1,854)
Disposal of Joint ventures 10 175 -
Sale of vessels 79,473 32,669
Sale of other non current assets 12 636
Purchase and sales of securities 257 8,217
Bank deposits pledged as security for debt (22,321) 47,680
Sale of controlling interest in subsidiaries 19 83,801 -
Dividend received from Joint ventures 10 5,600 21,176
Cash flow from investment activities (107,914) (329,582)
Financial receivables (1,514) (5,163)
Instalment on long-term debt (182,584) (379,113)
Proceeds from loans 291,249 707,163
Cash flow from financing activities 107,150 322,888
Changes for the year in cash and cash equivalents 33,295 79,056
Cash and cash equivalents at beginning of year 234,132 154,384
Currency adjustments on cash and cash equivalents (427) 692
Cash and cash equivalents at the end of the year 267,000 234,132
Undrawn committed credit facilities at end of year *) 1,009 58,312
Financial resources at the end of the year 268,009 292,444
Committed facilities available upon delivery of vessels 63,000 183,741
Financial resources incl. committed facilities available
upon delivery of vessels 331,009 476,185
*) In addition JL has an unsecured overdraft facility of DKK 100m for multi-currency short-term financing needs.
CASh FloW Statement
grouP

J. Lauritzen a/S · AnnuAl RepoRt 201270
noteS grouP
note 1 accounting eStimateS anD JuDgmentS
the preparation of the financial statements in conformity with IFRS as adopted by eu requires management to make estimates and judg-ments that affect the recognisition and carrying amounts of assets and liabilities and disclosure of contingent assets and liabilities at the date of the financial statements and the reported performance. manage-ment bases its estimates and judgments on historical data and other assumptions and sources that are considered reasonable. Actual re-sults could differ from those estimates and judgments.
Jl has identified the following significant accounting estimates and judgments used in the preparation of its consolidated financial state-ments.
criticaL accounting eStimateS anD JuDgmentSEstimated useful life and scrap value of vessels: the estimated useful life and residual value of vessels are assessed annually and adjusted if appropriate. the residual value is based on estimates on steel value less costs to scrap. estimated useful life of vessels is 25 years and the useful life of dry dockings range from 30 to 60 months.
there have been no signicant impact on profit/loss arising from chang-es in estimated useful life or residual value in 2011 or 2012.
Impairment test of non-current assets and charter commitments:the impairment test is carried out on the lowest level for which there are separately identifiable cash inflows (cash generating units, Cgu). the Cgus are identical with the reportable segments of Jl with the exception of lauritzen bulkers which are divided into two Cgus – large bulk carriers and small bulk carriers. the Cgus applied in the impair-ment test for 2012 are identical to those applied for 2011.
the material non-current assets included in the Cgus consist of ves-sels, vessels under construction and investment in joint ventures and associates (part owned vessels). Also charter commitments are includ-ed in the Cgus. Assets which are held for sale are not included in any Cgus, but are measured at the lower of the carrying amount and fair value less costs to sell.
Irrespective of indications of impairment the carrying amounts of non-current assets and charter commitments related to the Cgus are tested for impairment minimum annually.
Write-down of non-current assets are only applicable if the aggregat-ed carrying amount of all non-current assets in the Cgu is higher than calculated value in use and fair value less cost to sell.
Fair value less costs to sell is estimated by use of independent broker valuations and value in use is calculated as present value of future cash flows to be derived from the vessels and other non-current assets during their useful life.the key assumptions in the impairment test includes estimated future
earnings (including charter income, CoAs and estimated spot rates for open ship days), operating costs, counterparty risk, the composition of Cgus and the rate used to discount future cash flows. Jl uses its risk adjusted weighted average cost of capital (real) of 7% (2011: 7%) as the discount rate.
Impairment losses of assets within a Cgu are allocated first to the carrying amount of any goodwill allocated to the Cgu and then, to the carrying amount of the other assets in the Cgu on a pro rata basis to the higher of fair value less cost to sell and value in use. If the total carrying amount of the assets in the Cgu still exceeds the value in use of the Cgu, provisions are made for onerous contracts. provisions are made to individual contracts, if net present value from an individual contract is negative.
the current difficult market conditions for bulk carriers and product tankers caused declining broker valuations and lower estimated future income and thus also values in use. the impairment test at the end of 2012 resulted in impairment loss totaling uSD 166.9m regarding bulk carriers (uSD 120.3m) and product tankers (uSD 46.6m). the write-downs were related to vessels in operation, vessels under construction and vessels owned by joint ventures.
the other Cgus did not show impairment as at 31 December 2012
Vessels and vessels under construction:the impairment test at the end of 2012 resulted in write-downs on ves-sels and on vessels under construction of uSD 148.7m in total (2011: uSD 0). the carrying amount of vessels and vessels under construc-tion is disclosed in note 9. Contractual commitments on newbuilding contracts are disclosed in note 23.
Vessels partly owned through investments in joint ventures and associ-ates:the impairment test at the end of 2012 resulted in write-downs on vessels partly owned through investments in joint ventures and associ-ates of uSD 18.2m (2011: uSD 0). the carrying amount of investments in joint ventures and associates is disclosed in note 10.
Write-downs on non-current assets are summarized in the table below.
imPairment Write-DoWnS anD reVerSaLS:
no write-downs or reversals in 2011.
USDmVessels and vessels under construction Joint ventures Total Write‐down Reversal
Write‐down Reversal
impairment loss, net
2012Lauritzen Bulkers 103.2 ‐ 17.1 ‐ 120.3 Lauritzen Tankers 45.5 ‐ 1.1 ‐ 46.6 Total Group 148.7 ‐ 18.2 ‐ 166.9

J. Lauritzen a/S · AnnuAl RepoRt 2012 71
criticaL accounting JuDgmentS in aPPLYing JL’S ac-counting PoLicieSLeases: the group enters into different contracts regarding chartering vessels in and chartering vessels out. the majority of these contacts can easily be categorized as either operational or financial leases. however, some contracts may require judgment as to the substance of the agreement in order to recognise and measure them in accor-dance with Jl’s accounting policies.
Joint operations: Categorising of joint operations as subsidiaries, as-sociates or joint ventures is based on managerial judgment.
methoDS for Determination of fair VaLueA number of the group’s accounting policies and disclosures require the determination of fair value. Fair value has been determined for measurement and/or disclosure purposes based on the following methods:
Vessels: Fair value, used as basis in the annual impairment testing, has been determined by at least two independent brokers.
Listed shares: For listed shares the fair value is determined as the stock exchange closing price at the balance sheet date.
Bonds: the fair value of investments in bonds is based on the closing price at the balance sheet date obtained directly from the market or from third parties. the fair value of bond related products where an ac-tive and liquid market does not exist, is obtained by using discounted cash flow techniques and observable market data prevailing at the balance sheet date.
Shares available for sale: Include unlisted shares for which valuation techniques are used to measure fair value. Changes in fair value are recognised in equity.
Derivatives: the fair values of derivative instruments are based on their listed market price, if available, or estimated using appropriate market rates prevailing at the balance sheet date.
Non-derivative financial liabilities and non-current receivables: the fair value is calculated based on the present value of future principal and interest cash flows, discounted at the market interest rate at the bal-ance sheet date.
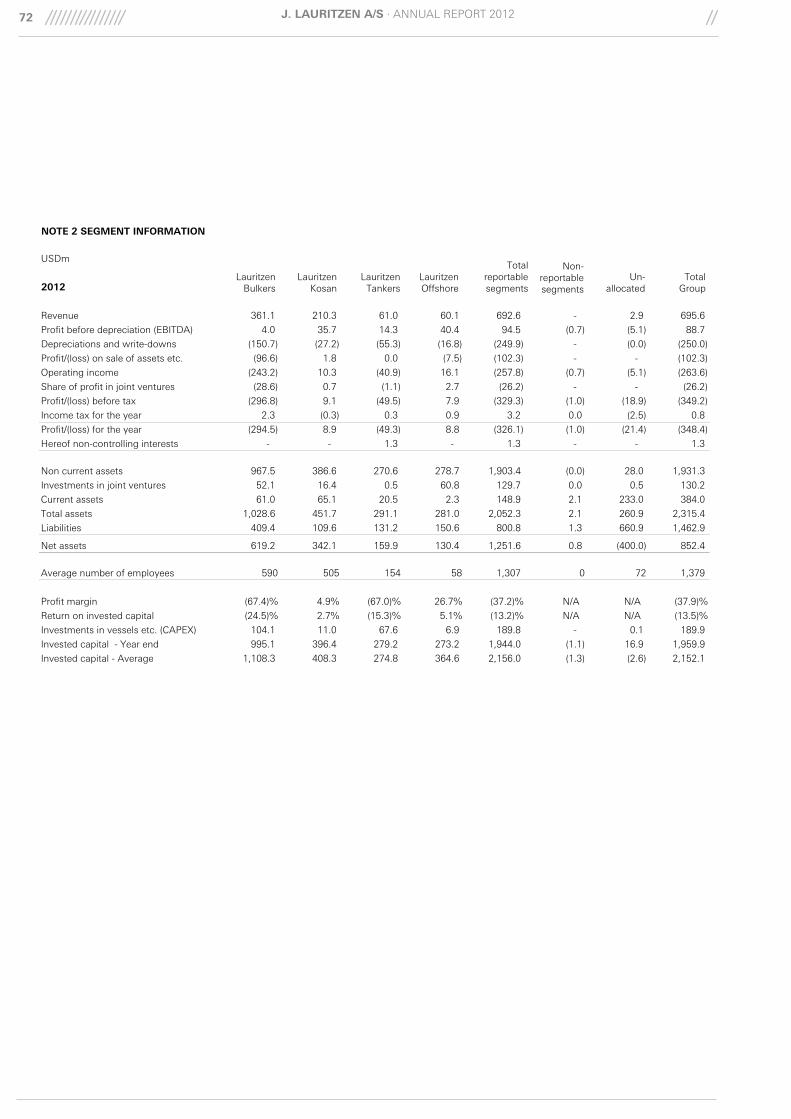
J. Lauritzen a/S · AnnuAl RepoRt 201272
NOTE 2 SEGMENT INFORMATION
USDm
2012
Revenue 361.1 210.3 61.0 60.1 692.6 - 2.9 695.6
Profit before depreciation (EBITDA) 4.0 35.7 14.3 40.4 94.5 (0.7) (5.1) 88.7
Depreciations and write-downs (150.7) (27.2) (55.3) (16.8) (249.9) - (0.0) (250.0)
Profit/(loss) on sale of assets etc. (96.6) 1.8 0.0 (7.5) (102.3) - - (102.3)
Operating income (243.2) 10.3 (40.9) 16.1 (257.8) (0.7) (5.1) (263.6)
Share of profit in joint ventures (28.6) 0.7 (1.1) 2.7 (26.2) - - (26.2)
Profit/(loss) before tax (296.8) 9.1 (49.5) 7.9 (329.3) (1.0) (18.9) (349.2)
Income tax for the year 2.3 (0.3) 0.3 0.9 3.2 0.0 (2.5) 0.8
Profit/(loss) for the year (294.5) 8.9 (49.3) 8.8 (326.1) (1.0) (21.4) (348.4)
Hereof non-controlling interests - - 1.3 - 1.3 - - 1.3
Non current assets 967.5 386.6 270.6 278.7 1,903.4 (0.0) 28.0 1,931.3
Investments in joint ventures 52.1 16.4 0.5 60.8 129.7 0.0 0.5 130.2
Current assets 61.0 65.1 20.5 2.3 148.9 2.1 233.0 384.0
Total assets 1,028.6 451.7 291.1 281.0 2,052.3 2.1 260.9 2,315.4
Liabilities 409.4 109.6 131.2 150.6 800.8 1.3 660.9 1,462.9
Net assets 619.2 342.1 159.9 130.4 1,251.6 0.8 (400.0) 852.4
Average number of employees 590 505 154 58 1,307 0 72 1,379
Profit margin (67.4)% 4.9% (67.0)% 26.7% (37.2)% N/A N/A (37.9)%
Return on invested capital (24.5)% 2.7% (15.3)% 5.1% (13.2)% N/A N/A (13.5)%
Investments in vessels etc. (CAPEX) 104.1 11.0 67.6 6.9 189.8 - 0.1 189.9
Invested capital - Year end 995.1 396.4 279.2 273.2 1,944.0 (1.1) 16.9 1,959.9
Invested capital - Average 1,108.3 408.3 274.8 364.6 2,156.0 (1.3) (2.6) 2,152.1
LauritzenBulkers
LauritzenKosan
LauritzenOffshore
LauritzenTankers
Total reportablesegments
Non-reportablesegments
Un-allocated
TotalGroup

J. Lauritzen a/S · AnnuAl RepoRt 2012 73
NOTE 2 SEGMENT INFORMATION (continued)
USDm
2011
Revenue 330.9 143.2 62.0 66.2 602.2 0.0 2.0 604.3
Profit before depreciation (EBITDA) 75.8 33.2 12.2 37.6 158.8 0.5 (13.2) 146.0
Depreciations and write-downs (37.9) (26.4) (6.3) (20.7) (91.2) 0.0 (0.0) (91.2)
Profit/(loss) on sale of assets (38.6) 2.3 0.0 0.0 (36.3) - - (36.3)
Operating income (0.7) 9.1 5.9 16.9 31.3 0.5 (13.2) 18.5
Share of profit in joint ventures 2.3 2.2 0.2 - 4.7 - - 4.7
Profit/(loss) before tax (16.8) 7.7 0.4 5.3 (3.5) 1.4 (43.8) (45.9)
Income tax for the year (7.9) (1.1) (2.2) (1.6) (12.8) (0.2) 14.9 1.9
Profit/(loss) for the year (24.7) 6.5 (1.8) 3.7 (16.3) 1.2 (28.9) (44.0)
Hereof non-controlling interests - - 2.2 - 2.2 - - 2.2
Non current assets 1,207.9 408.4 259.5 455.8 2,331.5 0.1 29.1 2,360.7
Investments in joint ventures 78.8 16.7 1.7 0.0 97.1 0.0 0.5 97.6
Current assets 86.7 35.3 90.0 47.1 259.0 6.3 55.9 321.2
Total assets 1,294.6 443.7 349.5 502.8 2,590.6 6.3 85.0 2,681.9
Liabilities 482.5 92.2 98.2 235.8 908.7 1.8 570.2 1,480.8
Net assets 812.1 351.4 251.3 267.0 1,681.9 4.5 (485.3) 1,201.1
Average number of employees 493 403 121 126 1,142 68 90 1,300
Profit margin (0.2)% 6.4% 9.6% 25.5% 5.2% N/A N/A 3.1%
Return on invested capital 0.1% 2.7% 2.7% 3.6% 1.6% N/A N/A 1.1%
Investments in vessels etc. (CAPEX) 299.6 27.2 87.6 23.7 438.1 - - 438.1
Invested capital - Year end 1,221.5 420.2 270.3 455.9 2,367.9 (1.4) (22.1) 2,344.4
Invested capital - Average 1,121.5 423.4 222.7 464.0 2,231.5 (2.4) (32.5) 2,196.6
LauritzenBulkers
LauritzenKosan
LauritzenOffshore
LauritzenTankers
Total reportablesegments
Non-reportablesegments
Un-allocated
TotalGroup
The reportable segments in the J. Lauritzen Group consist of the four business units Lauritzen Bulkers (bulk carriers), Lauritzen Kosan (gas
carriers), Lauritzen Tankers (product tankers) and Lauritzen Offshore (ASV and shuttle tankers). The four reportable segments are
identical with how the J. Lauritzen Group is organized around the different services in the four segments. Each business unit is operated
independently from the other business units, as each business unit services different customers and employs different types of vessels.
The revenue reported represents revenue from external customers. There are no inter-segment sales in 2012 or 2011.
The accounting policies of the reportable segments are the same as the Group's accounting policies described in note 26. Unallocated income
and expenses include group administration costs, finance costs and corporate services not allocated to the business units. Non-reportable
operating segments include non-material activities. Unallocated assets and liabilities include mainly financial assets and financial liabilities not
allocated to reportable segments. No vessels in any segment is limited to specific geographical area of the world and JL considers the global
market as a whole hence no geographical information is relevant or available.
No customer information is given as J. Lauritzen is not reliant on any single major customer.

J. Lauritzen a/S · AnnuAl RepoRt 201274
NOTE 3 STAFF COSTS, OFFICE & FLEET
USD '000 2012 2011
Staff costs include:Wages and salaries 94,835 91,506 Pensions (defined contribution plan) 3,006 3,603 Social security 653 1,223 Contract labour 97 344
98,591 96,676
Remuneration to J. Lauritzen A/S'Exec. Mngt - salaries 3,372 3,541 Exec. Mngt - long term employment bonus 121 131 Board of Directors 548 625
4,041 4,297
Average number of employees 1,379 1,300
Number of employees at year-end 1,341 1,384
Management and a number of executives are members of a bonus and/or severance scheme.
NOTE 8 TAX
USD '000 2012 2011
Certain group companies are jointly taxed with subsidiaries to the commercial foundation Lauritzen Fonden.
Tax in the Income Statement consist of:Current tax 2,771 1,959 Deferred tax (1,988) (33)
Income tax 783 1,926
Effective tax percent 0% 4%
Deferred tax on the Balance Sheet:Deferred tax 1 January 2,707 2,747 Translation adj. in foreign operations (65) (7) Tax on profit (1,988) (33)
Deferred tax 31 December 655 2,707
Deferred tax concerns:Taxable losses carried forward 655 2,707
655 2,707
Deferred tax, assets 655 2,707
655 2,707
Corporate tax (receivable)/payable can be specified as follows:Balance 1 January (833) 5,864 Exchange rate adjustments (31) 482 Paid during the year 2,517 (5,220) Provision for the year (2,771) (1,959)
(1,117) (833)
In 2005 the Danish based companies entered the Danish tonnagetaxation system, the adoption of which is binding until at least 2014.JL does not expect to leave the system and therefore no deferred taxprovision is made on the assets or liabilities effected by the Danishtonnage taxation system. If, however, JL should leave the Danishtonnage taxation system there could be a deferred tax liability of up toa maximum of USD 10m. In excess of deferred tax assets recognisedas specified above, the group have deductible unused tax losses ofUSD 42m at year-end 2012.
NOTE 4 OTHER SALES & ADMINISTRATIVE COSTS
USD '000 2012 2011
Total fees to elected auditors 588 1,016
Specified as follows:Statutory audit 529 567 Tax advisory services 36 29 Fee for other services 23 420
NOTE 5 DEPRECIATIONS & WRITE-DOWNS
USD '000 2012 2011
Vessels (222,630) (88,923) Vessels under construction (24,681) - Land and buildings (126) (89) Machinery and equipment (2,521) (2,229)
(249,958) (91,241)
NOTE 6 FINANCIAL INCOME
USD '000 2012 2011
Interest income, bank deposits 1,781 4,135 Other interest income 1,153 709 Currency exchange gains and losses, net 10,269 - Dividends received on shares available for sale 495 - Interest on financial instr. at FV through P&L 52 4 Firm commitments under FV hedge accounting 2,147 (1,213) Derivatives, FV hedge of firm commitments (2,147) 1,213
Financial income 13,749 4,848
NOTE 7 FINANCIAL EXPENSES
USD '000 2012 2011
Interest expenses on loans (65,845) (64,149) Other financial expenses (2,363) (5,618) Currency exchange gains and losses, net - (1,943) Financial instruments at FV through P&L, net (4,992) (2,304) Financial expenses (73,201) (74,014)
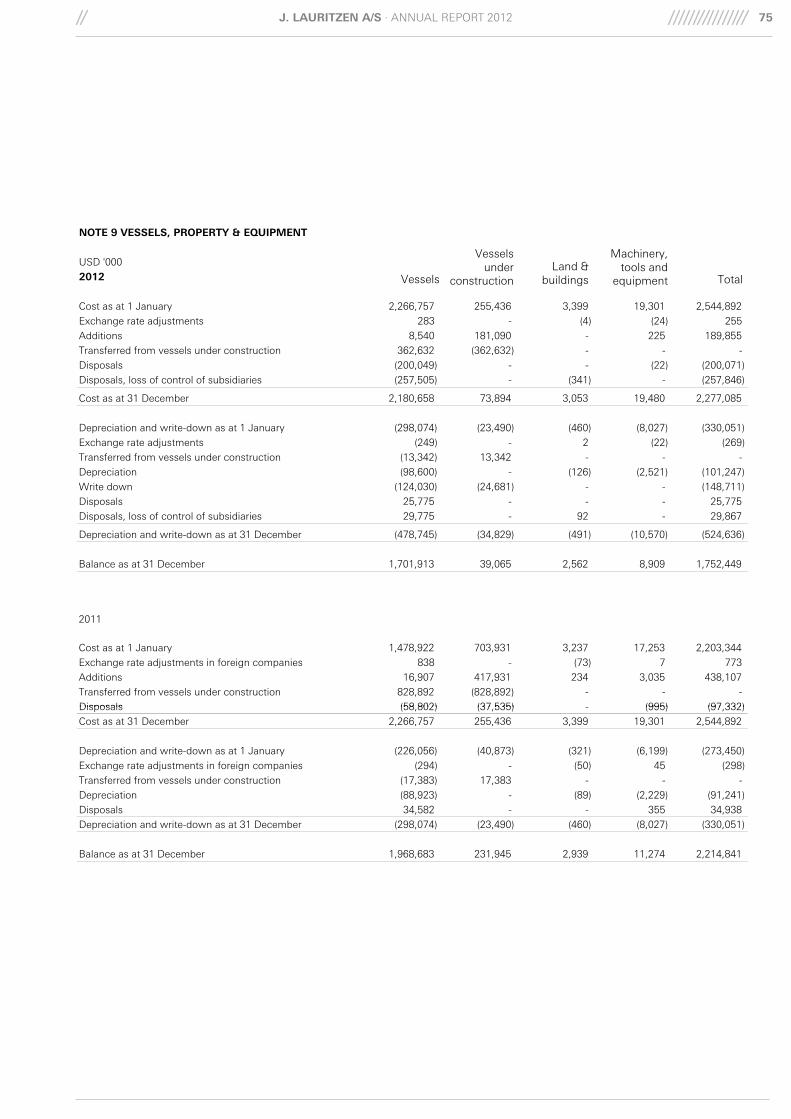
J. Lauritzen a/S · AnnuAl RepoRt 2012 75
NOTE 9 VESSELS, PROPERTY & EQUIPMENT
USD '000
2012
Cost as at 1 January 2,266,757 255,436 3,399 19,301 2,544,892
Exchange rate adjustments 283 - (4) (24) 255
Additions 8,540 181,090 - 225 189,855
Transferred from vessels under construction 362,632 (362,632) - - -
Disposals (200,049) - - (22) (200,071)
Disposals, loss of control of subsidiaries (257,505) - (341) - (257,846)
Cost as at 31 December 2,180,658 73,894 3,053 19,480 2,277,085
Depreciation and write-down as at 1 January (298,074) (23,490) (460) (8,027) (330,051)
Exchange rate adjustments (249) - 2 (22) (269)
Transferred from vessels under construction (13,342) 13,342 - - -
Depreciation (98,600) - (126) (2,521) (101,247)
Write down (124,030) (24,681) - - (148,711)
Disposals 25,775 - - - 25,775
Disposals, loss of control of subsidiaries 29,775 - 92 - 29,867
Depreciation and write-down as at 31 December (478,745) (34,829) (491) (10,570) (524,636)
Balance as at 31 December 1,701,913 39,065 2,562 8,909 1,752,449
2011
Cost as at 1 January 1,478,922 703,931 3,237 17,253 2,203,344
Exchange rate adjustments in foreign companies 838 - (73) 7 773
Additions 16,907 417,931 234 3,035 438,107
Transferred from vessels under construction 828,892 (828,892) - - - Disposals (58 802) (37 535) - (995) (97 332)
Vessels
Vessels under
constructionLand &
buildings
Machinery,tools and
equipment Total
Disposals (58,802) (37,535) - (995) (97,332)
Cost as at 31 December 2,266,757 255,436 3,399 19,301 2,544,892
Depreciation and write-down as at 1 January (226,056) (40,873) (321) (6,199) (273,450)
Exchange rate adjustments in foreign companies (294) - (50) 45 (298)
Transferred from vessels under construction (17,383) 17,383 - - -
Depreciation (88,923) - (89) (2,229) (91,241)
Disposals 34,582 - - 355 34,938
Depreciation and write-down as at 31 December (298,074) (23,490) (460) (8,027) (330,051)
Balance as at 31 December 1,968,683 231,945 2,939 11,274 2,214,841

J. Lauritzen a/S · AnnuAl RepoRt 201276
NOTE 10 INVESTMENTS IN JOINT VENTURES
USD'000 2012 2011
Cost as at 1 January 68,682 82,144 Additions during the year 65,055 1,854 Capital reduction - (15,071) Disposal during the year (3,158) (245)
Cost as at 31 December 130,579 68,682
Revaluation as at 1 January 49,224 50,618 Exchange rate adjustments (16) 9 Dividends received (5,600) (6,106) Revaluations during the year (26,203) 4,708 Disposal during the year 3,505 (6)
Revaluation as at 31 December 20,911 49,224
Write-down as at 1 January (21,243) (21,243)
Write-down as at 31 December (21,243) (21,243)
Balance as at 31 December 130,247 96,663
Key figures for joint ventures, in total: 2012 2011
Revenue 135,720 137,338 Net profit (22,045) 23,314 Assets 805,132 665,922 Liabilities 449,365 368,124
Group's share of net profit (30,071) 4,313 Internal profit/loss 3,868 395 Net profit in joint ventures (26,203) 4,708 Hereof associated companies amount to 40 (28)
Group's share of equity 133,178 104,123 Internal profit/loss (2,931) (7,460)
130,247 96,663 Negative equity set off against receivables - 956 Provision for negative equity - - Investments in joint ventures 130,247 97,619 Hereof associated companies amount to 186 162
NOTE 11 OTHER RECEIVABLES
USD '000 2012 2011
Specification of other receivablesFinancial derivatives (refer to note 16) 11,000 793 Bank deposits pledged as security for debt 34,180 11,859 Other short-term receivables 28,857 16,948 Total other receivables 74,037 29,600
Compared to annual report 2011 bank deposits pledged as securityfor debt of USD 11.9m has been reclassified from cash at hand andin bank to other receivables.
NOTE 13 EQUITY
The authorized and issued share capital of J. Lauritzen A/S has remained unchanged at DKK 430m in 2012 with 29 shares of DKK 50,000 or multiples of this.
Capital management
The general guidelines on capital approved by the Board of Directors include minimum solvency ratio of 35-40% for the Group.
JL pursues a prudent dividend policy that secures the necessary liquidity and supports JL’s ability to grow its business organically.
At the end of 2011 and 2012 no proposed dividends were included in retained earnings.
NOTE 14 PROVISIONS
USD '000 2012 2011
Provisions as at 1 January 1,037 5,772 Used during the year (920) (4,456) Reversal of provisions during the year (99) (278)
Provisions as at 31 December 18 1,037 Hereof:Non current liabilities - - Current liabilities 18 1,037
Provisions as at 31 December 18 1,037
NOTE 12 PREPAYMENTS
Prepayments include USD 5.6m (2011: USD 11.2m) related to a bulk carrier charter agreement with a remaining maturity of more than 1 year of which USD 0.2m (2011: USD 5.6m) relates to charter periods later than 2013.

J. Lauritzen a/S · AnnuAl RepoRt 2012 77
NOTE 15 LONG-TERM BORROWINGS
USD '000 <1 year 1 - 5 year > 5 year Total <1 year 1 - 5 year > 5 year Total
Mortgage on vessels *) (89,678) (703,554) (207,479) (1,000,712) (83,240) (702,338) (323,190) (1,108,768)
Subordinated loan **) - (159,582) - (159,582) - (166,796) - (166,796)
Issued bonds *) - (212,536) - (212,536) - (116,287) - (116,287) Other debt (709) (1,558) - (2,267) - (2,233) - (2,233)
Total long-term borrowings (90,387) (1,077,230) (207,479) (1,375,096) (83,240) (987,653) (323,190) (1,394,083)
Fair value of long-term borrowings (1,380,965) (1,395,310)
*) Please refer to pp 42-45 for description of financial covenants.
**) The loan is granted from LF Investment ApS and is subordinated to all other debts, liabilities and obligations.
USD '000 CurrencyFixed/
VariableInterest rate
fixation
Average effective
interest rate, excl. hedging
Average effective
interest rate incl. hedging Book value
2012Mortgage on vessels USD Variable 3-6 month 2.30% 3.46% (914,633)
Mortgage on vessels JPY Variable 6 month 2.41% 2.74% (86,078)
Subordinated loan DKK Variable 12 month 4.16% 4.16% (159,582)
Issued bonds NOK Fix./Var. 3-5 years 10.35% 9.24% (212,536)
Other debt DKK Fixed 2-3 years 4.73% 4.73% (2,267)
Total 3.70% 4.38% (1,375,096)
2011
Mortgage on vessels USD Variable 3-6 month 2.47% 3.40% (1,026,701)
Mortgage on vessels JPY Variable 6 month 2.40% 2.77% (82,067)
Subordinated loan DKK Variable 12 month 4.43% 4.43% (166,796)
Issued bonds NOK Fixed 4 years 10.50% 9.85% (116,287)
Other debt DKK Fixed 3-4 year 4.73% 4.73% (2,233)
Total 3.20% 3.96% (1,394,083)
Currency exposure on non-USD long-term borrowings, net of hedging:
USD '000 Book value
Currency hedging
derivaties Bank
deposits*)
Net currency exposure on
loan Book value
Currency hedging
derivaties Bank
deposits*)
Net currency exposure on
loan
JPY (86,078) 14,000 - (72,078) (82,067) - - (82,067)
DKK *) (161,849) - 148,614 (13,236) (169,028) - 152,811 (16,217)
NOK (212,536) 212,536 - - (116,287) 116,287 - -
Total (460,463) 226,536 148,614 (85,314) (367,382) 116,287 152,811 (98,284)
*) JL limits the currency risk by placing funds in DKK deposits.
Interest exposure on long-term borrowings to floating interest rates:
USD '000 2012 2011
Total long-term borrowings (1,375,096) (1,394,083)
Hereof fixed to maturity (128,027) (118,520)
Floating interest borrowings (1,247,069) (1,275,563)
Interest rate swaps floating to fixed at year end, nominal 679,235 534,120
Exposure to floating interest rates at year end (567,834) (741,443)
2012 2011
2012 2011

J. Lauritzen a/S · AnnuAl RepoRt 201278
note 16 financiaL inStrumentS anD financiaL riSKS
Jl is through its operation, investment and financing exposed to cer-tain financial risks. the financial risks relate to and defined as such:
Financial risks are regularly assessed and prioritized based on how likely they are to occur and their potential impact. As defined by Jl’s board of Directors, overall policies and objectives for financial risks were generally unchanged from 2011.
LiQuiDitY riSKthe purpose of managing liquidity risk is to ensure sufficient capital for day-to-day operations and financial commitments also in distressed situations. Cash requirements are regularly assessed in various sce-narios and stress tested.
liquidity is continuously monitored and assessed based on forecasts for the current year and years to come, outstanding capital expendi-ture, proceeds from committed and expected credit facilities and fu-ture liabilities from existing and expected future credit facilities. this is done to ensure liquidity is adequate at all times.
the general guidelines on liquidity approved by the board of Directors
include minimum liquidity and requirement for external funding to be drawn on or post delivery of vessels.
At year-end 2012 Jl’s cash and cash equivalents amounted to uSD 267m and besides having an unsecured overdraft facility of DKK 100m for multi-currency short-term financing needs at the group’s disposal, Jl had unused and committed credit facilities totaling uSD 64.0m. these funds are to cover future commitments on newbuildings to be mortgaged post delivery. please refer to note 23 for contractual com-mitments. Jl faces no risk related to refinancing until August 2014 where a minor facility matures. Remaining facilities have maturity dates from 2015 until 2023.
Jl’s loan portfolio consists of traditional mortgage-backed ship finance (approx. 51% of total facilities), eCA (export Credit Agency) backed agreements (approx. 22% of total facilities) as well as unsecured (non-mortgage) corporate bonds and a subordinated loan (approx. 27% of total facilities). According to Jl’s Financial Strategy no financial coun-terparty may account for more than 25% of total loan facilities.
With some banks, Jl has agreed to make margin payments if some predefined financial limits in loan agreements are met. At year-end 2012, Jl has made additional security available for three financial insti-tutions in the form of cash in order to counteract any potential breach of minimum value clauses in the existing credit facility (cf. note 20). there have been no breaches of credit facilities (cf. note 15).
below is a maturity analysis of Jl’s financial liabilities at year-end 2012. A maturity analysis of operational lease obligations is included in note 22.
USD '000
2012
Non-derivative financial instruments:Mortgage on vessels, bank debt and other interest-bearing debt *) (1,375,096) (1,575,328) (145,553) (1,204,341) (225,433) Trade and other payables (49,335) (49,335) (49,335) - -Derivatives, liabilities at fair value:Forward exchange contracts (1,143) (1,143) (1,143) - -Interest rate and currency swaps (36,600) (36,600) (11,014) (23,667) (1,919) FFA’s and oil contracts (385) (385) (385) - -Total at 31 December 2012 (1,462,560) (1,662,791) (207,431) (1,228,008) (227,352)
2011
Non-derivative financial instruments:Mortgage on vessels, bank debt and other interest bearing debt *) (1,394,083) (1,661,640) (143,875) (1,171,649) (346,116) Trade payable and other payables (42,572) (26,538) (26,538) - -Derivative, liabilities at fair value:Forward exchange contracts (1,727) (1,727) (1,727) - -Interest rate and currency swaps (39,740) (39,740) (9,888) (25,843) (4,009) FFA’s (155) (155) (155) - -Total at 31 December 2011 (1,478,277) (1,729,800) (182,183) (1,197,492) (350,125)
Carrying amount
Contractual cash flows <1 year 1-5 years >5 years
*) Contractual cash flows include undiscounted interest payments based on interest levels at year end
liquidity Risk
market Risk
Credit Risk
the risk that Jl is able to meet its future cash flow needs
the risk of losses in financial positions arising from movements in market prices to which Jl is exposed
the risk of incurring a financial loss if a customer or counterparty fails to fulfill its contractual obligations

J. Lauritzen a/S · AnnuAl RepoRt 2012 79
marKet riSKSmarket risks are the risk of losses in financial positions arising from movements in market prices to which Jl is exposed to through finan-cial instruments. market risks are regularly assessed and prioritized based on how likely they are to occur and their potential impact. based on this assessment the following market risks are considered signifi-cant for Jl:
to a minor extent Jl is exposed to other marked risks that are con-sidered less significant. these include risks on financial instruments related to share prices, oil prices and freight rates (FFA). Jl use deriva-tives to hedge oil and freight rates in a small scope. the fair value of these instruments is disclosed in the table “Derivative financial instru-ments”.
below is a description of how Jl manages the significant market risks and sensitivity analysis of the exposure. Sensitivity information is calculated at balance sheet date and com-prises only sensitivity relating to financial instruments, so the amounts disclosed do not necessarily give a complete picture of Jl’s risks relat-ing to the different categories of risk.
Currency riskJl’s operating and reporting currency is uSD and thus all amounts are recorded and reported in uSD. matching income and expenses and assets and liabilities minimises the net currency risk, leaving net posi-tions to be focused on.
Jl’s policy is to use derivative instruments to hedge the currency risks relating to net non-uSD cash flows from operating activities, invest-ments and financing. the general hedging policy is approved by the board of Directors.
the hedging strategy for operating costs is based on estimated annual net non-uSD cash flows, i.e. 12 month rolling cash flow. Jl’s policy is to use forward currency contracts to provide cover for at least 25% or
the equivalent of three months forward. Jl may hedge up to 100% net 12 month rolling non-uSD operational cash flow to secure minimum budget exchange rates. hedge accounting is not applied to forward contracts relating to future costs in non-uSD currencies.
the hedging strategy for non-uSD cash flows for investments in ship newbuildings is based on the total portfolio of outstanding capital ex-penditure payable in 2013. Jl’s policy is to hedge non-uSD payments on vessels when the exchange rate is viewed as advantageous with a minimum predefined target level at payment due date. Jl uses hedge accounting (fair value hedge) for the derivatives associated with firm commitments for vessels under construction.
According to the hedging strategy for non-uSD long-term borrowings, Jpy may be hedged up to 100% if the forward rate is viewed advan-tageous. Regarding the DKK subordinated loans Jl aims to limit the currency risk by placing funds in DKK deposits. Regarding the bond issue denominated in noK the full amount was swapped to uSD on the dates of issue. Cash flow hedge accounting applies for the uSD/noK swap.
please refer to note 15 for further disclosure of Jl’s currency exposure of long-term borrowings and hedging hereof.
Sensitivity of currency riskto measure currency risk in accordance with IFRS 7, sensitivity is cal-culated as the change in fair value of future cash flows from financial instruments as a result of fluctuations in exchange rates on balance sheet date. Sensitivity to fluctuations in non-uSD currencies at bal-ance sheet date is based (other things being equal and after tax) on a 10% decrease in currency translation rates against uSD (assum-ing 100% effectiveness) would result in a net profit/loss of uSD 5.0m (2011: 4.6m) and affect equity by uSD 2.5m (2011: 2.2m). the effect of a 10% increase in the currency translation rates against uSD would have a corresponding inverse effect.
Interest rate riskJl’s policy is to hedge risks associated with changes in interest rates to limit the negative financial effects of adverse changes in interest rates by converting variable interest rates to fixed interest rates. net interest rate risk may be hedged via forward rate agreements, interest rate swaps and related instruments if assessed as advantageous. the general hedging policy is approved by the board of Directors.
Jl uses cash flow hedge accounting in respect of interest rate deriva-tives. these are recycled in the income statement over the term of the hedged loans. please refer to note 15 for disclosure of Jl’s exposure to floating interest rates at balance sheet date.
Sensitivity of interest rate riskSensitivity of interest fluctuations is calculated as the hypothetic effect on net profit and equity as a result of fluctuations in interest rates at balance sheet date.
the sensitivity analysis includes financial instruments recognized at fair value for which the calculated effect on equity represents an im-mediate fair value change from a thought change in interest rates and
Currency risk - operational cash flow
Currency risk from operations is related non-uSD costs where DKK expenses
are the largest contributor.
Currency risk - Investments
Relates to the risk of contractual commitments in non-uSD. At year end Jl
had a commitment on newbuildings in Jpy equivalent of uSD 32m.
Currency risk - Financing
Relates to long-term borrowing in non-uSD. Jl had at year-end long-term
borrowings denominated in noK, DKK and Jpy, ref note 15..
Interest rates risk - long-term borrowings
41% of Jl’s long-term borrowings are exposed to floating interest rate.

J. Lauritzen a/S · AnnuAl RepoRt 201280
financial instruments with variable interest recognized at amortized costs for which the calculated effect represents a one year effect on net profit and equity based on balances at year end.
Assumptions for the sensitivity analysis:All hedging instruments assumed 100% effectiveChanges in interest rates are global and thus the impact on the fair value of forward currency contracts and similar derivatives is not con-sideredShares available for sale and shares at fair value through profit or loss are not included in sensitivity calculations due to inability to reliably measure the sensitivity of share prices to interest rate changes.
on financial instruments at fair value the calculated effect after tax based on a 1% decrease in interest rates would affect profit/loss by uSD (6.8)m (2011: (5.3)m) and equity by uSD (11.9)m (2011: uSD (20.8)m). on financial instruments with variable interest recognized at amortized costs profit/loss and equity would be effect by uSD 9.8m (2011: 9.0m).
A 1% increase in interest rates would have a corresponding inverse effect.
creDit riSKCredit risk is the risk of incurring a financial loss if a customer or coun-terparty fails to fulfill its contractual obligations.
Jl assesses customers for creditworthiness based on historical trading and payment records, input from rating agencies as well as industry knowledge and customer reputation. Further, customers and counter-parties are accepted only when fulfilling general requirements. In cer-tain cases contracts are guaranteed by parent companies or similar.
Very large contracts and very long-term commitments are reviewed and approved by the executive management and in some cases by the board of Directors.
the risks relating to financial counterparties, financial instruments, bonds and cash funds are minimized by trading only with financial institutions with a long-term investment grade credit rating from moody’s and by defined limits on deposits on each financial partner.
In 2012 a provision of uSD 0.2m were made for losses on trade receiv-ables (2011: uSD 0m). At year-end 2012, Jl did not have any further overdue trade receivables (2011: uSD 0m).
At year-end 2012, all of our financial counterparties had credit ratings of or above baa2.
Jl’s exposure to credit risks at balance sheet date can be illustrated as follows:
USD ‘000 2012 2011
Other long-term receivables 21,985 20,746 Trade receivables 5,250 18,706 Financial derivatives 11,000 793 Other short-term receivables 28,857 16,948 Cash and bank deposits 267,000 234,132 Maximum credit risk 334,092 291,325
the maximum credit risk corresponds to the carrying value of the in-dividual assets.
Additionally, Jl has non-monetary receivables relating to payments on vessel under construction. Risks relating to payments on vessels un-der construction are in general limited by agreements such as refund guarantees.
DeriVatiVe financiaL inStrumentSJl’s policy is to use derivative financial instruments to hedge financial risks. At year end Jl held the following derivatives:
USD mCash flow /Fair value hedge
Nominal, USDm
Duration, month
Recognised on equity Fair value
Nominal, USDm
Duration, month
Recognised on equity Fair value
Hedge accouning applied:Currency: USD/JPY Fair value 32.1 0-12 - (0.3) 34.3 0-12 - 0.6 Currency: USD/NOK Cash flow 212.5 29-58 (0.6) 8.5 116.3 41 (3.8) (5.8) Interest rate swaps Cash flow 542.0 21-131 (31.6) (31.6) 534.1 33-139 (30.3) (30.3) Terminated interest rate swap Cash flow N/A N/A 0.6 N/A N/A N/A 0.7 N/ATotal (31.7) (23.4) (33.4) (35.6)
Hedge accouning not applied:Currency: USD/NOK N/A (2.1) 0-1 - (0.2) (2.1) 0-1 - 0.0 Currency: USD/EUR N/A 7.5 0-2 - 0.4 - - - - Currency: USD/DKK N/A 27.0 0-1 - 0.7 31.0 0-1 - (1.3) Currency: USD/JPY N/A 2.8 0-1 - 0.2 (2.0) 0-1 - (0.4) FFA's and oil contracts N/A N/A N/A - 0.2 N/A N/A - (0.2) Interest indexswap N/A 38.2 39 - (5.0) 38.2 51 - (2.2) Total - (3.7) - (4.1)
Total derivative financial instruments (27.1) (39.7) Presented in the financial statement as:Other receivables 11.0 0.7 Other payables (38.1) (40.4)
2012 2011

J. Lauritzen a/S · AnnuAl RepoRt 2012 81
categorieS of financiaL aSSetS anD LiaBiLitieSthe following categories of financial assets and liabilities are recog-nized in the balance sheet:
Fair value hierarchy With the exception of listed bonds and shares of uSD 0.2m (2011: uSD 2.1m) (level 1) and shares available for sale of uSD 26.0m (2011: uSD 24.8m) (level 3), all financial instruments are stated at fair value on the basis of observable market prices (level 2), directly as prices or indirectly derived from prices.
In 2012 fair value adjustment of level 3 financial instruments amount-ed to uSD 0.8m recognised in other comprehensive income (2011: 21.2m). the fair value adjustment relate to unlisted shares for which a valuation technique has been used to determine fair value. material inputs in the valuation comprise equity value and expected Roe com-pared to Jl’s return requirements. Financial instruments categorized at level 3 have developed as follows:
USD ‘000 2012 2011
Fin. assets at FV through P/L *) 11,157 2,896
Loans and receivables**) 357,272 302,391
Fin. assets available for sale **) 26,010 24,788
Fin. liabilities - at FV through P/L *) (38,128) (41,622)
Fin. liabilities - at amortized cost**) (1,424,432) (1,436,655)
*) Figure includes financial derivatives designated for hedge accounting
**) Amounts recognized for financial asset and liabilities at amortized cost do not
differ materially from their fair value with the exception of issued bonds. Fair value
of issued bonds amount to USD 218.4m whereas the carrying amount totalled
USD 212.5m.
USD ‘000 2012 2011
Book value at 1 January 24,788 3,279 Purchase during the year 404 264 Sale during the year - - Fair value adjustment 818 21,245 Book value at 31 December 26,010 24,788
NOTE 17 ADJUSTMENTS TO CASH FLOW
USD '000 2012 2011
(Profit)/loss on sale of vessels 94,801 36,251 (Profit)/loss on sale of subsidiaries 7,545 - (Profit)/loss on sale of other assets 11 (3) Changes in provisions (1,019) (4,734) Other adjustments - (35,963)
101,337 (4,449)
NOTE 18 CHANGE IN WORKING CAPITAL
USD '000 2012 2011
Change in stocks (5,543) (8,082) Change in receivables 991 59,212 Change in payables 8,458 (16,136)
3,906 34,994
NOTE 19 Sale of controlling interest in subsidiaries
On 30 June 2012 JL has formed a 50/50 joint venture withHitechVision on JL's offshore accomodation business through ashare subscription agreement. JL contributed to the JV with theshareholdings in Dan Swift Singapore Pte. Ltd. and subsidiarieshereto whereas HitecVision contributed with cash. In forming the jointventure JL divested its subsidiaries related to the offshoreaccomodation business and instead acquired an investment in thenew joint venture Axis Offshore. Below is a specification of bookvalue of derecognised assets and liabilities of the divestedsubsidiaries:
USD '000As at June
30 2012 Vessels, property and equipment 227,979 Mortgage on vessels (133,891) Other receivables 1,180 Prepayments and other payables (3,923) Cash and cash equivalents 9,940 Total net assets in divested subsidiaries 101,285
Total consideration, net of transaction costs*) 93,741 Hereof cash and cash equivalent (9,940) Net cash from sale of controlling interest 83,801 Acquisition of share of joint venture, Axis Offshore (47,245) Net cash received by JL 36,555
Profit/(loss) on sale of subsidiaries:Total net assets in divested subsidiaries (101,285) Total consideration, net of transaction costs*) 93,741 Profit/loss on sale of subsidiaries (7,545)
*) Transaction cost of USD 0.8m recognised in profit/loss on sale ofsubsidiaries
NOTE 20 MORTGAGES
USD '000 2012 2011
Debt for a total of 1,000,712 1,108,768has been secured by mortgage in assetsat the following book values:Vessels 1,690,497 1,951,302Cash and cash equivalents 34,180 11,859
1,724,677 1,963,161
NOTE 21 CONTINGENT LIABILITIES
USDm 2012 2011
Guarantees undertaken for debt in joint ventures 158 17 Max. obligation to pay in capital into joint ventures 80 45 Guarantees regarding newbuildings - 15
Certain claims have been raised against JL. The judgment of themanagement is that the outcome of these claims will not have anymaterial impact on JL's financial position.
JL has issued certain guarantees in connection with the sale of assets.
noteS 19 SaLe of controLLing intereSt in SuBSiDiarieS
on 30 June 2012 Jl has formed a 50/50 joint venture with hitechVi-sion on Jl's offshore accommodation business through a share sub-scription agreement. Jl contributed to the JV with the shareholdings in Dan Swift Singapore pte. ltd. and subsidiaries hereto whereas hitecVision contributed with cash. In forming the joint venture Jl di-vested its subsidiaries related to the offshore accommodation busi-ness and instead acquired an investment in the new joint venture Axis offshore. below is a specification of book value of derecognised as-sets and liabilities of the divested subsidiaries:

J. Lauritzen a/S · AnnuAl RepoRt 201282
NOTE 22 OPERATING LEASES OF VESSELS
At the balance sheet date JL has the following contractually committed charter income from time charter and bareboat contracts:
USDm
2012 Bulkers Kosan Offshore Tankers Total0 - 1 Year 65.3 38.2 35.2 20.0 158.7 1 - 5 Year 225.3 14.9 90.1 19.9 350.2 > 5 Year 298.4 0.1 115.8 - 414.3
Total 589.0 53.2 241.1 39.9 923.3 Number of vessels chartered out: 8 15 3 5 31
2011 Bulkers Kosan Offshore Tankers Total0 - 1 Year 121.0 21.4 80.7 27.9 251.0 1 - 5 Year 301.5 7.7 266.2 34.0 609.3 > 5 Year 368.4 - 136.0 0.3 504.7
Total 790.9 29.0 483.0 62.2 1,365.0 Number of vessels chartered out: 16 7 4 8 35
At the balance sheet date JL has the following operational lease liabilities:
USDm
2012 Bulkers Kosan Offshore Tankers Total0 - 1 Year 187.2 14.5 - 28.7 230.4 1 - 5 Year 256.0 9.9 - 53.7 319.6 > 5 Year 116.1 - - - 116.1
Total 559.4 24.4 - 82.4 666.2 Number of vessels chartered in 43 9 - 7 59 Herof included chartered vessels where: JL has purchase option 9 - - - 9 JL has option to extend 6 3 - - 9
2011 Bulkers Kosan Offshore Tankers Total0 - 1 Year 215.3 10.9 - 26.3 252.5 1 - 5 Year 333.3 7.6 - 35.7 376.7 > 5 Year 72.6 - - 0.3 72.9
Total 621.1 18.5 - 62.4 702.0 Number of vessels chartered in 50 8 - 8 66 Herof included chartered vessels where: JL has purchase option 7 - - - 7 JL has option to extend 8 - - - 8

J. Lauritzen a/S · AnnuAl RepoRt 2012 83
NOTE 23 CONTRACTUAL COMMITMENTS
JL has entered into newbuilding contracts with a remainingcontractual commitment of USD 103.9m. These contracts cover theconstruction of 1 bulk carrier and 3 product tankers due for delivery in2013.
NOTE 24 RELATED PARTIES
As owners of J. Lauritzen A/S the Lauritzen Foundation and itsaffilliated companies are related parties.
Other related parties with a significant influence of the activities of J.Lauritzen A/S is the company's Board of Directors and the ExecutiveManagement (key management personnel).
Finally, additional related parties comprise joint ventures (cf. note 10)in which J. Lauritzen has a significant influence. Subsidiaries andjoint ventures together with J. Lauritzen's shareholding are shown inthe overall group structure on page 102-103.
Transactions with related parties are conducted at arms lengthand have comprised the following income/(expenses):
USD '000 2012 2011
LF InvestmentManagement fee 173 219 Rental of office facilities (1,649) (2,136) Interest expenses on subordinated loan (6,888) (7,571)
Joint ventures and associated companiesManagement fee 2,846 3,765
There have been no other material transactions with related partiesother than those stated above.
Consideration to key management personnel is disclosed in note 3.
note 26 accounting PoLicieS
J. lauritzen A/S is a private limited company with domicile in Den-mark. the consolidated financial statements for the period 1 January – 31 December 2012 comprise J. lauritzen A/S and its subsidiaries (the group).
the consolidated financial statements have been prepared in accor-dance with International Financial Reporting Standards (IFRS) as ad-opted by the eu and additional Danish disclosure requirements for an-nual reports of reporting class D. In addition, the consolidated financial statements have been prepared in compliance with the International Financial Reporting Standards issued by the IASb.
change in accounting PoLicieS anD neW financiaL rePorting StanDarDSWith effective date 1 January 2012, Jl has adopted:
Amendments to IFRS 7 Disclosures – transfers of Financial AssetsAmendments to IFRS 1 Severe hyperinflation and Removal of Fixed Dates for First-time AdoptersAmendment to IAS 12 Deferred tax – Recovery of underlying Assets
none of these new IFRS’s and IFRIC’s has affected recognition or measurement in 2012.
BaSiS of PreParation the financial statements are presented in uS dollars, rounded to the nearest thousand.
the financial statements are prepared under the historical cost con-vention, except that the following assets and liabilities are stated at their fair value: derivative financial instruments, financial instruments held for trading and financial instruments available for sale.
non-current assets and disposal groups classified as held for sale are measured at the lower of its carrying amount prior reclassification and fair value less costs to sell.
the accounting policies set out below have been applied consistently by all Jl entities and to all periods presented in these consolidated financial statements.
BaSiS of conSoLiDation the Annual Report comprises the parent Company, J. lauritzen A/S, and subsidiaries in which the parent Company has directly or indi-rectly the power to govern the financial and operating policies. this is normally accomplished by holding more than 50% of the voting rights. the existence and effect of potential voting rights that are currently exercisable or convertible are considered when assessing whether Jl has control or significant influence over another entity.
enterprises in which Jl has a significant influence, but not control are classified as associates.
Jointly controlled entities and associates are recognised using the eq-uity method.
the Consolidated Financial Statements are prepared on the basis of the financial statements of the parent Company and its subsidiaries, by combining items of a uniform nature and eliminating inter-compa-ny transactions and balances, and are based on financial statements prepared in compliance with Jl’s accounting policies.
Acquisitions, disposals and entities formed during the year are in-cluded in the financial statements during the period of Jl’s control or significant influence. Comparative figures are not adjusted for acquisi-tions. Disposals or liquidations are presented as discontinued opera-tions.
early 2013, the owner of J. lauritzen A/S, the lauritzen Foundation, decided to convert the two subordinated loans of uSD 159.6m to eq-uity. there have been no other events after the balance sheet date that could materially affect the accounts as presented.
note 25 eVentS after the BaLance Sheet

J. Lauritzen a/S · AnnuAl RepoRt 201284
BuSineSS comBinationSon acquisition of businesses, the purchase method is applied, accord-ing to which the identifiable assets, liabilities and contingent liabilities acquired are measured at their fair values on the date of acquisition. the excess of the cost of acquisition over the fair value of Jl’s share of the identifiable assets, liabilities and contingent liabilities acquired are recorded as goodwill. If the cost of acquisition is less than the fair value of the net assets of the business acquired (negative goodwill), the difference is recognised directly in the income statement.
gains or losses from the disposal or liquidation of subsidiaries or as-sociates are stated as the difference between the proceeds from dis-posal or liquidation and the book value of the net assets at the date of disposal or liquidation. this includes any goodwill as well as any anticipated disposal or liquidation costs.
tranSLation of foreign currencieS Items included in the financial statements of each of Jl’s entities are measured using the currency of the primary economic environment in which the entity operates (the functional currency). the consolidated financial statements of Jl are stated in uSD which is both Jl’s func-tional and presentation currency.
Foreign currency transactions are translated into the functional cur-rency at the exchange rate of the date when initially recognised. gains and losses arising between the exchange rate of the transaction date and that of the settlement date are recognised in the income state-ment under financial items.
Receivables, payables and other monetary items in foreign currencies that have not been settled at the balance sheet date are translated at the exchange rates then prevailing. Any differences between the ex-change rates at the balance sheet date and the transaction date rates are recognised in the income statement under financial items.
the results and financial position of any Jl entity that has a functional currency different from Jl’s presentation currency are translated into the presentation currency as follows:
Assets and liabilities, including goodwill and fair value adjustments arising on consolidation are translated at the closing rates at the date of the balance sheet.
Income and expenses for each income statement are translated at ex-change rates approximating the exchange rate of the date of transac-tion date, and all resulting exchange differences are recognised as a separate component of equity.
exchange differences arising from the translation of the net investment in foreign subsidiaries, associates, joint ventures and of borrowings or other currency instruments relating to hedging such investments are recognised in other comprehensive income in the translation reserve of equity. exchange differences are released to the income statement upon disposal of the net investment.
DeriVatiVe financiaL inStrumentS anD heDging actiVitieS Derivatives are recognised at fair value. positive and negative fair val-ues of derivatives are recognized in the statement of financial position
as other Receivable and other payables respectively, and offsetting is made only when the Jl has the right and intention to settle several derivatives net.
Fair value hedgeChanges in the fair value of derivatives designated as and qualifying for recognition as a hedge of the fair value of a recognised asset or li-ability are recognised in the income statement together with changes in the fair value of the hedged asset or liability. hedging of future cash flows relating to firm commitments are treated as fair value hedges.
Cash flow hedgeWhere a derivative financial instrument is designated as a hedge of a highly probable forecasted transaction, the effective part of any gain or loss on it is recognised in other comprehensive income in the hedging reserve of equity. When the forecasted transaction subsequently is re-alised, the associated cumulative gain or loss is reclassified from other comprehensive income in the hedging reserve of equity to the income statement in the same period or periods during which the hedged fore-casted transaction affects profit or loss. the ineffective part of any gain or loss is recognised in the income statement immediately.
When a hedging instrument expires or is sold, terminated or exercised, or the entity revokes designation of the hedge relationship but the hedged forecast transaction still is expected to occur, the cumulative gain or loss at that point remains in other comprehensive income in the hedging reserve of equity and is recognised in accordance with the above policy when the transaction occurs. If the hedged transaction is no longer expected to take place, the cumulative unrealised gain or loss recognised in equity is recognised in the income statement immediately.
Net investment hedgeDerivatives used to hedge net investments in foreign subsidiaries, associates or joint ventures are accounted for similarly to cash flow hedges. Any gain or loss on the hedging instrument relating to the effective portion of the hedge is recognised in equity; the gain and loss relating to the ineffective portion is recognised immediately rec-ognised in the income statement.
Derivatives that do not qualify for hedge accounting For derivatives that do not qualify for hedge accounting, changes in fair value are recognised in the income statement as they occur.
Segment information Segment information on key business areas is disclosed in line with Jl’s internal financial management, risks and accounting policies.
Assets in a segment comprise those that are directly attributable to the segment’s operations, including intangible assets, vessels, property, equipment, investments in associated companies and joint ventures, inventories, trade and other receivables, prepayments and cash.
liabilities in a segment comprise those that are directly employed in the segment’s operation, including trade payables, accruals and other liabilities.
J. Lauritzen a/S · AnnuAl RepoRt 2012 85
income StatementRevenues Revenues comprise charter income, freight and demurrage revenues from the vessels, and miscellaneous income. Revenues are recog-nised in the income statement as services are delivered. uncompleted voyages are recognised with the share related to the financial year. earnings from vessels which are engaged in pools are recognised in revenue on a net distribution basis.
In addition revenue comprises changes in fair value on forward freight agreements (FFA) used as hedging of Jl’s freight income. hedge ac-counting is not applied on FFA’s.
Operating cost of vessels operating cost of vessels includes maintenance and repairs, insurance of hulls and machinery, consumption of lubricants and supplies etc.
Other operating costsother operating costs include bunker oil, port costs, agent’s com-missions and other voyage related costs. Furthermore other operat-ing costs include fair value changes on financial bunkers contracts which are entered into for the purpose of hedging Jl’s bunkers costs as hedge accounting is not applied for these transactions.
Share of profit in associated companies and joint ventures the proportionate share of the net profit after tax in associated com-panies and joint ventures, after the elimination of proportional share of internal profit/loss is recognised in the income statement.
Financial items Financial items include interest income and expense, realised and unrealised exchange gains and losses, financial expenses in respect of finance leases, adjustments to the value of securities and certain financial instruments and other financial income and expenses.
borrowing costs directly attributable to the acquisition or construction of assets are capitalised as part of the cost of the asset.
Income taxIncome tax consists of tax calculated according to the regulations of the Danish tonnage tax Act for shipping activities and according to general tax regulations for other activities, as well as adjustments related to deferred tax. Income tax is recognised in the income state-ment except to the extent that it relates to items recognised directly to equity, in which case it is recognised in equity.
Statement of financiaL PoSitionGoodwill goodwill is stated at cost less any accumulated impairment losses. All business combinations are accounted for by applying the purchase method. goodwill represents the excess of acquisition price over the net fair value of acquired identifiable assets and liabilities arising on acquisition of subsidiaries, associates and joint ventures. In respect of associates and joint ventures, the carrying amount of goodwill is included in the carrying amount of the investment in the associate or joint venture.
Vessels, property and equipment Vessels Vessels are measured at cost less accumulated depreciation and ac-cumulated impairment losses. Vessels are depreciated on a straight line basis to an estimated scrap value. expected useful life of vessel is 25 years.
Cost of vessels acquired by way of finance leases are stated at the lower of fair value, and the present value of the minimum lease pay-ments at the inception of the lease.
Rebuilding of vessels is capitalised if the rebuilding is intended to ex-tend the service life and/or improve the earning potential. Rebuilding is depreciated over the expected service life of the investment.
Costs relating to dry dockings are capitalised and depreciated on a straight line basis. expected useful life of dry dockings range from 30 to 60 month.
Vessels under construction are measured at cost incurred until the time the vessel is taken into service.
Vessels which are held for sale are measured at the lower of the carry-ing amount and fair value less costs to sell.
Landland is measured at cost.
Buildings buildings are measured at cost less accumulated depreciation and ac-cumulated impairment losses. buildings are depreciated on a straight line basis. expected useful life of buildings is 50 years.
Machinery, tools and equipment machinery, tools and equipment are measured at cost less accumu-lated depreciation and accumulated impairment losses. machinery, tools and equipment are depreciated on a straight line basis. expected useful life of machinery, tools and equipment is 5-10 years.
gains and losses on the disposal of tangible assets are calculated as the difference between the sales price less cost of sales and the net book value at the time of sale.
Investments in associates and joint ventures Investments in associates and joint ventures are recognised according to the equity method of accounting.
Any goodwill resulting from the acquisition is included in the carrying value of the investment. It is tested for impairment as described below.
Associates and joint ventures with negative equity are measured at uSD 0 (nil), unless Jl has a legal or constructive obligation to cover the negative balance of the associate.

J. Lauritzen a/S · AnnuAl RepoRt 201286
Impairment the carrying amount of vessels, vessels under construction, part owned vessels through investments in joint ventures and associates and goodwill are tested annually for impairment.
the carrying amounts of other non-current assets, other than deferred tax assets, are reviewed at each balance sheet date to determine whether there is any indication of impairment. An impairment loss is recognised whenever the carrying amount of an asset or its cash-generating unit exceeds its recoverable amount. Impairment losses are recognised in the income statement.
please refer to note 1 for further disclosure on impairment test.
Inventories bunker oil is measured at cost according to the FIFo principle. major spare parts purchased and stored ashore for subsequent use are mea-sured at cost less individually assessed write-down. other inventories are recognised at the lower of cost or net realisable value.
Financial assetsJl classifies its investments in the following categories:
Financial assets at fair value through profit or loss (financial deriva-tives)loans and receivables andAvailable-for-sale financial assets.
the classification depends on the purpose for which the investments were acquired. management determines the classification of its in-vestments on initial recognition and re-evaluates this designation at every reporting date to the extent that such a designation is permitted and required. Financial assets classified at fair value through profit or loss are investments that are measured and reported at fair value in the internal management reporting.
Financial assets at fair value through profit or loss Comprise financial derivatives on which hedge accounting is not ap-plied and securities which is classified as such on initial recognition.
Loans and receivablesloans and receivables are non-derivative financial assets with fixed or determinable payments that are not quoted in an active market. loans and receivables are included in trade receivables and other receivables in the statement of financial position. trade receivables and other receivables are stated at amortised cost less allowances for doubtful trade receivables. the allowances are based on an individual assessment of each receivable.
Available-for-sale financial assetsAvailable-for-sale financial assets are non-derivatives that are not clas-sified held for trading. they are included in non-current assets unless management intends to dispose of the investment within 12 months of the balance sheet date.
Recognition and measurement of financial assetspurchases and sales of investments are recognised on the settlement date. Investments are initially recognised at fair value plus transaction
costs for all financial assets not classified as fair value through profit or loss.
Available-for-sale financial assets and financial assets at fair value through profit or loss are subsequently carried at fair value. loans and receivables are carried at amortised cost using the effective interest method.
unrealised gains and losses arising from changes in the fair value of financial assets classified as available-for-sale are recognised in eq-uity. When financial assets classified as available-for-sale are sold or impaired, the accumulated fair value adjustments are included in the Income statement as gains and losses from available-for-sale financial assets.
Prepayments prepayments recognised under assets include payments relating to costs in subsequent periods after the balance sheet date.
Equity proposed dividend is recognised as a separate item under equity until approved at the Annual general meeting, where after it is recognised as a liability.
Liabilities mortgage debt and other interest bearing debt to credit institutions are initially recognised as the proceeds received less any transaction costs incurred. Subsequently, financial liabilities are measured at amortised cost using the effective interest rate method, such that the difference between the proceeds and the redemption value is recognised in the income statement over the lifetime of the loan.
Financial liabilities also include lease obligations on finance leases.
trade payables and other amounts payable are measured at amortised cost.
Provisions A provision is recognised in the statement of financial position when Jl has a present legal or constructive obligation as a result of a past event, it is probable that an outflow of economic benefits will be re-quired to settle the obligation and it is possible to make a reliable es-timate of amount of the provision. If the effect is material, provisions are determined by discounting the expected future cash flows at a pre-tax rate that reflects current market assessments of the time value of money and, where appropriate, the risks specific to the liability.
Accruals Accruals include prepayments received relating to income in periods after the balance sheet date.
Corporate and deferred taxCorporate tax is the expected tax payable on the taxable income for the year, using tax rates enacted or substantially enacted at the bal-ance sheet date, and any adjustment to tax payable in respect of previ-ous years.
Deferred tax is provided using the balance sheet liability method, pro-

J. Lauritzen a/S · AnnuAl RepoRt 2012 87
viding for temporary differences between the carrying amounts of as-sets and liabilities for financial reporting purposes and the amounts used for taxation purposes. the following temporary differences are not provided for: goodwill not deductible for tax purposes, the initial recognition of assets or liabilities that affect neither accounting nor taxable profit, nor differences relating to investments in subsidiaries to the extent that they will probably not reverse in the foreseeable future. the amount of deferred tax provided is based on the expected manner of realisation or settlement of the carrying amount of assets and liabilities, using tax rates enacted or substantively enacted at the balance sheet date.
A deferred tax asset is recognised only to the extent that it is probable that future taxable profits will be available against which the asset can be utilised. Deferred tax assets are reduced to the extent that it is no longer probable that the related tax benefit will be realised.
caSh fLoW Statement the cash flow statement has been prepared according to the indirect method and shows the cash flows from operating, investing and fi-nancing activities for the year.
Cash flows from operating activities are calculated as the results for the year as adjusted for non-cash operational items, changes in work-ing capital and corporate tax payments.
Cash flows from investment activities cover receipts or payments re-lated to acquisition and divestment of companies and/or activities, transactions relating to non-current assets and purchase or sale of securities.
Cash flows from financing activities comprise changes in the size or mix of the share capital including related costs, raising and re-pay-ment of interest bearing debt, as well as payment of dividend to share-holders.
Cash and cash equivalents include bank deposits and short term de-posits that without restriction can be exchanged into cash funds and where there is insignificant risk of value fluctuations, with the deduc-tion of short term bank loans.
neW accounting reguLationS for future imPLementationthe IASb has issued the following new or revised accounting stan-dards (IAS and IFRS) and interpretations (IFRICs), that are not com-pulsory for Jl in the preparation of the financial statements for 2012: IFRIC 20, IFRS 9-13, IAS 27 (2011) and 28 (2011), Amendments to IFRS 1 and 7, Amendments to IAS 1, 19, and 32.
J. lauritzen A/S expects to implement the standards and interpreta-tions on effective date as issued by the IASb subject to their endorse-ment by the eu. none of the new standards and interpretations is expected to have material effect going forward.

J. Lauritzen a/S · AnnuAl RepoRt 201288
USD '000 Note 2012 2011
Revenue 11,935 13,785
Staff costs 1 (10,318) (13,581)
Other sales and administrative costs 2 (8,326) (10,662)
Profit before depreciation (EBITDA) (6,710) (10,458)
Depreciations and write-downs 6 0 (2)
Operating income (6,710) (10,460)
Financial income 3 46,091 94,717
Financial expenses 4 (106,062) (74,250)
Profit/(loss) before tax (66,682) 10,007
Income tax 5 794 4,696
Profit/(loss) for the year (65,888) 14,703
Proposed allocation of the profit:
Proposed dividend - -
Transferred to other reserves (65,888) 14,703
(65,888) 14,703
Statement of comprehensive income
USD'000 2012 2011
Profit/(loss) for the year (65,888) 14,703
Other comprehensive income
Fair value adjustment of hedging instruments during the year (4,786) (18,726)
Hedging instruments transferred to financial expenses 9,520 5,594
Fair value adjustment of shares available for sale 818 21,245
Other comprehensive income net of tax 5,552 8,113
Total comprehensive income (60,335) 22,816
StAtement oF comPrehenSiVe incomeUSD '000 2012 2011
Profit/(loss) for the year (65,888) 14,703
Other comprehensive income
Fair value adjustment of hedging instruments during the year (4,786) (18,726)
Hedging instruments transferred to financial expenses 9,520 5,594
Fair value adjustment of shares available for sale 818 21,245
Other comprehensive income net of tax 5,552 8,113
Total comprehensive income (60,335) 22,816
InCome Statement
Parent comPanY

J. Lauritzen a/S · AnnuAl RepoRt 2012 89
StAtement oF financiaL PoSition
USD '000 Note 2012 2011
ASSETS
Machinery, tools and equipment 6 1,399 1,426
Investments in subsidiaries 7 433,453 480,926
Deferred tax assets 5 655 2,642
Shares available for sale 25,331 24,513
Non-current assets 460,837 509,507
Other receivables 8 45,594 13,537
Receivables from affiliated companies 1,012,675 1,025,163
Corporate tax receivables 5 1,713 2,497
Prepayments 2,186 -
Securities 157 2,103
Cash and bank deposits 230,366 190,061
Current assets 1,292,691 1,233,360
Total assets 1,753,528 1,742,867
LIABILITIES
Equity
Share capital 60,633 60,633
Retained earnings 349,109 414,997
Reserves (4,839) (10,391)
Equity 9 404,903 465,238
Long-term borrowings 10 1,079,522 1,031,844
Non-current liabilities 1,079,522 1,031,844
Current portion of long-term borrowings 10 64,602 48,180
Trade payables 4,127 4,987
Other payables 54,168 57,513
Debt to affiliated companies 146,207 135,105
Current liabilities 269,103 245,785
Total liabilities 1,348,625 1,277,629
Total equity and liabilities 1,753,528 1,742,867
Parent comPanY

J. Lauritzen a/S · AnnuAl RepoRt 201290
eQuIty Statement
USD '000
Equity 1/1 2011 60,633 (18,505) - (18,505) 400,294 - 442,422
Profit/(loss) for the year - - - - 14,703 - 14,703
Other comprehensive income:
Deferred (gain)/loss on hedging instruments transferred to financial expenses - 5,594 - 5,594 - - 5,594 Fair value adjustment of shares available for sale - - 21,245 21,245 - - 21,245 Fair value adjustment of hedging instruments during the period - (18,726) - (18,726) - - (18,726) Total other comprehensive income - (13,131) 21,245 8,113 - - 8,113
Total comprehensive income - (13,131) 21,245 8,113 14,703 - 22,816
Transactions with owners:
Paid dividend - - - - - -
Total transactions with owners - - - - - -
Equity 31/12 2011 60,633 (31,636) 21,245 (10,391) 414,997 - 465,238
Profit/(loss) for the year - - - - (65,888) - (65,888)
Other comprehensive income:
Deferred (gain)/loss on hedging instruments transferred to financial expenses - 9,520 - 9,520 - - 9,520 Fair value adjustment of shares available for sale - - 818 818 - - 818 Fair value adjustment of hedging instruments during the period - (4,786) - (4,786) - - (4,786) Total other comprehensive income - 4,734 818 5,552 - - 5,552
Total comprehensive income - 4,734 818 5,552 (65,888) - (60,335)
Transactions with owners:
Hedging instrument
Sharecapital
Retained earnings Total
Proposed dividend
Shares available
for sale Reserves
Paid dividend - - - - - - -
Total transactions with owners - - - - - - -
Equity 31/12 2012 60,633 (26,902) 22,063 (4,839) 349,109 - 404,903
Parent comPanY

J. Lauritzen a/S · AnnuAl RepoRt 2012 91
CASh FloW Statement
USD '000 Note 2012 2011
Operating income (6,710) (10,460)
Depreciations and write-downs carried back 6 (0) 2
Adjustments 14,276 (34,909)
Change in working capital 7,462 (270,905)
Cash flow from operations before financial items 15,028 (316,272)
Ingoing financial payments 35,790 35,717
Outgoing financial payments (53,616) (46,411)
Cash flow from ordinary operations (2,797) (326,966)
Paid corporate tax 5 3,549 182
Cash flow from operating activities 751 (326,784)
Purchase of machinery and equipment 6 - (8)
Sale of shares in subsidiaries 649 5,065
Increase of share capital in subsidiaries 7 (1,165) (16,885)
Purchase and sales of securities 835 8,217
Cash and cash equivalents pledged as security for debt (22,321) 33,418
Dividend received from subsidiaries - 59,000
Cash flow from investment activities (22,003) 88,807
Instalment on long-term debt (150,872) (277,452)
Proceeds from loans 210,029 581,121
Dividend paid - -
Cash flow from financing activities 59,158 303,669
Changes for the year in cash and cash equivalents 37,906 65,692
Cash and cash equivalents at beginning of year 190,061 123,678
Currency adjustments on cash and cash equivalents 2,399 691
Cash and cash equivalents at the end of the year 230,366 190,061
Parent comPanY

J. Lauritzen a/S · AnnuAl RepoRt 201292
noteSNOTE 1 STAFF COSTS
USD '000 2012 2011
Staff costs include:Wages and salaries 9,419 12,332 Pensions (defined contribution plan) 765 869 Social security 37 38 Contract labour 97 342
10,318 13,581
Remuneration to J. Lauritzen A/S'Exec. Mngt - salaries 3,372 3,541 Exec. Mngt - long term employment bonus 121 131 Board of Directors 548 625
4,041 4,297
Average number of employees 63 63
Number of employees at year-end 60 61
Management and a number of executives are members of a bonusand/or severance scheme.
NOTE 2 OTHER SALES AND ADMINISTRATIVE COSTS
USD '000 2012 2011
Total fees to elected auditors 237 601
Specified as follows:Statutory audit 181 158Tax advisory services 33 29Fee for other services 23 414
NOTE 3 FINANCIAL INCOME
USD '000 2012 2011
Interest income on cash and deposits 2,253 3,631 Interest on receivables from subsidiaries 33,487 32,082 Income on financial assets at amortised costs 35,740 35,713 Currency exchange gains and losses, net 9,806 - Dividends on shares available for sale 495 - Interest on securities at fair value through P&L 51 4 Dividend received from subsidiaries - 59,000
Financial income 46,091 94,717
NOTE 5 TAX
USD '000 2012 2011
Tax in the Income Statement consist of:Current tax 2,782 4,729 Deferred tax (1,988) (33)
Income tax 794 4,696
Effective tax percent 1% -47%
Deferred tax on the Balance Sheet:Deferred tax 1 January 2,642 2,675 Tax on profit (1,988) (33)
Deferred tax 31 December 655 2,642
Deferred tax concerns:Taxable losses carried forward 655 2,642
655 2,642
Corporate tax payable can be specified as follows:Balance 1 January (2,497) 1,568 Exchange rate adjustments 17 483 Paid during the year 3,549 182 Provision for the year (2,782) (4,729)
(1,713) (2,497)
In excess of deferred tax assets recognised as specified above, theparent company have deductible unused tax losses of USD 28m asper 31 December 2012.
NOTE 6 MACHINERY, TOOLS & EQUIPMENT
USD '000 2012 2011
Cost as at 1 January 1,631 1,623 Additions during the year - 8 Disposals during the year (27) -
Cost as at 31 December 1,604 1,631
Depreciation and write-down as at 1 Jan. (206) (203) Depreciation during the year 0 (2)
Depreciation and write-down as at 31 Dec. (206) (206)
Balance as at 31 December 1,399 1,426
NOTE 4 FINANCIAL EXPENSES
USD '000 2012 2011
Interest expenses on loans (56,599) (58,532) Interest on debt to subsidiaries (363) (676) Total expenses on fin. liab. at amortised costs (56,962) (59,208) Currency exchange gains and losses, net - (6,345) Securities at fair value through P&L (1,111) (115) Loss on sale of shares in subsidiaries (602) (8,581) Impairment write-down of subsidiaries (47,388) -
Financial expenses (106,062) (74,250)
Parent comPanY

J. Lauritzen a/S · AnnuAl RepoRt 2012 93
NOTE 7 INVESTMENTS IN SUBSIDARIES
USD '000 2012 2011
Lauritzen Bulkers A/S, Denmark 100.0% 100.0%Lauritzen Kosan A/S, Denmark 100.0% 100.0%Lauritzen Reefers A/S, Denmark 100.0% 100.0%Lauritzen Tankers A/S, Denmark 100.0% 100.0%Lauritzen Ship Owner A/S, Denmark 100.0% 100.0%Lauritzen Tankers Shipowner A/S, Denmark - 100.0%J. Lauritzen Inversiones (Chile) Ltda., Chile 100.0% 100.0%J Lauritzen (Japan) K.K., Japan 100.0% 100.0%J. Lauritzen Singapore Pte., Singapore 100.0% 100.0%KRK 4 ApS, Denmark 100.0% 100.0%Segetrans Argentina S.A., Argentina 100.0% 100.0%ShipInvest A/S, Denmark - 100.0%LB Shipowner A/S, Denmark - 100.0%LB Shipowner II A/S, Denmark 100.0% 100.0%LK Shipowner A/S, Denmark - 100.0%J. Lauritzen Shanghai Co. Ltd., China 100.0% 100.0%LT Shipowner A/S, Denmark - 100.0%
2012 2011
Cost as at 1 January 813,814 810,575 Additions during the year 1,165 16,885 Disposal during the year (1,251) (13,646)
Cost as at 31 December 813,728 813,814
Accumulated impairment losses at 1 Jan. (332,888) (332,888) Impairment during the year (47,388) -
Accumulated impairment losses at 31 Dec. (380,276) (332,888)
Carrying amount at 31 Dec. 433,453 480,926
Ownership
NOTE 8 OTHER RECEIVABLES
USD '000 2012 2011
Financial derivatives 11,261 639 Liquidity pledged as security for debt 34,180 11,859 Other short-term receivables 152 1,039 Total other receivables 45,594 13,537
Compared to annual report 2011 bank deposits pledged as securityfor debt of USD 11.9m has been reclassified from cash at hand andin bank to other receivables.
NOTE 9 EQUITY
Composition of share capital and dividends are disclosed in note 13in the consolidated statements.

J. Lauritzen a/S · AnnuAl RepoRt 201294
NOTE 10 LONG-TERM BORROWINGS
USD '000 <1 year 1 - 5 year > 5 year Total <1 year 1 - 5 year > 5 year Total
Mortgage on vessels (63,893) (570,211) (135,635) (769,739) (48,180) (384,506) (362,022) (794,709)
Subordinated loan *) - (159,582) - (159,582) - (166,796) - (166,796)
Issued bonds - (212,536) - (212,536) - (116,287) - (116,287)
Other debt (709) (1,558) - (2,267) - (2,233) - (2,233)
Total long-term borrowings (64,602) (943,887) (135,635) (1,144,124) (48,180) (669,822) (362,022) (1,080,024)
Market value of long-term borrowings (1,149,992) (1,081,251) *) The loan is granted from LF Investment ApS and is subordinated to all other debts, liabilities and obligations.
USD '000 CurrencyFixed/
VariableInterest rate
fixation
Average effective
interest rate, excl. hedging
Average effective
interest rate incl. hedging Book value
2012Mortgage on vessels USD Variable 3-6 month 2.23% 3.54% (683,661)
Mortgage on vessels JPY Variable 6 month 2.41% 2.74% (86,078)
Subordinated loan DKK Variable 12 month 4.16% 4.16% (159,582)
Issued bonds NOK Fix./Var. 3-5 years 10.35% 9.24% (212,536) Other debt DKK Fixed 2-3 year 4.73% 4.73% (2,267) Total 3.98% 4.65% (1,144,124)
2011
Mortgage on vessels USD Variable 3-6 month 2.33% 3.68% (712,642)
Mortgage on vessels JPY Variable 6 month 2.40% 2.77% (82,067)
Subordinated loan DKK Variable 12 month 4.43% 4.43% (166,796)
Issued bonds NOK Fixed 4 years 10.50% 9.85% (116,287) Other debt DKK Fixed 3-4 year 4.73% 4.73% (2,233)
Total 3.35% 4.38% (1,080,024)
Currency exposure on non-USD long-term borrowings, net of hedging:
USD '000 Book value
Currency hedging
derivaties Bank
deposits *)
Net currency exposure on
loan Book value
Currency hedging
derivaties Bank
deposits *)
Net currency exposure on
loan
JPY (86,078) 14,000 - (72,078) (82,067) - - (82,067)
DKK *) (161,849) - 148,614 (13,236) (169,028) - 152,811 (16,217)
NOK (212,536) 212,536 - - (116,287) 116,287 - -
Total (460,463) 226,536 148,614 (85,314) (367,382) 116,287 152,811 (98,284)
JL aims to limit the currency risk by placing funds in DKK deposits.
Interest exposure to floating interest rates:
2012 2011
Total long-term borrowings (1,144,124) (1,080,024)
Herof fixed to maturity (128,027) (118,520)
Floating interest borrowings (1,016,097) (961,504)
Interest rate swaps floating to fixed at year end, nominal 541,957 444,100
Exposure to floating interest rates at year end (474,140) (517,404)
2012 2011
2012 2011

J. Lauritzen a/S · AnnuAl RepoRt 2012 95
liquidity Risk
market Risk
Credit Risk
the risk that Jl is able to meet its future cash flow needs
the risk of losses in financial positions arising from movements in market prices to which Jl is exposed
the risk of incurring a financial loss if a customer or counterparty fails to fulfill its contractual obligations
note 11 financiaL inStrumentS anD financiaL riSKS
Financial risks for J. lauritzen A/S relate to:
Financial risks are regularly assessed and prioritized based on how likely they are to occur and their potential impact. As defined by Jl’s board of Directors, overall policies and objectives for financial risks were generally unchanged from 2011. Reference is also made to note 16 to the consolidated financial statements.
LiQuiDitY riSKliquidity risk relates to the risk that Jl will not be able to fulfil its finan-cial obligations as they fall due.
below is a maturity analysis of financial liabilities at year-end 2012:
USD '000
2012
Non-derivative financial instruments:Mortgage on vessels, bank debt and other interest-bearing debt *) (1,144,124) (1,315,795) (112,313) (1,051,715) (151,767) Trade and other payables (24,793) (24,793) (24,793) - -Debt to affiliates (146,207) (146,207) (146,207) Derivatives, liabilities at fair value:Forward exchange contracts (1,143) (1,143) (1,143) - -Interest rate and currency swaps (31,835) (31,835) (9,708) (20,485) (1,642) FFA’s and oil contracts (523) (523) (523) - -Total at 31 December 2012 (1,348,625) (1,520,295) (294,687) (1,072,199) (153,409)
2011
Non-derivative financial instruments:Mortgage on vessels, bank debt and other interest bearing debt *) (1,080,024) (1,437,030) (97,276) (975,150) (212,878) Trade payable and other payables (22,292) (22,292) (22,292) - -Debt to affiliates (135,105) 135,105 (135,105) Derivative, liabilities at fair value:Forward exchange contracts (1,688) (1,688) (1,688) - -Interest rate swaps (37,882) (37,882) (9,763) (25,080) (3,039) Total at 31 December 2011 (1,276,990) (1,363,787) (266,124) (1,000,230) (215,917)
Carrying amount
Contractual cash flows <1 year 1-5 years >5 years
Total at 31 December 2011 (1,276,990) (1,363,787) (266,124) (1,000,230) (215,917)
*) Contractual cash flows include undiscounted interest payments based on interest levels at year end

J. Lauritzen a/S · AnnuAl RepoRt 201296
note 11 contInuedmarKet riSKSmarket risks are the risk of losses in financial positions arising from movements in market prices to which Jl is exposed to through finan-cial instruments. market risks are regularly assessed and prioritized based on how likely they are to occur and their potential impact. based on this assessment the following market risks are considered signifi-cant for J. lauritzen A/S:
below is sensitivity analysis of J. lauritzen A/S’s of the exposure to the market risks. please refer to note 16 to the consolidated financial statements for description of managing the risks.
Sensitivity information is calculated at balance sheet date and com-prises only sensitivity relating to financial instruments, so the amounts disclosed do not necessarily give a complete picture of Jl’s risks relat-ing to the different categories of risk.
Currency riskto measure currency risk in accordance with IFRS 7, sensitivity is cal-culated as the change in fair value of future cash flows from financial instruments as a result of fluctuations in exchange rates on balance sheet date. Sensitivity to fluctuations in non-uSD currencies at bal-ance sheet date is based (other things being equal and after tax) on a 10% decrease in currency translation rates against uSD (assum-ing 100% effectiveness) would result in a net profit/loss of uSD 5.0m (2011: 5.9m) and affect equity by uSD 2.5m (2011: 3.4m). the effect of a 10% increase in the currency translation rates against uSD would have a corresponding inverse effect.
Interest rate riskSensitivity of interest fluctuations is calculated as the hypothetic effect on net profit and equity as a result of fluctuations in interest rates at balance sheet date.
the sensitivity analysis includes financial instruments recognized at fair value for which the calculated effect on equity represents an im-mediate fair value change from a thought change in interest rates and financial instruments with variable interest recognized at amortized costs for which the calculated effect represents a one year effect on net profit and equity based on balances at year end.
Currency risk - operational cash flow
Currency risk from operations is related non-uSD costs where DKK expenses
are the largest contributor.
Currency risk - Financing
Relates to long-term borrowing in non-uSD. Jl had at year-end long-term
borrowings denominated in noK, DKK and Jpy, ref note 10.
Interest rates risk - long-term borrowings
41% of Jl’s long-term borrowings are exposed to floating interest rate.
USD ‘000 2012 2011
Financial derivatives 11,261 639 Other short-term receivables 152 1,039 Cash and bank deposits 230,366 190,061 Maximum credit risk 241,779 191,739
Assumptions for the sensitivity analysis:All hedging instruments assumed 100% effectiveChanges in interest rates are global and thus the impact on the fair value of forward currency contracts and similar derivatives is not con-sideredShares available for sale and shares at fair value through profit or loss are not included in sensitivity calculations due to inability to reliably measure the sensitivity of share prices to interest rate changes.
on financial instruments at fair value the calculated effect after tax based on a 1% decrease in interest rates would affect profit/loss by uSD (5.4)m (2011: (4.4)m) and equity by uSD (8.6)m (2011: uSD (16.7)m). on financial instruments with variable interest recognized at amortized costs profit/loss and equity would be effect by uSD (0.1)m (2011: (2.7)m).
A 1% increase in interest rates would have a corresponding inverse effect.
creDit riSKthe risks relating to financial counterparties, financial instruments, bonds and cash funds are minimized by trading only with financial institutions with a long-term investment grade credit rating from moody’s and by defined limits on deposits on each financial partner.
At year-end 2012, all of our financial counterparties had credit ratings of or above baa2.
J. lauritzen A/S’s exposure to credit risks at balance sheet date can be illustrated as follows:
the maximum credit risk corresponds to the carrying value of the in-dividual assets.

J. Lauritzen a/S · AnnuAl RepoRt 2012 97
DeriVatiVe financiaL inStrumentSJl’s policy is to use derivative financial instruments to hedge financial risks. At year end J. lauritzen A/S held the following derivatives:
categorieS of financiaL aSSetS anD LiaBiLitieSthe following categories of financial assets and liabilities are recog-nized in the balance sheet:
*) Figure includes financial derivatives designated for hedge accounting
**) Amounts recognized for financial asset and liabilities at amortized cost do
not differ materially from their fair value with the exception of issued bonds. Fair
value of issued bonds amount to uSD 218.4m whereas the carrying amount
totalled uSD 212.5m.
Fair value hierarchy With the exception of listed bonds and shares of uSD 0.2m (2011: uSD 2.1m) (level 1) and shares available for sale of uSD 25.3m (2011: uSD 24.5m)(level 3), all financial instruments are stated at fair value on the basis of observable market prices (level 2), directly as prices or indirectly derived from prices.
USD mCash flow /Fair value hedge
Nominal, USDm
Duration, month
Recognised on equity Fair value
Nominal, USDm
Duration, month
Recognised on equity Fair value
Hedge accouning applied:Currency: USD/JPY Fair value 32.1 0-12 - (0.3) 34.3 0-12 - 0.6 Currency: USD/NOK Cash flow 212.5 29-58 (0.6) 8.5 116.3 41 (3.8) (5.8) Interest rate swaps Cash flow 630.1 21-131 (26.9) (26.9) 444.1 33-139 (28.6) (28.6) Terminated interest rate swap Cash flow N/A N/A 0.6 N/A N/A N/A 0.7 N/ATotal (26.9) (18.7) (31.6) (33.8)
Hedge accouning not applied:Currency: USD/NOK N/A (2.1) 0-1 - (0.2) (2.1) 0-1 - 0.0 Currency: USD/EUR N/A 7.5 0-2 - 0.4 - - - - Currency: USD/DKK N/A 27.0 0-1 - 0.7 31.0 0-1 - (1.3) Currency: USD/JPY N/A 2.8 0-1 - 0.4 (2.0) 0-1 - (1.0) FFA's and oil contracts N/A N/A N/A - 0.0 N/A N/A - - Interest indexswap N/A 38.2 39 - (5.0) 38.2 51 - (2.2) Total 38.2 - (3.6) 38.2 - (4.5)
Total derivative financial instruments (22.2) (38.3) Presented in the financial statement as:Other receivables 11.2 0.6 Other payables (33.5) (38.9)
2012 2011
USD ‘000 2012 2011
Fin. assets at FV through P/L *) 11,418 2,741
Loans and receivables**) 1,047,008 1,228,122
Fin. assets available for sale **) 25,331 24,513
Fin. liabilities - at FV through P/L *) (33,501) (40,209)
Fin. liabilities - at amortized cost**) (1,315,123) (1,237,420)
In 2012 fair value adjustment of level 3 financial instruments amount-ed to uSD 0.8m recognised in other comprehensive income (2011: 21.2m). the fair value adjustment relate to unlisted shares for which a valuation technique has been used to determine fair value. material inputs in the valuation comprise equity value and expected Roe com-pared to Jl’s return requirements. Financial instruments categorized at level 3 have developed as follows:
USD ‘000 2012 2011
Book value at 1 January 24,513 3,268 Fair value adjustment 818 21,245 Book value at 31 December 25,331 24,513
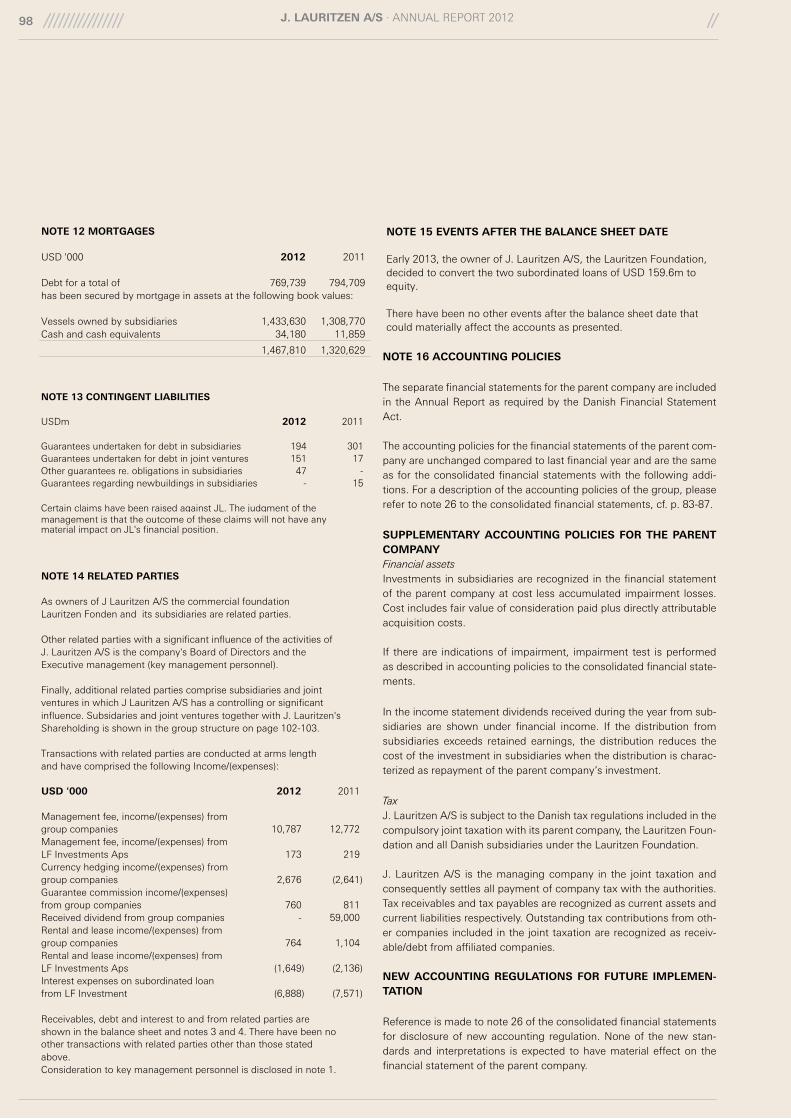
J. Lauritzen a/S · AnnuAl RepoRt 201298
NOTE 12 MORTGAGES
USD '000 2012 2011
Debt for a total of 769,739 794,709 has been secured by mortgage in assets at the following book values:
Vessels owned by subsidiaries 1,433,630 1,308,770Cash and cash equivalents 34,180 11,859
1,467,810 1,320,629
NOTE 13 CONTINGENT LIABILITIES
USDm 2012 2011
Guarantees undertaken for debt in subsidiaries 194 301 Guarantees undertaken for debt in joint ventures 151 17 Other guarantees re. obligations in subsidiaries 47 - Guarantees regarding newbuildings in subsidiaries - 15
Certain claims have been raised against JL. The judgment of themanagement is that the outcome of these claims will not have anymaterial impact on JL's financial position.
NOTE 14 RELATED PARTIES
As owners of J Lauritzen A/S the commercial foundationLauritzen Fonden and its subsidiaries are related parties.
Other related parties with a significant influence of the activities ofJ. Lauritzen A/S is the company's Board of Directors and theExecutive management (key management personnel).
Finally, additional related parties comprise subsidiaries and jointventures in which J Lauritzen A/S has a controlling or significantinfluence. Subsidaries and joint ventures together with J. Lauritzen'sShareholding is shown in the group structure on page 102-103.
Transactions with related parties are conducted at arms lengthand have comprised the following Income/(expenses):
USD '000 2012 2011
Management fee, income/(expenses) fromgroup companies 10,787 12,772 Management fee, income/(expenses) fromLF Investments Aps 173 219 Currency hedging income/(expenses) fromgroup companies 2,676 (2,641) Guarantee commission income/(expenses)from group companies 760 811 Received dividend from group companies - 59,000 Rental and lease income/(expenses) fromgroup companies 764 1,104 Rental and lease income/(expenses) fromLF Investments Aps (1,649) (2,136) Interest expenses on subordinated loanfrom LF Investment (6,888) (7,571)
Receivables, debt and interest to and from related parties areshown in the balance sheet and notes 3 and 4. There have been noother transactions with related parties other than those statedabove.Consideration to key management personnel is disclosed in note 1.
NOTE 15 EVENTS AFTER THE BALANCE SHEET DATE
Early 2013, the owner of J. Lauritzen A/S, the Lauritzen Foundation,decided to convert the two subordinated loans of USD 159.6m toequity.
There have been no other events after the balance sheet date thatcould materially affect the accounts as presented.
note 16 accounting PoLicieS
the separate financial statements for the parent company are included in the Annual Report as required by the Danish Financial Statement Act.
the accounting policies for the financial statements of the parent com-pany are unchanged compared to last financial year and are the same as for the consolidated financial statements with the following addi-tions. For a description of the accounting policies of the group, please refer to note 26 to the consolidated financial statements, cf. p. 83-87.
SuPPLementarY accounting PoLicieS for the Parent comPanYFinancial assetsInvestments in subsidiaries are recognized in the financial statement of the parent company at cost less accumulated impairment losses. Cost includes fair value of consideration paid plus directly attributable acquisition costs.
If there are indications of impairment, impairment test is performed as described in accounting policies to the consolidated financial state-ments.
In the income statement dividends received during the year from sub-sidiaries are shown under financial income. If the distribution from subsidiaries exceeds retained earnings, the distribution reduces the cost of the investment in subsidiaries when the distribution is charac-terized as repayment of the parent company’s investment.
TaxJ. lauritzen A/S is subject to the Danish tax regulations included in the compulsory joint taxation with its parent company, the lauritzen Foun-dation and all Danish subsidiaries under the lauritzen Foundation.
J. lauritzen A/S is the managing company in the joint taxation and consequently settles all payment of company tax with the authorities. tax receivables and tax payables are recognized as current assets and current liabilities respectively. outstanding tax contributions from oth-er companies included in the joint taxation are recognized as receiv-able/debt from affiliated companies.
neW accounting reguLationS for future imPLemen-tation
Reference is made to note 26 of the consolidated financial statements for disclosure of new accounting regulation. none of the new stan-dards and interpretations is expected to have material effect on the financial statement of the parent company.

J. Lauritzen a/S · AnnuAl RepoRt 2012 99
note 17 accounting eStimateS anD JuDgmentS
the preparation of the financial statements in conformity with IFRS re-quires management to make estimates and judgments that affect the reported carrying amounts of assets and liabilities and disclosure of contingent assets and liabilities at the date of the financial statements and the reported performance. management bases its estimates on historical experience and various other assumptions and sources that are believed to be reasonable. Actual results could differ from those estimates.
material accounting estimates in preparing the separate financial statement for the parent company comprise estimates included in im-pairment testing of investment in subsidiaries.
Critical accounting estimates and judgments for the group are dis-closed in note 1 of the consolidated financial statement.

J. Lauritzen a/S · AnnuAl RepoRt 2012100
torben Janholtpresident & Ceo
birgit Aagaard-Svendsenexecutive Vice president & CFo
the board of Directors and executive manage-ment have today discussed and approved the an-nual report of J. lauritzen A/S for the financial year 2012.
the annual report has been prepared in accord-ance with International Financial Reporting Stand-ards as adopted by the eu and additional dis-closure requirements in the Danish Financial Statements Act. It is our opinion that the consoli-dated financial statements and parent company fi-nancial statements give a true and fair view of the group’s and the parent company’s financial posi-tion at 31 December 2012 and of the results of the
mAnAgement Statement
Jan Kastrup-nielsenexecutive Vice president & Coo
* elected by the employees
bent Østergaard, Chairman
niels heering
marianne Wiinholt
ulrik Danstrøm*
BoarD of DirectorS
executiVe management
Ingar Skaug, Vice Chairman
peter poul lauritzen bay
Søren berg*
group’s and the parent company’s operations and cash flows for the financial year 1 January – 31 De-cember 2012.
Further, in our opinion, the management’s re-view gives a fair review of the development in the group’s and the parent company’s operations and financial matters, the results of the group’s and the parent company’s operations and financial po-sition and describes the material risks and uncer-tainties affecting the group and the parent com-pany.
We recommend that the annual report be ap-proved at the Annual general meeting
Copenhagen, 26 February 2013

J. Lauritzen a/S · AnnuAl RepoRt 2012 101
to the SharehoLDer of J. Lauritzen a/Sindependent auditors’ report on the consoli-dated financial statements and the parent company financial statements
We have audited the consolidated financial state-ments and the parent company financial state-ments of J. lauritzen A/S for the financial year 1 January – 31 December 2012. the consolidated financial statements and the parent company fi-nancial statements comprise income statement, statement of comprehensive income, statement of financial position, equity statement, cash flow statement and notes, including a summary of sig-nificant accounting policies for the group as well as for the parent company. the consolidated fi-nancial statements and the parent company fi-nancial statements are prepared in accordance with International Financial Reporting Standards as adopted by the eu and Danish disclosure re-quirements for listed companies.
management’S reSPonSiBiLitY for the conSoLiDateD financiaL StatementS anD the Parent comPanY financiaL State-mentSmanagement is responsible for the preparation of consolidated financial statements and parent company financial statements that give a true and fair view in accordance with International Fi-nancial Reporting Standards as adopted by the eu and Danish disclosure requirements for listed companies and for such internal control that management determines is necessary to enable the preparation of consolidated financial state-ments and parent company financial statements that are free from material misstatement, wheth-er due to fraud or error.
auDitorS’ reSPonSiBiLitYour responsibility is to express an opinion on the consolidated financial statements and the parent company financial statements based on our au-dit. We conducted our audit in accordance with International Standards on Auditing and addition-al requirements under Danish audit regulation. this requires that we comply with ethical require-ments and plan and perform the audit to obtain reasonable assurance as to whether the consoli-dated financial statements and the parent com-pany financial statements are free from material misstatement.An audit involves performing procedures to ob-tain audit evidence about the amounts and dis-closures in the consolidated financial statements and the parent company financial statements. the procedures selected depend on the auditors’ judgement, including the assessment of the risks of material misstatement of the consolidated fi-nancial statements and the parent company fi-
nancial statements, whether due to fraud or error. In making those risk assessments, the auditors consider internal control relevant to the Compa-ny’s preparation of consolidated financial state-ments and parent company financial statements that give a true and fair view in order to design audit procedures that are appropriate in the cir-cumstances, but not for the purpose of express-ing an opinion on the effectiveness of the Com-pany’s internal control. An audit also includes evaluating the appropriateness of accounting policies used and the reasonableness of account-ing estimates made by management, as well as evaluating the overall presentation of the consoli-dated financial statements and the parent com-pany financial statements.We believe that the audit evidence we have ob-tained is sufficient and appropriate to provide a basis for our opinion.our audit has not resulted in any qualification.
oPinionIn our opinion, the consolidated financial state-ments and the parent company financial state-ments give a true and fair view of the group’s and the parent company’s financial position at 31 De-cember 2012 and of the results of the group’s and the parent company’s operations and cash flows for the financial year 1 January – 31 De-cember 2012 in accordance with International Financial Reporting Standards as adopted by the eu and Danish disclosure requirements for listed companies.
Statement on BoarD & executiVe manage-ment’S Statementpursuant to the Danish Financial Statements Act, we have read the board & executive manage-ment Statement. We have not performed any fur-ther procedures in addition to the audit of the consolidated financial statements and the parent company financial statements. on this basis, it is our opinion that the information provided in the board & executive management Statement is consistent with the consolidated financial state-ments and the parent company financial state-ments.
Copenhagen, 26 February 2013
KPmgStatsautoriseret Revisionspartnerselskab
InDepenDent auDitorS’ rePort
henrik Kronborg iversen State Authorised public Accountant
carsten KjærState Authorised public Accountant

J. Lauritzen a/S · AnnuAl RepoRt 2012102
oVeRAll gRoup Structure
LAURITZEN BULKERS A/SDENMARK
100%
LAURITZEN (USA) INC.DENMARK
100%
LAURITZEN KOSAN A/SDENMARK
100%
LAURITZEN TANKERS A/SDENMARK
100%
LAURITZEN OFFSHORE SERVICES A/S
100%
J.LAURITZEN SINGAPORE PTE. LTD.
100%
LAURITZEN OFFSHORE PTE. LTD.
100%
LAURITZEN SHUTTLETANKERS SINGAPORE PTE LTD.
100%
HAFNIA MANAGEMENT
12%
HANDYVENTURE SINGAPORE PTE. LTD.
50%
J.LAURITZEN SHANGHAI CO. LTD
100%
GASNAVAL S.A.SPAIN100%
STAR MANAGEMENT ASS. JAPAN
30%
LKT GAS CARRIERS PTE. LTDSINGAPORE
50%
J. LAURITZEN A/SDENMARK
LAURITZEN KOSANSINGAPORE PTE. LTD.
100%
*
*Companies owned by J. Lauritzen Singapore Pte. Ltd.
AXIS OFFSHORE PTE. LTD.50%
MILAU PTE. LTDSINGAPORE
50%
LAURITZEN (JAPAN) K.K.DENMARK
100%
*

J. Lauritzen a/S · AnnuAl RepoRt 2012 103
lISt oF gRoup comPanieS
Company name Country Ownership %J. Lauritzen A/S Denmark -Segetrans Argentina S.A. Argentina 100 Greden Limited Bahamas 100 Labas (Bahamas) Ltd. Bahamas 100 Shoreoff Invest Bermuda Ltd. Bermuda 100 East Gate Shipping Ltd. China 100 J. Lauritzen Shanghai Co. Ltd China 100 Owneast Shipping Limited China 100 De Forenede Sejlskibe I/S * Denmark 43 Freja Polaris A/S * Denmark 49 KRK 4 ApS Denmark 100 K/S Bulkinvest 30 * Denmark 18 K/S Danred I * Denmark 44 K/S Danred II * Denmark 40 K/S Danred III * Denmark 35 K/S Danred V * Denmark 50 K/S Danskib 30 * Denmark 10 K/S Danskib 34 * Denmark 20 K/S Danskib 63 * Denmark 14 K/S Danskib 77 * Denmark 20 K/S Handybulk * Denmark 27 Lauritzen Bulkers A/S Denmark 100 Lauritzen Kosan A/S Denmark 100 Lauritzen Offshore Services A/S Denmark 100 Lauritzen Reefers A/S Denmark 100 Lauritzen Ship Owner A/S Denmark 100 Lauritzen Tankers A/S Denmark 100 LB Ship Owner II A/S Denmark 100 Quantum Tankers A/S *** Denmark 50 J. Lauritzen (Japan) K.K. Japan 100 Star Management Associates ** Japan 30 Lauritzen Shuttletankers Netherlands B.V. The Netherlands 100 Axis Offshore Pte. Ltd. * Singapore 50 Handyventure Singapore Pte. Ltd. * Singapore 50 J. Lauritzen Singapore Pte. Ltd. Singapore 100 Lauritzen Kosan Singapore Pte. Ltd. Singapore 100 Lauritzen Offshore Pte. Ltd. Singapore 100 Lauritzen Shuttletankers Singapore Pte. Ltd. Singapore 100 LKT Gas Carriers Pte. Ltd. * Singapore 50 Milau Pte. Ltd. * Singapore 50 Gasnaval S.A. Spain 100 J. Lauritzen (USA) Inc. USA 100
* Joint venture** Associated company*** Treated as subsidiary as JL has more than 50% of the voting rights
chinaJ. Lauritzen Shanghai co. Ltd.unit 2306, chong hing finance centerno. 288 nanjing road westhuangpu district, Shanghaichina 200003phone: +86 21 6358 0066fax: +86 21 6358 0077
JaPanJ. Lauritzen (Japan) k.k.kioicho building 3 A, 3-12kioichochiyoda-kutokyo 102-0094Japanphone: +81 3 3237 7431fax: +81 3 3237 7858
PhiLiPPineSLauritzen kosan representative office manila 6th floor, glass towerno. 115 don carlos palanca Jr. StreetLegaspi village, makati city 1229 phILIppIneS tlf: +63 2 856 7929fax: +63 2 813 112
SingaPoreJ. Lauritzen Singapore pte. Ltd.1 harbourfront Avenue#13-01/02 keppel bay towerSingapore 098632phone: +65 6275 8000fax: +65 6275 7208
SPaingasnaval S.A.pAe Ibarrabarriedificio A-1c/Iturriondo 18e-48940 Leioa, vizcayaSpainphone: +34 94 479 5600fax: +34 94 416 7316
uSaJ. Lauritzen (uSA) Inc.4 Landmark Square, Suite 150Stamford, ct 06901uSAphone: +1 203 961 8661fax: +1 203 964 0350
heaD officeJ. Lauritzen A/S28, Sankt Annae pladspo box 2147dk-1291 copenhagen kphone: +45 3396 8000fax: +45 3396 8001website: www.j-lauritzen.comCVR: 55 70 01 17
oWnerLauritzen fonden28, Sankt Annae pladsdk- 1291 copenhagen kphone: +45 3396 8425fax: +45 3396 8434email: [email protected]: www.lauritzenfonden.com
FinanCial yeaR: 1 January – 31 December
auditoRsKPMGOsvald Helmuths Vej 4PO Box 250DK-2000 Frederiksberg