annual report - mauritian eagle insurance
TRANSCRIPT

AN
NU
AL
RE
PO
RT

Our VisionTo be the preferred insurance specialist that goes beyond boundaries to create value.
Our MissionWe passionately provide comprehensive, customised and state of the art insurance solutions through innovation and operational excellence.

Company DetailsHead offi ce1st Floor, IBL House, Caudan, Port Louis, Mauritius.Tel: (230) 203 2200 - Fax: (230) 203 2299Email: [email protected]: www.mauritianeagle.com
AuditorsDeloitte, Ebène, Mauritius
Consulting actuaries• Towers Watson SA (Proprietary) Limited, South Africa • QED Actuaries & Consultants (Pty) Limited, South Africa
Bankers• The Mauritius Commercial Bank Limited• The Hong Kong and Shanghai Banking Corporation• Barclays Bank Plc• State Bank of Mauritius• Afrasia Bank Limited
Registrar and transfer offi ceMCB Registry and Securities, Raymond Lamusse Building, 9-11 Sir William Newton Street, Port Louis, Mauritius.
Registered offi ceIBL House, Caudan, Port Louis, Mauritius.
SecretarySimon-Pierre Rey, B.A (Hons) Econ., A.C.A.

Directors’ Profi les
Directors of Subsidiaries
Managers’ Profi les
Managers of Subsidiaries
Notice of Annual Meeting
Chairman’s and Managing Director’s Report
Corporate Governance Report
Statement of Directors’ Responsibilities
Certifi cate from the Company Secretary
Premium and Profi tability Charts
Report of the Auditors to the Shareholders
Statements of Financial Position
Statements of Comprehensive Income
Statements of Changes in Equity
Statements of Cash Flows
Notes to the Financial Statements
4
7
8
11
12
13
15
26
27
28
29
30
31
32
33
34
CONTENTS


Nicolas MAIGROTNon-Executive Chairman
Mr Maigrot was appointed Non-Executive Chairman of Mauritian Eagle Insurance on 18th January 2011. He holds a BSc in Management Sciences from the London School of Economics. Mr Maigrot is the Chief Executive and Director of Ireland Blyth Limited.
Gilbert ITHIER, LL. B. Hons, BarristerIndependent Non-Executive Director
Me Ithier was appointed as Independent Non-Executive Director on 15th November 2005. Me Ithier has been practicing as a barrister before all the courts of Mauritius since 1979, specialising mostly in civil, commercial, company, insurance and property matters.
André CHUNG SHUI, FCAManaging Director
Appointed Managing Director of Mauritian Eagle Insurance Company Limited on 1st of July 2011, Mr Chung Shui is a Fellow of the Institute of Chartered Accountants in England & Wales and is a Graduate of the London School of Economics. Before joining the Group, he was with the Happy World Group. He is a Director of the Stock Exchange of Mauritius Limited.
Robert IP MIN WAN, FCAIndependent Non-Executive Director
Mr Ip Min Wan was appointed as Independent Non-Executive Director on 13th June 2008. He was a Senior Audit Manager of Deloitte & Touche LLP in London before returning to Mauritius. He has a wide experience in the audit of the banking sector amongst others.
DIRECTORS’ PROFILES
Mau
riti
an E
agle
Insu
ranc
e C
om
pan
y Li
mit
ed
Ann
ual R
epo
rt 2
012
4

Subhash LALLAH, BarristerIndependent Non-Executive Director
Me Lallah was appointed as Independent Non-Executive Director on 29th March 2005. Former Chairman of the National Transport Corporation and Member of the Board of Governors of the Mauritius Broadcasting Corporation, he is the legal advisor of a number of companies and corporations.
Gaetan LAN HUN KUEN, FCANon-Executive Director
Mr Lan was appointed as Non-Executive Director on 1st January 2005 and before that he was the Chief Executive of Mauritian Eagle Insurance Company Limited. Mr Lan is the Chairman of the Stock Exchange of Mauritius Ltd, Director of Central Depository & Settlement Co Ltd and Ireland Blyth Limited. He has been with the IBL Group since 1977 and is currently the Chief Finance Offi cer of the Group.
John Edward O’NEILL, BCom (Hons), Chartered Accountant Non-Executive Director
Mr O’Neill has been appointed on 27th September 2012 and has over 16 years of extensive auditing experience within the fi nancial services sector with specialised knowledge in retail and stock broking, treasury, corporate and investment banking and securities trading. Mr O’Neill is currently the Chief Executive Offi cer of Zurich South Africa.
Alain MALLIATE, FCII, ACISExecutive Director
Mr Malliaté was appointed as Executive Director on 30th March 2004. He has been with the Company since August 1985 and is in charge of the Fire and Accident and Claims Departments of Mauritian Eagle Insurance.
Simon-Pierre REY, BA (Hons), ACANon-Executive Director
Mr Rey was appointed as Non-Executive Director on 3rd August 1989 and is also the Company Secretary since December 1996. He is currently the Chief Operating Offi cer in charge of Corporate Services of Ireland Blyth Limited.
M
auri
tian
Eag
le In
sura
nce
Co
mp
any
Lim
ited
Ann
ual R
epo
rt 2
012
5

DIRECTORS OF SUBSIDIARIES
Philip VENPIN, BSc Executive DirectorMauritian Eagle Life Company Limited
Joined Mauritian Eagle Insurance Company Limited in 1991 as Marketing manager, Mr Venpin who holds a bachelor degree in Actuarial science from the University of Toronto currently heads the Life and Pensions department. His areas of expertise are business and product development. Mr Venpin is a member of the Insurance Institute of Mauritius.
Yves MEYEPA Executive DirectorMauritian Eagle Leasing Company Limited
Mr Meyepa worked for more than 20 years in the IBL Group before joining Mauritian Eagle Leasing Company Limited at its incorporation as Executive Manager. He was appointed Executive Director in September 2005. His areas of responsibility include the management of day-to-day activities and liaison with regulatory authorities.
Natasha WONG CHUNG KI, FCCA, MBAExecutive DirectorMauritian Eagle Leasing Company Limited
Appointed Executive Director in September 2005, after having held offi ce in the audit department of Kemp Chatteris Deloitte and accounting department of DTOS Ltd, Mrs Wong Chung Ki’s areas of responsibility include the establishment of policies and procedures and monitoring of the fi nancial aff airs of the company.
M
auri
tian
Eag
le In
sura
nce
Co
mp
any
Lim
ited
Ann
ual R
epo
rt 2
012
7

Pierre AH SOON, ACCAFinance Manager
Joined in 2004, Pierre’s area of expertise is audit in which he has more than 5 years experience in an off shore company. He is actually responsible for the activities of the Finance department and is the Money Laundering Reporting Offi cer of the Company.
Bruno CHAN SIP SIONG, BSc (Hons)Manager, IT Department
Joined in 1995, Bruno has been working in the IT fi eld for more than 15 years including 10 in the insurance industry. Bruno is responsible for the day-to-day operations of IT Services department and end-user support. His other areas of responsibility also include the maintenance of insurance application systems.
José ARSENIUS, CISA, CISM Senior Manager, IT Department
Joined in 1994, with more than 20 years experience in the IT sector, José is the head of the IT Services department. He is responsible for all corporate management & information systems such as Information Security, Quality, Business Continuity and IT Service. He is both a Chartered IT and a Certifi ed Information Security Professional.
Vikash MUNGLA, BA (Hons)Reinsurance Manager
Joined in 2003 after more than 5 years with a world leading reinsurer, Vikash leads the Reinsurance department, including the underwriting of Global insurance policies. His main area of expertise is Reinsurance Analytics with specialization in dynamic fi nancial analysis and treaty structuring.
Winson CHAN CHIN WAH, ACII, Chartered Insurer Manager, Marine Department
Joined in 2004, with a vast experience in the general insurance industry, Winson leads the Marine department. He is a Chartered Insurer and a member of the Insurance Institute of Mauritius.
MANAGERS’ PROFILES
Mau
riti
an E
agle
Insu
ranc
e C
om
pan
y Li
mit
ed
Ann
ual R
epo
rt 2
012
8

Stéphanie PALLAMY, ACII, Chartered InsurerManager, Motor Department
Joined in 2005, Stéphanie has been working in the insurance industry for more than 10 years and is currently responsible for the operations of the Motor department. She is a Chartered Insurer and a council member of the Insurance Institute of Mauritius.
Jean Mario TYPHIS, ACII Senior Manager, Fire and Accident Department
Joined in 1987 as Reinsurance manager after more than 13 years in the reinsurance industry. His responsibilities subsequently moved to the underwriting and development of the Fire and Accident department which embraces fi re, accident, liability and engineering classes of insurance. Mario is a Chartered Insurer and is a member of the Insurance Institute of Mauritius.
Joëlle GRENOUILLE, BSc Human Resources Manager
Joined in 2011, Joëlle is responsible of the HR requirements of the Financial Services sector. Her responsibilities include recruitment, coaching, training, career development and counselling. Joëlle is the co-ordinator of the CSR Program of the Financial Services sector.
Gilbert PETITE Senior Manager, Claims Department
Joined in 1999, with more than 35 years experience in the insurance industry, Gilbert is conversant with both English and French insurance procedures. He actually manages the day-to-day operations of Claims department which processes motor, fi re and engineering claims. He is a member of the Insurance Institute of Mauritius.
Jean Claude TSANG YAN SANG, MCIM, MBA Senior Manager, Sales and Marketing Department
Joined in 2004, Jean Claude has worked in the insurance industry for the past 15 years. His area of expertise includes marketing analysis and planning. He is currently responsible for the Sales and Marketing department. Jean Claude is a member of the Chartered Institute of Marketing and of the Insurance Institute of Mauritius.
Allen LEUNG YOON SIUNG, Cert CII Manager, Fire and Accident Department
Joined in April 2012 with more than 20 years of experience in the insurance industry, Allen is responsible for the underwriting of fi re, accident, liability and engineering classes of insurance. He is a member of the Insurance Institute of Mauritius.
Mau
riti
an E
agle
Insu
ranc
e C
om
pan
y Li
mit
ed
Ann
ual R
epo
rt 2
012
9


MANAGERS OF SUBSIDIARIES
Guyto DEVALET, ACII Technical ManagerMauritian Eagle Life Company Limited
Joined the company in 2006 and has cumulated up to now more than 23 years experience in the fi eld of Life Insurance in diff erent positions. Guyto’s present area of responsibility in the Life & Pension Department includes technical aspects such as underwriting, group life, reinsurance and calculations.
Soobiraj KHAITOO, ACCA, MBA Operations ManagerMauritian Eagle Leasing Company Limited
Appointed Operations Manager in January 2009, after having held the post of accountant in diff erent departments within IBL since year 2000. Soobiraj’s responsibility include administration of the leasing department, client relationships and business development.
M
auri
tian
Eag
le In
sura
nce
Co
mp
any
Lim
ited
Ann
ual R
epo
rt 2
012
11

Notice is hereby given that the thirty-seventh Annual Meeting of the Shareholders of the Company will be held at the offi ces of the Company, 1st Floor, IBL House, Caudan, Port Louis on Friday 7th December 2012 at 14.00 hours to transact the following business :
Ordinary Resolutions • To adopt the minutes of proceedings of the annual meeting held on 1st December 2011.
• To receive and adopt the Group’s and Company’s fi nancial statements for the year ended 30 June 2012 and the Directors’ and Auditors’ reports thereon.
• To re-appoint Messrs Deloitte as Auditors for the ensuing year and to authorise the Board of Directors to fi x their remuneration.
• To appoint Mr John Edward O’Neill as Director.
• To re-elect as Directors to hold offi ce until the next Annual Meeting by way of separate resolutions the following persons:
- Mr André Chung Shui - Mr Robert Ip Min Wan - Me Gilbert Ithier - Me Subhash Lallah - Mr Gaetan Lan Hun Kuen - Mr Nicolas Maigrot - Mr Alain Malliaté - Mr Simon-Pierre Rey
By Order of the BoardSimon-Pierre ReySecretaryPort Louis, Mauritius
21 November 2012
A member entitled to attend and vote at the meeting may appoint any person, whether a member or not, to attend and vote in his stead. Proxy forms
must be lodged at the registered offi ce of the company not less than twenty-four hours before the meeting. A proxy form is included in the Annual Report
and is also available at the Registered Offi ce of the Company.
NOTICE OF ANNUAL MEETING
M
auri
tian
Eag
le In
sura
nce
Co
mp
any
Lim
ited
Ann
ual R
epo
rt 2
012
12

Overall resultsThe Group posted a turnover of Rs1,420.1m (LY: Rs1,256.0m), representing an increase of 13.1% over the corresponding period. Profi t before tax (PBT) increased signifi cantly to reach Rs98.2m (LY: Rs45.9m), last year’s fi gure included major provisions for impairment of trade receivables at the Leasing subsidiary.
Earnings per share stood at Rs10.40 (LY: Rs7.16) and Net Asset per share was Rs67.81 (LY: Rs63.62).
Short term insuranceThe Company generated improved turnover and profi tability. Gross insurance premiums increased by 12.7% to reach a total of Rs739.3m. All departments posted growth, with the Engineering department recording the largest increase at 96.6%. Net claims incurred were relatively stable at 54.3% (LY: 54.7%). Reinsurance costs went down to 46.8% of Gross premiums (LY: 47.9%). There were no major increases in the reinsurance rates during the year despite the major catastrophes which occurred during 2011. Underwriting profi ts as a percentage of net earned premiums improved to 17.1% (LY: 16.6%).
PBT amounted to Rs92.9m (LY: Rs75.9m), an increase of 22.5%.
Long term insuranceThe life fund stood at Rs 597.5m (LY: Rs 515.6m) on 30th June 2012.
Gross premiums went down to Rs 184.8m (LY: Rs208.8m), a decrease of 11.5%. However, last year’s turnover was exceptionally boosted by Rs91.7m, with some of the clients renewing their interest in the same product and other unit-linked products. No profi t was recognised by the life operations as recommended by the actuaries (LY: PBT of Rs11.2m).
Associate in SeychellesH Savy Insurance, an entity where we hold 20% of the issued share capital, performed reasonably during the year. We have consolidated Rs 5.9m (LY: Rs6.4m) within the year’s results. We received dividends amounting to Rs1.1m (LY: Rs2.8m) during the year.
LeasingThe department was in a marginal profi t position with a PBT of Rs0.4m (LY: loss of Rs44.8m) for the year. The leasing portfolio stood at Rs 1.56bn (LY: Rs 1.30bn) at the end of the year.
DividendsAn interim dividend of Rs1.10 (LY: Rs1.00) was paid during the year. The directors recommend that a fi nal dividend of Rs 1.30 (LY: 1.10) be paid to the shareholders.
Activities under CSRThe Group has been very active with many projects, a summary of these projects is included in the Corporate Governance Report on page 15.
DirectorsMessrs Gavin Munnoch and Dylan Garnett resigned from the Board with eff ect from 20th May and 31st May 2012 respectively. We thank them for their contributions to the deliberations of the Board.
ProspectsCompetition remains fi erce in the short term insurance sector. As competitors continue to fi ght for market share, premium rates remain under pressure and in some cases are being pushed below economic levels. This is not a healthy situation for the sector.
We will endeavour to maximise the use of our reinsurance treaties for the various risks that we are underwriting. Underwriting profi ts will continue to be our priority as we move forward.
AppreciationOur appreciation goes to the management and staff of the company for their contributions and commitment. Mr Mike Henry, Manager in the Fire & Accident department, retired during the year on grounds of ill-health, we thank him for his important contribution over the years. The management team witnessed the arrival of Mr Allen Leung in the Fire & Accident department. Lastly, we are grateful to our fellow directors for their involvement on the Board and the various committees.
CHAIRMAN’S AND MANAGING DIRECTOR’S REPORT
Nicolas Maigrot Chairman
Andre Chung ShuiManaging Director
Mau
riti
an E
agle
Insu
ranc
e C
om
pan
y Li
mit
ed
Ann
ual R
epo
rt 2
012
13


CORPORATE INFORMATION AND HISTORY
Mauritian Eagle Insurance Company Limited (“MEI”) was incorporated in 1973 and admitted on the Offi cial List of the Stock Exchange of Mauritius in 1993. MEI operates in both the domestic and commercial markets and is engaged in short-term insurance business. As from 1 January 2011, the activities of the long-term business of MEI were transferred to Mauritian Eagle Life Company Limited (“MEL”), a wholly-owned subsidiary of the Company. Mauritian Eagle Leasing Company Limited (“MELCO”), another subsidiary of MEI, provides deposit taking services and leasing facilities, both fi nance and operating leases.
Major Milestones2012 MEI awarded ISO 20000 IT Service Management Certifi cation
2010 Establishment of MEL as a separate entity
2007 MEI awarded ISO 27001:2005 Certifi cation
2005 MEI increased its stake to 20% in H.Savy Insurance Company Limited
2004 MEI obtained QM 9004 Certifi cation MEI participated in NQA Level 2 MEI celebrated its 30 years (1974-2004)
2003 MEI received Quality Commitment Award MEI obtained ISO 9001:2000 Certifi cation Second Branch Offi ce in Rodrigues
2002 Launching of Mauritian Eagle’s corporate website First Branch Offi ce in Centre de Flacq
2001 Establishment of MELCO
1998 Moving into new premises at Caudan
1996 MEI acquired a 15% stake in H.Savy Insurance Company Limited
1994 MEI celebrated its 20 years
1993 MEI listed on the Stock Exchange of Mauritius 1991 Launching of Life Assurance Policies & Pension Plans
1974 ME Insurance starts operation
CORPORATEGOVERNANCEREPORT
M
auri
tian
Eag
le In
sura
nce
Co
mp
any
Lim
ited
Ann
ual R
epo
rt 2
012
15

CORPORATE GOVERNANCE STATEMENTS
The Board, management and staff of the Group fully support and are committed to best practices of business integrity, transparency and professionalism.
We strive to ensure that all the activities of the Group are conducted in such a way as to satisfy the characteristics of good Corporate Governance, namely, • Discipline – behaviour that is universally recognised and accepted as correct and proper;• Transparency – ease with which an outsider is able to make meaningful analysis of the Company’s actions, its economic fundamentals
and the non-financial aspects pertinent to the business;• Independence – the extent to which mechanisms have been put in place to avoid or manage conflicts; • Accountability – the existence of effective mechanisms to ensure accountability; • Responsibility – the implementation of processes that allow for corrective actions and acting responsibly towards all stakeholders;• Fairness – the existence of systems within the Company that allow balancing of competing interests; and • Social responsibility – being aware of and responding to social issues and to place a high priority on ethical standards.
The Group is committed to high standards of corporate governance with the Board being accountable to the shareholders for good governance. The Board of Directors recognises that the Report on Corporate Governance (the Code) is regarded as best practice and therefore uses its best endeavours to ensure compliance with the provisions set out in the Code.
The Group has established a corporate governance system involving the Board of Directors, Board Committees, Management, Internal and External Auditors, Industry Best Practices as well as established policies and procedures across all operations. This ensures that the business and affairs of the Group are managed according to the highest standards of corporate governance and in the best interest of all its stakeholders.
GROUP STRUCTURE
GML Investissement Limitée(48.29%)
Zurich Insurance Company South Africa Limited
(15%)
Mauritian Eagle Life Company Limited
(100%)
Mauritian Eagle Insurance Company Limited
Public(27.23%)
Ireland Blyth Limited(60%)
H. Savy Insurance Company Limited –Seychelles
(20%)
Other Shareholders(24.48%)
Other Shareholders(25%)
Mauritian Eagle Leasing Company Limited
(51%)
CORPORATE GOVERNANCE REPORT
M
auri
tian
Eag
le In
sura
nce
Co
mp
any
Lim
ited
Ann
ual R
epo
rt 2
012
16

BOARD OF DIRECTORS
The Board bears the responsibility of organizing and directing the affairs of the Group in a manner that is in the best interest of shareholders and other stakeholders. It is primarily responsible for, amongst other things, the review and adoption of strategic plans, the overview of business performance, adoption of appropriate risk management systems and the establishment of proper internal control systems.
It is also responsible for continually reviewing the activities, practices and trends of the Group so that these are in conformity with legal and regulatory requirements. The Board retains full and effective control over MEI and its subsidiaries, delegating the day-to-day running and operational issues to the Managing Director and his management team.
CompositionThe Board, under the recommendation of the Nomination Committee, is responsible for the appointment of directors who are selected on the basis of their integrity, skill, acumen and experience to make sound judgements relevant to the business of the Company. The Board includes two executive directors, three independent non-executive directors and five non-executive directors. The Company complies with Section 30 (2) of the Insurance Acts 2005 which states that an insurance company’s Board of directors should be composed of no less than 7 natural persons of which 30% should be independent non-executive directors. The independent non-executive directors bring a wealth of experience and expertise to the Board and are free from any business or other relationships which would affect their eligibility to exercise independent judgement.
The Code of Corporate Governance provides for directors to be elected or re-elected every year at the annual meeting of shareholders.
The composition of the Board for the year under review was as follows:Nicolas MAIGROT Non-Executive Chairperson André CHUNG SHUI Managing Director Appointed on 1st July 2011Alain MALLIATE Executive DirectorRobert IP MIN WAN Independent Non- Executive DirectorGilbert ITHIER Independent Non-Executive DirectorSubhash LALLAH Independent Non-Executive DirectorGaetan LAN HUN KUEN Non-Executive DirectorGavin MUNNOCH Non-Executive Director Resigned on 20th May 2012Simon-Pierre REY Non-Executive DirectorDylan GARNETT Non-Executive Director Resigned on 31st May 2012John Edward O’NEILL Non-Executive Director Appointed on 27th September 2012
Changes in directorship
• Mr André CHUNG SHUI was appointed on 1st July 2011• Mr Gavin MUNNOCH resigned on 20th May 2012• Mr Dylan GARNETT resigned on 31st May 2012• Mr John Edward O’NEILL has been appointed on 27th September 2012
New directors have been informed of their duties and responsibilities by way of an induction.
Independent Non-Executive
33%
Executive22%
Non-Executive45%
M
auri
tian
Eag
le In
sura
nce
Co
mp
any
Lim
ited
Ann
ual R
epo
rt 2
012
17

BOARD OF DIRECTORS (continued)
Directors’ attendance at Board Meetings
Mauritian Eagle Life Company Limited The directors of MEL are as follows:Gaetan LAN HUN KUEN Non-Executive Chairman Philip VENPIN Executive Director Robert IP MIN WAN Independent Non- Executive Director Gilbert ITHIER Independent Non-Executive Director Subhash LALLAH Independent Non-Executive Director Gavin MUNNOCH Non-Executive Director Resigned on 20th May 2012André CHUNG SHUI Non-Executive Director Appointed on 1st July 2011
Board attendance of Mauritian Eagle Life Company Limited
Directors Board Meetings27 Sep 2011 7 Nov 2011 13 Feb 2012 7 May 2012
Nicolas Maigrot
André Chung Shui (Appointed on 1st July 2011)
Alain Malliaté apologies
Robert Ip Min Wan
Gilbert Ithier
Subhash Lallah
Gaetan Lan Hun Kuen
Gavin Munnoch (Resigned on 20th May 2012) apologies apologies apologies
Simon-Pierre Rey
Dylan Garnett (Resigned on 31st May 2012) apologies apologies
Directors Board Meetings27 Sep 2011 27 Mar 2012
Gaetan Lan Hun Kuen
Philip Venpin
Robert Ip Min Wan
Gilbert Ithier
Subhash Lallah
Gavin Munnoch (Resigned on 20th May 2012)
André Chung Shui (Appointed on 1st July 2011)
CORPORATE GOVERNANCE REPORT
M
auri
tian
Eag
le In
sura
nce
Co
mp
any
Lim
ited
Ann
ual R
epo
rt 2
012
18

Directors Board Meetings27 Sep 2011 7 Nov 2011 13 Feb 2012 7 May 2012
Nicolas Maigrot
Yves Méyépa
Natasha Wong Chung Ki
Antoine Domingue apologies
Robert Ip Min Wan
Gilbert Ithier
Subhash Lallah
Gaetan Lan Hun Kuen
Simon-Pierre Rey apologies
André Chung Shui (Appointed on 1st July 2011)
Mauritian Eagle Leasing Company Limited The directors of MELCO are:Nicolas MAIGROT Non-Executive Chairperson Yves MEYEPA Executive DirectorNatasha WONG CHUNG KI Executive DirectorAntoine DOMINGUE Independent DirectorRobert IP MIN WAN Independent DirectorGilbert ITHIER Independent DirectorSubhash LALLAH Independent DirectorGaëtan LAN HUN KUEN Non Executive DirectorSimon-Pierre REY Non Executive DirectorAndré CHUNG SHUI Non-Executive Director Appointed on 1st July 2011
Attendance at Board Meetings of Mauritian Eagle Leasing Company Limited
COMMITTEES OF THE BOARD OF DIRECTORS The Board fulfills its proper governance responsibilities through various Committees. Each Board Committee has formal written terms of reference in line with the Mauritian Code of Corporate Governance and international best practices that are reviewed on an annual basis. The directors confirm that the committees have functioned in accordance with these terms of reference during the year under review.
Two Committees deal with audit, risk, corporate governance and nomination issues.
Audit and Risk CommitteeThe Audit and Risk Committee is appointed by the Board of MEI and is chaired by an independent non-executive director, and comprises of at least two members who are non-executive directors. For the year under review, the Committee consisted of three directors, namely, Messrs.
Robert IP MIN WAN Independent Non-Executive DirectorGaetan LAN HUN KUEN Non-Executive Director and Simon Pierre REY Non-Executive Director
Its principal function is to oversee the financial reporting process. The activities of the Audit Committee includes regular reviews and monitoring of the effectiveness of MEI’s financial reporting and internal control policies and risk management systems, the effectiveness of the internal audit function, the independence of the external audit process and assessment of the external auditor’s performance, the remuneration of external auditors and to ensure compliance with laws and regulations relevant to financial reporting and with our internal code of business conduct. The Committee meets as frequently as it deems necessary prior to the Board’s review of the annual financial statements and profit announcements.
M
auri
tian
Eag
le In
sura
nce
Co
mp
any
Lim
ited
Ann
ual R
epo
rt 2
012
19

COMMITTEES OF THE BOARD OF DIRECTORS (continued)
Attendance to the Audit and Risk Committee for year under review was as follows:
Committee members Committee Meetings29 July 2011 22 Sep 2011 3 Nov 2011 2 Feb 2012 2 May 2012
Robert Ip Min Wan
Gaetan Lan Hun Kuen apologies
Simon-Pierre Rey apologies apologies
The presence of internal and external auditors and management team was requested whenever necessary. The internal audit function is entrusted to Ernst & Young who have been given unrestricted access to the records, management and employees of the group. The Board confirms that there have been no significant issues that have affected the proper functioning of the internal control systems during the year under review which could have impacted on the financial statements.
Risk Management
The Audit and Risk Committee is also responsible for reviewing the effectiveness of the risk strategy of MEI, for establishing and maintaining a strong risk control environment and for the monitoring of the risk management process. It ensures that appropriate structures, procedures and systems are in place to mitigate all risks. Risk assessment activities were carried out during the year under review and the risks discussed and identified. A Risk management process was implemented to minimize the impact of identified risks which have been categorised as follows:
• Insurance Risk MEI’s insurance activities are primarily concerned with the pricing, acceptance and management of risks from customers and also
include reinsurance risks. The claims department closely monitors claims developments whilst treaty purchases are analysed to ensure that the level of cover is aligned with the company’s strategy and objectives.
• Operational Risk Operational risks can have significant negative impact on the company’s financial position. These are fraud risks, reputational risks,
material damage, business continuity risks and disaster recovery, change management and human resources risks. In line with the requirement of the ISO standard which requires the identification of an operational area which is accessible to all stakeholders in case the company needs to rapidly operate after a disaster, a Business Continuity Management System has been implemented and tested during the year under review.
• Regulatory and Environment Risk These include regulatory risks and industry risks which can result in increased pressures and significantly affect the company’s ability
to conduct business.
• IT Risk These are the risks that hardware and software used are exposing the company to losses. MEI is certified ISO 27001-2005 Security
Management System Certification since February 2007.
CORPORATE GOVERNANCE REPORT
M
auri
tian
Eag
le In
sura
nce
Co
mp
any
Lim
ited
Ann
ual R
epo
rt 2
012
20

Corporate Governance CommitteeThe Corporate Governance Committee is appointed by the Board and the majority of which is composed of non-executive directors. The current committee consists of five members with the Chairman being an independent non-executive director and four other members, two of whom are non-executive directors.
The current Committee is composed of Messrs. Subhash LALLAH Independent Non-Executive DirectorGaetan LAN HUN KUEN Non-Executive DirectorSimon-Pierre REY Non-Executive DirectorAndre CHUNG SHUI Managing Director andAlain MALLIATE Executive Director
Attendance of Corporate Governance Committee for year under review was as follows:
The main functions of the Corporate Governance Committee is to provide guidance to the Board on aspects of corporate governance and for recommending the adoption of policies and best practices as appropriate for the Group. The Committee meets at least twice a year and on an ad-hoc basis.
Remuneration PhilosophyThe Board has entrusted the Corporate Governance Committee the responsibility for the nomination and remuneration of Directors by taking into consideration the market conditions, benchmarking in the industry and the Group’s results.
The Group strongly believes that the achievements and merits of high performing employees should be recognized and rewarded. The Human Resources department is delegated the responsibility of determining managers’ and employees’ remunerations and benefits. This is reviewed annually after taking into consideration market conditions and practices as well as the performances and responsibilities of the employees.
Internal ControlThe directors have the overall responsibility for maintaining a sound and effective system of internal controls. The system of internal controls has been designed to provide the Directors with reasonable assurance that assets of the Group are safeguarded, that transactions are authorised and properly recorded, that material misstatements or losses are either prevented or detected within a reasonable time and that the risks of failures in operational systems are being managed.
Dividend PolicyDividends are declared and paid half yearly. Subject to internal cash flow requirements and the need for future capital investments, it is MEI’s policy to declare dividends out of profits available for distribution in accordance with the Companies Act 2001 and International Financial Reporting Standards; the balance being transferred to reserves. For the year under review, a dividend of Rs 17,599,994 was paid (2011: Rs 15,999,996).
SHAREHOLDERS’ CALENDAR
Release of first quarter results November 2012 Payment of final dividend December 2012 Annual meeting of shareholders December 2012 Release of second quarter results and declaration of interim dividend February 2013 Payment of interim dividend April 2013 Release of third quarter results May 2013 Release of financial year end results and declaration of final dividend September 2013
Committee members Committee Meetings22 Sep 2011 2 Feb 2012
Subhash Lallah
Gaetan Lan Hun Kuen apologies
Simon-Pierre Rey apologies
Andre Chung Shui
Alain Malliaté
M
auri
tian
Eag
le In
sura
nce
Co
mp
any
Lim
ited
Ann
ual R
epo
rt 2
012
21

OTHER STATUTORY DISCLOSURES
Directorship of other listed companiesIncluded in Directors’ profile
Common DirectorsThe common directors of MEI and its subsidiaries are as follows:
The directors’ remuneration is disclosed by category in view of the confidentiality and sensitivity of the information.
The directors’ remuneration has also been disclosed under note 38 for related party transactions.
Directors’ remuneration and benefitsEmoluments paid by MEI and related corporations to directors of MEI is set out in the table below:
Directors Mauritian Eagle Insurance
Company Limited
Mauritian Eagle Leasing Company
Limited
Mauritian Eagle Life Company
LimitedAndré Chung Shui (Appointed on 1st July 2011) Director Director Director
Antoine Domingue - Director -
Dylan Garnett (Resigned on 31st May 2012) Director - -
Robert Ip Min Wan Director Director Director
Gilbert Ithier Director Director Director
Subhash Lallah Director Director Director
Gaetan Lan Hun Kuen Director Director Chairman
Alain Malliaté Director - -
Nicolas Maigrot Chairman Chairman -
Yves Méyépa - Director -
Gavin Munnoch (Resigned on 20th May 2012) Director - Director
Simon-Pierre Rey Director Director -
Philip Venpin - - Director
Natasha Wong Chung Ki - Director -
The Group The Company Related Corporations
2012Rs’000
2011Rs’000
2012Rs’000
2011Rs’000
2012Rs’000
2011Rs’000
Full-Time 16,480 17,159 8,828 11,090 - -
Part-Time 1,653 905 483 395 41,381 43,882
18,133 18,064 9,311 11,485 41,381 43,882
CORPORATE GOVERNANCE REPORT
M
auri
tian
Eag
le In
sura
nce
Co
mp
any
Lim
ited
Ann
ual R
epo
rt 2
012
22

Directors’ Service ContractsThere are no service contracts between MEI and its directors.
Directors’ Share InterestsNone of the directors have a direct or indirect share in the equity of MEI or its subsidiaries.
Share DealingsMembers of the Board have been informed that they should not deal in MEI’s shares during the 30 calendar days preceding publication of results, and prior to the declaration of dividends, or any major event affecting the company that might influence its share price. Members have also been advised to declare to MEI all transactions conducted by them outside the periods mentioned.
Significant ContractsNo contracts of significance existed during the year under review between MEI or one of its subsidiaries and any director or controlling shareholder of MEI, either directly or indirectly.
Substantial ShareholdingThe directors have been advised that the following persons or entities (excluding directors) held 5% or more of the nominal value of the share capital of MEI.
N.B. The above number of shareholders is indicative, due to consolidation of multi portfolios for reporting purposes. The total number of active shareholders as at 30 June 2012 was 614.
ConstitutionThe constitution of MEI does not provide any ownership restriction or pre-emption rights. It is in conformity with the Companies Act 2001 and the Mauritius Stock Exchange Listing Rules.
Auditor’s fees
Messrs. Deloitte, who has accepted to continue in office, will be proposed for re-appointment at the Annual Meeting.
Shareholding ProfileOwnership of ordinary share capital by size of shareholding as at 30 June 2012 was as follows:
Shareholders holding more than 5% of the shares Number of ordinary shares %Ireland Blyth Limited 4,800,000 60.00%
Zurich Insurance Company South Africa Limited 1,200,000 15.00%
Size of Shareholding Number of shareholders Number of Shares Owned % Holding1 - 100 shares 169 7,339 0.09%
101 - 200 shares 54 9,220 0.12%
201 - 300 shares 46 13,643 0.17%
301 - 500 shares 34 14,367 0.18%
501 - 1000 shares 89 64,372 0.80%
Above 1000 shares 184 7,891,057 98.64%
576 7,999,998 100.00%
The Group The Company
Fees paid to Deloitte for:2012
Rs’0002011
Rs’0002012
Rs’0002011
Rs’000
Audit fees 488 404 230 222
Tax services 10 15 - -
Advisory services - 760 - 471
498 1,179 230 693
M
auri
tian
Eag
le In
sura
nce
Co
mp
any
Lim
ited
Ann
ual R
epo
rt 2
012
23

OTHER STATUTORY DISCLOSURES (continued)
Share price information and performance
Year ended 30-Jun-12
Year ended 30-Jun-11
6 months ended 30-Jun-10
Year ended 31-Dec-09
Year ended 31-Dec-08
Market Price (Rs) 70.00 80.00 62.00 65.00 45.50
Earnings Per Share (Rs) 10.40 7.34 3.33 4.30 6.99
Dividend per share (Rs) 2.40 2.10 1.00 1.83 1.83
Price Earnings ratio (times) 6.73 10.90 18.62 15.12 24.86
Net Assets value per share (Rs) 67.81 63.62 55.17 51.22 42.55
Dividend yield (%) 3.43 2.63 3.23 2.82 4.02
Relationship with shareholdersThe Board is committed to properly understand the information needs of all shareholders and other stakeholders of MEI. It ensures that lines of communication are kept open to communicate all matters affecting MEI to its shareholders.
Anti-Money LaunderingIn line with the requirements of the Financial Intelligence and Anti-Money Laundering Act 2002 and the Regulations 2003, control procedures and internal policies are regularly reviewed and staff training is done at least twice yearly.
Safety, Health and Environmental PracticesHealth and safety policies adopted have ensured satisfactory compliance with the appropriate legislation and ruling standards. No injuries at work were recorded. The Group adheres to the IBL Group’s health and safety and environmental policies.
Code of EthicsThe Group is committed to the highest standards of integrity and ethical conduct with all its stakeholders.
Social ResponsibilityThe Group has kept working towards the advancement and welfare of its employees and the socio-economic development of the island. In line with the Group’s corporate social responsibility policy to help underprivileged children, numerous activities have been organised and staff have been encouraged to participate; these include amongst others:
• Sweat shirts were offered to needy children of Vuillemin Voluntary Association at Cite Sainte Catherine, Saint Pierre;• In addition to providing musical instruments for children aged 6-17 years, school materials were also provided to Groupe Zenfants
Innocents at Quatre Bornes;• Tables and chairs were provided to Fraternité Nord-Sud, an organisation promoting the education of children who have not completed
the Certificate of Primary Education exams;• Books and furniture were offered to Association des Amis de Don Bosco for the setting up of an educational room for children aged
5 to 15;• A Christmas tree and gifts were offered to needy children of The Thalassemia Society; and• At the request of Commission Solidarite et Justice, an offspring of Caritas Ile Maurice, a Christmas carol for 140 children and an
educational outing for 60 children were organised. A summer camp was also set up at Senlis-Sur-Mer, Riambel for youngsters aged 14 to 15.
CORPORATE GOVERNANCE REPORT
M
auri
tian
Eag
le In
sura
nce
Co
mp
any
Lim
ited
Ann
ual R
epo
rt 2
012
24
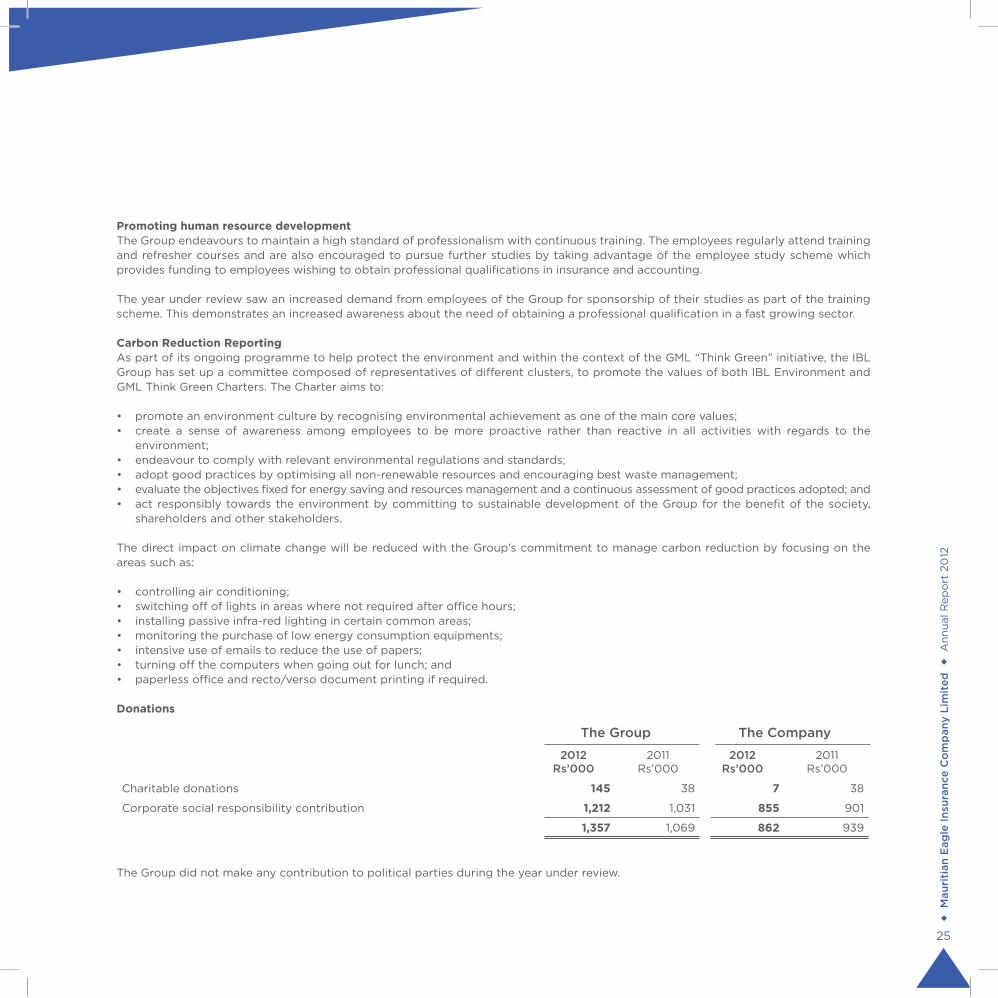
Promoting human resource developmentThe Group endeavours to maintain a high standard of professionalism with continuous training. The employees regularly attend training and refresher courses and are also encouraged to pursue further studies by taking advantage of the employee study scheme which provides funding to employees wishing to obtain professional qualifications in insurance and accounting.
The year under review saw an increased demand from employees of the Group for sponsorship of their studies as part of the training scheme. This demonstrates an increased awareness about the need of obtaining a professional qualification in a fast growing sector.
Carbon Reduction ReportingAs part of its ongoing programme to help protect the environment and within the context of the GML “Think Green” initiative, the IBL Group has set up a committee composed of representatives of different clusters, to promote the values of both IBL Environment and GML Think Green Charters. The Charter aims to:
• promote an environment culture by recognising environmental achievement as one of the main core values;• create a sense of awareness among employees to be more proactive rather than reactive in all activities with regards to the
environment;• endeavour to comply with relevant environmental regulations and standards;• adopt good practices by optimising all non-renewable resources and encouraging best waste management;• evaluate the objectives fixed for energy saving and resources management and a continuous assessment of good practices adopted; and• act responsibly towards the environment by committing to sustainable development of the Group for the benefit of the society,
shareholders and other stakeholders.
The direct impact on climate change will be reduced with the Group’s commitment to manage carbon reduction by focusing on the areas such as:
• controlling air conditioning;• switching off of lights in areas where not required after office hours;• installing passive infra-red lighting in certain common areas;• monitoring the purchase of low energy consumption equipments;• intensive use of emails to reduce the use of papers;• turning off the computers when going out for lunch; and• paperless office and recto/verso document printing if required.
Donations
The Group The Company
2012Rs’000
2011Rs’000
2012Rs’000
2011Rs’000
Charitable donations 145 38 7 38
Corporate social responsibility contribution 1,212 1,031 855 901
1,357 1,069 862 939
The Group did not make any contribution to political parties during the year under review.
M
auri
tian
Eag
le In
sura
nce
Co
mp
any
Lim
ited
Ann
ual R
epo
rt 2
012
25

STATEMENT OF DIRECTORS’ RESPONSIBILITIES
The directors acknowledge their responsibilities to prepare the fi nancial statements that fairly present the state of aff airs of the Group and the Company as at the end of the fi nancial year and the results of its operations and cashfl ows for that period in accordance with International Financial Reporting Standards and in compliance with the requirements of the Mauritius Companies Act 2001 and the Financial Reporting Act 2004. In preparing each of the Group and Company fi nancial statements the Directors have: • selected appropriate accounting policies supported by reasonable and prudent judgements and estimates and then applied them
consistently; • adhere to applicable accounting standards or, if there has been any departure in the interest of fair presentaton, this must not only
be disclosed and explained but quantifi ed; and
• prepared the fi nancial statements on a going concern basis.
The Directors are responsible for:
• the maintenance of adequate accounting records which disclose with reasonable accuracy at any time the fi nancial position of the Company.
• the set up of an eff ective system of internal controls and risk management; and • safeguarding the assets of the Company and hence for taking reasonable steps for the prevention and detection of fraud and other
irregularities. The external auditors are responsible for reporting on whether the fi nancial statements are fairly presented.
Signed on behalf of the Board of Directors
DIRECTOR DIRECTOR
26 September 2012
DIRECTOR
M
auri
tian
Eag
le In
sura
nce
Co
mp
any
Lim
ited
Ann
ual R
epo
rt 2
012
26

CERTIFICATE FROM THE COMPANY SECRETARY
In terms of Section 166(d) of the Companies Act 2001, I certify that to the best of my knowledge and belief, the Company has fi led with the Registrar of Companies all such returns as are required of the Company under the Companies Act.
Simon-Pierre ReyCompany Secretary
26 September 2012
M
auri
tian
Eag
le In
sura
nce
Co
mp
any
Lim
ited
Ann
ual R
epo
rt 2
012
27

PREMIUM AND PROFITABILITY CHARTS
General Business- Breakdown by category
Transportation 14%
Engineering 5%
Fire & Allied 29%
Motor 27%
Group Turnover
2008
200,000
400,000
600,000
800,000
1,000,000
1,200,000
1,400,000
1,600,000
Rs.000
Rs.000
2009 2010(6 months)
2011 2012
Profitability before and after Tax
Before Tax After Tax
Management Expense ratio
2008
10,000
20,000
30,000
40,000
50,000
Per
cent
age
of
Turn
over
60,000
70,000
80,000
90,000
2009 2010(6 months)
2011 20122008 2009 2010
(6 months)
11%
12%
14%
78,3
24
1,420
,09
4
1,256
,015
1,06
0,8
94
541,8
34
1,122
,00
6
92,
925
75,8
51
32,6
8740
,772
56,8
06 66
,58
7
27,9
94
30,3
12
49
,833
15%
11%
2011 2012
Accident 25%
M
auri
tian
Eag
le In
sura
nce
Co
mp
any
Lim
ited
Ann
ual R
epo
rt 2
012
28

M
auri
tian
Eag
le In
sura
nce
Co
mp
any
Lim
ited
Ann
ual R
epo
rt 2
012
29
INDEPENDENT AUDITOR’S REPORT TO THE SHAREHOLDERSOF MAURITIAN EAGLE INSURANCE COMPANY LIMITED
This report is made solely to the company’s shareholders, as a body, in accordance with section 205 of the Mauritius Companies Act 2001. Our audit work has been undertaken so that we might state to the company’s shareholders those matters we are required to state to them in an auditor’s report and for no other purpose. To the fullest extent permitted by law, we do not accept or assume responsibility to anyone other than the company and the company’s shareholders as a body, for our audit work, for this report, or for the opinions we have formed.
Report on the Financial Statements
We have audited the financial statements of Mauritian Eagle Insurance Company Limited (“the company”) and its subsidiaries (collectively referred as “the group”) on pages 30 to 97 which comprise the statements of financial position as at 30 June 2012 and the statements of comprehensive income, statements of changes in equity and statements of cash flows for the year then ended and a summary of significant accounting policies and other explanatory information.
Directors’ responsibilities for the financial statements The directors are responsible for the preparation and fair presentation of these financial statements in accordance with International Financial Reporting Standards and in compliance with the requirements of the Mauritius Companies Act 2001 and the Financial Reporting Act 2004. They are also responsible for such internal control as they determine is necessary to enable the preparation of financial statements that are free from material misstatement, whether due to fraud or error.
Auditor’s responsibilityOur responsibility is to express an opinion on these financial statements based on our audit. We conducted our audit in accordance with International Standards on Auditing. Those standards require that we comply with ethical requirements and plan and perform the audit to obtain reasonable assurance whether the financial statements are free from material misstatement.
An audit involves performing procedures to obtain audit evidence about the amounts and disclosures in the financial statements. The procedures selected depend on the auditor’s judgment, including the assessment of the risks of material misstatement of the financial statements, whether due to fraud or error. In making those risk assessments, the auditor considers internal control relevant to the entity’s preparation and fair presentation of the financial statements in order to design audit procedures that are appropriate in the circumstances, but not for the purpose of expressing an opinion on the effectiveness of the entity’s internal control. An audit also includes evaluating the appropriateness of accounting policies used and the reasonableness of accounting estimates made by management, as well as evaluating the overall presentation of the financial statements.
We believe that the audit evidence we have obtained is sufficient and appropriate to provide a basis for our audit opinion.
OpinionIn our opinion, the financial statements on pages 30 to 97 give a true and fair view of the financial position of the group and company as at 30 June 2012, and of their financial performance and cash flows for the year then ended in accordance with International Financial Reporting Standards and comply with the requirements of the Mauritius Companies Act 2001 and the Financial Reporting Act 2004.
Report on other legal requirementsIn accordance with the requirements of the Mauritius Companies Act 2001, we report as follows:
• wehavenorelationshipwith,orinterestsin,thecompanyanditssubsidiariesotherthaninourcapacitiesasauditorandtaxadvisor;• wehaveobtainedallinformationandexplanationsthatwehaverequired;and• inouropinion,properaccountingrecordshavebeenkeptbythecompanyasfarasappearsfromourexaminationofthoserecords.
The Financial Reporting Act 2004The directors are responsible for preparing the Corporate Governance Report and making the disclosures required by Section 8.4 of the Corporate Governance of Mauritius (“Code”). Our responsibility is to report on these disclosures.
In our opinion, the disclosures in the Corporate Governance Report are consistent with the requirements of the Code.
Insurance Act 2005
The financial statements have been prepared in the manner and meet the requirements specified by the Financial Services Commission.
7th Floor, Raffles Tower19 CybercityEbèneMauritius
DeloitteChartered Accountants
26 September 2012
L. Yeung Sik Yuen, ACALicensed by FRC

M
auri
tian
Eag
le In
sura
nce
Co
mp
any
Lim
ited
Ann
ual R
epo
rt 2
012
30
STATEMENTS OF FINANCIAL POSITION AS AT 30 JUNE 2012
The Group The Company2012 2011 2012 2011
Notes Rs'000 Rs'000 Rs'000 Rs'000(Restated)
ASSETSNon-current assetsProperty, plant and equipment 5 589,559 445,909 76,114 78,996 Intangible assets 6 11,028 11,362 2,476 3,692 Investment in subsidiaries 7 - - 127,000 127,000 Investment in associate 8 25,961 19,758 6,313 6,313 Statutory and other deposits 9 2,500 6,500 2,500 6,500 Financial assets 10 492,350 397,825 178,738 145,321 Mortgage and other loans 11 105,165 105,681 - - Finance lease receivables 12 934,970 790,521 - -
2,161,533 1,777,556 393,141 367,822 Current assetsStatutory and other deposits 9 6,500 9,500 6,500 9,500 Mortgage and other loans 11 17,108 16,741 - - Finance lease receivables 12 341,271 264,977 - - Trade and other receivables 13 280,105 259,710 146,356 147,810 Amounts due from group companies 14 272,953 261,492 195,150 184,348 Claims recoverable from reinsurers 15 66,195 67,142 66,195 67,142 Bank and cash balances 33 523,705 383,868 230,172 115,586
1,507,837 1,263,430 644,373 524,386
Total assets 3,669,370 3,040,986 1,037,514 892,208
EQUITY AND LIABILITIESCapital and reserves Stated capital 16 80,000 80,000 80,000 80,000 Reserves 452,350 417,445 424,032 369,868 Equity attributable to owners of the company 532,350 497,445 504,032 449,868 Non-controlling interests 99,305 99,273 - -
Total equity 631,655 596,718 504,032 449,868
Other reserves 17 2,346 2,334 - -
Insurance fundsGeneral insurance fund 18 217,784 167,088 217,784 167,088 Life insurance fund 19 597,511 515,586 - -
815,295 682,674 217,784 167,088 Non-current liabilitiesLoans 20 35,737 45,076 - - Deposits from customers 21 683,331 543,999 - - Deferred tax liabilities 22 11,980 11,581 3,657 3,617
731,048 600,656 3,657 3,617 Current liabilitiesTrade and other payables 23 209,822 114,006 79,228 66,833 Amounts due to immediate holding company 24 - 294 - - Loans 20 43,124 - - - Gross outstanding claims 15 226,977 202,191 226,977 202,191 Deposits from customers 21 1,003,267 839,502 - - Current tax liabilities 25(i) 5,836 2,611 5,836 2,611
1,489,026 1,158,604 312,041 271,635
Total equity and liabilities 3,669,370 3,040,986 1,037,514 892,208
Approved by the Board of Directors and authorised for issue on 26 September 2012
DIRECTOR DIRECTOR

M
auri
tian
Eag
le In
sura
nce
Co
mp
any
Lim
ited
Ann
ual R
epo
rt 2
012
31
STATEMENTS OF COMPREHENSIVE INCOMEFOR THE YEAR ENDED 30 JUNE 2012
The Group The Company 2012 2011 2012 2011
Notes Rs'000 Rs'000 Rs'000 Rs'000
Gross insurance premiums 923,881 864,875 739,345 656,157 Gross lease rental income 496,213 391,140 - -
1,420,094 1,256,015 739,345 656,157
Reinsurance premiums ceded (375,792) (330,127) (346,214) (314,228)Capital element of finance lease rental income (261,325) (197,337) - -
(637,117) (527,464) (346,214) (314,228)
Net Revenue 782,977 728,551 393,131 341,929 Investment income 26 67,463 61,522 30,712 22,558 Commission income 57,356 61,027 53,604 54,077 Other income 27 34,887 13,762 4,168 6,710
942,683 864,862 481,615 425,274 Benefits and ExpensesNet benefits and claims 28 (258,204) (395,918) (186,048) (155,282)Commission payable (87,414) (79,028) (67,735) (60,066)Administrative expenses 29 (244,074) (232,031) (84,211) (76,131)
(589,692) (706,977) (337,994) (291,479)
Profit from operations 352,991 157,885 143,621 133,795
(Release to)/transfer from: General insurance fund 18 (50,696) (57,944) (50,696) (57,944)Life insurance fund 19 (81,925) 69,717 - -
(132,621) 11,773 (50,696) (57,944)
220,370 169,658 92,925 75,851 Finance costs 30 (128,111) (130,151) - -
92,259 39,507 92,925 75,851 Share of profits of associate 8 5,940 6,367 - -
Profit before taxation 98,199 45,874 92,925 75,851 Income tax expense 25(ii) (14,960) (8,840) (14,601) (9,264)
Profit after taxation 83,239 37,034 78,324 66,587
Transfer to statutory reserve fund 17 (12) - - -
Profit for the year 83,227 37,034 78,324 66,587
Other comprehensive incomeNet (loss)/gain arising on revaluation of available-for-sale financial assets during the year
10 (19,137) 23,684 (1,274) 15,052
Reclassification adjustment relating to the transfer of life operations - - - (13,241)Reclassification adjustments relating to available-for-sale financial assets disposed of in the year (12,918) 1,116 (5,286) 1,414 Exchange difference arising from translation of associate operations 1,365 (2,096) - - Other comprehensive (loss)/income for the year (30,690) 22,704 (6,560) 3,225
TOTAL COMPREHENSIVE INCOME FOR THE YEAR 52,537 59,738 71,764 69,812
Profit/(loss) attributable to: Owners of the company 83,195 58,756 78,324 66,587 Non-controlling interests 32 (21,722) - -
83,227 37,034 78,324 66,587
Total comprehensive income/(loss) attributable to:Owners of the company 52,505 81,460 71,764 69,812 Non-controlling interests 32 (21,722) - -
52,537 59,738 71,764 69,812
EARNINGS PER SHARE 31 10.40 7.34 Rs
M
auri
tian
Eag
le In
sura
nce
Co
mp
any
Lim
ited
Ann
ual R
epo
rt 2
012
32
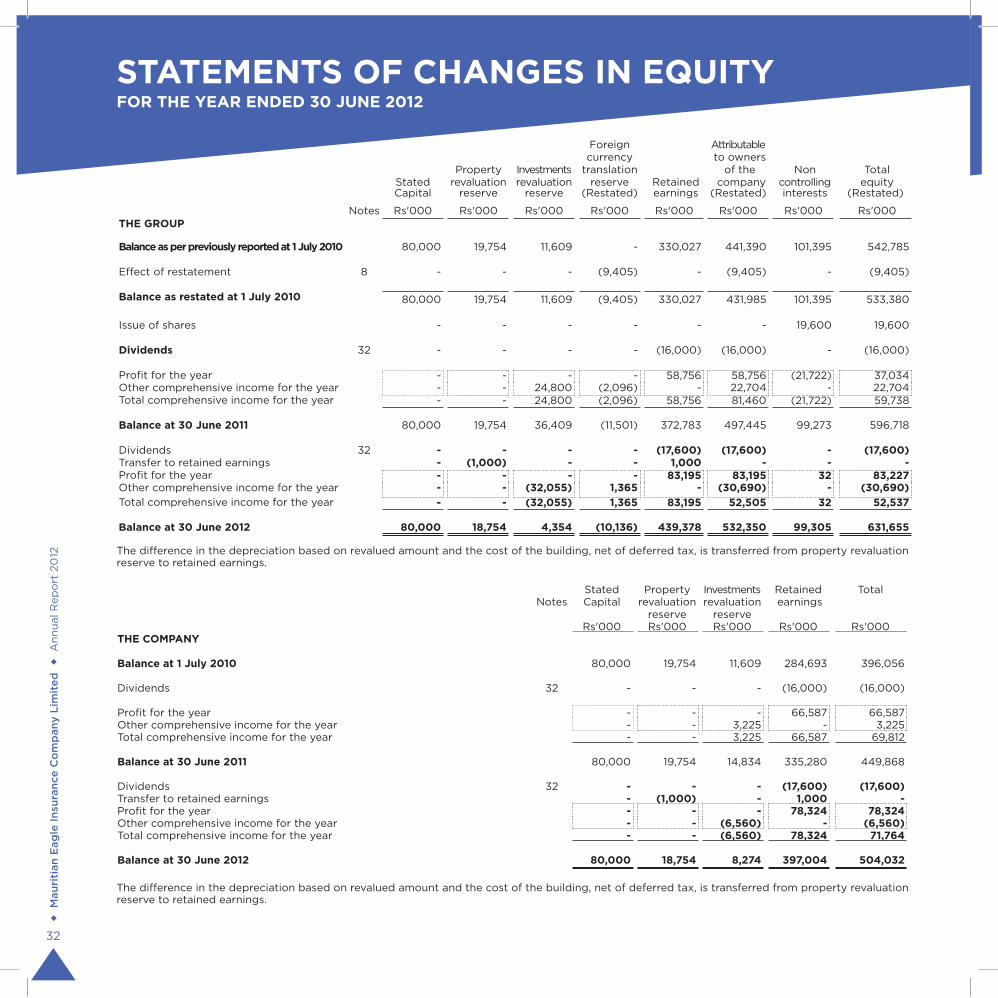
STATEMENTS OF CHANGES IN EQUITY FOR THE YEAR ENDED 30 JUNE 2012
Foreign Attributablecurrency to owners
Property Investments translation of the Non Total Stated revaluation revaluation reserve Retained company controlling equity Capital reserve reserve (Restated) earnings (Restated) interests (Restated)
Notes Rs'000 Rs'000 Rs'000 Rs'000 Rs'000 Rs'000 Rs'000 Rs'000 THE GROUP
Balance as per previously reported at 1 July 2010 80,000 19,754 11,609 - 330,027 441,390 101,395 542,785
Effect of restatement 8 - - - (9,405) - (9,405) - (9,405)
Balance as restated at 1 July 2010 80,000 19,754 11,609 (9,405) 330,027 431,985 101,395 533,380
Issue of shares - - - - - - 19,600 19,600
Dividends 32 - - - - (16,000) (16,000) - (16,000)
Profit for the year - - - - 58,756 58,756 (21,722) 37,034 Other comprehensive income for the year - - 24,800 (2,096) - 22,704 - 22,704 Total comprehensive income for the year - - 24,800 (2,096) 58,756 81,460 (21,722) 59,738
Balance at 30 June 2011 80,000 19,754 36,409 (11,501) 372,783 497,445 99,273 596,718
Dividends 32 - - - - (17,600) (17,600) - (17,600)Transfer to retained earnings - (1,000) - - 1,000 - - - Profit for the year - - - - 83,195 83,195 32 83,227 Other comprehensive income for the year - - (32,055) 1,365 - (30,690) - (30,690)Total comprehensive income for the year - - (32,055) 1,365 83,195 52,505 32 52,537
Balance at 30 June 2012 80,000 18,754 4,354 (10,136) 439,378 532,350 99,305 631,655
Stated Property Investments Retained Total Notes Capital revaluation revaluation earnings
reserve reserveRs'000 Rs'000 Rs'000 Rs'000 Rs'000
THE COMPANY
Balance at 1 July 2010 80,000 19,754 11,609 284,693 396,056
Dividends 32 - - - (16,000) (16,000)
Profit for the year - - - 66,587 66,587 Other comprehensive income for the year - - 3,225 - 3,225 Total comprehensive income for the year - - 3,225 66,587 69,812
Balance at 30 June 2011 80,000 19,754 14,834 335,280 449,868
Dividends 32 - - - (17,600) (17,600)Transfer to retained earnings - (1,000) - 1,000 - Profit for the year - - - 78,324 78,324 Other comprehensive income for the year - - (6,560) - (6,560)Total comprehensive income for the year - - (6,560) 78,324 71,764
Balance at 30 June 2012 80,000 18,754 8,274 397,004 504,032
The difference in the depreciation based on revalued amount and the cost of the building, net of deferred tax, is transferred from property revaluation reserve to retained earnings.
The difference in the depreciation based on revalued amount and the cost of the building, net of deferred tax, is transferred from property revaluation reserve to retained earnings.
M
auri
tian
Eag
le In
sura
nce
Co
mp
any
Lim
ited
Ann
ual R
epo
rt 2
012
33
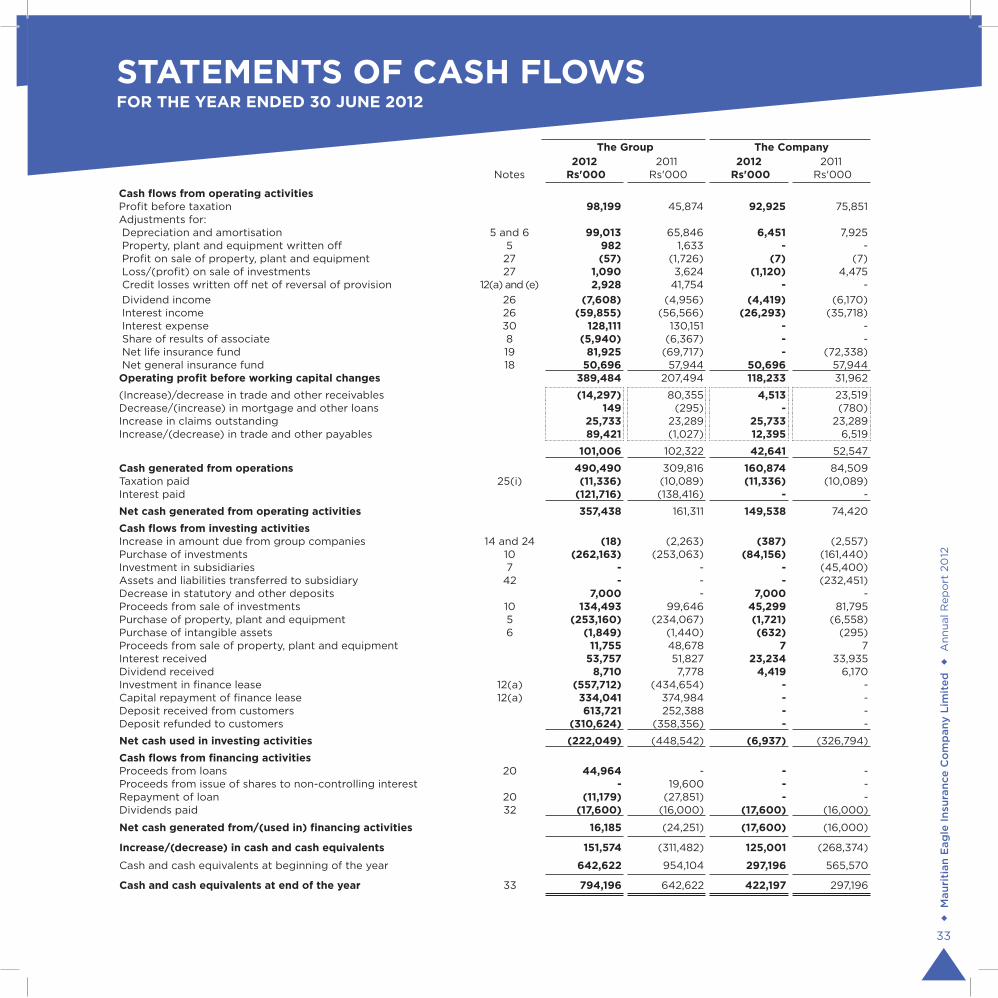
STATEMENTS OF CASH FLOWS FOR THE YEAR ENDED 30 JUNE 2012
The Group The Company2012 2011 2012 2011
Notes Rs'000 Rs'000 Rs'000 Rs'000
Cash flows from operating activitiesProfit before taxation 98,199 45,874 92,925 75,851 Adjustments for: Depreciation and amortisation 5 and 6 99,013 65,846 6,451 7,925 Property, plant and equipment written off 5 982 1,633 - - Profit on sale of property, plant and equipment 27 (57) (1,726) (7) (7) Loss/(profit) on sale of investments 27 1,090 3,624 (1,120) 4,475 Credit losses written off net of reversal of provision 12(a) and (e) 2,928 41,754 - - Dividend income 26 (7,608) (4,956) (4,419) (6,170) Interest income 26 (59,855) (56,566) (26,293) (35,718) Interest expense 30 128,111 130,151 - - Share of results of associate 8 (5,940) (6,367) - - Net life insurance fund 19 81,925 (69,717) - (72,338) Net general insurance fund 18 50,696 57,944 50,696 57,944 Operating profit before working capital changes 389,484 207,494 118,233 31,962
(Increase)/decrease in trade and other receivables (14,297) 80,355 4,513 23,519 Decrease/(increase) in mortgage and other loans 149 (295) - (780)Increase in claims outstanding 25,733 23,289 25,733 23,289 Increase/(decrease) in trade and other payables 89,421 (1,027) 12,395 6,519
101,006 102,322 42,641 52,547
Cash generated from operations 490,490 309,816 160,874 84,509 Taxation paid 25(i) (11,336) (10,089) (11,336) (10,089)Interest paid (121,716) (138,416) - -
Net cash generated from operating activities 357,438 161,311 149,538 74,420
Cash flows from investing activitiesIncrease in amount due from group companies 14 and 24 (18) (2,263) (387) (2,557)Purchase of investments 10 (262,163) (253,063) (84,156) (161,440)Investment in subsidiaries 7 - - - (45,400)Assets and liabilities transferred to subsidiary 42 - - - (232,451)Decrease in statutory and other deposits 7,000 - 7,000 - Proceeds from sale of investments 10 134,493 99,646 45,299 81,795 Purchase of property, plant and equipment 5 (253,160) (234,067) (1,721) (6,558)Purchase of intangible assets 6 (1,849) (1,440) (632) (295)Proceeds from sale of property, plant and equipment 11,755 48,678 7 7 Interest received 53,757 51,827 23,234 33,935 Dividend received 8,710 7,778 4,419 6,170 Investment in finance lease 12(a) (557,712) (434,654) - - Capital repayment of finance lease 12(a) 334,041 374,984 - - Deposit received from customers 613,721 252,388 - - Deposit refunded to customers (310,624) (358,356) - -
Net cash used in investing activities (222,049) (448,542) (6,937) (326,794)
Cash flows from financing activitiesProceeds from loans 20 44,964 - - - Proceeds from issue of shares to non-controlling interest - 19,600 - - Repayment of loan 20 (11,179) (27,851) - - Dividends paid 32 (17,600) (16,000) (17,600) (16,000)
Net cash generated from/(used in) financing activities 16,185 (24,251) (17,600) (16,000)
Increase/(decrease) in cash and cash equivalents 151,574 (311,482) 125,001 (268,374)
Cash and cash equivalents at beginning of the year 642,622 954,104 297,196 565,570
Cash and cash equivalents at end of the year 33 794,196 642,622 422,197 297,196

M
auri
tian
Eag
le In
sura
nce
Co
mp
any
Lim
ited
Ann
ual R
epo
rt 2
012
34
NOTES TO THE FINANCIAL STATEMENTS FOR THE YEAR ENDED 30 JUNE 2012
1 GENERAL INFORMATION Mauritian Eagle Insurance Company Limited (the “Company”) is a listed limited liability company incorporated and domiciled in
Mauritius. The Company’s registered office is situated at 5th Floor, IBL House, Caudan, Port Louis and operates at 1st Floor, IBL House, Caudan, Port Louis. The Company, the subsidiaries and associate are collectively referred to as the “Group”.
The Company carries out short term and long term insurance business and with effect from 1 January 2011, the activities of the long-term business were transferred to Mauritian Eagle Life Company Limited, a wholly-owned subsidiary of the Company. Short term insurance comprises of general insurances and covers the following:-
• Accident • Engineering • Fireandalliedperils • Motor • Transportation The activities of the subsidiary companies are disclosed in note 7(c). 2 APPLICATION OF NEW AND REVISED INTERNATIONAL FINANCIAL REPORTING STANDARDS (IFRSs) In the current year, the Group and the Company have applied all of the new and revised Standards and Interpretations issued by the
International Accounting Standards Board (“IASB”) and the International Financial Reporting Interpretations Committee (“IFRIC”) of the IASB that are relevant to its operations and effective for accounting periods beginning on 1 July 2011.
2.1 Standards and Interpretations applied with no effect on financial statements The following relevant new and revised Standards and Interpretations have been adopted in these financial statements. Their
application has not had any significant impact on the presentation and disclosure and on the amounts reported in these financial statements but may impact the accounting for future transactions or arrangements.
IAS 1 Presentation of Financial Statements - Amendments resulting from May 2010 Annual Improvements to IFRSs IAS 24 Related Party Disclosures - Revised definition of related parties IFRS 7 Financial Instruments: Disclosures - Amendments resulting from May 2010 Annual Improvements to IFRSs IFRS 7 Financial Instruments: Disclosures - Amendments enhancing disclosures about transfers of financial assets IFRIC 14 IAS 19 - The limit on a defined benefit asset, minimum funding requirements and their Interaction (November 2009
amendment with respect to voluntary prepaid contributions) 2.2 Standards and Interpretations in issue not yet effective At the date of authorisation of these financial statements, the following Standards and Interpretations were in issue but effective
on annual periods beginning on or after the respective dates as indicated: IAS 1 Presentation of Financial Statements - Amendments to revise the way other comprehensive income is presented
(effective 1 July 2012) IAS 1 Presentation of Financial Statements - Amendments resulting from Annual Improvements 2009-2011 Cycle
(comparative information) (effective 1 January 2013)

M
auri
tian
Eag
le In
sura
nce
Co
mp
any
Lim
ited
Ann
ual R
epo
rt 2
012
35
2 APPLICATION OF NEW AND REVISED INTERNATIONAL FINANCIAL REPORTING STANDARDS (IFRSs) (Continued) 2.2 Standards and Interpretations in issue not yet effective (Continued)
IAS 12 Deferred Tax: Income taxes - Limited scope amendments (recovery of underlying assets) IAS 19 Employee Benefits 2011 - Amendments with revised requirements for pensions and other postretirement benefits,
termination benefits and other changes (effective 1 January 2013) IAS 27 Separate Financial Statements (2011) - Original issue (effective 1 January 2013) IAS 28 Investments in Associates and Joint Ventures (2011) - Original issue (effective 1 January 2013) IAS 32 Financial Instruments: Presentation - Amendments relating to the offsetting of assets and liabilities (effective 1
January 2014) IAS 32 Financial Instruments: Presentation - Amendments resulting from Annual Improvements 2009-2011 Cycle (tax effect
of equity distributions) (effective 1 January 2013) IFRS 7 Financial Instruments: Disclosures - Amendments related to the offsetting of assets and liabilities (effective 1 January
2013) IFRS 7 Financial Instruments: Disclosures - Deferral of mandatory effective date of IFRS 9 and amendments to transition
disclosures (effective 1 January 2015) IFRS 9 Financial Instruments - Reissue to include requirements for the classification and measurement of financial liabilities
and incorporate existing derecognition requirements (effective 1 January 2013) IFRS 9 Financial Instruments - Original issue (effective 1 January 2015) IFRS 10 Consolidated Financial Statements - Original issue (effective 1 January 2013) IFRS 10 Consolidated Financial Statements - Amendments to transitional guidance (effective 1 January 2013) IFRS 12 Disclosure of Interests in Other Entities - Original issue (effective 1 January 2013). IFRS 12 Disclosure of Interests in Other Entities - Amendments to transitional guidance (effective 1 January 2013) IFRS 13 Fair Value Measurement - Original issue (effective 1 January 2013)
The directors anticipate that these amendments will be applied in the financial statements for the annual periods beginning on the respective dates as indicated above. The directors have not yet had an opportunity to consider the potential impact of the adoption of these amendments.
3 SIGNIFICANT ACCOUNTING POLICIES
The principal accounting policies adopted by the Group are as follows: 3.01 Basis of preparation The financial statements are prepared under the historical cost convention as modified by the revaluation of land and buildings
and certain available-for-sale investments and in accordance with International Financial Reporting Standards (IFRSs).
3.02 Basis of consolidation The consolidated financial statements include the results of the Company and of its subsidiaries. The results of the subsidiaries
acquired or disposed of during the year are included in the statements of comprehensive income from the date of their acquisition or up to the date of their disposal. Inter-Group transactions and balances are eliminated on consolidation.
Subsidiaries are all entities over which the Company has the power to govern the financial and operating policies of an entity so as to obtain benefits from its activities.
Non-controlling interests in the net assets of the subsidiaries are identified separately from the Group’s equity therein. Non-
controlling interests consist of the amount of those interests at the date of the original business combination and the non-controlling interests of changes in equity since the date of the combination. Losses applicable to the minority in excess of the non-controlling interests’s interest in the subsidiary’s equity are allocated against the interests of the Group except to the extent that the minority has a binding obligation and is able to make an additional investment to cover the losses.
When the Group loses control of a subsidiary, the profit or loss on disposal is calculated as the difference between (i) the aggregate of the fair value of the consideration received and the fair value of any retained interest and (ii) the previous carrying amount of the assets (including goodwill), and liabilities of the subsidiary and any non-controlling interests. Amounts previously recognised in other comprehensive income in relation to the subsidiary are accounted for (i.e. reclassified to profit

M
auri
tian
Eag
le In
sura
nce
Co
mp
any
Lim
ited
Ann
ual R
epo
rt 2
012
36
3 SIGNIFICANT ACCOUNTING POLICIES (continued)
3.02 Basis of consolidation (Continued)
or loss or transferred directly to retained earnings) in the same manner as would be required if the relevant assets or liabilities were disposed of. The fair value of any investment retained in the former subsidiary at the date when control is lost is regarded as the fair value on initial recognition for subsequent accounting under IAS 39 Financial Instruments: Recognition and Measurement or, when applicable, the cost on initial recognition of an investment in an associate or jointly controlled entity.
3.03 Property, plant and equipment
Property, plant and equipment are stated at cost or revalued amount less accumulated depreciation and any accumulated impairment losses. Revaluations are performed such that the carrying amount does not differ materially from that which would be determined using fair values at end of the reporting period.
Any revaluation increase arising on the revaluation of such land and buildings is recognised in other comprehensive income and
accumulated in equity, except to the extent that it reverses a revaluation decrease for the same asset previously recognised in profit or loss, in which case the increase is credited to profit or loss to the extent of the decrease previously expensed. A decrease in the carrying amount arising on the revaluation of such land and buildings is recognised in profit or loss to the extent that it exceeds the balance, if any, held in the properties revaluation reserve relating to a previous revaluation of that asset.
An item of property, plant and equipment is derecognised upon disposal or when no future economic benefits are expected to arise from the continued use of the asset. Any gain or loss arising on the disposal or retirement of an item of property, plant and equipment is determined as the difference between the sales proceeds and the carrying amount of the asset and is recognised in profit or loss.
Profit or loss on disposal of property, plant and equipment is determined as the difference between the carrying amount of the
assets and the net disposal proceeds and is accounted for in the statement of comprehensive income. Depreciation on revalued buildings is recognised in profit or loss. On the subsequent sale or retirement of a revalued property,
the attributable revaluation surplus remaining in the properties revaluation reserve is transferred directly to retained earnings. Surplus on the revalued property is transferred annually from property revaluation reserve to retained earning. The amount
transferred is computed on the difference between depreciation based on the revalued amount of the asset and depreciation based on the asset’s original cost.
3.04 Depreciation
No depreciation is provided on land. Depreciation on other property, plant and equipment is calculated to write off the cost or revalued amount of the assets to their estimated residual values on a straight line basis over their expected useful lives as follows:
Building 2.5 % Furniture and equipment 20 % Computer equipment 33.3 % Motor vehicles 6 years Plant and machinery and motor vehicles under operating leases depreciated over the lease terms
NOTES TO THE FINANCIAL STATEMENTS FOR THE YEAR ENDED 30 JUNE 2012

M
auri
tian
Eag
le In
sura
nce
Co
mp
any
Lim
ited
Ann
ual R
epo
rt 2
012
37
3 SIGNIFICANT ACCOUNTING POLICIES (continued)
3.05 Intangible asset and amortisation
Computer software is stated at cost less accumulated amortisation. Amortisation of computer software is calculated to write off its cost on a straight line basis over its estimated useful life of 3 to 6 years.
An intangible asset is derecognised on disposal, or when no future economic benefits are expected from use or disposal. Gains
or losses arising from derecognition of an intangible asset, measured as the difference between the net disposal proceeds and the carrying amount of the asset, are recognised in profit or loss when the asset is derecognised.
3.06 Investment in subsidiaries
In the Company’s financial statements, investment in subsidiaries is stated at cost. The carrying amount is reduced if there is any indication of impairment in value.
3.07 Investment in associate
An associate is an entity over which the Company has significant influence and that is neither a subsidiary nor an interest in a joint venture. Significant influence is the power to participate in the financial and operating policy decision of the investee but is not control or joint control over these policies.
Investment in associate is accounted for at cost and under the equity method in the Group accounts. The Group’s share of the
associates’ profit or loss for the year is recognised in the statement of comprehensive income and the Group’s interest in the associate is carried in the statement of financial position at an amount that reflects its share of the net assets of the associate.
Any excess of the cost of acquisition over the Company’s share of the net fair value of the identifiable assets, liabilities and
contingent liabilities of the associate recognised at the date of acquisition is recognised as goodwill. The goodwill is included within the carrying amount of the investment and is assessed for impairment on an annual basis as part of the investment. Any excess of the Group’s share of the net fair value of the identifiable assets, liabilities and contingent liabilities over the cost of acquisition, after reassessment, is recognised immediately in the statement of comprehensive income.
Where a Group entity transacts with an associate of the Group, profits and losses are eliminated to the extent of the Group’s
interest in the relevant associate.
3.08 Financial instruments
Financial assets and liabilities are recognised on the statement of financial position when the Group has become party to the contractual provisions of the financial instruments.
Financial Assets
All financial assets are recognised and derecognised on trade date where the purchase or sale of a financial asset is under a contract whose terms require delivery of the financial asset within the timeframe established by the market concerned, and are initially measured at fair value, plus transaction costs, except for those financial assets classified as at fair value through profit or loss, which are initially measured at fair value.
Financial assets are classified into the following specified categories: ‘held-to-maturity’ investments, ‘available-for-sale’ (AFS)
financial assets and ‘loans and receivables’. The classification depends on the nature and purpose of the financial assets and is determined at the time of initial recognition.
Under section 24 of the Insurance Act 2005, the Company is required to maintain a deposit pledged in favour of the Financial
Services Commission and statutory obligations are excluded from financial assets or liabilities as per IAS 32.AG12. Held-to-maturity investments Held-to-maturity investments are non-derivative financial assets with fixed or determinable payments and fixed maturity
dates that the Group has the positive intent and ability to hold to maturity. Bonds and debentures are classified as held-to-maturity investments and are recorded at amortised cost using the effective interest method less any impairment, with interest recognised on an effective yield basis.

M
auri
tian
Eag
le In
sura
nce
Co
mp
any
Lim
ited
Ann
ual R
epo
rt 2
012
38
3 SIGNIFICANT ACCOUNTING POLICIES (continued) 3.08 Financial instruments (continued)
Financial Assets (continued) Available-for-Sale (AFS) financial assets
Listed shares held by the Group that are traded in an active market are classified as being AFS and are stated at fair value. Gains and losses arising from changes in fair value are recognised directly in other comprehensive income and accummulated in equity in the investments revaluation reserve with the exception of impairment losses, interest calculated using the effective interest method and foreign exchange gains and losses on monetary assets, which are recognised directly in profit or loss. Where the investment is disposed of or is determined to be impaired, the cumulative gain or loss previously recognised in the investments revaluation reserve is transferred to profit or loss for the year.
The fair value of AFS monetary assets denominated in a foreign currency is determined in that foreign currency and translated
at the spot rate at the end of the reporting period. The change in fair value attributable to translation differences that result from a change in amortised cost of the asset is recognised in profit or loss, and other changes are recognised in equity.
Available-for-sale investments which do not have a quoted market price and whose fair value cannot be reliably measured, are
carried at cost, less any impairment loss. Loans and receivables
Trade receivables, loans, and other receivables that have fixed or determinable payments that are not quoted in an active market are classified as loans and receivables. Trade receivables originated by the Group are stated at cost less provision for doubtful debts. An estimate of doubtful debts is made based on a review of all outstanding amounts at end of the reporting period. Debts are written off during the year in which they are identified. Loans and receivables are measured at amortised cost using the effective interest method, less any impairment. Interest income is recognised by applying the effective interest rate, except for short-term receivables when the recognition of interest would be immaterial.
Impairment of financial assets
Financial assets are assessed for indicators of impairment at the end of each reporting period. Financial assets are impaired where there is objective evidence that, as a result of one or more events that occurred after the initial recognition of the financial asset, the estimated future cash flows of the investment have been impacted.
For AFS equity investments, a significant or prolonged decline in the fair value of the security below its cost is considered to be objective evidence of impairment.
Derecognition of financial assets
TheGroupderecognisesafinancialassetonlywhenthecontractualrightstothecashflowsfromtheassetexpire;orittransfersthe financial asset and substantially all the risks and rewards of ownership of the asset to another entity. If the Group neither transfers nor retains substantially all the risks and rewards of ownership and continues to control the transferred asset, the Group recognises its retained interest in the asset and an associated liability for amounts it may have to pay. If the Group retains substantially all the risks and rewards of ownership of a transferred financial asset, the Group continues to recognise the financial asset and also recognises a collateralised borrowing for the proceeds received.
NOTES TO THE FINANCIAL STATEMENTS FOR THE YEAR ENDED 30 JUNE 2012

M
auri
tian
Eag
le In
sura
nce
Co
mp
any
Lim
ited
Ann
ual R
epo
rt 2
012
39
3 SIGNIFICANT ACCOUNTING POLICIES (continued) 3.08 Financial instruments (continued)
Financial Liabilities
Financial liabilities are classified as ‘other financial liabilities’ Other financial liabilities, including borrowings, are initially measured at fair value, net of transaction costs.
Other financial liabilities are subsequently measured at amortised cost using the effective interest method, with interest expense recognised on an effective yield basis.
The effective interest method is a method of calculating the amortised cost of a financial liability and of allocating interest
expense over the relevant period. The effective interest rate is the rate that exactly discounts estimated future cash payments through the expected life of the financial liability, or, where appropriate, a shorter period to the net carrying amount on initial recognition
Derecognition of financial liabilities
The Group derecognises financial liabilities when, and only when, the Group’s obligations are discharged, cancelled or they expire.
3.09 Equity instruments
An equity instrument is any contract that evidence a residual interest in the assets of the entity after deducting all of its liabilities. Equity instruments issued by the Group are recognised at the proceeds received, net of direct issue costs.
3.10 Mortgage and other loans
Mortgage and other loans are stated at amortised cost less provisions if any.
3.11 Leases
Finance lease
Leases are classified as finance leases whenever the terms of the lease transfer substantially all the risks and rewards of ownership to the lessee. The other leases are classified as operating lease.
Amounts due from lessees under finance leases are recorded as receivables at the amount of the Group’s net investment in the
leases. Finance lease income is allocated to accounting periods so as to reflect a constant periodic rate of return on the Group’s net investment outstanding in respect of the leases.
Operating lease
Rental income from operating leases is recognised on a straight-line basis over the term of the relevant lease. Initial direct costs incurred in negotiating and arranging an operating lease are added to the carrying amount of the leased asset and recognised on a straight-line basis over the lease term.
3.12 Impairment At the end of each reporting period, the Group reviews the carrying amounts of its assets to determine whether there is any
indication that those assets have suffered an impairment loss. If any such indication exists, the recoverable amount of the asset is estimated in order to determine the extent of the impairment loss, if any, and the carrying amount of the asset is reduced to its recoverable amount. Any impairment loss is charged to the statement of comprehensive income.

M
auri
tian
Eag
le In
sura
nce
Co
mp
any
Lim
ited
Ann
ual R
epo
rt 2
012
40
3 SIGNIFICANT ACCOUNTING POLICIES (continued) 3.13 Provision for unearned premiums The provision for unearned premium represents that part of the written premiums, gross of commission payable to intermediaries,
that is estimated to be earned in subsequent periods. The change in the provision is recorded in the statement of comprehensive income to recognise revenue over the period of the risk. The provision is derecognised when the contract expires, is discharged or cancelled.
3.14 Life insurance fund The surplus arising from the long-term business operation is transferred to the life insurance fund and represents the increase in the value of policy liabilities. Under the provisions of the Insurance Act 2005, the adequacy of the liabilities is determined annually by actuarial valuation at the end of each financial period. 3.15 Taxation
Income tax expense represents the sum of the tax currently payable and deferred tax. (i) Current tax
The tax currently payable is based on taxable profit for the year. Taxable profit differs from profit as reported in the statement of comprehensive income because it excludes items of income or expense that are taxable or deductible in other periods but it further excludes items that are never taxable or deductible. The Group’s liability for current tax is calculated using tax rates that have been enacted or substantively enacted at the end of the reporting period.
(ii) Deferred tax
Deferred tax is recognised on differences between the carrying amounts of assets and liabilities in the financial statements and the corresponding tax bases used in the computation of taxable profit, and is accounted for using the liability method. Deferred tax liabilities are generally recognised for all taxable temporary differences, and deferred tax assets are generally recognised for all deductible temporary differences to the extent that it is probable that taxable profits will be available against which those deductible temporary differences can be utilised. Such assets and liabilities are not recognised if the temporary difference arises from goodwill or from the initial recognition (other than in a business combination) of other assets and liabilities in a transaction that affects neither the taxable profit nor the accounting profit.
Deferred tax liabilities are recognised for taxable temporary differences associated with investments in subsidiaries and
associates, except where the Group is able to control the reversal of the temporary difference and it is probable that the temporary difference will not reverse in the foreseeable future.
Deferred tax assets arising from deductible temporary differences associated with such investments and interests are only
recognised to the extent that it is probable that there will be sufficient taxable profits against which to utilise the benefits of the temporary differences and they are expected to reverse in the foreseeable future.
The carrying amount of deferred tax assets is reviewed at the end of each reporting period and reduced to the extent that it is no longer probable that sufficient taxable profits will be available to allow all or part of the asset to be recovered.
Deferred tax assets and liabilities are measured at the tax rates that are expected to apply in the year in which the liability is settled or the asset realised, based on tax rates (and tax laws) that have been enacted or substantively enacted at the end of the reporting period. The measurement of deferred tax liabilities and assets reflects the tax consequences that would follow from the manner in which the Group and the Company expect, at the reporting date, to recover or settle the carrying amount of its assets and liabilities.
NOTES TO THE FINANCIAL STATEMENTS FOR THE YEAR ENDED 30 JUNE 2012
M
auri
tian
Eag
le In
sura
nce
Co
mp
any
Lim
ited
Ann
ual R
epo
rt 2
012
41
3 SIGNIFICANT ACCOUNTING POLICIES (continued)
3.15 Taxation (continued)
(ii) Deferred tax (continued)
Deferred tax assets and liabilities are offset when there is a legally enforceable right to set off current tax assets against current tax liabilities and when they relate to income taxes levied by the same taxation authority and the Group and the Company intend to settle its current tax assets and liabilities on a net basis.
(iii) Current and deferred tax for the year
Current and deferred tax are recognised as an expense or income in the statement of comprehensive income. 3.16 Retirement benefits obligations
Defined benefit pension plan
The Company contributes to a defined benefit pension plan operated by its ultimate holding Company, GML Investissement Limitée. Contributions to the pension plan are charged to the statement of comphensive income in the period in which they fall due.
State plan and defined contribution pension plan
Contributions to the National Pension Scheme and defined contribution pension plan are expensed to the statement of comprehensive income in the period in which they fall due.
3.17 Outstanding claims
Outstanding claims represent the estimated liability for claims reported plus losses incurred but not yet reported and the related loss adjustment expenses. Claims and loss adjustment expenses are charged to the statement of comprehensive income as incurred based on the estimated liability for compensation owed to contract holders or third parties damaged by the contract holders. They include direct and indirect claim settlement costs and arise from events that have occurred up to the end of the reporting period even if they have not yet been reported to the Company. The liability for losses and loss adjustment expenses is determined using “case basis” evaluations and statistical analysis, and represents an estimate of the ultimate net cost of all losses incurred but not paid at the end of the reporting period. Although considerable variability is inherent in such estimates, management believes that the liability for unpaid losses and loss adjustment expenses is adequate. These estimates are continually reviewed and adjusted as necessary, such adjustments are reflected in current operations.
3.18 Salvage and subrogation reimbursements Some insurance contracts permit the company to sell property acquired in settling a claim (i.e. salvage). The Company may also
have the right to sue third parties for payment of some or all the costs incurred (i.e subrogation). Estimate of salvage recoveries are included as allowance in the measurement of the insurance liability for claims, and salvage property is recognised in other assets when the liability is settled.
3.19 Liability adequacy At the end of each reporting period the Company performs a liability adequacy test on its insurance liabilities to ensure that
the carrying value is adequate, using current estimates of future cash flows, taking into account the relevant investment return. If that assessment shows that the carrying amount of the liabilities is inadequate, any deficiency is recognised as an expense to the statement of comprehensive income by recognising an additional liability for claims provisions or recognising a provision for unexpired risks. The unexpired risks provision is assessed in aggregate for future business classes which are managed together.
3.20 Provisions A provision is recognised when there is a present obligation (legal or constructive) as a result of a past event, and it is probable
that an outflow of resources embodying economic benefits will be required to settle the obligation, and a reliable estimate can be made of the amount of the obligation. Provisions are reviewed at the end of each reporting period and adjusted to reflect the current best estimate.

M
auri
tian
Eag
le In
sura
nce
Co
mp
any
Lim
ited
Ann
ual R
epo
rt 2
012
42
3 SIGNIFICANT ACCOUNTING POLICIES (continued) 3.21 Insurance contracts
Insurance contracts are those contracts that transfer significant insurance risk at the inception of the contract. Such contracts remain insurance contracts until all rights and obligations are extinguished or expired.
Insurance contracts issued by the Group are classified as short term insurance, long term insurance and reinsurance contracts. Short term insurance contracts are in respect of general insurance business whereas long term insurance contracts refer to life insurance business.
3.22 Revenue recognition
General business
Gross premiums on general business excluding marine, motor and part of fire businesses are earned on a pro-rata basis over the term of the policy coverage. The portion of the unearned premiums, which is calculated using the 1/8 method, is transferred to the general insurance fund. Premiums are shown gross of commission.
Gross premiums on marine business are accounted for on an underwriting year basis and the net surplus is transferred to the
general insurance fund to be released to the statement of comprehensive income at the end of a period of two years. Life business
Insurance contracts with fixed and guaranteed terms
Gross premiums from life insurance business are recognised when they become payable from the policyholders and are shown gross of commission and other expenses.
Unit-linked insurance contracts
Insurance premiums are recognised directly as liabilities. Lease business
Gross earnings, which represent the income element of finance lease rentals receivable, are allocated to the relevant accounting periods covered by the leases using the actuarial method before tax.
Front end fee on finance lease is recognised when the fee is received. Other revenues
Other revenues earned by the Group are recognised on the following bases: Dividend income is recognised when the right to receive payment is established Commission income from reinsurers is recognised on an accrual basis in accordance with the substance of the relevant
agreement. Profit commission from reinsurers is recognised on an accrual basis. Consideration for annuities is recognised on a receipt basis. Interest income on banks deposits is recognised on an accrual basis whereas those on mortgages and policy loans are recognised
on a receipt basis.
NOTES TO THE FINANCIAL STATEMENTS FOR THE YEAR ENDED 30 JUNE 2012
M
auri
tian
Eag
le In
sura
nce
Co
mp
any
Lim
ited
Ann
ual R
epo
rt 2
012
43
3 SIGNIFICANT ACCOUNTING POLICIES (continued)
3.23 Reinsurance
The Group enters into reinsurance contracts in the normal course of business in order to limit the potential for losses arising from certain exposures. Outwards reinsurance premiums are accounted for in the same period as the related premiums for the direct or inwards reinsurance business being reinsured.
Reinsurance liabilities comprise premiums payable for outwards reinsurance contracts and are recognised as an expense when
due.
Reinsurance assets include balances due from reinsurance companies for paid and unpaid losses. Reinsurance assets are measured consistently with the amounts associated with the underlying insurance or investment contracts and in accordance with the terms of the reinsurance contract. Reinsurance is recorded as an asset unless a right of set-off exists, in which case the associated liabilities are reduced to take account of reinsurance.
Reinsurance assets are subject to impairment testing and the carrying amount is reduced to its recoverable amount. The
impairment loss is recognised as an expense in the statement of comprehensive income. The asset is impaired if objective evidence is available to suggest that it is probable that the Group will not be able to collect the amounts due from reinsurers.
Gains and losses on buying reinsurance are recognised in income at the date of purchase and are not amortised. 3.24 Benefits
Benefits are recorded as an expense when they are incurred. The liabilities for benefit are recalculated at each end of the reporting period using the assumptions established at the inception of the insurance contracts.
3.25 Borrowing costs
All other borrowing costs are recognised in profit or loss in the period in which they are incurred. 3.26 Cash and cash equivalents
Cash comprises cash at bank and in hand and demand deposits. Cash equivalents are short-term highly liquid investments that are readily convertible to known amounts of cash and which are subject to an insignificant risk of change in value.
3.27 Foreign currencies
The financial statements of each entity are presented in the currency of the primary economic environment in which the entity operates (its functional currency). For the purpose of consolidated financial statements, the results and financial position are expressed in Mauritian rupees, which is the functional currency of the Company and presentation currency for the consolidated financial statements.
In preparing the financial statements of the individual entities, transactions in currencies other than the entity’s functional
currency are recorded at the rates of exchange prevailing at the dates of transactions. At the end of the reporting period, monetary assets and liabilities denominated in foreign currencies are retranslated into the entity’s functional currency at the rates of exchange prevailing at the end of the reporting period.
Exchange differences arising on the settlement and retranslation of monetary items are recognised in the statement of
comphensive income in the period in which they arise.

M
auri
tian
Eag
le In
sura
nce
Co
mp
any
Lim
ited
Ann
ual R
epo
rt 2
012
44
3 SIGNIFICANT ACCOUNTING IES (continued)
3.28 Related Party
Parties are considered to be related if they have the ability, directly or indirectly, to control or exercise significant influence over the Group or the Company in making financial and operating decisions, or vice versa, or where the Group or the Company is subject to common significant influence. Related parties may be individuals or other entities.
3.29 Comparatives
Comparatives have been restated or regrouped where necessary to align with the current year’s presentation and disclosure.
4 CRITICAL ACCOUNTING ESTIMATES AND JUDGEMENTS IN APPLYING ACCOUNTING ESTIMATES Estimates and judgements are reviewed on an ongoing basis and are based on historical experience and other factors, including expectations of future events that are considered to be relevant under the circumstances. The Group makes estimates and assumptions concerning the future. The resulting accounting estimates will, by definition, seldom
equal the related actual results. The estimates and assumptions that have a significant risk of causing a material adjustment to the carrying amounts of assets and liabilities within the next financial year are discussed below:
4.1 Insurance contracts The uncertainty inherent in the financial statements of the Group arises in respect of insurance liabilities, which include liabilities
for unearned premiums, outstanding claims provision (including IBNR) and Life Assurance Fund. In addition to the inherent uncertainty involved when estimating liabilities, there is also uncertainty as regards the eventual outcome of claims. As a result, the Group applies estimation techniques to determine the appropriate provisions.
Short- term insurance (i) Claims provision Outstanding claims provision is determined based upon knowledge of events, terms and conditions of relevant policies, on
interpretation of circumstances as well as previous claims experience. Similar cases, historical claims payment trends, judicial decisions and economic conditions are also relevant and are taken into consideration.
(ii) Sensitivity analysis The Company adopted actuarial techniques to estimate the required levels of provisions, taking into account the
characteristics of the business class and risks involved.
Long-term insurance The majority of insurance liabilities are calculated by projecting liability outgo and expected future premiums and discounting the cashflows to the valuation date based on the valuation interest rate. The following table splits the gross premium actuarial liability between discounted and undiscounted liabilities:
NOTES TO THE FINANCIAL STATEMENTS FOR THE YEAR ENDED 30 JUNE 2012

M
auri
tian
Eag
le In
sura
nce
Co
mp
any
Lim
ited
Ann
ual R
epo
rt 2
012
45
(b) Discounted Liabilities The insurance liabilities for the balance of the business are established on a policy-by-policy basis. The basis of the
projections is a “best estimate” assumption basis. Certain margins were incorporated to allow for risk and uncertainty. As at 30 June 2012, the margins were as follows:
Change in Assumption Investment return 10 % p.a reduction in investment return Inflation 10 % Expenses 10 % Risk experience 10 % Estimates of future benefit payments under long-term insurance contracts are provided for, based on estimates made
by the company’s Actuary. Estimates are made as to the expected number of deaths for each of the years in which the company is exposed to risk. Estimates are based on standard industry mortality tables that reflect recent historical mortality experience, adjusted where appropriate, to reflect the country’s and company’s own experience.
For long-term insurance contracts with fixed and guaranteed terms and with Discretionary Participation Feature (DPF),
estimates of future deaths, voluntary terminations, investment returns and administration expenses are made at each valuation date and form the assumptions used for calculating the liabilities. A margin for risk and uncertainty is added to these assumptions. Assumptions are reconsidered each year based on the most recent operating experience and estimates of future experience and are used to recalculate the liabilities.
.
Long-term insurance (continued)
2012 2011
Rs’000 Rs’000
Discounted Liabilities 589,776 524,675
Undiscounted Liabilities 13,666 12,486
Net Actuarial Liability 603,442 537,161
4 CRITICAL ACCOUNTING ESTIMATES AND JUDGEMENTS IN APPLYING ACCOUNTING ESTIMATES (continued)
4.1 Insurance contracts (continued)
(a) Undiscounted Liabilities The following classes of business are valued on a retrospective basis: • GroupAnnuities • GroupLife • ManagedFunds
For this type of reserve calculation, the reserves are made up of: • UnearnedPremiumReserve(UPR); The UPR is in respect of unearned premiums of each policy, based on the renewal date of the policy and the frequency of
the premium payments.
For Managed Funds the Fund Value is held.
M
auri
tian
Eag
le In
sura
nce
Co
mp
any
Lim
ited
Ann
ual R
epo
rt 2
012
46
NOTES TO THE FINANCIAL STATEMENTS FOR THE YEAR ENDED 30 JUNE 2012
4.2 Credit impairment (a) Specific provision for credit impairment
The calculation of specific provision for credit impairment requires management to estimate the recoverable amount of each impaired asset, which is the estimated future cash flows discounted at the original effective interest rate of the lease. Where cash flows for large credits include the realisable value of collateral securing the credit, the value of such collateral is based on the opinion of independent and qualified appraisers and/or management judgement.
(b) Portfolio provision for credit impairment
The portfolio provision is estimated based upon historical patterns of losses in each component of the portfolio of leases as well as management estimate of the impact of current economic and other relevant conditions on the recoverability of the leases portfolio.
4 CRITICAL ACCOUNTING ESTIMATES AND JUDGEMENTS IN APPLYING ACCOUNTING ESTIMATES (continued)
Sensitivity analysis
The following table presents the sensitivity of the value of insurance liabilities disclosed, to movements in assumptions used in the estimation of insurance liabilities.
The table below indicates the level of the respective variable that will trigger an adjustment and then indicates the liability adjustment required as a result of a further deterioration in the variable.
Liability Difference
Rs’000 %
Actual reserve 603,442 -
Investment return less 1%(*) 619,259 1.03%
Mortality plus 10% 616,120 1.02%
Expenses plus 10% 615,290 1.02%
Withdrawals plus 10% 601,203 1.00%
Inflation plus 1% 610,487 1.01%
(*) without reducing the bonus rates

M
auri
tian
Eag
le In
sura
nce
Co
mp
any
Lim
ited
Ann
ual R
epo
rt 2
012
47
4 CRITICAL ACCOUNTING ESTIMATES AND JUDGEMENTS IN APPLYING ACCOUNTING ESTIMATES (continued)
4.3 Impairment of financial assets
Determining whether financial assets are impaired requires an estimation of the future cash flows and assess where there is objective evidence that, as a result of one or more events that occurred after the initial recognition of the financial asset, the estimated cash flows have been impacted. In making this estimation, the directors evaluate among other factors, the duration and the extent of the decline in the carrying of the financial asset below its cost, the financial health and near business outlook for the investee company and dividend yield. Changes in assumptions about these factors could affect the cash flow estimates, the carrying amount of the financial assets and the accounting treatment of the change in the carrying amount.
4.4 Impairment of unquoted investments
Determining whether investments are impaired requires an estimation of the value in use of the investments. In considering the value in use, the Directors have taken into account management accounts and cash flow projections. The actual results could, however, differ from the estimates.
4.5 Useful lives and residual values of property and equipment
Determining the carrying amounts of property and equipment requires the estimation of the useful lives and residual values of these assets which carry a degree of uncertainty. The directors have used historical information relating to the Group and the relevant industries in which the Group’s entities operate in order to best determine the useful lives and residual values of property and equipment.
4 CRITICAL ACCOUNTING ESTIMATES AND JUDGEMENTS IN APPLYING ACCOUNTING ESTIMATES (continued)
Sensitivity analysis
The following table presents the sensitivity of the value of insurance liabilities disclosed, to movements in assumptions used in the estimation of insurance liabilities.
The table below indicates the level of the respective variable that will trigger an adjustment and then indicates the liability adjustment required as a result of a further deterioration in the variable.
Liability Difference
Rs’000 %
Actual reserve 603,442 -
Investment return less 1%(*) 619,259 1.03%
Mortality plus 10% 616,120 1.02%
Expenses plus 10% 615,290 1.02%
Withdrawals plus 10% 601,203 1.00%
Inflation plus 1% 610,487 1.01%

M
auri
tian
Eag
le In
sura
nce
Co
mp
any
Lim
ited
Ann
ual R
epo
rt 2
012
48
5 PROPERTY, PLANT AND EQUIPMENT
Land and building
Plant and machinery
Furniture and equipment
Computer equipment
Motor vehicles
Total
Rs'000 Rs'000 Rs'000 Rs'000 Rs'000 Rs'000 The Group
Cost or valuationAt 1 July 2011 72,360 212,229 10,337 13,376 167,139 475,441 Additions - 200,672 10,703 2,801 19,891 234,067 Written off - - - - (2,405) (2,405)Disposals - (28,055) - (29) (55,417) (83,501)
At 30 June 2011 72,360 384,846 21,040 16,148 129,208 623,602 Additions - 137,177 2,750 2,914 110,319 253,160 Written off - - - - (1,227) (1,227)Disposals - (17,868) - (32) (29,629) (47,529)
At 30 June 2012 72,360 504,155 23,790 19,030 208,671 828,006
Accumulated depreciationAt 1 July 2011 - 74,550 7,683 10,364 58,653 151,250 Charge for the year 1,529 36,479 1,667 2,296 20,160 62,131 Written off - - - - (772) (772)Disposals - (7,307) - (29) (27,580) (34,916)
At 30 June 2011 1,529 103,722 9,350 12,631 50,461 177,693 Charge for the year 1,529 63,503 3,356 2,152 26,290 96,830 Written off - - - - (245) (245)Disposals - (15,084) - (32) (20,715) (35,831)
At 30 June 2012 3,058 152,141 12,706 14,751 55,791 238,447
Net book value at 30 June 2012 69,302 352,014 11,084 4,279 152,880 589,559
At 30 June 2011 70,831 281,124 11,690 3,517 78,747 445,909
NOTES TO THE FINANCIAL STATEMENTS FOR THE YEAR ENDED 30 JUNE 2012

M
auri
tian
Eag
le In
sura
nce
Co
mp
any
Lim
ited
Ann
ual R
epo
rt 2
012
49
5 PROPERTY, PLANT AND EQUIPMENT (Continued) Land and building
Furniture and equipment
Computer equipment
Motor vehicles
Total
Rs'000 Rs'000 Rs'000 Rs'000 Rs'000 The Company
Cost or valuationAt 1 July 2011 72,360 7,030 11,786 746 91,922 Additions - 5,542 1,016 - 6,558 Transfer to subsidiary company - (146) (507) - (653)Disposals - - (29) - (29)
At 30 June 2011 72,360 12,426 12,266 746 97,798 Additions - 153 1,568 - 1,721 Disposals - - (32) - (32)
At 30 June 2012 72,360 12,579 13,802 746 99,487
Accumulated depreciationAt 1 July 2011 - 4,975 8,966 436 14,377 Charge for the year 1,529 1,245 2,041 116 4,931 Transfer to subsidiary company - (96) (381) - (477)Disposals - - (29) - (29)
At 30 June 2011 1,529 6,124 10,597 552 18,802 Charge for the year 1,529 1,734 1,224 116 4,603 Disposals - - (32) - (32)
At 30 June 2012 3,058 7,858 11,789 668 23,373
Net book value at 30 June 2012 69,302 4,721 2,013 78 76,114
At 30 June 2011 70,831 6,302 1,669 194 78,996
2012 2011 Cost Accumulated
depreciation Net book
value Cost Accumulated
depreciationNet Book
value
Rs'000 Rs'000 Rs'000 Rs'000 Rs'000 Rs’000
Plant and machinery 508,917 156,900 352,017 384,846 103,722 281,124 Motor vehicles 206,910 54,774 152,136 127,529 49,768 77,761
715,827 211,674 504,153 512,375 153,490 358,885
(i) The value of land and building have been determined by the Directors based on a valuation carried out by an independent
valuer, Gexim Real Estate Ltd in June 2010 and taking into account their assessment of current market condition. The surplus of Rs.23,240,000 arising on revaluation was credited to revaluation reserve.
If land and building had been stated on an historical cost basis, the carrying amount would have been Rs.32,075,785 (2011: Rs.32,612,602).
(ii) The Group rents out the following plant and equipment under operating leases:-
M
auri
tian
Eag
le In
sura
nce
Co
mp
any
Lim
ited
Ann
ual R
epo
rt 2
012
50
5 PROPERTY, PLANT AND EQUIPMENT (continued) Rental income earned during the year was Rs103,558,340 (2011: Rs.71,157,800) and there were no expenses attributable directly
to plant and equipment under operating leases. The plant and equipment are expected to generate a yield ranging between 8.00% and 14.00% (2011: between 9.00% and 14.00%) on an ongoing basis. The plant and equipment and motor vehicles held have committed tenants for the next 2 to 5 years.
At the end of the reporting period, the Group has contracted with tenants for the following future minimum lease payments:
2012 2011Plant and machinery
Motor vehicles
Total Plant and machinery
Motor vehicles
Total
Rs'000 Rs'000 Rs'000 Rs'000 Rs'000 Rs’000
Within one year 80,896 36,404 117,300 70,329 23,786 94,115
In the second to the fifth years 200,793 87,351 288,144 180,587 50,646 231,233
After five years - 150 150 - - -
281,689 123,905 405,594 250,916 74,432 325,348
Operating lease contracts contain market review clauses. The lease terms vary between 5 and 6 years with an option for renewal. (iii) Mauritian Eagle Leasing Company Limited has pledged part of its plant and machinery with a net book value of Rs45 million to
secure loan facilities granted to it.
NOTES TO THE FINANCIAL STATEMENTS FOR THE YEAR ENDED 30 JUNE 2012

M
auri
tian
Eag
le In
sura
nce
Co
mp
any
Lim
ited
Ann
ual R
epo
rt 2
012
51
6 INTANGIBLE ASSETS
At 30 June 2012, computer softwares have a remaining useful life of 1 to 4.5 years for both the Group and the Company (2011: 1 to 6 years for the Group and 1 to 5.5 years for the Company).
The Group The CompanyRs’000 Rs’000
Computer software
Cost or valuationAt 1 July 2011 28,973 25,134 Additions 1,440 295 Transfer to subsidiary company - (6,344)
At 30 June 2011 30,413 19,085 Additions 1,849 632
At 30 June 2012 32,262 19,717
Accumulated depreciationAt 1 July 2011 15,336 12,399 Charge for the year 3,715 2,994
At 30 June 2011 19,051 15,393 Charge for the year 2,183 1,848
At 30 June 2012 21,234 17,241
Net book value at 30 June 2012 11,028 2,476
At 30 June 2011 11,362 3,692
7 INVESTMENT IN SUBSIDIARIES
(b) Valuation
The directors consider that the cost of the investment approximate its market value.
(c) Details of subsidiaries
The Company2012
Rs’0002011
Rs’000(a) Unquoted investment at cost
At 1 July 127,000 81,600 Additions - 45,400
At 30 June 127,000 127,000
Class of shares held
Main Activity Country of Incorporation
Mauritian Eagle Insurance% Holding
2012 2011
Mauritian Eagle Leasing Company Ltd Ordinary Leasing and deposit taking Mauritius 51% 51%
Mauritian Eagle Life Company Ltd Ordinary Life assurance and pension Mauritius 100% 100%

M
auri
tian
Eag
le In
sura
nce
Co
mp
any
Lim
ited
Ann
ual R
epo
rt 2
012
52
NOTES TO THE FINANCIAL STATEMENTS FOR THE YEAR ENDED 30 JUNE 2012
(c) Summarised financial information in respect of the Group’s associate is set out below:-
The investment in associate has been restated to account for movement in translation difference. The effect has been a decrease in the cost of investment in 2010 and prior years by Rs9.4m and by Rs2.1m in 2011 with a corresponding decrease in equity for the respective years.
2012Rs’000
2011Rs’000
Total assets 293,465 316,431 Total liabilities (163,659) (217,639)
Net assets 129,806 98,792
Group’s share of associate’s net assets 25,961 19,758
Revenue 254,232 248,083
Profit for the year 29,699 31,833
Group’s share of associate’s profit for the year 5,940 6,367
8 INVESTMENT IN ASSOCIATE
The Group The Company 2012 2011 2012 2011
Rs'000 Rs'000 Rs'000 Rs'000 (a) Unquoted investment at cost
At 1 July 19,758 18,309 6,313 6,313
Share of profit net of tax 5,940 6,367 - -
Dividend (1,102) (2,822) - -
Translation difference 1,365 (2,096) - -
At 30 June 25,961 19,758 6,313 6,313
(b) Details of associate Class of Main Country of Mauritian Eagle Insurance
shares held Activity Incorporation % Holding 2012 2011
H Savy Insurance Company Ltd Ordinary General and life insurance
business Seychelles 20% 20%

M
auri
tian
Eag
le In
sura
nce
Co
mp
any
Lim
ited
Ann
ual R
epo
rt 2
012
53
Held to maturity investments is made up of debentures and bank bonds bearing interest rate varying from 8.40% to 10.00% (2011: 9.75% to 10.00%) with maturity date varying from 2015 to 2018 respectively. The directors consider the cost of the unquoted investments to approximate their fair value.
The statutory deposits are pledged in favour of the Financial Services Commission and earn interest at rates varying from 4.55% to 6.55% per annum (2011: 5.65% to 6.55% per annum) with maturity dates varying from August 2012 to June 2016.
9 STATUTORY AND OTHER DEPOSITS2012 2011
The Group and Company Total Total Rs'000 Rs’000
At 1 July and 30 June 9,000 16,000
Analysed as:Non-current 2,500 6,500 Current 6,500 9,500
9,000 16,000
2012 2011 Available-for-sale Held to Total Total
The Group securities maturity At fair value At Cost
Rs'000 Rs'000 Rs'000 Rs'000 Rs'000
At 1 July 308,152 3,673 86,000 397,825 223,232 Additions 172,163 - 90,000 262,163 253,063 Disposals (148,501) - - (148,501) (102,154)Change in fair value (19,137) - - (19,137) 23,684
At 30 June 312,677 3,673 176,000 492,350 397,825
Net proceeds on disposals 134,493 - - 134,493 99,646
2012 2011 Available-for-sale Held to Total Total
The Company securities maturity At fair value At Cost
Rs'000 Rs'000 Rs'000 Rs'000 Rs'000
At 1 July 98,648 3,673 43,000 145,321 223,232 Additions 44,156 - 40,000 84,156 161,440 Disposals (49,465) - - (49,465) (84,856)Transfer to subsidiary company - - - - (169,547)Change in fair value (1,274) - - (1,274) 15,052
At 30 June 92,065 3,673 83,000 178,738 145,321
Net proceeds on disposals 45,299 - - 45,299 81,795
10 FINANCIAL ASSETS

M
auri
tian
Eag
le In
sura
nce
Co
mp
any
Lim
ited
Ann
ual R
epo
rt 2
012
54
NOTES TO THE FINANCIAL STATEMENTS FOR THE YEAR ENDED 30 JUNE 2012
10 FINANCIAL ASSETS (Continued)
11 MORTGAGE AND OTHER LOANS
Available-for-sale financial assets comprise of quoted and unquoted securities and units. The fair value is based on the Stock Exchange and brokers’ statement prices at the close of business at the end of the reporting period.
The Group2012 2011
Rs'000 Rs'000
Non-current 10,698 8,931 Repayable by instalments: after one and before two years 20,389 24,696 Repayable by instalments: after two and before five years 74,078 72,054 Repayable by instalments: after five years
105,165 105,681
CurrentRepayable by instalments within one year 17,108 16,741
122,273 122,422
The Group and Company
2012 2011 Rs'000 Rs'000
Ageing of past due but not impaired: 139 66 91-120 days 15,180 14,728
Over 121 days 15,319 14,794
The mortgage and other loans are secured on the respective assets and policy loans and bear interest at rates varying from 7.00% to 14.00% per annum for the year (2011: 7.00% to 14.00%).
The directors are of the opinion that the mortgage and other loans over 121 days are fully recoverable and that no provision is required.

M
auri
tian
Eag
le In
sura
nce
Co
mp
any
Lim
ited
Ann
ual R
epo
rt 2
012
55
12 FINANCE LEASE RECEIVABLES
The Group2012 2011
Rs'000 Rs'000 (a) Movement during the year:
At 1 July 1,094,483 1,122,963 Leases granted during the year 557,712 434,654 Capital Movement during the year (334,041) (413,134)Transferred during the year - (50,000)
1,318,154 1,094,483 Less allowance for credit losses (41,913) (38,985)
1,276,241 1,055,498
Present value of the minimum lease payments 1,318,154 1,094,483
Analysed as: Non-current 970,547 821,181 Less allowance for credit losses (35,577) (30,660)
934,970 790,521
Current 347,607 273,302 Less allowance for credit losses (6,336) (8,325)
341,271 264,977
1,276,241 1,055,498
All finance lease receivables are secured over the assets leased and in some cases additional guarantees are taken from the clients for the facility availed.
The average lease term is 5 to 7 years and the effective interest rate on finance leases is approximately 9% (2011: 10%) and is fixed at the contract date for the entire lease term. Before granting lease to clients, the subsidiary uses a credit scoring system to assess the potential client’s credit quality and profile. Upon satisfactory scoring and submission of all necessary documents, the lease is granted. There is no individual client which accounts for more than 10% of the total portfolio of the subsidiary. The largest client currently accounts for 5% (2011: 5%) of the total lease portfolio. No equipment has been transferred from finance to operating lease term during the year. The maximum exposure to credit risk of finance lease receivables for the current and prior periods is the carrying amount net of allowance for credit losses.

M
auri
tian
Eag
le In
sura
nce
Co
mp
any
Lim
ited
Ann
ual R
epo
rt 2
012
56
NOTES TO THE FINANCIAL STATEMENTS FOR THE YEAR ENDED 30 JUNE 2012
12 FINANCE LEASE RECEIVABLES (Continued)
Ageing of past due and impaired finance lease receivablesThe Group
2012 2011 Rs'000 Rs'000
Over 180 days 42,691 39,858
Movement in the allowance of credit losses
(b) The Group2012 2011
Rs'000 Rs'000 Gross and net investment in finance leases: - within one year 440,825 354,634 - between one and five years 1,088,443 936,708 - over 5 years 22,796 16,094
1,552,064 1,307,436 Less unearned finance income (233,910) (212,953)
Net investment in finance lease before allowance for credit losses 1,318,154 1,094,483
In determining the recoverability of a debt, the company considers each client on a case by case basis, taking into account any change in the credit quality of the client from the date credit was initially granted up to the recording date. The concentration of credit risk is limited due to the customer base being large and unrelated. Management is of the opinion that there is no further credit provision required in excess of the allowance for credit losses.
Ageing of past due debt but not impaired
The Group
2012 2011 Rs'000 Rs’000
90 days – 180 days 4,114 5,769 Over 180 days 35,910 39,973
40,024 45,742
Included in the amount of Rs.35,910,048 (2011: Rs.39,973,345) is an amount of Rs.1,012,971 (2011: Rs.7,980,565) for which the subsidiary holds additional collateral. The collateral held is a personal guarantee on the assets of the customer.

M
auri
tian
Eag
le In
sura
nce
Co
mp
any
Lim
ited
Ann
ual R
epo
rt 2
012
57
(c) Remaining term to maturityThe Group
2012Rs’000
2011Rs’000
Within 3 months 19,925 10,122 Over 3 to 6 months 19,388 15,091 Over 6 to 12 months 74,705 48,147 Over 1 to 5 years 1,110,155 993,349 Over 5 years 93,981 27,774
1,318,154 1,094,483
(d) Credit concentration of risk by industry sectorsThe Group
2012 Rs'000
2011 Rs'000
Agriculture and fishing 319,872 282,974 EPZ 62,506 76,414 Non-EPZ 560 860 Tourism 128,866 78,710 Transport 114,944 99,089 Construction 372,888 312,290 Financial and Business Services 62,021 56,216 Traders 132,883 91,649 Personal 120,108 95,094 Other 3,506 1,187
1,318,154 1,094,483
(e) Provision for credit lossesThe Group
2012 2011
Rs'000 Rs'000
At 1 July 38,985 78,118 Provision made during the year 15,986 15,578 Amount written off (13,058) (52,568) Amount recovered during the year - (2,143)
At 30 June 41,913 38,985
12 FINANCE LEASE RECEIVABLES (Continued)
The fair value of the finance lease receivables at 30 June 2012 is estimated at Rs1.3bn (2011: Rs1.1bn) based on discounted estimated future cash flows at market rate. The fair value of the collaterals of the finance lease receivables at 30 June 2012 is estimated at Rs1.4bn (2011: Rs.1.1bn), based on the assets depreciated value. The lessee has the option to purchase the asset at the end of the lease period. The guaranteed residual values of assets under finance leases at the end of the reporting year are estimated at Rs22.4m (2011: Rs16.6m).
Ageing of past due and impaired finance lease receivablesThe Group
2012 2011 Rs'000 Rs'000
Over 180 days 42,691 39,858
Movement in the allowance of credit losses
(b) The Group2012 2011
Rs'000 Rs'000 Gross and net investment in finance leases: - within one year 440,825 354,634 - between one and five years 1,088,443 936,708 - over 5 years 22,796 16,094
1,552,064 1,307,436 Less unearned finance income (233,910) (212,953)
Net investment in finance lease before allowance for credit losses 1,318,154 1,094,483
Ageing of past due debt but not impaired
The Group
2012 2011 Rs'000 Rs’000
90 days – 180 days 4,114 5,769 Over 180 days 35,910 39,973
40,024 45,742
Included in the amount of Rs.35,910,048 (2011: Rs.39,973,345) is an amount of Rs.1,012,971 (2011: Rs.7,980,565) for which the subsidiary holds additional collateral. The collateral held is a personal guarantee on the assets of the customer.

M
auri
tian
Eag
le In
sura
nce
Co
mp
any
Lim
ited
Ann
ual R
epo
rt 2
012
58
NOTES TO THE FINANCIAL STATEMENTS FOR THE YEAR ENDED 30 JUNE 2012
12 FINANCE LEASE RECEIVABLES (Continued)
(e) Provision for credit losses (continued)
Provision for credit losses by industry sector2012 2011
Ageing of Total Ageing of Total
impaired non- Provision impaired non- Provision
performing performing
leases Rs’000 leases Rs'000
The Group
Agriculture and fishing 11,713 14,536 7,600 10,219
EPZ - 700 202 939
Tourism - 1,500 1,043 2,093
Transport - 1,150 5,200 4,263
Construction 21,828 14,497 15,293 13,057
Financial and Business Services 2,737 3,944 4,447 2,917
Traders 3,219 1,982 3,674 3,167
Personal 3,194 3,564 2,399 2,303
Other - 40 - 27
42,691 41,913 39,858 38,985
(f) Credit facilities to related partiesThe Group
2012 2011
Rs'000 Rs'000
Net investment in finance leases granted to related partiesAt 1 July 40,864 40,116 Lease granted during the year 5,512 16,096 Reclassification of balances 20,048 (2,531)Capital repayments during the year (26,633) (12,817)
At 30 June 39,791 40,864

M
auri
tian
Eag
le In
sura
nce
Co
mp
any
Lim
ited
Ann
ual R
epo
rt 2
012
59
13 TRADE AND OTHER RECEIVABLES
14 AMOUNTS DUE FROM GROUP COMPANIES
The Group The Company2012 2011 2012 2011
Rs'000 Rs'000 Rs'000 Rs'000
Trade receivables 127,103 116,334 127,103 116,334 Amounts due by ceding companies 11,184 26,061 9,291 26,061 Other receivables 141,818 117,315 9,962 5,415
280,105 259,710 146,356 147,810
The Group & Company2012 2011
Rs'000 Rs'000
Ageing of past due but not impaired:91-120 days 11,145 17,891 Over 120 days 19,353 9,669
30,498 27,560
The Group The Company2012 2011 2012 2011
Rs'000 Rs'000 Rs'000 Rs'000 Amount due from immediate holding company 2,462 2,738 1,712 2,738 Deposit with immediate holding company 270,491 258,754 192,025 181,610 Amount due from subsidiary - - 1,413 -
272,953 261,492 195,150 184,348
The average credit period on sales of insurance premiums of the Company is 63 days (2011: 65 days) and no interest is charged on the trade receivables from the date the debit note is issued. Before accepting any new customer, the company’s credit control department assesses the potential customer’s credit quality and define terms and credit limits for the customer. Of the trade receivables balance at the end of the year, Rs4.3m (2011: Rs.2.9m) is due by the Group holding company, Ireland Blyth Limited, the Group’s largest customer and there are no other customers who represent more than 10% of the total balance of trade receivables.
In determining the recoverability of a trade receivable, the Group considers any change in the credit quality of the trade receivable from the date credit was initially granted up to the reporting date. No allowance for doubtful debts has been made for trade receivables over 120 days at end of year as management is of opinion that the amounts are considered to be recoverable for the Group.
(i) The amount due from the immediate holding company and subsidiary are unsecured, interest free and does not have fixed terms of repayment.
(ii) The deposit with the immediate holding company is unsecured, bears interest varying from 5.60% to 7.00% per annum (2011: 7.00% to 8.00% per annum) and does not have fixed terms of repayment.

M
auri
tian
Eag
le In
sura
nce
Co
mp
any
Lim
ited
Ann
ual R
epo
rt 2
012
60
NOTES TO THE FINANCIAL STATEMENTS FOR THE YEAR ENDED 30 JUNE 2012
15 OUTSTANDING CLAIMS
The Group The Company
2012 2012 Gross Reinsurance Net Gross Reinsurance Net
Rs'000 Rs'000 Rs'000 Rs'000 Rs'000 Rs'000
Claims notified 186,691 (67,142) 119,549 186,691 (67,142) 119,549 Claims incurred but not reported 15,500 - 15,500 15,500 - 15,500
At 1 July 202,191 (67,142) 135,049 202,191 (67,142) 135,049 Increase in liabilities (Note 28) 220,133 (34,085) 186,048 220,133 (34,085) 186,048
Cash (paid)/received for claims settled in the year (195,347) 35,032 (160,315) (195,347) 35,032 (160,315)At 30 June 226,977 (66,195) 160,782 226,977 (66,195) 160,782 Analysed as:Claims notified 203,977 (66,195) 137,782 203,977 (66,195) 137,782 Claims incurred but not reported 23,000 - 23,000 23,000 - 23,000
226,977 (66,195) 160,782 226,977 (66,195) 160,782
2011 2011 Gross Reinsurance Net Gross Reinsurance Net
Rs'000 Rs'000 Rs'000 Rs'000 Rs'000 Rs'000
Claims notified 156,030 (52,520) 103,510 156,030 (52,520) 103,510 Claims incurred but not reported 8,250 - 8,250 8,250 - 8,250
At 1 July 164,280 (52,520) 111,760 164,280 (52,520) 111,760 Increase in liabilities (Note 28) 194,413 (39,131) 155,282 194,413 (39,131) 155,282
Cash (paid)/received for claims settled in the year (156,502) 24,509 (131,993) (156,502) 24,509 (131,993)
At 30 June 202,191 (67,142) 135,049 202,191 (67,142) 135,049

M
auri
tian
Eag
le In
sura
nce
Co
mp
any
Lim
ited
Ann
ual R
epo
rt 2
012
61
The Group and Company
2012 2011
Rs'000 Rs'000
Issued and fully paid
7,999,998 ordinary shares of Rs10 each 80,000 80,000
The issued and fully paid shares carry one vote per share and a right to dividend.
The Group
2012 2011
Rs'000 Rs'000
At 1 July 2,334 2,334
Transfer from statement of comprehensive income 12 -
At 30 June 2,346 2,334
The Group and Company
Gross Reinsurance Net
Rs'000 Rs'000 Rs'000
At 1 July 2010 128,631 (19,487) 109,144
Increase in the year 62,948 (5,004) 57,944
At 30 June 2011 191,579 (24,491) 167,088
Increase in the year 49,058 1,638 50,696
At 30 June 2012 240,637 (22,853) 217,784
16 STATED CAPITAL
17 OTHER RESERVES
18 GENERAL INSURANCE FUND
In compliance with Section 21 of the Banking Act 2004, a reserve account representing a minimum of 15% of profit after tax for the year of Mauritian Eagle Leasing Company Limited has been maintained.

M
auri
tian
Eag
le In
sura
nce
Co
mp
any
Lim
ited
Ann
ual R
epo
rt 2
012
62
NOTES TO THE FINANCIAL STATEMENTS FOR THE YEAR ENDED 30 JUNE 2012
The Group The Company
2012 2011 2012 2011
Rs'000 Rs'000 Rs'000 Rs'000
At 1 July 515,586 585,303 - 585,303
Transfer from/(release to) life income statement 81,925 (69,717) - (72,338)
Transfer from holding company to subsidiary - - - (512,965)
At 30 June 597,511 515,586 - -
The Group
2012 2011
Rs'000 Rs'000
Non-current
Loans repayable after more than one year but less than five years 35,737 45,076
Current
Loans repayable within one year 43,124 -
78,861 45,076
19 LIFE INSURANCE FUND
20 LOANS
The loans of Rs13.1m repayable within one year and Rs35.7m (2011: Rs45.1m) repayable after more than one year have been taken by Mauritian Eagle Leasing Company Limited under the Leasing Equipment Modernisation Scheme to finance small and medium enterprises, bearing interest at 5% per annum and are repayable from 3 to 5 years. The bank loan of Rs.30m bears interest rate of 5.25% and is renewable on a monthly basis.

M
auri
tian
Eag
le In
sura
nce
Co
mp
any
Lim
ited
Ann
ual R
epo
rt 2
012
63
The Group The Company
2012 2011 2012 2011
Rs'000 Rs'000 Rs'000 Rs'000
At 1 July 11,581 13,044 3,617 4,656
Transfer to retained earnings (88) - (88) -
Charge for the year 487 (1,463) 128 (1,039)
At 30 June 11,980 11,581 3,657 3,617
The deferred tax balances comprise of the following:
Revaluation of properties 3,310 3,398 3,310 3,398
Accelerated capital allowances 8,670 8,183 347 219
The Group
2012 2011
Rs'000 Rs'000
Time deposits with remaining term to maturity:
Non-current
After one and before five years 681,581 542,499
After five years 1,750 1,500
683,331 543,999
Current
Within three months 357,119 239,828
After three and before six months 286,004 159,288
After six and before twelve months 360,144 440,386
1,003,267 839,502
1,686,598 1,383,501
The time deposits bear interest at rates varying from 4.95% and 13.75% per annum (2011: 5.15% and 13.75% per annum).
21 DEPOSITS FROM CUSTOMERS
22 DEFERRED TAX LIABILITIES
Deferred taxation is calculated on all temporary differences under the liability method at the rate of 15% (2011: 15%). The movement on deferred tax account is as follows:

M
auri
tian
Eag
le In
sura
nce
Co
mp
any
Lim
ited
Ann
ual R
epo
rt 2
012
64
NOTES TO THE FINANCIAL STATEMENTS FOR THE YEAR ENDED 30 JUNE 2012
The Group The Company
2012 2011 2012 2011
Rs'000 Rs'000 Rs'000 Rs'000
Amounts due to reinsurers 67,454 54,338 56,994 46,582
Other payables 142,368 59,668 22,234 20,251
209,822 114,006 79,228 66,833
(i) Current tax liabilities
The Group The Company
2012 2011 2012 2011
Rs'000 Rs'000 Rs'000 Rs'000
At 1 July 2,611 2,397 2,611 2,397
Charge for the year 13,819 10,303 13,819 10,303
Under provision in previous year 742 - 742 -
Amount paid during the year (11,336) (10,089) (11,336) (10,089)
At 30 June 5,836 2,611 5,836 2,611
23 TRADE AND OTHER PAYABLES
24 AMOUNTS DUE TO IMMEDIATE HOLDING COMPANY
25 TAXATION
(i) The Group has financial risk management policies in place to ensure that all payables are paid within the credit timeframe. (ii) The carrying amounts of trade and other payables approximate their fair values.
The amount due to the immediate holding company is unsecured, interest free and does not have fixed terms of repayment.
Income tax is calculated at the rate of 15% (2011:15%) on the profit for the year as adjusted for income tax purposes for both the company and its subsidiaries.

M
auri
tian
Eag
le In
sura
nce
Co
mp
any
Lim
ited
Ann
ual R
epo
rt 2
012
65
The Group The Company2012 2011 2012 2011
Rs'000 Rs'000 Rs'000 Rs'000 Interest incomeBank deposits 4,530 2,515 1,213 1,261 Loans and receivables 43,298 45,714 19,902 14,945 Held-to-maturity investments 12,027 8,337 5,178 956
59,855 56,566 26,293 17,162 Investment incomeDividend from available for sale investments 7,608 4,956 3,317 2,574 Dividend from associate - - 1,102 2,822
7,608 4,956 4,419 5,396
Total 67,463 61,522 30,712 22,558
(ii) Charge to statement of comprehensive income
The Group The Company2012 2011 2012 2011
Rs'000 Rs'000 Rs'000 Rs'000
Current tax liabilities 13,819 10,303 13,819 10,303 Under provision in previous year 742 - 742 - Deferred tax movement (Note 22) 399 (1,463) 40 (1,039)
14,960 8,840 14,601 9,264
(iii) Tax reconciliation
The tax on the Group’s and the Company’s profit before tax differs from the theoretical amount that arises using the basic tax rate of the Group and the Company as follows:
The Group The Company2012 2011 2012 2011
Rs'000 Rs'000 Rs'000 Rs'000
Profit before taxation 98,199 45,874 92,925 75,851
Tax calculated at 15% 14,730 6,881 13,939 11,378 Tax effect of:Income not subject to tax (1,732) (2,893) (625) (2,362)Under provision in previous year 742 - 742 - Expenses not deductible for tax purposes 1,220 4,852 545 248
14,960 8,840 14,601 9,264
25 TAXATION (Continued)
26 INVESTMENT INCOME

M
auri
tian
Eag
le In
sura
nce
Co
mp
any
Lim
ited
Ann
ual R
epo
rt 2
012
66
NOTES TO THE FINANCIAL STATEMENTS FOR THE YEAR ENDED 30 JUNE 2012
Investment revenue earned on financial assets, analysed by category of asset, is as follows:
The Group The Company
2012 2011 2012 2011
Rs'000 Rs'000 Rs'000 Rs'000
Available-for-sale financial assets 7,608 4,956 3,317 2,574
Loans and receivables (including cash and bank balances) 47,828 48,229 21,115 16,206
Associate - - 1,102 2,822
Held to maturity investments 12,027 8,337 5,178 956
67,463 61,522 30,712 22,558
The Group The Company
2012 2011 2012 2011
Rs'000 Rs'000 Rs'000 Rs'000
Profit on disposal of property, plant and equipment 57 1,726 7 7
(Loss)/profit on disposal of financial assets (1,090) (3,624) 1,120 (5,255)
Profit commission 8,466 2,421 - -
Consideration for annuities 4,502 2,439 - -
Net foreign exchange gains/(losses) 1,147 (294) 430 (251)
Administration and Management fees 9,908 - - 9,954
Others 11,897 11,094 2,611 2,255
34,887 13,762 4,168 6,710
26 INVESTMENT INCOME (Continued)
27 OTHER INCOME

M
auri
tian
Eag
le In
sura
nce
Co
mp
any
Lim
ited
Ann
ual R
epo
rt 2
012
67
The Group
2012 2011
Gross Reinsurance Net Gross Reinsurance Net
Rs'000 Rs'000 Rs'000 Rs'000 Rs'000 Rs'000
Net claims incurred (Note 15) 220,133 (34,085) 186,048 194,413 (39,131) 155,282
Death,maturity and surrender benefits paid 98,872 (26,716) 72,156 240,636 - 240,636
319,005 (60,801) 258,204 435,049 (39,131) 395,918
The Company
2012 2011
Gross Reinsurance Net Gross Reinsurance Net
Rs'000 Rs'000 Rs'000 Rs'000 Rs'000 Rs'000
Net claims incurred (Note 15) 220,133 (34,085) 186,048 194,413 (39,131) 155,282
The Group The Company
2012 2011 2012 2011
Rs'000 Rs'000 Rs'000 Rs'000
Administrative expenses include:
Staff costs 53,920 46,050 35,836 28,244
Depreciation and amortisation 99,013 65,846 6,451 7,925
Property, plant and equipment written off 982 1,633 - -
Net impairment loss on finance lease receivables 2,928 41,754 - -
Donations 145 38 7 35
Corporate social responsibility contribution 1,212 1,030 1,212 793
The Group2012 2011
Rs'000 Rs'000
Interest on deposits from customers 125,808 128,182
Interest on loans 2,303 1,969
128,111 130,151
28 BENEFITS AND CLAIMS
29 ADMINISTRATIVE EXPENSES
30 FINANCE COSTS
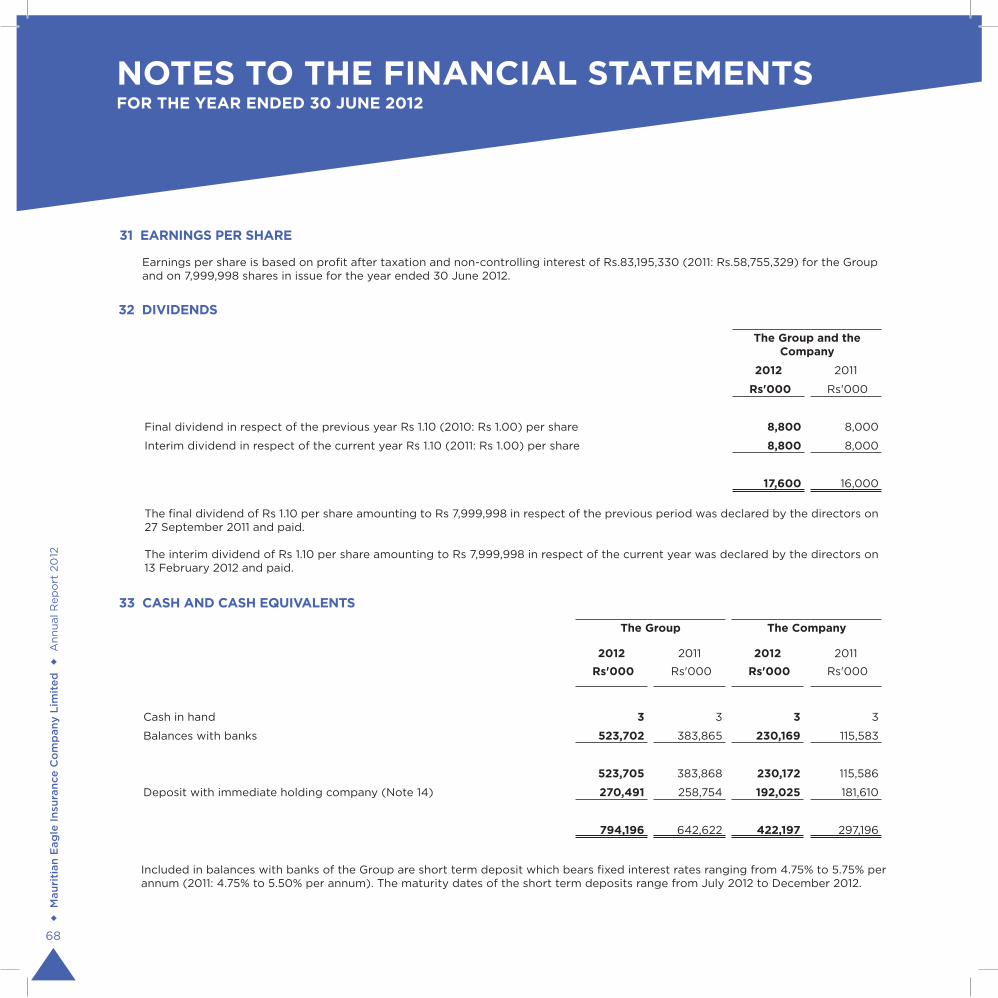
M
auri
tian
Eag
le In
sura
nce
Co
mp
any
Lim
ited
Ann
ual R
epo
rt 2
012
68
NOTES TO THE FINANCIAL STATEMENTS FOR THE YEAR ENDED 30 JUNE 2012
Earnings per share is based on profit after taxation and non-controlling interest of Rs.83,195,330 (2011: Rs.58,755,329) for the Group and on 7,999,998 shares in issue for the year ended 30 June 2012.
The Group and the Company
2012 2011
Rs'000 Rs'000
Final dividend in respect of the previous year Rs 1.10 (2010: Rs 1.00) per share 8,800 8,000
Interim dividend in respect of the current year Rs 1.10 (2011: Rs 1.00) per share 8,800 8,000
17,600 16,000
The final dividend of Rs 1.10 per share amounting to Rs 7,999,998 in respect of the previous period was declared by the directors on 27 September 2011 and paid.
The interim dividend of Rs 1.10 per share amounting to Rs 7,999,998 in respect of the current year was declared by the directors on 13 February 2012 and paid.
31 EARNINGS PER SHARE
32 DIVIDENDS
The Group The Company
2012 2011 2012 2011
Rs'000 Rs'000 Rs'000 Rs'000
Cash in hand 3 3 3 3
Balances with banks 523,702 383,865 230,169 115,583
523,705 383,868 230,172 115,586
Deposit with immediate holding company (Note 14) 270,491 258,754 192,025 181,610
794,196 642,622 422,197 297,196
33 CASH AND CASH EQUIVALENTS
Included in balances with banks of the Group are short term deposit which bears fixed interest rates ranging from 4.75% to 5.75% per annum (2011: 4.75% to 5.50% per annum). The maturity dates of the short term deposits range from July 2012 to December 2012.

M
auri
tian
Eag
le In
sura
nce
Co
mp
any
Lim
ited
Ann
ual R
epo
rt 2
012
69
(a) Defined benefit plan
The Group shares risks of a defined benefit plan which is operated by its ultimate holding company, GML Investissement Limitée. However Ireland Blyth Limited, the immediate holding company has a stated policy for charging the net defined benefit cost to the company or any shortfall in the contribution. The figures disclosed below relate to Ireland Blyth Limited and its subsidiaries (IBL Group).
The amounts recognised in statement of financial position of Ireland Blyth Limited:
2012 2011
Rs'000 Rs'000
Present value of defined benefit obligation (866,755) (810,149)
Fair value of plan assets 560,445 599,880
Deficit (306,310) (210,269)
Unrecognised actuarial loss 186,539 105,328
Net liability in statement of financial position (119,771) (104,941)
Movements in the present value of the defined benefit obligations in the current year were as follows:
2012 2011
Rs'000 Rs'000
At 1 July (810,149) (746,521)
Current service cost (17,485) (16,749)
Interest cost (73,134) (38,240)
Past service cost (11,403) (4,560)
Actuarial gains/(losses) 3,554 (44,222)
Benefits paid 41,862 40,143
At 30 June (866,755) (810,149)
34 RETIREMENT BENEFIT OBLIGATIONS

M
auri
tian
Eag
le In
sura
nce
Co
mp
any
Lim
ited
Ann
ual R
epo
rt 2
012
70
NOTES TO THE FINANCIAL STATEMENTS FOR THE YEAR ENDED 30 JUNE 2012
(a) Defined benefit plan (Continued)
Movements in the present value of the plan assets in the current year were as follows:
2012 2011
Rs'000 Rs'000
At 1 July 599,880 549,798
Expected return on plan assets 65,487 27,886
Contributions from the employer 28,618 28,704
Scheme expenses (720) (1,829)
Cost of insuring risk benefits (4,092) (5,365)
Actuarial gains/(losses) (86,866) 40,829
Benefits paid (41,862) (40,143)
At 30 June 560,445 599,880
The major categories of plan assets, and the expected rate of return at the end of the reporting period for each category, is as follows:
Expected rate of return at 30 June
Fair value ofplan assets
2012 2011 2012 2011 % % Rs'000 Rs'000
Local equities 13 13 229,782 245,951
Overseas equities 13 13 184,947 197,960
Fixed interest 10 10 145,716 155,969
Total market value of assets 560,445 599,880
Present value of plan liability (866,755) (810,149)
Deficit (306,310) (210,269)
Unrecognised actuarial loss 186,539 105,328
Net liability for retirement obligation (119,771) (104,941)
34 RETIREMENT BENEFIT OBLIGATIONS (Continued)

M
auri
tian
Eag
le In
sura
nce
Co
mp
any
Lim
ited
Ann
ual R
epo
rt 2
012
71
(a) Defined benefit plan (Continued)
The overall expected rate of return is a weighted average of the expected returns of the various categories of plan assets held. The Directors’ assessment of the expected returns is based on historical return trends and analysts’ predictions of the market for the asset in the next twelve months. The assets of the plan are part of the GML Pension Fund which is managed by Confident Asset Management, AXYS, IPRO and GML Management. The breakdown of the assets above correspond to the target allocation of the GML Pension Fund. In terms of the individual expected returns, the expected return on equities has been based on an equity risk premium above a risk free rate. The risk free rate has been measured in accordance to the yields on government bonds at the measurement date. The fixed interest portfolio includes government bonds, debentures, mortgages and cash. The expected return for this asset class has been based on yields of government bonds at the mesurement date. The history of experience adjustments is as follows:
2012 2011 2010 2009 2008
Rs'000 Rs'000 Rs'000 Rs'000 Rs'000
Present value of defined benefit obligation (866,755) (810,149) (746,521) (708,012) (636,821)
Fair value of plan assets 560,445 599,880 549,798 558,703 483,034
Deficit (306,310) (210,269) (196,723) (149,309) (153,787)
Experience gains/(losses) on plan liabilities 3,554 (44,222) (18,329) (41,928) (27,074)
Experience (losses)/gains on plan assets (86,866) 40,829 (25,369) 50,330 (156,482)
Expected contribution
Ireland Blyth Limited, is expected to contribute Rs32.5m (2011: Rs17.6m) to the defined benefit plans during the next financial year.
The principal actuarial assumptions used for accounting purposes were:
2012 2011
Discount rate 9.50% 9.50%
Expected return on plan assets 9.50% 10.50%
Future long term salary increases 8.00% 8.00%
Future guaranteed pension increase 0.00% 0.00%
Post retirement mortality tables a(90) a(90)
Retirement benefit obligations have been based on the report dated 27 August 2012 submitted by The Anglo Mauritius Assurance Society Ltd.
34 RETIREMENT BENEFIT OBLIGATIONS (Continued)

M
auri
tian
Eag
le In
sura
nce
Co
mp
any
Lim
ited
Ann
ual R
epo
rt 2
012
72
NOTES TO THE FINANCIAL STATEMENTS FOR THE YEAR ENDED 30 JUNE 2012
(b) Contribution to Ireland Blyth Limited's defined benefit pension plan
The Group The Company
2012 2011 2012 2011
Rs'000 Rs'000 Rs'000 Rs'000
Contributions expensed 2,613 2,526 3,025 2,108
(c) State pension plan
National Pension Scheme contributions expensed 879 740 666 586
(d) Contribution to defined contribution pension plan
Contributions expensed 2,459 1,986 1,333 1,066
35 FINANCIAL INSTRUMENTS
Capital Risk Management
The Group manages its capital to ensure that entities in the group will be able to continue as a going concern and also comply with applicable laws and regulations while maximizing the return to stakeholders through optimization of the debt and equity balance.
The capital structure of the Group consists of net debt (borrowings as disclosed in note 20, and offset by cash and bank balances) and equity attributable to owners of the Group (comprising issued capital, reserves, retained earnings and non-controlling interests as detailed in notes 16 and 17).
34 RETIREMENT BENEFIT OBLIGATIONS (Continued)

M
auri
tian
Eag
le In
sura
nce
Co
mp
any
Lim
ited
Ann
ual R
epo
rt 2
012
73
35 FINANCIAL INSTRUMENTS (Continued)
Capital Risk Management (Continued)
The Group is required to maintain a minimum capital requirement under the Insurance Act 2005 and rules made by the Financial Services Commission.
Under the Insurance (General Insurance Business Solvency) Rules 2007, the minimum capital requirement for general business is the sum of capital required for statement of financial position assets as per rule 6, capital required for investment above concentration limit as per rule 7, capital required for policy liabilities as per rule 8, capital required for catastrophes as per rule 9 and capital required for reinsurance ceded under rule 10.
Under the Insurance (Long-Term Insurance Business Solvency) Rules 2007, the minimum capital requirement for long term business is determined by the actuary, which is the higher of:
(a) a stress test requirement determined in accordance with guidelines issued by the Financial Services Commission to ensure thatthecompanyremainssolvent;or
(b) the higher of:
(i)anamountofRs25Million;or
(ii) an amount representing 13 weeks’ operating expenses, with operating expenses as defined and reported in the annual statutory return submitted to the Commission.
For the year ended 30 June 2012, the Group has satisfied the minimum capital requirements under Insurance (General Insurance Business Solvency) Rules 2007 and Insurance (Long-Term Insurance Business Solvency) Rules 2007.
Mauritian Eagle Leasing Company Limited is required to maintain a minimum capital requirement under the Banking Act 2004. The capital structure of the subsidiary consists of issued share capital, reserves and retained earnings. The subsidiary has to comply with the Banking Act 2004 in respect of both its share capital and reserves. For the year ended 30 June 2012, the subsidiary has complied with the laws and regulations applicable to both share capital and reserves.
Significant accounting policies
Details of the significant accounting policies and methods adopted, including the criteria for recognition, the basis of measurement and the basis on which income and expenses are recognised, in respect of each class of financial assets, financial liability and equity instrument are disclosed in note 3 to the financial statements.

M
auri
tian
Eag
le In
sura
nce
Co
mp
any
Lim
ited
Ann
ual R
epo
rt 2
012
74
NOTES TO THE FINANCIAL STATEMENTS FOR THE YEAR ENDED 30 JUNE 2012
35 FINANCIAL INSTRUMENTS (Continued)
Categories of financial instruments
The Group The Company
2012 2011 2012 2011
Rs'000 Rs'000 Rs'000 Rs'000
Financial assets
Held-to-maturity investments 176,000 86,000 83,000 43,000
Loans and receivables 2,006,416 1,761,436 406,546 398,656
Bank and cash balances 523,705 383,868 230,172 115,586
Available-for-sale financial assets 316,350 311,825 95,738 102,321
3,022,471 2,543,129 815,456 659,563
Financial liabilities
At amortised cost 2,202,258 1,745,068 306,205 269,024
Financial risk management
The Group monitors and manages the financial risks relating to their operations through internal control procedures and written policies approved by their respective Board. These risks include credit risk, currency risk, liquidity risk, interest rate risk and market risk.
Market Risk The Group’s activities are not significantly exposed to the financial risks of changes in foreign currency exchange rates and interest rates and no derivative financial instruments have been contracted for the financial year ended 30 June 2012. Foreign currency risk management The Group undertakes transactions that are mostly denominated in Mauritian Rupees, hence, minimizing the exposures to exchange rate risk. The currency profile of the financial assets and liabilities is summarised as follows:

M
auri
tian
Eag
le In
sura
nce
Co
mp
any
Lim
ited
Ann
ual R
epo
rt 2
012
75
The Group
Financial Financial Financial Financial
assets liabilities assets liabilities
2012 2012 2011 2011
Rs'000 Rs'000 Rs'000 Rs'000
Mauritian Rupees 2,730,013 2,202,258 2,301,674 1,745,068
United States Dollars 125,883 - 104,931 -
Euro 59,705 - 63,873 -
British Pounds 383 - 517 -
Seychelles Rupees 99 - 1,549 -
Australian Dollars 106,388 - 70,585 -
3,022,471 2,202,258 2,543,129 1,745,068
The Company
Financial Financial Financial Financial
assets liabilities assets liabilities
2012 2012 2011 2011
Rs'000 Rs'000 Rs'000 Rs'000
Mauritian Rupees 720,962 306,205 579,877 269,024
United States Dollars 57,492 - 48,438 -
Euro 505 - 3,307 -
British Pounds 360 - 517 -
Seychelles Rupees 99 - 1,549 -
Australian Dollars 36,038 - 25,875 -
815,456 306,205 659,563 269,024
The Group has mainly equity securities and bank deposits in foreign currencies and any fluctuation of the Mauritian rupee against those foreign currencies will affect the value of the deposits. At 30 June 2012, if the rupee had weakened/strengthened by 5% against the foreign currencies with all other variables held constant, the Group’s and the Company’s profit for the year would have been Rs.3,156,414 (2011: Rs.3,680,432) and Rs.1,523,942 (2011: Rs.927,749) respectively higher/lower mainly resulting from translation of deposits.
35 FINANCIAL INSTRUMENTS (Continued)
Financial risk management (Continued)

M
auri
tian
Eag
le In
sura
nce
Co
mp
any
Lim
ited
Ann
ual R
epo
rt 2
012
76
NOTES TO THE FINANCIAL STATEMENTS FOR THE YEAR ENDED 30 JUNE 2012
35 FINANCIAL INSTRUMENTS (Continued)
Financial risk management (Continued)
Interest rate risk management Under short- term insurance contracts, liabilities are not directly sensitive to the level of market interest rates. Fluctuations in interest rates however impact on returns on financial instruments but is closely monitored by the investment committee through a well diversified portfolio of fixed income securities and equity investments. Interest rate risk refers to the risk that the value of future cashflows from financial instrument backing the liabilities because of changes in market interest rates would be insufficient to fund guaranteed benefits payable especially under long-term Life Assurance contracts. If interest rates had been 50 basis points higher or lower and all other variables were held constant, the impact on the Life insurance fund for the year ended 30 June 2012 would decrease / increase by Rs.465,000. The leasing subsidiary is exposed to interest rate risk and manages such risk by maintaining an appropriate mix between the interest rate charged on leases and interest rate it has to pay on its obligations. The sensitivity analysis has been determined based on the exposure to interest rates for financial liabilities. For floating rate liabilities, the analysis is prepared assuming the amount of liability outstanding at the statement of financial position was outstanding for the whole year, except for loans where the normal repayment terms were considered. A 50 basis point increase when reporting interest rate risk internally to key management personnel and represents management’s assessment of the reasonably possible change in interest rates. If interest rates had been 50 basis points higher or lower and all other variables were held constant, the Group and the subsidiary’s profit for the year ended 30 June 2012 would decrease/increase by Rs.112,500 (2011: Rs.262,500). This is mainly attributable to the subsidiary’s exposure to interest rates on its variable rate borrowings and deposits.

M
auri
tian
Eag
le In
sura
nce
Co
mp
any
Lim
ited
Ann
ual R
epo
rt 2
012
77
35 FINANCIAL INSTRUMENTS (Continued)
Financial risk management (Continued)
Interest rate risk management (Continued)
The tables below analyse the interest rate risk exposure of the subsidiary carrying out leasing and deposit taking activities in terms of the remaining period to the next roll over or to the original maturity if not on a roll over basis.
30 June 2012 Interest Bearing - Term to maturity
Within 3 Months Rs’000
3 to 6 months Rs’000
6 to 12 months Rs’000
1 to 5 years
Rs’000
Over 5 years
Rs’000
Non Interest bearing Rs’000
Total
Rs’000
Assets
Deposits with banks 53,902 80,389 - - - 74,314 208,605 Net investment in finance leases after allowance for credit losses 22,143 21,664 91,243 1,272,214 102,886 - 1,510,150
Plant and equipment - - - 505,379 505,379
Other assets - - - - - 116,058 116,058
Total assets 76,045 102,053 91,243 1,272,214 102,886 695,751 2,340,192
Liabilities
Deposits 361,209 290,013 365,632 715,432 1,783 - 1,734,069
Borrowings 30,000 375 - 48,486 - - 78,861
Other liabilities - - - - - 80,021 80,021
Total liabilities 391,209 290,388 365,632 763,918 1,783 80,021 1,892,951
30 June 2011 Interest Bearing - Term to maturity
Within 3 Months Rs’000
3 to 6 months Rs’000
6 to 12 months Rs’000
1 to 5 years
Rs’000
Over 5 years
Rs’000
Non Interest bearing Rs’000
Total
Rs’000
Assets
Deposits with banks 134,233 - - - - 37,980 172,213 Net investment in finance leases after allowance for credit losses 9,173 14,716 49,272 1,167,595 27,694 - 1,268,450
Plant and equipment - - - - - 360,520 360,520
Other assets - - - - - 104,954 104,954
Total assets 143,406 14,716 49,272 1,167,595 27,694 503,454 1,906,137
Liabilities
Deposits 229,284 162,213 449,725 580,085 1,521 - 1,422,828
Borrowings - - - 45,075 - - 45,075
Other liabilities - - - - - 12,385 12,385
Total liabilities 229,284 162,213 449,725 625,160 1,521 12,385 1,480,288

M
auri
tian
Eag
le In
sura
nce
Co
mp
any
Lim
ited
Ann
ual R
epo
rt 2
012
78
NOTES TO THE FINANCIAL STATEMENTS FOR THE YEAR ENDED 30 JUNE 2012
35 FINANCIAL INSTRUMENTS (Continued)
Financial risk management (Continued)
Interest rate risk management (Continued)
In the above table, the subsidiary’s net investment in finance leases is analysed in terms of the remaining period to maturity. The interest rates included in the lease agreements are fixed at the start of the lease.
The interest rate profile of the financial assets and financial liabilities of the Group is as follows:
Financial assets The Group The CompanyFloating interest rate Floating interest rate
2012 2011 2012 2011 % % % %
Mauritian Rupee 4.55 - 10.00 7.00 - 14.00 4.55 - 10.00 7.00 - 14.00 United States Dollar 4.00 - 13.50 0.75 4.00 0.75 Euro 6.00 0.90 - 6.00 - 0.90 - 1.00
The above comprise mainly deposits with banks, mortgage and policy loans and finance lease receivables.
Financial liabilities The Group
Floating interest rate Fixed interest rate
2012 2011 2012 2011 % % % %
Mauritian Rupee - - 4.95 - 13.75 5.15 - 13.75
Financial liabilities are made up of deposits from customers and loans.
Fair value of financial assets and liabilities
The directors consider that the carrying amounts of financial assets and financial liabilities recognised in the financial statements approximate their fair values.
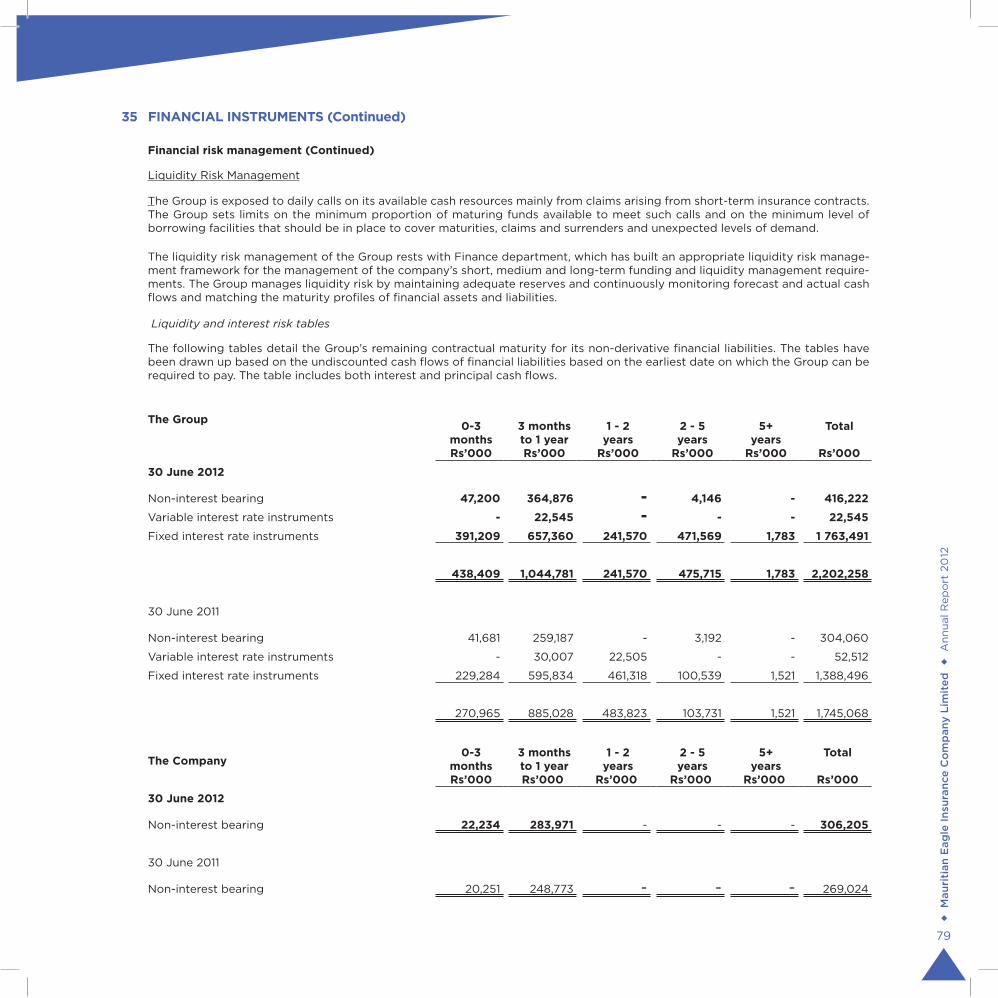
M
auri
tian
Eag
le In
sura
nce
Co
mp
any
Lim
ited
Ann
ual R
epo
rt 2
012
79
35 FINANCIAL INSTRUMENTS (Continued)
Financial risk management (Continued)
Liquidity Risk Management
The Group is exposed to daily calls on its available cash resources mainly from claims arising from short-term insurance contracts. The Group sets limits on the minimum proportion of maturing funds available to meet such calls and on the minimum level of borrowing facilities that should be in place to cover maturities, claims and surrenders and unexpected levels of demand.
The liquidity risk management of the Group rests with Finance department, which has built an appropriate liquidity risk manage-ment framework for the management of the company’s short, medium and long-term funding and liquidity management require-ments. The Group manages liquidity risk by maintaining adequate reserves and continuously monitoring forecast and actual cash flows and matching the maturity profiles of financial assets and liabilities.
Liquidity and interest risk tables
The following tables detail the Group’s remaining contractual maturity for its non-derivative financial liabilities. The tables have been drawn up based on the undiscounted cash flows of financial liabilities based on the earliest date on which the Group can be required to pay. The table includes both interest and principal cash flows.
The Group 0-3 months Rs’000
3 months to 1 year Rs’000
1 - 2 years
Rs’000
2 - 5 years
Rs’000
5+ years
Rs’000
Total
Rs’000
30 June 2012
Non-interest bearing 47,200 364,876 - 4,146 - 416,222
Variable interest rate instruments - 22,545 - - - 22,545
Fixed interest rate instruments 391,209 657,360 241,570 471,569 1,783 1 763,491
438,409 1,044,781 241,570 475,715 1,783 2,202,258
30 June 2011
Non-interest bearing 41,681 259,187 - 3,192 - 304,060
Variable interest rate instruments - 30,007 22,505 - - 52,512
Fixed interest rate instruments 229,284 595,834 461,318 100,539 1,521 1,388,496
270,965 885,028 483,823 103,731 1,521 1,745,068
The Company 0-3
months Rs’000
3 months to 1 year Rs’000
1 - 2 years
Rs’000
2 - 5 years
Rs’000
5+ years
Rs’000
Total
Rs’000
30 June 2012
Non-interest bearing 22,234 283,971 - - - 306,205
30 June 2011
Non-interest bearing 20,251 248,773 - - - 269,024

M
auri
tian
Eag
le In
sura
nce
Co
mp
any
Lim
ited
Ann
ual R
epo
rt 2
012
80
NOTES TO THE FINANCIAL STATEMENTS FOR THE YEAR ENDED 30 JUNE 2012
35 FINANCIAL INSTRUMENTS (Continued)
Financial risk management (Continued)
Credit risk management
Credit risk refers to the risk that a counterparty will default on its contractual obligations resulting in financial loss to the Group. The Group has adopted a policy of only dealing with credit worthy counterparties and obtaining sufficient collateral, where appropriate, as a means of mitigating the risk of financial loss from defaults.
The Group’s credit risk is primarily attributable to its trade receivables and finance lease receivables. The amounts presented in the statement of financial position are net of allowances for doubtful receivables, estimated by the company’s management based on prior experience.
The Group structures the levels of its credit risk it accepts by placing limits on its exposure to a single counterparty or groups of counterparty and to industry segments. Such risks are subject to annual or more frequent review. Reinsurance is used to manage credit risk. This does not, however, discharge the company’s liability as primary insurer. If a reinsurer fails to pay a claim for any reason, the company remains liable for the payment to the policyholder. The credit worthiness of reinsurers is considered on an annual basis by reviewing their credit rates provided by rating agencies prior to finalisation of any reinsurance contract. Although the insurance premiums due from related companies represent 19% (2011: 12%) of the trade receivables, the concentration of credit risk is limited due to the fact that it is composed of several companies and departments within the Group.
The subsidiary monitors the payment of these clients on a regular basis. To mitigate credit risk the subsidiary regularly requests update on the financial position of these clients. The lease portfolio consists of a large number of customers, spread across several business sectors and geographical areas. The amounts presented in the statement of financial position are net of allowances for doubtful receivables, estimated by the Group’s management based on prior experience. The six most significant concentration cases of the company relate to corporate clients of the agriculture and construction business sectors. The most significant customer accounts for 5% (2011: 6%) of total finance lease receivables, while the remaining five account for 3% to 4% (2011: 2% to 4%) of total finance lease portfolio. The conduct Review Committee meets on a quarterly basis and reviews the exposures of significant clients.
The carrying amount of financial assets recorded in the financial statements which is net of impairment losses, represents the company’s maximum exposure to credit risk without taking into account of the value of any security.
Fair value measurements recognised in the statement of financial position
The Group and the Company classify fair value measurements of its financial assets and financial liabilities at fair value using a fair value hierarchy that reflects the significance of the inputs used in making the measurements. The fair value hierarchy has the following levels:
•Level1: Fairvaluemeasurementsarethosederivedfromquotedprices(unadjusted)inactivemarketsforidenticalassets or liabilities.
•Level2: FairvaluemeasurementsarethosederivedfrominputsotherthanquotedpricesincludedwithinLevel1that are observable for the asset or liability, either directly (i.e. as prices) or indirectly (i.e. derived from prices).
•Level3: Fairvaluemeasurementsarethosederivedfromvaluationtechniquesthatincludeinputsfortheassetorliability that are not based on observable market data (unobservable inputs).

M
auri
tian
Eag
le In
sura
nce
Co
mp
any
Lim
ited
Ann
ual R
epo
rt 2
012
81
35 FINANCIAL INSTRUMENTS (Continued)
Financial risk management (Continued)
Fair value measurements recognised in the statement of financial position (Continued)
The following table analyses within the fair value hierarchy of the Group’s financial assets (by class) measured at fair value at 30 June 2012:
Available-for-sale financial assets
The Group The Company2012 2011 2012 2011
Rs'000 Rs'000 Rs'000 Rs'000
Level 1 312,677 308,152 92,065 98,648
Other price risks
The Group is exposed to equity price risks arising from equity investments. Equity price risk is mitigated by having a well-diversified portfolio of equity and unit investments in various industries and countries. Moreover certain units investments are capital-guaranteed.
The sensitivity analyses below have been determined based on the exposure to equity price risks at the reporting date.
If equity prices had been 10% higher/lower:
• profitfortheyearended30June2012wouldhavebeenunaffectedastheequityinvestmentsareclassifiedasavailable-for-saleandnoinvestmentsweredisposedoforimpaired;and
• otherequityreservefortheGroupandCompanywoulddecrease/increasebyRs.31,267,665(2011:Rs.30,815,140)fortheGroup and Rs.9,206,487 (2011: Rs.9,864,783) respectively as a result of the changes in fair value of available-for-sale shares.
The Group’s sensitivity to equity prices has not changed significantly from the prior year.
The risk under any one insurance contract is the possibility that an insured event occurs and the uncertainty of the amount of the resulting claim. By the very nature of an insurance contract, this risk is random and therefore unpredictable.
35 FINANCIAL INSTRUMENTS (Continued)
Financial risk management (Continued)
Credit risk management
Credit risk refers to the risk that a counterparty will default on its contractual obligations resulting in financial loss to the Group. The Group has adopted a policy of only dealing with credit worthy counterparties and obtaining sufficient collateral, where appropriate, as a means of mitigating the risk of financial loss from defaults.
The Group’s credit risk is primarily attributable to its trade receivables and finance lease receivables. The amounts presented in the statement of financial position are net of allowances for doubtful receivables, estimated by the company’s management based on prior experience.
The Group structures the levels of its credit risk it accepts by placing limits on its exposure to a single counterparty or groups of counterparty and to industry segments. Such risks are subject to annual or more frequent review. Reinsurance is used to manage credit risk. This does not, however, discharge the company’s liability as primary insurer. If a reinsurer fails to pay a claim for any reason, the company remains liable for the payment to the policyholder. The credit worthiness of reinsurers is considered on an annual basis by reviewing their credit rates provided by rating agencies prior to finalisation of any reinsurance contract. Although the insurance premiums due from related companies represent 19% (2011: 12%) of the trade receivables, the concentration of credit risk is limited due to the fact that it is composed of several companies and departments within the Group.
The subsidiary monitors the payment of these clients on a regular basis. To mitigate credit risk the subsidiary regularly requests update on the financial position of these clients. The lease portfolio consists of a large number of customers, spread across several business sectors and geographical areas. The amounts presented in the statement of financial position are net of allowances for doubtful receivables, estimated by the Group’s management based on prior experience. The six most significant concentration cases of the company relate to corporate clients of the agriculture and construction business sectors. The most significant customer accounts for 5% (2011: 6%) of total finance lease receivables, while the remaining five account for 3% to 4% (2011: 2% to 4%) of total finance lease portfolio. The conduct Review Committee meets on a quarterly basis and reviews the exposures of significant clients.
The carrying amount of financial assets recorded in the financial statements which is net of impairment losses, represents the company’s maximum exposure to credit risk without taking into account of the value of any security.
Fair value measurements recognised in the statement of financial position
The Group and the Company classify fair value measurements of its financial assets and financial liabilities at fair value using a fair value hierarchy that reflects the significance of the inputs used in making the measurements. The fair value hierarchy has the following levels:

M
auri
tian
Eag
le In
sura
nce
Co
mp
any
Lim
ited
Ann
ual R
epo
rt 2
012
82
NOTES TO THE FINANCIAL STATEMENTS FOR THE YEAR ENDED 30 JUNE 2012
36 MANAGEMENT OF INSURANCE RISKS
For a portfolio of insurance contracts where the theory of probability is applied to pricing and provisioning, the principal risk that the Group faces under its insurance contracts is that the actual claims and benefit payments exceed the carrying amount of the insurance liabilities. This could occur because the frequency or severity of claims and benefits are greater than estimated. Insurance events are random and the actual number and amount of claims and benefits will vary from year to year from the estimate established using statistical techniques.
Experience shows that the larger the portfolio of similar insurance contracts, the smaller the relative variability about the expected outcome will be (Law of large numbers). In addition, a more diversified portfolio is less likely to be affected across the board by a change in any subset of the portfolio. The Group has developed its insurance underwriting strategy to diversify the type of insurance risks accepted and within each of these categories to achieve a sufficiently large population of risks to reduce the variability of the expected outcome. Factors that aggravate insurance risk include lack of risk diversification in terms of type and amount of risk, geographical location and type of industry covered.
Casualty Insurance
Frequency and severity of claims
The frequency and severity of claims can be affected by several factors. The most significant are the increasing level of awards for the damage suffered as a result of motor injury claims. The Group manages these risks through its underwriting strategy, adequate reinsurance arrangements and proactive claims handling.
The Group has developed its insurance underwriting strategy to diversify the type of insurance risks accepted and within each of these categories to achieve a sufficiently large population of risks to reduce the variability of the expected outcome. As part of our permeating and systematic risk management, our Group continually identifies and analyses the risks. Underwriting guidelines and limits clearly regulate responsibility and accountability for the whole process of acquiring and concluding insurance contracts. Compliance with the above are regularly checked. Following developments in the local and global market, appropriate measures are taken, translated without delay in corresponding underwriting guidelines if required.
Underwriting limits are thus in place to enforce appropriate risk selection criteria. For example the Group has the right to impose deductibles and it has the right to reject the payment of a fraudulent claim, as well as inviting renewals on different terms. Insurance contracts also entitle the Group to sue third parties for payment of incurred costs (i.e. subrogation).
The reinsurance arrangements are mostly excess of loss reinsurance layers in respect of casualty.
Property insurance
Frequency and severity of claims
For property insurance contracts, climatic changes give rise to more frequent and severe extreme weather events (for example, cyclones, Tsunami etc.) and their consequences (for example, cyclone claims).
For certain contracts, the Group has also limited the number of claims that can be paid in any policy year or introduced a maximum amount payable for claims in any policy year.

M
auri
tian
Eag
le In
sura
nce
Co
mp
any
Lim
ited
Ann
ual R
epo
rt 2
012
83
36 MANAGEMENT OF INSURANCE RISKS
For a portfolio of insurance contracts where the theory of probability is applied to pricing and provisioning, the principal risk that the Group faces under its insurance contracts is that the actual claims and benefit payments exceed the carrying amount of the insurance liabilities. This could occur because the frequency or severity of claims and benefits are greater than estimated. Insurance events are random and the actual number and amount of claims and benefits will vary from year to year from the estimate established using statistical techniques.
Experience shows that the larger the portfolio of similar insurance contracts, the smaller the relative variability about the expected outcome will be (Law of large numbers). In addition, a more diversified portfolio is less likely to be affected across the board by a change in any subset of the portfolio. The Group has developed its insurance underwriting strategy to diversify the type of insurance risks accepted and within each of these categories to achieve a sufficiently large population of risks to reduce the variability of the expected outcome. Factors that aggravate insurance risk include lack of risk diversification in terms of type and amount of risk, geographical location and type of industry covered.
Casualty Insurance
Frequency and severity of claims
The frequency and severity of claims can be affected by several factors. The most significant are the increasing level of awards for the damage suffered as a result of motor injury claims. The Group manages these risks through its underwriting strategy, adequate reinsurance arrangements and proactive claims handling.
The Group has developed its insurance underwriting strategy to diversify the type of insurance risks accepted and within each of these categories to achieve a sufficiently large population of risks to reduce the variability of the expected outcome. As part of our permeating and systematic risk management, our Group continually identifies and analyses the risks. Underwriting guidelines and limits clearly regulate responsibility and accountability for the whole process of acquiring and concluding insurance contracts. Compliance with the above are regularly checked. Following developments in the local and global market, appropriate measures are taken, translated without delay in corresponding underwriting guidelines if required.
Underwriting limits are thus in place to enforce appropriate risk selection criteria. For example the Group has the right to impose deductibles and it has the right to reject the payment of a fraudulent claim, as well as inviting renewals on different terms. Insurance contracts also entitle the Group to sue third parties for payment of incurred costs (i.e. subrogation).
The reinsurance arrangements are mostly excess of loss reinsurance layers in respect of casualty.
Property insurance
Frequency and severity of claims
For property insurance contracts, climatic changes give rise to more frequent and severe extreme weather events (for example, cyclones, Tsunami etc.) and their consequences (for example, cyclone claims).
For certain contracts, the Group has also limited the number of claims that can be paid in any policy year or introduced a maximum amount payable for claims in any policy year.
36 MANAGEMENT OF INSURANCE RISKS (Continued)
Property insurance (Continued)
Frequency and severity of claims (Continued)
The Group has the right to re-price the risk on renewal. It also has the ability to impose deductibles and reject fraudulent claims. These contracts are underwritten by reference to the commercial replacement value of the properties and contents insured, and claims payment limits are always included to cap the amount payable on occurrence of the insured event. Cost of rebuilding properties, of replacement or indemnity for contents and time taken to restart operations for business interruption are the key factors that influence the level of claims under these policies. The greatest likelihood of significant losses on these contracts arises from cyclone or flood damage. Major changes in the reinsurance world happened after the September 2001 terrorist attack on the World Trade Centre. The availability and cost of reinsurance are subject to prevailing market conditions, both in terms of price and availability capacity. Although the reinsurers are liable to the extent of the reinsurance ceded, the group remains primarily liable to the policy holder as the direct insurer of all risks reinsured. The group evaluates the financial condition of its reinsurers to minimize its exposures to losses from reinsurer insolvencies.
To the Group’s knowledge, none of its reinsurers is experiencing financial difficulties. Markets have tightened their underwriting of proportional treaty programme, which have impacted on the Mauritian Insurance sector where companies were more used to traditional reinsurance and had to increase their net retention.
Catastrophe protection treaties are a must to insurance companies based in Mauritius due to our constant exposure towards tropical cyclones.
The Group has reinsurance cover for such damage to accommodate our increased exposure.
Property insurance contracts are subdivided into four risk groups: fire, business interruption, cyclone damage and other perils. The insurance risk arising from these contracts is not concentrated in any of the territories in which the Group operates, and there is a balance between commercial and personal properties in the overall portfolio of insured buildings.
Concentration of insurance risk (Short-term insurance)
The following table discloses the concentration of outstanding claims by class of business, gross and net of reinsurance.
2012 2011
Class of business Gross Net Gross Net
Rs'000 Rs'000 Rs'000 Rs'000
Accident 41,817 16,894 33,710 13,985
Engineering 12,663 3,608 8,000 1,930
Fire 26,256 16,597 23,933 14,509
Liability 41,857 35,621 49,226 32,681
Motor 81,384 65,062 71,822 56,444
IBNR 23,000 23,000 15,500 15,500
226,977 160,782 202,191 135,049
The company manages these risks through its underwriting strategy, adequate reinsurance arrangements and proactive claims handling.

M
auri
tian
Eag
le In
sura
nce
Co
mp
any
Lim
ited
Ann
ual R
epo
rt 2
012
84
NOTES TO THE FINANCIAL STATEMENTS FOR THE YEAR ENDED 30 JUNE 2012
36 MANAGEMENT OF INSURANCE RISKS (Continued)
Life insurance business
Frequency and severity of claims
For contracts where death is the assured risk, the most significant factors that could increase the overall frequency of claims are epidemics such as AIDS, or widespread changes of lifestyle, such as eating, smoking and exercising habits, resulting in earlier or more claims than expected. For contracts where survival is the insured risk, the most significant factor is continued improvement in medical science and social conditions that would increase longevity. At present, these risks do not vary significantly in relation to the location of risk insured by the Group. However, undue concentration by amounts could have an impact on the severity of benefit payment on a portfolio basis.
The underwriting strategy is intended to ensure that the risks underwritten are well diversified in terms of types of risk and the level of insured benefits. For example, the Group balances death risk and survival risk across its portfolio. Medical selection is also included in underwriting procedures with premiums varied to reflect the health condition and family medical history of the applicants. The Group has a retention limit on any single life assured and reinsures the excess under reinsurance arrangements. Insurance risk for life insurance contracts is also affected by the contract holder’s right to pay reduced or no future premiums, to terminate the contract completely, or to exercise a guaranteed annuity option. As a result, the amount of insurance risk is also subject to contract holder behaviour. On the assumption that contract holders will make decisions rationally, it is likely that contract holders whose health has aggravated significantly will be less inclined to terminate contracts insuring death benefits than those contract holders remaining in good health. This results in an increasing trend of expected mortality, as the portfolio of insurance contracts reduces due to voluntary terminations.

M
auri
tian
Eag
le In
sura
nce
Co
mp
any
Lim
ited
Ann
ual R
epo
rt 2
012
85
36 MANAGEMENT OF INSURANCE RISKS (Continued)
Life insurance business (Continued)
The table below presents the concentration of insured benefits across bands of insured benefits per individual life assured.
Before reinsurance
Sum assured Cumulative TotalRs m
% Cum % No of cases % Cum %From
RsToRs
0 100,000 208.4 1.6% 1.60% 2,720 12.5% 12.5%100,001 200,000 737.0 5.6% 7.20% 4,491 20.6% 33.1%200,001 300,000 1,019.1 7.8% 15.00% 4,075 18.7% 51.8%300,001 400,000 765.9 5.8% 20.80% 2,145 9.8% 61.6%400,001 1,000,000 3,537.5 26.9% 47.70% 5,689 26.1% 87.7%
1,000,001 2,000,000 2,358.1 17.9% 65.60% 1,705 7.8% 95.5%2,000,001 10,000,000 3,441.8 26.2% 91.80% 909 4.2% 99.7%
Above 10,000,001 1,073.0 8.2% 100.00% 59 0.3% 100.0%
13,140.8 21,793
After reinsurance
Sum assured Cumulative TotalRs m
% Cum % No of cases % Cum %From
RsToRs
0 100,000 208.4 4.2% 4.20% 2,720 12.5% 12.5%
100,001 200,000 737.0 14.7% 18.90% 4,491 20.6% 33.1%
200,001 300,000 4,080.0 81.1% 100.00% 14,582 66.9% 100.0%
5,025.4 21,793
The following table for annuity insurance contracts illustrates the concentration of risk based on bands that group these contracts in relation to the amount payable per annum as if the annuity were in payment as at 30 June 2012. The company does not hold any reinsurance contracts against the liabilities carried for these contracts.
Annuity payable per annum per life insured as at 30 June 2012Total annuities payable per
annumRs %
0 - 10,000 285,522 5.5%
10,001 - 20,000 550,336 10.6%
20,001 - 50,000 751,638 14.4%
50,001 - 100,000 1,058,050 20.3%
Above Rs100,000 2,558,643 49.2%
5,204,189 100.0%

M
auri
tian
Eag
le In
sura
nce
Co
mp
any
Lim
ited
Ann
ual R
epo
rt 2
012
86
NOTES TO THE FINANCIAL STATEMENTS FOR THE YEAR ENDED 30 JUNE 2012
36 MANAGEMENT OF INSURANCE RISKS (Continued)
Sources of uncertainty in the estimation of future benefit payments
Casualty insurance
Claims on casualty contracts are payable on a claims-occurrence basis. The Group is liable for all insured events that occurred during the term of the contract, even if the loss is discovered after the end of the contracts term. As a result, liability claims are settled over a long period of time and a larger element of the claims provision relates to incurred but not reported claims (IBNR). There are several variables that affect the amount and timing of cash flows from these contracts. These mainly relate to the inherent risks of the business activities carried out by individual contract holders and the risk management procedures they adopted. The compensation paid on these contracts is the monetary awards granted for bodily injury suffered by employees (for employer’s liabilities covers) or members of the public (for public liability covers). Such awards are lump-sum payments that are calculated as the present value of the lost earnings and rehabilitation expenses that the injured party will incur as a result of incident.
The estimated cost of claims includes direct expenses incurred in settling claims, net of the expected subrogation value and other recoveries. The Group takes all reasonable steps to ensure that it has appropriate information regarding its claims exposure. However, given the uncertainty in establishing claims provisions, it is likely that the final outcome will prove to be different from the original liability established. The liability for these contracts comprises a provision for IBNR, a provision for reported claims not yet paid and a provision for unexpired risks at the end of the reporting period. The amount of casualty claims is particularly sensitive to the level of court awards and to the development of legal precedent on matters of contract and tort. Casualty contracts are also subject to the emergence of new types of latent claims, but no allowance is included for this at the end of the reporting period.
In calculating the estimated cost of unpaid claims (both reported and not), the Group estimation techniques are a combination of loss-ratio-based estimates (where the loss ratio is defined as the ratio between ultimate cost of insurance claims and insurance premiums earned in a particular financial year in relation to such claims) and an estimate based upon actual claims experience using predetermined formulae where greater weight is given to actual claims experience as time passes.
The initial loss-ratio estimate is an important assumption in the estimation technique and is based on previous years’ experience, adjusted for factors such as premium rate changes, anticipated market experience and historical claims inflation. The initial estimate of the loss ratios used for the current year (before reinsurance) are analysed by territory and type of risk where the insured operates for current and prior year premium earned.
The estimation of IBNR is generally subject to a greater degree of uncertainty than the estimation of the cost of settling claims already notified to the Group, where information about the claim event is available. IBNR claims may not be apparent to the insurer until many years after the event that gave rise to the claims has happened. For casualty contracts, the IBNR proportion of the total liability is high and will typically display greater variations between initial estimates and final outcomes because of the greater degree of difficulty of estimating these liabilities.
M
auri
tian
Eag
le In
sura
nce
Co
mp
any
Lim
ited
Ann
ual R
epo
rt 2
012
87
36 MANAGEMENT OF INSURANCE RISKS (Continued)
Sources of uncertainty in the estimation of future benefit payments (Continued)
Casualty insurance (Continued )
In estimating the liability for the cost of reported claims not yet paid, the Group considered any information available from loss adjusters and information on the cost of settling claims with similar characteristics in previous periods. Large claims are as-sessed on a case-by-case basis or projected separately in order to allow for the possible distortive effect of their development and incidence on the rest of the portfolio.
Where possible, the Group adopts multiple techniques to estimate the required level of provisions. This provides a greater understanding of the trends inherent in the experience being projected. The projections given by the various methodologies also assist in estimating the range of possible outcomes. The most appropriate estimation technique is selected taking into account the characteristics of the business class and the extent of the development of each accident year.
Property insurance
Property claims are analysed separately for cyclone and non-cyclone claims. The development of large losses/catastrophes is analysed separately. Non-cyclone claims can be estimated with greater reliability, and the Group estimation processes reflect all the factors that influence the amount and timing of cash flows from these contracts. The shorter settlement period for these claims allows the Group to achieve a higher degree of certainty about the estimated cost of claims, and relatively little (Incurred but not Reported) IBNR is held at year-end.
Life insurance
Uncertainty in the estimation of future benefit payments and premium receipts for long-term insurance contracts arises from the unpredictability of long-term changes in overall levels of mortality and the variability in contract holder behaviour.
The Group uses appropriate base tables of standard mortality according to the type of contract being written and the territory in which the insured person resides. An investigation into the actual experience of the Group over the last three years is carried out, and statistical methods are used to adjust the crude mortality rates to produce a best estimate of expected mortality for the future.
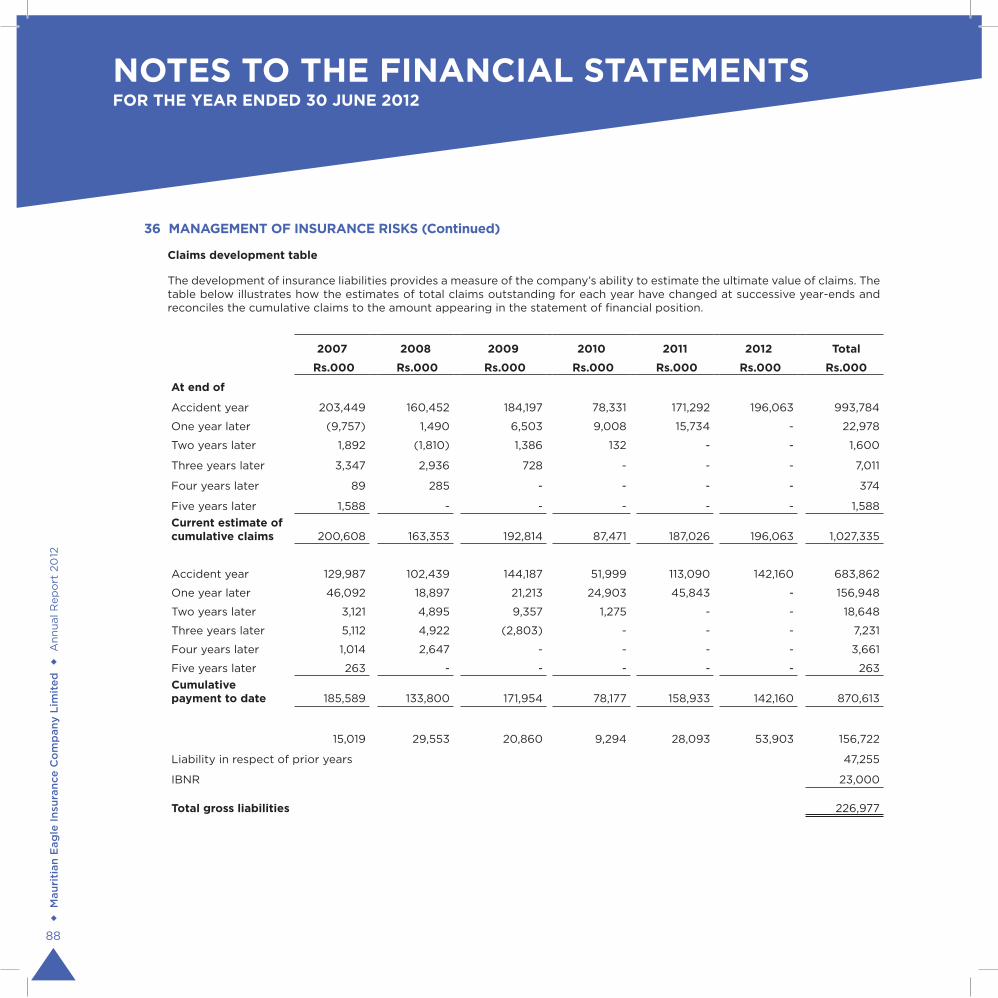
M
auri
tian
Eag
le In
sura
nce
Co
mp
any
Lim
ited
Ann
ual R
epo
rt 2
012
88
NOTES TO THE FINANCIAL STATEMENTS FOR THE YEAR ENDED 30 JUNE 2012
2007 2008 2009 2010 2011 2012 Total
Rs.000 Rs.000 Rs.000 Rs.000 Rs.000 Rs.000 Rs.000
At end of
Accident year 203,449 160,452 184,197 78,331 171,292 196,063 993,784
One year later (9,757) 1,490 6,503 9,008 15,734 - 22,978
Two years later 1,892 (1,810) 1,386 132 - - 1,600
Three years later 3,347 2,936 728 - - - 7,011
Four years later 89 285 - - - - 374
Five years later 1,588 - - - - - 1,588 Current estimate ofcumulative claims 200,608 163,353 192,814 87,471 187,026 196,063 1,027,335
Accident year 129,987 102,439 144,187 51,999 113,090 142,160 683,862
One year later 46,092 18,897 21,213 24,903 45,843 - 156,948
Two years later 3,121 4,895 9,357 1,275 - - 18,648
Three years later 5,112 4,922 (2,803) - - - 7,231
Four years later 1,014 2,647 - - - - 3,661
Five years later 263 - - - - - 263 Cumulative payment to date 185,589 133,800 171,954 78,177 158,933 142,160 870,613
15,019 29,553 20,860 9,294 28,093 53,903 156,722
Liability in respect of prior years 47,255
IBNR 23,000
Total gross liabilities 226,977
The development of insurance liabilities provides a measure of the company’s ability to estimate the ultimate value of claims. The table below illustrates how the estimates of total claims outstanding for each year have changed at successive year-ends and reconciles the cumulative claims to the amount appearing in the statement of financial position.
Claims development table
36 MANAGEMENT OF INSURANCE RISKS (Continued)

M
auri
tian
Eag
le In
sura
nce
Co
mp
any
Lim
ited
Ann
ual R
epo
rt 2
012
89
37 OPERATING SEGMENTS
IFRS 8 requires operating segments to be identified on the basis of internal reports about components of the Group that are regularly reviewed by the chief operating decision maker in order to allocate resources to the segments and to assess their performance.
Products and services from which reportable segments derive their revenues
General insurance
General insurance includes accident, engineering, fire and allied perils, motor and transportation.
Life insurance
Life insurance includes both life and pension.
LeasingLeasing consists of finance and operating leases.
Segment revenues and results
Revenue reported under segment revenues and results represents revenue generated from external customers. Inter-segment sales during the year was Rs.261,068 (2011: Rs.85,389).
The accounting policies of the reportable segments are the same as the Group’s accounting policies described in note 3. Segment profit represents the profit earned by each segment without allocation of finance costs, share of profits of associates and income tax expense. This is the measure reported to the chief operating decision maker for the purposes of resource allocation and assessment of segment performance.
2012
The Group General Life Leasing Group
Rs'000 Rs'000 Rs'000 Rs'000
Gross revenue 739,085 184,796 496,213 1,420,094
Profit from operations 142,520 79,690 130,781 352,991
Release to insurance funds (132,621)
220,370
Finance costs (128,111)
92,259
Share of results of associate 5,940
Profit before taxation 98,199
Taxation (14,960)
Profit after taxation 83,239

M
auri
tian
Eag
le In
sura
nce
Co
mp
any
Lim
ited
Ann
ual R
epo
rt 2
012
90
NOTES TO THE FINANCIAL STATEMENTS FOR THE YEAR ENDED 30 JUNE 2012
37 OPERATING SEGMENTS (Continued)
Segment revenues and results (Continued)
2011
The Group General Life Leasing Group
Rs'000 Rs'000 Rs'000 Rs'000
Gross revenue 656,071 208,804 391,140 1,256,015
Profit from operations 130,973 (61,249) 88,161 157,885
Transfer from insurance funds 11,773
169,658
Finance costs (130,151)
39,507
Share of results of associate 6,367
Profit before taxation 45,874
Taxation (8,840)
Profit after taxation 37,034

M
auri
tian
Eag
le In
sura
nce
Co
mp
any
Lim
ited
Ann
ual R
epo
rt 2
012
91
37 OPERATING SEGMENTS (Continued)
Segment assets and liabilities
For the purposes of monitoring segment performance and allocating resources between segments:
•allassetsareallocatedtoreportablesegmentsotherthaninvestmentsinassociate.
•allliabilitiesareallocatedtoreportablesegmentsotherthancurrenttaxliabilities.
2012 General Life Leasing Group
Rs'000 Rs'000 Rs'000 Rs'000
Segment assets 902,551 634,575 2,106,283 3,643,409
Investment in associate 25,961
Consolidated total assets 3,669,370
Segment liabilities 315,697 31,999 1,872,378 2,220,074
2011
General Life Leasing Group
Rs'000 Rs'000 Rs'000 Rs'000
Segment assets 758,802 569,241 1,693,185 3,021,228
Investment in associate 19,758
Consolidated total assets 3,040,986
Segment liabilities 275,160 22,743 1,461,357 1,759,260

M
auri
tian
Eag
le In
sura
nce
Co
mp
any
Lim
ited
Ann
ual R
epo
rt 2
012
92
NOTES TO THE FINANCIAL STATEMENTS FOR THE YEAR ENDED 30 JUNE 2012
37 OPERATING SEGMENTS (Continued)
Other segment information
The above businesses are conducted solely in Mauritius.
Other Information:-Depreciation and
amortisationAdditions to
non-current assets
2012 2011 2012 2011
Rs.000 Rs.000 Rs.000 Rs.000
General 6,451 7,925 2,353 6,853
Leasing 90,225 57,773 247,763 220,964
Life 2,337 148 4,893 7,690
99,013 65,846 255,009 235,507
Revenue from major products and services
The Group’s revenue from its major products and services were as follows:
The Group
2012 2011
Rs'000 Rs'000
Accident 181,457 154,408
Engineering 34,857 17,728
Fire and allied perils 215,031 207,889
Motor 201,353 174,892
Transportation 106,564 101,154
Life 184,619 208,804
Leasing 496,213 391,140
1,420,094 1,256,015
Information about major customers
Included in revenues arising from general insurance of Rs739.3m (2011: Rs656.2m) are revenues of Rs71.2m (2011: Rs83.3m) which arose from sales to the Group’s largest customer, Ireland Blyth Limited.

M
auri
tian
Eag
le In
sura
nce
Co
mp
any
Lim
ited
Ann
ual R
epo
rt 2
012
93
38 RELATED PARTY TRANSACTIONS
The Group is making the following disclosures in respect of related party transactions and balances.
Outstanding balances
The Group The Company2012 2011 2012 2011
Rs'000 Rs'000 Rs'000 Rs'000
(i) Receivable from related parties:-
Immediate holding company 6,787 5,678 6,037 5,678
Associate 849 418 849 418
Subsidiary - - 1,651 93
Fellow subsidiaries 41,585 37,880 4,573 3,997
Associates of immediate holding company 8,610 1,821 8,610 1,821
Subsidiaries of ultimate holding company 1,525 1,668 1,525 1,668
Associates of ultimate holding company 3,710 273 3,711 273
Directors and related parties 2,934 6,981 155 142
66,000 54,719 27,111 14,090
(ii) Payable to related parties:-
Immediate holding company 20 746 20 746
Fellow subsidiaries 19 1,661 19 1,074
Subsidiaries of ultimate holding company 3 - 3 -
42 2,407 42 1,820
(iii) Deposits with:-
Immediate holding company 270,491 258,754 192,025 181,610
(iv) Deposits from:-
Fellow subsidiaries 4,500 4,500 - -
Subsidiaries of ultimate holding company 223,500 208,500 - -
Directors and related parties 15,100 19,641 - -
243,100 232,641 - -
(v) Interest receivable from:-
Immediate holding company 1,376 333 1,002 333
Subsidiaries of ultimate holding company - 1,603 - 855
Associates of ultimate holding company 1,666 - 935 -
3,042 1,936 1,937 1,188
The outstanding balances are unsecured and interest free. Deposits bear interest rate as disclosed in note 35 under interest rate risk management.

M
auri
tian
Eag
le In
sura
nce
Co
mp
any
Lim
ited
Ann
ual R
epo
rt 2
012
94
NOTES TO THE FINANCIAL STATEMENTS FOR THE YEAR ENDED 30 JUNE 2012
38 RELATED PARTY TRANSACTIONS (Continued)
Transactions
The Group The Company2012 2011 2012 2011
Rs'000 Rs'000 Rs'000 Rs'000
(i) Sales of services to:-
Immediate holding company 71,175 85,818 71,175 84,065
Subsidiary - - 5,827 558
Associate 6,714 6,019 6,714 6,019
Fellow subsidiaries 14,629 12,967 14,629 12,967
Associates of holding company 18,614 19,266 18,614 19,266
Subsidiaries of ultimate holding company 53,061 11,993 36,890 11,205
Associates of ultimate holding company 59,480 6,909 59,480 6,909
223,673 142,972 213,329 140,989
(ii) Purchases of goods and services from:-
Immediate holding company 14,576 11,452 6,896 5,888
Fellow subsidiaries 4,283 11,065 2,564 9,409
Subsidiaries of ultimate holding company 72 485 72 485
Associates of ultimate holding company 510 1,303 - 486
Related parties 2,556 2,492 - -
21,997 26,797 9,532 16,268
(iii) Interest income from:-
Immediate holding company 23,513 30,660 19,629 22,652
Subsidiary - - - 2,234
Subsidiaries of ultimate holding company 7,619 1,603 4,165 855
31,132 32,263 23,794 25,741
(iv) Dividend income from:-
Associate - - 1,102 2,822
Subsidiaries of ultimate holding company 354 417 - 229
354 417 1,102 3,051

M
auri
tian
Eag
le In
sura
nce
Co
mp
any
Lim
ited
Ann
ual R
epo
rt 2
012
95
38 RELATED PARTY TRANSACTIONS (Continued)
Transactions (Continued)
The Group The Company
2012 2011 2012 2011
Rs'000 Rs'000 Rs'000 Rs'000
(v) Interest paid to directors and related parties 1,252 1,637 - -
(vi) Corporate social responsibility contribution paid to fellow subsidiary 1,212 1,031 1,212 901
(viii) Operating lease income from fellow subsidiaries 35,461 36,170 - -
(ix) Finance lease granted to related parties 5,512 16,096 - -
(x) Repayment from related parties 26,632 12,817 - -
(xi) Purchase of plant and equipment to a fellow subsidiary 56,905 - - -
(xii) Sale of plant and equipment to a fellow subsidiary - 53,510 - -
(xiii) Overhauling and repairs recharged to a fellow subsidiary - 21,687 - -
Compensation of key management personnel
The remuneration of directors and other members of key managementduring the year was as follows:
The Group The Company
2012 2011 2012 2011
Rs'000 Rs'000 Rs'000 Rs'000
Short-term benefits 17,086 16,858 8,677 10,760
Post-employment benefits 1,047 1,206 634 725
18,133 18,064 9,311 11,485
Contribution to defined benefit pension plan
Contribution expensed 2,613 2,526 3,025 2,108

M
auri
tian
Eag
le In
sura
nce
Co
mp
any
Lim
ited
Ann
ual R
epo
rt 2
012
96
NOTES TO THE FINANCIAL STATEMENTS FOR THE YEAR ENDED 30 JUNE 2012
39 ULTIMATE HOLDING COMPANY
The directors regard Ireland Blyth Limited and GML Investissement Limitée as the company’s immediate holding company and ultimate holding company, both incorporated and domiciled in Mauritius.
40 COMMITMENTS FOR FUTURE LEASES
At 30 June 2012, the Group had commitments amounting to Rs.200m (2011: Rs. 150 m) in respect of future leases.
41 EVENT AFTER THE REPORTING DATE
The directors have declared on 26 September 2012 a final dividend of Rs 1.30 (2011: Rs 1.10) per share. The payment of this dividend will not have any tax consequences for the company.
42 TRANSFER OF OPERATIONS
Pursuant to the Insurance Act 2005 which provides that an insurance company cannot transact both long term and general insurance businesses, as from 1 January 2011, Mauritian Eagle Insurance Company Limited has splitted the general and long term business operations and the assets, liabilities and the activities of the long-term business were transferred to Mauritian Eagle Life Company Limited, a wholly-owned subsidiary of the Company.
Assets and liabilities transferred to Mauritian Eagle Life Company Limited are as follows:
Rs.000
Assets
Property, plant and equipment 176
Intangible assets 6,344
Financial assets 169,547
Mortgage and other loans 122,907
Trade and other receivables 17,383
Amounts due from group companies 194,526
Bank and cash balances 37,925
548,808
Reserve and liabilities
Investment revaluation reserve 13,241
Life insurance fund 512,965
Current liabilities 22,602
548,808

M
auri
tian
Eag
le In
sura
nce
Co
mp
any
Lim
ited
Ann
ual R
epo
rt 2
012
97
42 TRANSFER OF OPERATIONS (Continued)
Statement of Comprehensive Income of the Life Business for the six months period ended 31 December 2010
Rs.000
Gross insurance premiums 148,428
Reinsurance premiums ceded (6,666)
Net premiums 141,762
Investment income 19,330
Commission income 542
Other income 5,906
167,540
Benefits and expenses
Net benefits and claims (209,306)
Commission paid (8,211)
Administrative expenses (22,361)
(239,878)
Loss from operations (72,338)
Less release from Life insurance fund 72,338
-

Notes
......................................................................................................................................................................................................................................
......................................................................................................................................................................................................................................
......................................................................................................................................................................................................................................
......................................................................................................................................................................................................................................
......................................................................................................................................................................................................................................
......................................................................................................................................................................................................................................
......................................................................................................................................................................................................................................
......................................................................................................................................................................................................................................
......................................................................................................................................................................................................................................
......................................................................................................................................................................................................................................
......................................................................................................................................................................................................................................
......................................................................................................................................................................................................................................
......................................................................................................................................................................................................................................
......................................................................................................................................................................................................................................
......................................................................................................................................................................................................................................
......................................................................................................................................................................................................................................
......................................................................................................................................................................................................................................
......................................................................................................................................................................................................................................
......................................................................................................................................................................................................................................
......................................................................................................................................................................................................................................
......................................................................................................................................................................................................................................
......................................................................................................................................................................................................................................
......................................................................................................................................................................................................................................
......................................................................................................................................................................................................................................
......................................................................................................................................................................................................................................
......................................................................................................................................................................................................................................
......................................................................................................................................................................................................................................

Head O� ce1st Floor, IBL House, Caudan, Port Louis, Mauritius.
Tel: (230) 203 2200 - Fax: (230) 203 2299Email: [email protected]
Flacq O� ceUnit no. 22, La Source Commercial Centre,
La Source, Centre de Flacq, Mauritius.Tel: (230) 413 0041 / 413 2827 - Fax: (230) 413 0048
Email: fl [email protected]
www.mauritianeagle.com