annual report - mizoram...work will be done by champhai power sub division under power project...
TRANSCRIPT
Champhai Power Circle
ANNUAL
REPORT
Prepared & issued by
Superintending Engineer,
Champhai Power Circle
2010-2011
June 2011

1
ANNUAL REPORT FOR 2010-2011
CONTENT Pages 1. Brief activities the Circle 3-6
2. Statistical Data
1) Organisation chart of CPC 9
2) List of sanction/vacant post under Circle’s office 10
3) List of sanction/vacant posts under PPD, Champhai 11
4) List of sanction/vacant posts under KPD 12
5) Workcharged Staff & Muster Roll Labourers 13
6) Statistic of Power/Generation/Station Transformers 14-16
7) Statistic of Feederwise DT & LT Lines 17-23
8) Abstract of lines 24
9) Statistic of consumers 25
10) Damaged Distribution Transformer 26
3. Expenditure on D&A 27-32
4. Power Profile & Energy Accounting
1) Local generation 35-39
2) Sub Division-wise Revenue Target & Achievement 40
3) Comparision of Sub Division-wise Revenue 41
Collection during 2009-10 & 2010-11
4) Abstract of Feeder Managers’ performance 42-43
5) Month-wise performance of Feeder Managers 44-63
6) Graph – Local generation & Energy input 64

2
ANNUAL REPORT OF CHAMPHAI POWER CIRCLE FOR 2010-11
Prepared by Er F.Rualzakhuma, MES (June 2011) Superintending Engineer Copies 100 Champhai Power Circle (For official circulation only) Power & Electricity Department Government of Mizoram
CONTACT ADDRESS
Superintending Engineer Ph: 03831-235077 Champhai Power Circle Fax: 03831-234306 Kahrawt, Champhai
Executive Engineer Executive Engineer Khawzawl Power Division Power Project Division Khawzawl Champhai Ph/Fax: 03831-261098 Ph/Fax: 03831-235067
Sub Divisional Officer Sub Divisional Officer Khawzawl Power Sub Division Champhai Power Sub Division Khawzawl Champhai Ph/Fax: 03831-261211 Ph: 03831-235996
Sub Divisional Officer Sub Divisional Officer Ngopa Power Sub Division Champhai Rural Power Sub Ngopa Division, Champhai Ph/Fax: 03830-2361347 Ph: 03831-234810
………………………………………………………………………………………..
Disclaimer:Disclaimer:Disclaimer:Disclaimer: This is an operational report with data analysis of the year 2010-11. Data/information in this report is indicative only and should not be used for any commercial purpose.


Champhai Power Circle Annual Report 2010-2011
5
Brief Activities of Champhai Power Circle:
I. Power Supply: (a) Presently power supply to the Champhai District is received through National /State grid lines via Aizawl-Saitual-Khawzawl 132kV line (for Khawzawl Block and Ngopa Block including some villages under Serchhip District) and via Aizawl-Serchhip-E.Lungdar-Khawzawl 132kV line (for Khawbung Block including Champhai town). During rainy season, generation from four Small Hydro Projects of Tuipui SHP (near Champhai), Lamsial SHP (Farkawn) and Maicham SHP Phase I & II (near N.Vanlaiphai under Serchhip district) are supplementing the power requirement of the areas including Serchhip District. (b) During October to May, due to low generation in the entire North Eastern area, there is always shortage of power every year due to which, frequent load shedding have to be resorted in various parts of North Eastern States including Mizoram.
II. Revenue target & Achievement: Revenue target made by E-in-C, P&E for 2010-11 and Achievement of Champhai Power Circle in detail is shown in page no. 40 & 41. The percentage achievement position of offices under Champhai Power Circle with respect to other Circles & Divisions are as below:-
Name of office Target Achievement % Achievement Position in the Deptt.
Power Project Division, Champhai
` 224.48 lakhs ` 277.96 lakhs 123.82% 1st
Khawzawl Power Division ` 130.23 lakhs ` 131.46 lakhs 100.95% 7th
Champhai Power Circle ` 354.72 lakhs ` 409.42 lakhs 115.42% 1st
III On-going Plan works: The Department is taking up the following works during 2010-11 for development of power in the areas:- a) Khawzawl 66/33kV Sub-Station is to be upgraded to 132/33kV level for which 132kV bay equipment are already erected. Balance required materials and works are held up due to fund constraint. Also improvement of existing 132kV line is required for charging at 132kV level which is also held up due to want of fund. The work is being done by Khawzawl Power Sub Division under Khawzawl Power Division.
b) Construction of 132kV line from Khawzawl-Champhai for drawing higher quantum of power is in the completion stage. This line will be charged at 33kV and used for main incoming line for Champhai area until the associated 132kV Sub-Station at Keifangtlang, Champhai is completed provided Khawzawl Sub-Station is also upgraded to 132kV level. The work is sanctioned by DoNER under NLCPR dt 7.12.2006 at a cost of ` 589.56 lakhs in the fund patern of 90:10. Fund released by DoNER up to the end of 2010-11 is ` 456.00 lakhs and release of final installment is awaited. The work is awarded to ZT
Power at a cost of ` 610.54 lakhs excluding the cost of power conductor. Due to various reasons, the estimate is revised at ` 764.00 lakhs and Administrative Approval is obtained. Total expenditure including loan portion, SNA at the end of 2010-11 is ` 651.13 lakhs. About 80% of the work is physically completed.
Champhai Power Circle Annual Report 2010-2011
6
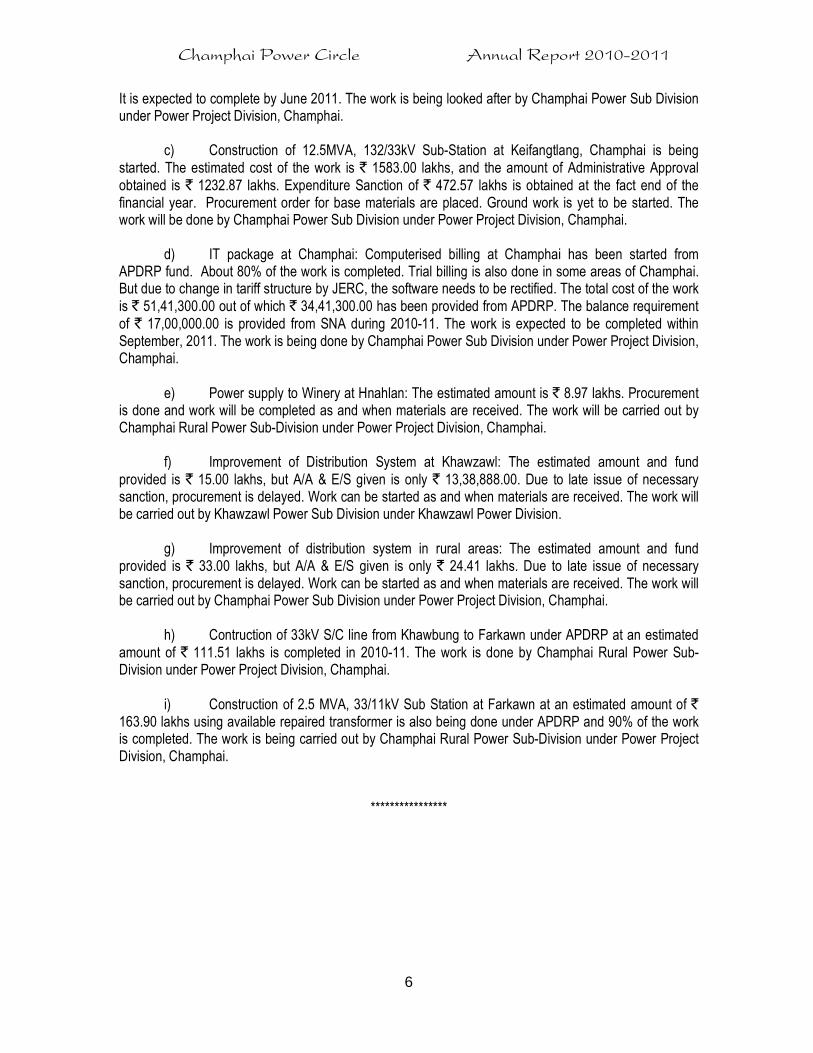
It is expected to complete by June 2011. The work is being looked after by Champhai Power Sub Division under Power Project Division, Champhai.
c) Construction of 12.5MVA, 132/33kV Sub-Station at Keifangtlang, Champhai is being
started. The estimated cost of the work is ` 1583.00 lakhs, and the amount of Administrative Approval obtained is ` 1232.87 lakhs. Expenditure Sanction of ` 472.57 lakhs is obtained at the fact end of the financial year. Procurement order for base materials are placed. Ground work is yet to be started. The work will be done by Champhai Power Sub Division under Power Project Division, Champhai.
d) IT package at Champhai: Computerised billing at Champhai has been started from
APDRP fund. About 80% of the work is completed. Trial billing is also done in some areas of Champhai. But due to change in tariff structure by JERC, the software needs to be rectified. The total cost of the work is ` 51,41,300.00 out of which ` 34,41,300.00 has been provided from APDRP. The balance requirement of ` 17,00,000.00 is provided from SNA during 2010-11. The work is expected to be completed within September, 2011. The work is being done by Champhai Power Sub Division under Power Project Division, Champhai.
e) Power supply to Winery at Hnahlan: The estimated amount is ` 8.97 lakhs. Procurement
is done and work will be completed as and when materials are received. The work will be carried out by Champhai Rural Power Sub-Division under Power Project Division, Champhai.
f) Improvement of Distribution System at Khawzawl: The estimated amount and fund
provided is ` 15.00 lakhs, but A/A & E/S given is only ` 13,38,888.00. Due to late issue of necessary sanction, procurement is delayed. Work can be started as and when materials are received. The work will be carried out by Khawzawl Power Sub Division under Khawzawl Power Division.
g) Improvement of distribution system in rural areas: The estimated amount and fund
provided is ` 33.00 lakhs, but A/A & E/S given is only ` 24.41 lakhs. Due to late issue of necessary sanction, procurement is delayed. Work can be started as and when materials are received. The work will be carried out by Champhai Power Sub Division under Power Project Division, Champhai.
h) Contruction of 33kV S/C line from Khawbung to Farkawn under APDRP at an estimated
amount of ` 111.51 lakhs is completed in 2010-11. The work is done by Champhai Rural Power Sub-Division under Power Project Division, Champhai.
i) Construction of 2.5 MVA, 33/11kV Sub Station at Farkawn at an estimated amount of `
163.90 lakhs using available repaired transformer is also being done under APDRP and 90% of the work is completed. The work is being carried out by Champhai Rural Power Sub-Division under Power Project Division, Champhai.
****************

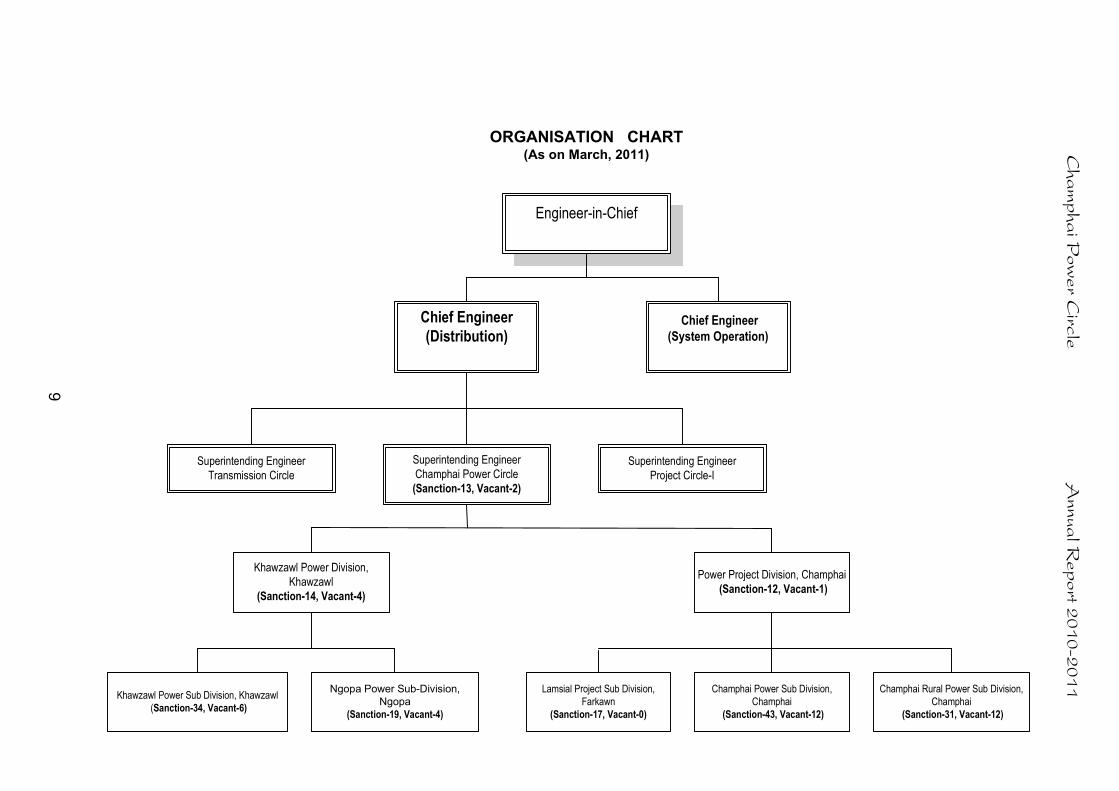
Engineer-in-Chief
Khawzawl Power Division,
Khawzawl
(Sanction-14, Vacant-4)
Power Project Division, Champhai
(Sanction-12, Vacant-1)
Chief Engineer
(Distribution)Chief Engineer
(System Operation)
Superintending Engineer
Champhai Power Circle
(Sanction-13, Vacant-2)
Superintending Engineer
Project Circle-I
Superintending Engineer
Transmission Circle
Lamsial Project Sub Division,
Farkawn
(Sanction-17, Vacant-0)
Champhai Power Sub Division,
Champhai
(Sanction-43, Vacant-12)
Champhai Rural Power Sub Division,
Champhai
(Sanction-31, Vacant-12)
Khawzawl Power Sub Division, Khawzawl
(Sanction-34, Vacant-6)
Ngopa Power Sub-Division,
Ngopa
(Sanction-19, Vacant-4)
ORGANISATION CHART(As on March, 2011)
9
Champhai P
ower C
ircle A
nnual R
eport 2
010-2011
Champhai Power Circle Annual Report 2010-2011
PlanNon-
Plan
1 2 3 4 5 6 7 8 9 10 11 12 13 14
1 SE (E) 1 1 1 0
2 EE (E) 1 1 0 1 1 0
3 AE/SDO (E) 1 1 1 0 3 3 0 2 2 0
4 J.E(E)/Asst Inspector(E) 2 2 1 1 8 6 2 8 5 3
5 J.E (C) 1 1 1 0 4 3 1
6 Sr. Lineman 5 3 2 1 1 0
7 Lineman-I 2 2
8 Lineman-II 10 9 1 4 3 1
9 S.A 1 1 0
10 Mechanic-I 1 1 0
11 Mechanic-II 1 1 0
12 Sr Electrician 1 1
13 Electrician-II 2 1 1
14 E.O-I 2 2 0
15 E.O-II 4 3 1 2 1 1
16 S.B.O-II 5 3 2 1 1 0
17 Compressor Operator 1 1 0
18 Wireman 2 2 0
19 Fitter 2 2 0
20 Electrical Worker 24 15 9 16 16 0
21 Sr. Meter Reader 1 1 0
22 Meter Reader 7 3 4 1 1 0
23 W/T. Operator 1 1 0
24 Driver 1 1 1 0 3 2 1 3 3 0
25 Storekeeper 1 1 0
26 H.A / Assistant 0 0 1 1 0
27 D.A 1 1 0 1 1 0
28 A.D.A 1 1 0 2 1 1
29 Steno-III 1 1 1
30 UDC 1 1 1 0 4 3 1 2 2 0
31 LDC 2 2 2 0 6 6 0 6 4 2
32 Peon 1 1 2 2 0 5 4 1 5 4 1
33 Chowkidar 1 1 1 0 3 3 0 2 1 1
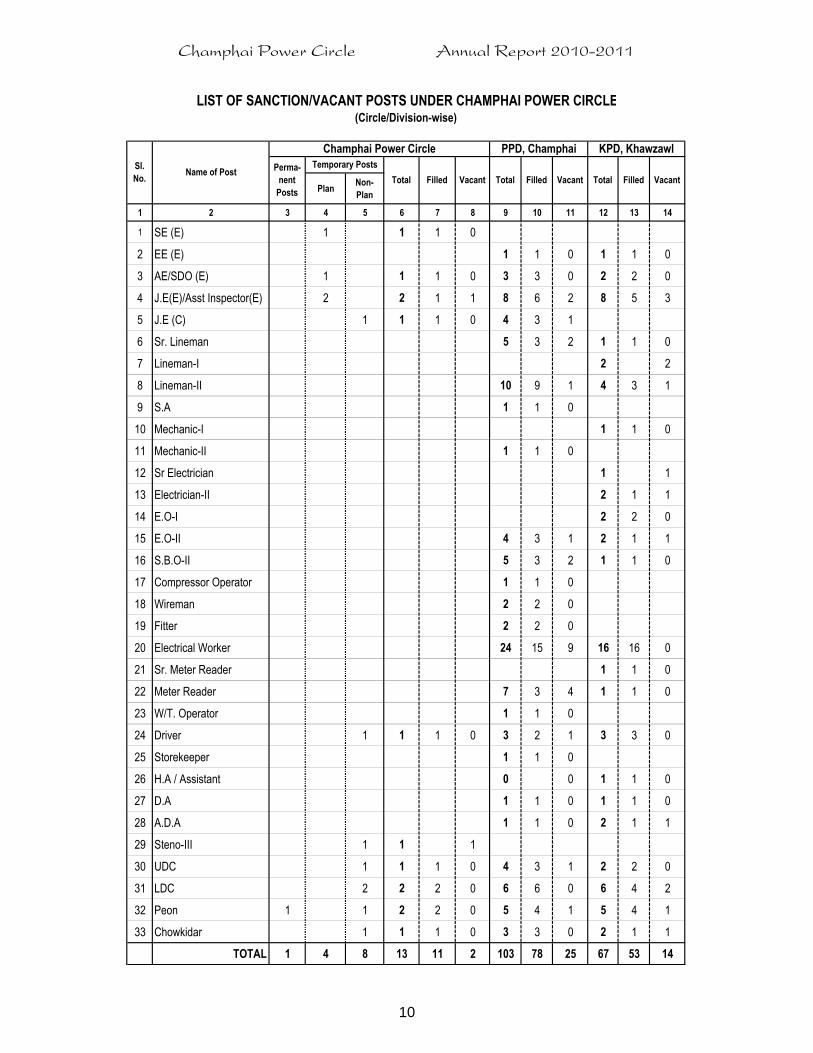
TOTAL 1 4 8 13 11 2 103 78 25 67 53 14
LIST OF SANCTION/VACANT POSTS UNDER CHAMPHAI POWER CIRCLE
Total
Sl.
No.Name of Post
Perma-
nent
Posts
Temporary Posts
Filled Vacant
(Circle/Division-wise)
Filled
KPD, Khawzawl
Total
Champhai Power Circle
Vacant
PPD, Champhai
Total Filled Vacant
10

Plan Non-Plan Plan Non-Plan Plan Non-Plan Plan Non-Plan
1 2 3 4 5 6 7 8 9 10 11 12 13 14 15 16 17 18 19
1 EE (E) - 1 - 1 - - - 0 - - - 0 - - - 0 1
2 AE/SDO (E) - - - 0 - - 1 1 - - 1 1 - 1 - 1 3
3 J.E(E)/Asst Inspector(E) - 2 - 2 - - 3 3 - - 3 3 - - - 0 8
4 J.E (C) - - 1 1 - - - 0 - - - 0 - - 3 3 4
5 Sr. Lineman - - - 0 - - 3 3 - - 2 2 - - - 0 5
6 Lineman-II - - - 0 - - 6 6 - - 4 4 - - - 0 10
7 S.A - - - 0 - - - 0 - - - 0 1 - - 1 1
8 Mechanic-II - - - 0 - - 1 1 - - - 0 - - - 0 1
9 E.O-II - - - 0 - - 4 4 - - - 0 - - - 0 4
10 S.B.O-II - - - 0 - - 2 2 - - 3 3 - - - 0 5
11 Compressor Operator - - - 0 - - - 0 - - - 0 - - 1 1 1
12 Wireman - - - 0 - - - 0 - 2 - 2 - - - 0 2
13 Fitter - - - 0 - - 2 2 - - - 0 - - - 0 2
14 Electrical Worker - - - 0 - 2 8 10 - - 10 10 - - 4 4 24
15 Meter Reader - - - 0 - 3 1 4 - 3 - 3 - - - 0 7
16 W/T. Operator - 1 - 1 - - - 0 - - - 0 - - - 0 1
17 Driver - - 1 1 - - 1 1 - - - 0 - - 1 1 3
18 Storekeeper - - - 0 - - - 0 - - - 0 - - 1 1 1
19 H.A / Assistant - - 0 - - - 0 - - - 0 - - - 0 0
20 D.A - - 1 1 - - - 0 - - - 0 - - - 0 1
21 A.D.A 1 - - 1 - - - 0 - - - 0 - - - 0 1
22 UDC - - 1 1 - - 1 1 - - 1 1 - - 1 1 4
23 LDC - - 2 2 - - 2 2 - - 1 1 - - 1 1 6
24 Peon - - - 0 - - 2 2 - - 1 1 - - 2 2 5
25 Chowkidar - - 1 1 - - 1 1 - - - 0 - 1 - 1 3
TOTAL 1 4 7 12 - 5 38 43 - 5 26 31 1 2 14 17 103
11
LIST OF SANCTION POSTS UNDER POWER PROJECT DIVISION, CHAMPHAI
Sl. No. Name of Post
Power Project Division Lamsial Project S/D
Total Total
Temporary PostsPerma-
nent
Posts
Temporary PostsTemporary Posts
Total Champhai P
ower C
ircle A
nnual re
port 2
010-2011
Total
Champhai Rural Power S/D
Perma-
nent
Posts
Champhai Power S/D
Perma-
nent
Posts
Perma-
nent
Posts
Temporary Posts Total under
PPD

Plan Non-Plan Plan Non-Plan Plan Non-Plan
1 2 3 4 5 6 7 8 9 10 11 12 13 14 19
1 EE (E) - - 1 1 - - - 0 - - - 0 1
2 AE/SDO (E) - - - 0 - - 1 1 1 - - 1 2
3 J.E(E)/Asst Inspector(E) - - 2 2 - - 3 3 2 - 1 3 8
4 Sr. Lineman - - - 0 - - 1 1 - - - 0 1
5 Lineman-I - - - 0 - 1 1 2 - - - 0 2
6 Lineman-II - - - 0 - - 2 2 - - 2 2 4
7 Mechanic-I - - - 0 - - 1 1 - - - 0 1
8 Sr Electrician - - - 0 - 1 - 1 - - - 0 1
9 Electrician-II - - - 0 - - 2 2 - - - 0 2
10 E.O-I - - - 0 - - 2 2 - - - 0 2
11 E.O-II - - - 0 - - 2 2 - - - 0 2
12 S.B.O-II - - - 0 - - 1 1 - - - 0 1
13 Electrical Worker - - - 0 - 4 4 8 - - 8 8 16
14 Sr. Meter Reader - - - 0 - - 1 1 - - - 0 1
15 Meter Reader - - - 0 - - 1 1 - - - 0 1
16 Driver - - 1 1 - - 1 1 - - 1 1 3
17 H.A / Assistant - - 1 1 - - - 0 - - - 0 1
18 D.A - - 1 1 - - - 0 - - - 0 1
19 A.D.A - - 2 2 - - - 0 - - - 0 2
20 UDC - - 1 1 - 1 - 1 - - 0 0 2
21 LDC - - 2 2 - - 2 2 2 - - 2 6
22 Peon - - 2 2 - - 2 2 - - 1 1 5
23 Chowkidar - - 1 1 - - - 0 - - 1 1 2
TOTAL - - 14 14 - 7 27 34 5 0 14 19 67
Champhai P
ower C
ircle A
nnual R
eport 2
010-2011
Khawzawl Power Division
Perma-nent
Posts
Temporary PostsTotal
Perma-nent
Posts
Temporary PostsTotal
12
Total
under
KPD
LIST OF SANCTION POSTS UNDER KHAWZAWL POWER DIVISION
Name of PostSl. No.
Khawzawl Power S/D
Perma-nent
Posts
Temporary PostsTotal
Ngopa Power S/D

Champhai Power Circle Annual Report 2010-2011
Champhai
Power S/D
Champhai
Rural Power
S/D
Lamsial
Project S/DTotal PPD
Khawzawl
Power S/D
Ngopa
Power S/DTotal KPD
1 2 3 4 5 6 7 8 9 10
1 Section Assistant 1 1 0 1
2 Electrical Worker 6 4 1 11 13 1 14 25
3 W.T. Optr. 1 1 2 2 3
4 Meter Reader 6 4 10 7 7 17
5 Carpenter 0 1 1 1
6 Driver 1 1 0 1
7 Chowkidar/Peon 2 2 1 1 3
TOTAL 17 8 1 26 20 5 25 51
Champhai
Power S/D
Champhai
Rural Power
S/D
Lamsial
Project S/DTotal PPD
Khawzawl
Power S/D
Ngopa
Power S/DTotal KPD
1 2 3 4 5 6 7 8 9 10
1 Skill-I 6 1 7 4 4 8 15
2 Skill-II 36 10 1 47 45 21 66 113
3 Semi Skill 12 12 2 26 11 6 17 43
4 Unskill 15 26 8 49 25 23 48 97
Total 69 49 11 129 85 54 139 268
Power Project Division, Champhai Khawzawl Power Division
Category of posts
(Work Charged)Sl. No.
STATISTIC OF WORKCHARGED (AS ON MARCH 2011)
TOTAL CPC
STATISTIC OF MUSTER ROLL LABOURER (AS ON MARCH 2011)
Sl. No. Grade
Power Project Division, Champhai Khawzawl Power Division
TOTAL CPC
13

Champhai Power Circle Annual Report 2010-2011
(I) POWER TRANSFORMERS :
6.3 MVA 2.5 MVA 2 MVA 1.6 MVA
1 3 4 5 6 7
1 1 1
2 1 1 2
3 0 2 1 0 3
4 1 1 2
5 1 1 2
6 1 1 1 1 4
7 1 3 2 1 7
(II) GENERATION TRANSFORMERS (STEP-UP) AND STATION SERVICE TRANSFORMERS:
11/0.4kV
630 kVA 250 kVA 100 kVA 63 kVA 25 kVA
1 2 3 4 5 6 7 8
1 Khawzawl Power S/D 1 2 3
2 Ngopa Power S/D 1 1 2
3 Total Khawzawl PD 0 1 3 0 1 5
4 Champhai PSD 1 2 1 4
5 Champhai Rural PSD 2 2
6 Lamsial Project SD 1 1
7 Total PPD, Champhai 2 0 4 1 0 7
8 Total CPC 2 1 7 1 1 12
(III) DISTRIBUTION TRANSFORMERS:
Sl 33/0.4kV 11/0.2kV
No Name of Sub-Division 100 kVA 250 kVA 100 kVA 63 kVA 25 kVA 16 kVA
1 2 3 4 5 6 7 8 8
1 Khawzawl Power S/D 6 21 10 10 47
2 Ngopa Power S/D 1 18 12 5 36
3 Total Khawzawl PD 1 6 39 22 15 0 83
3 Champhai PSD 1 16 24 12 5 1 59
4 Champhai Rural PSD 2 8 15 10 1 36
6 Total PPD, Champhai 1 18 32 27 15 2 95
7 Total CPC 2 24 71 49 30 2 178
Total
33/11kV
11/0.4kV
Khawzawl PSD
Ngopa PSD
Total Khawzawl PD
Total CPC
Champhai PSD
Champhai Rural PSD
Total PPD, Champhai
0.4/11kV 33/0.4kV
Sl
No
Sl.
No.Name of Sub-Division
ABSTRACT
STATISTIC OF TRANSFORMERS FOR ENDING MARCH/2011
(Owned and Maintained by Power & Electricity Department)
Total
Total
Name of Sub-Division
2
14
Champhai Power Circle Annual Report 2010-2011
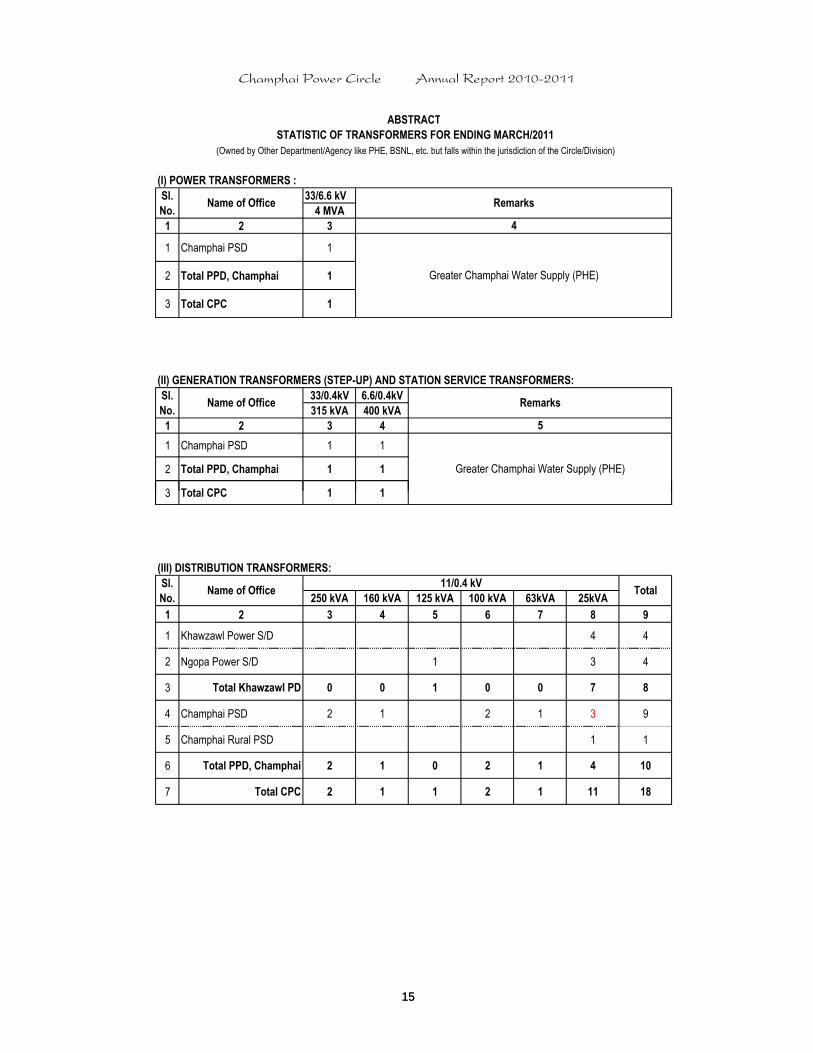
(I) POWER TRANSFORMERS :
33/6.6 kV
4 MVA
1 2 3
1 Champhai PSD 1
2 Total PPD, Champhai 1
3 Total CPC 1
(II) GENERATION TRANSFORMERS (STEP-UP) AND STATION SERVICE TRANSFORMERS:
33/0.4kV 6.6/0.4kV
315 kVA 400 kVA
1 2 3 4
1 Champhai PSD 1 1
2 Total PPD, Champhai 1 1
3 Total CPC 1 1
ABSTRACT
STATISTIC OF TRANSFORMERS FOR ENDING MARCH/2011
(Owned by Other Department/Agency like PHE, BSNL, etc. but falls within the jurisdiction of the Circle/Division)
4
Greater Champhai Water Supply (PHE)
Remarks
Greater Champhai Water Supply (PHE)
Sl.
No.Name of Office
Sl.
No.Name of Office
5
Remarks
15
3 Total CPC 1 1
(III) DISTRIBUTION TRANSFORMERS:
250 kVA 160 kVA 125 kVA 100 kVA 63kVA 25kVA
1 2 3 4 5 6 7 8 9
1 Khawzawl Power S/D 4 4
2 Ngopa Power S/D 1 3 4
3 Total Khawzawl PD 0 0 1 0 0 7 8
4 Champhai PSD 2 1 2 1 3 9
5 Champhai Rural PSD 1 1
6 Total PPD, Champhai 2 1 0 2 1 4 10
7 Total CPC 2 1 1 2 1 11 18
Sl.
No.Name of Office Total
11/0.4 kV
15

Champhai Power Circle Annual Report 2010-2011
(I) POWER TRANSFORMERS:
Sl.
No.Voltage Ratio Rating in MVA Name of Location/Sub-Station
First
commissioning
1 2 3 4 5
1 33/11kV 1x2.5 33KV New S/S, Khawzawl 20.9.2007
2 33/11kV 1x2 33kV S/S, Kawlkulh 15.12.2001
3 33/11kV 1x2.5 33kV S/S, Ngopa 30.6.2008
4 33/11kV 1x6.3 33kV Lower S/S, Champhai Oct-04
5 33/11kV 1x2.5 33kV Upper S/S, Champhai Aug-04
6 33/11kV 1x4 GCWS, Tuipui (PHE)* 7.5.2009
7 33/11kV 1 x 2 33kV S/S, Khuangleng August-08
8 33/11kV 1 x 1.6 33kV S/S, Hnahlan August-08
(II) GENERATION (STEP-UP) AND STATION SERVICE TRANSFORMERS:
Sl.
No.Voltage Ratio Rating in kVA Name of Location/Sub-Station
First
commissioning
1 2 3 4 5
1 33/0.4KV 1x200 66kV S/S, Khawzawl 21.2.2008
2 11/0.4KV 1x100 66kV S/S, Khawzawl 6.6.1995
3 11/0.4 1x25 33kV S/S, Kawlkulh 15.12.2001
4 33/0.4kV 1x100 33kV S/S, Ngopa 30.6.2008
5 33/0.4kV 1x100 33kV Lower S/S, Champhai October-04
6 33/0.4kV 1x100 33kV Upper S/S, Champhai August-04
7 33/0.4kV 1x400 GCWS, Tuipui (PHE)* 7.5.2009
8 6.6/0.4kV 1x315 GCWS, Tuipui (PHE)* 7.5.2009
9 0.4/11KV 1x630 Tuipui Small Hydel Project 1990
10 11/0.4KV 1x63 Tuipui Small Hydel Project 1990
11 0.4/11KV 1x630 Lamsial Small Hydel Project September-08
12 33/0.4KV 1x100 33kV S/S, Khuangleng August-08
13 33/0.4KV 1x100 33kV S/S, Hnahlan August-08
Note: ( *) Owned and maintained by PHE Department
STATISTIC OF TRANSFORMERS FOR ENDING MARCH/2011
16

Champhai Power Circle Annual Report 2010-2011
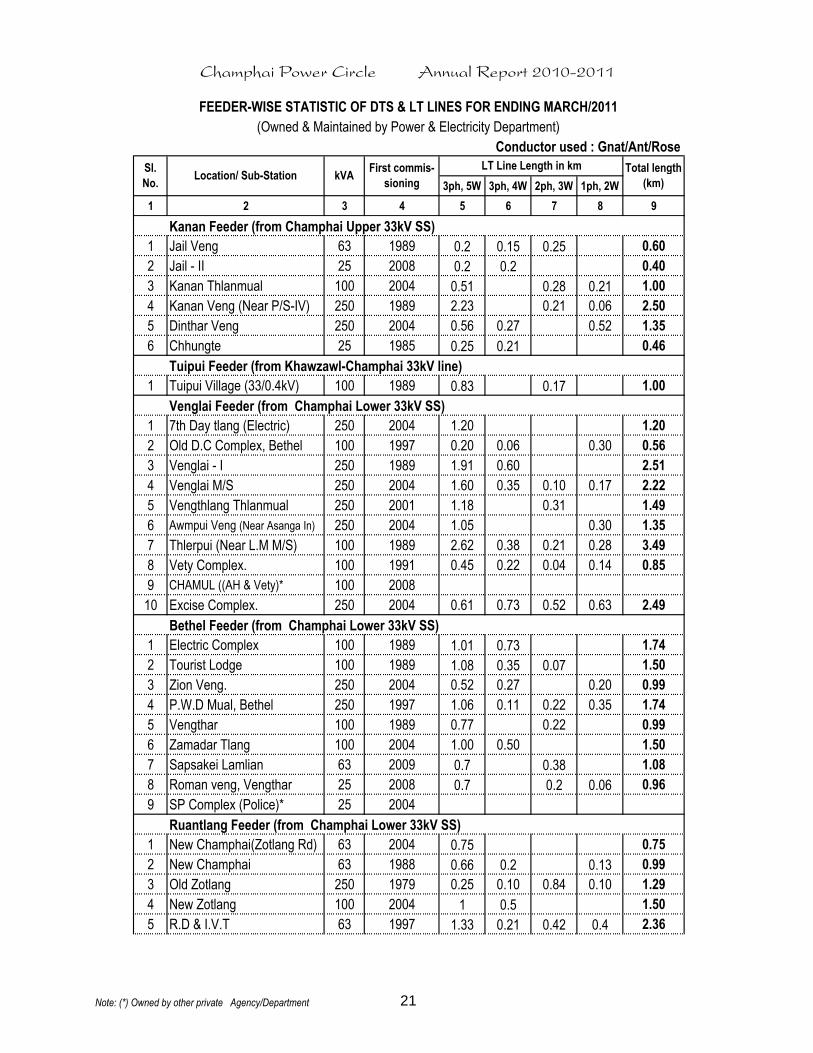
Conductor used : Gnat/Ant/Rose
3ph, 5W 3ph, 4W 2ph, 3W 1ph, 2W
1 2 3 4 5 6 7 8 9
Khawzawl Power Sub-Division
Vengthar Feeder (from Khawzawl 33kV SS)
1 Vengthar-I, Khawzawl 250 4.5.1981
2 Vengthar-II, Khawzawl 100 10.9.2003
3 Electric-II, Khawzawl 100 10.9.2003
4 Electric-III, Khawzawl 100 10.9.2003
5 Dinthar-I, Khawzawl 100 10.9.2003
6 Tuisenphai, Khawzawl 100 10.9.2003
Hermon Feeder (from Khawzawl 33kV SS)
1 Hermon-I, Khawzawl 100 10.9.2003
2 Hermon-II, Khawzawl 100 10.9.2003
3 Hermon-III, Khawzawl 100 10.9.2003
4 Electric-I, Khawzawl 250 4.5.1981
Zuchhip Feeder (from Khawzawl 33kV SS)
1 Zuchhip, Khawzawl 250 4.5.1981
2 Kawnzar, Khawzawl 100 4.5.1990
3 Darngawn-I, Khawzawl 100 10.9.2003
4 Darngawn-II,Khawzawl 100 10.9.2003
5 Darngawn-III,Khawzawl 100 10.9.2003
6 Dinthar-II, Khawzawl 100 10.9.2003
7 BSNL (Khawzawl)* 25 12.9.2002
8 College Veng, Khawzawl 100 10.9.2003
IR Feeder (from Khawzawl 33kV SS)
1 2nd IR, Khawzawl 250 15.12.2003
Khawhai Feeder (from Khawzawl 33kV SS)
1 Chawngtlai-I 100 21.2.1988 3 3
2 Chawngtlai Phaiveng 63 17.3.2008 1 1
3 Tualte 100 2.5.1990 3 0.4 3.4
4 Chalrang Melhnih 25 15.12.2007 0.3 0.3
5 Vangtlang 63 16.2.1990 2 2
6 Old Chalrang 63 11.4.1989 2 2
7 New Chalrang 63 2.6.1984 2 0.5 2.5
8 Old Khawhai 63 10.6.1991 1 1
9 New Khawhai 100 20.4.1983 7 7
10 Reliance (Khawhai)* 25 21.1.2009
1.5 30.25
FEEDER-WISE STATISTIC OF DTS & LT LINES FOR ENDING MARCH/2011
(Owned & Maintained by Power & Electricity Department)
kVATotal length
(km)
LT Line Length in kmSl.
No.Location/ Sub-Station
First commis-
sioning
28.75
Note: (*) Owned by other private Agency/Department 17

Champhai Power Circle Annual Report 2010-2011
Conductor used : Gnat/Ant/Rose
3ph, 5W 3ph, 4W 2ph, 3W 1ph, 2W
1 2 3 4 5 6 7 8 9
FEEDER-WISE STATISTIC OF DTS & LT LINES FOR ENDING MARCH/2011
(Owned & Maintained by Power & Electricity Department)
kVATotal length
(km)
LT Line Length in kmSl.
No.Location/ Sub-Station
First commis-
sioning
11 BSNL (Khawhai)* 25 4.8.2007
12 Lungtan 63 18.5.1996 1.2 1.2
13 Tlangmawi 25 18.2.1988 1 1
14 Tlangpui 100 19.12.1987 2 2
15 Sialhawk-I 250 2.11.1982 3.75 0.4 4.15
16 Sialhawk-II 100 2.2.2008 1 1
17 Reliance (Sialhawk)* 25 21.1.2009
18 Riangtlei 25 7.3.1992 1 0.3 1.3
19 Biate-I 100 18.5.1981 2.6 2.6
20 Biate-II 25 18.5.1981
21 Biate-III 250 2.9.2007
22 Tea Estate, Biate 25 5.6.2008 0.3 0.3
Rabung Feeder (from Khawzawl 33kV SS)
1 Hmuncheng 63 2.9.2005 1 1
2 Neihdawn 25 8.6.1986 2 0.4 2.4
3 Ngaizawl 25 12.6.1992 1 0.2 1.2
4 Tualpui 63 27.4.1991 1.25 1.25
5 Khualen 63 8.10.1992 0.5 0.25 0.75
6 Rabung-I 100 23.12.1991 2.5 0.3 0.25 0.4 3.45
7 Rabung-II 63 18.3.2008 1 0.25 1.25
8 Aiduzawl 25 12.5.1992 1 1
9 Pamchung 25 15.5.1996 1 1
10 Murlen 25 29.5.1996 4 0.6 4.6
Total KPSD 3530 82.85 2 2.05 3.5 90.4
Ngopa Power Sub-Division
Kawlkulh Feeder (from Kawlkulh 33kV SS)
1 Kawlkulh 100
2 Kawlkulh 100
3 Kawlkulh 100
4 Kawlkulh 100
5 Kawlkulh 25
6 BSNL (Kawlkulh)* 25 9.9.2006
7 Bangla kawn, Kawlkulh 63 Oct-96 0.5 0.5
8 Dulte 63 Oct-89 0.8 0.5 0.7 2
9 Tawitawkawn 25 Feb-98 1 1
6.5
2.4 1.5 1.5
6
2.6
Sep-86
8
0.5
Note: (*) Owned by other private Agency/Department 18

Champhai Power Circle Annual Report 2010-2011
Conductor used : Gnat/Ant/Rose
3ph, 5W 3ph, 4W 2ph, 3W 1ph, 2W
1 2 3 4 5 6 7 8 9
FEEDER-WISE STATISTIC OF DTS & LT LINES FOR ENDING MARCH/2011
(Owned & Maintained by Power & Electricity Department)
kVATotal length
(km)
LT Line Length in kmSl.
No.Location/ Sub-Station
First commis-
sioning
Puilo Feeder (from Kawlkulh 33kV SS)
1 Puilo 100 Aug-87 0.6 0.5 0.9 2
2 Chhawrtui 100 Dec-92 0.5 0.9 0.6 0.5 2.5
3 Vanchengpui 63 Dec-94 0.5 1.2 0.5 0.3 2.5
Arro Feeder (from Khawzawl-Kawlkulh 33kV line)
1 Arro (33/0.4kV) 100 Jun-93 0.2 0.8 1
Hliappui Feeder (from Kawlkulh 33kV SS)
1 Hliappui 100 Sep-88
2 Hliappui 100
3 Hliappui Venghlun 25 Sep-97 0.1 0.05 0.05 0.05 0.25
4 BSNL (Hliappui) 25 15.10.2006
5 Saichal 100 Nov-90 0.2 2.1 0.4 1.4 4.1
6 Channgzawl 63 Nov-90 0.3 0.4 0.2 1.2 2.1
7 Pawlrang 63 Nov-90 0.3 0.5 1.2 0.3 2.3
8 Lamzawl 63 May-02 1 1
Ngopa Feeder (from Ngopa 33kV SS)
1 Ngopa 100
2 Ngopa 100
3 Ngopa 100
4 Ngopa 100
5 Ngopa 100
6 Ngopa 100
7 NEEPCO (Ngopa)* 25 25.4.2002
8 Ngopa Tea Factory * 125 15.5.2005
N.E.Khawdungsei Feeder (from Ngopa 33kV SS)
1 NE Khawdungsei 100
2 NE Khawdungsei 100
3 NE Khawdungsei 25
4 Chiahpui 63 Aug-96 0.2 1.2 0.1 0.3 1.8
5 Khawkawn 25 Sep-98 0.2 0.1 0.3 0.3 0.9
6 Mimbung 100 Apr-96 1.3 0.9 1.2 3.4
0.5 4
8 8
1.8
0.9 4Apr-95
Nov-89
0.3 1.4
2.5 0.2 0.4
Note: (*) Owned by other private Agency/Department 19

Champhai Power Circle Annual Report 2010-2011
Conductor used : Gnat/Ant/Rose
3ph, 5W 3ph, 4W 2ph, 3W 1ph, 2W
1 2 3 4 5 6 7 8 9
FEEDER-WISE STATISTIC OF DTS & LT LINES FOR ENDING MARCH/2011
(Owned & Maintained by Power & Electricity Department)
kVATotal length
(km)
LT Line Length in kmSl.
No.Location/ Sub-Station
First commis-
sioning
Kawlbem Feeder (from Ngopa 33kV SS)
1 Kawlbem 63 May-97 0.2 0.2 0.4 0.4 1.2
2 Teikhang 63 May-02
3 Teikhang 63
4 New Hrianghmun 63 0.5 0.5
5 Old Hrianghmun 63 0.5 0.5
Total NgPSD 2981 25.6 10.45 9.45 10.05 55.55
Total Khawzawl PD 6511 108.45 12.45 11.5 13.55 145.95
Champhai Power Sub-Division
Kahrawt Feeder (from Champhai Upper 33kV SS)
1 Liana Veng 250 2004 0.70 0.28 0.30 0.21 1.49
2 Kahrawt Veng 250 1989 1.70 0.06 1.76
3 I.B Veng, Champhai 250 2002 2.00 0.50 2.50
4 CHANEM 250 2006 0.45 0.45
5 Hospital veng 100 2009 0.6 0.60
6 BSNL Complex, Champhai* 160 2001
7 BSNL Mobile* 25 2004
8 Pawhhawn tuikhur, Vengsang 100 2009 0.45 0.2 0.65
9 Tower Veng, Vengsang 25 2009 0.7 0.70
DC Feeder (from Champhai Upper 33kV SS)
1 Civil Hospital Complex. 100 1989 0.5 0.45 0.95
2 D.C Complex, Keifangtlang. 250 2006 3.50 3.50
Hmunhmeltha Feeder (from Champhai Upper 33kV SS)
1 Hmunhmeltha - I 100 1985 1.9 0.17 0.24 0.7 3.01
2 Hmunhmeltha - II 100 2004 1 0.22 0.27 1.49
3 Zote - I 100 1978 1.2 0.31 0.87 0.1 2.48
4 Zote - II 100 2004 0.5 0.50
5 Zote - III 100 2004 0.5 0.50
6 IIDC-I (ZIDCO)* 250 2007
7 IIDC-II (ZIDCO)* 250 2007
8 Ngur (under CPRSD) 63 1986 0.91 0.58 0.1 1.59
9 N.Khawbung 63 1988 0.5 0.4 0.6 1.50
2
May-02
2
Note: (*) Owned by other private Agency/Department 20
Champhai Power Circle Annual Report 2010-2011
Conductor used : Gnat/Ant/Rose
3ph, 5W 3ph, 4W 2ph, 3W 1ph, 2W
1 2 3 4 5 6 7 8 9
FEEDER-WISE STATISTIC OF DTS & LT LINES FOR ENDING MARCH/2011
(Owned & Maintained by Power & Electricity Department)
kVATotal length
(km)
LT Line Length in kmSl.
No.Location/ Sub-Station
First commis-
sioning
Kanan Feeder (from Champhai Upper 33kV SS)
1 Jail Veng 63 1989 0.2 0.15 0.25 0.60
2 Jail - II 25 2008 0.2 0.2 0.40
3 Kanan Thlanmual 100 2004 0.51 0.28 0.21 1.00
4 Kanan Veng (Near P/S-IV) 250 1989 2.23 0.21 0.06 2.50
5 Dinthar Veng 250 2004 0.56 0.27 0.52 1.35
6 Chhungte 25 1985 0.25 0.21 0.46
Tuipui Feeder (from Khawzawl-Champhai 33kV line)
1 Tuipui Village (33/0.4kV) 100 1989 0.83 0.17 1.00
Venglai Feeder (from Champhai Lower 33kV SS)
1 7th Day tlang (Electric) 250 2004 1.20 1.20
2 Old D.C Complex, Bethel 100 1997 0.20 0.06 0.30 0.56
3 Venglai - I 250 1989 1.91 0.60 2.51
4 Venglai M/S 250 2004 1.60 0.35 0.10 0.17 2.22
5 Vengthlang Thlanmual 250 2001 1.18 0.31 1.49
6 Awmpui Veng (Near Asanga In) 250 2004 1.05 0.30 1.35
7 Thlerpui (Near L.M M/S) 100 1989 2.62 0.38 0.21 0.28 3.49
8 Vety Complex. 100 1991 0.45 0.22 0.04 0.14 0.85
9 CHAMUL ((AH & Vety)* 100 2008
10 Excise Complex. 250 2004 0.61 0.73 0.52 0.63 2.49
Bethel Feeder (from Champhai Lower 33kV SS)
1 Electric Complex 100 1989 1.01 0.73 1.74
2 Tourist Lodge 100 1989 1.08 0.35 0.07 1.50
3 Zion Veng. 250 2004 0.52 0.27 0.20 0.99
4 P.W.D Mual, Bethel 250 1997 1.06 0.11 0.22 0.35 1.74
5 Vengthar 100 1989 0.77 0.22 0.99
6 Zamadar Tlang 100 2004 1.00 0.50 1.50
7 Sapsakei Lamlian 63 2009 0.7 0.38 1.08
8 Roman veng, Vengthar 25 2008 0.7 0.2 0.06 0.96
9 SP Complex (Police)* 25 2004
Ruantlang Feeder (from Champhai Lower 33kV SS)
1 New Champhai(Zotlang Rd) 63 2004 0.75 0.75
2 New Champhai 63 1988 0.66 0.2 0.13 0.99
3 Old Zotlang 250 1979 0.25 0.10 0.84 0.10 1.29
4 New Zotlang 100 2004 1 0.5 1.50
5 R.D & I.V.T 63 1997 1.33 0.21 0.42 0.4 2.36
Note: (*) Owned by other private Agency/Department 21

Champhai Power Circle Annual Report 2010-2011
Conductor used : Gnat/Ant/Rose
3ph, 5W 3ph, 4W 2ph, 3W 1ph, 2W
1 2 3 4 5 6 7 8 9
FEEDER-WISE STATISTIC OF DTS & LT LINES FOR ENDING MARCH/2011
(Owned & Maintained by Power & Electricity Department)
kVATotal length
(km)
LT Line Length in kmSl.
No.Location/ Sub-Station
First commis-
sioning
6 Old Ruantlang 100 1979 0.78 0.21 0.73 0.77 2.49
7 New Ruantlang 100 2004 0.52 0.22 0.74
8 Tlangsam - Tuipui Kai 63 2006 1 1.00
9 Chhanchhuahna In 16 1998 0.3 0.30
10 Cold Storage (Agri)* 100 2010
11 Winery, Tlangsam 63 2010
12 Old Tlangsam 100 1984 0.56 0.5 0.42 0.52 2.00
13 New Tlangsam 100 2004 0.52 0.28 0.28 0.21 1.29
Mualkawi Feeder (from Champhai Lower 33kV SS)
1 Mualkawi 100 1987 1.22 0.28 1.50
2 Melbuk 63 1988 0.65 0.24 0.1 0.99
3 Custom (Melbuk)* 63 2009
4 New Hruaikawn 63 1998 0.7 0.3 1.00
5 Old Hruaikawn 25 1992 0.5 0.1 0.4 1.00
6 Zokhawthar-I 100 1999 1.7 0.45 0.07 0.28 2.50
7 Zokhawthar - II 100 2008 1 1.00
8
Custom Complex,
Zokhawthar (Central Excise
& Custom)*
100 2007
9 Kelkang 63 1987 2.65 0.14 0.38 0.7 3.87
10 Dilkawn 63 1989 1.23 0.31 0.17 0.43 2.14
Total CPSD 8533 54.87 11.70 10.02 9.76 86.35
Champhai Rural Power Sub-Division
Hnahlan Feeder (from Hnahlan 33kV SS)
1 Hnahlan-I 250 1999 0.9 0.7 1.1 0.38 3.08
2 Hnahlan-II 25 2006 0.3 0.3
3 N. Diltlang 25 1999 0.43 0.14 0.14 0.71
Khuangphah Feeder (from Hnahlan 33kV SS)
1 Khuangphah 63 1999 0.69 0.6 0.21 0.1 1.6
2 Vaikhawtlang 25 2008 0.9 0.5 0.35 0.55 2.3
Tualcheng Feeder (from Hnahlan 33kV SS)
1 Tualcheng 63 1999 1.12 0.14 0.4 1.66
2 Lungphunlian 63 2002 0.14 0.1 0.24
3 Vapar 25 1998 0.51 0.38 0.14 0.11 1.14
4 Changpui (11/0.2kV) 16 2006 0.3 0.3
Note: (*) Owned by other private Agency/Department 22

Champhai Power Circle Annual Report 2010-2011
Conductor used : Gnat/Ant/Rose
3ph, 5W 3ph, 4W 2ph, 3W 1ph, 2W
1 2 3 4 5 6 7 8 9
FEEDER-WISE STATISTIC OF DTS & LT LINES FOR ENDING MARCH/2011
(Owned & Maintained by Power & Electricity Department)
kVATotal length
(km)
LT Line Length in kmSl.
No.Location/ Sub-Station
First commis-
sioning
Khuangleng Feeder (from Khuangleng 33kV SS)
1 Khuangleng 100 1989 0.8 0.5 1.2 2.5
Buang Feeder (from Khuangleng 33kV SS)
1 Buang 63 1992 0.49 0.21 0.1 0.8
Leisenzo Feeder (from Khuangleng 33kV SS)
1 Leisenzo 63 1992 0.66 0.52 0.42 1.6
2 Bulfekzawl 100 1993 1.01 0.04 0.07 1.31 2.43
3 Sesih 63 1992 0.42 0.38 0.35 0.94 2.09
4 Lianpui 63 1995 0.2 0.4 0.2 0.3 1.1
Leithum Feeder (from Khuangleng 33kV SS)
1 Leithum 63 1992 0.48 0.42 0.4 1.3
2 Sazep 25 1993 0.38 0.31 0.22 0.91
3 Vangchhia 100 2003 0.8 0.3 0.1 0.3 1.5
4 Vanzau 25 1992 0.5 0.48 0.1 0.85 1.93
5 Bungzung 100 1992 1.3 0.1 0.84 2.24
6 Zawngtetui 25 1993 1 1
7 Dungtlang 63 1993 0.89 0.1 0.99
8 S.Khawbung-I 250 1988 2.34 0.5 1.75 0.42 5.01
9 S. Khawbung II 63 2001 0.5 0.5
10 BSNL (S.Khawbung)* 25
11 Zawlsei 25 1988 0.7 0.3 0.04 0.55 1.59
12 Khuangthing 63 1993 0.8 0.2 0.25 0.1 1.35
13 Old Samthang 100 1991 0.9 0.63 0.46 1.99
14 New Samthang 25 1998 0.48 0.38 0.04 0.12 1.02
15 Vaphai 100 1992 1.71 0.38 0.17 0.63 2.89
16 Chawngtui E 100 2004 1.19 0.24 0.1 0.1 1.63
17 Farkawn I 100 1992 1.17 0.88 0.21 0.14 2.4
18 Farkawn II 63 1999 0.28 0.25 0.53
19 Khankawn 63 1998 0.6 0.25 0.25 1.1
20 Thekte 25 2002 0.41 0.24 0.35 1
21 Thekpui 63 2002 0.51 0.27 0.23 0.14 1.15
Total RPSD 2473 23.25 10.5 8.11 12.02 53.88
Total PPD 11006 78.12 22.20 18.13 21.78 140.23
Total CPC 17517 186.57 34.65 29.63 35.33 286.18
Note: (*) Owned by other private Agency/Department 23
Champhai Power Circle Annual Report 2010-2011
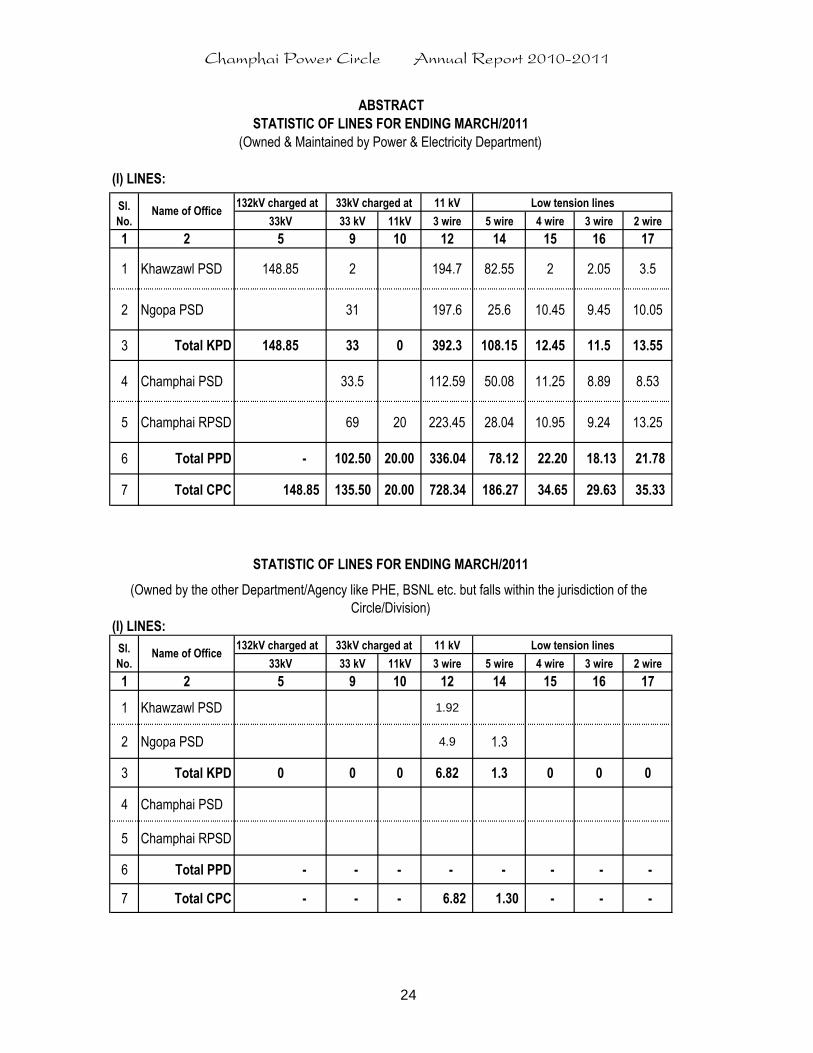
(I) LINES:
132kV charged at 11 kV
33kV 33 kV 11kV 3 wire 5 wire 4 wire 3 wire 2 wire
1 2 5 9 10 12 14 15 16 17
1 Khawzawl PSD 148.85 2 194.7 82.55 2 2.05 3.5
2 Ngopa PSD 31 197.6 25.6 10.45 9.45 10.05
3 Total KPD 148.85 33 0 392.3 108.15 12.45 11.5 13.55
4 Champhai PSD 33.5 112.59 50.08 11.25 8.89 8.53
5 Champhai RPSD 69 20 223.45 28.04 10.95 9.24 13.25
6 Total PPD - 102.50 20.00 336.04 78.12 22.20 18.13 21.78
7 Total CPC 148.85 135.50 20.00 728.34 186.27 34.65 29.63 35.33
(I) LINES:
132kV charged at 11 kV
33kV 33 kV 11kV 3 wire 5 wire 4 wire 3 wire 2 wire
1 2 5 9 10 12 14 15 16 17
1 Khawzawl PSD 1.92
2 Ngopa PSD 4.9 1.3
3 Total KPD 0 0 0 6.82 1.3 0 0 0
4 Champhai PSD
5 Champhai RPSD
6 Total PPD - - - - - - - -
7 Total CPC - - - 6.82 1.30 - - -
Name of OfficeLow tension linesSl.
No.
33kV charged at
Sl.
No.
33kV charged at
ABSTRACT
STATISTIC OF LINES FOR ENDING MARCH/2011
(Owned by the other Department/Agency like PHE, BSNL etc. but falls within the jurisdiction of the
Circle/Division)
Name of OfficeLow tension lines
STATISTIC OF LINES FOR ENDING MARCH/2011
(Owned & Maintained by Power & Electricity Department)
24

Champhai Power Circle Annual Report 2010-2011
KJS DOM COM IND AGRI
Public
Water
Works
Bulk
Supply
Public
LightingTotal
1 2 3 4 5 6 7 8 9 10 11
Mar, 2010 267 5171 107 3 0 0 4 44 5596 A
Mar, 2011 319 5338 111 3 0 0 4 46 5821 B
% increase 19.48 3.23 3.74 0.00 0.00 0.00 0.00 4.55 4.02 C
Mar, 2010 553 3263 54 1 0 0 4 40 3915 D
Mar, 2011 761 3479 59 1 0 0 6 40 4346 E
% increase 37.61 6.62 9.26 0.00 0.00 0.00 50.00 0.00 11.01 F
Mar, 2010 820 8434 161 4 0 0 8 84 9511 G
Mar, 2011 1080 8817 170 4 0 0 10 86 10167 H
% increase 31.71 4.54 5.59 0.00 0.00 0.00 25.00 2.38 6.90 I
Mar, 2010 118 6205 201 62 8 3 5 68 6670 J
Mar, 2011 264 6920 236 69 13 3 7 68 7580 K
% increase 123.73 11.52 17.41 11.29 62.50 0.00 40.00 0.00 13.64 L
Mar, 2010 137 4744 24 44 0 0 1 38 4988 M
Mar, 2011 90 4598 23 49 0 1 2 38 4801 N
% increase -34.31 -3.08 -4.17 11.36 0.00 0.00 100.00 0.00 -3.75 O
Mar, 2010 255 10949 225 106 8 3 6 106 11658 P
Mar, 2011 354 11518 259 118 13 4 9 106 12381 Q
% increase 38.82 5.20 15.11 11.32 62.50 33.33 50.00 0.00 6.20 R
Mar, 2010 1075 19383 386 110 8 3 14 190 21169 S
Mar, 2011 1434 20335 429 122 13 4 19 192 22548 T
% increase 33.40 4.91 11.14 10.91 62.50 33.33 35.71 1.05 6.51 U
Note:
Consumers under Champhai Power Circle
(as on 31st March 2010 & 2011)
Col. 3, 4, 5 - N : Reasons for decrease in consumers under Champhai Rural Power Sub-Division is due to the
handing over of two villages, i.e. Kelkang & Dilkawn to Champhai Power Sub-Division.
CATEGORYNam
e of
office
ParticularKhaw
zawl PSD
Ngopa PSD
Khaw
zawl PD
Cham
phai PSD
Rural PSD
PPD, C
ham
phai
Cham
phai PC
25

Sl
No.Name of Division
250kVA,
11/0.4kV
100kVA,
11/0.4kV
63kVA,
11/0.4kV
25kVA,
11/0.4kV
16kVA,
11/0.4kV
Office wise
Total
damage DT
Office wise
damage
percentage w.r.t.
Total damaged
DT
Office wise
Total DT of
various
ratings
Office wise
damaged
percentage w.r.t
Total DT
1 2 3 4 5 6 7 8 9 10 11
1 Champhai Power Sub-Division 1 2 1 4 26.67% 59 6.78%
2 Champhai Rural Power Sub-Division 2 2 4 26.67% 36 11.11%
3 Lamsial Project Sub-Division, Farkawn 0 0.00% 0.00%
4Total Power Project Division,
Champhai1 4 0 3 0 8 53.33% 95 8.42%
5 Khawzawl Power Sub-Division 1 1 2 13.33% 47 4.26%
6 Ngopa Power Sub-Division 1 4 5 33.33% 36 13.89%
7 Total Khawzawl Power Division 0 1 1 5 0 7 46.67% 83 8.43%
8 TOTAL CHAMPHAI POWER CIRCLE 1 5 1 8 0 15 178 8.43%
Rating-wiseTotal damage 1 5 1 8 0
Rating-wise damage % w.r.t damaged DT 0 33.33 6.67 53.33 0
26
Abstract of damaged Distribution Transformers during 2010-11
Champhai P
ower C
ircle A
nnual R
eport 2
010-2011


Name of Office: Champhai Power Circle Figures in ` ` ` ` Lakhs
1 2 3 4 5 6 7 8 9 10 11
Qtr P/NP (01) SALARY (06) M R ( 11 ) T E (13) O E (14) RENT (16) PUB (26) ADVT (51) MV Total
Plan 0.30000 0.16800 0.30000 0.76800
Non-Plan 7.78666 0.75000 0.26218 0.25200 9.05084
Total 7.78666 0.75000 0.26218 0.30000 0.16800 - 0.25200 0.30000 9.81884
Plan 0.17295 0.30000 0.16800 0.20000 0.58000 1.42095
Non-Plan 8.80802 0.75000 9.55802
Total 8.80802 0.75000 0.17295 0.30000 0.16800 0.20000 - 0.58000 10.97897
Plan 0.10445 0.40000 0.16800 0.29760 0.40000 1.37005
Non-Plan 14.62100 0.80000 15.42100
Total 14.62100 0.80000 0.10445 0.40000 0.16800 - 0.29760 0.40000 16.79105
Plan 0.50000 0.16800 0.30000 0.96800
Non-Plan 12.00023 1.02173 0.40000 0.30000 13.72196
Total 12.00023 1.02173 0.50000 0.40000 0.16800 - 0.30000 0.30000 14.68996
43.21591 3.32173 1.03958 1.40000 0.67200 0.20000 0.84960 1.58000 52.27882 Total for the year
1st Q
uar
ter
(Apr-
Jun, 20
09)
2nd Q
uar
ter
(Jul-Sep
, 20
09)
3rd Q
uar
ter
(Oct
-Dec
, 20
09)
4th Q
uar
ter
(Jan
-Mar
, 20
10)
29
Champhai P
ower C
ircle A
nnual R
eport 2
010-2011
Quarterly Expenditure on D&A during 2010-2011
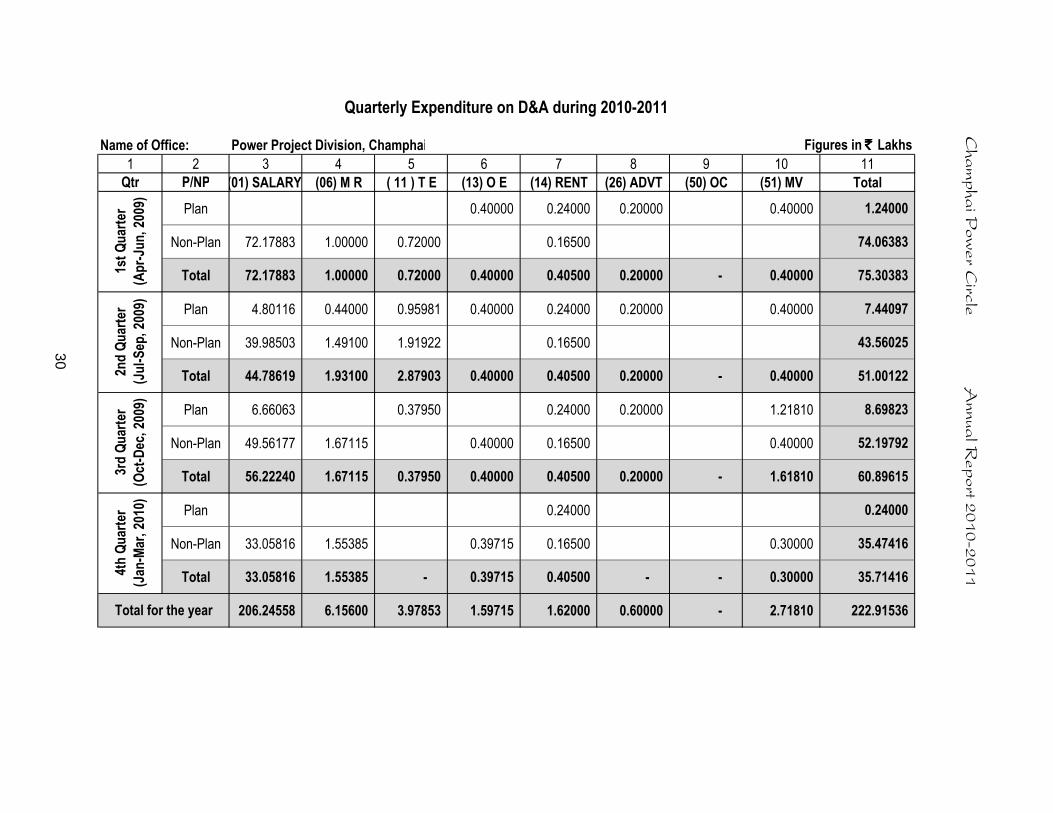
Name of Office: Power Project Division, Champhai Figures in ` ` ` ` Lakhs
1 2 3 4 5 6 7 8 9 10 11
Qtr P/NP (01) SALARY (06) M R ( 11 ) T E (13) O E (14) RENT (26) ADVT (50) OC (51) MV Total
Plan 0.40000 0.24000 0.20000 0.40000 1.24000
Non-Plan 72.17883 1.00000 0.72000 0.16500 74.06383
Total 72.17883 1.00000 0.72000 0.40000 0.40500 0.20000 - 0.40000 75.30383
Plan 4.80116 0.44000 0.95981 0.40000 0.24000 0.20000 0.40000 7.44097
Non-Plan 39.98503 1.49100 1.91922 0.16500 43.56025
Total 44.78619 1.93100 2.87903 0.40000 0.40500 0.20000 - 0.40000 51.00122
Plan 6.66063 0.37950 0.24000 0.20000 1.21810 8.69823
Non-Plan 49.56177 1.67115 0.40000 0.16500 0.40000 52.19792
Total 56.22240 1.67115 0.37950 0.40000 0.40500 0.20000 - 1.61810 60.89615
Plan 0.24000 0.24000
Non-Plan 33.05816 1.55385 0.39715 0.16500 0.30000 35.47416
Total 33.05816 1.55385 - 0.39715 0.40500 - - 0.30000 35.71416
206.24558 6.15600 3.97853 1.59715 1.62000 0.60000 - 2.71810 222.91536
1st Q
uar
ter
(Apr-
Jun, 20
09)
2nd Q
uar
ter
(Jul-Sep
, 20
09)
3rd Q
uar
ter
(Oct
-Dec
, 20
09)
4th Q
uar
ter
(Jan
-Mar
, 20
10)
30
Champhai P
ower C
ircle A
nnual R
eport 2
010-2011
Total for the year
Quarterly Expenditure on D&A during 2010-2011

Name of Office: Khawzawl Power Division, Khawzawl Figures in ` ` ` ` Lakhs
1 2 3 4 5 6 7 8 9 10 11
Qtr P/NP (01) SALARY (06) M R ( 11 ) T E (13) O E (14) RENT (26) ADVT (50) OC (51) MV Total
Plan -
Non-Plan 40.94415 0.97292 0.95308 0.40000 0.40000 43.67015
Total 40.94415 0.97292 0.95308 0.40000 - - - 0.40000 43.67015
Plan 0.50974 0.40000 0.40000 1.30974
Non-Plan 30.42832 0.49167 30.91999
Total 30.42832 0.49167 0.50974 0.40000 - - - 0.40000 32.22973
Plan 0.57932 1.00000 1.57932
Non-Plan 47.27013 0.76550 0.40000 0.40000 48.83563
Total 47.27013 0.76550 0.57932 1.40000 - - - 0.40000 50.41495
Plan 1.00000 2.10000 3.10000
Non-Plan 27.24911 1.57537 0.40000 0.30000 29.52448
Total 27.24911 1.57537 - 1.40000 - - 2.10000 0.30000 32.62448
145.89171 3.80546 2.04214 3.60000 - - 2.10000 1.50000 158.93931
1st Q
uar
ter
(Apr-
Jun, 20
09)
2nd Q
uar
ter
(Jul-Sep
, 20
09)
3rd Q
uar
ter
(Oct
-Dec
, 20
09)
4th Q
uar
ter
(Jan
-Mar
, 20
10)
31
Champhai P
ower C
ircle A
nnual R
eport 2
010-2011
Total for the year
Quarterly Expenditure on D&A during 2010-2011

Champhai Power Circle Annual report 2010-2011
-
50.00
100.00
150.00
200.00
250.00
PPD KPD CPC
92.52% 91.79%82.67%
Expenditure on salary (Green in ` lakhs)` lakhs)` lakhs)` lakhs) and % Expenditure on salary with respect to Total D&A (Red)
205.30
152.95
47.75
17.62
5.99 4.53
-
50.00
100.00
150.00
200.00
250.00
PPD KPD CPC
Expenditure on D&A during 2010-2011
Non-Plan
Plan
Name of Office
Name of Office
` ` ` ` (L
akh
s)
32


Champhai Power Circle Annual Report 2010-2011
Figures in kWh
MonthLamsial SHP (2X250 kW)
Tuipui Tuipui (2X250 kW)
TOTAL
1 2 3 4
Apr '09 16545 16545
May '09 11407 11407
Jun '09 5490.5 247996 253486.5
Jul '09 74938 74938 149876
Aug '09 23351 23351 46702
Sep '09 49503 49503 99006
Oct '09 0
Nov '09 76028 76028
Dec '09 36479 36479
Jan '10 3529 3529
Feb '10 0
Mar '10 0
Total (kWh) 153282.5 539776 693058.5
Total (MU) 0.15 0.54 0.69
LOCAL GENERATION (NET) DURING 2010-2011
35

Champhai Power Circle Annual Report 2010-2011
Month & Year
Set No-1 Total
Generation
(kWh)
Set No-2 Total
Generation
(kWh)
TOTAL
Auxiliary
Consumption
(kWh)
Net Generation
(kWh)
1 2 3 4 5 6
Apr-08 0 0 0 0 0
May-08 0 0 0 0 0
Jun-08 0 0 0 0 0
Jul-08 137520 138880 276400 5977 270423
Aug-08 167340 164250 331590 2850 328740
Sep-08 178410 176450 354860 2934 351926
Oct-08 123180 118270 241450 2204 239246
Nov-08 83900 32140 116040 1542 114498
Dec-08 340 2140 2480 539 1941
Jan-09 2090 350 2440 297 2143
Feb-09 0 0 0 0 0
Mar-09 0 0 0 0 0
Total 692780 632480 1325260 16343 1308917
Month & Year
Set No-1 Total
Generation
(kWh)
Set No-2 Total
Generation
(kWh)
TOTAL
Auxiliary
Consumption
(kWh)
Net Generation
(kWh)
1 2 3 4 5 6
Apr-08 0 0 0 0 0
May-08 0 0 0 0 0
Jun-08 18580 21890 40470 4103 36367
Jul-08 124150 126550 250700 4735 245965
Aug-08 146689 126784 273473 5104 268369
Sep-08 130760 142962 273722 5312 260410
Oct-08 165223 146080 311303 5326 305977
Nov-08 48193 41253 89446 2358 87088
Dec-08 12902 0 12902 1045 11857
Jan-09 1089 0 1089 582 507
Feb-09 0 0 0 0 0
Mar-09 0 0 0 0 0
Total 647586 605519 1253105 28565 1216540
MONTHLY GENERATION DATA FOR TUIPUI SHP 2008-2009
MONTHLY GENERATION DATA FOR TUIPUI SHP 2009-2010
36
Champhai Power Circle Annual Report 2010-2011
Month & Year
Set No-1 Total
Generation
(kWh)
Set No-2 Total
Generation
(kWh)
TOTAL
Auxiliary
Consumption
(kWh)
Net Generation
(kWh)
1 2 3 4 5 6
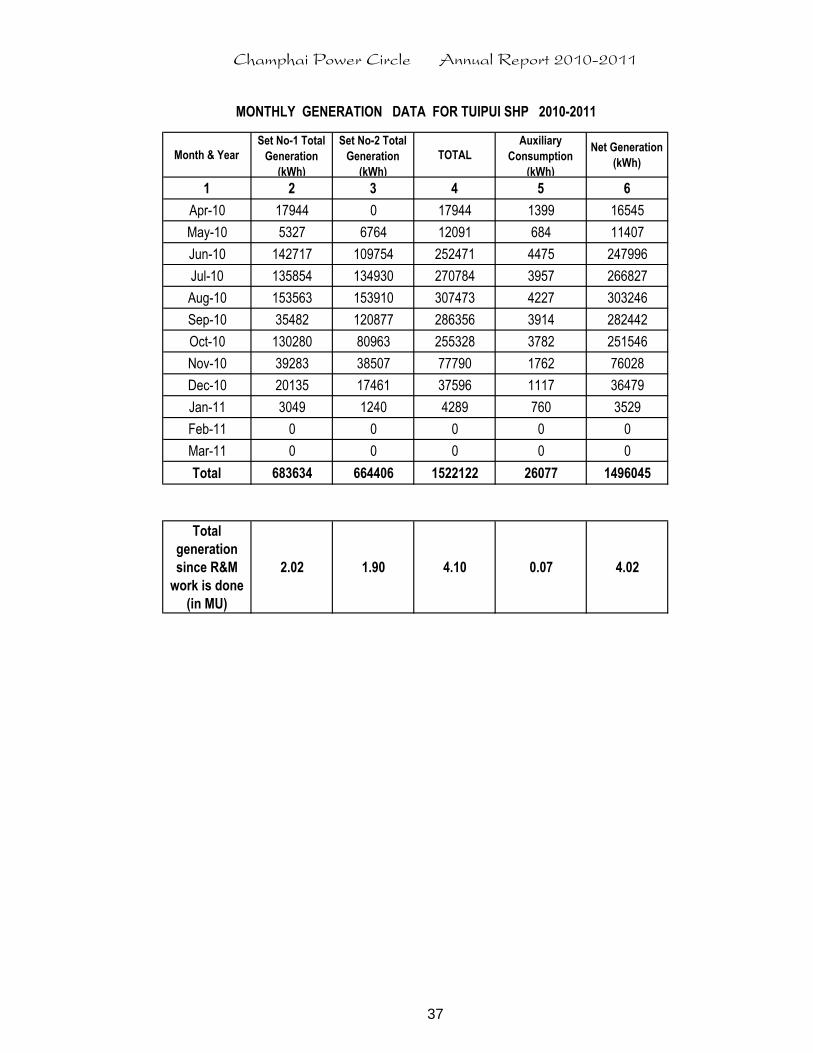
Apr-10 17944 0 17944 1399 16545
May-10 5327 6764 12091 684 11407
Jun-10 142717 109754 252471 4475 247996
Jul-10 135854 134930 270784 3957 266827
Aug-10 153563 153910 307473 4227 303246
Sep-10 35482 120877 286356 3914 282442
Oct-10 130280 80963 255328 3782 251546
Nov-10 39283 38507 77790 1762 76028
Dec-10 20135 17461 37596 1117 36479
Jan-11 3049 1240 4289 760 3529
Feb-11 0 0 0 0 0
Mar-11 0 0 0 0 0
Total 683634 664406 1522122 26077 1496045
Total
generation
since R&M
work is done
(in MU)
2.02 1.90 4.10 0.07 4.02
MONTHLY GENERATION DATA FOR TUIPUI SHP 2010-2011
37
Champhai Power Circle Annual Report 2010-2011
Month & Year
Set No-1 Total
Generation
(kWh)
Set No-2 Total
Generation
(kWh)
TOTAL
Auxiliary
Consumption
(kWh)
Net Generation
(kWh)
1 2 3 4 5 6
Apr-08 0 0 0 0 0
May-08 0 0 0 0 0
Jun-08 0 0 0 0 0
Jul-08 0 0 0 0 0
Aug-08 0 0 0 0 0
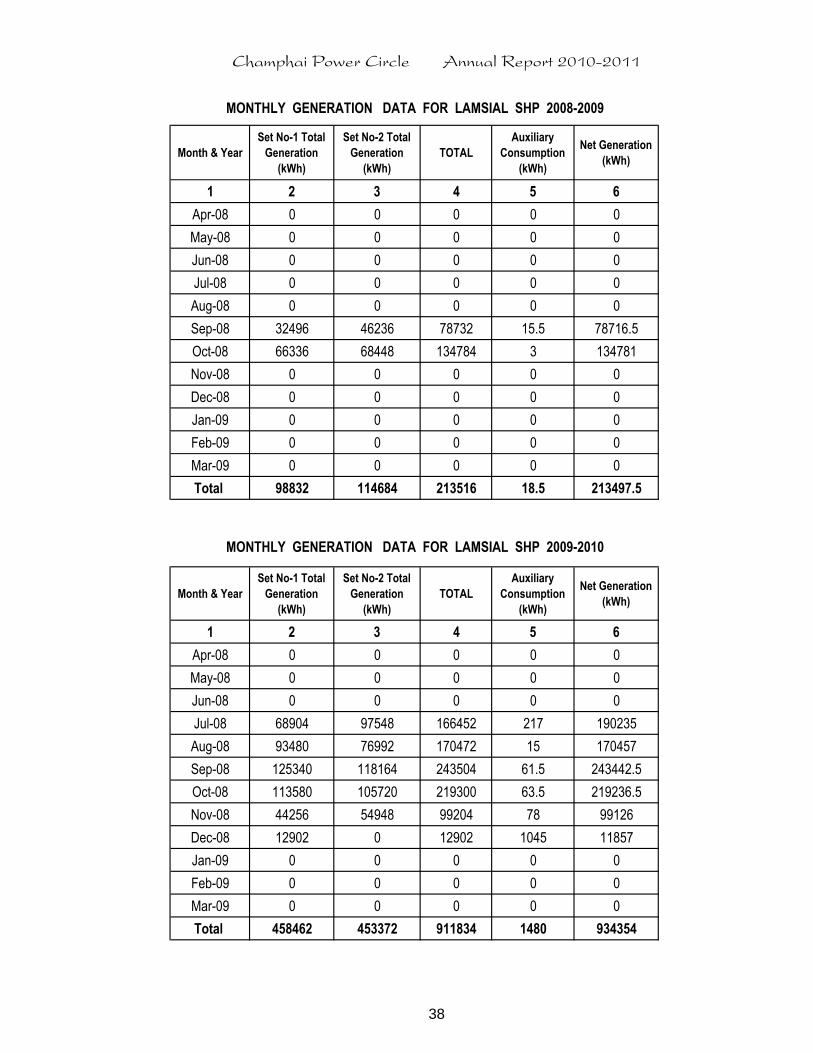
Sep-08 32496 46236 78732 15.5 78716.5
Oct-08 66336 68448 134784 3 134781
Nov-08 0 0 0 0 0
Dec-08 0 0 0 0 0
Jan-09 0 0 0 0 0
Feb-09 0 0 0 0 0
Mar-09 0 0 0 0 0
Total 98832 114684 213516 18.5 213497.5
Month & Year
Set No-1 Total
Generation
(kWh)
Set No-2 Total
Generation
(kWh)
TOTAL
Auxiliary
Consumption
(kWh)
Net Generation
(kWh)
1 2 3 4 5 6
Apr-08 0 0 0 0 0
May-08 0 0 0 0 0
Jun-08 0 0 0 0 0
Jul-08 68904 97548 166452 217 190235
Aug-08 93480 76992 170472 15 170457
Sep-08 125340 118164 243504 61.5 243442.5
Oct-08 113580 105720 219300 63.5 219236.5
Nov-08 44256 54948 99204 78 99126
Dec-08 12902 0 12902 1045 11857
Jan-09 0 0 0 0 0
Feb-09 0 0 0 0 0
Mar-09 0 0 0 0 0
Total 458462 453372 911834 1480 934354
MONTHLY GENERATION DATA FOR LAMSIAL SHP 2008-2009
MONTHLY GENERATION DATA FOR LAMSIAL SHP 2009-2010
38

Champhai Power Circle Annual Report 2010-2011
Month & Year
Set No-1 Total
Generation
(kWh)
Set No-2 Total
Generation
(kWh)
TOTAL
Auxiliary
Consumption
(kWh)
Net Generation
(kWh)
1 2 3 4 5 6
Apr-10 0 0 0 0 0
May-10 0 0 0 0 0
Jun-10 0 5592 5592 101.5 5490.5
Jul-10 0 75000 75000 62 74938
Aug-10 0 23352.0 23352.0 1.0 23351.0
Sep-10 0 49524 49524 21.0 49503
Oct-10 0 0 0 0 0
Nov-10 0 0.00 0.00 0.00 0.00
Dec-10 0 0 0 0 0
Jan-11 0.00 0.00 0.00 0.00 0.00
Feb-11 0.00 0.00 0.00 0.00 0.00
Mar-11 0.00 0.00 0.00 0.00 0.00
Total 0 153468 153468 185.5 153282.5
Total
generation
accumulated
(in MU)
0.56 0.72 1.28 0.00 1.30
MONTHLY GENERATION DATA FOR LAMSIAL SHP 2010-2011
39

` ` ` ` in Lakhs
Apr '10 May '10 Jun '10 Jul '10 Aug '10 Sep '10 Oct '10 Nov '10 Dec' 10 Jan '11 Feb '11 Mar '11 Total %
1 2 3 4 5 6 7 8 9 10 11 12 13 14 15 16
Champhai Power
Sub Division177.00 10.91 9.52 10.30 11.38 11.85 12.67 10.54 11.28 13.55 - 26.06 92.26 220.31 124.47
Champhai Rural
Power Sub Division47.48 2.92 2.24 2.90 3.33 2.91 3.50 3.81 3.26 2.93 3.99 3.41 9.83 45.02 94.82
Total PPD,
Champhai224.48 13.83 11.76 13.20 14.71 14.75 16.17 14.35 14.54 16.47 3.99 29.47 102.09 265.33 118.20
Misc. Receipt 1.03 1.09 1.13 1.06 1.15 1.06 0.98 1.08 1.03 0.35 1.68 1.00 12.63
Total receipt 14.85 12.86 14.33 15.77 15.90 17.23 15.33 15.62 17.50 4.33 31.14 103.08 277.96 123.82
Khawzawl Power
Sub Division78.14 4.40 4.74 4.86 4.22 4.83 5.57 5.36 5.66 6.07 6.04 5.86 17.06 74.66 95.55
Ngopa Power Sub
Division52.09 3.03 2.69 2.73 2.45 2.99 3.72 3.30 3.25 3.53 3.59 3.85 10.76 45.91 88.13
Total KPD,
Khawzawl130.23 7.43 7.43 7.59 6.67 7.82 9.30 8.66 8.91 9.60 9.63 9.71 27.82 120.57 92.58
Misc. Receipt 0.78 0.92 0.91 0.88 0.89 0.89 0.91 0.89 0.90 0.81 1.01 1.11 10.89
Total receipt 8.22 8.34 8.50 7.55 8.70 10.18 9.57 9.80 10.50 10.44 10.71 28.93 131.46 100.95
Total CPC 354.71 21.26 19.19 20.79 21.38 22.57 25.47 23.01 23.45 26.08 13.62 39.18 129.91 385.90 108.79
Total Misc. Receipt 1.81 2.01 2.05 1.94 2.04 1.94 1.89 1.97 1.93 1.16 2.68 2.11 23.52
Total receipt 23.07 21.20 22.84 23.32 24.61 27.41 24.90 25.42 28.00 14.78 41.86 132.01 409.42 115.42
40
Champhai P
ower C
ircle A
nnual R
eport 2
010-2011
Sub-Division/Division TargetAchievement ( `̀̀̀ )
SUB-DIVISION WISE REVENUE TARGET & ACHIEVEMENT (2010-11)

` in lakhs
Apr May Jun Jul Aug Sep Oct Nov Dec Jan Feb Mar Total
1 2 3 4 5 6 7 8 9 10 11 12 13 14 15
2010-11 10.91 9.52 10.30 11.38 11.85 12.67 10.54 11.28 13.55 - 26.06 92.26 220.31
2009-10 7.94 8.84 8.76 8.11 9.05 8.78 10.82 9.96 10.03 10.46 11.06 60.43 164.24
2010-11 2.92 2.24 2.90 3.33 2.91 3.50 3.81 3.26 2.93 3.99 3.41 9.83 45.02
2009-10 2.90 2.23 2.58 2.51 2.49 3.14 3.15 3.41 2.84 4.17 3.00 8.34 40.75
2010-11 13.83 11.76 13.20 14.71 14.75 16.17 14.35 14.54 16.47 3.99 29.47 102.09 265.33
2009-10 10.85 11.07 11.34 10.62 11.54 11.92 13.97 13.36 12.87 14.63 14.06 68.77 204.99
2010-11 4.40 4.74 4.86 4.22 4.83 5.57 5.36 5.66 6.07 6.04 5.86 17.06 74.66
2009-10 4.49 3.83 4.32 4.17 4.87 4.24 5.35 4.68 5.03 4.72 5.06 14.11 64.88
2010-11 3.03 2.69 2.73 2.45 2.99 3.72 3.30 3.25 3.53 3.59 3.85 10.76 45.91
2009-10 1.94 2.39 2.81 2.43 2.63 2.75 2.83 3.56 2.97 3.60 3.28 11.26 42.44
2010-11 7.43 7.43 7.59 6.67 7.82 9.30 8.66 8.91 9.60 9.63 9.71 27.82 120.57
2009-10 6.43 6.22 7.13 6.59 7.50 6.99 8.18 8.24 8.00 8.32 8.35 25.37 107.32
2010-11 21.26 19.19 20.79 21.38 22.57 25.47 23.01 23.45 26.08 13.62 39.18 129.91 385.90
2009-10 17.28 17.29 18.46 17.21 19.04 18.91 22.15 21.60 20.87 22.95 22.41 94.14 312.31
Champhai P
ower C
ircle A
nnual R
eport 2
010-2011
41
Total CPC (Increased by 23.57%)
COMPARISION OF SUB-DIVISION WISE REVENUE COLLECTION (2009-10 & 2010-11)
Name of office PeriodRevenue Collection from sale of energy only excluding miscellaneous receipt ( ` )
Champhai Power Sub
Division
(Increased by 34.14%)
Champhai Rural Power
Sub Division
(Increased by 10.48%)
Total PPD,
Champhai (Increased by 29.44%)
Khawzawl Power Sub
Division
(Increased by 15.08%)
Ngopa Power Sub
Division
(Increased by 8.17%)
Total KPD,
Khawzawl (Increased by 12.35%)
Input Sold % Loss Amount (`)Efficiency
(%)Amount (`)
Efficiency
(%)Billed Realised
1 2 3 4 5 6 7 8 9 10 11 12
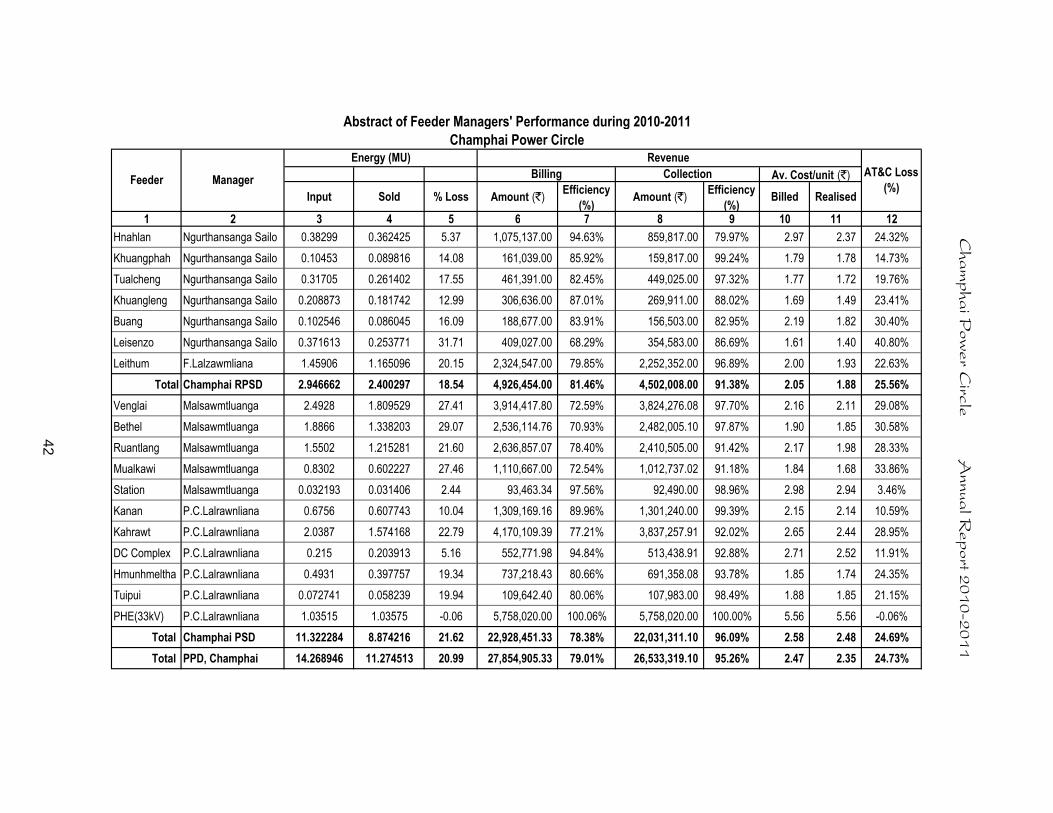
Hnahlan Ngurthansanga Sailo 0.38299 0.362425 5.37 1,075,137.00 94.63% 859,817.00 79.97% 2.97 2.37 24.32%
Khuangphah Ngurthansanga Sailo 0.10453 0.089816 14.08 161,039.00 85.92% 159,817.00 99.24% 1.79 1.78 14.73%
Tualcheng Ngurthansanga Sailo 0.31705 0.261402 17.55 461,391.00 82.45% 449,025.00 97.32% 1.77 1.72 19.76%
Khuangleng Ngurthansanga Sailo 0.208873 0.181742 12.99 306,636.00 87.01% 269,911.00 88.02% 1.69 1.49 23.41%
Buang Ngurthansanga Sailo 0.102546 0.086045 16.09 188,677.00 83.91% 156,503.00 82.95% 2.19 1.82 30.40%
Leisenzo Ngurthansanga Sailo 0.371613 0.253771 31.71 409,027.00 68.29% 354,583.00 86.69% 1.61 1.40 40.80%
Leithum F.Lalzawmliana 1.45906 1.165096 20.15 2,324,547.00 79.85% 2,252,352.00 96.89% 2.00 1.93 22.63%
Total Champhai RPSD 2.946662 2.400297 18.54 4,926,454.00 81.46% 4,502,008.00 91.38% 2.05 1.88 25.56%
Venglai Malsawmtluanga 2.4928 1.809529 27.41 3,914,417.80 72.59% 3,824,276.08 97.70% 2.16 2.11 29.08%
Bethel Malsawmtluanga 1.8866 1.338203 29.07 2,536,114.76 70.93% 2,482,005.10 97.87% 1.90 1.85 30.58%
Ruantlang Malsawmtluanga 1.5502 1.215281 21.60 2,636,857.07 78.40% 2,410,505.00 91.42% 2.17 1.98 28.33%
Mualkawi Malsawmtluanga 0.8302 0.602227 27.46 1,110,667.00 72.54% 1,012,737.02 91.18% 1.84 1.68 33.86%
Station Malsawmtluanga 0.032193 0.031406 2.44 93,463.34 97.56% 92,490.00 98.96% 2.98 2.94 3.46%
Kanan P.C.Lalrawnliana 0.6756 0.607743 10.04 1,309,169.16 89.96% 1,301,240.00 99.39% 2.15 2.14 10.59%
Kahrawt P.C.Lalrawnliana 2.0387 1.574168 22.79 4,170,109.39 77.21% 3,837,257.91 92.02% 2.65 2.44 28.95%
DC Complex P.C.Lalrawnliana 0.215 0.203913 5.16 552,771.98 94.84% 513,438.91 92.88% 2.71 2.52 11.91%
Hmunhmeltha P.C.Lalrawnliana 0.4931 0.397757 19.34 737,218.43 80.66% 691,358.08 93.78% 1.85 1.74 24.35%
Tuipui P.C.Lalrawnliana 0.072741 0.058239 19.94 109,642.40 80.06% 107,983.00 98.49% 1.88 1.85 21.15%
PHE(33kV) P.C.Lalrawnliana 1.03515 1.03575 -0.06 5,758,020.00 100.06% 5,758,020.00 100.00% 5.56 5.56 -0.06%
Total Champhai PSD 11.322284 8.874216 21.62 22,928,451.33 78.38% 22,031,311.10 96.09% 2.58 2.48 24.69%
Total PPD, Champhai 14.268946 11.274513 20.99 27,854,905.33 79.01% 26,533,319.10 95.26% 2.47 2.35 24.73%
Champhai Power Circle
Abstract of Feeder Managers' Performance during 2010-2011
Revenue Energy (MU)
Av. Cost/unit (`)Feeder Manager
42
Champhai P
ower C
ircle A
nnual R
eport 2
010-2011
Billing Collection AT&C Loss
(%)
Input Sold % Loss Amount (`)Efficiency
(%)Amount (`)
Efficiency
(%)Billed Realised
1 2 3 4 5 6 7 8 9 10 11 12
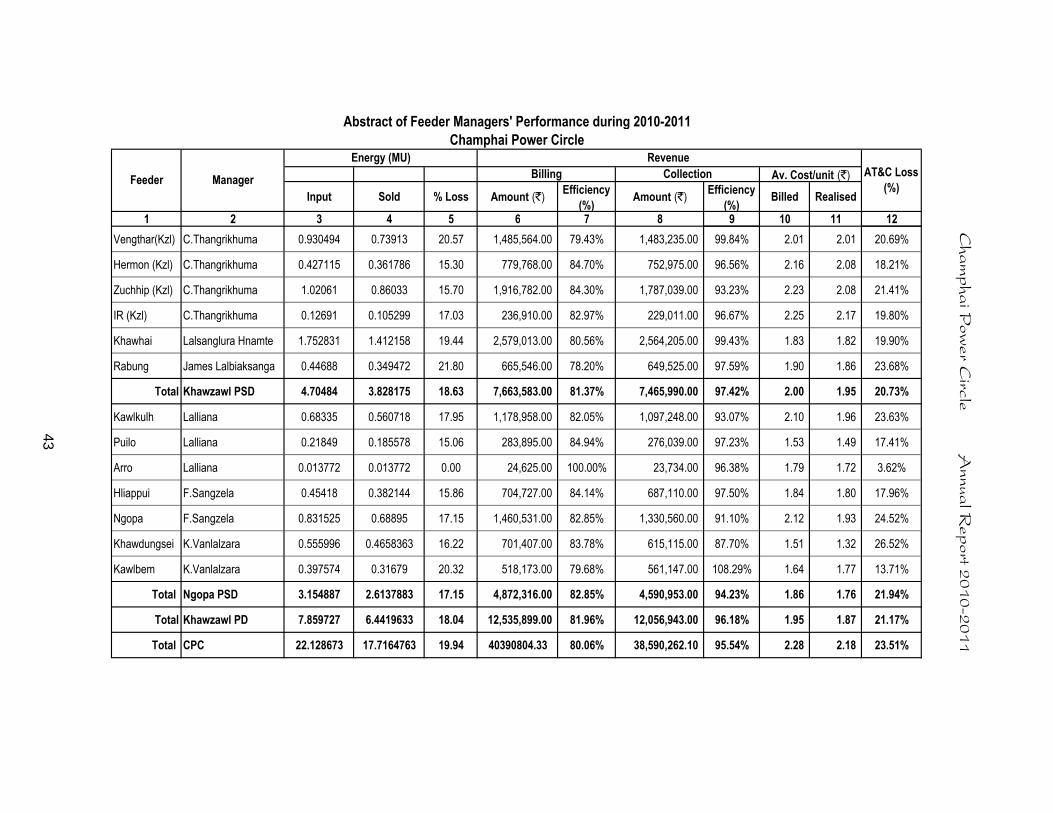
Champhai Power Circle
Abstract of Feeder Managers' Performance during 2010-2011
Revenue Energy (MU)
Av. Cost/unit (`)Feeder ManagerBilling Collection AT&C Loss
(%)
Vengthar(Kzl) C.Thangrikhuma 0.930494 0.73913 20.57 1,485,564.00 79.43% 1,483,235.00 99.84% 2.01 2.01 20.69%
Hermon (Kzl) C.Thangrikhuma 0.427115 0.361786 15.30 779,768.00 84.70% 752,975.00 96.56% 2.16 2.08 18.21%
Zuchhip (Kzl) C.Thangrikhuma 1.02061 0.86033 15.70 1,916,782.00 84.30% 1,787,039.00 93.23% 2.23 2.08 21.41%
IR (Kzl) C.Thangrikhuma 0.12691 0.105299 17.03 236,910.00 82.97% 229,011.00 96.67% 2.25 2.17 19.80%
Khawhai Lalsanglura Hnamte 1.752831 1.412158 19.44 2,579,013.00 80.56% 2,564,205.00 99.43% 1.83 1.82 19.90%
Rabung James Lalbiaksanga 0.44688 0.349472 21.80 665,546.00 78.20% 649,525.00 97.59% 1.90 1.86 23.68%
Total Khawzawl PSD 4.70484 3.828175 18.63 7,663,583.00 81.37% 7,465,990.00 97.42% 2.00 1.95 20.73%
Kawlkulh Lalliana 0.68335 0.560718 17.95 1,178,958.00 82.05% 1,097,248.00 93.07% 2.10 1.96 23.63%
Puilo Lalliana 0.21849 0.185578 15.06 283,895.00 84.94% 276,039.00 97.23% 1.53 1.49 17.41%
Arro Lalliana 0.013772 0.013772 0.00 24,625.00 100.00% 23,734.00 96.38% 1.79 1.72 3.62%
Hliappui F.Sangzela 0.45418 0.382144 15.86 704,727.00 84.14% 687,110.00 97.50% 1.84 1.80 17.96%
Ngopa F.Sangzela 0.831525 0.68895 17.15 1,460,531.00 82.85% 1,330,560.00 91.10% 2.12 1.93 24.52%
Khawdungsei K.Vanlalzara 0.555996 0.4658363 16.22 701,407.00 83.78% 615,115.00 87.70% 1.51 1.32 26.52%
Kawlbem K.Vanlalzara 0.397574 0.31679 20.32 518,173.00 79.68% 561,147.00 108.29% 1.64 1.77 13.71%
Total Ngopa PSD 3.154887 2.6137883 17.15 4,872,316.00 82.85% 4,590,953.00 94.23% 1.86 1.76 21.94%
Total Khawzawl PD 7.859727 6.4419633 18.04 12,535,899.00 81.96% 12,056,943.00 96.18% 1.95 1.87 21.17%
Total CPC 22.128673 17.7164763 19.94 40390804.33 80.06% 38,590,262.10 95.54% 2.28 2.18 23.51%
Champhai P
ower C
ircle A
nnual R
eport 2
010-2011
43

Fdr Mgr Apr-10 May-10 Jun-10 Jul-10 Aug-10 Sep-10 Oct-10 Nov-10 Dec-10 Jan-11 Feb-11 Mar-11 Annual
Energy Input (MU) 0.068050 0.062440 0.066300 0.060185 0.069659 0.072745 0.077993 0.083209 0.083260 0.082481 0.083033 0.121139 0.930494
Energy sold (MU) 0.053442 0.050612 0.053227 0.051999 0.056539 0.056706 0.062519 0.064946 0.066871 0.065877 0.064512 0.091880 0.739130
Revenue billed (`) 104,711 97,427 102,233 97,062 103,899 112,397 124,828 129,987 125,047 127,990 127,427 205,310 1,458,318
Arrear billed (̀ ) 9,364 36,669 36,469 41,935 61,865 65,200 70,533 85,667 106,843 119,147 126,855 132,385 9,364
Surcharge (̀ ) 188 733 730 839 1,237 1,305 1,411 1,713 2,137 2,384 2,536 2,669 17,882
Total Billed (`) 114,263 134,829 139,432 139,836 167,001 178,902 196,772 217,367 234,027 249,521 256,818 340,364 1,485,564
Amt. Realised (`) 77,594 98,360 97,497 77,971 101,801 108,369 111,105 110,524 115,780 122,666 124,433 337,135 1,483,235
Billing Efficiency 78.53% 81.06% 80.28% 86.40% 81.17% 77.95% 80.16% 78.05% 80.32% 79.87% 77.69% 75.85% 79.43%
Collection Efficiency 67.91% 72.95% 69.92% 55.76% 60.96% 60.57% 56.46% 50.85% 49.47% 49.16% 48.45% 99.05% 99.84%
AT&C Loss 46.67% 40.87% 43.86% 51.83% 50.52% 52.78% 54.74% 60.31% 60.27% 60.74% 62.36% 24.87% 20.69%
Outages (No) 3 15 24 16 20 4 10 10 3 1 106
Duration (hr:m:s) 9:15:00 9:40:00 30:46:00 54:40:00 24:52:00 5:44:00 8:23:00 10:27:00 5:50:00 0:15:00 159:52:00
Reliability Index 99% 99% 96% 93% 97% 99% 100% 99% 99% 99% 100% 100% 98.18%
Energy Input (MU) 0.032453 0.028546 0.032166 0.028802 0.033322 0.033045 0.034205 0.036186 0.037841 0.038227 0.037755 0.054567 0.427115
Energy sold (MU) 0.028256 0.026870 0.026563 0.024501 0.029580 0.027230 0.029044 0.030546 0.031987 0.031869 0.030679 0.044661 0.361786
Revenue billed (`) 59,709 55,738 53,953 50,896 60,982 56,135 58,920 60,994 63,584 63,010 63,037 97,103 744,061
Arrear billed (̀ ) 18,089 28,388 40,057 40,695 51,685 69,200 72,800 88,127 100,275 116,851 123,513 131,023 18,089
Surcharge (̀ ) 362 568 801 815 1,035 1,384 1,457 1,762 2,006 2,337 2,470 2,621 17,618
Total Billed (`) 78,160 84,694 94,811 92,406 113,702 126,719 133,177 150,883 165,865 182,198 189,020 230,747 779,768
Amt. Realised (`) 49,772 44,637 54,116 40,721 44,502 53,919 45,050 50,608 49,094 58,685 57,997 203,874 752,975
Billing Efficiency 87.07% 94.13% 82.58% 85.07% 88.77% 82.40% 84.91% 84.41% 84.53% 83.37% 81.26% 81.85% 84.70%
Collection Efficiency 63.68% 52.70% 57.08% 44.07% 39.14% 42.55% 33.83% 33.54% 29.60% 32.21% 30.68% 88.35% 96.56%
AT&C Loss 44.56% 50.39% 52.86% 62.51% 65.26% 64.94% 71.28% 71.69% 74.98% 73.15% 75.07% 27.69% 18.21%
Outages (No) 2 15 23 19 19 5 10 9 3 7 112
Duration (hr:m:s) 8:51:00 19:05:00 28:36:00 54:06:00 23:18:00 7:43:00 9:33:00 12:25:00 0:43:00 7:20:00 171:40:00
Reliability Index 99% 97% 96% 93% 97% 99% 100% 99% 98% 100% 100% 99% 98.04%
Khawzawl Power Sub-Division
MONTHWISE PERFORMANCE OF FEEDER MANAGERS DURING 2010-2011
C.T
han
grikh
um
a, JE
Ven
gth
ar (Kh
awzaw
l)
C.T
han
grikh
um
a, JE
Herm
on
(Kh
awzaw
l)
44
Champhai P
ower C
ircle A
nnual R
eport 2
010-2011

Fdr Mgr Apr-10 May-10 Jun-10 Jul-10 Aug-10 Sep-10 Oct-10 Nov-10 Dec-10 Jan-11 Feb-11 Mar-11 Annual
Khawzawl Power Sub-Division
MONTHWISE PERFORMANCE OF FEEDER MANAGERS DURING 2010-2011
Energy Input (MU) 0.074092 0.072123 0.075247 0.064678 0.077390 0.079791 0.084171 0.090275 0.093892 0.096197 0.088065 0.124689 1.020610
Energy sold (MU) 0.060776 0.062036 0.061815 0.063817 0.064438 0.063628 0.072368 0.080156 0.076877 0.076731 0.081734 0.095954 0.860330
Revenue billed (`) 134,003 139,116 137,314 139,378 138,467 144,074 159,713 179,498 169,075 179,479 143,258 208,029 1,871,404
Arrear billed (̀ ) 8,504 34,284 67,999 81,294 125,718 140,809 137,448 167,922 225,363 246,107 291,432 316,701 8,504
Surcharge (̀ ) 170 686 1,360 1,626 2,514 2,816 2,749 3,359 4,507 4,922 5,830 6,335 36,874
Total Billed (`) 142,677 174,086 206,673 222,298 266,699 287,699 299,910 350,779 398,945 430,508 440,520 531,065 1,916,782
Amt. Realised (`) 108,393 106,087 125,379 96,580 125,890 150,251 131,988 125,416 152,838 139,076 123,819 401,322 1,787,039
Billing Efficiency 82.03% 86.01% 82.15% 98.67% 83.26% 79.74% 85.98% 88.79% 81.88% 79.76% 92.81% 76.95% 84.30%
Collection Efficiency 75.97% 60.94% 60.67% 43.45% 47.20% 52.23% 44.01% 35.75% 38.31% 32.31% 28.11% 75.57% 93.23%
AT&C Loss 37.68% 47.58% 50.16% 57.13% 60.70% 58.35% 62.16% 68.25% 68.63% 74.23% 73.91% 41.85% 21.41%
Outages (No) 3 17 19 18 18 3 1 11 14 2 106
Duration (hr:m:s) 4:31:00 15:50:00 53:37:00 55:47:00 22:24:00 2:08:00 3:04:00 8:28:00 13:12:00 1:20:00 180:21:00
Reliability Index 99% 98% 93% 93% 97% 100% 100% 99% 98% 100% 100% 100% 97.94%
Energy Input (MU) 0.009020 0.007740 0.008670 0.008090 0.009040 0.009460 0.010220 0.010710 0.010840 0.011700 0.012800 0.018620 0.126910
Energy sold (MU) 0.007624 0.007462 0.007482 0.006301 0.007419 0.007476 0.008205 0.008761 0.008647 0.011061 0.010936 0.013925 0.105299
Revenue billed (`) 15,551 15,399 14,713 14,227 15,214 15,976 15,170 18,666 17,983 20,452 25,935 43,443 232,729
Arrear billed (̀ ) 564 4,618 5,534 8,337 11,249 13,227 15,386 17,872 22,687 24,350 25,597 30,648 564
Surcharge (̀ ) 11 92 111 167 225 265 308 358 454 487 526 613 3,617
Total Billed (`) 16,126 20,109 20,358 22,731 26,688 29,468 30,864 36,896 41,124 45,289 52,058 74,704 236,910
Amt. Realised (`) 11,508 14,575 12,021 11,482 13,461 14,082 12,992 14,209 16,774 19,692 21,410 66,805 229,011
Billing Efficiency 84.52% 96.41% 86.30% 77.89% 82.07% 79.03% 80.28% 81.80% 79.77% 94.54% 85.44% 74.79% 82.97%
Collection Efficiency 71.36% 72.48% 59.05% 50.51% 50.44% 47.79% 42.09% 38.51% 40.79% 43.48% 41.13% 89.43% 96.67%
AT&C Loss 39.68% 30.12% 49.04% 60.66% 58.61% 62.23% 66.21% 68.50% 67.46% 58.89% 64.86% 33.12% 19.80%
Outages (No) 4 16 24 16 19 4 2 16 14 1 1 117
Duration (hr:m:s) 10:54:00 20:40:00 37:24:00 70:00:00 29:14:00 4:50:00 3:05:00 11:10:00 43:29:00 0:28:00 1:18:00 232:32:00
Reliability Index 98% 97% 95% 91% 96% 99% 100% 98% 94% 100% 100% 100% 97.35%
C.T
han
grikh
um
a, JE
Zu
chh
ip (K
haw
zawl)
C.T
han
grikh
um
a, JE
IR (K
haw
zawl)
45
Champhai P
ower C
ircle A
nnual R
eport 2
010-2011

Fdr Mgr Apr-10 May-10 Jun-10 Jul-10 Aug-10 Sep-10 Oct-10 Nov-10 Dec-10 Jan-11 Feb-11 Mar-11 Annual
Khawzawl Power Sub-Division
MONTHWISE PERFORMANCE OF FEEDER MANAGERS DURING 2010-2011
Energy Input (MU) 0.116773 0.113144 0.119345 0.095568 0.131296 0.144633 0.151106 0.159485 0.158232 0.168504 0.160169 0.234576 1.752831
Energy sold (MU) 0.096689 0.098825 0.099753 0.083713 0.105580 0.119300 0.121288 0.125575 0.127696 0.132357 0.124675 0.176707 1.412158
Revenue billed (`) 173,704 171,517 171,611 150,886 185,048 204,923 210,817 219,295 226,132 240,212 221,880 346,136 2,522,161
Arrear billed (̀ ) 28,919 48,511 60,084 74,819 78,300 105,469 130,492 151,606 156,564 162,617 192,466 208,669 28,919
Surcharge (̀ ) 515 987 1,202 1,497 1,573 2,109 2,610 3,033 3,132 3,252 3,850 4,173 27,933
Total Billed (`) 203,138 221,015 232,897 227,202 264,921 312,501 343,919 373,934 385,828 406,081 418,196 558,978 2,579,013
Amt. Realised (`) 154,627 160,931 158,078 148,902 159,452 182,009 192,313 217,370 229,211 213,615 209,527 538,170 2,564,205
Billing Efficiency 82.80% 87.34% 83.58% 87.60% 80.41% 82.48% 80.27% 78.74% 80.70% 78.55% 77.84% 75.33% 80.56%
Collection Efficiency 76.12% 72.81% 67.87% 65.54% 60.19% 58.24% 55.92% 58.13% 59.41% 52.60% 50.10% 96.28% 99.43%
AT&C Loss 36.97% 36.40% 43.27% 42.59% 51.60% 51.96% 55.12% 54.23% 52.06% 58.68% 61.00% 27.47% 19.90%
Outages (No) 11 15 39 31 25 12 5 18 13 5 3 3 180
Duration (hr:m:s) 34:04:00 19:56:00 68:29:00 164:12:00 90:36:00 30:26:00 6:03:00 11:45:00 23:00:00 19:00:00 1:20:00 3:54:00 472:45:00
Reliability Index 95% 97% 90% 78% 87% 96% 99% 98% 97% 97% 100% 99% 94.60%
Energy Input (MU) 0.033420 0.030030 0.030580 0.027460 0.034840 0.040810 0.035920 0.041100 0.032540 0.040580 0.040590 0.059010 0.446880
Energy sold (MU) 0.027276 0.026402 0.024178 0.022158 0.026415 0.031919 0.028018 0.029816 0.027998 0.031005 0.029775 0.044512 0.349472
Revenue billed (`) 48,347 52,906 45,059 51,670 48,826 56,023 49,704 51,802 58,947 54,153 53,575 75,878 646,890
Arrear billed (̀ ) 6,572 16,851 21,145 27,657 33,825 45,597 53,890 61,661 67,078 83,935 89,427 96,474 6,572
Surcharge (̀ ) 132 338 423 553 676 912 1,078 1,233 1,342 1,679 1,789 1,929 12,084
Total Billed (`) 55,051 70,095 66,627 79,880 83,327 102,532 104,672 114,696 127,367 139,767 144,791 174,281 665,546
Amt. Realised (`) 38,200 48,950 38,970 46,055 37,730 48,642 43,011 47,618 43,432 50,340 48,317 158,260 649,525
Billing Efficiency 81.62% 87.92% 79.06% 80.69% 75.82% 78.21% 78.00% 72.55% 86.04% 76.40% 73.36% 75.43% 78.20%
Collection Efficiency 69.39% 69.83% 58.49% 57.66% 45.28% 47.44% 41.09% 41.52% 34.10% 36.02% 33.37% 90.81% 97.59%
AT&C Loss 43.37% 38.60% 53.76% 53.48% 65.67% 62.89% 67.95% 69.88% 70.66% 72.48% 75.52% 31.50% 23.68%
Outages (No) 5 27 33 30 15 11 14 16 21 5 2 8 187
Duration (hr:m:s) 13:00:00 47:32:00 83:25:00 92:12:00 74:19:00 10:24:00 16:20:00 17:53:00 40:49:00 17:41:00 0:40:00 20:17:00 434:32:00
Reliability Index 98% 94% 88% 88% 90% 99% 98% 98% 95% 98% 100% 97% 95.04%
46
Champhai P
ower C
ircle A
nnual R
eport 2
010-2011
Kh
awh
ai
Lalsan
glu
ra Hn
amte, JE
James L
albiakth
ang
a, JE
Rab
un
g

Fdr Mgr Apr-10 May-10 Jun-10 Jul-10 Aug-10 Sep-10 Oct-10 Nov-10 Dec-10 Jan-11 Feb-11 Mar-11 Annual
Energy Input (MU) 0.054010 0.044310 0.050220 0.044600 0.049870 0.055600 0.057070 0.065570 0.063210 0.067660 0.058900 0.072330 0.683350
Energy sold (MU) 0.042781 0.036916 0.040184 0.037174 0.042650 0.048387 0.050581 0.045834 0.051303 0.054976 0.055340 0.054592 0.560718
Revenue billed (`) 89,514 79,213 85,808 74,582 72,063 103,887 97,329 90,679 104,745 102,937 135,744 103,138 1,139,639
Arrear billed (`) 22,177 28,345 43,179 66,178 68,325 67,475 49,371 61,785 85,307 100,586 119,998 144,141 22,177
Surcharge (`) 444 567 863 1,324 1,367 1,350 988 1,236 1,707 2,013 2,400 2,883 17,142
Total Billed (`) 112,135 108,125 129,850 142,084 141,755 172,712 147,688 153,700 191,759 205,536 258,142 250,162 1,178,958
Amt. Realised (`) 83,790 64,946 63,672 73,759 74,280 123,341 85,903 68,393 91,173 85,538 114,001 168,452 1,097,248
Billing Efficiency 79.21% 83.31% 80.02% 83.35% 85.52% 87.03% 88.63% 69.90% 81.16% 81.25% 93.96% 75.48% 82.05%
Collection Efficiency 74.72% 60.07% 49.04% 51.91% 52.40% 71.41% 58.17% 44.50% 47.55% 41.62% 44.16% 67.34% 93.07%
AT&C Loss 40.81% 49.96% 60.76% 56.73% 55.19% 37.85% 48.45% 68.90% 61.41% 66.18% 58.51% 49.18% 23.63%
Outages (No) 1 6 53 13 9 35 13 15 14 10 9 178
Duration (hr:m:s) 3:15:00 10:54:00 77:08:00 20:45:00 7:50:00 34:21:00 11:53:00 20:20:00 18:16:00 5:44:00 7:41:00 218:07:00
Reliability Index 100% 99% 89% 97% 99% 95% 98% 97% 98% 99% 100% 99% 97.51%
Energy Input (MU) 0.032500 0.028210 0.027870 0.023310 0.033080 0.039360 0.038050 0.045710 0.040170 0.049320 0.041530 0.055070 0.454180
Energy sold (MU) 0.027319 0.019368 0.023657 0.020920 0.029630 0.035221 0.034093 0.037063 0.033517 0.041669 0.034185 0.045502 0.382144
Revenue billed (`) 49,593 45,621 49,467 44,180 55,412 64,417 62,811 60,595 55,067 65,169 52,237 74,777 679,346
Arrear billed (`) 10,530 18,013 25,352 30,413 40,807 52,821 66,822 79,669 91,456 97,210 112,433 116,924 10,530
Surcharge (`) 210 360 508 608 817 1,056 1,337 1,593 1,830 1,945 2,249 2,338 14,851
Total Billed (`) 60,333 63,994 75,327 75,201 97,036 118,294 130,970 141,857 148,353 164,324 166,919 194,039 704,727
Amt. Realised (`) 42,320 38,642 44,914 34,394 44,215 51,472 51,301 50,401 51,143 51,891 49,995 176,422 687,110
Billing Efficiency 84.06% 68.66% 84.88% 89.75% 89.57% 89.48% 89.60% 81.08% 83.44% 84.49% 82.31% 82.63% 84.14%
Collection Efficiency 70.14% 60.38% 59.63% 45.74% 45.57% 43.51% 39.17% 35.53% 34.47% 31.58% 29.95% 90.92% 97.50%
AT&C Loss 41.04% 58.54% 49.39% 58.95% 59.19% 61.06% 64.90% 71.19% 71.24% 73.32% 75.35% 24.88% 17.96%
Outages (No) 1 6 8 11 13 1 14 3 3 9 5 2 76
Duration (hr:m:s) 3:18:00 7:14:00 12:02:00 16:50:00 29:33:00 0:01:00 4:43:00 16:38:00 4:35:00 17:44:00 6:02:00 2:44:00 121:24:00
Reliability Index 100% 99% 98% 98% 96% 100% 99% 98% 99% 98% 99% 100% 98.61%
MONTHWISE PERFORMANCE OF FEEDER MANAGERS DURING 2010-2011
Lallian
a, JE
Kaw
lkulh
F. S
angzela, JE
Hliap
pui
Ngopa Power Sub-Division
Champhai P
ower C
ircle A
nnual R
eport 2
010-2011
47

Fdr Mgr Apr-10 May-10 Jun-10 Jul-10 Aug-10 Sep-10 Oct-10 Nov-10 Dec-10 Jan-11 Feb-11 Mar-11 Annual
MONTHWISE PERFORMANCE OF FEEDER MANAGERS DURING 2010-2011
Ngopa Power Sub-Division
Energy Input (MU) 0.015240 0.012740 0.015120 0.013540 0.017150 0.020140 0.018410 0.020100 0.020410 0.020760 0.018710 0.026170 0.218490
Energy sold (MU) 0.012589 0.010945 0.014585 0.012367 0.014430 0.017138 0.015832 0.014951 0.016954 0.017408 0.016409 0.021970 0.185578
Revenue billed (`) 20,411 18,155 18,962 19,406 19,607 26,504 21,741 24,989 27,303 24,502 25,152 31,213 277,945
Arrear billed (`) 2,534 4,630 5,588 8,891 11,256 12,777 14,353 16,258 20,788 22,400 25,072 26,456 2,534
Surcharge (`) 50 92 112 178 224 255 286 325 416 448 501 529 3,416
Total Billed (`) 22,995 22,877 24,662 28,475 31,087 39,536 36,380 41,572 48,507 47,350 50,725 58,198 283,895
Amt. Realised (`) 18,365 17,289 15,771 17,219 18,310 25,183 20,122 20,784 26,107 22,278 24,269 50,342 276,039
Billing Efficiency 82.60% 85.91% 96.46% 91.34% 84.14% 85.09% 86.00% 74.38% 83.07% 83.85% 87.70% 83.95% 84.94%
Collection Efficiency 79.87% 75.57% 63.95% 60.47% 58.90% 63.70% 55.31% 50.00% 53.82% 47.05% 47.84% 86.50% 97.23%
AT&C Loss 34.03% 35.07% 38.31% 44.77% 50.44% 45.80% 52.43% 62.81% 55.29% 60.55% 58.04% 27.38% 17.41%
Outages (No) 1 5 2 5 1 2 6 4 3 1 3 33
Duration (hr:m:s) 4:25:00 11:30:00 2:00:00 11:26:00 0:46:00 6:01:00 28:07:00 26:17:00 3:49:00 3:52:00 2:40:00 100:53:00
Reliability Index 99% 98% 100% 100% 98% 100% 99% 96% 96% 99% 99% 100% 98.85%
Energy Input (MU) 0.001223 0.001070 0.001000 0.001600 0.001029 0.001092 0.001118 0.000973 0.001163 0.001184 0.001253 0.001067 0.013772
Energy sold (MU) 0.001223 0.001070 0.001000 0.001600 0.001029 0.001092 0.001118 0.000973 0.001163 0.001184 0.001253 0.001067 0.013772
Revenue billed (`) 2,056 1,869 1,846 2,742 1,757 1,857 1,790 1,709 2,065 1,963 2,126 1,839 23,619
Arrear billed (`) 408 810 1,271 1,187 2,221 2,011 2,444 2,841 3,091 4,410 4,562 4,520 408
Surcharge (`) 8 17 25 24 45 40 50 57 62 89 91 90 598
Total Billed (`) 2,472 2,696 3,142 3,953 4,023 3,908 4,284 4,607 5,218 6,462 6,779 6,449 24,625
Amt. Realised (`) 1,662 1,425 1,955 1,732 2,012 1,464 1,443 1,516 808 1,900 2,259 5,558 23,734
Billing Efficiency 100.00% 100.00% 100.00% 100.00% 100.00% 100.00% 100.00% 100.00% 100.00% 100.00% 100.00% 100.00% 100.00%
Collection Efficiency 67.23% 52.86% 62.22% 43.81% 50.01% 37.46% 33.68% 32.91% 15.48% 29.40% 33.32% 86.18% 96.38%
AT&C Loss 32.77% 47.14% 37.78% 56.19% 49.99% 62.54% 66.32% 67.09% 84.52% 70.60% 66.68% 13.82% 3.62%
Outages (No) 12 39 13 42 82 5 26 45 48 42 27 3 384
Duration (hr:m:s) 18:18:00 49:13:00 25:54:00 34:12:00 113:36:00 1:50:00 23:56:00 47:41:00 43:53:00 48:18:00 8:10:00 7:41:00 422:42:00
Reliability Index 97% 93% 96% 95% 84% 100% 97% 93% 94% 93% 99% 99% 95.17%
Lallian
a, JE
Arro
Lallian
a, JE
Puilo
Champhai P
ower C
ircle A
nnual R
eport 2
010-2011
48

Fdr Mgr Apr-10 May-10 Jun-10 Jul-10 Aug-10 Sep-10 Oct-10 Nov-10 Dec-10 Jan-11 Feb-11 Mar-11 Annual
MONTHWISE PERFORMANCE OF FEEDER MANAGERS DURING 2010-2011
Ngopa Power Sub-Division
Energy Input (MU) 0.061679 0.056103 0.054853 0.055756 0.067203 0.073407 0.072564 0.074170 0.070405 0.085280 0.072606 0.087499 0.831525
Energy sold (MU) 0.047932 0.042608 0.047807 0.047417 0.058775 0.064025 0.064055 0.059524 0.057887 0.069976 0.058472 0.070472 0.688950
Revenue billed (`) 106,782 101,843 102,589 93,492 119,085 111,640 123,901 118,554 130,347 144,480 119,159 131,036 1,402,908
Arrear billed (`) 12,926 38,868 64,609 86,139 124,705 160,669 194,060 235,372 268,393 310,370 355,817 383,145 12,926
Surcharge (`) 259 776 1,293 1,722 2,493 3,214 3,881 4,708 5,367 6,205 7,116 7,663 44,697
Total Billed (`) 119,967 141,487 168,491 181,353 246,283 275,523 321,842 358,634 404,107 461,055 482,092 521,844 1,460,531
Amt. Realised (`) 81,099 76,878 82,352 56,648 85,614 81,463 86,470 90,241 93,737 105,238 98,947 391,873 1,330,560
Billing Efficiency 77.71% 75.95% 87.15% 85.04% 87.46% 87.22% 88.27% 80.25% 82.22% 82.05% 80.53% 80.54% 82.85%
Collection Efficiency 67.60% 54.34% 48.88% 31.24% 34.76% 29.57% 26.87% 25.16% 23.20% 22.83% 20.52% 75.09% 91.10%
AT&C Loss 47.47% 58.73% 57.40% 73.44% 69.60% 74.21% 76.28% 79.81% 80.93% 81.27% 83.47% 39.52% 24.52%
Outages (No) 2 3 11 11 15 12 7 4 5 6 6 3 85
Duration (hr:m:s) 0:58:00 0:30:00 28:31:00 16:39:00 17:43:00 7:12:00 5:11:00 9:27:00 8:17:00 5:10:00 3:18:00 2:01:00 104:57:00
Reliability Index 100% 100% 96% 98% 98% 99% 99% 99% 99% 99% 100% 100% 98.80%
Energy Input (MU) 0.039900 0.042734 0.032944 0.033778 0.049952 0.059941 0.049131 0.057892 0.052790 0.036989 0.029562 0.070383 0.555996
Energy sold (MU) 0.034117 0.034118 0.028346 0.029607 0.044328 0.052923 0.044215 0.046988 0.047932 0.025529 0.023677 0.054056 0.465836
Revenue billed (`) 55,504 56,633 56,992 52,068 66,518 70,223 65,978 74,118 80,960 33,640 33,665 34,541 680,840
Arrear billed (`) 6,693 15,709 24,080 37,802 47,828 63,353 73,628 85,224 99,707 48,055 57,130 134,766 6,693
Surcharge (`) 134 314 480 756 956 1,266 1,472 1,704 1,994 961 1,142 2,695 13,874
Total Billed (`) 62,331 72,656 81,552 90,626 115,302 134,842 141,078 161,046 182,661 82,656 91,937 172,002 701,407
Amt. Realised (`) 46,622 48,576 43,750 42,798 51,949 61,214 55,854 61,339 63,453 25,526 28,205 85,829 615,115
Billing Efficiency 85.51% 79.84% 86.04% 87.65% 88.74% 88.29% 89.99% 81.16% 90.80% 69.02% 80.09% 76.80% 83.78%
Collection Efficiency 74.80% 66.86% 53.65% 47.22% 45.05% 45.40% 39.59% 38.09% 34.74% 30.88% 30.68% 49.90% 87.70%
AT&C Loss 36.04% 46.62% 53.84% 58.61% 60.02% 59.92% 64.37% 69.09% 68.46% 78.69% 75.43% 61.68% 26.52%
Outages (No) 2 3 25 24 8 7 12 1 1 4 11 2 100
Duration (hr:m:s) 1:03:00 14:54:00 62:41:00 49:41:00 12:01:00 3:36:00 7:59:00 2:44:00 3:46:00 11:51:00 40:16:00 5:08:00 215:40:00
Reliability Index 100% 98% 91% 93% 98% 100% 99% 100% 99% 98% 95% 99% 97.54%
F. S
angzela, JE
Ngopa
K. V
anlalzara, JE
/F.San
gzela, JE
Khaw
dungsei
Champhai P
ower C
ircle A
nnual R
eport 2
010-2011
49

Fdr Mgr Apr-10 May-10 Jun-10 Jul-10 Aug-10 Sep-10 Oct-10 Nov-10 Dec-10 Jan-11 Feb-11 Mar-11 Annual
MONTHWISE PERFORMANCE OF FEEDER MANAGERS DURING 2010-2011
Ngopa Power Sub-Division
Energy Input (MU) 0.024663 0.022861 0.020163 0.018552 0.027912 0.027912 0.034605 0.036469 0.027769 0.059495 0.055717 0.041456 0.397574
Energy sold (MU) 0.016456 0.015299 0.016532 0.015475 0.024224 0.024383 0.030823 0.023225 0.022635 0.048196 0.045604 0.033938 0.316790
Revenue billed (`) 27,041 25,100 24,019 23,465 27,270 36,181 35,231 34,757 31,175 74,752 70,028 90,117 499,136
Arrear billed (`) 8,814 6,585 10,483 14,228 19,168 24,086 32,575 39,773 42,778 119,208 129,763 63,732 8,814
Surcharge (`) 176 131 210 285 384 482 651 796 855 2,384 2,595 1,274 10,223
Total Billed (`) 36,031 31,816 34,712 37,978 46,822 60,749 68,457 75,326 74,808 196,344 202,386 155,123 518,173
Amt. Realised (`) 29,446 21,333 20,484 18,810 22,736 28,174 28,684 32,547 26,753 66,581 67,620 197,979 561,147
Billing Efficiency 66.72% 66.92% 81.99% 83.41% 86.79% 87.36% 89.07% 63.68% 81.51% 81.01% 81.85% 81.87% 79.68%
Collection Efficiency 81.72% 67.05% 59.01% 49.53% 48.56% 46.38% 41.90% 43.21% 35.76% 33.91% 33.41% 127.63% 108.29%
AT&C Loss 45.47% 55.13% 51.62% 58.69% 57.86% 59.49% 62.68% 72.48% 70.85% 72.53% 72.65% -4.48% 13.71%
Outages (No) 2 28 28 10 8 7 3 5 8 9 5 113
Duration (hr:m:s) 24:35:00 76:43:00 69:43:00 27:09:00 7:12:00 4:27:00 7:28:00 9:40:00 12:59:00 10:54:00 15:39:00 266:29:00
Reliability Index 100% 97% 89% 91% 96% 99% 99% 99% 99% 98% 99% 98% 96.96%
Energy Input (MU) 0.229215 0.208028 0.202170 0.191136 0.246196 0.277452 0.270948 0.300884 0.275917 0.320688 0.278278 0.353975 3.154887
Energy sold (MU) 0.182417 0.160324 0.172111 0.164560 0.215066 0.243169 0.240717 0.228558 0.231391 0.258938 0.234940 0.281597 2.613788
Revenue billed (`) 350,901 328,434 339,683 309,935 361,712 414,709 408,781 405,401 431,662 447,443 438,111 466,661 4,703,433
Arrear billed (`) 64,082 112,960 174,562 244,838 314,310 383,192 433,253 520,922 611,520 702,239 804,775 873,684 64,082
Surcharge (`) 1,281 2,257 3,491 4,897 6,286 7,663 8,665 10,419 12,231 14,045 16,094 17,472 104,801
Total Billed (`) 416,264 443,651 517,736 559,670 682,308 805,564 850,699 936,742 1,055,413 1,163,727 1,258,980 1,357,817 4,872,316
Amt. Realised (`) 303,304 269,089 272,898 245,360 299,116 372,311 329,777 325,221 353,174 358,952 385,296 1,076,455 4,590,953
Billing Efficiency 79.58% 77.07% 85.13% 86.10% 87.36% 87.64% 88.84% 75.96% 83.86% 80.74% 84.43% 79.55% 82.85%
Collection Efficiency 72.86% 60.65% 52.71% 43.84% 43.84% 46.22% 38.77% 34.72% 33.46% 30.85% 30.60% 79.28% 94.23%
AT&C Loss 42.01% 53.26% 55.13% 62.26% 61.70% 59.49% 65.56% 73.63% 71.94% 75.09% 74.16% 36.93% 21.94%
Outages (No) 19 64 138 131 142 69 81 77 80 82 59 27 969
Duration (hr:m:s) 31:17:00 118:50:00 282:59:00 209:50:00 219:18:00 54:58:00 64:10:00 132:25:00 114:44:00 105:35:00 72:32:00 43:34:00 1450:12:00
Reliability Index 99% 98% 94% 96% 96% 99% 99% 97% 98% 98% 99% 99% 97.64%
Er L
iansan
gvu
ng, S
ub-Divisio
nal O
fficer
Ngopa P
ower S
ub-Divisio
n
Champhai P
ower C
ircle A
nnual R
eport 2
010-2011
50
K. V
anlalzara, JE
/F.San
gzela, JE
Kaw
lbem
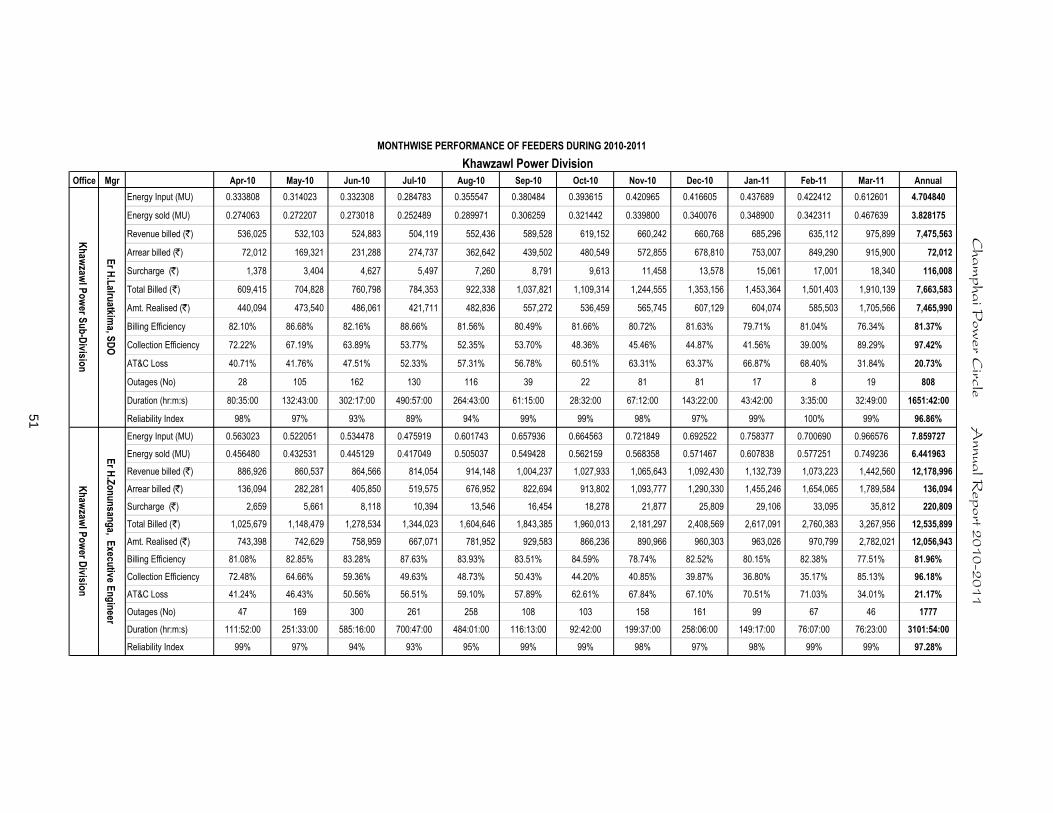
Office Mgr Apr-10 May-10 Jun-10 Jul-10 Aug-10 Sep-10 Oct-10 Nov-10 Dec-10 Jan-11 Feb-11 Mar-11 Annual
MONTHWISE PERFORMANCE OF FEEDERS DURING 2010-2011
Khawzawl Power Division
Energy Input (MU) 0.333808 0.314023 0.332308 0.284783 0.355547 0.380484 0.393615 0.420965 0.416605 0.437689 0.422412 0.612601 4.704840
Energy sold (MU) 0.274063 0.272207 0.273018 0.252489 0.289971 0.306259 0.321442 0.339800 0.340076 0.348900 0.342311 0.467639 3.828175
Revenue billed (`) 536,025 532,103 524,883 504,119 552,436 589,528 619,152 660,242 660,768 685,296 635,112 975,899 7,475,563
Arrear billed (`) 72,012 169,321 231,288 274,737 362,642 439,502 480,549 572,855 678,810 753,007 849,290 915,900 72,012
Surcharge (̀ ) 1,378 3,404 4,627 5,497 7,260 8,791 9,613 11,458 13,578 15,061 17,001 18,340 116,008
Total Billed (`) 609,415 704,828 760,798 784,353 922,338 1,037,821 1,109,314 1,244,555 1,353,156 1,453,364 1,501,403 1,910,139 7,663,583
Amt. Realised (`) 440,094 473,540 486,061 421,711 482,836 557,272 536,459 565,745 607,129 604,074 585,503 1,705,566 7,465,990
Billing Efficiency 82.10% 86.68% 82.16% 88.66% 81.56% 80.49% 81.66% 80.72% 81.63% 79.71% 81.04% 76.34% 81.37%
Collection Efficiency 72.22% 67.19% 63.89% 53.77% 52.35% 53.70% 48.36% 45.46% 44.87% 41.56% 39.00% 89.29% 97.42%
AT&C Loss 40.71% 41.76% 47.51% 52.33% 57.31% 56.78% 60.51% 63.31% 63.37% 66.87% 68.40% 31.84% 20.73%
Outages (No) 28 105 162 130 116 39 22 81 81 17 8 19 808
Duration (hr:m:s) 80:35:00 132:43:00 302:17:00 490:57:00 264:43:00 61:15:00 28:32:00 67:12:00 143:22:00 43:42:00 3:35:00 32:49:00 1651:42:00
Reliability Index 98% 97% 93% 89% 94% 99% 99% 98% 97% 99% 100% 99% 96.86%
Energy Input (MU) 0.563023 0.522051 0.534478 0.475919 0.601743 0.657936 0.664563 0.721849 0.692522 0.758377 0.700690 0.966576 7.859727
Energy sold (MU) 0.456480 0.432531 0.445129 0.417049 0.505037 0.549428 0.562159 0.568358 0.571467 0.607838 0.577251 0.749236 6.441963
Revenue billed (`) 886,926 860,537 864,566 814,054 914,148 1,004,237 1,027,933 1,065,643 1,092,430 1,132,739 1,073,223 1,442,560 12,178,996
Arrear billed (`) 136,094 282,281 405,850 519,575 676,952 822,694 913,802 1,093,777 1,290,330 1,455,246 1,654,065 1,789,584 136,094
Surcharge (̀ ) 2,659 5,661 8,118 10,394 13,546 16,454 18,278 21,877 25,809 29,106 33,095 35,812 220,809
Total Billed (`) 1,025,679 1,148,479 1,278,534 1,344,023 1,604,646 1,843,385 1,960,013 2,181,297 2,408,569 2,617,091 2,760,383 3,267,956 12,535,899
Amt. Realised (`) 743,398 742,629 758,959 667,071 781,952 929,583 866,236 890,966 960,303 963,026 970,799 2,782,021 12,056,943
Billing Efficiency 81.08% 82.85% 83.28% 87.63% 83.93% 83.51% 84.59% 78.74% 82.52% 80.15% 82.38% 77.51% 81.96%
Collection Efficiency 72.48% 64.66% 59.36% 49.63% 48.73% 50.43% 44.20% 40.85% 39.87% 36.80% 35.17% 85.13% 96.18%
AT&C Loss 41.24% 46.43% 50.56% 56.51% 59.10% 57.89% 62.61% 67.84% 67.10% 70.51% 71.03% 34.01% 21.17%
Outages (No) 47 169 300 261 258 108 103 158 161 99 67 46 1777
Duration (hr:m:s) 111:52:00 251:33:00 585:16:00 700:47:00 484:01:00 116:13:00 92:42:00 199:37:00 258:06:00 149:17:00 76:07:00 76:23:00 3101:54:00
Reliability Index 99% 97% 94% 93% 95% 99% 99% 98% 97% 98% 99% 99% 97.28%
Champhai P
ower C
ircle A
nnual R
eport 2
010-2011
51
Khawzawl Power D
ivision
Er H
.Lalruatkima, SDO
Er H
.Zonunsanga, E
xecutive Engineer
Khawzawl Power S
ub-Division

Fdr Mgr Apr-10 May-10 Jun-10 Jul-10 Aug-10 Sep-10 Oct-10 Nov-10 Dec-10 Jan-11 Feb-11 Mar-11 Annual
Energy Input (MU) 0.185400 0.172600 0.188600 0.166200 0.203600 0.213000 0.213200 0.218600 0.218800 0.243800 0.243980 0.225020 2.492800
Energy sold (MU) 0.122735 0.132742 0.132947 0.128666 0.143575 0.155805 0.150624 0.154441 0.154302 0.165206 0.149395 0.219091 1.809529
Revenue billed (`) 267,557 297,088 238,033 311,920 261,179 311,320 274,836 344,248 313,199 371,323 253,989 547,399 3,792,092
Arrear billed (`) 64,762 83,003 109,604 131,229 157,212 197,229 249,155 280,486 327,467 332,579 710,714 407,901 64,762
Surcharge (`) 1,367 1,786 2,302 2,795 3,354 4,184 5,289 5,962 6,655 6,813 8,689 8,369 57,564
Total Billed (`) 333,686 381,876 349,940 445,944 421,744 512,733 529,280 630,696 647,322 710,714 973,393 963,670 3,914,418
Amt. Realised (`) 250,683 272,272 218,711 288,732 224,515 263,578 248,794 303,229 314,743 - 565,491 873,528 3,824,276
Billing Efficiency 66.20% 76.91% 70.49% 77.42% 70.52% 73.15% 70.65% 70.65% 70.52% 67.76% 61.23% 97.37% 72.59%
Collection Efficiency 75.13% 71.30% 62.50% 64.75% 53.23% 51.41% 47.01% 48.08% 48.62% 58.09% 90.65% 97.70%
AT&C Loss 50.27% 45.17% 55.94% 49.88% 62.46% 62.40% 66.79% 66.03% 65.71% 100.00% 64.43% 11.74% 29.08%
Outages (No) 1 8 2 3 3 4 11 4 2 1 39
Duration (hr:m:s) 4:58:00 2:16:00 0:52:00 2:45:00 1:30:00 0:41:00 12:53:00 1:31:00 4:02:00 0:15:00 31:43:00
Reliability Index 100% 99% 100% 100% 100% 100% 100% 100% 98% 100% 99% 100% 99.64%
Energy Input (MU) 0.143600 0.136400 0.138800 0.120600 0.153800 0.149800 0.148800 0.166800 0.167800 0.187400 0.188200 0.184600 1.886600
Energy sold (MU) 0.101417 0.096932 0.097154 0.089420 0.108523 0.105396 0.107687 0.123712 0.119380 0.112225 0.105987 0.170370 1.338203
Revenue billed (`) 173,544 178,117 162,683 177,107 191,758 200,983 161,414 229,763 226,951 226,945 177,638 350,198 2,457,101
Arrear billed (`) 47,606 47,683 63,604 79,288 96,225 104,253 117,360 134,475 164,957 170,407 401,052 201,231 47,606
Surcharge (`) 1,019 1,069 1,414 1,772 2,070 2,274 2,584 2,956 3,550 3,700 4,417 4,583 31,408
Total Billed (`) 222,169 226,869 227,702 258,166 290,053 307,511 281,357 367,194 395,458 401,052 583,107 556,012 2,536,115
Amt. Realised (`) 174,486 163,265 148,414 161,941 185,800 190,151 146,882 202,237 225,051 - 381,876 501,902 2,482,005
Billing Efficiency 70.62% 71.06% 70.00% 74.15% 70.56% 70.36% 72.37% 74.17% 71.14% 59.89% 56.32% 92.29% 70.93%
Collection Efficiency 78.54% 71.96% 65.18% 62.73% 64.06% 61.84% 52.20% 55.08% 56.91% 65.49% 90.27% 97.87%
AT&C Loss 44.53% 48.86% 54.38% 53.49% 54.80% 56.49% 62.22% 59.15% 59.51% 100.00% 63.12% 16.69% 30.58%
Outages (No) 1 8 6 4 6 8 3 9 1 1 2 49
Duration (hr:m:s) 0:15:00 4:23:00 24:08:00 2:22:00 1:21:00 4:05:00 0:45:00 7:41:00 1:08:00 1:35:00 0:23:00 48:06:00
Reliability Index 100% 100% 99% 97% 100% 100% 99% 100% 99% 100% 100% 100% 99.45%
MONTHWISE PERFORMANCE OF FEEDERS DURING 2010-2011
Malsaw
mtlu
anga, JE
Ven
glai
Malsaw
mtlu
anga, JE
Beth
el
Champhai Power Sub-Division
Champhai P
ower C
ircle A
nnual R
eport 2
010-2011
52

Fdr Mgr Apr-10 May-10 Jun-10 Jul-10 Aug-10 Sep-10 Oct-10 Nov-10 Dec-10 Jan-11 Feb-11 Mar-11 Annual
MONTHWISE PERFORMANCE OF FEEDERS DURING 2010-2011
Champhai Power Sub-Division
Energy Input (MU) 0.110600 0.108200 0.108000 0.097600 0.130800 0.131400 0.132000 0.137800 0.139400 0.151200 0.151800 0.151400 1.550200
Energy sold (MU) 0.078126 0.075753 0.084400 0.082448 0.096307 0.102035 0.097559 0.099251 0.116204 0.118444 0.124947 0.139807 1.215281
Revenue billed (`) 235,580 123,026 196,252 198,565 244,214 205,314 181,061 188,972 225,950 240,146 221,987 310,682 2,571,748
Arrear billed (`) 29,899 122,765 131,107 151,776 166,209 195,887 204,261 229,109 277,076 307,754 553,081 365,954 29,899
Surcharge (`) 508 713 1,354 1,572 2,020 2,423 2,453 3,128 4,018 5,181 6,521 5,318 35,210
Total Billed (`) 265,987 246,504 328,713 351,913 412,443 403,624 387,775 421,209 507,044 553,081 781,589 681,954 2,636,857
Amt. Realised (`) 143,222 115,397 176,937 185,704 216,556 199,363 158,666 144,133 199,290 - 415,635 455,602 2,410,505
Billing Efficiency 70.64% 70.01% 78.15% 84.48% 73.63% 77.65% 73.91% 72.03% 83.36% 78.34% 82.31% 92.34% 78.40%
Collection Efficiency 53.85% 46.81% 53.83% 52.77% 52.51% 49.39% 40.92% 34.22% 39.30% 53.18% 66.81% 91.42%
AT&C Loss 61.96% 67.22% 57.94% 55.42% 61.34% 61.65% 69.76% 75.35% 67.24% 100.00% 56.23% 38.31% 28.33%
Outages (No) 6 1 7 6 6 2 16 2 10 1 3 2 62
Duration (hr:m:s) 10:18:00 1:00:00 6:19:00 8:24:00 28:03:00 4:55:00 8:34:00 0:21:00 7:42:00 0:12:00 1:58:00 2:30:00 80:16:00
Reliability Index 98% 100% 99% 99% 96% 99% 99% 100% 99% 100% 100% 100% 99.08%
Energy Input (MU) 0.035600 0.027600 0.036600 0.026200 0.074000 0.075200 0.072000 0.073800 0.107600 0.101200 0.101380 0.099020 0.830200
Energy sold (MU) 0.026935 0.021248 0.026628 0.025411 0.052183 0.053275 0.051361 0.052447 0.076010 0.074252 0.072773 0.069704 0.602227
Revenue billed (`) 43,672 49,586 53,531 67,089 93,229 97,956 81,955 89,993 120,968 129,588 123,502 97,059 1,048,128
Arrear billed (`) 48,551 27,588 38,235 38,407 73,135 86,378 88,089 93,812 107,478 123,795 254,992 148,919 48,551
Surcharge (`) 608 590 401 742 973 1,198 1,102 1,017 1,507 1,609 2,203 2,038 13,988
Total Billed (`) 92,831 77,764 92,167 106,238 167,337 185,532 171,146 184,822 229,953 254,992 380,697 248,016 1,110,667
Amt. Realised (`) 65,243 39,529 53,760 60,215 80,959 97,443 77,334 77,344 106,158 - 231,778 122,974 1,012,737
Billing Efficiency 75.66% 76.99% 72.75% 96.99% 70.52% 70.84% 71.33% 71.07% 70.64% 73.37% 71.78% 70.39% 72.54%
Collection Efficiency 70.28% 50.83% 58.33% 56.68% 48.38% 52.52% 45.19% 41.85% 46.17% 60.88% 49.58% 91.18%
AT&C Loss 46.82% 60.87% 57.56% 45.03% 65.88% 62.79% 67.77% 70.26% 67.39% 100.00% 56.30% 65.10% 33.86%
Outages (No) 3 6 8 11 11 2 15 10 11 3 1 2 83
Duration (hr:m:s) 9:07:00 15:25:00 37:40:00 25:03:00 22:59:00 3:05:00 6:55:00 16:04:00 10:55:00 1:45:00 1:00:00 0:05:00 150:03:00
Reliability Index 99% 98% 95% 97% 97% 100% 99% 98% 99% 100% 100% 100% 98.29%
Malsaw
mtlu
anga, JE
Mualkaw
i
Malsaw
mtlu
anga, JE
Ruan
tlang
Champhai P
ower C
ircle A
nnual R
eport 2
010-2011
53

Fdr Mgr Apr-10 May-10 Jun-10 Jul-10 Aug-10 Sep-10 Oct-10 Nov-10 Dec-10 Jan-11 Feb-11 Mar-11 Annual
MONTHWISE PERFORMANCE OF FEEDERS DURING 2010-2011
Champhai Power Sub-Division
Energy Input (MU) 0.005224 0.005536 0.005903 0.005903 0.005080 0.005164 0.005680 0.005884 0.004831 0.006400 0.008176 0.008960 0.072741
Energy sold (MU) 0.003752 0.004793 0.004207 0.004303 0.004944 0.004490 0.004757 0.004556 0.005169 0.006492 0.004822 0.005954 0.058239
Revenue billed (`) 7,717 9,073 6,641 11,105 9,032 8,806 7,930 7,775 8,832 11,491 7,830 10,108 106,340
Arrear billed (`) 1,554 2,169 5,485 7,073 11,279 14,763 5,483 5,641 7,188 8,258 19,903 9,236 1,554
Surcharge (`) 61 12 111 143 229 290 108 117 140 154 189 195 1,749
Total Billed (`) 9,332 11,254 12,237 18,321 20,540 23,859 13,521 13,533 16,160 19,903 27,922 19,538 109,642
Amt. Realised (`) 7,163 5,769 5,164 7,042 5,777 18,376 7,880 6,345 7,902 - 18,686 17,879 107,983
Billing Efficiency 71.82% 86.58% 71.27% 72.90% 97.32% 86.95% 83.75% 77.43% 107.00% 101.44% 58.98% 66.45% 80.06%
Collection Efficiency 76.76% 51.26% 42.20% 38.44% 28.13% 77.02% 58.28% 46.89% 48.90% 66.92% 91.51% 98.49%
AT&C Loss 44.87% 55.62% 69.92% 71.98% 72.63% 33.03% 51.19% 63.70% 47.68% 100.00% 60.53% 39.19% 21.15%
Outages (No) 3 2 5 2 1 13
Duration (hr:m:s) 27:24:00 2:30:00 12:55:00 5:15:00 0:10:00 48:14:00
Reliability Index 96% 100% 98% 99% 100% 100% 100% 100% 100% 100% 100% 100% 99.45%
Energy Input (MU) 0.001401 0.001501 0.001501 0.001501 0.001306 0.003280 0.003728 0.003116 0.004280 0.003568 0.003972 0.003039 0.032193
Energy sold (MU) 0.002353 0.002486 0.002420 0.002649 0.002639 0.002420 0.002474 0.002462 0.002563 0.002437 0.003092 0.003411 0.031406
Revenue billed (`) 6,554 6,955 6,847 7,269 7,276 6,858 7,310 6,877 7,032 6,792 6,844 9,712 86,325
Arrear billed (`) 548 5,985 9,947 14,012 18,794 23,832 29,085 34,015 39,575 44,582 52,270 55,584 548
Surcharge (`) 12 122 202 284 381 483 589 682 795 895 1,028 1,118 6,590
Total Billed (`) 7,114 13,062 16,996 21,565 26,450 31,173 36,983 41,574 47,401 52,270 60,142 66,413 93,463
Amt. Realised (`) 1,129 3,115 2,984 2,771 2,618 2,088 2,969 1,999 2,819 - 4,558 65,440 92,490
Billing Efficiency 167.95% 165.62% 161.23% 176.48% 202.07% 73.78% 66.36% 79.01% 59.88% 68.30% 77.84% 112.24% 97.56%
Collection Efficiency 15.87% 23.85% 17.56% 12.85% 9.90% 6.70% 8.03% 4.81% 5.95% 7.58% 98.53% 98.96%
AT&C Loss 73.35% 60.50% 71.69% 77.32% 80.00% 95.06% 94.67% 96.20% 96.44% 100.00% 94.10% -10.60% 3.46%
Outages (No) 2 2
Duration (hr:m:s) 0:52:00 0:52:00
Reliability Index 100% 100% 100% 100% 100% 100% 100% 100% 100% 100% 100% 100% 99.99%
Tuipui
P.C. L
alrawnlian
a, JE
Statio
n
Malsaw
mtlu
anga, JE
Champhai P
ower C
ircle A
nnual R
eport 2
010-2011
54

Fdr Mgr Apr-10 May-10 Jun-10 Jul-10 Aug-10 Sep-10 Oct-10 Nov-10 Dec-10 Jan-11 Feb-11 Mar-11 Annual
MONTHWISE PERFORMANCE OF FEEDERS DURING 2010-2011
Champhai Power Sub-Division
Energy Input (MU) 0.050700 0.046300 0.047400 0.043600 0.053100 0.052200 0.055400 0.056200 0.060100 0.072300 0.069200 0.069100 0.675600
Energy sold (MU) 0.039577 0.037806 0.044378 0.043453 0.045993 0.051315 0.047504 0.053964 0.054783 0.065343 0.058722 0.064905 0.607743
Revenue billed (`) 82,004 99,373 90,508 87,605 93,116 111,505 96,525 108,952 112,410 136,712 110,061 140,083 1,268,854
Arrear billed (`) 15,684 32,038 43,003 50,674 66,070 87,373 96,301 109,131 128,560 146,676 286,548 186,143 15,684
Surcharge (`) 348 702 952 1,236 1,463 1,916 2,109 2,401 2,807 3,160 3,661 3,876 24,632
Total Billed (`) 98,035 132,114 134,463 139,515 160,649 200,794 194,935 220,484 243,777 286,548 400,270 330,102 1,309,169
Amt. Realised (`) 65,997 89,111 83,789 73,445 73,276 104,493 85,804 91,924 97,101 - 214,127 322,173 1,301,240
Billing Efficiency 78.06% 81.65% 93.62% 99.66% 86.62% 98.30% 85.75% 96.02% 91.15% 90.38% 84.86% 93.93% 89.96%
Collection Efficiency 67.32% 67.45% 62.31% 52.64% 45.61% 52.04% 44.02% 41.69% 39.83% 53.50% 97.60% 99.39%
AT&C Loss 47.45% 44.92% 41.66% 47.53% 60.49% 48.84% 62.26% 59.97% 63.69% 100.00% 54.60% 8.33% 10.59%
Outages (No) 6 1 3 1 1 2 5 5 5 5 2 1 37
Duration (hr:m:s) 9:30:00 0:15:00 1:26:00 0:05:00 0:45:00 0:45:00 4:05:00 11:07:00 2:45:00 6:53:00 0:20:00 0:05:00 38:01:00
Reliability Index 99% 100% 100% 100% 100% 100% 99% 98% 100% 99% 100% 100% 99.57%
Energy Input (MU) 0.156800 0.147800 0.154800 0.138600 0.161900 0.168300 0.165700 0.172500 0.184000 0.193700 0.191200 0.203400 2.038700
Energy sold (MU) 0.125441 0.115078 0.114109 0.121697 0.117359 0.127928 0.123639 0.129031 0.149508 0.154963 0.116143 0.179272 1.574168
Revenue billed (`) 320,016 289,922 263,263 306,356 293,990 324,897 263,860 319,076 384,970 401,844 314,811 481,156 3,964,162
Arrear billed (`) 138,795 142,226 225,221 211,390 239,263 209,647 218,607 241,762 330,796 414,952 825,222 556,070 138,795
Surcharge (`) 2,925 3,075 4,570 4,533 5,139 4,597 4,837 5,355 6,729 8,427 9,906 7,059 67,152
Total Billed (`) 461,737 435,223 493,055 522,279 538,392 539,140 487,305 566,193 722,495 825,222 1,149,939 1,044,285 4,170,109
Amt. Realised (`) 319,511 210,002 281,665 283,016 328,745 320,533 245,543 235,397 307,543 - 593,869 711,434 3,837,258
Billing Efficiency 80.00% 77.86% 73.71% 87.80% 72.49% 76.01% 74.62% 74.80% 81.25% 80.00% 60.74% 88.14% 77.21%
Collection Efficiency 69.20% 48.25% 57.13% 54.19% 61.06% 59.45% 50.39% 41.58% 42.57% 51.64% 68.13% 92.02%
AT&C Loss 44.64% 62.43% 57.89% 52.42% 55.74% 54.81% 62.40% 68.90% 65.41% 100.00% 68.63% 39.95% 28.95%
Outages (No) 7 5 6 4 9 13 7 4 9 9 5 2 80
Duration (hr:m:s) 9:04:00 0:38:00 3:41:00 2:15:00 5:53:00 6:26:00 7:36:00 6:04:00 3:15:00 3:29:00 1:07:00 0:29:00 49:57:00
Reliability Index 99% 100% 99% 100% 99% 99% 99% 99% 100% 100% 100% 100% 99.43%
Kah
rawt
P.C. L
alrawnlian
a, JE
Kan
an
P.C. L
alrawnlian
a, JE
Champhai P
ower C
ircle A
nnual R
eport 2
010-2011
55

Fdr Mgr Apr-10 May-10 Jun-10 Jul-10 Aug-10 Sep-10 Oct-10 Nov-10 Dec-10 Jan-11 Feb-11 Mar-11 Annual
MONTHWISE PERFORMANCE OF FEEDERS DURING 2010-2011
Champhai Power Sub-Division
Energy Input (MU) 0.016300 0.012200 0.011800 0.017900 0.019900 0.020700 0.020600 0.019700 0.014800 0.022700 0.020300 0.018100 0.215000
Energy sold (MU) 0.012624 0.014967 0.009385 0.014949 0.014127 0.011353 0.012242 0.010654 0.011931 0.013000 0.061666 0.017015 0.203913
Revenue billed (`) 43,465 52,153 36,325 51,675 38,883 39,161 39,557 36,854 40,229 43,610 35,613 56,515 514,040
Arrear billed (`) 9,642 26,224 63,320 82,648 115,506 139,347 158,222 176,520 197,316 218,133 265,401 265,241 9,642
Surcharge (`) 177 467 1,235 1,532 2,200 2,349 2,457 2,824 3,242 3,659 4,334 4,614 29,089
Total Billed (`) 53,284 78,844 100,881 135,855 156,588 180,857 200,236 216,198 240,787 265,401 305,348 326,371 552,772
Amt. Realised (`) 27,060 15,524 18,233 20,349 17,241 22,635 23,716 18,882 22,654 - 40,107 287,038 513,439
Billing Efficiency 77.45% 122.68% 79.53% 83.51% 70.99% 54.85% 59.43% 54.08% 80.61% 57.27% 303.77% 94.01% 94.84%
Collection Efficiency 50.78% 19.69% 18.07% 14.98% 11.01% 12.52% 11.84% 8.73% 9.41% 13.13% 87.95% 92.88%
AT&C Loss 60.67% 75.84% 85.63% 87.49% 92.18% 93.14% 92.96% 95.28% 92.42% 100.00% 60.10% 17.32% 11.91%
Outages (No) 1 1 2 1 5 10
Duration (hr:m:s) 4:20:00 0:20:00 0:10:00 0:05:00 1:05:00 6:00:00
Reliability Index 99% 100% 100% 100% 100% 100% 100% 100% 100% 100% 100% 100% 99.93%
Energy Input (MU) 0.032400 0.030900 0.034000 0.033500 0.041500 0.041300 0.042800 0.045400 0.046600 0.050400 0.047500 0.046800 0.493100
Energy sold (MU) 0.028230 0.022623 0.024076 0.027730 0.035315 0.029521 0.033857 0.036341 0.040776 0.045043 0.028837 0.045408 0.397757
Revenue billed (`) 59,914 41,058 34,667 42,818 56,307 49,444 61,300 62,354 98,550 84,735 48,821 80,490 720,457
Arrear billed (`) 3,395 27,128 30,374 25,072 13,079 20,576 22,085 27,768 50,285 77,885 163,634 74,057 3,395
Surcharge (`) 233 208 479 349 392 555 344 7,088 580 1,014 1,142 981 13,366
Total Billed (`) 63,542 68,394 65,520 68,239 69,778 70,575 83,729 97,210 149,415 163,634 213,597 155,528 737,218
Amt. Realised (`) 36,414 38,020 40,448 55,160 49,202 48,490 55,961 46,925 71,530 - 139,540 109,668 691,358
Billing Efficiency 87.13% 73.21% 70.81% 82.78% 85.10% 71.48% 79.11% 80.05% 87.50% 89.37% 60.71% 97.03% 80.66%
Collection Efficiency 57.31% 55.59% 61.73% 80.83% 70.51% 68.71% 66.84% 48.27% 47.87% 65.33% 70.51% 93.78%
AT&C Loss 50.07% 59.30% 56.29% 33.09% 40.00% 50.89% 47.13% 61.36% 58.11% 100.00% 60.34% 31.58% 24.35%
Outages (No) 4 2 2 1 3 3 3 18
Duration (hr:m:s) 4:19:00 9:05:00 1:25:00 1:15:00 0:37:00 3:45:00 1:37:00 22:03:00
Reliability Index 99% 100% 100% 100% 100% 99% 100% 100% 100% 100% 99% 100% 99.75%
D.C.Complex
P.C. L
alrawnlian
a, JE
Hmunhmelth
a
P.C. L
alrawnlian
a, JE
Champhai P
ower C
ircle A
nnual R
eport 2
010-2011
56

Fdr Mgr Apr-10 May-10 Jun-10 Jul-10 Aug-10 Sep-10 Oct-10 Nov-10 Dec-10 Jan-11 Feb-11 Mar-11 Annual
MONTHWISE PERFORMANCE OF FEEDERS DURING 2010-2011
Champhai Power Sub-Division
Energy Input (MU) 0.092700 0.102600 0.078900 0.077700 0.077400 0.071700 0.079200 0.130350 0.152100 0.172500 1.035150
Energy sold (MU) 0.093300 0.102600 0.078900 0.077700 0.077400 0.071700 0.079200 0.130350 0.152100 0.172500 1.035750
Revenue billed (`) - - 368,538 1,494,870 311,655 310,800 305,730 283,215 316,850 514,883 600,795 690,000 5,197,336
Arrear billed (`) - - - 368,538 1,870,873 2,220,143 2,575,624 2,933,145 3,275,380 3,658,168 4,246,643 4,921,031 -
Surcharge (`) - - - 7,465 37,615 44,681 51,791 59,020 65,937 73,593 73,593 146,989 560,685
Total Billed (`) - - 368,538 1,870,873 2,220,143 2,575,624 2,933,145 3,275,380 3,658,168 4,246,643 4,921,031 5,758,020 5,758,020
Amt. Realised (`) - - - - - - - - - - - 5,758,020 5,758,020
Billing Efficiency #DIV/0! #DIV/0! 100.65% 100.00% 100.00% 100.00% 100.00% 100.00% 100.00% 100.00% 100.00% 100.00% 100.06%
Collection Efficiency #DIV/0! #DIV/0! 100.00% 100.00%
AT&C Loss #DIV/0! #DIV/0! 100.00% 100.00% 100.00% 100.00% 100.00% 100.00% 100.00% 100.00% 100.00% -0.06%
Outages (No)
Duration (hr:m:s)672:00:00 744:00:00 720:00:00 744:00:00 720:00:00 744:00:00 744:00:00 720:00:00 744:00:00 720:00:00 744:00:00 744:00:00 8760:00:00
Reliability Index 100% 100% 100% 100% 100% 100% 100% 100% 100% 100% 100% 100% 100.00%
Energy Input (MU) 0.738025 0.689037 0.820104 0.754204 0.923886 0.938044 0.937308 0.971500 1.027411 1.163018 1.177808 1.181939 11.322284
Energy sold (MU) 0.541190 0.524428 0.633004 0.643326 0.699865 0.721238 0.709104 0.738559 0.809826 0.887755 0.878484 1.087437 8.874216
Revenue billed (`) 1,240,023 1,146,352 1,457,290 2,756,378 1,600,638 1,667,044 1,481,479 1,678,079 1,855,940 2,168,068 1,901,891 2,773,401 21,726,582
Arrear billed (`) 360,437 516,810 719,901 1,160,106 2,827,644 3,299,429 3,764,272 4,265,865 4,906,079 5,503,188 7,779,461 7,191,368 360,437
Surcharge (`) 7,258 8,743 13,021 22,422 55,836 64,949 73,663 90,550 95,960 108,206 115,683 185,141 841,433
Total Billed (`) 1,607,718 1,671,905 2,190,211 3,938,907 4,484,118 5,031,422 5,319,414 6,034,494 6,857,979 7,779,461 9,797,035 10,149,910 22,928,451
Amt. Realised (`) 1,090,908 952,004 1,030,105 1,138,375 1,184,689 1,267,150 1,053,549 1,128,415 1,354,791 - 2,605,667 9,225,658 22,031,311
Billing Efficiency 73.33% 76.11% 77.19% 85.30% 75.75% 76.89% 75.65% 76.02% 78.82% 76.33% 74.59% 92.00% 78.38%
Collection Efficiency 67.85% 56.94% 47.03% 28.90% 26.42% 25.18% 19.81% 18.70% 19.75% 26.60% 90.89% 96.09%
AT&C Loss 50.24% 56.66% 63.70% 75.35% 79.99% 80.64% 85.02% 85.78% 84.43% 100.00% 80.16% 16.37% 24.69%
Outages (No) 30 17 45 32 34 31 60 28 63 23 17 13 393
Duration (hr:m:s) 74:02:00 25:01:00 68:40:00 66:02:00 62:47:00 27:27:00 33:41:00 36:33:00 46:53:00 14:58:00 13:47:00 5:24:00 475:15:00
Reliability Index 99% 100% 99% 99% 99% 100% 100% 100% 99% 100% 100% 100% 99.51%
33kV PHE
P.C. L
alrawnlian
a, JEEr L
althan
zuala, S
DO
Cham
phai P
ower S
ub-Divisio
n
Champhai P
ower C
ircle A
nnual R
eport 2
010-2011
57

Fdr Mgr Apr-10 May-10 Jun-10 Jul-10 Aug-10 Sep-10 Oct-10 Nov-10 Dec-10 Jan-11 Feb-11 Mar-11 Annual
Energy Input (MU) 0.025300 0.023250 0.021560 0.027400 0.039600 0.030100 0.034420 0.045400 0.031820 0.031170 0.031860 0.041110 0.382990
Energy sold (MU) 0.024321 0.022269 0.020308 0.023848 0.038193 0.029217 0.032134 0.043366 0.030640 0.028245 0.030349 0.039535 0.362425
Revenue billed (`) 98,907 54,193 58,235 60,429 65,143 78,062 168,752 130,893 55,917 67,535 55,346 89,988 983,400
Arrear billed (`) 57,996 75,692 101,743 123,469 75,918 109,616 117,018 169,133 262,042 274,417 224,694 232,107 57,996
Surcharge (`) 1,155 1,516 2,004 2,467 1,517 2,173 2,316 3,356 5,224 5,449 4,254 2,310 33,741
Total Billed (`) 158,058 131,401 161,982 186,365 142,578 189,851 288,086 303,382 323,183 347,401 284,294 324,405 1,075,137
Amt. Realised (`) 82,366 29,658 38,513 110,447 32,962 72,833 118,953 41,340 48,766 122,707 52,187 109,085 859,817
Billing Efficiency 96.13% 95.78% 94.19% 87.04% 96.45% 97.07% 93.36% 95.52% 96.29% 90.62% 95.26% 96.17% 94.63%
Collection Efficiency 52.11% 22.57% 23.78% 59.26% 23.12% 38.36% 41.29% 13.63% 15.09% 35.32% 18.36% 33.63% 79.97%
AT&C Loss 49.91% 78.38% 77.60% 48.42% 77.70% 62.76% 61.45% 86.98% 85.47% 67.99% 82.51% 67.66% 24.32%
Outages (No) 3 3 2 4 6 2 6 2 4 4 1 37
Duration (hr:m:s) 2:05:00 3:00:00 1:05:00 6:30:00 6:25:00 1:22:00 6:25:00 1:55:00 3:40:00 5:35:00 2:35:00 40:37:00
Reliability Index 100% 100% 100% 99% 99% 100% 99% 100% 100% 100% 99% 100% 99.54%
Energy Input (MU) 0.007200 0.006790 0.005460 0.006500 0.009140 0.016990 0.003340 0.009350 0.006310 0.013860 0.012130 0.007460 0.104530
Energy sold (MU) 0.006342 0.006282 0.004803 0.005594 0.007392 0.015565 0.003207 0.009108 0.006098 0.009899 0.008276 0.007250 0.089816
Revenue billed (`) 10,208 10,834 9,582 10,316 11,231 13,122 11,628 13,390 15,957 14,604 12,150 19,669 152,691
Arrear billed (`) 3,756 6,442 8,876 9,504 15,820 15,337 18,181 21,464 27,086 30,075 35,449 36,382 3,756
Surcharge (`) 77 128 176 188 296 304 363 428 526 596 697 813 4,592
Total Billed (`) 14,041 17,404 18,634 20,008 27,347 28,763 30,172 35,282 43,569 45,275 48,296 56,864 161,039
Amt. Realised (`) 7,599 8,528 9,130 4,188 12,010 10,582 8,708 8,196 13,494 9,826 11,914 55,642 159,817
Billing Efficiency 88.08% 92.52% 87.97% 86.06% 80.88% 91.61% 96.02% 97.41% 96.64% 71.42% 68.23% 97.18% 85.92%
Collection Efficiency 54.12% 49.00% 49.00% 20.93% 43.92% 36.79% 28.86% 23.23% 30.97% 21.70% 24.67% 97.85% 99.24%
AT&C Loss 52.33% 54.67% 56.90% 81.99% 64.48% 66.30% 72.29% 77.37% 70.07% 84.50% 83.17% 4.90% 14.73%
Outages (No) 1 1
Duration (hr:m:s) 0:55:00 0:55:00
Reliability Index 100% 100% 100% 100% 100% 100% 100% 100% 100% 100% 100% 100% 99.99%
MONTHWISE PERFORMANCE OF FEEDERS DURING 2010-2011
Ngurth
ansan
ga, JE
Hnah
lan
Ngurth
ansan
ga, JE
Khuan
gphah
Champhai Rural Power Sub-Division
Champhai P
ower C
ircle A
nnual R
eport 2
010-2011
58
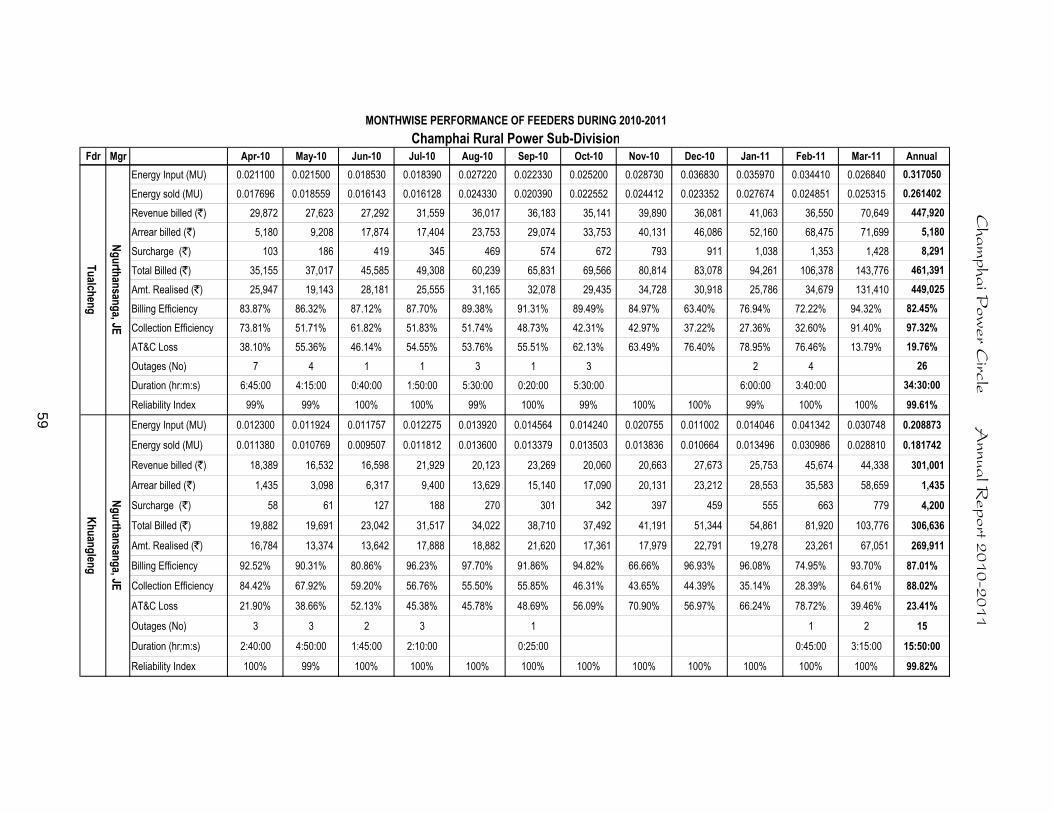
Fdr Mgr Apr-10 May-10 Jun-10 Jul-10 Aug-10 Sep-10 Oct-10 Nov-10 Dec-10 Jan-11 Feb-11 Mar-11 Annual
MONTHWISE PERFORMANCE OF FEEDERS DURING 2010-2011
Champhai Rural Power Sub-Division
Energy Input (MU) 0.021100 0.021500 0.018530 0.018390 0.027220 0.022330 0.025200 0.028730 0.036830 0.035970 0.034410 0.026840 0.317050
Energy sold (MU) 0.017696 0.018559 0.016143 0.016128 0.024330 0.020390 0.022552 0.024412 0.023352 0.027674 0.024851 0.025315 0.261402
Revenue billed (`) 29,872 27,623 27,292 31,559 36,017 36,183 35,141 39,890 36,081 41,063 36,550 70,649 447,920
Arrear billed (`) 5,180 9,208 17,874 17,404 23,753 29,074 33,753 40,131 46,086 52,160 68,475 71,699 5,180
Surcharge (`) 103 186 419 345 469 574 672 793 911 1,038 1,353 1,428 8,291
Total Billed (`) 35,155 37,017 45,585 49,308 60,239 65,831 69,566 80,814 83,078 94,261 106,378 143,776 461,391
Amt. Realised (`) 25,947 19,143 28,181 25,555 31,165 32,078 29,435 34,728 30,918 25,786 34,679 131,410 449,025
Billing Efficiency 83.87% 86.32% 87.12% 87.70% 89.38% 91.31% 89.49% 84.97% 63.40% 76.94% 72.22% 94.32% 82.45%
Collection Efficiency 73.81% 51.71% 61.82% 51.83% 51.74% 48.73% 42.31% 42.97% 37.22% 27.36% 32.60% 91.40% 97.32%
AT&C Loss 38.10% 55.36% 46.14% 54.55% 53.76% 55.51% 62.13% 63.49% 76.40% 78.95% 76.46% 13.79% 19.76%
Outages (No) 7 4 1 1 3 1 3 2 4 26
Duration (hr:m:s) 6:45:00 4:15:00 0:40:00 1:50:00 5:30:00 0:20:00 5:30:00 6:00:00 3:40:00 34:30:00
Reliability Index 99% 99% 100% 100% 99% 100% 99% 100% 100% 99% 100% 100% 99.61%
Energy Input (MU) 0.012300 0.011924 0.011757 0.012275 0.013920 0.014564 0.014240 0.020755 0.011002 0.014046 0.041342 0.030748 0.208873
Energy sold (MU) 0.011380 0.010769 0.009507 0.011812 0.013600 0.013379 0.013503 0.013836 0.010664 0.013496 0.030986 0.028810 0.181742
Revenue billed (`) 18,389 16,532 16,598 21,929 20,123 23,269 20,060 20,663 27,673 25,753 45,674 44,338 301,001
Arrear billed (`) 1,435 3,098 6,317 9,400 13,629 15,140 17,090 20,131 23,212 28,553 35,583 58,659 1,435
Surcharge (`) 58 61 127 188 270 301 342 397 459 555 663 779 4,200
Total Billed (`) 19,882 19,691 23,042 31,517 34,022 38,710 37,492 41,191 51,344 54,861 81,920 103,776 306,636
Amt. Realised (`) 16,784 13,374 13,642 17,888 18,882 21,620 17,361 17,979 22,791 19,278 23,261 67,051 269,911
Billing Efficiency 92.52% 90.31% 80.86% 96.23% 97.70% 91.86% 94.82% 66.66% 96.93% 96.08% 74.95% 93.70% 87.01%
Collection Efficiency 84.42% 67.92% 59.20% 56.76% 55.50% 55.85% 46.31% 43.65% 44.39% 35.14% 28.39% 64.61% 88.02%
AT&C Loss 21.90% 38.66% 52.13% 45.38% 45.78% 48.69% 56.09% 70.90% 56.97% 66.24% 78.72% 39.46% 23.41%
Outages (No) 3 3 2 3 1 1 2 15
Duration (hr:m:s) 2:40:00 4:50:00 1:45:00 2:10:00 0:25:00 0:45:00 3:15:00 15:50:00
Reliability Index 100% 99% 100% 100% 100% 100% 100% 100% 100% 100% 100% 100% 99.82%
Ngurth
ansan
ga, JE
Tualch
eng
Champhai P
ower C
ircle A
nnual R
eport 2
010-2011
59
Ngurth
ansan
ga, JE
Khuan
glen
g

Fdr Mgr Apr-10 May-10 Jun-10 Jul-10 Aug-10 Sep-10 Oct-10 Nov-10 Dec-10 Jan-11 Feb-11 Mar-11 Annual
MONTHWISE PERFORMANCE OF FEEDERS DURING 2010-2011
Champhai Rural Power Sub-Division
Energy Input (MU) 0.014500 0.015350 0.016171 0.018200 0.003294 0.003512 0.003254 0.004525 0.002657 0.006530 0.009773 0.004780 0.102546
Energy sold (MU) 0.012831 0.012631 0.011796 0.015676 0.003197 0.003403 0.003099 0.004220 0.002619 0.004308 0.008568 0.003697 0.086045
Revenue billed (`) 34,174 18,833 21,614 24,720 6,695 7,477 6,151 7,008 7,415 6,609 12,597 16,321 169,614
Arrear billed (`) 12,962 29,263 32,315 30,255 10,973 12,350 13,642 17,072 19,901 22,506 25,410 33,185 12,962
Surcharge (`) 251 580 640 601 715 764 300 339 391 445 505 570 6,101
Total Billed (`) 47,387 48,676 54,569 55,576 18,383 20,591 20,093 24,419 27,707 29,560 38,512 50,076 188,677
Amt. Realised (`) 18,124 16,361 24,314 17,491 6,033 6,949 3,021 4,518 5,201 4,150 5,327 45,014 156,503
Billing Efficiency 88.49% 82.29% 72.95% 86.13% 97.06% 96.90% 95.24% 93.26% 98.57% 65.97% 87.67% 77.34% 83.91%
Collection Efficiency 38.25% 33.61% 44.56% 31.47% 32.82% 33.75% 15.04% 18.50% 18.77% 14.04% 13.83% 89.89% 82.95%
AT&C Loss 66.16% 72.34% 67.50% 72.89% 68.15% 67.30% 85.68% 82.75% 81.50% 90.74% 87.87% 30.48% 30.40%
Outages (No) 2 1 3
Duration (hr:m:s) 2:35:00 0:45:00 3:20:00
Reliability Index 100% 100% 100% 100% 100% 100% 100% 100% 100% 100% 100% 100% 99.96%
Energy Input (MU) 0.015500 0.016722 0.017251 0.019823 0.029936 0.023134 0.025346 0.012774 0.040984 0.048850 0.083183 0.038110 0.371613
Energy sold (MU) 0.012337 0.014727 0.014555 0.017212 0.017582 0.021194 0.022523 0.012509 0.021473 0.036677 0.027901 0.035081 0.253771
Revenue billed (`) 21,051 23,431 25,873 29,225 29,787 24,998 33,588 28,841 31,691 54,317 41,225 53,059 397,086
Arrear billed (`) 3,181 7,082 12,649 16,783 22,929 32,660 33,696 40,295 47,304 56,634 91,716 102,833 3,181
Surcharge (`) 207 140 251 323 449 635 666 791 940 1,123 1,744 1,491 8,760
Total Billed (`) 24,439 30,653 38,773 46,331 53,165 58,293 67,950 69,927 79,935 112,074 134,685 157,383 409,027
Amt. Realised (`) 17,357 18,004 21,990 23,402 20,505 24,597 27,655 22,623 23,301 20,358 31,852 102,939 354,583
Billing Efficiency 79.59% 88.07% 84.37% 86.83% 58.73% 91.61% 88.86% 97.93% 52.39% 75.08% 33.54% 92.05% 68.29%
Collection Efficiency 71.02% 58.73% 56.71% 50.51% 38.57% 42.20% 40.70% 32.35% 29.15% 18.16% 23.65% 65.41% 86.69%
AT&C Loss 43.47% 48.27% 52.15% 56.14% 77.35% 61.34% 63.83% 68.32% 84.73% 86.36% 92.07% 39.79% 40.80%
Outages (No) 2 5 3 5 15
Duration (hr:m:s) 1:30:00 7:35:00 4:25:00 7:35:00 21:05:00
Reliability Index 100% 100% 100% 100% 99% 99% 99% 100% 100% 100% 100% 100% 99.76%
Buan
g
Ngurth
ansan
ga, JE
Leisen
zo
Ngurth
ansan
ga, JE
Champhai P
ower C
ircle A
nnual R
eport 2
010-2011
60

Fdr Mgr Apr-10 May-10 Jun-10 Jul-10 Aug-10 Sep-10 Oct-10 Nov-10 Dec-10 Jan-11 Feb-11 Mar-11 Annual
MONTHWISE PERFORMANCE OF FEEDERS DURING 2010-2011
Champhai Rural Power Sub-Division
Energy Input (MU) 0.094500 0.093750 0.086810 0.088190 0.113690 0.086350 0.102510 0.134150 0.129500 0.144720 0.281620 0.103270 1.459060
Energy sold (MU) 0.080395 0.083395 0.070843 0.074075 0.098747 0.078182 0.086536 0.115090 0.115963 0.127555 0.143917 0.090398 1.165096
Revenue billed (`) 150,797 150,797 149,690 143,756 173,869 182,809 177,691 197,907 168,468 207,915 210,874 296,101 2,210,674
Arrear billed (`) 75,955 104,620 138,293 136,455 149,731 157,181 161,555 166,176 170,828 194,434 209,479 242,583 75,955
Surcharge (`) 1,509 2,080 2,744 3,098 2,540 2,969 3,140 3,258 3,368 3,857 4,070 5,285 37,918
Total Billed (`) 228,261 257,497 290,727 283,309 326,140 342,959 342,386 367,341 342,664 406,206 424,423 543,969 2,324,547
Amt. Realised (`) 123,641 119,204 154,272 133,578 168,959 181,404 176,211 196,513 148,230 196,727 181,840 471,773 2,252,352
Billing Efficiency 85.07% 88.95% 81.61% 83.99% 86.86% 90.54% 84.42% 85.79% 89.55% 88.14% 51.10% 87.54% 79.85%
Collection Efficiency 54.17% 46.29% 53.06% 47.15% 51.81% 52.89% 51.47% 53.50% 43.26% 48.43% 42.84% 86.73% 96.89%
AT&C Loss 53.92% 58.82% 56.70% 60.40% 55.00% 52.11% 56.55% 54.10% 61.26% 57.31% 78.11% 24.08% 22.63%
Outages (No) 6 5 3 5 5 7 5 2 6 3 5 4 56
Duration (hr:m:s) 5:15:00 5:15:00 3:00:00 8:08:00 5:05:00 10:08:00 5:05:00 4:10:00 2:55:00 4:55:00 8:20:00 4:35:00 66:51:00
Reliability Index 99% 99% 100% 99% 99% 99% 99% 99% 100% 99% 99% 99% 99.24%
Energy Input (MU) 0.190400 0.189286 0.177539 0.190778 0.236800 0.196980 0.208310 0.255684 0.259103 0.295146 0.494318 0.252318 2.946662
Energy sold (MU) 0.165302 0.168632 0.147955 0.164345 0.203041 0.181330 0.183554 0.222541 0.210809 0.247854 0.274848 0.230086 2.400297
Revenue billed (`) 363,398 302,243 308,884 321,934 342,865 365,920 453,011 438,592 343,202 417,796 414,416 590,125 4,662,386
Arrear billed (`) 160,465 235,405 318,067 343,270 312,753 371,358 394,935 474,402 596,459 658,779 690,806 777,448 160,465
Surcharge (`) 3,360 4,691 6,361 7,210 6,256 7,720 7,799 9,362 11,819 13,063 13,286 12,676 103,603
Total Billed (`) 527,223 542,339 633,312 672,414 661,874 744,998 855,745 922,356 951,480 1,089,638 1,118,508 1,380,249 4,926,454
Amt. Realised (`) 291,818 224,272 290,042 332,549 290,516 350,063 381,344 325,897 292,701 398,832 341,060 982,914 4,502,008
Billing Efficiency 86.82% 89.09% 83.34% 86.14% 85.74% 92.06% 88.12% 87.04% 81.36% 83.98% 55.60% 91.19% 81.46%
Collection Efficiency 55.35% 41.35% 45.80% 49.46% 43.89% 46.99% 44.56% 35.33% 30.76% 36.60% 30.49% 71.21% 91.38%
AT&C Loss 51.95% 63.16% 61.83% 57.40% 62.36% 56.74% 60.73% 69.25% 74.97% 69.26% 83.05% 35.06% 25.56%
Outages (No) 23 16 8 13 19 15 19 4 10 5 14 7 153
Duration (hr:m:s) 20:50:00 18:15:00 6:30:00 18:38:00 24:35:00 17:25:00 24:35:00 6:05:00 6:35:00 10:55:00 18:20:00 10:25:00 183:08:00
Reliability Index 100% 100% 100% 100% 100% 100% 100% 100% 100% 100% 100% 100% 99.70%
R.Van
lalhluna, S
DO
Rural P
ower S
ub-Divisio
nLeith
um
F. L
alzawmlian
a, JE
Champhai P
ower C
ircle A
nnual R
eport 2
010-2011
61
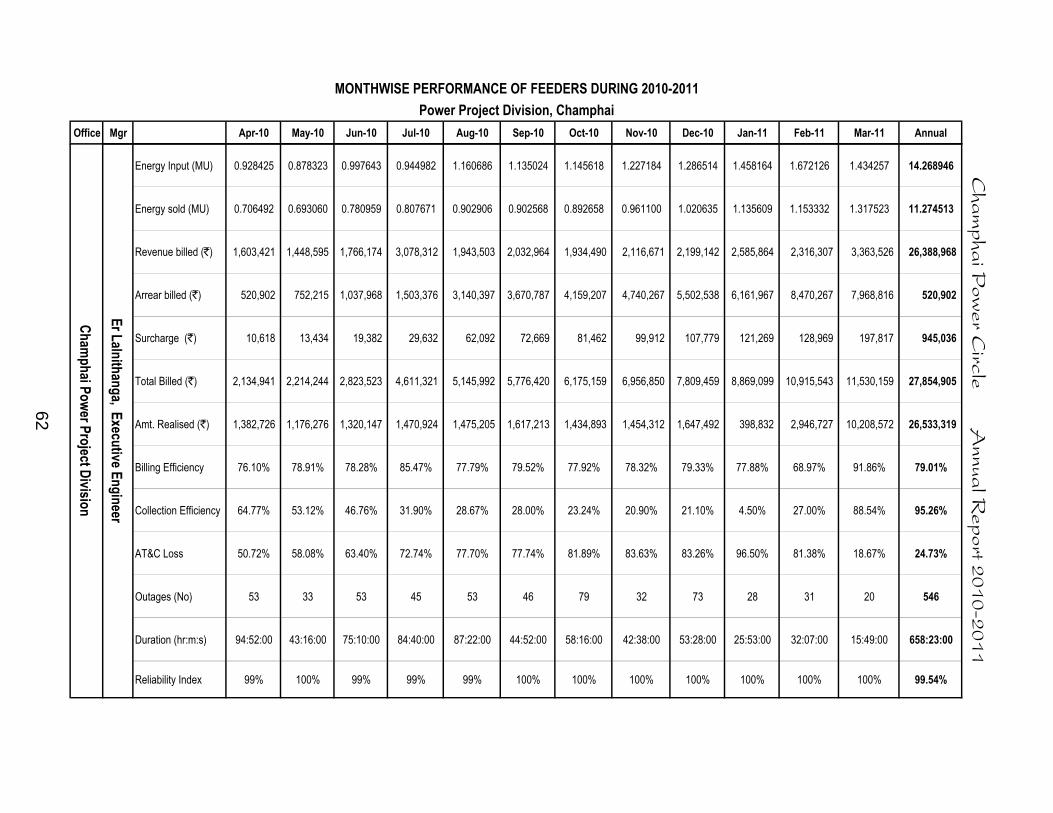
Office Mgr Apr-10 May-10 Jun-10 Jul-10 Aug-10 Sep-10 Oct-10 Nov-10 Dec-10 Jan-11 Feb-11 Mar-11 Annual
MONTHWISE PERFORMANCE OF FEEDERS DURING 2010-2011
Power Project Division, Champhai
Energy Input (MU) 0.928425 0.878323 0.997643 0.944982 1.160686 1.135024 1.145618 1.227184 1.286514 1.458164 1.672126 1.434257 14.268946
Energy sold (MU) 0.706492 0.693060 0.780959 0.807671 0.902906 0.902568 0.892658 0.961100 1.020635 1.135609 1.153332 1.317523 11.274513
Revenue billed (`) 1,603,421 1,448,595 1,766,174 3,078,312 1,943,503 2,032,964 1,934,490 2,116,671 2,199,142 2,585,864 2,316,307 3,363,526 26,388,968
Arrear billed (`) 520,902 752,215 1,037,968 1,503,376 3,140,397 3,670,787 4,159,207 4,740,267 5,502,538 6,161,967 8,470,267 7,968,816 520,902
Surcharge (`) 10,618 13,434 19,382 29,632 62,092 72,669 81,462 99,912 107,779 121,269 128,969 197,817 945,036
Total Billed (`) 2,134,941 2,214,244 2,823,523 4,611,321 5,145,992 5,776,420 6,175,159 6,956,850 7,809,459 8,869,099 10,915,543 11,530,159 27,854,905
Amt. Realised (`) 1,382,726 1,176,276 1,320,147 1,470,924 1,475,205 1,617,213 1,434,893 1,454,312 1,647,492 398,832 2,946,727 10,208,572 26,533,319
Billing Efficiency 76.10% 78.91% 78.28% 85.47% 77.79% 79.52% 77.92% 78.32% 79.33% 77.88% 68.97% 91.86% 79.01%
Collection Efficiency 64.77% 53.12% 46.76% 31.90% 28.67% 28.00% 23.24% 20.90% 21.10% 4.50% 27.00% 88.54% 95.26%
AT&C Loss 50.72% 58.08% 63.40% 72.74% 77.70% 77.74% 81.89% 83.63% 83.26% 96.50% 81.38% 18.67% 24.73%
Outages (No) 53 33 53 45 53 46 79 32 73 28 31 20 546
Duration (hr:m:s) 94:52:00 43:16:00 75:10:00 84:40:00 87:22:00 44:52:00 58:16:00 42:38:00 53:28:00 25:53:00 32:07:00 15:49:00 658:23:00
Reliability Index 99% 100% 99% 99% 99% 100% 100% 100% 100% 100% 100% 100% 99.54%
Champhai P
ower C
ircle A
nnual R
eport 2
010-2011
62
Er Laln
ithanga, E
xecutive E
ngineer
Cham
phai P
ower P
roject D
ivision

Office Mgr Apr-10 May-10 Jun-10 Jul-10 Aug-10 Sep-10 Oct-10 Nov-10 Dec-10 Jan-11 Feb-11 Mar-11 Annual
MONTHWISE PERFORMANCE OF FEEDERS UNDER CHAMPHAI POWER CIRCLE FOR 2010-2011
Champhai Power Circle
Energy Input (MU) 1.491448 1.400374 1.532121 1.420901 1.762429 1.792960 1.810181 1.949033 1.979036 2.216541 2.372816 2.400833 22.128673
Energy sold (MU) 1.162972 1.125591 1.226088 1.224720 1.407943 1.451996 1.454817 1.529458 1.592102 1.743447 1.730583 2.066759 17.716476
Revenue billed (`) 2,490,347 2,309,132 2,630,740 3,892,366 2,857,651 3,037,201 2,962,423 3,182,314 3,291,572 3,718,603 3,389,530 4,806,086 38,567,964
Arrear billed (`) 656,996 1,034,496 1,443,818 2,022,951 3,817,349 4,493,481 5,073,009 5,834,044 6,792,868 7,617,213 10,124,332 9,758,400 656,996
Surcharge (`) 13,277 19,095 27,500 40,026 75,638 89,123 99,740 121,789 133,588 150,375 162,064 233,629 1,165,845
Total Billed (`) 3,160,620 3,362,723 4,102,057 5,955,344 6,750,638 7,619,805 8,135,172 9,138,147 10,218,028 11,486,190 13,675,926 14,798,115 40,390,804
Amt. Realised (`) 2,126,124 1,918,905 2,079,106 2,137,995 2,257,157 2,546,796 2,301,129 2,345,278 2,607,795 1,361,858 3,917,526 12,990,593 38,590,262
Billing Efficiency 77.98% 80.38% 80.03% 86.19% 79.89% 80.98% 80.37% 78.47% 80.45% 78.66% 72.93% 86.09% 80.06%
Collection Efficiency 67.27% 57.06% 50.68% 35.90% 33.44% 33.42% 28.29% 25.66% 25.52% 11.86% 28.65% 87.79% 95.54%
AT&C Loss 47.55% 54.13% 59.44% 69.06% 73.29% 72.93% 77.27% 79.86% 79.47% 90.67% 79.11% 24.43% 23.51%
Outages (No) 100 202 353 306 311 154 182 190 234 127 98 66 2323
Duration (hr:m:s) 206:44:00 294:49:00 660:26:00 785:27:00 571:23:00 161:05:00 150:58:00 242:15:00 311:34:00 175:10:00 108:14:00 92:12:00 3760:17:00
20160:00:00 21817:00:00 21266:00:00 21819:00:00 21268:00:00 21821:00:00 21822:00:00 21271:00:00 21824:00:00 21273:00:00 21826:00:00 21827:00:00 ###########
Reliability Index 99% 99% 97% 96% 97% 99% 99% 99% 99% 99% 100% 100% 98.54%
Champhai P
ower C
ircle A
nnual R
eport 2
010-2011
63
Cham
phai P
ower C
ircle
Er F Rualzakh
uma, S
uperin
tending Engineer

Champhai Power Circle Annual Report 2010-2011
Tuipui SHP
Lamsial SHP
0.00 0.10 0.20 0.30 0.40 0.50 0.60Million Unit
Po
wer
Sta
tio
nLocal Generation during 2010-11
1.03
1.16 1.18 1.18
1.00
1.20
Energy Input during 2010-11
64
0.74
0.69
0.82
0.75
0.92 0.94 0.940.97
1.03
0.19 0.19 0.18 0.190.24
0.20 0.21
0.26 0.260.30
0.49
0.25
0.330.31
0.33
0.28
0.360.38 0.39
0.42 0.420.44
0.42
0.61
0.230.21 0.20 0.19
0.250.28 0.27
0.30 0.280.32
0.28
0.35
0.00
0.20
0.40
0.60
0.80
1.00
Apr
'10
May
'10
Jun
'10
Jul '
10
Aug
'10
Sep
'10
Oct
'10
Nov
'10
Dec
'10
Jan
'11
Feb
'11
Mar
'11
Mill
ion
Un
it
Month
CPSD
RPSD
KPSD
NGPSD
64