annual report - nevada...annual report fiscal year 2019 (2018-2019) state of nevada department of...
TRANSCRIPT
ANNUAL REPORT
Fiscal Year 2019 (2018-2019)
State of Nevada
Department of Taxation
Steve Sisolak Governor
State of Nevada
January 2020
Melanie Young Executive Director
Department of Taxation

January 15, 2020
The Honorable Steve SisolakGovernor of NevadaExecutive ChambersCarson City, NV 89701
Dear Governor Sisolak:
Revenues 2017-18 2018-19Increase/ (Decrease)
Percentage Change
Sales and Use Tax 1,148,256,329$ 1,241,341,110$ 93,084,781$ 8.11%Local School Support Tax 1,478,932,761 1,591,604,748 112,671,987 7.62%City/County Relief Tax 1,290,742,235 1,367,456,176 76,713,941 5.94%Local Options Tax 734,690,403 783,093,531 48,403,129 6.59%Intoxicating Beverage Tax 49,174,854 49,891,481 716,627 1.46%Cigarette Tax 170,123,732 174,462,289 4,338,557 2.55%Other Tobacco Products 16,496,006 18,099,022 1,603,017 9.72%Estate Tax 19,557 30,859 11,302 57.79%Lodging Tax 204,579,868 208,476,951 3,897,083 1.90%Net Proceeds of Mineral Tax 155,938,531 123,582,585 (32,355,946) -20.75%Centrally Assessed Property Tax 110,909,514 114,396,812 3,487,298 3.14%Insurance Premium Tax 381,540,491 409,840,471 28,299,980 7.42%Tire Tax 2,017,921 2,123,281 105,360 5.22%Government Service Fee 66,199,896 68,294,661 2,094,765 3.16%Bank Excise Tax 2,745,343 2,802,489 57,146 2.08%Business and Exhibition Fee 176,605 40,534 (136,071) -77.05%Live Entertainment Tax 24,694,887 25,792,344 1,097,457 4.44%Modified Business Tax 581,975,518 640,515,866 58,540,348 10.06%Real Property Transfer Tax 147,574,926 144,229,417 (3,345,509) -2.27%Transportation Connection Tax 26,773,229 30,216,771 3,443,541 12.86%Commerce Tax 201,926,513 226,770,333 24,843,821 12.30%Medical Marijuana Tax 92,765 204,642 111,876 120.60%Wholesale Marijuana Tax 27,270,582 44,000,057 16,729,475 61.35%Retail Marijuana Tax 42,489,201 55,184,916 12,695,715 29.88%Marijuana Fees 11,671,035 9,857,044 (1,813,992) -15.54%
Total 6,877,012,704$ 7,332,308,390$ 455,295,686$ 6.62%
Pursuant to NRS 360.100, the Department of Taxation submits herewith the Annual Report for Fiscal Year 2019 which ended June 30, 2019. Gross revenues and distributions during the period were as follows:
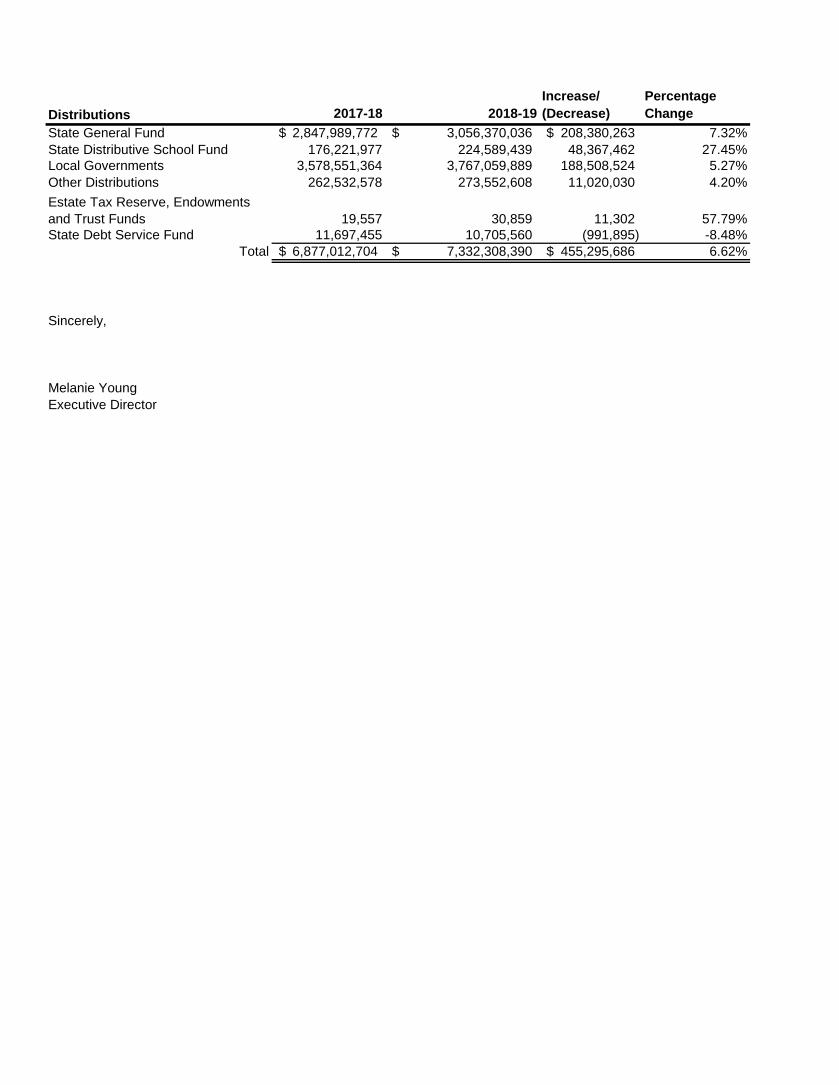
Distributions 2017-18 2018-19Increase/ (Decrease)
Percentage Change
State General Fund 2,847,989,772$ 3,056,370,036$ 208,380,263$ 7.32%State Distributive School Fund 176,221,977 224,589,439 48,367,462 27.45%Local Governments 3,578,551,364 3,767,059,889 188,508,524 5.27%Other Distributions 262,532,578 273,552,608 11,020,030 4.20%
19,557 30,859 11,302 57.79%State Debt Service Fund 11,697,455 10,705,560 (991,895) -8.48%
Total 6,877,012,704$ 7,332,308,390$ 455,295,686$ 6.62%
Sincerely,
Melanie YoungExecutive Director
Estate Tax Reserve, Endowments and Trust Funds

I. DEPARTMENT OF TAXATION
MISSION, PHILOSOPHY, AND GOALS------------------------------------------------------------------------- 1
TOTAL DEPARTMENT TAX REVENUES AND DISTRIBUTIONS----------------------------------------2
STATUTORY AUTHORITY; BOARDS AND COMMISSIONS----------------------------------------------3
DEPARTMENT ADMINISTRATION, ORGANIZATION AND FUNCTIONS----------------------------- 5
ORGANIZATIONAL CHART-----------------------------------------------------------------------------------------7
DEPARTMENT FINANCIAL STATEMENTS-------------------------------------------------------------------- 8
II. SALES, USE AND MODIFIED BUSINESS TAXES
CERTIFIED POPULATION------------------------------------------------------------------------------------------ 10
COMPONENTS OF SALES AND USE TAX RATES----------------------------------------------------------11 LOCAL SALES AND USE TAX RATES MAP---------------------------------------------------------------12
TAXABLE SALES COMPARISON--------------------------------------------------------------------------------- 13
SALES AND USE TAX REVENUE---------------------------------------------------------------------------------14
LOCAL SCHOOL SUPPORT TAX REVENUE------------------------------------------------------------------17
BASIC CITY/COUNTY RELIEF TAX REVENUE---------------------------------------------------------------19
SUPPLEMENTAL CITY/COUNTY RELIEF TAX REVENUE------------------------------------------------21
LOCAL OPTION SALES AND USE TAX REVENUE----------------------------------------------------------25
STAR BOND REVENUE----------------------------------------------------------------------------------------------28
CONSOLIDATED TAX REVENUE---------------------------------------------------------------------------------29
BUSINESS AND EXHIBITION FEE REVENUE---------------------------------------------------------------- 33
MODIFIED BUSINESS TAX REVENUE--------------------------------------------------------------------------34
III. EXCISE TAXES
LIVE ENTERTAINMENT TAX REVENUE------------------------------------------------------------------------36
BANK EXCISE TAX REVENUE------------------------------------------------------------------------------------ 37
INSURANCE PREMIUM TAX REVENUE------------------------------------------------------------------------38
CIGARETTE AND OTHER TOBACCO PRODUCTS TAX REVENUE----------------------------------- 40 TRANSFER OF CIGARETTE TAX REVENUE-------------------------------------------------------------45

Excise Taxes (continued)
LIQUOR TAX REVENUE---------------------------------------------------------------------------------------------46 TRANSFER OF LIQUOR TAX REVENUE-------------------------------------------------------------------51
ALCOHOLIC BEVERAGE GROWTH----------------------------------------------------------------------------- 52
LODGING TAX REVENUE-------------------------------------------------------------------------------------------54
ESTATE TAX REVENUE---------------------------------------------------------------------------------------------56 DISTRIBUTION OF ESTATE TAX REVENUE------------------------------------------------------------- 57
TIRE TAX REVENUE--------------------------------------------------------------------------------------------------58
GOVERNMENT SERVICES FEE REVENUE-------------------------------------------------------------------59
RETAIL MARIJUANA TAX REVENUE----------------------------------------------------------------------------61
WHOLESALE MARIJUANA TAX REVENUE----------------------------------------------------------------- 62
MARIJUANA FEE REVENUE--------------------------------------------------------------------------------------- 64
TRANSPORTATION CONNECTION TAX REVENUE--------------------------------------------------------66
COMMERCE TAX REVENUE---------------------------------------------------------------------------------------67
IV. LOCAL GOVERNMENT SERVICES
LOCAL GOVERNMENT SERVICES OVERVIEW------------------------------------------------------------- 68
CERTIFICATION OF APPRAISERS------------------------------------------------------------------------------ 70
STATE BOARD OF EQUALIZATION----------------------------------------------------------------------------- 71
ASSESSED VALUATIONS------------------------------------------------------------------------------------------ 73
REAL PROPERTY TRANSFER TAX REVENUE-------------------------------------------------------------- 75
NET PROCEEDS OF MINERALS REVENUE------------------------------------------------------------------ 77
MINING PROPERTIES----------------------------------------------------------------------------------------------- 80
PROPERTY TAXES - CENTRALLY ASSESSED PROPERTIES---------------------------------------- 81
LOCAL GOVERNMENT FINANCE-------------------------------------------------------------------------------- 85
V. ADDITIONAL INFORMATION
CONTACTS--------------------------------------------------------------------------------------------------------------87

Department of TaxationTax Commission
James DeVolld, ChairMelanie Young, Executive Director
Mission
Philosophy
Goals1. Ensure the stable administration of tax statutes.2. Improve compliance through education, information and enforcement.
5. Assure the fair and equitable treatment of taxpayers.6. Enhance workforce proficiency through training and communication.7. Improve tax administration through new technology.
Main Office Las Vegas District Office Reno District Office1550 College Parkway, Suite 115 Grant Sawyer Office Building Kietzke PlazaCarson City, Nevada 89706 555 East Washington Avenue, Suite 1300 4600 Kietzke Lane
Las Vegas, Nevada 89101 Building L, Suite 235Mailing Phone: (702) 486-2300 Reno, Nevada 895021550 College Parkway, Suite 115 Fax: (702) 486-2373 Phone: (775) 687-9999Carson City, Nevada 89706 Fax: (775) 688-1303
Phone: (775) 684-2000 Henderson Field OfficeIn-State Toll Free: (800) 992-0900 2550 Paseo Verde Parkway, Suite 180Fax: (775) 684-2020 Henderson, Nevada 89074
Phone: (702) 486-2300Fax: (702) 486-3377
or one of our offices at the following locations:
Provide fair, efficient and effective administration of tax programs for the State of Nevada in accordance with applicablestatutes, regulations and policies. Serve the taxpayers and state and local government entities, and enable and recognizeDepartment employees.
Dedicated to the highest standards of professionalism and ethical conduct. Committed to consistent, impartial andcourteous service and treatment. Providing resources, training and support to the men and women of the Department.Fostering initiative, creativity and effective performance.
3. Cooperate with other agencies and entities to better serve taxpayers.
Please visit our website at https://tax.nv.gov
4. Provide improved and more efficient service.
1

TOTAL DEPARTMENT TAX REVENUES AND TAX DISTRIBUTIONS
6
7
8
9
Sales and Use Taxes68.0%
Modified Business Tax
8.7%
Insurance Premium Tax
5.6%
Other Taxes5.3%
Commerce Tax3.1%
Cigarette and Tobacco Taxes
2.6%
Real Property Transfer Tax
2.0%
Net Proceeds of Minerals Tax
1.7%Centrally Assessed
Property Tax1.6%
Marijuana Taxes and Fees
1.5%
TAX REVENUES
Local Governments51.4%
State General Fund
41.7%
Other Distributions3.7%
State Distributive School Fund
3.1%
State Debt Service0.1%
TAX DISTRIBUTIONS
2

DEPARTMENT OF TAXATION
NRS TITLE/DESCRIPTION
Counties: Financing of Public Improvements 244ATourism Improvements 271AMunicipal Obligations 350Local Finance Administration 354General Provisions (includes Consolidated Tax) 360Exhibition and Business License Fee 360.760-360.796Sales and Use Tax Administration 360BProperty Tax, Taxes on Agricultural Property and Open Space 361, 361ATaxes on Patented Mines and Proceeds of Minerals 362Excise Tax on Banks 363A.120Business Tax: Financial Institutions and Mining, Business Tax 363A, 363BCommerce Tax 363CTax on Rental of Transient Lodging 364.125Tax on Live Entertainment 368AIntoxicating Liquor: Licenses and Taxes 369Tobacco: Licenses and Taxes; Supervision of Manufacturers and Wholesale Dealers 370State Sales and Use Taxes 372Tax on Controlled Substances (Wholesale and Retail Marijuana Tax)Taxes on Passenger CarriersLocal School Support TaxesTaxes on Transfers of Real PropertyTax on EstatesGeneration-Skipping Transfer TaxTaxes for Development of Open-Space LandCity-County Relief TaxTaxes for Miscellaneous Special PurposesTax for Infrastructure Tax on Residential ConstructionFee for Purchase of New TireMedical Use of MarijuanaRegulation and Taxation of MarijuanaShort-Term Auto Lease FeeControl of Floods - TaxationFees and Taxes (Insurance Premium Tax)Motor Carriers (Transportation Connection Tax)
372A372B374375375A375B376A377377A377B387.329 -387.332 444A.090453A453D482.313 543.600680B706
Statutory authority: Chapter 748 of the 1975 Statutes established the Department of Taxation and provided for itsorganization, powers, duties and functions. The Department is responsible for administering applicable sections of thefollowing statutes:
The Nevada Tax Commission, established on March 20, 1913, was created by the Twenty-Sixth Session of the Nevada Legislature. The first meeting of the Commission was held on April 3, 1913 in Carson City and present were two appointed Commissionerships and the First Associate Commissioner of the Railroad. In 1914 the Nevada Tax Commission prepared the Initial Report which detailed the tax assessment and expenditures. The Nevada Tax Commission now consists of eight members which are appointed by the Governor.
3

BOARDS AND COMMISSIONS
James DeVolld, Chair George Kelesis, MemberAnn Bersi, Ph.D. Member Anthony Wren, MemberFrancine J. Lipman, Member Sharon R. Rigby, Member
Dennis K. Meservy, Chairman Benjamin Q. Johnson, MemberGlenn Trowbridge, Member Al Plank, Member
Marvin Leavitt, Chairman Beth Kohn-Cole, MemberJeff Cronk, Member Marty Johnson, MemberGina Rackley, Member Tom Ciesynski, MemberJim McIntosh, Member Christine Vuletich, Member
Sorin Popa, Chair Chris Sarman, MemberJeff Payson, Member Shannon Silva, Member
Vacant Seat, Chairman Vacant SeatVacant Seat Vacant SeatVacant Seat
Vacant Seat
Governor Steve Sisolak, Ex Officio Member
Mary Walker, MemberPaul Johnson, Member
The Appraiser Certification Board is composed of six members, three of whom are qualified appraisers chosen bythe majority vote of the Nevada Assessor's Association, and three are appointed by the Nevada Tax Commission perNRS 361. The Board advises the Department on matters pertaining to certification and continuing education ofappraisers.
Jana Seddon, MemberKelson Powell, Member
Robert Schiffmacher, Member
The Committee on Local Government Finance is composed of 11 members appointed as follows: three personsappointed by the Nevada League of Cities; three persons appointed by the Nevada Association of Counties; threepersons appointed by the Nevada Association of School Boards; and two persons appointed by the Nevada StateBoard of Accountancy. The purpose of this Committee is to advise the Department regarding regulations, proceduresand forms for compliance with NRS 354.470 through 354.626 (Local Government Budget Act).
Jessica Colvin, Member
Randy J. Brown, MemberCraig Witt, Member
The State Board of Equalization is composed of five members appointed by the Governor per NRS 361.375. TheBoard hears and acts on appeals from the actions of the various county boards of equalization or from valuations set by the Nevada Tax Commission. The Board of Equalization convenes on the 4th Monday in March and shall conclude thebusiness of equalization in cases having a substantial effect on tax revenues on or before April 30. Additional cases nothaving substantial effect on tax revenues may be heard at meetings prior to November 1.
The Mining Oversight and Accountability Commission was created by Senate Bill 493 of the 2011 Session of theNevada Legislature. The Commission is comprised of seven members who are appointed by the Governor per NRS514A. The Commission has oversight of compliance with Nevada law relating to the activities of each state agency,board, bureau, commission, department or division with respect to the taxation, operation, safety and environmentalregulation of mines and mining in Nevada. The Department of Taxation serves as staff to the Commission.
The Nevada Tax Commission is composed of eight members appointed by the Governor as established by NevadaRevised Statute 360.010. The Governor is an ex officio, nonvoting member of the Commission. The Commission is thehead of the Department and exercises general supervision and control over its activities. The Chief AdministrativeOfficer of the Department is the Executive Director, who is also appointed by the Governor. Actions by the Departmentmay be appealed to the Commission as provided by law. The Commission may review all decisions of the Departmentand may reverse, affirm or modify them.
Vacant Seat
4

DEPARTMENT OF TAXATION ADMINISTRATION
Shellie Hughes Tasha Couste Kannaiah VadlakuntaChief Deputy Deputy Executive Director Deputy Executive Director
Executive Director Administrative Services Information Technology
Jeff Mitchell Tyler Klimas Terri UptonDeputy Executive Director Deputy Executive Director Deputy Executive Director
Local Government Services Marijuana Enforcement Compliance
Melanie YoungExecutive Director
DEPARTMENT ORGANIZATION AND FUNCTIONSThe Department maintains four office locations. The headquarters is located in Carson City, with district offices in Henderson, Las Vegas and Reno. For fiscal years 2018-19 the Department’s staff consisted of 425 full-time equivalent (FTE) positions statewide with a budget of $92,151,674.
The Department of Taxation has six major Divisions: Executive; Administrative Services; Information Technology; Local Government Services; Marijuana Enforcement; and Compliance, which consists of both the Revenue/Collection and Audit Sections. The Department acts as staff to the Nevada Tax Commission, State Board of Equalization and Committee on Local Government Finance. In addition, the Department is also responsible for annually developing the official population estimates the State and the various counties, cities, towns and townships. These estimates, after certification by the Governor, are used to distribute certain revenues to counties, cities and towns, and to determine the appropriate number of justices of the peace.
Executive is comprised of the Executive Director, who acts as the secretary to the Nevada Tax Commission and the State Board of Equalization; Deputy Directors; Administrative Law Judges; Executive Review section; Internal Audit; Communication and an administrative assistant. Staff administers taxpayer petitions and taxpayer hearings, performs internal audit functions, and conducts media and public relations.
Administrative Services is responsible for providing centralized support for all administrative, financial and fiscal activities of the Department. Sections include: Budget, Tax Distributions and Statistics, Demography, Revenue Accounting/Processing/Cancellations, Document Management and Support Services/Mailroom. More than seven billion dollars in revenue passes through this Division annually for distribution to the State General Fund, other state agencies, cities, counties and school districts.The State Demographer is responsible for producing an annual determination of the population of towns, townships, cities, and counties, which is certified by the Governor by March 1 of each year and used for revenue distributions, including the Consolidated Tax Distribution to counties, cities, and towns and special districts. The demographer is also responsible for producing age, sex, race, and Hispanic origin estimates and projections; 5-year population projections; and 20-year population projections. The demographer works with the U.S. Census Bureau in conducting the decennial census.
Information Technology (IT) is responsible for the operation, maintenance and ongoing enhancements to the Unified Taxation System (UTS), which includes the Tax Administration System (TAS), Nevada Tax Center online tax filing service and the Discover Tax data warehouse utilized by Compliance Division staff, streamlined sales tax, and other UTS-dependent software. In addition to the UTS, IT supports the official website for Taxation, the MSA Tobacco system, the Department’s Intranet site, and statewide LAN/WAN and desktop applications. IT is also responsible for supporting the Marijuana Enforcement Division’s Agent Portal for both Intranet and Internet.
Local Government Services is responsible for appraising all centrally assessed property, establishing guidelines for the county assessors, conducting the ratio study, ensuring statewide compliance with assessment standards established by the Tax Commission and administering the Net Proceeds of Minerals Tax and the Real Property Transfer Tax. The Local Government Finance Section reviews local government budgets and audits, prepares the ad valorem tax rates for certification, advises local governments on Budget Act compliance and financial management matters, and reviews entities' annual audits and plans to prevent the re-occurrence of violations as reported.
5

Department Organization and Functions (continued)
Marijuana Enforcement is responsible for regulating marijuana establishments. In accordance with statutes andadopted regulations, staff in this section review applications for licensure, issue and track licenses, identify violationsof the statutes and regulations, impose penalties, review and approve advertisements, and perform other duties toensure a strictly regulated marijuana industry. Staff perform facility and vehicle inspections to ensure compliance withsecurity, testing, labeling, packaging and other regulatory requirements.
Compliance – Revenue/Collection section provides oversight and collection of Sales and Use Taxes, the ModifiedBusiness Tax, the Business License Fee, Insurance Premium Tax, Cigarette Tax, Other Tobacco Tax, Liquor Tax, LiveEntertainment Tax, Bank Excise Tax, Short-term Auto Lease Fee, etc. It collects taxes on vehicles, vessels andaircraft based and licensed in Nevada and performs discovery work in the field for unregistered businesses and liquorand cigarette contraband. In addition, staff in this section actively collect accounts receivable; answer questions ontaxability; conduct hearings; monitor accounts for compliance with statutes and reporting requirements; collects taxesfrom delinquent accounts; and provide general taxpayer education.
Revenue officers also investigate possible tax evasion and follow up on tips from the public. When working on adelinquent account the revenue officer will do skip tracing to locate individuals and, as the need arises, they may issuetax deficiency notices, set up payment plans, file liens and withholds and may close a business as a measure of lastresort. This includes seizure of assets and subsequent sales of these assets to meet tax obligations. This section alsocontains the Taxpayer Service staff which answer questions by phone, correspondence and in person aboutregistration, the taxability of transactions and reporting requirements. The staff conduct monthly workshops called “Askthe Advisor” and provide general taxpayer education through publications and informational pamphlets.
Compliance - Audit section administers a comprehensive audit program to ensure taxpayer compliance. This sectionis responsible for ensuring financial compliance with laws relating to all the above-named taxes. Auditors also verifythe accuracy of taxpayer credit or refund requests. The Audit section uses discovery programs based on comparisonsof information from other taxing authorities. Audit staff conduct taxpayer workshops on technical issues and recordkeeping as well as on preparing for an audit.
The audit staff conducted 2,608 audits during Fiscal Year 2018-19: 1,416 sales and use tax audits, 1,070 modifiedbusiness tax audits; 38 commerce tax audits and 84 excise tax audits. The total net collections from audit billingsduring this period was $23,795,028. Audits billed may be collected in succeeding fiscal years or set up on paymentplans, adjusted through settlement negotiations, administrative law judge decisions or by the Nevada Tax Commission.The Department also conducts other specialized audits covering the Deferral and Abatement program and cigarette,and other tobacco products (non-sales and use tax accounts). The Department conducted 52 audits for the Deferraland Abatement program during this period.
6

OR
GAN
IZA
TIO
NA
L C
HAR
T
7

DEPARTMENT FINANCIAL STATEMENT
REVENUES REVENUES /
EXPENDITURES
WORK PROGRAM
AUTHORITY WORK PROGRAM
LESS ACTUAL
Carry Forward from State Fiscal Year 2018 -$ -$ -$ General Fund Appropriation 34,215,178 34,215,178 - Federal Grant - 454 (454) Retail Marijuana Application Fees - - - Retail Marijuana License Fees - - - Audit Fees 22,547 37,248 (14,701) Cigarette Tax Administration Fee 470,034 466,508 3,526 Short Term Auto Lease Fee 13,417 10,945 2,472 Administrative Fee Bad Check Charge 91,191 48,087 43,104 Justice Court/Township Fees 107,382 89,202 18,180 Miscellaneous Revenue 1,837 35,855 (34,018) Interim Finance Committee Contingency Allocation - - - Transfer from Dept. of Environmental Protection 10,616 9,149 1,467 Master Settlement Agreement Reimbursement 178,980 198,558 (19,578) Total Revenues 35,111,183$ 35,111,184$ (1)$
EXPENDITURESPersonnel Services 27,223,597$ 27,451,259$ 227,661.96$ Out-of-State Travel 15,327 17,699 2,372 In-State Travel 170,609 191,563 20,954 Operating 2,280,581 2,403,276 122,695 Equipment - - - Compliance Audit Investigation 3,534 5,091 1,557 Out-of-State Audit 43,578 53,648 10,070 Master Settlement Agreement 28,429 29,668 1,239 E Payment Fees - 1,700,373 1,700,373 Lockbox Program 441,062 660,849 219,787 Mining Oversight and Accountability Commission - 818 818 Demographer 34,756 37,083 2,327 Cigarette Stamps 193,633 202,904 9,271 Information Services 1,411,520 1,439,722 28,202 Training 15,052 15,979 927 County Assessor/Appraiser Training - - - Human Resources Cost Allocation 162,809 162,809 - Purchasing Assessment 7,989 7,989 - AG Cost Allocation 729,542 729,542 - Reserve for Reversion 458 912 454 Total Expenditures 32,762,476$ 35,111,184$ 2,348,707.68$ Total Reversion At Fiscal Year End Close 2,348,707
BALANCE FORWARDS and REVERSIONSReversion to General Fund 2,348,707 Total Reversion 2,348,707$
DEPARTMENT OF TAXATION ADMINISTRATION ACCOUNTREVENUES AND EXPENDITURES
JULY 1, 2018 - JUNE 30, 2019
8

DEPARTMENT FINANCIAL STATEMENT
REVENUES REVENUES /
EXPENDITURES WORK PROGRAM
AUTHORITY WORK PROGRAM
LESS ACTUAL
Carry Forward from State Fiscal Year 2018 2,776,313.00$ 2,776,313.00$ -$ General Fund Appropriation - - - Excise Tax -Medical Marijuana 204,641.76 194,181.00 (10,460.76) Excise Tax - Wholesale Marijuana 44,000,056.78 44,040,364.00 40,307.22 Application Fees 2,785,000.00 2,815,000.00 30,000.00 License Fee 5,213,525.00 5,274,565.00 61,040.00 Agent Card Registration Fee 1,409,779.00 1,404,529.00 (5,250.00) Administrative Fee Bad Check Charge 450.00 475.00 25.00 Time and Effort Assessment 388,323.50 435,538.00 47,214.50 Civil Penalties 60,416.00 99,500.00 39,084.00 Miscellaneous Revenue 25.00 25.00 - Total Revenues 56,838,530$ 57,040,490$ 201,960$
EXPENDITURESPersonnel Services 2,899,082$ 3,239,919$ 340,837$ Out-of-State Travel 12,072 12,674 602 In-State Travel 47,625 70,256 22,631 Operating 260,957 394,425 133,468 Equipment 133,052 213,348 80,296 Building Security 254,073 270,835 16,762 Local Government Grants 5,000,000 5,000,000 - Dispensaries and Establishment 372,031 511,975 139,944 Information Services 586,281 985,535 399,254 Transfer to the Health Division 320,412 350,000 29,588 Transfer to the Distributive School Account 43,764,762 43,804,454 39,692 Human Resources Cost Allocation 6,837 6,837 - Reserve - 2,100,512 2,100,512 Purchasing Assessment 6,250 6,250 - Statewide Cost Allocation Plan 11,680 11,680 - AG Cost Allocation Plan 61,790 61,790 - Total Expenditures 53,736,904$ 57,040,490$ 3,303,586$ Carry Forward to State Fiscal Year 2020 3,101,626
BALANCE FORWARDS and REVERSIONSReversion to General Fund - Balance Forward to Fiscal Year 2020 3,101,626
- 3,101,626$
DEPARTMENT OF TAXATION MARIJUANA REGULATION AND CONTROL ACCOUNTREVENUES AND EXPENDITURES
JULY 1, 2018 - JUNE 30, 2019
9

COUNTIES COUNTIES Cities Cities Towns TownsCARSON CITY 55,438 HUMBOLDT COUNTY 16,978CHURCHILL COUNTY 25,387 Winnemucca 7,947 Fallon 9,030 LANDER COUNTY 6,200CLARK COUNTY 2,193,818 Austin 166 Boulder City 16,121 Battle Mountain 3,473 Henderson 300,709 Kingston 123 Las Vegas 633,028 LINCOLN COUNTY 5,170 Mesquite 20,838 Caliente 1,066 North Las Vegas 243,339 Alamo 673 Bunkerville 1,042 Panaca 797 Enterprise 193,572 Pioche 784 Indian Springs 1,264 LYON COUNTY 54,657 Laughlin 9,672 Fernley 19,300 Moapa 1,026 Yerington 3,202 Moapa Valley 7,115 MINERAL COUNTY 4,674 Mt. Charleston 666 Hawthorne 3,066 Paradise 193,712 Luning 105 Searchlight 364 Mina 173 Spring Valley 216,228 Walker Lake 322 Summerlin 30,492 NYE COUNTY 46,390 Sunrise Manor 210,216 Amargosa 1,344 Whitney 44,449 Beatty 961 Winchester 33,065 Gabbs 218DOUGLAS COUNTY 48,300 Manhattan 126 Gardnerville 5,693 Pahrump 39,023 Genoa 213 Round Mountain 772 Minden 3,191 Tonopah 2,311ELKO COUNTY 53,287 PERSHING COUNTY 6,743 Carlin 2,617 Lovelock 1,933 Elko 20,789 Imlay 207 Wells 1,312 STOREY COUNTY 4,084 West Wendover 4,201 Gold City 202 Jackpot 860 Virginia City 850 Montello 63 WASHOE COUNTY 451,923 Mountain City 87 Reno 244,612ESMERALDA COUNTY 970 Sparks 96,928 Goldfield 263 WHITE PINE COUNTY 10,705 Silver Peak 122 Ely 4,267EUREKA COUNTY 1,932 Lund 205 Crescent Valley 380 McGill 1,191 Eureka 701 Ruth 450
TOTAL STATEWIDE POPULATION 2,986,656
CERTIFIED POPULATION2017 Governor Certified Population, developed by the Nevada State Demographer pursuant to NRS 360.283 and 360.285.The following population figures were used, as directed by specific statute, for allocation of tax revenue in fiscal year 2018-19.
10

COMPONENTS OF SALES AND USE TAX RATESComponents of 6.85% Minimum Statewide Tax Rate:
RATE NRS PROVISION DESCRIPTION DISTRIBUTION2.00 372
2.60 374
0.50 377
1.75 377
Local Sales and Use Tax Rates as of 01/01/2020:
COUNTY RATE COUNTY RATE PROVISION
DATE IMPOSED
Carson City 0.250 377A Public Roads 1/1/1987Carson City 0.250 By Ordinance Open Space 7/1/1997Carson City 0.125 377B V&T Railroad Bonds 4/1/2006
7.600 Carson City 0.125 377B Infrastructure 10/1/2014Churchill 0.250 377A Public Roads 11/1/1986Churchill 0.250 377.057 Local Government Tax Act 10/1/1991
7.600 Churchill 0.250 377B Infrastructure 10/1/2005Clark 0.250 543 Flood Control 3/1/1987Clark 0.250 377A Regional Transportation 7/1/1991Clark 0.250 377B Southern NV Water Authority 4/1/1999Clark 0.250 377A Regional Transportation ¼% increase 10/1/2003Clark 0.300 AB418 Police Support 1/1/2016Clark 0.100 AB1 Police Officers 4/1/2017
8.375 Clark 0.125 AB309 State Education Fund 1/1/20207.100 Douglas 0.250 AB174 Miscellaneous Facilities & Services 7/1/19997.100 Elko 0.250 377B Infrastructure 7/1/20167.100 Lander 0.250 377B Water Treatment 4/1/20047.100 Lincoln 0.250 377B School / Public Utilities 1/1/20017.100 Lyon 0.250 377B Infrastructure/Public Safety 10/1/2008
Nye 0.250 377A Public Roads 5/1/19867.600 Nye 0.500 AB461 Public Safety 4/1/20147.100 Pershing 0.250 377B Infrastructure/Public Safety 10/1/2008
Storey 0.250 377A Tourism 8/1/1985Storey 0.250 477 V & T Railroad Commission 1/1/1996
7.600 Storey 0.250 377B School / Public Utilities 1/1/2001Washoe 0.125 377A Regional Transportation 11/1/1982Washoe 0.250 377.057 Local Government Tax Act 10/1/1991Washoe 0.125 377B Flood/Public Safety 4/1/1999Washoe 0.125 506 Railroad Grade Project 4/1/1999Washoe 0.250 377A Regional Transportation ¼% increase 7/1/2003
8.265 Washoe 0.540 WC1 School Facilities 4/1/2017White Pine 0.250 377A Public Roads 11/1/1986White Pine 0.125 374A School Capital Improvement 4/1/2000White Pine 0.250 377B Infrastructure/Public Safety 10/1/2007
7.725 White Pine 0.250 377A Swimming Pool Maintenance 7/1/2012Minimum statewide rate applies to all other counties not listed.
Sales Tax
Local School Support Tax
To the State General Fund.In-State Business Returns: Tax is distributed to the school district in which the business is located.Out-of-State Business Returns: Tax is distributed to the State Distributive Schools Fund.
USE OF PROCEEDS
In-State Business Returns: Tax is distributed to the county where the sale was made.Out-of-State Business Returns: Tax is distributed to counties and cities based on a population formula.
Basic City-County Relief Tax
Supplemental City-County Relief Tax
Tax is distributed to all qualifying local governments according to statutory formula.
11

SALES AND USE TAX RATES BY COUNTY
12

TAXABLE SALES COMPARISON
Taxable Sales Comparison by County
County Fiscal Year 2017-18 Fiscal Year 2018-19 % Change
Carson City 1,144,376,853$ 1,240,116,234$ 8.4%Churchill 354,371,180 460,506,266 30.0%Clark 42,569,371,984 45,901,464,346 7.8%Douglas 780,078,815 802,736,583 2.9%Elko 1,495,115,958 1,555,167,469 4.0%Esmeralda 13,726,094 20,582,115 49.9%Eureka 314,094,816 300,813,459 -4.2%Humboldt 507,810,555 590,285,682 16.2%Lander 309,919,553 322,277,850 4.0%Lincoln 31,001,563 33,514,682 8.1%Lyon 490,414,813 605,862,308 23.5%Mineral 48,852,769 56,629,194 15.9%Nye 672,275,312 686,290,382 2.1%Pershing 118,013,814 119,288,470 1.1%Storey 1,275,451,338 718,439,041 -43.7%Washoe 8,531,252,745 8,829,863,974 3.5%White Pine 291,695,358 317,187,820 8.7%
STATE TOTAL 58,947,823,520$ 62,561,025,875$ 6.1%
The above comparisons for Fiscal Year 2017-18 and Fiscal Year 2018-19 on Taxable Sales are based on figures provided on Sales and Use Tax returns by registered permit holders in and out of the State of Nevada. Large increases or decreases may be due to audits, deficiency determinations, etc., performed on taxpayers doing business in a county.
13

SALES AND USE TAX REVENUE
FISCAL YEAR TAX PERMIT FEESTOTAL
COLLECTIONS*% CHANGE FROM
PRIOR YEAR2013-14 934,883,717$ 77,319$ 934,961,036$ 4.79%2014-15 998,637,766 81,418 998,719,184 6.82%2015-16 1,041,484,760 80,719 1,041,565,479 4.29%2016-17 1,095,777,430 75,638 1,095,853,068 5.21%2017-18 1,148,248,111 75,503 1,148,323,614 4.79%2018-19 1,241,264,104 77,007 1,241,341,110 8.10%
LEGAL CITATION Chapter 372 Nevada Revised Statutes.
RATE 2 percent on all taxable sales and taxable items of use.
CURRENT DISTRIBUTION OF REVENUE State General Fund.
ORIGINALLY ENACTED
RATE
REMOVAL OF SALES TAX FROM FOOD
REMOVAL OF SALES TAX FROM CERTAIN MEDICAL EQUIPMENT
HISTORY
1955 session of State Legislature. Approved by referendum in 1956.
2 percent since inception. Referendum to raise to 3 percent defeated in1963 by 2 to 1 margin.
On June 5, 1979, the voters, by special election, amended the Sales and Use Tax Act to provide for exemption of certain foods from taxation (effective July 1, 1979).
In the 2016 and 2018 General Election, voters approved an amendment to the Nevada Constitution to exempt from sales and use taxes certain durable medical equipment, oxygen delivery equipment and mobility enhancing equipment. Senate Bill 447 was passed by the 2019 Legislative Session and became effective July 1, 2019.
$600
$700
$800
$900
$1,000
$1,100
$1,200
$1,300
2013-14 2014-15 2015-16 2016-17 2017-18 2018-19
MILLIONS
FISCAL YEAR
14

Sales and Use Tax Revenue (continued)
AMENDMENTS 2019
*Total collections may not match actual distributions due to STAR Bond reversions.
Assembly Bill 445 of the 2019 Legislative Session requires certain marketplace facilitators, who directly or indirectly facilitate retail sales to customers in this State, to collect and remit sales and use taxes. Section 16.5 and Section 17 became effective July 1, 2019 and Sections 1 to 16, inclusive, became effective on October 1, 2019.
15

Sales and Use Tax Revenue (continued)
COUNTY TAXES AND FEES % OF TOTAL
Carson City 24,533,852$ 1.98%Churchill 7,587,229 0.61%Clark 910,559,826 73.35%Douglas 15,998,698 1.29%Elko 30,927,856 2.49%Esmeralda 415,268 0.03%Eureka 5,998,312 0.48%Humboldt 11,788,039 0.95%Lander 6,275,924 0.51%Lincoln 671,227 0.05%Lyon 12,122,445 0.98%Mineral 1,139,599 0.09%Nye 13,735,539 1.11%Pershing 2,387,472 0.19%Storey 6,835,141 0.55%Washoe 175,931,610 14.17%White Pine 6,343,692 0.51%Out of State 1,872,550 0.15%STAR Bonds Transfers 6,216,831 0.50%
TOTAL 1,241,341,110$ 100.00%
STATE 2% SALES AND USE TAX COLLECTION BY COUNTYFISCAL YEAR 2018-19
16

LOCAL SCHOOL SUPPORT TAX REVENUE
FISCAL YEAR TAX PERMIT FEESTOTAL
COLLECTIONS*% CHANGE FROM
PRIOR YEAR2013-14 1,225,878,560$ 77,322$ 1,225,955,882$ 4.59%2014-15 1,296,737,955 81,416 1,296,819,371 5.78%2015-16 1,353,951,301 80,719 1,354,032,020 4.41%2016-17 1,413,947,350 75,638 1,414,022,988 4.43%2017-18 1,478,933,892 75,503 1,479,009,396 4.60%2018-19 1,591,527,742 77,007 1,591,604,748 7.61%
LEGAL CITATION Chapter 374 Nevada Revised Statutes.
RATE 2.60 percent on all taxable sales and taxable items of use.
CURRENT DISTRIBUTION OF REVENUE
ORIGINALLY ENACTED
RATE
*Total collections may not match actual distributions due to STAR Bond reversions.
October 1, 1991 - 2.25 percent on all taxable sales and taxable items of use.
99.25 percent of fees, taxes, interest and penalties collected in each countyreturned to county of origin (location of the business) for distribution toschool districts; .75 percent to State General Fund. 99.25 percent of fees,taxes, interest and penalties collected from out-of-state businesses that donot maintain a presence in the State to State Distributive School Fund; .75percent to State General Fund.
HISTORY
1967 session of State Legislature. Held constitutional by Nevada SupremeCourt, June 1967; effective July 1, 1967.
July 1, 1967 to April 30, 1981 - 1 percent on all taxable sales and taxableitems of use.
May 1, 1981 - 1.50 percent on all taxable sales and taxable items of use.
July 1, 2009 - 2.60 percent on all taxable sales and taxable items of use.
$800
$900
$1,000
$1,100
$1,200
$1,300
$1,400
$1,500
$1,600
2013-14 2014-15 2015-16 2016-17 2017-18 2018-19
MILLIONS
FISCAL YEAR
17
Local School Support Tax Revenue (continued)
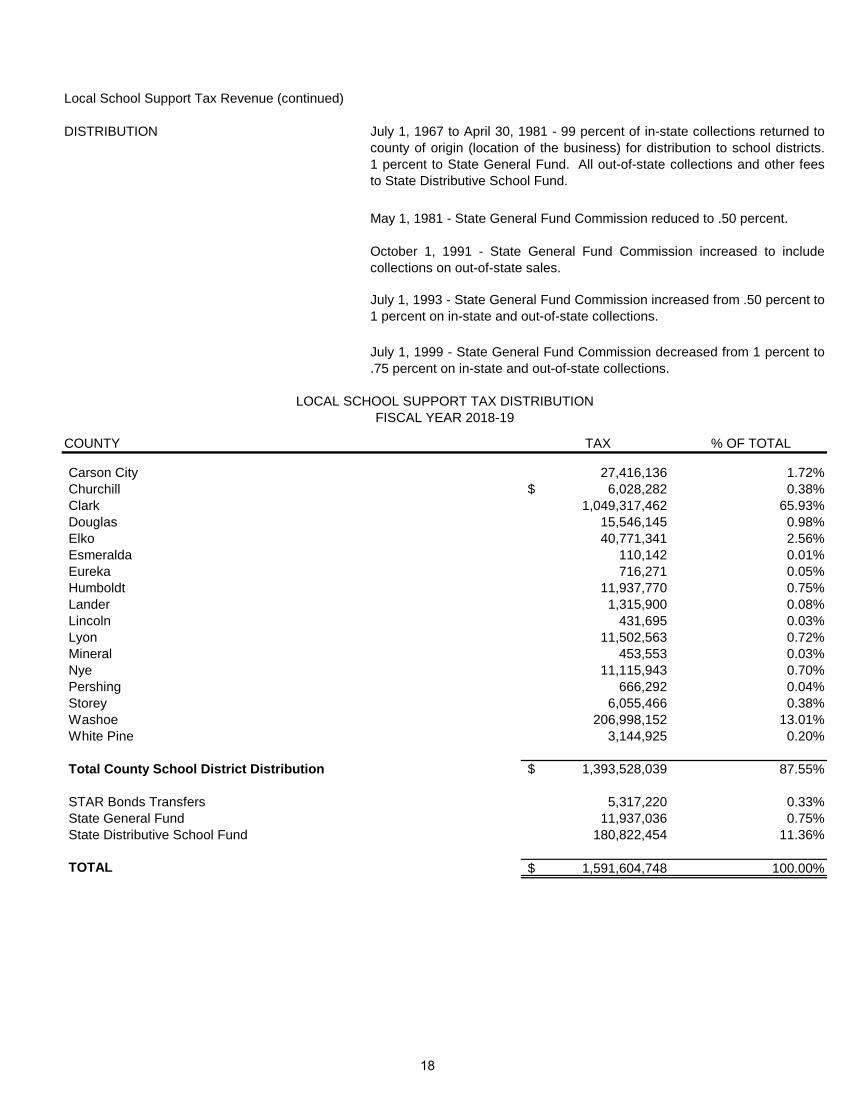
DISTRIBUTION
COUNTY TAX % OF TOTAL
Carson City 27,416,136 1.72%Churchill 6,028,282$ 0.38%Clark 1,049,317,462 65.93%Douglas 15,546,145 0.98%Elko 40,771,341 2.56%Esmeralda 110,142 0.01%Eureka 716,271 0.05%Humboldt 11,937,770 0.75%Lander 1,315,900 0.08%Lincoln 431,695 0.03%Lyon 11,502,563 0.72%Mineral 453,553 0.03%Nye 11,115,943 0.70%Pershing 666,292 0.04%Storey 6,055,466 0.38%Washoe 206,998,152 13.01%White Pine 3,144,925 0.20%
Total County School District Distribution 1,393,528,039$ 87.55%
STAR Bonds Transfers 5,317,220 0.33%State General Fund 11,937,036 0.75%State Distributive School Fund 180,822,454 11.36%
TOTAL 1,591,604,748$ 100.00%
LOCAL SCHOOL SUPPORT TAX DISTRIBUTIONFISCAL YEAR 2018-19
July 1, 1967 to April 30, 1981 - 99 percent of in-state collections returned tocounty of origin (location of the business) for distribution to school districts.1 percent to State General Fund. All out-of-state collections and other feesto State Distributive School Fund.
May 1, 1981 - State General Fund Commission reduced to .50 percent.
October 1, 1991 - State General Fund Commission increased to includecollections on out-of-state sales.
July 1, 1993 - State General Fund Commission increased from .50 percent to1 percent on in-state and out-of-state collections.
July 1, 1999 - State General Fund Commission decreased from 1 percent to.75 percent on in-state and out-of-state collections.
18

BASIC CITY/COUNTY RELIEF TAX REVENUE
FISCAL YEAR TAX PERMIT FEESTOTAL
COLLECTIONS% CHANGE FROM
PRIOR YEAR2013-14 233,566,082$ 77,041$ 233,643,123$ 5.03%2014-15 247,618,213 81,422 247,699,635 6.02%2015-16 257,408,578 80,722 257,489,300 3.95%2016-17 270,257,051 75,625 270,332,677 4.99%2017-18 285,461,919 75,490 285,537,409 5.62%2018-19 303,861,627 77,008 303,938,636 6.44%
LEGAL CITATION Chapter 377 Nevada Revised Statutes.
RATE 0.5 percent of all taxable sales and taxable items of use.
CURRENT DISTRIBUTION OF REVENUE
ORIGINALLY ENACTED
*Total collections may not match actual distributions due to STAR Bond reversions.
HISTORY
98.25 percent of in-state collections allocated to the county where the sale is made for distribution to eligible local governments through the Consolidated Tax Program; 1.75 percent to State General Fund. 98.25 percent out-of-state collections prorated amongst counties on the basis of population ratio for distribution to local governments through the Consolidated Tax Program; 1.75 percent to State General Fund.
1969 session of State Legislature as the City/County Relief Tax, effective July 1, 1969. Levy effected by county ordinance.
Collected in Clark and Washoe Counties as of July 1, 1969; Lyon County, January 1, 1971; Douglas, Elko, Humboldt, Lincoln, Mineral Counties, May 1, 1971; Nye County, June 1, 1972; Pershing County, July 1, 1972; Churchill County, July 1, 1973; Carson City, April 1, 1976; Storey County, July 1, 1976; Lander County, July 1, 1979; White Pine County, July 1, 1980; Esmeralda and Eureka Counties, May 1, 1981.
1969 levied for city/county support. 99 percent of in-state collections returned to county where the sale is made; 1 percent to State General Fund; 100 percent out-of-state collections prorated amongst counties levying the tax; combined collections distributed as follows: if no cities within county, 100 percent to county; if one city within county, to county and city, on basis of population ratio; if two or more cities within county, to cities only on basis of population ratio.
$150
$175
$200
$225
$250
$275
$300
$325
2013-14 2014-15 2015-16 2016-17 2017-18 2018-19
MILLIONS
FISCAL YEAR
19

Basic City/County Relief Tax Revenue (continued)
AMENDMENTS 1981
1991
1993
1997
1999
2009
COUNTY TAX % OF TOTAL
Carson City 6,156,455$ 2.03%Churchill 1,687,945 0.56%Clark 222,817,958 73.31%Douglas 3,914,039 1.29%Elko 7,149,598 2.35%Esmeralda 91,661 0.03%Eureka 1,061,110 0.35%Humboldt 2,688,633 0.88%Lander 1,234,387 0.41%Lincoln 178,000 0.06%Lyon 3,138,619 1.03%Mineral 295,001 0.10%Nye 3,471,914 1.14%Pershing 503,951 0.17%Storey 780,295 0.26%Washoe 40,576,023 13.35%White Pine 1,429,549 0.47%
Total County Transfers 297,175,135$ 97.77%STAR Bonds Transfers 1,444,574 1.75%State General Fund 5,318,926 0.48%Total 303,938,636$ 100.00%
TO CONSOLIDATED TAXFISCAL YEAR 2018-19
1981 session of State Legislature; name changed to Basic City/County Relief Tax effective May 1, 1981 and levy required by State Statute. May 1, 1981 General Fund Commission reduced to .50 percent.
Effective October 1, 1991, .50 percent General Fund Commission was imposed on out-of-state collections.
Effective July 1, 1993 General Fund Commission increased to 1 percent on in-state and out-of-state collections.
The 1997 Legislature created the Consolidated Tax Program. Beginning FY 98-99, the Department implemented the program that combines BCCRT, SCCRT, Cigarette Tax, Liquor Tax, Real Property Transfer Tax and Motor Vehicle Privilege Tax into one monthly distribution. Total allocation by county is transferred to the Consolidated Tax Account for distribution to individual local governments within the county.
Effective July 1, 1999 General Fund Commission decreased to .75 percent on in-state and out-of-state collections.
Effective July 1, 2009 General Fund Commission increased to 1.75 percent on in-state and out-of-state collections.
BASIC CITY/COUNTY RELIEF TAX TRANSFER
20

SUPPLEMENTAL CITY/COUNTY RELIEF TAX REVENUE
FISCAL YEAR% CHANGE FROM
PRIOR YEAR2014-15 866,660,923$ 6.05%2015-16 900,834,703 3.94%2016-17 945,756,811 4.99%2017-18 998,975,870 5.63%2018-19 1,063,517,541 6.46%
LEGAL CITATION Chapters 354 and 377, Nevada Revised Statutes.
RATE 1.75 percent of all taxable sales and taxable items of use.
CURRENT DISTRIBUTION OF REVENUE
ORIGINALLY ENACTED 1981 session of State Legislature; effective May 1, 1981.
AMENDMENTS 1983
1985
*Total collections may not match actual distributions due to STAR Bond reversions.
TOTAL COLLECTIONS
HISTORY
98.25 percent of total collections returned to local governments through Consolidated Tax Program based on distribution formula; 1.75 percent to State General Fund.
Fire districts organized pursuant to Chapter 473 of Nevada Revised Statutes to be included in the distribution. Shifted authority to grant reserve fund distributions from the Interim Legislative Committee on Local Government Finance to the Nevada Tax Commission.
Changed distribution of excess supplemental city/county relief tax receipts. When all entities within a county have received the maximum supplemental city/county relief tax allowable, excess is then deposited in the Reserve Fund. Shifted authority to grant Reserve Fund distributions from the Nevada Tax Commission to the Interim Finance Committee. Established the following maximum Reserve Fund amounts: 1.) $10,000,000 for distribution to local governments in the event actual receipts in any one year are less than the estimated receipts for that year. 2.) $2,500,000 for emergency distributions to local governments if unforeseen or uncontrollable conditions, existing or imminent, substantially impair the financial capacity of a local government to provide the basic services for which it was created. 3.) Any amount in excess of $12,500,000 in the fund, at the beginning of the year, must be distributed to local governments in the following fiscal year.
$500
$580
$660
$740
$820
$900
$980
$1,060
$1,140
2013-14 2014-15 2015-16 2016-17 2017-18 2018-19
MILLIONS
FISCAL YEAR
21

Supplemental City/County Relief Tax Revenue (continued)
AMENDMENTS (continued)
1987 Eliminated redevelopment districts from the distribution of supplemental city/county relief tax.
1989 Removed the limitations on the amount of supplemental city/county relief tax a local government may receive in any one fiscal year. Eliminated the Reserve Fund and created the Emergency Fund of the supplemental city/county relief tax. The amount of the fund was set at $2,500,000. Created the Redistribution Fund for the supplemental city/county relief tax and provided specific dollar allocations to the Town of Laughlin, Clark County, Churchill County and Elko County.
1991 Changed distribution of supplemental city/county relief tax at the county level. First a group of selected counties receive a guaranteed distribution from the total collections. The remaining funds are allocated to a second group of counties based on the percentage of county collections to the total collections for the group. Adjustments to ease the impact of the legislation to certain counties are made to the distribution formula. Counties in the guaranteed group will be moved into the point-of-origin group if their collections outpace their distribution by 10 percent in a fiscal year. Intracounty distributions were not amended by the Legislature. The Local Government Tax Act of 1991 authorized certain counties that were negatively impacted by the rebasing of the distribution formula to impose certain taxes to make up the revenue loss.
1993 The Local Government Tax Act of 1993 authorized certain counties that were negatively impacted by additional rebasing of the distribution formula to impose certain taxes to make up the revenue loss. These additional taxes, if imposed, are to be levied from October 1, 1993 through September 30, 1994.
Effective July 1, 1993 General Fund Commission increased to 1 percent on in-state and out-of-state collections.
1997 The 1997 Legislature created the Consolidated Tax Program. Beginning FY 98-99, the Department implemented the program that combines BCCRT, SCCRT, Cigarette Tax, Liquor Tax, Real Property Transfer Tax and Motor Vehicle Privilege Tax into one monthly distribution. Total allocation by county is transferred to the Consolidated Tax Account for distribution to individual local governments within the county.
1999 Effective July 1, 1999 General Fund Commission decreased to .75 percent on in-state and out-of-state collections.
2009 Effective July 1, 2009 General Fund Commission increased to 1.75 percent on in-state and out-of-state collections.
22
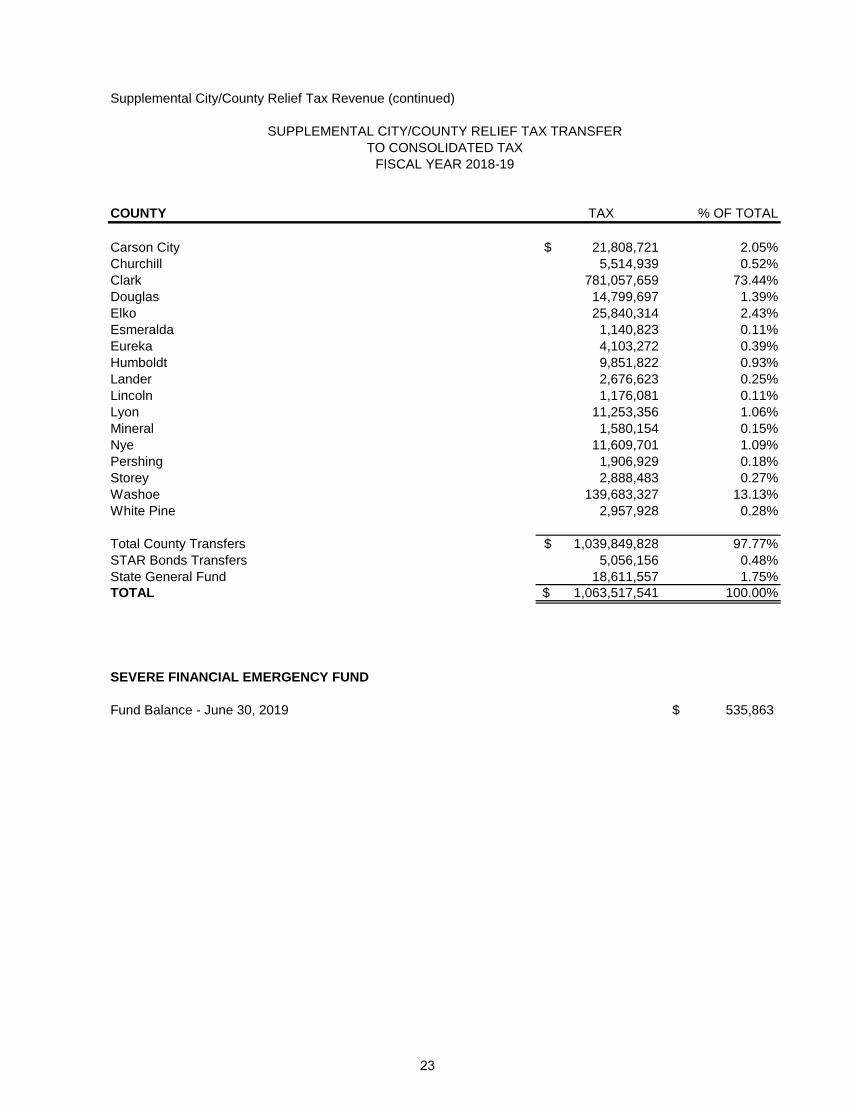
Supplemental City/County Relief Tax Revenue (continued)
COUNTY TAX % OF TOTAL
Carson City 21,808,721$ 2.05%Churchill 5,514,939 0.52%Clark 781,057,659 73.44%Douglas 14,799,697 1.39%Elko 25,840,314 2.43%Esmeralda 1,140,823 0.11%Eureka 4,103,272 0.39%Humboldt 9,851,822 0.93%Lander 2,676,623 0.25%Lincoln 1,176,081 0.11%Lyon 11,253,356 1.06%Mineral 1,580,154 0.15%Nye 11,609,701 1.09%Pershing 1,906,929 0.18%Storey 2,888,483 0.27%Washoe 139,683,327 13.13%White Pine 2,957,928 0.28%
Total County Transfers 1,039,849,828$ 97.77%STAR Bonds Transfers 5,056,156 0.48%State General Fund 18,611,557 1.75%TOTAL 1,063,517,541$ 100.00%
SEVERE FINANCIAL EMERGENCY FUND
Fund Balance - June 30, 2019 535,863$
SUPPLEMENTAL CITY/COUNTY RELIEF TAX TRANSFERTO CONSOLIDATED TAX
FISCAL YEAR 2018-19
23

Supplemental City/County Relief Tax Revenue (continued)
LOCAL GOVERNMENT TAX ACTS OF 1991 AND 1993SPECIAL FUND COLLECTIONS AND DISTRIBUTIONS
FISCAL YEAR 2018-19
CHURCHILL COUNTY WASHOE COUNTY Sales and Use Tax 793,319$ Sales and Use Tax 20,901,314$ Government Services Tax 738,465 Government Services Tax 4,088,348 Real Property Transfer Tax 34,271 Gaming License Fee 1,188,356 Property Tax 162,218 Real Property Transfer Tax 71,079 Interest 2,453 Property Tax 1,258,521
TOTAL 1,730,725$ Interest 32,714 TOTAL 27,540,331$
CHURCHILL COUNTY 1,342,337$ WASHOE COUNTY 19,046,710$ Fallon 290,566 Reno 4,468,746 Other 97,821 Sparks 2,108,157
TOTAL 1,730,725$ Other 1,916,717 TOTAL 27,540,331$
COLLECTIONS
DISTRIBUTIONS
24

LOCAL OPTION SALES AND USE TAX REVENUE
FISCAL YEAR% CHANGE FROM
PRIOR YEAR2013-14 502,729,113$ 6.89%2014-15 540,660,708 7.55%2015-16 573,065,363 5.99%2016-17 636,174,188 11.01%2017-18 734,690,403 15.49%2018-19 783,093,531 6.59%
LEGAL CITATION
RATE
CURRENT DISTRIBUTION OF REVENUE
ORIGINALLY ENACTED
TOTAL COLLECTIONS
HISTORY
Chapters 374A, 367A, 377A, 377B and 543 Nevada Revised Statutes.
0.125, 0.25, or 0.50 percent of all taxable sales and taxable items of use in a county.
NRS 374A provides for a county to impose a tax up to one-eighth of one percent for the cost of extraordinary maintenance, repair or improvement of school facilities within the county. Per NRS 377A.020, the board of county commissioners may impose a tax of 0.25 percent for mass transit or the construction of public roads; or counties with population of less than 700,000 may impose a 0.25 percent tax for the promotion of tourism. NRS 377B.100 provides that a county, under certain population requirements, may impose up to 0.25 percent tax for infrastructure; NRS 543.600 provides that a county whose population is 400,000 or more may impose a 0.25 percent tax for the purpose of flood control. 98.25 percent of collections are returned to the county of origin (where the sale was made); 1.75 percent to State General Fund. Special Acts of the Legislature have provided for certain counties to impose additional option taxes for specific local purposes.
1981 session of State Legislature. Washoe County enacted ordinance effective November 1, 1982; Storey County effective August 1, 1985; Nye County effective May 1, 1986; Churchill and White Pine Counties effective November 1, 1986; Carson City effective January 1, 1987; and Clark County effective March 1, 1987; Elko County effective July 1, 2016; Lander County effective April 1, 2004; Pershing County effective October 1, 2008; Douglas County effective July 1, 1999.
$150
$250
$350
$450
$550
$650
$750
$850
2013-14 2014-15 2015-16 2016-17 2017-18 2018-19
MILLIONS
FISCAL YEAR
25

Local Option Sales and Use Tax Revenue (continued)
AMENDMENTS 1985
1989
1991
1993
1995
1997
1999
2003
2005
2007
2009
2011
Amended Chapter 377B to allow the tax for infrastructure to be used for judicialand/or public safety infrastructure projects.
Effective July 1, 2009- General Fund Commission increased to 1.75 percent on in-state and out-of-state collections.
Ratified Carson City voter approved imposition of ¼ of 1 percent sales and usetax for open space. Added chapter 377B, tax for infrastructure to NevadaRevised Statutes.
Added Chapter 374A, 1/8 of 1 percent tax for extraordinary maintenance, repairor improvement of school facilities.
Effective July 1, 1999- General Fund Commission decreased to .75 percent onin-state and out-of-state collections.
Added NRS 377A.062 stipulating that the tax for miscellaneous purposes maybe used to support the operation and maintenance of a county swimming pool.
Passed the Clark County Sales and Use Tax Act of 2005. The revenues are tobe used to employ and equip additional police officers.
Amended Chapter 377B to allow the tax for infrastructure to be used for theconstruction or renovation of facilities having cultural or historical value. Alsoallows the tax to be used for the maintenance and operation of wastewatertreatment facilities.
Amended Chapter 377A by increasing the county population limitation from 400,000 to 700,000.
Allowed the Tri-County Railway Commission to impose ¼ of 1 percent salesand use tax in a county upon approval of the voters.
Amended NRS 377A.020 by adding that the tax may be used for theconstruction of public roads, and NRS 543.600 stipulates for the purpose offlood control.
Amended NRS 543.600 by increasing the population limitation from 250,000 to400,000 or more in a county that may consider imposing a tax for flood control.
Implemented the Local Government Tax Act of 1991, AB 104 authorizing certaincounties that were negatively impacted by the change to the SupplementalCounty/City Relief Tax distribution formula to impose by county ordinance anadditional ¼ of 1 percent sales and use tax.
Implemented the Local Government Tax Act of 1993, SB 506 authorizing certainadditional counties that were negatively impacted by additional changes to theSupplemental City/County Relief Tax distribution formula to impose by countyordinance ¼ of 1 percent sales and use tax from October 1, 1993 throughSeptember 30, 1994.
Effective July 1, 1993- General Fund Commission increased to 1 percent on in-state and out-of-state collections.
26

Local Option Sales and Use Tax Revenue (continued)
COUNTY PROVISION USE OF PROCEEDS DATE IMPOSED AMOUNTOption TaxesCarson City 377A Public Roads 1/1/1987 2,976,911$ Carson City 377B V&T Railroad Bonds 4/1/2006 1,488,465 Carson City 377B Infrastructure 10/1/2014 1,487,619 Churchill 377A Public Roads 11/1/1986 793,762 Churchill 377B Infrastructure 10/1/2005 793,763 Clark 377A Regional Transportation 7/1/1991 221,840,583 Clark 377A Regional Transportation ¼% increase 10/1/2003Clark 377B So NV Water Authority 4/1/1999 110,912,175 Clark 543 Flood Control 3/1/1987 110,927,729 Elko 377B Infrastructure 7/1/2016 3,815,624 Lander 377B Water Treatment 4/1/2004 763,770 Lincoln 377B School / Public Utilities 1/1/2001 82,434 Lyon 377B Infrastructure 10/1/2008 1,455,094 Nye AB461 Public Safety 4/1/2014 3,365,225 Nye 377A Public Roads 5/1/1986 1,686,761 Pershing 377B Infrastructure 10/1/2008 293,205 Storey 377A Tourism 8/1/1985 488,650 Storey 377B School / Public Utilities 1/1/2001 488,650 Washoe 377A Regional Transportation 11/1/1982 31,351,595 Washoe 377A Regional Transportation ¼% increase 7/1/2003Washoe 377B Flood/Public Safety 4/1/1999 10,450,539 White Pine 374A School Cap Improvement 4/1/2000 389,581 White Pine 377A Public Roads 11/1/1986 779,157 White Pine 377A Swimming Pool Maintenance 10/1/2003 779,135 White Pine 354 Operating/Severe Fin. Emergency 7/1/2006 14 White Pine 377B Infrastructure/Public Safety 10/1/2007 779,142 Special ActsChurchill Local Government Tax Act 10/1/1991 793,319 Clark Police Support 10/1/2005 133,070,597 Clark Police Officers 4/1/2017 44,296,359 Storey Tricounty Railway Commission 1/1/1996 488,650 Washoe Railroad Grade Project 4/1/1999 10,450,522 Washoe Local Government Tax Act 10/1/1991 20,901,314 Washoe School Facilities 4/1/2017 46,275,511 Miscellaneous AmendmentsCarson City Open Space 7/1/1997 2,976,911 Douglas Misc. Facilities & Services 7/1/1999 1,946,630 Total to Counties 769,389,395$ State General Fund 13,704,137 TOTAL 783,093,531$
LOCAL OPTION SALES AND USE TAX DISTRIBUTION FISCAL YEAR 2018-19
27

STAR BOND REVENUE
FISCAL YEAR% CHANGE FROM
PRIOR YEAR2013-14 12,055,545$ 2.47%2014-15 12,940,923 7.34%2015-16 15,386,091 18.89%2016-17 15,760,343 2.43%2017-18 17,389,966 10.34%2018-19 18,301,482 5.24%
LEGAL CITATION Chapter 271A Nevada Revised Statutes.
CURRENT DISTRIBUTION OF REVENUE
ORIGINALLY ENACTED
AMENDMENTS 2009
2013
Effective July 1, 2009- General Fund Commission increased to 1.75 percent on in-state and out-of-state collections for Sales and Use Tax and City-County Relief Tax.
Senate Bill 406 exempts the Local School Support Tax from being pledged for any Tourism Improvement Districts created or revised after July 1, 2013. It also revises the requirements for contractors and subcontractors operating within the district.
TOTAL COLLECTIONS
HISTORY
Up to 75 percent of the Sales and Use Tax generated in a Tourism Improvement District may be pledged toward the repayment of the bonds. The pledge does not include Local Option Sales and Use Taxes, or any amount above 2.25 percent of the Local School Support Tax rate. 1.75 percent commission to the State General Fund for Sales and Use Tax and City-County Relief Tax; 0.75 percent commission to the State General Fund for Local School Support Tax.
2005 session of State Legislature. Became effective July 1, 2005.
The statute provides the means for municipalities to create Tourism Improvement Districts. The taxable sales generated in these districts may be pledged toward the payment of bonds issued by the municipality to finance projects in the districts.
$-
$4
$8
$12
$16
$20
2013-14 2014-15 2015-16 2016-17 2017-18 2018-19
MILLIONS
FISCAL YEAR
28
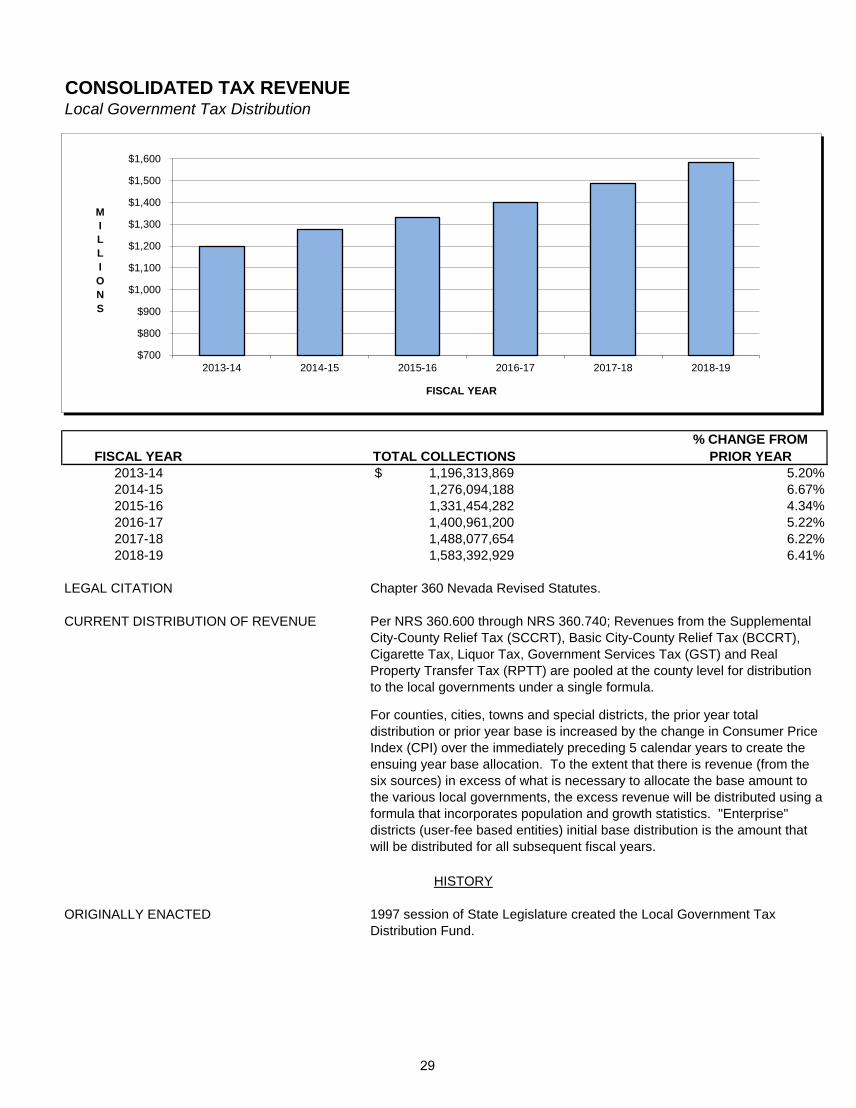
CONSOLIDATED TAX REVENUELocal Government Tax Distribution
FISCAL YEAR% CHANGE FROM
PRIOR YEAR2013-14 1,196,313,869$ 5.20%2014-15 1,276,094,188 6.67%2015-16 1,331,454,282 4.34%2016-17 1,400,961,200 5.22%2017-18 1,488,077,654 6.22%2018-19 1,583,392,929 6.41%
LEGAL CITATION Chapter 360 Nevada Revised Statutes.
CURRENT DISTRIBUTION OF REVENUE
ORIGINALLY ENACTED
TOTAL COLLECTIONS
HISTORY
Per NRS 360.600 through NRS 360.740; Revenues from the Supplemental City-County Relief Tax (SCCRT), Basic City-County Relief Tax (BCCRT), Cigarette Tax, Liquor Tax, Government Services Tax (GST) and Real Property Transfer Tax (RPTT) are pooled at the county level for distribution to the local governments under a single formula.
For counties, cities, towns and special districts, the prior year total distribution or prior year base is increased by the change in Consumer Price Index (CPI) over the immediately preceding 5 calendar years to create the ensuing year base allocation. To the extent that there is revenue (from the six sources) in excess of what is necessary to allocate the base amount to the various local governments, the excess revenue will be distributed using a formula that incorporates population and growth statistics. "Enterprise" districts (user-fee based entities) initial base distribution is the amount that will be distributed for all subsequent fiscal years.
1997 session of State Legislature created the Local Government Tax Distribution Fund.
$700
$800
$900
$1,000
$1,100
$1,200
$1,300
$1,400
$1,500
$1,600
2013-14 2014-15 2015-16 2016-17 2017-18 2018-19
MILLIONS
FISCAL YEAR
29

Consolidated Tax (continued)
AMENDMENTS 2001
2005 SB 38 provides an additional method for calculating the excess amount of the base monthly amount to be allocated to local governments in which: (1) the average amount of the assessed valuation of taxable property attributable to the net proceeds of minerals over the preceding 5 fiscal years is at least $50 million; (2) the average percentage of change in the population over the preceding 5 fiscal years is a negative figure; or (3) both. The bill applied retroactively to January 1, 2005, but did not affect money previously distributed to local governments.
A base amount of revenue was initially established under the 1997 legislation. For counties, cities, towns and special districts, the total distribution is increased by the change in CPI over the prior calendar year to create the ensuing year base allocation.
For counties, cities, towns and special districts, the lesser of prior year total distribution or prior year base is increased by the change in CPI over the prior calendar year to create the ensuing year base allocation. "One Plus" component of excess distribution to be phased out over the next 4 years.The City of Henderson received a one time base increase of $4,000,000.
30

COUNTY BCCRT SCCRT CIGARETTE LIQUOR RPTT GST TOTAL
CARSON CITY 6,156,455$ 21,808,721$ 178,189$ 72,647$ 520,461$ 2,942,467$ 31,678,939$ CHURCHILL 1,687,945 5,514,939 81,599 33,267 188,489 1,460,820 8,967,059 CLARK 222,817,958 781,057,659 7,051,373 2,874,810 32,451,151 130,210,428 1,176,463,380 DOUGLAS 3,914,039 14,799,697 155,246 63,293 1,050,768 3,183,966 23,167,009 ELKO 7,149,598 25,840,314 171,275 69,828 410,164 4,789,745 38,430,924 ESMERALDA 91,661 1,140,823 3,118 1,271 7,425 210,836 1,455,133 EUREKA 1,061,110 4,103,272 6,210 2,532 9,074 359,760 5,541,958 HUMBOLDT 2,688,633 9,851,822 54,571 22,248 117,858 1,810,425 14,545,557 LANDER 1,234,387 2,676,623 19,928 8,125 25,152 894,493 4,858,707 LINCOLN 178,000 1,176,081 16,617 6,775 21,420 485,348 1,884,240 LYON 3,138,619 11,253,356 175,679 71,623 767,073 3,606,245 19,012,594 MINERAL 295,001 1,580,154 15,023 6,125 10,436 485,497 2,392,236 NYE 3,471,914 11,609,701 149,107 60,790 470,087 2,892,449 18,654,048 PERSHING 503,951 1,906,929 21,673 8,836 28,449 697,266 3,167,105 STOREY 780,295 2,888,483 13,127 5,352 127,800 409,897 4,224,953 WASHOE 40,576,023 139,683,327 1,452,572 592,206 6,921,864 34,178,513 223,404,504 WHITE PINE 1,429,549 2,957,928 34,408 14,028 56,442 1,052,229 5,544,583
TOTAL 297,175,135$ 1,039,849,828$ 9,599,715$ 3,913,756$ 43,184,111$ 189,670,384$ 1,583,392,929$
Government Services Tax (GST): Revenue for each county is transferred monthly to the Consolidated Tax Account by the Department of Motor Vehicles.
CONSOLIDATED TAX SUMMARY OF THE REVENUE TRANSFERRED BY COUNTY
FISCAL YEAR 2018-19
BCCRT, SCCRT, Cigarette and Liquor taxes: Revenue for each county is transferred monthly to the Consolidated Tax Account by the Department of Taxation.Real Property Transfer Tax (RPTT): Each county treasurer deposits to the Consolidated Tax Account, at least quarterly the revenue collected within the county.
31

CARSON CITY 31,638,326$ LANDER COUNTY 3,832,574$ Other 40,614 Other 1,026,133
TOTAL 31,678,939$ TOTAL 4,858,707$
CHURCHILL COUNTY 6,701,273$ LINCOLN COUNTY 1,377,498$ Fallon 1,920,240 Caliente 153,973 Other 345,546 Other 352,769
TOTAL 8,967,059$ TOTAL 1,884,240$
CLARK COUNTY 414,827,083$ LYON COUNTY 16,808,935$ Boulder City 11,730,051 Fernley 176,435 Henderson 118,869,105 Yerington 484,659 Las Vegas 323,848,791 Other 1,542,566 Mesquite 9,143,797 TOTAL 19,012,594$ North Las Vegas 61,192,352 Other 236,852,201 MINERAL COUNTY 2,259,405$
TOTAL 1,176,463,380$ Other 132,831 TOTAL 2,392,236$
DOUGLAS COUNTY 12,412,704$ Other 10,754,305 NYE COUNTY 15,705,290$
TOTAL 23,167,009$ Other 2,948,758 TOTAL 18,654,048$
ELKO COUNTY 15,988,677$ Carlin 1,985,202 PERSHING COUNTY 2,404,072$ Elko 14,289,781 Lovelock 449,819 Wells 1,261,004 Other 313,213 West Wendover 2,844,516 TOTAL 3,167,105$ Other 2,061,746
TOTAL 38,430,924$ STOREY COUNTY 4,223,476$ Other 1,477
ESMERALDA COUNTY 1,402,234$ TOTAL 4,224,953$ Other 52,899
TOTAL 1,455,133$ WASHOE COUNTY 114,016,013$ Reno 67,516,830
EUREKA COUNTY 5,471,522$ Sparks 27,220,270 Other 70,436 Other 14,651,391
TOTAL 5,541,958$ TOTAL 223,404,504$
HUMBOLDT COUNTY 9,357,340$ WHITE PINE COUNTY 3,491,318$ Winnemucca 3,530,196 Ely 1,462,119 Other 1,658,021 Other 591,146
TOTAL 14,545,557$ TOTAL 5,544,583$
TOTAL DISTRIBUTION 1,583,392,929$
CONSOLIDATED TAX DISTRIBUTIONFISCAL YEAR 2018-19
32

BUSINESS AND EXHIBITION FEE REVENUE
FISCAL YEAR% CHANGE FROM
PRIOR YEAR2013-14 244,905$ -27.06%2014-15 217,271 -11.28%2015-16 192,525 -11.39%2016-17 224,305 16.51%2017-18 191,556 -14.60%2018-19 186,450 -2.67%
LEGAL CITATION Chapter 360.760 - 360.796, Nevada Revised Statutes.
IMPOSITION AND RATE
CURRENT DISTRIBUTION OF REVENUE State General Fund.
ORIGINALLY ENACTED
AMENDMENTS 2005
2009
*Total collections may not match fiscal year distributions due to balancing activity.
Amended effective October 1, 2009 by Assembly Bill 146 of the 75th Session of the Nevada Legislature. Assembly Bill 146 transferred the administration of the Business License fee from the Department of Taxation to the Nevada Secretary of State. The administration of the Exhibition Facilities fee remains with the Department of Taxation.
TOTAL COLLECTIONS
HISTORY
Business License Fee is $200 annually, effective July 1, 2009. This is a fee imposed on persons doing business in Nevada.
Business License Fee was originally enacted during the 2003 Legislation Session as a fee on a person for the privilege of conducting business in this State, effective October 1, 2003. It replaced the business license requirement in 364A, repealed September 30, 2003.
Amended effective July 1, 2005, by the 22nd Special Session of the Nevada Legislature to include a licensing fee for exhibition facilities.
Exhibition fee is $5,000 if paid annually. Or if paid quarterly, the fee is equal to the number of businesses without a state business license taking part in each exhibition, multiplied by the number of days on which the exhibition is held, multiplied by $1.25.
$0
$50
$100
$150
$200
$250
$300
$350
$400
2013-14 2014-15 2015-16 2016-17 2017-18 2018-19
THOUSANDS
FISCAL YEAR
33

MODIFIED BUSINESS TAX REVENUE
FISCAL YEAR
GENERAL BUSINESS
FINANCIAL INSTITUTIONS MINING
ECONOMIC DEVELOPMENT
TOTAL COLLECTIONS
% CHANGE FROM PRIOR YEAR
2013-14 361,095,880$ 23,789,898$ -$ 135,167$ 385,020,945$ -0.44%2014-15 386,213,334 24,144,270 - 145,552 410,503,156 6.62%2015-16 511,574,457 27,043,782 21,938,368 164,140 560,720,746 36.59%2016-17 525,711,142 27,418,060 22,103,717 170,282 575,403,201 2.62%2017-18* 531,001,790 28,404,810 22,437,129 140,267 581,983,996 1.14%2018-19 588,364,782 29,590,123 22,419,773 141,188 640,515,866 10.06%
LEGAL CITATION Chapter 363A, 363B, Nevada Revised Statutes.
IMPOSITION AND RATE
ORIGINALLY ENACTED
*Total collections may not match distributions due to reversions.
Tax is imposed on general businesses, financial institutions, and any entity subject to Net Proceeds of Minerals tax. For general businesses the tax rate is 1.475 percent of the amunt by which the sum of all wages exceeds $50,000 for the calendar quarter. The tax rate for financial institutions and entities subject to Net Proceeds of Minerals is 2 percent of the gross wages paid by the employer during the calendar quarter. There is an allowable deduction from the gross wages for amounts paid by the employer for qualified health insurance or a qualified health benefit plan. The tax is due on or before the last day of the month immediately following the calendar quarter.
CURRENT DISTRIBUTION OF REVENUE Tax collected is distributed to the State General Fund. 50 percent of the tax paid by an entity which was directly recruited/assisted in locating to Nevada by a qualifying economic development agency is distributed back to that agency for a period of 10 years.
HISTORY
2003 Special Session of the State Legislature, effective July 1, 2003. This tax replaces the Business Tax under NRS 364A which was repealed September 30, 2003.
$-
$100
$200
$300
$400
$500
$600
$700
2013-14 2014-15 2015-16 2016-17 2017-18 2018-19
MILLIONS
FISCAL YEAR
34

Modified Business Tax (continued)
AMENDMENTS 2003
2009
2009
2011
2013
2015
Senate Bill 429 of the 2009 Session of the State Legislature changed the tax to a two-tiered rate for General Businesses. The rate on the first $62,500 of taxable wages is 0.5 percent; wages above $62,500 are taxed at 1.17 percent. The rate for Financial Institutions was not changed.
Assembly Bill 317 of the 2009 Session of the State Legislature provides for a 50 percent distribution of Modified Business Tax paid by a business for a period of 10 years to a redevelopment agency that is responsible for locating a business in the state between July 1, 2009 and June 30, 2011.
Assembly Bill 561 of the 2011 Session of the State Legislature changed the rate to 1.17 percent on taxable wages paid above $62,500 in a calendar quarter. There is no tax on wages paid which are less than $62,500 in a calendar quarter. The new rate applies from July 1, 2011 through June 30, 2013.
Senate Bill 475 of the 2013 Session of the State Legislature became effective July 1, 2013. The changes under this bill extend the 0% rate on Tier 1 of the MBT to June 30, 2015. Additionally, the Tier 1 threshold is increased from $62,500 to $85,000. If the sum of all taxable wages, after health care deductions, paid by the employer does not exceed $85,000 for the calendar quarter, the amount of tax is 0% of the sum of those wages. If the sum of all the wages paid by the employer exceeds $85,000 for the calendar quarter, the tax is 1.17 percent of the amount of the wages that exceeds $85,000.
Senate Bill 483 of the 2015 Session of the State Legislature became effective July 1, 2015. The changes under this bill bring the rate to 1.475 percent from 1.17 percent. Additionally, the new threshold is decreased from $85,000 to $50,000 per quarter. If the sum of all taxable wages, after health care deductions, paid by the employer does not exceed $50,000 for the calendar quarter, the amount of tax is $0. If the sum of all the wages paid by the employer exceeds $50,000 for the calendar quarter, the tax is 1.475% of the amount of wages that exceeds the $50,000.
The 2003 Special Session of the State Legislature set the initial tax rate of 0.7 percent for general businesses, effective July 1, 2003 through June 30, 2004. The rate decreased to 0.65 percent effective July 1, 2004 through June 30, 2005. The rate for general businesses decreased to 0.63 percent effective July 1, 2005. A 2% tax rate imposed upon financial institutions.
35

LIVE ENTERTAINMENT TAX REVENUE
FISCAL YEARNEVADA ARTS
COUNCIL GENERAL FUND TOTAL COLLECTIONS% CHANGE FROM
PRIOR YEAR 2013-14 -$ 14,979,978$ 14,979,978$ 27.96%2014-15 - 14,965,649 14,965,649 -0.10%2015-16 150,000 16,536,346 16,686,346 11.50%2016-17 150,000 26,977,758 27,127,758 62.57%2017-18 150,000 24,544,887 24,694,887 -8.97%2018-19 150,000 25,642,344 25,792,344 4.44%
LEGAL CITATION Chapter 368A, Nevada Revised Statutes.
IMPOSITION AND RATE
CURRENT DISTRIBUTION OF REVENUE
HISTORY
ORIGINALLY ENACTED
AMENDMENTS 2005
2007
2015
Amended by the 2007 Session of the State Legislature to exempt minor league baseball games from the tax.
Amended by the 2015 Session of the State Legislature to eliminate the two tiers based on occupancy. The two-tiered tax rates were also eliminated, along with the tax on the sale of food, beverage, and merchandise.
Live Entertainment Tax is administered by two State agencies, the Gaming Control Board for live entertainment events held within licensed gaming establishments; and the Department of Taxation for live entertainment events held in other venues. A 9 percent tax rate is imposed on the admission charge to a facility with a minimum occupancy of 200; or 9 percent of the charge, expressed in money, for the live entertainment provided by an escort.
2003 Session of the State Legislature enacted a tax on live entertainment establishments with a minimum occupancy of 300 seates, effective January 1, 2004.
Amended by the 2005 Session of the State Legislature to reduce the minimum occupancy to 200 seats, and to exempt NASCAR Nextel Cup races from the tax effective July 1, 2007.
State General Fund. Each year $150,000 is transferred to the Nevada Arts Council.
$5
$10
$15
$20
$25
$30
2013-14 2014-15 2015-16 2016-17 2017-18 2018-19
MILLIONS
FISCAL YEAR
36

BANK EXCISE TAX REVENUE
FISCAL YEAR% CHANGE FROM
PRIOR YEAR2013-14 2,788,166$ -6.95%2014-15 3,129,940 12.26%2015-16 2,786,429 -10.98%2016-17 2,785,200 -0.04%2017-18 2,745,343 -1.43%2018-19 2,802,489 2.08%
LEGAL CITATION Chapter 363A.120 Nevada Revised Statutes.
IMPOSITION AND RATE
State General Fund.
ORIGINALLY ENACTED 2003 Session of the State Legislature, effective January 1, 2004.
AMENDMENTS 2005 2005 Special Session of the State Legislature amended the language to impose the tax on the number of branch offices in each county in excess of one branch per county.
TOTAL COLLECTIONS
CURRENT DISTRIBUTION OF REVENUE
A tax imposed on each bank at the rate of $1,750 for each branch office in excess of one maintained by the bank in any county in this State on the first day of each calendar quarter. Each bank that maintains more than one branch office in any county in this State on the first day of a calendar quarter shall make quarterly tax payments due on or before the last day of the first month of that calendar quarter.
HISTORY
$1
$2
$2
$3
$3
$4
$4
2013-14 2014-15 2015-16 2016-17 2017-18 2018-19
MILLIONS
FISCAL YEAR
37

INSURANCE PREMIUM TAX REVENUE
FISCAL YEAR% CHANGE FROM
PRIOR YEAR2013-14 254,662,152$ 5.86%2014-15 283,745,186 11.42%2015-16 299,605,621 5.59%2016-17 348,928,247 16.46%2017-18 381,540,491 9.35%2018-19 409,840,471 7.42%
LEGAL CITATION Chapter 680B Nevada Revised Statutes.
IMPOSITION AND RATE
CURRENT DISTRIBUTION OF REVENUE State General Fund.
ORIGINALLY ENACTED 1933 session of the State legislature.
TOTAL COLLECTIONS
HISTORY
A tax rate of 3.5 percent is imposed on insurers for the privilege of transacting business in this State; and effective June 17, 2005, 2 percent tax rate for Risk Retention Groups. The tax is assessed upon net direct premiums and net direct considerations written. The premium tax is due on March 15th of each year on premiums written in the prior calendar year. Insurers who are required to pay a tax of at least $2,000 the preceding calendar year must pay quarterly tax payments based on actual net direct premiums and net direct considerations written for the current reporting quarter. An insurer is entitled to a "Home Office Credit" of 50 percent of the aggregate amount of tax due and full credit for ad valorem taxes paid by the insurer during the preceding calendar year if the insurer maintains a home office or regional home office in Nevada. The total aggregate amount of credits that may be applied by all insurers is capped at $5,000,000 and is allocated to each insurer on a pro rata basis by determining the percentage of the total amount calculated for all insurers that is allocable to each insurer.
$140
$190
$240
$290
$340
$390
$440
2013-14 2014-15 2015-16 2016-17 2017-18 2018-19
MILLIONS
FISCAL YEAR
38

Insurance Premium Tax Revenue (continued)
AMENDMENTS 1993
1995
1997
1999
2005
2014 2014 Special Session of the State Legislature changed the amount of credits that may be applied by all qualified insurers to not exceed $5 million and must be allocated to each insurer on a pro rata basis by determining the percentage of the total amount calculated for all insurers, effective January 1, 2016.
2005 Session of the State Legislature lowered the tax rate for Risk Retention Groups from 3.5 percent to 2 percent, effective June 17, 2005.
1993 session of the State Legislature transferred the function of tax collection to the Department of Taxation from the Department of Insurance effective July 1, 1993 per AB 782.
1995 Session of the State Legislature passed legislation requiring private insurers who are writing industrial insurance in this State to pay premium tax on those policies. The legislation also provided for a credit against premium taxes on industrial insurance policies in an amount equal to the assessment paid by the insurer to the Division of Industrial Relations, effective July 1, 1999.
1997 Session of the State Legislature changed the due date of the annual return from March 1st to March 15th and requires insurers to report premium taxes based on actual premiums written instead of estimated, effective January 1, 1998.
1999 Session of the State Legislature requires insurers to provide statements to insureds if the portion of premium is attributable to the general premium tax, fees or assessments, effective July 1, 2000.
39

CIGARETTE AND OTHER TOBACCO PRODUCTS TAX REVENUE
FISCAL YEARSTAMP
REVENUE
OTHER TOBACCO
PRODUCTS LICENSESTOTAL
COLLECTIONS
% CHANGE FROM PRIOR
YEAR2013-14 91,004,623$ 11,620,286$ 9,717$ 102,634,626$ -2.47%2014-15 105,914,305 11,458,040 9,863 117,382,207 14.37%2015-16 161,946,389 13,131,919 10,070 175,088,378 49.16%2016-17 191,304,626 14,693,540 9,788 206,007,953 17.66%2017-18 170,112,494 16,496,006 11,238 186,619,738 -9.41%2018-19 174,452,651 18,099,022 9,638 192,561,311 3.18%
FISCAL YEAR
# OFREVENUE STAMPS
% CHANGE FROM PRIOR
YEAR FISCAL YEAR
# OFREVENUE STAMPS
% CHANGE FROM PRIOR
YEAR2013-14 114,233,400 -4.06% 2016-17 106,665,600 19.47%2014-15 131,808,000 15.38% 2017-18 94,796,400 -11.13%2015-16 89,281,635 -32.26% 2018-19 97,178,850 2.51%
NOTE: The tax represents stamps paid for, penalty and interest, and Use Tax paid by manufacturers on gift or sample cigarettes. Revenue stamps represent the number of paid stamps issued by the Department.
$-
$50
$100
$150
$200
$250
2013-14 2014-15 2015-16 2016-17 2017-18 2018-19
MILLIONS
FISCAL YEAR
-
50
100
150
2013-14 2014-15 2015-16 2016-17 2017-18 2018-19
MILLIONS
FISCAL YEAR
REVENUE STAMPS ISSUED
40

Cigarette and Other Tobacco Products Tax Revenue (continued)
LEGAL CITATION
RATE
LICENSE FEES Wholesale Cigarette Dealer $150Retail Cigarette Dealer $0Cigarette Manufacturer $0
Wholesale Other Tobacco Product Dealer $0
CURRENT DISTRIBUTION OF REVENUE
ORIGINALLY ENACTED
RATE
AMENDMENTS 1947
1949
1953
1955
1960
1961
1965
1967
Two or more cities - to cities based on population.
1969
HISTORY
Chapter 370 and Chapter 370A Nevada Revised Statutes.
Cigarettes - 90 mills per cigarette. Other Tobacco Products - 30 percent of manufacturers wholesale price.
5 mills per cigarette for distribution to eligible local governments through the Consolidated Tax distribution.
85 mills per cigarette to the State General Fund. Other Tobacco Productsrevenue to the State General Fund.
Administrative fees determined by legislative appropriation are taken from total receipts.
1947 Session of State Legislature.
1947 - 1949, 2 cents per package; 1949 - 1961, 3 cents per package; 1961 - 1969, 7 cents per package; 1969 to June 30, 1983, 10 cents; July 1, 1983 to June 30, 1985, 15 cents per package; July 1, 1985 to June 30, 1987, 7.5 mills per cigarette; July 1, 1987 to June 30, 1989, 10 mills per cigarette; July 1, 1989, 17.5 mills per cigarette; July 22, 2003, 40 mills per cigarette.
Wholesalers' discount of 10 percent for stamping; 5 percent for administration; remainder to State General Fund.
Wholesalers' discount reduced to 7 percent; revenue distribution, 87.5 percent to State General Fund; 12.5 percent to counties.
Effective date of Use Tax on cigarettes.
Wholesalers' discount for stamping reduced to 5 percent.
Refunds allowed for tax paid on stale cigarettes.
Wholesalers' stamping discount, 4 percent; revenue distribution, 66 percent to State General Fund; 28.5 percent to cities and counties based on population; 5.5 percent to counties based on sales.
Revenue distribution changed - 30 percent to State General Fund; 64.5 percent to cities and counties based on population; 5.5 percent to counties based on county sales.
Revenue distribution changed - 100 percent local.
No cities - 100 percent to county.
One city - to county and city based on population.
Compensation to the state for the costs of collecting the taxes and license fees was changed to annual transmission of $33,000 from the remittances of the tax to the state treasurer to the tax commission.
41
Cigarette and Other Tobacco Products Tax Revenue (continued)
AMENDMENTS (continued) 1971
1977
1980
1983
1985
1987
1989
1991
1997
1999
Compensation to the state for costs of collecting the taxes and license fees waschanged from $33,000 annually to such a sum as the legislature shall specify.Additionally, Monthly report required from tobacco dealers of other tobaccoproducts.
Required licensing of retail dealers in cigarettes and for direct taxation of theconsumers of cigarettes; permitted the governing body of an Indian reservationof colony to impose an excise tax on the sales of cigarettes and provided forrefund in certain instances.
June 10, 1980 - Supreme Court decision of Washington vs. Coleville Indian Reservation determined that State cigarette tax could not be applied to on-reservation transactions. Effective July 16, 1980 cigarettes sold to and by eligible Indian smoke shops required tribal cigarette stamps or metered impressions on packages sold. In 1980 the Department of Taxation furnished 13,091,470 tribal stamps. In more recent years the Department has furnished the following number of tribal stamps:
FY 2013-14 17,580,000 FY 2014-15 20,115,000FY 2015-16 16,185,000 FY 2016-17 15,780,000FY 2017-18 16,830,000 FY 2018-19 16,560,000
The 1983 session of the State Legislature enacted an additional 5 cent per pack tax for distribution to the State General Fund. In addition, all products made from tobacco, other than cigarettes, are taxed at 30 percent of the manufacturer's wholesale price for distribution to the State General Fund.
The 1985 Session of the State Legislature enacted a tax base change to 7.5 mills per cigarette but not less than 15 cents per package.
The 1989 Session of the State Legislature enacted a tax rate change to 17.5 mills per cigarette.
Wholesalers' discount for stamping reduced from 4 percent to 3 percent.
The 1987 Session of the State Legislature enacted a tax rate change to 10 mills per cigarette but not less than 20 cents per package.
The 1997 Legislature created the Consolidated Tax Program. Beginning FY 1998-99, the Department implemented the program that combines BCCRT, SCCRT, Cigarette Tax, Liquor Tax, Real Property Transfer Tax and Motor Vehicle Privilege Tax into one monthly distribution. Total allocation by county is transferred to the Consolidated Tax Account for distribution to individual local governments within the county.
Other tobacco products displayed or exhibited at trade show exempt from excise tax.
The 1999 Legislature enacted Assembly Bill 667, which is Nevada's model legislation for the Tobacco Master Settlement Agreement. Effective May 24, 1999, all manufacturers of tobacco products sold in Nevada are required to participate in the Tobacco Settlement Agreement or to place money in escrow.
42

Cigarette and Other Tobacco Products Tax Revenue (continued)
AMENDMENTS (continued) 2001
2003
2005
2008
2009
2015
Senate Bill 381, effective July 1, 2001, revised the definition of wholesale dealer and wholesale price for Other Tobacco Products. SB 381 changed the payment of tax to after the sale or distribution of Other Tobacco Products.
Senate Bill 527, effective July 1, 2001, provides for an exemption for duty-free sales enterprises and persons importing cigarettes for personal use. SB 527 also requires cigarette revenue stamps designed to identify the dealer who affixes the stamp.
Senate Bill 8, effective July 22, 2003, enacted a tax rate change on cigarettes to 40 mills per cigarette.
Assembly Bill 4, effective August 1, 2003, changed the cigarette wholesalers’ discount rate for stamping from 3 percent to 0.5 percent. AB4 also changed the other tobacco products wholesalers’ collection allowance from 2 percent to 0.5 percent if the taxes are paid timely.
Assembly Bill 436, effective October 1, 2005, requires the Department to maintain a listing of tobacco products that may be sold in the state of Nevada on the Department’s internet website by January 1, 2006; prohibits a person from affixing a stamp to a package of cigarettes of a manufacturer of tobacco products or brand family which is not included in the directory; and prohibits the sale, offer or possession for sale, cigarettes of a manufacturer of tobacco products or brand family not included in the directory.
Assembly Bill 464, effective June 10, 2005, adds new licensing requirements for manufacturers and retailers of tobacco products; adds licensing and reporting requirements for anyone selling tobacco products into Nevada; prohibits a person, other than a wholesale dealer, from receiving unstamped cigarette packages; and provides various felony charges for certain violations of the tobacco tax laws.
Senate Bill 2 of the 25th Special Session temporarily changed the cigarette wholesalers' discount rate for stamping from 0.5 percent to 0.25 percent. Senate Bill 2 also temporarily changed the other tobacco products wholesalers' collection allowance from 0.5 percent to 0.25 percent for the period beginning on January 1, 2009 and ending on June 30, 2009.
Assembly Bill 552 of the 2009 Legislative Session removed the sunset date of June 30, 2009 for the collection allowance and discount rate of 0.25 percent.
Senate Bill 483 of the 2015 Legislative Session increased the General Fund portion of sales tax from 40 mills to 90 mills per pack.
43

Cigarette and Other Tobacco Products Tax Revenue (continued)
AMENDMENTS (continued) 2019
Cigarette Manufacturer's License $1,000Wholesale Dealer of Cigarettes License $650Wholesale Dealer of Other Tobacco Products License $650Tobacco Retailer's License $50
Senate Bill 81 of the 2019 Legislative Session revised when the payment of the tax on other tobacco products is due; requires tobacco wholesale dealers to maintain a certain level of product inventory; establishes procedures for claiming a refund; requires tobacco dealers to maintain certain records; revises civil penalties for violations of the law; and provides conforming language to include other tobacco products within the cigarette statutes.
Assembly Bill 535 of the 2019 Legislative Session revised the wholesale cigarette dealer licensing fee and established licensing fees for cigarette manufacturers, wholesale dealers of other tobacco products and tobacco retailers, to be effective October 1, 2019:
Senate Bill 263 of the 2019 Legislative Session added vapor and alternative nicotine products to the definition of other tobacco products, including electronic cigarettes, cigars, cigarillos, pipes, hookahs, vape pens, similar products and their components.
44

Cigarette and Other Tobacco Products Tax Revenue (continued)
COUNTY TAX % OF TOTAL
Carson City 178,189$ 0.09%Churchill 81,599 0.04%Clark 7,051,373 3.66%Douglas 155,246 0.08%Elko 171,275 0.09%Esmeralda 3,118 0.00%Eureka 6,210 0.00%Humboldt 54,571 0.03%Lander 19,928 0.01%Lincoln 16,617 0.01%Lyon 175,679 0.09%Mineral 15,023 0.01%Nye 149,107 0.08%Pershing 21,673 0.01%Storey 13,127 0.01%Washoe 1,452,572 0.75%White Pine 34,408 0.02%
TOTAL COUNTY TRANSFER 9,599,715$ 4.99%
Administrative Fees 470,034$ 0.24%State General Fund 164,392,540 85.37%Other Tobacco Products 18,099,022 9.40%TOTAL 192,561,311$ 100.00%
TRANSFER OF CIGARETTE TAX REVENUETO CONSOLIDATED TAX
FISCAL YEAR 2018-19
45

LIQUOR TAX REVENUE
FISCAL YEAR TAX LICENSES AND
FINES TOTAL
COLLECTIONS % CHANGE FROM
PRIOR YEAR2013-14 46,502,331$ 198,350$ 46,700,681$ 5.34%2014-15 47,244,106 207,775 47,451,881 1.61%2015-16 48,737,828 214,800 48,952,628 3.16%2016-17 48,610,512 219,756 48,830,269 -0.25%2017-18 48,944,973 229,881 49,174,854 0.71%2018-19 49,665,191 226,290 49,891,481 1.46%
LEGAL CITATION Chapters 369 and 597 Nevada Revised Statutes.
RATES Over 22 percent alcohol content by volume $3.60 per gallonOver 14 percent up to 22 percent by volume $1.30 per gallon0.5 up to 14 percent by volume $0.70 per gallonBeer (malt beverage) $0.16 per gallon
LICENSE FEES Importer of wine, beer, and liquor $500Importer of beer $150Wholesaler of wine, beer and liquor $250Wholesaler of beer $75Brew Pub $75Brewer $75Winemaker $75Certificate of Compliance $50Instructional Wine Maker $75Craft Distiller $75Estate Distiller $75
FINES First offense $500Second offense $1,000Third and subsequent offenses $5,000
$-
$10
$20
$30
$40
$50
$60
2013-14 2014-15 2015-16 2016-17 2017-18 2018-19
MILLIONS
FISCAL YEAR
46

Liquor Tax Revenue (continued)
CURRENT DISTRIBUTION OF REVENUE
ORIGINALLY ENACTED 1935 as a Stamp Tax.
RATES 1935
1945
1947
1961
1969 Over 22 percent alcohol increased to $1.90 per gallon.
1981 Over 22 percent alcohol increased to $2.05 per gallon.
1983
2003
DISTRIBUTION 1935
1937
1939
Beer, 16 cents per per gallon, up to 14 percent alcohol content, 70 cents per gallon; over 14 percent up to 22 percent alcohol content, $1.30 cents per gallon; over 22 percent alcohol content, $3.60 per gallon.
Beer, 9 cents per gallon; liquor, up to 14 percent alcohol content, 40 cents per gallon; over 14 percent up to 22 percent alcohol content, 75 cents per gallon; over 22 percent alcohol content, $2.05 per gallon.
50 cents per gallon of collections on over 22 percent alcohol content allocated for distribution to eligible local governments through the Consolidated Tax distribution. The portion of tax on liquor containing over 22 percent alcohol which exceeds $3.45 per wine gallon is transferred to the liquor program account in the State General Fund. Fifty percent of Liquor Awareness Fines go to Aid for Victims of Domestic Violence and the other fifty percent go to community juvenile justice programs. All remaining revenues go to the State General Fund.
Case beer, 24 bottles, 6 cents per case; 36 bottles, 9 cents per case; keg beer, 2 cents per gallon. Wines up to 14 percent alcohol content, 2 1/2 cents per quart; 14 percent up to 22 percent alcohol content, 5 cents per quart. All alcoholic beverages over 22 percent alcohol content, up to 4 ounces, 1 cent; up to 8 ounces, 2 cents; up to 16 ounces, 5 cents; up to 32 ounces, 10 cents.
Beer, 3 cents per gallon; liquor, 8 percent up to 14 percent alcohol content, 15 cents per gallon; over 14 percent up to 22 percent alcohol content, 25 cents per gallon; over 22 percent alcohol content, 60 cents per gallon.
Beer, 3 cents per gallon; liquor, up to 14 percent alcohol content, 15 cents per gallon; over 14 percent to 22 percent alcohol content, 25 cents per gallon; over 22 percent alcohol content, 80 cents per gallon.
Beer, 6 cents per gallon; liquor, up to 14 percent alcohol content, 30 cents per gallon; over 14 percent up to 22 percent alcohol content, 50 cents per gallon; over 22 percent alcohol content, $1.40 per gallon.
HISTORY
3 percent for administration, $100,000 to School Fund; $24,000 to University Contingent Fund; balance to State Emergency Employment Bond Interest and Redemption Fund.
5 percent maximum for administration; balance as follows: 50 percent to School Fund; 15 percent to University Contingent Fund; 35 percent to State Emergency Employment Bond Interest and Redemption Fund.
5 percent maximum for administration; balance as follows: 50 percent to School Fund; 40 percent to University Contingent Fund; 10 percent to Consolidated Bond Interest and Redemption Fund.
47

Liquor Tax Revenue (continued)
1943 5 percent maximum for administration; balance to General Fund.
1949 All revenue to General Fund, administration costs appropriated.
1969
No cities - 100 percent to county.
One city - based on population ratio of county and city.
Two or more cities - to cities based on population.
1981
AMENDMENTS 1945 Changed from Stamp Tax to Excise Tax.
1955 Allowed 2 percent tax discount to importer.
1961 Allowed 3 percent tax discount to importer.
1969
1981
1983
1995
1997
1999
All revenues to General Fund except 5/19 of that collected on liquor over 22percent which is allocated accordingly:
Additional 15 cent tax on over 22 percent alcohol allocated to the Account for Alcohol and Drug Abuse in the Department of Human Resources Gift Fund.
DISTRIBUTION (continued)
Assembly Bill 594, effective July 2, 1995, prohibited a person from operating a brew pub without a brew pub's license; added the definition of a brew pub and provided language for the operations of a brewpub.
Senate Bill 428, effective June 7, 1999 increased the amount of wine a Nevada resident may import from one gallon per month to twelve cases per year for personal or household use. Other alcoholic beverages remain at one gallon per month.
Raised rate for over 22 percent alcohol content from $1.40 to $1.90 and allocated 50 cents of that rate to counties and cities.
Raised rate for over 22 percent alcohol content from $1.90 to $2.05 allocating 50 cents of that rate to counties and cities and 15 cents to the Account for Alcohol and Drug Abuse in the Department of Human Resources Gift Fund.
Raised rates for beer to 9 cents per gallon; liquor up to 14 percent alcohol content, 40 cents per gallon; over 14 percent up to 22 percent alcohol content, 75 cents per gallon. Over 22 percent alcohol content remained at $2.05 per gallon.
An applicant for a certificate of compliance must pay a $50 fee. This fee is renewable on or before July 1st of each year.
The 1997 Legislature created the Consolidated Tax Program. Beginning FY 98-99, the Department implemented the program that combines BCCRT, SCCRT, Cigarette Tax, Liquor Tax, Real Property Transfer Tax and Motor Vehicle Privilege Tax into one monthly distribution. Total allocation by county is transferred to the Consolidated Tax Account for distribution to individual local governments within the county.
48
Liquor Tax Revenue (continued)
AMENDMENTS(continued)
2001
2003
2005
2008
2009
Senate Bill 233, effective June 10, 2005, creates licensing requirements for Instructional Wine Making Facilities; limits the amount of wine produced per person to 60 gallons in a 12 month period; wine produced on the premises can only be used for household or personal use; and exempts Instructional Wine Making Facilities from the liquor excise tax.
Assembly Bill 12, effective June 15, 2001, authorized the transfer of liquor (not including beer), between affiliated retailers that hold non-restricted gaming licenses.
Assembly Bill 437, effective July 1, 2003, changed the definition of supplier and authorized the transfer of liquor including beer, between affiliated retailers that hold non-restricted gaming licenses.
Assembly Bill 4, effective August 1, 2003, changed the early payment discount rate from 3 percent to 0.5 percent.
Senate Bill 373, effective October 1, 2003, changed the reporting requirements for shipments of liquor into Nevada by a common or contract carrier.
Raised rates for beer to 16 cents per gallon; liquor up to 14 percent alcohol content, 70 cents per gallon; over 14 percent up to 22 percent alcohol content, $1.30 per gallon and over 22 percent alcohol content to $3.60 per gallon.
Assembly Bill 221, effective June 10, 2005, adds rectifiers to the definition of a supplier.
Senate Bill 457, effective June 17, 2005, revised provisions governing the storage and transfer of liquor between certain retail liquor stores; authorizes a wholesale dealer, supplier, retailer or retail liquor dealer to bring a civil action for certain violations relating to intoxicating liquor; requires sellers, servers and security personnel employed at an establishment where alcoholic beverages are sold to complete alcohol awareness training; and requires the Department of Taxation to impose administrative fines upon the owners or operators of certain establishments for violations relating to alcohol awareness training cards.
Senate Bill 2 of the 25th Special Session temporarily reduced the early payment discount rate from 0.5 percent to 0.25 percent for the period beginning on January 1, 2009 and ending on June 30, 2009.
Assembly Bill 432 of the 2009 Legislative Session provides that fines collected from establishments for alcohol awareness training violations are to be distributed 50 percent to Aid to Victims of Domestic Violence and 50 percent to community juvenile justice programs.
Assembly Bill 552 removed the sunset date of June 30, 2009 for the discount rate.
49

Liquor Tax Revenue (continued)
AMENDMENTS(continued)
2013
2017
Assembly Bill 153 provided for the licensing and operation of craft distilleries in the State; setting forth the conditition under which spirits manufactured as such estate distilleries may be sold.
Senate Bill 199 added language to provide for the licensing and operation of estate distilleries in this State; setting forth the conditions under which spirits manufactured at such estate distilleries may be sold.
50

Liquor Tax Revenue (continued)
COUNTY TAX % OF TOTAL
Carson City 72,647$ 0.15%Churchill 33,267 0.07%Clark 2,874,810 5.76%Douglas 63,293 0.13%Elko 69,828 0.14%Esmeralda 1,271 0.00%Eureka 2,532 0.01%Humboldt 22,248 0.04%Lander 8,125 0.02%Lincoln 6,775 0.01%Lyon 71,623 0.14%Mineral 6,125 0.01%Nye 60,790 0.12%Pershing 8,836 0.02%Storey 5,352 0.01%Washoe 592,206 1.19%White Pine 14,028 0.03%
TOTAL COUNTY TRANSFER 3,913,756$ 7.84%
Liquor Program Account 1,174,127 2.35%State General Fund 44,790,598 89.78%Alcoholic Beverage Awareness Program Fine Victims of Domestic Violence 6,500 0.01% Community Juvenile Justice Program 6,500 0.01%TOTAL 49,891,481$ 100.00%
TRANSFER OF LIQUOR TAX REVENUETO CONSOLIDATED TAX
FISCAL YEAR 2018-19
51

ALCOHOLIC BEVERAGE GROWTH
BEER - GALLONS
FISCAL YEAR GALLONS% CHANGE FROM
PRIOR YEAR FISCAL YEAR GALLONS
% CHANGE FROM PRIOR
YEAR2013-14 71,710,388 2.93% 2016-17 72,923,338 0.81%2014-15 72,967,647 1.79% 2017-18 73,850,960 1.27%2015-16 72,340,606 -0.86% 2018-19 71,415,131 -3.30%
FISCAL YEAR GALLONS% CHANGE FROM
PRIOR YEAR FISCAL YEAR GALLONS
% CHANGE FROM PRIOR
YEAR2013-14 9,877,949 6.16% 2016-17 10,345,879 0.11%2014-15 10,112,114 2.37% 2017-18 10,405,489 0.58%2015-16 10,334,207 2.20% 2018-19 10,677,534 2.61%
ALCOHOLIC BEVERAGES 0.50% TO 14% ALCOHOL CONTENT BY VOLUME - GALLONS
60
65
70
75
80
2013-14 2014-15 2015-16 2016-17 2017-18 2018-19
MILLIONS
FISCAL YEAR
0
2
4
6
8
10
12
2013-14 2014-15 2015-16 2016-17 2017-18 2018-19
MILLIONS
FISCAL YEAR
52

Alcohol Beverage Growth (continued)
FISCAL YEAR GALLONS% CHANGE FROM
PRIOR YEAR FISCAL YEAR GALLONS
% CHANGE FROM PRIOR
YEAR2013-14 1,583,207 1.24% 2016-17 1,753,107 1.50%2014-15 1,742,336 9.59% 2017-18 1,800,661 2.71%2015-16 1,727,184 -0.87% 2018-19 1,987,756 10.39%
FISCAL YEAR GALLONS% CHANGE FROM
PRIOR YEAR FISCAL YEAR GALLONS
% CHANGE FROM PRIOR
YEAR2013-14 7,208,111 3.18% 2016-17 7,625,726 -0.95%2014-15 7,288,991 1.12% 2017-18 7,644,794 0.25%2015-16 7,698,594 6.80% 2018-19 7,837,545 2.52%
ALCOHOLIC BEVERAGES OVER 14% UP TO 22% ALCOHOL CONTENT BY VOLUME - GALLONS
ALCOHOLIC BEVERAGES OVER 22% ALCOHOL CONTENT BY VOLUME - GALLONS
0.0
0.5
1.0
1.5
2.0
2013-14 2014-15 2015-16 2016-17 2017-18 2018-19
MILLIONS
FISCAL YEAR
4.5
5.0
5.5
6.0
6.5
7.0
7.5
8.0
2013-14 2014-15 2015-16 2016-17 2017-18 2018-19
MILLIONS
FISCAL YEAR
53

LODGING TAX REVENUE
FISCAL YEAR TOURISM GENERAL FUNDSCHOOL SUPPORT
FUNDTOTAL
COLLECTIONS% CHANGE FROM
PRIOR YEAR2013-14 19,279,041$ -$ 141,118,366$ 160,397,406$ 9.58%2014-15 20,461,307 - 151,112,157 171,573,464 6.97%2015-16 22,458,107 - 167,015,992 189,474,099 10.43%2016-17 24,236,383 - 178,845,620 203,082,002 7.18%2017-18 24,629,235 - 179,950,633 204,579,868 0.74%2018-19 25,079,061 - 183,397,890 208,476,951 1.90%
LEGAL CITATION
IMPOSITION AND RATE
Chapter 244.3354, Nevada Revised Statutes.
Tax on revenues from rental of transient lodging is imposed at the rate of at least 1 percent of the gross receipts in a county with a population of less than 700,000. Tax on revenues from the rental of transient lodging is imposed at the rate of 2 percent of the gross receipts in a county with a population of 700,000 or more. An additional tax rate of 3 percent of the gross receipts from the rental of transient lodging is imposed in a county whose population is 300,000 or more.
The local boards of county commissioners are responsible for the imposition and collection of the lodging tax, while the Department of Taxation records and transfers the revenue to the appropriate state budget accounts.
In counties whose population is 700,000 or more, 3/8 of the first 1 percent of the proceeds must be paid to the Department of Taxation for deposit with the State Treasurer for credit to the Fund for the Promotion of Tourism, the remaining proceeds are transmitted to the county treasurer for the deposit in the county school districts fund for capital projects.
In counties whose population is less than 700,000, 3/8 must be paid to the Department of Taxation for deposit with the State Treasurer for credit to the Fund for the Promotion of Tourism, 5/8 must be deposited with the county fair and recreation board or, if no such board was created, with the board of county commissioners to be used to advertise resources of that county related to tourism.
CURRENT DISTRIBUTION OF REVENUE
$0
$30
$60
$90
$120
$150
$180
$210
2013-14 2014-15 2015-16 2016-17 2017-18 2018-19
MILLIONS
FISCAL YEAR
54

Lodging Tax Revenue (continued)
ORIGINALLY ENACTED 1983 session of State Legislature, effective May 9, 1983.
AMENDMENTS 2009
HISTORY
Initiative Petition 1 (IP 1) of the 2009 Session of the State Legislature imposed an additional 3 percent tax in counties with populations greater than 300,000 for remittance to the State General Fund. If the lodging tax rate on July 31, 2008 was under 10 percent, an additional lodging tax rate of 3 percent will be imposed. If the lodging tax rate exceeded 10 percent on July 31, 2008, the tax imposed is at a rate equal to the difference between 13 percent and the sum of the rates of the existing taxes. Any increase in the rate of an existing tax after July 31, 2008 does not reduce the rate of the tax imposed under IP 1. As of July 1, 2011 the additional percentage imposed by IP 1 is deposited into the State Supplement School Support Fund.
55
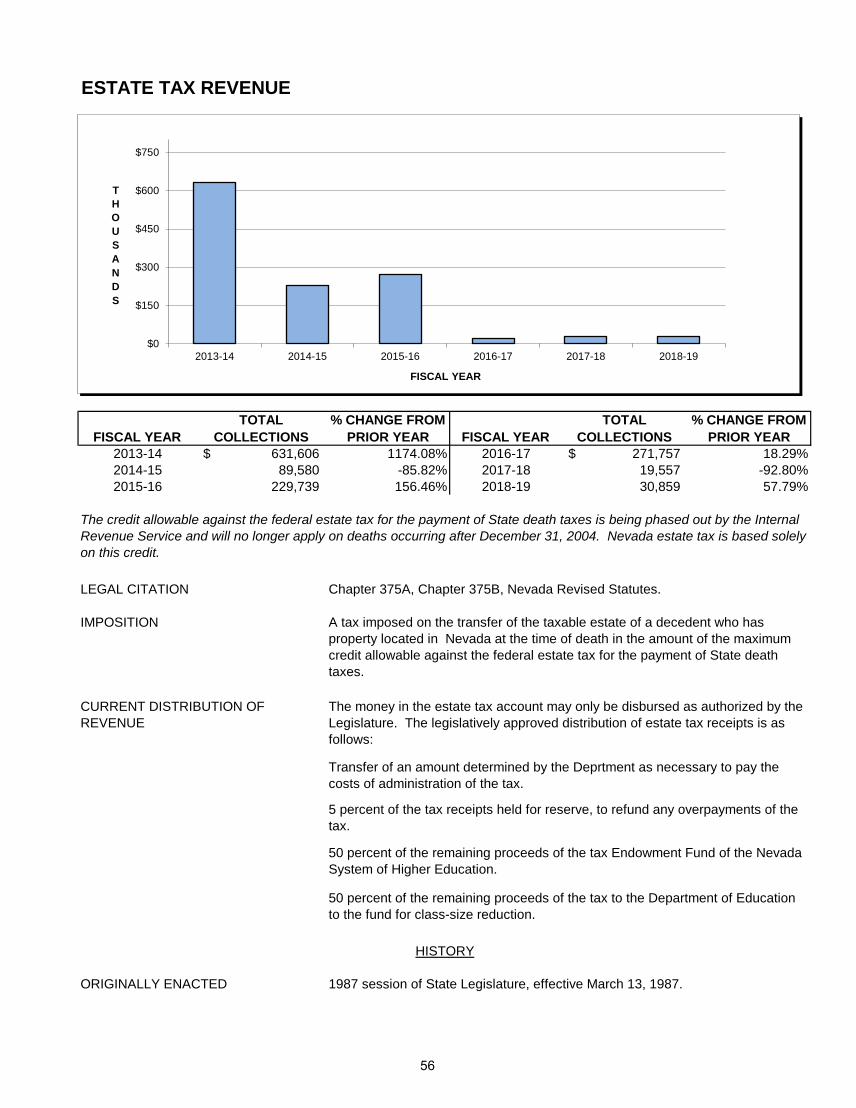
ESTATE TAX REVENUE
FISCAL YEARTOTAL
COLLECTIONS% CHANGE FROM
PRIOR YEAR FISCAL YEARTOTAL
COLLECTIONS% CHANGE FROM
PRIOR YEAR2013-14 631,606$ 1174.08% 2016-17 271,757$ 18.29%2014-15 89,580 -85.82% 2017-18 19,557 -92.80%2015-16 229,739 156.46% 2018-19 30,859 57.79%
LEGAL CITATION Chapter 375A, Chapter 375B, Nevada Revised Statutes.
IMPOSITION
ORIGINALLY ENACTED 1987 session of State Legislature, effective March 13, 1987.
The credit allowable against the federal estate tax for the payment of State death taxes is being phased out by the Internal Revenue Service and will no longer apply on deaths occurring after December 31, 2004. Nevada estate tax is based solely on this credit.
50 percent of the remaining proceeds of the tax Endowment Fund of the Nevada System of Higher Education.
50 percent of the remaining proceeds of the tax to the Department of Education to the fund for class-size reduction.
CURRENT DISTRIBUTION OF REVENUE
5 percent of the tax receipts held for reserve, to refund any overpayments of the tax.
HISTORY
A tax imposed on the transfer of the taxable estate of a decedent who has property located in Nevada at the time of death in the amount of the maximum credit allowable against the federal estate tax for the payment of State death taxes.
The money in the estate tax account may only be disbursed as authorized by the Legislature. The legislatively approved distribution of estate tax receipts is as follows:
Transfer of an amount determined by the Deprtment as necessary to pay the costs of administration of the tax.
$0
$150
$300
$450
$600
$750
2013-14 2014-15 2015-16 2016-17 2017-18 2018-19
THOUSANDS
FISCAL YEAR
56

Estate Tax Revenue (continued)
Department of Taxation administrative costs -$ Reserve for refunds 30,859 Department of Education: Trust Fund for the Education of Pupils - University of Nevada System Endowment Fund -
TOTAL 30,859$
ESTATE TAX RESERVE FOR REFUNDS
Beginning balance brought forward July 1, 2018 1,393,996$ Estate tax receipts - Reserve for refunds Fiscal Year 2019 30,859
Balance available 1,424,855$
Less: Refunds issued Fiscal Year 2019 -
Ending Balance at June 30, 2019 1,424,855$
DISTRIBUTION OF ESTATE TAX REVENUEFISCAL YEAR 2018-19
57

TIRE FEE REVENUE
FISCAL YEAR% CHANGE FROM
PRIOR YEAR2013-14 1,768,460$ 2.85%2014-15 1,809,948 2.35%2015-16 1,883,747 4.08%2016-17 1,981,400 5.18%2017-18 2,017,921 1.84%2018-19 2,123,281 5.22%
LEGAL CITATION Chapter 444A Nevada Revised Statutes.
IMPOSITION AND RATE
CURRENT DISTRIBUTION OF REVENUE
ORIGINALLY ENACTED 1991 Session of the State Legislature.
AMENDMENTS 1993 1993 Session of the State Legislature, per Senate Bill No. 97 and Assembly Bill 386, transferred the function of fee collection to the Department of Taxation from the Department of Conservation and Natural Resources and provided for the change to the current distribution.
A fee imposed on the retail sale of a new tire at the rate of $1.00 per tire. The fee is collected from the purchaser by the seller at the time of sale in addition to applicable sales taxes; 95 percent of the fee is remitted to the Department; 5 percent is retained by the seller to cover their related administrative costs.
The revenue collected by the Department is deposited for credit to the Solid Waste Management Account in the State General Fund. The State Controller distributes quarterly as follows: 0.5 percent, Department of Taxation; 44.5 percent State Department of Conservation and Natural Resources; 30 percent Clark County District Board of Health; and 25 percent Washoe County District Board of Health.
HISTORY
TOTAL COLLECTIONS
$0.0
$0.5
$1.0
$1.5
$2.0
$2.5
2013-14 2014-15 2015-16 2016-17 2017-18 2018-19
MILLIONS
FISCAL YEAR
58

GOVERNMENTAL SERVICES FEE REVENUE
FISCAL YEAR% CHANGE FROM
PRIOR YEAR2013-14 55,251,487$ 1.02%2014-15 58,204,664 5.34%2015-16 62,080,261 6.66%2016-17 62,786,363 1.14%2017-18 66,199,896 5.44%2018-19 68,294,661 3.16%
LEGAL CITATION Chapter 244A and Chapter 482 Nevada Revised Statutes.
IMPOSITION AND RATE
ORIGINALLY ENACTED
AMENDMENTS 1997
1993 Session of the State Legislature, effective July 9, 1993.
Assembly Bill 388, effective July 1, 1997, transferred the responsibility for the collection of the short-term lease fees from the Department of Motor Vehicles and Public Safety to the Department of Taxation.
HISTORY
TOTAL COLLECTIONS
Effective April 1, 2004, Washoe County imposed a fee at the rate of 2 percent of lease charges with 0.25 percent of that amount going to the Department of Taxation for Collection allowance.
Effective July 1, 2005 Clark County imposed a fee at the rate of 2 percent of lease charges with 0.10 percent of that amount going to the Department of Taxation for Collection allowance.
CURRENT DISTRIBUTION OF REVENUE State General Fund, State Highway Fund, Washoe County and Clark County.
A fee imposed on the short-term lease of passenger vehicles. The fee is 10 percent of lease charges. Fees are due on a quarterly basis.
$-
$10
$20
$30
$40
$50
$60
$70
2013-14 2014-15 2015-16 2016-17 2017-18 2018-19
MILLIONS
FISCAL YEAR
59
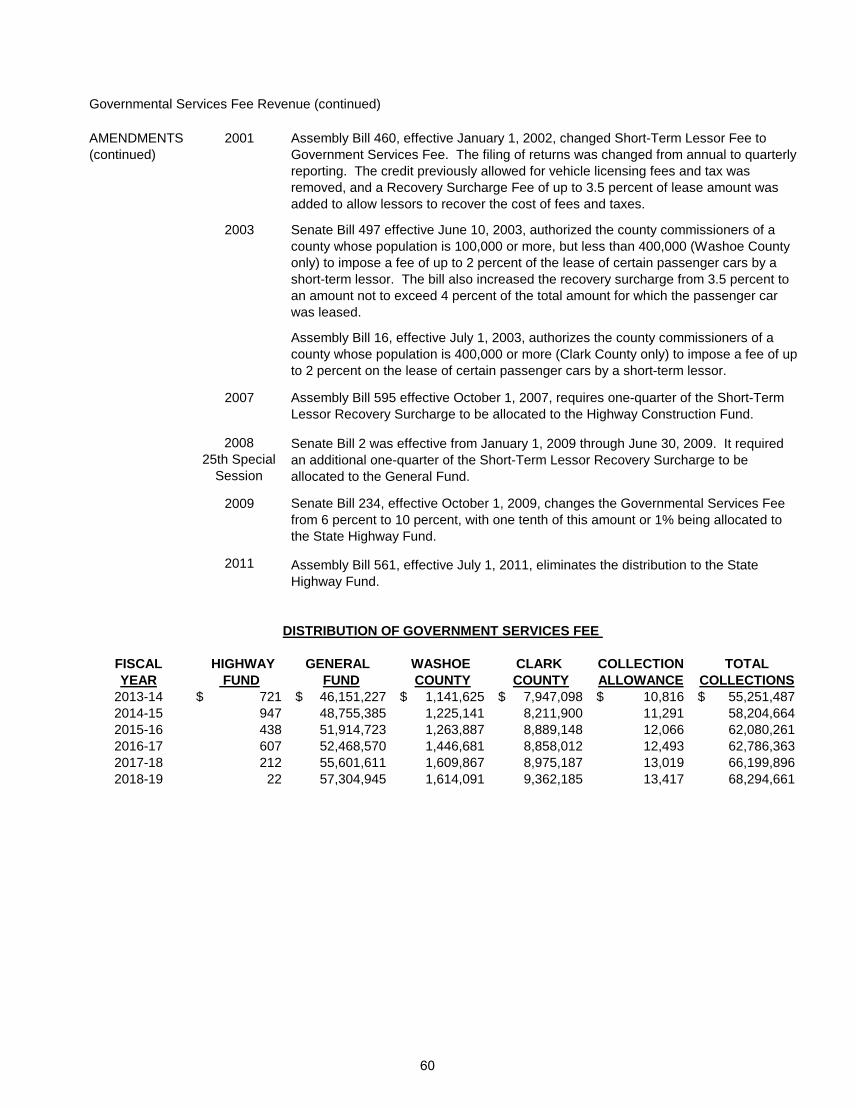
Governmental Services Fee Revenue (continued)
AMENDMENTS (continued)
2001
2003
2007
2008 25th Special
Session
2009
2011
DISTRIBUTION OF GOVERNMENT SERVICES FEE
FISCAL HIGHWAY GENERAL WASHOE CLARK COLLECTION TOTALYEAR FUND FUND COUNTY COUNTY ALLOWANCE COLLECTIONS
2013-14 721$ 46,151,227$ 1,141,625$ 7,947,098$ 10,816$ 55,251,487$ 2014-15 947 48,755,385 1,225,141 8,211,900 11,291 58,204,664 2015-16 438 51,914,723 1,263,887 8,889,148 12,066 62,080,261 2016-17 607 52,468,570 1,446,681 8,858,012 12,493 62,786,363 2017-18 212 55,601,611 1,609,867 8,975,187 13,019 66,199,896 2018-19 22 57,304,945 1,614,091 9,362,185 13,417 68,294,661
Assembly Bill 561, effective July 1, 2011, eliminates the distribution to the State Highway Fund.
Assembly Bill 460, effective January 1, 2002, changed Short-Term Lessor Fee to Government Services Fee. The filing of returns was changed from annual to quarterly reporting. The credit previously allowed for vehicle licensing fees and tax was removed, and a Recovery Surcharge Fee of up to 3.5 percent of lease amount was added to allow lessors to recover the cost of fees and taxes.
Senate Bill 497 effective June 10, 2003, authorized the county commissioners of a county whose population is 100,000 or more, but less than 400,000 (Washoe County only) to impose a fee of up to 2 percent of the lease of certain passenger cars by a short-term lessor. The bill also increased the recovery surcharge from 3.5 percent to an amount not to exceed 4 percent of the total amount for which the passenger car was leased.
Assembly Bill 16, effective July 1, 2003, authorizes the county commissioners of a county whose population is 400,000 or more (Clark County only) to impose a fee of up to 2 percent on the lease of certain passenger cars by a short-term lessor.
Assembly Bill 595 effective October 1, 2007, requires one-quarter of the Short-Term Lessor Recovery Surcharge to be allocated to the Highway Construction Fund.
Senate Bill 2 was effective from January 1, 2009 through June 30, 2009. It required an additional one-quarter of the Short-Term Lessor Recovery Surcharge to be allocated to the General Fund.
Senate Bill 234, effective October 1, 2009, changes the Governmental Services Fee from 6 percent to 10 percent, with one tenth of this amount or 1% being allocated to the State Highway Fund.
60

RETAIL MARIJUANA TAX REVENUE
FISCAL YEAR % CHANGE FROM
PRIOR YEAR2017-18 42,489,201$ Not Applicable2018-19 55,184,916 29.88%
LEGAL CITATION Chapter 372A.290(2), Nevada Revised Statutes.
IMPOSITION AND RATE
CURRENT DISTRIBUTION OF REVENUE
ORIGINALLY ENACTED 2017
AMENDMENTS 2019
Senate Bill 545 of the 2019 Session of State Legislature requires that these revenues be deposited in the State Distributive School Account in the State General Fund and removed the requirement for the deposit to the Stabilize the Operation of the State Government account of the State General Fund, effective July 1, 2019.
TOTAL COLLECTIONS
An excise tax on the retail sale of marijuana or marijuana products by a retail marijuana store in Nevada, at a rate of 10 percent of the sales price of the marijuana or marijuana product.
During Fiscal Year 2019 revenue was deposited to the Account to Stabilize the Operation of the State Government (a.k.a the Rainy Day Fund) in the State General Fund. Effective July 1, 2019 revenue is deposited to the State Distributive School Account in the State General Fund.
2017 Session of State Legislature, effective July 1, 2017.
Senate Bill 543 of the 2019 Session of State Legislature created the State Education Fund and required revenue be deposited into the fund, in addition to direct legislative appropriations from the State General Fund, effective June 14, 2019.
HISTORY
$-
$25
$50
$75
$100
2013-14 2014-15 2015-16 2016-17 2017-18 2018-19
MILLIONS
FISCAL YEAR
61

WHOLESALE MARIJUANA TAX REVENUE
FISCAL YEARWHOLESALE
MARIJUANA TAX
MEDICAL MARIJUANA TAX (LATE
PAYMENTS)TOTAL
COLLECTIONS % CHANGE FROM
PRIOR YEAR2017-18 27,270,582$ 92,765$ 27,363,347$ Not Applicable2018-19 44,000,057 204,642 44,204,699 61.55%
LEGAL CITATION Chapters 453D.500 and 372A.290(1), Nevada Revised Statutes.
IMPOSITION AND RATE
CURRENT DISTRIBUTION OF REVENUE
ORIGINALLY ENACTED
AMENDMENTS 2016
An excise tax at the rate of 15 percent of the Fair Market Value at Wholesale of marijuana. The tax is the obligation of the cultivation facility and is levied on the first transfer of marijuana only. Additionally, any Medical Marijuana Tax revenue received in Fiscal Year 2019 as late payments for tax obligations in prior fiscal years were combined with and distributed as Wholesale Marijuana Tax.
Revenues collected from the tax are first distributed to the Department to pay the costs of carrying out the provisions of chapters 453A and 453D of NRS and to local governments in the amount of $5 million per year to pay their costs. Any remaining money is distributed to the State Distributive School Account.
Wholesale Marijuana Tax for adult-use marijuana established by initiative petition, Ballot Question no. 2, codified as NRS 453D.
HISTORY
Medical Marijuana Tax was established by the 2013 Session of the State Legislature and became effective April 1, 2014. The rate was 2 percent and the tax was levied on each transfer by a medical marijuana cultivator, product manufacturer, and dispensary. Seventy-five percent of the proceeds of the tax were distributed to the State Distributive School Account and 25 percent to pay the costs of the Division of Public and Behavioral Health in carrying out the provisions of NRS 453A.
$-
$10
$20
$30
$40
$50
2013-14 2014-15 2015-16 2016-17 2017-18 2018-19
MILLIONS
FISCAL YEAR
62

Wholesale Marijuana Tax Revenue (continued)
AMENDMENTS (continued)
2017
2019 Senate Bill 543 of the 2019 Session of State Legislature created the State Education Fund and required revenue to be deposited into the Fund, in addition to the direct legislative appropriations from the State General Fund, effective June 14, 2019.
Senate Bill 545 of the 2019 Session of State Legislature requires that these revenues be deposited in the State Distributive School Account in the State General Fund and removed the requirement for deposit to the Stabilize the Operation of the State Government account of the State General Fund.
SB 487 of the 2017 session of the State Legislature eliminated the Medical Marijuana Tax on transfers by medical product manufacturers and dispensaries and changed the rate from 2 to 15 percent on medical cultivators to align with the Wholesale Marijuana Tax established by Ballot Question 2. SB 487 also changed the distribution to align with the Wholesale Marijuana Tax to first fund the costs of the Department (which took over the medical marijuana program on July 1, 2017) and local governments and distribute any remaining revenue to the State Distributive School Account.
63

MARIJUANA FEE REVENUE
FISCAL YEAR % CHANGE FROM
PRIOR YEAR2017-18 11,671,035$ Not Applicable2018-19 9,857,044 -15.54%
LEGAL CITATION Chapters 453D and 453A, Nevada Revised Statutes.
RECREATIONAL LICENSE FEES INITIAL ANNUAL RENEWAL
Application $ 5,000 N/ACultivation 30,000 $ 10,000 Production 10,000 3,300 Laboratory 15,000 5,000 Retail Stores 20,000 6,600 Distribution 15,000 5,000
MEDICAL LICENSE FEES INITIAL ANNUAL RENEWAL
Application $ 5,000 N/ACultivation 3,000 $ 1,000 Production 3,000 1,000 Laboratory 5,000 3,000 Dispensary 30,000 5,000
TIME AND EFFORT FEES $111 per hour
AGENT CARD APPLICATION INITIAL ANNUAL RENEWAL $ 75 $ 75
TOTAL COLLECTIONS
CIVIL PENALTIES Variable depending on severity and number of violations.
$-
$10
$20
$30
$40
$50
2013-14 2014-15 2015-16 2016-17 2017-18 2018-19
MILLIONS
FISCAL YEAR
64

Marijuana Fee Revenue (continued)
CURRENT DISTRIBUTION OF REVENUE
ORIGINALLY ENACTED 2013
AMENDMENTS 2016
2019
Assembly Bill 533 transfers the authority to collect and distribute marijuana establishment license fees from the Department to the Cannabis Compliance Board as of July 1, 2020.
Assembly Bill 533 replaces NRS 453A and NRS 453D with NRS 60. This bill creates the Cannabis Advisory Commission and entitles each member of the Commission to a salary of not more than $80 for each day or portion thereof during which the member is in attendance at a regularly called meeting of the Commission. AB 533 also creates the Cannabis Compliance Board. The Chair of the Board is entitled to receive an annual Salary of $27,500 and each of the other Board member are entitled to receive an annual salary of $20,000. The cannabis establishment agent registration card expiration period is extended from 1 to 2 years, and fees are increased from $75.00 to $150.00 for both initial issuance and renewal, effective July 1, 2020.
Adult-use marijuana fees and distribution added to NRS by 2016 initiativepetition, Ballot Question No. 2.
Fees and penalties are first expended to pay the costs of the Department in carrying out the provisions of chapters 453A and 453D of NRS. Adult-use marijuana application and license fees also contribute to the annual $5 million distribution to local governments for their costs in carrying out those provisions. Any remaining money goes to the State Distributive School Account in the State General Fund.
Medical marijuana fees and revenue distribution established in the 2013 Session of the State Legislature.
HISTORY
65

TRANSPORTATION CONNECTION TAX REVENUE
FISCAL YEAR HIGHWAY FUND GENERAL FUND TOTAL COLLECTIONS% CHANGE FROM
PRIOR YEAR2015-16 5,000,000$ 11,898,532$ 16,898,532$ Not Applicable2016-17 - 23,101,058 23,101,058 36.70%2017-18 5,000,000 21,773,229 26,773,229 15.90%2018-19 - 30,216,771 30,216,771 12.86%
LEGAL CITATION Chapter 706A and Chapter 372B, Nevada Revised Statutes.
IMPOSITION AND RATE
ORIGINALLY ENACTED 2015
The Transportation Connection Tax law imposes an excise tax on the transportation of a passenger by a transportation network company, common motor carrier of passengers or taxicab at the rate of 3 percent of the total fare charged for the transportation.
CURRENT DISTRIBUTION OF REVENUE The first $5 million every biennium is distributed to the Highway Fund. The remaining distributions are to the General Fund.
HISTORY
Assembly Bill 175 was enacted by the 2015 Session of the State Legislature.Sections 2 to 50 inclusive; sections 53 to 57 inclusive; and section 58 of thisact are effective May 29, 2015. Sections 51 and 52 of this act are effectiveAugust 27, 2015. Section 1 of this act is effective October 1, 2015.
$-
$5
$10
$15
$20
$25
$30
$35
2013-14 2014-15 2015-16 2016-17 2017-18 2018-19
MILLIONS
FISCAL YEAR
66

COMMERCE TAX REVENUE
FISCAL YEAR% CHANGE FROM
PRIOR YEAR2015-16 143,507,593$ Not Applicable2016-17 197,827,208 37.85%2017-18 201,926,513 2.07%2018-19 226,770,333 12.30%
LEGAL CITATION Chapter 363C Nevada Revised Statutes.
IMPOSITION AND RATE
ORIGINALLY ENACTED
ADMENDMENTS 2019
TOTAL COLLECTIONS
The Commerce tax is imposed on each business entity engaged in business in this State whose Nevada gross revenue in a fiscal year exceeds $4,000,000 at a rate that is based on the industry in which the business entity is primarily engaged.
CURRENT DISTRIBUTION OF REVENUE State General Fund
HISTORY
2015 Session of State Legislature, effective July 1, 2015
SB 497 of the 2019 Session of State Legislature removed the filing requirement for business entities with a Nevada gross revenue of $4,000,000 or less during the tax year, effective June 3, 2019.
CREDIT AGAINST MODIFIED BUSINESS TAX Per NRS 363B.110 and 363A.130, employers who pay Commerce Tax in a fiscal year are entitled to take a credit against their Modified Business Tax in the following fiscal year of 50 percent of the Commerce Tax paid. The credit may only be used during the four calendar quarters immediately following the end of the taxable year for which the Commerce Tax was paid. Unused credits may not be carried forward beyond the fourth calendar quarter immediately following the end of the taxable year for which the commerce tax was paid, and employers are not entitled to a refund of any unused credit.
$-
$40
$80
$120
$160
$200
$240
2013-14 2014-15 2015-16 2016-17 2017-18 2018-19
MILLIONS
FISCAL YEAR
67

Locally Assessed Properties Section
The Locally Assessed Properties Section oversees and monitors the quality of assessmentsperformed by county assessors. Staff appraisers conduct appraisal ratio studies to determine the ratioof the assessed value of property to the taxable value of the property in each county of the Stateevery third year (NRS 361.333). In addition to reporting on the assessment level and uniformity withineach county, the Locally Assessed Properties Section conducts performance audits and reviewsassessment policies, procedures and methods used within each county to ensure proper methodsand procedures are developed and maintained. The staff analyzes and publishes various studies andreports which include but is not limited to the improvement factors to be applied to non-reappraisedproperties, the level of exemption for personal property tax bills, as well as any special studiesrequested by the Nevada Tax Commission.
Centrally Assessed Properties is also responsible for the administration of the Net Proceeds ofMinerals Tax under the authority granted in NRS 362.100(1)(a). Every person extracting any mineralis required to file a statement showing the gross yield, royalties paid and claimed net proceeds fromeach geographically separate operation where a mineral is extracted. The Centrally AssessedProperties Section reviews the reported information and computes taxes due. There areapproximately 103 net proceeds operators currently reporting to Taxation as well as 388 royaltyreporters.
The Department of Taxation also collects and distributes the Net Proceeds of Minerals Tax and theproperty tax from interstate or inter-county properties to the counties.
Local Government Finance Section
The Local Government Finance Section provides oversight of the financial administration ofapproximately 265 Nevada local governments. Statutory authority for this function is found in NRSChapters 350 - Municipal Obligations, and 354 - Local Financial Administration. The local governmentfinance staff reviews and approves the budgets of all local governments within the state and monitorsbudgetary and financial information throughout the fiscal year. In addition to these duties, the sectionprovides ad valorem (property) tax revenue rate regulation, provides oversight of local governmentdebt management and evaluates financing proposals submitted by local governments.
When the Nevada Tax Commission (NTC) declares a local entity in severe financial difficulty, theLocal Government Finance Section also provides management oversight and, in extreme cases,provides financial administration.
LOCAL GOVERNMENT SERVICES DIVISIONThe Local Government Services Division (LGS) is responsible for administering and overseeing variousproperty tax and real property transfer tax programs as well as providing oversight to the financialadministration of local governments. LGS consists of five (5) sections as follows, as well as a Billings andPublications section that is not discussed.
Centrally Assessed Properties Section
Under the authority of NRS 361.320, the Centrally Assessed Properties Section is responsible for thevaluation, assessment, collection and distribution of ad valorem ("according to value") taxes related toproperty of an interstate or inter-county nature. Approximately 298 interstate or inter-county propertiesowned by airlines, railroads, telecommunications, electric power, gas pipeline, private carlines andwater companies are valued by the Centrally Assessed Properties Section.
In addition, the real and personal property associated with mines is valued by the Centrally AssessedProperties Section pursuant to NRS 362.100(1)(b). Approximately 180 secured and unsecured miningproperty valuations are then transmitted to county assessors for property tax assessment andcollection.
68

The Mining Oversight and Accountability Commission (MOAC) The staff arranges meetings forthe Commission to review compliance issues of various state agencies with regard to the miningindustry and prepares reports regarding the net proceeds of minerals tax. The MOAC was created bySenate Bill 493 of the 2011 Session of the Nevada Legislature.
Audit Section
Pursuant to NRS 362.200, the Audit Section conducts financial audits of taxpayers reporting net proceeds of minerals. In addition, audits of the records of county recorders and county treasurers may be conducted to ensure the real property transfer tax is collected fairly and equitably with all claims for exemption in compliance with NRS 375.090. The audit consists of on-site inspections, individual interviews with the recorder and treasurer of the subject county, and review of deeds, declarations of value, and other corporate, estate planning, and title documents, to determine whether the transfer of real property was a taxable event.
The Nevada Tax Commission (NTC) The staff prepares a variety of publications regarding propertytax assessment which must be approved by the Commission. In addition, staff maintains case filesfrom appeals of abatement determinations by County Assessors and prepares case files and makesrecommendations for appeals of decisions of penalty and interest waivers by County Treasurers andAssessors. Staff also drafts regulations for approval of the Nevada Tax Commission clarifyingstatutes in NRS Chapters 360, 361, 361A, 362 and 375.
The State Board of Equalization (SBE) hears and determines all appeals from action of countyboards of equalization. The SBE also hears and determines direct appeals from valuations of theNevada Tax Commission. The staff prepares all hearing notices, case files and decision letters.
The Section designs, plans, and conducts performance audits of county officials with regard to theadministration of the property tax. Those audits include a variety of topics such as the methodologyused to establish value for taxable property, the application of exemptions and abatements, and thecollection and distribution of the property tax.
Boards and Commissions
The Appraiser Certification Board (ACB) is an appointed board established to advise theDepartment of Taxation on matters pertaining to certification and continuing education of allappraisers certified for tax purposes. The staff tracks and maintains a database of all CountyAppraisers' continuing education credits.
The Committee on Local Government Finance (CLGF) is an eleven member appointed boardauthorized by NRS 354 to advise the Department of Taxation on matters affecting local governmentsand their finances. The staff prepares and delivers reports on the financial condition of localgovernments, and drafts regulations on local government finance topics for adoption by CLGF.
In addition, under the authority of NRS 375, the Audit Section provides oversight, compliance, andaudit services to the offices of county recorders. The Section monitors appeals of the real propertytransfer tax in local jurisdictions and reviews district attorney opinions for congruity and compliancewith NRS 375 and NAC 375. In addition, the section discovers, researches, and distributesinformation to the county recorders with regard to applying exemptions and requirements forsupporting documentation, monitors all remittances submitted pursuant to NRS 375.023 and NRS375.070, and reconciles the remittances to county recorder reports.
This section establishes, for assessment purposes, the valuation of: agricultural land (NRS361a.140); mobile homes (NRS 361.325); and personal property (NRS 361.227). The Departmentprovides guidance in the implementation of the property tax abatement program adopted by theNevada State Legislature in 2005.
In addition, this section assists county assessors in valuing property upon request or upon thedirection of the NTC (NRS 360.215 (8)). If the NTC finds property in a county to be assessed outsidethe guidelines of the ratio studies, it may call upon the section to implement a reappraisal program(NRS 361.333 (5c)). This section also provides training to Assessors through classes and webinars.
69

CERTIFICATION OF PROPERTY TAX APPRAISERS
NUMBER OF CERTIFIED APPRAISERS - JUNE 2019
REAL ANDREAL PERSONAL PERSONAL TEMPORARY
JURISDICTIONS PROPERTY PROPERTY PROPERTY CERTIFICATIONS
Department of Taxation 2 3 17 2Carson City 1 1 4Churchill 1 1 3 1Clark 49Douglas 5 2Elko 2 1 6Esmeralda 1 1Eureka 2 1 1Humboldt 2 1 1Lander 1 3Lincoln 3Lyon 2 2 3Mineral 1 1Nye 2 2 2Pershing 1 1 1Storey 1 1 2Washoe 2 22 3White Pine 4Independent Contractors 2
TOTAL 17 18 128 10
All persons who are employees of or independent contractors for the State or any of its politicalsubdivisions and who perform the duties of an appraiser for tax purposes must hold a valid appraisercertificate issued by the Department of Taxation.
The Department issues an appraiser certificate to any person who has successfully passed theappropriate certification exam. Persons holding a professional designation may be able to waivetaking certain portions of the exam.
Each person who holds an appraiser certificate must complete 36 contact hours of appropriate trainingin each succeeding fiscal year following certification. The 36 hour training requirement is waived forpersons who either have accumulated 180 contact hours or hold a professional designation. Thesepersons must complete 36 contact hours during every three year period thereafter.
Newly employed appraisers are issued a temporary certificate which expires two years following theemployee's date of hire or upon successful completion of the appraiser certification exam, whicheveroccurs first. The temporary certificate is not renewable.
70

No
Cha
nges
CO
UN
TYTO
TAL
Tax
paye
r Pe
titio
n G
rant
ed
Tax
paye
r Pe
titio
n D
enie
d
Ass
esso
r Pe
titio
n G
rant
ed
Ass
esso
r Pe
titio
n D
enie
d
Eq
ualiz
atio
n O
rder
Hea
rd N
o Ju
risdi
ctio
n N
ot H
eard
W
ithdr
awn
Con
tin-
uanc
es
Dec
isio
ns b
y St
ate
Boa
rd o
f Eq
ualiz
atio
n N
et In
crea
se
Net
D
ecre
ase
CC
4
-
2
-
-
-
1
1
-
-
-
-
CH
-
-
-
-
-
-
-
-
-
-
-
-
C
L37
1
26
6
1
-
1
1
1
-
1,
545,
429
7,70
0
D
O-
-
-
-
-
-
-
-
-
-
-
-
-
-
-
-
-
-
-
-
-
-
-
-
ES-
-
-
-
-
-
-
-
-
-
-
-
EU-
-
-
-
-
-
-
-
-
-
-
-
HU
-
-
-
-
-
-
-
-
-
-
-
-
LA
-
-
-
-
-
-
-
-
-
-
-
-
LI
-
-
-
-
-
-
-
-
-
-
-
-
LY
-
-
-
-
-
-
-
-
-
-
-
-
M
I-
-
-
-
-
-
-
-
-
-
-
-
NY
-
-
-
-
-
-
-
-
-
-
-
-
PE
-
-
-
-
-
-
-
-
-
-
-
-
ST
-
-
-
-
-
-
-
-
-
-
-
-
W
A13
1
12
-
-
-
-
-
-
-
-
19
6,85
1
WP
-
-
-
-
-
-
-
-
-
-
-
-
TO
TALS
54
2
40
6
1
-
2
2
1
-
1,54
5,42
9
-
Cen
tral
ly A
sses
sed
2
2
-
-
-
-
-
-
-
-
144,
002
4,
352,
071
U
nita
ryC
ases
con
tinue
d 1
-
-
-
-
-
-
-
1
-
-
-
fr
om p
rior y
ears
GR
AND
TO
TAL
57
4
40
6
1
-
2
2
2
-
1,68
9,43
1
4,
352,
071
NET
IMPA
CT
OF
ALL
DEC
ISIO
NS
(2
,662
,640
)
* N
ote:
The
prin
cipa
l diff
eren
ce b
etw
een
Sec
ured
and
Uns
ecur
ed ta
x ro
lls is
rela
ted
to th
e le
vy o
f the
tax.
P
ursu
ant t
o N
RS
361
.450
, eve
ry ta
x le
vied
is a
per
petu
al li
en a
gain
st th
e pr
oper
ty a
sses
sed
until
the
tax
and
any
pena
lty c
harg
es a
nd in
tere
st w
hich
may
acc
rue
are
paid
. The
lien
atta
ches
on
Jul
y 1
each
yea
r, up
on a
ll [re
al] p
rope
rty w
ithin
the
coun
ty.
STAT
E B
OAR
D O
F EQ
UAL
IZAT
ION
2018
-19
SUM
MAR
Y O
F TR
ANSA
CTI
ON
S* -
SEC
UR
ED P
RO
PER
TY V
ALU
ATIO
NS
The
Sta
teB
oard
ofE
qual
izat
ion
hear
san
dde
term
ines
appe
als
from
actio
nof
coun
tybo
ards
ofeq
ualiz
atio
n.Th
eS
tate
Boa
rdal
sohe
ars
and
dete
rmin
esdi
rect
appe
als
from
valu
atio
nsof
the
Nev
ada
Tax
Com
mis
sion
,ag
ricul
tura
lco
nver
sion
,ex
empt
ions
and
othe
rty
pes
ofap
peal
s.Lo
cal
Gov
ernm
ent
Ser
vice
sis
resp
onsi
ble
for
coor
dina
ting
mee
tings
ofth
eS
tate
Boa
rdof
Equ
aliz
atio
n.O
ther
resp
onsi
bilit
ies
ofth
eS
tate
Boa
rdof
Equ
aliz
atio
nin
clud
eeq
ualiz
ing
prop
erty
valu
atio
nsin
the
Sta
te,b
yre
view
ing
the
tax
rolls
ofth
eva
rious
coun
ties
aseq
ualiz
edby
the
coun
tybo
ards
of e
qual
izat
ion.
If n
eces
sary
, the
Sta
te B
oard
adj
usts
the
valu
atio
ns th
ereo
n in
ord
er to
equ
aliz
e pr
oper
ty ta
x va
lues
.
SEC
UR
ED 2
018-
19C
hang
es
71

CO
UN
TYTO
TAL
Hea
rd N
o Ju
risdi
ctio
n N
ot H
eard
W
ithdr
awn
Con
tin-
uanc
es
Tax
paye
r Pe
titio
n D
enie
d
Ass
esso
r Pe
titio
n D
enie
d
Tax
paye
r Pe
titio
n G
rant
ed
Ass
esso
r Pe
titio
n G
rant
ed
Equ
aliz
atio
n O
rder
N
et
Incr
ease
N
et
Dec
reas
e
CC
-
-
--
-
-
-
-
-
CH
-
-
--
-
-
-
-
-
- C
L11
-2
-
5
-
4-
-
2,
114,
437
DO
-
-
--
-
-
-
-
-
- EL
3
-3
-
-
-
-
-
-
-
ES-
--
-
-
-
-
-
-
-
EU-
--
-
-
-
-
-
-
-
HU
-
-
--
-
-
-
-
-
- LA
-
-
--
-
-
-
-
-
- LI
-
-
--
-
-
-
-
-
- LY
-
-
--
-
-
-
-
-
- M
I-
--
-
-
-
-
-
-
- N
Y1
-
1 -
-
-
-
-
-
- PE
-
-
--
-
-
-
-
-
- ST
-
-
--
-
-
-
- -
-
WA
2
-1
-
-
-
1-
-
4,
037
WP
1
1 -
-
-
-
-
-
-
-
TOTA
LS18
1 7
-
5
-
5
- -
2 ,11
8,47
4
Cen
tral
ly A
sses
sed
-
-
--
-
-
-
-
-
-
Uni
tary
-
-
--
-
-
-
-
-
- D
ept -
Min
es6
-
2 -
-
-
4
-
-
3,72
5,40
1
N
et P
roce
eds
of M
ines
11
-
--
-
-
11
-
58
,453
,712
7,
555,
467
Cas
es c
ontin
ued
from
pr
ior y
ears
-
-
--
-
-
-
-
-
-
GR
AND
TO
TAL
35
1
9 -
5 -
20 -
58,4
53,7
12
13,3
99,3
42
NET
IMPA
CT
OF
ALL
DEC
ISIO
NS
45
,054
,370
*N
ote:
The
prin
cipa
l diff
eren
ce b
etw
een
Sec
ured
and
Uns
ecur
ed ta
x ro
lls is
rela
ted
to th
e le
vy o
f the
tax.
Pur
suan
t to
NR
S 3
61.4
50, e
very
tax
levi
ed is
a p
erpe
tual
lien
aga
inst
the
prop
erty
ass
esse
d un
til th
e ta
x an
d an
y pe
nalty
cha
rges
and
inte
rest
whi
ch m
ay a
ccru
e ar
e pa
id. T
he li
en a
ttach
es o
n Ju
ly 1
eac
h ye
ar, u
pon
all [
real
] pro
perty
with
in th
e co
unty
.
STA
TE B
OAR
D O
F EQ
UAL
IZAT
ION
20
18-1
9 SU
MM
ARY
OF
TRAN
SAC
TIO
NS*
- U
NSE
CU
RED
PR
OPE
RTY
VAL
UAT
ION
S
No
Cha
nges
Cha
nges
72

ASSESSED VALUATIONS
FISCAL YEAR VALUATION % CHANGE FROM
PRIOR YEAR FISCAL YEAR VALUATION
% CHANGE FROM PRIOR
YEAR2013-14* 86,322,839,939$ 0.7% 2016-17 110,541,490,277$ 7.9%2014-15 94,342,292,351 9.3% 2017-18* 118,460,961,920 7.2%2015-16* 102,484,903,369 8.6% 2018-19 125,888,252,779 6.3%
Assessed values shown are net of exemptions.*Numbers vary from last annual report due to corrections made after reporting time frame.
RATIO STUDY
TOTAL NET ASSESSED VALUATION STATEWIDE
Under NRS 361.333, the Nevada Tax Commission is obligated to equalize property under its jurisdiction. Equalization isthe process by which the Commission ensures "that all property subject to taxation within the county has been assessedas required by law." There are two types of information which the Commission considers to determine whether propertyhas been assessed equitably. The first type of information comes from a ratio study, which is a statistical analysisdesigned to study the level and uniformity of the assessments. The second type of information comes from a performanceaudit which is designed to fulfill the requirements of NRS 361.333(1)(b)(2). The performance audit examines the workpractices of the assessor to determine whether all property is being assessed in a correct and timely manner.
In addition, the State Board of Equalization is required to equalize property valuations in the state pursuant to NRS361.395. The State Board also uses the information on county tax rolls and the Department's ratio study to determine ifinter-county equalization is necessary (see page 63 for information regarding the amount of valuation increases ordecreases as a result of equalization orders).
$-
$20
$40
$60
$80
$100
$120
$140
$160
$180
2004-05 2005-06 2006-07 2007-08 2008-09 2008-09
BIL
LIO
NS
$-
$30
$60
$90
$120
$150
2013-14 2014-15 2015-16 2016-17 2017-18 2018-19
BILLIONS
FISCAL YEAR
73
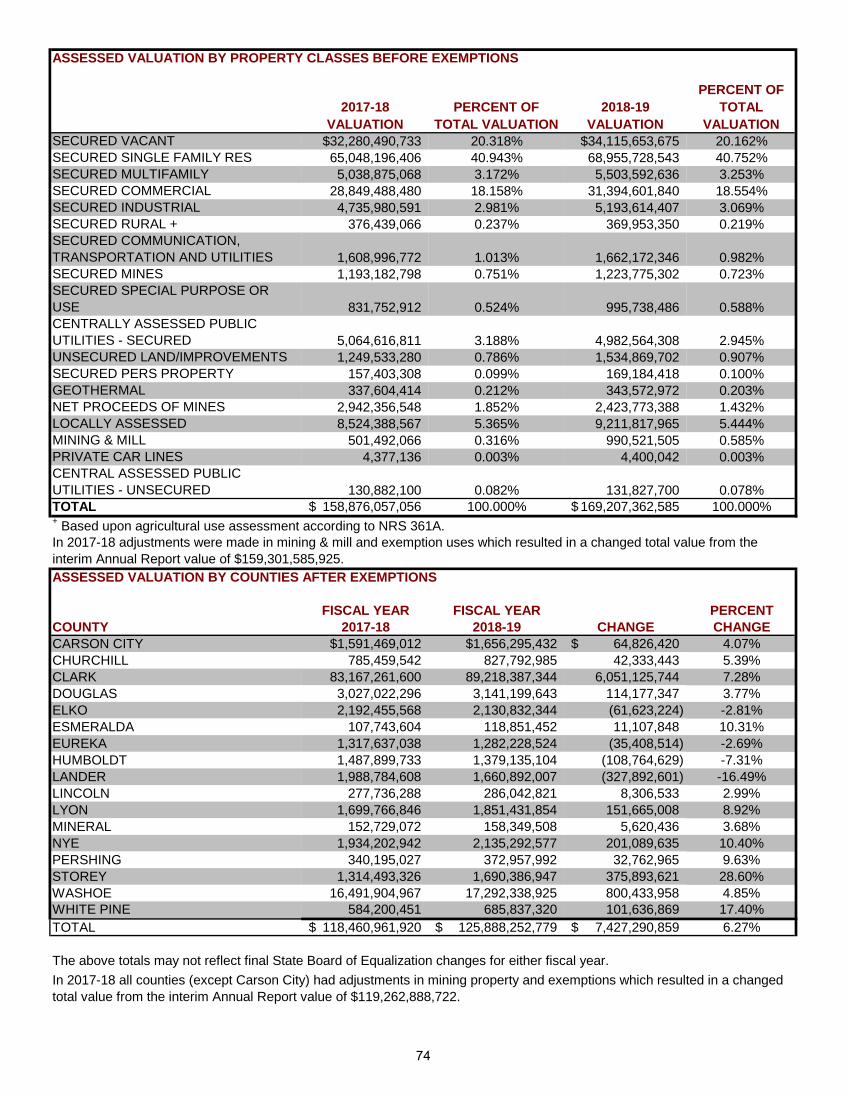
ASSESSED VALUATION BY PROPERTY CLASSES BEFORE EXEMPTIONS
2017-18 VALUATION
PERCENT OF TOTAL VALUATION
2018-19 VALUATION
PERCENT OF TOTAL
VALUATIONSECURED VACANT $32,280,490,733 20.318% $34,115,653,675 20.162%SECURED SINGLE FAMILY RES 65,048,196,406 40.943% 68,955,728,543 40.752%SECURED MULTIFAMILY 5,038,875,068 3.172% 5,503,592,636 3.253%SECURED COMMERCIAL 28,849,488,480 18.158% 31,394,601,840 18.554%SECURED INDUSTRIAL 4,735,980,591 2.981% 5,193,614,407 3.069%SECURED RURAL + 376,439,066 0.237% 369,953,350 0.219%SECURED COMMUNICATION, TRANSPORTATION AND UTILITIES 1,608,996,772 1.013% 1,662,172,346 0.982%SECURED MINES 1,193,182,798 0.751% 1,223,775,302 0.723%SECURED SPECIAL PURPOSE OR USE 831,752,912 0.524% 995,738,486 0.588%CENTRALLY ASSESSED PUBLIC UTILITIES - SECURED 5,064,616,811 3.188% 4,982,564,308 2.945%UNSECURED LAND/IMPROVEMENTS 1,249,533,280 0.786% 1,534,869,702 0.907%SECURED PERS PROPERTY 157,403,308 0.099% 169,184,418 0.100%GEOTHERMAL 337,604,414 0.212% 343,572,972 0.203%NET PROCEEDS OF MINES 2,942,356,548 1.852% 2,423,773,388 1.432%LOCALLY ASSESSED 8,524,388,567 5.365% 9,211,817,965 5.444%MINING & MILL 501,492,066 0.316% 990,521,505 0.585%PRIVATE CAR LINES 4,377,136 0.003% 4,400,042 0.003%CENTRAL ASSESSED PUBLIC UTILITIES - UNSECURED 130,882,100 0.082% 131,827,700 0.078%TOTAL 158,876,057,056$ 100.000% 169,207,362,585$ 100.000%+ Based upon agricultural use assessment according to NRS 361A.
ASSESSED VALUATION BY COUNTIES AFTER EXEMPTIONS
FISCAL YEAR FISCAL YEAR PERCENTCOUNTY 2017-18 2018-19 CHANGE CHANGECARSON CITY $1,591,469,012 $1,656,295,432 64,826,420$ 4.07%CHURCHILL 785,459,542 827,792,985 42,333,443 5.39%CLARK 83,167,261,600 89,218,387,344 6,051,125,744 7.28%DOUGLAS 3,027,022,296 3,141,199,643 114,177,347 3.77%ELKO 2,192,455,568 2,130,832,344 (61,623,224) -2.81%ESMERALDA 107,743,604 118,851,452 11,107,848 10.31%EUREKA 1,317,637,038 1,282,228,524 (35,408,514) -2.69%HUMBOLDT 1,487,899,733 1,379,135,104 (108,764,629) -7.31%LANDER 1,988,784,608 1,660,892,007 (327,892,601) -16.49%LINCOLN 277,736,288 286,042,821 8,306,533 2.99%LYON 1,699,766,846 1,851,431,854 151,665,008 8.92%MINERAL 152,729,072 158,349,508 5,620,436 3.68%NYE 1,934,202,942 2,135,292,577 201,089,635 10.40%PERSHING 340,195,027 372,957,992 32,762,965 9.63%STOREY 1,314,493,326 1,690,386,947 375,893,621 28.60%WASHOE 16,491,904,967 17,292,338,925 800,433,958 4.85%WHITE PINE 584,200,451 685,837,320 101,636,869 17.40%TOTAL 118,460,961,920$ 125,888,252,779$ 7,427,290,859$ 6.27%
The above totals may not reflect final State Board of Equalization changes for either fiscal year.In 2017-18 all counties (except Carson City) had adjustments in mining property and exemptions which resulted in a changed total value from the interim Annual Report value of $119,262,888,722.
In 2017-18 adjustments were made in mining & mill and exemption uses which resulted in a changed total value from the interim Annual Report value of $159,301,585,925.
74

REAL PROPERTY TRANSFER TAX
LEGAL CITATION
IMPOSITION AND RATE
CURRENT DISTRIBUTION OF REVENUE
ORIGINALLY ENACTED
REVISED TO INCLUDE STATE GENERAL FUND
2003 Special Session of State Legislature, effective October 1, 2003.
Chapter 375.023 - 375.026 Nevada Revised Statutes.
$1.95 on each $500 of value, or fraction thereof, on transfer of real property; except in Churchill and Washoe counties which impose $2.05 and Clark county which imposes $2.55, on each $500 of value, or fraction thereof.
$1.30 to the State General Fund, $0.55 to Consolidated Tax, and $0.10 to the Account for Low Income Housing. In addition to this, Churchill and Washoe counties distribute an additional $0.10 for the Local Government Tax Act and Clark county distributes an additional $.60 for the School District.
HISTORY
Added to NRS in 1967.
Carson City1.20%
Churchill0.44%
Clark75.14%
Douglas2.43%
Elko0.95%
Esmeralda0.02%
Eureka0.02%
Humboldt0.27%
Lander0.06%
Lincoln0.05%
Lyon1.78%
Mineral0.02% Nye
1.09%
Pershing0.07% Storey
0.30%
Washoe16.03%
White Pine0.13%
Percentage Collection of Transfer Tax by County FY 19, General Fund Only
75

Real Property Transfer Tax General Fund Revenue
FISCAL YEARTOTAL
COLLECTIONS2012-13 54,989,831$ 13.68%2013-14 60,046,652 9.20%2014-15 64,214,342 6.94%2015-16 72,937,591 13.58%2016-17 83,908,935 15.04%2017-18 103,385,321 23.21%2018-19 101,048,761 -2.26%
July - Sept 18 Oct - Dec 18 Jan - Mar 19 April - June 191st Quarter 2nd Quarter 3rd Quarter 4th Quarter
General Fund General Fund General Fund General Fund
Carson City 350,941.73$ 284,451.45$ 241,362.69$ 338,708.29$ Churchill 128,310.04 106,854.48 83,728.39 122,171.03 Clark 20,232,215.40 18,691,694.65 15,558,240.57 21,448,127.60 Douglas 801,782.99 601,686.66 443,950.65 611,376.78 Elko 231,582.78 188,481.68 175,479.86 364,495.04 Esmeralda 2,365.52 370.66 916.36 13,633.20 Eureka 3,030.90 7,823.68 3,823.68 6,555.99 Humboldt 71,693.63 78,860.95 53,684.64 71,549.49 Lander 12,021.88 12,929.20 9,074.65 24,828.78 Lincoln 16,223.94 10,339.77 8,730.16 18,284.00 Lyon 409,851.47 472,395.84 338,663.62 574,030.16 Mineral 5,864.00 4,774.32 5,972.95 7,869.21 Nye 243,457.50 301,388.04 213,829.69 341,326.05 Pershing 14,854.55 16,229.06 16,576.56 18,911.18 Storey 52,477.41 52,986.93 27,075.90 168,609.83 Washoe 4,469,077.78 3,602,624.04 3,131,089.37 4,994,368.89 White Pine 28,902.17 19,202.05 41,527.65 42,441.42 TOTAL FOR QUARTER 27,074,654$ 24,453,093$ 20,353,727$ 29,167,287$
CUMULATIVE BY QUARTER 27,074,654$ 51,527,747$ 71,881,475$ 101,048,761$
REVENUE GENERATED BY REAL PROPERTY TRANSFER TAX
% CHANGE FROM PRIOR YEAR
General Fund Collected for Each QuarterFISCAL YEAR 18-19
$-
$30
$60
$90
$120
2012-13 2013-14 2014-15 2015-16 2016-17 2017-18 2018-19
MILLIONS
FISCAL YEAR
76

NET PROCEEDS OF MINERALS
Percent of Percent of Percent of Percent of Total Gross Total Gross Total Gross Total GrossProceeds Proceeds Proceeds Proceeds
Mineral Type 2015-16 2016-17 2017-18 2018-19
Gold/Silver 90.30% 91.39% 91.22% 90.27%Copper 5.00% 4.52% 4.62% 4.91%
Geothermal 0.94% 1.29% 1.08% 1.19%Oil 0.18% 0.14% 0.15% 0.21%
Gypsum 0.53% 0.49% 0.49% 0.34%* Other 3.05% 2.17% 2.44% 3.08%
100.00% 100.00% 100.00% 100.00%
Percent of Total Gross Proceeds by Mineral Type
The Nevada Department of Taxation determines the tax on the net proceeds of minerals pursuant to NRS Chapter362. Producers annually report the gross yield of each separate extractive operation as well as expenses relatedto the extraction, processing, transportation, and marketing of the mineral. Royalty recipients report only theamount of royalties received. The Department calculates the net proceeds by deducting allowable expenses fromthe gross yield. The tax rate on the net proceeds of each operation depends on the ratio of the net proceeds to the gross proceeds as provided in NRS 362.140. The maximum tax rate is five percent, applied to net proceeds in excess of $4,000,000 annually and to all royalties. Taxpayers are required to estimate current year taxes. The Department certifies and bills the net proceeds tax due each year on April 20th, with final payment due by May 10th.
* Other includes: Building Stone, Clay, Copper, Dolomite, Feldspar, Gemstones, Salt, and other miscellaneous minerals.
Gold/Silver90.27%
Copper4.91%
Geothermal1.19%
Oil0.21%
Gypsum0.34%
* Other3.08%
Percent of Gross Proceeds 2018-2019
77

FISCAL YEAR
ACTUAL ASSESSED
VALUATION*
% CHANGE FROM PRIOR
YEAR FISCAL YEAR
ACTUAL ASSESSED
VALUATION*
% CHANGE FROM PRIOR
YEAR 2013-14 3,431,989,291$ -33.06% 2016-17 2,759,094,689$ 34.51%2014-15 2,083,161,166 -39.30% 2017-18 3,102,177,308 12.43%2015-16 2,051,175,348 -1.54% 2018-19 2,552,569,932 -17.72%
* Based on actual calendar year reports to the Department.
COUNTY 2013-14 2014-15 2015-16 2016-17 2017-18 2018-19
Carson City -$ $ $ $ $ $Churchill 18,440,054 24,794,397 16,736,897 22,856,524 24,239,893 34,666,081Clark 6,117,336 9,022,773 11,854,088 19,194,584 11,152,239 10,243,607Douglas 5,600 0 0 0 0 0Elko 160,338,052 106,068,900 113,598,205 268,891,594 370,558,877 229,804,299Esmeralda 28,129,417 13,940,206 12,165,465 19,318,090 26,361,164 45,000,680Eureka 884,790,192 660,206,148 577,429,126 723,145,100 337,706,513 426,133,593Humboldt 475,362,596 387,007,813 390,911,096 530,588,705 435,706,803 370,284,868Lander 1,486,623,934 676,524,669 650,670,413 859,877,669 1,353,714,849 932,022,586Lincoln 253,721 224,246 148,201 2,408 2,131 1,637Lyon 4,003,748 3,332,672 4,645,134 5,038,179 3,022,115 1,774,499Mineral 74,676,703 8,149,792 9,124,214 10,322,533 4,699,713 8,687,121Nye 164,686,457 116,132,852 147,413,904 167,917,613 276,480,078 190,962,862Pershing 58,693,817 44,438,192 52,509,608 33,608,359 45,038,283 38,155,406Storey 1,417,403 7,412,265 3,871,536 985,302 927,293 786,730Washoe 4,742,762 5,093,789 3,707,380 4,512,090 2,589,726 1,581,237White Pine 63,707,500 20,812,452 56,390,081 92,835,940 209,977,631 262,464,725
TOTAL 3,431,989,291$ 2,083,161,166$ 2,051,175,348$ 2,759,094,689$ 3,102,177,308$ 2,552,569,932$
ACTUAL NET PROCEEDS OF MINERALS ASSESSED VALUATIONS
Adjustments for County and State Board of Equalization pending decisions, and pending or unresolved audits, are not reflected.
$500
$1,500
$2,500
$3,500
$4,500
2013-14 2014-15 2015-16 2016-17 2017-18 2018-19
Millions
FISCAL YEAR
78
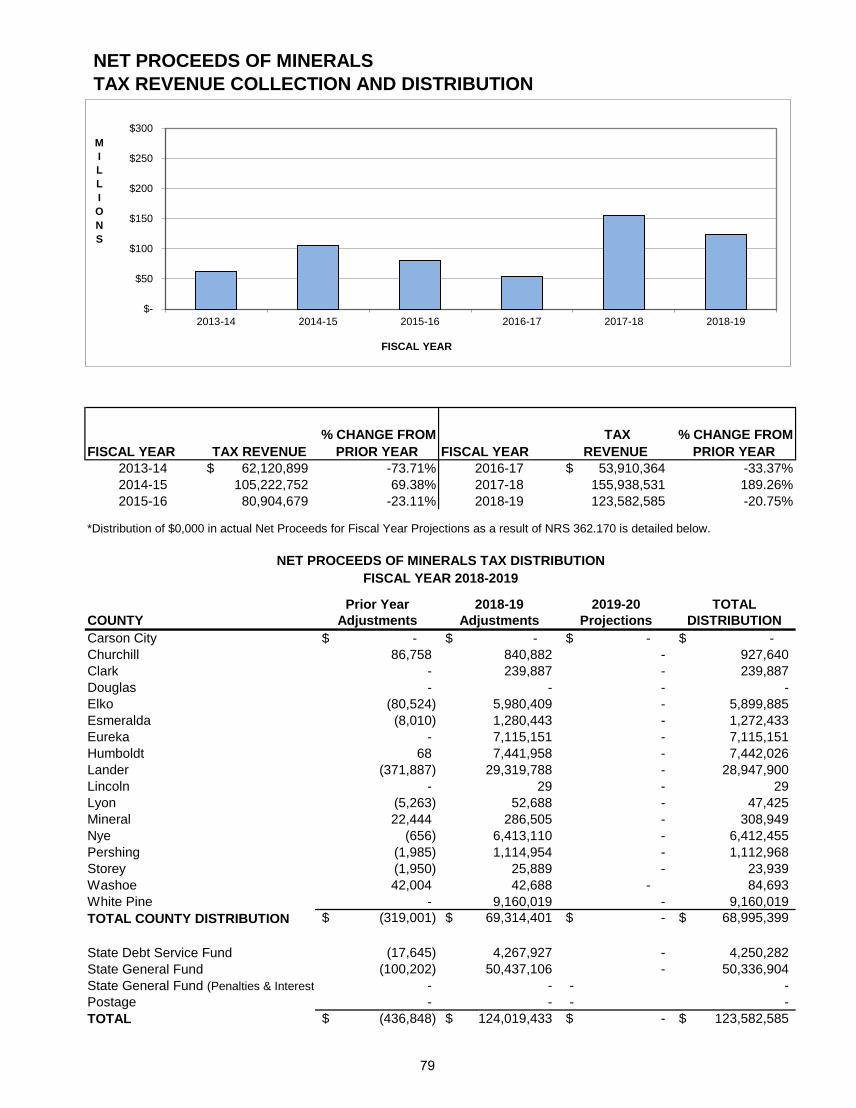
FISCAL YEAR TAX REVENUE % CHANGE FROM
PRIOR YEAR FISCAL YEAR TAX
REVENUE % CHANGE FROM
PRIOR YEAR 2013-14 62,120,899$ -73.71% 2016-17 53,910,364$ -33.37%2014-15 105,222,752 69.38% 2017-18 155,938,531 189.26%2015-16 80,904,679 -23.11% 2018-19 123,582,585 -20.75%
Prior Year 2018-19 2019-20 TOTALCOUNTY Adjustments Adjustments Projections DISTRIBUTIONCarson City -$ -$ -$ -$ Churchill 86,758 840,882 - 927,640 Clark - 239,887 - 239,887 Douglas - - - - Elko (80,524) 5,980,409 - 5,899,885 Esmeralda (8,010) 1,280,443 - 1,272,433 Eureka - 7,115,151 - 7,115,151 Humboldt 68 7,441,958 - 7,442,026 Lander (371,887) 29,319,788 - 28,947,900 Lincoln - 29 - 29 Lyon (5,263) 52,688 - 47,425 Mineral 22,444 286,505 - 308,949 Nye (656) 6,413,110 - 6,412,455 Pershing (1,985) 1,114,954 - 1,112,968 Storey (1,950) 25,889 - 23,939 Washoe 42,004 42,688 - 84,693 White Pine - 9,160,019 - 9,160,019 TOTAL COUNTY DISTRIBUTION (319,001)$ 69,314,401$ -$ 68,995,399$
State Debt Service Fund (17,645) 4,267,927 - 4,250,282 State General Fund (100,202) 50,437,106 - 50,336,904 State General Fund (Penalties & Interest - - - - Postage - - - - TOTAL (436,848)$ 124,019,433$ -$ 123,582,585$
FISCAL YEAR 2018-2019
NET PROCEEDS OF MINERALS TAX REVENUE COLLECTION AND DISTRIBUTION
*Distribution of $0,000 in actual Net Proceeds for Fiscal Year Projections as a result of NRS 362.170 is detailed below.
NET PROCEEDS OF MINERALS TAX DISTRIBUTION
$-
$50
$100
$150
$200
$250
$300
2013-14 2014-15 2015-16 2016-17 2017-18 2018-19
MILLIONS
FISCAL YEAR
79

FISCAL YEAR ASSESSED VALUATION
% CHANGE FROM PRIOR YEAR FISCAL YEAR
ASSESSED VALUATION
% CHANGE FROM PRIOR YEAR
2013-14 2,476,438,589$ 27.92% 2016-17 2,169,338,249$ -3.98%2014-15 2,248,729,206 -9.20% 2017-18 2,156,243,400 -0.60%2015-16 2,259,222,128 0.47% 2018-19 2,298,923,614 6.62%
NUMBER OF ASSESSED NUMBER OF ASSESSEDCOUNTY APPRAISALS VALUATION* APPRAISALS VALUATION*Carson City 0 -$ 0 -$ Churchill 14 126,706,439$ 14 130,186,567$ Clark 14 16,422,341$ 13 16,988,732$ Douglas 0 -$ 0 -$ Elko 33 198,988,158$ 32 196,195,796$ Esmeralda 11 17,573,410$ 10 13,106,331$ Eureka 21 637,195,763$ 23 610,173,617$ Humboldt 22 258,041,577$ 24 318,571,289$ Lander 20 452,239,180$ 22 458,476,749$ Lincoln 2 236,621$ 2 188,420$ Lyon 11 16,487,674$ 9 21,301,698$ Mineral 4 12,716,387$ 7 14,583,097$ Nye 32 170,070,074$ 28 190,059,898$ Pershing 14 92,222,861$ 12 110,242,938$ Storey 3 9,390,269$ 3 5,254,864$ Washoe 3 41,854,268$ 5 64,701,573$ White Pine 8 106,098,378$ 8 148,892,048$ TOTAL 212 2,156,243,401$ 212 2,298,923,614$
*May include adjustments for County and State Boards of Equalization through 2019.
MINING PROPERTIES - ASSESSED VALUATIONS
The secured, unsecured, and supplemental assessments form the values for the fiscal years above.
The Department of Taxation is required to appraise all mining improvements and personal property in accordance with NRS362.100(1b). The appraisals shown here are transmitted to the County Assessors who then apply adjustments, abatements,tax caps or land values.
FISCAL YEAR 2017-18 FISCAL YEAR 2018-19
$(200)
$300
$800
$1,300
$1,800
$2,300
$2,800
2013-14 2014-15 2015-16 2016-17 2017-18 2018-19
MILLIONS
FISCAL YEAR
80

ASSESSMENT YEAR VALUATION
% CHANGE FROM PRIOR YEAR
ASSESSMENT YEAR VALUATION
% CHANGE FROM PRIOR YEAR
2013-14 4,592,189,915$ 19.93% 2016-17 4,887,343,868$ -3.30%2014-15 4,950,451,427 7.80% 2017-18 4,835,462,047 -1.06%2015-16 5,054,343,597 2.10% 2018-19 4,774,119,250 -1.27%
COUNTYSECURED
UTILITIES & 6-Mo CWIP
PRIVATE CARLINES
UNSECURED 12-Mo CWIP and
PETTOTAL TAX
Carson City 1,092,910$ -$ 80,915$ $ 1,173,825 Churchill 2,124,268 6,501 127,925 $ 2,258,694 Clark 53,089,029 14,547 1,441,977 $ 54,545,554
Douglas 1,154,808 - 62,649 $ 1,217,457 Elko 10,036,979 29,425 144,325 $ 10,210,729 Esmeralda 893,738 - 26,603 $ 920,341 Eureka 652,924 3,582 19,047 $ 675,553 Humboldt 6,342,724 12,544 84,206 $ 6,439,474 Lander 1,790,602 5,429 66,385 $ 1,862,415 Lincoln 2,243,625 11,552 37,417 $ 2,292,594 Lyon 2,840,165 4,789 154,183 $ 2,999,136 Mineral 1,632,659 - 55,752 $ 1,688,411 Nye 2,838,622 - 171,503 $ 3,010,125 Pershing 2,277,645 10,496 86,925 $ 2,375,066 Storey 2,962,816 1,250 152,740 $ 3,116,806 Washoe 11,400,215 14,706 445,651 $ 11,860,572 White Pine 736,836 - 29,867 $ 766,703 Total County Distribution 104,110,565$ 114,820$ 3,188,070$ 107,413,455$
State Debt Service Fund 6,262,096 7,312 185,869 6,455,277 State General Fund - P&I 17,164 - - 17,164 Postage - - - - NV Dept of Energy Fund 507,768 - 3,149 510,916 TOTAL 110,897,593$ 122,131$ 3,377,088$ 114,396,812$
FISCAL YEAR 2018 - 2019
2018 - 2019 TAX YEARINTERSTATE AND INTERCOUNTY VALUATIONS
(ASSESSED VALUE)
CENTRALLY ASSESSED UNITARY AND CONSTRUCTION WORK IN PROGRESSTAX DISTRIBUTION
$0
$1,000
$2,000
$3,000
$4,000
$5,000
$6,000
2013-14 2014-15 2015-16 2016-17 2017-18 2018-19
MILLIONS
FISCAL YEAR
81

Tota
lU
nita
ry6
Mo.
CW
IPU
nita
ry6
Mo.
CW
IPU
nita
ry6
Mo.
CW
IPU
nita
ry6
Mo.
CW
IPU
nita
ry6
Mo.
CW
IPB
y C
ount
y
Car
son
City
258,
564
$
46
4$
16,5
71,2
20$
24
4,65
0$
22
,831
,056
$
44
8,83
5$
-$
-$
900,
637
$
47
8$
41
,255
,904
$
Chu
rchi
ll7,
268,
217
80
42
,968
,661
4,59
8,13
2
17,0
27,1
01
231,
438
20
,038
,624
2,
561
493,
673
-
92
,628
,487
Cla
rk26
1,02
3,19
4
51
7,75
9
1,88
1,27
8,47
0
24
,225
,918
316,
912,
217
3,87
4,90
4
47
,171
,107
6,
087
20,9
96,8
14
543,
260
2,
556,
549,
730
Dou
glas
1,07
1,66
3
1,
157
31,5
52,8
95
46
5,83
3
6,
711,
528
131,
942
-
-
9,
427,
841
-
49,3
62,8
59
Elk
o2,
216,
039
41,4
68
53
,225
,851
632,
996
222,
730,
895
192,
034
90
,462
,335
11
,490
17,8
71,0
29
23,0
33
38
7,40
7,17
0
Esm
eral
da21
,108
,658
16
,322
13,1
10,7
72
37
5,21
7
-
-
-
-
14
9,31
8
-
34,7
60,2
87
Eur
eka
4,00
1,48
0
6,
467
24,3
84,3
66
23
5,74
2
3,
444,
481
28,9
34
17
,458
,468
2,
213
446,
774
-
50
,008
,925
Hum
bold
t4,
420,
916
77,9
73
63
,603
,397
501,
971
182,
160,
336
219,
053
49
,163
,629
6,
240
2,82
8,29
5
16
,419
302,
998,
228
Land
er5,
661,
629
66,6
40
46
,077
,098
443,
677
2,01
2,78
4
39
,569
14,0
90,7
40
1,78
8
43
5,82
2
-
68,8
29,7
45
Linc
oln
7,71
5,11
2
13
4,40
6
58,0
11,3
03
21
3,07
0
22
,222
,119
18
,818
34,2
92,9
49
4,42
5
3,
289,
447
24,9
24
12
5,92
6,57
3
Lyon
5,86
3,03
0
12
,964
58,1
84,7
07
1,
179,
482
20
,141
,304
34
6,90
8
13,4
08,0
60
1,72
4
2,
038,
982
-
101,
177,
161
Min
eral
10,5
97,1
88
29,4
15
58
,425
,430
304,
241
775,
653
15
,249
-
-
18,0
13
-
70,1
65,1
89
Nye
47,3
61,8
30
212,
106
76
,996
,211
2,51
2,36
9
787,
290
15
,477
-
-
1,04
2,73
0
52
6
12
8,92
8,53
9
Per
shin
g3,
040,
496
47,4
94
40
,577
,969
464,
923
14,1
33,9
83
277,
860
29
,619
,967
3,
759
1,11
6,47
0
-
89
,282
,921
Sto
rey
2,01
6,52
4
2,
221
78,8
84,3
29
1,
164,
613
5,
248,
336
24,5
92
3,
158,
616
401
16
,674
-
90
,516
,306
Was
hoe
36,8
19,3
99
14,2
89
14
9,25
7,33
9
2,19
7,47
9
150,
489,
922
1,15
3,38
6
41
,621
,503
5,
313
9,03
1,19
3
6,
943
39
0,59
6,76
6
Whi
te P
ine
6,29
4,06
5
38
,575
59,1
34,9
84
18
5,09
0
-
-
-
-
12
,286
21
8
65
,665
,218
Tota
l42
6,73
8,00
4$
1,
219,
800
$
2,75
2,24
5,00
4$
39
,945
,400
$
987,
629,
004
$
7,01
9,00
0$
36
0,48
5,99
8$
46
,000
$
70,1
15,9
98$
615,
800
$
4,
646,
060,
008
$
2018
- 20
19 T
AX Y
EAR
Secu
red
Tax
Rol
l Sum
mar
yA
sses
sed
Valu
es -
Cen
tral
ly A
sses
sed
Prop
ertie
s
Airl
ines
Elec
tric
sG
as/P
ipel
ines
Rai
lroad
sC
omm
unic
atio
ns
82

Uns
ecur
edPr
ivat
ePr
oper
ty E
scap
ing
Tota
lAi
rline
sC
arlin
esTa
xatio
nAi
rline
sEl
ectr
ics
Gas
/Pip
elin
eR
ailro
adC
omm
unic
atio
n12
Mo
CW
IP
Car
son
City
153,
857
$
-$
-$
659
$
961,
198
$
1,24
9,25
2$
-$
12,3
52$
2,22
3,46
1$
Chu
rchi
ll17
,498
244,
162
-
12
4
4,
145,
354
64
4,16
6
11
,708
32,1
39
4,83
3,49
1
Cla
rk16
,548
,569
568,
352
-
1,
016,
719
31
,419
,307
12
,241
,752
27
,829
729,
287
45
,434
,894
Dou
glas
-
-
-
1,
652
1,
830,
197
36
7,23
6
-
-
2,
199,
085
Elko
2,24
4,11
3
1,11
0,02
4
-
58
,845
2,27
0,47
8
534,
492
52,5
29
16
1,84
6
3,07
8,19
0
Esm
eral
da7,
143
-
-
23
,549
902,
904
-
-
-
92
6,45
2
Eure
ka37
,722
214,
717
-
9,
218
94
5,66
3
80
,531
10
,117
22,9
17
1,06
8,44
7
Hum
bold
t42
,689
603,
766
-
11
0,61
1
3,
010,
519
60
9,69
4
28
,527
128,
920
3,
888,
272
Land
er98
,565
173,
143
-
94
,541
1,75
0,41
4
110,
134
8,17
2
23,7
88
1,98
7,04
9
Linc
oln
16,2
04
41
3,18
7
-
191,
014
247,
448
634,
077
20,2
31
24
9,64
8
1,34
2,41
8
Lyon
2,27
8
162,
277
-
18
,422
3,90
3,02
8
965,
557
7,88
0
5,91
4
4,
900,
800
Min
eral
2,92
6
-
-
41,8
27
1,
640,
798
42
,442
-
-
1,
725,
067
Nye
3,44
7,70
1
-
-
301,
700
4,81
8,39
2
43,0
78
-
4,84
8
5,
168,
018
Pers
hing
9,39
8
363,
841
-
67
, 374
2,00
8,03
1
773,
372
17,1
83
66
,874
2,
932,
835
Stor
ey-
38,7
90
-
3,
153
4,
575,
613
60
,590
1,
833
36
5
4,64
1,55
4
Was
hoe
1,15
7,67
8
507,
783
-
42
,257
9,60
2,07
0
2,68
9,02
7
24,2
91
26
2,99
2
12,6
20,6
37
Whi
te P
ine
36,6
60
-
-
54
,734
810,
385
-
-
41
1
865,
529
Tota
l23
,823
,000
$
4,40
0,04
2$
-
$
2,03
6,40
0$
74,8
41,8
00$
21,0
45,4
00$
210,
300
$
1,
702,
300
$
99,8
36,2
00$
*CW
IP =
Con
stru
ctio
n W
ork
in P
rogr
ess
Purs
uant
to N
RS
361.
321,
con
stru
ctio
n w
ork-
in-p
rogr
ess
(CW
IP) m
ust b
e in
clud
ed o
n th
e ce
ntra
l ass
essm
ent r
oll.
2018
- 20
19 T
AX Y
EAR
UN
SEC
UR
ED T
AX R
OLL
SU
MM
ARY
ASSE
SSED
VAL
UES
CEN
TRAL
LY A
SSES
SED
PR
OPE
RTI
ES
Twel
ve M
onth
CW
IP*
83

Secu
red
Secu
red
Uns
ecur
edU
nsec
ured
Uns
ecur
edU
nsec
ured
Com
bine
dSe
cure
dU
nsec
ured
Com
bine
dU
nita
ry6
Mo.
CW
IP *
Airl
ine
Car
line
PET
**12
Mo.
CW
IP*
Num
ber o
fTo
tal V
alue
Tota
l Val
ueTo
tal V
alue
Asse
ssm
ents
Asse
ssm
ents
Asse
ssm
ents
Asse
ssm
ents
Asse
ssm
ents
Asse
ssm
ents
Asse
ssm
ents
Asse
ssm
ents
Asse
ssm
ents
Asse
ssm
ents
Car
son
City
164
30
427
41,2
55,9
04$
2,
377,
318
$
43
,633
,222
$
C
hurc
hill
257
223
50
927
892
,628
,487
$
5,09
5,15
2$
97,7
23,6
39
Cla
rk51
169
221
021
318
2,55
6,54
9,73
0$
62
,551
,815
$
2,61
9,10
1,54
5
D
ougl
as13
30
04
2049
,362
,859
$
2,19
9,08
5$
51,5
61,9
44
Elk
o28
122
235
014
291
387,
407,
170
$
6,
432,
327
$
39
3,83
9,49
7
Esm
eral
da9
31
04
1734
,760
,287
$
933,
595
$
35,6
93,8
82
Eur
eka
197
223
50
927
250
,008
,925
$
1,32
0,88
6$
51,3
29,8
11
Hum
bold
t20
83
235
09
275
302,
998,
228
$
4,
534,
727
$
30
7,53
2,95
5
Land
er21
62
235
09
273
68,8
29,7
45$
2,
258,
757
$
71
,088
,502
Li
ncol
n21
72
221
011
262
125,
926,
573
$
1,
771,
808
$
12
7,69
8,38
1
Lyon
277
123
50
927
910
1,17
7,16
1$
5,06
5,35
6$
106,
242,
517
M
iner
al17
52
08
3270
,165
,189
$
1,72
7,99
2$
71,8
93,1
81
Nye
218
50
1145
128,
928,
539
$
8,
615,
719
$
13
7,54
4,25
8
Per
shin
g20
62
235
08
271
89,2
82,9
21$
3,
306,
073
$
92
,588
,994
S
tore
y20
50
235
08
268
90,5
16,3
06$
4,
680,
344
$
95
,196
,650
W
asho
e42
106
235
014
307
390,
596,
766
$
14
,286
,097
$
404,
882,
863
W
hite
Pin
e14
52
06
2765
,665
,218
$
902,
189
$
66,5
67,4
07
Tota
l38
411
944
2,55
70
158
3,26
24,
646,
060,
008
128,
059,
242
4,77
4,11
9,25
0
* C
onst
ruct
ion
Wor
k in
Pro
gres
s**
Pro
perty
Esc
apin
g Ta
xatio
n
2018
- 20
19 T
AX Y
EAR
CEN
TRAL
LY A
SSES
SED
UTI
LITI
ES T
AX R
OLL
SU
MM
ARY
84

LOCAL GOVERNMENT FINANCE SECTION
Taxes
Fees for Licenses and Permits
INDEBTEDNESS
Medium Term Obligations
Annual Indebtedness Report
BUDGETS
Calculate and prepare property tax rates to be certified by the Nevada Tax Commission.
Prepare and publish the Property Tax Rates Publication for Nevada Local Governments.
Prescribe guidelines for calculating fee increases for business licenses and building permits.
Monitor for compliance the adoption or increase of fees for business licenses and buildingpermits.
The purpose of the Local Government Finance section is to oversee the financial administration of Nevada'scounties, cities, schools and special districts. For the Fiscal Year ended June 30, 2018, this consisted ofoverseeing the financial activities of 17 counties, 18 incorporated cities, 48 unincorporated towns, 17 schooldistricts, 158 special districts including 3 multi-county districts.
The major areas of responsibility of the section are contained within the provisions of the Local GovernmentBudget & Finance Act (NRS 354.470 to 354.626, inclusive). The areas include overseeing the revenuelimitations, indebtedness, budgets and audits of local governments. The section’s functional responsibilitieswithin each area include the following:
REVENUE LIMITATIONS
Establish and monitor the maximum allowed revenue a local government may receive fromproperty taxes.Compile, calculate and prepare proforma projections of revenue a local government mayreceive from property taxes.
Examine, review, and approve local government budgets based on compliance ornoncompliance with statutes and regulations. The examination procedures include but are notlimited to the following:
1. Review in detail the form, classification and content of the local governments'estimated resources and expenditures/expenses;
2. Review and verify reported actual prior year resources and expenditures/expenseswith the amounts contained in the local governments' audited financial statements.
The examination and approval process applies to tentative, final, amended and augmented budgets.
Prepare and provide local governments with a written certificate of compliance or a written notice of lack of compliance regarding their submitted budget documents.
Review and approve or disapprove medium term financing requests including lease/purchaseobligations. The approval or disapproval is based upon the probable ability of the localgovernment to repay the debt.
Analyze, for reasonableness, the annual indebtedness information submitted by the localgovernments.
Compile, prepare and publish the Annual Local Government Indebtedness Report.
85

Local Government Finance Section (con't)
AUDITS
COUNTY SCHOOL CITIES TOWNS DISTRICTS TOTAL
Carson City 156,794,746$ 113,080,412$ -$ -$ 5,366,854$ 275,242,012$ Churchill 52,503,311 45,040,198 32,588,386 - 1,199,000 131,330,895 Clark 6,858,367,249 4,239,976,031 2,669,924,837 9,168,912 3,452,368,600 17,229,805,629 Douglas 101,417,913 84,472,222 - 8,341,672 73,969,945 268,201,752 Elko 79,605,742 173,936,480 88,727,731 4,827,742 13,372,141 360,469,836 Esmeralda 9,365,296 3,518,947 - 851,904 - 13,736,147 Eureka 22,646,480 14,443,118 - 1,887,300 669,500 39,646,398 Humboldt 40,792,492 49,371,343 12,889,408 - 56,695,668 159,748,911 Lander 67,298,036 17,717,308 - 3,186,475 16,673,786 104,875,605 Lincoln 18,656,600 15,473,469 3,113,054 1,419,564 12,416,684 51,079,371 Lyon 91,618,211 132,880,819 32,591,625 - 20,121,285 277,211,940 Mineral 10,663,834 9,263,052 - 2,333,318 14,772,019 37,032,223 Nye 84,051,362 86,823,988 - 33,677,388 7,583,212 212,135,950 Pershing 18,150,121 12,547,096 2,293,379 81,293 12,766,912 45,838,801 Storey 24,895,839 9,096,114 - - 10,768,453 44,760,406 Washoe 609,916,059 1,055,433,349 569,227,893 - 595,131,360 2,829,708,661 White Pine 56,258,785 7,800,310 6,904,724 248,835 34,920,046 106,132,700 Multicounty Districts 5,216,131 5,216,131
TOTALS 8,303,002,076$ 6,070,874,256$ 3,418,261,037$ 66,024,403$ 4,334,011,596$ 22,192,173,368$ * Source: Final budgets filed June 1, 2018
BUDGETED (ESTIMATED) EXPENDITURES-EXPENSES*
FISCAL YEAR 2018-2019
Review annual independent audits of local governments to determine whether the audits comply with regulationsadopted pursuant to NRS 354.594.
Refer to the State Board of Accountancy audits which do not adhere to regulations adopted pursuant to NRS 354.594.
Identify all statute and regulation violations reported within each audit.
Evaluate and monitor each local government's plan to correct the identified statute and regulation violations.
In addition, the Local Government Finance Division determines and advises local government officers of regulations,procedures and report forms for compliance with the Local Government Budget and Finance Act. The Division makessuch determinations after hearing the advice and recommendations of the Committee on Local Government Finance.
LOCAL GOVERNMENT
86

ADDITIONAL INFORMATION For additional information regarding this publication, contact:
Eden Collings, Public Information Officer Department of Taxation [email protected](775) 684-2199
Kevin Williams, Distributions and Statistics Department of Taxation [email protected] (775) 684-2024
87