annual report november 30, 2016 - ocm gold fund
TRANSCRIPT

Annual ReportNovember 30, 2016


– 1 –
OCM GOLD FUNDShareholder Letter – November 30, 2016
(Unaudited)
Dear Fellow Shareholder:
After several successive down years in the value of gold and shares of gold mining companies, precious metal investors experienced robust performance over the past fiscal year ending November 30, 2016 as the price of gold bullion rose 10.94% to $1,178 (London PM Fix)1. Your Fund responded positively to the rise in gold prices. Over the 12-month period, the OCM Gold Fund Adviser Class (OCMAX) gained 55.98%, while the Investor Class (OCMGX) gained 54.74% (47.75% after maximum sales load). The Philadelphia Gold and Silver Index (XAU)2 outpaced your Fund by returning 73.92% over the 12-month period due primarily to rallies in heavily indebted major index components, such as Freeport McMoran, Inc. and Barrick Gold Corporation (which were not held by the Fund), which gained more than your Fund’s broader portfolio across the precious metals sector. The S&P 500 Index3 appreciated 8.06% over the fiscal period. Your Fund’s investment approach has proven itself over time however, with the Investor Class annual returns outperforming the XAU Index over each of the three, five, and ten year periods. We remain confident our investment strategy and portfolio flexibility within the precious metals mining sector may allow your Fund to continue achieving superior returns to the XAU Index over longer durations.

– 2 –
OCM GOLD FUNDShareholder Letter – November 30, 2016 (Continued)
(Unaudited)
Market Commentary
Market focus on central bank policy remained front and center for much of 2016. The Federal Reserve lifted rates off zero in December of 2015, but sluggish global economic activity persuaded the Fed to limit rate hikes to a single increase for 12 months rather than the three it had signaled earlier to the market for 2016. As a result, the Fed’s move toward “normalization” lost credibility in some circles. Additionally, market attention was directed at negative interest rates in Europe and Japan and the uncertainty brought about by the British vote to exit (commonly referred to as Brexit) the European Union (EU) and the resulting questions about the future of both the EU and the euro. Consequently, gold found Western buyers looking to hedge perceived growing risks as evidenced by the significant increase in the amount of gold held by the gold bullion exchange traded funds (ETFs)4 over the year.
The Brexit vote shocked the establishment and the markets; however, the pushback toward globalization was not complete, and still may not be, as the United States’ electorate followed suit with the election of businessman/reality TV star Donald Trump in November. Dire market prognostications of a Trump victory quickly gave way to optimism that Trump’s plan for fiscal stimulus would be the second coming of Reagonomics and provide the economic growth necessary to thwart the flagging effects of monetary stimulus. While the euphoria surrounding a pivot from past policies may be warranted, we think the potential for disappointment remains high. In our opinion, the challenges facing the Trump administration remain daunting and are ripe with political and systemic financial risk and reinforce the need for investors to establish and maintain a position in gold assets as part of a diversified portfolio.
Sentiment toward gold has been universally tepid from investment banks. They continue to sing the same tune of higher rates leading to a stronger U.S. dollar putting downward pressure on gold prices without any regard for other factors, most notably, the potential fallout from the extreme monetary measures employed by central banks over the past eight years. In our opinion, gold prices are positioned to surprise to the upside as gold reaffirms its role as a preeminent monetary asset in a period of extreme risk and positive gold market fundamentals.
We believe there are several factors that have the potential to favorably impact capital flows toward gold in 2017 and signal gold prices have resumed a major uptrend, such as:
• The coming year poses heightened political risk as Europe holds key elections in the Netherlands, France, and Germany. The populist movement brought about by immigration and uneven wealth distribution raises the prospect of the disintegration of the European Union and the euro currency. Gold stands to potentially gain from safe haven flows from Europeans looking to hedge further upheaval.
• President Trump’s “Art of the Deal” tactic of starting off negotiations at ridiculous extremes to achieve favorable outcomes increases the risk of contentious trade negotiations and geopolitical tension risk with China and other trade partners.

– 3 –
OCM GOLD FUNDShareholder Letter – November 30, 2016 (Continued)
(Unaudited)
• Gold historically is negatively correlated to financial assets. With equity market indexes at historic highs and bond prices skewed by central bank purchases, the prospect of financial assets correcting down as central banks attempt to back away from market intervention in favor of fiscal stimulus is quite high.
• President Trump’s economic agenda is expected to increase inflationary expectations as increased spending on infrastructure and penalizing foreign manufacturing leads to higher prices and upward pressure on wages in a tight labor market. While the Federal Reserve and other central banks have moved to foster inflation to lessen the burden of high sovereign debt levels and future entitlement obligations through aggressive monetary policy, it is questionable whether the Fed will be able to tame the inflation genie once it is out of the bottle due to the systemic risks posed by significantly higher interest rates on the value of interest sensitive instruments to its member banks. If the Fed is perceived to be behind the curve as it was in the 1970s, we believe gold may attract significant capital flows looking to protect purchasing power and hedge fixed income portfolios.
• The likelihood of Trump failing to deliver on his economic promises and disappointing the markets in his first two years is certainly not out of the question. Trump’s policies have drawn comparisons to Ronald Reagan’s term in office with a high degree of optimism on Wall Street for similar economic growth. It should be noted, Reagan found the first two years of his presidency tough sledding with the stock market down 25%. Trump has the challenge of taking office with debt to GDP levels three times that of when Reagan took office along with interest rates at historic lows versus the Reagan era when rates were at historically high levels. Raising the possibility the bulk of Trump’s fiscal stimulus plans may be crowded out as increased interest costs on the $20 trillion dollar U.S. debt in a rising interest rate environment kick in along with the $120 billion per year increase in baby boomer entitlements taking effect. The alternative is a growing budget deficit and continuing the trend of the past two administrations of doubling the total outstanding government debt every eight years.
• Over the past decade, China has absorbed vast quantities of physical gold previously held in western vaults, mostly in London. Chinese gold consumption is unlikely to be traded back into the market for a quick trade as it tends to be held for strategic purposes versus the pervasive Western mentality of holding gold for a trade. The uptick in gold prices in the first half of 2016 to meet Western demand for physical by gold ETFs exhibited a level of tightness and sensitivity the gold market had not seen for a long time. The largest ETF, SPDR Gold Trust5, needed to borrow 26 tons of gold from the Bank of England to meet its backing requirement as inflows surged. The lack of physical gold available to satisfy settlement without borrowing in the London market illustrates that Western buyers may need to significantly bid up the price of gold in order to pry gold back from Asia. This is a positive development as the reach for true price discovery of physical gold versus the massive paper gold market that settles its trades almost entirely

– 4 –
through cash settlement gets closer to reality. In our opinion, the creation of gold out of thin air strictly off balance sheet wherewithal has negatively distorted gold prices and profitability of gold mining companies by making the supply of gold appear much greater than it truly is by over 100 times.
• A major development that may have significant impact for increased physical gold demand is a new Shari’ah Standard for Gold instituted by the Accounting and Auditing Organization for Islamic Financial Institutions (AAOIFI) in December 2016. The new Standard provides a definitive guidance on allowable gold products, potentially allowing 25% of the world’s population to invest in gold where it hadn’t been allowed in the past.
• Diverging monetary policy between the U.S. and other parts of the world poses several potential problems. The most troublesome is default risk increases for foreign borrowers of U.S. dollars as euro dollar availability is squeezed as U.S. interest rates move higher. Dollar denominated debt outside the U.S. is estimated at $14 trillion owed by both private corporations and sovereign governments.
Shares of Gold Mining Companies
Shares of gold mining companies reversed a prolonged decline versus the bullion in 2016 as investors rewarded the industry for renewed focus on generating free cash flow and a more disciplined approach to capital allocation. Several precious metals mining companies utilized the increase in gold prices in the first half of 2016 to deleverage over-indebted balance sheets by either selling off assets or issuing new equity. The industry overall is in much better financial condition than one year ago, but the challenge to replace reserves and depleting production remains. We continue to believe the lack of new discoveries and the prolonged lead-lag time to place new discoveries into production is pointing toward significantly lower global gold production over the next eight years. The market’s appreciation for junior producers and emerging producers consequently should grow, in our opinion.
Your Fund’s investment strategy remains a disciplined approach to searching out value and growth opportunities across all segments of the gold and silver mining industry on a global basis. We believe those companies that possess strong management, large reserves in the ground in stable jurisdictions, and exhibit capital discipline while holding equity dear will be the companies that outperform over time. Your Fund has the flexibility to maneuver within the precious metals sector to invest in opportunities that larger funds and exchange traded funds cannot; from senior gold producers with over one million ounces of annual production to junior producers with less than 100,000 ounces of annual production to small exploration and development companies with micro capitalizations. With higher gold prices over the past year, we have selectively established new positions in a number of promising companies that are junior producers or emerging producers. This strategy has historically led to your Fund outperforming the XAU Index over the past 15 years.
OCM GOLD FUNDShareholder Letter – November 30, 2016 (Continued)
(Unaudited)

– 5 –
OCM GOLD FUNDShareholder Letter – November 30, 2016 (Continued)
(Unaudited)
Conclusion
In our opinion, the heightened level of political and geopolitical uncertainty associated with the populist movement in Europe and the United States, combined with the systemic financial risk from eight years of radical monetary policy, has created an environment of unparalleled risk.
Trump may prove successful in stimulating the necessary economic growth to service the increased debt burden placed on the economy over the past two administrations, but it seems prudent, in our opinion, to hedge against an unwinding process that may prove to be detrimental to the value of financial assets with exposure to gold and precious metal equities. We believe, markets may move ahead of Trump’s fiscal stimulus plan and the Federal Reserve by collapsing the bubble in the bond market in anticipation of rising inflation and ballooning budget deficits and foreign central banks’ need to sell U.S. treasuries to meet dollar obligations. A rapid spike in interest rates from current levels could trigger a cascading sequence of defaults that may lead to deflationary consequences if not handled swiftly and appropriately by policy-makers. In our opinion, if this were to occur a new monetary order in the context of a Bretton Woods Agreement6 could be enacted to instill confidence in the financial system, stabilize exchange rates and cap interest rates. Of note, Trump has surrounded himself with several advisers that are sound money advocates, such as Judy Shelton and Vice President Mike Pence. Therefore, it is not too farfetched to imagine a new Bretton Woods with gold having a role, perhaps as a reference point.
We appreciate your shareholding and confidence in the OCM Gold Fund and we look forward to meeting the investment objective of preserving your purchasing power. Should you have any questions regarding the Fund or gold, please contact your financial adviser or you may contact us directly at 1-800-779-4681. For questions regarding your account, please contact Shareholder Service at 1-800-628-9403.
Sincerely,
Gregory M. Orrell Portfolio Manager January 18, 2017
– 6 –
OCM GOLD FUNDShareholder Letter – November 30, 2016 (Continued)
(Unaudited)
London PM Fix1 is the price per ounce for each of the precious metals (gold, silver, platinum and palladium) determined daily at 10:30 and 15:00 GMT by a brief conference call among the five members of the London Gold Pool (Scotia-Mocatta, Barclays Capital, Deutsche Bank, HSBC and Société Générale). The London spot fix price is the price fixed at the moment when the conference call terminates.
Philadelphia Gold and Silver Index (XAU)2 is a capitalization-weighted index featuring sixteen widely held securities in the gold and silver mining and production industry or companies investing in such mining and production companies.
S&P 500 Index3 is a registered trademark of the Standard & Poor’s Corporation and is an unmanaged broadly based index of the common stock prices of 500 large U.S. companies.
Investors cannot invest directly in an index.
An ETF4, or exchange traded fund, is a marketable security that tracks an index, a commodity, bonds, or a basket of assets like an index fund. Unlike mutual funds, an ETF trades like a common stock on a stock exchange.
The SPDR Gold Shares ETF5 (NYSEARCA: GLD) tracks the price of gold bullion in the over-the-counter (OTC) market.
The Bretton Woods Agreement6, which was introduced in the late 1940s, after World War II, established a fixed exchange rate system, having been agreed upon at the Bretton Woods conference by the more than 40 countries that participated. The system was developed to give structure to international monetary exchanges and policies and to maintain stability in all international finance transactions and interactions.

– 7 –
Investor Class Performance as of November 30, 2016
OCMGX (without load)
OCMGX (with load)
Philadelphia Gold and Silver Index (XAU)1 S&P 5002
Six Months (4.06)% (8.40)% (0.68)% 6.01%One Year 54.74% 47.75% 73.92% 8.06%3 Year Annualized 1.89% 0.34% (1.68)% 9.07%5 Year Annualized (14.88)% (15.66)% (16.31)% 14.45%10 Year Annualized (1.98)% (2.43)% (4.94)% 6.89%
Advisor Class Performance as of November 30, 2016
OCMAX
Philadelphia Gold and Silver
Index (XAU)1 S&P 5002
Six Months (3.65)% (0.68)% 6.01%One Year 55.98% 73.92% 8.06%3 Year Annualized 2.67% (1.68)% 9.07%5 Year Annualized (14.31)% (16.31)% 14.45%Since Inception Annualized* (6.25)% (9.12)% 12.29%
*Inception: April 1, 2010
The performance data quoted above represents past performance. Current performance may be lower or higher than the performance data quoted above. Past performance is no guarantee of future results. The investment return and principal value of an investment will fluctuate so that investor’s shares, when redeemed, may be worth more or less than their original cost. The Fund’s Total Annual Operating Expenses for the OCM Gold Fund Investor Class and Advisor Class are 2.59% and 2.01% respectively. Please review the Fund’s prospectus for more information regarding the Fund’s fees and expenses. For performance information current to the most recent month-end, please call toll-free 800-628-9403. The returns shown include the reinvestment of all dividends but do not reflect the deduction of taxes that a shareholder would pay on Fund distributions or the redemption of Fund shares.
1 The Philadelphia Gold and Silver Index (XAU) is an unmanaged capitalization-weighted index composed of 16 companies listed on U.S. exchanges involved in the gold and silver mining industry. The index is generally considered as representative of the gold and silver share market. You cannot invest directly in an index.
2 The S&P 500 Index, a registered trademark of McGraw-Hill Co., Inc. is a market capitalization-weighted index of 500 widely held common stocks. You cannot invest directly in an index.
OCM GOLD FUNDShareholder Letter – November 30, 2016 (Continued)
(Unaudited)

– 8 –See notes to financial statements.
Shares
Value
COMMON STOCKS 95.6%Major Gold Producers 37.5%
89,000 Agnico Eagle Mines Ltd. ............ $ 3,653,450200,000 AngloGold Ashanti Ltd. ADR* ... 2,188,000325,000 Gold Fields Ltd. ADR ................. 997,75045,750 Goldcorp, Inc. ............................ 603,442
234,469 Kinross Gold Corp.* .................. 771,40370,000 Newmont Mining Corp. ............. 2,270,80059,500 Randgold Resources Ltd. ADR .. 4,276,860
100,000 Sibanye Gold Ltd. ADR .............. 831,000219,625 Yamana Gold, Inc. ..................... 656,679
16,249,384Intermediate/Mid-Tier Gold Producers 12.2%
100,000 Alacer Gold Corp.* .................... 183,131310,000 Alamos Gold, Inc. ...................... 1,980,900311,200 B2Gold Corp.* ........................... 752,922100,000 Centerra Gold, Inc. ..................... 516,638120,633 Eldorado Gold Corp.* ................ 330,534100,000 Endeavour Mining Corp.* .......... 1,505,993
5,270,118Junior Gold Producers 14.2%
435,000 Argonaut Gold, Inc.* ................. 799,8593,400,000 Jaguar Mining, Inc.* .................. 1,594,581
150,000 Klondex Mines Ltd.* .................. 725,8241,000,000 Perseus Mining Ltd.* ................ 416,884
650,000 Ramelius Resources Ltd.* ........ 239,99447,976 Richmont Mines, Inc.* .............. 307,046
1,151,000 Wesdome Gold Mines Ltd.* ...... 2,082,1346,166,322
Exploration and Development Companies 9.6%500,000 Amarillo Gold Corp.* ................. 122,832138,500 Asanko Gold, Inc.*^ .................. 486,135
Shares
Value
Exploration and Development Companies 9.6% (Continued)111,500 Asanko Gold, Inc.* .................... $ 390,951650,000 Atlantic Gold Corp.* .................. 430,656500,000 Blackham Resources Ltd.* ........ 188,303412,356 Dacian Gold Ltd.*# .................... 904,370
2,000,000 Intermin Resources Ltd.* .......... 162,4581,755,500 Lydian International Ltd.* .......... 385,523
150,000 Premier Gold Mines Ltd.* ......... 255,713650,000 Roxgold, Inc.* ........................... 638,725
5,572,040 Sutter Gold Mining, Inc.* .......... 186,6614,152,327
Primary Silver Producers 6.4%200,000 Fortuna Silver Mines, Inc.* ........ 1,208,96315,000 Hecla Mining Co. ....................... 91,200
100,000 Tahoe Resources, Inc. ............... 961,06655,000 Tahoe Resources, Inc.^ ............. 526,900
2,788,129Royalty/Streaming Companies 15.7%
14,800 Franco-Nevada Corp. ................. 859,7078,000 Franco-Nevada Corp.^ ............... 463,360
32,600 Royal Gold, Inc. ......................... 2,270,264175,000 Silver Wheaton Corp. ................. 3,183,950
6,777,281Total Common Stocks
(Cost $20,886,543) ................... 41,403,561
EXCHANGE TRADED FUND 4.3%16,500 SPDR Gold Shares* .................. 1,843,875
Total Exchange Traded Fund(Cost $729,465) ........................ 1,843,875
OCM GOLD FUNDSchedule of Investments – November 30, 2016

– 9 –See notes to financial statements.
Shares
Value
RIGHTS 0.0%Major Gold Producers 0.0%
13,727 Yamana Gold, Inc.* Exercise Price 3.25 CAD, Exp. 12/22/2016 .................... $ 3,372
Total Rights(Cost $0) .................................... 3,372
WARRANTS 0.1%Exploration and Development Companies 0.1%
566,625 Lydian International Ltd.* Exercise Price 0.36 CAD, Exp. 11/27/2017 .................... 29,527
1,000,000 Intermin Resources Ltd.* Exercise Price 0.17 AUD, Exp. 8/31/2018 ...................... 15,507
45,034Total Warrants
(Cost $24,261) .......................... 45,034
Total Investments(Cost $21,640,269) ......100.0% 43,295,842
Other Assets less Liabilities ..............0.0% 11,915TOTAL NET ASSETS ........................100.0% $ 43,307,757
ADR – American Depository Receipt.
AUD – Australian Dollars.
CAD – Canadian Dollars.
* Non-income producing security.
^ Denoted investment is a Canadian security traded on U.S. stock exchange.
# The security is valued at fair value in accordance with procedures established by the Fund’s Board of Trustees.
OCM GOLD FUNDSchedule of Investments – November 30, 2016 (Continued)

– 10 –See notes to financial statements.
SUMMARY OF INVESTMENTS BY COUNTRY
Country ValuePercent of
Investment Securities
Australia $ 1,927,515 4.4%Canada 24,677,535 57.0Cayman Islands 1,505,993 3.5Jersey 4,691,910 10.8South Africa 4,016,750 9.3United States 6,476,139 15.0
Total $ 43,295,842 100.0%
OCM GOLD FUNDSchedule of Investments – November 30, 2016 (Continued)
– 11 –See notes to financial statements.
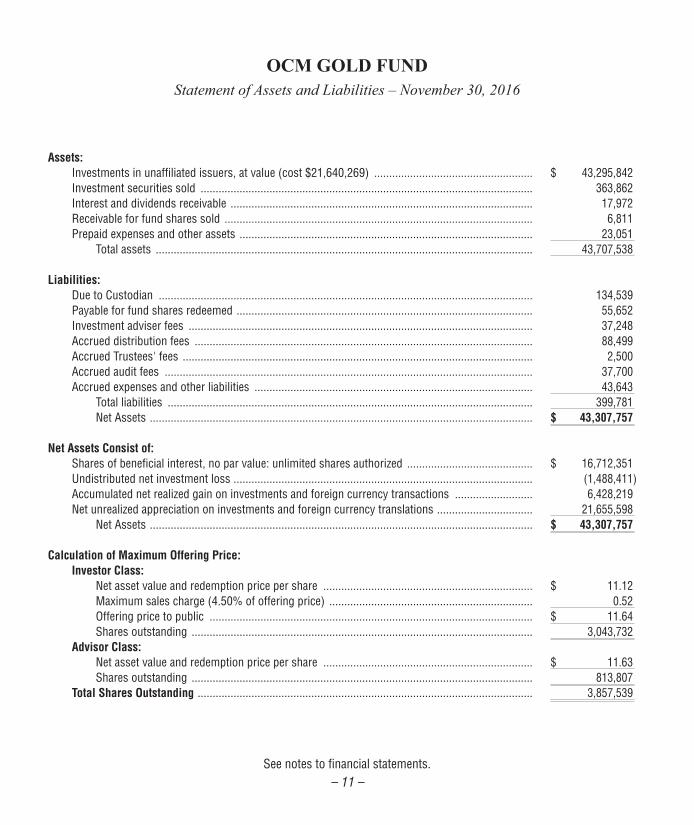
Assets:Investments in unaffiliated issuers, at value (cost $21,640,269) ..................................................... $ 43,295,842Investment securities sold ............................................................................................................... 363,862Interest and dividends receivable ..................................................................................................... 17,972Receivable for fund shares sold ....................................................................................................... 6,811Prepaid expenses and other assets .................................................................................................. 23,051
Total assets .............................................................................................................................. 43,707,538
Liabilities:Due to Custodian ............................................................................................................................. 134,539Payable for fund shares redeemed ................................................................................................... 55,652Investment adviser fees ................................................................................................................... 37,248Accrued distribution fees ................................................................................................................. 88,499Accrued Trustees' fees ..................................................................................................................... 2,500Accrued audit fees ........................................................................................................................... 37,700Accrued expenses and other liabilities ............................................................................................. 43,643
Total liabilities .......................................................................................................................... 399,781Net Assets ................................................................................................................................ $ 43,307,757
Net Assets Consist of:Shares of beneficial interest, no par value: unlimited shares authorized .......................................... $ 16,712,351Undistributed net investment loss .................................................................................................... (1,488,411)Accumulated net realized gain on investments and foreign currency transactions .......................... 6,428,219Net unrealized appreciation on investments and foreign currency translations ................................ 21,655,598
Net Assets ................................................................................................................................ $ 43,307,757
Calculation of Maximum Offering Price:Investor Class:
Net asset value and redemption price per share ...................................................................... $ 11.12Maximum sales charge (4.50% of offering price) .................................................................... 0.52Offering price to public ............................................................................................................ $ 11.64Shares outstanding .................................................................................................................. 3,043,732
Advisor Class:Net asset value and redemption price per share ...................................................................... $ 11.63Shares outstanding .................................................................................................................. 813,807
Total Shares Outstanding ................................................................................................................ 3,857,539
OCM GOLD FUNDStatement of Assets and Liabilities – November 30, 2016

– 12 –See notes to financial statements.
Investment IncomeInterest ............................................................................................................................................. $ 153Dividend (net of foreign withholding taxes of $40,142) ................................................................... 294,023
Total investment income .......................................................................................................... 294,176
Expenses Investment advisory fees ................................................................................................................. 478,697Distribution fees - Investor Class ..................................................................................................... 321,225Fund administration and accounting fees ......................................................................................... 129,517Transfer agent fees and expenses .................................................................................................... 105,492Federal and state registration fees ................................................................................................... 42,013Audit fees ......................................................................................................................................... 39,700Distribution fees - Advisor Class ...................................................................................................... 31,495Legal fees ......................................................................................................................................... 27,464Chief Compliance Officer fees .......................................................................................................... 25,023Reports to shareholders ................................................................................................................... 22,197Custody fees .................................................................................................................................... 17,834Trustees' fees ................................................................................................................................... 10,000Other expenses ................................................................................................................................ 9,169
Total expenses ......................................................................................................................... 1,259,826Net investment loss ................................................................................................................. (965,650)
Realized and Unrealized Gain on Investments:Net realized gain on investments and foreign currency transactions ............................................... 8,737,060Net change in unrealized appreciation/depreciation on investments
and foreign currency translations ............................................................................................ 8,315,305Net gain on investments .......................................................................................................... 17,052,365
Net increase in net assets from operations ........................................................................................... $ 16,086,715
OCM GOLD FUNDStatement of Operations - Year Ended November 30, 2016

– 13 –See notes to financial statements.
Year Ended November 30,
2016
Year Ended November 30,
2015
Operations:Net investment loss ..................................................................................... $ (965,650) $ (706,269)Net realized gain (loss) on investments and foreign currency transactions .... 8,737,060 (451,006)Net change in unrealized appreciation/depreciation on investments and
foreign currency translations ............................................................... 8,315,305 (12,077,277)Net increase (decrease) in net assets from operations ................................ 16,086,715 (13,234,552)
Distributions Paid to Shareholders Investor Class:
Distributions paid from net realized gains ............................................ (12,996) (615,794)Total distributions from Investor Class ................................................ (12,996) (615,794)
Advisor Class:Distributions paid from net realized gains ............................................ (2,629) (291,493)Total distributions from Advisor Class ................................................. (2,629) (291,493)Total distributions ................................................................................ (15,625) (907,287)
Fund Share Transactions Investor Class:
Net proceeds from shares sold ............................................................ 1,979,714 1,751,025Distributions reinvested ....................................................................... 11,651 543,376Payment of shares redeemed1 ............................................................. (6,399,365) (7,462,865)Net decrease in net assets from Investor Class share transactions ...... (4,408,000) (5,168,464)
Advisor Class:Net proceeds from shares sold ............................................................ 13,556,278 16,354,937Distributions reinvested ....................................................................... 2,547 275,664Payment of shares redeemed2 ............................................................. (25,703,693) (8,677,582)Net increase (decrease) in net assets from Advisor Class
share transactions ........................................................................ (12,144,868) 7,953,019Net increase (decrease) in net assets from Fund share transactions ... (16,552,868) 2,784,555
Total decrease in net assets ............................................................... (481,778) (11,357,284)
Net Assets, Beginning of Period ......................................................................... 43,789,535 55,146,819Net Assets, End of Period ................................................................................... 43,307,757 43,789,535
Accumulated Net Investment Loss ..................................................................... $ (1,488,411) $ (1,816,570)
OCM GOLD FUNDStatements of Changes in Net Assets

– 14 –See notes to financial statements.
OCM GOLD FUNDStatements of Changes in Net Assets (Continued)
Year Ended November 30,
2016
Year Ended November 30,
2015
Transactions in sharesInvestor Class:
Shares sold .......................................................................................... 158,683 188,952Shares issued on reinvestment of distributions ................................... 1,612 60,712Shares redeemed ................................................................................. (560,783) (836,796)Net decrease in Investor Class shares outstanding .............................. (400,488) (587,132)
Advisor Class:Shares sold .......................................................................................... 1,046,137 1,664,548Shares issued on reinvestment of distributions ................................... 340 29,895Shares redeemed ................................................................................. (2,785,818) (880,355)Net increase (decrease) in Advisor Class shares outstanding .............. (1,739,341) 814,088
Net Increase (Decrease) in Fund Shares Outstanding ............................... (2,139,829) 226,956
1 Net of redemption fees of $497 for the year ended November 30, 2016 and $26 for the year ended November 30, 2015, respectively.
2 Net of redemption fees of $44,618 for the year ended November 30, 2016 and $11,601 for the year ended November 30, 2015, respectively.

– 15 –
Note 1. Organization
OCM Mutual Fund (the “Trust”) is registered under the Investment Company Act of 1940, as amended, as an open-end management investment company. The Trust was organized as a Massachusetts business trust on January 6, 1984 and consists of the OCM Gold Fund (the “Fund”). The Fund is a non-diversified fund. The investment objective for the Fund is long-term growth of capital through investing primarily in equity securities of domestic and foreign companies engaged in activities related to gold and precious metals.
The Fund is an investment company and accordingly follows the investment company accounting and reporting guidance of the Financial Accounting Standards Board (“FASB”) Accounting Standard Codification Topic 946 “Financial Services—Investment Companies.”
Note 2. Significant Accounting Policies
The following is a summary of significant accounting policies followed by the Fund in the preparation of its financial statements.
Security Valuation – Portfolio securities that are listed on national securities exchanges, other than the NASDAQ Stock Market LLC, are valued at the last sale price as of the close of business of such securities exchanges, or, in the absence of recorded sales, at the average of readily available closing bid and ask prices on such exchanges. NASDAQ Global Select Market, Global Market and Capital Market securities are valued at the NASDAQ Official Closing Price (“NOCP”). If a NOCP is not issued for a given day, these securities are valued at the average of readily available closing bid and asked prices. Unlisted securities are valued at the average of the quoted bid and ask prices in the over-the-counter market. Short-term investments which mature in less than 60 days are valued at amortized cost (unless the Trust’s Board of Trustees determines that this method does not represent fair value). Short-term investments which mature after 60 days are valued at market. Securities and other assets for which market quotations are not readily available are valued at fair value as determined in good faith by the investment adviser under procedures established by and under the general supervision and responsibility of the Trust’s Board of Trustees. For each investment that is fair valued, the investment adviser considers, to the extent applicable, various factors including, but not limited to, the type of security, the financial condition of the company, comparable companies in the public market, the nature and duration of the cause for a quotation not being readily available and other relevant factors.
Under Fair Value Measurements and Disclosures, various inputs are used in determining the value of the Fund’s investments. These inputs are summarized into three broad levels as described below:
• Level 1 – quoted prices in active markets for identical securities
OCM GOLD FUNDNotes to Financial Statements – November 30, 2016

– 16 –
OCM GOLD FUNDNotes to Financial Statements – November 30, 2016 (Continued)
• Level 2 – other significant observable inputs (including quoted prices for similar securities, interest rates, and evaluated quotation obtained from pricing services)
• Level 3 – significant unobservable inputs (including the Fund’s own assumptions in determining the fair value of investments).
The inputs or methodology used for valuing securities are not an indication of the risk associated with investing in those securities. The following is a summary of the inputs used, as of November 30, 2016, in valuing the Fund’s assets:
Sector Level 1 Level 2 Level 3 Total
Common Stocks
Major Gold Producers $ 16,249,384 $ — $ — $ 16,249,384
Intermediate/Mid-Tier Gold Producers 5,270,118 — — 5,270,118
Junior Gold Producers 6,166,322 — — 6,166,322
Exploration and Development Companies 3,247,957 904,370 — 4,152,327
Primary Silver Producers 2,788,129 — — 2,788,129
Royalty/Streaming Companies 6,777,281 — — 6,777,281
Exchange Traded Fund 1,843,875 — — 1,843,875
Rights 3,372 — — 3,372
Warrants 45,034 — — 45,034
Total $ 42,391,472 $ 904,370 $ — $ 43,295,842
The Fund held one Level 2 security at November 30, 2016. Dacian Gold Ltd. halted trading on November 29, 2016 and was fair valued in accordance with procedures established by and under the general supervision of the Trust’s Board of Trustees. This security resumed trading on December 6, 2016 after successful completion of a capital issuance. At the beginning of the period, this security was classified as a Level 1 and represents the only transfer between levels. The Fund recognizes transfers between levels at the end of the reporting period. There were no Level 3 securities as of November 30, 2016.

– 17 –
OCM GOLD FUNDNotes to Financial Statements – November 30, 2016 (Continued)
Foreign Currency – Investment securities and other assets and liabilities denominated in foreign currencies are translated into U.S. dollar amounts at the date of valuation. Purchases and sales of investment securities and income and expense items denominated in foreign currencies are translated into U.S. dollar amounts on the respective dates of such transactions. The Fund does not isolate that portion of the results of operations resulting from changes in foreign exchange rates on investments from the fluctuations arising from changes in market prices of securities held. Such fluctuations for the year ended November 30, 2016 are included within the realized and unrealized gain/loss on investments section of the Statement of Operations.
Reported net realized foreign exchange gains or losses arise from sales of foreign currencies, currency gains or losses realized between the trade and settlement dates on securities transactions, and the difference between the amounts of dividends, interest and foreign withholding taxes recorded on the Fund’s books and the U.S. dollar equivalent of the amounts actually received or paid. Net unrealized foreign exchange gains and losses arise from changes in the fair value of assets and liabilities, other than investments in securities at fiscal period end, resulting from changes in exchange rates. Such fluctuations for the year ended November 30, 2016 are included within the realized and unrealized gain/loss on investments section of the Statement of Operations.
Federal Income Taxes – The Fund intends to comply with the requirements of the Internal Revenue Code necessary to qualify as a regulated investment company and to make the requisite distributions of income to its shareholders to relieve it from all or substantially all federal income taxes. Withholding taxes on foreign dividends have been provided for in accordance with the Fund’s understanding on the applicable county’s tax rules and rate.
Accounting for Uncertainty in Income Taxes (“Income Tax Statement”) requires an evaluation of tax positions taken (or expected to be taken) in the course of preparing the Fund’s tax returns to determine whether these positions meet a “more-likely-than-not” standard that, based on the technical merits, have a more than fifty percent likelihood of being sustained by a taxing authority upon examination. A tax position that meets the “more-likely-than-not” recognition threshold is measured to determine the amount of benefit to recognize in the financial statements. The Fund’s policy is to classify interest and penalties associated with underpayment of federal and state income taxes, if any, as income tax expense on the Statement of Operations. As of November 30, 2016, the Fund did not have any interest or penalties associated with the underpayment of any income taxes.
The Income Tax Statement requires management of the Fund to analyze all open tax years, fiscal years 2013-2016 as defined by IRS statute of limitations for all major jurisdictions, including federal tax authorities and certain state tax authorities. As of and during the year ended November 30, 2016, the Fund did not have a liability for any unrecognized tax benefits. The Fund has no examinations in progress and is not aware of any tax positions for which it is reasonably possible that the total amounts of unrecognized tax benefits will significantly change in the next twelve months.

– 18 –
OCM GOLD FUNDNotes to Financial Statements – November 30, 2016 (Continued)
Share Classes – The Fund offers two classes of shares, Investor Class and Advisor Class. The outstanding shares of the Fund on April 1, 2010 were renamed “Investor Class shares.” The Advisor Class shares commenced operations on April 1, 2010. The two classes represent interests in the same portfolio of investments and have the same rights. Investor Class shares are subject to an annual 12b-1 fee of up to 0.99% of the Fund’s average daily net assets allocable to Investor Class shares, whereas Advisor Class shares are subject to an annual 12b-1 fee of up to 0.25% of the Fund’s average daily net assets allocable to Advisor Class shares. Income, expenses (other than expenses attributable to a specific class) and realized and unrealized gains and losses on investments are allocated to each class of shares in proportion to their relative shares outstanding.
Securities Transactions and Investment Income – Securities transactions are accounted for on a trade date basis. Realized gains and losses on sales of securities are calculated on the identified cost basis. Dividend income is recorded on the ex-dividend date and interest income is recorded on an accrual basis.
Distributions to Shareholders – The character of distributions made during the year from net investment income or net realized gains may differ from the characterization for federal income tax purposes due to differences in the recognition of income, expense or gain items for financial statement and tax purposes. To the extent that these differences are attributable to permanent book and tax accounting differences, the components of net assets have been adjusted.
Redemption Fee – A 1.50% redemption fee is retained by the Fund to offset transaction costs and other expenses associated with short-term investing. The fee is imposed on redemptions or exchanges of shares held less than three months from their purchase date. The Fund records the fee as a reduction of shares redeemed and as a credit to shares of beneficial interest. For the year ended November 30, 2016, the Investor Class and the Advisor Class received $497 and $44,618 in redemption fees, respectively.
Guarantees and Indemnifications – In the normal course of business, the Fund enters into contracts with service providers that contain general indemnification clauses. Also, under the Fund's organizational documents, its officers and trustees are indemnified by the Fund against certain liabilities arising out of the performance of their duties to the Fund. The Fund’s maximum exposure under these arrangements is unknown as this would involve future claims against the Fund that have not yet occurred. Based on experience, the Fund expects the risk of loss to be remote.
Use of Estimates – The preparation of financial statements in conformity with accounting principles generally accepted in the United States of America requires management to make estimates and assumptions that affect the reported amounts of assets and liabilities and disclosure of contingent assets and liabilities at the date of the financial statements and the reported amounts of increases and decreases in net assets from operations during the reporting period. Actual results could differ from those estimates.
– 19 –
OCM GOLD FUNDNotes to Financial Statements – November 30, 2016 (Continued)
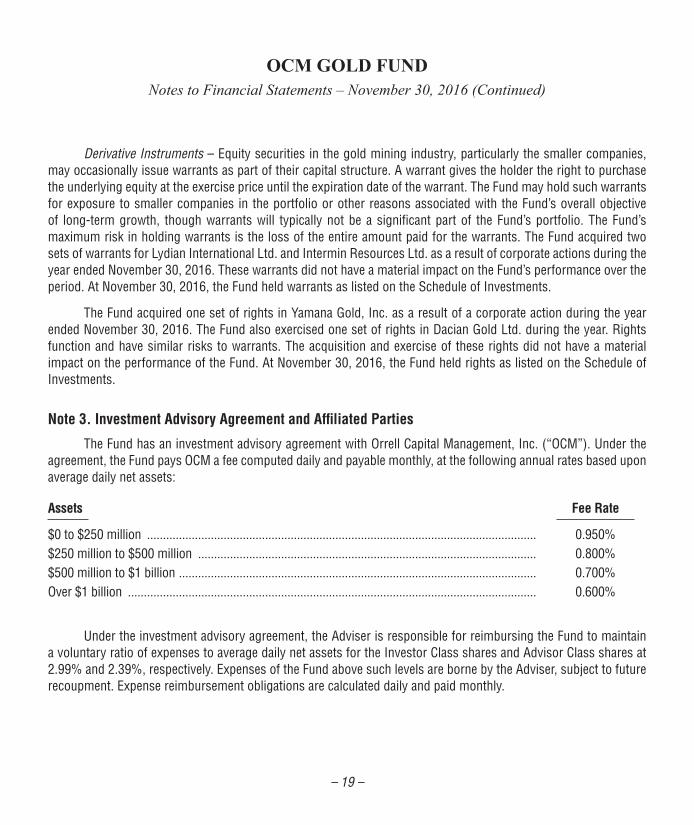
Derivative Instruments – Equity securities in the gold mining industry, particularly the smaller companies, may occasionally issue warrants as part of their capital structure. A warrant gives the holder the right to purchase the underlying equity at the exercise price until the expiration date of the warrant. The Fund may hold such warrants for exposure to smaller companies in the portfolio or other reasons associated with the Fund’s overall objective of long-term growth, though warrants will typically not be a significant part of the Fund’s portfolio. The Fund’s maximum risk in holding warrants is the loss of the entire amount paid for the warrants. The Fund acquired two sets of warrants for Lydian International Ltd. and Intermin Resources Ltd. as a result of corporate actions during the year ended November 30, 2016. These warrants did not have a material impact on the Fund’s performance over the period. At November 30, 2016, the Fund held warrants as listed on the Schedule of Investments.
The Fund acquired one set of rights in Yamana Gold, Inc. as a result of a corporate action during the year ended November 30, 2016. The Fund also exercised one set of rights in Dacian Gold Ltd. during the year. Rights function and have similar risks to warrants. The acquisition and exercise of these rights did not have a material impact on the performance of the Fund. At November 30, 2016, the Fund held rights as listed on the Schedule of Investments.
Note 3. Investment Advisory Agreement and Affiliated Parties
The Fund has an investment advisory agreement with Orrell Capital Management, Inc. (“OCM”). Under the agreement, the Fund pays OCM a fee computed daily and payable monthly, at the following annual rates based upon average daily net assets:
Assets Fee Rate
$0 to $250 million .......................................................................................................................... 0.950%$250 million to $500 million .......................................................................................................... 0.800%$500 million to $1 billion ................................................................................................................ 0.700%Over $1 billion ................................................................................................................................ 0.600%
Under the investment advisory agreement, the Adviser is responsible for reimbursing the Fund to maintain a voluntary ratio of expenses to average daily net assets for the Investor Class shares and Advisor Class shares at 2.99% and 2.39%, respectively. Expenses of the Fund above such levels are borne by the Adviser, subject to future recoupment. Expense reimbursement obligations are calculated daily and paid monthly.

– 20 –
The Fund does not compensate Trustees and Officers affiliated with OCM. For the year ended November 30, 2016, the expenses accrued for Trustees who are not affiliated with OCM are reported on the Statement of Operations. The Fund pays the salary and related expenses of the Fund’s Chief Compliance Officer. The expenses incurred for the Chief Compliance Officer are reported on the Statement of Operations.
Note 4. Distribution Agreement and Plan
The Trust has adopted a Distribution Plan (the “Plan”) pursuant to Rule 12b-1 under the Investment Company Act of 1940, as amended. The Plan authorizes the Fund to reimburse the distributor for marketing expenses incurred in distributing shares of the Fund, including the cost of printing sales material and making payments to dealers of the Fund’s Investor Class and Advisor Class, in any fiscal year, subject to limits of 0.99% and 0.25%, respectively, of the average daily net assets of each respective class. For the year ended November 30, 2016, the Investor Class and the Advisor Class incurred $321,225 and $31,495, respectively, in expenses under the Plan.
Note 5. Purchases and Sales of Securities
Purchases and sales of investment securities (excluding short-term securities and U.S. government obligations) for the year ended November 30, 2016 were $5,540,209 and $21,631,526, respectively. There were no purchases or sales of U.S. government obligations.
Note 6. Federal Income Tax Information
At November 30, 2016, gross unrealized appreciation and depreciation of investments owned by the Fund, based on cost for federal income tax purposes were as follows:
Cost of investments ........................................................................................................................ $ 22,557,919Unrealized appreciation .................................................................................................................. $ 22,571,186Unrealized depreciation .................................................................................................................. (1,833,263)Unrealized appreciation on foreign currency .................................................................................. 25Net unrealized appreciation on investments ................................................................................... $ 20,737,948
The difference between cost amounts for financial statement and federal income tax purposes is due primarily to investments in passive foreign investment companies (“PFICs”).
OCM GOLD FUNDNotes to Financial Statements – November 30, 2016 (Continued)

– 21 –
The tax character of distributions paid during the fiscal years ended November 30, 2016 and 2015 was as follows:
2016 2015
Ordinary income ............................................................................................. $ — $ —Net long-term capital gains ............................................................................ 15,625 907,287Total distributions ........................................................................................... $ 15,625 $ 907,287
As of November 30, 2016 the components of accumulated earnings on a tax basis were as follows:
Undistributed ordinary income ....................................................................................................... $ —Undistributed long-term gains ....................................................................................................... 6,400,958Tax accumulated earnings .............................................................................................................. 6,400,958Accumulated capital and other losses ............................................................................................ (543,500)Unrealized appreciation on investments ......................................................................................... 20,737,948Total accumulated earnings ............................................................................................................ $ 26,595,406
The Fund has $543,500 in qualified late-year losses, which are deferred until fiscal year 2017 for tax purposes. Net late-year ordinary losses incurred after December 31 and within the taxable year and net late-year specified losses incurred after October 31 and within the taxable year are deemed to arise on the first day of the Fund’s next taxable year.
The Fund utilized $1,052,857 of its capital loss carryforward during the year ended November 30, 2016.
Note 7. Concentration of Risk
Investing in foreign securities involves certain risks not necessarily found in U.S. markets. These include risks associated with adverse changes in economic, political, regulatory and other conditions, changes in currency exchange rates, exchange control regulations, expropriation of assets or nationalization, imposition of withholding taxes on dividend or interest payments or capital gains, and possible difficulty in obtaining and enforcing judgments against foreign entities. Further, issuers of foreign securities are subject to different, and often less comprehensive, accounting, reporting, and disclosure requirements than domestic issuers.
OCM GOLD FUNDNotes to Financial Statements – November 30, 2016 (Continued)

– 22 –
As the Fund concentrates its investments in the gold mining industry, a development adversely affecting the industry (for example, changes in the mining laws which increases production costs or a significant decrease in the market price of gold) would have a greater adverse effect on the Fund than it would if the Fund invested in a number of different industries.
Note 8. Illiquid Securities
The Fund may invest up to 15% of net assets in securities for which there is no readily available market (“illiquid securities”). The 15% limitation includes securities whose disposition would be subject to legal restrictions (“restricted securities”). Illiquid and restricted securities often have a market value lower than the market price of unrestricted securities of the same issuer and are not readily marketable without some time delay. This could result in the Fund being unable to realize a favorable price upon disposition of such securities and in some cases might make disposition of such securities at the time desired by the Fund impossible.
Note 9. Subsequent Events
Management has evaluated subsequent events and determined there were no subsequent events that require recognition or disclosure in the financial statements.
OCM GOLD FUNDNotes to Financial Statements – November 30, 2016 (Continued)

– 23 –See notes to financial statements.
Year Ended
Nov. 30, 2016
Year Ended
Nov. 30, 2015
Year Ended
Nov. 30, 2014
Year Ended
Nov. 30, 2013
Year Ended
Nov. 30, 2012
Per Share Operating Performance(For a share outstanding throughout each period)
Net asset value, beginning of period ................................................. $ 7.19 $ 9.47 $ 11.26 $ 21.68 $ 28.49
Income from Investment Operations:Net investment loss ........................................................................... (0.24)1 (0.14)1 (0.17)1 (0.27) (0.25)Net realized and unrealized gain/(loss) on investments and
foreign currency transactions ....................................................... 4.17 (1.98) (1.17) (9.75) (5.48)Total from investment operations ...................................................... 3.93 (2.12) (1.34) (10.02) (5.73)
Less Distributions:Dividends from net investment income ............................................. — — — — —Distribution from net realized gains .................................................. —2 (0.16) (0.45) (0.40) (1.08)Total distributions .............................................................................. — (0.16) (0.45) (0.40) (1.08)
Redemption fee proceeds ................................................................ —2 —2 —2 —2 —2
Net asset value, end of period ......................................................... $ 11.12 $ 7.19 $ 9.47 $ 11.26 $ 21.68
Total return* ...................................................................................... 54.74% (22.76)% (11.49)% (47.03)% (20.27)%
Ratios/Supplemental Data:Net assets, end of year (in 000's) ...................................................... $ 33,841 $ 24,750 $ 38,177 $ 52,231 $ 125,286Ratio of expenses to average net assets ........................................... 2.66% 2.59% 2.39% 2.22% 1.99%Ratio of net investment loss to average net assets ........................... (2.07)% (1.51)% (1.34)% (0.85)% (1.04)%Portfolio turnover rate ....................................................................... 11% 11% 5% 8% 1%
* Assumes no sales charge1 Based on average shares method.2 Amount represents less than $0.01 per share.
OCM GOLD FUNDFinancial Highlights Investor Class

– 24 –See notes to financial statements.
Year Ended
Nov. 30, 2016
Year Ended
Nov. 30, 2015
Year Ended
Nov. 30, 2014
Year Ended
Nov. 30, 2013
Year Ended
Nov. 30, 2012
Per Share Operating Performance(For a share outstanding throughout each period)
Net asset value, beginning of period ................................................. $ 7.46 $ 9.76 $ 11.49 $ 22.00 $ 28.74
Income from Investment Operations:Net investment income loss .............................................................. (0.18)1 (0.09)1 (0.09)1 (0.08) (0.12)Net realized and unrealized gain/(loss) on investments and
foreign currency transactions ....................................................... 4.31 (2.06) (1.20) (10.03) (5.54)Total from investment operations ...................................................... 4.13 (2.15) (1.29) (10.11) (5.66)
Less Distributions:Dividends from net investment income ............................................. — — — — —Distribution from net realized gains .................................................. —2 (0.16) (0.45) (0.40) (1.08)Total distributions .............................................................................. — (0.16) (0.45) (0.40) (1.08)
Redemption fee proceeds ................................................................ 0.04 0.01 0.01 —2 —2
Net asset value, end of period ......................................................... $ 11.63 $ 7.46 $ 9.76 $ 11.49 $ 22.00
Total return ........................................................................................ 55.98% (22.28)% (10.74)% (46.75)% (19.83)%
Ratios/Supplemental Data:Net assets, end of year (in 000's) ...................................................... $ 9,467 $ 19,040 $ 16,970 $ 12,005 $ 17,322Ratio of expenses to average net assets ........................................... 2.03% 2.01% 1.79% 1.69% 1.48%Ratio of net investment loss to average net assets ........................... (1.44)% (0.92)% (0.74)% (0.31)% (0.52)%Portfolio turnover rate ....................................................................... 11% 11% 5% 8% 1%
1 Based on average shares method.2 Amount represents less than $0.01 per share.
OCM GOLD FUNDFinancial Highlights Advisor Class

– 25 –
OCM GOLD FUNDReport of Independent Registered Public Accounting Firm
To the Shareholders and Board of Trustees of OCM Gold Fund:
We have audited the accompanying statement of assets and liabilities, including the schedule of investments, of OCM Gold Fund (the “Fund”), as of November 30, 2016, and the related statement of operations for the year then ended, the statements of changes in net assets for each of the two years in the period then ended, and the financial highlights for each of the five years in the period then ended. These financial statements and financial highlights are the responsibility of the Fund’s management. Our responsibility is to express an opinion on these financial statements and financial highlights based on our audits.
We conducted our audits in accordance with the standards of the Public Company Accounting Oversight Board (United States). Those standards require that we plan and perform the audit to obtain reasonable assurance about whether the financial statements and financial highlights are free of material misstatement. The Fund is not required to have, nor were we engaged to perform, an audit of its internal control over financial reporting. Our audits included consideration of internal control over financial reporting as a basis for designing audit procedures that are appropriate in the circumstances, but not for the purpose of expressing an opinion on the effectiveness of the Fund’s internal control over financial reporting. Accordingly, we express no such opinion. An audit also includes examining, on a test basis, evidence supporting the amounts and disclosures in the financial statements, assessing the accounting principles used and significant estimates made by management, as well as evaluating the overall financial statement presentation. Our procedures included confirmation of securities owned as of November 30, 2016, by correspondence with the custodian and brokers. We believe that our audits provide a reasonable basis for our opinion.
In our opinion, the financial statements and financial highlights referred to above present fairly, in all material respects, the financial position of the Fund as of November 30, 2016, the results of its operations for the year then ended, the changes in its net assets for each of the two years in the period then ended, and the financial highlights for each of the five years in the period then ended, in conformity with accounting principles generally accepted in the United States of America.
Milwaukee, Wisconsin January 27, 2017

– 26 –
As a shareholder of the OCM Gold Fund (the “Fund”), you incur two types of costs: (1) transaction costs, including sales charges (loads) on purchase payments and redemption fees on certain redemptions; and (2) ongoing costs, including management fees; distribution (12b-1) fees; and other Fund expenses. This Example is intended to help you understand your ongoing costs (in dollars) of investing in the Fund and to compare these costs with the ongoing costs of investing in other mutual funds.
The Example is based on an investment of $1,000 invested at the beginning of the period and held for the entire period from June 1, 2016 to November 30, 2016 (the “period”).
Actual ExpensesThe row titled “Actual” in the table below provides information about actual account values and actual
expenses. You may use this information, together with the amount you invested, to estimate the expenses you paid over the period. Simply divide your account value by $1,000 (for example, an $8,600 account value divided by $1,000 equals 8.6), then multiply the result by the number in the appropriate line for your share class under the heading entitled “Expenses Paid During the Period” to estimate the expenses you paid on your account during the periods.
Hypothetical Example for Comparison PurposesThe row titled “Hypothetical” in the table below provides information about hypothetical account values and
hypothetical expenses based on each class’ actual expense ratio and an assumed rate of return of 5% per year before expenses, which is not each class’ actual return. The hypothetical account values and expenses may not be used to estimate the actual ending account balance or expenses you paid for the period. You may use this information to compare the ongoing costs of investing in the classes of the Fund and other funds. To do so, compare these 5% hypothetical examples with the 5% hypothetical examples that appear in the shareholder reports of other funds.
Please note that the expenses shown in the table are meant to highlight your ongoing costs only and do not reflect any transactional costs, such as sales charges (loads) and redemption fees. Therefore, the hypothetical lines of the table are useful in comparing the ongoing costs only, and will not help you determine the relative total costs of owning different funds. In addition, if these transactional costs were included, your costs could have been higher.
OCM GOLD FUNDExpense Example – For the Period Ended November 30, 2016
(Unaudited)

– 27 –
Expenses Paid During the Period
Beginning Account Value June 1, 2016
Ending Account Value
November 30, 2016
Expenses Paid During the
Period Ended November 30, 2016*
Investor ClassActual ........................................................................ $ 1,000.00 $ 959.40 $ 12.37Hypothetical (5% return before expenses) ............... 1,000.00 1,012.37 12.71
Advisor Class Actual ........................................................................ 1,000.00 963.50 9.41Hypothetical (5% return before expenses) ............... 1,000.00 1,015.42 9.65
* Expenses are equal to the Investor Class’ and Advisor Class’ annualized expense ratios of 2.53% and 1.92%, respectively, for the period, multiplied by the average account value over the period, multiplied by 183/366 (to reflect the one-half year period).
OCM GOLD FUNDExpense Example – For the Period Ended November 30, 2016 (Continued)
(Unaudited)

– 28 –
Investments by Sector – As of November 30, 2016 As a Percentage of Total Investments
Primary Silver Producers
6.4%
Royalty/StreamingCompanies
15.7%
Junior Gold Producers
14.2%
Intermediate/Mid-Tier Gold
Producers12.2%
Exploration andDevelopmentCompanies
9.7%Major GoldProducers
37.5%
ExchangeTraded Fund
4.3%
The Fund will file its complete schedule of investments with the Securities and Exchange Commission (SEC) for the first and third quarters of each fiscal year on Form N-Q. The Fund's Forms N-Q will be available on the EDGAR database on the SEC's website at http://www.sec.gov. These Forms may also be reviewed and copied at the SEC's Public Reference Room in Washington, D.C. Information about the operation of the Public Reference Room may be obtained by calling 1-800-SEC-0330.
A description of the Fund's proxy voting policies and procedures and a record of the Fund's proxy votes for the year ended June 30, 2016 are available without charge, upon request by calling toll free 1-800-779-4681 and on the SEC's website at http://www.sec.gov. The Fund's proxy voting policies and procedures are also available on the Fund's website at http://www.ocmgoldfund.com.
OCM GOLD FUNDOther Information
(Unaudited)

– 29 –
Average Annual Total Returns
Investor Class S&P 500® IndexPhiladelphia
Gold & Silver Index
1 year ............................................................................... 47.75% 8.06% 73.92%5 year ............................................................................... (15.66%) 14.45% (16.31%)10 year ............................................................................. (2.43%) 6.89% (4.94%)
The graph below compares the change in value of a $10,000 investment in the Investor Class of the OCM Gold Fund with the S&P 500® Index and the Philadelphia Gold and Silver Index since November 30, 2006.
$0
$5,000
$10,000
$15,000
$20,000
11/3
0/16
11/3
0/06
11/3
0/07
11/3
0/08
11/3
0/09
11/3
0/10
11/3
0/11
11/3
0/12
11/3
0/13
11/3
0/14
11/3
0/15
$7,821
$19,462
OCM Gold Fund - Investor Class - $7,821
$6,026
S&P 500® Index - $19,462Philadelphia Gold & Silver Index - $6,026
The returns shown include the reinvestment of all dividends and the maximum sales load charge, but do not reflect the deduction of taxes that a shareholder would pay on fund distributions or the redemption of fund shares. Past performance is not indicative of future results.
The Philadelphia Gold and Silver Index (XAU) is an unmanaged capitilization-weighted index composed of 16 companies listed on U.S. exchanges involved in the gold and silver mining industry. The index is generally considered as representative of the gold and silver share market.
The S&P 500® Index is a broad unmanaged index generally considered as representative of the U.S. equity market.
OCM GOLD FUND - INVESTOR CLASSPerformance Results – Year Ended November 30, 2016
(Unaudited)

– 30 –
Average Annual Total Returns
Advisor Class S&P 500® IndexPhiladelphia
Gold & Silver Index
1 year ............................................................................... 55.98% 8.06% 73.92%5 year ............................................................................... (14.31%) 14.45% (16.31%)Since Inception on 4/1/10 ............................................... (6.25%) 12.29% (9.12%)
The graph below compares the change in value of a $10,000 investment in the Advisor Class of the OCM Gold Fund with the S&P 500® Index and the Philadelphia Gold and Silver Index since April 1, 2010 (inception date of Advisor Class).
$0
$5,000
$10,000
$15,000
$20,000
$25,000
11/3
0/16
4/1/
10
$6,504
$21,667
OCM Gold Fund - Advisor Class - $6,504
$5,284
S&P 500® Index - $21,667Philadelphia Gold & Silver Index - $5,284
11/3
0/10
11/3
0/11
11/3
0/12
11/3
0/13
11/3
0/14
11/3
0/15
The returns shown include the reinvestment of all dividends, but do not reflect the deduction of taxes that a shareholder would pay on fund distributions or the redemption of fund shares. Past performance is not indicative of future results.
The Philadelphia Gold and Silver Index (XAU) is an unmanaged capitilization-weighted index composed of 16 companies listed on U.S. exchanges involved in the gold and silver mining industry. The index is generally considered as representative of the gold and silver share market.
The S&P 500® Index is a broad unmanaged index generally considered as representative of the U.S. equity market.
OCM GOLD FUND - ADVISOR CLASSPerformance Results – Period Ended November 30, 2016
(Unaudited)

– 31 –
On October 18, 2016, the Board of Trustees of OCM Mutual Fund approved the continuation of the Fund’s investment advisory agreement with Orrell Capital Management, Inc. (the “Adviser”). Prior to approving the continuation of the agreement, the Board considered:
• the nature, extent and quality of the services provided by the Adviser
• the investment performance of the Fund
• the costs of the services to be provided and profits to be realized by the Adviser from its relationship with the Fund
• the extent to which economies of scale would be realized as the Fund grows and whether fee levels reflect those economies of scale
• the expense ratio of the Fund
All of the factors discussed by the Trustees were considered as a whole, and were considered separately by the Trustees who are not “interested persons” of the Trust (the “Independent Trustees”), meeting in executive session. The factors were viewed in their totality by the Trustees, with no single factor being the principal or determinative factor in the Trustees’ determination of whether to approve the continuation of the investment advisory agreement. The Trustees recognized that the management and fee arrangements for the Fund are the result of years of review and discussion between the Independent Trustees and the Adviser, that certain aspects of such arrangements may receive greater scrutiny in some years than in others and that the Trustees’ conclusions may be based, in part, on their consideration of these same arrangements and information received during the course of the year and in prior years.
The material considerations and determinations of the Board, including all of the Independent Trustees, are provided below.
In considering the nature, extent and quality of the services provided by the Adviser, the Board considered an oral presentation by the Adviser describing the portfolio management, shareholder communication, and regulatory compliance services provided by the Adviser to the Fund. Based on their review, the Trustees believe that the Adviser provides high quality services to the Fund, and they noted that their overall confidence in the Adviser is high. The Trustees also concluded that they were satisfied with the nature, extent and quality of the investment advisory services provided to the Fund by the Adviser, and that the nature and extent of the services provided by the Adviser are appropriate to ensure that the Fund’s operations are conducted in compliance with applicable laws, rules and regulations.
OCM GOLD FUNDAnnual Renewal of Investment Advisory Agreement
(Unaudited)

– 32 –
The Trustees compared the performance of the Fund to benchmark indices over various periods of time. The Adviser provided information regarding and led discussions of factors impacting the performance of the Fund, outlining current market conditions and explaining the Adviser’s expectations and strategies for the future. Based on this information, the Trustees concluded, within the context of their full deliberations, that the investment results that the Adviser had been able to achieve for the Fund were sufficient to support renewal of the investment advisory agreement. The Trustees noted that the Fund adhered to its investment style.
In concluding that the advisory fees payable by the Fund were reasonable, the Trustees reviewed the profits realized by the Adviser, from its relationship with the Fund. They discussed in detail the profitability of the Adviser as it relates to the Fund, and they discussed the impact of the intermediary service fees on the profitability. The Trustees also considered the resources and revenues that the Adviser has put into managing and distributing the Fund, and concluded that the level of profitability realized by the Adviser from its provision of services to the Fund is reasonable, and that the overall expense ratio and investment advisory fee were fair and within the range of industry averages.
As part of its analysis the Board considered the value of the research the Adviser received from broker-dealers executing securities transactions for the Fund. The Trustees concluded that the research obtained by the Adviser is beneficial to the Fund and that the Adviser had executed the Fund’s portfolio transactions in a manner designed to obtain best execution for the Fund. The Trustees determined such research has been used for legitimate purposes relating to the Fund by providing assistance in the investment decision-making process. The Trustees concluded that the other benefits realized by the Adviser from its relationship with the Fund were reasonable.
The Trustees also reviewed reports comparing the expense ratios of each class and advisory fees paid by the Fund to those paid by other comparable mutual funds in the same category and concluded that the advisory fees paid by the Fund and the expense ratios of each class of the Fund were in the range of comparable mutual funds. In making this conclusion, the Trustees also noted the unique expertise of the Adviser and that the Adviser does not currently engage any sub-advisers for the Fund. The Trustees also discussed the advisory fees payable by the Fund in relation to other advisory clients of the Adviser.
The Trustees concluded that the Fund has the right structure in place to realize lower fees and expenses when asset levels increase. The Trustees also considered whether the investment advisory agreement fee schedule should be adjusted for an increase in assets under management. They concluded that the existing “breakpoints” embodied in the investment advisory agreement resulted in substantially lower fee rates than those of comparable mutual funds.
OCM GOLD FUNDAnnual Renewal of Investment Advisory Agreement (Continued)
(Unaudited)

– 33 –
After reviewing the materials provided at the meeting, management’s presentation, as well as other information regularly provided at the Board’s quarterly meetings throughout the year regarding the quality of services provided by the Adviser, the performance of the Fund, expense information, regulatory compliance issues, trading information and related matters and other factors deemed relevant by the Board, the Trustees, including all of the Independent Trustees, determined to continue the investment advisory agreement.
Long Term Capital Gains Designation (Unaudited)
Pursuant to IRC 852(b)(3) of the Internal Revenue Code OCM Gold Fund hereby designates $15,625 as long-term capital gains distributed during the year ended November 30, 2016.
OCM GOLD FUNDAnnual Renewal of Investment Advisory Agreement (Continued)
(Unaudited)

– 34 –
The business and affairs of the Funds are managed under the direction of the Board of Trustees. Information pertaining to the Trustees and Officers of the Fund is set forth below. The Fund’s Statement of Additional Information includes additional information about Trustees and is available, without charge, upon request by calling 1-800-779-4681.
Independent Trustees*
Name, Address and AgePosition(s)
Held with Fund
Term of Office and Length of Service
Principal Occupation(s) During Past 5 Years
Other Directorships
Held by Trustee or Nominee
for Trustee
John L. Crary 2600 Kitty Hawk Road, Suite 119 Livermore, California 94551 Age 63
Trustee (Chairman of the
Board)
Indefinite Since 2004
Since 1999 Mr. Crary has been the managing member of Crary Enterprises, LLC, a private investment company. Since 1988 Mr. Crary has been an independent corporate financial advisor and private investor in various biotechnology, software and other early stage business ventures. Mr. Crary began his business career as an investment banker with E.F. Hutton & Company Inc.
Scheid Vineyards, Inc.
Doug Webenbauer 2600 Kitty Hawk Road, Suite 119 Livermore, California 94551 Age 56
Trustee Indefinite Since 2005
Controller of Comtel Systems Technology, Inc. communications and security installation and service provider, since 2016. Prior to that, Chief Financial Officer of M.E. Fox & Company, Inc., a beer distributor (1999 to 2016).
None
OCM GOLD FUNDTrustee and Officer Information
(Unaudited)
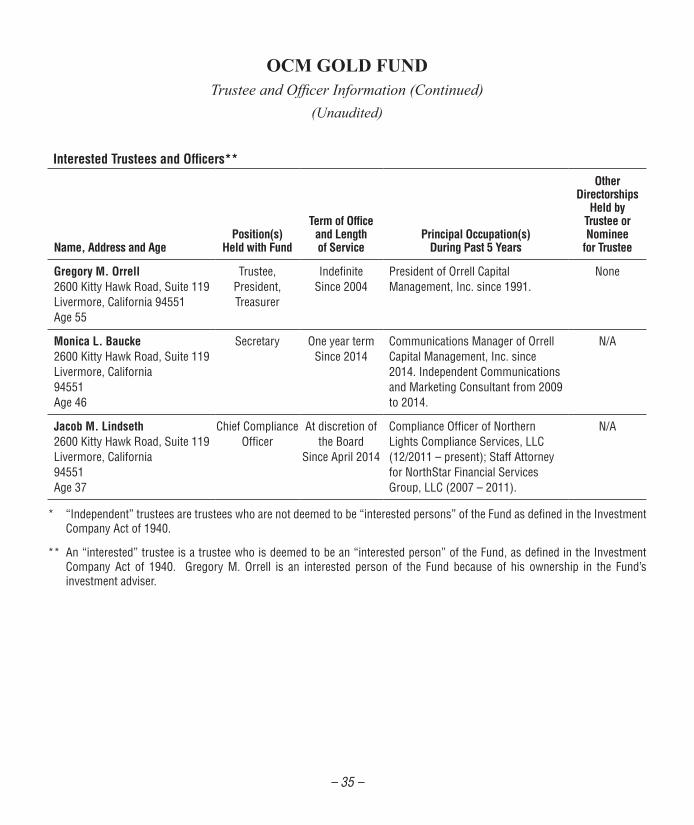
– 35 –
Interested Trustees and Officers**
Name, Address and AgePosition(s)
Held with Fund
Term of Office and Length of Service
Principal Occupation(s) During Past 5 Years
Other Directorships
Held by Trustee or Nominee
for Trustee
Gregory M. Orrell 2600 Kitty Hawk Road, Suite 119 Livermore, California 94551 Age 55
Trustee, President, Treasurer
Indefinite Since 2004
President of Orrell Capital Management, Inc. since 1991.
None
Monica L. Baucke 2600 Kitty Hawk Road, Suite 119 Livermore, California 94551 Age 46
Secretary One year term Since 2014
Communications Manager of Orrell Capital Management, Inc. since 2014. Independent Communications and Marketing Consultant from 2009 to 2014.
N/A
Jacob M. Lindseth 2600 Kitty Hawk Road, Suite 119 Livermore, California 94551 Age 37
Chief Compliance Officer
At discretion of the Board
Since April 2014
Compliance Officer of Northern Lights Compliance Services, LLC (12/2011 – present); Staff Attorney for NorthStar Financial Services Group, LLC (2007 – 2011).
N/A
* “Independent” trustees are trustees who are not deemed to be “interested persons” of the Fund as defined in the Investment Company Act of 1940.
** An “interested” trustee is a trustee who is deemed to be an “interested person” of the Fund, as defined in the Investment Company Act of 1940. Gregory M. Orrell is an interested person of the Fund because of his ownership in the Fund’s investment adviser.
OCM GOLD FUNDTrustee and Officer Information (Continued)
(Unaudited)

THIS PAGE INTENTIONALLY LEFT BLANK

THIS PAGE INTENTIONALLY LEFT BLANK

OCM Gold Fund Distributed by:
Northern Lights Distributors, LLC 17605 Wright Street Omaha, NE 68130
5069-NLD-01/24/2017