annual report on curriculum, instruction, and student ... report on curriculum, instruction, and...
TRANSCRIPT
Annual Report on Curriculum,
Instruction, and Student Achievement
Canby Public Schools, ISD 891
Systems Accountability
Approved September 18, 2017
2016-2017

2
An Overview of the Report on Curriculum, Instruction,
and Student Achievement
The annual report on curriculum, instruction, and student achievement,
or the Systems Accountability Report (SAR), is the community’s
opportunity to review Canby School District’s progress as we
continuously strive toward the goal of
high student achievement.
This report contains our students’
achievement scores on standardized
tests, parent survey results, general
information about the district and its
Systems Accountability Committee, and
a summary of the goals developed to serve our students.
Parents, guardians, and community members are invited to stay
connected to our students and our district now and in the future
through school involvement in any capacity available.
3
An Overview of Systems Accountability
The Canby Systems Accountability and Staff Development Committee is
an advisory committee of teachers, staff, parents, and community
members that has the overall goal of improving curriculum and
academic instruction.
The Canby Systems Accountability and Staff Development Committee
meets the first Friday of the month at 7:30 a.m. and alternates sites
between the Canby Elementary School and the Canby High School.
Current members of the Canby Systems Accountability and Staff
Development Committee include:
School Board Member: Kari Harding
Elementary Staff: Kevin Hansen, Amy Drietz, Allyson Pesek
High School Staff: Jennifer Ufkin, Barb Antony, Laurie Kallhoff
Special Education: Melanie Gohring
Paraprofessional: Sara Wollum
Administration: Ryan Nielsen, Dr. Robert Slaba, Ryan Arndt
The Canby Systems Accountability and Staff Development Committee
are always looking for community members interested in joining the
committee. If you would like more information or would like to join
this committee, please contact Canby Superintendent, Ryan Nielsen, at
507-223-2001.

4
District 891 Communities and Schools
Independent School District 891 serves approximately 500 students in
grades PreK-Grade 12. District 891 serves the communities of Canby,
Porter, St. Leo, and Taunton. Many students open enroll from outside
the Canby School District as well into District 891. The school district
has one elementary building and one high school building located in
Canby. Other academic programs offered in the Canby School District
include Early Childhood Family Education, Early Childhood Special
Education, and Adult Basic
Education.
District 891 School Board
Minnesota public schools
operate for the residents of a
school district under the
guidance of a district’s school board. In District 891, there are six
elected members on the school board who represent the public.
Members of the school board develop policy, which is then carried out
by the district’s administration and staff.
Current Canby School Board Members are: Greg Pederson, Brenda Full,
Alan Saltee, Kari Harding, Laurie Driessen, and Nathan Thorpe.

5
District 891 Education Goals
Philosophy of our School We will attempt to create and conduct activities that will promote
optimum growth in all academic areas, and permit students to gain
their highest level of accomplishment within each of their own physical
and mental limitations. We also believe that our educational program
should prepare each student for the privileges and responsibilities of
our democratic society.
Educational Goals In order to achieve this philosophy, the Canby School Board of
Independent School District #891 has adopted the following district-
wide curriculum goals. This is a condensation and summary of
Educational Goals established as early as 1982.
1. BASIC SKILLS - The K-12 curriculum should emphasize the
development of basic skills in reading, writing, speaking, and
listening. This requires a basic foundation in communications,
mathematics, science, and social science for all students.
2. PERSONAL DEVELOPMENT - Individual student needs and the
development of a set of basic values should be a necessary focus.
This requires learning activities such as feelings of self-worth, self-
respect, good character, pride in work, and respect for others with
whom they live and work.
3. EXPANDED SKILLS in GENERAL EDUCATION - Basic skills are to be
expanded to include wider applications of the minimal levels
indicated under basic skills programs. [This should allow for broader
programs aimed at the Gifted Learner in its broadest sense.]

6
4. CAREERS & VOCATIONS - The K-12 program must prepare students
for adult life, along with its privileges and responsibilities. This
requires:
(a) the ability to find information and use resources, such as counseling, in relation to the field of work and careers; and,
(b) the development of the skills to select career paths compatible
with their abilities and interests.
5. INSTRUCTION - In teaching skills, the student's thought process
should be foremost with constant emphasis being placed on the
student's strong and inherent desire to learn and to make sense of
his/her environment.
6. MEDIA/INFORMATION TECHNOLOGY - The K-12 curriculum for students will include the essential Media/Information Technology to ensure that each student acquires the skills necessary to become a self-reliant, lifelong learner. Therefore, the student will have equal and timely access to all forms of information and technology.

7
Staff Development and Student Achievement Goals
Canby Public Schools prides itself on academic excellence and
opportunities for its students. The teacher is an extremely important
variable in the achievement and success of students’ academic success.
The continual improvement in instructional practices is vital to the
overall success of the students. Below are the district’s staff
development goals for the 2016-2017 school year to guide the process
of increasing student achievement.
Canby Public Schools District Staff Development Goal:
Continue to provide staff development opportunities throughout
the year that will allow staff to assist students in meeting and
exceeding challenging state academic standards.
Canby Public Schools Staff Development Goal:
Continue to provide staff development opportunities throughout
the year that will allow staff to help meet and exceed challenging
state academic standards
The High School and Elementary testing goals were combined and
now states: To stay at or increase the state’s percentages in the
areas of math, reading, and science. Also to push students to the
next level on MCA scores.

8
District 891 Curriculum Review Cycle
Canby Public Schools has a 6-year curriculum review cycle. This cycle designates that the following occur within each year for certain curriculum areas. Each curriculum area has a place within each year of the cycle.
Canby Curriculum Review Cycle
YEAR 1: Instructional materials are evaluated and selected for the program to be implemented.
YEAR 2: Subject area learner outcomes and changes (such as new curriculum materials) are implemented.
YEAR 3: Subject area departments review learner outcomes and assess the impact on student performance.
YEAR 4: The research cycle recycles. Data is collected and shared within the department. YEAR 5: Subject areas researched and Learner Outcomes written. YEAR 6: The subject area is tested and evaluated.
Year 1
Year 2 Year 3 Year 4 Year 5 Year 6
Review, Report, Order
Implement Implement Recycle Learner Outcomes
Evaluate
13
14
Science Music
Reading Lang. Arts
Reading Lang. Arts
Art PE/HE Social St.
Math World Lang.
Vocational Math
14
15
Vocational Math
Science Music
Reading Lang. Arts
Reading Lang. Arts
Art PE/HE Social St.
Math World Lang.
15
16
Math World Lang.
Vocational Math
Science Music
Reading Lang. Arts
Reading Lang. Arts
Art PE/HE Social St.
16
17
Art PE/HE Social St.
Math World Lang.
Vocational Math
Science Music
Reading Lang. Arts
Reading Lang. Arts
17
18
Reading Lang. Arts
Art PE/HE Social St.
Math World Lang.
Vocational Math
Science Music
Reading Lang. Arts
18
19
Reading Lang. Arts
Reading Lang. Arts
Art PE/HE Social St.
Math World Lang.
Vocational Math
Science Music
9
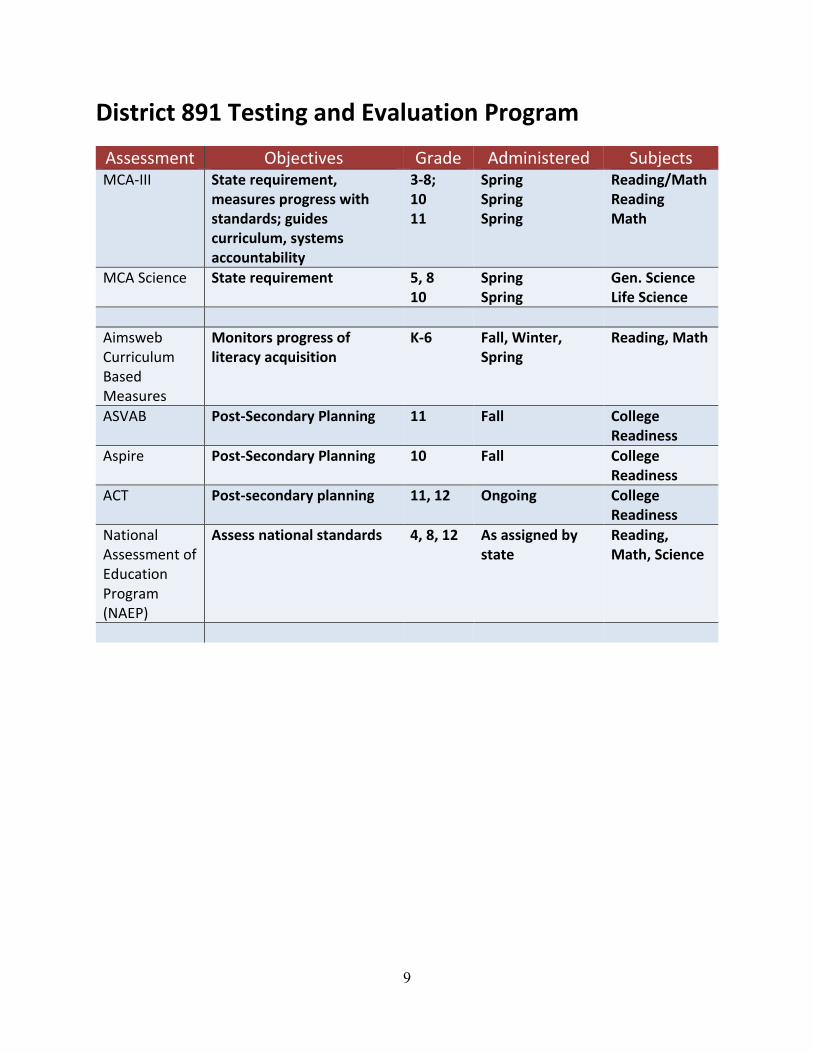
District 891 Testing and Evaluation Program
Assessment Objectives Grade Administered Subjects MCA-III State requirement,
measures progress with standards; guides curriculum, systems accountability
3-8; 10 11
Spring Spring Spring
Reading/Math Reading Math
MCA Science State requirement 5, 8 10
Spring Spring
Gen. Science Life Science
Aimsweb Curriculum Based Measures
Monitors progress of literacy acquisition
K-6 Fall, Winter, Spring
Reading, Math
ASVAB Post-Secondary Planning 11 Fall College Readiness
Aspire Post-Secondary Planning 10 Fall College Readiness
ACT Post-secondary planning 11, 12 Ongoing College Readiness
National Assessment of Education Program (NAEP)
Assess national standards 4, 8, 12 As assigned by state
Reading, Math, Science

10
District 891 Graduation Requirements
To be eligible for graduation from Canby High School, a student must
earn a total of 28 credits for the graduation class of 2017. Graduates
beyond the class of 2017, a student must earn 27 credits.
COURSE and CREDIT REQUIREMENTS: Students graduating from high
school must meet the following minimum requirements:
For the classes of 2017 and beyond:
a. 4 credits in Language Arts (one credit each year, grades 9-12) b. 3.5 credits in Social Studies (one credit each year, grades 9-12) c. 3 credits of Math: Algebra I, Geometry, and Algebra II d. 3 credits of Science e. 1 credit of Physical Education/Health f. 1 credit of Fine Art g. 1/2 credit in Computer Skills h. 12 Electives for the class of 2017; 11 Electives for classes after
2017

11
District 891 Adequate Yearly Progress Results
Adequate Yearly Progress or AYP is a measure of student achievement
required by the federal government as part of the “No Child Left
Behind” Act. School districts are designated as making AYP based on
meeting benchmark scores on reading and math assessment tests. In
Minnesota the tests that are used are called the Minnesota
Comprehensive Assessments or MCA-III. School districts that have
been designated as “Not Making AYP” have not met those benchmark
scores in specific categories. With the Adoption of the Every Student
Succeeds Act (ESSA) there isn’t an AYP Calculation done for the 2016-
2017 school year
Adequate Yearly Progress (AYP) for a
district is determined by aggregating the
results of academic achievement
measures in reading and math, student
participation rates in these assessments, graduation rates, and
attendance rates. Sometimes subgroups that are tested are not large
enough to meet the minimum group size at an individual school level.
However, when all of the data is compiled into one district level report,
the numbers may qualify the district as not making AYP.
12
Multiple Measurement System Summary
Multiple Measurement System Summary
Each Multiple Measurement domain has common summary components that are averaged to create the Multiple Measurement Rating for a school. Summary numbers for number of students (n-counts), raw numbers and final MMR points are shown below. If a school does not qualify for any one domain, the Multiple Measurement Rating is determined using
available information. Further domain detail is available in the charts below. With the
Adoption of the Every Student Succeeds Act (ESSA) there isn’t an MMR
Calculation done for the 2016-2017 school year
District 891 MCA-III Results
Standardized testing is the method used for measuring the
success of a district regarding state and federal requirements. The
Minnesota Comprehensive Assessments-III were developed by the
state and assists school districts in measuring progress toward meeting
the standards set for each grade level. MCA-III reading tests are
administered in grades 3 through 8 and grade 10. MCA-III math tests
are given in grades 3 through 8 and grade 11. Students are assigned
one of four proficiency categories based on test performance: exceeds,
meets, partially meets, or does not meet standards.

13
MCA-III Math-District Comparison with State of Minnesota Proficiency Percentages by Grade Level
Grade Year Entity Exceeds Meets Partially Meets
Does Not Meet
03
2017 Canby 23.5 56.9 11.8 7.8
State of MN 29.0 39.1 16.5 15.5
2016 Canby 43.8 40.6 12.5 3.1
State of MN 30.0 39.4 16.0 14.6
2015 Canby 30.3 51.5 12.1 6.1
State of MN 31.1 39.8 15.4 13.7
Grade Year Entity Exceeds Meets Partially Meets
Does Not Meet
04
2017 Canby 57.9 26.3 10.5 5.3
State of MN 32.7 34.0 15.0 18.3
2016 Canby 74.3 17.1 5.7 2.9
State of MN 34.9 33.8 14.6 16.7
2015 Canby 45.7 48.6 5.7 0.0
State of MN 35.6 34.4 14.5 15.5
Grade Year Entity Exceeds Meets Partially Meets
Does Not Meet
05
2017 Canby 37.8 51.4 10.8 0.0
State of MN 19.7 37.4 22.4 20.5
2016 Canby 24.2 45.5 27.3 3.0
State of MN 20.3 38.5 22.1 19.0
2015 Canby 22.7 56.8 18.2 2.3
State of MN 21 38.7 22.3 18.1
Grade Year Entity Exceeds Meets Partially Meets
Does Not Meet
06
2017 Canby 42.9 40.0 17.1 0.0
State of MN 23.8 31.4 21.6 23.1
2016 Canby 50.0 39.1 8.7 2.2
State of MN 24.0 31.9 21.2 22.9
2015 Canby 53.6 39.3 3.6 3.6
State of MN 24 33.6 21.1 21.2

14
MCA-III Math-District Comparison with State of Minnesota Proficiency Percentages by Grade Level
Grade Year Entity Exceeds Meets Partially Meets
Does Not Meet
07
2017 Canby 20.8 50.9 20.8 7.5
State of MN 22.3 32.6 25.2 19.9
2016 Canby 25.7 42.9 17.1 14.3
State of MN 22.7 33.5 25.3 18.5
2015 Canby 16.7 52.8 27.8 2.8
State of MN 21.5 33.6 26.0 18.8
Grade Year Entity Exceeds Meets Partially Meets
Does Not Meet
08
2017 Canby 7.9 55.3 23.7 13.2
State of MN 27.4 30.6 21.2 20.8
2016 Canby 13.9 58.3 16.7 11.1
State of MN 27.0 31.0 21.4 20.6
2015 Canby 21.7 39.1 23.9 15.2
State of MN 26.8 31.0 22.0 20.2
Grade Year Entity Exceeds Meets Partially Meets
Does Not Meet
11
2017 Canby 0.0 30.6 28.6 40.8
State of MN 18.1 30.2 22.0 29.7
2016 Canby 8.1 32.4 37.8 21.6
State of MN 17.3 29.7 23.1 29.8
2015 Canby 6.7 33.3 35.6 24.4
State of MN 17.9 30.8 22.5 28.8

15
MCA-III Reading-District Comparison with State of Minnesota Proficiency Percentages by Grade Level
Grade Year Entity Exceeds Meets Partially Meets
Does Not Meet
03
2017 Canby 13.7 45.1 27.5 13.7
State of MN 14.5 42.0 16.6 26.8
2016 Canby 15.6 56.3 21.9 6.3
State of MN 15.3 42.0 15.9 26.8
2015 Canby 6.1 60.6 18.2 15.2
State of MN 15.5 43.2 15.4 25.8
Grade Year Entity Exceeds Meets Partially Meets
Does Not Meet
04
2017 Canby 31.6 47.4 15.8 5.3
State of MN 16.8 40.0 20.8 22.4
2016 Canby 31.4 51.4 8.6 8.6
State of MN 18.2 40.1 20.3 21.4
2015 Canby 5.7 68.6 20.0 5.7
State of MN 17.6 40.3 21.0 21.1
Grade Year Entity Exceeds Meets Partially Meets
Does Not Meet
05
2017 Canby 29.7 54.1 8.1 8.1
State of MN 21.2 46.3 17.2 15.3
2016 Canby 18.2 57.6 18.2 6.1
State of MN 20.6 47.1 17.7 14.6
2015 Canby 14.3 69.0 14.3 2.4
State of MN 20.4 46.3 18.7 14.6
Grade Year Entity Exceeds Meets Partially Meets
Does Not Meet
06
2017 Canby 17.1 62.9 17.1 2.9
State of MN 25.4 38.0 17.5 19.1
2016 Canby 37.0 52.2 8.7 2.2
State of MN 25.7 36.6 17.1 20.6
2015 Canby 32.1 60.7 7.1 0.0
State of MN 25.4 38.4 16.8 19.4

16
MCA-III Reading-District Comparison with State of Minnesota Proficiency Percentages by Grade Level
Grade Year Entity Exceeds Meets Partially Meets
Does Not Meet
07
2017 Canby 13.2 54.7 24.5 7.5
State of MN 17.3 40.2 19.8 22.7
2016 Canby 14.3 57.1 11.4 17.1
State of MN 16.8 39.8 20.0 23.4
2015 Canby 8.3 58.3 22.2 11.1
State of MN 17.4 38.2 20.1 24.3
Grade Year Entity Exceeds Meets Partially Meets
Does Not Meet
08
2017 Canby 7.9 47.4 21.1 23.7
State of MN 20.7 38.0 18.9 22.4
2016 Canby 13.9 47.2 30.6 8.3
State of MN 20.2 36.9 19.3 23.6
2015 Canby 30.4 30.4 21.7 17.4
State of MN 19.8 36.2 18.8 25.2
Grade Year Entity Exceeds Meets Partially Meets
Does Not Meet
10
2017 Canby 22.9 39.6 14.6 22.9
State of MN 22.4 37.9 20.3 19.4
2016 Canby 15.9 38.6 31.8 13.6
State of MN 21.5 37.4 21.4 19.7
2015 Canby 14.3 40.0 28.6 17.1
State of MN 20.8 36.2 21.0 22.0
17
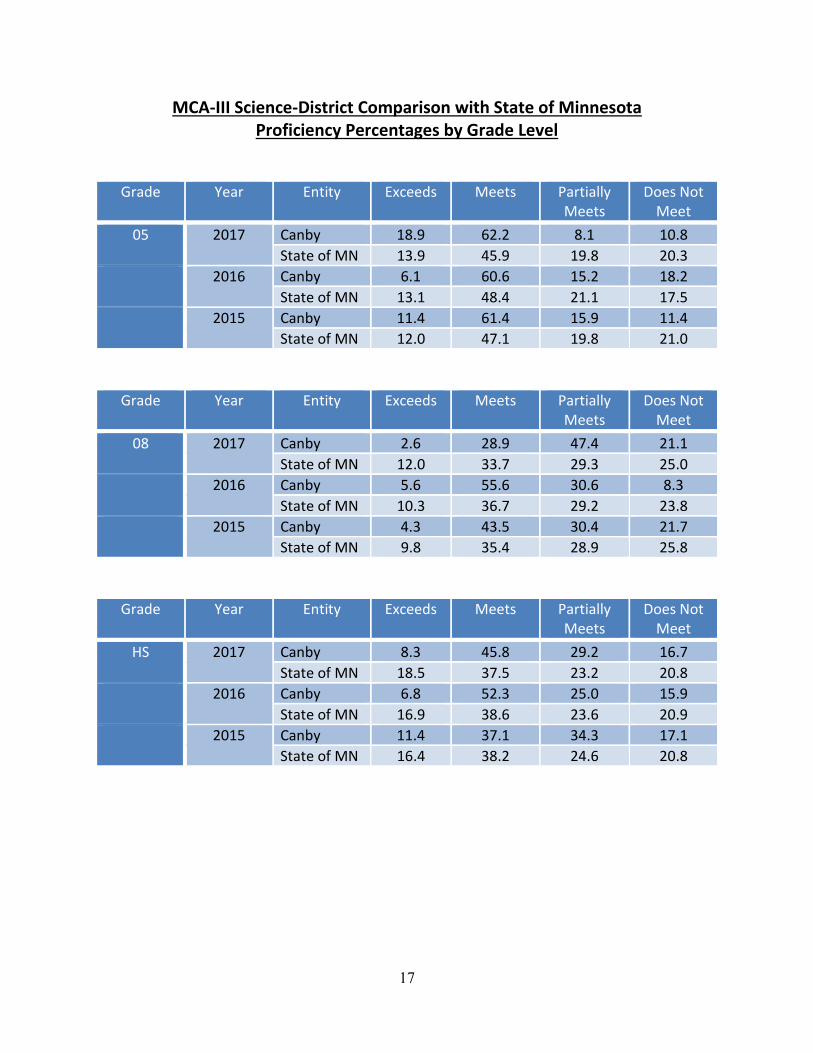
MCA-III Science-District Comparison with State of Minnesota Proficiency Percentages by Grade Level
Grade Year Entity Exceeds Meets Partially Meets
Does Not Meet
05
2017 Canby 18.9 62.2 8.1 10.8
State of MN 13.9 45.9 19.8 20.3
2016 Canby 6.1 60.6 15.2 18.2
State of MN 13.1 48.4 21.1 17.5
2015 Canby 11.4 61.4 15.9 11.4
State of MN 12.0 47.1 19.8 21.0
Grade Year Entity Exceeds Meets Partially Meets
Does Not Meet
08
2017 Canby 2.6 28.9 47.4 21.1
State of MN 12.0 33.7 29.3 25.0
2016 Canby 5.6 55.6 30.6 8.3
State of MN 10.3 36.7 29.2 23.8
2015 Canby 4.3 43.5 30.4 21.7
State of MN 9.8 35.4 28.9 25.8
Grade Year Entity Exceeds Meets Partially Meets
Does Not Meet
HS
2017 Canby 8.3 45.8 29.2 16.7
State of MN 18.5 37.5 23.2 20.8
2016 Canby 6.8 52.3 25.0 15.9
State of MN 16.9 38.6 23.6 20.9
2015 Canby 11.4 37.1 34.3 17.1
State of MN 16.4 38.2 24.6 20.8

18
District 891 Aspire Results for 2016-2017
ACT Aspire test was given to all seventh and tenth grade students in
November 2016. The test was administered online. The Aspire test
replaced the Explore and Plan tests previously given. The Aspire test is
linked to ACT College Readiness Benchmarks and aligned with the
Common Core State Standards.
The Aspire test is anchored by the capstone college readiness
assessment. The Aspire test has the following subject areas:
English, math, reading, science, and writing.
REPORTING
In addition to subject scores, there are reporting categories based on
the ACT College and Career Readiness Standards and aligned to the
other sets of college and career readiness standards being used by
states (of which the Common Core State Standards are one).
SCORING
College-Career-Readiness Act-Aspire results are reported on a 3-digit
score scale. Aspire test results also report an “ACT Readiness
Benchmark” for English, reading, writing, math and science at each
grade level to provide additional perspectives on student readiness.
The following chart depicts Canby Public School vs. the National Norm
Group that is at or above the ACT Readiness Benchmark. The National
Average is the mean score of all students in the norm group for the
grade and subject shown.
19
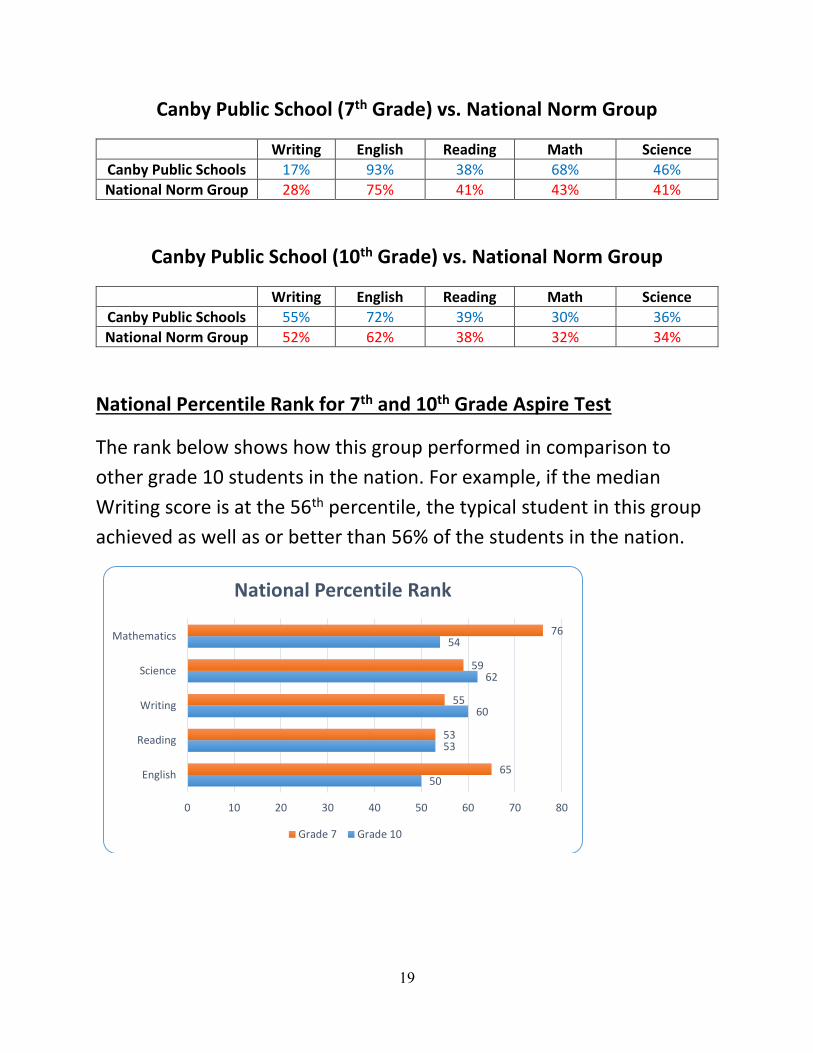
Canby Public School (7th Grade) vs. National Norm Group
Writing English Reading Math Science
Canby Public Schools 17% 93% 38% 68% 46%
National Norm Group 28% 75% 41% 43% 41%
Canby Public School (10th Grade) vs. National Norm Group
Writing English Reading Math Science
Canby Public Schools 55% 72% 39% 30% 36%
National Norm Group 52% 62% 38% 32% 34%
National Percentile Rank for 7th and 10th Grade Aspire Test
The rank below shows how this group performed in comparison to
other grade 10 students in the nation. For example, if the median
Writing score is at the 56th percentile, the typical student in this group
achieved as well as or better than 56% of the students in the nation.
50
53
60
62
54
65
53
55
59
76
0 10 20 30 40 50 60 70 80
English
Reading
Writing
Science
Mathematics
National Percentile Rank
Grade 7 Grade 10

20
District 891 ACT Results for 2017
2011 AMERICAN COLLEGE TESTING (ACT) SCORE RESULTS & FIVE YEAR SUMMARY The ACT Assessment is designed for students who plan to attend a university, junior college, and some two-year colleges. The test focuses on a recommended course of study consisting of four years of English, three years of Math, three years of Social Studies and three years of Natural Science. The following chart illustrates the average ACT scores achieved by all Canby students who took the test, not just students who followed a core college preparatory curriculum. Canby results are compared to students testing statewide. The definition of Core classes is: four years English, three years Math, three years of Social Studies and three years Natural Science. These scores illustrate results from the graduated Senior Classes, of which, their last ACT test score is used in the data, not their best test score.
Average ACT DISTRICT VS. STATE VS. NATIONAL Scores for all students tested
GRAD YR English Math Reading
Canby State Canby State Canby State
2017 19.4 20.4 20.4 21.5 21.6 21.8
2016 19.2 20.0 20.1 21.2 20.3 21.3
2015 20.1 21.8 21.5 22.8 21.8 23.0
2014 19.4 22.1 20.2 23.0 20.5 23.1
2013 22.4 22.2 22.3 23.1 23.2 23.1
2012 20.0 22.1 19.5 23.0 20.7 22.9
2011 19.7 22.3 20.3 23.0 20.7 22.9
2010 21.1 22.3 21.1 22.9 21.9 22.9
2009 19.9 22.0 20.9 22.7 21.5 23.1
GRAD YR Science Composite
Canby State Canby State
2017 22.0 21.6 21.0 21.5
2016 21.2 21.3 20.3 21.1
2015 22.8 22.7 21.6 22.7
2014 21.0 22.9 20.4 22.9
2013 23.1 22.9 22.9 23.0
2012 21.6 22.7 20.6 22.8
2011 20.2 22.8 20.3 22.9
2010 22.8 22.8 21.9 22.9
2009 21.5 22.6 21.0 22.7
**Note: The ACT High School Profile report has changed. This report no longer reports State or National Core and Less Than Core Composite Score Data.

21
District 891 Parent Survey Results
Canby Elementary Parent Survey Results Rating Scale: 1=Strongly Disagree; 2=Disagree; 3=Neutral; 4= Agree; 5=Strongly Agree
1. I am well informed about my child’s progress. 4.28 out of 5.0
2. My child is making academic progress. 4.33 out of 5.0
3. My child understands his/her responsibilities at Canby Elementary. 4.38 out of 5.0
4. I believe that my child has the opportunity to learn in a variety of ways. 4.20 out of 5.0
5. My child is given sufficient opportunities to use technology. 4.11 out of 5.0
6. The school has a friendly and warm atmosphere. 4.32 out of 5.0
7. My child feels comfortable asking the school staff for help. 4.21 out of 5.0
8. My child takes responsibility for his/her own homework and class assignments. 4.23 out of 5.0
9. I feel comfortable communicating with my child’s teacher or teachers. 4.55 out of 5.0
10.Our school is doing an excellent job teaching:
a. Reading 4.27 out of 5.0
b. Writing 4.24 out of 5.0
c. Math 4.17 out of 5.0
d. Science 4.11 out of 5.0
e. Social Studies 4.10 out of 5.0
f. Music 4.33 out of 5.0
g. Physical Education 3.84 out of 5.0
h. Technology 4.06 out of 5.0
11. The Accelerated Reader programs help my child practice reading fluently and with understanding.
4.15 out of 5.0
12. Our school’s discipline policies are fair and effective. 4.07 out of 5.0
13. Our school provides students and teachers with a safe and orderly environment.
3.98 out of 5.0

22
14. Teachers and administrators at our school demonstrate genuine concern for the well-being of students.
4.37 out of 5.0
15. As a parent, I receive information I need about the school’s programs and activities.
4.33 out of 5.0
16. Over the last year I have seen improvements in my school that benefit my student.
4.37 out of 5.0
17. I use the school’s online resources. 3.94 out of 5.0
23
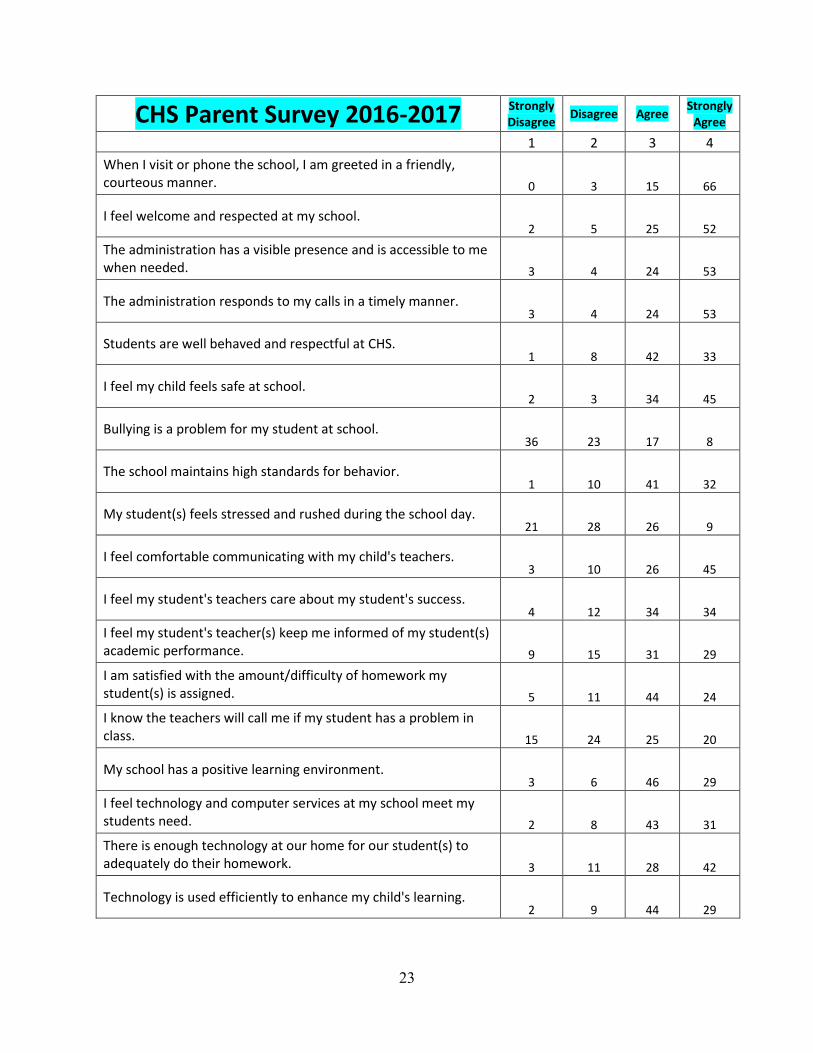
CHS Parent Survey 2016-2017 Strongly Disagree
Disagree Agree Strongly
Agree
1 2 3 4
When I visit or phone the school, I am greeted in a friendly, courteous manner. 0 3 15 66
I feel welcome and respected at my school. 2 5 25 52
The administration has a visible presence and is accessible to me when needed. 3 4 24 53
The administration responds to my calls in a timely manner. 3 4 24 53
Students are well behaved and respectful at CHS. 1 8 42 33
I feel my child feels safe at school. 2 3 34 45
Bullying is a problem for my student at school. 36 23 17 8
The school maintains high standards for behavior. 1 10 41 32
My student(s) feels stressed and rushed during the school day. 21 28 26 9
I feel comfortable communicating with my child's teachers. 3 10 26 45
I feel my student's teachers care about my student's success. 4 12 34 34
I feel my student's teacher(s) keep me informed of my student(s) academic performance. 9 15 31 29
I am satisfied with the amount/difficulty of homework my student(s) is assigned. 5 11 44 24
I know the teachers will call me if my student has a problem in class. 15 24 25 20
My school has a positive learning environment. 3 6 46 29
I feel technology and computer services at my school meet my students need. 2 8 43 31
There is enough technology at our home for our student(s) to adequately do their homework. 3 11 28 42
Technology is used efficiently to enhance my child's learning. 2 9 44 29

24
CHS Parent Survey 2016-2017 Strongly Disagree
Disagree Agree Strongly
Agree
I feel my student(s) receive enough information regarding career and college options. 6 24 34 20
My school keeps me well-informed of activities through emails, announcements, parent portal, etc. 2 11 34 37
I am satisfied with the number and variety of after school activities (clubs/sports/fine arts) offered at CHS. 2 1 35 46
I utilize Canby High Schools JMC On-line parent/student information system. 3 8 18 55