annual report - s22.q4cdn.com
TRANSCRIPT

1 Good Energy Annual Report 2020
Climate change is our responsibilityLet’s keep the world our home
Annual Report& accounts
2020
2 Good Energy Annual Report 2020
Contents
Strategic ReportWhy we exist: Let’s keep the world our home 4
How we achieve our purpose: Powering a cleaner, greener future together 14
What we do to achieve our purpose: Empowering you to use, share, generate and store clean energy 36
Governance ReportBoard of Directors 54
Governance & Directors’ Report 56
Audit & Risk Report 67
Remuneration & Nomination Report 71
Independent Auditors’ Report 86
Financial StatementsConsolidated Statement of Comprehensive Income 100
Consolidated Statement of Financial Position 102
Parent Company Statement of Financial Position 104
Consolidated Statement of Changes in Equity 106
Parent Company Statement of Changes in Equity 108
Consolidated Statement of Cash Flows 109
Parent Company Statement of Cash Flows 110
Notes to the Financial Statements 111
1Contents
Annual Report & Accounts 2020
Why we exist: Let’s keep the world our home
Our purpose and manifesto 05
Sustainable development goals 06
2020 achievements 08
Chairman’s statement 10
Chief Executive Officer’s review 12
How we achieve our purpose: Powering a cleaner, greener future together
Strategic review 16
In Focus: Mobility & EV 19
The business model 23
Key performance indicators 24
Operating review 26
Key risks 28
Chief financial officer’s review 32
What we do to achieve our purpose: Empowering you to use, share, generate and store clean energy
Engaging with our community 38
Our response to COVID-19 41
Innovating to achieve net-zero 42
Our environmental impact 44
Our social impact 48
Our people 50
Strategic report
Good Energy Annual Report 20202 3Contents

Our manifesto
We believe that everyone deserves a future on our home planet. Swimming in our rivers, walking in the forest or simply breathing clean air should always be an option; for us, for our children and for their children.
We know that to keep the planet our home we have to get to 100% renewable energy. So that’s what we are working towards every single day.
We exist to give you the ability to generate your own power, not just buy ours. No one owns the sunshine, the wind or the rain, so let’s share it.
Our goal is to turn every home and business into its own clean power station. Get your clean energy from families and businesses in your local community. Power generated by people like you, for people like you.
We believe that we all have our part to play. We do ours not only by empowering you to buy and share clean energy but also by investing in clean technologies.
We must be bold, stand up and take action to tackle climate change. We are more powerful together with our customers, generators, shareholders, partners and people. We invite you to stand up with us.
Our purpose
Climate change is our responsibility, let’s keep the world our home.
Strategic report 5
Why we exist: Let’s keep the world our home
Good Energy Annual Report 20204
Foreword from our CEO and Founder, Juliet DavenportIn February 2020 Prime Minister Boris Johnson joined environmentalist David Attenborough on stage at the Science Museum to declare a ‘year of climate action’. This would culminate with COP26, the UN’s climate conference, which was scheduled to be hosted in Glasgow in November.
Just a couple of weeks after Johnson’s climate commitment, environmental activist Greta Thunberg came to Bristol. The city is only a short train ride from our offices, so we told everyone at Good Energy that they could take the once in a lifetime opportunity to march alongside her. I am proud to say that Good Energy was a loud and visible presence alongside Greta and the 30,000 activists calling for leaders like the PM to put words into action on climate.
Then like so much in 2020, COVID-19 disrupted plans, derailing COP26. It was postponed to 2021.
2020 became the year of COVID-19, rather than climate action. For Good Energy’s part I am proud of how we were able to respond, switching rapidly to remote working and developing new policies to support our people. We remained committed to our purpose, perhaps stronger than ever in our resolve. Many examples of which are detailed in this report.
It has been a time of anguish and pain for many, but one with some silver, or indeed green, linings too. Climate change may not have been number one on any government’s agenda, but as soon as there was discussion about recovery from the pandemic, the focus was on green recovery.
Today we are still battling the pandemic. But there is widespread public support for climate action and we are beginning to see positive policies coming from government on things like support for offshore wind and a 2030 cut-off for sales of petrol and diesel cars.
I cannot help the feeling of déjà vu when I say, we have COP26 to look forward to this November. It is difficult to say what the conference will look like, but it remains the UK’s opportunity to show leadership on climate action to a global audience.
It feels like we may have reasons to be hopeful for action on climate change, and this only makes Good Energy’s purpose more relevant than ever.
Juliet Davenport

Sustainable Development Goals
Sustainability is why we’re in businessSustainability is a broad term, but it captures the need to protect and preserve our planet.
The UN’s Sustainable Development Goals (SDGs) provide a strong framework and guide for businesses to work towards. These 17 goals range across environmental and social factors, from protecting life on land to ending hunger.
Good Energy is a member of the UN Global Compact, the world’s largest corporate sustainability initiative, founded to encourage businesses to support the SDGs. Our business has two of the goals at its heart:
Affordable & clean energy (Goal 7)Our unique model has remained unchanged for over 20 years: support the growth of independent, renewable generation in the UK. This means we offer our community of over 1,600 generators a fair price for their power and a route to market for small clean energy projects. Our customers, employees, and investors are given an opportunity to support this model and be part of the solution to the climate crisis.
Climate action (Goal 13)Good Energy was set up to tackle climate change, and this defining global challenge continues to inform how we operate as a company. Our financial decisions; new customer propositions; or policy and regulatory positions, are based on this starting point.
Financial Statements
Governance Report
Strategic Report
Strategic report 76 Good Energy Annual Report 2020

8 Good Energy Annual Report 2020 9Strategic Report
Strategic ReportG
overnance ReportFinancial Statem
ents
2020 AchievementsGood Energy maintained a resilient financial performance despite the ongoing impact of COVID-19. The foundations are now in place for the company and its stakeholders to benefit from new energy services. Here are some of the highlights of our year:
Invested in our peopleFrom clean energy awareness courses to the Signature Skills programme, which enables all employees to develop and practice personal leadership skills.
Strategic partnerships and time of use tariff for EV driversAnnounced a ToU tariff and new partnerships in electric mobility, helping drive a cleaner greener future for transport.
Zap-Map and Zap-PayGood Energy converted its initial investment in Zap-Map into a majority 50.1% equity stake. Zap-Pay was also launched, enabling EV drivers to use the app to pay for charging across different networks.
Investment in technologyDomestic customers migrated to the Kraken customer services platform and business customers are migrating to the ENSEK platform, which will enable us to better serve them with new products and services.
Lower operating expenditureWhich allowed us to minimise outflow in times of uncertainty during the pandemic, and build for a more sustainable and efficient future.
Strong cash balanceFinancial and operational resilience provided us with the flexibility against significant market volatility.
Workplace and workforceWe have quickly adapted to remote working in response to the pandemic as well as adapting our office to make it Covid secure, with learnings paving the way for a more flexible future operating model.
‘Outstanding’ Best Companies accreditationAwarded the gold standard for workplace engagement, based entirely on feedback of employees.
Increased digital salesOnline sales increased 90% and marketing spend decreased by 25% year on year.
Heat pump tariffUK’s first ever heat pump tariff released, called ‘Green Heat’.
Revaluation of the generation assets portfolioDelivered a net £16m uplift to asset values, and an increase in non-distributable reserves resulting in gearing decline from 68.6% to 51.6%.
Strong cash collectionsDespite Covid, business cash collections and billing rates improved, and domestic cash collections were maintained and we remain highly cash generative.

10 Good Energy Annual Report 2020
Strategic ReportG
overnance ReportFinancial Statem
ents
11Strategic Report
Chairman’s statement
“We have continued to make excellent progress in building our position within the new world of energy as a service, including successfully implementing new customer technology platforms for domestic and business customers. ”
In 2020 we witnessed one of the most tumultuous years in recent history, with the onset of a global pandemic and national lockdowns. Against this backdrop, I am incredibly proud of the resilience shown by all our colleagues in adapting so effectively to new working conditions at all levels within our organisation. Regardless of this challenging environment we had another good year of progress, as we delivered on key projects and milestones which will enable growth in 2021. Our strong cash performance in the year reflects that we remain well positioned both financially and operationally. Despite being prudent on cost control, we were still able to make tangible investments in our future strategy, progressing in our transition towards technology enabled energy services for the generation, supply and sharing of 100% renewable power for all. Our market: opportunities and challengesIn 2019, I said that the UK economy remained buoyant but highly sensitive due to the ongoing uncertainty caused by Brexit negotiations and macroeconomic volatility. It transpired that 2020 was a year unlike any we had ever witnessed. The COVID-19 pandemic caused national lockdowns across the world, severely impacting economies. The UK economy took its biggest hit since the second world war, causing the UK Government to take unprecedented action to limit the impact on UK businesses and workers through the furlough scheme and other job retention and stimulus packages. As a business, we have proven that our financial and operational resilience allowed us to react to these market challenges. We remain highly cash generative and have seen improvements in cash collection and billing rates in 2020. While we have obviously seen an impact from COVID, this impact has been limited compared to other companies in the market. We have made positive strides in addressing the changing nature of our industry, especially given the reduced consumption in business energy and a more volatile wholesale energy market. Strategic developmentsDespite COVID, we have not rested on our laurels in 2020. We have continued to make excellent progress in building our position within the new world of energy as a service, including successfully implementing new customer technology platforms for domestic and business customers. These platforms will enable us to operate more flexibly to deliver new, digitally focused products and services to customers at scale. We remain focused on technology, strategic partnerships and our people. Our investments in both Kraken and Zap-Map continue to progress and allow us to have the technological capabilities to play in the right markets and deliver our vision of a zero-carbon future.
Board updateIn February 2021 we announced that Juliet Davenport has decided to leave her role as CEO and take up a Non-Executive Director position with the business, as well as remaining Chair of subsidiary company, Zap-Map. This transition is part of the continuing evolution of Good Energy from its roots as a simple green energy provider to the new world of providing energy and mobility as a service. With Good Energy now well established as a leading renewable energy provider and following a period of significant internal investment and progress, Juliet has decided that now is the appropriate time to bring in a new CEO to take the business forward.
Juliet is a recognised and influential industry figure, and her ongoing commitment as a Non - Executive Director of Good Energy and Zap-Map will provide a strong platform to support both the Board and new CEO.
I would like to personally thank Juliet for her commitment over the past 20 years to Good Energy and celebrate her achievement of growing the business into what it has become today. Her experience and insights will continue to play an important role in both Good Energy and Zap-Map and I look forward to this next stage of the company’s growth. CEO appointmentIn April 2021 we announced the appointment of Nigel Pocklington as Chief Executive Officer. Nigel has strong, relevant, and current commercial experience at a senior executive level in a variety of global digital businesses, ranging from global e-commerce to financial technology.
Nigel most recently served as Chief Commercial Officer of Moneysupermarket.com Group plc. Prior to this, he held senior roles within Expedia Inc., including Chief Marketing Officer of Hotels.com. He spent a decade of his early career at Pearson plc, including a period leading the digital operations of the Financial Times. Nigel is also a Non-Executive Director for global digital transformation business Kin and Carta plc, where he chairs the Remuneration Committee and is a member of the Audit and Nomination Committees.
We are delighted to welcome Nigel as our new Chief Executive Officer. Following an extensive search and a thorough evaluation of high-quality candidates, we are confident that Nigel’s digital and transformation experience will be an asset to Good Energy in the next stage of the Group’s development.
Good energy bondsIn April 2021, we announced the successful restructuring of the financing on our renewable generation asset portfolio, which we undertook to consolidate and simplify funding facilities. Together with a strong net cash position, the restructuring gives us greater capital flexibility going forwards. More details are in the CFO review.
Longer term, the transaction also provides on-going improved visibility of cash flows and frees up future cash generated by the generation portfolio to be utilised by the Company.
The upfront cash provided, combined with existing strong levels of cash on the balance sheet, gives the Company the ability to wholly repay Good Energy Bonds II. It is anticipated that this will be completed during FY2022.
We recognise the importance of optimising our balance sheet, which this move allows us to do. We are in a strong position to continue making investments across the Group and consider all relevant funding sources when appropriate. Dividend Alongside our ongoing investments, we aim to deliver a progressive dividend policy. The policy has the objective of increasing the dividend over time as profitability grows to provide an appropriate return to shareholders. We remain mindful of maintaining and balancing the ability to invest in long term growth opportunities.
The Board recognises the importance of dividends to many shareholders, but it is important that we retain a prudent approach to balance sheet management at this stage. The Board has determined that due to the strong underlying performance of the business in 2020, and the continued improvement of macroeconomic conditions, that the dividend policy will resume in 2021.
Will WhitehornChairman

12 Good Energy Annual Report 2020
Strategic ReportG
overnance ReportFinancial Statem
ents
13Strategic Report
Financial Statements
Governance Report
Strategic Report
Continued green momentum despite COVID-19 and macroeconomic conditions Despite the continuing challenges presented by COVID-19, the desire for a green recovery and to Build Back Better continues to build. The concept of a green recovery has quickly gathered strong support from the business community. Tangible investments have already been made in schemes committed to low carbon homes, low carbon transport infrastructure and investments dedicated to supporting green innovation. Both corporations and investment and pension fund managers are increasingly considering environmental credentials as key requirements for potential investments.
Even with the pandemic, 2020 has been a seminal year for policy and investment decisions in green technology. The government set out their Ten Point Plan for a Green Industrial Revolution. Implementing this plan will mobilise £12 billion of government investment, and potentially three times as much from the private sector, to create and support up to 250,000 green jobs. The ambition is to turn the UK into the world’s number one centre for green technology and finance, laying the foundations for decades of economic growth by delivering net zero emissions in a way that creates jobs and allows us to carry on living our lives.
Focus has been put on developing offshore wind and electrifying transport and heat. The plans for transport include bringing the ban on petrol and diesel cars forward from 2040 to 2030; accelerating plans for EV charge points; providing grants and incentives; and mass production of EV batteries.
It may be too soon to talk about market recovery, but resilience and adaptability are key. With green recovery front of mind for climate conscious Brits, pressure from Ed Miliband to bring the Green recovery forward to align and prove it at COP26 in November 2021 and pressure on the UK to match President Biden’s clean energy goals to 2035, building back better could be a fantastic opportunity for hope and positive action following a challenging year Green accreditationIn March 2021, we became the first and only energy supplier to have our standard variable and fixed tariffs accredited as Uswitch Green Tariff Gold Standard. The comparison and switching service’s independent panel judged our electricity and gas tariffs to be ‘market leading in their environmental credentials’. This ‘first of its kind’ scheme from a comparison and switching site categorises green energy tariffs into Bronze, Silver and Gold, with Good Energy the only supplier so far awarded Gold.
Chief Executive Officer’s reviewMarket environmentA year like no other
2020 will go down as one of the most unique in our history as a nation. The impact of COVID-19 has been felt throughout society, from politics to the economy.
The retail and business supply markets in the first two months of 2020 aligned with expectations , and our underlying business performed strongly. However, from March, the breadth and depth of COVID–19 impacts began to be felt across the economy following the start of the first national lockdown. Business premises largely closed and employees shifted to a remote working model. We witnessed Business energy supply demand reduce by almost 35% during the first lockdown, compared to our expectations. We saw signs of recovery throughout the summer after the first lockdown eased in May. Despite a second national lockdown in the latter half of the year, the UK economy managed to avoid a contraction in the fourth quarter of 2020 as individuals and businesses were better prepared for the impact of a lockdown and remote working business models. Despite the adaptability of many UK businesses, the rolling lockdowns negatively impacted growth momentum and saw the economy contract by 9.9% overall in 2020.
Nevertheless, it is pleasing that despite these challenges, our business responded well and achieved a strong performance in context of the ‘new normal’.
The macroeconomic, consumer and competitive backdrop contain considerable uncertainties. A lockdown prolonged beyond the first quarter of 2021 will inevitably see GDP contract, although by much less than 2020. A rapid vaccine roll-out is now underway and expected to facilitate relatively strong growth from Q2 2021 onwards, whilst Brexit-related frictions are also expected to ease in the second half of the year.
Many economic forecasts continue to outline muted projections on growth and employment levels, given the ongoing global uncertainty surrounding the virus. However, as lockdowns ease, we are seeing energy demand starting to recover. Without a third wave, we expect this to continue back to more normalised levels. However, we remain aware that subsequent lockdowns are a possibility and could impact the energy sector in general.
“Despite the continuing challenges presented by COVID-19, the desire for a green recovery and to Build Back Better continues to build.”
The Uswitch Green Accreditation aims to provide transparency to customers looking to switch to a green tariff. Research from the comparison service found that whilst a third of households are now on a ‘green’ tariff, more than half (52%) of UK consumers are confused about what actually makes up the many ‘green’ deals on the market.
Criteria verified by an independent panel of experts require Gold standard tariffs to be backed with 100% renewable electricity purchased from renewable generators directly through Power Purchase Agreements, and 10% of gas from biogas producers. Good Energy, which is also rated ‘Excellent’ on customer service reviews site Trustpilot, was awarded the standard for all tariffs it submitted.
There are more than 6 million domestic energy customers who switch supplier every year, with the majority via switching and comparison sites. Uswitch is the most popular, receiving over 5 million visits per month.
This new accreditation is a watershed moment for transparency around green tariffs. For years now, energy suppliers have been able to mislead customers who are trying to do the right thing in choosing green. So it’s brilliant to see Uswitch take action, and do it in the right way by asking independent experts. We hope to see other comparison and switching services follow suit.
The UK cannot achieve net zero without bringing everyone along. Being dishonest with the very people trying to help is not the way to go about that. To build a greener future together, we have to give people the facts about the renewable choices they are making. As we build up to COP26 in the second half of 2021, decisions like this will only help to address the underlying issues we need to fix in the UK energy landscape.
Juliet DavenportFounder and Chief Executive Officer

How we achieve our purpose: Powering a cleaner, greener future together
Good Energy Annual Report 202014 15Strategic report
Strategic ReportG
overnance ReportFinancial Statem
ents
16 Good Energy Annual Report 2020
Strategic ReportG
overnance ReportFinancial Statem
ents
17Strategic Report
Smart meter rollout
The first COVID lockdown in March 2020 paused our smart meter rollout, as restrictions meant we were unable to visit customers’ homes to install meters. However, demand improved as lockdown restrictions eased, with installations restarting in July. Without further lockdowns, we expect to see this trend continue and installations are now back in line with our expectations.
Our ambition is to roll out 20,000 smart meters by the end of 2021. By the end of 2020 we had installed 5,100 smart meters. We expect installation numbers to increase throughout the year as lockdown restrictions ease. Not only do Smart meters help customers better understand their energy consumption and how to reduce it, but they are key to enabling products that will support the transition to net zero. Half hourly settlement, optimised time of use tariffs and flexibility services will all help customers play practical roles in creating a greener energy system.
Ensek business billing platform
In the second half of the year, we partnered with Ensek, one of the leading software suppliers to UK energy providers by moving our B2B supply customers onto their Ignition platform.
The move brings a more efficient digital service – enhancing customer experience and supporting the launch of new services. The platform enables us to serve everyone from small businesses to large industrial consumers with greater speed and accuracy.
Alongside Ensek comes a new B2B online account that allows customers to digitally self serve on a wide range of tasks, providing a simplified view of complex billing and pricing through to import and PPA. Ensek’s highly automated software-as-a-service platform gives us the flexibility to serve a large range of business customers more efficiently and better focus on their needs. The platform will support our growth plans by reducing the cost to serve and improving customer experience.
We have currently migrated over 80% of our business customers to the new platform and aim to fully transition all business customers by the end of Q2 2021.
Proposition development
Our ambition is to provide customers with the tools to achieve a zero-carbon footprint across electricity, transport and heat in both Business and Domestic settings.
• Electricity
Our aim is to provide electricity from renewable sources and support decentralised generation for homes and businesses. Alongside smart time
of use tariffs, we are continuing to develop our One Home proposition, which will incorporate FIT export rate (FER) and Smart export guarantee (SEG) tariffs supported by our GenEx SMART metering, bundled with a supply offering and the installation of EV charging hardware, solar panels and eventually storage solutions.
• Transport
We must support electric vehicle adoption and the electrification of infrastructure through providing homes and businesses with charging hardware and services. We continue to develop our mobility as a service solution, which positions Good Energy as one point of contact for supply, EV hardware and services that help businesses and consumers shift to EVs.
• Heat
Our focus is supporting the movement to electrified and renewable heating systems by providing access to heating care products and heat demand reduction technologies. In September we announced a new heat pump tariff, which generated positive demand. In 2021, we will roll out smart time of use tariffs for heat solutions and continue to evolve how we support the necessary societal shift away from gas heating.
We position ourselves as an expert able to help customers better understand and reduce their energy use. Providing accurate live data on device usage through consumer access devices and smart metering technology will empower customers to be part of the zero-carbon journey.
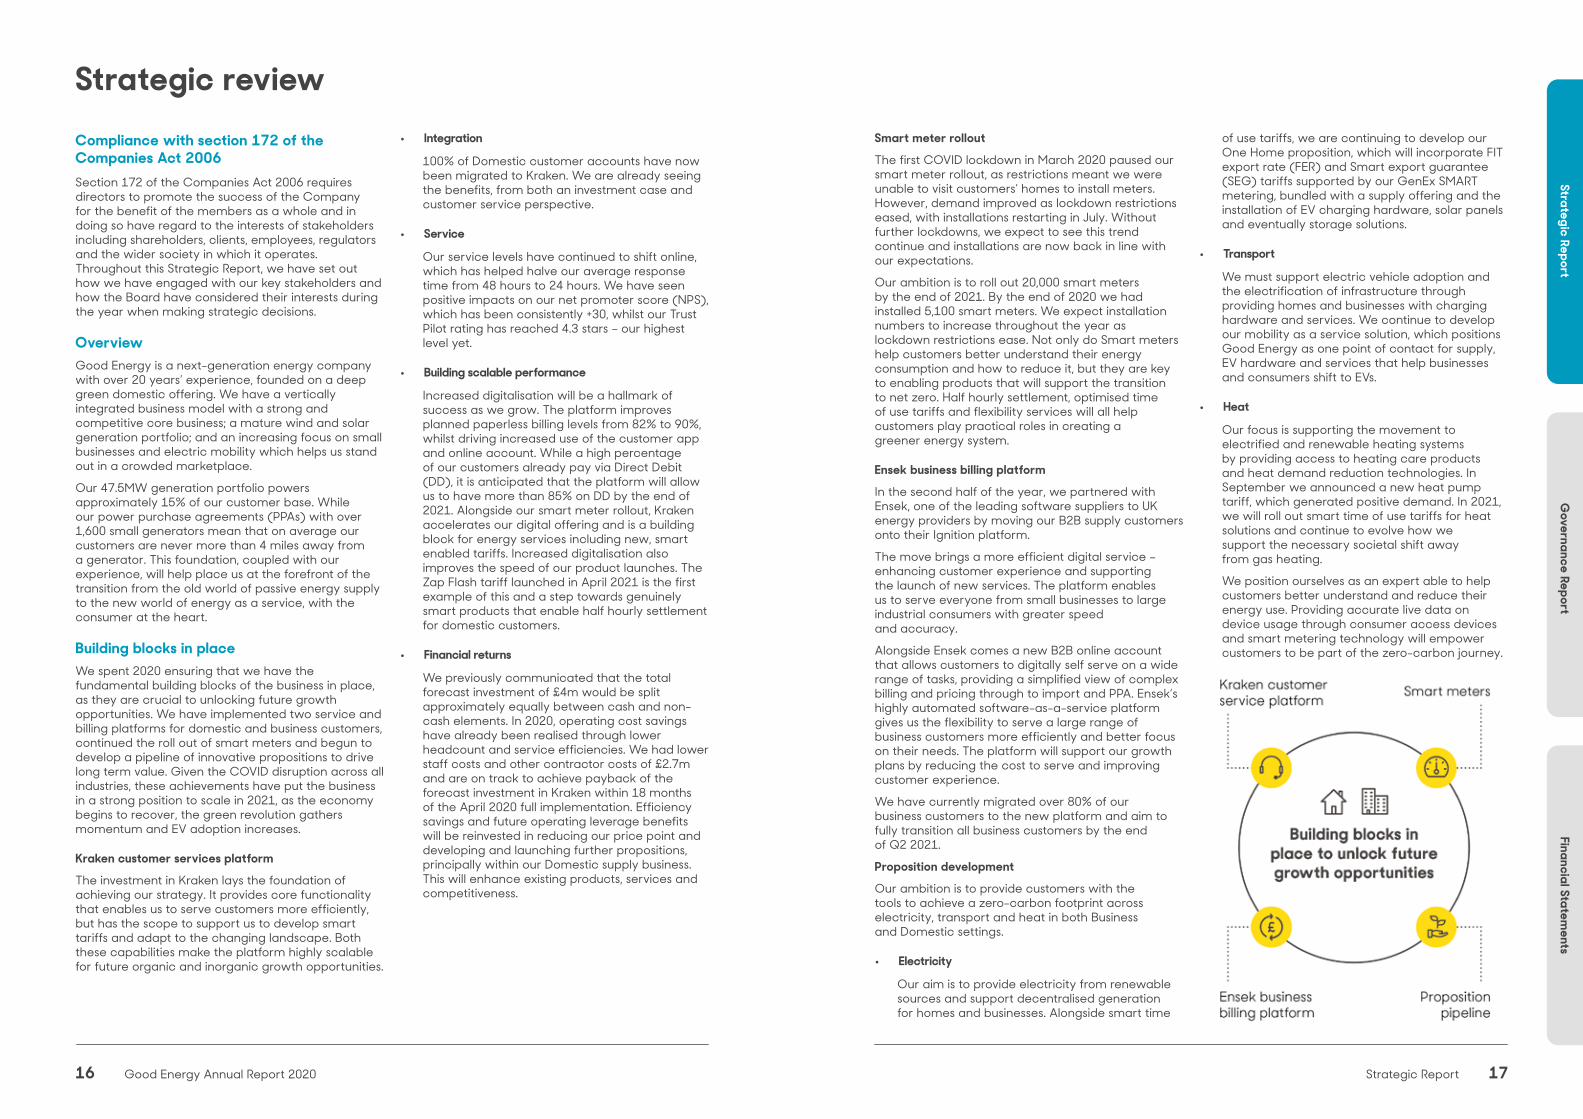
Strategic reviewCompliance with section 172 of the Companies Act 2006 Section 172 of the Companies Act 2006 requires directors to promote the success of the Company for the benefit of the members as a whole and in doing so have regard to the interests of stakeholders including shareholders, clients, employees, regulators and the wider society in which it operates. Throughout this Strategic Report, we have set out how we have engaged with our key stakeholders and how the Board have considered their interests during the year when making strategic decisions. OverviewGood Energy is a next-generation energy company with over 20 years’ experience, founded on a deep green domestic offering. We have a vertically integrated business model with a strong and competitive core business; a mature wind and solar generation portfolio; and an increasing focus on small businesses and electric mobility which helps us stand out in a crowded marketplace.
Our 47.5MW generation portfolio powers approximately 15% of our customer base. While our power purchase agreements (PPAs) with over 1,600 small generators mean that on average our customers are never more than 4 miles away from a generator. This foundation, coupled with our experience, will help place us at the forefront of the transition from the old world of passive energy supply to the new world of energy as a service, with the consumer at the heart. Building blocks in place We spent 2020 ensuring that we have the fundamental building blocks of the business in place, as they are crucial to unlocking future growth opportunities. We have implemented two service and billing platforms for domestic and business customers, continued the roll out of smart meters and begun to develop a pipeline of innovative propositions to drive long term value. Given the COVID disruption across all industries, these achievements have put the business in a strong position to scale in 2021, as the economy begins to recover, the green revolution gathers momentum and EV adoption increases.
Kraken customer services platform
The investment in Kraken lays the foundation of achieving our strategy. It provides core functionality that enables us to serve customers more efficiently, but has the scope to support us to develop smart tariffs and adapt to the changing landscape. Both these capabilities make the platform highly scalable for future organic and inorganic growth opportunities.
• Integration
100% of Domestic customer accounts have now been migrated to Kraken. We are already seeing the benefits, from both an investment case and customer service perspective.
• Service
Our service levels have continued to shift online, which has helped halve our average response time from 48 hours to 24 hours. We have seen positive impacts on our net promoter score (NPS), which has been consistently +30, whilst our Trust Pilot rating has reached 4.3 stars – our highest level yet.
• Building scalable performance
Increased digitalisation will be a hallmark of success as we grow. The platform improves planned paperless billing levels from 82% to 90%, whilst driving increased use of the customer app and online account. While a high percentage of our customers already pay via Direct Debit (DD), it is anticipated that the platform will allow us to have more than 85% on DD by the end of 2021. Alongside our smart meter rollout, Kraken accelerates our digital offering and is a building block for energy services including new, smart enabled tariffs. Increased digitalisation also improves the speed of our product launches. The Zap Flash tariff launched in April 2021 is the first example of this and a step towards genuinely smart products that enable half hourly settlement for domestic customers.
• Financial returns
We previously communicated that the total forecast investment of £4m would be split approximately equally between cash and non-cash elements. In 2020, operating cost savings have already been realised through lower headcount and service efficiencies. We had lower staff costs and other contractor costs of £2.7m and are on track to achieve payback of the forecast investment in Kraken within 18 months of the April 2020 full implementation. Efficiency savings and future operating leverage benefits will be reinvested in reducing our price point and developing and launching further propositions, principally within our Domestic supply business. This will enhance existing products, services and competitiveness.

18 Good Energy Annual Report 2020
Strategic ReportG
overnance ReportFinancial Statem
ents
19Strategic Report
In Focus: Mobility & EV Good Energy as an EV supply business The UK’s plans for decarbonisation as presented in the Prime Minister’s 10-point plan in November 2020 include the expectation that electricity demand will roughly double over the next 20 years, driven by increased demand resulting from electrification of heat and transport. Good Energy has a huge opportunity to address a completely new market – that of transportation. EV adoption is moving fast, with battery electric or hybrid vehicles making up more than 20% of new vehicle sales in the first months of 2021.
EV adoption will alter how consumers view mobility. The traditional vehicle-centric (petrol/diesel) system will be replaced by a more flexible, customer-centric (electric) system, where mobility as a service dominates. In this system, direct vehicle ownership declines and brands will serve customers that fall into three clear categories: direct vehicle ownership; decentralised or hybrid fleets; and traditional centralised fleets.
This shift to EV also means that every B2C and B2B electric mobility customer is also a potential electricity supply customer. Energy Retailers have typically focused less on B2B EV business models, creating a clear gap for us to lead the way. Focusing on B2B mobility customers fits with Good Energy’s strategy and creates an opportunity to scale our mobility platform, all while continuing to supply energy to both domestic and non-domestic customers. We can operate a B2B2C model which engages the business, fleet manager, vehicle drivers and employees.
EV market outlook
We are at the outset of a rapid uptake in EVs, with 91% of UK new car sales expected to be EV by 2030. Drivers for adoption include favourable regulation/policy, growing auto industry investment, increased EV model availability and continued infrastructure development. Declining battery manufacturing costs suggest that EV total cost of ownership (TCO) will compare favourably with internal combustion engines (ICE) by 2021-23 (varying by vehicle and use case), providing the tipping point for mass adoption by consumers and fleets.
EVs in use are expected to grow at ~47% CAGR through to 2026, as UK EV sales ramp-up prior to the announced 2030 ICE ban. Company owned EVs are expected to form a significant share of the early fleet as companies are disproportionately responsible for purchasing new vehicles (~60% of new car registrations today) and can take advantage of specific UK EV incentives (e.g. 0% BiK and 100% first year capital deductions).
Overall power demand from EVs is set to grow at a rate of 52% CAGR 2020-26, linked to EV parc growth, reaching nearly 14TWh of annual demand by 2026. B2B customer segments represent the largest share of power usage, reflecting the high proportion (and comparatively higher mileages) of company vehicles. This balance will shift more towards retail customers over time through increased used EV sales.
Future ecosystem
Future energy and mobility customer needs should merge to form an intricate ecosystem and unlock innovative ways to grow market share. It is uncertain how the EV market will develop over time, but we believe, as customers demand more flexibility over transport options, the mobility system will shift from vehicle-centric to customer-centric, whilst trusted relationships between customer and mobility providers will serve as a platform for players in the emerging EV value chain to centre themselves in the mobility market.
Energy suppliers, who already have strong capabilities in the highly regulated energy value chain, are ideally placed to enter this market. Placed at the heart of the future mobility eco system, suppliers can provide interconnected services spanning the four main mobility value chains: Energy, EV infrastructure, asset management/services and EVs.
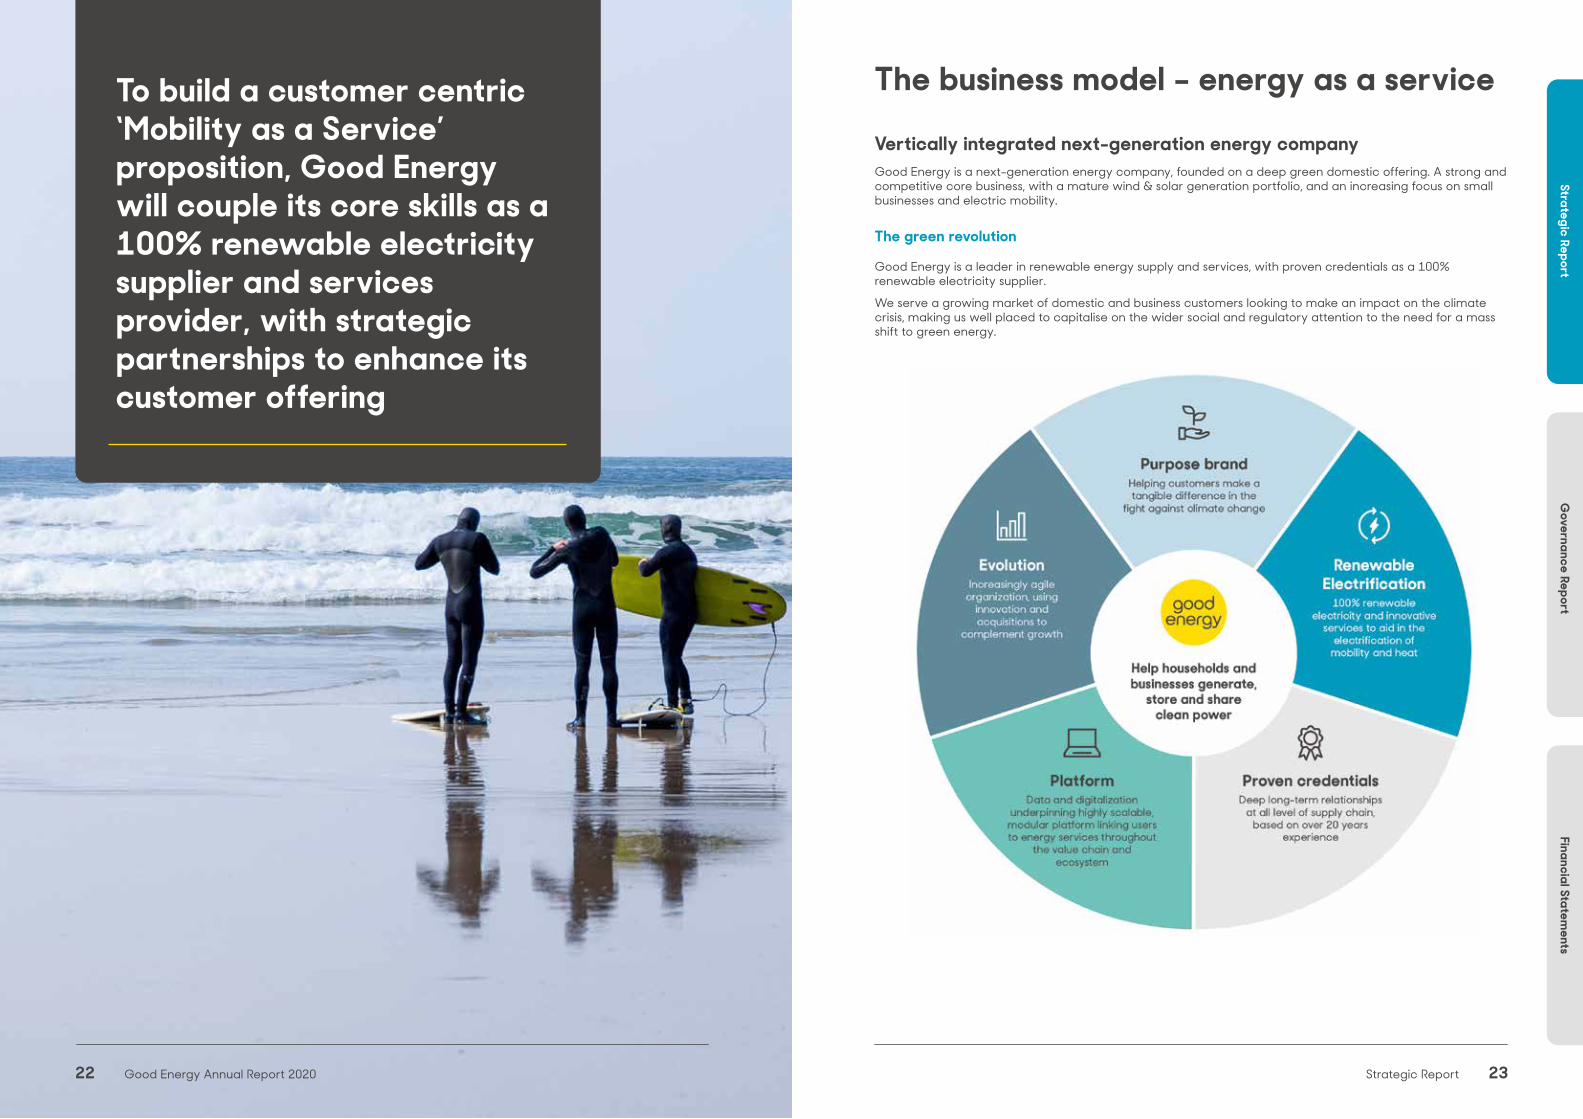
Energy as a serviceOur aim remains to help households and businesses generate, store and share clean power. We use our demonstrated expertise as a leader in 100% renewable electricity supply to create sustainable value for our stakeholders. Societal and regulatory changes are increasing green momentum, and a growing market of business and domestic customers want to reduce their environmental impact.
But as the energy sector moves rapidly from being about Megawatts to Megabytes, we recognise that it will be consumers who will be responsible for over 60% of the activities that will drive this change. Our business model has evolved to reflect this.
• Purpose brand: Helping customers make a tangible difference in the fight against climate change.
• Renewable electrification: 100% renewable electricity and innovative services to support the electrification of transport and heat.
• Proven credentials: Deep long-term relationships at all levels of energy supply chain, based on over 20 years’ experience.
• Data & digitalisation: Business underpinned by highly scalable, modular platform that links users to energy services throughout the value chain and ecosystem.
• Evolution: An increasingly agile organisation, using innovation and acquisitions to complement growth.
Scaling the business through innovationThis customer centric model is being applied to our mobility as a service offering, but can be replicated across heat, solar, storage and demand side flexibility to provide an innovative offering to a broad range of customers, in an ever-increasing market. Good Energy has the tools to replicate this offering in multiple verticals and solidify its place at the heart of the energy ecosystem.
Corporate development in this space will focus around understanding the right approach to building our own capabilities, investing in proven technologies and skills, or forming strategic partnerships to take advantage of growing markets.

20 Good Energy Annual Report 2020
Strategic ReportG
overnance ReportFinancial Statem
ents
21Strategic Report
Mobility as a service
To build a customer centric ‘Mobility as a Service’ proposition, Good Energy will couple its core skills as a 100% renewable electricity supplier and services provider, with strategic partnerships to enhance its customer offering.
In December 2020, we announced our first strategic partnerships with leading companies in the mobility space. We will continue to develop our EV services through internal development, partnerships and inorganic options.
Mina Energy
Mina’s innovative and unique technology solution helps make home charging simple and cost effective for fleets and their drivers. By integrating with drivers’ home charging infrastructure and energy providers, Mina supports fleets with paying for work vehicles charged from home.
Horizon Energy Infrastructure
Horizon provide specialist funding and partnership solutions to support the deployment of low carbon assets.
Horizon provides Good Energy customers with asset-backed funding for their charging infrastructure, which is a key financial service offered as part of Good Energy’s ‘One Point’ charging hardware solution.
Select Car Leasing
One of the UK’s largest independent car and van leasing specialists, Select works with manufacturers, large motor groups and key finance partners to offer competitive services for drivers and fleets.
Good Energy will be Select’s green energy partner, providing Select customers with smart, 100% renewable energy tariffs to assist them on their green journey.
Zap-Map: the UK’s leading EV mapping app
In 2019 we made a strategic investment for a majority share in the UK’s leading EV mapping service, as part of the development of GE’s own mobility propositions. This investment was predicated on the planned electrification of transport.
EV charging made simple
Zap-Map has established a position as the go-to brand in the UK EV app market. With a capital light model and technology agnostic digital platform, Zap focuses on three core areas in the EV industry:
• Mapping
The core of the platform is mapping of available EV charge points – essential for EV route planning.
• Payment
Zap-Pay enables in-app payment for using charge points operated by different providers, easing a pain point for current and future EV drivers.
• Data & insights
Zap-Map provides insights across the EV ecosystem to help futureproof new EV propositions, using over 10 years of unique data sets to help understand EV adoption and driver behaviours.
Zap-Map currently has over 95% of the UK’s public points on its network, with live dynamic data for over 70% of the UK EV charging network. It is the number one app used by EV drivers to locate chargers. Over 75% of UK EV drivers have downloaded Zap-Map, which has grown over 50% in 2020 in line with the UK EV market. With over 180k registered users, 140k cross platform users, 130k saved route plans and over 12k user comments per month, Zap-Map is securing its position as the voice of the EV driver, and an indispensable tool for new and existing drivers.
Despite positive performance in the year, it is unlikely that product or financial milestones per the initial investment agreement will be met in 2021, as a result of conscious scaling back of projects during the pandemic.
Commercial milestones
As the EV market grows, Zap is focused on providing further value across its core segments of mapping, payment and data services. Zap is in the very early stages of monetising these segments. These critical business milestones underpin investment strategy, driving customer loyalty and maintaining an engaged userbase, which is key to ensuring its growth.
‘Zap-Pay’, released by Zap-Map in September 2020, is a new service that enables EV drivers to use a single interoperable app to pay for public charging across different networks. This removes the challenge of having to navigate multiple payment systems, which is a barrier to EV adoption. Zap-Pay will be rolled out
across UK networks in 2021, providing unrivalled coverage across the country. Providing a seamless charging experience is crucial to mass adoption and this genuinely innovative service allows EV drivers to search, plan and pay all in one app. We continue to make good progress working with an increasing number of charge-point operators and will continue to grow the network of Zap-Pay enabled chargers.
The business continues to innovate and will be launching a new fleet payment solution, improved routing, and a ‘freemium’ subscription model of the app for both consumers and fleet users. In 2021, the business plans to invest to leverage its market leading position, commercialise existing products and services (Zap-Map and Zap-Pay) and cement itself as a leading player in the new and evolving EV market.
Commercial partnership with Fleetcor UK
As part of making charging simple for all EV drivers, Zap-Map have entered a heads of terms agreement with Fleetcor UK (part of Fleetcor, global business payments company) to integrate its Zap-Pay solution with the Allstar payment platform. This agreement aims to deliver a solution to remove payment complexities for businesses and commercial fleets.
As part of an on the road solution, the Allstar One Electric fuel card enables fleet operators to manage all fuel types, whether traditional (petrol or diesel) or an alternative such as electric, hydrogen or hybrid, on one payment card. Allstar has already partnered with nine leading EV charging providers, including Chargepoint services, ESB Energy, Engenie, and Source London, to create one of the largest multi-branded EV fuel networks in the UK. It now provides fleet operators and drivers with access to more than 4,277 charging points across 1,700 locations throughout the UK. Allstar is continually working to grow its electric charging network, easing access to charge points and reducing range anxiety.
Zap Flash tariff
Leveraging Zap’s market leading position in the EV industry, Zap and Good Energy have launched a new smart EV tariff, designed with input from Zap users. The tariff will allow EV drivers to be powered by 100% renewable electricity on an innovative time of use tariff from Good Energy.
By utilising smart meters, the tariff will provide weekly four-hour ‘flash’ windows of free electricity. The ‘flash’ windows are based on times of abundant renewable electricity and signalled to customers in advance, making it easier for customers to benefit from cost effective, greener EV charging.
Good Energy will use smart technology and its core capabilities as a renewable energy supplier, utilising Zap Map’s customer base as an effective route to market. Good Energy will be rolling out smart EV chargers and an updated app to work alongside this tariff. Whilst initially the tariff will be a beta, further evolutions should allow Good Energy to transition to more sophisticated smart tariffs and technology aimed at optimising energy consumption for customers.
22 Good Energy Annual Report 2020
Strategic ReportG
overnance ReportFinancial Statem
ents
23Strategic Report
The business model – energy as a service
Vertically integrated next-generation energy companyGood Energy is a next-generation energy company, founded on a deep green domestic offering. A strong and competitive core business, with a mature wind & solar generation portfolio, and an increasing focus on small businesses and electric mobility. The green revolution
Good Energy is a leader in renewable energy supply and services, with proven credentials as a 100% renewable electricity supplier.
We serve a growing market of domestic and business customers looking to make an impact on the climate crisis, making us well placed to capitalise on the wider social and regulatory attention to the need for a mass shift to green energy.
To build a customer centric ‘Mobility as a Service’ proposition, Good Energy will couple its core skills as a 100% renewable electricity supplier and services provider, with strategic partnerships to enhance its customer offering
22 Good Energy Annual Report 2020

24 Good Energy Annual Report 2020
Strategic ReportG
overnance ReportFinancial Statem
ents
25Strategic Report
Good Energy measures its progress with a number of key performance indicators (KPIs) which closely align with our business.
Further detail on the factors driving the KPI performances is set out in the Chief Executive, Financial and Operating Reviews within this Strategic Report.
Key performance indicators
Churn (%)Total customer numbers (000’s)
Supply volume
-1.0%1.8%
2.7%
-8.5%
Reflects the rate of turnover or loss of customers
Measures domestic, business and FIT supply customers
Measures the amount of electricity we supplied to customers
Measures the amount of gas we supplied to customers
Churn (%)
2019 2020
14.0%
14.5%
15.0%
15.5%
16.0%
Total customer meters (000’s)
2019 2020
200
220
240
260
280
Supply volume (E)
2019 2020
400
440
480
520
560
600
Supply volume (G)
2019 2020
400
440
480
520
560
600
Cost to serve (£ per meter)
Revenue growth (%)
-2.9%
5.1%
Measures the overhead cost per customer excluding acquisition costs (ie. sales and marketing)
Measures growth in sales over the period
Measures profitability as a proportion of revenue after the cost of sales
80
82
84
86
88
Cost to serve (£)
2019 2020
Revenue growth
2019 2020100
110
120
130
140
Gross margin (%)
-2.8%
Gross margin
2019 202020%
22%
24%
26%
Electricity (GWh)
Gas (GWh)
Admin cost growth (£m)2
EBITDA (£m)2
Employee engagement (%)
Operating margin (%)1
Net debt (£m)
NPS
PBT - Underlying (£m)
Cash & cash equivalents (£m)
Carbon avoided (GWh)
Measures operational efficiency by looking at administration cost growth
Measures profitability of the company before the cost of interest, tax, depreciation and amortisation
Measures how engaged our people are based on Gallup 12 survey
Measures profitability as a proportion of revenue after operating costs
Measures the Company’s ability to repay all debts if they were due immediately
Measures how likely a customer is to recommend Good Energy
Measures profitability as a proportion of revenue after operating costs
Measures the un-restricted cash and cash equivalents held by the business at a point in time
Measures the carbon we avoided in the year
-2.2%
1.7%
0.0%
-1.7%
16.8%
1.9%
-69.2%
33.8%
5.5%
Admin cost (£m)
2019 2020
25
26
27
EBITDA
2019 2020
9
9.5
10
Employee engage
2019 2020
75%
80%
85%
Operating margin
2019 2020
0%
1%
2%
3%
4%
5%
Net debt
2019 2020
30
35
40
45
NPS
2019 2020
52
53
54
55
PBT
2019 2020
0.0
0.5
1.0
1.5
2.0
Carbon avoided
2019 2020
500
550
600
650
Cash & cash equi.
2019 2020
10
15
20
1 Operating Margin reflects continuing underlying operations2 EBITDA and Admin cost growth reflect continuing operations.
26 Good Energy Annual Report 2020
Strategic ReportG
overnance ReportFinancial Statem
ents
27Strategic Report
Operating reviewWholesale energy market conditionsDemand
Our revenues are sensitive to changes in electricity and gas demand. At the outset of the pandemic, market trends showed a 15% increase in Domestic electricity demand and a close to 35% reduction in overall Business demand.
As lockdown eased, the picture changed again. Towards the end of 2020, domestic demand dropped relative to earlier in the pandemic, trending around 7.5% above normalised levels, while Business demand picked up and was closer to a 10-15% reduction on normalised levels. We continue to monitor the data closely.
Weather conditions further impacted energy demand. In H1, average temperatures were 0.95 degrees warmer than seasonal averages for 5 out of the first 6 months of the year. This reduced demand for gas but had a less material impact on electricity volumes.
Power prices & supply volume
In the first half of 2020, wholesale power prices dropped significantly. Following global trends in the fossil fuel markets, electricity prices fell 42% from H1 2019 and gas prices fell by 52% from H1 2019. As a result of decreased demand, excess forward-bought power was sold back into this market at a loss.
We saw a more bullish market in the second half of the year, with power prices rising back towards pre–COVID levels. Longer term pricing depends on the worldwide changes in demand sentiment. We have reviewed our traded positions and feel comfortable that we are sufficiently procured in gas and electricity to manage this position over this winter.
Overall supply volumes were 2.9% down, an improvement on the 6% saw in H1. Total gas supply volumes decreased 8.5% to 486 Mwh (FY 2019: 532Mwh), driven by the warmer weather. Electricity volumes increased 2.7%, driven by growth in Business supply volumes, following an increase in contracted business in late 2019. Half hourly (larger) business volumes increased 12.6% to 292 Mwh whilst our combined SME & Domestic supply volumes decreased 6.4%.
A strong and growing core businessTotal customer numbers in the period increased 1.8% to 271.3k, driven by continued business and FIT growth. The impact of COVID, warmer weather and the revaluation of the generation assets in the first half masked the underlying good performance of the core business.
Business
Total Business customers increased 9.0% to 139.3k. Business FIT customers increased 8.8% to 130.5k, maintaining our position as a market leader in voluntary FiT administration. Total Business supply customers increased 12.3% to 8.8k.
Business customer growth has underpinned our strategy in recent years; a planned shift that has brought greater stability through longer term contracts and higher retention compared to Domestic supply. Whilst we saw gross margins fall because of this shift, operating margins have the potential to increase over time due to the lower cost per acquisition and cost to serve these customers.
Domestic
Total Domestic customers decreased 4.7% to 132.0k. Domestic FIT customer numbers increased 1.1% to 47.1k, whilst domestic supply customers decreased 7.7% to 84.9k.
We remain committed to having a competitive price point for our unique proposition, while avoiding the price war that many energy companies are engaged in. Although many customers remain price sensitive, an expanding number want a truly green energy provider. Recognition from OFGEM, Uswitch and Which? of Good Energy as a genuinely 100% renewable supplier strengthens our brand position.
Our recent migration onto the Kraken customer service system will aid our target to reduce churn and the cost to acquire new customers. Domestic customer churn is currently approximately 14.9% - an improvement of our 2019 level of 16% and lower than the mid-20s industry average.
Feed in tariff (FIT)
FIT administration provides the foundation of our ‘energy as a service’ model. Despite the FIT scheme closing to new entrants in March 2019, we continue to administer the scheme for domestic and business customers. We saw domestic customer numbers increase 1.1% to 47.1k and business customers increase 8.8% to 130.5k in the period.
Generation performance
Our 47.5MW generation portfolio consists of 6 solar (30.1MW) and 2 wind sites (17.4 MW). In the summer, all our sites exceeded their P50 performance except for our smallest site, Creathorne, which experienced transformer issues.
Weather conditions and reduced energy demand saw renewables break new records, with wind meeting 59% of electricity demand following Storm Ellen in August. We expect these high renewable days to increasingly become part of the trading landscape.
Generation revaluation
We are committed to delivering value to stakeholders by working on our existing generation sites, which continue to perform well.
In the first half of the year, we revalued our entire generation portfolio. We have historically marked the assets at cost less accumulated depreciation. We also noted that in recent years the relative values of the generation assets and the long-term loans that finance them have become more disconnected, given the generation sites are depreciated on a straight-line basis whilst the loan repayments are scheduled on an amortising basis, with the majority of the total cash payments in the earlier years allocated to interest costs. The revaluation provides more accurate information on the value of the future economic benefits expected to be realised from these assets. These assets have been pledged as security for the debt against them and therefore the revaluation policy provides more accurate and transparent picture of the asset value against its related debt obligations.
The revaluation provides greater transparency of the generation sites’ current value on the balance sheet; notably gross assets, total equity and gearing. It results in additional depreciation going forward which decreases profits, but the additional depreciation does not impact distributable profits available to shareholders.
The revaluation, which was planned for H1 2020, considered the current, COVID-19 impacted power price market.
Restructure and refinance of generation portfolio
In April 2021 we announced the restructuring of the financing on our renewable generation asset portfolio to consolidate and simplify funding facilities. The restructuring consolidates the generation assets into one portfolio that will be solely financed by funds managed by Gravis.
Whilst headline gearing will not change, the restructuring and refinancing provides real short- and long-term benefits to Good Energy.
Initially, it will provide £7.8m of unrestricted cash on completion, of which:
• £4.7m relates to the release of various reserve accounts and other restricted cash balances which form part of the existing facilities,
• £3.1m of additional debt raised against the Delabole windfarm, associated with mirroring the terms of Delabole in line with the rest of the portfolio.
Longer term, the transaction also improves cash flow visibility, with a rebalancing of the performance covenants over the entire generation portfolio. This frees up future cash generated by the generation portfolio to be utilised by the Company.
The upfront cash provided, combined with existing strong levels of cash on the balance sheet gives the Company the ability to wholly repay Good Energy Bonds II. It is anticipated that this will be completed during FY2022. At the end of December 2020, the outstanding capital on Good Energy Bonds II was £16.8m, while associated interest costs are £0.8m per annum.

28 Good Energy Annual Report 2020
Strategic ReportG
overnance ReportFinancial Statem
ents
29Strategic Report
Key risksRisk management approach:Good Energy recognises that effective risk management is critical to enable it to meet its strategic objectives.
The Company has a clear framework for identifying and managing risk, both at an operational and strategic level. Its risk identification and mitigation processes have been designed to respond to the changing environment in which it operates. The impact of emerging risks on the Company’s business model are also considered and used to make informed decisions, including as to the delivery and evolution of the Group’s strategy. The table below captures those risks that would have the most significant adverse impact on the company, based on their impact and/or likelihood. While the risks are typical of the risks faced by other energy suppliers, we believe the Company is well positioned to mitigate through a combination of our risk management processes, our control activity and our evolving strategic direction.
Political
Wholesale market and price volatility
Regulatory
Weather, forecasting demand and generation
Cyber
COVID-19
Financial risk management
Brand, trust and reputation
lower risk lower/medium risk medium risk elevated risk
Our business modelGood Energy has two principal business areas: Supply and Generation. Through our Supply business we serve over 270,000 domestic and business customers, matching the electricity they use with power from 100% renewable sources. Within Supply, our Feed-in Tariff (FIT) administration services help households and businesses meet either all or part of their electricity demand directly from their own renewable technology.
Our Generation business delivers 100% renewable electricity to the UK electricity grid from eight renewable energy facilities that Good Energy owns and operates.
Operationally, we keep functions relating to both business areas as centralised as possible, such as sales, IT, marketing etc. To support this centralised way of working, we have invested in software platforms that will allow us to scale growth efficiently and cross-sell services to different customer types. In 2020 we introduced a new domestic customer services platform with Kraken Technologies, and a new software platform tailored to our Business customers from ENSEK Limited. Built to efficiently handle large data volumes, they will support the continued roll out of smart products and services. This will allow Good Energy to play to its strengths in the home and business clean energy services market through simplifying its customer service and enabling the company to adapt to meet future customer needs.
Our business model relies on important partnerships and communities, in addition to customers that range from individual households and small businesses through to large corporations.
Our proposition to our customers is to be a trusted and fair customer-focused supplier of 100% clean energy, who is driven by a clear purpose to power the choice of a cleaner, greener future together. This unique proposition, along with our strong brand, are important elements of our business model.
In our Supply and Generation business areas, we continue to support our operational and financial resilience through robust continuity planning. The coronavirus (COVID-19) pandemic provides an example of an exogenous shock we have prepared for. We have seen no significant impact from the pandemic to date, however we are monitoring the situation closely while planning for a range of scenarios including changes to current government guidance or policy. The business is confident that it has the flexibility and plans in place to mitigate the material impacts of the crisis.
Generation Sharing servicesEnergy supply
Generation PPA Supply B2C FiTSupply
B2B Services
Power purchase agreements (PPA)Domestic customer supply (Supply B2C)Business customer supply (Supply B2B)
Feed-in-Tariff (FIT)Energy services (Services)

30 Good Energy Annual Report 2020
Strategic ReportG
overnance ReportFinancial Statem
ents
31Strategic Report
Principal risks and uncertainties
Political riskPolitical risk is ever present. Good Energy was minimally impacted by the UK’s formal departure from the EU in 2020 due to its largely UK-based supply chain. However with the political focus on COVID and BREXIT the business has faced a fight to keep political focus on climate change and the green economy. 2021 is a key year in the fight against global heating and climate breakdown. With the UK hosting COP26, Good Energy will continue to push hard to be part of the climate conversation - supporting, lobbying and influencing UK green policy wherever appropriate.
In 2018, the government introduced a market-wide Standard Variable Tariff (SVT) price cap, which sets the maximum price suppliers can charge for domestic electricity and gas. The cap is intended to protect consumers that have not proactively chosen a tariff and are therefore on an SVT or other default tariff. On 1 August 2019, Ofgem awarded us a permanent derogation from the price cap for our SVT in recognition of how we support renewable energy; the costs associated with providing green energy; and because our customers actively chose to switch to our SVT to support our purpose. Successfully proving all these factors means our SVT is exempt from the price cap until its removal in 2023.
Regulatory riskThe energy industry is constantly changing. Government policy, the push for a low carbon economy, technology advances and consumer needs all affect our business and industry. Complying with new regulations requires the Company to make changes within set timelines and has already led (and will continue to lead) to the Company incurring additional time and cost.
A significant volume of regulatory change is a risk as it can divert time and resource away from growth initiatives as well as the risk of not meeting regulatory deadlines. The Company has invested in its regulatory and compliance capability, which enables us to respond effectively to change and reduce risk.
GDPR came into effect from May 2018. Good Energy promotes diligence and high ethical standards when it comes to collecting customers’ personal information. We aim for a high level of security through education, training, and sharing skills, experiences, and information. We encourage a culture of risk awareness and the constructive challenging of decisions and follow sound data protection principles. We comply with internal and government policies, regulations and procedures, and respect their spirit. All individuals, including our partners and suppliers, are expected to share this culture of safety and awareness.
Cyber-attackBusiness growth and technological advances mean we are increasingly exposed to the threat of cyber-attack. As with many businesses, a successful cyberattack on Good Energy could result in the Company being unable to serve customers, potentially damaging its reputation and leading to customer and revenue loss. It could also result in financial penalties.
Good Energy continually assesses its security policies, standards and procedures, adjusting them so they are proportionate to the threat profile the Company faces. The Company trains all staff annually on cyber security and potential threats and actively monitors risks using the National Cyber Security Centre (NCSC), which provides weekly updates on the cyber threat landscape.
Wholesale market and price volatilityElectricity and gas sales revenue is affected by fluctuations in wholesale prices and the associated costs of purchases during volatile market conditions. Good Energy mitigates this risk through vertical integration and its forward-looking and prudent hedging policy. Due to these policies Good Energy was able to hold its SVT prices unchanged through 2020, providing certainty to customers.
Weather, forecasting demand and generationOn the supply side, weather drives demand and customer behavior. From a generation perspective, the impacts of climate change, alongside the annual variability of wind speeds and solar radiation, can result in year-to-year fluctuations. Any material reduction could adversely impact financial results.
Accurate forecasting reduces risk by enabling informed hedging, which mitigates adverse market movements and short-term balancing risks. Continued investment in staff and systems has provided Good Energy with good visibility and forecasting performance.
Brand, trust and reputationGood Energy’s purpose is key to its proposition. Damage to its brand and reputation would compromise its competitive position. Good Energy was founded in 1999 to help homes and businesses be part of a sustainable solution to climate change. To ensure we are being true to our purpose we put the business through a comprehensive Green Audit in Q1 2021.
Our community of shareholders, bondholders, generators, customers, and employees are helping create a cleaner, greener future powered by renewables. From using digital innovation to help UK households and businesses manage their energy usage, to empowering them to generate, store and share their own clean power, we are leading the charge towards a cleaner, distributed energy system.
COVID-19The national and international response to the COVID-19 pandemic has created unique risks for all businesses. For Good Energy, those risks can be summarised as cashflow, business continuity, employee welfare and supplier/customer relationships.
During 2020 the group quickly adapted to remote working, mitigating some operational impacts posed by COVID-19. The Company expects to maintain a more flexible approach to home and office based working.
The more macroeconomic challenges driven by COVID-19 continue to require active review and management by the business. The Group continues to identify drivers to preserve and improve cash and balance sheet strength to counter any potential reductions in revenues/increases in customer debt resulting from the economic downturn. To date the ongoing Government support packages have helped mitigate economic impacts, but as the vaccine program is delivered the economic support for individuals and businesses is going to be scaled back. Good Energy continues to plan ahead and is ready to face the challenges this situation presents. Please see the Going Concern disclosure (page 68) for more details.
Financial risk managementThis has been considered within note 3 in the Notes to the Financial Statements.
32 Good Energy Annual Report 2020
Strategic ReportG
overnance ReportFinancial Statem
ents
33Strategic Report
Chief Financial Officer’s review
“Despite the impact of COVID-19, the Group has had a positive financial performance from the core business and maintained a strong cash balance.”
Financial outlookDespite the impact of COVID-19, the Group has had a positive financial performance from the core business and maintained a strong cash balance. This includes reduced operating costs following the implementation of new digital platforms. Customer numbers have remained stable, whilst cash collections have been strong and the overall working capital position has remained healthy. The implementation of our Kraken technology platform is complete and the smart meter roll-out is on track. We remain vigilant to the potential impacts of the withdrawal of various government support schemes for individuals and businesses later in 2021, and plan to retain a cash buffer through to the end of winter 2021/22 as a result.
The first quarter of 2021 has seen power price volatility, most notably in January, and periods of colder than average weather which has led to domestic customer demand being higher. The Delabole site experienced outages following storms at the start of the year together with some delays to parts being available from Europe as a result of Brexit. Availability at the Delabole site in 2021 to date is slightly under 80% as a result. These factors do not affect management’s expectations of the performance of the business for the full year.
Financial updateOverview
Performance in the year can be broadly split into three key areas: good internal cost management of factors within our control; external market factors outside of our control; and proactive decisions made on structural changes.
Underlying profit before tax would have seen year on year growth, after normalising to exclude the impact of the generation revaluation and one-off restructuring costs associated with the Kraken customer services technology platform integration.
Internal cost management
Combatting the ongoing COVID-19 impact, Kraken investment returns and prudent cost control across the business has helped to deliver cash cost reduction of £2.7m in the period. Normalised admin costs are £2.3m better. These values are after removing the additional COVID-19 related ECL provision, Creathorne write down, HQ cancellation and Brynwhilach profit on disposal in 2019.
External market factors
Electricity margin has been negatively impacted by reduced half hourly (“HH”) volumes and the sale of excess power back to the market at a time of
reduced prices and additional network charges, which resulted from reduced demand during lockdown. In aggregate these account for a £1.9m negative impact to gross margin. There was some compensation from £0.7m additional PPA benefits on account of the lower power prices.
Gas margin is flat year on year, with the impact of lower demand at the start of 2020 being reversed with higher margins in the second half due to increased home working and lower prices providing upside.
An incremental £0.8m expected credit loss provision was taken, driven by the macroeconomic outlook. In 2020 this is a non-cash impact.
Structural changes
We commenced planning for the revaluation of our generation asset portfolio at the end of 2019 and completed the exercise in H1 2020. We have historically marked the assets at cost less accumulated depreciation. We have also noted that over recent years the relative values of the generation assets and the long-term loans that finance them have become more disconnected, given that the generation sites are depreciated on a straight-line basis whilst the loan repayments are scheduled on an amortising basis, with the majority of the total cash payments in the earlier years allocated to interest costs. The revaluation therefore provides greater transparency of the generation sites’ current value on the balance sheet, notably gross assets, total equity and gearing.
Generation asset revaluation delivered net upwards asset value of £15.9m. This comprised of uplift on seven assets totalling £16.4m, and the £0.5m write down on the small Creathorne solar site There is also an incremental ongoing £1.1m depreciation charge, which does not impact distributable profits available to shareholders.
As planned, there has been a realisation of a further £0.5m on restructuring costs relating to the new customer services technology platform. There was an initial £0.9m recognised in 2019.
Financial performance Profit and loss
Revenue increased by 5.1% in the period to £130.6m (2019: £124.3m) driven by business supply volume growth offset by lower domestic supply customers. The impact of COVID masked an underlying increase in contracted business.
Cost of sales increased by 9.2% to £101.1m (2019: £92.6m). Gross profit decreased by 6.6% to £29.6m (2019: £31.7m). Gross profit margin decreased to 22.6% (2019: 25.5%).
Administration costs excluding non-underlying administration costs decreased 0.7% to £25.0m (2019: £25.2m). This was primarily driven by Kraken cost savings of £2.7m mostly offset by an incremental £0.8m charge for expected credit loss provisioning, Creathorne write down, cancellation of the move of headquarters and Brynwhilach profit on disposal in 2019. Total administration costs decreased 2.2% to £25.5m (2019: £26.1m).
Underlying operating margin decreased to 3.5% (2019: 5.2%).
Net finance costs decreased by 3.3% to £4.1m, as overall debt paydown continued to be offset by an increase in reported finance costs following the implementation of IFRS16.
Non underlying costs of £0.5m associated with restructuring costs, delivered a loss before tax from continuing operations of £0.1m. Overall £0.1m of profit is attributable to the Group, after removing the losses attributable to NCI (minority shareholders of Zap Map).
Cash flow and cash generation
Our business model remains highly cash generative with £11.4m cash generated from operations (2019: £8.1m), with £10.6m generated before movements in working capital (2019: £10.0m). Working capital movements remain in line with seasonal trends, despite the impact in the year of COVID-19.
There was a net increase in cash of £4.6m, delivering a strong cash balance of £18.3m (2019: £13.7m) funding investment across the business, continued paydown of debt and capital flexibility.
Funding and debt
Net debt decreased 16.8% to £34.6m (FY 2019: £41.6m) following further debt repayment and good cash generation. Gearing reduced to 51.6% (2019: 68.9%) primarily as a result of the upward valuation of the generation portfolio.
Following the repayment of Bond I in June 2019, Group finance costs have been lower and this is a positive step towards lowering the Company’s ongoing financing costs and reducing the gearing ratio over the medium term. There is a change since the interim accounts in that the Good Energy bond is now reported mostly within non-current liabilities. This is due to an annual redemption request window for bondholders in December of each year, with upcoming bond redemptions set at June 2021 or June 2022.
The Group continues to maintain a robust financial position. We look to optimise our use of capital by continually reviewing the returns on our assets, balancing operating requirements, investment for growth, and payment of dividends back to shareholders.
34 Good Energy Annual Report 2020
Strategic ReportG
overnance ReportFinancial Statem
ents
The Group is currently evolving its strategy towards energy services and remains mindful of the need to capitalise on strategic business development and investment opportunities. Prudent balance sheet management remains a key priority.
Earnings
Basic underlying profit per share decreased to 3.3p. Reported profit per share decreased to 0.4p (2019: profit per share 7.5p).
Dividend
Due to the need to appropriately balance between investment in the core business and shareholder returns, no final dividend has been proposed for 2020. The Board recognises the importance of the dividend to many shareholders; therefore the Board will resume the company dividend from 2021.
Non underlying costs
An amount of £0.5m has been incurred as non-underlying costs within the period. These relate to the one-off expenditure of implementing the Kraken technology platform and accelerated depreciation.
Expected credit loss
The Group’s outlook and base case economic scenario used to calculate expected credit loss (ECL) allowance has been updated since both the 2019 year-end and H1 2020, to reflect the Group’s best estimate of the future economic outlook of the Group’s customer and client base, has resulted in an incremental provision charge of £0.8 million in the period. The Group’s ECL allowance continues to reflect a probability-weighted view of future economic scenarios where future macroeconomic forecasts deteriorate further from the 2020 year-end. We remain mindful of the potential economic impact on both our SME and domestic customers. The provision reflects external benchmarks of future macroeconomic performance, as well as our own internal debt collection performance in year.
Strategic investment
The Group converted its equity position in Zap-Map (Next Green Car Limited) to take a majority 50.1% position in the period. As a result, Zap-map has been consolidated as a subsidiary under IFRS 3 from the date control was obtained. Non-controlling interests have been recognised at their share of the fair value of net assets.
Generation portfolio
Our 47.5MW generation portfolio consists of 6 solar and 2 wind sites. In the period we have revalued the entire generation portfolio to accurately reflect the current value of these assets. As outlined in our 2019 Annual Report, we undertook a review to ensure that our valuation was reflective of market conditions.
Generation asset revaluation delivered upwards asset value of £16.4m. However, there is an incremental ongoing £1.1m depreciation charge, and further £0.5m write down on the small Creathorne solar site. The revaluation includes the impact of the current, COVID-19 impacted power price market.
Events after the balance sheet
On 1 April 2021 the Group announced the restructuring of the financing on its renewable generation asset portfolio to consolidate and simplify funding facilities. On 8 April, the Group announced a further £1m strategic investment into Zap Map’s parent company Next Green Car Ltd, via a convertible loan note. See page 82 for further detail.
Rupert SandersonChief Financial Officer
35Strategic Report 35
Strategic ReportG
overnance ReportFinancial Statem
ents

What we do to achieve our purpose: Empowering you to use, share, generate and store clean energy
Good Energy Annual Report 202036 37Strategic report
Financial Statements
Governance Report
Strategic Report

Engaging with our community
Partners for changeForming partnerships with like-minded organisations helps to further our purpose and reach new audiences. We’re currently working with partners from a range of different sectors, from the creative arts to sustainable agriculture.
BAFTA AlbertWe are proud to have strong links with BAFTA (British Academy of Films and Television Arts) and its sustainability initiative, albert.
Since 2017, we have worked with albert on the Creative Energy Project, a scheme which makes it easier for film and TV companies to switch to 100% renewable electricity. In 2020 we signed up 25 new companies to the project, bringing the total to 69.
“Good Energy’s green credentials and their successful tender makes them a leading choice of energy partner for albert’s Creative Energy Project. Together we aim to make clean renewable energy easier and more accessible than ever before helping you reduce your environmental impact for all film and TV production.”Kevin Price, Chair of the BAFTA albert Consortium
Julie’s BicycleJulie’s Bicycle is a charity that supports the creative arts to reduce their environmental impact and tackle the climate crisis. With their help, we expanded the Creative Energy Project to reach more businesses which are starting out on their sustainability journey. Over the past couple of years, we have worked with Julie’s Bicycle on their flagship Creative Green Awards. The event aims to recognise the achievements of arts organisations taking action on climate change.
“Clean, renewable energy is the simplest of the many solutions to climate change and Good Energy have been pioneering this solution for many years. We have been really grateful to be in partnership with Good Energy, driving demand for renewables as well as celebrating their work with the creative sector”Alison Tickell, CEO and Founder
Friends of the EarthWe have been working with Friends of the Earth for over a decade. As one of the UK’s most well-known environmental organisations, their support is invaluable in promoting our purpose. We remain one of only two energy suppliers the charity recommends to its large number of supporters.
“We’re deeply concerned about climate change and its impacts on the planet and people. But by working with Good Energy to move Britain away from imported fossil fuels and towards green energy generated locally, we’re helping to reduce one of its greatest causes.”Guy Shrubsole, Climate & Energy Campaigner.
We also work with these businesses and organisations to promote sustainability and fight climate change:
Investing in a green future: our pensionsPensions could be the next frontline in the fight against climate change.
Historically, many pension funds have invested in companies that have a negative impact on our climate, supply chains that are unsustainable, and industries that accelerate climate change. When people find out they’re accidental investors in these companies, they’re often horrified.
We have partnered with the ‘Make My Money Matter’ campaign, which is creating a movement calling for the trillions of pounds invested in our UK pensions to build a better world.
We also published our own research into Britain’s ethical pensions market, having contacted 54 pension schemes and funds which collectively hold £2.9 trillion of assets under management. Our own progress will continue as we seek to provide our people with pensions options that match their desire to protect the planet.
Better BusinessLike millions of others during lockdown, our CEO and Founder Juliet Davenport was now working from home. She found that as many other business founders were doing the same it was easier to stop, reflect, and have valuable conversations about how businesses can be a force for good.
This was behind the idea behind Better Business, our video series where Juliet speaks to some of the UK’s most prominent sustainable and purpose-led business leaders. Featuring the likes of Tom Kay of Finisterre, Anne-Marie Imafidon of STEMettes, Richard Ballard of Growing Underground and Mart Drake-Knight of Rapanui, the series of discussions covers the themes of purpose in business, coping with crises and building back better.
The interviews can be watched back on our YouTube channel and our website here: goodenergy.co.uk/business/better-business
38 Good Energy Annual Report 2020 Strategic report 39
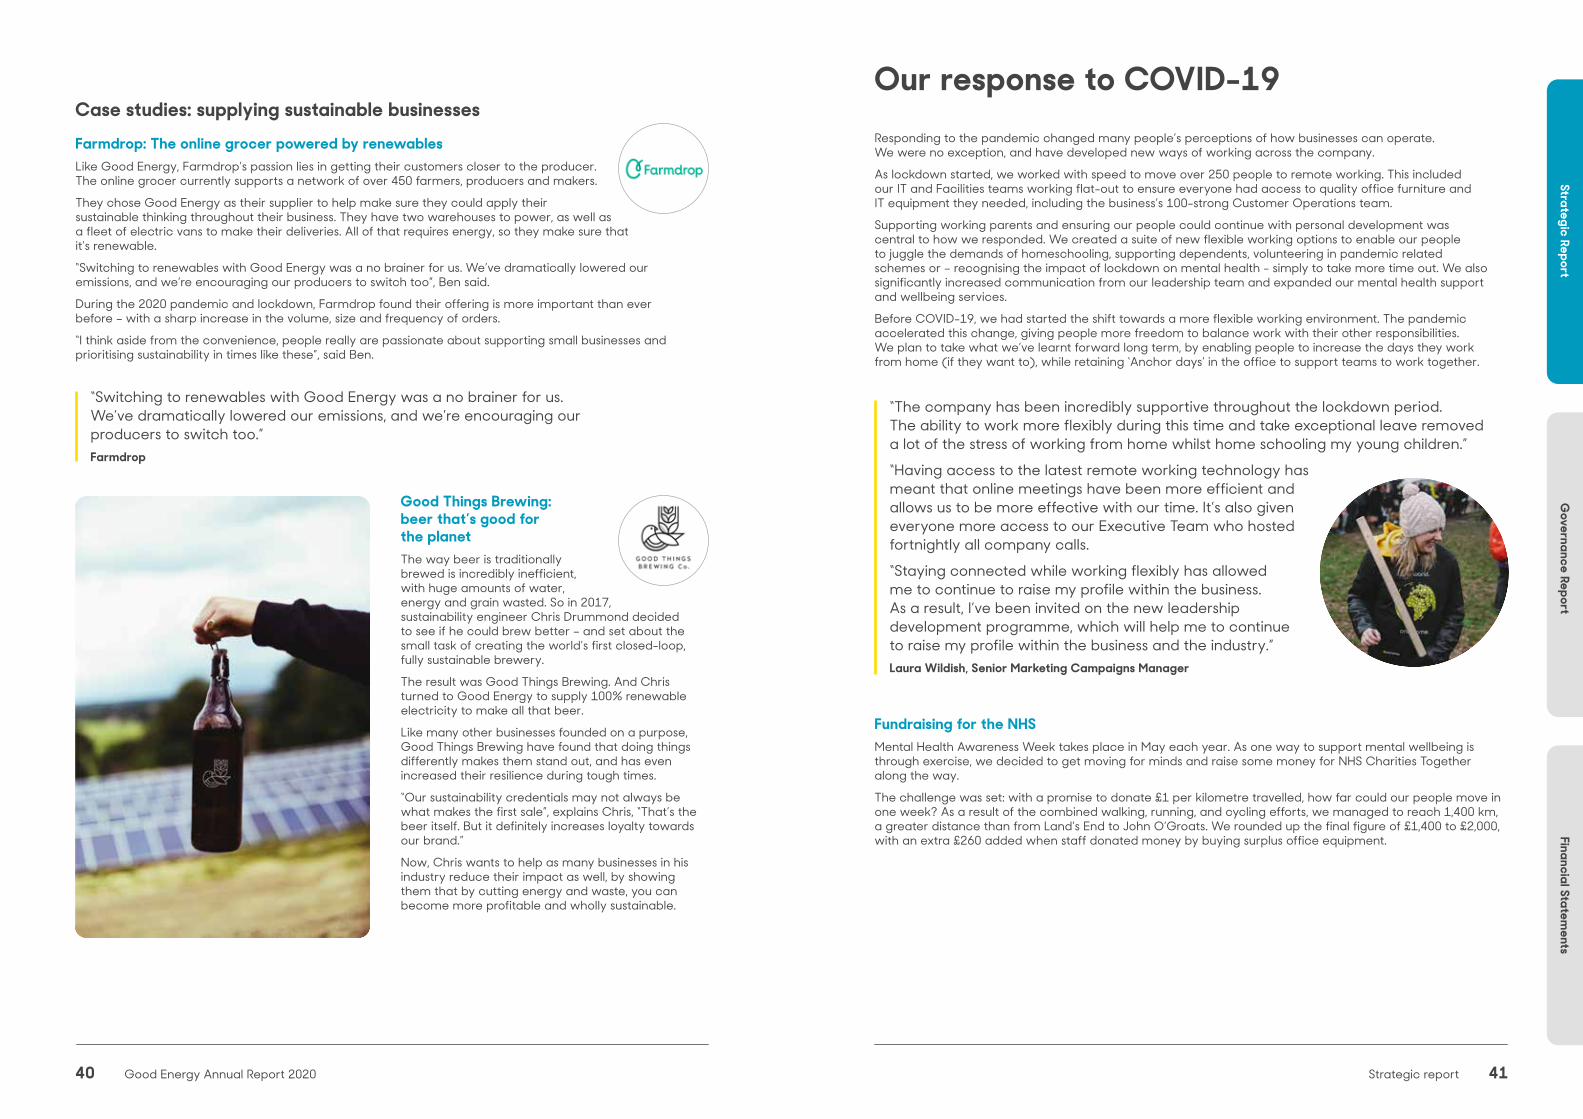
Case studies: supplying sustainable businessesFarmdrop: The online grocer powered by renewablesLike Good Energy, Farmdrop’s passion lies in getting their customers closer to the producer. The online grocer currently supports a network of over 450 farmers, producers and makers.
They chose Good Energy as their supplier to help make sure they could apply their sustainable thinking throughout their business. They have two warehouses to power, as well as a fleet of electric vans to make their deliveries. All of that requires energy, so they make sure that it’s renewable.
“Switching to renewables with Good Energy was a no brainer for us. We’ve dramatically lowered our emissions, and we’re encouraging our producers to switch too”, Ben said.
During the 2020 pandemic and lockdown, Farmdrop found their offering is more important than ever before – with a sharp increase in the volume, size and frequency of orders.
“I think aside from the convenience, people really are passionate about supporting small businesses and prioritising sustainability in times like these”, said Ben.
Good Things Brewing: beer that’s good for the planetThe way beer is traditionally brewed is incredibly inefficient, with huge amounts of water, energy and grain wasted. So in 2017, sustainability engineer Chris Drummond decided to see if he could brew better – and set about the small task of creating the world’s first closed-loop, fully sustainable brewery.
The result was Good Things Brewing. And Chris turned to Good Energy to supply 100% renewable electricity to make all that beer.
Like many other businesses founded on a purpose, Good Things Brewing have found that doing things differently makes them stand out, and has even increased their resilience during tough times.
“Our sustainability credentials may not always be what makes the first sale”, explains Chris, “That’s the beer itself. But it definitely increases loyalty towards our brand.”
Now, Chris wants to help as many businesses in his industry reduce their impact as well, by showing them that by cutting energy and waste, you can become more profitable and wholly sustainable.
40 Good Energy Annual Report 2020
“Switching to renewables with Good Energy was a no brainer for us. We’ve dramatically lowered our emissions, and we’re encouraging our producers to switch too.”Farmdrop
Strategic report 41
Strategic ReportG
overnance ReportFinancial Statem
ents
Our response to COVID-19Responding to the pandemic changed many people’s perceptions of how businesses can operate. We were no exception, and have developed new ways of working across the company.
As lockdown started, we worked with speed to move over 250 people to remote working. This included our IT and Facilities teams working flat-out to ensure everyone had access to quality office furniture and IT equipment they needed, including the business’s 100-strong Customer Operations team.
Supporting working parents and ensuring our people could continue with personal development was central to how we responded. We created a suite of new flexible working options to enable our people to juggle the demands of homeschooling, supporting dependents, volunteering in pandemic related schemes or – recognising the impact of lockdown on mental health - simply to take more time out. We also significantly increased communication from our leadership team and expanded our mental health support and wellbeing services.
Before COVID-19, we had started the shift towards a more flexible working environment. The pandemic accelerated this change, giving people more freedom to balance work with their other responsibilities. We plan to take what we’ve learnt forward long term, by enabling people to increase the days they work from home (if they want to), while retaining ‘Anchor days’ in the office to support teams to work together.
Fundraising for the NHSMental Health Awareness Week takes place in May each year. As one way to support mental wellbeing is through exercise, we decided to get moving for minds and raise some money for NHS Charities Together along the way.
The challenge was set: with a promise to donate £1 per kilometre travelled, how far could our people move in one week? As a result of the combined walking, running, and cycling efforts, we managed to reach 1,400 km, a greater distance than from Land’s End to John O’Groats. We rounded up the final figure of £1,400 to £2,000, with an extra £260 added when staff donated money by buying surplus office equipment.
“The company has been incredibly supportive throughout the lockdown period. The ability to work more flexibly during this time and take exceptional leave removed a lot of the stress of working from home whilst home schooling my young children.”“Having access to the latest remote working technology has meant that online meetings have been more efficient and allows us to be more effective with our time. It’s also given everyone more access to our Executive Team who hosted fortnightly all company calls.“Staying connected while working flexibly has allowed me to continue to raise my profile within the business. As a result, I’ve been invited on the new leadership development programme, which will help me to continue to raise my profile within the business and the industry.”Laura Wildish, Senior Marketing Campaigns Manager

Innovating to achieve net-zeroAs we think about the future of energy there are three areas we need to tackle: electricity, heat and transport. The transition to net-zero emissions means supporting our customers to do their bit across all three. 2020 saw us develop our propositions, partnerships and philosophy around how to do just that.
These new propositions include the UK’s first ever heat pump tariff, called Green Heat, and the trial of smart time of use tariff for electric vehicle drivers. Creating these unique tariffs is an important way to support people who are shifting from using fossil fuels to clean alternatives.
Greener heatingRenewable heat pumps are an essential solution for freeing Britain’s homes from the gas grid. Our Green Heat tariff offers lower rates and zero standing charge over the winter months to help make running a heat pump more affordable. This will help customers pay less to heat their home at a time of year they use their heat pump most intensively.
We understand that investing in a heat pump may not be possible for everyone. So we’ve also looked to provide ways for people to make sure their existing gas heating is running as efficiently as possible. An annual boiler service can improve efficiency by up to 15%, which not only saves people money, but cuts carbon emissions as well. Our strategic partnership with home and boiler care provider Hometree will help give people peace of mind over their heating – especially important with more people than ever working from home and using more energy through the winter.
Driving changeOur new EV tariff, called ‘Green Driver’ is another example of innovation in action. The tariff - now in trial stage - is a smart, insight-driven “time of use” tariff developed using Zap-Map’s rich data. Green Driver offers customers a lower cost and longer off-peak charging window, starting earlier in the evening at 10pm. The tariff will help customers shift consumption, providing a cost saving while also supporting the grid at a time of day when a higher proportion of demand is met by renewable energy.
Pathways to a Zero Carbon BritainIn 2019, the UK government legislated to reduce greenhouse gas emissions to zero by 2050. This major commitment was the first of its kind in the world, and a significant increase on the existing target of an 80% reduction. The move was the starting gun in the race to develop new policies and ideas to support the transformation to a zero-carbon economy.
Good Energy has a strong track record of influencing climate policy and we decided the time was right to make a fresh contribution to the debate. We commissioned Energy Systems Catapult, a research centre, to model our vision for how Britain can reach zero carbon emissions under a set of innovative scenarios. These scenarios imagined a world where millions of homes have roof-top solar panels and battery storage devices; where renewables provide 98% of our electricity demand; and where we develop new homegrown renewable technologies, such as tidal and geothermal power.
The full results of the report are to be published in 2021 and we will follow the work with a range of events for policymakers, investors, and businesses.
Strategic ReportG
overnance ReportFinancial Statem
ents
43Strategic report42 Good Energy Annual Report 2020
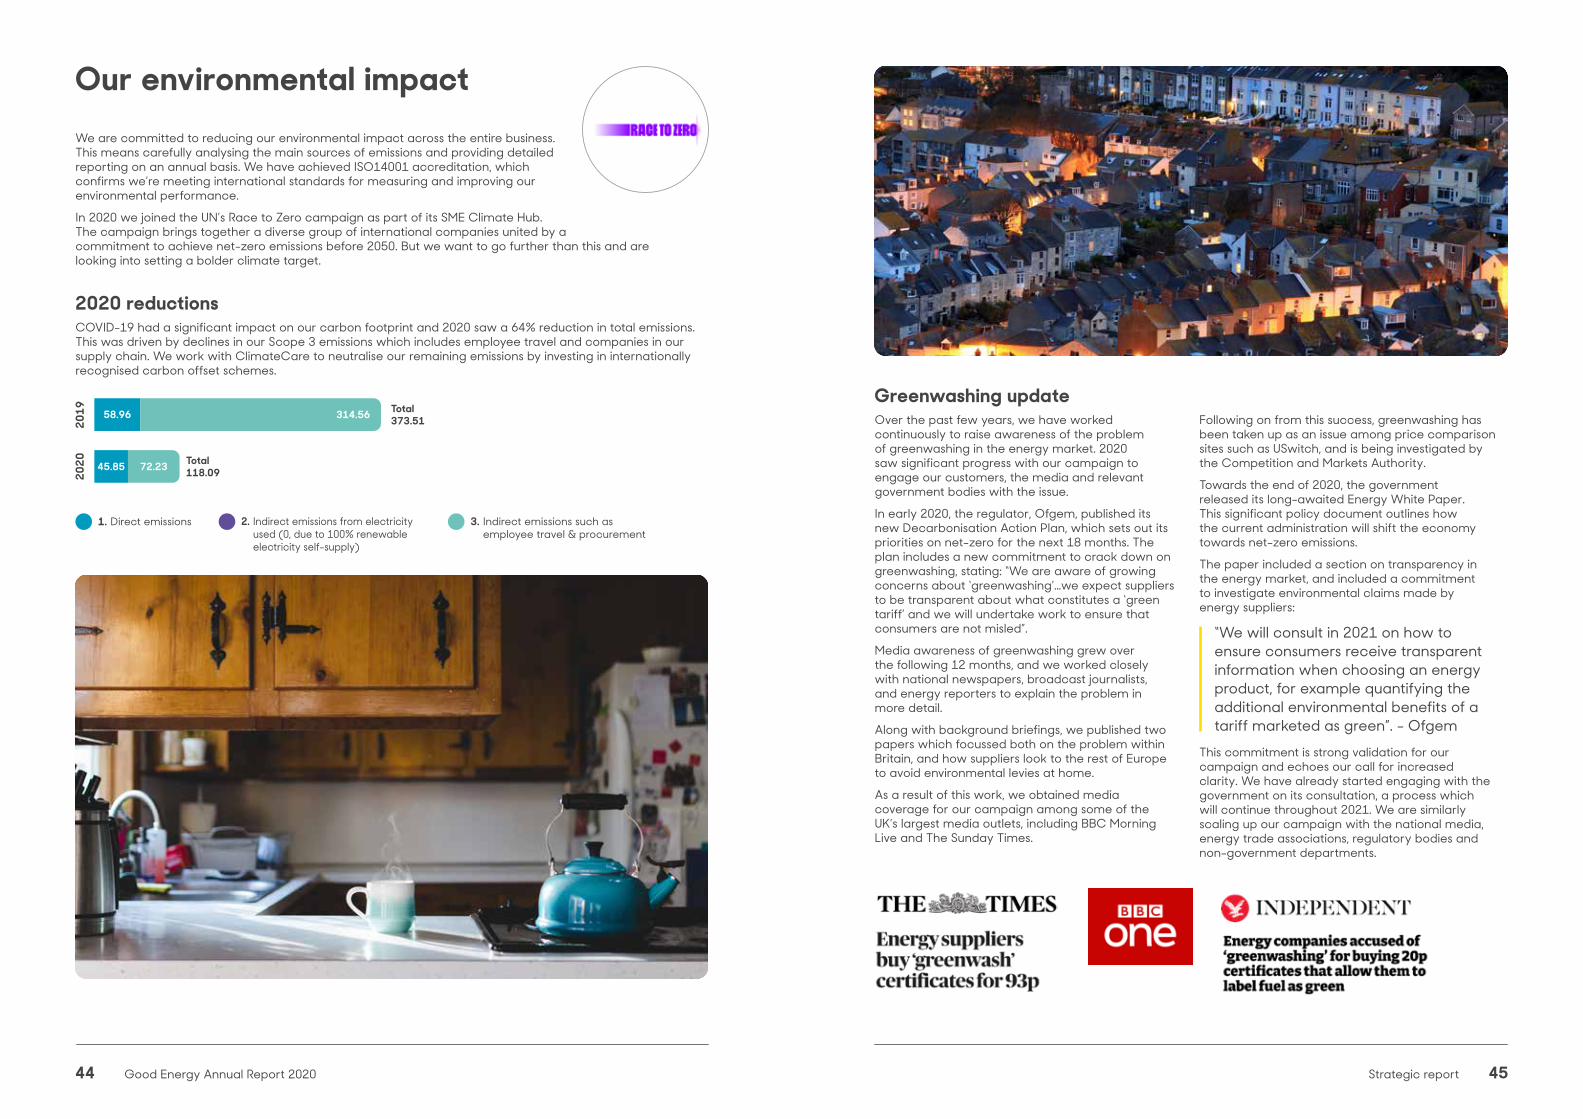
Our environmental impactWe are committed to reducing our environmental impact across the entire business. This means carefully analysing the main sources of emissions and providing detailed reporting on an annual basis. We have achieved ISO14001 accreditation, which confirms we’re meeting international standards for measuring and improving our environmental performance.
In 2020 we joined the UN’s Race to Zero campaign as part of its SME Climate Hub. The campaign brings together a diverse group of international companies united by a commitment to achieve net-zero emissions before 2050. But we want to go further than this and are looking into setting a bolder climate target.
2020 reductions COVID-19 had a significant impact on our carbon footprint and 2020 saw a 64% reduction in total emissions. This was driven by declines in our Scope 3 emissions which includes employee travel and companies in our supply chain. We work with ClimateCare to neutralise our remaining emissions by investing in internationally recognised carbon offset schemes.
Greenwashing updateOver the past few years, we have worked continuously to raise awareness of the problem of greenwashing in the energy market. 2020 saw significant progress with our campaign to engage our customers, the media and relevant government bodies with the issue.
In early 2020, the regulator, Ofgem, published its new Decarbonisation Action Plan, which sets out its priorities on net-zero for the next 18 months. The plan includes a new commitment to crack down on greenwashing, stating: “We are aware of growing concerns about ‘greenwashing’…we expect suppliers to be transparent about what constitutes a ‘green tariff’ and we will undertake work to ensure that consumers are not misled”.
Media awareness of greenwashing grew over the following 12 months, and we worked closely with national newspapers, broadcast journalists, and energy reporters to explain the problem in more detail.
Along with background briefings, we published two papers which focussed both on the problem within Britain, and how suppliers look to the rest of Europe to avoid environmental levies at home.
As a result of this work, we obtained media coverage for our campaign among some of the UK’s largest media outlets, including BBC Morning Live and The Sunday Times.
Following on from this success, greenwashing has been taken up as an issue among price comparison sites such as USwitch, and is being investigated by the Competition and Markets Authority.
Towards the end of 2020, the government released its long-awaited Energy White Paper. This significant policy document outlines how the current administration will shift the economy towards net-zero emissions.
The paper included a section on transparency in the energy market, and included a commitment to investigate environmental claims made by energy suppliers:
“We will consult in 2021 on how to ensure consumers receive transparent information when choosing an energy product, for example quantifying the additional environmental benefits of a tariff marketed as green”. - Ofgem
This commitment is strong validation for our campaign and echoes our call for increased clarity. We have already started engaging with the government on its consultation, a process which will continue throughout 2021. We are similarly scaling up our campaign with the national media, energy trade associations, regulatory bodies and non-government departments.
Total 118.09
1. Direct emissions 2. Indirect emissions from electricity used (0, due to 100% renewable electricity self-supply)
3. Indirect emissions such as employee travel & procurement
72.23
Total 373.5158.96 314.56
45.85
1. Direct emissions 2. Indirect emissions from electricity used (0, due to 100% renewable electricity self-supply)
3. Indirect emissions such as employee travel & procurement
44 Good Energy Annual Report 2020 Strategic report 45

Good Housekeeping AccreditationFor almost 100 years, the Good Housekeeping Institute has been a trusted source for the best and most reliable products in the consumer market. Its experts provide recommendations to consumers off the back of this, on everything from food recipes to freezers.
In 2020, and after a rigorous period of testing, the institute announced that Good Energy was approved as a “100% renewable electricity provider”. This was an important recognition of everything Good Energy stands for and has practised in the energy market for 20 years.
We know that not all suppliers have the same high standards when it comes to evidencing their green claims. Receiving the Good Housekeeping Institute’s coveted Getting Greener endorsement is another way of showing people what we do is different.
2021L
Carbon-neutral gasIn 2016 we launched carbon neutral gas, made up of 6% green gas with the remainder carbon offset. This year we increased the proportion of biogas to 10%, and supported three new gold standard biogas-based carbon offset projects so that we are promoting green energy worldwide, too.
Green gas, or biomethane, is gas that’s not from fossil fuels. It’s made when organic materials — like food waste — decomposes and releases methane, in a process called anaerobic digestion. This biomethane gas is then captured and fed into the national gas grid to be used in your home.
It’s not possible to simply swap all of the fossil fuel gas in the UK with green gas, but we’re leading the way with our 10% for customers.
Carbon offsetting is not the final answer to decarbonising either. But what offsetting can do is fill a gap in time, finance or ambition. To make real reductions in the amount of carbon in the atmosphere and have other positive social benefits at the same time.
It is with this in mind that we chose a set of new carbon offset projects with our partners Climate Care. 10% may be the limit for biogas in the UK, but we can go further through supporting it elsewhere in the world. Climate change is a global problem after all. We are now supporting three new biogas projects in India, China and Turkey, all of which are Gold Standard accredited, which is one of the highest levels of internationally recognised verification schemes.
47Strategic report
Financial Statements
Governance Report
Strategic Report
46 Good Energy Annual Report 2020

Our social impact
Marching with Greta ThunbergGreta Thunberg and other young activists have mobilised an entire generation to call for climate action, creating a movement that has put increased pressure on those in power to combat climate change. And in February 2020 she announced that she was coming to Bristol, which is just a short train ride from Good Energy’s headquarters, and the home city for many of our team.
We told everyone in Good Energy that provided there was enough cover to ensure adequate support for customers that they could go to Bristol to see Greta speak and march with the 30,000 strong crowd. Good Energy’s yellow banners were very visible on the day, and widely featured on the extensive national news coverage.
Following the event, which took place in pouring rain, College Green where the march started and finished had been turned to mud. A crowdfund campaign was started to ‘make College Green green again’, and Good Energy quickly responded to become the biggest donor. We then became involved in the plans to use the donations to rewild the green, which will involve planting wildflowers and trees to make it more ecologically friendly than before.
Strengthening our ties with rural communitiesOur two wind and six solar farms were developed in the early 2010s with community support. Each one of these projects has a community fund attached to ensure local people benefit from hosting renewables.
In 2020, our funds reached an important milestone, having generated £400,000 in direct contributions since they were established. These ongoing donations have helped a range of initiatives come to life in only a few short years, from creating new green spaces to investing in digital equipment for schoolchildren.
The Alderholt Community Fund in Dorset is one such example. The fund was created in 2015 alongside Good Energy’s Crossroads solar farm, located nearby. The fund will last for 30 years with an average of £7,000 committed annually by Good Energy for the lifetime of the green power plant. The Alderholt fund has provided a helping hand to 27 community projects, ranging from health to sporting needs. Local leaders also put £1,300 towards the Alderholt Coronavirus Response Group.
“In the time since it was set up the fund has played a major role in supporting the local community. That good work will continue as we recover from coronavirus, and in the years to come.”James Grazebrook, chair of the Alderholt Community Fund.
An ‘outstanding’ place to workAs a business we try to ensure our values flow through everything we do. We set ourselves high standards for our workplace and want our staff to have a job they genuinely believe in.
The hard work we put into this part of the business was recently recognised with an ‘outstanding’ rating by Best Companies. The accreditation offered by Best Companies is the gold standard for workplace engagement. The results we received were based entirely on the feedback of employees, which makes it even more special to receive.
2020 was a challenging year for all our people. The impact of the pandemic meant we’ve had to completely change how we work together. So, to be recognised as outstanding truly reflects the resilience and optimism of our fantastic team. We know we’re all more powerful when we work together, and 2020 proved that more than ever.
The Good Future BoardGood Energy has long had four stakeholder groups. Like most companies, our investors, our customer and our people are vitally important. But we also always consider a fourth — our futureholders.
Futureholders are the young people who will be most impacted by climate change if we do not take sufficient action. They are at the heart of Good Energy’s purpose, and in 2020 we decided to make their voice better heard within the business.
This was the idea behind the Good Future Board. Designed to mirror our existing company board, but with the notable difference of all members being aged 18 or under.
Announced in November 2020, we worked with environmental education charity Eco-Schools to gather applications, asking for a personal statement of 500 words or fewer.
Phenomenally, we received close to 1000 applications for the six places on the board. Eco-Schools helped shortlist the 1000 down to just 24, which were then voted on within the business to select the six.
The final six Good Future Board members will now attend at least two board meetings a year where Good Energy will get their feedback and ideas, helping us to stay true to our purpose and commitment of protecting their futures. They are —
Shaina ShahShaina is a Girl Guide who completed her ‘conscious consumer’ badge by creating an ethical fashion brand.
Jack SollyIn Jack’s application he pitched a new certification called CarbonCorp, for businesses which are carbon negative.
Kathryn GornallShe expressed dismay that the average age of a board member of a top UK company is nearly sixty, while the average age of a US senator is 62 and UK MP around 50.
Ada WoodHaving achieved an A* in an Environmental Management GCSE last year, Ada is forthcoming on the need to listen to science and not be drawn by economics or public opinion.
Akash ThakerIn his first year of A Levels, having worked with circular economy start-up The Good Plate Company and been waste manager at festivals, Akash has an excellent grasp of sustainability.
Mahnoor KamranHaving migrated to the UK after living in the Middle East and South Asia, at only 17 Mahnoor has seen severe effects of climate change firsthand. She is a regular public speaker, well-informed on the global inequalities caused and exacerbated by climate change.
48 Good Energy Annual Report 2020 Strategic report 49
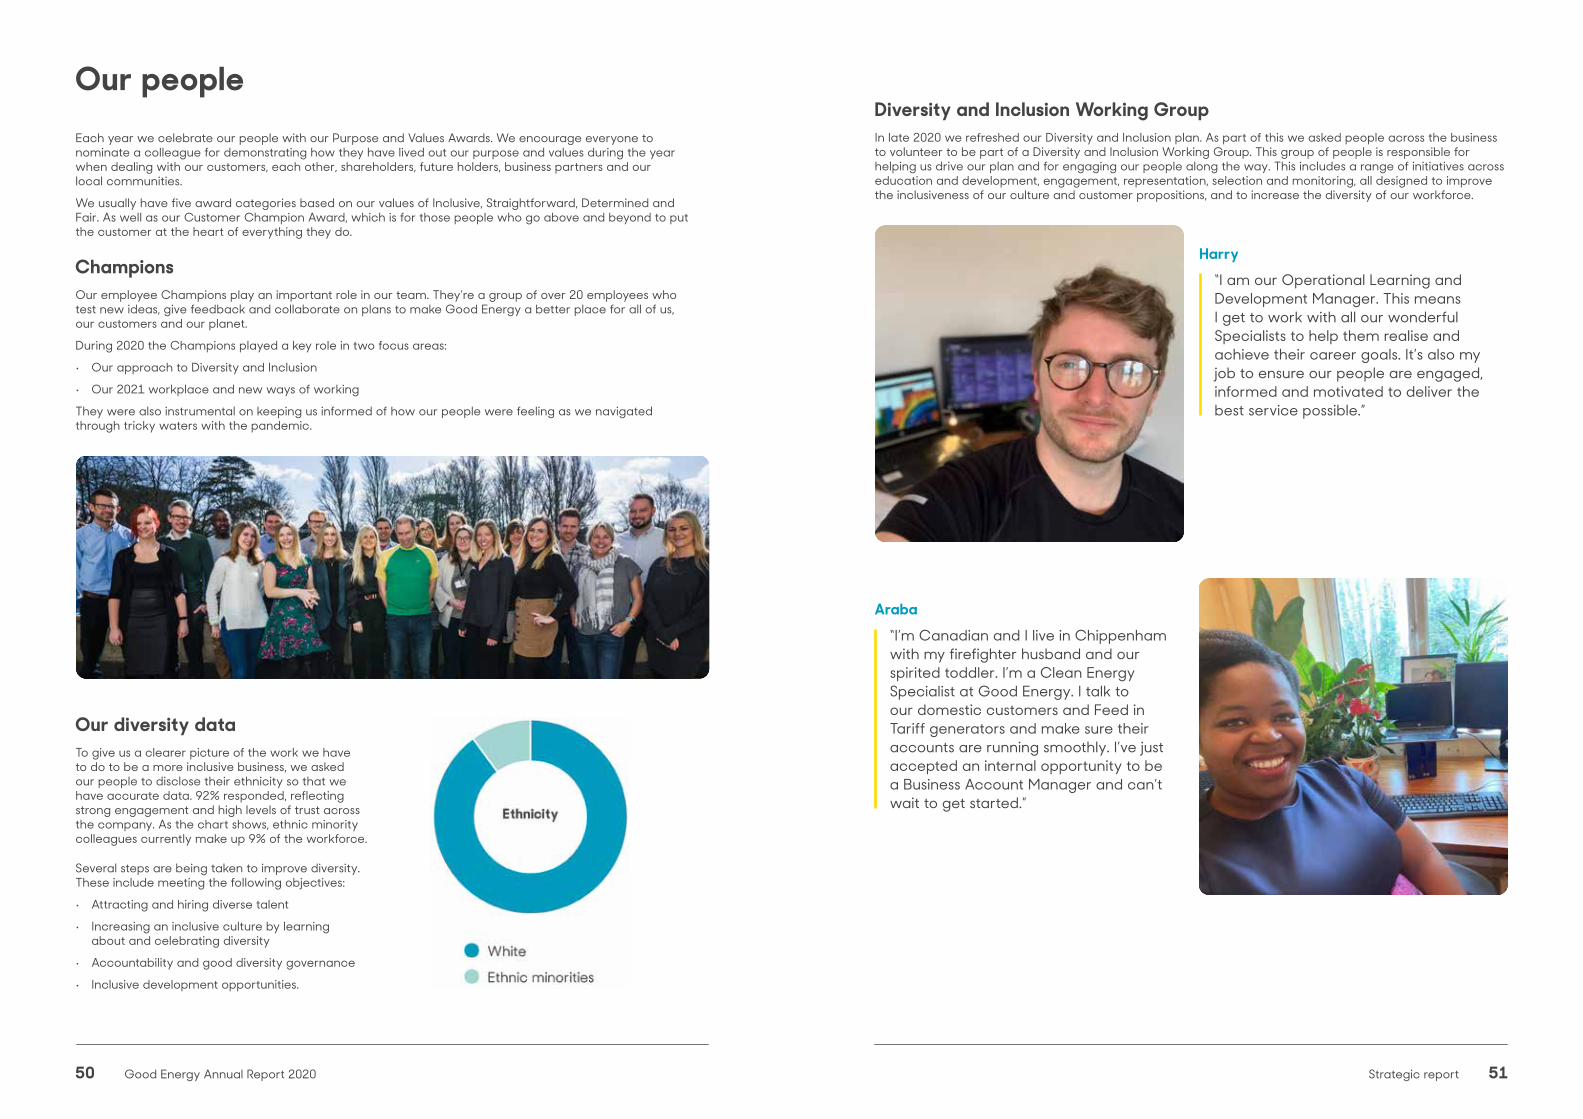
Our peopleEach year we celebrate our people with our Purpose and Values Awards. We encourage everyone to nominate a colleague for demonstrating how they have lived out our purpose and values during the year when dealing with our customers, each other, shareholders, future holders, business partners and our local communities.
We usually have five award categories based on our values of Inclusive, Straightforward, Determined and Fair. As well as our Customer Champion Award, which is for those people who go above and beyond to put the customer at the heart of everything they do.
ChampionsOur employee Champions play an important role in our team. They’re a group of over 20 employees who test new ideas, give feedback and collaborate on plans to make Good Energy a better place for all of us, our customers and our planet.
During 2020 the Champions played a key role in two focus areas:
• Our approach to Diversity and Inclusion
• Our 2021 workplace and new ways of working
They were also instrumental on keeping us informed of how our people were feeling as we navigated through tricky waters with the pandemic.
Our diversity data To give us a clearer picture of the work we have to do to be a more inclusive business, we asked our people to disclose their ethnicity so that we have accurate data. 92% responded, reflecting strong engagement and high levels of trust across the company. As the chart shows, ethnic minority colleagues currently make up 9% of the workforce.
Several steps are being taken to improve diversity. These include meeting the following objectives:
• Attracting and hiring diverse talent
• Increasing an inclusive culture by learning about and celebrating diversity
• Accountability and good diversity governance
• Inclusive development opportunities.
Harry“I am our Operational Learning and Development Manager. This means I get to work with all our wonderful Specialists to help them realise and achieve their career goals. It’s also my job to ensure our people are engaged, informed and motivated to deliver the best service possible.”
Araba“I’m Canadian and I live in Chippenham with my firefighter husband and our spirited toddler. I’m a Clean Energy Specialist at Good Energy. I talk to our domestic customers and Feed in Tariff generators and make sure their accounts are running smoothly. I’ve just accepted an internal opportunity to be a Business Account Manager and can’t wait to get started.”
Diversity and Inclusion Working GroupIn late 2020 we refreshed our Diversity and Inclusion plan. As part of this we asked people across the business to volunteer to be part of a Diversity and Inclusion Working Group. This group of people is responsible for helping us drive our plan and for engaging our people along the way. This includes a range of initiatives across education and development, engagement, representation, selection and monitoring, all designed to improve the inclusiveness of our culture and customer propositions, and to increase the diversity of our workforce.
50 Good Energy Annual Report 2020 Strategic report 51
Strategic ReportG
overnance ReportFinancial Statem
ents
53Governance Report52 Good Energy Annual Report 2020
Strategic ReportG
overnance ReportFinancial Statem
ents
Board of Directors 54
Governance & Directors’ Report 56
Audit & Risk Report 67
Remuneration & Nomination Report 71
Independent Auditors’ Report 86
Governance Report
53Governance Report52 Good Energy Annual Report 2020

Strategic ReportG
overnance ReportFinancial Statem
ents
54 55Good Energy Annual Report 2020 Governance Report
Strategic ReportG
overnance ReportFinancial Statem
ents
54 Good Energy Annual Report 2020 Governance Report
William (Will) Whitehorn – Non-Executive Chairman (Independent)Will focuses on fast-moving and growing companies, with extensive experience across a broad range of sectors, especially in technology, digital and branding.
Will currently holds a number of other Non-Executive roles across a range of companies, including space technology company AAC Clyde Space AB of Sweden. He is also Chairman of Craneware PLC and the Scottish Event Campus, host of COP 26. He was also one of the founding shareholders of Purplebricks Group PLC. He is a Non-Executive Director on the Royal Air Force Board with the rank equivalent to Air Vice-Marshal. In 2020, he was appointed President of UKspace.
Skills and Expertise: Will spent more than 20 years with Virgin Group, where he was responsible for global brand development and corporate affairs. He also played a key role in founding several Virgin businesses including Virgin Rail and Virgin Galactic and was special advisor to Sir Richard Branson.
Joined Board: July 2018
Responsibilities: Chairman of the Board
Member of Nominations & Remuneration Committee and Member of Audit & Risk Committee
Board of Directors
Juliet Davenport – Chief Executive OfficerJuliet is founder and Chief Executive Officer of Good Energy – a renewable energy company with a mission to power a greener, cleaner future together with its customers. Juliet has been an innovator for over 20 years, developing technologies and services to fight climate change and transform the energy sector for the better. In 2013, she was awarded an OBE for services to renewables. In 2020 Juliet was appointed Chair of Zap-Map and appointed to the board of The Crown Estate. She currently sits on the board of the Renewable Energy Association, Innovate UK and is Vice President of the Energy Institute. In addition, she sits on the advisory boards of leading UK think tanks, including Aurora, Oxford Energy and Grantham Institute.
Skills and Expertise: Worked for a year at the European Commission on European energy policy, then at the European Parliament on carbon taxation and holds a masters in environmental economics.
Rupert Sanderson - Chief Financial OfficerRupert joined us in February 2017 and is responsible for all finance, legal, company secretariat and trading matters, including managing our financial stakeholders. Having worked widely in larger support services and energy organisations as well as in supporting smaller organisations through growth programmes, Rupert brings valuable experience to Good Energy as it develops its services and propositions. His previous roles include senior financial and commercial positions at Centrica, British Gas, Serco and Avis Europe. In January 2020 Rupert was appointed to the Good Energy Board as Chief Financial Officer.
Rupert began his career as an accountant for PwC and is a Fellow of the Institute of Chartered Accountants in England and Wales.
Appointed CEO: 2002
Joined Board: January 2020
Nemone Wynn-Evans - Non-Executive Director (Independent)With extensive experience in the financial services sector, Nemone brings a broad range of skills across audit, risk management, business development, corporate finance, corporate governance, investor relations and marketing. She is currently Chair of the Nominations Committee, a member of the Audit Committee and is Senior Independent Director of Shepherds Friendly Society. Nemone also holds a number of roles across a range of companies, including as a Non-Executive at Hinckley & Rugby Building Society where she sits on both the Audit & Nominations Committees, is a Board Advisor at SORBUS Partners LLP and is a member of the Commercial Advisory Committee at Coventry University. She is also a Fellow of the Chartered Institute of Securities and Investments.
Skills and Expertise: Nemone began her career in the City of London and has worked with many listed PLC and PRA/FCA/FSA regulated companies, having acted as a Finance Director on the main board of a stock exchange.
Joined Board: February 2019
Responsibilities: Chair of Audit & Risk Committee
Member of Nominations & Remuneration Committee
Timothy (Tim) Jones – Non-Executive Director (Independent)Tim was appointed Non-Executive Director in December 2017 and is a Technology Executive, Advisor and Angel Investor who brings 25 years of digital innovation, execution and operation experience to the Board.
A former executive of Moneysupermarket Group PLC where he was CIO for 7 years and a co-founder and former Executive at AutoTrader UK. Now founder and CEO of Disrupt Club, a specialist digital advisory firm. In 2020, Tim was appointed a Non-Executive Director to the Zap-Map Board.
Skills and Expertise: Tim is a chartered engineer (CEng) and chartered IT professional (MBCS CITP) with a depth of experience in leading digital transformation and commercial growth; both scaling early stage companies and the formation and leadership of highly performing teams in established organisations. Tim has extensive experience in delivering innovative consumer propositions in various online sectors such as retail, automotive, travel, marketplace and the highly regulated verticals of insurance, financial services, energy and telecommunications.
Joined Board: December 2017
Responsibilities: Member of Audit & Risk Committee
Member of Nominations & Remuneration Committee
Emma Tinker – Non-Executive Director (Independent)Emma is a private equity investment Director who brings a wealth of investment experience. She is a Director of numerous renewable energy companies, established the renewable energy business at HG Capital in 2002 and founded Asper Investment Management in 2016 as the spin-out of that business where she is Chief Investment Officer. She has been a Director for renewable developers and independent power producers, working across a range of renewable technologies. Emma is also a Director of the Gardeners’ Royal Benevolent Society.
Skills and Expertise: Has substantial commercial experience spanning the entire lifecycle of investments in energy businesses, and has worked across a range of renewable technologies.
Joined Board: September 2016
Responsibilities: Chair of Nominations & Remuneration Committee
Member of Audit & Risk Committee
Governance Report 55

Strategic ReportG
overnance ReportFinancial Statem
ents
56 57Good Energy Annual Report 2020 Governance Report
OverviewGood Energy is committed to high standards of corporate governance and places good governance at the heart of the business. In July 2018, the Board of Good Energy formally adopted the Quoted Companies Alliance’s (“QCA”) code of corporate governance (“the Code”) in line with requirements of the London Stock Exchange’s AIM Rules. The Board believes that the QCA Code provides the Company with a rigorous corporate governance framework to support the business and its success in the long-term. The Code sets out 10 corporate governance principles. The ways in which Good Energy meets these principles is described in the following sections and incorporates information about the ways in which the Board discharges its duties under the Companies Act 2006, s172. This is also available to view on our website at group.goodenergy.co.uk.
1. Establish a strategy and business model which promote long-term value for shareholdersGood Energy is a different kind of energy company, powering the choice of a cleaner, greener future together. Guided by our principles and values, Good Energy has a track record of successfully challenging the way things are done, putting power back into the hands of families, communities and businesses across the country.
In establishing Good Energy’s strategy, the Board considered the long-term interests of Good Energy’s stakeholders and set a course which aligns those interests with those of the Company, promoting the long-term interests of the Company and long-term value for shareholders.
Good Energy’s strategy aims to provide customers with the tools to achieve a zero-carbon footprint across electricity, transport and heat in both Business and Domestic settings. Good Energy continue to invest across the business as we develop our propositions and a range of innovation projects to drive future profit growth and support the journey to a zero-carbon Britain.
Good Energy is well positioned to deliver long-term value for shareholders through the implementation of its strategy, focusing on:
• Core supply and generation business is able to operate efficiently and provide the ability to unlock future opportunities
• Energy as a service to help households and businesses generate, store and share clean power, using our deep green credentials and expertise in 100% renewable energy supply
• Scaling through innovation to apply our customer centric model to transport, heat, solar, storage and demand side flexibility
Good Energy continually reviews and aligns its business model to better enable delivery of its strategic ambitions. We have engaged our people through ongoing communication, using multiple channels to reinforce the pioneering, agile culture that enables Good Energy to continue to innovate and drive change.
The Strategic Report describes the excellent progress Good Energy has made in pursuit of its strategic ambitions and the momentum we are building to deliver the energy market of the future.
2. Seek to understand and meet shareholder needs and expectationsGood Energy is proud to have a diverse shareholder base, including a significant proportion of private shareholders (many of whom are also Good Energy customers) and other long-term investors. The Board seeks to understand the needs and expectations of its stakeholders, particularly shareholders, through insight gained from regular customer surveys and focus groups, periodic investor surveys and obtaining structured feedback from investor roadshows. Good Energy’s strategy responds to the insight gained through these consultations.
Good Energy provides shareholders and other stakeholders with relevant information in a timely and balanced manner and meets with its largest shareholders periodically to understand their views on Good Energy’s performance and future plans. Good Energy actively encourages shareholders to participate in its AGM as an opportunity for all shareholders to share their views openly with the whole Board and other shareholders. Please see principle 10 for more details about the AGM and shareholder engagement.
3. Consider wider stakeholder and social responsibilities and their implications for long-term successThe Board recognises its primary legal responsibility to promote the success of the Company for the benefit of its members as a whole, taking into account the interests of other stakeholders including customers, employees, partners, suppliers, regulators, the environment and the local communities in which Good Energy operates. Interpreting this responsibility, and in line with recommendations published by the GC 100, the Board considers that its duty is not to balance the interests of the Company and those of other stakeholders identified but instead to determine, after weighing up the relevant factors, the course of action it considers best leads to the long-term success of the Company.
Purpose-led from the outset, Good Energy continues to prove that the “other way” is better:
Governance & Directors’ report• In recognition of the many ways in which we
continue to support renewable energy generation across the UK, we secured a permanent derogation from OFGEM’s price cap in August 2019
• We’re the first energy company to be awarded the Good Housekeeping Institute’s new green accreditation after being verified as an “100% renewable electricity provider”. This is another way of showing people what we do is different.
• We were named “best green electricity supplier” and one of the UK’s most ethical companies of the last 25 years by Ethical Consumer Magazine
• We are also proud to have been an accredited Living Wage employer since 2015
Establishing the right culture is an integral part of delivering Good Energy’s strategy, in which employees are key internal stakeholders within the business and developing its culture. More information on this is outlined in principle 8.
You can find out more about where and how we source our energy, how we look after our people and how we treat our customers in the Strategic Report and at: group.goodenergy.co.uk.
As a purpose-led business, we aspire to be as transparent as possible about our activities. The Strategic Report describes what we’ve been doing to deliver our mission and reflects on our progress towards achieving our purpose.
4. Embed effective risk management, considering both opportunities and threats, throughout the organisationGood Energy recognises that effective enterprise risk management is critical to enable it to meet its strategic objectives.
We have a clear framework for identifying and managing risk, both at an operational and strategic level. Our risk identification and mitigation processes have been designed to be responsive to the changing environment in which we operate. The impact of emerging risks on the Company’s business model are also considered and used to make informed decisions, including as to the delivery and evolution of our strategy.
Key Risks faced by the Company are described on pages 28-31. While the risks are typical of the risks faced by other energy suppliers, we believe the Company is well positioned to mitigate these through a combination of our risk management processes, our control activity and the strategic direction we are pursuing.
Further information on risk management and controls are described in the Audit & Risk Committee Report on page 67.
5. Maintain the Board as a well-functioning, balanced team led by the ChairThe Board currently comprises two Executive and four Non-Executive Directors as described on pages 54-55. The roles and responsibilities of the Chairman, Non-Executive Directors, Executive Directors and the Company Secretary are clearly defined and regularly reviewed. Details of current roles and responsibilities are set out in the table overleaf.
The Board meets at least four times a year. For Board meetings, the management team submit reports for consideration and the Board has a formal schedule of matters reserved to it. The Board have access to the company secretarial team and are able to take independent advice in the furtherance of duties if necessary.
The Nominations & Remuneration Committee discusses members time commitments from Directors, particularly Non-Executive Directors. Over the period Non-Executive Directors spent 20-25 days with Good Energy, the latter if they are Chair of a Committee.

Strategic ReportG
overnance ReportFinancial Statem
ents
58 59Good Energy Annual Report 2020 Governance Report
The Board
Role of the Board • Setting Group strategy and objectives in collaboration with the Executive.
• Providing leadership, knowledge and experience to support and guide the Executive.
• Engaging with shareholders.
• Overseeing and monitoring business performance, internal controls, corporate governance and risk management.
• Oversight of principal risks – including competitive position, political risk and programme delivery.
Chairman William Whitehorn
• Effective running of the Board and its Committees in accordance with principles of good corporate governance.
• Setting the Board agenda.
• Managing the Board to ensure adequate time is allocated at Board meetings for discussion of all agenda items.
• Ensuring the Board receives accurate, timely and clear information.
Other Non-Executive Directors
• Providing knowledge, skills and external experience to support the Chairman and the Executive.
Chief Executive Juliet Davenport
• Overseeing the day-to-day operation of the Group’s business.
• Developing and implementing the Group’s strategy as approved by the Board.
• Establishing and maintaining formal and appropriate delegations of authority.
• Maintaining a close working relationship with the Chairman.
Chief Financial Officer Rupert Sanderson
• Developing and implementing the Group’s strategy as approved by the Board.
• Establishing and maintaining formal and appropriate delegations of authority.
• Overseeing and managing financial resources for the Group and its subsidiaries.
• Maintaining a close working relationship with the Chair of Audit & Risk Committee.
Role of the Company Secretary
• The Board and each Director has unlimited access to the Company Secretary. Eversecretary Limited served as the Company Secretary from 2 January 2020 to 1 February 2021 when the Company secretarial team transferred to LDC Nominee Secretary Limited, which currently serves as the Company Secretary and is responsible for:
• Acting as Secretary to the Board and its Committees, ensuring compliance with Board procedures and corporate governance requirements, Directors’ induction and ongoing training requirements.
• Providing governance, advisory and administrative support to the Board and its Committees.
• The UK Corporate Secretarial Team at Konexo UK, a division of Eversheds Sutherland (International) LLP appointed as Eversecretary Limited transferred to the Law Debenture Corporation p.l.c. (“LawDeb”) on 1 February 2021. The LawDeb appointed company secretary is LDC Nominee Secretary Limited.
Other information:• The roles of Chairman and Chief Executive have
always been split with the Chairman acting in a non-executive capacity.
• The Executive Directors are accountable to the Board for the operating and financial performance of the Group.
• The Board is also responsible for approving the appointment of Executives, setting Executive remuneration and devising incentive programmes, agreeing financial and accounting policies and ensuring that the shareholders are properly informed about the state of the businesses. In addition, the Board is responsible for the appointment and removal of the Company Secretary.
• At the end of the reporting period, the Board comprised the Chairman, Chief Executive Officer, Chief Financial Officer and three Non-Executive Directors, each of whom the Board considers to be independent.
• The Board is satisfied that it currently has a sufficient range of relevant operational and financial experience to be able to discharge its responsibilities.
• The Board has constituted two Committees: Audit & Risk and Nominations & Remuneration. Both Committees comprise only Non-Executive Directors.
• One of the Directors has a substantial shareholding in the Company, in aggregate representing approximately 3.8% of the issued capital. All current Directors hold shares in the Company although the Company does not require them to do so.
• Over the period, the Board and the Executive team have worked together to evolve the flow of information to the Board. This has resulted in simpler, insight- focussed reporting to facilitate effective debate and enable robust and timely decision-making.
6. Ensure that between them the Directors have the necessary up-to-date experience, skills and capabilitiesThe Board is satisfied that it has an appropriate balance of skills and experience as well as an appropriate balance of personal qualities and capabilities to deliver the Company’s long-term strategic objectives. The Board is committed to maintaining balanced representation of both women and men across the organisation, including at Board level and within the Executive team.
The Board regularly reviews its composition and that of its Committees to ensure it has access to diverse perspectives and the necessary up-to-date
experience, skills and capabilities to discharge its duties effectively. The Board also reviews the length of time each Director has served on the Board and assesses if contributions made by each Director remain effective. Details of the Director’s tenure can be found on page 60.
Changes are made to the composition of the Board and its Committees to ensure the right balance of complementary skills and capabilities for the next phase of Good Energy’s strategic direction. The Nomination and Remuneration Committee also works to ensure the right balance of skills, knowledge and capabilities on the Board.
Further information about the Board, including biographies describing each Director’s experience, are set out on pages 54-55 and the Nomination and Remuneration can be found on pages 71-77.
The Company encourages each Director to identify their individual training needs to support the effective operation of the Board and the delivery of the Company’s strategy. The Company provides specific training on renewable energy and energy markets both in house and using external providers as appropriate. Over the period, the Board have also received briefings on a variety of topics including developments in corporate governance and appropriate handling of personal data, insight from shareholders, customers and staff on their views and expectations of Good Energy as well as formal briefing from the Company’s nominated adviser on updates to the AIM rules and other capital markets matters.
Procedures are in place to enable individual Directors to seek independent advice at the expense of the Company and appropriate cover is in place. The Board and its Committees may take external advice as appropriate.
7. Evaluate board performance based on clear and relevant objectives, seeking continuous improvementThe Board conducts an annual evaluation process to assess its effectiveness, as well as that of its Committees and the individual Directors, to drive its continuous improvement. The process is described in more detail on page 65.
8. Promote a corporate culture that is based on ethical values and behavioursThe Board recognises the importance of its role in promoting and monitoring the Company’s desired culture and ensuring it is consistent with the Company’s long-term strategic objectives.
Good Energy is a different kind of energy company. Our core values - fair, straightforward, determined and inclusive – underpin the delivery of our purpose to power the choice of a cleaner, greener future together.

Strategic ReportG
overnance ReportFinancial Statem
ents
60 61Good Energy Annual Report 2020 Governance Report
See Principle 3 and further information in the Strategic Report on pages 38-51 and the Nomination & Remuneration Report on pages 71-77.
Good Energy operates on the principle that a workplace where people’s differences are valued creates a more productive, innovative and effective organisation. We also recognise that attracting, retaining and incentivising key talent is integral to its ability to meet its strategic objectives.
The Group’s employment policies follow best practice based on equal opportunities for all employees, irrespective of race, gender, nationality, sexual orientation, disability, marital status, religion or age. All decisions relating to employment are objective, free from bias and based upon work criteria and individual merit. Consultation with employees or their representatives has continued at all levels, with the aim of ensuring that views are taken into account when decisions are made that are likely to affect their interests and that all employees are aware of the financial and economic performance of the business.
In 2020, Good Energy introduced a Diversity and Inclusion working group to enhance the Company’s commitment to a diverse workplace beyond gender. Find out more about Diversity and Inclusion, gender pay and our approach to modern slavery in the strategic report and in the Nomination & Remuneration report as well as on the Company’s website group.goodenergy.co.uk
Good Energy completed a group-wide upgrade of its control environment in 2015, introducing a code of conduct: a ‘Guiding Principles’ approach that is appropriate for a fast-growing business. By design, our Guiding Principles reflect the Board’s duties under the Companies Act 2006, s172. This ensures everyone who works at Good Energy reflects our ethos and
values when working together and that our policy and procedural framework supports the Board in discharging its duties.
Our Guiding Principles:
• provide a framework to empower Good Energy employees to make informed decisions that are in the best interests of the Company and its customers and other stakeholders
• reflect the environment in which the Company operates
• mitigate risk
• explain where our employees can get advice
• demonstrate the Group’s commitment to working with honesty, respect and transparency
• Include policies relating to, amongst other things, customer service, data handling, health & safety, approvals & authorities, procurement, and corporate responsibility
The Guiding Principles are refreshed at least annually and the Group continues to evolve the way in which it secures engagement from employees at all levels across the organisation.
In addition, in 2020 we launched an internal Governance Hub for our people. The hub contains all policies, information security, data protection and wider information management such as training material and FAQs. This enables collaboration between our people in an easy to access format.
1. Data as at 31 December 2020.
Gender Diversity1
Non-Executive Tenure1
Female
Male
Non-executive
Executive
0-2 Yrs
2-5 Yrs
Balance of the Board1
9. Maintain governance structures and processes that are fit for purpose and support good decision-making by the BoardGood Energy’s governance structures support its corporate culture and are appropriate to its stage of development and the complexity of the business. The Board has established a Nominations and Governance Committee and an Audit and Risk Committee to support effective governance and decision-making.
The key areas for focus for the Committees are listed on the next page.
The Board continuously monitors the effectiveness of its governance structures, enabling them to evolve over time to support Good Energy’s growth and development.
10. Communicate how the Company is governed and is performing by maintaining a dialogue with shareholders and other relevant stakeholdersAs described above, the Board considers that its duty is not to balance the interests of the Company and those of other stakeholders but instead to determine, after weighing up the relevant factors, the course of action it considers best leads to the long-term success of the company. Good Energy welcomes dialogue with shareholders, particularly the need for open communication on the Company’s strategy and takes care to calibrate perspectives expressed by individual members in the context of Good Energy’s members as a whole.
Principal communications with shareholders are conducted through the Annual and Interim results, AGM and interim RNS announcements on key
business developments. Good Energy supplements its Annual and Interim results with presentations to analysts and other interested stakeholders (all available on its website) and meets with larger shareholders at least twice annually to discuss both performance and governance, as well as our future plans as well as one to one meetings.
Good Energy’s Investor Relations team supports effective communications with shareholders and other investors and can be contacted at: [email protected]. In addition, there is a dedicated group website and option to sign up to investor related alerts.
The Board actively encourages shareholder participation at its Annual General Meeting and other general meetings from time to time. As such, in 2020 Good Energy introduced the Investor Meet Company platform enabling all shareholders to interact with the CEO and CFO at key financial events.
The Board also recognises the importance of ensuring that the Company maintains effective engagement with other stakeholders and taking into account the interests of internal and external stakeholders when making decisions at Board level. Examples of ways in which Good Energy maintains active communication with other stakeholders include:
Customers:
• updating customers on Good Energy’s activities through regular newsletters, communications via digital platforms and publication of content on goodenergy.co.uk and on the Company’s social media channels;
• hearing customers views and expectations of Good Energy through thematic assessment of customer contact, gathering in the moment feedback from customers during or immediately
The Board’s Committees
Nomination & Remuneration Committee Audit & Risk Committee
Board Composition Corporate Governance
Succession planning Financial Reporting
Board nominations Internal Controls
Remuneration policy Risk Management
Incentive design and target setting External Auditor
Executive remuneration review Oversight of principal risks

Strategic ReportG
overnance ReportFinancial Statem
ents
62 63Good Energy Annual Report 2020 Governance Report
following calls, conducting periodic consumer focus groups and regular customer surveys; and
• involving customers in trials of new products and services.
People
• engaging our people regularly with Good Energy’s purpose and performance through structured, monthly company-wide briefings with Q&A;
• maintaining regular engagement with our people both individually and through an established group of employee champions from across the business;
• encouraging information sharing and debate via our internal Intranet and communication forum Yammer; and
• conducting regular engagement surveys and taking into account the feedback received.
Bondholders
• progress updates are provided via the Company’s websites, investor newsletters and periodically as part of other communications to bondholders, for example within letters enclosing notice of interest payments.
Delivery partners and suppliers
• operating a tailored approach to support the development and maintenance of strategic relationships.
Local communities
• maintaining open relationships with local authorities and key business groups in Wiltshire and the South West;
• continuing our engagement with communities hosting Good Energy’s renewable generation assets and publicising externally; and
• assisting community funds to support COVID-19 related projects;
• providing talks in local schools.
Policy-makers and regulators
• maintaining a constructive dialogue with policy-makers on matters relevant to Good Energy’s strategy and current operations;
• regular engagement with the energy regulator, Ofgem, both bilaterally as well as through public consultations and industry forums; and
• engagement with thinktanks and consumer groups who hold positions of policy influence in the energy sector; and
• targeted participation in industry groups aligned to Good Energy’s purpose, values and strategy.
The Board and its CommitteesThe Board is ultimately responsible to shareholders for the direction, management and performance of the Company and its business.
Biographies of the Board’s Directors are set out pages 55-55. Details of the Directors’ remuneration, including share options, are set out in the Nominations and Remuneration report on pages 71-77. Details of the Directors’ interests in ordinary shares in the capital of the Company are set out on page 80 under Statutory and other information.
The Board maintains a list of matters reserved for its approval, generally being items which affect the shape, risk profile or strategic direction of the Group, as well as the key financial items. The Board reviews this schedule annually and it is updated as necessary.
The Board has established two principal committees which focus on particular areas as set out overleaf. The Chair of each Committee reports to the Board on its activities after each Committee meeting. Reports from each Committee are included later in this section.
Matters that are not reserved to shareholders, the Board or one of its Committees are the responsibility of the Executive Directors who have established and maintains a documented schedule of delegations of authority to members of the Executive and other management. This delegation of authority is incorporated within the Company’s Guiding Principles and includes a detailed authorisation matrix covering financial limits and approvals needed when conducting business on behalf of the Group. The delegation of authority is reviewed by the Board at regular intervals.
Board and Committee compositionThe following table sets out the composition of the Board and its committees as at 31 December 2020:
Board Nominations & Renumeration
Audit & Risk Management
Juliet Davenport (CEO) – –
Rupert Sanderson (CFO) – –
Will Whitehorn (Chairman)
Emma Tinker (Non-Executive)
Tim Jones (Non-Executive)
Nemone Wynn-Evans (Non-Executive)
Chair Member – Not applicable/invitation only
Board & Committee ChangesAs part of its annual evaluation process and otherwise as required, the Board reviews its composition to ensure that the Group has access to a balance of complementary skills and experience to enable the Group to achieve its strategic ambitions and wider purpose.
Rupert Sanderson, Chief Financial Officer, was appointed to the Board on 8 January 2020.
In February 2021, the Company announced Juliet Davenport will be transitioning from Chief Executive Officer to a Non-Executive Director position. In April 2021 the Company announced the appointment of Nigel Pocklington as Chief Executive Officer.
Independence of the Non-Executive DirectorsThe Board conducts an annual review of the independence of the Non-Executive Directors and considers all of its Non-Executive Directors to be independent in both character and judgement.
The Chairman, Will Whitehorn, was independent upon appointment to the Board in July 2018.
Directors’ Indemnities and InsuranceAs permitted by the Company’s Articles of Association, the Directors have the benefit of an indemnity which is a qualifying third party indemnity provision as defined by Section 234 of the Companies Act 2006. The indemnity was in force throughout the last financial year and is currently in force. The Company also purchased and maintained throughout the financial year Directors’ and Officers’ liability insurance in respect of itself and its Directors and Officers.

Strategic ReportG
overnance ReportFinancial Statem
ents
64 65Good Energy Annual Report 2020 Governance Report
Board Audit & Risk Committee
Nominations & Remuneration
Committee
Executive Directors
Juliet Davenport 6/6 4/4 3/3
Rupert Sanderson 6/6 4/4 2/32
Non-Executive Directors
Will Whitehorn 6/6 4/4 3/3
Emma Tinker 6/6 4/4 3/3
Tim Jones 6/6 4/4 3/3
Nemone Wynn-Evans 6/6 4/4 3/3
Board and Committee Attendance
2. Rupert Sanderson part-attended the Remuneration & Nomination Committee meetings
Operations of the BoardDetails of the number of scheduled Board meetings and attendance of Directors is set out in the table on page 64. The Group’s performance is reviewed at these scheduled meetings and the Board is responsible for agreeing and reviewing the strategy for the Group, for which it maintains both short term (twelve months) and longer-term (three to five years) plans.
In addition, it is responsible for matters relating to employee recruitment and remuneration, strategy, health and safety and other specific subject areas.
Where relevant, members of the Executive team and other senior leaders within the business are invited to attend Board and Committee discussions. Members of the Board also engage with members of the Executive team and other senior leaders directly on relevant initiatives.
During the year, the Board and relevant Committees convened a number of ad-hoc proceedings to support the Group in developing, refining and implementing initiatives in support of its strategic ambitions. In addition, the Board or relevant Committees held regular informal discussions on a variety of topics to consider the impacts of macro-economic events, developments in Government policy and to provide guidance and insight to support the Company in delivering its short term and longer term objectives.
The Board conducts a formal review of the Group’s strategy at least annually, at which all Board members and all of the Executive team are present.
Board packs are generally circulated at least one week ahead of scheduled meetings to allow adequate time for the Board and/or Committee Members to review information and prepare. Where a Director is unable to attend a meeting, the materials for the meeting are provided to them and subsequent briefings are provided as appropriate.
The Chairman and Chief Executive maintain regular contact and the Chairman receives a briefing from the Chief Executive before each scheduled Board meeting. The Chairman provides a briefing to the Non-Executive Directors before each scheduled Board meeting to align priorities and maximise the Board’s effectiveness at meetings. The Chairman also regularly de-briefs with the Non-Executive Directors after meetings to capture feedback and identify opportunities for improvement. The Executive Directors do not participate in these discussions.
All Directors have the right to request that any concerns they have are recorded in the appropriate Committee or Board minutes.
The Board reviews the operational and financial performance of the Group for each month against a pre-agreed set of performance targets. In addition, the Board receives information through a system of continuous financial planning which enables it to better manage profit and cash flow forecasting, and to inform investment decision making. The formal financial plan
for the forthcoming year is reviewed and authorised by the Board.
The Board and each of its Committees have access to the services of the Company Secretary and external advisers as necessary.
Executive TeamThe roles of Chief Executive and Chairman have always been split, with the Chairman operating in a Non-Executive capacity. An outline of the roles and responsibilities of the Chairman, Chief Executive, other Executive Directors and, Non-Executive Directors are provided on page 58.
As at 31 December 2020 the Executive comprised the Chief Executive, Chief Financial Officer, Chief Commercial Officer, and Director of People & Customer Operations. The Chief Financial Officer was appointed to the Board on 2 January 2020.
The Executive team is an executive-level forum of the Group’s most senior leaders, chaired by the Chief Executive. It comes together to communicate, review and agree on issues and actions of Group-wide significance. It helps to develop, implement and monitor strategic and operational plans, considers the continuing applicability, appropriateness and impact of risks, leads the Group’s culture and aids the decision-making of the Chief Executive and Chief Financial Officer in managing the business in the performance of their duties.
In 2020 we implemented regular forums to provide clearer governance allowing the Company to strengthen in good decisions, reduce risks, and review strategic plans, alongside the Audit & Risk Committee and the Nominations & Remuneration Committee. Monthly forums include the Executive Committee, Customer Board and People & Operations Board. The Budget & Forecasting Board are held quarterly and the Energy & Assets Board is held monthly. The Executive and Sales & Operations meetings are weekly.
In February 2021, the Company announced Juliet Davenport will be transitioning from Chief Executive Officer to a Non-Executive Director position. In April 2021 the Company announced the appointment of Nigel Pocklington as Chief Executive Officer.
Board and Directors’ Performance Evaluation In the period a full evaluation was undertaken by way of a Board effectiveness questionnaire. Results were analysed, discussed and actions set for 2021 to ensure an effective Board.

Strategic ReportG
overnance ReportFinancial Statem
ents
66 67Good Energy Annual Report 2020 Governance Report
Succession planningThe Board considers succession planning a vital task and periodic reviews of the approach to succession planning will include contingency, short-medium-long term planning for the Chair, CEO and Executitive team. As noted above, CEO succession planning took place in early 2021. The Company appointed an Executive search firm to recruit a new CEO. The process covered a pool of external and internal candidates. As internal candidates were considered, the Good Energy NEDs operated an independent process for this exciting role to take the Company into its next phase of growth.
Performance of Individual DirectorsThe individual performance of Executive and Non- Executive Directors is reviewed periodically.
The Chairman conducts an individual annual appraisal with the Executive Directors and each Non-Executive Director. The cumulative time commitments of Non-Executive Directors are reviewed as part of the annual performance evaluation to ensure that no Non-Executive Director becomes over-committed and is able to devote sufficient time to the Company to discharge duties effectively. The Chairman’s performance is reviewed by the Non-Executive Directors, with input from the Executive Directors and members of the Executive Team as part of the Board effectiveness review.
The performance of members of the Executive team is discussed at the Nominations & Remuneration Committee during the first quarter each year and on an ad hoc basis as required. Aside from the CEO attending when relevant, members of the exec team do not attend that discussion.
Annual General Meeting (AGM)Our preference had been to welcome shareholders in person to our 2021 Annual General Meeting, particularly given the constraints we faced in 2020 due to the COVID-19 pandemic. However, at present this will not be possible due to restrictions still in place.
We are therefore proposing to hold the Annual General Meeting with the minimum attendance
required to form a quorum. Shareholders are strongly encouraged to appoint the Chairman as their proxy in advance, to ensure that they can vote and be represented at the 2021 AGM.
The health and wellbeing of our shareholders is of paramount importance to us. Any shareholders attempting to attend in person will be refused entry.
Given the constantly evolving nature of the situation, should circumstances change before the time of the Annual General Meeting we will notify shareholders of the change by RNS and on our website as early as possible before the date of the meeting.
There will be opportunity for shareholders to ask questions ahead of the meeting and the details will be provided to shareholders in due course.
The AGM notice will be circulated to members through their preferred communication methods and will also be available to view on the Group’s website at group.goodenergy.co.uk.
A poll is conducted on each resolution at all Company general meetings except in the circumstance of a closed meeting. All shareholders have the opportunity to cast their votes in respect of proposed resolutions by proxy, either electronically or by post. Following the AGM, voting outcomes are published and are made available on the Group’s website.
Good Energy BondsThe first repayment date for Good Energy Bonds II is 30 June 2021. The Company received £420,750 worth of redemption requests for repayment on 30 June 2021.
On 1 April 2021, Good Energy announced it anticipates repayment of the bond in 2022. Further details are available on the Group’s website: group.goodenergy.co.uk/investor-centre/bond-information/good-energy-bonds-two, and will be communicated directly to bondholders.
OverviewGood Energy recognises that effective risk management is critical to enable it to meet its strategic objectives.
The Company has a clear framework for identifying and managing risk, both at an operational and strategic level. Its risk identification and mitigation processes have been designed to be responsive to the changing environment in which it operates. The impact of emerging risks on the Company’s business model are also considered and used to make informed decisions, including as to the delivery and evolution of the Group’s strategy.
A summary of the key risks facing the Group is set out in the Strategic Report on page 28.
The Board retains overall responsibility for the Company’s risk management and internal controls framework. While the Board reviews the Company’s principal risks and the suitability of the internal controls annually, responsibility for reviewing the effectiveness of risk management and internal controls is delegated to the Audit and Risk Committee which reviews this on an annual basis. The system of
Audit & Risk Management report
“Good Energy recognises that effective risk management is critical to enable it to meet its strategic objectives”
Nemone Wynn-Evans Chair of Audit & Risk Committee
internal controls is designed effectively to manage, rather than eliminate, the risk of failure to achieve business objectives.
Audit & Risk CommitteeThe members of the Audit and Risk Management Committee are shown on page 63.
Emma Tinker and Nemone Wynn-Evans are considered to have recent and relevant financial experience. The Chief Executive attends meetings of the Committee by invitation only together with the Chief Financial Officer and Audit & Risk Specialist.
The primary duty of the Audit and Risk Committee is to oversee the accounting and financial reporting process, the internal accounting practices, external audit arrangements and effectiveness of the Group’s risk management and internal control system. Further reviews were undertaken throughout 2020 in light of the COVID-19 outbreak.
The Audit and Risk Committee also meets at least annually with the Group’s external auditors to review and agree the audit services being provided to the Group, including any non - audit services. It also meets with external auditors, without management being present, to discuss the audit process. During the period, the Committee:
• oversaw an upgrade of the enterprise risk management framework to improve business integration;
• oversaw ongoing improvement of financial and operational reporting and controls;
• were consulted on the implementation plan for the Kraken and Ensek projects; and
• were consulted on the adjustments to financial reporting and provisioning as a result of the Covid-19 outbreak and its economic impact.
Risk control environment and internal auditThe Company has an established risk and internal audit function which falls under the remit of the Chief Financial Officer and was led by the Head of Commercial Finance and Internal Audit throughout the year.
The function is responsible for Good Energy’s risk management activities, and internal audits. As such, its activities include ensuring the regular review of internal controls relating to key risks, reporting on risk events to the Audit & Risk Committee and reviewing and testing the effectiveness of internal controls through audit reviews. The Company has a dedicated Compliance Team in place to provide context to company risk and assurance at an operational level to support the internal audit function. Key Risks are shown on pages 28-31 in the Strategic report.

Strategic ReportG
overnance ReportFinancial Statem
ents
68 69Good Energy Annual Report 2020 Governance Report
Since completing its groupwide upgrade of the control environment in 2015, Good Energy has continued to evolve its code of conduct, a ‘Guiding Principles’ approach that is appropriate for a fast-growing business. This ensures everyone who works at Good Energy reflects the Company’s ethos when working together.
The internal audit and risk management function aims to build on initiatives such as the Company’s Guiding Principles, to enhance the control environment. Reporting into the Audit and Risk Committee, the function has carried out audit activity to provide assurance that key risks are being identified and mitigated, and associated controls are operating effectively.
Going Concern The financial statements have been prepared on the going concern basis as the Directors have assessed that there is a reasonable expectation that the Group will be able to continue in operation and meet its commitments as they fall due over the going concern period.
The Group continues to respond well to the challenges associated with the Covid-19 pandemic. All core business functions continue to perform as expected during remote working, and the operation of generation sites has not been affected by lockdown periods. The implementation of our new customer technology platform is progressing as planned which provides us with flexibility to operate and deliver all services to customers.
The additional cash released through the restructuring of the financing of the Group’s renewable generation asset portfolio, has provided the Group with £7.8m of unrestricted cash. This financing restructure also represents a loosening of covenant ratios compared to the existing GCP facility.
Looking to the future, the Group has performed a going concern review, going out until December 2022 for prudence, considering both a Base Case and a Downside Case. Having reviewed this forecast, and having applied a reverse stress test, the possibility that financial headroom could be exhausted is considered to be extremely remote.
The Base case assumes continued depressed Commercial volumes for the first half of 2021 due to Covid-19 related lockdowns, recovering to normal levels by the end of 2021. It also assumes no cash flow mitigations are actioned during the years covered by the Going Concern review and that the Group will repay the bond on its entirety by June 2022.
The Downside case assumes Commercial volumes remain depressed until the end of December 2021 and assumes higher levels of customer churn than expected in the Base case.
Directors consider the main risks to going concern to be liquidity and compliance with covenants, and so have performed a Reverse Cash Stress Test. This shows that it is very unlikely that the Group will have problems with liquidity or covenants during the year, as there is significant headroom above both the Base case and the Downside case.
The Group has long standing and well operated trading relationships with a number of counterparties, the majority of which contain an agreement that the Group’s Tangible Net Worth (defined as paid up shareholder cash contributions plus retained earnings) should not decrease by more than 25% over a 12 month period or fall to below a certain level. Tangible Net Worth covenants are tested annually on publication of audited financial statements. Breach of this financial covenant allows counterparties, if they so decide, to request additional financial support (which may be in the form of a parent company guarantee, letter of credit or other financial security). The counterparty may terminate the contract if appropriate additional financial security is not provided, if requested, within a timely manner. The value at risk with counterparties based upon current commodity contracts and current market prices is estimated at approximately £0.3m. The Group’s electricity is purchased from direct relationships with generators, with power hedged and balanced by trading with counterparties. This reduces the Group’s reliance on trading counterparties when compared to a supplier without such supplier relationships.
The Group’s borrowings with GCP, amounting to £39.8m after the restructure performed in April 2021, contains three covenants being two debt service cover ratios (DSCR) and a loan life cover ratio (LLCR) specifically associated with the generation assets. The new loan facility has reset the DSCR and LLCR cover ratios . Compliance with these covenants is based on generation prices and volumes, which the Board has concluded are unlikely to materially decrease due to any foreseeable reason. Covenant over Cooperative Bank has been extinguished and the GCP covenant has been reset due to the refinancing.
In order for the business to run out of cash and breach a counterparty covenant, the Reverse Cash Stress Test requires that 31% of commercial debts, and 32% of domestic debts are not collected after government Covid-19 reliefs start to taper off, for a period lasting 6 months, and that only 50% of these debts not originally collected are subsequently collected over a period of 9 months post-March 2022. In this case, cash flow mitigations would be implemented, mostly reductions in discretionary spending. The directors believe that this scenario is very unlikely as a result of the historic evidence gained from our sustained performance during 2020, which was a year impacted significantly by Covid. Throughout 2020 the Group’s cash collections have remained strong, with bad debt write offs similar to a usual year.
Therefore, Directors are confident in the ongoing stability of the Group, and its ability to continue operation and meet its commitments as they fall due over the going concern period. Accordingly, the Directors adopt the going concern basis in preparing the financial statements.
External Audit Auditor appointment
Following a competitive tender process, the Group appointed Ernst & Young as auditors during 2017. Ernst & Young’s appointment was confirmed by members at the 2018 AGM. Ernst & Young LLP continue as the Company’s auditors. The Committee has been considering re-tendering during the year. This will be finalised over the course of 2021.
Auditor independence
The Audit and Risk Committee monitors the Group’s safeguards against compromising the objectivity and independence of the external auditors. It annually reviews any non-audit services provided to the Group and their cost, and whether the auditors believe there are any relationships that may affect their independence and obtaining written confirmation from the auditors that they are independent.
The Audit and Risk Committee has also reviewed its policy for awarding non-audit work.
For the financial year ended 31 December 2020, the Committee has conducted its review of the auditors’ independence and concluded that no conflict of interest exists between Ernst & Young LLP audit and non-audit work. The Audit and Risk Committee is using Ernst & Young for audit only services.
Audit and non-audit fees
The Audit & Risk Committee reviewed the remuneration received by Ernst & Young for non-audit work conducted during the period as part of assessing their independence. For further details regarding fees paid, see note 7 to the financial statements.
Whistleblowing PolicyThe Group’s whistleblowing policy is supported by a clear process where concerns can be raised internally at all levels as well as to the Non-Executive Directors. An independent person may be engaged in some cases. The policy also includes reference to the list of prescribed persons or bodies that may be contacted outside of Good Energy, with contact details. The policy applies to any person, from employees to casual contract workers, who may raise concerns about wrong doing, poor practices, risks or dangers in relation to the Company’s business dealings or activities.
The Whistleblowing Policy is reviewed annually by the Audit and Risk Committee. Any whistleblowing incidents and their outcomes are reported to the Committee. No reports were made during 2020.

Strategic ReportG
overnance ReportFinancial Statem
ents
70 71Good Energy Annual Report 2020 Governance ReportGood Energy Annual Report 201970
Nomination & Remuneration report
OverviewGood Energy operates on the principle that a workplace where people’s differences are valued creates a more productive, innovative and effective organisation. The Company also recognises that attracting, retaining and incentivising key talent is integral to its ability to meet its strategic objectives.
The Board retains overall responsibility for the Company’s people and reward strategies.
Diversity and inclusion are beliefs which Good Energy are passionate about and continue to promote throughout the company and in 2020 a Diversity & Inclusion working group was established involving employees from across the business. Diversity at Good Energy provides different perspectives which are highly valued as these differences support the Company in achieving its purpose. The Company believe inclusion and diversity are consistent with its values and are considered in recruitment selection processes, opportunities for development and promotion, pay and benefits for its people. Diversity,
“A workplace where people’s differences are valued creates a more productive, innovative and effective organisation”
equality & inclusion guidance and online training is provided to all employees during induction.
The Diversity and Inclusion volunteer working group have been working hard on employee engagement, analysing data and implementing initiatives to enhance the Company’s commitment to a diverse workplace beyond gender. More details are available in the Strategic Report.
While the Board reviews the suitability of these strategies annually, responsibility for reviewing the effectiveness of these strategies and underlying plans is delegated to the Nominations & Remuneration Committee.
The Nominations & Remuneration CommitteeThe members of the Nominations and Remuneration Committee are Emma Tinker (Chair), Will Whitehorn, Tim Jones and Nemone Wynn-Evans, all of whom are independent Non-Executive Directors.
The primary duties of the Nominations & Remuneration Committee are to:
• review the structure, size and composition of the Board and its Committees to ensure that they remain appropriate to support the Company’s growth and development, and making recommendations to the Board;
• ensure that there is a formal, rigorous and transparent process for the appointment of new Directors to the Board;
• to consider and develop succession plans appropriate for the Group;
• determine the Group’s approach to the remuneration of the Executive Directors and senior managers of the Group, on behalf of the Board;
• conduct an annual appraisal of the performance of the Executive Directors;
• assess Company performance against performance targets within reward schemes; and
• oversee the group-wide remuneration strategy, particularly with respect to diversity, inclusion and gender pay.
No Director may be involved in any decisions as to their own remuneration.
The functions of a Nominations Committee were introduced to the pre-existing Remuneration Committee during 2016. In 2019, the Board considered whether these functions would be better separated into two separate committees and concluded that it remained appropriate for the functions to be combined within a single committee. The Board will review this periodically.
Emma Tinker Chair of Nomination and Remuneration Committee

Strategic ReportG
overnance ReportFinancial Statem
ents
72 73Good Energy Annual Report 2020 Governance Report
• a Performance Share Plan for Executive Directors and members of the senior management team, details of which are set out on page 76.
The Company has reported its first CEO pay ratio relative to its employees. Going forward, a comparative table will be built up providing a transparent view to the ratio. See page 81 for details.
Remuneration PolicyDetails of the Company’s Nominations & Remuneration Committee are set out on page 63.
The Nomination & Remuneration Committee has designed and adopted a remuneration policy to ensure that the Company is able to attract, retain and motivate its Executive Directors and senior management.
The Group operates in a competitive environment and sets out to provide competitive remuneration to all of its employees, appropriate to the business environment, geographical location and strategic aims of the Company.
The Group aims to align the interests of shareholders with those of Executive Directors and senior management by giving the latter the opportunity to build up a shareholding interest in the Company.
Service agreements, notice periods and termination paymentsThe service agreements for the Executive Directors are not for a fixed term and may in normal circumstances be terminated on the notice periods listed on the following page.
The remuneration of the Chairman of the Company and the Non-Executive Directors consists of fees that are paid monthly in arrears.
The Chairman and the Non-Executive Directors did not participate in any bonus scheme or long-term incentive reward schemes, nor did they accrue any pension entitlement during the period. Following the publication in August 2015 of HMRC’s express confirmation of the travel rules that apply to Non- Executive Directors, the Company reimburses Non- Executive Directors’ travel expenses between home and the Company’s Head Office. The key terms of the Non-Executives Directors’ appointments are set out in the table on the following page.
The Group reviewed Non-Executive Director fees and concluded that the existing annual fees and structure remain appropriate. See table overleaf. The fee for each Non- Executive Director is £25,000, with an additional fee for those that chair a committee. The fee payable to the Chairman is £45,000.
Executive salaries were also benchmarked during the year against AIM company data and adjusted where necessary to reflect the size of the Company.
Name Position Date of contract Notice period Annual Salary (£)
Executive Directors
Juliet Davenport Chief Executive 02 August 2007 9 months 222,572
Rupert Sanderson Chief Financial Officer 8 January 2020 6 months 155,000
Non-Executive Directors
Emma Tinker 02 September 2016 30,000
Tim Jones 01 December 2017 25,000
Will Whitehorn 26 July 20181 45,000
Nemone Wynn-Evans 01 January 2019 32,000
Service agreements, notice periods and termination payments
1. Formal appointment to the Board took effect on 4 July 2018.
NominationsThe Committee will keep under review the composition of the Board, the mix of skills and experience of the Directors and the needs of the business, having due consideration for the benefits of diversity, and support the Group in developing appropriate succession plans to meet its long-term objectives.
The Board remains focused on promoting diversity across the organisation and notes that women and men were equally represented at both Board and Executive level during the period.
The Committee is responsible for reviewing the time commitments of each Director both prior to all appointments and annually, as part of the Board Evaluation process, to ensure that all Directors devote sufficient time to the Company to discharge their duties effectively.
During the period, the Committee:
• received and considered proposals to implement the role of Chief Financial Officer, including reviewing the resulting composition of the Board and the availability of a suitable mix of skills, experience and expertise;
• oversaw the recruitment, appointment and induction of Rupert Sanderson following its recommendation that the Board appoint a Chief Financial Officer to the Board; and
• reviewed overall appropriateness of the new Executive management structure in order to implement and deliver company strategy.
On 2 February, the Group announced that Juliet Davenport would be stepping down as CEO and would move into a non-executive director position on the Group’s board, as well as remaining Chair of the Zap Map board. A settlement agreement has been reached regarding this change. On 7 April Nigel Pocklington was announced as new Group CEO, with his role starting from 1 May 2021.
RemunerationInformation about the remuneration of the Directors of the Company for the year ended 31 December 2020 is set out in the following section. This report is unaudited and has been prepared in accordance with the requirements for AIM listed companies set out in the Companies Act 2006 and the AIM rules.
The Group’s bonus and share-based incentive schemes have been in place since 2016 and remain aligned with current best practice. They are designed to motivate and incentivise key talent to assist the Group in achieving its strategic aims and comprise:
• an Annual Bonus Plan that encompasses both financial and non-financial annual performance targets, details of which are set out on page 75; and

Strategic ReportG
overnance ReportFinancial Statem
ents
74 75Good Energy Annual Report 2020 Governance Report
Salaries/Fees, annual bonus and benefits
Name
Salary/fee
Pension
Benefits in Kind
Annual Bonus
Total
Total
2020 (£) 2020 (£) 2020 (£) 2020 (£) 2020 (£) 2019 (£)
Executive Directors
Juliet Davenport 222,572 28,232 15,887 - 266,691 367,902
Rupert Sanderson2 155,000 15,500 11,710 - 182,210 -
Sub-total 377,572 43,823 27,597 - 448,901 367,902
Non-Executive Directors
Will Whitehorn 45,470 - - - 45,470 46,278
Emma Tinker 30,763 - - - 30,763 31,864
Tim Jones 25,000 - - - 25,000 25,109
Nemone Wynn-Evans 32,165 - - - 32,165 32,719
Sub-total 133,398 - - - 133,398 169,720
Overall total 510,970 - - - 582,299 537,6223
2. Pro-rata for the period of directorship. Joined the Board effective 08 January 2020.3. 2018 bonus paid in 2019.
Operation of the schemeIn 2018, the Remuneration Committee agreed a non-material alteration to the performance criteria for the scheme, introducing an objective measure which considers retention of key talent in place of the previous employee engagement criterion. No other changes were made to the operation of the bonus scheme during the period.
All bonuses under the bonus scheme are individually capped. A maximum potential bonus of 75% of Executive Directors’ salary is payable in relation to the Company’s performance against four key performance metrics. The performance metrics and their relative weightings are shown in the table below.
Maximum bonus will only be payable in the event that stretch targets for all four of these performance metrics are met. Performance against the targets is measured on a sliding scale basis between the achievement of threshold, on-target and stretch targets, starting with one third of the potential
bonus being payable where threshold targets are met. No bonus will be payable unless the Group’s profit before tax meets the threshold targets unless the Nominations & Remuneration Committee, in its discretion, determines otherwise.
The Nominations & Remuneration Committee also retains discretion, under the bonus scheme rules, to adjust any payments in line with individual performance.
Individual performance targets are set annually and reviewed at the end of the relevant financial year, and annual targets for each of the four Company performance metrics will be set by the Nominations and Remuneration Committee.
The Group considers that the targets for 2021 are commercially sensitive and are not therefore disclosed. However, retrospective disclosure of performance against targets for the year ending 31 December 2020 is provided on the following page.
Measure Strategic objective Weighting
Group profit before tax Deliver profit growth 60%
Absolute net promoter score Maintain customer satisfaction ratings 20%
Employee retention Attract and retain employees with the right skills, knowledge and mind-set to help deliver the Company’s growth plans 10%
CO2 reduction Help to reduce carbon emissions 10%
Annual bonus scheme
2020 targets and performanceIn 2020 we retained bonus targets of profit before tax, employee retention and CO2 reduction. The payment of any bonus requires a threshold level of profit before tax to be achieved before performance of non-financial metrics is considered. In light of the COVID-19 challenges in particular, which are described within the Operating Review on pages 26-27, this threshold has not be achieved and therefore no bonus will be paid.
In light of the ongoing COVID-19 pandemic the staff bonus was deferred for 2019. Management authorised payment of the 2019 bonus in January 2021.

Strategic ReportG
overnance ReportFinancial Statem
ents
76 77Good Energy Annual Report 2020 Governance Report
Operation of the schemeThe existing scheme was implemented during 2016 following advice from external remuneration consultants and in consultation with the Company’s ten largest shareholders. It is designed to enhance alignment between Executive Directors and shareholders, and better reflect current market practice, including the addition of performance conditions for the vesting of awards, which are described in more detail below, where previously there were none.
The usual policy is to grant awards to Executive Directors over shares worth up to 50% of salary at the time of grant. The maximum limit of an award to any individual under the PSP in any financial year would be 100% of annual salary, subject to the Remuneration Committee’s discretion to increase to 150% of salary in exceptional circumstances.
Awards granted under the scheme shall normally vest three years from the date of grant, subject to continued employment and satisfaction of performance criteria measured over a three year period.
Performance against targets is measured on a sliding scale, with 20% of the relevant part of the award vesting at threshold level, 50% vesting for on-target performance through to 100% vesting
for achieving stretch targets. No award will vest unless Total Shareholder Return is positive over the measurement period.
The Nominations & Remuneration Committee may, at any time up to and including vesting, reduce the vesting level of awards where there has been, amongst other things, a material misstatement in the accounts, an error in any information on which performance targets were based, gross misconduct or fraud by the employee.
Performance targetsThe performance metrics and their relative weightings for the 2020 grant of awards are shown in the table below. The Group considers the targets themselves to be commercially sensitive and these are not therefore disclosed. However, retrospective disclosure of performance against targets will be provided at the end of the relevant measurement period.
Measure Strategic objective Weighting
Earnings per share Drive shareholder value 60%
Relative net promoter score (relative to large energy companies)
Maintain higher customer satisfaction rating than the large energy firms
20%
Customer CO2 reduction Ensure long term sustainability of our own operation 20%
Performance share plan (“PSP”) Directors’ share optionsDetails of the Directors’ share options outstanding at 31 December 2020 are shown below.
Name Date option granted
Number of options outstanding as at 31 December 2020
Option price
Exercised during period
Cancelled/ surrendered during period
Rupert Sanderson 15/11/2018 58,427 £0.05
Total 58,427
Juliet Davenport 13/02/2012 86,956 £1.15 - -
13/02/2012 17,390 £1.15 - -
18/09/2012 - £0.50 - 189,052
13/07/2013 144,000 £1.25 - -
10/05/2017 - £0.05 42,363
15/11/2018 122,472 £0.05 - -
Total 370,818 - 231,415

Strategic ReportG
overnance ReportFinancial Statem
ents
78 79Good Energy Annual Report 2020 Governance ReportGood Energy Annual Report 201978
General company informationGood Energy Group PLC is a public limited company incorporated in England and Wales.
The Company’s registered office, which changed on 1 February 2021, and principal place of business is: Monkton Park Offices, Monkton Park, Chippenham, Wiltshire, SN15 1GH and the registered number is 04000623.
Share capitalOn 31 December 2020, 16,643,067 ordinary shares of 5p each were in issue. The Company is listed on the Alternative Investment Market (AIM) of the London Stock Exchange, and its shares have been trading on the Aquis Exchange (formally NEX Growth Market)since 5 January 2016.
Significant shareholdersAt 31 December 2020, the following shareholders had notified an interest exceeding 3% of the issued ordinary share capital of the Company (excluding Directors and their respective families as defined in the AIM rules, details of which are set out on the next page):
Share class rightsOrdinary shares
The full share class rights are set out in the Company’s Articles of Association which are available to view at goodenergygroup.co.uk, at Companies House and summarised below:
Each member has one vote for each ordinary share held. Holders of ordinary shares are entitled to: receive the Company’s Annual Report and Accounts; attend and speak at general meetings of the Company; appoint one or more proxies or, if they are corporations, corporate representatives; and exercise voting rights. Holders of ordinary shares may receive a dividend in cash or ordinary shares under the Company’s scrip dividend scheme and on liquidation may share in the assets of the Company.
Shareholder agreements and consent requirements
There are no known arrangements under which financial rights carried by any of the shares in the Company are held by a person other than the holder of the shares and no known agreements between the holders of shares with restrictions on the transfer of shares or exercise of voting rights.
Authority to issue shares
At the AGM in 2020, authority was given to the Directors to allot new ordinary shares up to a nominal value of £277,384, equivalent to one-third of the issued share capital of the Company at that time. The Directors were also authorised to allot up to two thirds of the total issued share capital of the Company, but only in the case of a rights issue.
These authorities are valid until the AGM in 2021, and the Directors propose to renew this authority at the AGM.
The Board believes this authority will allow the Company to retain flexibility to respond to circumstances and opportunities as they arise.
Deadlines for exercising voting rights
Electronic and paper proxy appointments, and voting instructions, must be received by the company’s Registrar not less than 48 hours before a general meeting.
Dividends
Details relating to dividends are set out in the Chairman’s Statement on page 10.
Directors
The names of the Directors that held office during the financial year are set out on page 54-55.
Shareholder Number of shares %
Ecotricity Group Limited 4,169,948 25.1%
Hargreaves Lansdown plc 1,166,706 7.0%
Martin Edwards 669,827 4.0%
Statutory and other information
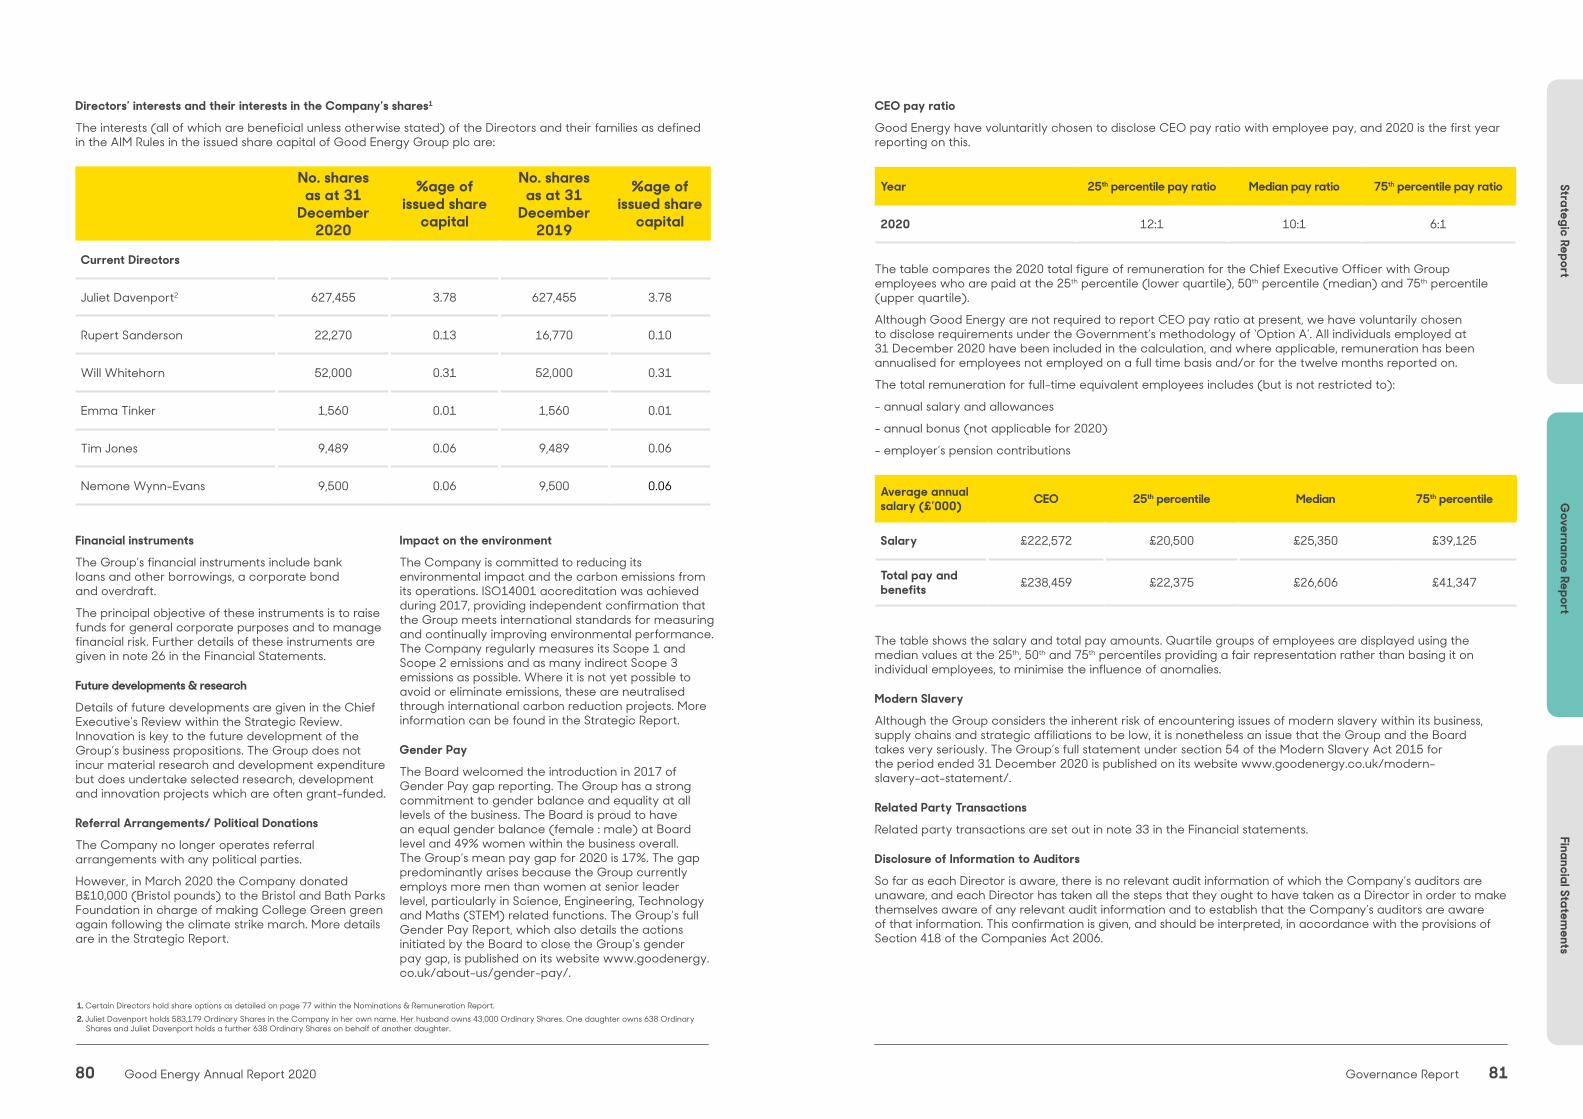
Strategic ReportG
overnance ReportFinancial Statem
ents
80 81Good Energy Annual Report 2020 Governance Report
No. shares as at 31
December 2020
%age of issued share
capital
No. shares as at 31
December 2019
%age of issued share
capital
Current Directors
Juliet Davenport2 627,455 3.78 627,455 3.78
Rupert Sanderson 22,270 0.13 16,770 0.10
Will Whitehorn 52,000 0.31 52,000 0.31
Emma Tinker 1,560 0.01 1,560 0.01
Tim Jones 9,489 0.06 9,489 0.06
Nemone Wynn-Evans 9,500 0.06 9,500 0.06
1. Certain Directors hold share options as detailed on page 77 within the Nominations & Remuneration Report.2. Juliet Davenport holds 583,179 Ordinary Shares in the Company in her own name. Her husband owns 43,000 Ordinary Shares. One daughter owns 638 Ordinary Shares and Juliet Davenport holds a further 638 Ordinary Shares on behalf of another daughter.
Directors’ interests and their interests in the Company’s shares1
The interests (all of which are beneficial unless otherwise stated) of the Directors and their families as defined in the AIM Rules in the issued share capital of Good Energy Group plc are:
Financial instruments
The Group’s financial instruments include bank loans and other borrowings, a corporate bond and overdraft.
The principal objective of these instruments is to raise funds for general corporate purposes and to manage financial risk. Further details of these instruments are given in note 26 in the Financial Statements.
Future developments & research
Details of future developments are given in the Chief Executive’s Review within the Strategic Review. Innovation is key to the future development of the Group’s business propositions. The Group does not incur material research and development expenditure but does undertake selected research, development and innovation projects which are often grant-funded.
Referral Arrangements/ Political Donations
The Company no longer operates referral arrangements with any political parties.
However, in March 2020 the Company donated B£10,000 (Bristol pounds) to the Bristol and Bath Parks Foundation in charge of making College Green green again following the climate strike march. More details are in the Strategic Report.
Impact on the environment
The Company is committed to reducing its environmental impact and the carbon emissions from its operations. ISO14001 accreditation was achieved during 2017, providing independent confirmation that the Group meets international standards for measuring and continually improving environmental performance. The Company regularly measures its Scope 1 and Scope 2 emissions and as many indirect Scope 3 emissions as possible. Where it is not yet possible to avoid or eliminate emissions, these are neutralised through international carbon reduction projects. More information can be found in the Strategic Report.
Gender Pay
The Board welcomed the introduction in 2017 of Gender Pay gap reporting. The Group has a strong commitment to gender balance and equality at all levels of the business. The Board is proud to have an equal gender balance (female : male) at Board level and 49% women within the business overall. The Group’s mean pay gap for 2020 is 17%. The gap predominantly arises because the Group currently employs more men than women at senior leader level, particularly in Science, Engineering, Technology and Maths (STEM) related functions. The Group’s full Gender Pay Report, which also details the actions initiated by the Board to close the Group’s gender pay gap, is published on its website www.goodenergy.co.uk/about-us/gender-pay/.
CEO pay ratio
Good Energy have voluntaritly chosen to disclose CEO pay ratio with employee pay, and 2020 is the first year reporting on this.
Year 25th percentile pay ratio Median pay ratio 75th percentile pay ratio
2020 12:1 10:1 6:1
The table compares the 2020 total figure of remuneration for the Chief Executive Officer with Group employees who are paid at the 25th percentile (lower quartile), 50th percentile (median) and 75th percentile (upper quartile).
Although Good Energy are not required to report CEO pay ratio at present, we have voluntarily chosen to disclose requirements under the Government’s methodology of ‘Option A’. All individuals employed at 31 December 2020 have been included in the calculation, and where applicable, remuneration has been annualised for employees not employed on a full time basis and/or for the twelve months reported on.
The total remuneration for full-time equivalent employees includes (but is not restricted to):
- annual salary and allowances
- annual bonus (not applicable for 2020)
- employer’s pension contributions
Average annual salary (£’000) CEO 25th percentile Median 75th percentile
Salary £222,572 £20,500 £25,350 £39,125
Total pay and benefits £238,459 £22,375 £26,606 £41,347
The table shows the salary and total pay amounts. Quartile groups of employees are displayed using the median values at the 25th, 50th and 75th percentiles providing a fair representation rather than basing it on individual employees, to minimise the influence of anomalies.
Modern Slavery
Although the Group considers the inherent risk of encountering issues of modern slavery within its business, supply chains and strategic affiliations to be low, it is nonetheless an issue that the Group and the Board takes very seriously. The Group’s full statement under section 54 of the Modern Slavery Act 2015 for the period ended 31 December 2020 is published on its website www.goodenergy.co.uk/modern- slavery-act-statement/.
Related Party Transactions
Related party transactions are set out in note 33 in the Financial statements.
Disclosure of Information to Auditors
So far as each Director is aware, there is no relevant audit information of which the Company’s auditors are unaware, and each Director has taken all the steps that they ought to have taken as a Director in order to make themselves aware of any relevant audit information and to establish that the Company’s auditors are aware of that information. This confirmation is given, and should be interpreted, in accordance with the provisions of Section 418 of the Companies Act 2006.

Strategic ReportG
overnance ReportFinancial Statem
ents
82 83Good Energy Annual Report 2020 Governance Report
Events after the Balance Sheet date There have been three events subsequent to the year-end which may be of note to users of the financial statements.
On 2 February, the Group announced that Juliet Davenport would be stepping down as CEO and would move into a non-executive director position on the Group’s board, as well as remaining Chair of the Zap Map board. A settlement agreement has been reached regarding this change. On 7 April Nigel Pocklington was announced as new Group CEO, with his role starting from 1 May 2021.
On 1 April 2021 the Group announced the restructuring of the financing on its renewable generation asset portfolio to consolidate and simplify funding facilities. At the year end the Group had two secured bank loans against its 50MW of wind and solar assets, comprising: £4.5m secured against Good Energy’s Delabole wind farm financed by the Cooperative Bank (“Co-Op”) and £32.6m secured against the rest of the solar and wind asset portfolio, financed by funds managed by Gravis Capital Management Limited (“Gravis”).
This refinancing and restructuring consolidates the generation assets into one portfolio, with a transfer of direct ownership of Delabole to Good Energy Generation Assets No.1 Limited, from Good Energy Group PLC. This portfolio will be solely financed by a revised facility of £39.8m managed by Gravis and will amortise through to June 2035. The Co-Op Facility was previously used to finance the 9MW Delabole windfarm on a standalone basis. The cost of settling the Co-Op debt is de minimis.
On completion, the transaction provides £7.8m of unrestricted cash, this relates to the release of reserve accounts and other restricted cash balances which form part of the existing facilities (£4.7m), and additional debt raised against the Delabole windfarm, associated with mirroring the terms of Delabole in line with the rest of the portfolio (£3.1m). The transaction also rebalances the performance covenants over the entire generation portfolio. This frees up future cash generated by the generation portfolio to be utilised by the Company.
On 8 April, the Group announced a further £1m strategic investment into Zap Map’s parent company Next Green Car Ltd, via a convertible loan note. The loan note comprises three broadly equal and separate tranches of investment throughout 2021, and the Good Energy can exercise the conversion of the loan at the earlier of subsequent funding rounds, or a longstop date of 12 months from the date of agreement, at a material discount.
83Governance Report
Strategic ReportG
overnance ReportFinancial Statem
ents
Strategic ReportG
overnance ReportFinancial Statem
ents
84 85Good Energy Annual Report 2020 Governance Report
The Directors submit their Annual Report and Financial Statements (Annual Report and Accounts) for Good Energy Group plc for the year ended 31 December 2020. The directors’ report required under the Companies Act 2006 comprises this Governance & Directors’ Report and the Nominations & Remuneration Report.
The Company is required to set out a fair review of the Group’s activities and a description of the principal risks and uncertainties facing the business as detailed in the Strategic Report. This requirement includes an analysis of the development and performance of the Group’s business during the financial year, and the position of the Group at the end of the reporting period consistent with its size and complexity.
The Directors are responsible for preparing the Annual Report and Accounts in accordance with applicable
law and regulation, including company law which requires the Directors to prepare financial statements for each financial year. Under company law the Directors must not approve the financial statements unless they are satisfied that they give a true and fair view of the state of affairs of the Group and parent company and of the profit or loss of the Group and parent company for that period.
In preparing the financial statements, the Directors are required to:
• select suitable accounting policies and then apply them consistently;
• state whether applicable International Financial Reporting Standards (IFRSs) in conformity with the requirements of the Companies Act 2006 have been followed for the Group financial statements and IFRSs as adopted by the European Union have been followed for the Company financial statements, subject to any material departures disclosed and explained in the financial statements;
• make judgements and accounting estimates that are reasonable and prudent; and
• prepare the financial statements on the going concern basis unless it is inappropriate to presume that the Group and parent company will continue in business.
The Directors have prepared the Group financial statements in accordance with (IFRSs) in conformity with the requirements of the Companies Act 2006 and parent company financial statements in accordance with International Financial Reporting Standards (IFRSs) as adopted by the European Union.
The Directors are responsible for keeping adequate accounting records that are sufficient to show and explain the Group and parent company’s transactions and disclose with reasonable accuracy at any time the financial position of the Group and parent company. These records must also enable them to ensure that the financial statements comply with the Companies Act 2006 and, as regards the Group financial statements, Article 4 of the IAS Regulation.
The Directors are also responsible for the system of internal controls, for safeguarding the assets of the Group and parent company and for taking reasonable steps for the prevention and detection of fraud and other irregularities.
The Directors of the ultimate parent company are responsible for the maintenance and integrity of the
Statement of Directors’ responsibilities in respect of the annual report and the financial statements
ultimate parent company’s website. Legislation in the United Kingdom governing the preparation and dissemination of financial statements may differ from legislation in other jurisdictions.
The Directors consider that the Annual Report and Accounts, taken as a whole, is fair, balanced and understandable and provides the information necessary for shareholders to assess the Group and parent company’s position and performance, business model and strategy.
Each of the Directors, whose names and functions are listed in the Governance & Directors report confirm that, to the best of their knowledge:
• the parent company financial statements, which have been prepared in accordance with IFRSs as adopted by the European Union, give a true and fair view of the assets, liabilities, financial position and profit of the Company
• the Group’s consolidated financial statements, which have been prepared in accordance with IFRSs as adopted by the European Union, give a true and fair view of the assets, liabilities, financial position and profit of the Group; and
• the Annual Report and Accounts includes a fair review of the development and performance of the business and the position of the Group and parent company, together with a description of the principal risks and uncertainties that it faces.
In the case of each Director in office at the date the Governance Report is approved:
• so far as the Director is aware, there is no relevant audit information of which the Group and parent company’s auditors are unaware; and
• they have taken all the steps that they ought to have taken as a Director in order to make themselves aware of any relevant audit information and to establish that the Group and parent company’s auditors are aware of that information.
The Annual Report and Accounts, including the Strategic Report, Governance & Directors’ Report, Remuneration Report and Financial Statements, have been prepared and approved by the Board and are published in accordance with, and with reliance on, applicable English company law. The liabilities of Directors in relation to the Annual Report and Accounts are subject to the limitations and restrictions provided by such law.
Will Whitehorn Chairman
“The Directors submit their Annual Report and Accounts or Good Energy Group plc for the year ended 31 December 2020”
Strategic ReportG
overnance ReportFinancial Statem
ents
86 87Good Energy Annual Report 2020 Governance Report
Opinion
In our opinion:
• Good Energy Group plc’s group financial statements and parent company financial statements (the ‘financial statements’) give a true and fair view of the state of the group’s and of the parent company’s affairs as at 31 December 2020 and of the group’s loss for the year then ended;
• the group financial statements have been properly prepared in accordance with international accounting standards in conformity with the requirements of the Companies Act 2006;
• the parent company financial statements have been properly prepared in accordance with International Accounting Standards in conformity with the requirements of the Companies Act 2006 as applied in accordance with section 408 of the Companies Act 2006; and
• the financial statements have been prepared in accordance with the requirements of the Companies Act 2006.
Independent Auditors’ report to the members of Good Energy Group plc
Group Parent company
Consolidated Statement of Financial Position as at 31 December 2020
Parent Company Statement of Financial Position as at 31 December 2020
Consolidated Statement of Comprehensive Income for the year then ended
Consolidated Statement of Changes in Equity for the year then ended
Parent Company Statement of Changes in Equity for the year then ended
Consolidated Statement of Cash Flows for the year then ended
Parent Company Statement of Cash Flows for the year then ended
Related notes 1 to 36 to the financial statements, including a summary of significant accounting policies
Related notes 1 to 36 to the financial statements including a summary of significant accounting policies
The financial reporting framework that has been applied in their preparation is applicable law and International Accounting Standards in conformity with the requirements of the Companies Act 2006 and, as regards the parent company financial statements, as applied in accordance with section 408 of the Companies Act 2006.
Basis for opinion We conducted our audit in accordance with International Standards on Auditing (UK) (ISAs (UK)) and applicable law. Our responsibilities under those standards are further described in the Auditor’s responsibilities for the audit of the financial statements section of our report. We are independent of the group in accordance with the ethical requirements that are relevant to our audit of the financial statements in the UK, including the FRC’s Ethical Standard as applied to listed public interest entities, and we have fulfilled our other ethical responsibilities in accordance with these requirements.We believe that the audit evidence we have obtained is sufficient and appropriate to provide a basis for our opinion.
Conclusions relating to Going ConcernIn auditing the financial statements, we have concluded that the directors use of the going concern basis of accounting in the preparation of the financial statements is appropriate. Our evaluation of the directors’ assessment of the group and parent company’s ability to continue to adopt the going concern basis of accounting included the following procedures:
• We gained an understanding of the process undertaken by management to perform the going concern assessment, including their assessment of risks and evaluation of the ongoing impact of COVID-19 on the group including discussion with management to ensure all key factors were taken into account.
• We obtained management’s forecast cash flows and covenant calculations covering the period from the date of signing to 31 December 2022 and we agreed these to the Board approved budgets and forecasts.
• We tested the mathematical accuracy of the cash flows, as well as the calculation of the forecast covenants.
• We considered the group’s access to available sources of liquidity and agreed available facilities to underlying agreements and the extent of drawings thereunder to external confirmations.
• We obtained the confirmation from the lender for the expected covenant ratios for the going concern period until 31 December 2022.
• We obtained the deed of release and other relevant document regarding the group’s refinancing of their generation assets portfolio.
• We challenged management in respect of the assumptions used in the going concern assessment and reverse stress test reflecting their principal risks and uncertainties, including the risk of a further lockdown later in FY21 and the impact this would have on liquidity and on compliance with financial covenants.
• We understood and challenged the Board’s controllable mitigation plans and the forecast
impact on the ability of the business to operate within its financial covenants. We obtained supporting documentation to evaluate the plausibility and achievability of management’s mitigation plans considering actions delivered to date.
• We compared forecast future cashflows to historical data, ensuring variations are in line with our expectations, such as historical performance, peer’s result and understanding of the business and considered the reliability of past forecasts.
• We considered the results of other audit procedures and other knowledge obtained in the audit and whether it was consistent with or contradicted management’s assumptions.
• We performed our own sensitivity analysis on management’s forecast cashflows and considered the reverse stress tested management model to understand how severe conditions would have to be to breach liquidity and/or covenant headroom, and whether the scenario has no more than a remote possibility of occurring.
• Inquired of management as to their knowledge of events or conditions beyond the period of their assessment that may cast significant doubt on the entity’s ability to continue as a going concern and compared their response to the maturity of the group’s liabilities, review of subsequent events, contracts and minutes of meetings.
• We assessed the appropriateness of disclosures within the Annual Report and Accounts.
Our key observations • We have observed that the group is experiencing
a minimal level of disruption from the impact of the pandemic from both a revenue and profitability perspective.
• In April 2021, the Group has refinanced its generation assets with a new loan from Gravis Capital Partners (GCP). The refinancing enabled repayment of the Co-op loan reset the underlying covenants and has made an additional cash available to the Group – this is being disclosed as a non-adjusting post balance sheet event.
Based on the work we have performed, we have not identified any material uncertainties relating to events or conditions that, individually or collectively, may cast significant doubt on the group and parent company’s ability to continue as a going concern over a period of 20 months from when the financial statements are authorised for issue to 31 December 2022. Going concern has also been determined to be a key audit matter.Our responsibilities and the responsibilities of the directors with respect to going concern are described in the relevant sections of this report. However, because not all future events or conditions can be predicted, this statement is not a guarantee as to the group’s ability to continue as a going concern.
We have audited the financial statements of Good Energy Group plc (the ‘parent company’) and its subsidiaries (the ‘group’) for the year ended 31 December 2020 which comprise:

Strategic ReportG
overnance ReportFinancial Statem
ents
88 89Good Energy Annual Report 2020 Governance Report
Overview of our audit approach
Audit scope • We performed an audit of the complete financial information of 3 components and audit procedures on specific balances for a further 9 components.
• The components where we performed full or specific audit procedures accounted for 100% of Earnings before interest and tac from continuing operations (EBIT) measure used to calculate materiality, 99% of Revenue and 96% of Total assets.
Key audit matters • Revenue recognition, specifically the estimated unbilled income
• Revenue recognition due to the susceptibility to management override through inappropriate, manual entries
• Valuation of the expected credit loss provision
• Generation asset revaluation
• Going Concern basis used in preparation of the Annual Report & Accounts
Materiality • Overall group materiality of £0.3m which represents 5% of EBIT from continuing operations.
Tailoring the scopeOur assessment of audit risk, our evaluation of materiality and our allocation of performance materiality determine our audit scope for each company within the group. Taken together, this enables us to form an opinion on the consolidated financial statements. We take into account size, risk profile, the organisation of the group and effectiveness of group-wide controls, changes in the business environment and other factors such as recent Internal audit results when assessing the level of work to be performed at each company.
In assessing the risk of material misstatement to the group financial statements, and to ensure we had adequate quantitative coverage of significant accounts in the financial statements, of the 14 reporting components of the group, we selected all components covering entities within the UK, which represent the principal business units within the group.
Of the 14 components selected, we performed an audit of the complete financial information of 4 components (“full scope components”) which were selected based on their size or risk characteristics. For the remaining 10 components (9 “specific scope components” and 1 “specific procedures”), we performed audit procedures on specific accounts within that component that we considered had the potential for the greatest impact on the significant accounts in the financial statements either because of the size of these accounts or their risk profile.
The reporting components where we performed audit procedures accounted for 100% (2019: 100%) of the group’s EBIT from continuing operations, 99% (2019: 100%) of the group’s Revenue and 96% (2019: 95%) of the group’s Total assets. For the current year, the full scope components contributed 75% (2019: 88%) of the group’s EBIT, 93% (2019: 93%) of the group’s Revenue and 59% (2019: 43%) of the group’s Total assets. The specific scope component contributed 8% (2019: 3%) of the group’s EBIT, 6% (2019: 7%) of the group’s Revenue and 54% (2019: 40%) of the group’s Total assets. The audit scope of these components may not have included testing of all significant accounts of the component but will have contributed to the coverage of significant tested for the group. We also perform specified procedures over the acquisition of Next Green Ltd (Zap Map), as described in the Risk section below.
Of the remaining 2 components that together represent 11% (2019: 3%) of the group’s earnings before interest and tax, these components are part of the generation side of business and do not have external revenue. For these components, we performed other procedures, including analytical review and testing of intercompany eliminations to respond to any potential risks of material misstatement to the group financial statements.
The charts below illustrate the coverage obtained from the work performed by our audit teams.
An overview of the scope of our audit
Changes from the prior year No significant changes identified in relation to prior year scoping.
Involvement with component teams All audit work performed for the purposes of the audit was undertaken by the group audit team.
Strategic ReportG
overnance ReportFinancial Statem
ents
90 91Good Energy Annual Report 2020 Governance Report
Risk Our response to the riskKey observations communicated to the Audit Committee
Revenue recognition, specifically the estimated unbilled income
Accounting policies (page 115); and Note 21 of the Consolidated Financial Statements (page 163)
The group’s material revenue streams relate to the provision of gas and electricity services.
This risk over revenue recognition specifically arises in income from metered services amounting to £16.4m (2019: £18.7m), which requires an estimation of the amount of unbilled charges at the year end.
This is calculated using a combination of system generated information, based on previous customer volume usage, together with management judgements as to the likely impact on usage of factors such as seasonal variations.
Due to the accrued income being an estimation, the risk of management bias is high.
The risk has decreased in the current year due to the new billing system that was fully implemented during the year and estimation and calculation process of accrued income now being fully operational for two years.
Our procedures included:
• We obtained an understanding of the process for the supply of gas and electric services, meter reading and related billing in order to ascertain the completeness of adjustments to reflect the accrual or deferral of revenue.
• We assessed the design of key controls linked to system generated information relating to the estimation process for measured revenue.
• We tested the inputs into the billing system, including meter reads, tariffs and estimated average consumption. This was to assess whether calculated bills and the resultant revenues reflected accurate contract agreed prices and usage.
• We compared the accrued income to bills raised post year end for a sample of customers to check the accuracy of the estimated usage and revenue recorded.
• We corroborated the key assumptions made by management in recognising revenue, by obtaining internal and external data on demand.
• We tested whether revenue was recognised in the correct period by recalculating the accrued income based on the last billed date and compared that to the amount billed.
• We performed analytical procedures by comparing revenue balances for the year against expectation from industry consumption data and obtaining support for significant variances against that data.
• In performing our journal testing, we paid increased attention to entries impacting revenue focusing on non-system postings and those raised in the last two weeks of the year.
• We have performed testing over completeness of the data migration from the old billing system to the new billing system.
• We performed full scope audit procedures over this risk area in two locations, which covered 100% of the risk amount.
We did not identify material errors in the unbilled income report, nor evidence of management manipulation of revenue within this report.
We concluded that management’s assumptions in respect of customer demand are within an acceptable range and that the basis of calculation of the unbilled income accrual is appropriate.
Key audit mattersKey audit matters are those matters that, in our professional judgement, were of most significance in our audit of the financial statements of the current period and include the most significant assessed risks of material misstatement (whether or not due to fraud) that we identified. These matters included those which had the greatest effect on: the overall audit strategy, the allocation of resources in the audit; and directing the efforts of the engagement team. These matters were addressed in the context of our audit of the financial statements as a whole, and in our opinion thereon, and we do not provide a separate opinion on these matters.
Risk Our response to the riskKey observations communicated to the Audit Committee
Revenue recognition due to the susceptibility to management override through inappropriate manual entries.
Accounting policies (page 115); and Note 4 of the Consolidated Financial Statements (page 131).
We consider that all except the accrued income of Good Energy’s revenue transactions reported under existing IFRS guidance are routine, non-complex, and systems driven, with no judgement applied over the recorded amount.
However, the accounting for revenues is susceptible to management override through the recording of manual topside journal entries either in the underlying ledgers or during the consolidation process.
We focused on this area due to the manual nature of the consolidation process and the non-routine judgemental nature of some of the manual journals posted.
Our procedures included:
• We performed walkthroughs of the consolidation process at various month ends throughout the year, including the interim and year end to assess the design and implementation of key controls over the manual consolidation process.
• Audit procedures specifically designed to address the risk of management override included using data extracted from the accounting system to test the appropriateness of journal entries impacting revenue, as well as other adjustments made in the preparation of the financial statements, with a focus on selecting and testing manual journals.
• For all locations we assessed the results of the consolidated entities used in the manual consolidation by agreeing the results included in the consolidation directly to the results audited by the audit team.
• We selected all consolidation journals exceeding 15% of performance materiality and obtained evidence to assess the validity and accuracy of the journals being posted.
Based on the audit procedures performed manual entries were appropriate, including post close adjustments during the consolidation process.
Our journal entry testing procedures did not identify instances of inappropriate management override in the recognition of revenue.

Strategic ReportG
overnance ReportFinancial Statem
ents
92 93Good Energy Annual Report 2020 Governance Report
Risk Our response to the riskKey observations communicated to the Audit Committee
Expected Credit Losses
Accounting policies (page 124); and Note 21 of the Financial Statements (page 163)
There is an expected credit loss (ECL) provision of £8.9m (2019: £7.3m) at the year-end against gross amounts receivable from customers of £34.3m (2019: £33.7m).
The simplified approach to ECL under IFRS 9 was calculated using management’s judgement of the future likely recovery rates.
There is a risk that the assumptions used by management in calculating the ECL provision may be susceptible to management bias and the valuation of ECL amounts against trade receivables and unbilled income may be misstated.
Our procedures included:
• We performed a walkthrough of the process for calculating the ECL provision and assessed the design effectiveness of key controls.
• We tested the integrity of data and the report utilised to generate the ageing and categorisation of debt within the group’s billing system.
• We corroborated assumptions made by management on collection rates, by analysing historical information, subsequent collection data, and performed sensitivity analysis on the impact of these rates on the ECL provision.
• We formed a view that the assumptions made by management on collection rates were within our expected range and performed sensitivity analysis on the impact of these rates on the ECL provision. We also compared the outstanding sales days to peers and competitors within the industry to ensure these were reasonable.
• We assessed the use of IFRS 9 on the calculation prepared by management and challenged provisioning rates based on expected credit losses through past history and predicted market conditions.
• We performed analysis against debt held at year end compared to cash collected post year end disaggregated into the categorisation of customers used by management in the provision calculation to assess the reasonableness of provisioning rates.
• We tested the appropriateness of journal entries and adjustments impacting the ECL provision particularly those raised close to the balance sheet date.
• We performed full scope audit procedures over this risk area in two locations, which covered 100% of the risk amount.
We assessed management’s judgments and concluded that the ECL provision is within an acceptable range and reflects likelihood of collections in future periods.
Risk Our response to the riskKey observations communicated to the Audit Committee
Generation asset revaluation:
Accounting policies (page 117); and Note 15 of the Financial Statements (page 145)
The group changed the accounting policy with respect to the measurement of Generation assets as at 1 January 2020 on a prospective basis.
The properties’ fair values are based on valuations performed by an accredited independent valuer, which was determined using a Discounted Cashflow (DCF) method.
The revaluation gain recognised as at 1 January 2020 is £15.9 million, net of £0.5 million revaluation loss from one of the generation assets.
The net book value of Property Plant and Equipment (PPE), after revaluation as at 31 December 2020 is £58.6 million (2019: £46.3 million)
The risk involves significant estimation uncertainty, subjectivity and complexity in the fair value determination by the group’s external specialist, which could impact key ratios of the group, such as lowering the gearing ratio.
Our procedures included:
• We have reviewed the valuation report and calculation from Good Energy over the accounting treatment and the proposed disclosures required under IFRS.
• We have obtained and reviewed the revaluation report provided by the external specialist engaged by management.
• We involved EY Valuation specialists to provide assessment on the reliability of the process and methods used in the valuation of generation assets.
• We discussed with management the frequency of revaluations which depends upon the whether the fair values of the revalued assets differ materially with its carrying amount and the appropriate and adequate disclosures regarding the matter.
• We also focused on corroborating management reasons why applying this policy change provides reliable and more relevant information, in particular to the economic decision-making needs of the users of the financial statements.
• We performed sensitivity analysis over key assumptions within the estimate.
We concluded that the proposed voluntary change in the accounting policy from cost model to revaluation model for subsequent measurement of PPE is in accordance with IFRS and is allowed by IAS 8, IAS 16 and related standards as it results in the financial statements of the group, its subsidiaries, immediate and ultimate parents providing reliable and more relevant information about the effects of transactions, other events or conditions on the entity’s financial position, financial performance or cash flows.
We also concluded that the proposed prospective application of the change in the accounting policy is conformant to the requirements of IFRSs and we concluded that to the material extent the proposed disclosure satisfies and is compliant with the relevant requirements of IFRSs.
Strategic ReportG
overnance ReportFinancial Statem
ents
94 95Good Energy Annual Report 2020 Governance Report
Risk Our response to the riskKey observations communicated to the Audit Committee
Zap Map acquisition
Accounting policies (page 119); and Note 17 of the Financial Statements (page 152)
Good Energy made an equity investment in Zap-Map through Next Green Car Limited in the previous year. The transaction is complex due to the ownership structure and financing arrangements of the investment, from investment in associate to a subsidiary.
Zap Map acquisition resulted to £0.9 million of goodwill, £0.4 million software licenses through £1.2 million consideration paid by the Group.
The risk involves significant estimation uncertainty, subjectivity and complexity in the fair value determination with respect to the investment acquired and the impairment assessment of the goodwill recognised.
Our procedures included:
• We have validated all material fair value adjustments through third part documentations and underlying supports.
• We have checked the clerical accuracy of the fair value calculation and the DCF used for the assessment of goodwill impairment.
• We have reviewed the sensitivity analysis and inflationary increases to assess whether they have been correctly applied and considered the impact of changing any assumptions in the model within a reasonable range and the consequential effect on goodwill headroom.
• We have involved the EY Valuation team to support us in our evaluation of the assumptions used in the discounted cash flow analysis to assess impairment, including evaluation of the growth rates, discount rate and terminal value, comparing against past experience and independently assessing future market outlook.
• We have checked the disclosures made to ensure that this is in accordance with the applicable standards.
We concluded that the fair value of the software assets at acquisition are fairly stated and that the amortisation period of three years is appropriate.
There were no changes in the key audit matters in the prior year auditor’s report compared to the current year auditor’s report.
Our application of materiality We apply the concept of materiality in planning and performing the audit, in evaluating the effect of identified misstatements on the audit and in forming our audit opinion.
MaterialityThe magnitude of an omission or misstatement that, individually or in the aggregate, could reasonably be expected to influence the economic decisions of the users of the financial statements. Materiality provides a basis for determining the nature and extent of our audit procedures.
We determined materiality for the Group to be £0.3 million (2019: £1.0 million), which is 5% of EBIT (2019: 0.8% of revenue). We believe that earnings before interest and tax provides us with an appropriate basis for determining the nature and extent of our audit procedures. The assessed materiality is less than the prior year’s materiality mainly due to the change of the basis of materiality.
The generation asset development segment has been discontinued, and there is new investment into the technology solutions side of the business including demand management managing supply. This change meant 2018 and 2019 profitability increase. However, in part as a result of decreased demand and increased risk of credit default due to COVID-19, the group made a loss before tax in the 2020 half year interim results released to the market. This business has reached its peaked in terms of generation and supply of energy therefore diversifying their business model towards high margin, which is focused more on earnings than the growth or activity. We concluded that based on these considerations that earnings before interest and tax is reflective of the Company’s position and would be the measure of most interest to the users of the financial statements, being a listed company.
We determined materiality for the parent company to be £0.2 million (2019: £0.3 million), which is 1.4% (2019: 1.6%) of equity. Equity is the most appropriate measure given the parent company is an investment holding company with no revenue.
During the course of our audit, we reassessed initial materiality and updated it to reflect actual earnings before interest and tax having based our initial materiality on forecast earnings before interest and tax.
Performance materialityThe application of materiality at the individual account or balance level. It is set at an amount to reduce to an appropriately low level the probability that the aggregate of uncorrected and undetected misstatements exceeds materiality.
On the basis of our risk assessments, together with our assessment of the Group’s overall control environment, our judgement was that performance materiality was 50% (2019: 50%) of our materiality £0.15 million (2019: £0.5 million). We have set performance materiality at this percentage due to
our understanding of the group and the past history of misstatements, is that the likelihood of material misstatement is higher.
Audit work at component locations for the purpose of obtaining audit coverage over significant financial statement accounts is undertaken based on a percentage of total performance materiality. The performance materiality set for each component is based on the relative scale and risk of the component to the group as a whole and our assessment of the risk of misstatement at that component. In the current year, the range of performance materiality allocated to components was £0.05 million to £0.2 million (2019: £0.1 million to £0.4 million).
Reporting threshold An amount below which identified misstatements are considered as being clearly trivial.
We agreed with the Audit Committee that we would report to them all uncorrected audit differences in excess of £15,000 (2019: £0.05 million), which is set at 5% of planning materiality, as well as differences below that threshold that, in our view, warranted reporting on qualitative grounds..
We evaluate any uncorrected misstatements against both the quantitative measures of materiality discussed above and in light of other relevant qualitative considerations in forming our opinion.
Other information The other information comprises the information included in the annual report set out on pages 4-85 other than the financial statements and our auditor’s report thereon. The directors are responsible for the other information contained within the annual report.
Our opinion on the financial statements does not cover the other information and, except to the extent otherwise explicitly stated in this report, we do not express any form of assurance conclusion thereon.
Our responsibility is to read the other information and, in doing so, consider whether the other information is materially inconsistent with the financial statements or our knowledge obtained in the course of the audit or otherwise appears to be materially misstated. If we identify such material inconsistencies or apparent material misstatements, we are required to determine whether there is a material misstatement in the financial statements themselves. If, based on the work we have performed, we conclude that there is a material misstatement of the other information, we are required to report that fact.
We have nothing to report in this regard.
Strategic ReportG
overnance ReportFinancial Statem
ents
96 97Good Energy Annual Report 2020 Governance Report
Opinions on other matters prescribed by the Companies Act 2006In our opinion, based on the work undertaken in the course of the audit:
• the information given in the strategic report and the directors’ report for the financial year for which the financial statements are prepared is consistent with the financial statements; and
• the strategic report and directors’ report have been prepared in accordance with applicable legal requirements.
Matters on which we are required to report by exceptionIn the light of the knowledge and understanding of the group and the parent company and its environment obtained in the course of the audit, we have not identified material misstatements in the strategic report or the directors’ report.
We have nothing to report in respect of the following matters in relation to which the Companies Act 2006 requires us to report to you if, in our opinion:
• adequate accounting records have not been kept by the parent company, or returns adequate for our audit have not been received from branches not visited by us; or
• the parent company financial statements and the part of the Directors’ Remuneration Report to be audited are not in agreement with the accounting records and returns; or
• certain disclosures of directors’ remuneration specified by law are not made; or
• we have not received all the information and explanations we require for our audit.
Responsibilities of directorsAs explained more fully in the directors’ responsibilities statement set out on page 84, the directors are responsible for the preparation of the financial statements and for being satisfied that they give a true and fair view, and for such internal control as the directors determine is necessary to enable the preparation of financial statements that are free from material misstatement, whether due to fraud or error.
In preparing the financial statements, the directors are responsible for assessing the group and parent company’s ability to continue as a going concern, disclosing, as applicable, matters related to going concern and using the going concern basis of accounting unless the directors either intend to liquidate the group or the parent company or to cease operations, or have no realistic alternative but to do so.
Auditor’s responsibilities for the audit of the financial statements Our objectives are to obtain reasonable assurance about whether the financial statements as a whole are free from material misstatement, whether due to fraud or error, and to issue an auditor’s report that includes our opinion. Reasonable assurance is a high level of assurance, but is not a guarantee that an audit conducted in accordance with ISAs (UK) will always detect a material misstatement when it exists. Misstatements can arise from fraud or error and are considered material if, individually or in the aggregate, they could reasonably be expected to influence the economic decisions of users taken on the basis of these financial statements.
Explanation as to what extent the audit was considered capable of detecting irregularities, including fraudIrregularities, including fraud, are instances of non-compliance with laws and regulations. We design procedures in line with our responsibilities, outlined above, to detect irregularities, including fraud. The risk of not detecting a material misstatement due to fraud is higher than the risk of not detecting one resulting from error, as fraud may involve deliberate concealment by, for example, forgery or intentional misrepresentations, or through collusion. The extent to which our procedures are capable of detecting irregularities, including fraud is detailed below.
However, the primary responsibility for the prevention and detection of fraud rests with both those charged with governance of the group and management.
• We obtained an understanding of the legal and regulatory frameworks that are applicable to the group and determined that the most significant are:
o IFRS, FRS101 and the Companies Act 2006
o Financial reporting Council (FRC)
o Tax legislation (Governed by HM Revenue and Customs)
o General Data Protection Regulation
o The UK Bribery Act
o Anti-Money Laundering Legislation
o Consumer rights laws
o Office of Gas and Electricity Markets
• We understood how Good Energy Group plc is complying with those frameworks by reading internal policies and codes of conduct and assessing the entity level control environment, including the level of oversight of the directors. We made enquiries of the group’s legal counsel
John Howarth (Senior statutory auditor)for and on behalf of Ernst & Young LLP, Statutory AuditorBristol30 April 2021
and internal audit of known instances of non-compliance or suspected non-compliance with laws and regulations. We designed our audit procedures to identify non-compliance with such laws and regulations identified in the paragraph above. As well as enquiry and attendance at meetings, our procedures involved a review of the reporting to the tax and treasury committee and a review of board meetings and other committee minutes to identify any non-compliance with laws and regulations. We understood any controls put in place by management to reduce the opportunities for fraudulent transactions.
• We assessed the susceptibility of the group’s financial statements to material misstatement, including how fraud might occur by making enquiries of senior management and those charged with governance. We understood the programmes and controls that the group has established to address risks identified, or that otherwise prevent, deter and detect fraud; and how senior management monitors those programmes and controls. We planned our audit to identify risks of management override, tested higher risk journal entries and performed audit procedures to address the potential for management bias, particularly over areas involving significant estimation and judgement. Our procedures were designed to provide reasonable assurance that the group and parent company financial statements were free from material misstatement.
• Based on this understanding we designed our audit procedures to identify non-compliance with such laws and regulations including all the subsidiaries included on the Group. Our procedures involved making enquiries of key management and legal counsel, reviewing key policies, inspecting legal registers and correspondence with regulators and reading key management meeting minutes. We also completed procedures to conclude on the compliance of significant disclosures in the Annual Report and Financial Statements with the requirements of the relevant accounting standards and UK legislation.
A further description of our responsibilities for the audit of the financial statements is located on the Financial Reporting Council’s website at https://www.frc.org.uk/auditorsresponsibilities. This description forms part of our auditor’s report.
Use of our reportThis report is made solely to the company’s members, as a body, in accordance with Chapter 3 of Part 16 of the Companies Act 2006. Our audit work has been undertaken so that we might state to the company’s members those matters we are required to state to them in an auditor’s report and for no other purpose. To the fullest extent permitted by law, we do not accept or assume responsibility to anyone other than the company and the company’s members as a body, for our audit work, for this report, or for the opinions we have formed.
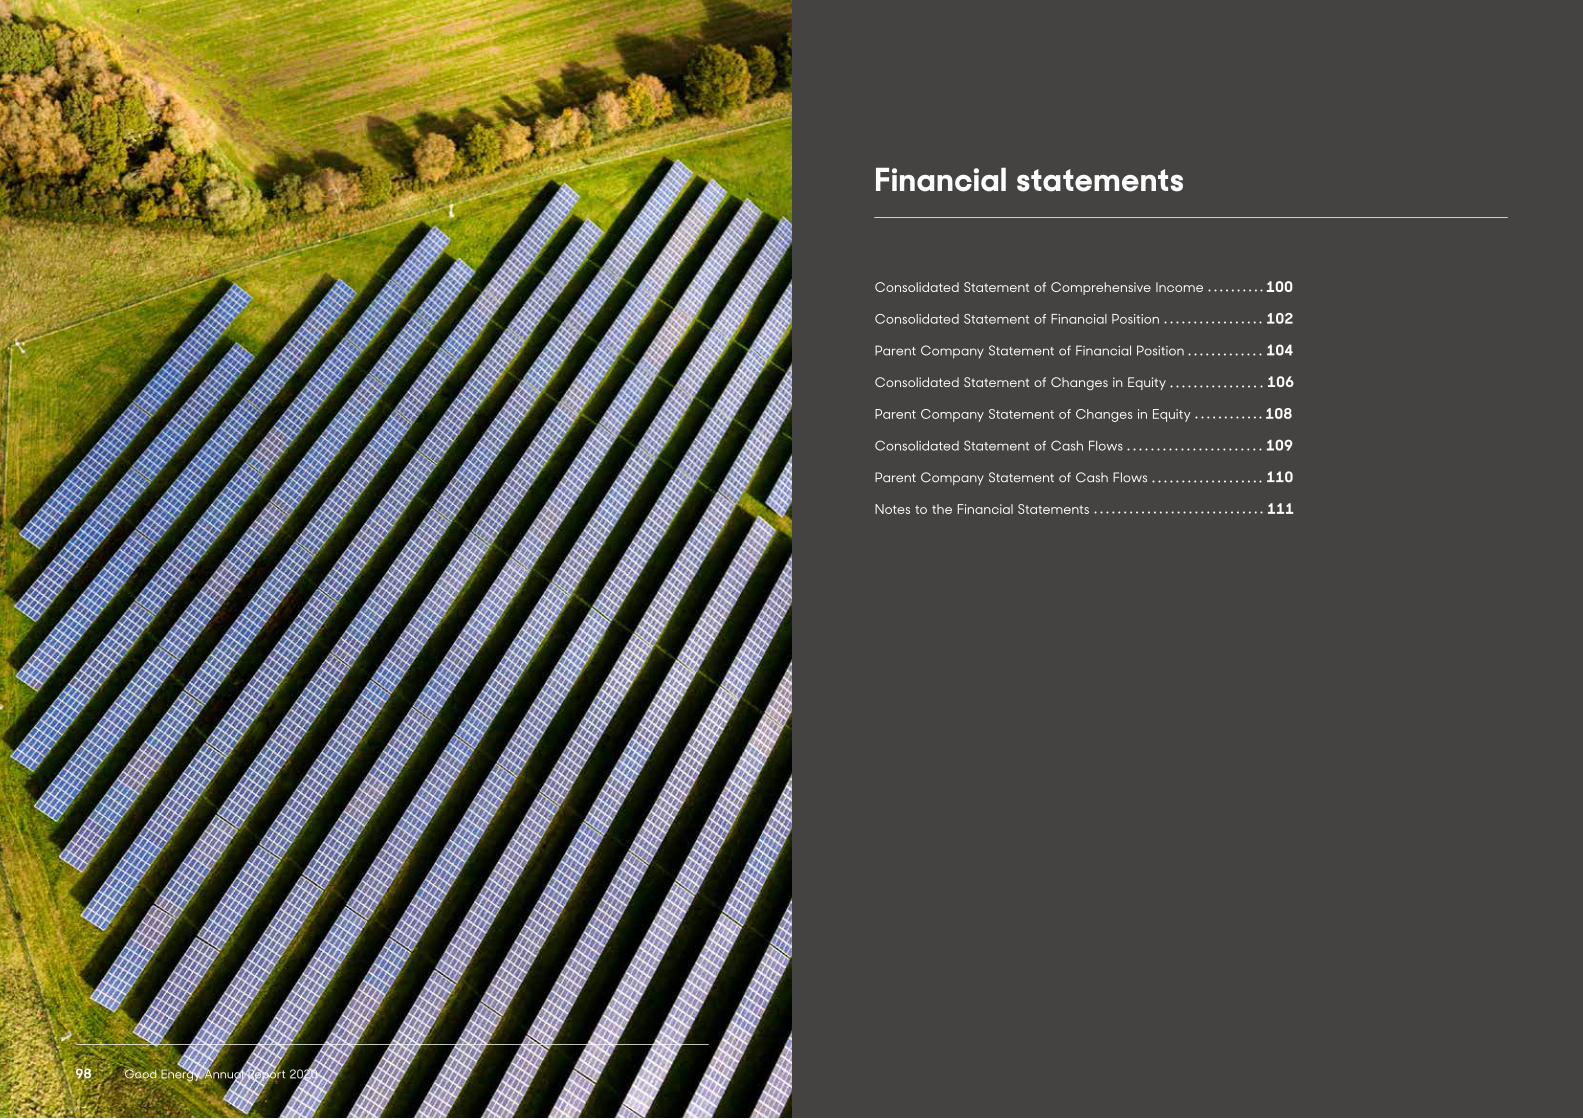
98 Good Energy Annual Report 2020
Strategic ReportG
overnance ReportFinancial Statem
ents
99Strategic Report
Consolidated Statement of Comprehensive Income 100
Consolidated Statement of Financial Position 102
Parent Company Statement of Financial Position 104
Consolidated Statement of Changes in Equity 106
Parent Company Statement of Changes in Equity 108
Consolidated Statement of Cash Flows 109
Parent Company Statement of Cash Flows 110
Notes to the Financial Statements 111
Financial statements
98 Good Energy Annual Report 2020

Strategic ReportG
overnance ReportFinancial Statem
ents
100 101Good Energy Annual Report 2020 Financial statements
Consolidated Statement of Comprehensive IncomeFor the year ended 31 December 2020
Note
2020
Underlying
2020 Non-
underlyingitems (note 7)
2020 2019
Underlying
2019Non-
underlying items
2019
£000’s £000’s £000’s £000’s £000’s £000’s
REVENUE 6 130,649 - 130,649 124,258 - 124,258
Cost of sales 6 (101,082) - (101,082) (92,601) - (92,601)
GROSS PROFIT 29,567 - 29,567 31,657 - 31,657
Administrative expenses 7 (25,029) (477) (25,506) (25,219) (865) (26,084)
OPERATING PROFIT 7 4,538 (477) 4,061 6,438 (865) 5,573
Finance income 11 109 - 109 166 - 166
Finance costs 12 (4,239) - (4,239) (4,439) - (4,439)
Share of loss of associate 19 (13) - (13) (42) - (42)
(LOSS)/PROFIT BEFORE TAX 6 395 (477) (82) 2,123 (865) 1,258
Taxation 13 (72) 91 19 (206) 164 (42)
(LOSS)/PROFIT FOR THE YEAR FROM CONTINUING OPERATIONS
323 (386) (63) 1,917 (701) 1,216
(Loss) from discontinued operations, before tax
6 - - - (930) - (930)
Taxation on discontinued operations
13 - - - (32) - (32)
(LOSS)/PROFIT FOR THE PERIOD 323 (386) (63) 955 (701) 254
Attributable to: Good Energy Group PLC
448 (386) 62 955 (701) 254
Attributable to: Non-controlling Interests
(125) - (125) - - -
Earnings per share Basic 14 2.7p (2.4p) 0.4p 5.9p (4.3p) 1.6p
Diluted 14 2.7p (2.3p) 0.4p 5.7p (4.2p) 1.5p
Earnings per share (continuing operations) Basic 14 2.7p (2.4p) 0.4p 11.8p (4.3p) 7.5p
Diluted 14 2.7p (2.3p) 0.4p 11.4p (4.2p) 7.2p
Note
2020
Underlying
2020 Non-
underlyingitems
(note 7)
2020 2019
Underlying
2019Non-
underlying items
2019
£000’s £000’s £000’s £000’s £000’s £000’s
PROFIT FOR THE PERIOD 323 (386) (63) 955 (701) 254
OTHER COMPREHENSIVE INCOME
Other Comprehensive income that will not be reclassified to profit or loss in subsequent periods (net of tax)
Revaluation of Generation sites 15 13,313 - 13,313 - -
Other comprehensive income for the year, net of tax
13,313 - 13,313 - - -
Total comprehensive income for the year attributable to owners of the parent company
13,636 (386) 13,250 955 (701) 254
Attributable to: Good Energy Group PLC
13,761 (386) 13,375 955 (701) 254
Attributable to: Non-controlling Interests
(125) - (125) - - -
The notes on pages 111 to 177 form part of these financial statements.
Consolidated Statement of Comprehensive Income (continued)For the year ended 31 December 2020
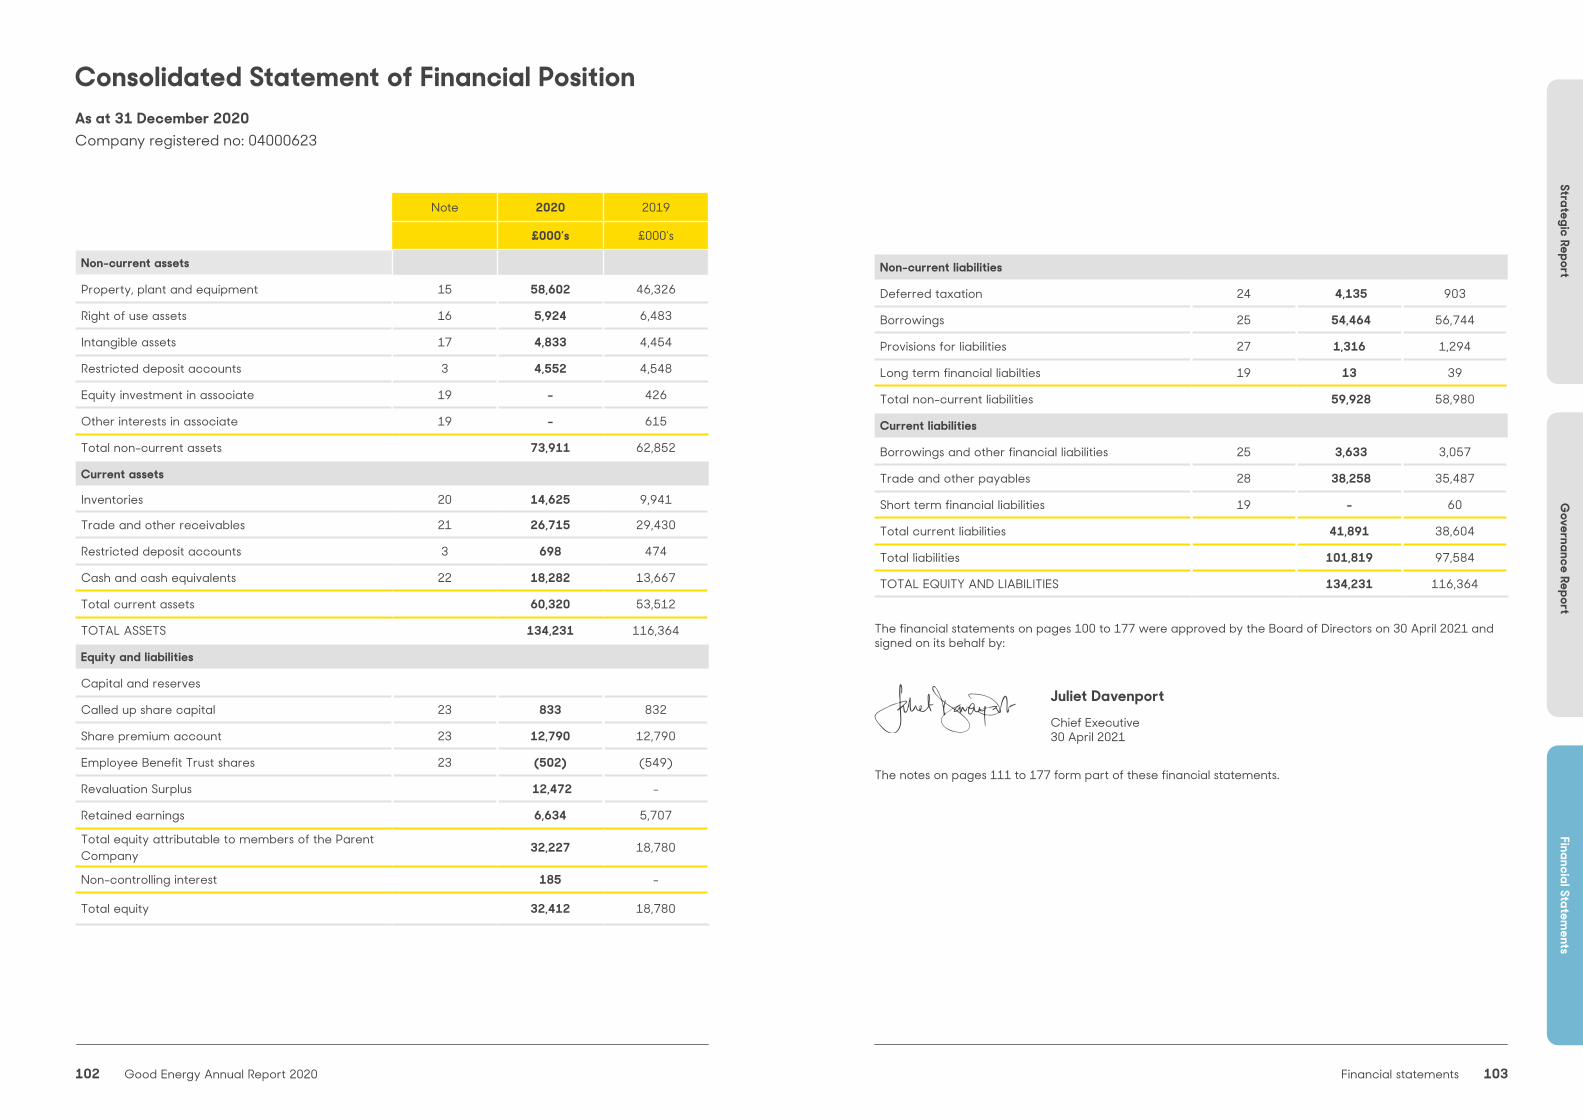
Strategic ReportG
overnance ReportFinancial Statem
ents
102 103Good Energy Annual Report 2020 Financial statements
Non- current liabilities
Deferred taxation 24 4,135 903
Borrowings 25 54,464 56,744
Provisions for liabilities 27 1,316 1,294
Long term financial liabilties 19 13 39
Total non- current liabilities 59,928 58,980
Current liabilities
Borrowings and other financial liabilities 25 3,633 3,057
Trade and other payables 28 38,258 35,487
Short term financial liabilities 19 - 60
Total current liabilities 41,891 38,604
Total liabilities 101,819 97,584
TOTAL EQUITY AND LIABILITIES 134,231 116,364
The financial statements on pages 100 to 177 were approved by the Board of Directors on 30 April 2021 and signed on its behalf by:
The notes on pages 111 to 177 form part of these financial statements.
Note 2020 2019
£000’s £000’s
Non-current assets
Property, plant and equipment 15 58,602 46,326
Right of use assets 16 5,924 6,483
Intangible assets 17 4,833 4,454
Restricted deposit accounts 3 4,552 4,548
Equity investment in associate 19 - 426
Other interests in associate 19 - 615
Total non- current assets 73,911 62,852
Current assets
Inventories 20 14,625 9,941
Trade and other receivables 21 26,715 29,430
Restricted deposit accounts 3 698 474
Cash and cash equivalents 22 18,282 13,667
Total current assets 60,320 53,512
TOTAL ASSETS 134,231 116,364
Equity and liabilities
Capital and reserves
Called up share capital 23 833 832
Share premium account 23 12,790 12,790
Employee Benefit Trust shares 23 (502) (549)
Revaluation Surplus 12,472 -
Retained earnings 6,634 5,707
Total equity attributable to members of the Parent Company 32,227 18,780
Non-controlling interest 185 -
Total equity 32,412 18,780
Consolidated Statement of Financial PositionAs at 31 December 2020Company registered no: 04000623
Juliet DavenportChief Executive 30 April 2021
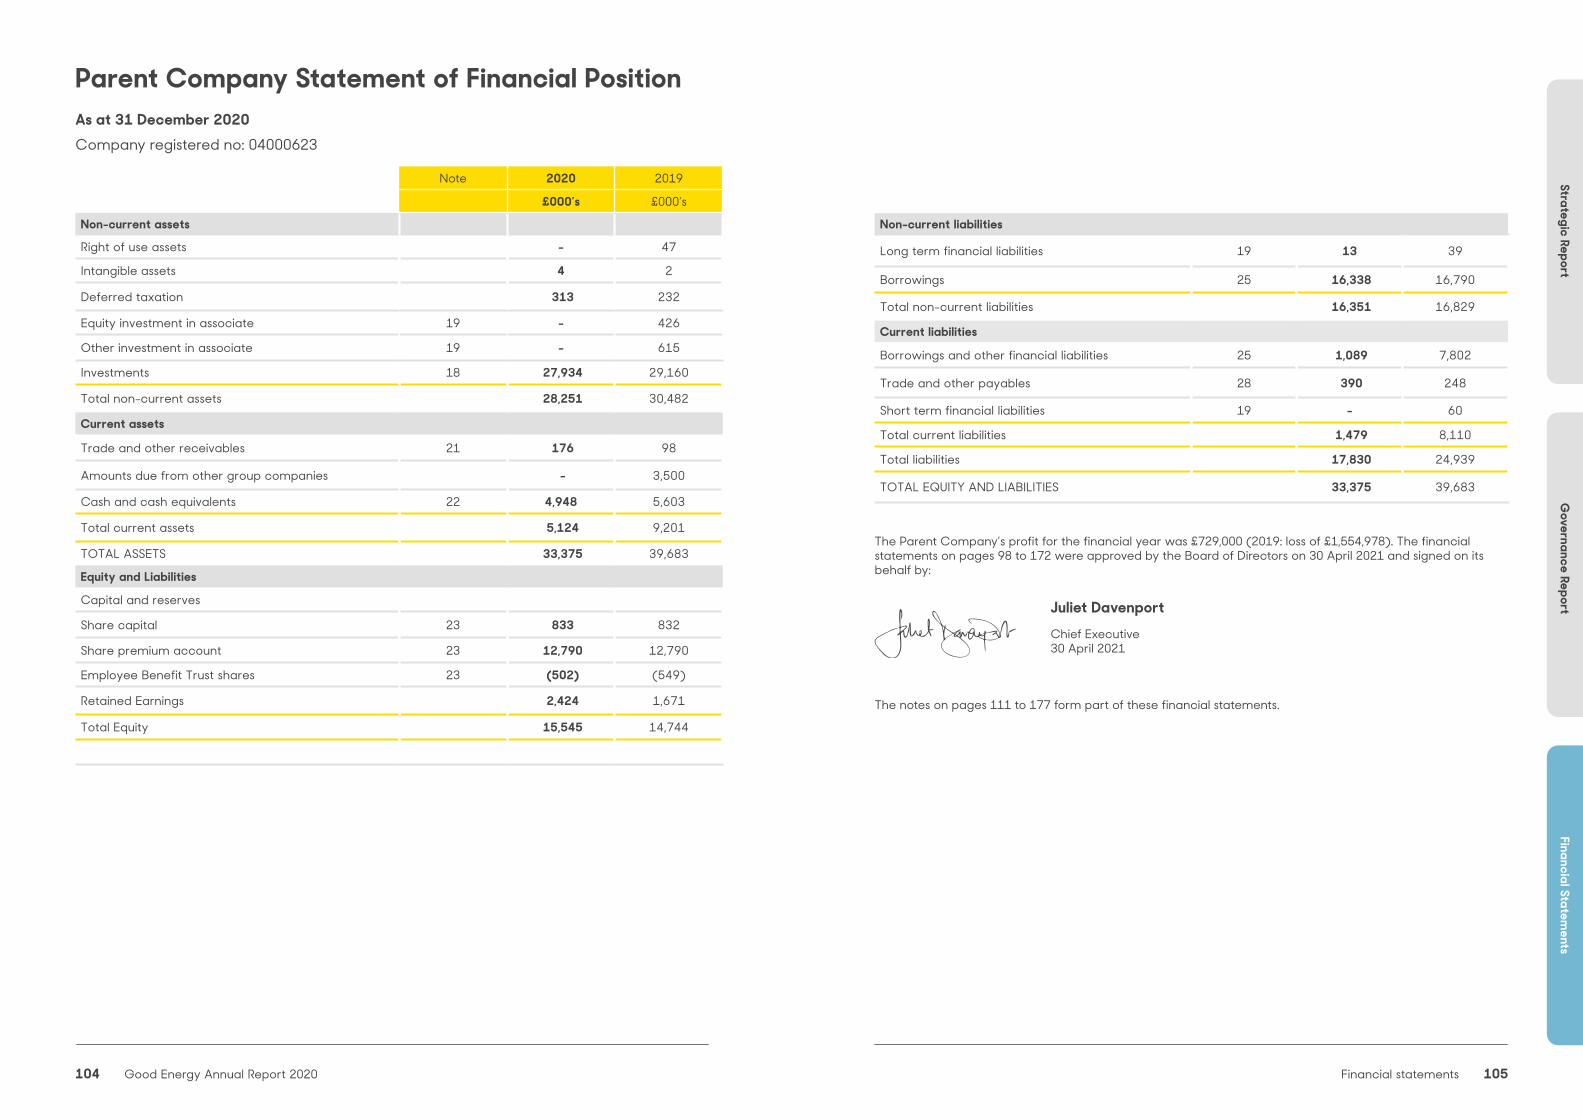
Strategic ReportG
overnance ReportFinancial Statem
ents
104 105Good Energy Annual Report 2020 Financial statements
Parent Company Statement of Financial PositionAs at 31 December 2020Company registered no: 04000623
Note 2020 2019
£000’s £000’s
Non-current assets
Right of use assets - 47
Intangible assets 4 2
Deferred taxation 313 232
Equity investment in associate 19 - 426
Other investment in associate 19 - 615
Investments 18 27,934 29,160
Total non- current assets 28,251 30,482
Current assets
Trade and other receivables 21 176 98
Amounts due from other group companies - 3,500
Cash and cash equivalents 22 4,948 5,603
Total current assets 5,124 9,201
TOTAL ASSETS 33,375 39,683
Equity and Liabilities
Capital and reserves
Share capital 23 833 832
Share premium account 23 12,790 12,790
Employee Benefit Trust shares 23 (502) (549)
Retained Earnings 2,424 1,671
Total Equity 15,545 14,744
Non- current liabilities
Long term financial liabilities 19 13 39
Borrowings 25 16,338 16,790
Total non- current liabilities 16,351 16,829
Current liabilities
Borrowings and other financial liabilities 25 1,089 7,802
Trade and other payables 28 390 248
Short term financial liabilities 19 - 60
Total current liabilities 1,479 8,110
Total liabilities 17,830 24,939
TOTAL EQUITY AND LIABILITIES 33,375 39,683
The Parent Company’s profit for the financial year was £729,000 (2019: loss of £1,554,978). The financial statements on pages 98 to 172 were approved by the Board of Directors on 30 April 2021 and signed on its behalf by:
The notes on pages 111 to 177 form part of these financial statements.
Juliet DavenportChief Executive 30 April 2021

Strategic ReportG
overnance ReportFinancial Statem
ents
106 107Good Energy Annual Report 2020 Financial statements
Note Called up share capital
Share premium account
EBT shares Retainedearnings
Total equity
£000’s £000’s £000’s £000’s £000’s
At 1 January 2019 829 12,719 (810) 6,088 18,826
Profit for the year - - - 254 254
Other comprehensive income for the year - - - - -
Total comprehensive income for the year - - - 254 254
Share based payments 31 - - - 81 81
Exercise of options 31 - - 261 (132) 129
Dividend paid 29 3 71 - (584) (510)
Total contributions by and distributions to owners of the parent, recognised directly in equity
3 71 261 (635) (300)
At 31 December 2019 832 12,790 (549) 5,707 18,780
Consolidated Statement of Changes in EquityFor the year ended 31 December 2020
Note Share captial
Share premium account
EBT shares Retainedearnings
Revaluationsurplus
Non-controlling
interest
Total equity
£000’s £000’s £000’s £000’s £000’s £000’s £000’s
At 1 January 2020 832 12,790 (549) 5,707 - - 18,780
Profit/(Loss) for the year - - - 62 - (125) (63)
Other comprehensive income for the year
- - - - 13,313 - 13,313
Total comprehensive income for the year
- - - 62 13,313 (125) 13,250
Share based payments 31 - - - 39 - - 39
Exercise of options 31 1 - 47 (15) - - 33
Acquisition of subsidiary - - - - - 310 310
Transfer of revaluation to retained earnings
- - - 841 (841) - -
Total contributions by and distributions to owners of the parent, recognised directly in equity
1 - 47 865 (841) 310 382
At 31 December 2020 833 12,790 (502) 6,634 12,472 185 32,412
The notes on pages 111 to 177 form part of these financial statements.
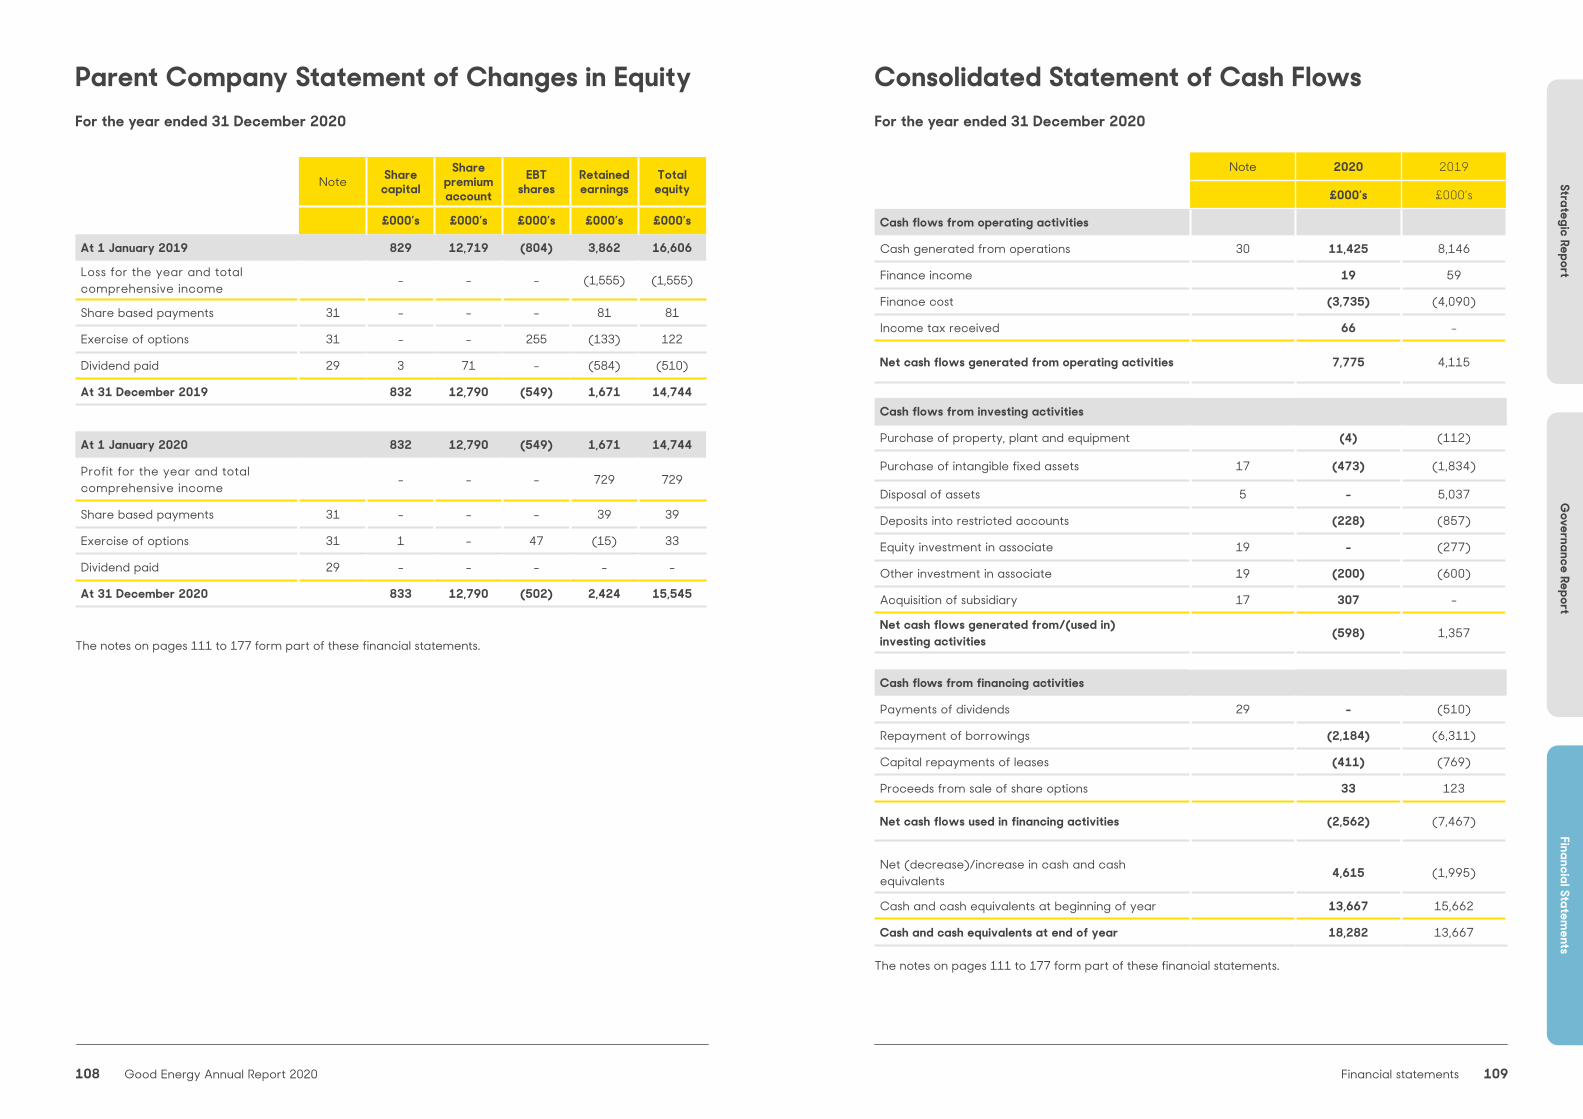
Strategic ReportG
overnance ReportFinancial Statem
ents
108 109Good Energy Annual Report 2020 Financial statements
Note Share capital
Share premium account
EBT shares
Retainedearnings
Total equity
£000’s £000’s £000’s £000’s £000’s
At 1 January 2019 829 12,719 (804) 3,862 16,606
Loss for the year and total comprehensive income - - - (1,555) (1,555)
Share based payments 31 - - - 81 81
Exercise of options 31 - - 255 (133) 122
Dividend paid 29 3 71 - (584) (510)
At 31 December 2019 832 12,790 (549) 1,671 14,744
At 1 January 2020 832 12,790 (549) 1,671 14,744
Profit for the year and total comprehensive income - - - 729 729
Share based payments 31 - - - 39 39
Exercise of options 31 1 - 47 (15) 33
Dividend paid 29 - - - - -
At 31 December 2020 833 12,790 (502) 2,424 15,545
The notes on pages 111 to 177 form part of these financial statements.
Parent Company Statement of Changes in EquityFor the year ended 31 December 2020
Note 2020 2019
£000’s £000’s
Cash flows from operating activities
Cash generated from operations 30 11,425 8,146
Finance income 19 59
Finance cost (3,735) (4,090)
Income tax received 66 -
Net cash flows generated from operating activities 7,775 4,115
Cash flows from investing activities
Purchase of property, plant and equipment (4) (112)
Purchase of intangible fixed assets 17 (473) (1,834)
Disposal of assets 5 - 5,037
Deposits into restricted accounts (228) (857)
Equity investment in associate 19 - (277)
Other investment in associate 19 (200) (600)
Acquisition of subsidiary 17 307 -
Net cash flows generated from/(used in) investing activities (598) 1,357
Cash flows from financing activities
Payments of dividends 29 - (510)
Repayment of borrowings (2,184) (6,311)
Capital repayments of leases (411) (769)
Proceeds from sale of share options 33 123
Net cash flows used in financing activities (2,562) (7,467)
Net (decrease)/increase in cash and cash equivalents 4,615 (1,995)
Cash and cash equivalents at beginning of year 13,667 15,662
Cash and cash equivalents at end of year 18,282 13,667 The notes on pages 111 to 177 form part of these financial statements.
Consolidated Statement of Cash FlowsFor the year ended 31 December 2020
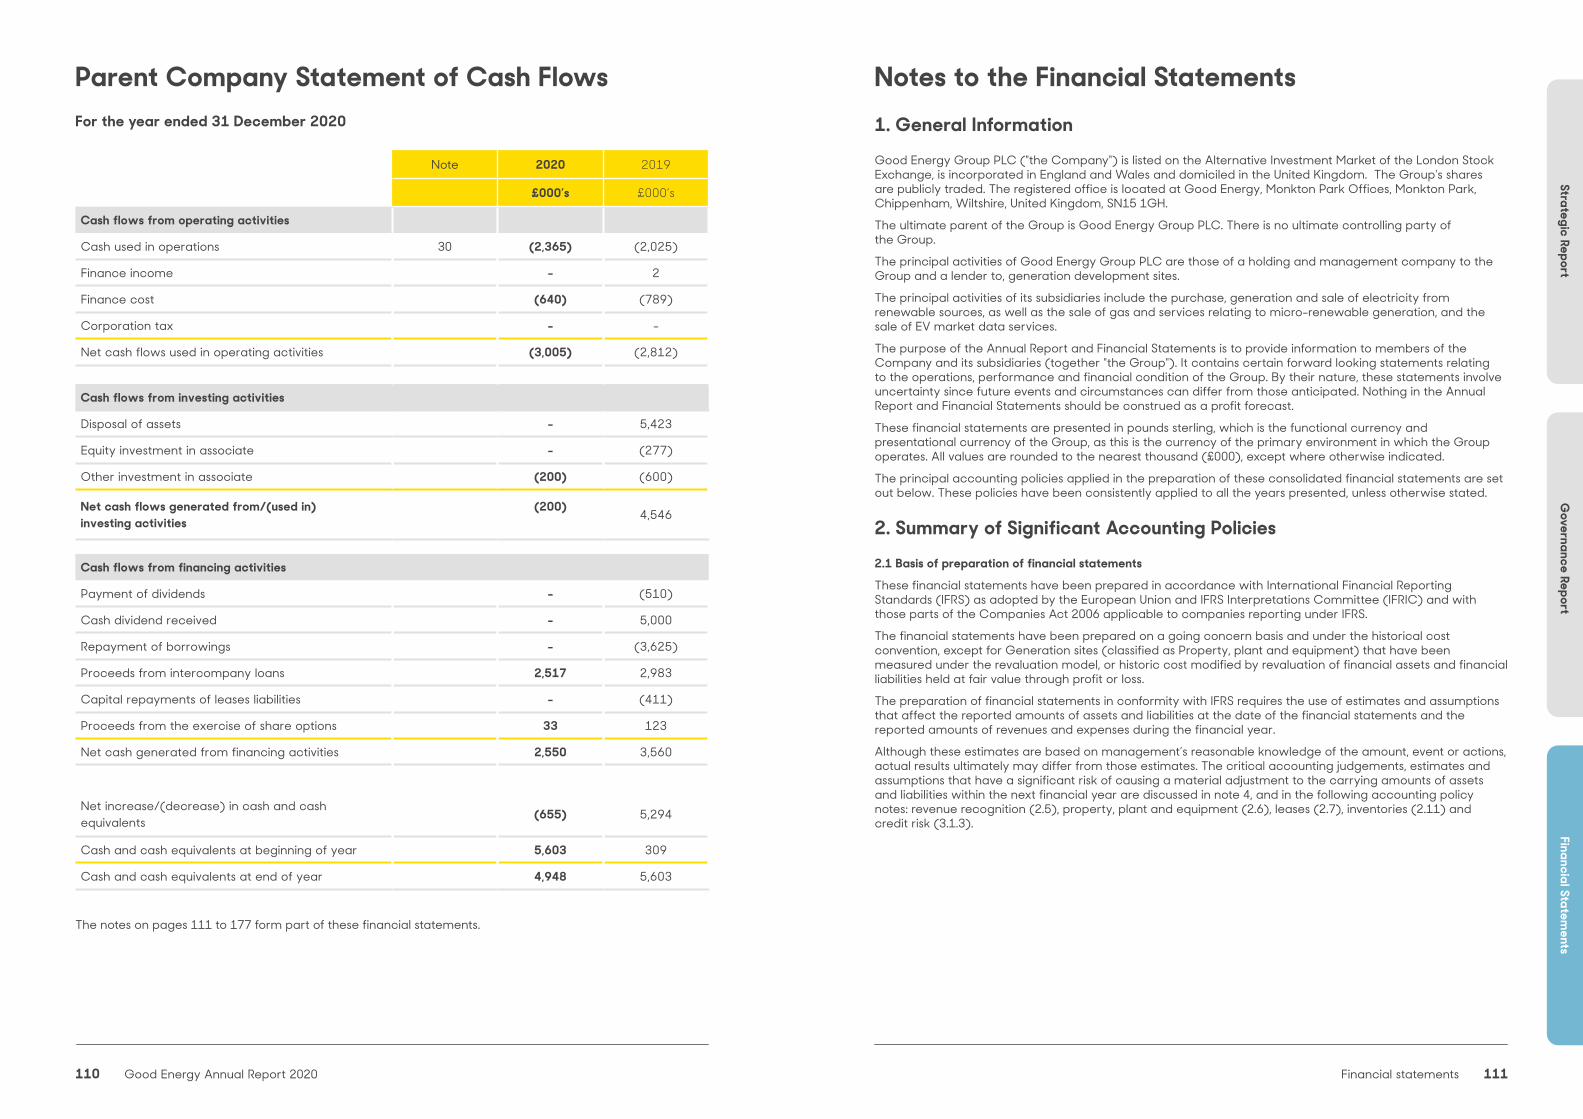
Strategic ReportG
overnance ReportFinancial Statem
ents
110 111Good Energy Annual Report 2020 Financial statements
Note 2020 2019
£000’s £000’s
Cash flows from operating activities
Cash used in operations 30 (2,365) (2,025)
Finance income - 2
Finance cost (640) (789)
Corporation tax - -
Net cash flows used in operating activities (3,005) (2,812)
Cash flows from investing activities
Disposal of assets - 5,423
Equity investment in associate - (277)
Other investment in associate (200) (600)
Net cash flows generated from/(used in) investing activities
(200) 4,546
Cash flows from financing activities
Payment of dividends - (510)
Cash dividend received - 5,000
Repayment of borrowings - (3,625)
Proceeds from intercompany loans 2,517 2,983
Capital repayments of leases liabilities - (411)
Proceeds from the exercise of share options 33 123
Net cash generated from financing activities 2,550 3,560
Net increase/(decrease) in cash and cash equivalents (655) 5,294
Cash and cash equivalents at beginning of year 5,603 309
Cash and cash equivalents at end of year 4,948 5,603
The notes on pages 111 to 177 form part of these financial statements.
Parent Company Statement of Cash FlowsFor the year ended 31 December 2020
Notes to the Financial Statements1. General InformationGood Energy Group PLC ("the Company") is listed on the Alternative Investment Market of the London Stock Exchange, is incorporated in England and Wales and domiciled in the United Kingdom. The Group's shares are publicly traded. The registered office is located at Good Energy, Monkton Park Offices, Monkton Park, Chippenham, Wiltshire, United Kingdom, SN15 1GH.
The ultimate parent of the Group is Good Energy Group PLC. There is no ultimate controlling party of the Group.
The principal activities of Good Energy Group PLC are those of a holding and management company to the Group and a lender to, generation development sites.
The principal activities of its subsidiaries include the purchase, generation and sale of electricity from renewable sources, as well as the sale of gas and services relating to micro-renewable generation, and the sale of EV market data services.
The purpose of the Annual Report and Financial Statements is to provide information to members of the Company and its subsidiaries (together "the Group"). It contains certain forward looking statements relating to the operations, performance and financial condition of the Group. By their nature, these statements involve uncertainty since future events and circumstances can differ from those anticipated. Nothing in the Annual Report and Financial Statements should be construed as a profit forecast.
These financial statements are presented in pounds sterling, which is the functional currency and presentational currency of the Group, as this is the currency of the primary environment in which the Group operates. All values are rounded to the nearest thousand (£000), except where otherwise indicated.
The principal accounting policies applied in the preparation of these consolidated financial statements are set out below. These policies have been consistently applied to all the years presented, unless otherwise stated.
2. Summary of Significant Accounting Policies2.1 Basis of preparation of financial statements
These financial statements have been prepared in accordance with International Financial Reporting Standards (IFRS) as adopted by the European Union and IFRS Interpretations Committee (IFRIC) and with those parts of the Companies Act 2006 applicable to companies reporting under IFRS.
The financial statements have been prepared on a going concern basis and under the historical cost convention, except for Generation sites (classified as Property, plant and equipment) that have been measured under the revaluation model, or historic cost modified by revaluation of financial assets and financial liabilities held at fair value through profit or loss.
The preparation of financial statements in conformity with IFRS requires the use of estimates and assumptions that affect the reported amounts of assets and liabilities at the date of the financial statements and the reported amounts of revenues and expenses during the financial year.
Although these estimates are based on management’s reasonable knowledge of the amount, event or actions, actual results ultimately may differ from those estimates. The critical accounting judgements, estimates and assumptions that have a significant risk of causing a material adjustment to the carrying amounts of assets and liabilities within the next financial year are discussed in note 4, and in the following accounting policy notes: revenue recognition (2.5), property, plant and equipment (2.6), leases (2.7), inventories (2.11) and credit risk (3.1.3).
Strategic ReportG
overnance ReportFinancial Statem
ents
112 113Good Energy Annual Report 2020 Financial statements
Notes to the Financial Statements2. Summary of Significant Accounting Policies (continued)2.2 Basis of consolidation
The consolidated financial statements comprise the financial statements of the Group and its subsidiaries as at 31 December 2020. Control is achieved when the Group is exposed, or has rights, to variable returns from its involvement with the investee and has the ability to affect those returns through its power over the investee. Specifically, the Group controls an investee if, and only if, the Group has:
• Power over the investee (i.e. existing rights that give it the current ability to direct the relevant activities of the investee).
• Exposure, or rights, to variable returns from its involvement with the investee.
• The ability to use its power over the investee to affect its returns.
Generally, there is a presumption that a majority of voting rights result in control. To support this presumption, and when the Group has less than a majority of the voting or similar rights of an investee, the Group considers all relevant facts and circumstances in assessing whether it has power over an investee, including:
• The contractual arrangement with the other vote holders of the investee.
• Rights arising from other contractual arrangements.
• The Group’s voting rights and potential voting rights.
The Group reassesses whether or not it controls an investee if facts and circumstances indicate that there are changes to one or more of the three elements of control. Consolidation of a subsidiary begins when the Group obtains control over the subsidiary and ceases when the Group loses control of the subsidiary.
Assets, liabilities, income and expenses of a subsidiary acquired or disposed of during the year are included in the consolidated financial statements from the date the Group gains control until the date the Group ceases to control the subsidiary.
Profit or loss and each component of other comprehensive income (OCI) are attributed to the equity holders of the Parent of the Group and to the non-controlling interests, even if this results in the non-controlling interests having a deficit balance. When necessary, adjustments are made to the financial statements of subsidiaries to bring their accounting policies into line with the Group’s accounting policies.
All intra-group assets and liabilities, equity, income, expenses and cash flows relating to transactions between members of the Group are eliminated in full on consolidation.
A change in the ownership interest of a subsidiary, without a loss of control, is accounted for as an equity transaction.
If the Group loses control over a subsidiary, it derecognises the related assets (including goodwill), liabilities, non-controlling interest and other components of equity while any resultant gain or loss is recognised in profit or loss. Any investment retained is recognised at fair value.
Notes to the Financial Statements2. Summary of Significant Accounting Policies (continued)2.3 Going concernThe financial statements have been prepared on the going concern basis as the Directors have assessed that there is a reasonable expectation that the Group will be able to continue in operation and meet its commitments as they fall due over the going concern period. The Group continues to respond well to the challenges associated with the Covid-19 pandemic. All core business functions continue to perform as expected during remote working, and the operation of generation sites has not been affected by lockdown periods. The implementation of our new customer technology platform is progressing as planned which provides us with flexibility to operate and deliver all services to customers.The additional cash released through the restructuring of the financing of the Group’s renewable generation asset portfolio, has provided the Group with £7.8m of unrestricted cash. This financing restructure also represents a loosening of covenant ratios compared to the existing GCP facility. Looking to the future, the Group has performed a going concern review, going out until December 2022 for prudence, considering both a Base Case and a Downside Case. Having reviewed this forecast, and having applied a reverse stress test, the possibility that financial headroom could be exhausted is considered to be extremely remote. The Base case assumes continued depressed Commercial volumes for the first half of 2021 due to Covid-19 related lockdowns, recovering to normal levels by the end of 2021. It also assumes no cash flow mitigations are actioned during the years covered by the Going Concern review and that the Group will repay the bond on its entirety by June 2022. The Downside case assumes Commercial volumes remain depressed until the end of December 2021 and assumes higher levels of customer churn than expected in the Base case. Directors consider the main risks to going concern to be liquidity and compliance with covenants, and so have performed a Reverse Cash Stress Test. This shows that it is very unlikely that the Group will have problems with liquidity or covenants during the year, as there is significant headroom above both the Base case and the Downside case. The Group has long standing and well operated trading relationships with a number of counterparties, the majority of which contain an agreement that the Group’s Tangible Net Worth (defined as paid up shareholder cash contributions plus retained earnings) should not decrease by more than 25% over a 12 month period or fall to below a certain level. Tangible Net Worth covenants are tested annually on publication of audited financial statements. Breach of this financial covenant allows counterparties, if they so decide, to request additional financial support (which may be in the form of a parent company guarantee, letter of credit or other financial security). The counterparty may terminate the contract if appropriate additional financial security is not provided, if requested, within a timely manner. The value at risk with counterparties based upon current commodity contracts and current market prices is estimated at approximately £0.3m. The Group’s electricity is purchased from direct relationships with generators, with power hedged and balanced by trading with counterparties. This reduces the Group’s reliance on trading counterparties when compared to a supplier without such supplier relationships.The Group’s borrowings with GCP, amounting to £39.8m after the restructure performed in April 2021, contains three covenants being two debt service cover ratios (DSCR) and a loan life cover ratio (LLCR) specifically associated with the generation assets. The new loan facility has reset the DSCR and LLCR cover ratios . Compliance with these covenants is based on generation prices and volumes, which the Board has concluded are unlikely to materially decrease due to any foreseeable reason. Covenant over Cooperative Bank has been extinguished and the GCP covenant has been reset due to the refinancing. In order for the business to run out of cash and breach a counterparty covenant, the Reverse Cash Stress Test requires that 31% of commercial debts, and 32% of domestic debts are not collected after government Covid-19 reliefs start to taper off, for a period lasting 6 months, and that only 50% of these debts not originally collected are subsequently collected over a period of 9 months post-March 2022. In this case, cash flow mitigations would be implemented, mostly reductions in discretionary spending. The directors believe that this scenario is very unlikely as a result of the historic evidence gained from our sustained performance during 2020, which was a year impacted significantly by Covid. Throughout 2020 the Group’s cash collections have remained strong, with bad debt write offs similar to a usual year. Therefore, Directors are confident in the ongoing stability of the Group, and its ability to continue operation and meet its commitments as they fall due over the going concern period. Accordingly, the Directors adopt the going concern basis in preparing the financial statements.

Strategic ReportG
overnance ReportFinancial Statem
ents
114 115Good Energy Annual Report 2020 Financial statements
Notes to the Financial Statements2. Summary of Significant Accounting Policies (continued) 2.4 Change in accounting policies and disclosures
Revaluation of Generation assetsThe Group re-assessed its accounting for property, plant and equipment with respect to measurement of a certain class of property, plant and equipment after initial recognition. The Group had previously measured all property, plant and equipment using the historical cost model whereby, after initial recognition, the asset was carried at cost less accumulated depreciation and accumulated impairment losses.On 1 January 2020, the Group elected to change the method of accounting for its generation assets classified as property, plant and equipment, as the Group believes that the revaluation model provides more relevant information to the users of its financial statements. The generation assets are a key part of the Group’s Electricity Generation segment and underpin the majority of the Group’s long-term debt. The election to adopt the revaluation model for these assets provides more accurate information on the value of the future economic benefits expected to be realised from these assets. These assets have been pledged as security for the debt against them and therefore the revaluation policy provides more accurate and transparent picture of the asset value against its related debt obligations. The adoption of the revaluation policy will only provide users with additional information with which to assess the Group’s position, and will not remove any information previously presented to users. In addition, available valuation techniques provide reliable estimates of the generation assets’ fair value. The Group has applied the revaluation model prospectively.
Notes to the Financial Statements2. Summary of Significant Accounting Policies (continued) 2.5 Revenue recognition
The Group is in the business of providing supplies of electricity and gas, the generation of power, the sale of advertising space and EV market data, as well as Feed-in-Tariff (FiT) administration services. Revenue from contracts with customers is recognised when control of the goods or services is transferred to the customer at an amount that reflects the consideration to which the Group expects to be entitled in exchange for those goods or services. The Group has generally concluded that it is the principal in its revenue arrangements, except for the FiT administration services below, because it typically controls the goods or services before transferring to the customer.
The disclosures of significant accounting judgements, estimates and assumptions relating to revenue from contracts with customers are provided in notes 4.1.1 and 4.2.1.
A contract liability is the obligation to transfer goods or services to a customer for which the Group has received consideration from the customer.
If a customer pays consideration before the Group transfers goods or services to the customer, a contract liability is recognised when the payment is made. Contract liabilities are recognised as revenue when the Group performs under the contract. The Group recognises contract liabilities when customers are in a credit position.
2.5.1 Power supply
Revenue for the supply of electricity is accrued based on industry data flows and National Grid data. Revenue calculated from energy sales includes an estimate of the quantity in units of electricity or gas supplied to customers by profile class in the 12 months preceding the end of the period, and an estimate of the average sales price per unit, and standing charge.
10% of the total revenue figure is estimated, with a fixed transaction price and estimated unit consumption. The estimate is made using historical consumption patterns, industry estimated consumption rates, and takes into consideration industry reconciliation processes, upon which the Group takes a prudent position until final reconciliation data is available from the industry 14 months after the supply date.
Unbilled revenue is superseded when customer meter reads are received; at which point estimates are adjusted to actual usage. Transaction price is explicitly stated per unit and per day. Unbilled revenue is estimated using the most likely outcome approach.
For gas, revenue is accrued based on information received from the Group’s gas shipper, Contract Natural Gas Limited, which includes details of all the sites held, their estimated annual quantities of gas used adjusted by a pre-determined weather correction factor. This information is subsequently adjusted and invoiced based on customer and industry meter reads. Transaction price is explicitly stated per unit and per day.
Revenue is recognised over time as the electricity or gas is delivered to the customer. The transaction price is clearly stated, there are no separate performance obligations to which a portion of the transaction price needs to be allocated, and there is no variable consideration. Discounts are given to 100% of customers who meet certain criteria, and a provision is built up monthly to account for these, offsetting against revenue over time as the discount is incurred, which is in line with IFRS 15 Revenue from Contracts with Customers.
For electricity and gas supply, payment is collected either as a direct debit or paid on receipt of bill in arrears. Overdue amounts are reviewed regularly for impairment and provision made as necessary. No refunds, returns or warranties are applicable.
2.5.2 Feed-in-Tariff (FiT) revenue
Some of the generation sites receive FiT subsidy revenue from OFGEM. The FiT scheme (introduced in April 2010) is a government scheme designed to promote the uptake of renewable generation technologies. FiT payments are received quarterly for the electricity that the generating asset has generated and exported in the period, based on meter readings supplied. This is a single performance obligation (to generate renewable electricity) and the transaction price is explicitly set out per unit of electricity generated. The performance obligation is satisfied immediately when the power is generated. Payment is received from OFGEM approximately 45 days after the end of the period of generation. No refunds, returns or warranties are applicable.

Strategic ReportG
overnance ReportFinancial Statem
ents
116 117Good Energy Annual Report 2020 Financial statements
Notes to the Financial Statements2. Summary of Significant Accounting Policies (continued) 2.5 Revenue recognition (continued)
2.5.3 Feed-in-Tariff (FiT) administration services
The Group provides FiT administration services to micro-generators who are signed up to the FiT scheme. For FiT services, revenue is earned from OFGEM for administering the scheme, which is deemed to be the transaction price. For FiT services, there is an initial fee paid by OFGEM for taking on a generator, and then an ongoing amount that is received annually for provision of FiT services.
The initial fee is spread over the period from when the customer signs up with Good Energy until the following April, when the FiT compliance year ends for a new customer, and the ongoing fee that is received is spread over the 12 month compliance period. No refunds, returns or warranties are applicable.
2.5.4 Renewable Obligation Certificates (ROCs) revenue recognition
ROCs are awarded to the Group from OFGEM based on generation of power. These ROCs are sold on receipt of certificates from OFGEM allowing transfer of title. ROC revenue is deemed to be subsidy revenue rather than revenue from contracts with customers.
The amount of revenue recognised on sale is in accordance with a contractual agreement where the pricing is based on OFGEM’s minimum ROC value (the buy-out) and a prudent estimate of the re-cycle element of the final value of a ROC once all energy suppliers have complied or paid the penalty for non-compliance with the renewables obligation (the recycle). A final adjustment to ROC revenue and profit is recognised once OFGEM have announced the final out-turn ROC price, but this is not accounted for in advance of the receipt of the final out-turn price as the transaction price is not measurable. The amount receivable is a contingent asset.
The performance obligation is satisfied when the power is generated as this ensures the certificates are generated by OFGEM. There is a three-month delay from generation to invoice, and payment is made 5 days after receipt of the invoice. No refunds, returns or warranties are applicable.
2.5.5 Power generation revenue
Revenue is generated when the wind or solar asset produced power that is sold to Good Energy Limited through a Power Purchase Agreement at an arms length fixed price per MWh, which is the transaction price. The performance obligation is satisfied at a point in time; immediately when the power is generated. Payment is made no more than one month after the delivery month of the power ends. No refunds, returns or warranties are applicable.
2.5.6 Advertising revenue
The Group has contracts to provide advertising space to companies on the nextgreencar.com website and Zap-map app. Advertising contracts are entered into for adverts to run for a set period of time, and explicitly state the transaction price. Payment is made on receipt of bill in advance. The performance obligation for revenue recognition is satisfied over time based upon the amount of time that the advert has been running on the platforms. No refunds, returns or warranties are applicable.
2.5.7 Sale of EV market data
The Group sells licences for access to data feeds on the EV market and sells data insight reports. The transaction is explicitly stated in the contract. The performance obligation for the data feed licence is satisfied over time as the customer has a licence to access data when they require for a set contracted time period. Payment is made on receipt of bill in advance. The performance obligation for the sale of data insight reports is satisfied at the point in time the report is delivered to the customer. No refunds, returns or warranties are applicable.
Notes to the Financial Statements2. Summary of Significant Accounting Policies (continued) 2.6 Property, plant and equipment
Property, plant and equipment is stated at cost, net of accumulated depreciation and accumulated impairment losses. Cost includes the original purchase price of the asset and any costs attributable to bringing the asset to its working condition for its intended use.
The Group recognises part of an asset when that cost is incurred, if the recognition criteria are satisfied. The carrying amount of the replaced part is derecognised. All other repaid and maintenance costs are charged to profit or loss in the period in which they are incurred.
Generation assets are measured at fair value less accumulated depreciation and impairment losses recognised after the date of revaluation. Valuations are performed with sufficient frequency to ensure that the carrying amount of a revalued asset does not differ materially from its fair value. A valuation is completed at least every 3 years, with a formal external valuation taking place at least every 5 years.
A revaluation surplus is recorded in OCI and credited to the asset revaluation surplus in equity. However, to the extent that it reverses a revaluation deficit of the same asset previously recognised in profit or loss, the increase is recognised in profit and loss. A revaluation deficit is recognised in the statement of profit or loss, except to the extent that it offsets an existing surplus on the same asset recognised in the asset revaluation surplus.
An annual transfer from the asset revaluation surplus to retained earnings is made for the difference between depreciation based on the revalued carrying amount of the asset and depreciation based on the asset’s original cost. Additionally, accumulated depreciation as at the revaluation date is eliminated against the gross carrying amount of the asset and the net amount is restated to the revalued amount of the asset.
Upon disposal, any revaluation surplus relating to the particular asset being sold is transferred to retained earnings.
Depreciation is calculated on a straight-line basis over the estimated useful life of the asset, less any estimated residual value, on the following bases:
Fixtures, fittings and equipment between 3 and 5 years
Leasehold improvements over the life of the lease
Generation assets between 20 and 29 years
Assets under construction not depreciated
Depreciation of property, plant and equipment is included in the Consolidated Statement of Comprehensive Income in those expense categories consistent with the function of the asset.
An item of property, plant and equipment is derecognised upon disposal (i.e. at the date on which the recipient obtains control), or when no future economic benefits are expected from its use or disposal. Any gain or loss arising on derecognition (being the difference between the carrying amount of the asset and the net disposal proceeds) is included in profit or loss, upon derecognition.
2.6.1 Impairment of property, plant and equipment (including right-of-use assets)
The useful economic lives of assets and their residual values are reviewed on an annual basis and revised where considered appropriate.
At each reporting date, property, plant and equipment is reviewed for impairment if events or changes in circumstances indicate that the carrying amount may not be recoverable. Any impairment in carrying value is charged to the Statement of Comprehensive Income in those expense categories consistent with the function of the impaired asset, and is recognised in the period in which it occurs.
Strategic ReportG
overnance ReportFinancial Statem
ents
118 119Good Energy Annual Report 2020 Financial statements
Notes to the Financial Statements2. Summary of Significant Accounting Policies (continued) 2.7 Leases (the Group as a lessee)
For any new contracts entered into on or after 1 January 2019, the Group performs an assessment at the inception of a contract to determine whether the contract is, or contains, a lease. A lease is defined as “a contract, or part of a contract, that conveys the right to control the use of an identified asset for a period of time in exchange for consideration”.
The Group applies a single recognition and measurement approach for all leases, with the exception of those which are short-term, or which comprise low-value assets. The Group recognises lease liabilities to make lease payments and right-of-use assets representing the right to use the underlying assets.
(a) Right-of-use assets
At the lease commencement date (i.e. the date on which the underlying asset is made available for use), the Group recognises a right-of-use asset on the Statement of Financial Position. Right-of-use assets are measured at cost, less any accumulated depreciation and impairment losses, and adjusted for any remeasurement of lease liabilities.
The cost of the right-of-use asset comprises:
• the initial measurement of the lease liability,
• any initial direct costs incurred by the Group,
• an estimate of any costs required to dismantle or remove the asset at the end of the lease, and
• any lease payments made in advance of the lease commencement date, net of any incentives received.
Right-of-use assets are depreciated on a straight-line basis from the lease commencement date to the earlier of the end of the estimated useful life of the right-of-use assets and the end of the lease term. If ownership of the leased asset transfers to the Group at the end of the lease term, or the cost reflects the exercise of a purchase option, depreciation is calculated using the estimated useful life of the asset.
The Group classifies its right-of-use assets in a manner consistent with that of its property, plant and equipment, which includes the application of the same estimated useful life bases - please see note 2.6 for details.
The Group also assesses the right-of-use assets for impairment, when such indicators exist. Please refer to note 2.6.1 for the accounting policy in respect of impairment.
(b) Lease liabilities
At the commencement date of the lease, the Group recognises lease liabilities measured at the present value of the lease payments to be made over the lease term. Lease payments included in the measurement of the lease liability include:
• fixed payments (including in-substance fixed payments) less any incentives receivable,
• variable lease payments that depend on an index or rate, and
• amounts expected to be paid under residual value guarantees.
The lease payments also include the exercise price of a purchase option that is reasonably certain to be exercised by the Group, along with payments of penalties for termination of the lease if the lease term reflects the Group exercising the option to terminate. Variable lease payments that do not depend on an index or rate are recognised as expenses in the period in which the event of condition that triggers the payment occurs.
In calculating the present value of lease payments, the Group uses its incremental borrowing rate at the lease commencement date if the rate implicit in the lease is not readily determinable. Subsequent to initial measurement, the amount of lease liabilities is increased to reflect the accretion of interest and reduced to reflect lease payments made.
The carrying amount of lease liabilities is remeasured if there is a modification, a change in the lease term, a change in the lease payments (e.g. changes to future payments resulting from a change in an index or rate used to determine the lease payments) or a change in the assessment of an option to purchase the underlying asset.
In the Statement of Financial Position, the Group’s lease liabilities are included within borrowings (please refer to note 26).
Notes to the Financial Statements2. Summary of Significant Accounting Policies (continued) 2.7 Leases (the Group as a lessee) (continued)
(c) Short-term leases and leases of low value assets
The Group has elected to apply the recognition exemption in respect of short-term leases (i.e. those which have a lease term of 12 months from the lease commencement date, and do not contain a purchase option), as well as the recognition exemption applicable to leases of assets that are considered to be low value.
Instead of recognising a right-of-use asset and lease liability, lease payments in relation to these are recognised as an expense in the Statement of Comprehensive Income, on a straight-line basis over the lease term.
2.8 Goodwill, intangible assets and amortisation
Goodwill is measured as the difference between:
• the net of the acquisition-date amounts of the identifiable assets acquired and the liabilities assumed, and
• the aggregate of:
(i) the value of consideration transferred (at fair value),
(ii) the amount of any non-controlling interest, and
(iii) in a business combination achieved in stages, the acquisition date fair value of the acquirer's previously held equity interest in the acquiree.
2.8.1 Definite life intangible assets
Definite life intangible assets comprise software licences and website development costs, which meet the criteria of IAS 38 Intangible Assets, and are carried at cost less accumulated amortisation and impairment losses. Cost comprises purchase price from third parties as well as directly attributable internally generated development costs, where relevant.
2.8.2 Indefinite life intangible assets
Indefinite life intangible assets comprise goodwill and the power supply licence. The power supply licence is held as an indefinite life intangible asset according to the criteria of IAS 38 Intangible Assets, and is carried at cost less accumulated impairment losses. Cost comprises purchase price from third parties as well as directly attributable internally generated development costs, where relevant.
2.8.3 Amortisation
Amortisation on definite life intangible assets is charged to the Consolidated Statement of Comprehensive Income (included within administrative expenses) on a straight-line basis over the estimated useful life of the intangible asset. The estimated useful lives for intangible assets with definite lives are as follows:
Software licenses between 3 and 10 years
Website development costs between 2 and 5 years
Assets under the course of development not amortised
An intangible asset is derecognised upon disposal (i.e. at the date on which the recipient obtains control), or when no future economic benefits are expected from its use or disposal. Any gain or loss arising on derecognition (being the difference between the carrying amount of the asset and the net disposal proceeds) is included in profit or loss, upon derecognition.

Strategic ReportG
overnance ReportFinancial Statem
ents
120 121Good Energy Annual Report 2020 Financial statements
Notes to the Financial Statements2. Summary of Significant Accounting Policies (continued) 2.8 Goodwill, intangible assets and amortisation (continued)
2.8.4 Impairment of intangible assets
The Directors regularly review intangible assets for impairment and provision is made if necessary. Assets with indefinite useful lives are not subject to amortisation, therefore are tested annually for impairment. Assets that are subject to amortisation are reviewed for impairment whenever events or changes in circumstance indicate that the carrying amount may not be recoverable.
An impairment loss is recognised for the amount by which the asset's carrying amount exceeds its recoverable amount. The recoverable amount is the higher of an asset's fair value less costs to sell, and value in use. For the purposes of assessing impairment, assets are grouped at the lowest levels for which there are separately identifiable cash flows (cash-generating units). Non-financial assets other than goodwill that suffered an impairment are reviewed for possible reversal of the impairment at the end of each reporting period. Any impairment in carrying value is charged to the Statement of Comprehensive Income within administrative expenses and is recognised in the period in which it occurs.
2.9 Investments in associates
An associate is an entity over which the Group has significant influence. Significant influence is defined as "the power to participate in the financial and operating policy decisions of the investee, but is not control or joint control of those policies".
The considerations made in determining significant influence are similar to those necessary to determine control over subsidiaries. Generally, there is a presumption that a holding of 20% or more of the voting power of the investee results in significant influence.
To support this presumption - and when the Group has less than a 20% holding - the Group considers all relevant facts and circumstances in assessing whether it has significant influence, including:
• Representation on the Board of Directors or equivalent governing body of the investee.
• Participation in policy making processes.
• The interchange of managerial personnel.
The Group reassesses whether or not there is significant influence over an investee if facts and circumstances indicate that there are one or more changes to the above.
The Group's investments in associates are accounted for using the equity method. Under this method, the investment in the associate is initially recognised at cost. Subsequent movements in the carrying value of the investment are accounted for by recognising the Group's share of the associate's profit or loss since the acquisition date, as well as any fair value movements in the associate's net assets.
Gains or losses from the associate's operating activities are recognised in the Consolidated Statement of Comprehensive Income, outside of operating profit. Any changes in OCI of the associate is presented as part of the Group's OCI.
Goodwill relating to the associate is included in the carrying value of the investment, and is not separately tested for impairment. Rather, the entire carrying amount of the investment is tested for impairment.
2.9.1 Impairment of investments in associates
The Group recognises an impairment loss if, and only if, there is a triggering event giving rise to objective evidence that the associate is impaired, and that the triggering event has an impact on the future estimated cash flows from the net investment that can be reliably estimated. Where such evidence exists, the Group calculates the amount of the impairment as the difference between the recoverable amount of the investment (being the higher of its value in use and its fair value less costs to sell) and its carrying value.
Any impairment is recognised within the "Share of Profit of Associate" line in the Consolidated Statement of Comprehensive Income.
Notes to the Financial Statements2. Summary of Significant Accounting Policies (continued) 2.10 Investments in subsidiaries
The Parent Company holds investments in subsidiary companies and these are accounted for at cost less impairment in the Parent Company financial statements only.
2.11 Inventories
2.11.1 Renewable Obligation Certificates (ROCs)
Under the provisions of the Utilities Act 2000, all electricity suppliers are required to procure a set percentage of their supplies from accredited renewable electricity generators. This obligation can be fulfilled by the purchase and surrender of ROCs originally issued to generators, or by making payments to OFGEM who then recycle the payments to purchasers of ROCs. Notwithstanding that Good Energy Limited, a subsidiary company, supplies electricity sourced entirely from renewable generation over a 12 month period, its percentage obligation to submit ROCs is set by OFGEM. The cost obligation is recognised as electricity is supplied and charged as a cost of sale in the Consolidated Statement of Comprehensive Income. Any gains or losses on disposal of ROCs which are in excess of the Group’s compliance obligations are included as an adjustment to the compliance cost included within cost of sales. ROCs are valued at the lower of purchase cost and estimated realisable value.
2.11.2 Carbon Offset Instruments
Carbon Offset Instruments are used by the Group to offset emissions generated by gas supply, as part of the Group's green gas offering. These instruments are recognised as inventory at the lower of cost and net realisable value.
2.12 Financial instruments
The Group uses certain financial instruments in its operating and investing activities that are deemed appropriate for its strategy and circumstances.
Financial instruments recognised on the Consolidated Statement of Financial Position include: cash and cash equivalents, trade receivables, trade payables, borrowings, and financial assets and financial liabilities at fair value through profit and loss.
Financial assets and liabilities are recognised on the Consolidated Statement of Financial Position when the Group has become a party to the contractual provisions of the instrument.
2.12.1 Financial assets at amortised cost
The Group’s financial assets at amortised cost comprise trade and other receivables and cash and cash equivalents in the Consolidated Statement of Financial Position. These assets are non-derivative financial assets with fixed or determinable payments that are not quoted in an active market, and are solely payments of principal and interest. They arise principally through the provision of goods and services to customers (e.g. trade receivables), but also incorporate other types of contractual monetary asset. They are initially recognised at fair value and are subsequently carried at amortised cost using the effective interest rate method, less allowances for expected credit losses (ECLs). These are held in a business model which intends to hold the financial assets to collect the contractual cash flows rather than through sale. Trade receivables are shown inclusive of unbilled amounts to customers.
The Group recognises an allowance for ECLs for all financial assets measured at amortised cost. ECLs are based on the difference between the contractual cash flows due in accordance with the contract and all the cash flows that the Group expects to receive.
For trade receivables and contract assets, the Group applies a simplified approach in calculating ECLs. Therefore, the Group does not track changes in credit risk, but instead recognises a loss allowance based on lifetime ECLs at each reporting date. The Group has established a provision matrix that is based on its historical credit loss experience, adjusted for forward-looking factors specific to the debtors and the economic environment.

Strategic ReportG
overnance ReportFinancial Statem
ents
122 123Good Energy Annual Report 2020 Financial statements
Notes to the Financial Statements2. Summary of Significant Accounting Policies (continued) 2.12 Financial instruments (continued)
2.12.1 Financial assets at amortised cost (continued)
For trade receivables, which are reported net, such provisions are recorded in a separate allowance account with the loss being recognised within administrative expenses in the Consolidated Statement of Comprehensive Income. On confirmation that the trade receivable will not be collectable, the gross carrying value of the asset is written off against the associated provision.
Cash and cash equivalents comprise cash on hand and on demand deposits, and other short-term, highly liquid investments that are readily convertible to a known amount of cash and are subject to an insignificant risk of changes in value.
Restricted deposits are held by financing providers to cover debt service and maintenance expenses on generation sites to which the funding relates.
Short-term security deposits are held by trading exchanges to cover short-term electricity trades.
2.12.2 Financial assets and financial liabilities at fair value through profit or loss (FVTPL) and equity instruments
Financial instruments at fair value through profit or loss comprise financial assets consisting of secured convertible loan stock, and financial liabilities consisting of contingent consideration.
Both financial assets and financial liabilities at FVTPL are initially recognised at fair value in the Statement of Financial Position. Any fair value gains and losses on subsequent remeasurement are recognised directly in profit or loss.
Financial liabilities and equity instruments are classified according to the substance of the contractual arrangements entered into.
An equity instrument is any contract that evidences a residual interest in the assets of the Group after deducting all of its liabilities.
Details of the fair value estimation attributable to financial instruments at FVTPL can be found per note 3.3.
2.12.3 Trade and other payables
Trade payables are obligations to pay for goods or services that have been acquired in the course of ordinary business from suppliers. Accounts payable are classified as current liabilities if payment is due within one year or less. If not, they are presented as non-current liabilities. Trade payables are recognised initially at fair value and subsequently held at amortised cost.
2.12.4 Borrowings
The Group expenses borrowing costs over the term of the loan facility. Where borrowing costs are attributable to the acquisition, construction or production of a qualifying asset, such costs are capitalised as part of the specific asset. Details of the Group’s borrowings are included in note 25.
2.13 Disposal groups held for sale
Disposal groups are classified as held for sale when their carrying amount is to be recovered principally through a sale transaction and the sale is highly probable. Disposal groups classified as held for sale are stated at the lower of carrying amount and fair value less costs to sell. They are not depreciated or amortised.
2.14 Non-underlying costs
Non-underlying items are those that in the Directors’ view should be separately disclosed by virtue of their size, nature or incidence to enable a full understanding of the Group’s financial performance.
Notes to the Financial Statements2. Summary of Significant Accounting Policies (continued) 2.15 Current and deferred taxation
The tax charge or credit included in the Consolidated Statement of Comprehensive Income for the period comprises current and deferred tax. Current and deferred tax is charged or credited to the Consolidated Statement of Comprehensive Income, except when it relates to items charged or credited directly to equity, in which case the current or deferred tax is also recognised within equity.
Current tax is the expected tax payable or receivable based on the taxable profit for the period. Taxable profit differs from net profit as reported in the Statement of Comprehensive Income as it excludes items of income or expense that are taxable or deductible in other years, and it further excludes permanent differences (i.e. items that are never taxable or deductible).
Current income tax assets and liabilities are measured at the amount expected to be recovered from or paid to the taxation authorities. The tax rates and tax laws used to compute these amounts are those that are enacted or substantively enacted at the reporting date in the countries where the Group operates and generates taxable income.
Management periodically evaluates positions taken in the tax returns with respect to situations in which applicable tax regulations are subject to interpretation and establishes provisions where appropriate.
Deferred tax is the expected tax payable or recoverable on temporary differences which arise between the carrying amount of assets and liabilities in the financial statements, and the corresponding tax bases used in the computation of taxable profit, and is provided for using the liability method. Deferred tax liabilities are generally recognised for all taxable temporary differences, and deferred tax assets are recognised to the extent that it is probable that taxable profits will be available against which deductible temporary differences can be utilised.
Such assets and liabilities are not recognised if the temporary difference arises from goodwill or from the initial recognition (other than in a business combination) of other assets and liabilities in a transaction which affects neither the tax profit nor the accounting profit. Deferred tax liabilities are recognised for taxable temporary differences arising in investments in subsidiaries except where the Group is able to control the reversal of the temporary difference and it is probable that the temporary difference will not reverse in the foreseeable future.
The carrying amount of deferred tax assets is reviewed at the end of each financial period and reduced to the extent that it is no longer probable that sufficient taxable profits will be available to allow all or part of the asset to be recovered. Deferred tax is calculated based on tax rates and tax laws that are expected to apply in the period when the asset is realised or the liability is settled.
Deferred tax assets and liabilities are offset when there is a legally enforceable right to set off current tax assets against current tax liabilities and when they relate to income taxes levied by the same taxation authority. The Group intends to settle its current tax assets and current tax liabilities on a net basis.
2.16 Decommissioning costs
Liabilities for decommissioning costs are recognised when the Group has an obligation to dismantle and remove the generation assets and restore the land on which it is located. Liabilities may arise upon construction of such facilities, upon acquisition or through a subsequent change in legislation or regulations. The amount recognised is the estimated present value of expenditure determined in accordance with local conditions and requirements. A corresponding tangible item of property, plant and equipment to the provision is also created.
Any changes in the present value of the estimated expenditure is added to or deducted from the cost of the assets to which it relates. The adjusted depreciated amount is then depreciated prospectively over its useful economic life. The unwinding of the discount on the decommissioning provision is included in the Consolidated Statement of Comprehensive Income as a finance cost. The estimated future costs of decommissioning are reviewed annually and adjusted as appropriate.
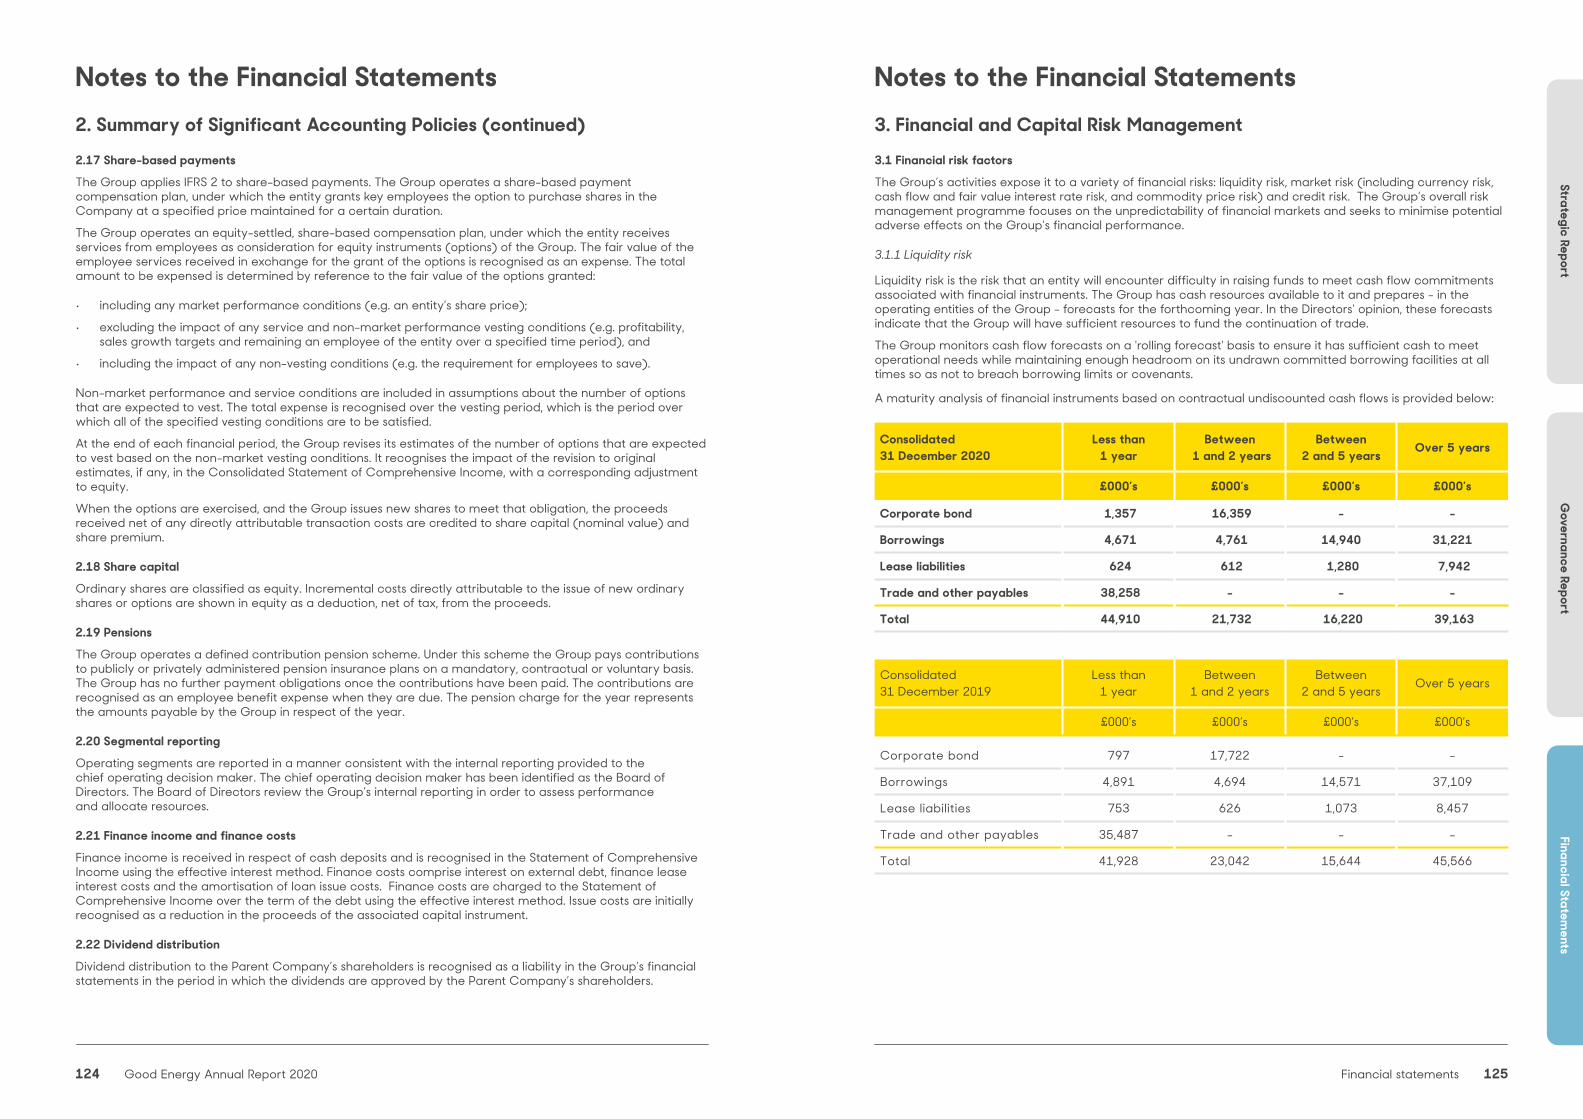
Strategic ReportG
overnance ReportFinancial Statem
ents
124 125Good Energy Annual Report 2020 Financial statements
Notes to the Financial Statements2. Summary of Significant Accounting Policies (continued) 2.17 Share-based payments
The Group applies IFRS 2 to share-based payments. The Group operates a share-based payment compensation plan, under which the entity grants key employees the option to purchase shares in the Company at a specified price maintained for a certain duration.
The Group operates an equity-settled, share-based compensation plan, under which the entity receives services from employees as consideration for equity instruments (options) of the Group. The fair value of the employee services received in exchange for the grant of the options is recognised as an expense. The total amount to be expensed is determined by reference to the fair value of the options granted:
• including any market performance conditions (e.g. an entity’s share price);
• excluding the impact of any service and non-market performance vesting conditions (e.g. profitability, sales growth targets and remaining an employee of the entity over a specified time period), and
• including the impact of any non-vesting conditions (e.g. the requirement for employees to save).
Non-market performance and service conditions are included in assumptions about the number of options that are expected to vest. The total expense is recognised over the vesting period, which is the period over which all of the specified vesting conditions are to be satisfied.
At the end of each financial period, the Group revises its estimates of the number of options that are expected to vest based on the non-market vesting conditions. It recognises the impact of the revision to original estimates, if any, in the Consolidated Statement of Comprehensive Income, with a corresponding adjustment to equity.
When the options are exercised, and the Group issues new shares to meet that obligation, the proceeds received net of any directly attributable transaction costs are credited to share capital (nominal value) and share premium.
2.18 Share capital
Ordinary shares are classified as equity. Incremental costs directly attributable to the issue of new ordinary shares or options are shown in equity as a deduction, net of tax, from the proceeds.
2.19 Pensions
The Group operates a defined contribution pension scheme. Under this scheme the Group pays contributions to publicly or privately administered pension insurance plans on a mandatory, contractual or voluntary basis. The Group has no further payment obligations once the contributions have been paid. The contributions are recognised as an employee benefit expense when they are due. The pension charge for the year represents the amounts payable by the Group in respect of the year.
2.20 Segmental reporting
Operating segments are reported in a manner consistent with the internal reporting provided to the chief operating decision maker. The chief operating decision maker has been identified as the Board of Directors. The Board of Directors review the Group’s internal reporting in order to assess performance and allocate resources.
2.21 Finance income and finance costs
Finance income is received in respect of cash deposits and is recognised in the Statement of Comprehensive Income using the effective interest method. Finance costs comprise interest on external debt, finance lease interest costs and the amortisation of loan issue costs. Finance costs are charged to the Statement of Comprehensive Income over the term of the debt using the effective interest method. Issue costs are initially recognised as a reduction in the proceeds of the associated capital instrument.
2.22 Dividend distribution
Dividend distribution to the Parent Company’s shareholders is recognised as a liability in the Group’s financial statements in the period in which the dividends are approved by the Parent Company’s shareholders.
Notes to the Financial Statements3. Financial and Capital Risk Management3.1 Financial risk factors
The Group’s activities expose it to a variety of financial risks: liquidity risk, market risk (including currency risk, cash flow and fair value interest rate risk, and commodity price risk) and credit risk. The Group’s overall risk management programme focuses on the unpredictability of financial markets and seeks to minimise potential adverse effects on the Group’s financial performance.
3.1.1 Liquidity risk
Liquidity risk is the risk that an entity will encounter difficulty in raising funds to meet cash flow commitments associated with financial instruments. The Group has cash resources available to it and prepares - in the operating entities of the Group - forecasts for the forthcoming year. In the Directors' opinion, these forecasts indicate that the Group will have sufficient resources to fund the continuation of trade.
The Group monitors cash flow forecasts on a 'rolling forecast' basis to ensure it has sufficient cash to meet operational needs while maintaining enough headroom on its undrawn committed borrowing facilities at all times so as not to breach borrowing limits or covenants.
A maturity analysis of financial instruments based on contractual undiscounted cash flows is provided below:
Consolidated31 December 2020
Less than 1 year
Between 1 and 2 years
Between 2 and 5 years Over 5 years
£000’s £000’s £000’s £000’s
Corporate bond 1,357 16,359 - -
Borrowings 4,671 4,761 14,940 31,221
Lease liabilities 624 612 1,280 7,942
Trade and other payables 38,258 - - -
Total 44,910 21,732 16,220 39,163
Consolidated 31 December 2019
Less than 1 year
Between 1 and 2 years
Between 2 and 5 years Over 5 years
£000’s £000’s £000’s £000’s
Corporate bond 797 17,722 - -
Borrowings 4,891 4,694 14,571 37,109
Lease liabilities 753 626 1,073 8,457
Trade and other payables 35,487 - - -
Total 41,928 23,042 15,644 45,566

Strategic ReportG
overnance ReportFinancial Statem
ents
126 127Good Energy Annual Report 2020 Financial statements
Notes to the Financial Statements3. Financial and Capital Risk Management (continued) 3.1 Financial risk factors (continued)
3.1.1 Liquidity risk (continued)
Parent31 December 2020
Less than 1 year
Between 1 and 2 years
Between 2 and 5 years
Over 5 years
£000’s £000’s £000’s £000’s
Corporate bond 1,357 16,359 - -
Lease liabilities 27 7 - -
Loans from group companies - - - -
Trade and other payables 390 - - -
Total 1,774 16,366 - -
Parent 31 December 2019
Less than 1 year
Between 1 and 2 years
Between 2 and 5 years
Over 5 years
£000’s £000’s £000’s £000’s
Corporate bond 797 17,722 - -
Borrowings 49 - - -
Lease liabilities 29 27 7 -
Loans from group companies 7,330 - - -
Trade and other payables 248 - - -
Total 8,453 17,749 7 -
IFRS 16 requires that the maturity analysis of lease liabilities are disclosed separately from the maturity analyses of other financial liabilities.
Notes to the Financial Statements3. Financial and Capital Risk Management (continued) 3.1 Financial risk factors (continued)
3.1.2 Market Risk
3.1.2a Currency risk
The Group is exposed to foreign exchange risk arising from certain generation asset maintenance contracts which are payable in euros. Management have set up a policy, that when it is deemed appropriate, the Group will forward buy euros against these contracts to reduce foreign exchange exposure. As at 31 December 2020, no euros (2019: no euros) were purchased forward. The annual exposure to sterling euro exchange rate movements is currently £2,770 per one percent movement in the exchange rate.
3.1.2b Cash flow and fair value interest rate risk
The financial risk is the risk to the Group’s earnings that arises from fluctuations in interest rates and the degree of volatility of these rates. For short-term bank overdraft facilities, the Group does not use derivative instruments to reduce its exposure to interest rate fluctuations as the policy of the Group is not to rely on short-term borrowing facilities for any significant duration. The Directors use interest rate swaps if they consider their exposure to interest rate risk to be material. For long term borrowings, the Group may use interest rate swaps to fix the interest rate payable on these material balances in order to mitigate the risk of any fluctuations in interest rates.
3.1.2c Commodity price risk
The Group’s operations result in exposure to fluctuations in energy prices. Management monitors energy prices and analyses supply and demand volumes to manage exposure to these risks. The Group typically buys power forwards in order to mitigate some of the risk of commodity price fluctuations.
If the wholesale market moves significantly upwards or downwards, the price risk to the Group will depend upon a number of factors including the excess or deficiency of power being supplied by renewable power purchase contracts in place at the time. The Group may be required to pass on the price risk to customers. Retail prices can be amended with 30 days’ advance notification to customers. The Group closely monitors movements in the wholesale market and assesses trends, so it is ready to take necessary action when required.
Vertical integration of the Group helps further mitigate exposure to changes in power prices.
3.1.3 Credit risk
The Group’s exposure to credit risk arises from its receivables from customers. At 31 December 2020 and 31 December 2019, the Group’s trade and other receivables were classed as due within one year, details of which are included in note 21. The Group’s policy is to undertake credit checks where appropriate on new customers and to provide for expected credit losses (ECLs) based on estimated irrecoverable amounts determined by reference to specific circumstances and past default experience. Credit risk is also in part mitigated by the policy to offer direct debit as a preferred method of payment for customers. At the end of the reporting period the Directors have provided for specific expected credit losses and believe that there is no further credit risk.
Credit risk also arises from cash and cash equivalents, and deposits with banks and financial institutions. The Directors monitor the credit quality of the institutions used when considering which banks and financial institutions funds should be placed with.
The ECL model has been calculated in line with requirements under IFRS 9. The Group’s trade receivables have no significant financing component, so the Group has used the simplified method for providing for these under IFRS 9. Therefore, the impairment loss is measured at lifetime ECL. Trade debtors have been segmented into categories of customer type and age, meaning the debt is split into categories with similar expected credit losses.
An impairment analysis is performed at each reporting date using a provision matrix to measure the expected credit losses. The calculation reflects the probability-weighted outcome, the time value of money, and reasonable and supportable information that is available at the reporting date about past events, current conditions and forecasts of future economic conditions.

Strategic ReportG
overnance ReportFinancial Statem
ents
128 129Good Energy Annual Report 2020 Financial statements
Notes to the Financial Statements3. Financial and Capital Risk Management (continued) 3.2 Capital risk management
The Group’s objectives when managing capital are to safeguard the Group’s ability to continue as a going concern in order to provide returns to shareholders, and to maintain an optimal capital structure.
The Group monitors capital on the basis of the gearing ratio calculated as net debt divided by total capital. Net debt is calculated as total borrowings (including 'current and non-current borrowings' as shown in the Consolidated Statement of Financial Position) less cash and cash equivalents. Total capital is calculated as 'equity' as shown in the Consolidated Statement of Financial Position, plus net debt. The capital structure of the Group is as follows:
Note 2020 2019
£000’s £000’s
Total borrowings 25 58,097 59,801
Less: cash in restricted deposit accounts (non-current) (4,552) (4,548)
Less: cash in restricted deposit accounts (current) (698) (474)
Less: cash and cash equivalents 22 (18,282) (13,667)
Net debt 34,565 41,112
Total equity 32,412 18,780
Total capital 66,977 59,892
Gearing ratio 51.6% 68.6%
During 2020 the Group’s strategy was to ensure debt funding from lenders was sustainable against long term power generation assets. These assets have highly predictable revenue streams and are considered stable for long-term borrowing. After the year end, the Group restructured the financing on its renewable generation asset portfolio to consolidate and simplify funding facilities (See note 35 for information on this restructuring).
The Group's borrowings are subject to maintaining covenants as defined by the debt funders. Throughout the year ended 31 December 2020 the Group complied with all external borrowing covenants and management monitors the continued compliance with these covenants on a monthly or quarterly basis.
3.3 Fair value estimation
The Group measures certain financial instruments at fair value, at each reporting date. Fair value is defined as "the price that would be received to sell an asset, or paid to transfer a liability, in an orderly transaction between market participants at the measurement date". The fair value measurement assumes that the transaction to sell the asset or to transfer the liability takes place either:
• in the principal market for the asset or liability; or
• in the absence of a principal market, in the most advantageous market available for the asset or liability, which must be accessible by the Group.
All financial assets and financial liabilities subject to measurement at fair value and disclosed within these financial statements are categorised within the fair value hierarchy, the levels of which are defined as follows:
• Level 1 - Quoted prices (unadjusted) in active markets for identical assets or liabilities.
• Level 2 - Inputs other than quoted prices included within Level 1 that are observable for the asset or liability, either directly (i.e., as prices) or indirectly (i.e., derived from prices).
• Level 3 - Inputs for the asset or liability that are not based on observable market data (i.e., unobservable inputs).
Notes to the Financial Statements3. Financial and Capital Risk Management (continued) 3.3 Fair value estimation (continued)
If one or more of the significant inputs is not based on observable market data, the instrument is included within Level 3.
As part of our overall financial review, we continue to monitor the fair value of all of our investments through both an understanding of the wider environment in addition to the underlying economics of all assets across the business.
The table below presents the Group’s financial assets that are measured at fair value, by valuation method at 31 December 2020.
2020 Level 1 Level 2 Level 3 Total
£000’s £000’s £000’s £000’s
Assets
Revalued property, plant and equipment
Generation sites - - 62,045 62,045
Fair value through profit or loss financial assets
Other interests in associates - - - -
Total financial assets - - 62,045 62,045
2020 Level 1 Level 2 Level 3 Total
£000’s £000’s £000’s £000’s
Liabilities
Fair value through profit or loss financial liabilities
Contingent consideration - - 13 13
Total financial liabilities - - 13 13
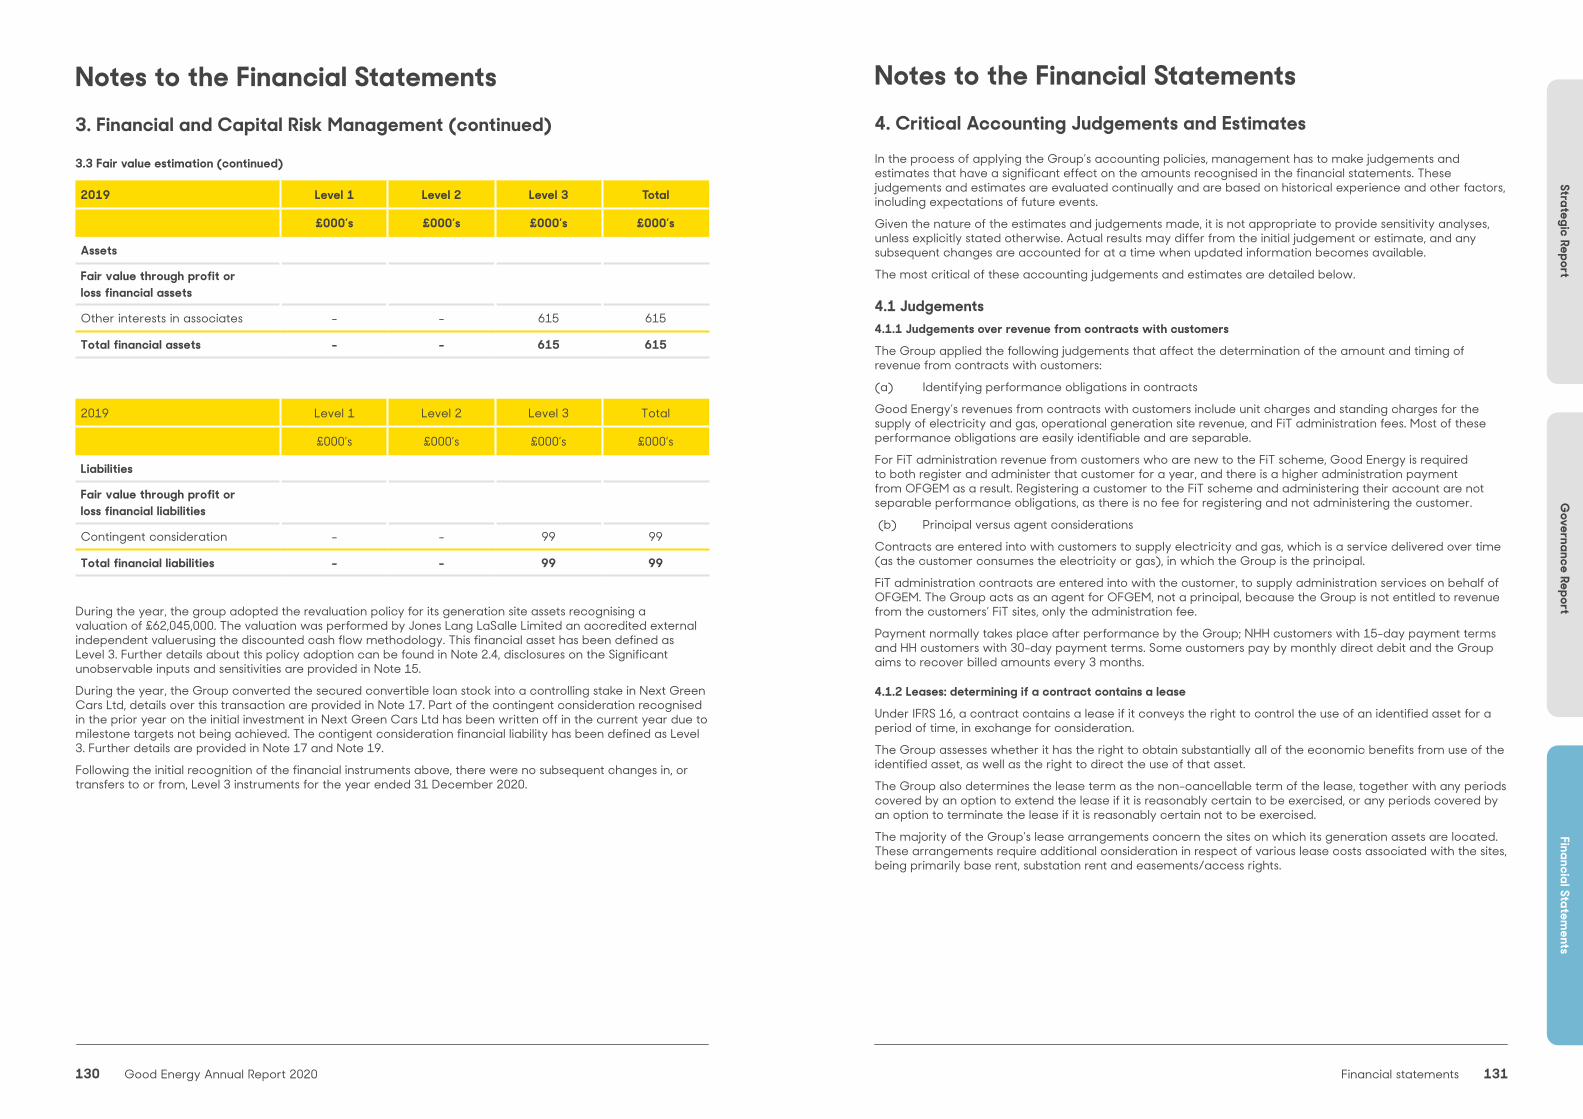
Strategic ReportG
overnance ReportFinancial Statem
ents
130 131Good Energy Annual Report 2020 Financial statements
Notes to the Financial Statements3. Financial and Capital Risk Management (continued)
3.3 Fair value estimation (continued)
2019 Level 1 Level 2 Level 3 Total
£000’s £000’s £000’s £000’s
Assets
Fair value through profit or loss financial assets
Other interests in associates - - 615 615
Total financial assets - - 615 615
2019 Level 1 Level 2 Level 3 Total
£000’s £000’s £000’s £000’s
Liabilities
Fair value through profit or loss financial liabilities
Contingent consideration - - 99 99
Total financial liabilities - - 99 99
During the year, the group adopted the revaluation policy for its generation site assets recognising a valuation of £62,045,000. The valuation was performed by Jones Lang LaSalle Limited an accredited external independent valuerusing the discounted cash flow methodology. This financial asset has been defined as Level 3. Further details about this policy adoption can be found in Note 2.4, disclosures on the Significant unobservable inputs and sensitivities are provided in Note 15.
During the year, the Group converted the secured convertible loan stock into a controlling stake in Next Green Cars Ltd, details over this transaction are provided in Note 17. Part of the contingent consideration recognised in the prior year on the initial investment in Next Green Cars Ltd has been written off in the current year due to milestone targets not being achieved. The contigent consideration financial liability has been defined as Level 3. Further details are provided in Note 17 and Note 19.
Following the initial recognition of the financial instruments above, there were no subsequent changes in, or transfers to or from, Level 3 instruments for the year ended 31 December 2020.
Notes to the Financial Statements4. Critical Accounting Judgements and EstimatesIn the process of applying the Group’s accounting policies, management has to make judgements and estimates that have a significant effect on the amounts recognised in the financial statements. These judgements and estimates are evaluated continually and are based on historical experience and other factors, including expectations of future events.
Given the nature of the estimates and judgements made, it is not appropriate to provide sensitivity analyses, unless explicitly stated otherwise. Actual results may differ from the initial judgement or estimate, and any subsequent changes are accounted for at a time when updated information becomes available.
The most critical of these accounting judgements and estimates are detailed below.
4.1 Judgements4.1.1 Judgements over revenue from contracts with customers
The Group applied the following judgements that affect the determination of the amount and timing of revenue from contracts with customers:
(a) Identifying performance obligations in contracts
Good Energy’s revenues from contracts with customers include unit charges and standing charges for the supply of electricity and gas, operational generation site revenue, and FiT administration fees. Most of these performance obligations are easily identifiable and are separable.
For FiT administration revenue from customers who are new to the FiT scheme, Good Energy is required to both register and administer that customer for a year, and there is a higher administration payment from OFGEM as a result. Registering a customer to the FiT scheme and administering their account are not separable performance obligations, as there is no fee for registering and not administering the customer.
(b) Principal versus agent considerations
Contracts are entered into with customers to supply electricity and gas, which is a service delivered over time (as the customer consumes the electricity or gas), in which the Group is the principal.
FiT administration contracts are entered into with the customer, to supply administration services on behalf of OFGEM. The Group acts as an agent for OFGEM, not a principal, because the Group is not entitled to revenue from the customers’ FiT sites, only the administration fee.
Payment normally takes place after performance by the Group; NHH customers with 15-day payment terms and HH customers with 30-day payment terms. Some customers pay by monthly direct debit and the Group aims to recover billed amounts every 3 months.
4.1.2 Leases: determining if a contract contains a lease
Under IFRS 16, a contract contains a lease if it conveys the right to control the use of an identified asset for a period of time, in exchange for consideration.
The Group assesses whether it has the right to obtain substantially all of the economic benefits from use of the identified asset, as well as the right to direct the use of that asset.
The Group also determines the lease term as the non-cancellable term of the lease, together with any periods covered by an option to extend the lease if it is reasonably certain to be exercised, or any periods covered by an option to terminate the lease if it is reasonably certain not to be exercised.
The majority of the Group’s lease arrangements concern the sites on which its generation assets are located. These arrangements require additional consideration in respect of various lease costs associated with the sites, being primarily base rent, substation rent and easements/access rights.

Strategic ReportG
overnance ReportFinancial Statem
ents
132 133Good Energy Annual Report 2020 Financial statements
Notes to the Financial Statements4. Critical Accounting Judgements and Estimates (continued)
4.1 Judgements (continued)4.1.2 Leases: determining if a contract contains a lease (continued)
Access rights in particular refer to land easements or rights to use, access or cross the land of another entity or individual, for a specified purpose. The lease arrangements give the Group the right to use the land but do not give the Group exclusivity of use or right to control.
In assessing whether these land easements and access rights form part of the relevant leases, management have determined the following;
• The land easements and access rights are distinct identified assets, which enable to Group to access the land and wind/solar farms, for the specific purposes of power generation, and maintenance of the generation equipment. These land easements and access rights are active for the duration of the lease term, meaning that they are deemed specific, not perpetual, in nature.
• The Group receives substantially all of the economic benefits from the use of those easements and access right, for the specific purposes of power generation and maintenance of the generation equipment.
• The leases state that the landlord must not breach the Group's right as a tenant to access the land. The Group instructs maintenance, repair and replacement work to be completed on the generation assets by third parties, which requires the Group to have the right to direct the use of the identified assets - being the land easements and access rights.
On the basis of the above, management have concluded that these land easements and access rights therefore be treated as part of the underlying lease.
4.2 Estimates4.2.1 Estimates over revenue from contracts with customers
Revenue calculated from energy sales includes an industry estimate of the quantity in units of electricity or gas supplied to the Group's customers during the 12 months preceding the end of the reporting period. It also includes an estimate in the form of the average sales price per unit, and standing charge.
10% of the total revenue figure is estimated, with a fixed transaction price and estimated unit consumption.
The estimate is made using historical consumption patterns, industry estimated consumption rates, seasonality data available, and takes into consideration industry reconciliation processes, upon which the Group takes a prudent position until final reconciliation data is available from the industry 14 months after the supply date.
The Group identified the amount of accrued income subject to estimation uncertainty is approximately £0.5m.
4.2.2 Provision for expected credit losses of trade and intercompany receivables, and contract assets
The Group uses a provision matrix to calculate expected credit losses (ECLs) for trade receivables. The provision rates are based on days past due for groupings of various customer segments that have similar loss patterns (e.g. by customer type).
The provision matrix is initially based on the Group’s historic observed default rates, calibrated to adjust the historic credit loss experience with forward-looking information. For instance, if forecast economic conditions are expected to deteriorate over the next year which can lead to an increased number of defaults, the historical default rates are adjusted. At every reporting date, the historical observed default rates are updated and changes in the forward-looking estimates are analysed.
The amount of ECLs is sensitive to changes in circumstances and of forecasted economic conditions. The group has used external benchmarks for future macroeconomic indicators (e.g. GDP, unemployment rates), applied against our segmented customer base to reach an estimate of the future impact caused by COVID-19. This overlay of macro economic indicators has resulted in an incremental provision charge of £0.8m. The Group’s historical credit loss experience and forecast of economic conditions may also not be representative of customers’ actual default in the future.
The assessments undertaken in recognising provisions have been made in accordance with IFRS 9. A provision for impairment of trade receivables is established based on an expected credit loss model. Information about the ECLs on the Group’s trade receivables is disclosed in note 21.
Notes to the Financial Statements4. Critical Accounting Judgements and Estimates (continued)
4.2 Estimates (continued)4.2.2 Provision for expected credit losses of trade and intercompany receivables, and contract assets (continued)
The Parent Company also holds material receivable balances with its subsidiaries, for which the expected credit loss model is also used in establishing a provision for impairment, in accordance with IFRS 9. Information about the Parent Company loans to Group undertakings can be found per note 18.
4.2.3 Power purchase costs
Power purchase costs can typically take 14 months from the date of supply to be finalised due to the processes that the energy market has to complete in order to finalise generation and consumption data for any one particular month. Therefore, there is an element of power purchase costs that needs to be estimated based on a combination of in-house and industry data that is available at any particular point in time.
4.2.4 Inventories
The Group carries Renewable Obligation Certificates (ROCs) as inventory in its Consolidated Statement of Financial Position. These are valued at the lower of cost or estimated realisable value. Gains or losses made on ROCs which are subsequently sold, are only recognised in the Statement of Comprehensive Income when they crystallise.
The final out-turn value of a ROC is only published by OFGEM in October following the compliance year (April to March) which may require a final adjustment to gains or losses on the sale or purchase of ROCs previously recognised in the Consolidated Statement of Comprehensive Income.
4.2.5 Impairment of indefinite life assets
In line with Next Green Car Ltd’s (“Zap-Map”) status as a start-up, management believe that Fair Value less cost to sell method of valuation using earnings multiples is the most appropriate way of valuing the business, and use this methodology in our ongoing investment decision making. We are required for the purposes of impairment testing to perform a value-in-use assessment using discounted cashflows. This assessment is subject to significant estimation uncertainty surrounding appropriate growth and discount rates. As a result of the impairment assessment the directors do not believe there is any reason for impairment at this time.
The projected cash flows have been based on financial forecasts by senior management for a 10 year period with a 10% nominal growth rate applied to periods post the forecasted period. This long term growth rate for Zap Map has been based on the expected long term growth rate for the EV market. A period longer than 5 years has been used in this assessment because of expected short-term negative net cashflows, and an expected higher growth rate in the EV market over the next 10 years compared with the terminal growth rate. The post-tax discount rate applied to cash flow projections for the Zap Map is 25%. This post-tax cost of capital was assessed at a higher rate than all other CGUs due to Zap-Map’s moving into its scale-up phase, as well as the specific risk characteristics of the forecast cash flows.
Sensitivity analysis has been conducted on the cost of capital for the Zap Map and the Directors noted that an increase of the post-tax discount rate by 6% was required before the carrying value of the CGU is lower than its recoverable amount.
4.2.6 Revaluation of property, plant and equipment
The Group carries its Generation sites at revalued amounts, changes in fair value are recognised in OCI, using valuation methodology based on a discounted cash flow (DCF) model. The Group engaged an independent valuation specialist to assess fair values at 1 January 2020. Key assumptions are provide in Note 15.
4.3 Change in EstimatesIn the year, the Group has revised its accounting estimate for the life of the generation assets to more accurately reflect the period in which the assets will generate future economic benefits to the group. The revised lives of the assets are still within the policy range for generation asset lives, however the lives of individual assets have changed by between -7 to +2.5 years.
The expected annual impact of this change in estimate is £35,000 less depreciation expense in the current and future years.
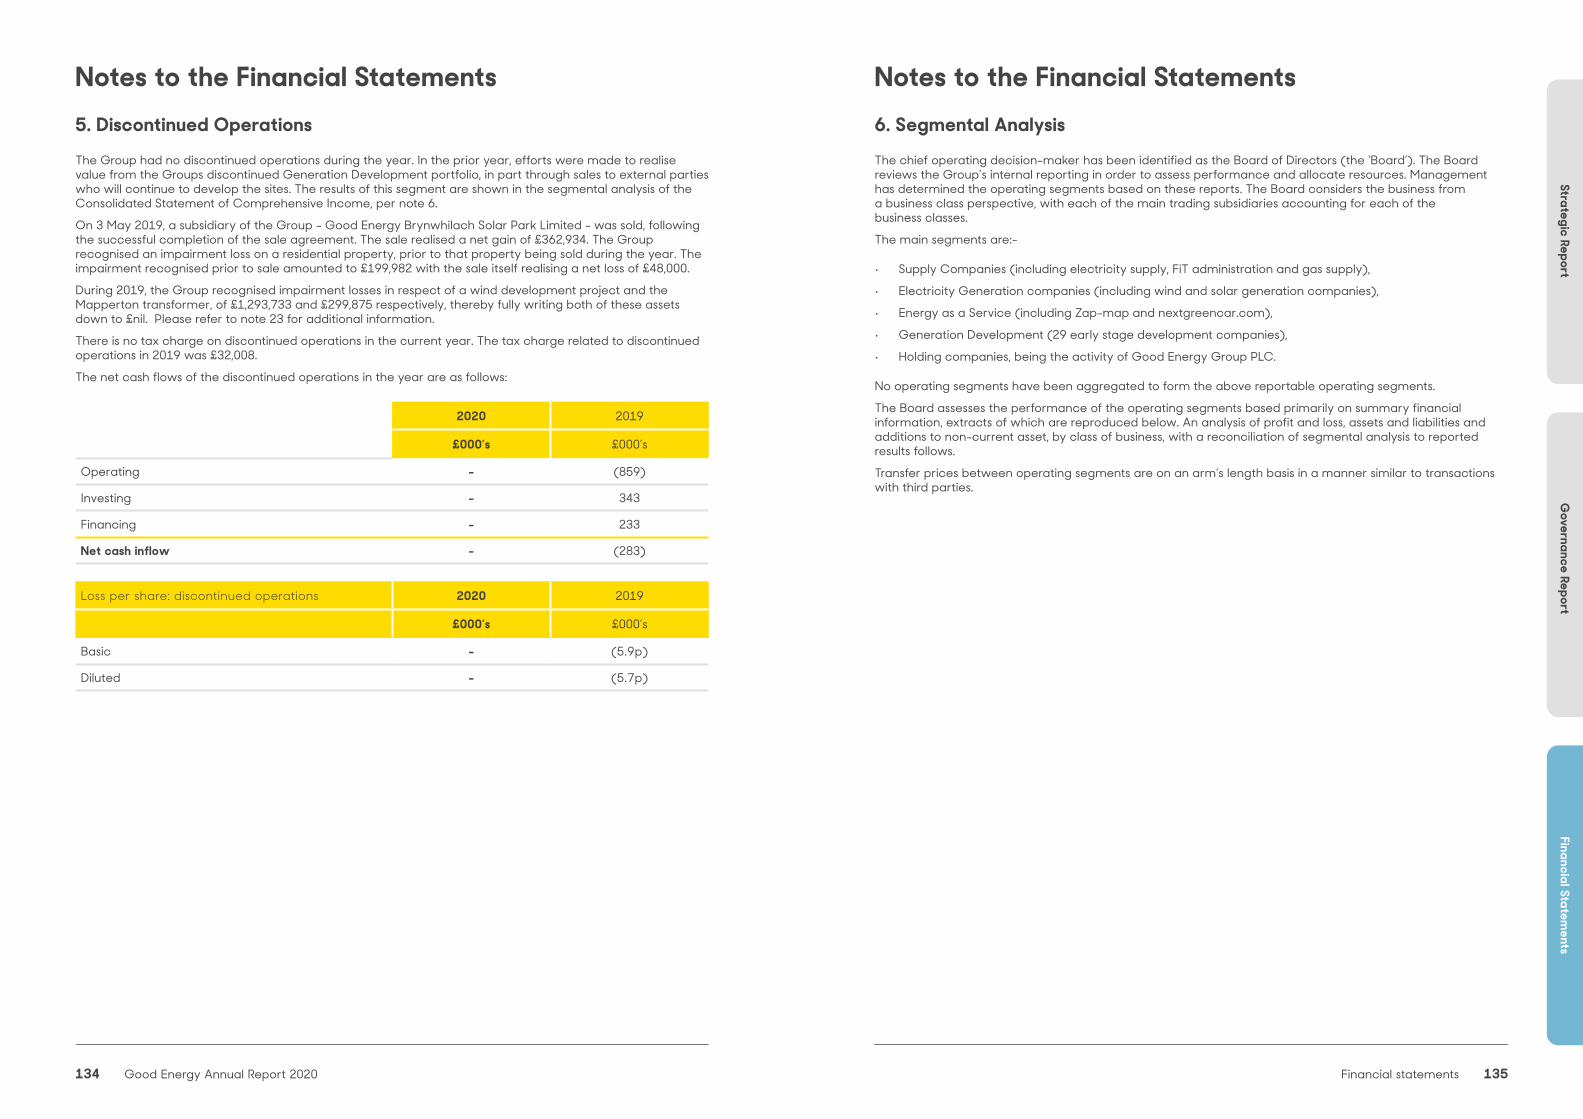
Strategic ReportG
overnance ReportFinancial Statem
ents
134 135Good Energy Annual Report 2020 Financial statements
Notes to the Financial Statements 6. Segmental AnalysisThe chief operating decision-maker has been identified as the Board of Directors (the ‘Board’). The Board reviews the Group’s internal reporting in order to assess performance and allocate resources. Management has determined the operating segments based on these reports. The Board considers the business from a business class perspective, with each of the main trading subsidiaries accounting for each of the business classes.
The main segments are:-
• Supply Companies (including electricity supply, FiT administration and gas supply),
• Electricity Generation companies (including wind and solar generation companies),
• Energy as a Service (including Zap-map and nextgreencar.com),
• Generation Development (29 early stage development companies),
• Holding companies, being the activity of Good Energy Group PLC.
No operating segments have been aggregated to form the above reportable operating segments.
The Board assesses the performance of the operating segments based primarily on summary financial information, extracts of which are reproduced below. An analysis of profit and loss, assets and liabilities and additions to non-current asset, by class of business, with a reconciliation of segmental analysis to reported results follows.
Transfer prices between operating segments are on an arm’s length basis in a manner similar to transactions with third parties.
Notes to the Financial Statements5. Discontinued OperationsThe Group had no discontinued operations during the year. In the prior year, efforts were made to realise value from the Groups discontinued Generation Development portfolio, in part through sales to external parties who will continue to develop the sites. The results of this segment are shown in the segmental analysis of the Consolidated Statement of Comprehensive Income, per note 6.
On 3 May 2019, a subsidiary of the Group - Good Energy Brynwhilach Solar Park Limited - was sold, following the successful completion of the sale agreement. The sale realised a net gain of £362,934. The Group recognised an impairment loss on a residential property, prior to that property being sold during the year. The impairment recognised prior to sale amounted to £199,982 with the sale itself realising a net loss of £48,000.
During 2019, the Group recognised impairment losses in respect of a wind development project and the Mapperton transformer, of £1,293,733 and £299,875 respectively, thereby fully writing both of these assets down to £nil. Please refer to note 23 for additional information.
There is no tax charge on discontinued operations in the current year. The tax charge related to discontinued operations in 2019 was £32,008.
The net cash flows of the discontinued operations in the year are as follows:
2020 2019
£000’s £000’s
Operating - (859)
Investing - 343
Financing - 233
Net cash inflow - (283)
Loss per share: discontinued operations 2020 2019
£000’s £000’s
Basic - (5.9p)
Diluted - (5.7p)

Strategic ReportG
overnance ReportFinancial Statem
ents
136 137Good Energy Annual Report 2020 Financial statements
Notes to the Financial Statements6. Segmental Analysis (continued)
Year ended 31 December 2019
Electricity Supply
FIT Admin-istration
Gas Supply
Total supply
companies Electricity
Generation
Holidng companies/
consolidation adjustments
Total - continuing operations
Generation Development
(discontinued)Total
£000’s £000’s £000’s £000’s £000’s £000’s £000’s £000’s £000’s
Revenue
Revenue from contracts withcustomers
89,981 5,247 26,335 121,563 1,697 - 123,260 91 123,351
FiT/ROC subsidy revenue
- - - - 998 - 998 - 998
Inter-segmentrevenue - - - - 6,084 (6,084) - - -
Total Revenue 89,981 5,247 26,335 121,563 8,779 (6,084) 124,258 91 124,349
Expenditure
Cost of sales (69,382) (462) (18,835) (88,679) (3,922) - (92,601) (1,246) (93,847)
Inter-segment cost of sales (6,084) - - (6,084) - 6,084 - - -
Gross Profit/(loss) 14,515 4,785 7,500 26,800 4,857 - 31,657 (1,155) 30,502
Administrative expenses (21,589) (426) (2,780) (24,795) 225 (24,570)
Depreciation & amortisation (1,091) - (198) (1,289) - (1,289)
Operating profit/(loss) 4,120 4,431 (2,978) 5,573 (930) 4,643
Net financeincome/(costs) 27 (3,377) (923) (4,273) - (4,273)
Share of Loss of Associate - - (42) (42) - (42)
Profit/(loss) before tax 4,147 1,054 (3,943) 1,258 (930) 328
Segments assets & liabilities
Segment assets 54,410 63,633 (2,184) 115,859 505 116,364
Segment liabilities 43,981 65,176 (23,808) 85,349 12,235 97,584
Net assets/(liabilities) 10,429 (1,543) 21,624 30,510 (11,730) 18,780
Additions tonon- current assets
2,923 5,090 1,041 9,054 - 9,054
All turnover arose within the United Kingdom. Consolidation adjustments relate to inter-company sales of generated electricity and the elimination of inter-company balances.
Notes to the Financial Statements6. Segmental Analysis (continued)
Year ended 31 December 2020
Electricity Supply
FIT Admin-istration
Gas Supply
Total supply companies
Electricity Generation
Energy as a Service
Holding companies/
consolidation adjustments
Total
£000’s £000’s £000’s £000’s £000’s £000’s £000’s £000’s
Revenue
Revenue from contracts with customers
97,385 5,467 24,462 127,314 1,761 342 - 129,417
FiT/ROC subsidy revenue - 1,232 - - 1,232
Inter-segment revenue - 5,786 - (5,786) -
Total revenue 97,385 5,467 24,462 127.314 8,779 342 (5,786) 130,649
Expenditure
Cost of sales (77,826) (600) (16,909) (95,335) (5,526) (60) (161) (101,082)
Inter-segment cost of sales (5,786) - - (5,786) - - 5,786 -
Gross profit 13,773 4,867 7,553 26,193 3,253 282 (161) 29,567
Administrative expenses (19,622) (869) (598) (2,481) (23,570)
Depreciation & amortisation (1,812) - - (124) (1,936)
Operating profit/(loss) 4,759 2,384 (316) (2,766) 4,061
Net finance income/(costs) (42) (3,261) - (827) (4,130)
Share of Loss of Associate - - - (13) (13)
Profit/(loss) before tax 4,717 (877) (316) (3,606) (82)
Segments assets & liabilities
Segment assets 54,502 74,631 320 4,778 134,231
Segment liabilities 41,217 62,759 215 (2,372) 101,819
Net assets/(liabilities) 13,285 11,872 105 7,150 32,412
Additions to non- current assets 899 6 23 - 928
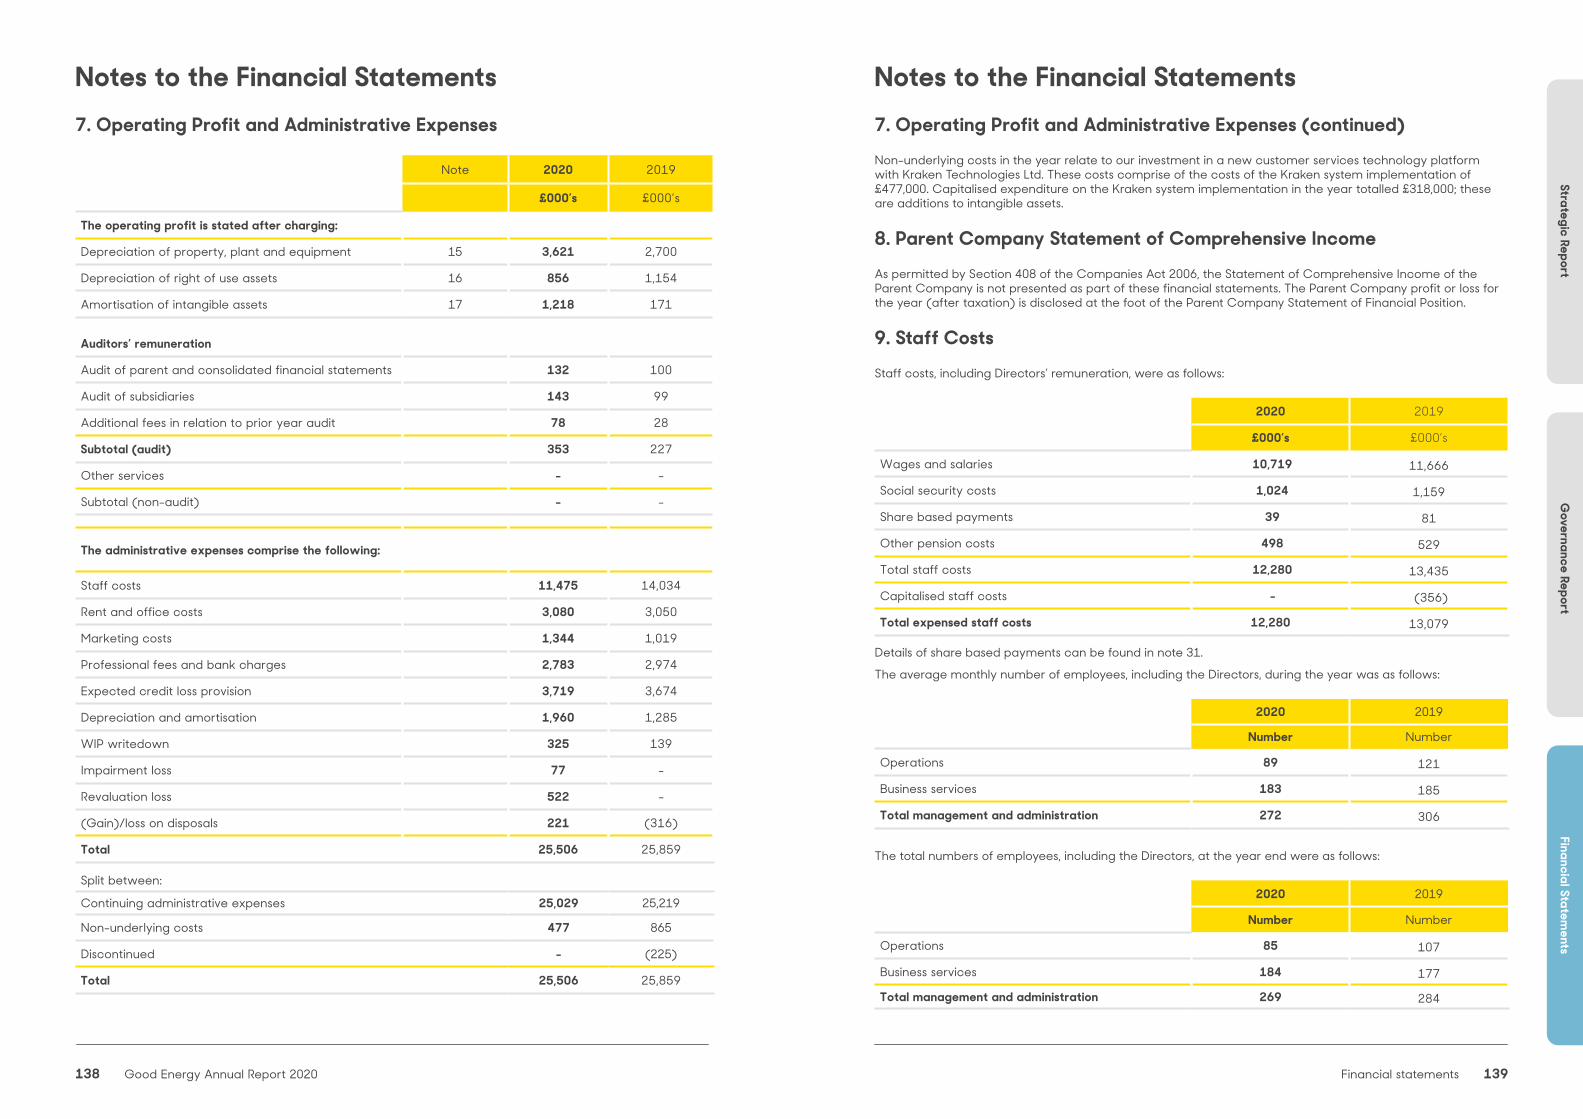
Strategic ReportG
overnance ReportFinancial Statem
ents
138 139Good Energy Annual Report 2020 Financial statements
Notes to the Financial Statements7. Operating Profit and Administrative Expenses (continued)Non-underlying costs in the year relate to our investment in a new customer services technology platform with Kraken Technologies Ltd. These costs comprise of the costs of the Kraken system implementation of £477,000. Capitalised expenditure on the Kraken system implementation in the year totalled £318,000; these are additions to intangible assets.
8. Parent Company Statement of Comprehensive IncomeAs permitted by Section 408 of the Companies Act 2006, the Statement of Comprehensive Income of the Parent Company is not presented as part of these financial statements. The Parent Company profit or loss for the year (after taxation) is disclosed at the foot of the Parent Company Statement of Financial Position.
9. Staff CostsStaff costs, including Directors’ remuneration, were as follows:
2020 2019
£000’s £000’s
Wages and salaries 10,719 11,666
Social security costs 1,024 1,159
Share based payments 39 81
Other pension costs 498 529
Total staff costs 12,280 13,435
Capitalised staff costs - (356)
Total expensed staff costs 12,280 13,079
Details of share based payments can be found in note 31.
The average monthly number of employees, including the Directors, during the year was as follows:
2020 2019
Number Number
Operations 89 121
Business services 183 185
Total management and administration 272 306
The total numbers of employees, including the Directors, at the year end were as follows:
2020 2019
Number Number
Operations 85 107
Business services 184 177
Total management and administration 269 284
Notes to the Financial Statements7. Operating Profit and Administrative Expenses
Note 2020 2019
£000’s £000’s
The operating profit is stated after charging:
Depreciation of property, plant and equipment 15 3,621 2,700
Depreciation of right of use assets 16 856 1,154
Amortisation of intangible assets 17 1,218 171
Auditors’ remuneration
Audit of parent and consolidated financial statements 132 100
Audit of subsidiaries 143 99
Additional fees in relation to prior year audit 78 28
Subtotal (audit) 353 227
Other services - -
Subtotal (non-audit) - -
The administrative expenses comprise the following:
Staff costs 11,475 14,034
Rent and office costs 3,080 3,050
Marketing costs 1,344 1,019
Professional fees and bank charges 2,783 2,974
Expected credit loss provision 3,719 3,674
Depreciation and amortisation 1,960 1,285
WIP writedown 325 139
Impairment loss 77 -
Revaluation loss 522 -
(Gain)/loss on disposals 221 (316)
Total 25,506 25,859
Split between:
Continuing administrative expenses 25,029 25,219
Non-underlying costs 477 865
Discontinued - (225)
Total 25,506 25,859
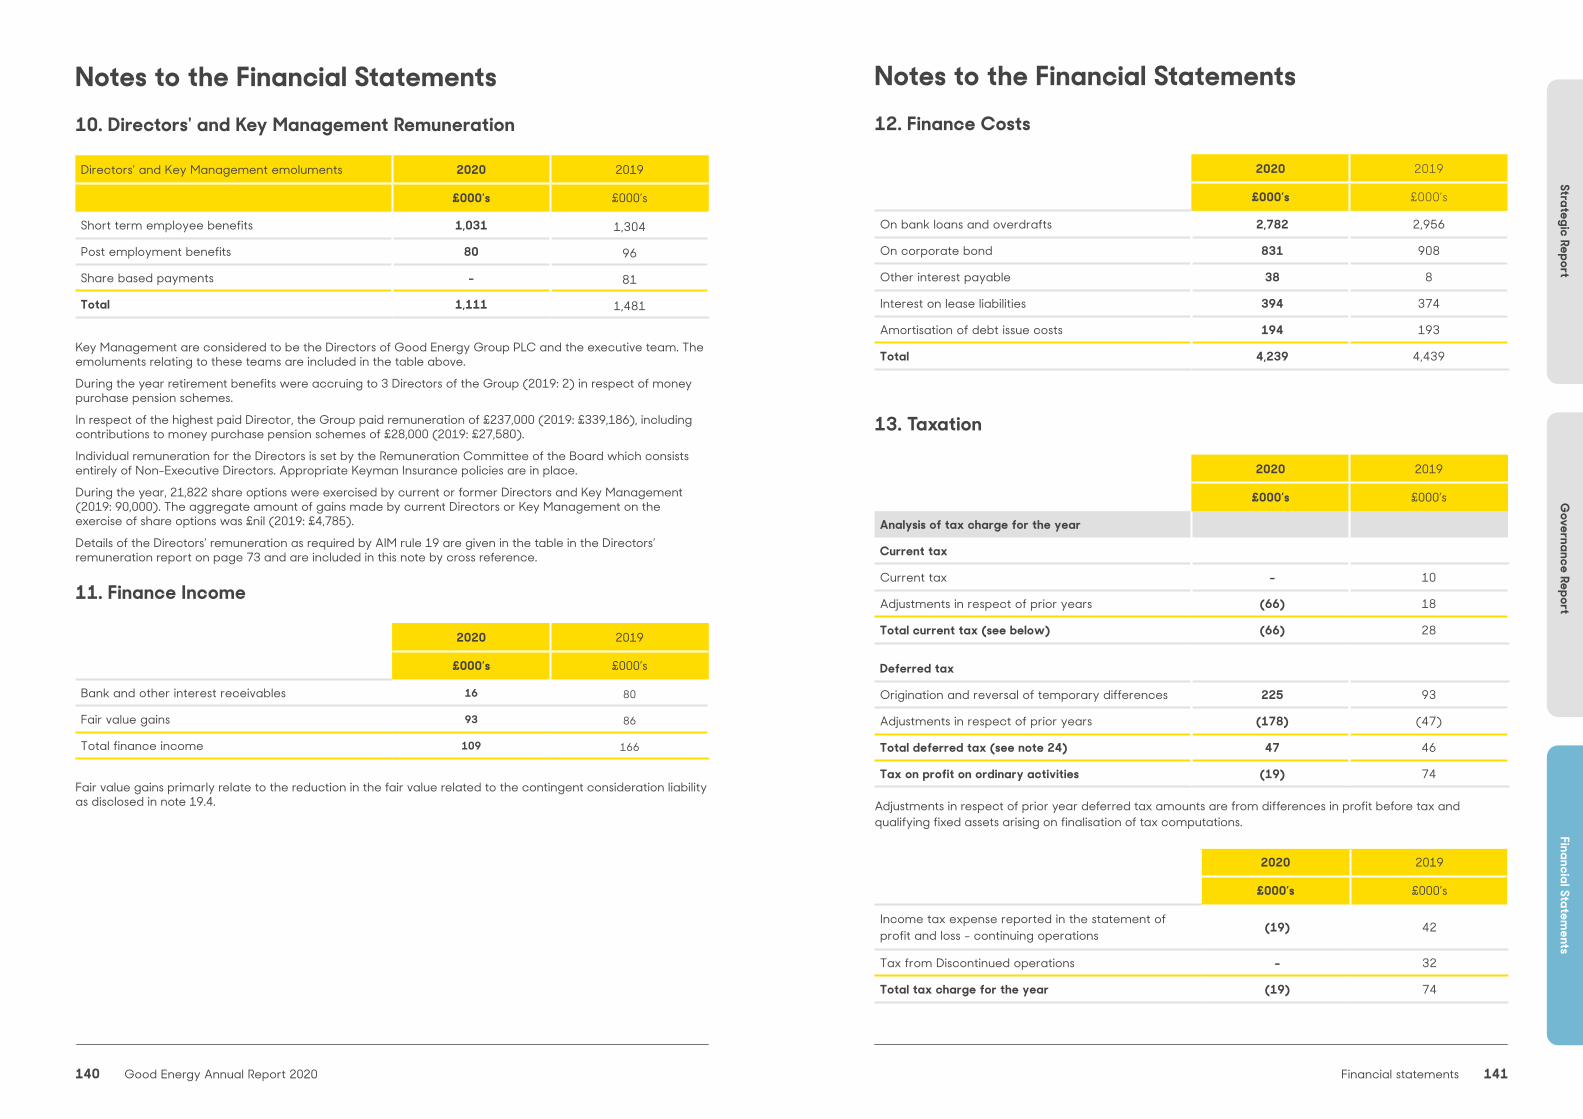
Strategic ReportG
overnance ReportFinancial Statem
ents
140 141Good Energy Annual Report 2020 Financial statements
Notes to the Financial Statements10. Directors' and Key Management Remuneration
Directors’ and Key Management emoluments 2020 2019
£000’s £000’s
Short term employee benefits 1,031 1,304
Post employment benefits 80 96
Share based payments - 81
Total 1,111 1,481
Key Management are considered to be the Directors of Good Energy Group PLC and the executive team. The emoluments relating to these teams are included in the table above.
During the year retirement benefits were accruing to 3 Directors of the Group (2019: 2) in respect of money purchase pension schemes.
In respect of the highest paid Director, the Group paid remuneration of £237,000 (2019: £339,186), including contributions to money purchase pension schemes of £28,000 (2019: £27,580).
Individual remuneration for the Directors is set by the Remuneration Committee of the Board which consists entirely of Non-Executive Directors. Appropriate Keyman Insurance policies are in place.
During the year, 21,822 share options were exercised by current or former Directors and Key Management (2019: 90,000). The aggregate amount of gains made by current Directors or Key Management on the exercise of share options was £nil (2019: £4,785).
Details of the Directors’ remuneration as required by AIM rule 19 are given in the table in the Directors’ remuneration report on page 73 and are included in this note by cross reference.
11. Finance Income
2020 2019
£000’s £000’s
Bank and other interest receivables 16 80
Fair value gains 93 86
Total finance income 109 166
Fair value gains primarly relate to the reduction in the fair value related to the contingent consideration liability as disclosed in note 19.4.
Notes to the Financial Statements12. Finance Costs
2020 2019
£000’s £000’s
On bank loans and overdrafts 2,782 2,956
On corporate bond 831 908
Other interest payable 38 8
Interest on lease liabilities 394 374
Amortisation of debt issue costs 194 193
Total 4,239 4,439
13. Taxation
2020 2019
£000’s £000’s
Analysis of tax charge for the year
Current tax
Current tax - 10
Adjustments in respect of prior years (66) 18
Total current tax (see below) (66) 28
Deferred tax
Origination and reversal of temporary differences 225 93
Adjustments in respect of prior years (178) (47)
Total deferred tax (see note 24) 47 46
Tax on profit on ordinary activities (19) 74
Adjustments in respect of prior year deferred tax amounts are from differences in profit before tax and qualifying fixed assets arising on finalisation of tax computations.
2020 2019
£000’s £000’s
Income tax expense reported in the statement of profit and loss - continuing operations (19) 42
Tax from Discontinued operations - 32
Total tax charge for the year (19) 74

Strategic ReportG
overnance ReportFinancial Statem
ents
142 143Good Energy Annual Report 2020 Financial statements
Notes to the Financial Statements13. Taxation (continued) Factors affecting the tax charge for the year
The tax assessed for the year is higher (2019: higher) than the standard rate of corporation tax in the UK of 19.00% (2019: 19.00%). The differences are explained as follows:
2020 2019
£000’s £000’s
Accounting profit before tax from continuing operations (82) 1,258
Loss before tax from discontinued operations - (930)
Accounting profit before income tax (82) 328
Profit before tax multiplied by the standard rate of corporation tax in the UK of 19.00% (2018: 19.00%) (16) 62
Tax effects of:
Expenses not deductible for tax purposes 31 323
Share of loss in associate - 8
Non-taxable gain on sale of investment - (79)
Effects of changes in tax rate 69 (15)
Share-based payment adjustment 86 (148)
Prior year adjustments (244) (29)
Deferred tax on losses not recognised 55 -
Recognition of deferred tax on losses previously unrecognised - (48)
Total tax charge for the year (19) 74
Factors that may affect future tax charges
The Finance (No.2) Act 2015 reduced the main rate of UK corporation tax to 19%, effective from 1 April 2017. A further reduction in the UK corporation tax rate to 17% was expected to come into effect from 1 April 2020 (as enacted by Finance Act 2016 on 15 September 2016). However, legislation introduced in the Finance Act 2020 (enacted on 22 July 2020) repealed the reduction of the corporation tax, thereby maintaining the current rate of 19%. Deferred taxes on the balance sheet have been measured at 19% (2019 – 17%) which represents the future corporation tax rate that was enacted at the balance sheet date.
The UK Budget 2021 announcements on 3 March 2021 included measures to support economic recovery as a result of the ongoing COVID-19 pandemic. These included an increase to the UK’s main corporation tax rate to 25%, which is due to be effective from 1 April 2023. These changes were not substantively enacted at the balance sheet date and hence have not been reflected in the measurement of deferred tax balances at the period end. If the group’s deferred tax balances at the period end were remeasured at 25% this would result in a deferred tax charge of £1.5m.
Notes to the Financial Statements13. Taxation (continued) Corporation tax payable
Parent Company Consolidated
2020 2019 2020 2019
£000’s £000’s £000’s £000’s
UK Corporation Tax on profits for the year - - - 10
14. Earnings/(Loss) per ShareBasic
Basic earnings/(loss) per share is calculated by dividing the profit/(loss) attributable to owners of the Company by the weighted average number of ordinary shares during the year after excluding 268,270 (2019: 293,270) shares held by Clarke Willmott Trust Corporation Limited in trust for the Good Energy Group Employee Benefit Trust.
Consolidated
2020 2019
Profit/(loss) attributable to owners of the Company (£000’s) 62 254
Basic weighted average number of ordinary shares (000’s) 16,350 16,294
Basic earnings/(loss) per share 0.4p 1.6p
Continuing operations Consolidated
2020 2019
Profit/(loss) attributable to owners of the Company (£000’s) 62 1,216
Basic weighted average number of ordinary shares (000’s) 16,350 16,294
Basic earnings/(loss) per share 0.4p 7.5p
Diluted
Diluted earnings per share is calculated by adjusting the weighted average number of ordinary shares to assume conversion of all potentially dilutive ordinary shares. Potentially dilutive ordinary shares arise from awards made under the Group’s share-based incentive plans. Where the vesting of these awards is contingent on satisfying a service or performance condition, the number of potentially dilutive ordinary shares is calculated based on the status of the condition at the end of the period. Potentially dilutive ordinary shares are actually dilutive only when the average market price of the Company’s ordinary shares during the period exceeds their exercise price (options) or issue price (other awards).
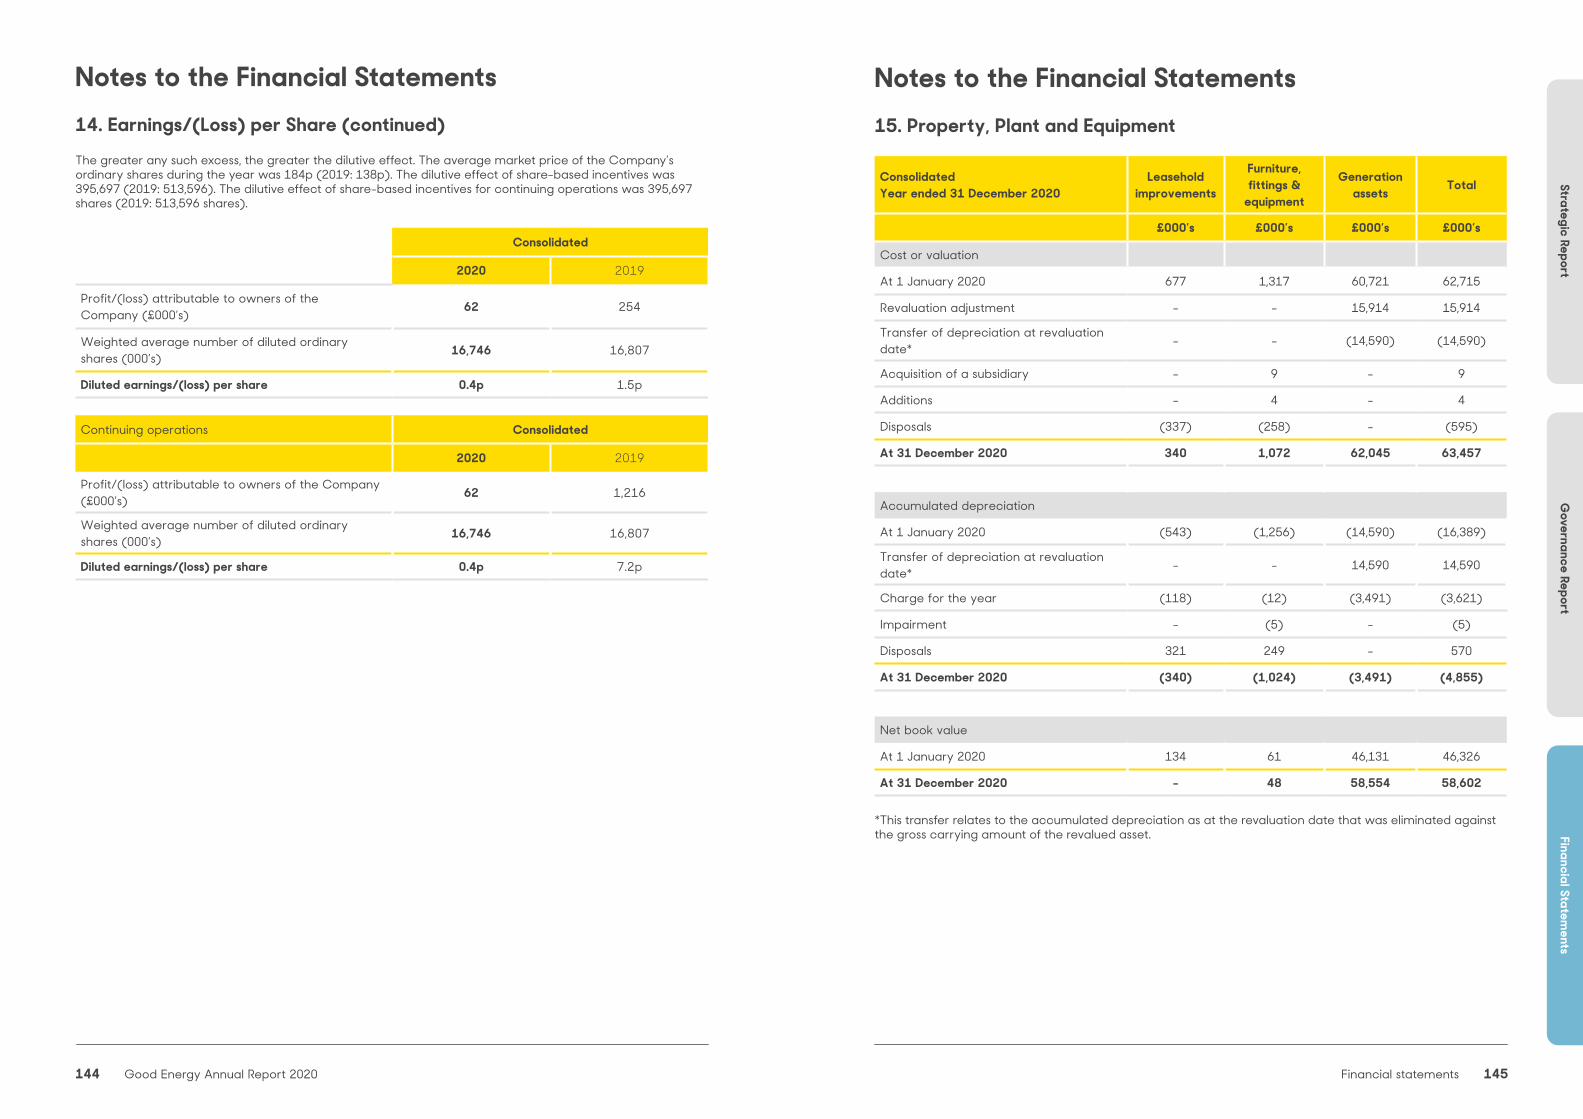
Strategic ReportG
overnance ReportFinancial Statem
ents
144 145Good Energy Annual Report 2020 Financial statements
Notes to the Financial Statements14. Earnings/(Loss) per Share (continued)The greater any such excess, the greater the dilutive effect. The average market price of the Company’s ordinary shares during the year was 184p (2019: 138p). The dilutive effect of share-based incentives was 395,697 (2019: 513,596). The dilutive effect of share-based incentives for continuing operations was 395,697 shares (2019: 513,596 shares).
Consolidated
2020 2019
Profit/(loss) attributable to owners of the Company (£000’s) 62 254
Weighted average number of diluted ordinary shares (000’s) 16,746 16,807
Diluted earnings/(loss) per share 0.4p 1.5p
Continuing operations Consolidated
2020 2019
Profit/(loss) attributable to owners of the Company (£000’s) 62 1,216
Weighted average number of diluted ordinary shares (000’s) 16,746 16,807
Diluted earnings/(loss) per share 0.4p 7.2p
Notes to the Financial Statements15. Property, Plant and Equipment
ConsolidatedYear ended 31 December 2020
Leasehold improvements
Furniture,fittings &
equipment
Generation assets Total
£000’s £000’s £000’s £000’s
Cost or valuation
At 1 January 2020 677 1,317 60,721 62,715
Revaluation adjustment - - 15,914 15,914
Transfer of depreciation at revaluation date* - - (14,590) (14,590)
Acquisition of a subsidiary - 9 - 9
Additions - 4 - 4
Disposals (337) (258) - (595)
At 31 December 2020 340 1,072 62,045 63,457
Accumulated depreciation
At 1 January 2020 (543) (1,256) (14,590) (16,389)
Transfer of depreciation at revaluation date* - - 14,590 14,590
Charge for the year (118) (12) (3,491) (3,621)
Impairment - (5) - (5)
Disposals 321 249 - 570
At 31 December 2020 (340) (1,024) (3,491) (4,855)
Net book value
At 1 January 2020 134 61 46,131 46,326
At 31 December 2020 - 48 58,554 58,602
*This transfer relates to the accumulated depreciation as at the revaluation date that was eliminated against the gross carrying amount of the revalued asset.

Strategic ReportG
overnance ReportFinancial Statem
ents
146 147Good Energy Annual Report 2020 Financial statements
Notes to the Financial Statements15. Property, Plant and Equipment (continued)
ConsolidatedYear ended 31 December 2019
Leasehold improvements
Furniture, fittings &
equipment
Generation assets Total
£000’s £000’s £000’s £000’s
Cost
At 1 January 2019 677 1,800 62,081 64,558
Assets held for sale - (545) (1,250) (1,795)
Additions - 62 50 112
Disposals - - (160) (160)
At 31 December 2019 677 1,317 60,721 62,715
Accumulated depreciation
At 1 January 2019 (479) (1,406) (12,322) (14,207)
Assets held for sale - 304 50 354
Charge for the year (64) (154) (2,482) (2,700)
Disposals - - 164 164
At 31 December 2019 (543) (1,256) (14,590) (16,389)
Net book value
At 1 January 2019 198 394 49,759 50,351
At 31 December 2019 134 61 46,131 46,326
The generation assets relate to electricity generating assets (wind turbines, solar panels and ancillaries). These assets are held within the Company’s subsidiaries: Good Energy Delabole Wind Farm Limited; Good Energy Hampole Wind Farm Limited; Good Energy Woolbridge Solar Park Limited; Good Energy Creathorne Solar Park Limited, Good Energy Rook Wood Solar Park Limited, Good Energy Carloggas Solar Park Limited, Good Energy Lower End Solar Park Limited and Good Energy Cross Roads Solar Park Limited.
These assets have been pledged as security against bank and other loan liabilities.
Details of the right-of-use assets and their associated lease liabilities are disclosed in note 16.
Notes to the Financial Statements15. Property, Plant and Equipment (continued)
Reconciliation of carrying amount
£000’s
Carrying amount at 1 January 2020 46,131
Level 3 valuation gain recognised due to change in accounting policy to revaluation model as at 1 January 2020 16,436
Level 3 valuation loss recognised due to change in accounting policy to revaluation model as at 1 January 2020 (522)
Carrying amount and fair value at 1 January 2020 62,045
Depreciation for the year (3,491)
Carrying amount at 31 December 2020 58,554 The group changed the accounting policy with respect to the measurement of Generation assets as at 1 January 2020 on a prospective basis. Therefore, the fair value of the generation assets was not measured at 1 January 2019. The effective date of the revaluation was 1 January 2020. The properties’ fair values are based on valuations performed by Jones Lang LaSalle Limited, an accredited independent valuer who has extensive valuation experience in wind and solar assets. The fair values were determined using a Discounted Cashflow method.
If the generation assets were measured using the cost model, the carrying amount would be, as follows:
2020
£000’s
Opening NBV at 1 January 2020 46,131
Accumulated depreciation & impairment (2,964)
Closing NBV at 31 December 2020 43,167
Significant unobservable valuation inputs Range Sensitivity
Discount rate 6-7% ±1%: (£4.1m) - £4.7m
Inflation Inflation curve ±1%: (£3.5m) - ££3.8m
Power prices Power curve ±10%: (£2.4m) - £2.4m
Energy yield P50 (1,900-26,000MWh) ±2%: (£1.8m) - £1.8m
Degradation 0.4%-0.5% ±0.2%: (£1.3m) - £1.3m

Strategic ReportG
overnance ReportFinancial Statem
ents
148 149Good Energy Annual Report 2020 Financial statements
Notes to the Financial Statements16. Right of Use Assets and LeasesThe Group has lease contracts for the access to, and use of, land on which its generation assets are located, office buildings, other equipment and software licences.
Leases of land (inclusive of access rights) typically have lease terms of between 20 and 30 years, office buildings of between 4 to 6 years, whilst other equipment and software licences have lease terms of between 3 and 10 years. The Group's obligations under its leases are secured by the lessor's title to the leased assets.
The Group also has certain leases of printers, laptops, and coffee and water machines, with low value underlying assets. The Group has applied the recognition exemption in respect of these leases.
Each lease generally imposes a restriction from subleasing the underlying assets to another party, therefore the right-of-use assets can only be used by the Group.
The lease payments within all of the Group's lease agreements (with the exception of short-term leases, leases of low value underlying assets, and those leases containing a variable lease payment component) are linked to annual charges in the Retail Price Index.
The Group has several leases subject to variable lease payments which do not depend on an index or rate. These relate to the Group's generation assets, where the lease payments are based on the actual performance of the asset (which in turn is dependent upon the weather). These payments are not, in substance, fixed, and therefore are excluded from the initial measurement of the lease liability and right-of-use asset.
The Group classifies its right-of-use assets in a manner consistent with that of its property, plant and equipment. The carrying values of the right-of-use assets, together with the depreciation charge split by class of underlying asset, are shown below:
Notes to the Financial Statements16. Right of Use Assets and Leases (continued)
ConsolidatedYear ended 31 December 2020
Land, land easements and
buildings
Furniture, fittings and equipment
Generation assets Total
£000s £000’s £000s £000’s
Cost
At 1 January 2020 5,684 1,393 1,250 8,327
Reassessment of lease liabilities 370 - - 370
At 31 December 2020 6,054 1,393 1,250 8,697
Accumulated depreciation
At 1 January 2020 (590) (1,154) (100) (1,844)
Charge for the year (563) (239) (54) (856)
Impairment (73) - - (73)
At 31 December 2020 (1,226) (1,393) (154) (2,773)
Net book value
At 1 January 2020 5,094 239 1,150 6,483
At 31 December 2020 4,828 - 1,096 5,924
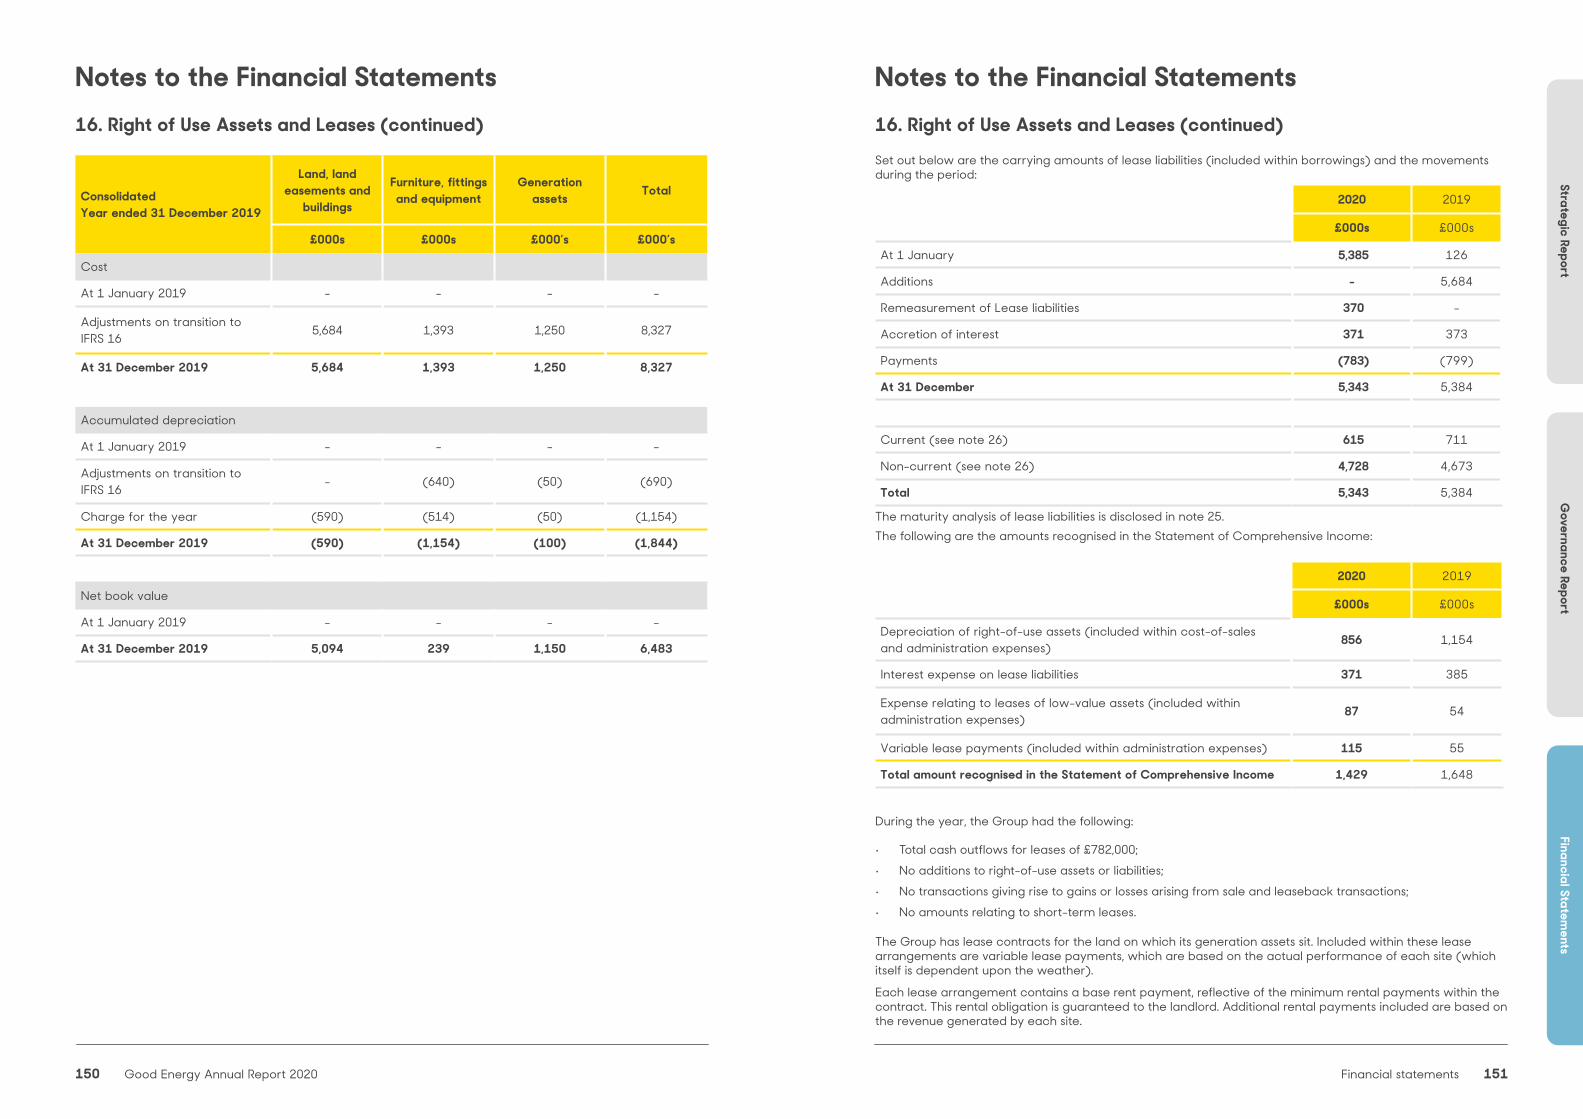
Strategic ReportG
overnance ReportFinancial Statem
ents
150 151Good Energy Annual Report 2020 Financial statements
Notes to the Financial Statements16. Right of Use Assets and Leases (continued)
ConsolidatedYear ended 31 December 2019
Land, land easements and
buildings
Furniture, fittings and equipment
Generation assets Total
£000s £000s £000’s £000’s
Cost
At 1 January 2019 - - - -
Adjustments on transition to IFRS 16 5,684 1,393 1,250 8,327
At 31 December 2019 5,684 1,393 1,250 8,327
Accumulated depreciation
At 1 January 2019 - - - -
Adjustments on transition to IFRS 16 - (640) (50) (690)
Charge for the year (590) (514) (50) (1,154)
At 31 December 2019 (590) (1,154) (100) (1,844)
Net book value
At 1 January 2019 - - - -
At 31 December 2019 5,094 239 1,150 6,483
Notes to the Financial Statements16. Right of Use Assets and Leases (continued)Set out below are the carrying amounts of lease liabilities (included within borrowings) and the movements during the period:
2020 2019
£000s £000s
At 1 January 5,385 126
Additions - 5,684
Remeasurement of Lease liabilities 370 -
Accretion of interest 371 373
Payments (783) (799)
At 31 December 5,343 5,384
Current (see note 26) 615 711
Non-current (see note 26) 4,728 4,673
Total 5,343 5,384
The maturity analysis of lease liabilities is disclosed in note 25.The following are the amounts recognised in the Statement of Comprehensive Income:
2020 2019
£000s £000s
Depreciation of right-of-use assets (included within cost-of-sales and administration expenses) 856 1,154
Interest expense on lease liabilities 371 385
Expense relating to leases of low-value assets (included within administration expenses) 87 54
Variable lease payments (included within administration expenses) 115 55
Total amount recognised in the Statement of Comprehensive Income 1,429 1,648
During the year, the Group had the following:
• Total cash outflows for leases of £782,000;• No additions to right-of-use assets or liabilities;• No transactions giving rise to gains or losses arising from sale and leaseback transactions;• No amounts relating to short-term leases.
The Group has lease contracts for the land on which its generation assets sit. Included within these lease arrangements are variable lease payments, which are based on the actual performance of each site (which itself is dependent upon the weather).
Each lease arrangement contains a base rent payment, reflective of the minimum rental payments within the contract. This rental obligation is guaranteed to the landlord. Additional rental payments included are based on the revenue generated by each site.
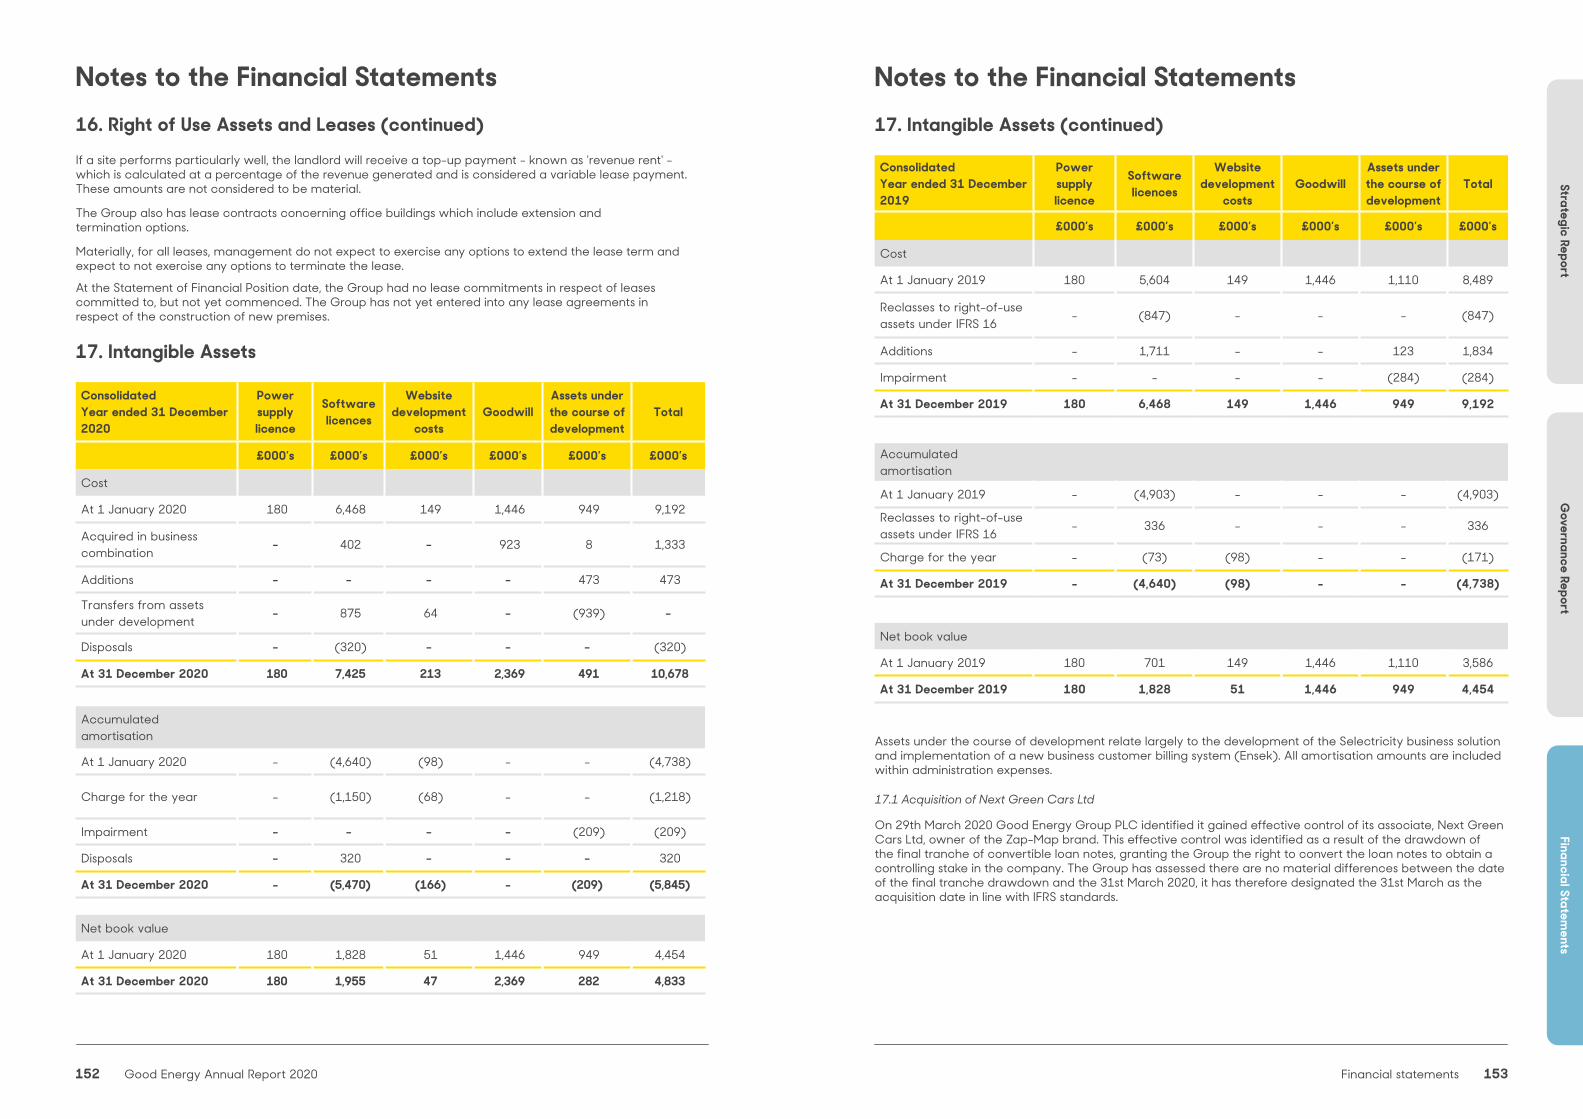
Strategic ReportG
overnance ReportFinancial Statem
ents
152 153Good Energy Annual Report 2020 Financial statements
Notes to the Financial Statements16. Right of Use Assets and Leases (continued)If a site performs particularly well, the landlord will receive a top-up payment - known as 'revenue rent' - which is calculated at a percentage of the revenue generated and is considered a variable lease payment. These amounts are not considered to be material.
The Group also has lease contracts concerning office buildings which include extension and termination options.
Materially, for all leases, management do not expect to exercise any options to extend the lease term and expect to not exercise any options to terminate the lease.
At the Statement of Financial Position date, the Group had no lease commitments in respect of leases committed to, but not yet commenced. The Group has not yet entered into any lease agreements in respect of the construction of new premises.
17. Intangible Assets
ConsolidatedYear ended 31 December 2020
Power supply licence
Software licences
Website development
costsGoodwill
Assets under the course of development
Total
£000’s £000’s £000’s £000’s £000’s £000’s
Cost
At 1 January 2020 180 6,468 149 1,446 949 9,192
Acquired in business combination - 402 - 923 8 1,333
Additions - - - - 473 473
Transfers from assets under development - 875 64 - (939) -
Disposals - (320) - - - (320)
At 31 December 2020 180 7,425 213 2,369 491 10,678
Accumulated amortisation
At 1 January 2020 - (4,640) (98) - - (4,738)
Charge for the year - (1,150) (68) - - (1,218)
Impairment - - - - (209) (209)
Disposals - 320 - - - 320
At 31 December 2020 - (5,470) (166) - (209) (5,845)
Net book value
At 1 January 2020 180 1,828 51 1,446 949 4,454
At 31 December 2020 180 1,955 47 2,369 282 4,833
Notes to the Financial Statements17. Intangible Assets (continued)
ConsolidatedYear ended 31 December 2019
Power supply licence
Software licences
Website development
costsGoodwill
Assets under the course of development
Total
£000’s £000’s £000’s £000’s £000’s £000’s
Cost
At 1 January 2019 180 5,604 149 1,446 1,110 8,489
Reclasses to right-of-use assets under IFRS 16 - (847) - - - (847)
Additions - 1,711 - - 123 1,834
Impairment - - - - (284) (284)
At 31 December 2019 180 6,468 149 1,446 949 9,192
Accumulated amortisation
At 1 January 2019 - (4,903) - - - (4,903)
Reclasses to right-of-use assets under IFRS 16 - 336 - - - 336
Charge for the year - (73) (98) - - (171)
At 31 December 2019 - (4,640) (98) - - (4,738)
Net book value
At 1 January 2019 180 701 149 1,446 1,110 3,586
At 31 December 2019 180 1,828 51 1,446 949 4,454
Assets under the course of development relate largely to the development of the Selectricity business solution and implementation of a new business customer billing system (Ensek). All amortisation amounts are included within administration expenses.
17.1 Acquisition of Next Green Cars Ltd
On 29th March 2020 Good Energy Group PLC identified it gained effective control of its associate, Next Green Cars Ltd, owner of the Zap-Map brand. This effective control was identified as a result of the drawdown of the final tranche of convertible loan notes, granting the Group the right to convert the loan notes to obtain a controlling stake in the company. The Group has assessed there are no material differences between the date of the final tranche drawdown and the 31st March 2020, it has therefore designated the 31st March as the acquisition date in line with IFRS standards.

Strategic ReportG
overnance ReportFinancial Statem
ents
154 155Good Energy Annual Report 2020 Financial statements
Trade and other payables (126) - (126)
Net assets acquired 355 266 621
NCI interest in net assets 49.90% (310)
Net assets attributable to Group 311
Goodwill at acquisition 923
Consideration transferred 1,234
Goodwill of £2,369,000 (2019: £1,446,453) comprises: £1,061,000 (2018: £1,060,996) arising from the original acquisition of Good Energy Limited, £385,000 (2019: £385,457) from the original acquisition of the wind farm at Delabole, and £923,000 (2019: £nil) from the acquisition of Next Green Car Ltd and the Zap-map brand.
Notes to the Financial Statements17. Intangible Assets (continued)The carrying values of indefinite life assets included in intangible assets are: goodwill of £2,369,000 (2019: £1,446,453), and a power supply licence of £180,000 (2019: £180,000) which relates to the subsidiary, Good Energy Limited. In arriving at the conclusion that these assets have an indefinite life, management have observed that the power supply licence is awarded until any breach of conditions stipulated by OFGEM. The treatment of goodwill is aligned with relevant accounting standards. An impairment review is undertaken annually or more frequently. The result of this review was that no impairment is required in respect of the carrying values of the indefinite life assets. The key assumptions for value in use excluding goodwill in Next Green Car Ltd are as follows:
Value in use assumptions 2020 2019
Gross margin* 20%-30% 20%-30%
Growth rate beyond five year plan 3% 3%
Pre-tax discount rate 8% 8% *Annual margins have been modelled in the five year cashflow at varying levels.Sensitivity analysis has been performed on the impairment review. It has been noted that an increase in the discount rate by 100% would not result in an impairment of the goodwill. Management believe any increase in discount rates above 10% to be remote and therefore the Directors believe there to be significant headroom.
In line with Next Green Car Ltd’s (“Zap-Map”) status as a start-up, management believe that Fair Value less cost to sell method of valuation using earnings multiples is the most appropriate way of valuing the business, and use this methodology in our ongoing investment decision making. We are required for the purposes of impairment testing to perform a value-in-use assessment using discounted cashflows. This assessment is subject to significant estimation uncertainty surrounding appropriate growth and discount rates. As a result of the impairment assessment the directors do not believe there is any reason for impairment at this time.
The projected cash flows have been based on financial forecasts by senior management for a 10 year period with a 10% nominal growth rate applied to periods post the forecasted period. This long term growth rate for Zap Map has been based on the expected long term growth rate for the EV market. A period longer than 5 years has been used in this assessment because of expected short-term negative net cashflows, and an expected higher growth rate in the EV market over the next 10 years compared with the terminal growth rate. The post-tax discount rate applied to cash flow projections for the Zap Map is 25%. This post-tax cost of capital was assessed at a higher rate than all other CGUs due to Zap-Map’s entering its scale-up phase, as well as the specific risk characteristics of the forecast cash flows.
Sensitivity analysis has been conducted on the cost of capital for the Zap Map and the Directors noted that an increase of the post-tax discount rate by 6% was required before the carrying value of the CGU equalled its recoverable amount.
Notes to the Financial Statements17. Intangible Assets (continued)17.1 Acquisition of Next Green Cars Ltd (continued)
Next Green Cars Ltd was previously accounted for as an equity associate, with Good Energy Group PLC owning a 12.9% stake in the business and a director appointed to the board granting 33% of the boards voting rights. This was identified as constituting significant influence to direct the relevant activities of NGCL.
As part of the initial purchase of shares in Next Green Cars Ltd a contingent consideration was agreed. Contingent consideration was payable dependent on the satisfaction of product milestones in July 2020 and stretching financial milestone targets in December 2021. The product milestones were not met in July 2020 and this contingent consideration was written to the profit and loss. The maximum possible deferred consideration is £0.6m. The value of the remaining contingent consideration liability is disclosed in Note 19.
At 31 December 2019 the group held £600,000 of the authorised £800,000 secured convertible loan notes in NGCL, carried at a fair value of £614,000. At the drawdown date of the final tranche of convertible loan stock, the entire loan stock was valued at £821,000.
£410,000 of separately identifiable intangible assets were acquired on 31 March 2020 as part of the acquisition of NGCL. A valuation of these internally developed intangible assets was performed by the Group using the replacement cost as the basis for valuation. The goodwill arising on the acquisition of the above company is attributable to the anticipated profitability of NGCLs software in the EV market and the synergies expected as part of the Group’s wider Energy as a Service offering.
Good Energy Group PLC on the 25 June 2020 formally converted the loan notes into a combined total 50.1% equity holding.
The net assets at the date of acquisition are stated at their fair value as set out below.
NBV at 31 March 2020
Fair valueadjustment
Next Green Car Ltd acquisition balance sheet at 31 March
2020
£000’s £000’s £000’s
Property, plant and equipment 9 - 9
Intangible assets 82 328 410
Trade and other receivables 129 - 129
Cash and cash equivalents 307 - 307
Deferred tax - (62) (62)
ST borrowings (46) - (46)
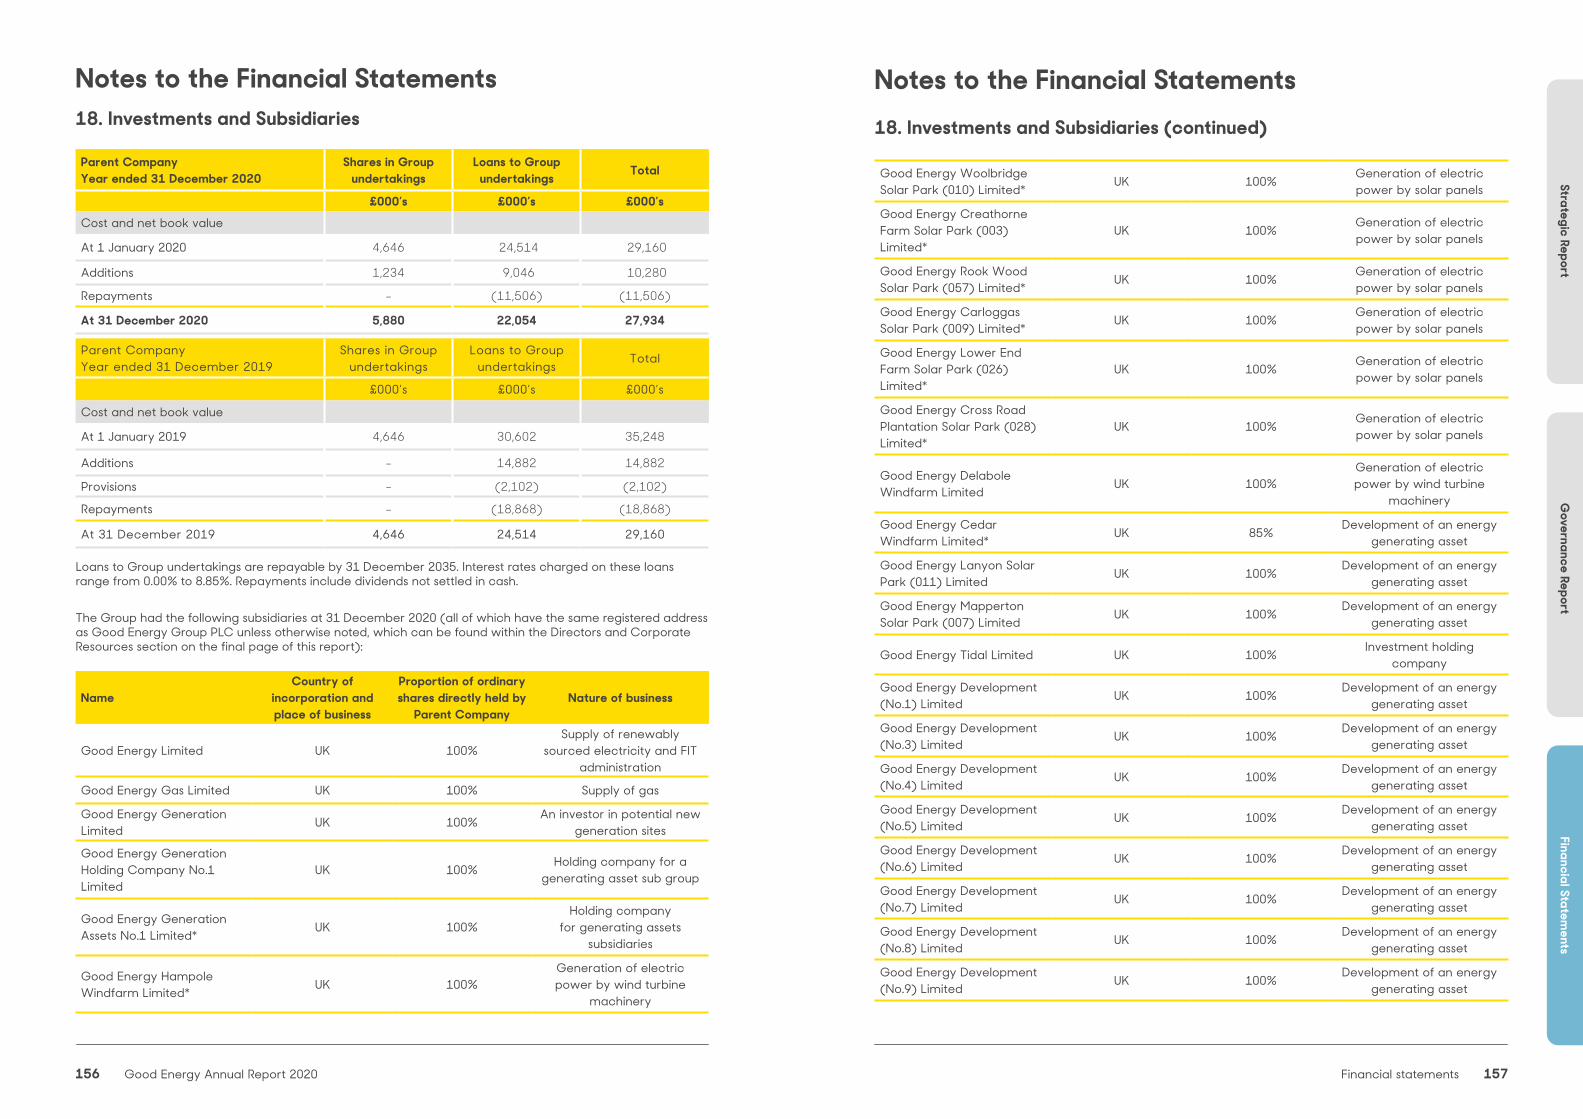
Strategic ReportG
overnance ReportFinancial Statem
ents
156 157Good Energy Annual Report 2020 Financial statements
Notes to the Financial Statements18. Investments and Subsidiaries
Parent CompanyYear ended 31 December 2020
Shares in Groupundertakings
Loans to Group undertakings Total
£000’s £000’s £000’sCost and net book value
At 1 January 2020 4,646 24,514 29,160
Additions 1,234 9,046 10,280
Repayments - (11,506) (11,506)
At 31 December 2020 5,880 22,054 27,934
Parent CompanyYear ended 31 December 2019
Shares in Groupundertakings
Loans to Group undertakings Total
£000’s £000’s £000’s
Cost and net book value
At 1 January 2019 4,646 30,602 35,248
Additions - 14,882 14,882
Provisions - (2,102) (2,102)
Repayments - (18,868) (18,868)
At 31 December 2019 4,646 24,514 29,160
Loans to Group undertakings are repayable by 31 December 2035. Interest rates charged on these loans range from 0.00% to 8.85%. Repayments include dividends not settled in cash.
The Group had the following subsidiaries at 31 December 2020 (all of which have the same registered address as Good Energy Group PLC unless otherwise noted, which can be found within the Directors and Corporate Resources section on the final page of this report):
NameCountry of
incorporation and place of business
Proportion of ordinary shares directly held by
Parent CompanyNature of business
Good Energy Limited UK 100%Supply of renewably
sourced electricity and FIT administration
Good Energy Gas Limited UK 100% Supply of gas
Good Energy Generation Limited UK 100% An investor in potential new
generation sites
Good Energy Generation Holding Company No.1 Limited
UK 100% Holding company for a generating asset sub group
Good Energy Generation Assets No.1 Limited* UK 100%
Holding company for generating assets
subsidiaries
Good Energy Hampole Windfarm Limited* UK 100%
Generation of electric power by wind turbine
machinery
Good Energy Woolbridge Solar Park (010) Limited* UK 100% Generation of electric
power by solar panels
Good Energy Creathorne Farm Solar Park (003) Limited*
UK 100% Generation of electric power by solar panels
Good Energy Rook Wood Solar Park (057) Limited* UK 100% Generation of electric
power by solar panels
Good Energy Carloggas Solar Park (009) Limited* UK 100% Generation of electric
power by solar panels
Good Energy Lower End Farm Solar Park (026) Limited*
UK 100% Generation of electric power by solar panels
Good Energy Cross Road Plantation Solar Park (028) Limited*
UK 100% Generation of electric power by solar panels
Good Energy Delabole Windfarm Limited UK 100%
Generation of electric power by wind turbine
machinery
Good Energy Cedar Windfarm Limited* UK 85% Development of an energy
generating asset
Good Energy Lanyon Solar Park (011) Limited UK 100% Development of an energy
generating asset
Good Energy Mapperton Solar Park (007) Limited UK 100% Development of an energy
generating asset
Good Energy Tidal Limited UK 100% Investment holding company
Good Energy Development (No.1) Limited UK 100% Development of an energy
generating asset
Good Energy Development (No.3) Limited UK 100% Development of an energy
generating asset
Good Energy Development (No.4) Limited UK 100% Development of an energy
generating asset
Good Energy Development (No.5) Limited UK 100% Development of an energy
generating asset
Good Energy Development (No.6) Limited UK 100% Development of an energy
generating asset
Good Energy Development (No.7) Limited UK 100% Development of an energy
generating asset
Good Energy Development (No.8) Limited UK 100% Development of an energy
generating asset
Good Energy Development (No.9) Limited UK 100% Development of an energy
generating asset
Notes to the Financial Statements18. Investments and Subsidiaries (continued)

Strategic ReportG
overnance ReportFinancial Statem
ents
158 159Good Energy Annual Report 2020 Financial statements
Good Energy Development (No.10) Limited UK 100% Development of an energy
generating asset
Good Energy Development (No.12) Limited UK 100% Development of an energy
generating asset
Good Energy Development (No.14) Limited UK 100% Development of an energy
generating asset
Good Energy Development (No.15) Limited UK 100% Development of an energy
generating asset
Good Energy Development (No.16) Limited UK 100% Development of an energy
generating asset
Good Energy Development (No.17) Limited UK 100% Development of an energy
generating asset
Llangyfelach Community Solar Farm C.I.C UK 100% Development of an energy
generating asset
Worminster Down Somerset Community Solar Farm C.I.C UK 100% Development of an energy
generating asset
Good Energy Development (No.20) Limited UK 100% Development of an energy
generating asset
Good Energy Development (No.21) Limited UK 100% Development of an energy
generating asset
Good Energy Development (No.22) Limited UK 100% Development of an energy
generating asset
Good Energy Development (No.24) Limited UK 100% Development of an energy
generating asset
Good Energy Development (No.25) Limited UK 100% Development of an energy
generating asset
Good Energy Development (No.26) Limited UK 100% Development of an energy
generating asset
Good Energy Development (No.27) Limited UK 100% Development of an energy
generating asset
Good Energy Development (No.28) Limited UK 100% Development of an energy
generating asset
Good Energy Development (No.29) Limited UK 100% Development of an energy
generating asset
Good Energy Development (No.30) Limited UK 100% Development of an energy
generating asset
Homegrown Energy Ltd UK 100% Dormant
Next Green Car Ltd** UK 50.1% Development of EV Charging point platform app
*Entities indirectly owned by Good Energy Group PLC.
** Registered address: Unit 66, Spike Island, 133 Cumberland Road, Bristol, England, BS1 6UX.
The subsidiaries above have all been included in the consolidated financial statements.
Notes to the Financial Statements18. Investments and Subsidiaries (continued) Impairment
The Group performed an impairment test in December 2020. The Group considers the relationship between its market capitalisation and its book value, as well as forward looking estimates of cash flows, when reviewing for indicators of impairment. As at 31 December 2020, the market capitalisation of the Group was higher than the book value of its equity. Management concluded from these reviews that no indicators of impairment existed.
The recoverable amount of the intercompany loan receivable balance in the Parent Company has been determined based on an assessment of forward looking estimates of cash flows and a probability of default. The projected cash flows have been adjusted to allow for normalised business (i.e. no new business activity costs or revenue are included), and are considering a prudent case. The pre-tax discount rate applied to cash flow projections is 8.0%, and cash flows beyond the five-year period are extrapolated using a 3.0% growth rate. It was concluded that the future cash flows do exceed the value of the intercompany loan receivable, and therefore no expected credit loss provision is required.
Key assumptions used in impairment calculations and sensitivity to changes in assumptions
The calculation of value in use is most sensitive to the following assumptions:
• Discount rate
• Growth rates used to extrapolate cash flows beyond the forecast period
Discount rate – the discount rate represents the current market assessment of the risks specific to the Group, taking into consideration the time value of money. The discount rate is derived from the Group’s weighted average cost of capital (WACC). The WACC takes into account both debt and equity. A rise in the pre-tax discount rate to 11.17% would result in impairment.
Growth rate estimates – rates are based on management’s prudent estimates of expected growth. A decrease in the growth rate estimate to 0% would still leave significant headroom, and would not trigger an indication of impairment.
Notes to the Financial Statements18. Investments and Subsidiaries (continued)
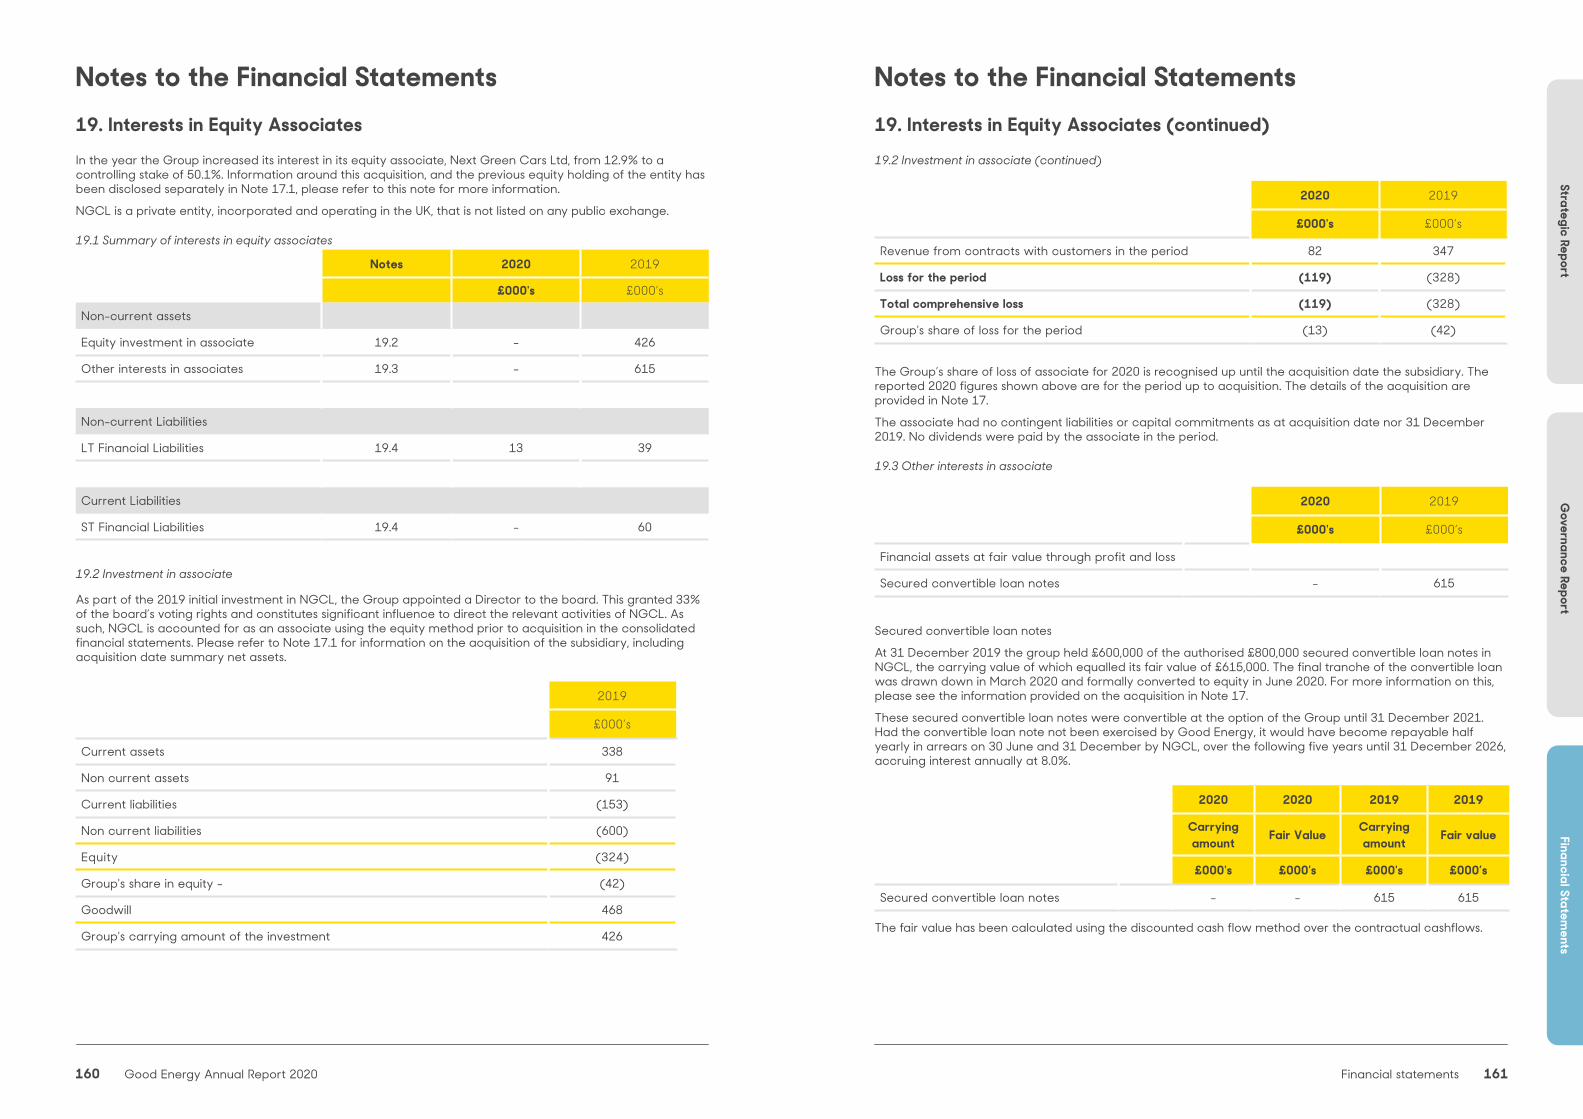
Strategic ReportG
overnance ReportFinancial Statem
ents
160 161Good Energy Annual Report 2020 Financial statements
Notes to the Financial Statements19. Interests in Equity AssociatesIn the year the Group increased its interest in its equity associate, Next Green Cars Ltd, from 12.9% to a controlling stake of 50.1%. Information around this acquisition, and the previous equity holding of the entity has been disclosed separately in Note 17.1, please refer to this note for more information.
NGCL is a private entity, incorporated and operating in the UK, that is not listed on any public exchange.
19.1 Summary of interests in equity associates
Notes 2020 2019
£000's £000’s
Non-current assets
Equity investment in associate 19.2 - 426
Other interests in associates 19.3 - 615
Non-current Liabilities
LT Financial Liabilities 19.4 13 39
Current Liabilities
ST Financial Liabilities 19.4 - 60
19.2 Investment in associate
As part of the 2019 initial investment in NGCL, the Group appointed a Director to the board. This granted 33% of the board’s voting rights and constitutes significant influence to direct the relevant activities of NGCL. As such, NGCL is accounted for as an associate using the equity method prior to acquisition in the consolidated financial statements. Please refer to Note 17.1 for information on the acquisition of the subsidiary, including acquisition date summary net assets.
2019
£000’s
Current assets 338
Non current assets 91
Current liabilities (153)
Non current liabilities (600)
Equity (324)
Group's share in equity - (42)
Goodwill 468
Group's carrying amount of the investment 426
Notes to the Financial Statements19. Interests in Equity Associates (continued)19.2 Investment in associate (continued)
2020 2019
£000's £000’s
Revenue from contracts with customers in the period 82 347
Loss for the period (119) (328)
Total comprehensive loss (119) (328)
Group's share of loss for the period (13) (42)
The Group’s share of loss of associate for 2020 is recognised up until the acquisition date the subsidiary. The reported 2020 figures shown above are for the period up to acquisition. The details of the acquisition are provided in Note 17.
The associate had no contingent liabilities or capital commitments as at acquisition date nor 31 December 2019. No dividends were paid by the associate in the period.
19.3 Other interests in associate
2020 2019
£000's £000’s
Financial assets at fair value through profit and loss
Secured convertible loan notes - 615 Secured convertible loan notes
At 31 December 2019 the group held £600,000 of the authorised £800,000 secured convertible loan notes in NGCL, the carrying value of which equalled its fair value of £615,000. The final tranche of the convertible loan was drawn down in March 2020 and formally converted to equity in June 2020. For more information on this, please see the information provided on the acquisition in Note 17.
These secured convertible loan notes were convertible at the option of the Group until 31 December 2021. Had the convertible loan note not been exercised by Good Energy, it would have become repayable half yearly in arrears on 30 June and 31 December by NGCL, over the following five years until 31 December 2026, accruing interest annually at 8.0%.
2020 2020 2019 2019
Carrying amount Fair Value Carrying
amount Fair value
£000's £000's £000's £000’s
Secured convertible loan notes - - 615 615
The fair value has been calculated using the discounted cash flow method over the contractual cashflows.

Strategic ReportG
overnance ReportFinancial Statem
ents
162 163Good Energy Annual Report 2020 Financial statements
Notes to the Financial Statements19. Interests in Equity Associates (continued)19.4 Other financial liabilities
2020 2019
£000's £000’s
Financial liabilities at fair value through profit and loss
Contingent consideration at 1 January/initial recognition 99 171
Fair value gain (86) (72)
Contingent consideration at 31 December 13 99
Total current - 60
Total non-current 13 39
The carrying amount of these liabilities is equivalent to the fair value.
Contingent consideration
As part of the initial purchase of shares in Next Green Cars Ltd a contingent consideration was been agreed. Contingent consideration was payable dependant on the satisfaction of product milestones in July 2020 and stretching financial milestone targets in December 2021. The product milestones were not met in July 2020 and this contingent consideration was written to the profit and loss. The maximum possible deferred consideration is £0.6m.
20. InventoriesParent Company Consolidated
2020 2019 2020 2019
£000’s £000’s £000’s £000’s
Renewable Obligation Certificates - - 14,477 9,506
Emission Certificates - - 148 435
Total - - 14,625 9,941
As at 31 December 2020 there were Renewable Obligation Certificates (ROCs) of £7,447,000 (2019: £6,263,879) included in the above amount that were unissued for generation that had already taken place and therefore these ROCs were not available for sale before the end of the financial year. The cost of inventories recognised as an expense, including any impairment value, and included in 'cost of sales' amounted to £12.1m (2019: £12.5m).
Notes to the Financial Statements21. Trade and Other Receivables
Parent Company Consolidated
2020 2019 2020 2019
£000’s £000’s £000’s £000’s
Gross trade receivables and unbilled receivables 57 8 34,278 33,724
Provision for impairment/non-payment of trade receivables - - (8,882) (7,345)
Net trade receivables and unbilled receivables 57 8 25,396 26,379
Prepayments and other debtors 112 55 1,157 2,951
Other taxation 7 35 162 100
Total 176 98 26,715 29,430
Where a customer account is in credit this is included in contract liabilities (see note 28 Trade and Other Payables).
The Group has identified that the amount of accrued income subject to estimation uncertainty is approximately £0.5m.
The Group has a provision in place to set aside an allowance to cover potential impairment and non-payment of trade receivables. An expected credit loss provision has been calculated on trade receivables in accordance with IFRS 9 Financial Instruments. Some trade receivables are with customers who do not have externally available credit ratings.
The movements on the provision for impairment and non-payment of trade receivables is shown below:
Movement on the provision for impairment and non-payment of trade receivables
2020 2019
£000’s £000’s
Balance at 1 January 7,345 5,922
Increase in allowance for impairment/non-payment 3,719 3,674
Impairment/non-payment losses recognised (2,182) (2,251)
Balance at 31 December 8,882 7,345
Trade receivables 31 December 2020
Days past due
Contract assets Current <30 days 30-60
days61-90 days >91 days Total
£000's £000's £000's £000's £000's £000's £000's
Expected credit loss rate - 8.0% 8.1% 13.9% 23.3% 80.8%
Estimated total gross carrying amount at default
- 17,891 4,984 2,193 1,211 7,999 34,278
Expected credit loss rate - 1,426 403 304 282 6,467 8,882

Strategic ReportG
overnance ReportFinancial Statem
ents
164 165Good Energy Annual Report 2020 Financial statements
Notes to the Financial Statements21. Trade and Other Receivables (continued)
Trade receivables 31 December 2019
Days past due
Contract assets Current <30 days 30-60
days61-90 days >91 days Total
£000's £000's £000's £000's £000's £000's £000's
Expected credit loss rate - 5.5% 5.5% 12.4% 19.9% 70.9%
Estimated total gross carrying amount at default
- 15,703 6,230 2,518 1,475 7,798 33,724
Expected credit loss rate - 864 343 313 294 5,531 7,345
All trade receivables are designated as financial assets measured at amortised cost.
22. Cash and Cash Equivalents Parent Company Consolidated
2020 2019 2020 2019
£000’s £000’s £000’s £000’s
Cash at bank and in hand 4,948 5,603 14,259 9,476
Short-term bank deposits - - 1,895 952
Security deposits - - 2,128 3,239
Total 4,948 5,603 18,282 13,667
As part of the bank loan agreements, the lenders require a minimum cash balance to be held in separate reserve accounts, these balances are disclosed as "restricted deposit accounts" in non-current assets on the Statement of Financial Position. Included within cash at bank and in hand for both the Parent Company and the Group is £372,000 (2019: £340,038 in respect of monies held by the Good Energy Employee Benefits Trust. As a result of a subsequent event, some funds in restricted deposit accounts have been released, see Note 34.
The credit quality of cash and cash equivalents can be assessed by reference to external credit ratings as follows:
Parent Company Consolidated
2020 2019 2020 2019
£000’s £000’s £000’s £000’s
AA - - - 95
A+ 4,854 5,509 15,628 10,032
A - - 950 1,000
A- - - 1,178 -
B 94 94 526 397
BBB+ - - - 2,143
Total 4,948 5,603 18,282 13,667
Cash and cash equivalents are all financial assets designated as financial assets at amortised cost.
Notes to the Financial Statements 23. Share Capital and Share Premium
Parent Company & Consolidated
Number of shares issued and
fully paid Share Capital Share Premium
Account Total
£000’s £000’s £000’s
At 1 January 2019 16,571,521 829 12,719 13,548
Proceeds from shares issued 49,724 3 71 74
At 31 December 2019 16,621,245 832 12,790 13,622
Proceeds from shares issued 21,822 1 - 1
At 31 December 2020 16,643,067 833 12,790 13,623
The ordinary shares are the only class of shares in the Company. Holders of ordinary shares are entitled to vote at general meetings of the Company and receive dividends as declared. The Articles of Association of the Company do not contain any restrictions on the transfer of shares or on voting rights.
In 2020, the Company issued 21,822 ordinary shares of 5p each in settlement of the exercise of share options, for a total exercise consideration of £1k. There were no scrip dividend issues in the year (2019: 34,641 and 15,083 shares respectively).
Clarke Willmott Trust Corporation Limited holds in trust 268,270 (2019: 293,270) ordinary shares of the Company for the present and the future beneficiaries of the Good Energy Group Employee Share Option Scheme. These are deducted from equity as the Employee Benefit Trust shares shown in the Consolidated and Parent Company Statements of Changes in Equity. During the year the Trust disposed of 25,000 (2019: 110,000) shares as a result of options exercised and acquired nil (2019: nil) shares.
No final dividend has been proposed in the current year considering the ongoing COVID-19 pandemic and prudent cashflow management (2019: 2.6p).

Strategic ReportG
overnance ReportFinancial Statem
ents
166 167Good Energy Annual Report 2020 Financial statements
Notes to the Financial Statements24. Deferred TaxationThe provision for deferred taxation is made up as follows:
Consolidated 2020 2019
£000’s £000’s
At 1 January 903 927
Charged to the Consolidated Statement of Comprehensive Income 47 46
Elimination on disposal of subsidiaries - (70)
Acquisition of subsidiaries 62 -
Charged to equity 3,123 -
At 31 December 4,135 903
Deferred tax assets 2020 2019
£000’s £000’s
On short term timing differences 132 181
Losses 878 976
Interest deductible 54 -
Total 1,064 1,157
Deferred tax liabilities 2020 2019
£000’s £000’s
On accelerated capital allowances (2,029) (2,060)
Revaluation of Generation sites (3,123) -
Acquisition of subsidiary fair values (47) -
Total (5,199) (2,060)
Notes to the Financial Statements24. Deferred Taxation (continued)
Accelerated capital
allowances
Revaluation of
Generation sites
Acquisition of subsidiary
fair values
Short-term timing
differencesLosses Interest
deductible Total
£000’s £000’s £000’s £000’s £000’s
Deferred tax assets/(liabilities)
At 1 January 2019 (1,863) - - 65 860 11 (927)
Credited/(charged) to the income statement
(267) - - 116 116 (11) (46)
Elimination on disposal of subsidiaries
70 - - - - - 70
At 31 December 2019 (2,060) - - 181 976 - (903)
Credited/(charged) to the income statement
31 - 15 (49) (98) 54 (47)
Acquisition of subsidiary - - (62) - - - (62)
(Charged) to other comprehensive income
- (3,123) - - - - (3,123)
At 31 December 2020 (2,029) (3,123) (47) 132 878 54 (4,135)
Deferred tax on losses incurred pre 1 April 2017 has only been recognised to the extent that the relevant companies which incurred the losses have sufficient deferred tax liabilities available for offset. Should deferred tax be recognised on all such losses, the deferred tax asset and profit after tax would increase by £195,000.

Strategic ReportG
overnance ReportFinancial Statem
ents
168 169Good Energy Annual Report 2020 Financial statements
Notes to the Financial Statements25. Borrowings and Other Financial Liabilities
Parent Company Consolidated
2020 2019 2020 2019
£000’s £000’s £000’s £000’s
Current:
Bank and other borrowings - 50 1,955 1,951
Bond 1,063 395 1,063 395
Loans from Group companies - 7,330 - -
Lease liabilities 26 27 615 711
Total 1,089 7,802 3,633 3,057
Parent Company Consolidated
2020 2019 2020 2019
£000’s £000’s £000’s £000’s
Non current:
Bank and other borrowings - - 33,405 35,314
Bond 16,331 16,757 16,331 16,757
Lease liabilities 7 33 4,728 4,673
Total 16,338 16,790 54,464 56,744
The Group has no bank overdraft facilities (2019 undrawn bank overdraft: £10,000,000) as at 31 December 2020. The facility in the prior year was secured by guarantees from Good Energy Limited, Good Energy Gas Limited and other Group entities.
At 31 December 2020, £4,585,000 (2019: £5,449,283) of the bank loans relate to the Parent Company’s subsidiary, Good Energy Delabole Wind Farm Limited and is secured by a mortgage debenture on that company dated 16 January 2010 incorporating a fixed and floating charge over all current and future assets of that subsidiary. The facility will be repaid from future cash flows arising from the wind farm of this company. On 7 January 2011, the loan balance was transferred from the build phase to the repayment phase, with repayments of capital and interest scheduled bi-annually over 15 years.
As part of the facility Good Energy Delabole Wind Farm Limited entered into a floating rate to fixed rate interest swap. They were entered into at the same time and in contemplation of one another, have the same counter-party, relate to the same risk and amortise concurrently. Given these circumstances and the fact that there is no economic need or substantive business purpose for structuring the transactions separately that could not also have been accomplished in a single transaction, these instruments are treated as one fixed rate loan instrument. The fixed rate interest is payable at an annual rate of 7.15%.
Notes to the Financial Statements25. Borrowings and Other Financial Liabilities (continued) At 31 December 2020, £30,728,000 (2019: £33,882,698) of the bank loans relate to the Parent Company’s subsidiary, Good Energy Generation Assets No. 1 Limited. The loan is secured by a mortgage debenture on that company and its subsidiaries dated 17 December 2014, incorporating charges over the shares of that company and those of its subsidiaries. The facility will be repaid from future cash flows arising from the subsidiaries of that company with repayments of capital and interest scheduled quarterly over a period of 18 years commencing 17 December 2014. Interest is payable at 6.85% and the outstanding principal balance is partially exposed if annual RPI inflation exceeds 3%. Costs incurred in raising finance were £2,754,000 (2019: £2,754,299) and are being amortised over the life of the loan.
After the year end the group completed a group restructuring. As part of this Good Energy Delabole Wind Farm Limited was brought within the Good Energy Generation Assets No. 1 Limited sub-group, its bank loans were repaid in full with additional debt issued to Good Energy Generation Assets No. 1 Limited as part of a revised facility with Gravis Capital Partners LLP. This is a non-adjusting subsequent event, more details of this transaction are disclosed within Note 34.
Parent CompanyInter-
companyloan
BondBank and
other borrowings
Lease liabilities Total
£000’s £000’s £000’s £000’s £000’s
31 December 2020
Due less than 1 year - 1,063 - 26 1,089
Due between 1 and 5 years - 16,331 - 7 16,338
Total - 17,394 - 33 17,427
Parent CompanyInter-
companyloan
Bond
Bank and other
borrowings
Lease liabilities Total
£000’s £000’s £000’s £000’s £000’s
31 December 2019
Due less than 1 year 7,330 395 50 27 7,802
Due between 1 and 5 years - 16,757 - 33 16,790
Total 7,330 17,152 50 60 24,592

Strategic ReportG
overnance ReportFinancial Statem
ents
170 171Good Energy Annual Report 2020 Financial statements
Notes to the Financial Statements25. Borrowings and Other Financial Liabilities (continued)
Consolidated BondBank and
other borrowings
Lease liabilities Total
£000’s £000’s £000’s £000’s
31 December 2020
Due less than 1 year 1,063 1,955 615 3,633
Due between 1 and 5 years 16,331 10,404 1,541 28,276
Due more than 5 years - 23,001 3,187 26,188
Total 17,394 35,360 5,343 58,097
Consolidated Bond Bank and
other borrowings
Lease liabilities Total
£000’s £000’s £000’s £000’s
31 December 2019
Due less than 1 year 395 1,951 711 3,057
Due between 1 and 5 years 16,757 9,115 1,381 27,253
Due more than 5 years - 26,199 3,292 29,491
Total 17,152 37,265 5,384 59,801
The fair values of borrowings have been calculated taking into account the interest rate risk inherent in the loans and the bond. The fair value estimates and carrying values of borrowings (excluding issue costs) in place at 31 December 2020 are:
2020 2020 2019 2019
Fairvalue
Carrying value
Fairvalue
Carrying value
£000s £000s £000s £000s
Good Energy Delabole Wind farm Ltd 4,672 4,657 5,565 5,546
Good Energy Generation Assets No. 1 Limited 32,962 32,645 34,683 33,883
Corporate bond 16,586 17,422 17,309 16,785
Borrowings are designated as other financial liabilities held at amortised cost.
Notes to the Financial Statements26. Changes in Liabilities Arising from Financing Activities
1 January 2020 Cash flows
Acquisition of
Subsidiary
Lease liability remeasure
-mentOther 31 December
2020
£000's £000's £000's £000’s £000's £000's
Current interest-bearing loans and borrowings (excluding items listed below)
2,346 (2,184) (46) - 2,902 3,018
Non-current interest-bearing loans and borrowings (excluding items listed below)
52,071 - - - (2,335) 49,736
Current lease obligations 711 (411) - - 315 615
Non-current lease obligations 4,673 - - 370 (315) 4,728
Total liabilities from financing activities 59,801 (2,595) (46) 370 567 58,097
The 'Other' column includes the effect of reclassification of the non-current portion of interest-bearing loans and borrowings, including obligations under leases to current due to the passage of time, and the effect of accrued but not yet paid interest on interest-bear ing loans and borrowings. The Group classifies interest paid as cash flows from operating activities.
27. Provisions for LiabilitiesA provision has been recognised for decommissioning costs associated with wind farms and solar parks owned and operated by the Group. The value of the provision below wholly relates to the decommissioning provision. The decommissioning provision is based on MWh or number of turbines for the respective generating sites.
2020 2019
£000s £000s
1 January 1,294 1,446
Additions to provisions - -
Disposals - (174)
Charged to profit or loss 22 22
31 December 1,316 1,294
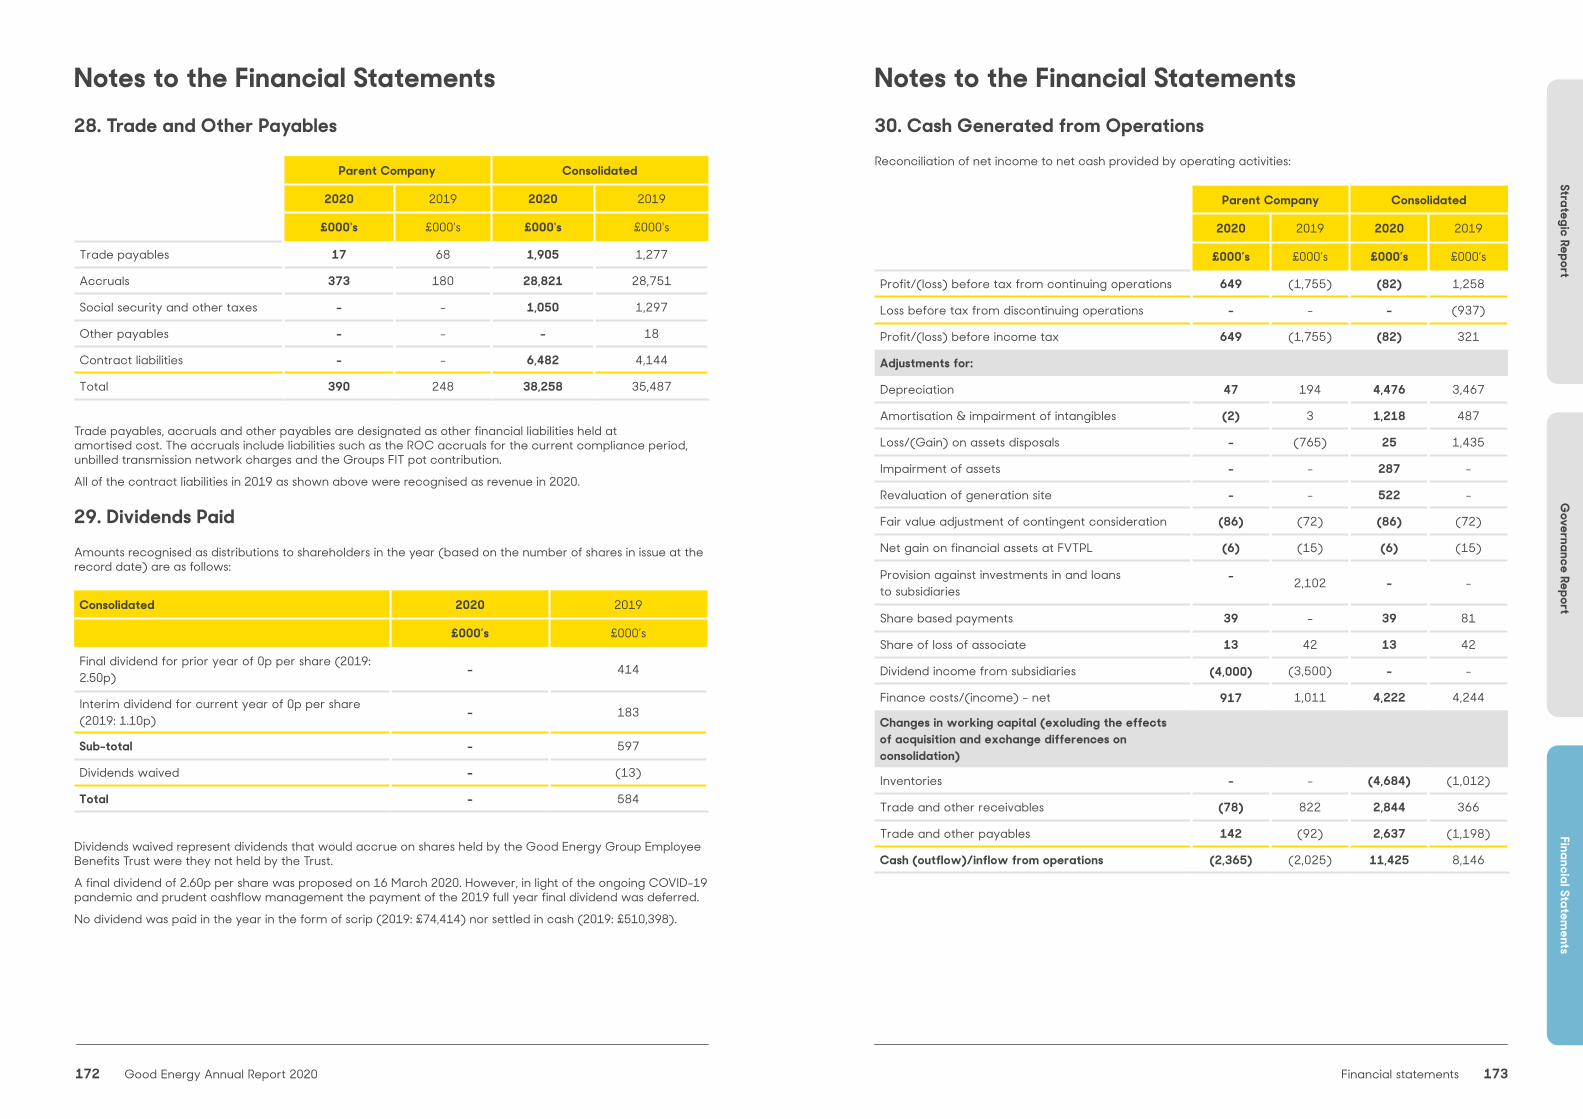
Strategic ReportG
overnance ReportFinancial Statem
ents
172 173Good Energy Annual Report 2020 Financial statements
Notes to the Financial Statements28. Trade and Other Payables
Parent Company Consolidated
2020 2019 2020 2019
£000's £000's £000's £000's
Trade payables 17 68 1,905 1,277
Accruals 373 180 28,821 28,751
Social security and other taxes - - 1,050 1,297
Other payables - - - 18
Contract liabilities - - 6,482 4,144
Total 390 248 38,258 35,487
Trade payables, accruals and other payables are designated as other financial liabilities held at amortised cost. The accruals include liabilities such as the ROC accruals for the current compliance period, unbilled transmission network charges and the Groups FIT pot contribution.
All of the contract liabilities in 2019 as shown above were recognised as revenue in 2020.
29. Dividends PaidAmounts recognised as distributions to shareholders in the year (based on the number of shares in issue at the record date) are as follows:
Consolidated 2020 2019
£000’s £000’s
Final dividend for prior year of 0p per share (2019: 2.50p) - 414
Interim dividend for current year of 0p per share (2019: 1.10p) - 183
Sub-total - 597
Dividends waived - (13)
Total - 584 Dividends waived represent dividends that would accrue on shares held by the Good Energy Group Employee Benefits Trust were they not held by the Trust.
A final dividend of 2.60p per share was proposed on 16 March 2020. However, in light of the ongoing COVID-19 pandemic and prudent cashflow management the payment of the 2019 full year final dividend was deferred.
No dividend was paid in the year in the form of scrip (2019: £74,414) nor settled in cash (2019: £510,398).
Notes to the Financial Statements30. Cash Generated from Operations Reconciliation of net income to net cash provided by operating activities:
Parent Company Consolidated
2020 2019 2020 2019
£000’s £000’s £000’s £000’s
Profit/(loss) before tax from continuing operations 649 (1,755) (82) 1,258
Loss before tax from discontinuing operations - - - (937)
Profit/(loss) before income tax 649 (1,755) (82) 321
Adjustments for:
Depreciation 47 194 4,476 3,467
Amortisation & impairment of intangibles (2) 3 1,218 487
Loss/(Gain) on assets disposals - (765) 25 1,435
Impairment of assets - - 287 -
Revaluation of generation site - - 522 -
Fair value adjustment of contingent consideration (86) (72) (86) (72)
Net gain on financial assets at FVTPL (6) (15) (6) (15)
Provision against investments in and loans to subsidiaries
- 2,102 - -
Share based payments 39 - 39 81
Share of loss of associate 13 42 13 42
Dividend income from subsidiaries (4,000) (3,500) - -
Finance costs/(income) - net 917 1,011 4,222 4,244
Changes in working capital (excluding the effects of acquisition and exchange differences on consolidation)
Inventories - - (4,684) (1,012)
Trade and other receivables (78) 822 2,844 366
Trade and other payables 142 (92) 2,637 (1,198)
Cash (outflow)/inflow from operations (2,365) (2,025) 11,425 8,146

Strategic ReportG
overnance ReportFinancial Statem
ents
174 175Good Energy Annual Report 2020 Financial statements
Notes to the Financial Statements31. Share-Based Payments In order to retain the services of key employees and to incentivise their performance, the Parent Company operates the Good Energy Employee Share Option Scheme under which certain employees of the Group are granted options to acquire Ordinary 5p shares at future dates. Costs in respect of these options of £39,000 (2019: £81,271) are recognised in the Consolidated Statement of Comprehensive Income. As at 31 December 2020, the following options had been issued:
Number of options Weighted averageexercise price
Total exerciseconsideration
2020 2019 2020 2019 2020 2019
(Number) (Number) (£) (£) £000’s £000’s
Outstanding at beginning of year 1,255,293 1,627,271 0.81 0.81 1,022 1,321
Granted - - - - - -
Exercised (46,822) (110,000) 0.68 1.11 (32) (122)
Cancelled/surrendered (580,462) (261,978) 0.97 0.67 (562) (177)
Outstanding at the end of year 628,009 1,255,293 0.68 0.81 428 1,022
In order to partially fulfil the options granted, 268,270 (2019: 293,270) shares representing approximately 43% (2019: 23%) of the options outstanding have already been issued and held by Clarke Willmott Trust Corporation Limited as the Trustee of the Good Energy Group Employee Benefits Trust. Dividends have been waived on these shares.
Notes to the Financial Statements31. Share-Based Payments (continued)The options expire at various dates up to November 2028. Share options outstanding at the end of the year have the following expiry date and exercise price:
Grant-vest Expiry year Exercise price in £ pershare options
Share options (thousands)
2020 2019
2012-2015 2025 0.50 - 189
2012-2015 2025 1.15 104 104
2013-2016 2026 1.25 144 169
2015-2017 2027 - - 22
2015-2017 2027 2.29 - 200
2015-2018 2028 2.25 50 50
2016-2019 2029 0.05 - 10
2017-2020 2030 0.05 - 87
2018-2021 2031 0.05 330 424
628 1,255
There were no share options granted in the current year. The right to exercise share options expires in line with contractual agreements between the group and the holder made at the grant date date, or varied by agreement with both the Group and the holder.
See note 10 for the total expense recognised in the Income Statement for share options granted to Directors and employees.
32. PensionsThe Group operates a defined contribution pension scheme. The assets of the scheme are held separately from those of the Group in an independently administered fund. The pension cost represents contributions payable by the Group to the fund and amounted to £485,000 (2019: £528,781).
Total contributions of £148,000 (2019: £41,250) were payable to the fund at the end of the financial year and are included in other payables.
The Group has no further pension liability either realised or contingent and in line with the Group’s environmental position all employer contributions are invested within a suitable fund.
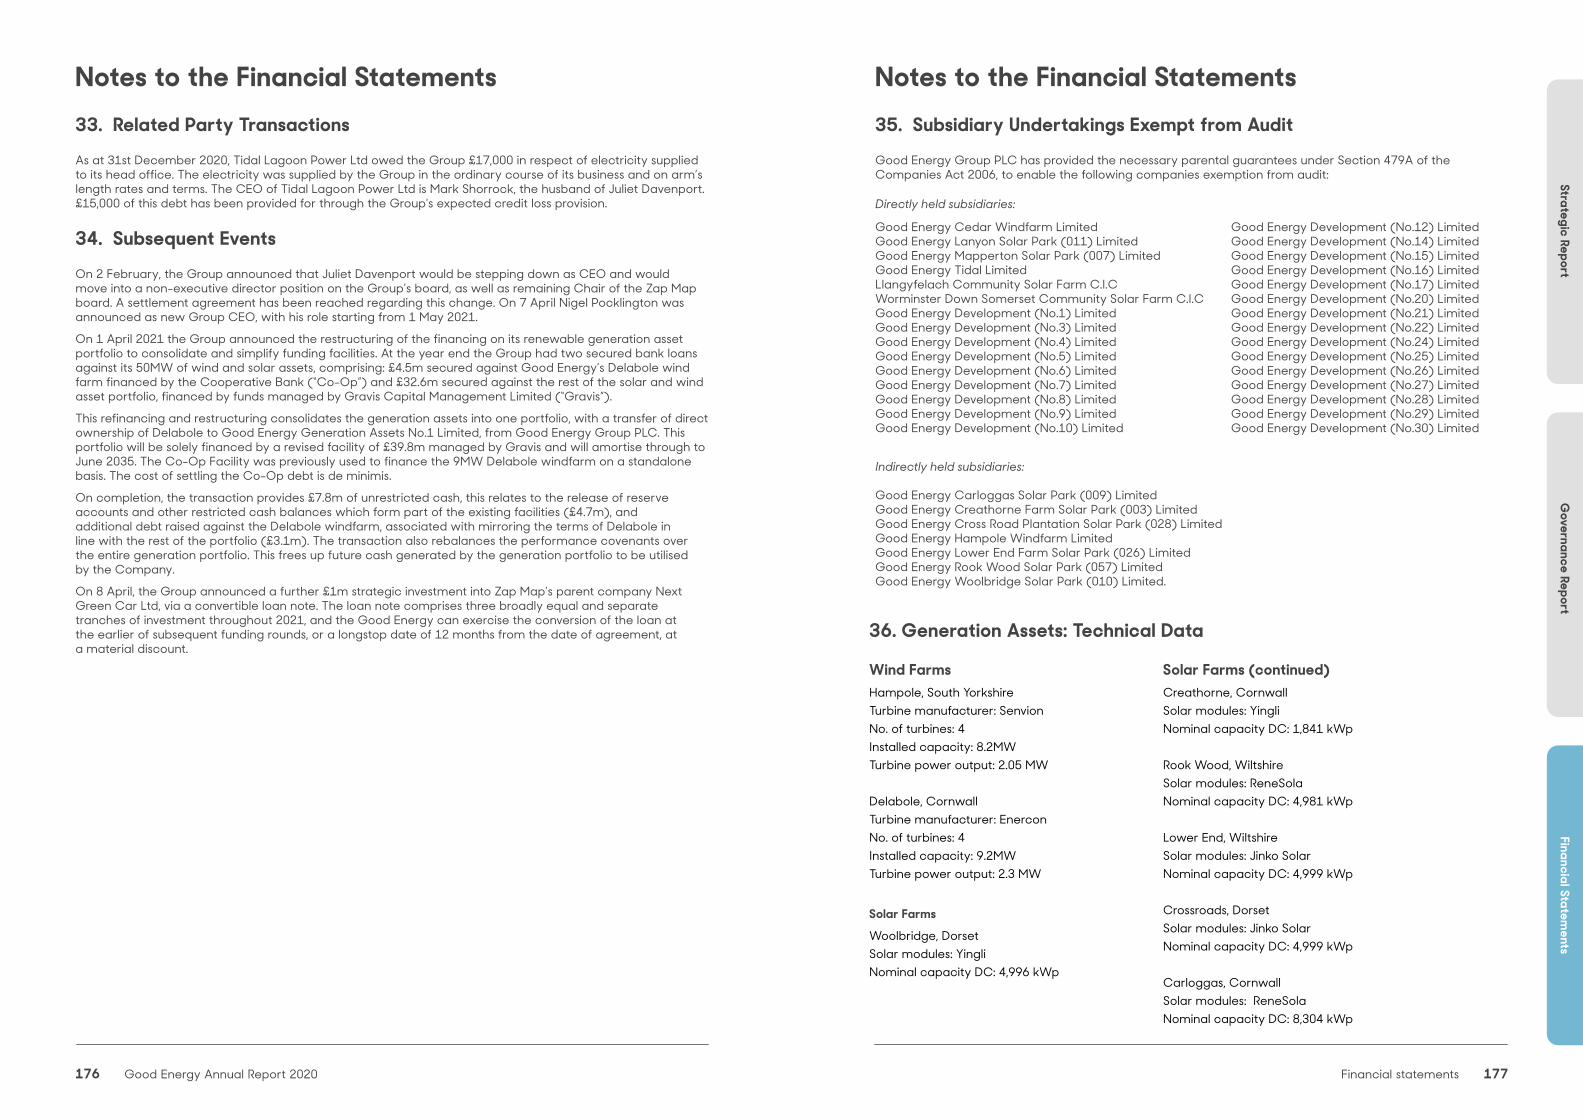
Strategic ReportG
overnance ReportFinancial Statem
ents
176 177Good Energy Annual Report 2020 Financial statements
Notes to the Financial Statements33. Related Party TransactionsAs at 31st December 2020, Tidal Lagoon Power Ltd owed the Group £17,000 in respect of electricity supplied to its head office. The electricity was supplied by the Group in the ordinary course of its business and on arm’s length rates and terms. The CEO of Tidal Lagoon Power Ltd is Mark Shorrock, the husband of Juliet Davenport. £15,000 of this debt has been provided for through the Group's expected credit loss provision.
34. Subsequent EventsOn 2 February, the Group announced that Juliet Davenport would be stepping down as CEO and would move into a non-executive director position on the Group’s board, as well as remaining Chair of the Zap Map board. A settlement agreement has been reached regarding this change. On 7 April Nigel Pocklington was announced as new Group CEO, with his role starting from 1 May 2021.
On 1 April 2021 the Group announced the restructuring of the financing on its renewable generation asset portfolio to consolidate and simplify funding facilities. At the year end the Group had two secured bank loans against its 50MW of wind and solar assets, comprising: £4.5m secured against Good Energy’s Delabole wind farm financed by the Cooperative Bank (“Co-Op”) and £32.6m secured against the rest of the solar and wind asset portfolio, financed by funds managed by Gravis Capital Management Limited (“Gravis”).
This refinancing and restructuring consolidates the generation assets into one portfolio, with a transfer of direct ownership of Delabole to Good Energy Generation Assets No.1 Limited, from Good Energy Group PLC. This portfolio will be solely financed by a revised facility of £39.8m managed by Gravis and will amortise through to June 2035. The Co-Op Facility was previously used to finance the 9MW Delabole windfarm on a standalone basis. The cost of settling the Co-Op debt is de minimis.
On completion, the transaction provides £7.8m of unrestricted cash, this relates to the release of reserve accounts and other restricted cash balances which form part of the existing facilities (£4.7m), and additional debt raised against the Delabole windfarm, associated with mirroring the terms of Delabole in line with the rest of the portfolio (£3.1m). The transaction also rebalances the performance covenants over the entire generation portfolio. This frees up future cash generated by the generation portfolio to be utilised by the Company.
On 8 April, the Group announced a further £1m strategic investment into Zap Map’s parent company Next Green Car Ltd, via a convertible loan note. The loan note comprises three broadly equal and separate tranches of investment throughout 2021, and the Good Energy can exercise the conversion of the loan at the earlier of subsequent funding rounds, or a longstop date of 12 months from the date of agreement, at a material discount.
Notes to the Financial Statements35. Subsidiary Undertakings Exempt from AuditGood Energy Group PLC has provided the necessary parental guarantees under Section 479A of the Companies Act 2006, to enable the following companies exemption from audit:
Directly held subsidiaries:
Indirectly held subsidiaries:
Good Energy Cedar Windfarm Limited Good Energy Lanyon Solar Park (011) Limited Good Energy Mapperton Solar Park (007) Limited Good Energy Tidal Limited Llangyfelach Community Solar Farm C.I.C Worminster Down Somerset Community Solar Farm C.I.C Good Energy Development (No.1) Limited Good Energy Development (No.3) Limited Good Energy Development (No.4) Limited Good Energy Development (No.5) Limited Good Energy Development (No.6) Limited Good Energy Development (No.7) Limited Good Energy Development (No.8) Limited Good Energy Development (No.9) Limited Good Energy Development (No.10) Limited
Good Energy Development (No.12) Limited Good Energy Development (No.14) Limited Good Energy Development (No.15) Limited Good Energy Development (No.16) Limited Good Energy Development (No.17) Limited Good Energy Development (No.20) Limited Good Energy Development (No.21) Limited Good Energy Development (No.22) Limited Good Energy Development (No.24) Limited Good Energy Development (No.25) Limited Good Energy Development (No.26) Limited Good Energy Development (No.27) Limited Good Energy Development (No.28) Limited Good Energy Development (No.29) Limited Good Energy Development (No.30) Limited
Wind FarmsHampole, South YorkshireTurbine manufacturer: SenvionNo. of turbines: 4Installed capacity: 8.2MWTurbine power output: 2.05 MW
Delabole, CornwallTurbine manufacturer: EnerconNo. of turbines: 4Installed capacity: 9.2MWTurbine power output: 2.3 MW
Solar Farms
Woolbridge, DorsetSolar modules: YingliNominal capacity DC: 4,996 kWp
Solar Farms (continued)Creathorne, CornwallSolar modules: YingliNominal capacity DC: 1,841 kWp
Rook Wood, WiltshireSolar modules: ReneSolaNominal capacity DC: 4,981 kWp
Lower End, WiltshireSolar modules: Jinko SolarNominal capacity DC: 4,999 kWp
Crossroads, DorsetSolar modules: Jinko SolarNominal capacity DC: 4,999 kWp
Carloggas, CornwallSolar modules: ReneSolaNominal capacity DC: 8,304 kWp
36. Generation Assets: Technical Data
Good Energy Carloggas Solar Park (009) Limited Good Energy Creathorne Farm Solar Park (003) Limited Good Energy Cross Road Plantation Solar Park (028) Limited Good Energy Hampole Windfarm Limited Good Energy Lower End Farm Solar Park (026) Limited Good Energy Rook Wood Solar Park (057) Limited Good Energy Woolbridge Solar Park (010) Limited.
178 Good Energy Annual Report 2020
Directors and Corporate ResourcesDirectorsWilliam Whitehorn (Non-Executive Chairman) Juliet Davenport (Chief Executive) Emma Tinker (Non-Executive Director) Timothy Jones (Non-Executive Director) Nemone Wynn-Evans (Non-Executive Director) Rupert Sanderson (Chief Financial Officer)
Company Secretary LDC NOMINEE SECRETARY LIMITED 70 Great Bridgewater Street Manchester M1 5ES
Company Number 04000623
Principal Place of Business and Registered OfficeMonkton Park Offices Monkton Park, Chippenham Wiltshire SN15 1GH
Independent Auditors EY The Paragon, 32 Counterslip Bristol BS1 6BX
Financial Advisors Investec Bank plc 30 Gresham Street London, EC2V 7QP
Canaccord Genuity Limited 88 Wood Street London, EC2V 7QR
Bankers Lloyds Bank 3rd Floor, 125 London Wall London, EC2Y 5AS
The Co-operative Bank PLC PO Box 101, 1 Balloon Street Manchester M60 4EP
Gravis Capital Partners LLP 24 Savile Row London, W1S 2ES
Legal Advisors Norton Rose LLP 3 More London, Riverside London, SE1 2AQ
RegistrarsComputershare Investor Services PLC The Pavilions, Bridgwater Road Bristol BS99 6ZY
180 Good Energy Annual Report 2020
Annual Report & Accounts 2020
Good Energy Group PLCMonkton Park OfficesMonkton ParkChippenhamSN15 1GH
goodenergygroup.co.uk