annual report - sunpower corporation
TRANSCRIPT

Corporate HeadquartersSunPower Corporation51 Rio Robles San Jose, California 95134408.240.5500
sunpower.com
©2020 SunPower Corporation. All Rights Reserved. SUNPOWER, the SUNPOWER logo, and all other trademarks cited herein are the property of SunPower Corporation in the U.S. and other countries as well.
Annual Report
Changing the Way Our World is Powered
Finding the right solar doesn’t have to be complicated. As we
celebrate our 35th anniversary, SunPower continues to help
homeowners and businesses across the globe reduce their
monthly electricity bills with the most efficient, powerful and
reliable panels available—all backed by our industry-leading
25-year warranty. It’s solar made simple.
Headquartered in Silicon Valley, SunPower has a team of
dedicated, customer-focused employees in Africa, Asia, Australia,
Europe, North and South America. For more information about
how SunPower is changing the way our world is powered, visit
www.sunpower.com.
Executive OfficersThomas WernerPresident, Chief Executive Officer and Chairman of the Board
Manavendra SialExecutive Vice President and Chief Financial Officer
Kenneth MahaffeyExecutive Vice President and General Counsel
Douglas RichardsExecutive Vice President, Administration
Jeffrey WatersChief Executive Officer, SunPower Technologies
Vichheka HeangCorporate Controller and Principal Accounting Officer
Board of DirectorsThomas WernerChairman of the Board
François BadoualDirector
Catherine LesjakDirector
Thomas McDanielDirector
Julien PougetDirector
Thomas RebeyrolDirector
Denis ToulouseDirector
Franck TrochetDirector
Patrick Wood IIIDirector

April 3, 2020
Dear Shareholder:
As SunPower marks its 35th year, I’ve been reflecting on how much in our sector has progressed – from solar technology, products, acceptance, penetration and job growth, to its contribution to the overall economy. With the price of solar power coming down, it is becoming more and more cost effective for consumers, businesses, and utilities to use in place of conventional sources of power. This means that end-user economics, rather than financial subsidies from the government, are increasingly driving solar power adoption. It’s been an impressive evolution of change. As we enter a new decade, the groundwork we laid in 2019 will allow SunPower to help define the next decade of solar.
During the past year, we simplified our financials and continued to operate as two business units, culminating in our announced plans to separate into two independent, industry-leading, publicly listed companies – SunPower and Maxeon Solar Technologies. We also had other significant accomplishments that included completing a successful capital raise to further de-lever our balance sheet, and we are seeing strong demand for our leading solar solutions.
A New Chapter and a $298 Million Equity Investment Our announcement to split SunPower into two solar-focused companies marked the beginning of a new chapter. SunPower will continue as the leading North American distributed generation, storage and energy services company, taking advantage of our strong dealer network, which represents the largest residential and commercial franchise in the industry. Its focus will be on product innovation, high efficiency solar systems plus high-growth storage and energy services. We’ll also continue our commitment to American manufacturing, operating our facility in Hillsboro, Ore.
To best maximize our outstanding R&D team, SunPower and Maxeon Solar will cooperate to develop and commercialize our next generation solar panel technologies with early stage research conducted by SunPower, and deployment-focused innovation and scale-up carried out by Maxeon Solar.
Jeff Waters, who joined us at the beginning of 2019 to lead our SunPower Technologies business unit, will be CEO of Maxeon Solar, the leading global technology innovator, manufacturer and marketer of premium solar panels. Maxeon Solar will be headquartered in Singapore, marketing its solar panels under the SunPower brand into the global solar power marketplace, and into the U.S. and Canada via a multi-year exclusive supply agreement to be entered into with SunPower at the time of separation. Maxeon Solar is well-positioned to expand on SunPower’s well-established market channels and increase international sales in some of the fastest-growing solar markets outside of North America.
A key component of this planned effort is that our long-time partner, Tianjin Zhonghuan Semiconductor Co., Ltd. (TZS), a premier global supplier of silicon wafers, has committed to make a $298 million equity investment in Maxeon Solar.
Significant Steps in Financial Transparency As we entered 2019, one of our core financial goals was to de-lever our balance sheet and improve the transparency of our financial statements for our investors. We also wanted to free up the resources to continue to invest in our key growth initiatives. I can confidently say, we accomplished these goals. For example, we made the strategic decision to exit non-core businesses, such as our micro-inverter business, while monetizing non-core assets including our power plant portfolio. As a result of this action, we significantly improved our balance sheet.

Our focused R&D investments went to further expand our technological leadership as we continued investment in our residential and commercial energy storage products, as well as our digital initiatives. We capped the year with a successful capital raise of more than $170 million. This enabled us to continue to invest in our growth opportunities while utilizing some of the proceeds to further pay down our company debt.
We remain committed to these goals this year.
Leading Solar Solutions We continued to see strong demand for our leading solar solutions around the globe, aided by new, innovative products. We expect the future of solar will see attach rates of storage increase dramatically. As with our solar, we expect to lead with this transition. We announced the next major advancement in our Equinox energy platform – Equinox Storage. This will give homeowners more resiliency from utility outages, grid uncertainty and peak energy rates. Beta testing began last year, and we anticipate starting customer installations in June. As the attach rates for storage increase, we will continue to provide software solutions that optimize the use of this stored energy.
We’re working on improving customer experience and lowering customer acquisition costs through our investment in software and machine learning technology. With our new Design Studio, millions of future solar homeowners can create custom solar designs instantly, seeing how their solar will look and modeling expected savings.
In the U.S., we also launched our next generation technology home solar panel, called A-Series, delivering 400 and 415 watts of power. A 400-watt product is also available in Europe and Australia, where it is called Maxeon 3. Both are designed to deliver 60 percent more energy in the same amount of roof space over the first 25 years compared to conventional solar.
We sell and install our solar panels and solar solutions through hundreds of dealers around the world. SunPower’s U.S. dealer network is second to none with nearly 700 independent commercial and residential dealers in 45 states. These small businesses average about 20 employees, contributing to local economies and representing more than 14,000 indirect jobs. Of these, there are 32 branded Master Dealers, who exclusively sell SunPower and represent about 45 percent of our business.
Globally, we have established downstream channels in more than 80 countries across six continents. In the Asia-Pacific region, we have 280 dealers in Australia and Japan; in the European Union, about 700 dealers sell SunPower in six countries.
In our Commercial and Industrial business segment, we had more than $500 million of projects awarded, our largest pipeline ever. Significant projects we announced last year included Chevron, Gap, Bed Bath and Beyond, many school districts and repeat customers, all showing confidence in what we can deliver. We saw growing demand for solar and storage for large-scale customers thanks to our Helix Storage solution, which delivers more value and reliable long-term savings. Current attach rates are 35 percent.
Expansion of Our Differentiated Proprietary Technology With each year, we continue to raise the bar on technology and manufacturing excellence and this year was no different. Following extensive research and development (R&D) work and testing at our Silicon Valley Research Facility – Maxeon 5, with 22.3 percent efficiency – saw volume production at our factory in Malaysia. TZS’ investment will allow Maxeon Solar to scale up production capacity.

Our Performance Series (P-Series), a front contact solar panel with uncompromising quality and unparalleled value, ramped production thanks to our long-established joint venture, Huansheng. This is a product that came about from a start-up acquisition that we made several years ago and further developed in our research facility.
We also now deliver P-Series to projects across America as our Hillsboro facility started production last year, only months after SunPower’s acquisition. It is now at full capacity and is fulfilling our commitment to U.S. manufacturing.
COVID-19 Pandemic As I write this letter, I want to address the ongoing COVID-19 pandemic, as it affects how our teams around the globe work and how we operate our company, including manufacturing, selling, installing and servicing. Our priority during this global pandemic has been to enhance our already stringent health and safety standards to protect our employees, customers and those in the communities we serve, while we thoughtfully manage market impacts. We’ve taken prudent measures to reduce costs and continue to evaluate further actions as needed. These actions, in addition to having the industry’s best technology and innovative product suite, will position SunPower well for when the solar industry returns to strong growth.
Well-Positioned for the Future To date, SunPower has installed 13.2 gigawatts of solar; the equivalent of powering nearly 7.5 million homes for one year. I couldn’t be prouder of this and our many other contributions that SunPower has made to the industry’s progress and mainstream acceptance. Our tenacious and dedicated workforce have worked hard to consistently design, manufacture, sell and install the best leading solar technology, solutions and products on the market today. And our focus remains on a commitment to our customers, who are at the heart of what we do.
Each of our planned companies – SunPower and Maxeon Solar – are well positioned for the future and we expect both companies to be well-capitalized post-separation. We appreciate your investment in us and together, we will change the way our world is powered.
Sincerely,
Thomas H. Werner Chief Executive Officer and Chairman of the Board SunPower
Forward-Looking Statements Some of the information we provide in this document contains forward-looking statements within the meaning of the Private Securities Litigation Reform Act of 1995. These forward-looking statements are based on our current assumptions, expectations and beliefs and involve substantial risks and uncertainties that may cause results, performance, or achievement to materially differ from those expressed or implied by these forward-looking statements. A detailed discussion of these factors and other risks that affect our business is included in filings we make with the Securities and Exchange Commission (SEC) from time to time, including our most recent reports on Form 10-K and Schedule 14A. All forward-looking statements in this document are based on information currently available to us, and we assume no obligation to update these forward-looking statements in light of new information or future events.

UNITED STATESSECURITIES AND EXCHANGE COMMISSION
Washington, D.C. 20549
FORM 10-K□ ANNUAL REPORT PURSUANT TO SECTION 13 OR 15(d) OF THE SECURITIES EXCHANGE ACT OF 1934
For the fiscal year ended December 29, 2019OR
□ TRANSITION REPORT PURSUANT TO SECTION 13 OR 15(d) OF THE SECURITIES EXCHANGE ACT OF 1934
For the transition period from toCommission file number 001-34166
SunPower Corporation(Exact Name of Registrant as Specified in Its Charter)
Delaware 94-3008969(State or Other Jurisdiction of Incorporation or Organization) (I.R.S. Employer Identification No.)
51 Rio RoblesSan Jose California 95134
(Address of Principal Executive Offices) (Zip Code)
(408) 240-5500(Registrant’s Telephone Number, Including Area Code)
Securities registered pursuant to Section 12(b) of the Act:
Title of each class Trading Symbol Name of each exchange on which registeredCommon Stock $0.001 par value SPWR Nasdaq Global Select Market
Securities registered pursuant to Section 12(g) of the Act: None
Indicate by check mark if the registrant is a well-known seasoned issuer, as defined in Rule 405 of the Securities Act. Yes □ No □
Indicate by check mark if the registrant is not required to file reports pursuant to Section 13 or Section 15(d) of the Act. Yes □ No □
Indicate by check mark whether the registrant (1) has filed all reports required to be filed by Sections 13 or 15(d) of the Securities ExchangeAct of 1934 during the preceding 12 months (or for such shorter period that the registrant was required to file such reports), and (2) has been subjectto such filing requirements for the past 90 days. Yes □ No □
Indicate by check mark whether the registrant has submitted electronically every Interactive Data File required to be submitted pursuant to Rule405 of Regulation S-T (§232.405 of this chapter) during the preceding 12 months (or for such shorter period that the registrant was required to submitsuch files). Yes □ No □
Indicate by check mark whether the registrant is a large accelerated filer, an accelerated filer, a non-accelerated filer, smaller reporting company,or an emerging growth company. See the definitions of ‘‘large accelerated filer,’’ ‘‘accelerated filer,’’ ‘‘smaller reporting company,’’ and ‘‘emerginggrowth company’’ in Rule 12b-2 of the Exchange Act.
Large accelerated filer □ Accelerated filer □
Emerging growth company □ Non-accelerated filer □
Smaller reporting company □
If an emerging growth company, indicate by check mark if the registrant has elected not to use the extended transition period for complying withany new or revised financial accounting standards provided pursuant to Section 13(a) of the Exchange Act. □
Indicate by check mark whether the registrant is a shell company (as defined in Rule 12b-2 of the Act). Yes □ No ☒
The aggregate market value of the voting stock held by non-affiliates of the registrant on June 30, 2019 (the last business day of the registrant’smost recently completed second fiscal quarter) was $670 million. Such aggregate market value was computed by reference to the closing price of thecommon stock as reported on the Nasdaq Global Select Market on June 30, 2019. For purposes of determining this amount only, the registrant hasdefined affiliates as including Total Solar INTL SAS, formerly known as Total Solar International SAS, Total Energies Nouvelles Activités USA andTotal Gas & Power USA, SAS and the executive officers and directors of the registrant on June 30, 2019.
The total number of outstanding shares of the registrant’s common stock as of February 7, 2020 was 168,394,511.
DOCUMENTS INCORPORATED BY REFERENCE
Parts of the registrant’s definitive proxy statement for the registrant’s 2020 annual meeting of stockholders are incorporated by reference in Items10, 11, 12, 13, and 14 of Part III of this Annual Report on Form 10-K.

TABLE OF CONTENTS
Page
Part I.
Item 1. Business . . . . . . . . . . . . . . . . . . . . . . . . . . . . . . . . . . . . . . . . . . . . . . . . . . . . . . . . . . . . . . . . . . . . 4
Item 1A. Risk Factors . . . . . . . . . . . . . . . . . . . . . . . . . . . . . . . . . . . . . . . . . . . . . . . . . . . . . . . . . . . . . . . 21
Item 1B. Unresolved Staff Comments . . . . . . . . . . . . . . . . . . . . . . . . . . . . . . . . . . . . . . . . . . . . . . . . . . . 57
Item 2. Properties . . . . . . . . . . . . . . . . . . . . . . . . . . . . . . . . . . . . . . . . . . . . . . . . . . . . . . . . . . . . . . . . . . . 57
Item 3. Legal Proceedings . . . . . . . . . . . . . . . . . . . . . . . . . . . . . . . . . . . . . . . . . . . . . . . . . . . . . . . . . . . . 58
Item 4. Mine Safety Disclosures . . . . . . . . . . . . . . . . . . . . . . . . . . . . . . . . . . . . . . . . . . . . . . . . . . . . . . . 58
Part II.
Item 5. Market for Registrant’s Common Equity, Related Stockholder Matters and Issuer
Purchases of Equity Securities . . . . . . . . . . . . . . . . . . . . . . . . . . . . . . . . . . . . . . . . . . . . . . . . . . . . . . . 59
Item 6. Selected Consolidated Financial Data. . . . . . . . . . . . . . . . . . . . . . . . . . . . . . . . . . . . . . . . . . . . . 60
Item 7. Management’s Discussion and Analysis of Financial Condition and Results of Operations. . 61
Item 7A. Quantitative and Qualitative Disclosure About Market Risk . . . . . . . . . . . . . . . . . . . . . . . . . 86
Item 8. Financial Statements and Supplementary Data . . . . . . . . . . . . . . . . . . . . . . . . . . . . . . . . . . . . . 88
Item 9. Changes in and Disagreements with Accountants on Accounting and Financial Disclosure. . 157
Item 9A. Controls and Procedures. . . . . . . . . . . . . . . . . . . . . . . . . . . . . . . . . . . . . . . . . . . . . . . . . . . . . . 157
Item 9B. Other Information . . . . . . . . . . . . . . . . . . . . . . . . . . . . . . . . . . . . . . . . . . . . . . . . . . . . . . . . . . . 157
Part III.
Item 10. Directors, Executive Officers and Corporate Governance . . . . . . . . . . . . . . . . . . . . . . . . . . . . 157
Item 11. Executive Compensation . . . . . . . . . . . . . . . . . . . . . . . . . . . . . . . . . . . . . . . . . . . . . . . . . . . . . . 158
Item 12. Security Ownership of Certain Beneficial Owners and Management and Related
Stockholder Matters . . . . . . . . . . . . . . . . . . . . . . . . . . . . . . . . . . . . . . . . . . . . . . . . . . . . . . . . . . . . . . . 158
Item 13. Certain Relationships and Related Transactions, and Director Independence . . . . . . . . . . . . 158
Item 14. Principal Accountant Fees and Services . . . . . . . . . . . . . . . . . . . . . . . . . . . . . . . . . . . . . . . . . . 158
Part IV.
Item 15. Exhibits, Financial Statement Schedules . . . . . . . . . . . . . . . . . . . . . . . . . . . . . . . . . . . . . . . . . 158
Signatures . . . . . . . . . . . . . . . . . . . . . . . . . . . . . . . . . . . . . . . . . . . . . . . . . . . . . . . . . . . . . . . . . . . . . . . . . . . . . . . 164
1

INTRODUCTORY NOTES
Trademarks
The following terms, among others, are our trademarks and may be used in this report: SunPower®, Maxeon®,
Oasis®, OasisGEO™, EnergyLink™, InvisiMount®, Tenesol®, Greenbotics®, Customer Cost of Energy™
(‘‘CCOE™’’), SunPower Spectrum™, Helix™, Equinox™, Signature™, SolarBridge®, and The Power of One™.
Other trademarks appearing in this report are the property of their respective owners.
Unit of Power
When referring to our solar power systems, our facilities’ manufacturing capacity, and total sales, the unit of
electricity in watts for kilowatts (‘‘KW’’), megawatts (‘‘MW’’), and gigawatts (‘‘GW’’) is direct current (‘‘DC’’),
unless otherwise noted as alternating current (‘‘AC’’).
Levelized Cost of Energy (‘‘LCOE’’)
LCOE is an evaluation of the life-cycle energy cost and life-cycle energy production of an energy producing
system. It allows alternative technologies to be compared to different scales of operation, investment or operating
time periods. It captures capital costs and ongoing system-related costs, along with the amount of electricity
produced, and converts them into a common metric. Key drivers for LCOE reduction for photovoltaic products
include panel efficiency, capacity factors, reliable system performance, and the life of the system.
Customer Cost of Energy (‘‘CCOE’’)
Our customers are focused on reducing their overall cost of energy by intelligently integrating solar and other
distributed generation, energy efficiency, energy management, and energy storage systems with their existing
utility-provided energy. The CCOE measurement is an evaluation of a customer’s overall cost of energy, taking into
account the cost impact of each individual generation source (including the utility), energy storage systems, and
energy management systems. The CCOE measurement includes capital costs and ongoing operating costs, along with
the amount of electricity produced, stored, saved, or re-sold, and converts all of these variables into a common metric.
The CCOE metric allows a customer to compare different portfolios of generation sources, energy storage, and
energy management, and to tailor towards optimization.
Cautionary Statement Regarding Forward-Looking Statements
This Annual Report on Form 10-K contains forward-looking statements within the meaning of the Private
Securities Litigation Reform Act of 1995. Forward-looking statements are statements that do not represent historical
facts and the assumptions underlying such statements. We use words such as ‘‘anticipate,’’ ‘‘believe,’’ ‘‘continue,’’
‘‘could,’’ ‘‘estimate,’’ ‘‘expect,’’ ‘‘intend,’’ ‘‘may,’’ ‘‘plan,’’ ‘‘predict,’’ ‘‘project,’’ ‘‘potential,’’ ‘‘will,’’ ‘‘would,’’
‘‘should,’’ and similar expressions to identify forward-looking statements. Forward-looking statements in this Annual
Report on Form 10-K include, but are not limited to, our plans and expectations regarding future financial results,
expected operating results, business strategies, the sufficiency of our cash and our liquidity, projected costs and cost
reduction measures, development of new products and improvements to our existing products, the impact of recently
adopted accounting pronouncements, our manufacturing capacity and manufacturing costs, the adequacy of our
agreements with our suppliers, our ability to monetize our solar projects, legislative actions and regulatory
compliance, competitive positions, management’s plans and objectives for future operations, our ability to obtain
financing, our ability to comply with debt covenants or cure any defaults, our ability to repay our obligations as they
come due, our ability to continue as a going concern, our ability to complete certain divestiture, spin-off or other
strategic transactions, trends in average selling prices, the success of our joint ventures and acquisitions, expected
capital expenditures, warranty matters, outcomes of litigation, our exposure to foreign exchange, interest and credit
risk, general business and economic conditions in our markets, industry trends, the impact of changes in government
incentives, expected restructuring charges, risks related to privacy and data security, and the likelihood of any
impairment of project assets, long-lived assets, and investments. These forward-looking statements are based on
information available to us as of the date of this Annual Report on Form 10-K and current expectations, forecasts
and assumptions and involve a number of risks and uncertainties that could cause actual results to differ materially
from those anticipated by these forward-looking statements. Such risks and uncertainties include a variety of factors,
some of which are beyond our control. Please see ‘‘Item 1A. Risk Factors’’ herein and our other filings with the
2

Securities and Exchange Commission (‘‘SEC’’) for additional information on risks and uncertainties that could cause
actual results to differ. These forward-looking statements should not be relied upon as representing our views as of
any subsequent date, and we are under no obligation to, and expressly disclaim any responsibility to, update or alter
our forward-looking statements, whether as a result of new information, future events or otherwise.
The following information should be read in conjunction with the Consolidated Financial Statements and the
accompanying Notes to Consolidated Financial Statements included in this Annual Report on Form 10-K. Our fiscal
year ends on the Sunday closest to the end of the applicable calendar year. All references to fiscal periods apply to
our fiscal quarter or year, which end on the Sunday closest to the calendar month end.
3

PART I
ITEM 1. BUSINESS
Corporate History
SunPower has been a leader in the solar industry for over 30 years, originally incorporated in California in 1985
and reincorporated in Delaware during 2004 in connection with our initial public offering. In November 2011, our
stockholders approved the reclassification of all outstanding former class A common stock and class B common stock
into a single class of common stock listed on the Nasdaq Global Select Market under the symbol ‘‘SPWR.’’ In fiscal
2011, we became a majority owned subsidiary of Total Solar INTL SAS, formerly known as Total Solar International
SAS, Total Gas & Power USA, SAS and Total Energies Nouvelles Activités USA (‘‘Total’’), a subsidiary of Total
S.A. (‘‘Total S.A.’’).
Company Overview
We are a leading global energy company dedicated to changing the way our world is powered. We deliver
complete solar solutions to residential, commercial, and power plant customers worldwide by offering:
• cutting-edge solar module technology and solar power systems that are designed to generate electricity over
a system life typically exceeding 25 years;
• integrated storage and software solutions that enable customers to effectively manage and optimize their
CCOE energy usage and expenses;
• installation, construction, and ongoing maintenance and monitoring services; and
• financing solutions that provide customers with a variety of options for purchasing or leasing high
efficiency solar products at competitive energy rates.
Our global reach is enhanced by Total S.A.’s long-standing presence in many countries where significant solar
installation goals are being established.
Recent Developments
Announcement of Separation Transaction
On November 11, 2019, we announced plans to separate into two independent, complementary, strategically
aligned and publicly-traded companies – SunPower and Maxeon Solar Technologies, Pte. Ltd. (‘‘Maxeon Solar’’).
Each company will focus on distinct offerings built on extensive experience across the solar value chain.
• SunPower will continue as the leading North American distributed generation, storage and energy services
company.
• Newly-formed Maxeon Solar will be the leading global technology innovator, manufacturer and marketer
of premium solar panels.
Concurrent with the transaction, an equity investment of $298 million will be made in Maxeon Solar by
long-time partner Tianjin Zhonghuan Semiconductor Co., Ltd. (‘‘TZS’’), a premier global supplier of silicon wafers,
to help finance the scale-up of A-Series (Maxeon 5) production capacity.
The separation is expected to occur through a spin-off (the ‘‘Spin-Off’’) and distribution of all of the shares of
Maxeon Solar held by SunPower to SunPower shareholders, followed by the TZS investment. The Spin-Off is
intended to be tax-free to SunPower stockholders. After the completion of the transactions, TZS will own
approximately 28.848% of the diluted ordinary shares of Maxeon Solar and approximately 71.152% will be owned
by SunPower shareholders, as of the record date of the spin-off. SunPower expects to complete the separation and
Maxeon Solar capital injection in the second quarter of fiscal 2020. The investment by TZS, and consequently, the
separation, is subject to certain conditions, including, among others, obtaining approvals from antitrust regulatory
authorities in the Peoples Republic of China, as well as execution of internal reorganization and separation tax plan
to impact to the tax-free nature of the transaction for federal income tax purposes and the effectiveness of a
Form 20-F filing with the SEC for Maxeon Solar.
In order to effect the Spin-Off, on November 8, 2019, we entered into a Separation and Distribution Agreement
(the ‘‘Separation and Distribution Agreement’’) with Maxeon Solar. The Separation and Distribution Agreement
4
governs the principal corporate transactions required to effect the separation and the Spin-Off distribution, and
provides for the allocation between SunPower and Maxeon Solar of the assets, liabilities, and obligations of the
respective companies as of the separation. In addition, the Separation and Distribution Agreement, together with
certain Ancillary Agreements (defined below), provide a framework for the relationship between SunPower and
Maxeon Solar subsequent to the completion of the Spin-Off.
Pursuant to the Separation and Distribution Agreement, consummation of the distribution is subject to certain
conditions being satisfied or waived by us or Maxeon Solar, including, among other things: (1) completion of the
transactions to complete the separation; (2) obtaining all necessary corporate approvals; (3) completion of all
necessary filings under the U.S. securities laws; (4) receipt by our Board of Directors of one or more opinions from
an independent valuation firm confirming the solvency and financial viability of each of us and Maxeon Solar
immediately after the consummation of the distribution in a form acceptable to us; (5) receipt of an opinion regarding
the qualification of the distribution as a transaction that is generally tax-free for U.S. federal income tax purposes
under Section 355 of the U.S. Internal Revenue Code to our stockholders; (6) if applicable, the receipt of a waiver
from the Singapore Securities Industry Council from the applicability of the Singapore Code on Take-overs and
Mergers to the distribution; (7) the absence of any legal impediments prohibiting the distribution; and (8) the
satisfaction or waiver of certain conditions precedent to the TZS investment set forth in the Investment Agreement
(as further described below).
Also on November 8, 2019, we entered into an Investment Agreement (the ‘‘Investment Agreement’’) with
Maxeon Solar, TZS, and, for the limited purposes set forth therein, Total, pursuant to which TZS will purchase from
Maxeon Solar ordinary shares that will, in the aggregate, represent approximately 28.848% of the outstanding
ordinary shares of Maxeon Solar on a fully diluted basis after giving effect to the Spin-Off for $298 million. Pursuant
to the Investment Agreement, we, Maxeon Solar, TZS and, with respect to certain provisions, Total have agreed to
certain customary representations, warranties and covenants, including certain representations and warranties as to
the financial statements, contracts, liabilities, and other attributes of Maxeon Solar, certain business conduct
restrictions and covenants requiring efforts to complete the transactions.
Pursuant to the Investment Agreement, consummation of the TZS investment is subject to certain conditions
being satisfied or waived by us or Maxeon Solar on the one hand, and TZS, on the other hand, including, among other
things: (1) the completion of the separation and the distribution in accordance with the Separation and Distribution
Agreement; (2) Maxeon Solar entering into definitive agreements for a term loan facility in an amount not less than
$325 million; (3) Maxeon Solar obtaining certain additional financing in the form of a revolving credit facility of not
less than $100 million or, alternatively, making certain working capital adjustment arrangements; (4) Maxeon Solar
having no more than $138 million in debt and no less than $50 million in Cash (as defined in the Investment
Agreement) immediately prior to the TZS investment; (5) execution of certain ancillary agreements and a
shareholders agreement; (6) receipt of required governmental approvals; (7) completion of all necessary filings under
the U.S. securities laws; (8) receipt by our Board of Directors of one or more opinions from an independent valuation
firm confirming the solvency and financial viability of each of us and Maxeon Solar immediately after the
consummation of the distribution in a form acceptable to us; (9) if applicable, the receipt of a waiver from the
Singapore Securities Industry Council from the applicability of the Singapore Code on Take-overs and Mergers to
the distribution and the investment; and (10) the absence of any legal impediments prohibiting the investment.
Moreover, the obligations of us and Maxeon Solar, on the one hand, and TZS, on the other hand, to consummate the
investment are subject to certain other conditions, including, among other things, (A) the accuracy of the other party’s
representations and warranties (subject to certain materiality qualifiers) and (B) the other party’s performance of its
agreements and covenants contained in the investment Agreement in all material respects. In addition, the obligation
of TZS to consummate the investment is subject to the absence of any Material Adverse Effect (as defined in the
Investment Agreement) on Maxeon Solar occurring from the date of the Investment Agreement through the closing
of the Investment, subject, in each case, to certain exclusions set forth in the Investment Agreement.
The Investment Agreement provides certain termination rights for each of us and TZS, and further provides that,
if the Investment Agreement is terminated, a termination fee may be payable under specified circumstances,
including: (1) if we terminate to accept a superior proposal (as described in the Investment Agreement), a fee of
$80 million payable by us to TZS; (2) if our Board of Directors recommends an alternative transaction that would
constitute a sale of us and TZS terminates the Investment Agreement, a fee of $80 million payable by us to TZS;
(3) if, as a result of an intentional breach by us or Maxeon Solar of our respective representations, warranties or
covenants and, as a result, either (a) the transactions are not capable of being satisfied by August 8, 2020 (or such
5

other extended date as contemplated under the Investment Agreement) (the ‘‘Outside Date’’), (b) any final,
non-appealable government order prohibiting the transactions has been issued, or (c) the closing conditions related
to representations, warranties and covenants of us and Maxeon Solar are not capable of being satisfied, then a fee
of $20 million payable by us to TZS; (4) if certain approvals by the Chinese government are not obtained, then a fee
of $35 million payable by TZS to us; or (5) if, as a result of an intentional breach by TZS of its representations,
warranties or covenants and, as a result, either (a) the transactions are not capable of being satisfied by the Outside
Date, (b) any final, non-appealable government order prohibiting the transactions has been issued, or (c) the closing
conditions related to representations, warranties and covenants of TZS are not capable of being satisfied, then a fee
of $35 million payable by TZS to us. In addition, under the Investment Agreement, in the event that, within seven
months after termination of the Investment Agreement because the TZS investment could not be completed by the
Outside Date, (1) we enter into an agreement for or consummate an alternative transaction that would constitute a
sale of our company, and prior to the termination of the Investment Agreement a third party had submitted a proposal
for a transaction that would constitute a sale of us, then we are obligated to pay TZS a fee of $80 million, or (2) we
(a) enter into an agreement for or consummate an alternative transaction that constitutes a sale of (i) 50% or more
of Maxeon Solar’s equity or assets or (ii) 50% or more of the business being contributed to Maxeon Solar in the
separation and (b) prior to the termination of the Investment Agreement a third party had submitted a proposal for
an alternative transaction that constitutes a sale of (i) 50% or more of Maxeon Solar’s equity or assets or (ii) 50%
or more of the business being contributed to Maxeon Solar in the separation, then we are obligated to pay TZS a fee
of $20 million.
The Separation and Distribution Agreement and Investment Agreement contemplate certain additional
agreements be entered into between us, Maxeon Solar and other parties in connection with the Spin-Off and related
investment by TZS, including a tax matters agreement, employee matters agreement, transition services agreement,
brand framework agreement, cross license agreement, collaboration agreement and supply agreement (collectively,
the ‘‘Ancillary Agreements’’), each as we previously noted in our announcement of the contemplated transaction.
We expect to incur total costs associated with the separation activities of $57.6 million through the completion
of the separation. Furthermore, we have also concluded on the legal form of the separation and determined that
Maxeon Solar will be the spinnee in the U.S. Accordingly, during the first half of fiscal 2020, we expect to effect
certain internal reorganizations of, and transactions among, our wholly owned subsidiaries and operating activities
in preparation for the legal form of separation.
Common Stock Offering
On November 25, 2019, we completed an offering of 25,300,000 shares of our common stock at a price of
$7.0 per share, which included 3,300,000 shares issued and sold pursuant to the underwriter’s exercise in full of its
option to purchase additional shares, for gross proceeds of $177.1 million. We received net proceeds of
$171.8 million from the offering, after deducting underwriter discounts which were recorded as a reduction of
Additional Paid In Capital (‘‘APIC’’). We incurred other expenses of $1.1 million for the transaction which was
recorded in APIC. We intend to use the net proceeds from the offering for general corporate purposes, including
partially funding the repayment of our senior convertible debentures. Refer to ‘‘Item 8. Financial Statements and
Supplementary Data—Notes to Consolidated Financial Statements— Note 18. Subsequent Events’’ for further details.
Financing for Safe Harbor Panels Inventory
In September 2019, we entered into the Solar Sail LLC (‘‘Solar Sail’’) and Solar Sail Commercial Holdings,
LLC (‘‘Solar Sail Commercial’’) joint ventures with Hannon Armstrong Sustainable Infrastructure Capital, Inc.
(‘‘Hannon Armstrong’’), to finance the purchase of 200 megawatts of panel inventory, in accordance with IRS safe
harbor guidance, to preserve the 30% federal Investment Tax Credit (‘‘ITC’’) for third-party owned commercial and
residential systems. As of December 29, 2019, we had $100.6 million borrowed and outstanding under this
agreement. We have the ability to draw up to $112.8 million under this agreement as of December 29, 2019. A portion
of the value of the safe harbored panels was funded by equity contributions in the joint venture of $6.0 million each
by us and Hannon Armstrong.
The ITC for systems placed into service in 2020 is 26%, and will step down to 22% in 2021 and then remain
at 10%for commercial customers and zero for residential customers in 2022 and beyond. The safe harbor facility is
expected to preserve 30% ITC value for projects placed in service from now through mid-2022, based on forecasted
deployment of the panels.
6

Sale and Leaseback of Hillsboro Facility
In September 2019, we completed the sale of our manufacturing facility buildings in Hillsboro, Oregon, to
RagingWire Data Centers, Inc., through its affiliate for a purchase price of $63.5 million (the ‘‘Sale-Leaseback
Transaction’’). In connection with the Sale-Leaseback Transaction, we also entered into a lease agreement to lease
back a portion of the facility, consisting of the module assembly building for three years. Further, we agreed to
complete the decommissioning of certain equipment and structures in the buildings, which was completed in the
fourth quarter of fiscal 2019.
Net cash consideration of $39.7 million was received at the closing, net of fees and expenses of $3.8 million,
and a holdback amount of $20.0 million for timely completion of decommissioning services. The holdback amount
of $20.0 million was received by us in the fourth quarter of fiscal 2019, as the related decommissioning services were
completed.
In connection with the sale transaction, we recognized a total gain of $25.2 million, which is included within
‘‘Cost of revenue’’ in our consolidated statements of operations for fiscal 2019. As of December 29, 2019, we have
a deferred gain of $3.8 million that represents the excess of fair market value of the building leased back to be
recognized over the leaseback term of three years.
For additional information, refer to ‘‘Item 8. Financial Statements and Supplementary Data—Notes to
Consolidated Financial Statements—Note 4. Business Divestitures and Sale of Assets.’’
Sale of Residential Lease Assets
In fiscal 2018, we created SunStrong Capital Holdings, LLC (‘‘SunStrong’’) to own and operate a portion of our
residential lease assets (‘‘Residential Lease Portfolio’’), and subsequently contributed to SunStrong our controlling
equity interests in a number of solar project entities that we controlled. As previously disclosed, on November 5,
2018, we entered into a Purchase and Sale Agreement (the ‘‘PSA’’) with HA SunStrong Capital LLC (‘‘HA SunStrong
Parent’’), a subsidiary of Hannon Armstrong, to sell 49.0% of the SunStrong membership interests. Following the
closing of the PSA, we do not have the power to unilaterally make decisions that affect the performance of
SunStrong, and accordingly, we deconsolidated SunStrong, thereby deconsolidating majority of our residential lease
assets portfolio.
On September 27, 2019, we sold the remainder of the residential lease assets still owned by us, that were not
previously sold. These residential lease assets were sold under a new assignment of interest agreement entered into
with SunStrong. SunStrong also assumed debts related to the residential lease assets sold. We recognized a net loss
of $7.2 million on this sale within ‘‘Loss on sale and impairment of residential lease assets’’ on our consolidated
statements of operations for fiscal 2019.
For additional information, refer ‘‘Item 8. Financial Statements and Supplementary Data—Notes to
Consolidated Financial Statements—Note 4. Business Divestitures and Sale of Assets.’’
Sale of Commercial Sale-Leaseback Portfolio
On March 26, 2019, we entered into a Membership Interest Purchase and Sale Agreement (the ‘‘Purchase and
Sale Agreement’’) with a wholly-owned subsidiary of Goldman Sachs Renewable Power LLC. Pursuant to the
Purchase and Sale Agreement, we agreed to sell, in exchange for cash consideration of up to $86.9 million, leasehold
interests in operating solar photovoltaic electric generating projects (the ‘‘Projects’’) subject to sale-leaseback
financing arrangements with one or more financiers (each a ‘‘Lessor’’). The Projects are located at approximately
200 sites across the United States, and represent in aggregate, approximately 233 MW of generating capacity.
The portfolio of Projects financed by each Lessor represents a separate asset (a ‘‘Portfolio’’) for which the price is
separately agreed and stated in the Purchase and Sale Agreement. Upon the sale of the applicable membership
interests, the related assets have been deconsolidated from our balance sheet.
In connection with the sale transaction, we received aggregate consideration of $81.3 million and recognized a
total gain of $143.4 million, which is included within ‘‘Gain on business divestiture’’ in our consolidated statements
of operations for fiscal 2019.
For additional information, refer ‘‘Item 8. Financial Statements and Supplementary Data—Notes to
Consolidated Financial Statements—Note 4. Business Divestitures and Sale of Assets.’’
7

Segments Overview
Consistent with fiscal 2018, our segment reporting consists of our upstream and downstream structures. Under
this segmentation, the SunPower Energy Services Segment (‘‘SunPower Energy Services’’ or ‘‘Downstream’’) refers
to sales of solar energy solutions in the North America region previously included in the legacy Residential Segment
and Commercial Segment (collectively previously referred to as ‘‘Distributed Generation’’ or ‘‘DG’’) including direct
sales of turn-key engineering, procurement and construction (‘‘EPC’’) services, sales to our third-party dealer
network, sales of energy under power purchase agreements (‘‘PPAs’’), storage solutions, cash sales and long-term
leases directly to end customers, and sales to resellers. SunPower Energy Services Segment also includes sales of our
global Operations and Maintenance (‘‘O&M’’) services. The SunPower Technologies Segment (‘‘SunPower
Technologies’’ or ‘‘Upstream’’) refers to our technology development, worldwide solar panel manufacturing
operations, equipment supply to resellers, commercial and residential end-customers outside of North America
(‘‘International DG’’), and worldwide power plant project development and project sales.
Our Chief Executive Officer, as the chief operating decision maker (‘‘CODM’’), reviews our business, manages
resource allocations and measures performance of our activities based on financial information for the SunPower
Energy Services Segment and SunPower Technologies Segment.
SunPower Energy Services
North America Residential Channels
Residential Systems
We offer a complete set of residential solutions that deliver value to homeowners and our dealer partners.
We have developed the capability to deliver AC panels with factory-integrated microinverters. The AC system
architecture, as compared with DC systems, facilitates direct panel installation, eliminating the need to mount or
assemble additional components on the roof or the side of a building, driving down system costs, improving overall
system reliability, and providing improved, cleaner design aesthetics. As part of our complete solution approach, we
offer our Equinox residential market product, a fully-integrated solar platform utilizing Maxeon cells, AC
microinverter, and EnergyLink monitoring hardware to combine solar power production and energy management,
allowing residential installers to quickly and easily complete their system installations and to ensure always-on
connectivity so homeowners can easily access their data anytime, anywhere. The Equinox platform is also sold with
our EnergyLink software analytics, which provides our customers with detailed information about their energy
consumption and production, enabling them to further reduce their energy costs.
Concurrent with the sale of certain assets and intellectual property related to the production of microinverters
to Enphase on August 9, 2018, we entered into a Master Supply Agreement (the ‘‘MSA’’) pursuant to which, with
certain exceptions, we have agreed to exclusively procure module-level power electronics (‘‘MLPE’’) and AC cables
from Enphase to meet all of our needs for MLPE and AC cables for the manufacture and distribution of AC modules
and discrete MLPE system solutions for the U.S. residential market, including our current Equinox solution and any
AC module-based successor products. We have also agreed not to pair any third-party MLPE or AC cables with any
of our modules for use in the grid-tied U.S. residential market where an Enphase MLPE is qualified and certified for
such module. The initial term of the MSA is through December 31, 2023, and the MSA term will automatically be
extended for successive two-year periods unless either party provides written notice of non-renewal.
We offer the SunPower InvisiMount residential mounting system in our product portfolio. The InvisiMount
system is designed specifically for use with our panels and reduces installation time through pre-assembled parts and
integrated grounding. The InvisiMount system is well-suited for residential sloped roof applications and provides
design flexibility and enhanced aesthetics by delivering a unique, ‘‘floating’’ appearance.
We support our hardware development with investments in our proprietary set of advanced monitoring
applications (the ‘‘SunPower Monitoring System’’) and our EnergyLink customer portal, which enable customers to
gain visibility into their solar system production and household energy consumption. This software is available for
use on the web or through the SunPower mobile application on smartphones and tablets.
Residential Sales Channels, Residential Leasing Program, and other Financing Options
We sell our residential solar energy solutions to end customers through a variety of means, including cash sales
directly to end customers, sales to resellers, including our third-party dealer network, and sales of our operations and
maintenance (‘‘O&M’’) services.
8

We offer financing programs that are designed to offer customers a variety of options to obtain high efficiency
solar products and systems, including loans arranged through our third-party lending partners, in some cases for no
money down, or by leasing high efficiency solar systems at competitive energy rates. Since its launch in 2011, our
residential lease program, in partnership with third-party investors, provides U.S. customers SunPower systems under
20-year lease agreements that include system maintenance and warranty coverage, including warranties on system
performance. SunPower residential lease customers have the option to purchase their leased solar systems upon the
sale or transfer of their home. These financing options enhance our ability to provide individually-tailored solar
solutions to a broad range of residential customers.
As part of our strategic goals to de-lever our balance sheet and simplify our financial statements, we announced
during the fourth quarter of 2017 our decision to monetize our interest in more than 400 MW of residential lease
assets that historically have been consolidated in our balance sheets. On November 5, 2018, we sold a portion of our
interest in certain entities that have historically held the assets and liabilities comprising our residential lease business
to an affiliate of Hannon Armstrong. On September 27, 2019, we sold the majority of the remainder of our residential
lease assets.
Commercial Sales Channels and Financing Options
We sell our commercial solar energy solutions to commercial and public entity end customers through sales to
our third-party dealer network.
For additional information, refer to ‘‘Item 8. Financial Statements and Supplementary Data—Notes to
Consolidated Financial Statements—Note 4. Business Divestitures and Sale of Assets, Note 7. Solar Services,
Note 10. Equity Investments, and Note 11. Debt and Credit Sources.’’
North America Commercial Direct
Commercial Roof, Carport, and Ground Mounted Systems
As part of our complete solution product approach, we offer our Helix commercial market product. The Helix
system is a pre-engineered, modular solution that combines our industry-leading solar module technology with
integrated plug-and-play power stations, cable management systems, and mounting hardware that is built to last and
fast to install, enabling customers to scale their solar programs quickly with minimal business disruption. The Helix
platform is standardized across rooftop, carport, and ground installations and designed to lower system cost while
improving performance. The Helix platform is also bundled with our Smart Energy software analytics, which
provides our customers with information about their energy consumption and production, enabling them to further
reduce their energy costs.
We also offer a variety of commercial solutions designed to address a wide range of site requirements for
commercial rooftop, parking lot, and open space applications, including a portfolio of solutions utilizing framed
panels and a variety of internally or externally developed mounting methods for flat roof and high tilt roof
applications. Our commercial flat rooftop systems are designed to be lightweight and to interlock, enhancing wind
resistance and providing for secure, rapid installations.
We offer parking lot structures designed specifically for SunPower panels, balance of system components, and
inverters and in fiscal 2015 expanded our capability to design and install innovative solar structures and systems for
carport applications. These systems are typically custom design-build projects that utilize standard templates and
design best practices to create a solution tailored to unique site conditions. SunPower’s highest efficiency panels are
especially well suited to stand-alone structures, such as those found in parking lot applications, because our systems
require less steel and other materials per unit of power or energy produced as compared with our competitors.
Sales Channels and Financing Options
We sell our commercial solar energy solutions to commercial and public entity end customers through a variety
of means, including direct sales of turn-key engineering, procurement and construction (‘‘EPC’’) services, selling
energy to customers under power purchase agreements (‘‘PPAs’’), and sales of our O&M services.
Operations & Maintenance
Our solar power systems are designed to generate electricity over a system life typically exceeding 25 years.
We offer our customers various levels of post-installation O&M services with the objective of optimizing our
customers’ electrical energy production over the life of the system. The terms and conditions of post-installation
9

O&M services may provide for remote monitoring of system production and performance, including providing
performance reports, preventative maintenance, including solar module cleanings, corrective maintenance, and
rapid-response outage restoration, including repair or replacement of all system components covered under warranty
or major maintenance agreements.
We incorporate leading information technology platforms to facilitate the management of our solar power
systems operating globally. Real-time flow of data from our customers’ sites is aggregated centrally where an engine
applies advanced solar specific algorithms to detect and report potential performance issues. Our work management
system routes any anomalies to the appropriate responders to help ensure timely resolution. Our performance model,
PVSim, was developed over the last 21 years and has been audited by independent engineers. Solar panel
performance coefficients are established through independent third-party testing. The SunPower Monitoring System
also provides customers real-time performance status of their solar power system, with access to historical or daily
system performance data through our customer website (www.sunpowermonitor.com). The SunPower Monitoring
System is available through applications on Apple® and Android™ devices. Some customers choose to install
‘‘digital signs’’ or kiosks to display system performance information from the lobby of their facility. We believe these
displays enhance our brand and educate the public and prospective customers about solar power.
We typically provide a system output performance warranty, separate from our standard solar panel product
warranty, to customers that have subscribed to our post-installation O&M services. In connection with system output
performance warranties, we agree to pay liquidated damages in the event the system does not perform to the stated
specifications, with certain exclusions. The warranty excludes system output shortfalls attributable to force majeure
events, customer curtailment, irregular weather, and other similar factors. In the event that the system output falls
below the warrantied performance level during the applicable warranty period, and provided that the shortfall is not
caused by a factor that is excluded from the performance warranty, the warranty provides that SunPower will pay the
customer an amount based on the value of the shortfall of energy produced relative to the applicable warrantied
performance level. For leased systems, we provide a system output performance warranty with similar terms and
conditions as that for non-leased systems.
We calculate our expectation of system output performance based on a particular system’s design specifications,
including the type of panels used, the type of inverters used, site irradiation measures derived from historical weather
data, our historical experience as a manufacturer, EPC services provider, and project developer as well as other
unique design considerations such as system shading. The warrantied system output performance level varies by
system depending on the characteristics of the system and the negotiated agreement with the customer, and the level
declines over time to account for the expected degradation of the system. Actual system output is typically measured
annually for purposes of determining whether warrantied performance levels have been met.
Our primary remedy for the system output performance warranty is our ongoing O&M services which enable
us to quickly identify and remediate potential issues before they have a significant impact on system performance.
We also have remedies in the form of our standard product warranties and third-party original equipment
manufacturer warranties that cover certain components, such as inverters, to prevent potential losses under our system
output performance warranties or to minimize further losses.
In September 2019, we signed a definitive agreement to sell our O&M business. We expect to complete the sale
of our O&M business during the first half of fiscal 2020 subject to the satisfaction of customary conditions precedent,
including receipt of certain third-party consents and approvals.
Technology
Balance of System Components
‘‘Balance of system components’’ are components of a solar power system other than the solar panels, and
include mounting structures, charge controllers, grid interconnection equipment, and other devices, depending on the
specific requirements of a particular system and project.
Inverters
Every solar power system needs an inverter to transform the direct current electricity collected from the solar
panels into utility-grade AC power that is ready for use. We sell inverters manufactured by third parties, some of
which are SunPower-branded. We also have integrated microinverter technology that converts DC generated by a
single solar photovoltaic panel into AC directly on the panel. Subsequent to the sale of our microinverter business
10

in August 2018, we exclusively procure microinverters for the manufacture and distribution of AC modules and
discrete MLPE system solutions for the U.S. residential market from Enphase. Panels with these factory-integrated
microinverters perform better in shaded applications compared to conventional string inverters and allow for
optimization and monitoring at the solar panel level, enabling maximum energy production by the solar system.
Smart Energy
We see ‘‘Smart Energy’’ as a way to harness our world’s energy potential by connecting the most powerful and
reliable solar systems on the market with an increasingly vast array of actionable data that can help our customers
make smarter decisions about their energy use. Our Smart Energy initiative is designed to add layers of intelligent
control to homes, buildings and grids—all personalized through easy-to-use customer interfaces. In order to enhance
the portfolio of Smart Energy solutions we offer, we continue to invest in integrated technology solutions to help
customers manage and optimize their CCOE measurement.
We have also negotiated several agreements with residential and commercial energy storage providers to
integrate storage technology into our residential and commercial solar solutions. By combining storage with energy
management, we lower our customers’ cost of energy through improvements in self-consumption, rate arbitrage,
demand management, and grid and market participation. We continue to work to make combined solar and storage
solutions broadly commercially available.
We continue to work with Enphase to develop next generation microinverters for use with our high efficiency
solar panels in order to enhance our portfolio of Smart Energy solutions. Panels with these factory-integrated
microinverters can convert direct current generated by the solar panel into alternating current, enabling optimization
and monitoring at the solar panel level to ensure maximum energy production by the solar system.
SunPower Technologies
Our SunPower Technologies Segment refers to our technology development, worldwide solar panel
manufacturing operations, equipment supply to resellers, commercial and residential end-customers outside of North
America (‘‘International DG’’), and worldwide power plant project development and project sales.
As part of our separation transaction announced on November 11, 2019, we formed Maxeon Solar in the third
quarter of 2019 in Singapore to serve as the holding company of businesses to be contributed to Maxeon Solar by
SunPower in connection with a spin-off of the following businesses that are currently held by SunPower (collectively,
the ‘‘Maxeon Business’’):
• SunPower’s non-U.S. manufacturing business, including solar cell and module manufacturing facilities
located in France, Malaysia, Mexico and the Philippines;
• SunPower’s international sales and distribution business outside of the 50 U.S. states, the District of
Columbia and Canada;
• a 20% interest in Huansheng Photovoltaic (Jiangsu) Co., Ltd. (formerly known as Dongfang Huansheng
Photovoltaic (Jiangsu) Co., Ltd.) (‘‘Huansheng’’), a joint venture to manufacture Performance solar panels
(the ‘‘Performance Line’’ or ‘‘P-Series’’) in China;
• an 80% interest in SunPower Systems International Limited, an international sales company based in Hong
Kong;
• a 25% interest in Huaxia CPV Power Co. Ltd., a joint venture to manufacture and deploy low-concentration
photovoltaic concentrator technology in Inner Mongolia and other regions in China; and
• a 3.7% interest in Deca Technologies Inc. (‘‘Deca Tech’’), a privately held wafer-level interconnect foundry
business with headquarters in Tempe, Arizona and manufacturing in the Philippines.
Our Products
Our primary products are the Maxeon Line of interdigitated back contact (‘‘IBC’’) solar cells and panels, and
the Performance Line (P-Series) of shingled solar cells and panels. We believe the Maxeon Line of solar panels are
the highest-efficiency solar panels on the market with an aesthetically pleasing design, and the Performance Line of
11

solar panels offer a high-value, cost-effective solution for applications compared to conventional solar panels.
The Maxeon Line, which includes E-Series (Maxeon 2), X-Series (Maxeon 3) and A-Series (Maxeon 5) solar panels,
is primarily targeted at residential and commercial customers across the globe. The Performance Line is primarily
targeted at the utility-scale power plant market.
Solar panels are made using solar cells electrically connected together and encapsulated in a weatherproof panel.
Solar cells are semiconductor devices that convert sunlight into direct current electricity. Our solar cells are designed
without highly reflective metal contact grids or current collection ribbons on the front of the solar cell, which
provides additional efficiency and allows our solar cells to be assembled into solar panels with a more uniform
appearance. Our X-Series (Maxeon 3) solar panels, made with our X-Series (Maxeon 3) solar cells, have
demonstrated panel efficiencies exceeding 22% in high-volume production. In fiscal 2016, one of our standard
production modules set a world record for aperture area efficiency as tested by the National Renewable Energy
Laboratory. We believe our X-Series (Maxeon 3) solar panels are the highest efficiency solar panels available for the
mass market, incorporating Gen 3 solar cells with average efficiency of over 25%. Because our solar cells are more
efficient relative to conventional solar cells, when our solar cells are assembled into panels, the assembly cost per
watt is less because more power is incorporated into a given size panel. Higher solar panel efficiency allows installers
to mount a solar power system with more power within a given roof or site area and can reduce per watt installation
costs. Our suite of solar panels provides customers a variety of features to fit their needs, including the SunPower
Signature black design which allows the panels to blend seamlessly into the rooftop. Both our X-Series (Maxeon 3)
and E-Series (Maxeon 2) panels have proven performance with low levels of degradation, as validated by third-party
performance tests. Our latest technology, or A-Series (Maxeon 5), offers solar cell efficiency of up to 25%, roughly
in line with our X-Series (Maxeon 3) technology. When fully ramped, we expect A-Series (Maxeon 5) panels to be
significantly less expensive to manufacture than E-Series (Maxeon 2) and X-Series (Maxeon 3) technology.
We eventually plan to transform all of our legacy E-Series (Maxeon 2) production capacity in Fab 3 to A-Series
(Maxeon 5). Due to higher manufacturing equipment throughput, we expect to be able to retrofit Fab 3 with
approximately 1.9 gigawatts of A-Series (Maxeon 5) capacity—more than twice that of our legacy E-Series
(Maxeon 2) technology.
Since fiscal 2016, we launched a line of solar panels under the P-Series and Performance product names, which
is now referred to as our Performance Line of solar panels. These products utilize a proprietary manufacturing process
to assemble conventional silicon solar cells into panels with increased efficiency and reliability compared with
conventional panels. Performance Line solar panels are produced by Huansheng, a Yixing, China based joint venture
in which we will own a 20% equity stake at the time of distribution. Huansheng currently has a capacity to produce
approximately 1.9 gigawatts per year of Performance Line solar panels and has indicated that it plans to expand
capacity to approximately 5 gigawatts per year by 2021. We have the right to take up to 33% of Huansheng’s capacity
for sale directly into global DG markets, and a further 33% for sale into global power plant markets through a
marketing joint venture in which we own an 80% stake.
Our proprietary technology platforms, including the Maxeon Line and Performance Line, target distinct market
segments, serving both the distributed generation and power plant markets. This ability to address the full market
spectrum allows us to benefit from a range of diverse industry drivers and retain a balanced and diversified customer
base.We believe that our Maxeon Line of IBC technology stands apart from the competition in key metrics that our
customers value, including efficiency, energy yield, reliability and aesthetics.
We believe the combination of these characteristics enables the delivery of an unparalleled product and value
proposition to our customers. Our A-Series (Maxeon 5) panels deliver 60% more energy in any given amount of roof
space over the first 25 years, as compared to conventional panels.
We believe that we possess a technological advantage as the leading manufacturer of back-contact,
back-junction cells that enables our panels to produce more electricity, last longer and resist degradation more
effectively. We believe that our technology allows us to deliver:
• superior performance, including the ability to generate up to 35% more power per unit area than
conventional solar cells;
• superior aesthetics, with our uniformly black surface design that eliminates highly visible reflective grid
lines and metal interconnection ribbons;
• superior reliability, as confirmed by multiple independent reports and internal reliability data;
12

• superior energy production per rated watt of power, as confirmed by multiple independent reports; and
• solar power systems that are designed to generate electricity over a system life typically exceeding
25 years.
With industry-leading conversion efficiencies, we continuously improve our Maxeon solar cells and believe they
perform better and are tested more extensively to deliver maximum return on investment when compared with the
products of our competitors.
Warranties
SunPower provides a combined 25-year standard solar panel product and power warranty for defects in materials
and workmanship. The solar product warranty also warrants that Maxeon panels will provide 98% of the panel’s
minimum peak power (‘‘MPP’’) rating for the first year, declining due to expected degradation by no more than
0.25% per year for the following 24 years, such that the power output at the end of year 25 will be at least 92% of
the panel’s MPP rating. Our Performance panels are warranted to provide 97% of the panel’s MPP rating for the first
year, declining due to expected degradation by no more than 0.6% per year for the following 24 years, such that the
power output at the end of year 25 will be at least 82.6% of the panel’s MPP rating. Our warranty provides that we
will repair or replace or reimburse any defective solar panels during the warranty period. We also pass through
long-term warranties from the original equipment manufacturers of certain system components to customers for
periods ranging from five to 20 years. In addition, we generally warrant our workmanship on installed systems for
periods ranging up to 25 years.
Research and Development
We engage in extensive research and development efforts to improve solar cell efficiency through the
enhancement of our existing products, development of new techniques, and by reductions in manufacturing cost and
complexity. Our research and development group works closely with our manufacturing facilities, our equipment
suppliers and our customers to improve our solar cell design and to lower solar cell, solar panel and system product
manufacturing and assembly costs. In addition, we have dedicated employees who work closely with our current and
potential suppliers of crystalline silicon, a key raw material used in the manufacture of our solar cells, to develop
specifications that meet our standards and ensure the high quality we require, while at the same time controlling costs.
Refer to ‘‘Item 7. Management’s Discussion and Analysis of Financial Condition and Results of
Operations—Research and Development.’’
Manufacturing and Suppliers
We purchase polysilicon, ingots, wafers, solar cells, balance of system components, and inverters from various
manufacturers on both a contracted and a purchase order basis. We have contracted with some of our suppliers for
multi-year supply agreements. Under such agreements, we have annual minimum purchase obligations and in certain
cases prepayment obligations. Refer to ‘‘Item 7. Management’s Discussion and Analysis of Financial Condition and
Results of Operations—Liquidity and Capital Resources—Contractual Obligations’’ for further information
regarding the amount of our purchase obligations in fiscal 2020 and beyond. Under other supply agreements, we are
required to make prepayments to vendors over the terms of the arrangements. As of December 29, 2019, advances
to suppliers totaled $121.4 million. We may be unable to recover such prepayments if the credit conditions of these
suppliers materially deteriorate or if we are unable to fulfill our obligations under these supply agreements. For
further information regarding our future prepayment obligations, refer to ‘‘Item 8. Financial Statements and
Supplementary Data—Notes to Consolidated Financial Statements—Note 9. Commitments and
Contingencies—Advances to Suppliers.’’ We currently believe our supplier relationships and various short- and
long-term contracts will afford us the volume of material and services required to meet our planned output over the
next several years. For more information about risks related to our supply chain, including without limitation risks
relating to announced tariffs on solar cells and modules imported into the U.S., refer to ‘‘Item 1A. Risk
Factors—Risks Related to Our Supply Chain.’’
We are working with our suppliers and partners along all steps of the value chain to reduce costs by improving
manufacturing technologies and expanding economies of scale. Crystalline silicon is the principal commercial
material for solar cells and is used in several forms, including single-crystalline, or monocrystalline silicon,
multi-crystalline, or polycrystalline silicon, ribbon and sheet silicon, and thin-layer silicon. Our solar cell value chain
starts with high purity silicon called polysilicon. Polysilicon is created by refining quartz or sand.
13

Polysilicon is melted and grown into crystalline ingots and sawed into wafers by business partners specializing
in those processes. The wafers are processed into solar cells in our manufacturing facilities located in the Philippines
and Malaysia. Our solar cell manufacturing facility that we own and operate in the Philippines has a total rated annual
capacity of 500 MW. The solar cell manufacturing facility we own and operate in Malaysia has a total rated annual
capacity of over 800 MW and is currently being upgraded to 1,900 MW of A-Series (Maxeon 5) capacity.
We use our solar cells to manufacture our X-Series (Maxeon 3) and E-Series (Maxeon 2) solar panels at our solar
panel assembly facilities located in Mexico and France, while we source solar cells from third parties for use in our
P-Series solar panels at our solar panel assembly facility in Mexico and in Hillsboro, Oregon starting in 2019.
Our solar panel manufacturing facilities have a combined total rated annual capacity of over 1.4 GW.
We source the materials and components of our solar panels and systems based on quality, performance, and cost
considerations both internally and from third-party suppliers. We typically assemble proprietary components, while
we purchase generally available components from third-party suppliers. The balance of system components, along
with the EPC cost to construct the project, can comprise as much as two-thirds of the cost of a solar power system.
Therefore, we focus on standardizing our products with the goal of driving down installation costs, such as with our
Equinox and Helix systems.
Customers
Our scope and scale allow us to deliver solar solutions across all segments, ranging from consumer homeowners
to the largest commercial and governmental entities in the world. Our customers typically include investors, financial
institutions, project developers, electric utilities, independent power producers, commercial and governmental
entities, production home builders, residential owners and small commercial building owners. We leverage a
combination of direct sales as well as a broad partner ecosystem to efficiently reach our global customer base.
We work with development, construction, system integration, and financing companies to deliver our solar
power products and solutions to wholesale sellers, retail sellers, and retail users of electricity. In the United States,
commercial and electric utility customers typically choose to purchase solar electricity under a PPA with an investor
or financing company that buys the system from us. End-user customers typically pay the investors and financing
companies over an extended period of time based on energy they consume from the solar power systems, rather than
paying for the full capital cost of purchasing the solar power systems. Our utility-scale solar power systems are
typically purchased by an investor or financing company, and operated as central-station solar power plants.
In addition, our third-party dealer network and our new homes division have deployed thousands of SunPower
rooftop solar power systems to residential customers. See ‘‘Item 7. Management’s Discussion and Analysis of
Financial Condition and Results of Operations—Revenue’’ for our significant customers.
Competition
The market for solar electric power technologies is competitive and continually evolving. In the last year, we
faced increased competition, resulting in price reductions in the market and reduced margins, which may continue
and could lead to loss of market share. Our solar power products and systems compete with many competitors in the
solar power market, including, but not limited to:
• SunPower Energy Services Segment: Canadian Solar Inc., First Solar, Inc., GAF Energy, Hanwha QCELLS
Corporation, Hyundai Heavy Industries Co. Ltd., JA Solar Holdings Co., Jinko Solar, Kyocera Corporation,
LG Corporation, LONGi Solar, NRG Energy, Inc., Panasonic Corporation, REC Group, Sharp Corporation,
SunRun, Inc., Tesla, Inc., Trina Solar Ltd., Vivint, Inc., and Yingli Green Energy Holding Co. Ltd.
• SunPower Technologies: Canadian Solar Inc., First Solar Inc., Hanwha QCELLS Corporation, JA Solar
Holdings Co., Jinko Solar, LG Solar, LONGi Solar, Tongwei Co. Ltd., Panasonic, and Trina Solar Ltd.
We also face competition from resellers that have developed related offerings that compete with our product and
service offerings, or have entered into strategic relationships with other existing solar power system providers.
We compete for limited government funding for research and development contracts, customer tax rebates and other
programs that promote the use of solar, and other renewable forms of energy with other renewable energy providers
and customers.
In addition, universities, research institutions, and other companies have brought to market alternative
technologies, such as thin-film solar technology, which compete with our PV technology in certain applications.
14
Furthermore, the solar power market in general competes with other energy providers such as electricity produced
from conventional fossil fuels supplied by utilities and other sources of renewable energy such as wind, hydro,
biomass, solar thermal, and emerging distributed generation technologies such as micro-turbines, sterling engines and
fuel cells.
In the large-scale on-grid solar power systems market, we face direct competition from a number of companies,
including those that manufacture, distribute, or install solar power systems as well as construction companies that
have expanded into the renewable sector. In addition, we will occasionally compete with distributed generation
equipment suppliers.
We believe that the key competitive factors in the market for solar power systems include:
• total system price;
• LCOE evaluation;
• CCOE evaluation;
• power efficiency, reliability and performance;
• aesthetic appearance of solar panels and systems;
• speed and ease of installation through modular solutions such as our Helix system;
• strength of distribution relationships;
• availability of third-party financing and investments;
• established sales channels to customers;
• timeliness of new product introductions;
• bankability, strength, and reputation of our company; and
• warranty protection, quality, and customer service.
We believe that we can compete favorably with respect to each of these elements, although we may be at a
disadvantage in comparison to larger companies with broader product lines, greater technical service and support
capabilities, and financial resources. For more information on risks related to our competition, please see the risk
factors set forth under the caption ‘‘Item 1A. Risk Factors’’ including ‘‘Risks Related to Our Sales Channels—The
increase in the global supply of solar cells and panels, and increasing competition, may cause substantial downward
pressure on the prices of such products and cause us to lose sales or market share, resulting in lower revenues,
earnings, and cash flows.’’
Intellectual Property
We rely on a combination of patent, copyright, trade secret, trademark, and contractual protections to establish
and protect our proprietary rights. ‘‘SunPower’’ and the ‘‘SunPower’’ logo are our registered trademarks in countries
throughout the world for use with solar cells, solar panels, energy monitoring systems, inverters, and mounting
systems. We also hold registered trademarks for, among others, ‘‘SunPower Equinox,’’ ‘‘SunPower Giving,’’
‘‘SunPower Horizons,’’ ‘‘SunPower Energy Services,’’ ‘‘SunPower Technologies,’’ ‘‘Bottle the Sun,’’ ‘‘Demand
Better Solar,’’ ‘‘EDDiE,’’ ‘‘EnergyLink,’’ ‘‘Equinox Energy Systems and Design,’’ ‘‘Equinox Solar Systems and
Design,’’ ‘‘Equinox,’’ ‘‘Experiential Learning. Expanding Opportunities.,’’ ‘‘Helix,’’ ‘‘InvisiMount,’’ ‘‘Light on
Land,’’ ‘‘Maxeon,’’ ‘‘Oasis,’’ ‘‘Oasis Geo,’’ ‘‘Powering a Brighter Tomorrow,’’ ‘‘Smarter Solar,’’ ‘‘Solar Showdown,’’
‘‘Sol,’’ ‘‘SunTile,’’ ‘‘More Energy. For Life.,’’ ‘‘The Planet’s Most Powerful Solar,’’ and ‘‘The Power of One’’ in
certain countries. We are seeking and will continue to seek registration of the ‘‘SunPower’’ trademark and other
trademarks in additional countries as we believe is appropriate. As of December 29, 2019, we held registrations for
32 trademarks in the United States, and had 9 trademark registration applications pending. We also held
159 trademark registrations and had 37 trademark applications pending in foreign jurisdictions. We typically require
our business partners to enter into confidentiality and non-disclosure agreements before we disclose any sensitive
aspects of our solar cells, technology, or business plans. We typically enter into proprietary information agreements
with employees, consultants, vendors, customers, and joint venture partners.
15

We own multiple patents and patent applications that cover aspects of the technology in the solar cells, mounting
products, and electrical and electronic systems that we currently manufacture and market. We continue to file for and
receive new patent rights on a regular basis. The lifetime of a utility patent typically extends for 20 years from the
date of filing with the relevant government authority. We assess appropriate opportunities for patent protection of
those aspects of our technology, designs, methodologies, and processes that we believe provide significant
competitive advantages to us, and for licensing opportunities of new technologies relevant to our business. As of
December 29, 2019, we held 502 patents in the United States, which will expire at various times through 2037, and
had 237 U.S. patent applications pending. We also held 688 patents and had 563 patent applications pending in
foreign jurisdictions. While patents are an important element of our intellectual property strategy, our business as a
whole is not dependent on any one patent or any single pending patent application. We additionally rely on trade
secret rights to protect our proprietary information and know-how. We employ proprietary processes and customized
equipment in our manufacturing facilities. We therefore require employees and consultants to enter into
confidentiality agreements to protect them.
When appropriate, we enforce our intellectual property rights against other parties. For more information about
risks related to our intellectual property, please see the risk factors set forth under the caption ‘‘Item 1A. Risk
Factors’’ including ‘‘Risks Related to Our Intellectual Property—We depend on our intellectual property, and we may
face intellectual property infringement claims that could be time-consuming and costly to defend and could result in
the loss of significant rights,’’ ‘‘Risks Related to Our Intellectual Property—We rely substantially upon trade secret
laws and contractual restrictions to protect our proprietary rights, and, if these rights are not sufficiently protected,
our ability to compete and generate revenue could suffer,’’ and ‘‘Risks Related to Our Intellectual Property—We may
not obtain sufficient patent protection on the technology embodied in the solar products we currently manufacture
and market, which could harm our competitive position and increase our expenses.’’
Backlog
We believe that backlog is not a meaningful indicator of our future business prospects. In our SunPower Energy
Services Segment’s residential and commercial and international DG markets, we often sell large volumes of solar
panels, mounting systems, and other solar equipment to third parties, which are typically ordered by our third-party
dealer network and customers under standard purchase orders with relatively short delivery lead-times. Additionally,
we often require project financing for development and construction of our SunPower Technologies Segment’s solar
power plant projects, which require significant investments before the equity is later sold by us to investors.
Therefore, our solar power system project backlog would exclude sales contracts signed and completed in the same
quarter and contracts still conditioned upon obtaining financing. Based on these reasons, we believe backlog at any
particular date is not necessarily a meaningful indicator of our future revenue for any particular period of time.
Regulations
Public Policy Considerations
Different public policy mechanisms have been used by governments to accelerate the adoption and use of solar
power. Examples of customer-focused financial mechanisms include capital cost rebates, performance-based
incentives, feed-in tariffs, tax credits, and net metering. Some of these government mandates and economic incentives
are scheduled to be reduced or to expire, or could be eliminated altogether. Capital cost rebates provide funds to
customers based on the cost and size of a customer’s solar power system. Performance-based incentives provide
funding to a customer based on the energy produced by their solar power system. Feed-in tariffs pay customers for
solar power system generation based on energy produced, at a rate generally guaranteed for a period of time.
Tax credits reduce a customer’s taxes at the time the taxes are due. Net metering allows customers to deliver to the
electric grid any excess electricity produced by their on-site solar power systems, and to be credited for that excess
electricity at or near the full retail price of electricity.
In addition to the mechanisms described above, new market development mechanisms to encourage the use of
renewable energy sources continue to emerge. For example, many states in the United States have adopted renewable
portfolio standards which mandate that a certain portion of electricity delivered to customers come from eligible
renewable energy resources. Some states, such as California and Hawaii, have significantly expanded their renewable
portfolio standards in recent years. In certain developing countries, governments are establishing initiatives to expand
access to electricity, including initiatives to support off-grid rural electrification using solar power. For more
information about how we avail ourselves of the benefits of public policies and the risks related to public policies,
16

please see the risk factors set forth under the caption ‘‘Item 1A. Risk Factors’’ including ‘‘Risks Related to Our Sales
Channels—The reduction, modification or elimination of government incentives could cause our revenue to decline
and harm our financial results,’’ ‘‘Risks Related to Our Sales Channels—Existing regulations and policies and
changes to these regulations and policies may present technical, regulatory, and economic barriers to the purchase
and use of solar power products, which may significantly reduce demand for our products and services,’’ and
‘‘Changes in international trade policies, tariffs, or trade disputes could significantly and adversely affect our
business, revenues, margins, results of operations, and cash flows.’’
Environmental Regulations
We use, generate, and discharge toxic, volatile, or otherwise hazardous chemicals and wastes in our research and
development, manufacturing, and construction activities. We are subject to a variety of foreign, U.S. federal and state,
and local governmental laws and regulations related to the purchase, storage, use, and disposal of hazardous
materials. We believe that we have all environmental permits necessary to conduct our business and expect to obtain
all necessary environmental permits for future activities. We believe that we have properly handled our hazardous
materials and wastes and have appropriately remediated any contamination at any of our premises. For more
information about risks related to environmental regulations, please see the risk factors set forth under the caption
‘‘Item 1A. Risk Factors’’ including ‘‘Risks Related to Our Operations—Compliance with environmental regulations
can be expensive, and noncompliance with these regulations may result in adverse publicity and potentially
significant monetary damages and fines.’’
Information concerning certain limited activities in Iran and Syria
Information concerning the activities of our affiliate Total and its affiliated companies (collectively, the ‘‘Total
Group’’) related to Iran that took place in 2019 provided in this section is disclosed according to Section 13(r) of the
Securities Exchange Act of 1934, as amended (‘‘U.S. Exchange Act’’).
In addition, information for 2019 is provided concerning the payments made by Total Group affiliates to, or
additional cash flow that operations of Total Group affiliates generate for, governments of any country identified by
the United States as state sponsors of terrorism (currently, Iran, North Korea, Syria and Sudan) or any entity
controlled by those governments. The Total Group is not present in North Korea. Other than fees related to the
renewal of the registration of an international trademark with the world intellectual property organization (which
includes North Korea) paid in 2019, Total is not aware of any of its activities in 2019 having resulted in payments
to, or additional cash flow for, the government of this country.
Total believes that these activities are not subject to sanctions.
Iran
The Total Group’s operational activities related to Iran were stopped in 2018 following the withdrawal of the
United States from the Joint Comprehensive Plan of Action (‘‘JCPOA’’) in May 2018 and prior to the re-imposition
of U.S. secondary sanctions on the oil industry as of November 5, 2018.
Statements in this section concerning affiliates intending or expecting to continue activities described below are
subject to such activities continuing to be permissible under applicable international economic sanctions regimes.
Exploration & Production
The Tehran branch office of Total E&P South Pars S.A.S. (a wholly-owned affiliate), which opened in 2017 for
the purposes of the development and production of phase 11 of the South Pars gas field, ceased all operational
activities prior to November 1, 2018. In addition, since November 2018, Total Iran BV maintains a local
representative office in Tehran with few employees solely for non-operational functions. Concerning payments to
Iranian entities in 2019, Total Iran BV and Elf Petroleum Iran collectively made payments of approximately IRR
1.87 billion (approximately €39,500, using the average exchange rate for fiscal 2019, as published by the Central
Bank of Iran) to the Iranian administration for taxes and social security contributions concerning the staff of the
aforementioned representative office. None of these payments were executed in U.S. dollars.
Since November 30, 2018, Total E&P UK Limited (‘‘TEP UK’’), a wholly-owned affiliate, holds a 1% interest
in a joint venture relating to the Bruce field in the United Kingdom (the ‘‘Bruce Field Joint Venture’’) with Serica
Energy (UK) Limited (‘‘Serica’’) (98%, operator) and BP Exploration Operating Company Limited (‘‘BPEOC’’)
17

(1%), following the completion of the sale of 42.25% of TEP UK’s interest in the Bruce Field Joint Venture on
November 30, 2018 pursuant to a sale and purchase agreement dated August 2, 2018 entered into between TEP UK
and Serica. Upon closing of the transaction on November 30, 2018, all other prior joint venture partners also sold their
interests in the Bruce Field Joint Venture to Serica (BPEOC sold 36% retaining a 1% interest, BHP Billiton Petroleum
Great Britain Limited (‘‘BHP’’) sold its entire interest of 16% and Marubeni Oil & Gas (U.K.) Limited (‘‘Marubeni’’)
sold its entire interest of 3.75%).
The Bruce Field Joint Venture is party to an agreement governing certain transportation, processing and
operation services provided to another joint venture at the Rhum field in the UK (the ‘‘Bruce Rhum Agreement’’).
The licensees of the Rhum field are Serica (50%, operator) and the Iranian Oil Company UK Ltd (‘‘IOC UK’’), a
subsidiary of NIOC (50%), an Iranian government-owned corporation. Under the terms of the Bruce Rhum
Agreement, the Rhum field owners pay a proportion of the operating costs of the Bruce field facilities calculated on
a gas throughput basis.
In November 2018, the U.S. Treasury Department’s Office of Foreign Asset Control (‘‘OFAC’’) granted a
conditional license to BPEOC and Serica authorizing provision of services to the Rhum field following the
re-imposition of U.S. secondary sanctions. The principal condition of the license is that the ownership of shares in
IOC UK by Naftiran Intertrade Company Limited (the trading branch of the NIOC) are transferred into and held in
a Jersey-based trust, thereby ensuring that the Iranian government does not derive any economic benefit from the
Rhum field so long as U.S. sanctions against these entities remain in place. IOC UK’s interest is managed by an
independent management company established by the trust and referred to as the ‘‘Rhum Management Company’’
(‘‘RMC’’). Where necessary TEP UK liaises with RMC in relation to the Bruce Rhum Agreement and TEP UK
expects to continue liaising with RMC on the same basis in 2020.
In October 2019, OFAC renewed and extended the conditional license to Serica authorizing the provision of
services to the Rhum field until February 2021. In addition, OFAC informed that, to the extent that the license
remains valid and Serica represents that the conditions set out in the license are met, activities and transactions of
non-U.S. persons involving the Rhum filed or the Bruce field, including in relation to the operation of the trust, IOC
UK and RMC will not be exposed to U.S. secondary sanctions with respect to Iran.
IOC UK’s share of costs incurred under the Bruce Rhum Agreement have been paid to TEP UK in 2019 by
RMC. In 2019, based upon TEP UK’s 1% interest in the Bruce Field Joint Venture and income from the net cash flow
sharing arrangement with Serica, gross revenue to TEP UK from IOC UK’s share of the Rhum field resulting from
the Bruce Rhum Agreement was approximately £8 million. This amount was used to offset operating costs on the
Bruce field and as such, generated no net profit to TEP UK. This arrangement is expected to continue in 2020.
Early 2019, TEP UK continued to act as agent for BHP and Marubeni pursuant to the agency agreement entered
into in June 2018 between BHP, Marubeni and TEP UK according to which TEP UK received payments from RMC
in relation to BHP and Marubeni’s share of income from the Bruce Rhum Agreement (the ‘‘Agency Agreement’’).
The payments related to the period before November 30, 2018, prior to BHP and Marubeni divested their respective
interest in the Bruce Field Joint Venture to Serica. In 2019, total payment received on behalf of BHP and Marubeni
by TEP UK under this arrangement was approximately £1.1 million. TEP UK transferred all income received under
the Agency Agreement to BHP and Marubeni and provided the service on a no profit, no loss basis. The Agency
Agreement was terminated on June 27, 2019 following receipt of all payments relating to the period up to
November 30, 2018.
TEP UK is also party to an agreement with Serica whereby TEP UK uses reasonable endeavors to evacuate
Rhum NGL from the St Fergus Terminal (the ‘‘Rhum NGL Agreement’’). TEP UK provides this service subject to
Serica having title to all of the Rhum NGL to be evacuated and Serica having a valid license from OFAC for the
activity. The service is provided on a cost basis, and TEP UK charges a monthly handling fee that generates an income
of approximately £35,000 per annum relating to IOC UK’s 50% stake in the Rhum field. After costs, TEP UK realizes
little profit from this arrangement. TEP UK expects to continue this activity in 2020.
Total S.A. paid approximately €2,000 to Iranian authorities related to various patents in 2019. Similar payments
are expected to be made in 2020. Section 560.509 of the U.S. Iranian Transactions and Sanctions Regulations
provides an authorization for certain transactions in connection with patent, trademark, copyright or other intellectual
property protection in the United States or Iran, including payments for such services and payments to persons in Iran
directly connected to intellectual property rights, and Total believes that the activities related to the industrial property
rights are consistent with that authorization.
18

Other business segments
In 2019, Total S.A. paid fees of approximately €1,500 to Iranian authorities related to the maintenance and
protection of trademarks and designs in Iran. Similar payments are expected to be made in 2020.
Refining & Chemicals
In 2019, Hanwha Total Petrochemicals (‘‘HTC’’), a South Korean joint venture in which each of Total Holdings
UK Limited (a wholly-owned affiliate) and its partner Hanwha General Chemicals holds a 50% interest, reported
some activity in Iran. In November 2018, South Korea was granted a significant reduction exemption waiver (the
‘‘SRE waiver’’) allowing it to import Iranian condensate from NIOC for six months. In that context, HTC purchased
approximately 13.5 Mb of condensates from NIOC for approximately KRW 1,000 billion (approximately
€760 million, using the average exchange rate for fiscal 2019, as published by Bloomberg) from January 2019 to
April 2019. HTC stopped purchasing from NIOC thereafter. These condensates are used as raw material for certain
of HTC’s steam crackers.
In 2019, Total Research & Technology Feluy (‘‘TRTF’’, a wholly-owned affiliate) and Total Raffinage Chimie
(‘‘TRC’’, a wholly-owned affiliate) paid fees related to three patents to Iranian authorities for an amount of
approximately €1,400.
Marketing & Services
In 2019, Total Marketing France (‘‘TMF’’, a wholly-owned affiliate), provided fuel payment cards to the Iranian
embassy located in Neuilly-sur-Seine (France) and the Iranian delegation to UNESCO in Paris (France), to be used
in the Total Group’s service stations. In 2019, this activity generated gross revenue of approximately €30,300 and net
profit of approximately €2,200. The Total Group expects to continue this activity in 2020.
In 2019, as part of its refueling activities in France, Caldeo, a company wholly-owned by TMF, delivered fuel
oil to the Iranian embassy in Neuilly-sur-Seine (France). In 2019, this activity generated gross revenue of
approximately €1,500 and net profit of approximately €14. The Total Group expects to continue this activity in 2020.
In 2019, Total Belgium (a wholly-owned affiliate) provided fuel payment cards to the Iranian embassy in
Brussels (Belgium), to be used in the Total Group’s service stations. In 2019, this activity generated gross revenue
of approximately €11,000 and net profit of €4,000. The Total Group expects to continue this activity in 2020.
Syria
Since early December 2011, Total has ceased its activities that contribute to oil and gas production in Syria and
maintains a local office solely for non-operational functions. In late 2014, the Total Group initiated a downsizing of
its Damascus office and reduced its staff to few employees. Following the termination of their employment contracts
in May 2019, the Damascus office was closed. In 2019, Total paid approximately €6,500 to the Syrian government
as contributions for social security in relation to the aforementioned staff of the Damascus office before it was closed.
Employees
As of December 29, 2019, we had about 8,400 full-time employees worldwide, of which about 2,000 each were
located in the United States and in the Philippines, about 1,700 were located in Malaysia, and about 2,500 were
located in other countries. Of these employees, about 5,300 were engaged in manufacturing, about 1,500 in
construction projects, about 300 in research and development, about 400 in sales and marketing, and more than 700
in general and administrative services. Although in certain countries, we have works councils and statutory employee
representation obligations, our employees are generally not represented by labor unions on an ongoing basis. We have
never experienced a work stoppage, and we believe our relations with our employees to be good.
Seasonal Trends and Economic Incentives
Our business is subject to industry-specific seasonal fluctuations including changes in weather patterns and
economic incentives, among others. Sales have historically reflected these seasonal trends with the largest percentage
of total revenues realized during the last two quarters of our fiscal year. The construction of solar power systems or
installation of solar power components and related revenue may decline during cold winter months. In the United
States, many customers make purchasing decisions towards the end of the year in order to take advantage of tax
19

credits or for other budgetary reasons. In addition, revenues may fluctuate due to the timing of project sales,
construction schedules, and revenue recognition of certain projects, which may significantly impact the quarterly
profile of our results of operations. We may also retain certain development projects on our balance sheet for longer
periods of time than in preceding periods in order to optimize the economic value we receive at the time of sale in
light of market conditions, which can fluctuate after we have committed to projects. Delays in disposing of projects,
or changes in amounts realized on disposition, may lead to significant fluctuations to the period-over-period profile
of our results of operations and our cash available for working capital needs.
Available Information
We make available our Annual Reports on Form 10-K, Quarterly Reports on Form 10-Q, Current Reports on
Form 8-K, and amendments to those reports filed or furnished pursuant to Section 13(a) or Section 15(d) of the
Securities Exchange Act of 1934 (the ‘‘Exchange Act’’) free of charge on our website at www.sunpower.com, as soon
as reasonably practicable after they are electronically filed with or furnished to the SEC. The contents of our website
are not incorporated into, or otherwise to be regarded as part of this Annual Report on Form 10-K. Copies of such
material may be obtained, free of charge, upon written request submitted to our corporate headquarters: SunPower
Corporation, Attn: Investor Relations, 51 Rio Robles, San Jose, California, 95134. Copies of materials we file with
the SEC may also be accessed the SEC’s website at www.sec.gov.
20

ITEM 1A. RISK FACTORS
Our business is subject to various risks and uncertainties, including those described below and elsewhere in
this Annual Report on Form 10-K, which could adversely affect our business, results of operations, and financial
condition. Although we believe that we have identified and discussed below certain key risk factors affecting our
business, there may be additional risks and uncertainties that are not currently known to us or that are not
currently believed by us to be material that may also harm our business, results of operations, and financial
condition.
Risks Related to the Spin-Off
Our plan to separate into two independent publicly-traded companies by means of a sponsored spin-off of ourinternational SunPower Technologies business unit is subject to various risks and uncertainties and may not becompleted in accordance with the expected plans or anticipated timeline, or at all, and will involve significant timeand expense, which could disrupt or adversely affect our business.
On November 11, 2019, we announced plans to separate into two independent publicly-traded through the
proposed Spin-Off. In the Spin-Off, we will distribute shares of Maxeon Solar to our stockholders
The Spin-Off, which is currently targeted to be completed in the second quarter of 2020, is subject to certain
conditions, including final approval by our Board of Directors, as well as other conditions such as completion of all
necessary filings under the U.S. securities laws; receipt by our Board of Directors of one or more opinions from an
independent valuation firm confirming the solvency and financial viability of each of SunPower and Maxeon Solar
immediately after the completion of the distribution in a form acceptable to us; receipt of an opinion regarding the
qualification of the Distribution as a transaction that is generally tax-free for U.S. federal income tax purposes under
Section 355 of the Internal Revenue Code of 1986, as amended (the ‘‘Code’’) to our stockholders; if applicable, the
receipt of a waiver from the Singapore Securities Industry Council from the applicability of the Singapore Code on
Take-overs and Mergers to the distribution; the absence of any legal impediments prohibiting the Distribution; and
the satisfaction or waiver of certain conditions Investment set forth in the Investment Agreement and as detailed
below. In addition, we may not be able to complete the contemplated Spin-Off should TZS decide not to provide its
contemplated investment. Pursuant to the Investment Agreement, the investment is subject to certain conditions being
satisfied or waived by us or Maxeon Solar, on the one hand, and TZS, on the other hand, including, among other
things, the completion of the Spin-Off, as well as other conditions including Maxeon Solar entering into definitive
agreements for a term loan facility in an amount not less than $325 million; Maxeon Solar obtaining certain additional
financing in the form of a revolving credit facility of not less than $100 million or, alternatively, making certain
working capital adjustment arrangements; Maxeon Solar having no more than $138 million in other debt and no less
than $50 million in Cash (as defined in the Investment Agreement) immediately prior to the Investment; execution
of ancillary agreements and a shareholders agreement; receipt of required governmental approvals; completion of all
necessary filings under the U.S. securities laws; receipt by our Board of Directors of one or more opinions from an
independent valuation firm confirming the solvency and financial viability of each of us and Maxeon Solar
immediately after the consummation of the Distribution in a form acceptable to us; if applicable, the receipt of a
waiver from the Singapore Securities Industry Council from the applicability of the Singapore Code on Take-overs
and Mergers to the distribution and the investment; and the absence of any legal impediments prohibiting the
investment. Maxeon Solar has not yet secured commitment letters for the required term loan facility or revolving
credit facility noted above, and there is no guarantee that Maxeon Solar will be able to secure such commitments.
The failure to satisfy all of the required conditions could delay the completion of the Spin-Off or the investment for
a significant period of time or prevent them from occurring at all.
Unanticipated developments, including changes in the competitive conditions of our markets, possible delays in
obtaining various tax opinions or rulings, regulatory approvals or clearances, negotiating challenges, the uncertainty
of the financial markets, changes in the law, and challenges in executing the separation, could delay or prevent the
completion of the Spin-Off, or cause the Spin-Off to occur on terms or conditions that are different or less favorable
than expected. Any changes to the Spin-Off or delay in completing the Spin-Off could cause us not to realize some
or all of the expected benefits, or realize them on a different timeline than expected. Further, our Board of Directors
could decide, either because of a failure of conditions or because of market or other factors, to abandon the Spin-Off.
If it does so, not only will we not realize any benefits of the Spin-Off, we may have to pay, in some cases, a breakup
fee to TZS of either $20 million or $80 million, depending on the circumstances. No assurance can be given as to
whether and when the Spin-Off will occur.
21

We have incurred significant expenses in connection with the Spin-Off and investment, and expect that the
process of completing the Spin-Off will be time-consuming and involve significant additional costs and expenses,
which may be significantly higher than what we currently anticipate and may not yield a discernible benefit if the
separation is not completed. Executing the Spin-Off will require significant time and attention from our senior
management and employees, which could adversely affect our business, financial results, and results of operations.
We may also experience increased difficulties in attracting, retaining, and motivating employees during the pendency
of the Spin-Off and following its completion, which could harm our businesses. In addition, if the Spin-Off is not
completed, we will still be required to pay certain costs and expenses incurred in connection therewith, such as legal,
accounting, and other professional fees. And, as noted, in some cases we may have to pay a breakup fee to TZS.
Any of the above factors could cause the Spin-Off (or the failure to execute the Spin-Off) to have a material
adverse effect on our business, financial condition and results of operations and the price of our common stock.
The Spin-Off may not achieve some or all of the anticipated benefits.
We may not realize some or all of the anticipated strategic, financial, operational, marketing or other benefits
from the Spin-Off. We cannot predict with certainty when the benefits expected from the Spin-Off will occur or the
extent to which they will be achieved. If the Spin-Off is completed, our operational and financial profile will change
and we will face new risks. As independent, publicly-traded companies, SunPower and Maxeon Solar will be smaller,
less-diversified companies with narrower business focuses and may be more vulnerable to changing market
conditions, which could materially and adversely affect their respective businesses, financial condition, and results
of operations. There is no assurance that following the Spin-Off each separate company will be successful.
In addition, some investors holding our common stock prior to the separation may hold our common stock
because of a decision to invest in a company that operates all of our business units, including our SunPower
Technologies business unit. If the Spin-Off is completed, shares in each independent company held by those investors
will represent an investment in a company with a different profile than that of SunPower, and, as a result, some
investors may sell our common stock prior to the Separation or sell the shares of one or both independent companies
resulting from the separation. Excess selling could cause the relative market price of our common stock to decrease
and be subject to greater volatility following the completion of the Spin-Off. We expect the trading price of our
common stock immediately following the ex-dividend date for the Spin-Off to be significantly lower than
immediately preceding the ex-dividend date, as the trading price of our common stock will no longer reflect the value
of our SunPower Technologies business unit. Further, there can be no assurance that the combined value of the shares
of the two publicly-traded companies will be equal to or greater than what the value of our common stock would have
been had the proposed Spin-Off not occurred.
The proposed Spin-Off may result in disruptions to, and may negatively impact our relationships with, ourcustomers and other business partners.
Uncertainty related to the Spin-Off may lead customers and other parties with which we currently do business,
or may do business in the future, to terminate or attempt to negotiate changes in existing business relationships, or
consider entering into business relationships with parties other than us. These disruptions could have a material and
adverse effect on our businesses, financial condition and results of operations. The effect of such disruptions could
be exacerbated by any delays or unanticipated developments in the completion of the Spin-Off.
Following the Spin-Off, each of SunPower and Maxeon Solar will operate as an independent publicly-tradedcompany with its own business goals, objectives and commercial relationships.
Following the Spin-Off, we and Maxeon Solar will operate as independent publicly-traded companies.
Accordingly, our business goals, objectives and commercial relationships will be different from those of Maxeon
Solar. In that respect, we may not have exclusive access to next-generation solar cells and panels that may be
produced by Maxeon Solar, including Maxeon 5 solar cells and A-Series (Maxeon 5) modules, following the
applicable exclusivity periods in the supply agreement we will enter into with Maxeon, which could have an adverse
effect on our business, financial condition and results of operations and our ability to execute our business strategy.
We may have divergent interests with respect to the transition services agreement and other ancillary agreementsthat we will enter into with Maxeon Solar, which could negatively impact the scope, duration or effectiveness ofsuch agreements in a manner that negatively impacts our and Maxeon Solar’s businesses and operations.
We and Maxeon Solar will enter into a transition services agreement and other ancillary agreements in
connection with the Spin-Off pursuant to which SunPower and Maxeon Solar will provide each other, on an interim,
22
transitional basis, various services related to finance, accounting, business technology, human resources information
systems, human resources, facilities, document management and record retention, relationship and strategy
management and module operations, technical and quality support. Nevertheless, our interests and those of Maxeon
Solar could differ with respect to these agreements, which could negatively impact the scope, duration or
effectiveness of such agreements. In addition, if we or Maxeon Solar do not satisfactorily perform our obligations
under these agreements, the non-performing party may be held liable for any resulting losses suffered by the other
party. Also, during the periods of these agreements, our and Maxeon Solar’s management and employees may be
required to divert their attention away from our and their respective business in order to provide services pursuant
to the agreements, which could adversely affect our and their business. Any of these factors could negatively impact
our and Maxeon Solar’s businesses and operations.
If the Spin-Off fails to qualify for tax-free distribution treatment to the stockholders for U.S. federal income taxpurposes, then the distribution could result in tax liability to the stockholders.
We expect that for U.S. federal income tax purposes, the distribution should qualify, for our stockholders, as a
tax-free distribution under Section 355 of the Code. This expectation is based, among other things, on various factual
assumptions we have made. If any of these assumptions are, or become, inaccurate or incomplete, our expectations
may change. For instance, this expectation relies on certain significant ownership interests in the resulting companies
continuing after the Spin-Off. Whether such ownership continues may be out of SunPower’s control following the
completion of the Spin-Off, because none of its stockholders have committed to SunPower to retain their shares of
SunPower or Maxeon Solar after the Spin-Off. Additionally, there can be no assurance that the IRS will not challenge
any positions we take with respect to the Spin-Off or that a court would not sustain such a challenge.
Although the stockholders are expected to obtain tax-free treatment in the distribution portion of the Spin-Off,
the separation is expected to result in a fully taxable event to SunPower, for which SunPower expects to recognize
gain which it expects to offset with prior year losses, thus resulting in a significant reduction in our net operating loss
carryforwards. We may incur certain non-U.S. tax costs in connection with the separation, including tax expense
resulting from separations in multiple non-U.S. jurisdictions that do not legally provide for tax-free separations,
which may be material. If the distribution fails to qualify as tax-free under Section 355 of the Code, each SunPower
stockholder will generally be required to include in its taxable income as a dividend the fair market value of the
Maxeon Solar ordinary shares received by it to the extent of earnings and profits of SunPower and will generally take
a fair market value basis in the Maxeon Solar ordinary shares received by it in the distribution.
We may determine to forgo certain transactions in order to avoid the risk of incurring material tax-relatedliabilities.
As a result of requirements of Section 355 of the Code and/or other applicable tax laws, we may determine to
forgo certain transactions that would otherwise be advantageous. In particular, we may determine to continue to
operate certain of our business operations for the foreseeable future even if a sale or discontinuance of such business
would otherwise be advantageous.
If the Spin-Off is completed, any financing we obtain in the future could involve higher costs.
Following completion of the Spin-Off, any financing that we obtain will be with the support of a reduced pool
of diversified assets and a significant amount of outstanding debt, and therefore we may not be able to secure
adequate debt or equity financing on desirable terms. The cost to us of financing without our SunPower Technologies
business unit as part of our consolidated company may be materially higher than the cost of financing prior to the
Spin-Off. If we have credit ratings lower than we currently have, it could be more expensive for us to obtain debt
financing than it has been to date.
Certain members of our Board of Directors and management may have actual or potential conflicts of interestbecause of their ownership of shares of Maxeon Solar and SunPower or their relationships with Maxeon Solarfollowing the Spin-Off.
Certain members of our Board of Directors and management are expected to own shares of Maxeon Solar and/or
options to purchase shares of Maxeon Solar, which could create, or appear to create, potential conflicts of interest
when our directors and executive officers are faced with decisions that could have different implications for
SunPower and Maxeon Solar. This may create, or appear to create, potential conflicts of interest if these directors are
faced with decisions that could have different implications for Maxeon Solar than the decisions have for SunPower.
23

Our historical financial statements do not reflect the effects of the Spin-Off.
Our historical financial information for periods prior to the completion of the Spin-Off are not necessarily
indicative of what our results of operations, financial position and cash flows will be in the future if the Spin-Off is
completed and, for periods prior to the Spin-Off, do not reflect many significant changes in our capital structure,
funding and operations that will result from the Spin-Off.
Risks Related to Our Sales Channels
Our operating results are subject to significant fluctuations and are inherently unpredictable.
We do not know whether our revenue will continue to grow, or if it will continue to grow sufficiently to outpace
our expenses, which we also expect to grow. As a result, we may not be profitable on a quarterly or annual basis.
Our revenue and operating results are difficult to predict and have in the past fluctuated significantly from quarter
to quarter. The principal reason for these significant fluctuations in our results is that we derive a substantial portion
of our total revenues from our large commercial customers, consequently:
• the amount, timing and mix of sales to our large commercial customers often for a single medium or
large-scale project, may cause large fluctuations in our revenue and other financial results because, at any
given time, a single large-scale project can account for a material portion of our total revenue in a given
quarter;
• our inability to monetize our projects as planned, or any delay in obtaining the required government support
or initial payments to begin recognizing revenue under the relevant recognition criteria, and the
corresponding revenue impact, may similarly cause large fluctuations in our revenue and other financial
results;
• our ability to monetize projects as planned is also subject to market conditions, including fluctuations in
demand based on the availability of regulatory incentives and other factors, changes in the internal rate of
return expected by customers in light of market conditions, the increasing number of power plants being
constructed or available for sale and competition for financing, which can make both financing and
disposition more challenging and may significantly affect project sales prices;
• market conditions may deteriorate after we have committed to projects, resulting in delays in disposing of
projects, or changes in amounts realized on disposition, which may lead to significant fluctuations in the
period-over-period profile of our results of operations and our cash available for working capital needs;
• in the event a project is subsequently canceled, abandoned, or is deemed unlikely to occur, we will charge
all prior capital costs as an operating expense in the quarter in which such determination is made, which
could materially adversely affect operating results;
• a delayed disposition of a project could require us to recognize a gain on the sale of assets instead of
recognizing revenue;
• our agreements with these customers may be canceled if we fail to meet certain product specifications or
materially breach these agreements;
• in the event of a customer bankruptcy, our customers may seek to terminate or renegotiate the terms of
current agreements or renewals; and
• the failure by any significant customer to pay for orders, whether due to liquidity issues or otherwise, could
materially and adversely affect our results of operations.
Any decrease in revenue from our large commercial customers whether due to a loss or delay of projects or an
inability to collect, could have a significant negative impact on our business. See also ‘‘Item 7A. Quantitative and
Qualitative Disclosures About Market Risk.’’ See also under this section ‘‘Risks Related to Our Sales
Channels—Revenues from a limited number of customers and large projects are expected to continue to comprise a
significant portion of our total revenues and any decrease in revenues from those customers or projects, payment of
liquidated damages, or an increase in related expenses, could have a material adverse effect on our business, results
of operations and financial condition.’’
Sales to our residential and light commercial customers are similarly susceptible to fluctuations in volumes and
revenue, as well as fluctuations in demand based on the availability of regulatory incentives and other factors. In
24

addition, demand from our commercial and residential customers may fluctuate based on the perceived cost-
effectiveness of the electricity generated by our solar power systems as compared to conventional energy sources,
such as natural gas and coal (which fuel sources are subject to significant price swings from time to time), and other
non-solar renewable energy sources, such as wind. Declining average selling prices immediately affect our residential
and light commercial sales volumes, and therefore lead to large fluctuations in revenue.
Further, our revenue mix of materials sales versus project sales can fluctuate dramatically from quarter to
quarter, which may adversely affect our margins and financial results in any given period.
Any of the foregoing may cause us to miss our financial guidance for a given period, which could adversely
impact the market price for our common stock and our liquidity.
We base our planned operating expenses in part on our expectations of future revenue and a significant portion
of our expenses is fixed in the short term. If revenue for a particular quarter is lower than we expect, we likely will
be unable to proportionately reduce our operating expenses for that quarter, which would materially adversely affect
our operating results for that quarter. See also under this section, ‘‘Risks Related to Our Sales Channels—Our
business could be adversely affected by seasonal trends and construction cycles,’’ ‘‘Risks Related to Our Sales
Channels—The reduction, modification or elimination of government incentives could cause our revenue to decline
and harm our financial results,’’ and ‘‘Risks Related to Our Sales Channels—Existing regulations and policies and
changes to these regulations and policies may present technical, regulatory, and economic barriers to the purchase
and use of solar power products, which may significantly reduce demand for our products and services.’’
Changes in international trade policies, tariffs, or trade disputes could significantly and adversely affect our
business, revenues, margins, results of operations, and cash flows.
On February 7, 2018, safeguard tariffs on imported solar cells and modules went into effect pursuant to
Proclamation 9693, which approved recommendations to provide relief to U.S. manufacturers and impose safeguard
tariffs on imported solar cells and modules, based on the investigations, findings, and recommendations of the U.S.
International Trade Commission (the ‘‘International Trade Commission’’). Modules are subject to a four-year tariff
at a rate of 30% in the first year, declining 5% in each of the three subsequent years, to a final tariff rate of 15% in
2021. Cells are subjected to a tariff-rate quota, under which the first 2.5 GW of cell imports each year will be exempt
from tariffs; and cells imported after the 2.5 GW quota has been reached will be subject to the same 30% tariff as
modules in the first year, with the same 5% decline in each of the three subsequent years. The tariff-free cell quota
applies globally, without any allocation by country or region.
The tariffs could materially and adversely affect our business and results of operations. While solar cells and
modules based on interdigitated back contact (‘‘IBC’’) technology, like our X-Series (Maxeon 3), E-Series
(Maxeon 2), A-Series (Maxeon 5) and related products, were granted exclusion from these safeguard tariffs on
September 19, 2018, our solar products based on other technologies continue to be subject to the safeguard tariffs.
Although we are actively engaged in efforts to mitigate the effect of these tariffs, there is no guarantee that these
efforts will be successful.
Additionally, the Office of the United States Trade Representative (‘‘USTR’’) initiated an investigation under
Section 301 of the Trade Act of 1974 into the government of China’s acts, policies, and practices related to technology
transfer, intellectual property, and innovation. In notices published June 20, 2018, August 16, 2018, and
September 21, 2018, the USTR imposed additional import duties of up to 25% on certain Chinese products covered
by the Section 301 remedy. These tariffs include certain solar power system components and finished products,
including those purchased from our suppliers for use in our products and used in our business. The United States and
China continue to signal the possibility of taking additional retaliatory measures in response to actions taken by the
other country, which may result in changes to existing trade agreements and terms including additional tariffs on
imports from China or other countries.
Uncertainty surrounding the implications of existing tariffs affecting the U.S. solar market, trade tensions
between China and the United States is likely to cause market volatility, price fluctuations, supply shortages, and
project delays, any of which could harm our business, and our pursuit of mitigating actions may divert substantial
resources from other projects. In addition, the imposition of tariffs is likely to result in a wide range of impacts to
the U.S. solar industry and the global manufacturing market, as well as our business in particular. Such tariffs could
materially increase the price of our solar products and result in significant additional costs to us, our resellers, and
25

our resellers’ customers, which could cause a significant reduction in demand for our solar power products and
greatly reduce our competitive advantage. With the uncertainties associated with the tariffs and Section 301 trade
case, events and changes in circumstances indicated that the carrying values of our long-lived assets associated with
our manufacturing operations might not be recoverable.
The execution of our growth strategy is dependent upon the continued availability of third-party financingarrangements for our projects, including our residential lease program, and our customers, and is affected bygeneral economic conditions and other factors.
Our growth strategy depends on third-party financing arrangements. We often require project financing for
development and construction of certain of our projects, which require significant investments before the equity is
later sold to investors. Many purchasers of our systems projects have entered into third-party arrangements to finance
their systems over an extended period of time, while many end-customers have chosen to purchase solar electricity
under a power purchase agreement (‘‘PPA’’) with an investor or financing company that purchases the system from
us or our authorized dealers. We often execute PPAs directly with the end-user, with the expectation that we will later
assign the PPA to a financier. Under such arrangements, the financier separately contracts with us to acquire and build
the solar power system, and then sells the electricity to the end-user under the assigned PPA. When executing PPAs
with end-users, we seek to mitigate the risk that financing will not be available for the project by allowing termination
of the PPA in such event without penalty. However, we may not always be successful in negotiating for penalty-free
termination rights for failure to obtain financing, and certain end-users have required substantial financial penalties
in exchange for such rights. These structured finance arrangements are complex and may not be feasible in many
situations.
Global economic conditions, including conditions that may make it more difficult or expensive for us to access
credit and liquidity, could materially and adversely affect our business and results of operations. Credit markets are
unpredictable, and if they become more challenging, we may be unable to obtain project financing for our projects,
customers may be unable or unwilling to finance the cost of our products, we may have difficulties in reaching
agreements with financiers to finance the construction of our solar power systems, or the parties that have historically
provided this financing may cease to do so, or only do so on terms that are substantially less favorable for us or our
customers, any of which could materially and adversely affect our revenue and growth in both segments of our
business. Our plans to continue to grow our residential lease program may be delayed if credit conditions prevent us
from obtaining or maintaining arrangements to finance the program. We are actively arranging additional third-party
financing for our residential lease program; however, if we encounter challenging credit markets, we may be unable
to arrange additional financing partners for our residential lease program in future periods, which could have a
negative impact on our sales. In the event we enter into a material number of additional leases without obtaining
corresponding third-party financing, our cash, working capital and financial results could be negatively affected.
In addition, a rise in interest rates would likely increase our customers’ cost of financing or leasing our products and
could reduce their profits and expected returns on investment in our products. The general reduction in available
credit to would-be borrowers or lessees, worldwide economic uncertainty, and the condition of worldwide housing
markets could delay or reduce our sales of products to new homebuilders and authorized resellers. For more
information, see ‘‘Item 8. Financial Statements and Supplementary Data-Notes to Consolidated Financial Statements-
Note 6. Solar Services.’’
The availability of financing depends on many factors, including market conditions, the demand for and supply
of solar projects, and resulting risks of refinancing or disposing of such projects. It also depends in part on
government incentives, such as tax incentives. In the United States, with the expiration of the Treasury Grant under
Section 1603 of the American Recovery and Reinvestment Act program, we have needed to identify interested
financiers with sufficient taxable income to monetize the tax incentives created by our solar systems. In the long term,
as we look toward markets not supported (or supported less) by government incentives, we will continue to need to
identify financiers willing to finance residential solar systems without such incentives. Our failure to effectively do
so could materially and adversely affect our business and results of operations. In addition, with the recent passage
of comprehensive reform of the Code, the impact of revisions to various industry-specific tax incentives, such as
accelerated depreciation, and an overall reduction in corporate tax rates may lead to changes in the market and
availability of tax equity investors.
The lack of project financing, due to tighter credit markets or other reasons, could delay the development and
construction of our solar power plant projects, thus reducing our revenues from the sale of such projects. We may
in some cases seek to pursue partnership arrangements with financing entities to assist residential and other customers
26

to obtain financing for the purchase or lease of our systems, which would expose us to credit or other risks. We face
competition for financing partners and if we are unable to continue to offer a competitive investment profile, we may
lose access to financing partners or they may offer financing on less favorable terms than our competitors, which
could materially and adversely affect our business and results of operations.
If we fail to successfully execute our cost reduction roadmap, or fail to develop and introduce new and enhanced
products and services, we may be unable to compete effectively, and our ability to generate revenues and profits
would suffer.
Our solar panels are competitive in the market as compared with lower cost conventional solar cells, such as
thin-film, due to our products’ higher efficiency, among other things. Given the general downward pressure on prices
for solar panels driven by increasing supply and technological change, a principal component of our business strategy
is reducing our costs to manufacture our products to remain competitive. We also focus on standardizing our products
with the goal of driving down installation costs. If our competitors are able to drive down their manufacturing and
installation costs or increase the efficiency of their products faster than we can, or if competitor products are
exempted from tariffs and quotas and ours are not, our products may become less competitive even when adjusted
for efficiency. Further, if raw materials costs and other third-party component costs were to increase, we may not meet
our cost reduction targets. If we cannot effectively execute our cost reduction roadmap, our competitive position will
suffer, and we could lose market share and our margins would be adversely affected as we face downward pricing
pressure.
The solar power market is characterized by continually changing technology and improving features, such as
increased efficiency, higher power output and enhanced aesthetics. Technologies developed by our direct competitors,
including thin-film solar panels, concentrating solar cells, solar thermal electric and other solar technologies, may
provide energy at lower costs than our products. We also face competition in some markets from other energy
generation sources, including conventional fossil fuels, wind, biomass, and hydro. In addition, other companies could
potentially develop a highly reliable renewable energy system that mitigates the intermittent energy production
drawback of many renewable energy systems. Companies could also offer other value-added improvements from the
perspective of utilities and other system owners, in which case such companies could compete with us even if the
cost of electricity associated with any such new system is higher than that of our systems. We also compete with
traditional utilities that supply energy to our potential customers. Such utilities have greater financial, technical,
operational and other resources than we do. If electricity rates decrease and our products become less competitive by
comparison, our operating results and financial condition will be adversely affected.
Our failure to further refine our technology, reduce costs in our manufacturing process, and develop and
introduce new solar power products could cause our products or our manufacturing facilities to become less
competitive or obsolete, which could reduce our market share, cause our sales to decline, and cause the impairment
of our assets. This risk requires us to continuously develop new solar power products and enhancements for existing
solar power products to keep pace with evolving industry standards, competitive pricing and changing customer
preferences, expectations, and requirements. It is difficult to successfully predict the products and services our
customers will demand. If we cannot continually improve the efficiency and prove the reliability of our solar panels
as compared with those of our competitors, our pricing will become less competitive, we could lose market share and
our margins would be adversely affected.
As we introduce new or enhanced products or integrate new technology and components into our products,
we will face risks relating to such transitions including, among other things, the incurrence of high fixed costs,
technical challenges, acceptance of products by our customers, disruption in customers’ ordering patterns, insufficient
supplies of new products to meet customers’ demand, possible product and technology defects arising from the
integration of new technology and a potentially different sales and support environment relating to any new
technology. Our failure to manage the transition to newer products or the integration of newer technology and
components into our products could adversely affect our business’s operating results and financial condition. See also
under this section, ‘‘Risks Related to Our Sales Channels-Changes in international trade policies, tariffs, or trade
disputes could significantly and adversely affect our business, revenues, margins, results of operations, and cash
flows.’’
27

The increase in the global supply of solar cells and panels, and increasing competition, may cause substantialdownward pressure on the prices of such products and cause us to lose sales or market share, resulting in lowerrevenues, earnings, and cash flows.
Global solar cell and panel production capacity has been materially increasing overall, and solar cell and solar
panel manufacturers currently have excess capacity, particularly in China. Excess capacity and industry competition
have resulted in the past, and may continue to result, in substantial downward pressure on the price of solar cells and
panels, including SunPower products. Intensifying competition could also cause us to lose sales or market share. Such
price reductions or loss of sales or market share could have a negative impact on our revenue and earnings, and could
materially adversely affect our business, financial condition and cash flows. In addition, our internal pricing forecasts
may not be accurate in such a market environment, which could cause our financial results to be different than
forecasted. Uncertainty with respect to Chinese government policies, including subsidies or other incentives for solar
projects, may cause increased, decreased, or volatile supply and/or demand for solar products, which could negatively
impact our revenue and earnings. Finally, the imposition by the U.S. of tariffs and quotas could materially adversely
affect our ability to compete with other suppliers and developers in the U.S. market. See also under this section,
‘‘Risks Related to Our Sales Channels-If we fail to successfully execute our cost reduction roadmap, or fail to develop
and introduce new and enhanced products and services, we may be unable to compete effectively, and our ability to
generate revenues and profits would suffer,’’ and ‘‘Risks Related to Our Sales Channels-Changes in international
trade policies, tariffs, or trade disputes could significantly and adversely affect our business, revenues, margins,
results of operations, and cash flows.’’
The reduction, modification or elimination of government incentives could cause our revenue to decline and harmour financial results.
The market for on-grid applications, where solar power is used to supplement a customer’s electricity purchased
from the utility network or sold to a utility under tariff, depends in large part on the availability and size of
government mandates and economic incentives because, at present, the cost of solar power generally exceeds retail
electric rates in many locations and wholesale peak power rates in some locations. Incentives and mandates vary by
geographic market. Various government bodies in most of the countries where we do business have provided
incentives in the form of feed-in tariffs, rebates, and tax credits and other incentives and mandates, such as renewable
portfolio standards and net metering, to end-users, distributors, system integrators and manufacturers of solar power
products to promote the use of solar energy in on-grid applications and to reduce dependency on other forms of
energy. These various forms of support for solar power are subject to change (as, for example, occurred in 2015 with
Nevada’s decision to change net energy metering; and in 2017 with California’s adoption of new time-of-use rates
that reduced the price paid to solar system owners for mid-day electricity production; and in 2020 with California’s
adoption of building standards requiring the installation of solar systems on new homes), and are expected in the
longer term to decline. Even changes that may be viewed as positive (such as the extension at the end of 2015 of U.S.
tax credits related to solar power) can have negative effects if they result, for example, in delaying purchases that
otherwise might have been made before expiration or scheduled reductions in such credits. Governmental decisions
regarding the provision of economic incentives often depend on political and economic factors that we cannot predict
and that are beyond our control. The reduction, modification or elimination of grid access, government mandates or
economic incentives in one or more of our customer markets would materially and adversely affect the growth of
such markets or result in increased price competition, either of which could cause our revenue to decline and
materially adversely affect our financial results.
Existing regulations and policies and changes to these regulations and policies may present technical, regulatory,and economic barriers to the purchase and use of solar power products, which may significantly reduce demandfor our products and services.
The market for electric generation products is heavily influenced by federal, state and local government laws,
regulations and policies concerning the electric utility industry in the United States and abroad, as well as policies
promulgated by electric utilities. These regulations and policies often relate to electricity pricing and technical
interconnection of customer-owned electricity generation, and changes that make solar power less competitive with
other power sources could deter investment in the research and development of alternative energy sources as well as
customer purchases of solar power technology, which could in turn result in a significant reduction in the demand
for our solar power products. The market for electric generation equipment is also influenced by trade and local
content laws, regulations and policies that can discourage growth and competition in the solar industry and create
economic barriers to the purchase of solar power products, thus reducing demand for our solar products. In addition,
28
on-grid applications depend on access to the grid, which is also regulated by government entities. We anticipate that
our solar power products and their installation will continue to be subject to oversight and regulation in accordance
with federal, state, local and foreign regulations relating to construction, safety, environmental protection, utility
interconnection and metering, trade, and related matters. It is difficult to track the requirements of individual states
or local jurisdictions and design equipment to comply with the varying standards. In addition, the U.S., European
Union and Chinese governments, among others, have imposed tariffs or are in the process of evaluating the
imposition of tariffs on solar panels, solar cells, polysilicon, and potentially other components. These and any other
tariffs or similar taxes or duties may increase the price of our solar products and adversely affect our cost reduction
roadmap, which could harm our results of operations and financial condition. Any new regulations or policies
pertaining to our solar power products may result in significant additional expenses to us, our resellers and our
resellers’ customers, which could cause a significant reduction in demand for our solar power products. See also
under this section, ‘‘Risks Related to Our Sales Channels-Changes in international trade policies, tariffs, or trade
disputes could significantly and adversely affect our business, revenues, margins, results of operations, and cash
flows.’’
We may incur unexpected warranty and product liability claims that could materially and adversely affect ourfinancial condition and results of operations.
Our current standard product warranty for our solar panels and their components includes a 25-year warranty
period for defects in materials and workmanship and for greater than promised declines in power performance.
We believe our warranty offering is in line with industry practice. This long warranty period creates a risk of
extensive warranty claims long after we have shipped product and recognized revenue. We perform accelerated life
cycle testing that exposes our products to extreme stress and climate conditions in both environmental simulation
chambers and in actual field deployments in order to highlight potential failures that could occur over the 25-year
warranty period. We also employ measurement tools and algorithms intended to help us assess actual and expected
performance; these attempt to compare actual performance against an expected performance baseline that is intended
to account for many factors (like weather) that can affect performance. Although we conduct accelerated testing of
our solar panels and components, they have not and cannot be tested in an environment that exactly simulates the
25-year warranty period and it is difficult to test for all conditions that may occur in the field. Further, there can be
no assurance that our efforts to accurately measure and predict panel and component performance will be successful.
We have sold products under our warranties since the early 2000s and have therefore not experienced the full
warranty cycle.
In our project installations, our current standard warranty for our solar power systems differs by geography and
end-customer application and usually includes a limited warranty of 10 years for defects in workmanship, after which
the customer may typically extend the period covered by its warranty for an additional fee. We also typically provide
a system output performance warranty, separate from our standard solar panel product warranty, to customers that
have subscribed to our post-installation O&M services. The long warranty period and nature of the warranties create
a risk of extensive warranty claims long after we have completed a project and recognized revenues. Warranty and
product liability claims may also result from defects or quality issues in certain technology and components (whether
manufactured by us or third parties) that we incorporate into our solar power systems, such as solar cells, panels,
inverters, and microinverters, over which we may have little or no control. See also under this section ‘‘Risks Related
to Our Supply Chain-We will continue to be dependent on a limited number of third-party suppliers for certain raw
materials and components for our products, which could prevent us from delivering our products to our customers
within required time frames and could in turn result in sales and installation delays, cancellations, penalty payments
and loss of market share.’’ While we generally pass through to our customers the manufacturer warranties we receive
from our suppliers, in some circumstances, we may be responsible for repairing or replacing defective parts during
our warranty period, often including those covered by manufacturers’ warranties, or incur other non-warranty costs.
If a manufacturer disputes or otherwise fails to honor its warranty obligations, we may be required to incur substantial
costs before we are compensated, if at all, by the manufacturer. Furthermore, our warranties may exceed the period
of any warranties from our suppliers covering components, such as third-party solar cells, third-party panels and
third-party inverters, included in our systems. In addition, manufacturer warranties may not fully compensate us for
losses associated with third-party claims caused by defects or quality issues in their products. For example, most
manufacturer warranties exclude certain losses that may result from a system component’s failure or defect, such as
the cost of de-installation, re-installation, shipping, lost electricity, lost renewable energy credits or other solar
incentives, personal injury, property damage, and other losses. In certain cases, the direct warranty coverage we
provide to our customers, and therefore our financial exposure, may exceed our recourse available against cell, panel
29

or other manufacturers for defects in their products. In addition, in the event we seek recourse through warranties,
we will also be dependent on the creditworthiness and continued existence of the suppliers to our business. In the
past, certain of our suppliers have entered bankruptcy and our likelihood of a successful warranty claim against such
suppliers is minimal.
Increases in the defect rate of SunPower or third-party products, including components, could cause us to
increase the amount of warranty reserves and have a corresponding material, negative impact on our results of
operations. Further, potential future product or component failures could cause us to incur substantial expense to
repair or replace defective products or components, and we have agreed in some circumstances to indemnify our
customers and our distributors against liability from some defects in our solar products. A successful indemnification
claim against us could require us to make significant damage payments. Repair and replacement costs, as well as
successful indemnification claims, could materially and negatively impact our financial condition and results of
operations.
Like other retailers, distributors and manufacturers of products that are used by customers, we face an inherent
risk of exposure to product liability claims in the event that the use of the solar power products into which solar cells,
solar panels, and microinverters are incorporated results in injury, property damage or other damages. We may be
subject to warranty and product liability claims in the event that our solar power systems fail to perform as expected
or if a failure of our solar power systems or any component thereof results, or is alleged to result, in bodily injury,
property damage or other damages. Since our solar power products are electricity-producing devices, it is possible
that our systems could result in injury, whether by product malfunctions, defects, improper installation or other
causes. In addition, since we only began selling our solar cells and solar panels in the early 2000s and the products
we are developing incorporate new technologies and use new installation methods, we cannot predict the extent to
which product liability claims may be brought against us in the future or the effect of any resulting negative publicity
on our business. Moreover, we may not have adequate resources to satisfy a successful claim against us. We rely on
our general liability insurance to cover product liability claims. A successful warranty or product liability claim
against us that is not covered by insurance or is in excess of our available insurance limits could require us to make
significant payments of damages. In addition, quality issues can have various other ramifications, including delays
in the recognition of revenue, loss of revenue, loss of future sales opportunities, increased costs associated with
repairing or replacing products, and a negative impact on our goodwill and reputation, any of which could adversely
affect our business, operating results and financial condition.
As our sales to residential customers have grown, we have increasingly become subject to substantial financingand consumer protection laws and regulations.
As we continue to seek to expand our retail customer base, our activities with customers - and in particular, our
financing activities with our residential customers - are subject to consumer protection laws that may not be
applicable to our other businesses, such as federal truth-in-lending, consumer leasing, telephone and digital
marketing, and equal credit opportunity laws and regulations, as well as state and local finance laws and regulations.
Claims arising out of actual or alleged violations of law may be asserted against us by individuals or governmental
entities and may expose us to significant damages or other penalties, including fines. In addition, our affiliations with
third-party dealers may subject us to alleged liability in connection with actual or alleged violations of law by such
dealers, whether or not actually attributable to us, which may expose us to significant damages and penalties, and we
may incur substantial expenses in defending against legal actions related to third-party dealers, whether or not we are
ultimately found liable.
We may not achieve some or all of the expected benefits of our restructuring plans and our restructuring mayadversely affect our business.
We announced restructuring plans in February 2018 and December 2019 to realign and optimize workforce
requirements in light of recent changes to our business, including the contemplated plan to separate into two public
companies through the Spin-Off, to reduce operating expenses and cost of revenue overhead in light of the known
shorter-term impact of U.S. tariffs imposed on PV solar cells and modules pursuant to Section 201 of the Trade Act
of 1974 and our broader initiatives to control costs and improve cash flow. While we expect to complete the February
2018 and December 2019 plans in 2020 and 2023, respectively, additional actions may be costly and disruptive to
our business, and we may not be able to obtain the cost savings and benefits that were initially anticipated in
connection with our restructuring. Additionally, we may experience a loss of continuity, loss of accumulated
knowledge, or inefficiency during transitional periods associated with our restructurings. Reorganization and
30

restructuring can require a significant amount of management and other employees’ time and focus, which may divert
attention from operating and growing our business. If we fail to achieve some or all of the expected benefits of the
restructurings, it could have a material adverse effect on our competitive position, business, financial condition,
results of operations and cash flows. For more information about our restructuring plan, see ‘‘Item 8. Financial
Statements and Supplementary Data-Notes to Consolidated Financial Statements-Note 8. Restructuring.’’
As owners and operators of solar power systems that deliver electricity to the grid, certain of our affiliated entitiesmay be considered public utilities for purposes of the Federal Power Act, as amended (the ‘‘FPA’’), and are subjectto regulation by the Federal Energy Regulatory Commission (‘‘FERC’’), as well as various local and stateregulatory bodies.
Although we are not directly subject to FERC regulation under the FPA, we are considered to be a ‘‘holding
company’’ for purposes of Section 203 of the FPA, which regulates certain transactions involving public utilities, and
such regulation could adversely affect our ability to grow the business through acquisitions. Likewise, investors
seeking to acquire our public utility subsidiaries or acquire ownership interests in their securities may require prior
FERC approval to do so. Such approval could result in transaction delays or uncertainties.
Public utilities under the FPA are required to obtain FERC acceptance of their rate schedules for wholesale sales
of electricity and to comply with various regulations. FERC may grant our affiliated entities the authority to sell
electricity at market-based rates and may also grant them certain regulatory waivers, such as waivers from
compliance with FERC’s accounting regulations. These FERC orders reserve the right to revoke or revise
market-based sales authority if FERC subsequently determines that our affiliated entities can exercise market power
in the sale of generation products, the provision of transmission services, or if it finds that any of the entities can
create barriers to entry by competitors. In addition, if the entities fail to comply with certain reporting obligations,
FERC may revoke their power sales tariffs. Finally, if the entities were deemed to have engaged in manipulative or
deceptive practices concerning their power sales transactions, they would be subject to potential fines, disgorgement
of profits, and/or suspension or revocation of their market-based rate authority. If our affiliated entities were to lose
their market-based rate authority, such companies would be required to obtain FERC’s acceptance of a cost-of-service
rate schedule and could become subject to the accounting, record-keeping, and reporting requirements that are
imposed on utilities with cost-based rate schedules, which would impose cost and compliance burdens on us and have
an adverse effect on our results of operations. In addition to the risks described above, we may be subject to additional
regulatory regimes at state or foreign levels to the extent we own and operate solar power systems in such
jurisdictions.
We do not typically maintain long-term agreements with our customers and accordingly we could lose customerswithout warning, which could adversely affect our operating results.
Our product sales to residential dealers and components customers typically are not made under long-term
agreements. We often contract to construct or sell large projects with no assurance of repeat business from the same
customers in the future. Although cancellations of our purchase orders to date have been infrequent, our customers
may cancel or reschedule purchase orders with us on relatively short notice. Cancellations or rescheduling of
customer orders could result in the delay or loss of anticipated sales without allowing us sufficient time to reduce,
or delay the incurrence of, our corresponding inventory and operating expenses. In addition, changes in forecasts or
the timing of orders from these or other customers expose us to the risks of inventory shortages or excess inventory.
These circumstances, in addition to the completion and non-repetition of large projects, declining average selling
prices, changes in the relative mix of sales of solar equipment versus solar project installations, and the fact that our
supply agreements are generally long-term in nature and many of our other operating costs are fixed, could cause our
operating results to fluctuate and may result in a material adverse effect in our business, results of operations, and
financial condition. In addition, since we rely partly on our network of international dealers for marketing and other
promotional programs, if our dealers fail to perform up to our standards, our operating results could be adversely
affected.
Our business could be adversely affected by seasonal trends and construction cycles.
Our business is subject to significant industry-specific seasonal fluctuations. Our sales have historically reflected
these seasonal trends, with the largest percentage of our total revenues realized during the second half of each fiscal
year. There are various reasons for this seasonality, mostly related to economic incentives and weather patterns.
For example, in European countries with feed-in tariffs, the construction of solar power systems may be concentrated
31

during the second half of the calendar year, largely due to the annual reduction of the applicable minimum feed-in
tariff and the fact that the coldest winter months in the Northern Hemisphere are January through March. In the
United States, many customers make purchasing decisions towards the end of the year in order to take advantage of
tax credits. In addition, sales in the new home development market are often tied to construction market demands,
which tend to follow national trends in construction, including declining sales during cold weather months.
The competitive environment in which we operate often requires us to undertake customer obligations, which mayturn out to be costlier than anticipated and, in turn, materially and adversely affect our business, results ofoperations and financial condition.
We are often required, as a condition of financing or at the request of our end customer, to undertake certain
obligations such as:
• system output performance warranties;
• system maintenance;
• penalty payments or customer termination rights if the system we are constructing is not commissioned
within specified time frames or other construction milestones are not achieved;
• guarantees of certain minimum residual value of the system at specified future dates;
• system put-rights whereby we could be required to buy back a customer’s system at fair value on a future
date if certain minimum performance thresholds are not met; and
• indemnification against losses customers may suffer as a result of reductions in benefits received under the
solar commercial investment tax credit (‘‘ITC’’) and of the Treasury grant programs under Section 1603 of
the American Recovery and Reinvestment Act (the ‘‘Cash Grant’’).
Such financing arrangements and customer obligations involve complex accounting analyses and judgments
regarding the timing of revenue and expense recognition, and in certain situations these factors may require us to
defer revenue or profit recognition until projects are completed or until contingencies are resolved, which could
adversely affect our revenues and profits in a particular period.
Risks Related to Our Liquidity
We may be unable to generate sufficient cash flows or obtain access to external financing necessary to fund ouroperations and make adequate capital investments, as planned due to the general economic environment and thecontinued market pressure driving down the average selling prices of our solar power products, among otherfactors.
To develop new products, including our A-Series (Maxeon 5), support future growth, achieve operating
efficiencies, and maintain product quality, we must make significant capital investments in manufacturing
technology, facilities and capital equipment, research and development, and product and process technology.
Our manufacturing and assembly activities have required and will continue to require significant investment of
capital and substantial engineering expenditures. In addition, we expect to invest a significant amount of capital to
develop solar power systems for sale to customers. Developing and constructing solar power projects requires
significant time and substantial initial investment. The delayed disposition of such projects, or the inability to realize
the full anticipated value of such projects on disposition, could have a negative impact on our liquidity. See also under
this section, ‘‘Risks Related to Our Operations-Project development or construction activities may not be successful
and we may make significant investments without first obtaining project financing, which could increase our costs
and impair our ability to recover our investments’’ and ‘‘Risks Related to Our Sales Channels-Revenues from a
limited number of customers and large projects are expected to continue to comprise a significant portion of our total
revenues and any decrease in revenues from those customers or projects, payment of liquidated damages, or an
increase in related expenses, could have a material adverse effect on our business, results of operations and financial
condition,’’ and ‘‘Changes in international trade policies, tariffs, or trade disputes could significantly and adversely
affect our business, revenues, margins, results of operations, and cash flows.’’
Certain of our customers also require performance bonds issued by a bonding agency, or bank guarantees or
letters of credit issued by financial institutions, which are returned to us upon satisfaction of contractual requirements.
If there is a contractual dispute with the customer, the customer may withhold the security or make a draw under the
security, which could have an adverse impact on our liquidity.
32

On October 29, 2019, we entered into a new Green Revolving Credit Agreement (the ‘‘2019 Revolver’’) with
Crédit Agricole, as lender, with a revolving credit commitment of $55.0 million. The 2019 Revolver contains
affirmative covenants, events of default and repayment provisions customarily applicable to similar facilities and has
a per annum commitment fee of 0.05% on the daily unutilized amount, payable quarterly. Loans under the 2019
Revolver bear either an adjusted LIBOR interest rate for the period elected for such loan or a floating interest rate
of the higher of prime rate, federal funds effective rate, or LIBOR for an interest period of one month, plus an
applicable margin, ranging from 0.25% to 0.60%, depending on the base interest rate applied, and each matures on
the earlier of April 29, 2021, or the termination of commitments thereunder. Our payment obligations under the 2019
Revolver are guaranteed by Total S.A. up to the maximum aggregate principal amount of $55.0 million. In
consideration of the commitments of Total S.A., we are required to pay them a guaranty fee of 0.25% per annum on
any amounts borrowed under the 2019 Revolver and to reimburse Total S.A. for any amounts paid by them under
the parent guaranty. We have pledged the equity of a wholly-owned subsidiary of the Company that holds our shares
of Enphase Energy, Inc. common stock to secure our reimbursement obligation under the 2019 Revolver. We have
also agreed to limit our ability to draw funds under the 2019 Revolver, to no more than 67% of the fair market value
of the common stock held by our subsidiary at the time of the draw. As of December 29, 2019, we had no outstanding
borrowings under the 2019 Revolver.
We manage our working capital requirements and fund our committed capital expenditures, including the
development and construction of our planned solar power projects, through our current cash and cash equivalents,
cash generated from operations, and funds available under our 2019 Revolver and from our other construction
financing providers. Upon the termination of the 2019 Revolver, we may be unable to find adequate credit support
in replacement, on acceptable terms or at all. In such case, our ability to obtain adequate amounts of debt financing
may be harmed. The lenders under our credit facilities and holders of our debentures may also require us to repay
our indebtedness to them in the event that our obligations under other indebtedness or contracts in excess of the
applicable threshold amount, are accelerated and we fail to discharge such obligations. If our capital resources are
insufficient to satisfy our liquidity requirements, for example, due to cross acceleration of indebtedness, we may seek
to sell additional equity investments or debt securities or obtain other debt financings. Market conditions, however,
could limit our ability to raise capital by issuing new equity or debt securities on acceptable terms, and lenders may
be unwilling to lend funds on acceptable terms. The sale of additional equity investments or convertible debt
securities may result in additional dilution to our stockholders. Additional debt would result in increased expenses
and could impose new restrictive covenants that may be different from those restrictions contained in the covenants
under certain of our current debt agreements and debentures. Financing arrangements, including project financing for
our solar power projects and letters of credit facilities, may not be available to us, or may not be available in amounts
or on terms acceptable to us. If additional financing is not available, we may be forced to seek to sell assets or reduce
or delay capital investments, any of which could adversely affect our business, results of operations and financial
condition.
If we cannot generate sufficient cash flows, find other sources of capital to fund our operations and projects,
make adequate capital investments to remain technologically and price competitive, or provide bonding or letters of
credit required by our projects, we may need to sell additional equity investments or debt securities, or obtain other
debt financings. If adequate funds from these or and other sources are not available on acceptable terms, our ability
to fund our operations, develop and construct solar power projects, develop and expand our manufacturing operations
and distribution network, maintain our research and development efforts, provide collateral for our projects, meet our
debt service obligations, or otherwise respond to competitive pressures would be significantly impaired. Our inability
to do any of the foregoing could have a material adverse effect on our business, results of operations and financial
condition.
We have a significant amount of debt outstanding. Our substantial indebtedness and other contractualcommitments could adversely affect our business, financial condition, and results of operations, as well as ourability to meet our payment obligations under the debentures and our other debt.
We currently have a significant amount of debt and debt service requirements. As of December 29, 2019, we had
approximately $1.0 billion of outstanding debt.
This level of debt could have material consequences on our future operations, including:
• making it more difficult for us to meet our payment and other obligations under the debentures and our
other outstanding debt;
33

• resulting in an event of default if we fail to comply with the financial and other restrictive covenants
contained in our debt agreements (with certain covenants becoming more restrictive over time), which
event of default could result in all or a significant portion of our debt becoming immediately due and
payable;
• reducing the availability of our cash flows to fund working capital, capital expenditures, project
development, acquisitions and other general corporate purposes, and limiting our ability to obtain
additional financing for these purposes;
• subjecting us to the risk of increased sensitivity to interest rate increases on our indebtedness with variable
interest rates, including borrowings under our credit agreement with Credit Agricole;
• limiting our flexibility in planning for, or reacting to, and increasing our vulnerability to, changes in our
business, the industry in which we operate and the general economy; and
• placing us at a competitive disadvantage compared with our competitors that have less debt or have lower
leverage ratios.
In the event, expected or unexpected, that any of our joint ventures is consolidated with our financial statements,
such consolidation could significantly increase our indebtedness.
Our ability to meet our payment and other obligations under our debt instruments depends on our ability to
generate significant cash flows, which, to some extent, is subject to general economic, financial, competitive,
legislative and regulatory factors as well as other factors that are beyond our control. We cannot assure you that our
business will generate cash flows from operations, or that future borrowings will be available to us under our existing
or any future credit facilities or otherwise, in an amount sufficient to enable us to meet our payment obligations under
our debentures and our other debt and to fund other liquidity needs. If we are unable to generate sufficient cash flows
to service our debt obligations, we may need to refinance or restructure our debt, including our debentures, sell assets,
reduce or delay capital investments, or seek to raise additional capital. There can be no assurance that we will be
successful in any sale of assets, refinancing, or restructuring effort. See also under this section, ‘‘Risks Related to Our
Operations-We may in the future be required to consolidate the assets, liabilities, and financial results of certain of
our existing or future joint ventures, which could have an adverse impact on our financial position, gross margin and
operating results’’, ‘‘Risks Related to Our Sales Channels-Changes in international trade policies, tariffs, or trade
disputes could significantly and adversely affect our business, revenues, margins, results of operations, and cash
flows,’’ and ‘‘Item 8. Financial Statements and Supplementary Data-Notes to Consolidated Financial Statements-
Note 1. Organization and Summary of Significant Accounting Policies-Liquidity.’’
Although we are currently in compliance with the covenants contained in our debt agreements, we cannot assure
you that we will be able to remain in compliance with such covenants in the future. We may not be able to cure future
violations or obtain waivers from our creditors in order to avoid a default. An event of default under any of our debt
agreements could have a material adverse effect on our liquidity, financial condition, and results of operations.
Our current tax holidays in the Philippines and Malaysia will expire within the next several years, and other
related international tax developments could adversely affect our results.
We benefit from income tax holiday incentives in the Philippines in accordance with our subsidiary’s registration
with the Philippine Economic Zone Authority (‘‘PEZA’’), which provides that we pay no income tax in the
Philippines for those operations subject to the ruling. Tax savings associated with the Philippines tax holidays were
approximately $4.0 million, $3.4 million, and $5.6 million in fiscal 2019, 2018, and 2017, respectively, which
provided a diluted net income (loss) per share benefit of $0.03, $0.02, and $0.04 in fiscal 2019, 2018, and 2017,
respectively.
Our income tax holidays were granted as manufacturing lines were placed in service. We plan to apply for
extensions and renewals upon expiration; however, while we expect all approvals to be granted, we can offer no
assurance that they will be. We believe that if our Philippine tax holidays are not extended or renewed, (a) gross
income attributable to activities covered by our PEZA registrations will be taxed at a 5% preferential rate, and (b) our
Philippine net income attributable to all other activities will be taxed at the statutory Philippine corporate income tax
rate, currently 30%. An increase in our tax liability could materially and adversely affect our business, financial
condition and results of operations.
34

We continue to qualify for the auxiliary company status in Switzerland where we sell our solar power products.
The auxiliary company status entitles us to a tax rate of 11.5% in Switzerland, reduced from approximately 24.2%.
Tax savings associated with this ruling were approximately $2.3 million, $1.8 million, and $2.4 million in fiscal 2019,
2018, and 2017, respectively, which provided a diluted net income (loss) per share benefit of $0.02, $0.01, and $0.02
in fiscal 2019, 2018, and 2017, respectively.
We also benefit from a tax holiday granted by the Malaysian government, subject to certain hiring, capital
spending, and manufacturing requirements. We received approval from the Malaysian government of the extension
of our tax holiday for a second five-year term (through June 30, 2021). The Company is in the process of negotiating
with the Malaysia government to modify the requirements of the second five-year term because of the planned
manufacturing expansion in Malaysia. The current negotiation is not expected to affect the tax holiday status.
Tax savings associated with the Malaysia tax holiday were approximately $3.9 million, $7.6 million, and $6.8 million
in fiscal 2019, 2018, and 2017 respectively, which provided a diluted net income (loss) per share benefit of $0.03,
$0.05, and $0.05 in fiscal 2019, 2018, and 2017 respectively. Although we were granted the extension, should we fail
to meet certain requirements in the future and are unable to renegotiate the tax ruling further, we could be
retroactively and prospectively subject to statutory tax rates and repayment of certain incentives which could
negatively impact our business.
More generally, with the finalization of specific actions contained within the Organization for Economic
Development and Cooperation’s (‘‘OECD’’) Base Erosion and Profit Shifting (‘‘BEPS’’) study (‘‘Actions’’), many
OECD countries have acknowledged their intent to implement the Actions and update their local tax regulations.
Among the considerations required by the Actions is the need for appropriate local business operational substance
to justify any locally granted tax incentives, such as those described above, and that the incentives are not determined
to constitute ‘‘state aid’’ which would invalidate the incentive. If we fail to maintain sufficient operational substance
or if the countries determine the incentive regimes do not conform with the BEPS regulations being considered for
implementation, adverse material economic impacts may result.
A change in our effective tax rate could have a significant adverse impact on our business, and an adverse
outcome resulting from examination of our income or other tax returns could adversely affect our results.
A number of factors may adversely affect our future effective tax rates, such as the jurisdictions in which our
profits are determined to be earned and taxed; changes in the valuation of our deferred tax assets and liabilities;
adjustments to estimated taxes upon finalization of various tax returns; adjustments to our interpretation of transfer
pricing standards; changes in available tax credits, grants and other incentives; changes in stock-based compensation
expense; the availability of loss or credit carryforwards to offset taxable income; changes in tax laws or the
interpretation of such tax laws (for example U.S. and international tax reform); changes in U.S. generally accepted
accounting principles (U.S. GAAP); expiration or the inability to renew tax rulings or tax holiday incentives.
A change in our effective tax rate due to any of these factors may adversely affect our future results from operations.
On December 22, 2017, the U.S. enacted significant changes to U.S. tax law following the passage and signing
of H.R.1, ‘‘An Act to Provide for Reconciliation Pursuant to Titles II and V of the Concurrent Resolution on the
Budget for fiscal year 2018 (previously known as ‘‘The Tax Cuts and Jobs Act’’ and, as enacted, the ‘‘Tax Act’’).
The Tax Act reduced the federal corporate tax rate from 35% to 21%, required companies to pay a one-time transition
tax on earnings of certain foreign subsidiaries that were previously tax deferred and created new taxes on certain
foreign sourced earnings. The U.S. Department of Treasury has broad authority to issue regulations and interpretive
guidance that may significantly impact how we will apply the law and impact our results of operations in the period
issued. We analyzed the impacts of the ‘‘Tax Act’’ and concluded that our cash payments for income tax will not be
materially impacted in the foreseeable future.
Significant judgment is required to determine the recognition and measurement attributes prescribed in the
accounting guidance for uncertainty in income taxes. The accounting guidance for uncertainty in income taxes applies
to all income tax positions, including the potential recovery of previously paid taxes, which if settled unfavorably
could adversely affect our provision for income taxes. In addition, we are subject to examination of our income tax
returns by various tax authorities. We regularly assess the likelihood of adverse outcomes resulting from any
examination to determine the adequacy of our provision for income taxes. An adverse determination of an
examination could have an adverse effect on our operating results and financial condition. See also ‘‘Item 8. Financial
Statements and Supplementary Data-Notes to Consolidated Financial Statements-Note 13. Income Taxes.’’
35

Additionally, longstanding international tax norms that determine each country’s jurisdiction to tax cross-border
international trade are evolving (for example, those relating to the Actions currently being undertaken by the OECD
and similar actions by the G8 and G20) and U.S. tax reform may lead to further changes in (or departure from) these
norms. As these and other tax laws and related regulations change, our financial results could be materially impacted.
Given the unpredictability of these possible changes and their potential interdependency, it is very difficult to assess
whether the overall effect of such potential tax changes would be cumulatively positive or negative for our earnings
and cash flow, but such changes could adversely impact our financial results.
Our credit and other agreements contain restrictions that may limit our ability to operate our business.
We may be unable to respond to changes in business and economic conditions, engage in transactions that might
otherwise be beneficial to us, or obtain additional financing, because our debt agreements, our Affiliation Agreement
with Total, foreign exchange hedging agreements and equity derivative agreements contain, and any of our other
future similar agreements may contain, restrictions that limit our ability to, among other things:
• incur additional debt, assume obligations in connection with letters of credit, or issue guarantees;
• create liens;
• make certain investments or acquisitions;
• enter into transactions with our affiliates;
• sell certain assets;
• redeem capital stock or make other restricted payments;
• declare or pay dividends or make other distributions to stockholders; and
• merge or consolidate with any person.
Our ability to comply with these covenants is dependent on our future performance, which will be subject to
many factors, some of which are beyond our control, including prevailing economic conditions. In addition,
our failure to comply with these covenants could result in a default under our other debt instruments, which could
permit the holders to accelerate such debt. If any of our debt is accelerated, we may not have sufficient funds
available to repay such debt, which could materially and negatively affect our financial condition and results of
operations.
Risks Related to Our Supply Chain
Our long-term, firm commitment supply agreements could result in excess or insufficient inventory, place us ata competitive disadvantage on pricing, or lead to disputes, each of which could impair our ability to meet our costreduction roadmap, and in some circumstances may force us to take a significant accounting charge.
If our supply agreements provide insufficient inventory to meet customer demand, or if our suppliers are unable
or unwilling to provide us with the contracted quantities, we may be forced to purchase additional supply at market
prices, which could be greater than expected and could materially and adversely affect our results of operations.
Due to the industry-wide shortage of polysilicon experienced before 2011, we purchased polysilicon that we resold
to third-party ingot and wafer manufacturers who deliver wafers to us that we then use in the manufacturing of our
solar cells. Without sufficient polysilicon, some of those ingot and wafer manufacturers would not have been able to
produce the wafers on which we rely. We have historically entered into multiple long-term fixed supply agreements
for periods of up to 10 years to match our estimated customer demand forecasts and growth strategy for the next
several years. The long-term nature of these agreements, which often provide for fixed or inflation-adjusted pricing,
may prevent us from benefiting from decreasing polysilicon costs, has, and may continue to, cause us to pay more
at unfavorable payment terms than the current market prices and payment terms available to our competitors, and has
in the past, and could again in the future, cause us to record an impairment. In the event that we have inventory in
excess of short-term requirements of polysilicon, in order to reduce inventory or improve working capital, we may,
and sometimes do, elect to sell such inventory in the marketplace at prices below our purchase price, thereby
incurring a loss.
Additionally, because certain of these agreements are ‘‘take or pay,’’ if our demand for polysilicon from these
suppliers decreases, we could be required to purchase polysilicon that we do not need, resulting in either storage costs
36

or payment for polysilicon we nevertheless choose not to accept from such suppliers. Further, we face significant,
specific counterparty risk under long-term supply agreements when dealing with suppliers without a long, stable
production and financial history. In the event any such supplier experiences financial difficulties or goes into
bankruptcy, it could be difficult or impossible, or may require substantial time and expense, for us to recover any or
all of our prepayments. Any of the foregoing could materially harm our financial condition and results of operations.
We will continue to be dependent on a limited number of third-party suppliers for certain raw materials and
components for our products, which could prevent us from delivering our products to our customers within
required timeframes and could in turn result in sales and installation delays, cancellations, penalty payments, and
loss of market share.
We rely on a limited number of third-party suppliers for certain raw materials and components for our solar cells,
panels and power systems, such as polysilicon, inverters and module material. If we fail to maintain our relationships
with our suppliers or to build relationships with new suppliers, or if suppliers are unable to meet demand through
industry consolidation, we may be unable to manufacture our products or our products may be available only at a
higher cost or after a long delay.
To the extent the processes that our suppliers use to manufacture components are proprietary, we may be unable
to obtain comparable components from alternative suppliers. In addition, the financial markets could limit our
suppliers’ ability to raise capital if required to expand their production or satisfy their operating capital requirements.
As a result, they could be unable to supply necessary raw materials, inventory and capital equipment which we would
require to support our planned sales operations to us, which would in turn negatively impact our sales volume,
profitability, and cash flows. The failure of a supplier to supply raw materials or components in a timely manner, or
to supply raw materials or components that meet our quality, quantity and cost requirements, could impair our ability
to manufacture our products or could increase our cost of production. If we cannot obtain substitute materials or
components on a timely basis or on acceptable terms, we could be prevented from delivering our products to our
customers within required time frames.
Any such delays could result in sales and installation delays, cancellations, penalty payments or loss of revenue
and market share, any of which could have a material adverse effect on our business, results of operations, and
financial condition.
We utilize construction loans, term loans, sale-leaseback, partnership flip, preferred equity, and other financing
structures to fund acquisition, development, construction, and expansion of certain solar projects, and such funds
may or may not continue to be available as required to further our plans. Furthermore, such project financing
increases our consolidated debt and may be structurally senior to other debt such as our 2019 Revolver and
outstanding convertible debentures.
Certain of our subsidiaries and other affiliates are separate and distinct legal entities and, except in limited
circumstances, have no obligation to pay any amounts due with respect to our indebtedness or indebtedness of other
subsidiaries or affiliates, and do not guarantee the payment of interest on or principal of such indebtedness.
Such subsidiaries may borrow funds to finance particular projects. In the event of a default under a project financing
which we do not cure, the lenders or lessors generally have rights to the power plant project and related assets. In
the event of foreclosure after a default, we may not be able to retain any interest in the power plant project or other
collateral supporting such financing. In addition, any such default or foreclosure may trigger cross default provisions
in our other financing agreements, including our corporate debt obligations, which could materially and adversely
affect our results of operations. In the event of our bankruptcy, liquidation or reorganization (or the bankruptcy,
liquidation or reorganization of a subsidiary or affiliate), such subsidiaries’ or other affiliates’ creditors, including
trade creditors and holders of debt issued by such subsidiaries or affiliates, will generally be entitled to payment of
their claims from the assets of those subsidiaries or affiliates before any assets are made available for distribution to
us or the holders of our indebtedness. As a result, holders of our corporate indebtedness will be effectively
subordinated to all present and future debts and other liabilities (including trade payables) of certain of our
subsidiaries. As of December 29, 2019, our subsidiaries had $9.1 million in subsidiary project financing, which is
effectively senior to our corporate debt, such as our 2019 Revolver, our 4.00% debentures due 2023 and our 0.875%
debentures due 2021.
37

Risks Related to Our Operations
We have significant international activities and customers, and plan to continue these efforts, which subject us toadditional business risks, including logistical complexity and political instability.
A substantial portion of our sales are made to customers outside of the United States, and a substantial portion
of our supply agreements are with supply and equipment vendors located outside of the United States. We have solar
cell and module production lines located at our manufacturing facilities in the Philippines, Mexico, France, and
Malaysia.
Risks we face in conducting business internationally include:
• multiple, conflicting and changing laws and regulations, export and import restrictions, employment laws,
environmental protection, regulatory requirements, international trade agreements, and other government
approvals, permits and licenses;
• difficulties and costs in staffing and managing foreign operations as well as cultural differences;
• potentially adverse tax consequences associated with current, future or deemed permanent establishment of
operations in multiple countries;
• relatively uncertain legal systems, including potentially limited protection for intellectual property rights,
and laws, changes in the governmental incentives we rely on, regulations and policies which impose
additional restrictions on the ability of foreign companies to conduct business in certain countries or
otherwise place them at a competitive disadvantage in relation to domestic companies;
• inadequate local infrastructure and developing telecommunications infrastructures;
• financial risks, such as longer sales and payment cycles and greater difficulty collecting accounts
receivable;
• currency fluctuations, government-fixed foreign exchange rates, the effects of currency hedging activity,
and the potential inability to hedge currency fluctuations;
• political and economic instability, including wars, acts of terrorism, political unrest, boycotts, curtailments
of trade and other business restrictions;
• trade barriers such as export requirements, tariffs, taxes and other restrictions and expenses, which could
increase the prices of our products and make us less competitive in some countries; and
• liabilities associated with compliance with laws (for example, the Foreign Corrupt Practices Act in the U.S.
and similar laws outside of the U.S.).
We have a complex organizational structure involving many entities globally. This increases the potential impact
of adverse changes in laws, rules and regulations affecting the free flow of goods and personnel, and therefore
heightens some of the risks noted above. Further, this structure requires us to effectively manage our international
inventory and warehouses. If we fail to do so, our shipping movements may not correspond with product demand and
flow. Unsettled intercompany balances between entities could result, if changes in law, regulations or related
interpretations occur, in adverse tax or other consequences affecting our capital structure, intercompany interest rates
and legal structure. If we are unable to successfully manage any such risks, any one or more could materially and
negatively affect our business, financial condition and results of operations.
If we experience interruptions in the operation of our solar cell production lines, our revenue and results ofoperations may be materially and adversely affected.
If our solar cell or module production lines suffer problems that cause downtime, we might be unable to meet
our production targets, which would adversely affect our business. Our manufacturing activities require significant
management attention, a significant capital investment and substantial engineering expenditures.
The success of our manufacturing operations is subject to significant risks including:
• cost overruns, delays, supply shortages, equipment problems and other operating difficulties;
• custom-built equipment may take longer or cost more to engineer than planned and may never operate as
designed;
38

• incorporating first-time equipment designs and technology improvements, which we expect to lower unit
capital and operating costs, may not be successful;
• our ability to obtain or maintain third-party financing to fund capital requirements;
• difficulties in maintaining or improving our historical yields and manufacturing efficiencies;
• difficulties in protecting our intellectual property and obtaining rights to intellectual property developed by
our manufacturing partners;
• difficulties in hiring and retaining key technical, management, and other personnel;
• impacts that may arise from natural disasters and epidemics; and
• potential inability to obtain, or obtain in a timely manner, financing, or approvals from governmental
authorities for operations; and
• tariffs imposed on imported solar cells and modules which may cause market volatility, price fluctuations,
supply shortages, and project delays.
Any of these or similar difficulties may unexpectedly delay or increase costs of our supply of solar cells, which
could adversely impact our business and operating results. For example, in December 2019, a strain of coronavirus
was reported to have surfaced in Wuhan, China, resulting in extended holidays and travel restrictions. At this point,
the extent to which the coronavirus may impact our supply, operations, or sale of our products is uncertain.
If we do not achieve satisfactory yields or quality in manufacturing our solar products, our sales could decreaseand our relationships with our customers and our reputation may be harmed.
The manufacture of solar cells is a highly complex process. Minor deviations in the manufacturing process can
cause substantial decreases in yield and in some cases, cause production to be suspended or yield no output. We have
from time to time experienced lower than anticipated manufacturing yields. As we expand our manufacturing
capacity and qualify additional suppliers, we may initially experience lower yields. If we do not achieve planned
yields, our product costs could increase, and product availability would decrease resulting in lower revenues than
expected. In addition, in the process of transforming polysilicon into ingots, a significant portion of the polysilicon
is removed in the process. In circumstances where we provide the polysilicon, if our suppliers do not have very strong
controls in place to ensure maximum recovery and utilization, our economic yield can be less than anticipated, which
would increase the cost of raw materials to us.
Additionally, products as complex as ours may contain undetected errors or defects, especially when first
introduced. For example, our solar cells or solar panels may contain defects that are not detected until after they are
shipped or are installed because we cannot test for all possible scenarios. These defects could cause us to incur
significant warranty, non-warranty, and re-engineering costs, divert the attention of our engineering personnel from
product development efforts, and significantly affect our customer relations and business reputation. If we deliver
solar products with errors or defects, including cells or panels of third-party manufacturers, or if there is a perception
that such solar products contain errors or defects, our credibility and the market acceptance and sales of our products
could be harmed. In addition, some of our arrangements with customers include termination or put rights for
non-performance. In certain limited cases, we could incur liquidated damages or even be required to buy back a
customer’s system at fair value on specified future dates if certain minimum performance thresholds are not met.
A change in the solar investment tax credit could adversely affect our business, revenues, margins, results ofoperations and cash flows.
We have incorporated into our financial planning and agreements with our customers certain assumptions
regarding the future level of U.S. tax incentives, including the ITC, which is administered by the Internal Revenue
Service (‘‘IRS’’). The ITC allows qualified applicants to claim an amount equal to 26% of the eligible cost basis for
qualifying solar energy property. We hold projects and have sold projects to certain customers based on certain
underlying assumptions regarding the ITC. We have also accounted for certain projects and programs in our business
using the same assumptions.
Owners of our qualifying projects and our residential lease program have applied or will apply for the ITC and
the assumptions regarding expected tax benefits, both in timing and amount, are made in accordance with the
guidance provided by the IRS. Any changes to the IRS guidance which we relied upon in structuring our projects,
39

failure to comply with the requirements, including the safe harbor guidance, lower levels of incentives granted, or
changes in assumptions including the estimated residual values and the estimated fair market value of financed and
installed systems for the purposes of the ITC, could materially and adversely affect our business and results of
operations. If the IRS disagrees, as a result of any future review or audit, with the fair market value of, or other
assumptions concerning, our solar projects or systems that we have constructed or that we construct in the future,
including the systems for which tax incentives have already been paid, it could have a material adverse effect on our
business and financial condition. We also have obligations to indemnify certain of our customers and investors for
the loss of tax incentives. We may have to recognize impairments or lower margins than initially anticipated for
certain of our projects or our residential lease program. Additionally, if the amount or timing of ITCs received varies
from what we have projected, our revenues, margins and cash flows could be adversely affected and we may have
to recognize losses, which would have a material adverse effect on our business, results of operations and financial
condition.
There are continuing developments in the interpretation and application of how companies should calculate their
eligibility and level of ITC incentives. There have been recent cases in the U.S. district courts that challenge the
criteria for a true lease, which could impact whether the structure of our residential lease program qualifies under the
ITC. If the IRS redetermines the amount of the ITC, investors may be required to make corresponding adjustments
to their taxable income or other changes. Such adjustments may provide us with an indication of IRS practice
regarding the valuation of residential leased solar assets, and we would consider such adjustments in our accounting
for our indemnification obligations to investors who receive ITCs.
Acquisitions of other companies, project development pipelines and other assets, or investments in joint ventureswith other companies could materially and adversely affect our financial condition and results of operations, anddilute our stockholders’ equity.
To expand our business and maintain our competitive position, we have acquired a number of other companies
and entered into several joint ventures over the past several years, including our acquisitions of Cogenra Solar, Inc.
and Solaire Generation, Inc. in fiscal 2015, our acquisition of 100% of the equity voting interest in our former joint
venture AUO SunPower Sdn. Bhd. in fiscal 2016, our entry into a manufacturing joint venture in China in 2017, and
our SunStrong and Solar Sail joint ventures with Hannon Armstrong and acquisition of SolarWorld Americas in fiscal
2018 and 2019. In the future, we may acquire additional companies, project pipelines, products, or technologies or
enter into additional joint ventures or other strategic initiatives.
Acquisitions and joint ventures involve a number of risks that could harm our business and result in the acquired
business or joint venture not performing as expected, including:
• insufficient experience with technologies and markets in which the acquired business or joint venture is
involved, which may be necessary to successfully operate and/or integrate the business or the joint venture;
• problems integrating the acquired operations, personnel, IT infrastructure, technologies or products with the
existing business and products;
• diversion of management time and attention from the core business to the acquired business or joint
venture;
• potential failure to retain or hire key technical, management, sales and other personnel of the acquired
business or joint venture;
• difficulties in retaining or building relationships with suppliers and customers of the acquired business or
joint venture, particularly where such customers or suppliers compete with us;
• potential failure of the due diligence processes to identify significant issues with product quality and
development or legal and financial liabilities, among other things;
• potential inability to obtain, or obtain in a timely manner, approvals from governmental authorities or work
councils, which could delay or prevent acquisitions, delay our ability to achieve synergies, or adversely
impact our successful operation of acquired companies or joint ventures;
• potential necessity to re-apply for permits of acquired projects;
• problems managing joint ventures with our partners, meeting capital requirements for expansion, potential
litigation with joint venture partners and reliance upon joint ventures which we do not control;
40
• differences in philosophy, strategy, or goals with our joint venture partners;
• subsequent impairment of the acquired assets, including intangible assets; and
• assumption of liabilities including, but not limited to, lawsuits, tax examinations, warranty issues,
environmental matters, and liabilities associated with compliance with laws (for example, the FCPA).
Additionally, we may decide that it is in our best interests to enter into acquisitions or joint ventures that are
dilutive to earnings per share or that negatively impact margins as a whole. In an effort to reduce our cost of revenue,
we have and may continue to enter into acquisitions or joint ventures involving suppliers or manufacturing partners,
which would expose us to additional supply chain risks. Acquisitions or joint ventures could also require investment
of significant financial resources and require us to obtain additional equity financing, which may dilute our
stockholders’ equity, or require us to incur additional indebtedness. Such equity or debt financing may not be
available on terms acceptable to us. In addition, we could in the future make additional investments in our joint
ventures or guarantee certain financial obligations of our joint ventures, which could reduce our cash flows, increase
our indebtedness and expose us to the credit risk of our joint ventures.
To the extent that we invest in upstream suppliers or downstream channel capabilities, we may experience
competition or channel conflict with certain of our existing and potential suppliers and customers. Specifically,
existing and potential suppliers and customers may perceive that we are competing directly with them by virtue of
such investments and may decide to reduce or eliminate their supply volume to us or order volume from us.
In particular, any supply reductions from our polysilicon, ingot or wafer suppliers could materially reduce
manufacturing volume.
Acquisitions could also result in dilutive issuances of equity securities, the use of our available cash, or the
incurrence of debt, which could harm our operating results.
We obtain certain of our capital equipment used in our manufacturing process from sole suppliers and if thisequipment is damaged or otherwise unavailable, our ability to deliver products on time will suffer, which in turncould result in order cancellations and loss of revenue.
Some of the capital equipment used in the manufacture of our solar power products has been developed and
made specifically for us, is not readily available from multiple vendors and would be difficult to repair or replace if
it were to become damaged or stop working. If any of these suppliers were to experience financial difficulties or go
out of business, or if there were any damage to or a breakdown of our manufacturing equipment, our business would
suffer. In addition, a supplier’s failure to supply this equipment in a timely manner, with adequate quality and on
terms acceptable to us, could delay our future capacity expansion or manufacturing process improvements and
otherwise disrupt our production schedule or increase our costs of production.
If we cannot offer residential lease customers an attractive value proposition due to an inability to continue tomonetize tax benefits in connection with our residential lease arrangements, an inability to obtain financing forour residential lease program, challenges implementing our third-party ownership model in new jurisdictions,declining costs of retail electricity, or other reasons, we may be unable to continue to increase the size of ourresidential lease program, which could have a material, adverse effect on our business, results of operations, andfinancial condition.
Our residential lease program has been eligible for the ITC. We have relied on, and expect to continue to rely
on, financing structures that monetize a substantial portion of those benefits. If we were unable to continue to
monetize the tax benefits in our financing structures or such tax benefits were reduced or eliminated, we might be
unable to provide financing or pricing that is attractive to our customers. Under current law, the ITC was reduced
from approximately 30% of the cost of the solar system to approximately 26% for solar systems placed into service
after December 31, 2019, and will be further reduced to approximately 22% for solar systems placed into service after
December 31, 2020, before being reduced permanently to 10% for commercial projects and 0% for residential
projects.
Changes in existing law and interpretations by the IRS and the courts could reduce the willingness of financing
partners to invest in funds associated with our residential lease program. Additionally, benefits under the ITC
programs are tied, in part, to the fair market value of our systems, as ultimately determined by the federal agency
administering the benefit program. This means that, in connection with implementing financing structures that
monetize such benefits, we need to, among other things, assess the fair market value of our systems in order to arrive
41

at an estimate of the amount of tax benefit expected to be derived from the benefit programs. We incorporate
third-party valuation reports that we believe to be reliable into our methodology for assessing the fair market value
of our systems, but these reports or other elements of our methodology may cause our fair market value estimates
to differ from those ultimately determined by the federal agency administering the applicable benefit program. If the
amount or timing of the ITC received in connection with our residential lease program varies from what we have
projected, due to discrepancies in our fair value assessments or otherwise, our revenues, cash flows, and margins
could be adversely affected.
Additionally, if any of our financing partners that currently provide financing for our solar systems decide not
to continue to provide financing due to general market conditions, changes in tax benefits associated with our solar
systems, concerns about our business or prospects, or any other reason, or if they materially change the terms under
which they are willing to provide future financing, we will need to identify new financing partners and negotiate new
financing terms.
See also under this section, ‘‘Risks Related to Our Supply Chain—A change in the solar investment tax credit
could adversely affect our business, revenues, margins, results of operations and cash flows.’’
We have to continuously build and improve infrastructure to support our residential lease program, and any
failure or delay in implementing the necessary processes and infrastructure could adversely affect our financial
results. We establish credit approval limits based on the credit quality of our customers. We may be unable to collect
rent payments from our residential lease customers in the event they enter into bankruptcy or otherwise fail to make
payments when due. If we experience higher customer default rates than we currently experience or if we lower credit
rating requirements for new customers, it could be more difficult or costly to attract future financing. See also under
this section, ‘‘Risks Related to Our Sales Channels—The execution of our growth strategy is dependent upon the
continued availability of third-party financing arrangements for our solar power plants, our residential lease
program, and our customers, and is affected by general economic conditions.’’
We make certain assumptions in accounting for our residential lease program, including, among others,
assumptions in accounting for our residual value of the leased systems. As our residential lease program grows, if the
residual value of leased systems does not materialize as assumed, it will adversely affect our results of operations.
At the end of the term of the lease, our customers have the option to extend the lease and certain of those customers
may either purchase the leased systems at fair market value or return them to us. Should there be a large number of
returns, we may incur de-installation costs in excess of amounts reserved.
We believe that, as with our other customers, retail electricity prices factor significantly into the value
proposition of our products for our residential lease customers. If prices for retail electricity or electricity from other
renewable sources decrease, our ability to offer competitive pricing in our residential lease program could be
jeopardized because such decreases would make the purchase of our solar systems or the purchase of energy under
our lease agreements and PPAs less economically attractive.
Our leases are third-party ownership arrangements. Sales of electricity by third parties face regulatory
challenges in some states and jurisdictions. Other challenges pertain to whether third-party owned systems qualify
for the same levels of rebates or other non-tax incentives available for customer-owned solar energy systems.
Reductions in, or eliminations of, this treatment of these third-party arrangements could reduce demand for our
residential lease program. As we look to extend the third-party ownership model outside of the United States, we will
be faced with the same risks and uncertainties we have in the United States. Our growth outside of the United States
could depend on our ability to expand the third-party ownership model, and our failure to successfully implement a
third-party ownership model globally could adversely affect our financial results.
Our success depends on the continuing contributions of our key personnel.
We rely heavily on the services of our key executive officers and the loss of services of any principal member
of our management team could adversely affect our operations. We have experienced significant turnover in our
management team in the recent past, and we are investing significant resources in developing new members of
management as we complete our restructuring and strategic transformation. In connection with our separation into
two public companies through the Spin-Off, members of SunPower’s management team may accept roles with
Maxeon Solar. We also anticipate that over time we will need to hire a number of highly skilled technical,
manufacturing, sales, marketing, administrative, and accounting personnel. In recent years, we have conducted
several restructurings, which may negatively affect our ability to execute our strategy and business model, and may
42

impair our ability to retain key talent required to provide transition services during such restructurings.
The competition for qualified personnel is intense in our industry. We may not be successful in attracting and
retaining sufficient numbers of qualified personnel to support our anticipated growth. We cannot guarantee that any
employee will remain employed with us for any definite period of time since all of our employees, including our key
executive officers, serve at-will and may terminate their employment at any time for any reason.
Project development or construction activities may not be successful, and we may make significant investmentswithout first obtaining project financing, which could increase our costs and impair our ability to recover ourinvestments.
The development and construction of solar power electric generation facilities and other energy infrastructure
projects involve numerous risks. We may be required to spend significant sums for preliminary engineering,
permitting, legal, and other expenses before we can determine whether a project is feasible, economically attractive
or capable of being built. In addition, we will often choose to bear the costs of such efforts prior to obtaining project
financing, prior to getting final regulatory approval, and prior to our final sale to a customer, if any.
Successful completion of a particular project may be adversely affected by numerous factors, including:
• failures or delays in obtaining desired or necessary land rights, including ownership, leases and/or
easements;
• failures or delays in obtaining necessary permits, licenses or other governmental support or approvals, or
in overcoming objections from members of the public or adjoining land owners;
• unforeseen engineering problems;
• uncertainties relating to access to available transmission for electricity generated by our solar power
systems and delays in interconnection of such systems;
• construction delays and contractor performance shortfalls;
• work stoppages or labor disruptions and compliance with labor regulations;
• cost over-runs;
• availability of products and components from suppliers;
• adverse weather conditions;
• environmental, archaeological and geological conditions; and
• availability of construction and permanent financing.
If we are unable to complete the development of a solar power project, or fail to meet one or more agreed target
construction milestone dates, we may be subject to liquidated damages and/or penalties under the EPC agreement or
other agreements relating to the power plant, and we typically will not be able to recover our investment in the
project. We expect to invest a significant amount of capital to develop projects initially owned by us or ultimately
owned by third parties. If we are unable to complete the development of a solar power project, we may write-down
or write-off some or all of these capitalized investments, which would have an adverse impact on our net income in
the period in which the loss is recognized.
We act as the general contractor for many of our customers in connection with the installations of our solar powersystems and are subject to risks associated with construction, cost overruns, delays and other contingencies tiedto performance bonds and letters of credit, or other required credit and liquidity support guarantees, any of whichcould have a material adverse effect on our business and results of operations.
We act as the general contractor for many of our customers in connection with the installation of our solar power
systems. Some customers require performance bonds issued by a bonding agency or letters of credit issued by
financial institutions, or may require other forms of liquidity support. Due to the general performance risk inherent
in construction activities, it has become increasingly difficult to attain suitable bonding agencies willing to provide
performance bonding. Obtaining letters of credit may require collateral. In the event we are unable to obtain bonding,
sufficient letters of credit, or other liquidity support, we will be unable to bid on, or enter into, sales contracts
requiring such bonding.
43

Almost all of our EPC contracts are fixed price contracts. We attempt to estimate all essential costs at the time
of entering into the EPC contract for a particular project, and these are reflected in the overall price that we charge
our customers for the project. These cost estimates are preliminary and may or may not be covered by contracts
between us or the subcontractors, suppliers, and any other parties that may become necessary to complete the project.
In addition, we require qualified, licensed subcontractors to install most of our systems. Thus, if the cost of materials
or skilled labor were to rise dramatically, or if financing costs were to increase, our operating results could be
adversely affected.
In addition, the contracts with some of our larger customers obligate us to pay substantial penalty payments for
each day or other period beyond an agreed target date that a solar installation for any such customer is not completed,
up to and including the return of the entire project sale price. This is particularly true in Europe, where long-term,
fixed feed-in tariffs available to investors are typically set during a prescribed period of project completion, but the
fixed amount declines over time for projects completed in subsequent periods. We face material financial penalties
in the event we fail to meet the completion deadlines, including but not limited to a full refund of the contract price
paid by the customers. In certain cases we do not control all of the events which could give rise to these penalties,
such as reliance on the local utility to timely complete electrical substation construction.
Furthermore, investors often require that the solar power system generate specified levels of electricity in order
to maintain their investment returns, allocating substantial risk and financial penalties to us if those levels are not
achieved, up to and including the return of the entire project sale price. Also, our customers often require protections
in the form of conditional payments, payment retentions or holdbacks, and similar arrangements that condition its
future payments on performance. Delays in solar panel or other supply shipments, other construction delays,
unexpected performance problems in electricity generation or other events could cause us to fail to meet these
performance criteria, resulting in unanticipated and severe revenue and earnings losses and financial penalties.
Construction delays are often caused by inclement weather, failure to timely receive necessary approvals and permits,
or delays in obtaining necessary solar panels, inverters or other materials. Additionally, we sometimes purchase land
in connection with project development and assume the risk of project completion. All such risks could have a
material adverse effect on our business and results of operations.
We could be adversely affected by any violations of the FCPA and foreign anti-bribery laws.
The FCPA generally prohibits companies and their intermediaries from making improper payments to non-U.S.
government officials for the purpose of obtaining or retaining business. Other countries in which we operate also have
anti-bribery laws, some of which prohibit improper payments to government and non-government persons and
entities. Our policies mandate compliance with these anti-bribery laws. We continue to acquire businesses outside of
the United States and operate in many parts of the world that have experienced governmental corruption to some
degree and, in certain circumstances, strict compliance with anti-bribery laws may conflict with local customs and
practices. In addition, due to the level of regulation in our industry, our entry into new jurisdictions through internal
growth or acquisitions requires substantial government contact where norms can differ from U.S. standards. While
we implement policies and procedures and conduct training designed to facilitate compliance with these anti-bribery
laws, thereby mitigating the risk of violations of such laws, our employees, subcontractors and agents may take
actions in violation of our policies and anti-bribery laws. Any such violation, even if prohibited by our policies, could
subject us to criminal or civil penalties or other sanctions, which could have a material adverse effect on our business,
financial condition, cash flows, and reputation.
Fluctuations in the demand for our products may cause impairment of our project assets and other long-livedassets or cause us to write off equipment or inventory, and each of these events would adversely affect ourfinancial results.
We have tangible project assets on our Consolidated Balance Sheets related to capitalized costs incurred in
connection with the development of solar power systems. Project assets consist primarily of capitalized costs relating
to solar power system projects in various stages of development that we incur prior to the sale of the solar power
system to a third party. These costs include costs for land and costs for developing and constructing a solar power
system. These project assets could become impaired if there are changes in the fair value of these capitalized costs.
If these project assets become impaired, we may write-off some or all of the capitalized project assets, which would
have an adverse impact on our financial results in the period in which the loss is recognized.
In addition, if the demand for our solar products decreases, our manufacturing capacity could be underutilized,
and we may be required to record an impairment of our long-lived assets, including facilities and equipment, which
44

would increase our expenses. In improving our manufacturing processes consistent with our cost reduction roadmap,
we could write off equipment that is removed from the manufacturing process. In addition, if product demand
decreases or we fail to forecast demand accurately, we could be required to write off inventory or record excess
capacity charges, which would have a negative impact on our gross margin. Factory-planning decisions may shorten
the useful lives of long-lived assets, including facilities and equipment, and cause us to accelerate depreciation. Each
of the above events would adversely affect our future financial results.
We may not be able to expand our business or manage our future growth effectively.
We may not be able to expand our business or manage future growth. We plan to continue to improve our
manufacturing processes and build additional manufacturing production over the next five years, which will require
successful execution of:
• expanding our existing manufacturing facilities and developing new manufacturing facilities, which would
increase our fixed costs and, if such facilities are underutilized, would negatively impact our results of
operations;
• ensuring delivery of adequate polysilicon, ingots, and third-party cells;
• enhancing our customer resource management and manufacturing management systems;
• implementing and improving additional and existing administrative, financial and operations systems,
procedures and controls, including the need to centralize, update and integrate our global financial internal
control;
• hiring additional employees;
• expanding and upgrading our technological capabilities;
• managing multiple relationships with our customers, suppliers and other third parties;
• maintaining adequate liquidity and financial resources; and
• continuing to increase our revenues from operations.
Improving our manufacturing processes, expanding our manufacturing facilities or developing new facilities
may be delayed by difficulties such as unavailability of equipment or supplies or equipment malfunction. Ensuring
delivery of adequate polysilicon, ingots, and third-party cells is subject to many market risks including scarcity,
significant price fluctuations and competition. Maintaining adequate liquidity is dependent upon a variety of factors
including continued revenues from operations, working capital improvements, and compliance with our indentures
and credit agreements. If we are unsuccessful in any of these areas, we may not be able to achieve our growth strategy
and increase production capacity as planned during the foreseeable future. In addition, we need to manage our
organizational growth, including rationalizing reporting structures, support teams, and enabling efficient decision
making. For example, the administration of the residential lease program requires processes and systems to support
this business model. If we are not successful or if we delay our continuing implementation of such systems and
processes, we may adversely affect the anticipated volumes in our residential lease business. If we are unable to
manage our growth effectively, we may not be able to take advantage of market opportunities, develop new solar cells
and other products, satisfy customer requirements, execute our business plan, or respond to competitive pressures.
Fluctuations in foreign currency exchange rates and interest rates could adversely affect our business and resultsof operations.
We have significant sales globally, and we are exposed to movements in foreign exchange rates, primarily
related to sales to European customers that are denominated in Euros. A depreciation of the Euro would adversely
affect our margins on sales to European customers. When foreign currencies appreciate against the U.S. dollar,
inventories and expenses denominated in foreign currencies become more expensive. An increase in the value of the
U.S. dollar relative to foreign currencies could make our solar power products more expensive for international
customers, thus potentially leading to a reduction in demand, our sales and profitability. As a result, substantial
unfavorable changes in foreign currency exchange rates could have a substantial adverse effect on our financial
condition and results of operations. Although we seek to reduce our currency exposure by engaging in hedging
transactions where we deem it appropriate, we do not know whether our efforts will be successful. Because we hedge
some of our expected future foreign exchange exposure, if associated revenues do not materialize, we could
45

experience losses. In the past, we have experienced an adverse impact on our revenue, gross margin, cash position
and profitability as a result of foreign currency fluctuations. In addition, any break-up of the Eurozone would disrupt
our sales and supply chain, expose us to financial counterparty risk, and materially and adversely affect our results
of operations and financial condition.
We are exposed to interest rate risk because many of our customers depend on debt financing to purchase our
solar power systems. An increase in interest rates could make it difficult for our customers to obtain the financing
necessary to purchase our solar power systems on favorable terms, or at all, and thus lower demand for our solar
power products, reduce revenue and adversely affect our operating results. An increase in interest rates could lower
a customer’s return on investment in a system or make alternative investments more attractive relative to solar power
systems, which, in each case, could cause our customers to seek alternative investments that promise higher returns
or demand higher returns from our solar power systems, which could reduce our revenue and gross margin and
adversely affect our operating results. Our interest expense would increase to the extent interest rates rise in
connection with our variable interest rate borrowings. Conversely, lower interest rates have an adverse impact on our
interest income. See also ‘‘Item 7A. Quantitative and Qualitative Disclosures About Market Risk’’ and under this
section ‘‘Risks Related to Our Sales Channels-The execution of our growth strategy is dependent upon the continued
availability of third-party financing arrangements for our solar power plants, our residential lease program and our
customers, and is affected by general economic conditions.’’
Uncertainty about the continuing availability of LIBOR may adversely affect our business, financial condition,results of operations, and cash flows.
Borrowings under certain of our credit facilities bear interest at a floating rate based on the London Inter-bank
Offered Rate (‘‘LIBOR’’). We also have entered into fixed-for-floating interest rate forward swap agreements to
manage our exposure to fluctuations in the LIBOR benchmark interest rate. As described in Note 14 (Foreign
Currency and Interest Rate Derivatives) to the Condensed Consolidated Financial Statements in Part I of this Annual
Report, we pay the counterparties to these swap agreements a fixed rate in return for a LIBOR-based floating rate,
which we may use to fund payments under our credit facilities. The aggregate notional amount of these swap
agreements is $6.1 million. Please see Item 8. Financial Statements Note 12. Derivative Financial Instruments for
more details.
In July 2017, the United Kingdom’s Financial Conduct Authority (the ‘‘FCA’’), which regulates LIBOR,
announced that after December 31, 2021, it would no longer compel banks to submit the rates required to calculate
LIBOR. We cannot predict the effect of the FCA’s decision not to sustain LIBOR or, if changes ultimately are made
to LIBOR, the effect those changes may have on the interest we pay on our 2019 Revolver and the payments we
receive under our interest rate forward swap agreements.
In anticipation of LIBOR’s discontinuation, our credit facilities generally provide a transition mechanism to a
LIBOR-replacement rate to be mutually agreed upon by us and our lenders. There can be no assurance, however, that
we will be able to reach an agreement with our lenders on any such replacement benchmark before experiencing
adverse effects due to changes in interest rates, if at all. In addition, any such changes under the credit facilities may
result in interest rates and/or payments that are higher or lower than payments we presently are obligated to make.
We also may seek to amend our swap agreements to replace the benchmark rate. There can be no assurance, however,
that the counterparties to those agreements will agree to a replacement rate, and any such changes to the swap
agreements may result in us receiving payments that are higher or lower than the payments we are entitled to receive
under our existing swap agreements. There also can be no assurance that (a) the amounts we are entitled to receive
under the swap agreements will continue to be correlated with the amounts we are required to pay under our credit
facilities or (b) transitions to new benchmarks will be concurrent across our various agreements, the failure of either
or both of which could diminish the swaps’ effectiveness as hedging instruments. Any of these risks could adversely
affect our business, financial condition, results of operations, and cash flows.
We depend on third-party contract manufacturers to assemble a portion of our solar cells into solar panels andany failure to obtain sufficient assembly and test capacity could significantly delay our ability to ship our solarpanels and damage our customer relationships.
We outsource a portion of module manufacturing to contract manufacturers in China. As a result of outsourcing
this final step in our production, we face several significant risks, including limited control over assembly and testing
capacity, delivery schedules, quality assurance, manufacturing yields, production costs and tariffs. If the operations
46

of our third-party contract manufacturers were disrupted or their financial stability impaired, or if they were unable
or unwilling to devote capacity to our solar panels in a timely manner, our business could suffer as we might be
unable to produce finished solar panels on a timely basis. We also risk customer delays resulting from an inability
to move module production to an alternate provider or to complete production internationally, and it may not be
possible to obtain sufficient capacity or comparable production costs at another facility in a timely manner.
In addition, migrating our design methodology to third-party contract manufacturers or to a captive panel assembly
facility could involve increased costs, resources and development time, and utilizing additional third-party contract
manufacturers could expose us to further risk of losing control over our intellectual property and the quality of our
solar panels. Any reduction in the supply of solar panels could impair our revenue by significantly delaying our
ability to ship products and potentially damage our relationships with new and existing customers, any of which could
have a material and adverse effect on our financial condition and results of operation.
While we believe we currently have effective internal control over financial reporting, we may identify a materialweakness in our internal control over financial reporting that could cause investors to lose confidence in thereliability of our financial statements and result in a decrease in the value of our common stock.
Our management is responsible for maintaining internal control over financial reporting designed to provide
reasonable assurance regarding the reliability of financial reporting and the preparation of consolidated financial
statements for external purposes in accordance with U.S. GAAP. Management concluded that as of the end of each
of fiscal 2019, 2018, and 2017, our internal control over financial reporting and our disclosure controls and
procedures were effective.
We need to continuously maintain our internal control processes and systems and adapt them as our business
grows and changes. This process is expensive, time-consuming, and requires significant management attention.
We cannot be certain that our internal control measures will continue to provide adequate control over our financial
processes and reporting and ensure compliance with Section 404 of the Sarbanes-Oxley Act. Furthermore, as we grow
our business or acquire other businesses, our internal controls may become more complex and we may require
significantly more resources to ensure they remain effective. Failure to implement required new or improved controls,
or difficulties encountered in their implementation, either in our existing business or in businesses that we may
acquire, could harm our operating results or cause us to fail to meet our reporting obligations. If we or our
independent registered public accounting firm identify material weaknesses in our internal controls, the disclosure of
that fact, even if quickly remedied, may cause investors to lose confidence in our financial statements and the trading
price of our common stock may decline.
Remediation of a material weakness could require us to incur significant expense and if we fail to remedy any
material weakness, our financial statements may be inaccurate, our ability to report our financial results on a timely
and accurate basis may be adversely affected, our access to the capital markets may be restricted, the trading price
of our common stock may decline, and we may be subject to sanctions or investigation by regulatory authorities,
including the SEC or The NASDAQ Global Select Market. We may also be required to restate our financial
statements from prior periods.
We may in the future be required to consolidate the assets, liabilities and financial results of certain of our existingor future joint ventures, which could have an adverse impact on our financial position, gross margin, andoperating results.
The Financial Accounting Standards Board has issued accounting guidance regarding variable interest entities
(‘‘VIEs’’) that affects our accounting treatment of our existing and future joint ventures. To ascertain whether we are
required to consolidate an entity, we determine whether it is a VIE and if we are the primary beneficiary in accordance
with the accounting guidance. Factors we consider in determining whether we are the VIE’s primary beneficiary
include the decision making authority of each partner, which partner manages the day-to-day operations of the joint
venture and each partner’s obligation to absorb losses or right to receive benefits from the joint venture in relation
to that of the other partner. Changes in the financial accounting guidance, or changes in circumstances at each of these
joint ventures, could lead us to determine that we have to consolidate the assets, liabilities and financial results of
such joint ventures. The consolidation of our VIEs would significantly increase our indebtedness and could have a
material adverse impact on our financial position, gross margin and operating results. In addition, we may enter into
future joint ventures or make other equity investments, which could have an adverse impact on us because of the
financial accounting guidance regarding VIEs.
47

Our affiliation with Total S.A. may require us to join in certain tax filings with Total S.A. in the future. Theallocation of tax liabilities between us and Total S.A., and any future agreements with Total S.A. regarding taxindemnification and certain tax liabilities may adversely affect our financial position.
We have not joined in tax filings on a consolidated, combined or unitary basis with Total S.A., and no tax sharing
agreement is currently in place. We may in the future become required to join in certain tax filings with Total S.A.
on a consolidated, combined, or unitary basis in certain jurisdictions, at which point we may seek to enter into a tax
sharing agreement with Total S.A., which would allocate the tax liabilities among the parties. The entry into any
future agreement with Total S.A. may result in less favorable allocation of certain liabilities than we experienced
before becoming subject to consolidated, combined, or unitary filing requirements, and may adversely affect our
financial position.
Our headquarters and manufacturing facilities, as well as the facilities of certain subcontractors and suppliers,are located in regions that are subject to epidemics, earthquakes, floods, fires, and other natural disasters, andclimate change and climate change regulation could have an adverse effect on our operations.
Our headquarters and research and development operations are located in California, and our manufacturing
facilities are located in the Philippines, Malaysia, France, Mexico and Oregon, U.S. Any significant epidemic,
earthquake, flood, fire or other natural disaster in these countries or countries where our suppliers are located could
materially disrupt our management operations and/or our production capabilities, could result in damage or
destruction of all portion of our facilities or could result in our experiencing a significant delay in delivery, or
substantial shortage, of our products and services. For example, ash and debris from volcanic activity at the Taal
Volcano in the Philippines forced closures and evacuations of nearby areas in January 2020 and impacted our
employees.
In addition, legislators, regulators, and non-governmental organizations, as well as companies in many business
sectors, are considering ways to reduce green-house gas emissions. Further regulation could be forthcoming at the
federal or state level with respect to green-house gas emissions. Such regulation or similar regulations in other
countries could result in regulatory or product standard requirements for our global business, including our
manufacturing operations. Furthermore, the potential physical impacts of climate change on our operations may
include changes in weather patterns (including floods, fires, tsunamis, drought and rainfall levels), water availability,
storm patterns and intensities, and temperature levels. These potential physical effects may adversely affect the cost,
production, sales and financial performance of our operations.
We sell our solar products to agencies of the U.S. government, and as a result, we are subject to a number ofprocurement rules and regulations, and our business could be adversely affected by an audit by the U.S.government if it were to identify errors or a failure to comply with regulations.
We have sold and continue to sell our solar power systems to various U.S. government agencies. In connection
with these contracts, we must comply with and are affected by laws and regulations relating to the award,
administration, and performance of U.S. government contracts, which may impose added costs on our business.
We are expected to perform in compliance with a vast array of federal laws and regulations, including, without
limitation, the Federal Acquisition Regulation, the Truth in Negotiations Act, the Federal False Claims Act, the
Anti-Kickback Act of 1986, the Trade Agreements Act, the Buy American Act, the Procurement Integrity Act, and
the Davis Bacon Act. A violation of specific laws and regulations, even if prohibited by our policies, could result in
the imposition of fines and penalties, reductions of the value of our contracts, contract modifications or termination,
or suspension or debarment from government contracting for a period of time.
In some instances, these laws and regulations impose terms or rights that are more favorable to the government
than those typically available to commercial parties in negotiated transactions. For example, the U.S. government
may terminate any of our government contracts either at its convenience or for default based on performance.
A termination arising out of our default may expose us to liability and have a material adverse effect on our ability
to compete for future contracts.
U.S. government agencies may audit and investigate government contractors. These agencies review a
contractor’s performance under its contracts, cost structure, and compliance with applicable laws, regulations, and
standards. If an audit or investigation uncovers improper or illegal activities, we may be subject to civil or criminal
penalties and administrative sanctions, including termination of contracts, forfeiture of profits, suspension of
payments, fines, and suspension or prohibition from doing business with the U.S. government. In addition, we could
suffer reputational harm if allegations of impropriety were made against us.
48

Compliance with environmental regulations can be expensive, and noncompliance with these regulations mayresult in adverse publicity and potentially significant monetary damages and fines.
We are required to comply with all foreign, U.S. federal, state and local laws and regulations regarding pollution
control and protection of the environment. In addition, under some statutes and regulations, a government agency,
or other parties, may seek recovery and response costs from owners or operators of property where releases of
hazardous substances have occurred or are ongoing, even if the owner or operator was not responsible for such release
or otherwise at fault. We use, generate and discharge toxic, volatile and otherwise hazardous chemicals and wastes
in our research and development and manufacturing activities. Any failure by us to control the use of, or to restrict
adequately the discharge of, hazardous substances could subject us to, among other matters, potentially significant
monetary damages and fines or liabilities or suspensions in our business operations. In addition, if more stringent
laws and regulations are adopted in the future, the costs of compliance with these new laws and regulations could
be substantial. If we fail to comply with present or future environmental laws and regulations, we may be required
to pay substantial fines, suspend production or cease operations, or be subjected to other sanctions.
In addition, U.S. legislation includes disclosure requirements regarding the use of ‘‘conflict’’ minerals mined
from the Democratic Republic of Congo and adjoining countries and procedures regarding a manufacturer’s efforts
to prevent the sourcing of such ‘‘conflict’’ minerals. We have incurred and will incur additional costs to comply with
the disclosure requirements, including costs related to determining the source of any of the relevant minerals and
metals used in our products. The implementation of these requirements could affect the sourcing and availability of
minerals used in the manufacture of solar products. As a result, there may only be a limited pool of suppliers who
provide conflict free minerals, and we cannot be certain that we will be able to obtain products in sufficient quantities
or at competitive prices. Since our supply chain is complex, we have not been able to sufficiently verify, and in the
future we may not be able to sufficiently verify, the origins for these conflict minerals used in our products. As a
result, we may face reputational challenges with our customers and other stakeholders if we are unable to sufficiently
verify the origins for all minerals used in our products.
Our insurance for certain indemnity obligations we have to our officers and directors may be inadequate, andpotential claims could materially and negatively impact our financial condition and results of operations.
Pursuant to our certificate of incorporation, by-laws, and certain indemnification agreements, we indemnify our
officers and directors for certain liabilities that may arise in the course of their service to us. Although we currently
maintain directors and officers liability insurance for certain potential third-party claims for which we are legally or
financially unable to indemnify them, such insurance may be inadequate to cover certain claims, or may prove
prohibitively costly to maintain in the future. In addition, in previous years, we have primarily self-insured with
respect to potential third-party claims. If we were required to pay a significant amount on account of these liabilities
for which we self-insured, our business, financial condition, and results of operations could be materially harmed.
Risks Related to Our Intellectual Property
We depend on our intellectual property, and we may face intellectual property infringement claims that could betime-consuming and costly to defend and could result in the loss of significant rights.
From time to time, we, our customers, or our third parties with whom we work may receive letters, including
letters from other third parties, and may become subject to lawsuits with such third parties alleging infringement of
their patents. Additionally, we are required by contract to indemnify some of our customers and our third-party
intellectual property providers for certain costs and damages of patent infringement in circumstances where our
products are a factor creating the customer’s or these third-party providers’ infringement liability. This practice may
subject us to significant indemnification claims by our customers and our third-party providers. We cannot assure
investors that indemnification claims will not be made or that these claims will not harm our business, operating
results or financial condition. Intellectual property litigation is very expensive and time-consuming and could divert
management’s attention from our business and could have a material adverse effect on our business, operating results
or financial condition. If there is a successful claim of infringement against us, our customers or our third-party
intellectual property providers, we may be required to pay substantial damages to the party claiming infringement,
stop selling products or using technology that contains the allegedly infringing intellectual property, or enter into
royalty or license agreements that may not be available on acceptable terms, if at all. Parties making infringement
claims may also be able to bring an action before the International Trade Commission that could result in an order
49

stopping the importation into the United States of our solar products. Any of these judgments could materially
damage our business. We may have to develop non-infringing technology, and our failure in doing so or in obtaining
licenses to the proprietary rights on a timely basis could have a material adverse effect on our business.
We have filed, and may continue to file, claims against other parties for infringing our intellectual property thatmay be very costly and may not be resolved in our favor.
To protect our intellectual property rights and to maintain our competitive advantage, we have filed, and maycontinue to file, suits against parties who we believe infringe or misappropriate our intellectual property. Intellectualproperty litigation is expensive and time consuming, could divert management’s attention from our business, andcould have a material adverse effect on our business, operating results, or financial condition, and our enforcementefforts may not be successful. In addition, the validity of our patents may be challenged in such litigation.Our participation in intellectual property enforcement actions may negatively impact our financial results.
Our business is subject to a variety of U.S. and international laws, rules, policies, and other obligations regardingprivacy, data protection, and other matters.
We are subject to federal, state, and international laws relating to the collection, use, retention, security, andtransfer of customer, employee, and business partner personally identifiable information (‘‘PII’’), including theEuropean Union’s General Data Protection Regulation (‘‘GDPR’’), which came into effect in May 2018 and theCalifornia Consumer Privacy Act (‘‘CCPA’’), which came into effect on January 1, 2020. In many cases, these lawsapply not only to third-party transactions, but also to transfers of information between one company and itssubsidiaries, and among the subsidiaries and other parties with which we have commercial relations. The introductionof new products or expansion of our activities in certain jurisdictions may subject us to additional laws andregulations. Foreign data protection, privacy, and other laws and regulations, including GDPR, can be more restrictivethan those in the United States. These U.S. federal and state and foreign laws and regulations, including GDPR whichcan be enforced by private parties or government entities, are constantly evolving and can be subject to significantchange. In addition, the application and interpretation of these laws and regulations, including GDPR, are oftenuncertain, particularly in the new and rapidly evolving industry in which we operate, and may be interpreted andapplied inconsistently from country to country and inconsistently with our current policies and practices. Theseexisting and proposed laws and regulations can be costly to comply with and can delay or impede the developmentof new products, result in negative publicity, increase our operating costs, require significant management time andattention, and subject us to inquiries or investigations, claims or other remedies, including fines, which may besignificant, or demands that we modify or cease existing business practices.
A failure by us, our suppliers, or other parties with whom we do business to comply with posted privacy policiesor with other federal, state, or international privacy-related or data protection laws and regulations, includingGDPR and CCPA, could result in proceedings against us by governmental entities or others, which could have amaterial adverse effect on our business, results of operations, and financial condition.
We rely substantially upon trade secret laws and contractual restrictions to protect our proprietary rights, and, ifthese rights are not sufficiently protected, our ability to compete and generate revenue could suffer.
We seek to protect our proprietary manufacturing processes, documentation, and other written materialsprimarily under trade secret and copyright laws. We also typically require employees, consultants, and third parties,such as our vendors and customers, with access to our proprietary information to execute confidentiality agreements.The steps we take to protect our proprietary information may not be adequate to prevent misappropriation of ourtechnology. Our systems may be subject to intrusions, security breaches, or targeted theft of our trade secrets.In addition, our proprietary rights may not be adequately protected because:
• others may not be deterred from misappropriating our technologies despite the existence of laws or
contracts prohibiting such misappropriation and information security measures designed to deter or prevent
misappropriation of our technologies;
• policing unauthorized use of our intellectual property may be difficult, expensive, and time-consuming, the
remedy obtained may be inadequate to restore protection of our intellectual property, and moreover, we
may be unable to determine the extent of any unauthorized use;
• the laws of other countries in which we market our solar products, such as some countries in the
Asia/Pacific region, may offer little or no protection for our proprietary technologies; and
• reports we file in connection with government-sponsored research contracts are generally available to the
public and third parties may obtain some aspects of our sensitive confidential information.
50

Reverse engineering, unauthorized copying, or other misappropriation of our proprietary technologies could
enable third parties to benefit from our technologies without compensating us for doing so. Our joint ventures or our
partners may not be deterred from misappropriating our proprietary technologies despite contractual and other legal
restrictions. Legal protection in countries where our joint ventures are located may not be robust and enforcement by
us of our intellectual property rights may be difficult. As a result, our joint ventures or our partners could directly
compete with our business. Any such activities or any other inabilities to adequately protect our proprietary rights
could harm our ability to compete, to generate revenue, and to grow our business.
We may be subject to breaches of our information technology systems, which could lead to disclosure of our
internal information, damage our reputation or relationships with dealers and customers, and disrupt access to
our online services. Such breaches could subject us to significant reputational, financial, legal, and operational
consequences.
Our business requires us to use and store confidential and proprietary information, intellectual property,
commercial banking information, personal information concerning customers, employees, and business partners, and
corporate information concerning internal processes and business functions. Malicious attacks to gain access to such
information affects many companies across various industries, including ours.
Where appropriate, we use encryption and authentication technologies to secure the transmission and storage of
data. These security measures may be compromised as a result of third-party security breaches, employee error,
malfeasance, faulty password management, or other irregularity or malicious effort, and result in persons obtaining
unauthorized access to our data.
We devote resources to network security, data encryption, and other security measures to protect our systems and
data, but these security measures cannot provide absolute security. Because the techniques used to obtain
unauthorized access, disable or degrade service, or sabotage systems change frequently, target end users through
phishing and other malicious techniques, and/or may be difficult to detect for long periods of time, we may be unable
to anticipate these techniques or implement adequate preventative measures. As a result, we have experienced such
breaches of our systems in the past, and may experience a breach of our systems in the future that reduces our ability
to protect sensitive data. In addition, hardware, software, or applications we develop or procure from third parties
may contain defects in design or manufacture or other problems that could unexpectedly compromise information
security. Unauthorized parties may also attempt to gain access to our systems or facilities through fraud, trickery or
other forms of deceiving our team members, contractors and temporary staff. If we experience, or are perceived to
have experienced, a significant data security breach, fail to detect and appropriately respond to a significant data
security breach, or fail to implement disclosure controls and procedures that provide for timely disclosure of data
security breaches deemed material to our business, including corrections or updates to previous disclosures, we could
be exposed to a risk of loss, increased insurance costs, remediation and prospective prevention costs, damage to our
reputation and brand, litigation and possible liability, or government enforcement actions, any of which could
detrimentally affect our business, results of operations, and financial condition.
We may also share information with contractors and third-party providers to conduct our business. While we
generally review and typically request or require such contractors and third-party providers to implement security
measures, such as encryption and authentication technologies to secure the transmission and storage of data, those
third-party providers may experience a significant data security breach, which may also detrimentally affect our
business, results of operations, and financial condition as discussed above. See also under this section, ‘‘Risks Related
to Our Intellectual Property-We rely substantially upon trade secret laws and contractual restrictions to protect our
proprietary rights, and, if these rights are not sufficiently protected, our ability to compete and generate revenue
could suffer.’’
We may not obtain sufficient patent protection on the technology embodied in the solar products we currently
manufacture and market, which could harm our competitive position and increase our expenses.
Although we substantially rely on trade secret laws and contractual restrictions to protect the technology in the
solar products we currently manufacture and market, our success and ability to compete in the future may also depend
to a significant degree upon obtaining patent protection for our proprietary technology. We currently own multiple
patents and patent applications which cover aspects of the technology in the solar cells and mounting systems that
51

we currently manufacture and market. Material patents that relate to our systems products and services primarily
relate to our rooftop mounting products and ground-mounted tracking products. We intend to continue to seek patent
protection for those aspects of our technology, designs, and methodologies and processes that we believe provide
significant competitive advantages.
Our patent applications may not result in issued patents, and even if they result in issued patents, the patents may
not have claims of the scope we seek or we may have to refile patent applications due to newly discovered prior art.
In addition, any issued patents may be challenged, invalidated, or declared unenforceable, or even if we obtain an
award of damages for infringement by a third party, such award could prove insufficient to compensate for all
damages incurred as a result of such infringement.
The term of any issued patent is generally 20 years from its earliest filing date and if our applications are pending
for a long time period, we may have a correspondingly shorter term for any patent that may issue. Our present and
future patents may provide only limited protection for our technology and may be insufficient to provide competitive
advantages to us. For example, competitors could develop similar or more advantageous technologies on their own
or design around our patents. Also, patent protection in certain foreign countries may not be available or may be
limited in scope and any patents obtained may not be readily enforceable because of insufficient judicial
effectiveness, making it difficult for us to aggressively protect our intellectual property from misuse or infringement
by other companies in these countries. Our inability to obtain and enforce our intellectual property rights in some
countries may harm our business. In addition, given the costs of obtaining patent protection, we may choose not to
protect certain innovations that later turn out to be important.
We may not be able to prevent others from using the term SunPower or similar terms, or other trademarks which
we hold, in connection with their solar power products which could adversely affect the market recognition of our
name and our revenue.
‘‘SunPower’’ and the SunPower logo are our registered trademarks in certain countries, including the United
States, for uses that include solar cells and solar panels. We are seeking registration of these trademarks in other
countries, but we may not be successful in some of these jurisdictions. We hold registered trademarks for SunPower,
Maxeon, Oasis, EnergyLink, InvisiMount, Greenbotics, SolarBridge, The Power of One, and many more marks,
in certain countries, including the United States. We have not registered, and may not be able to register, these
trademarks in other key countries. In the foreign jurisdictions where we are unable to obtain or have not tried to obtain
registrations, others may be able to sell their products using trademarks compromising or incorporating ‘‘SunPower,’’
or a variation thereof, or our other chosen brands, which could lead to customer confusion. In addition, if there are
jurisdictions where another proprietor has already established trademark rights in marks containing ‘‘SunPower,’’ or
our other chosen brands, we may face trademark disputes and may have to market our products with other trademarks
or without our trademarks, which may undermine our marketing efforts. We may encounter trademark disputes with
companies using marks which are confusingly similar to the SunPower mark, or our other marks, which if not
resolved favorably, could cause our branding efforts to suffer. In addition, we may have difficulty in establishing
strong brand recognition with consumers if others use similar marks for similar products.
Our past and possible future reliance on government programs to partially fund our research and development
programs could impair our ability to commercialize our solar power products and services.
Government funding of some of our research and development efforts imposed certain restrictions on our
ability to commercialize results and could grant commercialization rights to the government. In some funding
awards, the government is entitled to intellectual property rights arising from the related research. Such rights
include a nonexclusive, nontransferable, irrevocable, paid-up license to practice or have practiced each subject
invention developed under an award throughout the world by or on behalf of the government. Other rights
include the right to require us to grant a license to the developed technology or products to a third party or, in
some cases, if we refuse, the government may grant the license itself, if the government determines that action
is necessary because we fail to achieve practical application of the technology, because action is necessary to
alleviate health or safety needs, to meet requirements of federal regulations, or to give the United States industry
preference. Accepting government funding can also require that manufacturing of products developed with
federal funding be conducted in the United States.
52

We may be subject to information technology system failures or network disruptions that could damage ourbusiness operations, financial conditions, or reputation.
We may be subject to information technology system failures and network disruptions. These may be caused by
natural disasters, accidents, power disruptions, telecommunications failures, acts of terrorism or war, computer
viruses, physical or electronic break-ins, or similar events or disruptions. System redundancy may be ineffective or
inadequate, and our disaster recovery planning may not be sufficient for all eventualities. Such failures or disruptions
could result in delayed or canceled orders. System failures and disruptions could also impede the manufacturing and
shipping of products, delivery of online services, transactions processing, and financial reporting.
Risks Related to Our Debt and Equity Securities
Our debentures are effectively subordinated to our existing and any future secured indebtedness and structurallysubordinated to existing and future liabilities and other indebtedness of our current and any future subsidiaries.
Our convertible debentures are general, unsecured obligations and rank equally in right of payment with all of
our existing and any future unsubordinated, unsecured indebtedness. As of December 29, 2019, we and our
subsidiaries had $825.0 million in principal amount of senior convertible debentures. Our debentures are effectively
subordinated to our existing and any future secured indebtedness we may have, including for example, our Loan and
Security Agreement with Bank of America, N.A., to the extent of the value of the assets securing such indebtedness,
and structurally subordinated to our existing and any future liabilities and other indebtedness of our subsidiaries.
In addition to our unsecured indebtedness described above, as of December 29, 2019, we and our subsidiaries had
$221.0 million in principal amount of other indebtedness outstanding, which includes $9.1 million in non-recourse
project debt. These liabilities may also include other indebtedness, trade payables, guarantees, lease obligations, and
letter of credit obligations. Our debentures do not restrict us or our current or any future subsidiaries from incurring
indebtedness, including senior secured indebtedness, in the future, nor do they limit the amount of indebtedness we
can issue that is equal in right of payment. For a discussion the impact of our liquidity on our ability to meet our
payment obligations under our debentures, see also ‘‘Risks Related to Our Liquidity-We have a significant amount
of debt outstanding. Our substantial indebtedness and other contractual commitments could adversely affect our
business, financial condition and results of operations, as well as our ability to meet our payment obligations under
our debentures and our other debt.’’
Total’s majority ownership of our common stock may adversely affect the liquidity and value of our common stock.
As of December 29, 2019, Total owned approximately 47% of our outstanding common stock. However,
pursuant to Affiliation Agreement, Total had a grace period of nine months ending on September 30, 2020, during
which it had the ability to, and did, acquire stock sufficient retain at least 50% ownership of the Company. During
this period, Total continued to be entitled to, among other items, designate directors as if it actually held more than
50% of the voting stock of the Company, exercise the stockholder approval rights, and our stockholders may still act
by written consent. As of February 7, 2020, Total owned approximately 51% of our outstanding common stock,
inclusive of common stock issuable upon conversion of our 0.875% debentures and 4.00% debentures.
The Board of Directors of SunPower includes five designees from Total, giving Total majority control of our
Board. As a result, subject to the restrictions in the Affiliation Agreement, Total possesses significant influence and
control over our affairs. Our non-Total stockholders have reduced ownership and voting interest in our company and,
as a result, have less influence over the management and policies of our company than they exercised prior to Total’s
tender offer. As long as Total controls us, the ability of our other stockholders to influence matters requiring
stockholder approval is limited. Total’s stock ownership and relationships with members of our Board of Directors
could have the effect of preventing minority stockholders from exercising significant control over our affairs,
delaying or preventing a future change in control, impeding a merger, consolidation, takeover, or other business
combination or discouraging a potential acquirer from making a tender offer or otherwise attempting to obtain control
of us, limiting our financing options. These factors in turn could adversely affect the market price of our common
stock or prevent our stockholders from realizing a premium over the market price of our common stock.
The Affiliation Agreement limits Total and any member of the Total affiliated companies (‘‘Total Group’’) from
effecting, seeking, or entering into discussions with any third party regarding any transaction that would result in the
Total Group beneficially owning our shares in excess of certain thresholds during a standstill period. The Affiliation
Agreement also imposes certain limitations on the Total Group’s ability to seek to effect a tender offer or merger to
acquire 100% of our outstanding voting power. Such provisions may not be successful in preventing the Total Group
53

from engaging in transactions which further increase their ownership and negatively impact the price of our common
stock. See also ‘‘Risks Related to Our Liquidity-We may be unable to generate sufficient cash flows or obtain access
to external financing necessary to fund our operations and make adequate capital investments as planned due to the
general economic environment and the continued market pressure driving down the average selling prices of our solar
power products, among other factors.’’ Finally, the market for our common stock has become less liquid and more
thinly traded as a result of the Total tender offer. The lower number of shares available to be traded could result in
greater volatility in the price of our common stock and affect our ability to raise capital on favorable terms in the
capital markets.
If we cease to be considered a ‘‘controlled company’’ within the meaning of the NASDAQ corporate governancerules, during a one-year transition period, we may continue to rely on exemptions from certain corporategovernance requirements.
If we cease to be considered a ‘‘controlled company’’ under the NASDAQ corporate governance rules, we will
be subject to additional corporate governance requirements, including the requirements that:
• a majority of our Board of Directors consist of independent directors;
• our Nominating and Corporate Governance Committee be composed entirely of independent directors with
a written charter addressing the committee’s purpose and responsibilities;
• our Compensation Committee be composed entirely of independent directors with a written charter
addressing the committee’s purpose and responsibilities; and
• there be an annual performance evaluation of the Nominating and Corporate Governance Committee and
the Compensation Committee.
The NASDAQ listing rules provide for phase-in periods for these requirements (including that each such
committee consist of a majority of independent directors within 90 days of ceasing to be a ‘‘controlled company’’),
but we must be fully compliant with the requirements within one year of the date on which we cease to be a
‘‘controlled company.’’ Currently, we do not have a majority of independent directors on our Board of Directors and
only two of the four members of each of our Nominating and Governance Committee and our Compensation
Committee are independent. During this transition period, our stockholders may not have the same protections
afforded to stockholders of companies that are subject to all of the NASDAQ corporate governance rules and the
ability of our independent directors to influence our business policies and affairs may be reduced. In addition, we may
not be able to attract and retain the number of independent directors needed to comply with NASDAQ corporate
governance rules during the transition period.
In addition, as a result of potentially no longer being a ‘‘controlled company,’’ we may need to obtain certain
consents, waivers and amendments in connection with our existing debt agreements. Any failure to obtain such
consents, waivers and amendments might cause cross defaults under other agreements and may have a material
adverse effect on our results of operations and financial conditions.
Conversion of our outstanding 0.875% debentures and 4.00% debentures, and future substantial issuances ordispositions of our common stock or other securities, could dilute ownership and earnings per share or cause themarket price of our stock to decrease.
The conversion of some or all of our outstanding 0.875% or 4.00% debentures into shares of our common stock
will dilute the ownership interests of existing stockholders, including holders who had previously converted their
debentures. Any sales in the public market of the common stock issuable upon such conversion could adversely affect
prevailing market prices of our common stock. Sales of our common stock in the public market or sales of any of
our other securities could dilute ownership and earnings per share, and even the perception that such sales could occur
could cause the market prices of our common stock to decline. In addition, the existence of our outstanding
debentures may encourage short selling of our common stock by market participants who expect that the conversion
of the debentures could depress the prices of our common stock.
Future sales of our common stock in the public market could lower the market price for our common stock andadversely impact the trading price of our debentures.
In the future, we may sell additional shares of our common stock to raise capital. We cannot predict the size of
future issuances or the effect, if any, that they may have on the market price for our common stock. In addition,
a substantial number of shares of our common stock is reserved for issuance upon the exercise of stock options,
54

restricted stock awards, restricted stock units, warrants, and upon conversion of our outstanding 0.875% and 4.00%
debentures. The issuance and sale of substantial amounts of common stock, or the perception that such issuances and
sales may occur, could adversely affect the trading price of our debentures and the market price of our common stock
and impair our ability to raise capital through the sale of additional equity or equity-linked securities.
The price of our common stock, and therefore of our outstanding 0.875% and 4.00% debentures, may fluctuatesignificantly.
Our common stock has experienced extreme price and volume fluctuations. The trading price of our common
stock could be subject to further wide fluctuations due to many factors, including the factors discussed in this risk
factors section. In addition, the stock market in general, and The NASDAQ Global Select Market and the securities
of technology companies and solar companies in particular, have experienced severe price and volume fluctuations.
These trading prices and valuations, including our own market valuation and those of companies in our industry
generally, may not be sustainable. These broad market and industry factors may decrease the market price of our
common stock, regardless of our actual operating performance. Because the 0.875% and 4.00% debentures are
convertible into our common stock (and/or cash equivalent to the value of our common stock), volatility or depressed
prices of our common stock could have a similar effect on the trading price of the debentures.
If securities or industry analysts change their recommendations regarding our stock adversely, our stock price andtrading volume could decline.
The trading market for our common stock is influenced by the research and reports that industry or securities
analysts publish about us, our business or our market. If one or more of the analysts who cover us change their
recommendation regarding our stock adversely, our stock price would likely decline. If one or more of these analysts
ceases coverage of our company or fails to regularly publish reports on us, we could lose visibility in the financial
markets, which in turn could cause our stock price or trading volume, and the value of our debentures, to decline.
We do not intend to pay cash dividends on our common stock in the foreseeable future.
We have never declared or paid cash dividends. For the foreseeable future, we intend to retain any earnings, after
considering any dividends on any preferred stock, to finance the development of our business, and we do not
anticipate paying any cash dividends on our common stock. Any future determination to pay cash dividends will be
at the discretion of our Board of Directors and will be dependent upon then-existing conditions, including our
operating results and financial condition, capital requirements, contractual restrictions, business prospects, and other
factors that our Board of Directors considers relevant. Accordingly, holders of our common stock must rely on sales
of their common stock after price appreciation, which may never occur, as the only way to realize a return on their
shares of common stock.
Delaware law and our certificate of incorporation and by-laws contain anti-takeover provisions and ouroutstanding 0.875% and 4.00% debentures provide for a right to convert upon certain events, and our Board ofDirectors entered into a rights agreement and declared a rights dividend, any of which could delay or discouragetakeover attempts that stockholders may consider favorable.
Provisions in our certificate of incorporation and by-laws may have the effect of delaying or preventing a change
of control or changes in our management. These provisions include the following:
• the right of the Board of Directors to elect a director to fill a vacancy created by the expansion of the Board
of Directors;
• the prohibition of cumulative voting in the election of directors, which would otherwise allow less than a
majority of stockholders to elect director candidates;
• the requirement for advance notice for nominations for election to the Board of Directors or for proposing
matters that can be acted upon at a stockholders’ meeting;
• our Board of Directors is divided into three classes of directors, with the classes to be as nearly equal in
number as possible;
• stockholders may not call special meetings of the stockholders, except by Total under limited
circumstances; and
• our Board of Directors is able to alter our by-laws without obtaining stockholder approval.
55

Certain provisions of our outstanding debentures could make it more difficult or more expensive for a third party
to acquire us. Upon the occurrence of certain transactions constituting a fundamental change, including an entity
(such as Total) becoming the beneficial owner of 75% of our voting stock, holders of our outstanding debentures will
have the right, at their option, to require us to repurchase, at a cash repurchase price equal to 100% of the principal
amount plus accrued and unpaid interest on the debentures, all or a portion of their debentures. We may also be
required to issue additional shares of our common stock upon conversion of such debentures in the event of certain
fundamental changes.
The issuance of shares of common stock, conversion of our outstanding 0.875% and 4.00% debentures, and futuresubstantial issuances or dispositions of our common stock or other securities, could dilute ownership and earningsper share or cause the market price of our stock to decrease.
In the equity offering in 2019, we sold an aggregate of 25,300,000 shares. Sales of our common stock in the
public market or sales of any of our other securities will or could, as applicable, dilute ownership and earnings per
share, and even the perception that such sales could occur could cause the market prices of our common stock to
decline.
To the extent we issue common stock upon conversion of our outstanding 0.875% and 4.00% debentures,
the conversion of some or all of such debentures will dilute the ownership interests of existing stockholders, including
holders who had previously converted their debentures. Any sales in the public market of the common stock issuable
upon such conversion could adversely affect prevailing market prices of our common stock. In addition, the existence
of our outstanding debentures may encourage short selling of our common stock by market participants who expect
that the conversion of the debentures could depress the prices of our common stock.
Our ability to use our net operating loss and credit carryforwards to offset future taxable income may be subjectto certain limitations.
As of December 29, 2019, we had federal net operating loss carryforwards of $839.8 million for tax purposes
of which $133.4 million was generated in fiscal years 2018 and thereafter and can be carried forward indefinitely
under the Tax Cuts and Job Acts of 2017 (‘‘The Tax Act’’). The remaining federal net operating loss carry forward
of $706.4 million, which were generated prior to 2018, will expire at various dates from 2031 to 2037. As of
December 29, 2019, we had California state net operating loss carryforwards of approximately $876.1 million for tax
purposes, of which $5.2 million relate to debt issuance and will benefit equity when realized. These California net
operating loss carryforwards will expire at various dates from 2029 to 2039. We also had credit carryforwards of
approximately $68.2 million for federal tax purposes, of which $16.6 million relate to debt issuance and will benefit
equity when realized. We had California credit carryforwards of $9.0 million for state tax purposes, of which
$4.7 million relate to debt issuance and will benefit equity when realized. These federal credit carryforwards will
expire at various dates from 2019 to 2039, and the California credit carryforwards do not expire. Our ability to utilize
a portion of the net operating loss and credit carryforwards is dependent upon our being able to generate taxable
income in future periods or being able to carryback net operating losses to prior year tax returns. Our ability to utilize
net operating losses may be limited due to restrictions imposed on utilization of net operating loss and credit
carryforwards under federal and state laws upon a change in ownership, such as transaction with Cypress
Semiconductor Corporation (‘‘Cypress’’) while we were deemed to be a member and subsidiary of the Cypress
consolidated group.
Section 382 of the Code imposes restrictions on the use of a corporation’s net operating losses, as well as certain
recognized built-in losses and other carryforwards, after an ‘‘ownership change’’ occurs. A Section 382 ‘‘ownership
change’’ occurs if one or more stockholders or groups of stockholders who own at least 5% of our stock increase their
ownership by more than 50 percentage points over their lowest ownership percentage within the prior three-year
period (calculated on a rolling basis). A conversion of our outstanding convertible notes debentures, and/or other
issuances or sales of our stock (including certain transactions involving our stock that are outside of our control)
could result in an ownership change under Section 382. If an ‘‘ownership change’’ occurs, Section 382 would impose
an annual limit on the amount of pre-change net operating losses and other losses we can use to reduce our taxable
income generally equal to the product of the total value of our outstanding equity immediately prior to the
‘‘ownership change’’ and the applicable federal long-term tax-exempt interest rate for the month of the
‘‘ownership change’’ (subject to certain adjustments).
The majority of our U.S. federal net operating losses were generated prior to 2018, and these losses may be
carried forward for up to 20 years. The annual limitation may effectively provide a cap on the cumulative amount
56

of pre-ownership change losses, including certain recognized built-in losses that may be utilized. Such pre-ownership
change losses in excess of the cap may be lost. In addition, if an ownership change were to occur, it is possible that
the limitations imposed on our ability to use pre-ownership change losses and certain recognized built-in losses could
cause a net increase in our U.S. federal income tax liability and require U.S. federal income taxes to be paid earlier
than otherwise would be paid if such limitations were not in effect. Further, if for financial reporting purposes the
amount or value of these deferred tax assets is reduced, such reduction would have a negative impact on the book
value of our common stock.
As discussed in ‘‘Risk Factors—Risks Related to the Spin-Off,’’ the Spin-Off is expected to result in a fully
taxable event to SunPower, for which we expect to recognize gain which it expects to offset with prior year losses,
thus resulting in a significant reduction in our net operating loss carryforwards.
ITEM 1B: UNRESOLVED STAFF COMMENTS
None.
ITEM 2: PROPERTIES
The table below presents details for each of our principal properties:
Facility Location
ApproximateSquareFootage Held
Year WhenLease Term
Ends Segment
Solar cell manufacturing facility1, 2 . . . . . Philippines 390,000 Owned n/a SPT6
Solar cell manufacturing facility3 . . . . . . Malaysia 885,000 Owned n/a SPT
Former solar cell manufacturing
facility1, 4
. . . . . . . . . . . . . . . . . . . . . . . . Philippines 641,000 Owned n/a SPT
Solar cell manufacturing support
and storage facility . . . . . . . . . . . . . . . . Philippines 280,000 Leased 2024 SPT
Former solar module assembly
facility1, 4. . . . . . . . . . . . . . . . . . . . . . . . Philippines 132,000 Owned n/a SPT
Solar cell and module
manufacturing facility5 . . . . . . . . . . . . . Oregon, U.S. 212,000 Leased 2022 SPT
Solar module assembly facility . . . . . . . . Mexico 320,000 Leased 2021 SPT
Solar module assembly facility . . . . . . . . Mexico 191,000 Leased 2026 SPT
Solar module assembly facility . . . . . . . . France 36,000 Owned n/a SPT
Corporate headquarters . . . . . . . . . . . . . . . California,
U.S. 61,000 Leased 2027 SPT
Corporate headquarters . . . . . . . . . . . . . . . California,
U.S. 5,000 Leased 2020 SPES7 & SPT
Global support offices . . . . . . . . . . . . . . . California,
U.S. 163,000 Leased 2023 SPES & SPT
Global support offices . . . . . . . . . . . . . . . Texas, U.S. 46,000 Leased 2024 SPES
Global support offices . . . . . . . . . . . . . . . Texas, U.S. 23,000 Leased 2021 SPES
Global support offices . . . . . . . . . . . . . . . France 27,000 Leased 2023 SPT
Global support offices . . . . . . . . . . . . . . . Philippines 65,000 Owned n/a SPES
1 The lease for the underlying land expires in May 2048 and is renewable for an additional 25 years.
2 The solar cell manufacturing facility we operate in the Philippines has a total annual capacity of 500 MW.
3 The solar cell manufacturing facility we operate in Malaysia has a total annual capacity of over 800 MW.
4 We still owned this facility as of December 29, 2019; however, relevant operations ceased during fiscal 2016.
5 The solar cell manufacturing facility we operate in Oregon, U.S. has a total annual capacity of over 120 MW.
6 SPT refers to SunPower Technology segment
7 SPES refers to SunPower Energy Services segment
As of December 29, 2019, our principal properties included operating solar cell manufacturing facilities with a
combined total annual capacity of over 1.4 GW and solar module assembly facilities with a combined total annual
capacity of approximately 1.4 GW. For more information about our manufacturing capacity, see ‘‘Item 1. Business.’’
57
We identify and allocate property, plant and equipment by country and by business segment. For more
information see ‘‘Item 8. Financial Statements and Supplementary Data—Notes to Consolidated Financial
Statements—Note 5. Balance Sheet Components and Note 17. Segments, respectively.’’
ITEM 3. LEGAL PROCEEDINGS
The disclosure under ‘‘Item 1. Financial Statements—Note 9. Commitments and Contingencies—Legal
Matters’’ in the Notes to the Consolidated Financial Statements in this Annual Report on Form 10-K is incorporated
herein by reference.
ITEM 4: MINE SAFETY DISCLOSURES
Not applicable.
58

PART II
ITEM 5: MARKET FOR REGISTRANT’S COMMON EQUITY, RELATED STOCKHOLDER MATTERS
AND ISSUER PURCHASES OF EQUITY SECURITIES
Our common stock is listed on the Nasdaq Global Select Market under the trading symbol ‘‘SPWR.’’
As of February 7, 2020, there were approximately 664 holders of record of our common stock. A substantially
greater number of holders are in ‘‘street name’’ or beneficial holders, whose shares are held of record by banks,
brokers, and other financial institutions.
Dividends
We have never declared or paid any cash dividend on our common stock, and we do not currently intend to pay
a cash dividend on our common stock in the foreseeable future. Certain of our debt agreements place restrictions on
us and our subsidiaries’ ability to pay cash dividends. For more information on our common stock and dividend
rights, see ‘‘Item 8. Financial Statements and Supplementary Data—Notes to Consolidated Financial
Statements—Note 14. Common Stock.’’
Issuer Purchases of Equity Securities
The following table sets forth all purchases made by or on behalf of us or any ‘‘affiliated purchaser,’’ as defined
in Rule 10b-18(a)(3) under the Exchange Act, of shares of our common stock during each of the indicated periods.
Period
Total Numberof Shares
Purchased1Average Price
Paid Per Share
Total Numberof Shares
Purchased asPart ofPublicly
AnnouncedPlans or
Programs
MaximumNumber of
Shares ThatMay Yet BePurchasedUnder thePublicly
AnnouncedPlans or
Programs
September 30, 2019 through October 27, 2019 . . . . . . . . . . 15,850 $10.55 — —
October 28, 2019 through November 24, 2019 . . . . . . . . . . 36,526 $ 8.56 — —
November 25, 2019 through December 29, 2019 . . . . . . . . 58,642 $ 7.09 — —
111,018 $ 8.73 — —
1 The shares purchased represent shares surrendered to satisfy tax withholding obligations in connection with the vesting of restricted stock
issued to employees.
59

ITEM 6: SELECTED CONSOLIDATED FINANCIAL DATA
The following selected consolidated financial data should be read together with ‘‘Item 7. Management’s
Discussion and Analysis of Financial Condition and Results of Operations’’ and ‘‘Item 8. Financial Statements and
Supplementary Data’’ included in this Annual Report on Form 10-K.
Year Ended1
(In thousands, except per share data)December 29,
2019December 30,
2018December 31,
2017January 1,
2017January 3,
2016
Consolidated Statements of Operations Data
Revenue . . . . . . . . . . . . . . . . . . . . . . . . . . . . . . . . . . $1,864,225 $1,726,085 $ 1,794,047 $2,552,637 $1,576,473
Gross margin (loss) . . . . . . . . . . . . . . . . . . . . . . . . . $ 125,905 $ (297,081) $ (18,645) $ 221,819 $ 244,646
Operating loss . . . . . . . . . . . . . . . . . . . . . . . . . . . . . $ (98,115) $ (849,031) $(1,024,917) $ (427,754) $ (206,294)
Income (loss) from continuing operations before
income taxes and equity in earnings (loss) of
unconsolidated investees. . . . . . . . . . . . . . . . . . . $ 25,968 $ (898,671) $(1,200,750) $ (528,392) $ (242,311)
Income (loss) from continuing operations per
share of common stock:
Basic . . . . . . . . . . . . . . . . . . . . . . . . . . . . . . . . . . $ 0.15 $ (5.76) $ (6.67) $ (3.25) $ (1.39)
Diluted . . . . . . . . . . . . . . . . . . . . . . . . . . . . . . . . . $ 0.15 $ (5.76) $ (6.67) $ (3.25) $ (1.39)
1 Previously reported information for fiscal 2017, 2016 have been restated for the adoption of Accounting Standards Codification (ASC) Topic
606, Revenue from Contracts with Customers, when it was adopted in fiscal 2018. However, fiscal 2015 has not been restated and is,
therefore not comparable to the fiscal 2019, 2018, 2017, and 2016 information.
Effective December 31, 2018, we adopted Accounting Standards Update (‘‘ASU’’) No. 2016-02, Leases
(Topic 842), as amended (‘‘ASC 842’’). For additional information on the changes resulting from the new standard
and the impact to our financial results on adoption, refer to ‘‘Item 8. Financial Statements’’ Note 1. Organization and
Summary of Significant Accounting Policies.
As of1
(In thousands)December 29,
2019December 30,
2018December 31,
2017January 1,
2017January 3,
2016
Consolidated Balance Sheet Data
Cash and cash equivalents . . . . . . . . . . . . . . . . . . . $ 422,955 $ 309,407 $ 435,097 $ 425,309 $ 954,528
Working capital . . . . . . . . . . . . . . . . . . . . . . . . . . . . $ 482,522 $ 368,765 $ 253,424 $ 832,754 $1,515,918
Total assets . . . . . . . . . . . . . . . . . . . . . . . . . . . . . . . $2,171,921 $2,352,649 $4,028,656 $4,968,742 $4,856,993
Long-term debt . . . . . . . . . . . . . . . . . . . . . . . . . . . . $ 113,827 $ 40,528 $ 430,634 $ 451,243 $ 478,948
Convertible debt, net of current portion. . . . . . . . . $ 820,259 $ 818,356 $ 816,454 $1,113,478 $1,110,960
Total stockholders’ equity. . . . . . . . . . . . . . . . . . . . $ 10,163 $ (208,696) $ 588,209 $1,531,038 $1,449,149
1 Previously reported information for fiscal 2017 and 2016 have been restated for the adoption of Accounting Standards Codification (ASC)
Topic 606, Revenue from Contracts with Customers, when it was adopted in fiscal 2018. However, fiscal 2015 has not been restated and
is, therefore not comparable to the fiscal 2019, 2018, 2017, and 2016 information.
Effective December 31, 2018, we adopted Accounting Standards Update (‘‘ASU’’) No. 2016-02, Leases
(Topic 842), as amended (‘‘ASC 842’’). For additional information on the changes resulting from the new standard
and the impact to our financial results on adoption, refer to ‘‘Item 8. Financial Statements’’ Note 1. Organization and
Summary of Significant Accounting Policies.
60

ITEM 7: MANAGEMENT’S DISCUSSION AND ANALYSIS OF FINANCIAL CONDITION AND
RESULTS OF OPERATIONS
Cautionary Statement Regarding Forward-Looking Statements
You should read the following discussion of our financial condition and results of operations in conjunction with
the consolidated financial statements and the notes thereto included elsewhere in this Annual Report on Form 10-K
for the fiscal year ended December 29, 2019.
This Annual Report on Form 10-K contains forward-looking statements within the meaning of the Private
Securities Litigation Reform Act of 1995. Forward-looking statements are statements that do not represent historical
facts or the assumptions underlying such statements. We use words such as ‘‘anticipate,’’ ‘‘believe,’’ ‘‘continue,’’
‘‘could,’’ ‘‘estimate,’’ ‘‘expect,’’ ‘‘intend,’’ ‘‘may,’’ ‘‘plan,’’ ‘‘predict,’’ ‘‘project,’’ ‘‘potential,’’ ‘‘seek,’’ ‘‘should,’’ ‘‘will,’’
‘‘would,’’ and similar expressions to identify forward-looking statements. Forward-looking statements in this Annual
Report on Form 10-K include, but are not limited to, our plans and expectations regarding future financial results,
expected operating results, business strategies, the sufficiency of our cash and our liquidity, projected costs and cost
reduction measures, development of new products and improvements to our existing products, the impact of recently
adopted accounting pronouncements, our manufacturing capacity and manufacturing costs, the adequacy of our
agreements with our suppliers, our ability to monetize utility projects, legislative actions and regulatory compliance,
competitive positions, management’s plans and objectives for future operations, our ability to obtain financing, our
ability to comply with debt covenants or cure any defaults, our ability to repay our obligations as they come due, our
ability to continue as a going concern, our ability to complete certain divestiture transactions, trends in average
selling prices, the success of our joint ventures and acquisitions, expected capital expenditures, warranty matters,
outcomes of litigation, our exposure to foreign exchange, interest and credit risk, general business and economic
conditions in our markets, industry trends, the impact of changes in government incentives, expected restructuring
charges, risks related to privacy and data security, and the likelihood of any impairment of project assets, long-lived
assets, and investments. These forward-looking statements are based on information available to us as of the date of
this Annual Report on Form 10-K and current expectations, forecasts and assumptions and involve a number of risks
and uncertainties that could cause actual results to differ materially from those anticipated by these forward-looking
statements. Such risks and uncertainties include a variety of factors, some of which are beyond our control. Factors
that could cause or contribute to such differences include, but are not limited to, those identified above, those
discussed in the section titled ‘‘Risk Factors’’ included in this Annual Report on Form 10-K and our Annual Report
on Form 10-K for the fiscal year ended December 29, 2019, and our other filings with the SEC. These forward-
looking statements should not be relied upon as representing our views as of any subsequent date, and we are under
no obligation to, and expressly disclaim any responsibility to, update or alter our forward-looking statements,
whether as a result of new information, future events or otherwise.
Our fiscal year ends on the Sunday closest to the end of the applicable calendar year. All references to fiscal
periods apply to our fiscal quarter or year, which end on the Sunday closest to the calendar month end.
Overview
SunPower Corporation (together with its subsidiaries, ‘‘SunPower,’’ ‘‘we,’’ ‘‘us,’’ or ‘‘our’’) is a leading global
energy company that delivers solar solutions to customers worldwide through an array of hardware, software, and
financing options and through development capabilities, operations and maintenance (‘‘O&M’’) services, and
‘‘Smart Energy’’ solutions. Our Smart Energy initiative is designed to add layers of intelligent control to homes,
buildings and grids—all personalized through easy-to-use customer interfaces. Of all the solar cells commercially
available to the mass market, we believe our solar cells have the highest conversion efficiency, a measurement of the
amount of sunlight converted by the solar cell into electricity. For more information about our business, please refer
to the section titled ‘‘Part I. Item 1. Business’’ in our Annual Report on Form 10-K for the fiscal year ended
December 29, 2019.
Recent Developments
Effective December 31, 2018, we adopted Accounting Standards Update (‘‘ASU’’) No. 2016-02, Leases
(Topic 842), as amended (‘‘ASC 842’’) using the optional transition method as discussed in ‘‘Part I-Item 1. Financial
Statements-Notes to the Consolidated Financial Statements-Note 1. Organization and Summary of Significant
Accounting Policies’’ of this Annual Report on Form 10-K.
61
Key transactions during the fiscal quarter ended December 29, 2019 include the following:
Announcement of Separation Transaction
On November 8, 2019, we entered into the Separation and Distribution Agreement with Maxeon Solar.
The Separation and Distribution Agreement governs the principal corporate transactions required to effect the
separation and the Spin-Off distribution, and provides for the allocation between SunPower and Maxeon Solar of the
assets, liabilities, and obligations of the respective companies as of the separation. In addition, the Separation and
Distribution Agreement, together with certain Ancillary Agreements, provide a framework for the relationship
between SunPower and Maxeon Solar subsequent to the completion of the Spin-Off. Also on November 8, 2019, we
entered into the Investment Agreement with Maxeon Solar, TZS, and, for the limited purposes set forth therein, Total.
Pursuant to the Investment Agreement, we, Maxeon Solar, TZS and, with respect to certain provisions, Total have
agreed to certain customary representations, warranties and covenants, including certain representations and
warranties as to the financial statements, contracts, liabilities, and other attributes of Maxeon Solar, certain business
conduct restrictions and covenants requiring efforts to complete the transactions. The Spin-Off is intended to be
tax-free to SunPower stockholders.
Common Stock Offering
On November 20, 2019, we completed an offering of 25,300,000 shares of the Company’s common stock at a
price of $7.00 per share, which included 3,300,000 shares issued and sold pursuant to the underwriter’s exercise in
full of its option to purchase additional shares, for gross proceeds of $177.1 million. We received net proceeds of
$171.8 million from the offering, after deducting underwriter discounts which were recorded as a reduction of
additional paid in capital. We incurred other expenses of $1.1 million for the transaction which was recorded in
additional paid in capital (‘‘APIC’’). In addition, we incurred incremental organization costs in connection with the
offering of $1.3 million which was recorded in the consolidated statement of operations. We intend to use the net
proceeds from the offering for general corporate purposes, including partially funding the repayment of our senior
convertible debentures. Refer to ‘‘Item 8. Financial Statements and Supplementary Data—Notes to Consolidated
Financial Statements— Note 18. Subsequent Events’’ for further details.
Segments Overview
Consistent with fiscal 2018, our segment reporting consists of upstream and downstream structure. Under this
segmentation, the SunPower Energy Services Segment (‘‘SunPower Energy Services’’ or ‘‘Downstream’’) refers to
sales of solar energy solutions in the North America region previously included in the legacy Residential Segment
and Commercial Segment (collectively previously referred to as ‘‘Distributed Generation’’ or ‘‘DG’’) including direct
sales of turn-key engineering, procurement and construction (‘‘EPC’’) services, sales to our third-party dealer
network, sales of energy under power purchase agreements (‘‘PPAs’’), storage solutions, cash sales and long-term
leases directly to end customers, and sales to resellers. SunPower Energy Services Segment also includes sales of our
global Operations and Maintenance (‘‘O&M’’) services. The SunPower Technologies Segment (‘‘SunPower
Technologies’’ or ‘‘Upstream’’) refers to our technology development, worldwide solar panel manufacturing
operations, equipment supply to resellers, commercial and residential end-customers outside of North America
(‘‘International DG’’), and worldwide power plant project development and project sales. Some support functions and
responsibilities have been shifted to each segment, including financial planning and analysis, legal, treasury, tax and
accounting support and services, among others.
The operating structure provides our management with a comprehensive financial overview of our key
businesses. The application of this structure permits us to align our strategic business initiatives and corporate goals
in a manner that best focuses our businesses and support operations for success.
Our Chief Executive Officer, as the chief operating decision maker (‘‘CODM’’), reviews our business, manages
resource allocations and measures performance of our activities between the SunPower Energy Services Segment and
SunPower Technologies Segment.
For more information about our business segments, see the section titled ‘‘Part I. Item 1. Business’’ of our
Annual Report on Form 10-K for the fiscal year ended December 29, 2019. For more segment information,
see ‘‘Item 1. Financial Statements—Note 17. Segment Information and Geographical Information’’ in the notes to
the consolidated financial statements in this Annual Report on Form 10-K.
62

Fiscal Years
We have a 52 to 53 week fiscal year that ends on the Sunday closest to December 31. Accordingly, every fifth
or sixth year will be a 53 week fiscal year. Fiscal 2019, 2018 and 2017 are 52 week fiscal years. Our fiscal 2019 ended
on December 29, 2019, fiscal 2018 ended on December 30, 2018 and fiscal 2017 ended on December 31, 2017.
Outlook
Demand
During fiscal 2019, we faced market challenges, including competitive solar product pricing pressure and the
impact of tariffs imposed pursuant to Section 201 and Section 301 of the Trade Act of 1974. On February 7, 2018,
tariffs went into effect pursuant to Proclamation 9693, which approved recommendations to provide relief to
U.S. manufacturers and imposed safeguard tariffs on imported solar cells and modules, based on the investigations,
findings, and recommendations of the International Trade Commission. While solar cells and modules based on
interdigitated back contact (‘‘IBC’’) technology, like our X-Series (Maxeon 3), E-Series (Maxeon 2)A-Series
(Maxeon 5) panels and related products, were granted exclusion from these safeguard tariffs on September 19, 2018,
our solar products based on other technologies continue to be subject to the safeguard tariffs. On June 13, 2019, the
Office of the United States Trade Representative (‘‘USTR’’) published a notice describing its grant of exclusion
requests for three additional categories of solar products. Beginning on June 13, 2019, the following categories of
solar products are not subject to the Section 201 safeguard tariffs: (i) bifacial solar panels that absorb light and
generate electricity on each side of the panel and that consist of only bifacial solar cells that absorb light and generate
electricity on each side of the cells; (ii) flexible fiberglass solar panels without glass components other than fiberglass,
such panels having power outputs ranging from 250 to 900 watts; and (iii) solar panels consisting of solar cells
arranged in rows that are laminated in the panel and that are separated by more than 10 mm, with an optical film
spanning the gaps between all rows that is designed to direct sunlight onto the solar cells, and not including panels
that lack said optical film or only have a white or other backing layer that absorbs or scatters sunlight. We are working
to understand the opportunities and challenges created by the exclusion of these products, as well as the impact of
the exclusions on the demand and availability of competing products. However, the excluded technologies currently
represent a small percentage of the global solar market.
Additionally, the USTR initiated an investigation under Section 301 of the Trade Act of 1974 into the
government of China’s acts, policies, and practices related to technology transfer, intellectual property, and
innovation. The USTR imposed additional import duties of up to 25% on certain Chinese products covered by the
Section 301 remedy. These tariffs include certain solar power system components and finished products, including
those purchased from our suppliers for use in our products and used in our business. In the near term, imposition of
these tariffs - on top of anti-dumping and countervailing duties on Chinese solar cells and modules, imposed under
the prior administration - is likely to result in a wide range of impacts to the U.S. solar industry, global manufacturing
market and our business. Such tariffs could cause market volatility, price fluctuations, and demand reduction.
Uncertainties associated with the Section 201 and Section 301 trade cases prompted us to adopt a restructuring plan
and implement initiatives to reduce operating expenses and cost of revenue overhead and improve cash flow.
During fiscal 2019 and 2018, we incurred total tariffs charges of approximately $6.5 million and $42.5 million,
respectively.
In fiscal 2019, focused on investments that we expected would offer the best opportunities for growth including
our industry-leading A-Series (Maxeon 5) cell and panel technology, solar-plus-storage solutions and digital platform
to improve customer service and satisfaction in our SunPower Energy Services offerings. We believe that our
strategic decision to re-segment our business into an upstream and downstream structure, to focus our downstream
efforts on our leading U.S. DG business while growing global sales of our upstream solar panel business through our
SunPower Technologies business segment, will improve transparency and enable us to regain profitability.
In late fiscal 2015, the U.S. government enacted a budget bill that extended the solar commercial investment tax
credit (the ‘‘Commercial ITC’’) under Section 48(c) of the Code, and the individual solar investment tax credit under
Section 25D of the Code (together with the Commercial ITC, the ‘‘ITC’’) for five years, at rates gradually decreasing
from 30% through 2019 to 22% in 2021. After 2021, the Commercial ITC is retained at 10% while the individual
solar investment tax credit is reduced to 0%. In fiscal 2019 we completed a transaction to purchase solar equipment
in accordance with IRS safe harbor guidance, allowing us to preserve the current ITC rates for solar projects that are
completed after the scheduled reduction in rates. During December 2017, the current administration and Congress
passed comprehensive reform of the Code which resulted in the reduction or elimination of various industry-specific
63

tax incentives in return for an overall reduction in corporate tax rates. These changes are likely to result in a wide
range of impacts to the U.S. solar industry and our business. For more information about how we avail ourselves of
the benefits of public policies and the risks related to public policies, please see the risk factors set forth under the
caption ‘‘Part I. Item 1A. Risk Factors—Risks Related to Our Sales Channels,’’ including ‘‘—The reduction,
modification or elimination of government incentives could cause our revenue to decline and harm our financial
results’’ and ‘‘—Existing regulations and policies and changes to these regulations and policies may present
technical, regulatory, and economic barriers to the purchase and use of solar power products, which may
significantly reduce demand for our products and services.’’
Supply
We are focused on delivering complete solar power generation solutions to our customers. As part of our
solutions-focused approach, we launched our SunPower Helix product for our commercial business customers during
fiscal 2015 and our SunPower Equinox product for our residential business customers during fiscal 2016.
The Equinox and Helix systems are pre-engineered modular solutions for residential and commercial applications,
respectively, that combine our high-efficiency solar module technology with integrated plug-and-play power stations,
cable management systems, and mounting hardware that enable our customers to quickly and easily complete system
installations and manage their energy production. Our Equinox systems utilize our latest Maxeon Gen 3 cell and
ACPV technology for residential applications, where we are also expanding our initiatives on storage and Smart
Energy solutions. Additionally, we continue to focus on producing our new lower cost, high efficiency P-Series
product line and our A-Series (Maxeon 5) product line, which will enhance our ability to rapidly expand our global
footprint with minimal capital cost.
We continue to see significant and increasing opportunities in technologies and capabilities adjacent to our core
product offerings that can significantly reduce our customers’ CCOE, including the integration of energy storage and
energy management functionality into our systems, and have made investments to realize those opportunities,
enabling our customers to make intelligent energy choices by addressing how they buy energy, how they use energy,
and when they use it. We have added advanced module-level control electronics to our portfolio of technology
designed to enable longer series strings and significant balance of system components cost reductions in large arrays.
We currently offer solar panels that use microinverters designed to eliminate the need to mount or assemble additional
components on the roof or the side of a building and enable optimization and monitoring at the solar panel level to
ensure maximum energy production by the solar system.
We continue to improve our unique, differentiated solar cell and panel technology. We emphasize improvement
of our solar cell efficiency and LCOE and CCOE performance through enhancement of our existing products,
development of new products and reduction of manufacturing cost and complexity in conjunction with our overall
cost-control strategies. We are now producing production efficiencies for our solar cells of over 25% and our solar
panels of over 22%.
We monitor and change our overall solar cell manufacturing output in an ongoing effort to match profitable
demand levels, with increasing bias toward our highest efficiency X-Series (Maxeon 3) product platform, which
utilizes our latest solar cell technology, and our P-Series product, which utilizes conventional cell technology that we
purchase from third parties in low-cost supply chain ecosystems such as China. We are focusing on our latest
generation, lower cost panel assembly facilities in Mexico. We are also increasing production of our new P-Series
technology at our newly-acquired U.S. manufacturing facility.
We are focused on reducing the cost of our solar panels and systems, including working with our suppliers and
partners along all steps of the value chain to reduce costs by improving manufacturing technologies, expanding
economies of scale and reducing manufacturing cost and complexity in conjunction with our overall cost-control
strategies. We believe that the global demand for solar systems is highly elastic and that our current aggressive,
but achievable, cost reduction roadmap will reduce installed costs for our customers across both of our business
segments and drive increased demand for our solar solutions.
We also work with our suppliers and partners to ensure the reliability of our supply chain. We have contracted
with some of our suppliers for multi-year supply agreements, under which we have annual minimum purchase
obligations. For more information about our purchase commitments and obligations, see ‘‘Liquidity and Capital
Resources—Contractual Obligations’’ and ‘‘Item 1. Financial Statements—Note 4. Business Divestiture and Sale of
Assets’’ and ‘‘Note 9. Commitments and Contingencies.’’
64

We currently believe our supplier relationships and various short- and long-term contracts will afford us the
volume of material and services required to meet our planned output; however, we face the risk that the pricing of
our long-term supply contracts may exceed market value. For example, we purchase our polysilicon under fixed-price
long-term supply agreements. The pricing under these agreements significantly in excess of market value results in
inventory write-downs based on expected net realizable value. Additionally, existing arrangements from prior years
have resulted in above current market pricing for purchasing polysilicon, resulting in inventory losses we have
realized. For several years now, we have elected to sell polysilicon inventory in excess of short-term needs to third
parties at a loss, and may enter into further similar transactions in future periods. For more information about these
risks, see the risk factors set forth under the caption ‘‘Part 1. Item 1A. Risk Factors—Risks Related to Our Supply
Chain,’’ including ‘‘—Our long-term, firm commitment supply agreements could result in excess or insufficient
inventory, place us at a competitive disadvantage on pricing, or lead to disputes, each of which could impair our
ability to meet our cost reduction roadmap, and in some circumstances may force us to take a significant accounting
charge’’ and ‘‘—We will continue to be dependent on a limited number of third-party suppliers for certain raw
materials and components for our products, which could prevent us from delivering our products to our customers
within required time frames and could in turn result in sales and installation delays, cancellations, penalty payments
and loss of market share.’’
Results of Operations
Results of operations in dollars and as a percentage of net revenue were as follows:
Fiscal Year Ended
December 29, 2019 December 30, 2018 December 31, 2017
in thousands% of
Revenue in thousands% of
Revenue in thousands% of
Revenue
Total revenue. . . . . . . . . . . . . . . . . . . . . . . . . . . . . 1,864,225 100 1,726,085 100 1,794,047 100
Total cost of revenue . . . . . . . . . . . . . . . . . . . . . . 1,738,320 93 2,023,166 117 1,812,692 101
Gross profit (loss) . . . . . . . . . . . . . . . . . . . . . . . 125,905 7 (297,081) (17) (18,645) (1)
Research and development . . . . . . . . . . . . . . . . . . 67,515 4 81,705 5 82,247 5
Sales, general and administrative. . . . . . . . . . . . . 260,443 14 260,111 15 278,645 16
Restructuring charges . . . . . . . . . . . . . . . . . . . . . . 14,110 1 17,497 1 21,045 1
Loss on sale and impairment of residential
lease assets . . . . . . . . . . . . . . . . . . . . . . . . . . . . 25,352 1 251,984 15 624,335 35
Gain on business divestitures . . . . . . . . . . . . . . . . (143,400) (8) (59,347) (3) — —
Operating loss . . . . . . . . . . . . . . . . . . . . . . . . . . (98,115) (5) (849,031) (50) (1,024,917) (56)
Other income (expense), net . . . . . . . . . . . . . . . . 124,083 7 (49,640) (3) (175,833) (10)
Income (loss) before income taxes and equity
in losses of unconsolidated investees. . . . . . 25,968 2 (898,671) (53) (1,200,750) (66)
(Provision) benefit for income taxes . . . . . . . . . . (26,631) (1) (1,010) — 3,944 —
Equity in earnings (losses) of unconsolidated
investees . . . . . . . . . . . . . . . . . . . . . . . . . . . . . . (7,058) — (17,815) (1) 25,938 1
Net loss . . . . . . . . . . . . . . . . . . . . . . . . . . . . . . . (7,721) (1) (917,496) (54) (1,170,868) (65)
Net loss attributable to noncontrolling
interests and redeemable noncontrolling
interests . . . . . . . . . . . . . . . . . . . . . . . . . . . . . 29,880 2 106,405 6 241,747 13
Net income (loss) attributable to
stockholders . . . . . . . . . . . . . . . . . . . . . . . $ 22,159 1 $ (811,091) (48) $ (929,121) (52)
Total Revenue:
Our total revenue increased by 8% during fiscal 2019 as compared to 2018, primarily due to an increase in our
SunPower Technologies Segment. Increase and decrease by segments is further discussed below.
Our total revenue decreased by 4% during fiscal 2018 as compared to fiscal 2017, primarily due to reduced sales
in our SunPower Technologies Segment in the U.S. and in Asia as result of our decision to cease the development
65

of large-scale solar power projects. We sold our remaining U.S. power plant development portfolio in the third quarter
of fiscal 2018. This was partially offset by an increase in our SunPower Energy Services Segment in the proportion
of capital leases placed in service relative to total leases placed in service under our residential leasing program within
the U.S., as well as stronger sales of solar power systems and components to residential customers in all regions, and
stronger sales of commercial solar power projects in all regions.
We did not have customers that accounted for greater than 10% of total revenue in the years ended December 29,
2019 and December 30, 2018.
Revenue - by Segment:
A description of our segments, along with other required information can be found in Note 17, ‘‘Segment and
Geographical Information’’ of the consolidated financial statements in Item 8 of Part II, which is incorporated herein
by reference.
Below, we have further discussed increase and decrease in revenue for each segment.
Fiscal Year
(In thousands, except percentages)December 29,
2019%
ChangeDecember 30,
2018%
ChangeDecember 31,
2017
SunPower Energy Services . . . . . . . . . . . . . . . . . . . . . $1,148,006 —% $1,143,967 (2)% $1,170,253
SunPower Technologies1 . . . . . . . . . . . . . . . . . . . . . . . 1,314,076 24% 1,059,506 (26)% 1,425,254
Intersegment Eliminations and other. . . . . . . . . . . . . . (597,857) 25% (477,388) (40)% (801,460)
Total Revenue . . . . . . . . . . . . . . . . . . . . . . . . . . . . . . . 1,864,225 8% 1,726,085 (4)% 1,794,047
SunPower Energy Services
Overall, revenue for the segment remained flat during fiscal 2019 as compared to fiscal 2018. Higher volume
of sales to our residential customers, was partially offset by a decrease in our commercial business.
Revenue from residential customers increased 10% during fiscal 2019 as compared to fiscal 2018, primarily due
to a higher volume in residential deals, as well as an increase in the sales of solar power components and systems
to our residential customers in the U.S., partially offset by lower third-party dealer cash transactions. Revenue from
commercial customers decreased 24% during fiscal 2019 as compared to fiscal 2018 primarily due to reduction in
power generation revenue due to sale of our commercial sale-leaseback portfolio in the first and second quarters of
fiscal 2019, and lower volume of systems sales and EPC contracts.
Revenue from residential customers increased 28% during fiscal 2018 as compared to fiscal 2017, primarily due
to a higher volume in residential deals together with the increased proportion of capital leases placed in service
relative to total leases placed in service under our residential leasing program within the U.S., as well as an increase
in the sales of solar power components and systems to our residential customers in the U.S., partially offset by lower
third-party dealer cash transactions. Revenue from commercial customers decreased 57% during fiscal 2018 as
compared to fiscal 2017 primarily because of weaker sales of EPC and PPA commercial systems.
SunPower Technologies
Revenue for the segment increased 24% during fiscal 2019 as compared to fiscal 2018, primarily due to higher
volume of module sales in Europe and Asia, as well as revenue from sale of development projects in Japan, Chile,
and Mexico.
Revenue for the segment decreased 26% during fiscal 2018 as compared to fiscal 2017, primarily due to
divesting our U.S. power plant development portfolio during the third quarter of fiscal 2018 partially offset by
increased sales of power plant development and solar power solutions sales in regions outside of the U.S.
Concentrations:
Our SunPower Energy Services Segment as a percentage of total revenue recognized was 62% during fiscal
2019 as compared to 66% during fiscal 2018. The relative change in revenue for SunPower Energy Services Segment
as a percentage of total revenue recognized reflects the impact of a significant increase in revenue in SunPower
Technologies Segment. Our SunPower Technologies Segment as a percentage of total revenue recognized was 70%
66

during fiscal 2019, as compared to 61% during fiscal 2018. The relative change in revenue for SunPower
Technologies Segment as a percentage of total revenue recognized reflects higher volume of module sales in Europe
and Asia, as well as revenue from sale of development projects in Japan, Chile, and Mexico.
Fiscal Year
(As a percentage of total revenue) 2019 2018 2017
Significant Customer: Business Segment:
Actis GP LLP. . . . . . . . . . . . . . . . . . . . . . . . . . . . . . . . Power Plant n/a * 13%
* percentage is less than 10%.
Total Cost of Revenue:
Our total cost of revenue decreased 14% during fiscal 2019 as compared to fiscal 2018, primarily due to the
non-cash impairment charge of $355.1 million during fiscal 2018, offset by increases in cost of revenue in both
SunPower Energy Services segment and SunPower Technology segment. Increase and decrease by segments is
discussed below in detail.
Our total cost of revenue increased 12% during fiscal 2018 as compared to fiscal 2017, primarily as a result of
a non-cash impairment charge of $355.1 million, total tariffs charge of approximately $42.5 million, higher volume
in U.S. residential deals, and increased cost in solar power solutions in our sales to commercial customers. The
increase was partially offset by lower project cost in our sales to power plant following our decision to cease the
development of large-scale power projects. During fiscal 2018, we incurred a write-down of $24.7 million on certain
solar development projects which we sold during the third quarter of fiscal 2018. In addition, we incurred charges
totaling $31.6 million recorded in connection with the contracted sale of raw material inventory to third parties during
2018.
Fiscal Year
(In thousands, except percentages)December 29,
2019 % ChangeDecember 30,
2018 % ChangeDecember 31,
2017
SunPower Energy Services . . . . . . . . . . . . . . . . $1,026,832 2% $1,001,879 (4)% $1,040,885
SunPower Technologies1 . . . . . . . . . . . . . . . . . . 1,142,671 10% 1,040,456 (19)% 1,289,681
Intersegment elimination and other . . . . . . . . . . (431,183) 2,149% (19,169) (96)% (517,874)
Total Cost of Revenue . . . . . . . . . . . . . . . . . . . . 1,738,320 (14)% 2,023,166 12% 1,812,692
1 Balance is net of intersegment elimination.
Cost of Revenue - by Segment:
Below, we have further discussed increase and decrease in cost of revenue for each segment.
SunPower Energy Services
Cost of revenue for the segment increased by 2% during fiscal 2019 as compared to fiscal 2018, primarily due
to a higher volume of sales to our residential customers, partially offset by a decrease in our commercial business
as a result of sale of commercial sale-leaseback portfolio in the first and second quarter of fiscal 2019.
Cost of revenue for the segment decreased by 4% during fiscal 2018 as compared to fiscal 2017, primarily due
to a higher volume of sales to our residential customers.
SunPower Technologies
Cost of revenue for the segment increased by 10% during fiscal 2019 as compared to fiscal 2018, primarily due
to higher volume of module sales in Europe and Asia, offset by a gain on the sale and leaseback of our Oregon
manufacturing facility, (refer to Note 4 Business Divestiture and Sale of Assets for further details), as well as a
reduction in cost of revenues relating to power plant development as we ceased the development of large-scale solar
power projects in the fourth quarter of fiscal 2018.
67

Cost of revenue for the segment decreased by 19% during fiscal 2018 as compared to fiscal 2017, primarily due
to divesting our U.S. power plant development portfolio during the third quarter of fiscal 2018 partially offset by
increased sales of power plant development and solar power solutions sales in regions outside of the U.S.
Gross Margin
Our gross margin increased from (17%) in fiscal 2018 to 7% in fiscal 2019, primarily due to non-cash
impairment charges on certain property, plant and equipment recorded in fiscal 2018.
Our gross margin decreased from (1%) in fiscal 2017 to (17%) in fiscal 2018, primarily due to non-cash
impairment charges on certain property, plant and equipment recorded in fiscal 2018.
Gross Margin - by Segment
Fiscal Year
2019 2018 2017
SunPower Energy Services . . . . . . . . . . . . . . . . . . . . . . . . . . . . . . . . . . . . . . . . . . . 11% 12% 11%
SunPower Technologies . . . . . . . . . . . . . . . . . . . . . . . . . . . . . . . . . . . . . . . . . . . . . 13% 2% 10%
SunPower Energy Services
Gross margin for the segment decreased by 1% during fiscal 2019 as compared to fiscal 2018, primarily as a
result of lower margin on sales in our residential business and higher project costs in our commercial business.
Gross margin for our SunPower Energy Services Segment increased by 1% during fiscal 2018 as compared to
fiscal 2017. Gross margin improved primarily due to a higher volume in residential deals together with the increased
proportion of capital leases placed in service on residential sales, offset by lower margin on sales to residential
customers and higher cost incurred related to solar power solutions deals.
SunPower Technologies
Gross margin for the segment increased by 11%, during fiscal 2019 as compared to fiscal 2018, primarily due
to higher volume of module sales in Europe and Asia, as well as the sale of development projects in Japan and Chile,
and profit contributed by the gain on sale and leaseback of our Oregon manufacturing facility.
Gross margin for our SunPower Technologies Segment decreased by 8% during fiscal 2018 as compared to
fiscal 2017, primarily as a result of lower volume in sales, and reduction due to pressure on project pricing due to
increased global competition and other factors.
Research and Development (‘‘R&D’’)
Fiscal Year
(In thousands, except percentages) 2019 2018 2017
R&D . . . . . . . . . . . . . . . . . . . . . . . . . . . . . . . . . . . . . . . . . . . . . . . . . . . . . . . . . . . . 67,515 81,705 82,247
As a percentage of revenue . . . . . . . . . . . . . . . . . . . . . . . . . . . . . . . . . . . . . . . . . . 4% 5% 5%
R&D expense decreased by $14.2 million during the fiscal 2019 as compared to fiscal 2018, primarily due to
a decrease in labor and facility costs as a result of reductions in headcount driven by our February 2018 restructuring
plan.
R&D expense decreased by $0.5 million during fiscal 2018 as compared to fiscal 2017. The decrease was
primarily due to a decrease in labor costs as a result of reductions in headcount and salary expenses driven by our
February 2018 restructuring plan. The decrease was partially offset by the impairment of property, plant and
equipment related to R&D facilities of $12.8 million.
68

Sales, General and Administrative (‘‘SG&A’’)
Fiscal Year
(In thousands, except percentages) 2019 2018 2017
SG&A . . . . . . . . . . . . . . . . . . . . . . . . . . . . . . . . . . . . . . . . . . . . . . . . . . . . . . . . . 260,443 260,111 278,645
As a percentage of revenue . . . . . . . . . . . . . . . . . . . . . . . . . . . . . . . . . . . . . . . . 14% 15% 16%
SG&A expense increased by $0.3 million during fiscal 2019 as compared to fiscal 2018 primarily due to an
increase in transaction expenses incurred as a result of the proposed spin-off, as well as organization expenses
incurred as a result of the equity offering in the fourth quarter of 2019, offset by reductions in headcount and salary
expenses driven by our February 2018 restructuring plan and ongoing cost reduction efforts.
SG&A expense decreased by $18.5 million during fiscal 2018 as compared to fiscal 2017 primarily due to
reductions in headcount and salary expenses driven by our February 2018 restructuring plan and ongoing cost
reduction efforts.
Restructuring Charges
Fiscal Year
(In thousands, except percentages) 2019 2018 2017
Restructuring charges . . . . . . . . . . . . . . . . . . . . . . . . . . . . . . . . . . . . . . . . . . . . . 14,110 17,497 21,045
As a percentage of revenue . . . . . . . . . . . . . . . . . . . . . . . . . . . . . . . . . . . . . . . . 1% 1% 1%
Restructuring charges decreased by $3.4 million during fiscal 2019 as compared to fiscal 2018, due to lower
severance charges incurred in fiscal 2019 in connection with the newly implemented December 2019 restructuring
plan compared to February 2018 restructuring plan. During the fourth quarter of fiscal 2019, we adopted a
restructuring plan (‘‘December 2019 Restructuring Plan’’) to realign and optimize workforce requirements in light of
recent changes to its business, including the previously announced planned spin-off of Maxeon Solar. Total costs
incurred under the December 2019 Plan during fiscal 2019 was $7.4 million. See ‘‘Item 8. Financial Statements and
Supplementary Data—Notes to Consolidated Financial Statements—Note 8 Restructuring’’ in the Notes to the
consolidated financial statements in this annual report on Form 10-K for further information regarding our
restructuring plans. As a result of the December 2019 Restructuring Plan, we expect to generate total cost savings
of $1.3 million of operating expenses and $1.3 million of cost of goods sold, which are expected to be cash savings,
primarily from a reduction in U.S. workforce, with effects beginning the first quarter of 2020. Actual savings realized
may, however, differ if our assumptions are incorrect or if other unanticipated events occur.
Restructuring charges decreased by $3.5 million during fiscal 2018 as compared to fiscal 2017, primarily
because we have incurred slightly lower severance and benefits charges in connection with the February 2018
restructuring plan compared to the facilities related expenses in the prior periods in connection with our December
2016 restructuring plan. See ‘‘Item 8. Financial Statements—Note 9. Restructuring’’ in the Notes to the Consolidated
Financial Statements in this Annual Report on Form 10-K for further information regarding our restructuring plans.
As a result of the February 2018 restructuring plan, we expected to generate annual cost savings of approximately
$20.5 million in operating expenses, which are expected to be cash savings primarily from a reduction in global
workforce, and the effects commenced in the first quarter of fiscal 2018. Actual savings realized may, however, differ
if our assumptions are incorrect or if other unanticipated events occur.
Loss on sale and impairment of residential lease assets
Fiscal Year
(In thousands, except percentages) 2019 2018 2017
Loss on sale and impairment of residential lease assets . . . . . . . . . . . . . . . . . 25,352 251,984 624,335
As a percentage of revenue . . . . . . . . . . . . . . . . . . . . . . . . . . . . . . . . . . . . . . . . 1% 15% 35%
Loss on sale and impairment of residential lease assets decreased by $226.6 million during the fiscal 2019 as
compared to fiscal 2018, primarily due to the sale of a majority of our residential lease assets portfolio in the
fourth quarter of fiscal 2018. During fiscal year 2019, we sold the remaining portion of the portfolio of residential
lease assets to SunStrong Capital Holdings, LLC, and recorded a loss on sale of $7.2 million.
69

In the fourth quarter of fiscal 2017, in conjunction with our efforts to generate more available liquid funds in
the near-term, we made the decision to sell a portion of our interest in our Residential Lease Portfolio. As a result,
in the fourth quarter of fiscal 2017, we determined it was necessary to evaluate the potential for impairment in our
ability to recover the carrying amount of our Residential Lease Portfolio. As a result of our evaluation, we recognized
noncash impairment charges of $624.3 million. In fiscal 2018, we continued recording additional non-cash
impairment charges through the sale of a portion of our equity interests in SunStrong, our previously wholly-owned
subsidiary, to Hannon Armstrong in November 2018. During the year ended December 30, 2018, we recognized, in
aggregate, loss on sale and impairment of residential lease assets of $252.0 million on the consolidated statements
of operations for fiscal 2018. See Note 4. Business Divestitures and Sale of Assets for further details.
Gain on business divestiture
Fiscal Year
(In thousands, except percentages) 2019 2018 2017
Gain on business divestiture . . . . . . . . . . . . . . . . . . . . . . . . . . . . . . . . $(143,400) $(59,347) $—
As a percentage of revenue . . . . . . . . . . . . . . . . . . . . . . . . . . . . . . . . . (8)% (3)% —%
Gain on business divestiture increased by $84.1 million during the fiscal 2019 as compared to fiscal 2018,
primarily due to the gain on the sale of our commercial sale-leaseback portfolio of $143.4 million, compared to the
gain on sale of $59.3 million for the sale of our microinverter business recorded during fiscal 2018.
Gain on business divestiture increased by $59.3 million during the fiscal 2018 as compared to fiscal 2017,
primarily due to the gain on sale of $59.3 million for sale of our microinverter business recorded in fiscal 2018.
Other Income (Expense), Net
Fiscal Year
(In thousands, except percentages) 2019 2018 2017
Interest income. . . . . . . . . . . . . . . . . . . . . . . . . . . . . . . . . . . . . . . . . . . $ 2,702 $ 3,057 $ 2,100
Interest expense . . . . . . . . . . . . . . . . . . . . . . . . . . . . . . . . . . . . . . . . . . (53,353) (108,011) (90,288)
Other Income (expense):
Other, net . . . . . . . . . . . . . . . . . . . . . . . . . . . . . . . . . . . . . . . . . . . . . 174,734 55,314 (87,645)
Other income (expense), net . . . . . . . . . . . . . . . . . . . . . . . . . . . . . . . . $124,083 $ (49,640) $(175,833)
As a percentage of revenue . . . . . . . . . . . . . . . . . . . . . . . . . . . . . . . . . 7% (3)% (10)%
Interest expense decreased $54.7 million during fiscal 2019 as compared to fiscal 2018, primarily due to
elimination of the non-recourse residential financing obligations in connection with the sale of the Residential Lease
Portfolio in November 2018, as well as the elimination of the sales-leaseback financing obligations in connection
with the sale of the commercial sale-leaseback portfolio during the first and second quarters of fiscal 2019.
Interest expense increased $17.7 million in fiscal 2018 as compared to fiscal 2017 primarily due to new debt and
new commercial sale-leaseback arrangements.
Other income increased by $119.4 million during fiscal 2019 as compared to fiscal 2018, primarily due to a
$158.3 million gain on an equity investment with readily determinable fair value in fiscal 2019, as compared to a loss
of $6.4 million in fiscal 2018. Additionally, gain on sale of equity investments during fiscal 2019 was $17.7 million,
compared to $54.2 million in fiscal 2018.
Other income increased by $143.0 million in fiscal 2018 as compared to fiscal 2017. The change is primarily
due to a $54.2 million gain on the sale of our equity method investments in fiscal 2018, a $73.0 million impairment
charge in fiscal 2017 in our 8point3 Energy Partners LP equity investment balance due to the adoption of ASC 606
which materially increased the investment balance and consequently, led to the recognition of an other-than-
temporary impairment in the first quarter of fiscal 2017.
Income Taxes
Fiscal Year
(In thousands, except percentages) 2019 2018 2017
Benefit from (provision for) income taxes . . . . . . . . . . . . . . . . . . . . . (26,631) (1,010) 3,944
As a percentage of revenue . . . . . . . . . . . . . . . . . . . . . . . . . . . . . . . . . (1)% —% —%
70

In the year ended December 29, 2019, our income tax provision of $26.6 million on a profit before income taxes
and equity in earnings (losses) of unconsolidated investees of $26.0 million was primarily due to related tax expense
in foreign jurisdictions that were profitable. In the year ended December 30, 2018, our income tax provision of
$1.0 million on a loss before income taxes and equity in earnings of unconsolidated investees of $898.7 million was
also primarily due to tax expense in foreign jurisdictions that were profitable, offset by tax benefit related to release
of valuation allowance in a foreign jurisdiction and release of tax reserve due to lapse of statutes of limitation.
The income tax benefit of $3.9 million in the year ended December 31, 2017 on a loss before income taxes and equity
in earnings of unconsolidated investees of $1,200.8 million, was primarily due to the related tax effects of the
carryback of fiscal 2016 net operating losses to fiscal 2015 domestic tax returns, partially offset by tax expense in
profitable jurisdictions.
We record a valuation allowance to reduce our deferred tax assets in the U.S., Malta, South Africa, Spain, and
Mexico to the amount that is more likely than not to be realized. In assessing the need for a valuation allowance, we
consider historical levels of income, expectations and risks associated with the estimates of future taxable income and
ongoing prudent and feasible tax planning strategies. In the event we determine that we would be able to realize
additional deferred tax assets in the future in excess of the net recorded amount, or if we subsequently determine that
realization of an amount previously recorded is unlikely, we would record an adjustment to the deferred tax asset
valuation allowance, which would change income tax in the period of adjustment.
A material amount of our total revenue is generated from customers located outside of the United States, and
a substantial portion of our assets and employees are located outside of the United States. Because of the one-time
transition tax related to the Tax Cuts and Jobs Act enacted in 2017, a significant portion of the accumulated foreign
earnings were deemed to have been repatriated, and accordingly taxed, and were no longer subject to the U.S. federal
deferred tax liability, and the post-2017 accumulated foreign-sourced earnings are generally not taxed in the
U.S. upon repatriation. Foreign withholding taxes have not been provided on the existing undistributed earnings of
our non-U.S. subsidiaries as of December 29, 2019 as these are intended to be indefinitely reinvested in operations
outside the United States.
In June 2019, the U.S. Court of Appeals for the Ninth Circuit overturned the 2015 U.S. tax court decision in
Altera Co v. Commissioner, regarding the inclusion of stock-based compensation costs under cost sharing
agreements. In July 2019, Altera Corp., a subsidiary of Intel Inc., requested en banc review of the decision from the
Ninth Circuit panel and the request was denied in November 2019. In February 2020, Altera Corp. petitioned the
U.S. Supreme Court for review. While a final decision remains outstanding, we quantified and recorded the impact
of the case of $5.8 million as a reduction to deferred tax asset, fully offset by a reduction to valuation allowance of
the same amount, without any income tax expense impact. If the Altera Ninth Circuit opinion is reversed by the U.S.
Supreme Court, we would anticipate unwinding the reduction to both deferred tax asset and valuation allowance
impact as aforementioned. We will continue to monitor the effects of the case’s outcome on our tax provision and
related disclosures once more information becomes available.
Equity in Earnings (Losses) of Unconsolidated Investees
Fiscal Year
(In thousands, except percentages) 2019 2018 2017
Equity in earnings (losses) of unconsolidated investees . . . . . . . . . . $(7,058) $(17,815) $25,938
As a percentage of revenue . . . . . . . . . . . . . . . . . . . . . . . . . . . . . . . . . —% (1)% 1%
Our equity in losses of unconsolidated investees decreased by $10.8 million in fiscal 2019 as compared to fiscal
2018, primarily driven by a decrease in our share of losses of unconsolidated investees, specifically, 8point3 Energy
Partners and its affiliates (the ‘‘8point3 Group’’) which we divested in June 2018.
Our equity in earnings (losses) of unconsolidated investees decreased $43.8 million in fiscal 2018 as compared
to fiscal 2017, primarily driven by the activities of the 8point3 Group, which we divested in June 2018. As a result
of this transaction, we received, after the payment of fees and expenses, merger proceeds of approximately
$359.9 million in cash and no longer directly or indirectly owns any equity interests in the 8point3 Group.
In connection with the sale, we recognized a $34.4 million gain within ‘‘Other, net’’ in ‘‘Other income (expense), net’’
of our consolidated statements of operations for fiscal 2018.
71

Net Loss Attributable to Noncontrolling Interests and Redeemable Noncontrolling Interests
Fiscal Year
(In thousands, except percentages) 2019 2018 2017
Net loss attributable to noncontrolling interests and redeemable
noncontrolling interests . . . . . . . . . . . . . . . . . . . . . . . . . . . . . . . . . . . . . . . . . $29,880 $106,405 $241,747
We have entered into facilities with third-party tax equity investors under which the investors invest in a
structure known as a partnership flip. We determined that we hold controlling interests in these less-than-wholly-
owned entities and therefore we have fully consolidated these entities. We apply the HLBV method in allocating
recorded net income (loss) to each investor based on the change in the reporting period, of the amount of net assets
of the entity to which each investor would be entitled to under the governing contractual arrangements in a liquidation
scenario.
In fiscal 2019, we attributed $29.9 million of net losses primarily to the third-party investors as a result of
allocating certain assets, including tax credits and accelerated tax depreciation benefits, to the investors.
The $76.5 million decrease in net loss attributable to noncontrolling interests and redeemable noncontrolling interests
is primarily due to the deconsolidation of a majority of our residential lease assets in the last quarter of fiscal 2018
and during the third quarter of fiscal 2019, and partially offset by an increase in contributions by Hannon Armstrong
for the equity interest in a new joint venture formed during the third quarter of fiscal 2019.
In fiscal 2018 and 2017, we attributed $106.4 million and $241.7 million, respectively, of net losses primarily
to the third-party investors as a result of allocating certain assets, including tax credits and accelerated tax
depreciation benefits, to the investors. The $135.3 million increase in net loss attributable to noncontrolling interests
and redeemable noncontrolling interests is primarily attributable to the allocated portion of the impairment charge
related to our residential lease assets of $150.6 million (see ‘‘Item 1. Financial Statements—Note 7. Leasing’’), and
an increase in total number of leases placed in service under new and existing facilities with third-party investors.
Critical Accounting Estimates
We prepare our consolidated financial statements in conformity with U.S. generally accepted accounting
principles, which requires management to make estimates and assumptions that affect the amounts of assets,
liabilities, revenues, and expenses recorded in our financial statements. We base our estimates on historical
experience and on various other assumptions that we believe to be reasonable under the circumstances, the results
of which form the basis for making judgments about the carrying values of assets and liabilities that are not readily
apparent from other sources. Actual results may differ from these estimates under different assumptions and
conditions. In addition to our most critical estimates discussed below, we also have other key accounting policies that
are less subjective and, therefore, judgments involved in their application would not have a material impact on our
reported results of operations (See ‘‘Item 8. Financial Statements and Supplementary Data-Notes to Consolidated
Financial Statements-Note 1. Organization and Summary of Significant Accounting Policies’’).
Revenue Recognition
Module and Component Sales
We sell our solar panels and balance of system components primarily to dealers, system integrators and
distributors, and recognizes revenue at a point in time when control of such products transfers to the customer, which
generally occurs upon shipment or delivery depending on the terms of the contracts with the customer. There are no
rights of return. Other than standard warranty obligations, there are no significant post-shipment obligations
(including installation, training or customer acceptance clauses) with any of our customers that could have an impact
on revenue recognition. Our revenue recognition policy is consistent across all geographic areas.
Solar Power System Sales and Engineering, Procurement, and Construction Services
We design, manufacture and sell rooftop and ground-mounted solar power systems under construction and
development agreements, to our residential and commercial customers. In contracts where we sell completed systems
as a single performance obligation, primarily to our joint venture for residential projects, we recognize revenue at the
point-in-time when such systems are placed in service. Any advance payments received before control is transferred
is classified as ‘‘contract liabilities.’’
72

Engineering, procurement and construction (‘‘EPC’’) projects governed by customer contracts that require us to
deliver functioning solar power systems are generally completed within three to twelve months from commencement
of construction. Construction on large projects may be completed within eighteen to thirty-six months, depending on
the size and location. We recognize revenue from EPC services over time as our performance creates or enhances an
energy generation asset controlled by the customer. We use an input method based on cost incurred as we believe that
this method most accurately reflects our progress toward satisfaction of the performance obligation. Under this
method, revenue arising from fixed-price construction contracts is recognized as work is performed based on the ratio
of costs incurred to date to the total estimated costs at completion of the performance obligations.
Incurred costs include all direct material, labor and subcontract costs, and those indirect costs related to contract
performance, such as indirect labor, supplies, and tools. Project material costs are included in incurred costs when
the project materials have been installed by being permanently attached or fitted to the solar power system as required
by the project’s engineering design. Cost-based input methods of revenue recognition require us to make estimates
of net contract revenues and costs to complete the projects. In making such estimates, significant judgment is required
to evaluate assumptions related to the amount of net contract revenues, including the impact of any performance
incentives, liquidated damages, and other payments to customers. Significant judgment is also required to evaluate
assumptions related to the costs to complete the projects, including materials, labor, contingencies, and other system
costs. If the estimated total costs on any contract are greater than the net contract revenues, we recognize the entire
estimated loss in the period the loss becomes known and can be reasonably estimated.
Our arrangements may contain clauses such as contingent repurchase options, delay liquidated damages or early
performance bonus, most favorable pricing, or other provisions that can either increase or decrease the transaction
price. These variable amounts generally are awarded upon achievement of certain performance metrics or milestones.
Variable consideration is estimated at each measurement date at its most likely amount to the extent that it is probable
that a significant reversal of cumulative revenue recognized will not occur and true-ups are applied prospectively as
such estimates change.
Changes in estimates for sales of systems and EPC services occur for a variety of reasons, including but not
limited to (i) construction plan accelerations or delays, (ii) product cost forecast changes, (iii) change orders, or
(iv) changes in other information used to estimate costs. The cumulative effect of revisions to transaction prices or
input cost estimates are recorded in the period in which the revisions to estimates are identified and the amounts can
be reasonably estimated.
Operations and Maintenance
We offer our customers various levels of post-installation operations and maintenance (‘‘O&M’’) services with
the objective of optimizing our customers’ electrical energy production over the life of the system. We determine that
the post-installation systems monitoring and maintenance qualifies as a separate performance obligation. Post-
installation monitoring and maintenance is deferred at the time the contract is executed, based on the estimate of
selling price on a standalone basis, and is recognized to revenue over time as customers receive and consume benefits
of such services. The non-cancellable term of the O&M contracts are typically 90 days for commercial and residential
customers and 180 days for power plant customers.
We typically provide a system output performance warranty, separate from our standard solar panel product
warranty, to customers that have subscribed to our post-installation O&M services. In connection with system output
performance warranties, we agree to pay liquidated damages in the event the system does not perform to the stated
specifications, with certain exclusions. The warranty excludes system output shortfalls attributable to force majeure
events, customer curtailment, irregular weather, and other similar factors. In the event that the system output falls
below the warrantied performance level during the applicable warranty period, and provided that the shortfall is not
caused by a factor that is excluded from the performance warranty, the warranty provides that we will pay the
customer an amount based on the value of the shortfall of energy produced relative to the applicable warrantied
performance level. Such liquidated damages represent a form of variable consideration and are estimated at contract
inception and updated at each reporting period and recognized over time as customers receive and consume the
benefits of the O&M services.
Lease Accounting
Effective December 31, 2018, we adopted Accounting Standards Update (‘‘ASU’’) No. 2016-02, Leases
(Topic 842), as amended (‘‘ASC 842’’). For additional information on the changes resulting from the new standard
73

and the impact to our financial results on adoption, refer to the section Recently Adopted Accounting Pronouncements
below.
Arrangements with SunPower as a lessee
We determine if an arrangement is a lease at inception. Our operating lease agreements are primarily for real
estate and are included within operating lease right-of-use (‘‘ROU’’) assets and operating lease liabilities on the
consolidated balance sheets. We elected the practical expedient to combine our lease and related non-lease
components for all our leases.
ROU assets represent our right to use an underlying asset for the lease term and lease liabilities represent our
obligation to make lease payments arising from the lease. ROU assets and lease liabilities are recognized at the
commencement date based on the present value of lease payments over the lease term. Variable lease payments are
excluded from the ROU assets and lease liabilities and are recognized in the period in which the obligation for those
payments is incurred. As most of our leases do not provide an implicit rate, we use our incremental borrowing rate
based on the information available at commencement date in determining the present value of lease payments. ROU
assets also include any lease prepayments made and exclude lease incentives. Many of our lessee agreements include
options to extend the lease, which we do not include in our minimum lease terms unless they are reasonably certain
to be exercised. Rental expense for lease payments related to operating leases is recognized on a straight-line basis
over the lease term.
Sale-Leaseback Arrangements
We enter into sale-leaseback arrangements under which solar power systems are sold to third parties and
subsequently leased back by us over lease terms of up to 25 years.
We classify our initial sale-leaseback arrangements of solar power systems as operating leases or sales-type
leases, in accordance with the underlying accounting guidance on leases. We may sell our lessee interests in these
arrangements in entirety before the end of the underlying term of the leaseback.
For all sale-leaseback arrangements classified as operating leases, the profit related to the excess of the proceeds
compared to the fair value of the solar power systems is deferred and recognized over the term of the lease.
Sale-leaseback arrangements classified as finance leases or failed sale, are accounted for under the financing method,
the proceeds received from the sale of the solar power systems are recorded as financing liabilities. The financing
liabilities are subsequently reduced by our payments to lease back the solar power systems, less interest expense
calculated based on our incremental borrowing rate adjusted to the rate required to prevent negative amortization.
Refer to Note 4. Business Divestiture and Sale of Assets, for details of the sale of our commercial sale-leaseback
portfolio during fiscal 2019.
Arrangements with SunPower as a lessor
Solar Services
We offer solar services, in partnership with third-party financial institutions, which allows our residential
customers to obtain continuous access to SunPower solar power systems under contracts for terms of up to 20 years.
Solar services revenue is primarily comprised of revenue from such contracts wherein we provide continuous access
to an operating solar system to third parties.
We begin to recognize revenue on solar services when permission to operate (‘‘PTO’’) is given by the local
utility company, the system is interconnected and operation commences. We recognize revenue evenly over the time
that we satisfy our performance obligations over the initial term of the solar services contracts. Solar services
contracts typically have an initial term of 20 years. After the initial contract term, our customers may request an
extension of the term of the contract on prevailing market terms, or request to remove the system. Otherwise, the
contract will automatically renew and continue on a month-to-month basis.
We also apply for and receive Solar Renewable Energy Credits (‘‘SRECs’’) associated with the energy generated
by our solar energy systems and sell them to third parties in certain jurisdictions. SREC revenue is estimated net of
any variable consideration related to possible liquidated damages if we were to deliver fewer SRECs than
contractually committed, and is generally recognized upon delivery of the SRECs to the counterparty.
74

We typically provide a system output performance warranty, separate from our standard solar panel product
warranty, to our solar services customers. In connection with system output performance warranties, we agree to pay
liquidated damages in the event the system does not perform to the stated specifications, with certain exclusions. The
warranty excludes system output shortfalls attributable to force majeure events, customer curtailment, irregular
weather, and other similar factors. In the event that the system output falls below the warrantied performance level
during the applicable warranty period, and provided that the shortfall is not caused by a factor that is excluded from
the performance warranty, the warranty provides that we will pay the customer an amount based on the value of the
shortfall of energy produced relative to the applicable warrantied performance level. Such liquidated damages
represent a form of variable consideration and are estimated at contract inception and updated at each reporting period
and recognized over time as customers receive and consume the benefits of the solar services.
There are rebate programs offered by utilities in various jurisdictions and are issued directly to homeowners,
based on the lease agreements, the homeowners assign these rights to rebate to us. These rights to rebate are
considered non-cash consideration, measured based on the utilities’ rebates from the installed solar panels on the
homeowners’ roofs and recognized over the lease term.
Revenue from solar services contracts entered into prior to the adoption of ASC 842 were accounted for as leases
under the superseded lease accounting guidance and reported within ‘‘Residential leasing’’ on the consolidated
statement of operations.
Shipping and Handling Costs
We account for shipping and handling activities related to contracts with customers as costs to fulfill our promise
to transfer goods and, accordingly, records such costs in cost of revenue.
Taxes Collected from Customers and Remitted to Governmental Authorities
We exclude from our measurement of transaction prices all taxes assessed by governmental authorities that are
both (i) imposed on and concurrent with a specific revenue-producing transaction and (ii) collected from customers.
Accordingly, such tax amounts are not included as a component of revenue or cost of revenue.
Impairment of Residential Lease Assets
We evaluate our long-lived assets, including property, plant and equipment, solar power systems leased and to
be leased, and other intangible assets with finite lives, for impairment whenever events or changes in circumstances
indicate that the carrying value of such assets may not be recoverable. Factors considered important that could result
in an impairment review include significant under-performance relative to expected historical or projected future
operating results, significant changes in the manner of use of acquired assets, and significant negative industry or
economic trends. Our impairment evaluation of long-lived assets includes an analysis of estimated future
undiscounted net cash flows expected to be generated by the assets over their remaining estimated useful lives. If our
estimate of future undiscounted net cash flows is insufficient to recover the carrying value of the assets over the
remaining estimated useful lives, we record an impairment loss in the amount by which the carrying value of the
assets exceeds the fair value. Fair value is generally measured based on either quoted market prices, if available, or
discounted cash flow analysis.
Financing receivables are generated by solar power systems leased to residential customers under sales-type
leases. Financing receivables represent gross minimum lease payments to be received from customers over a period
commensurate with the remaining lease term and the system’s estimated residual value, net of unearned income and
allowance for estimated losses. Our evaluation of the recoverability of these financing receivables is based on
evaluation of the likelihood, based on current information and events, and whether we will be able to collect all
amounts due according to the contractual terms of the underlying lease agreements. In accordance with this
evaluation, we recognize an allowance for losses on financing receivables based on our estimate of the amount equal
to the probable losses net of recoveries. The combination of the leased solar power systems discussed in the preceding
paragraph together with the lease financing receivables is referred to as the ‘‘Residential Lease Portfolio.’’
We performed a recoverability test for assets in the residential assets by estimating future undiscounted net cash
flows expected to be generated by the assets, based on our own specific alternative courses of action under
consideration. The alternative courses were either to sell or refinance the assets, or hold the assets until the end of
their previously estimated useful lives. Upon consideration of the alternatives, we determined that market value, in
75

the form of indicative purchase price from a third-party investor was available for a portion of our residential assets.
As we intend to sell these remaining residential portfolio assets, we used the indicative purchase price from a
third-party investor as fair value of the underlying net assets in our impairment evaluation.
Allowance for Doubtful Accounts and Sales Returns
We maintain allowances for doubtful accounts for estimated losses resulting from the inability of our customers
to make required payments. A considerable amount of judgment is required to assess the likelihood of the ultimate
realization of accounts receivable. We make our estimates of the collectability of our accounts receivable by
analyzing historical bad debts, specific customer creditworthiness and current economic trends.
In addition, at the time revenue is recognized from the sale of solar panels and balance of system components,
we record estimates for sales returns which reduce revenue. These estimates are based on historical sales returns and
analysis of credit memo data, among other known factors.
Product Warranties
We generally provide a 25-year standard warranty for solar panels that we manufacture for defects in materials
and workmanship. The warranty provides that we will repair or replace any defective solar panels during the warranty
period. In addition, we pass through to customers’ long-term warranties from the original equipment manufacturers
of certain system components, such as inverters. Warranties of 25 years from solar panel suppliers are standard in the
solar industry, while certain system components carry warranty periods ranging from five to 20 years.
In addition, we generally warrant our workmanship on installed systems for periods ranging up to 25 years and
also provide a separate system output performance warranty to customers that have subscribed to our post-installation
monitoring and maintenance services which expires upon termination of the post-installation monitoring and
maintenance services related to the system. The warrantied system output performance level varies by system
depending on the characteristics of the system and the negotiated agreement with the customer, and the level declines
over time to account for the expected degradation of the system. Actual system output is typically measured annually
for purposes of determining whether warrantied performance levels have been met. The warranty excludes system
output shortfalls attributable to force majeure events, customer curtailment, irregular weather, and other similar
factors. In the event that the system output falls below the warrantied performance level during the applicable
warranty period, and provided that the shortfall is not caused by a factor that is excluded from the performance
warranty, the warranty provides that we will pay the customer a liquidated damage based on the value of the shortfall
of energy produced relative to the applicable warrantied performance level.
We maintain reserves to cover the expected costs that could result from these warranties. Our expected costs are
generally in the form of product replacement or repair. Warranty reserves are based on our best estimate of such costs
and are recognized as a cost of revenue. We continuously monitor product returns for warranty failures and maintain
a reserve for the related warranty expenses based on various factors including historical warranty claims, results of
accelerated lab testing, field monitoring, vendor reliability estimates, and data on industry averages for similar
products. Due to the potential for variability in these underlying factors, the difference between our estimated costs
and our actual costs could be material to our consolidated financial statements. If actual product failure rates or the
frequency or severity of reported claims differ from our estimates or if there are delays in our responsiveness to
outages, we may be required to revise our estimated warranty liability. Historically, warranty costs have been within
management’s expectations.
Inventories
Inventories are accounted for on a first-in-first-out basis and are valued at the lower of cost or net realizable
value. We evaluate the realizability of our inventories, including future purchase commitments under fixed-price
long-term supply agreements, based on assumptions about expected demand and market conditions. Our assumption
of expected demand is developed based on our analysis of bookings, sales backlog, sales pipeline, market forecast
and competitive intelligence. Our assumption of expected demand is compared to available inventory, production
capacity, future polysilicon purchase commitments, available third-party inventory and growth plans. Our factory
production plans, which drive materials requirement planning, are established based on our assumptions of expected
demand. We respond to reductions in expected demand by temporarily reducing manufacturing output and adjusting
expected valuation assumptions as necessary. In addition, expected demand by geography has changed historically
due to changes in the availability and size of government mandates and economic incentives.
76

We evaluate the terms of our long-term inventory purchase agreements with suppliers for the procurement of
polysilicon, ingots, wafers, and solar cells and establish accruals for estimated losses on adverse purchase
commitments as necessary, such as lower of cost or net realizable value adjustments, forfeiture of advanced deposits
and liquidated damages. Obligations related to non-cancellable purchase orders for inventories match current and
forecasted sales orders that will consume these ordered materials and actual consumption of these ordered materials
are compared to expected demand regularly. We anticipate total obligations related to long-term supply agreements
for inventories will be realized because quantities are less than management’s expected demand for its solar power
products over a period of years; however, if raw materials inventory balances temporarily exceed near-term demand,
we may elect to sell such inventory to third parties to optimize working capital needs. In addition, because the
purchase prices required by our long-term polysilicon agreements are significantly higher than current market prices
for similar materials, if we are not able to profitably utilize this material in our operations or elect to sell near-term
excess, we may incur additional losses. Other market conditions that could affect the realizable value of our
inventories and are periodically evaluated by management include the aging of inventories on hand, historical
inventory turnover ratio, anticipated sales price, new product development schedules, the effect new products might
have on the sale of existing products, product obsolescence, customer concentrations, the current market price of
polysilicon as compared to the price in our fixed-price arrangements, and product merchantability, among other
factors. If, based on assumptions about expected demand and market conditions, we determine that the cost of
inventories exceeds its net realizable value or inventory is excess or obsolete, or we enter into arrangements with third
parties for the sale of raw materials that do not allow us to recover our current contractually committed price for such
raw materials, we record a write-down or accrual, which may be material, equal to the difference between the cost
of inventories and the estimated net realizable value. If actual market conditions are less favorable than those
projected by management, additional inventory write-downs may be required that could negatively affect our gross
margin and operating results. If actual market conditions are more favorable, we may have higher gross margin when
products that have been previously written down are sold in the normal course of business. Additionally, the
Company’s classification of its inventory as either current or long-term inventory requires it to estimate the portion
of on-hand inventory that we estimate will be realized over the next 12 months.
Stock-Based Compensation
We provide stock-based awards to our employees, executive officers and directors through various equity
compensation plans including our employee stock option and restricted stock plans. We measure and record
compensation expense for all stock-based payment awards based on estimated fair values. The fair value of restricted
stock awards and units is based on the market price of our common stock on the date of grant. We have not granted
stock options since fiscal 2008. We are required under current accounting guidance to estimate forfeitures at the date
of grant. Our estimate of forfeitures is based on our historical activity, which we believe is indicative of expected
forfeitures. In subsequent periods if the actual rate of forfeitures differs from our estimate, the forfeiture rates are
required to be revised, as necessary. Changes in the estimated forfeiture rates can have a significant effect on
stock-based compensation expense since the effect of adjusting the rate is recognized in the period the forfeiture
estimate is changed.
We also grant performance share units to executive officers and certain employees that require us to estimate
expected achievement of performance targets over the performance period. This estimate involves judgment
regarding future expectations of various financial performance measures. If there are changes in our estimate of the
level of financial performance measures expected to be achieved, the related stock-based compensation expense may
be significantly increased or reduced in the period that our estimate changes.
Variable Interest Entities (‘‘VIE’’)
We regularly evaluate our relationships and involvement with unconsolidated VIEs and our other equity and cost
method investments, to determine whether we have a controlling financial interest in them or have become the
primary beneficiary, thereby requiring us to consolidate their financial results into our financial statements.
In connection with the sale of the equity interests in the entities that hold solar power plants, we also consider whether
we retain a variable interest in the entity sold, either through retaining a financial interest or by contractual means.
If we determine that the entity sold is a VIE and that we hold a variable interest, we then evaluate whether we are
the primary beneficiary. If we determine that we are the primary beneficiary, we will consolidate the VIE.
The determination of whether we are the primary beneficiary is based upon whether we have the power to direct the
activities that most directly impact the economic performance of the VIE and whether we absorb any losses or
benefits that would be potentially significant to the VIE.
77

Accounting for Business Divestitures
From time to time, we may dispose of significant assets or portion of our business by sale or exchange for other
assets. In accounting for such transactions, we apply the applicable guidance of U.S. GAAP pertaining to
discontinued operations and disposals of components of an entity. We assess such transaction as regards specified
significance measures to determine whether a disposal qualifies as a discontinuance of operations verses a sale of
asset components of our entity. Our assessment includes how such a disposal may represent a significant strategic
shift in our operations and its impact on our continuing involvement as regards that portion of our business. Instances
where disposals do not remove our ability to participate in a significant portion of our business are accounted as
disposal of assets. Instances where disposals remove our ability to participate in a significant portion of our business
are accounted as discontinued operations. For additional details see Note 4. Business Combinations and Divestitures’’
under ‘‘Item 8. Financial Statements and Supplementary Data-Notes to Consolidated Financial Statements.’’
We charge disposal related costs that are not part of the consideration to general and administrative expense as they
are incurred. These costs typically include transaction and disposal costs, such as legal, accounting, and other
professional fees.
Long-Lived Assets
Our long-lived assets include property, plant and equipment, solar power systems leased and to be leased, and
other intangible assets with finite lives. We evaluate our long-lived assets for impairment whenever events or changes
in circumstances indicate that the carrying value of such assets may not be recoverable. Factors considered important
that could result in an impairment review include significant under-performance relative to expected historical or
projected future operating results, significant changes in the manner of use of acquired assets and significant negative
industry or economic trends. Our impairment evaluation of long-lived assets includes an analysis of estimated future
undiscounted net cash flows expected to be generated by the assets over their remaining estimated useful lives. If our
estimate of future undiscounted net cash flows is insufficient to recover the carrying value of the assets over the
remaining estimated useful lives, we record an impairment loss in the amount by which the carrying value of the
assets exceeds the fair value. Fair value is generally measured based on either quoted market prices, if available, or
discounted cash flow analyses.
Accounting for Income Taxes
Our global operations involve manufacturing, research and development, and selling and project development
activities. Profit from non-U.S. activities is subject to local country taxation. It is our intention to indefinitely reinvest
these earnings outside the United States. We record a valuation allowance to reduce our U.S., Malta, South Africa,
Mexico, and Spain entities’ deferred tax assets to the amount that is more likely than not to be realized. In assessing
the need for a valuation allowance, we consider historical levels of income, expectations and risks associated with
the estimates of future taxable income and ongoing prudent and feasible tax planning strategies. In the event we
determine that we would be able to realize additional deferred tax assets in the future in excess of the net recorded
amount, or if we subsequently determine that realization of an amount previously recorded is unlikely, we would
record an adjustment to the deferred tax asset valuation allowance, which would change income tax in the period of
adjustment. As of December 29, 2019, we believe there is insufficient evidence to realize additional deferred tax
assets beyond the U.S. net operating losses that can be benefited through a carryback election; however, the reversal
of the valuation allowance, which could be material, could occur in a future period.
The calculation of tax expense and liabilities involves dealing with uncertainties in the application of complex
global tax regulations, including in the tax valuation of projects sold to tax equity partnerships and other third parties.
We recognize potential liabilities for anticipated tax audit issues in the United States and other tax jurisdictions based
on our estimate of whether, and the extent to which, additional taxes will be due. If payment of these amounts
ultimately proves to be unnecessary, the reversal of the liabilities would result in tax benefits being recognized in the
period in which we determine the liabilities are no longer necessary. If the estimate of tax liabilities proves to be less
than the ultimate tax assessment, a further charge to expense would result. We accrue interest and penalties on tax
contingencies which are classified as ‘‘Provision for income taxes’’ in our Consolidated Statements of Operations and
are not considered material. In addition, foreign exchange gains (losses) may result from estimated tax liabilities
which are expected to be realized in currencies other than the U.S. dollar.
Pursuant to the Tax Sharing Agreement with Cypress, our former parent company, we are obligated to indemnify
Cypress upon current utilization of carryforward tax attributes generated while we were part of the Cypress
78

consolidated or combined group. Further, to the extent Cypress experiences any tax examination assessments
attributable to our operations while part of the Cypress consolidated or combined group, Cypress will require an
indemnification from us for those aspects of the assessment that relate to our operations. See also ‘‘Item 1A. Risk
Factors - Risks Related to Our Operations-Our agreements with Cypress require us to indemnify Cypress for certain
tax liabilities. These indemnification obligations and related contractual restrictions may limit our ability to pursue
certain business initiatives.’’
Liquidity and Capital Resources
Cash Flows
A summary of the sources and uses of cash, cash equivalents, restricted cash and restricted cash equivalents is
as follows:
Fiscal Year Ended
(In thousands)December 29,
2019December 30,
2018December 31,
2017
Net cash used in operating activities . . . . . . . . . . . . . . . . . . . . . . . . . . . . . . $(270,413) $(543,389) $(267,412)
Net cash provided by (used in) investing activities. . . . . . . . . . . . . . . . . . . $ 21,366 $ 274,900 $(293,084)
Net cash provided by financing activities . . . . . . . . . . . . . . . . . . . . . . . . . . $ 344,314 $ 85,847 $ 589,932
Operating Activities
Net cash used in operating activities for the year ended December 29, 2019 was $270.4 million and was
primarily the result of: (i) $158.3 million mark-to-market gain on equity investments with readily determinable fair
value; (ii) $143.4 million gain on business divestiture; (iii) $128.4 million increase in inventories to support the
construction of our solar energy projects; (iv) $66.2 million increase in accounts receivable, primarily driven by
billings in excess of collections; (v) $38.2 million increase in contract assets driven by construction activities;
(vi) $25.2 million gain on sale of assets; (vii) $17.3 million gain on sale of equity investments without readily
determinable fair value; (viii) $8.9 million decrease in operating lease liabilities; (ix) $8.8 million increase in prepaid
expenses and other assets, primarily related to movements in prepaid inventory; (x) net loss of $7.7 million; and
(xi) $2.2 million increase in project assets, primarily related to the construction of our commercial solar energy
projects. This was offset by: (i) $80.1 million depreciation and amortization; (ii) $79.3 million increase in accounts
payable and other accrued liabilities; (iii) $50.2 million increase in advances to suppliers; (iv) $33.8 million loss on
sale and impairment of residential lease assets; (v) $27.5 million increase in contract liabilities driven by construction
activities; (vi) stock-based compensation of $26.9 million; (vii) $9.5 million non-cash interest expense;
(viii) $8.6 million decrease in operating lease right-of-use assets; (ix) $7.1 million loss in equity in earnings of
unconsolidated investees; (x) $5.9 million non-cash restructuring charges; and (xi) $5.0 million net change in
deferred income taxes; and (xii) impairment of long-lived assets of $0.8 million.
In December 2018 and May 2019, we entered into factoring arrangements with two separate third-party factor
agencies related to our accounts receivable from customers in Europe. As a result of these factoring arrangements,
title of certain accounts receivable balances was transferred to third-party vendors, and both arrangements were
accounted for as a sale of financial assets given effective control over these financial assets has been surrendered. As a
result, these financial assets have been excluded from our consolidated balance sheets. In connection with the
factoring arrangements, we sold accounts receivable invoices amounting to $119.4 million and $26.3 million in fiscal
2019 and 2018, respectively. As of December 29, 2019 and December 30, 2018, total uncollected accounts receivable
from end customers under both arrangements were $11.6 million and $21.0 million, respectively.
Net cash used in operating activities in fiscal 2018 was $543.4 million and was primarily the result of: (i) net
loss of $917.5 million; (ii) $182.9 million increase in long-term financing receivables related to our net investment
in sales-type leases; (iii) $127.3 million decrease in accounts payable and other accrued liabilities, primarily
attributable to payments of accrued expenses; (iv) $59.3 million gain on business divestiture; (v) $54.2 million gain
on the sale of equity investments; (vi) $43.5 million increase in contract assets driven by construction activities;
(vii) $39.2 million increase in inventories due to the support of various construction projects; (viii) $30.5 million
decrease in contract liabilities driven by construction activities; (ix) $6.9 million increase in deferred income taxes;
(x) $6.8 million increase due to other various activities; and (xi) $0.2 million increase in accounts receivable,
primarily driven by billings. This was partially offset by: (i) impairment of property, plant and equipment of
79
$369.2 million; (ii) impairment of residential lease assets of $189.7 million; (iii) net non-cash charges of
$162.1 million related to depreciation, stock-based compensation and other non-cash charges; (iv) loss on sale of
residential lease assets of $62.2 million; (v) $44.4 million decrease in advance payments made to suppliers;
(vi) $39.5 million decrease in project assets, primarily related to the construction of our Commercial solar energy
projects; (vii) $22.8 million decrease in prepaid expenses and other assets, primarily related to the receipt of prepaid
inventory; (viii) $17.8 million decrease in equity in earnings of unconsolidated investees; (ix) $6.9 million net change
in income taxes; (x) $6.4 million unrealized loss on equity investments with readily determinable fair value; and
(xi) $3.9 million dividend from equity method investees.
Net cash used in operating activities in fiscal 2017 was $267.4 million and was primarily the result of: (i) net
loss of $1,170.9 million; (ii) $216.3 million decrease in accounts payable and other accrued liabilities, primarily
attributable to payment of accrued expenses; (iii) $123.7 million increase in long-term financing receivables related
to our net investment in sales-type leases; (iv) $38.2 million increase in inventories to support the construction of our
solar energy projects; (vi) $25.9 million increase in equity in earnings of unconsolidated investees; (vii) $7.0 million
net change in income taxes; (viii) $5.3 million gain on sale of equity method investment; and (ix) $1.2 million
decrease in accounts receivable, primarily driven by collections; This was partially offset by: (i) $624.3 million
impairment of residential lease assets; (ii) other net non-cash charges of $239.6 million related to depreciation,
stock-based compensation and other non-cash charges; (iii) $145.2 million increase in contract liabilities driven by
construction activities; (iv) $110.5 million decrease in prepaid expenses and other assets, primarily related to the
receipt of prepaid inventory; (v) $89.6 million impairment of 8point3 Energy Partners investment balance;
(vi) $68.8 million decrease in advance payments made to suppliers; (vii) $30.1 million dividend from 8point3 Energy
Partners; (viii) $10.7 million decrease in contract assets driven by milestone billings; (ix) $2.3 million decrease in
project assets, primarily related to the construction of our commercial and power plant solar energy projects
Investing Activities
Net cash provided by investing activities in the year ended December 29, 2019 was $21.4 million, which
included (i) proceeds of $60.0 million from sale of property, plant, and equipment; (ii) $42.9 million proceeds from
sale of investments; (iii) net proceeds of $40.5 million from business divestiture; and (iv) $2.0 million of proceeds
resulting from realization of estimated receivables from a business divestiture. This was offset by (i) cash paid for
solar power systems of $53.3 million; (ii) $47.4 million of purchases of property, plant and equipment; (iii) cash paid
for investments in unconsolidated investees of $12.4 million; and (iv) $10.9 million of cash de-consolidated from the
sale of residential lease assets.
Net cash provided by investing activities in fiscal 2018 was $274.9 million, which included (i) proceeds from
the sale of investment in joint ventures and non-public companies of $420.3 million; (ii) proceeds of $23.3 million
from business divestiture; and (iii) a $13.0 million dividend from equity method investees. This was partially offset
by: (i) $167.0 million in capital expenditures primarily related to the expansion of our solar cell manufacturing
capacity and costs associated with solar power systems, leased and to be leased; and (ii) $14.7 million paid for
investments in consolidated and unconsolidated investees.
Net cash used in investing activities in fiscal 2017 was $293.1 million, which included (i) $283.0 million in
capital expenditures primarily related to the expansion of our solar cell manufacturing capacity and costs associated
with solar power systems, leased and to be leased; (ii) $18.6 million paid for investments in consolidated and
unconsolidated investees; and (iii) $1.3 million purchase of marketable securities. This was partially offset by
proceeds from the sale of investment in joint ventures of $6.0 million and a $3.8 million dividend from equity method
investees.
Financing Activities
Net cash provided by financing activities in the year ended December 29, 2019 was $344.3 million, which
included: (i) $171.9 million from the common stock offering; (ii) $110.9 million in net proceeds of bank loans and
other debt; (iii) $69.2 million net proceeds from the issuance of non-recourse residential financing, net of issuance
costs; (iv) $35.5 million of net contributions from noncontrolling interests and redeemable noncontrolling interests
related to residential lease projects; (v) $3.0 million of proceeds from issuance of non-recourse power plant and
commercial financing, net of issuance costs. This was partially offset by (i) $39.0 million of payment associated with
prior business combination; (ii) $5.6 million in purchases of treasury stock for tax withholding obligations on vested
restricted stock; and (iii) $1.6 million settlement of contingent consideration arrangement, net of cash received.
80

Net cash provided by financing activities in fiscal 2018 was $85.8 million, which included: (i) $174.9 million
in net proceeds from the issuance of non-recourse residential financing, net of issuance costs; (ii) $129.3 million of
net contributions from noncontrolling interests and redeemable noncontrolling interests related to residential lease
projects; and (iii) $94.7 million in net proceeds from the issuance of non-recourse power plant and commercial
financing, net of issuance costs. This was partially offset by: (i) $307.6 million in net repayments of 0.75% debentures
due 2018, bank loans and other debt; and (ii) $5.5 million in purchases of treasury stock for tax withholding
obligations on vested restricted stock.
Net cash provided by financing activities in fiscal 2017 was $589.9 million, which included: (i) $351.8 million
in net proceeds from the issuance of non-recourse power plant and commercial financing, net of issuance costs;
(ii) $179.2 million of net contributions from noncontrolling interests and redeemable noncontrolling interests
primarily related to residential lease projects; and (iii) $82.7 million in net proceeds from the issuance of
non-recourse residential financing, net of issuance costs. This was partially offset by: (i) 19.1 million in net
repayments of bank loans and other debt; and (ii) $4.7 million in purchases of treasury stock for tax withholding
obligations on vested restricted stock.
Debt and Credit Sources
Convertible Debentures
As of December 29, 2019, an aggregate principal amount of $425.0 million of the 4.00% senior convertible
debentures due 2023 (the ‘‘4.00% debentures due 2023’’) remained issued and outstanding. The 4.00% debentures
due 2023 were issued on December 15, 2015. Interest on the 4.00% debentures due 2023 is payable on January 15
and July 15 of each year, beginning on July 15, 2016. Holders are able to exercise their right to convert the debentures
at any time into shares of our common stock at an initial conversion price approximately equal to $30.53 per share,
subject to adjustment in certain circumstances. If not earlier repurchased or converted, the 4.00% debentures due
2023 mature on January 15, 2023. Holders may require us to repurchase all or a portion of their 4.00% debentures
due 2023, upon a fundamental change, as described in the related indenture, at a cash repurchase price equal to 100%
of the principal amount plus accrued and unpaid interest. If we undergo a non-stock change of control, as described
in the related indenture, the 4.00% debentures due 2023 will be subject to redemption at our option, in whole but not
in part, for a period of 30 calendar days following a repurchase date relating to the non-stock change of control, at
a cash redemption price equal to 100% of the principal amount plus accrued and unpaid interest. Otherwise, the
4.00% debentures due 2023 are not redeemable at our option prior to the maturity date. In the event of certain events
of default, Wells Fargo Bank, National Association (‘‘Wells Fargo’’), the trustee, or the holders of a specified amount
of then-outstanding 4.00% debentures due 2023 will have the right to declare all amounts then outstanding due and
payable.
As of December 29, 2019, an aggregate principal amount of $400.0 million of the 0.875% senior convertible
debentures due 2021 (the ‘‘0.875% debentures due 2021’’) remained issued and outstanding. The 0.875% debentures
due 2021 were issued on June 11, 2014. Interest on the 0.875% debentures due 2021 is payable on June 1 and
December 1 of each year. Holders are able to exercise their right to convert the debentures at any time into shares
of our common stock at an initial conversion price approximately equal to $48.76 per share, subject to adjustment
in certain circumstances. If not earlier repurchased or converted, the 0.875% debentures due 2021 mature on June 1,
2021. Holders may require us to repurchase all or a portion of their 0.875% debentures due 2021, upon a fundamental
change, as described in the related indenture, at a cash repurchase price equal to 100% of the principal amount plus
accrued and unpaid interest. If we undergo a non-stock change of control, as described in the related indenture, the
0.875% debentures due 2021 will be subject to redemption at our option, in whole but not in part, for a period of
30 calendar days following a repurchase date relating to the non-stock change of control, at a cash redemption price
equal to 100% of the principal amount plus accrued and unpaid interest. Otherwise, the 0.875% debentures due
2021 are not redeemable at our option prior to the maturity date. In the event of certain events of default, Wells Fargo,
the trustee, or the holders of a specified amount of then-outstanding 0.875% debentures due 2021 will have the right
to declare all amounts then outstanding due and payable. (See ‘‘Item 8. Financial Statements - Note 18. Subsequent
Event’’)
Loan Agreement with California Enterprise Development Authority (‘‘CEDA’’)
On December 29, 2010, we borrowed from CEDA the proceeds of the $30.0 million aggregate principal amount
of CEDA’s tax-exempt Recovery Zone Facility Revenue Bonds (SunPower Corporation - Headquarters Project)
Series 2010 (the ‘‘Bonds’’) maturing April 1, 2031 under a loan agreement with CEDA. Certain of our obligations
81

under the loan agreement were contained in a promissory note dated December 29, 2010 issued by us to CEDA,
which assigned the promissory note, along with all right, title and interest in the loan agreement, to Wells Fargo, as
trustee, with respect to the Bonds for the benefit of the holders of the Bonds. The Bonds bear interest at a fixed-rate
of 8.50% per annum. As of December 29, 2019, the fair value of the Bonds was $32.1 million, determined by using
Level 2 inputs based on quarterly market prices as reported by an independent pricing source.
As of December 29, 2019, the $30.0 million aggregate principal amount of the Bonds was classified as
‘‘Long-term debt’’ in our consolidated balance sheets.
Revolving Credit Facility with Credit Agricole
On October 29, 2019, we entered into a new Green Revolving Credit Agreement (the ‘‘2019 Revolver’’) with
Crédit Agricole Corporate and Investment Bank (‘‘Credit Agricole’’), as lender, with a revolving credit commitment
of $55.0 million. The 2019 Revolver contains affirmative covenants, events of default and repayment provisions
customarily applicable to similar facilities and has a per annum commitment fee of 0.05% on the daily unutilized
amount, payable quarterly. Loans under the 2019 Revolver bear either an adjusted LIBOR interest rate for the period
elected for such loan or a floating interest rate of the higher of prime rate, federal funds effective rate, or LIBOR for
an interest period of one month, plus an applicable margin, ranging from 0.25% to 0.60%, depending on the base
interest rate applied, and each matures on the earlier of April 29, 2021, or the termination of commitments thereunder.
Our payment obligations under the 2019 Revolver are guaranteed by Total S.A. up to the maximum aggregate
principal amount of $55.0 million. In consideration of the commitments of Total S.A., we are required to pay them
a guaranty fee of 0.25% per annum on any amounts borrowed under the 2019 Revolver and to reimburse Total
S.A. for any amounts paid by them under the parent guaranty. We have pledged the equity of a wholly-owned
subsidiary of the Company that holds our shares of Enphase Energy, Inc. common stock to secure our reimbursement
obligation under the 2019 Revolver. We have also agreed to limit our ability to draw funds under the 2019 Revolver,
to no more than 67% of the fair market value of the common stock held by our subsidiary at the time of the draw.
As of December 29, 2019, we had no outstanding borrowings under the 2019 Revolver.
September 2011 Letter of Credit Facility with Deutsche Bank and Deutsche Bank Trust CompanyAmericas (together, ‘‘Deutsche Bank Trust’’)
On September 27, 2011, we entered into a letter of credit facility with Deutsche Bank Trust which provides for
the issuance, upon request by us, of letters of credit to support our obligations in an aggregate amount not to exceed
$200.0 million. Each letter of credit issued under the facility is fully cash-collateralized and we have entered into a
security agreement with Deutsche Bank Trust, granting them a security interest in a cash collateral account
established for this purpose.
As of December 29, 2019, letters of credit issued under the Deutsche Bank Trust facility totaled $3.6 million,
which was fully collateralized with restricted cash as classified on the consolidated balance sheets.
Other Facilities
Asset-Backed Loan with Bank of America
On March 29, 2019, we entered in a Loan and Security Agreement with Bank of America, N.A., which provides
a revolving credit facility secured by certain inventory and accounts receivable in the maximum aggregate principal
amount of $50.0 million. The Loan and Security Agreement contains negative and affirmative covenants, events of
default and repayment and prepayment provisions customarily applicable to asset-backed credit facilities. The facility
bears a floating interest rate of LIBOR plus an applicable margin, and matures on the earlier of March 29, 2022, a date
that is 91 days prior to the maturity of our 2021 convertible debentures, or the termination of the commitments
thereunder. During fiscal 2019, we drew loans totaling $31.3 million, under this facility and we repaid loans of
$12.2 million, leaving a balance outstanding of $19.2 million as of December 29, 2019.
SunTrust Facility
On June 28, 2018, we entered into a Financing Agreement with SunTrust Bank, which provides a revolving
credit facility in the maximum aggregate principal amount of $75.0 million. Each loan draw from the facility bears
interest at either a base rate or federal funds rate plus an applicable margin or a floating interest rate of LIBOR plus
an applicable margin, and matures no later than three years following the date of the draw. As of December 29, 2019,
we had $75.0 million in borrowing capacity under this limited recourse construction financing facility.
82

Non-recourse Financing and Other Debt
In order to facilitate the construction, sale or ongoing operation of certain solar projects, including our residential
leasing program, we regularly obtain project-level financing. These financings are secured either by the assets of the
specific project being financed or by our equity in the relevant project entity and the lenders do not have recourse
to our general assets for repayment of such debt obligations, and hence the financings are referred to as non-recourse.
Non-recourse financing is typically in the form of loans from third-party financial institutions, but also takes other
forms, including ‘‘flip partnership’’ structures, sale-leaseback arrangements, or other forms commonly used in the
solar or similar industries. We may seek non-recourse financing covering solely the construction period of the solar
project or may also seek financing covering part or all of the operating life of the solar project. We classify
non-recourse financings in our consolidated balance sheets in accordance with their terms; however, in certain
circumstances, we may repay or refinance these financings prior to stated maturity dates in connection with the sale
of the related project or similar circumstances. In addition, in certain instances, the customer may assume the loans
at the time that the project entity is sold to the customer. In these instances, subsequent debt assumption is reflected
as a financing outflow and operating inflow in the consolidated statements of cash flows to reflect the substance of
the assumption as a facilitation of customer financing from a third party.
Liquidity
As of December 29, 2019, we had unrestricted cash and cash equivalents of $423.0 million as compared to
$309.4 million as of December 30, 2018. Our cash balances are held in numerous locations throughout the world,
and as of December 29, 2019, we had approximately $79.6 million held outside of the United States. This offshore
cash is used to fund operations of our business in the Europe and Asia Pacific regions as well as non-U.S.
manufacturing operations, which require local payment for product materials and other expenses. The amounts held
outside of the United States represent the earnings of our foreign subsidiaries which under the enacted Tax Act,
incurred a one-time transition tax (such amounts were previously tax deferred), however, would not result in a cash
payment due to our cumulative net operating loss position. We expect total capital expenditures related to purchases
of property, plant and equipment of approximately $96.8 million in fiscal 2020 in order to increase our manufacturing
capacity for our highest efficiency A-Series (Maxeon 5) product platform and our P-Series technology, improve our
current and next generation solar cell manufacturing technology, and other projects. In addition, while we have begun
the transition away from our project development business, we still expect to invest capital to develop solar power
systems and plants for sale to customers. The development of solar power plants can require long periods of time and
substantial initial investments. Our efforts in this area may consist of all stages of development, including land
acquisition, permitting, financing, construction, operation and the eventual sale of the projects. We often choose to
bear the costs of such efforts prior to the final sale to a customer, which involves significant upfront investments of
resources (including, for example, large transmission deposits or other payments, which may be non-refundable),
land acquisition, permitting, legal and other costs, and in some cases the actual costs of constructing a project, in
advance of the signing of PPAs and EPC contracts and the receipt of any revenue, much of which is not recognized
for several additional months or years following contract signing. Any delays in disposition of one or more projects
could have a negative impact on our liquidity.
Certain of our customers also require performance bonds issued by a bonding agency or letters of credit issued
by financial institutions, which are returned to us upon satisfaction of contractual requirements. If there is a
contractual dispute with the customer, the customer may withhold the security or make a draw under such security,
which could have an adverse impact on our liquidity. Obtaining letters of credit may require adequate collateral.
All letters of credit issued under our 2016 Guaranteed LC Facilities are guaranteed by Total S.A. pursuant to the
Credit Support Agreement. Our September 2011 letter of credit facility with Deutsche Bank Trust is fully
collateralized by restricted cash, which reduces the amount of cash available for operations. As of December 29,
2019, letters of credit issued under the Deutsche Bank Trust facility amounted to $3.6 million which were fully
collateralized with restricted cash on our consolidated balance sheets.
Solar power plant projects often require significant up-front investments. These include payments for
preliminary engineering, permitting, legal, and other expenses before we can determine whether a project is feasible.
We often make arrangements with third-party financiers to acquire and build solar power systems or to fund project
construction using non-recourse project debt. As of December 29, 2019, outstanding amounts related to our project
financing totaled $9.1 million.
83

There are no assurances, however, that we will have sufficient available cash to repay our indebtedness or that
we will be able to refinance such indebtedness on similar terms to the expiring indebtedness. If our capital resources
are insufficient to satisfy our liquidity requirements, we may seek to sell additional equity investments or debt
securities or obtain other debt financing. The current economic environment, however, could limit our ability to raise
capital by issuing new equity or debt securities on acceptable terms, and lenders may be unwilling to lend funds on
acceptable terms in the amounts that would be required to supplement cash flows to support operations. The sale of
additional equity investments or convertible debt securities would result in additional dilution to our stockholders
(and the potential for further dilution upon the exercise of warrants or the conversion of convertible debt) and may
not be available on favorable terms or at all, particularly in light of the current conditions in the financial and credit
markets. Additional debt would result in increased expenses and would likely impose new restrictive covenants which
may be similar or different than those restrictions contained in the covenants under our current loan agreements and
debentures. In addition, financing arrangements, including project financing for our solar power plants and letters of
credit facilities, may not be available to us, or may not be available in amounts or on terms acceptable to us.
While challenging industry conditions and a competitive environment extended throughout fiscal 2019, we
believe that our total cash and cash equivalents, including cash expected to be generated from operations, will be
sufficient to meet our obligations over the next 12 months from the date of issuance of our consolidated financial
statements. Also, we have been successful in our ability to divest certain investments and non-core assets, such as
the sale of membership interests in our Commercial Sale-Leaseback Portfolio, and the sale and leaseback of Hillsboro
facility (Note 4. Business Divestiture and Sale of Assets). Additionally, we have secured other sources of financing
to satisfy our liquidity needs such as the issuance of common stock through the public offering completed in
November 2019 and realizing cash savings resulting from restructuring actions and cost reduction initiatives
(Note 14. Common Stock and Note 8. Restructuring). We continue to focus on improving our overall operating
performance and liquidity, including managing cash flows and working capital.
While we have not drawn on it, we also have the ability to enhance our available cash by borrowing up to
$55 million under our 2019 Revolver. See Note 11. Debt and Credit Sources.
Although we have historically been able to generate liquidity, we cannot predict, with certainty, the outcome of
our actions to generate liquidity as planned.
Contractual Obligations
The following table summarizes our contractual obligations as of December 29, 2019:
Payments Due by Fiscal Period
(In thousands) Total 2020 2021-2022 2023-2024Beyond
2024
Convertible debt, including interest1 . . . . . . . . . $ 881,958 $ 20,500 $435,750 $425,708 $ —
CEDA loan, including interest2 . . . . . . . . . . . . . 59,325 2,550 5,100 5,100 46,575
Other debt, including interest3 . . . . . . . . . . . . . . 209,283 114,437 89,153 2,048 3,645
Future financing commitments4 . . . . . . . . . . . . . 2,900 2,900 — — —
Operating lease commitments5 . . . . . . . . . . . . . 110,312 15,390 29,189 17,902 47,831
Finance lease commitments6 . . . . . . . . . . . . . . . 2,087 627 1,282 178 —
Non-cancellable purchase orders7 . . . . . . . . . . . 154,653 154,653 — — —
Purchase commitments under agreements8 . . . . 513,803 354,666 119,197 33,858 6,082
Deferred purchase consideration in connection
with acquisition9 . . . . . . . . . . . . . . . . . . . . . . . 30,000 30,000 — —
Total . . . . . . . . . . . . . . . . . . . . . . . . . . . . . . . . $1,964,321 $695,723 $679,671 $484,794 $104,133
1 Convertible debt, including interest, relates to the aggregate of $825.0 million in outstanding principal amount of our senior convertibledebentures on December 29, 2019. For the purpose of the table above, we assume that all holders of the outstanding debentures will holdthe debentures through the date of maturity, and upon conversion, the values of the senior convertible debentures will be equal to theaggregate principal amount with no premiums.
2 CEDA loan, including interest, relates to the proceeds of the $30.0 million aggregate principal amount of the Bonds. The Bonds mature onApril 1, 2031 and bear interest at a fixed rate of 8.50% through maturity.
84

3 Other debt, including interest, primarily relates to non-recourse finance projects and solar power systems and leases under our residential
lease program as described in ‘‘Item 1. Financial Statements—Note 9. Commitments and Contingencies’’ in the Notes to the Consolidated
Financial Statements in this Annual Report on Form 10-K.
4 In connection with purchase and joint venture agreements with non-public companies, we will be required to provide additional financing
to such parties of up to $2.9 million, subject to certain conditions.
5 Operating lease commitments primarily relate to certain solar power systems leased from unaffiliated third parties over minimum lease terms
of up to 20 years as of December 29, 2019, and various facility lease agreements including leases entered into that have not yet commenced.
6 Finance lease commitments primarily relate to certain buildings, manufacturing and equipment under capital leases in Europe for terms of
up to 6 years.
7 Non-cancellable purchase orders relate to purchases of raw materials for inventory and manufacturing equipment from a variety of vendors.
8 Purchase commitments under agreements primarily relate to arrangements entered into with several suppliers, including some of our
unconsolidated investees, for polysilicon, ingots, wafers, and module-level power electronics and alternating current cables, among others.
These agreements specify future quantities and pricing of products to be supplied by the vendors for periods up to 5 years and there are
certain consequences, such as forfeiture of advanced deposits and liquidated damages relating to previous purchases, in the event we
terminate these arrangements.
9 In connection with the acquisition of AUO SunPower Sdn. Bhd. in 2016, we are required to make noncancellable annual installment
payments during 2019 and 2020. The payment due in fiscal 2019 was made on the first day of the fourth quarter of fiscal 2019.
Liabilities Associated with Uncertain Tax Positions
Due to the complexity and uncertainty associated with our tax positions, we cannot make a reasonably reliable
estimate of the period in which cash settlement will be made for our liabilities associated with uncertain tax positions
in other long-term liabilities. Therefore, they have been excluded from the table above. As of December 29, 2019 and
December 30, 2018, total liabilities associated with uncertain tax positions were $20.1 million and $16.8 million,
respectively, and are included within ‘‘Other long-term liabilities’’ in our consolidated balance sheets as they are not
expected to be paid within the next twelve months.
Off-Balance Sheet Arrangements
As of December 29, 2019, we did not have any significant off-balance sheet arrangements, as defined in
Item 303(a)(4)(ii) of SEC Regulation S-K.
85

ITEM 7A: QUANTITATIVE AND QUALITATIVE DISCLOSURES ABOUT MARKET RISK
Foreign Currency Exchange Risk
Our exposure to movements in foreign currency exchange rates is primarily related to sales to Europeancustomers that are denominated in Euros. Revenue generated from European customers represented 10%, 7% and 5%of our total revenue in fiscal 2019, 2018 and 2017, respectively. A 10% change in the Euro exchange rate would haveimpacted our revenue by approximately $17.9 million, $11.5 million and $10.0 million in fiscal 2019, 2018 and 2017,respectively.
Since we operate in many countries, we could experience a volatility on our revenue, gross margin andprofitability as a result of foreign currency fluctuations, which could positively or negatively impact the operatingresults. When foreign currencies appreciate against the U.S. dollar, inventories and expenses denominated in foreigncurrencies become more expensive. An increase in the value of the U.S. dollar relative to foreign currencies couldmake our solar power products more expensive for international customers, thus potentially leading to a reductionin demand, our sales and profitability. Furthermore, many of our competitors are foreign companies that could benefitfrom such a currency fluctuation, making it more difficult for us to compete with those companies.
We currently conduct hedging activities which involve the use of option and/or forward currency contracts thatare designed to address our exposure to changes in the foreign exchange rate between the U.S. dollar and othercurrencies. As of December 29, 2019 and December 30, 2018, we had designated outstanding cash flow hedgeforward contracts with a notional value of $48.9 million and zero, respectively. As of December 29, 2019 andDecember 30, 2018, we also had designated outstanding cash flow hedge option contracts with a notional value of$142.9 million and zero, respectively. As of December 29, 2019 and December 30, 2018, we had non-designatedoutstanding forward currency contracts with aggregate notional values of $17.5 million and $11.4 million,respectively. Because we hedge some of our expected future foreign exchange exposure, if associated revenues donot materialize we could experience a reclassification of gains or losses into earnings. Such a reclassification couldadversely impact our revenue, margins and results of operations. We cannot predict the impact of future exchangerate fluctuations on our business and operating results.
Credit Risk
We have certain financial and derivative instruments that subject us to credit risk. These consist primarily of cashand cash equivalents, restricted cash and cash equivalents, investments, accounts receivable, advances to suppliers,foreign currency option contracts, foreign currency forward contracts, bond hedge and warrant transactions. We areexposed to credit losses in the event of nonperformance by the counterparties to our financial and derivativeinstruments. Our investment policy requires cash and cash equivalents, restricted cash and cash equivalents, andinvestments to be placed with high-quality financial institutions and limits the amount of credit risk from any oneissuer. We additionally perform ongoing credit evaluations of our customers’ financial condition whenever deemednecessary and generally do not require collateral.
We enter into agreements with vendors that specify future quantities and pricing of polysilicon to be suppliedfor periods up to 10 years. Under certain agreements, we are required to make prepayments to the vendors over theterms of the arrangements. As of December 29, 2019 and December 30, 2018, advances to suppliers totaled$121.4 million and $171.6 million, respectively. One supplier accounted for 100.0% and 99.6% of total advances tosuppliers as of December 29, 2019 and December 30, 2018, respectively.
We enter into foreign currency derivative contracts and convertible debenture hedge transactions withhigh-quality financial institutions and limit the amount of credit exposure to any single counterparty. The foreigncurrency derivative contracts are limited to a time period of a month or less. We regularly evaluate the credit standingof our counterparty financial institutions.
Interest Rate Risk
We are exposed to interest rate risk because many of our customers depend on debt financing to purchase oursolar power systems. An increase in interest rates could make it difficult for our customers to obtain the financingnecessary to purchase our solar power systems on favorable terms, or at all, and thus lower demand for our solarpower products, reduce revenue and adversely impact our operating results. An increase in interest rates could lowera customer’s return on investment in a system or make alternative investments more attractive relative to solar powersystems, which, in each case, could cause our customers to seek alternative investments that promise higher returnsor demand higher returns from our solar power systems, reduce gross margin and adversely impact our operatingresults. This risk is significant to our business because our sales model is highly sensitive to interest rate fluctuationsand the availability of credit, and would be adversely affected by increases in interest rates or liquidity constraints.
86

Our interest expense would increase to the extent interest rates rise in connection with our variable interest rate
borrowings. During the fourth quarter of fiscal 2018, we repaid all of our variable interest rate borrowings. We do
not believe that an immediate 10% increase in interest rates would have a material effect on our financial statements
under potential future borrowings. In addition, lower interest rates would have an adverse impact on our interest
income. Due to the relatively short-term nature of our investment portfolio, we do not believe that an immediate 10%
decrease in interest rates would have a material effect on the fair market value of our money market funds. Since we
believe we have the ability to liquidate substantially all of this portfolio, we do not expect our operating results or
cash flows to be materially affected to any significant degree by a sudden change in market interest rates on our
investment portfolio.
Equity Price Risk Involving Minority Investments in Joint Ventures and Other Public and Non-PublicCompanies
Our investments held in joint ventures and other non-public companies expose us to equity price risk. As of
December 29, 2019 and December 30, 2018, investments of $26.7 million and $34.8 million, respectively, are
accounted for using the equity method. As of December 29, 2019 and December 30, 2018, investments of
$8.5 million and $8.8 million, respectively, are accounted for using the measurement alternative method.
On August 9, 2018, we completed the sale of certain assets and intellectual property related to the production
of microinverters to Enphase in exchange for $25.0 million in cash and 7.5 million shares of Enphase common stock
(NASDAQ: ENPH). We received the common stock and a $15.0 million cash payment upon closing, and received
the final $10.0 million cash payment of the purchase price on December 10, 2018. The common stock was recorded
as an equity investment with readily determinable fair value (Level 1), with changes in fair value recognized in net
income. For fiscal 2019 and 2018, we recorded mark-to-market gains of $158.3 million and mark-to-market loss of
$6.4 million, respectively, within ‘‘other, net’’ in our consolidated statement of operations. During the year ended
December 29, 2019, we sold 1 million of shares of Enphase common stock for cash proceeds of $20.6 million.
These strategic equity investments in third parties are subject to risk of changes in market value could result in
realized impairment losses. We generally do not attempt to reduce or eliminate our market exposure in equity
investments. We monitor these investments for impairment and record reductions in the carrying values when
necessary. Circumstances that indicate an other-than-temporary decline include the valuation ascribed to the issuing
company in subsequent financing rounds, decreases in quoted market prices and declines in operations of the issuer.
There can be no assurance that our equity investments will not face risks of loss in the future.
Interest Rate Risk and Market Price Risk Involving Debt
As of December 29, 2019, we held outstanding convertible debentures with an aggregate face value of
$825.0 million, comprised of $400.0 million of 0.875% debentures due in 2021 and $425.0 million of 4.00%
debentures due in 2023. The aggregate estimated fair value of our outstanding convertible debentures was
$719.7 million and $648.9 million as of December 29, 2019 and December 30, 2018, respectively. Estimated fair
values are based on quoted market prices as reported by an independent pricing source. The fair market value of our
debentures is subject to interest rate risk, market price risk and other factors due to the convertible feature of the
debentures. The fair market value of the debentures will generally increase as interest rates fall, and decrease as
interest rates rise. When our common stock price is in-the-money relative to these fixed stock price conversion rates,
the fair market value of the debentures will generally increase as the market price of our common stock increases,
and decrease as our common stock’s market price falls, based on each debenture’s respective fixed conversion rate.
The interest and market value changes affect the fair market value of the debentures, but do not impact our financial
position, cash flows or results of operations due to the fixed nature of the debt obligations, except to the extent
increases in the value of our common stock may provide the holders the right to convert such debentures into stock,
or cash, in certain instances, but only applicable during periods when our common stock is in-the-money relative to
such conversion rights. As our common stock price is significantly below the conversion price for both debentures
and therefore unlikely to be exercised by the holders, a 10% increase or decrease in our common stock will not impact
our financial statements. Also refer to Note 18. Subsequent Event for early repayment of the convertible debentures.
We also have interest rate risk relating to our other outstanding debt, besides debentures, all of which bear fixed
rates of interest (Refer Note 11. Debt and Credit Sources). The interest and market value changes affect the fair
market value of these debts, but do not impact our financial position, cash flows or results of operations due to the
fixed nature of the debt obligations. A hypothetical 10 basis points increase or decrease on market interest rates
related to these debts would have an immaterial impact on the fair market value of these debts.
87

ITEM 8. FINANCIAL STATEMENTS AND SUPPLEMENTARY DATA
SUNPOWER CORPORATION
INDEX TO CONSOLIDATED FINANCIAL STATEMENTS
Page
REPORTS OF ERNST & YOUNG LLP, INDEPENDENT REGISTERED PUBLIC ACCOUNTING
FIRM. . . . . . . . . . . . . . . . . . . . . . . . . . . . . . . . . . . . . . . . . . . . . . . . . . . . . . . . . . . . . . . . . . . . . . . . . . . . . . . . 89
FINANCIAL STATEMENTS
CONSOLIDATED BALANCE SHEETS . . . . . . . . . . . . . . . . . . . . . . . . . . . . . . . . . . . . . . . . . . . . . . . . . . . 91
CONSOLIDATED STATEMENTS OF OPERATIONS . . . . . . . . . . . . . . . . . . . . . . . . . . . . . . . . . . . . . . . . 92
CONSOLIDATED STATEMENTS OF COMPREHENSIVE INCOME (LOSS) . . . . . . . . . . . . . . . . . . . . 93
CONSOLIDATED STATEMENTS OF EQUITY (DEFICIT) . . . . . . . . . . . . . . . . . . . . . . . . . . . . . . . . . . . 94
CONSOLIDATED STATEMENTS OF CASH FLOWS . . . . . . . . . . . . . . . . . . . . . . . . . . . . . . . . . . . . . . . 95
NOTES TO CONSOLIDATED FINANCIAL STATEMENTS . . . . . . . . . . . . . . . . . . . . . . . . . . . . . . . . . . 98
88

Report of Independent Registered Public Accounting Firm
To the Stockholders and the Board of Directors of SunPower Corporation
Opinion on the Financial Statements
We have audited the accompanying consolidated balance sheets of SunPower Corporation (the Company) as of
December 29, 2019 and December 30, 2018, the related consolidated statements of operations, comprehensive
income (loss), equity (deficit), and cash flows for each of the three years in the period ended December 29, 2019,
and the related notes (collectively referred to as the ‘‘consolidated financial statements’’). In our opinion, the
consolidated financial statements present fairly, in all material respects, the financial position of the Company at
December 29, 2019 and December 30, 2018, and the results of its operations and its cash flows for each of the three
years in the period ended December 29, 2019, in conformity with U.S. generally accepted accounting principles.
We also have audited, in accordance with the standards of the Public Company Accounting Oversight Board (United
States) (PCAOB), the Company’s internal control over financial reporting as of December 29, 2019, based on criteria
established in Internal Control-Integrated Framework issued by the Committee of Sponsoring Organizations of the
Treadway Commission (2013 framework) and our report dated February 14, 2020 expressed an unqualified opinion
thereon.
Adoption of ASU No. 2016-02
As discussed in Note 1 to the consolidated financial statements, the Company changed its method of accounting for
leases in 2019 due to the adoption of Accounting Standards Update (ASU) No. 2016-02, Leases (Topic 842), and the
related amendments.
Basis for Opinion
These financial statements are the responsibility of the Company’s management. Our responsibility is to express an
opinion on the Company’s financial statements based on our audits. We are a public accounting firm registered with
the PCAOB and are required to be independent with respect to the Company in accordance with the U.S. federal
securities laws and the applicable rules and regulations of the Securities and Exchange Commission and the PCAOB.
We conducted our audits in accordance with the standards of the PCAOB. Those standards require that we plan and
perform the audit to obtain reasonable assurance about whether the financial statements are free of material
misstatement, whether due to error or fraud. Our audits included performing procedures to assess the risks of material
misstatement of the financial statements, whether due to error or fraud, and performing procedures that respond to
those risks. Such procedures included examining, on a test basis, evidence regarding the amounts and disclosures in
the financial statements. Our audits also included evaluating the accounting principles used and significant estimates
made by management, as well as evaluating the overall presentation of the financial statements. We believe that our
audits provide a reasonable basis for our opinion.
/s/ Ernst & Young LLP
We have served as the Company’s auditor since 2012.
San Jose, California
February 14, 2020
89

Report of Independent Registered Public Accounting Firm
To the Stockholders and the Board of Directors of SunPower Corporation
Opinion on Internal Control over Financial Reporting
We have audited SunPower Corporation’s internal control over financial reporting as of December 29, 2019, based
on criteria established in Internal Control - Integrated Framework issued by the Committee of Sponsoring
Organizations of the Treadway Commission (2013 framework) (the COSO criteria). In our opinion, SunPower
Corporation (the Company) maintained, in all material respects, effective internal control over financial reporting as
of December 29, 2019, based on the COSO criteria.
We also have audited, in accordance with the standards of the Public Company Accounting Oversight Board (United
States) (PCAOB), the consolidated balance sheets of the Company as of December 29, 2019 and December 30, 2018,
the related consolidated statements of operations, comprehensive income (loss), equity (deficit), and cash flows for
each of the three years in the period ended December 29, 2019, and the related notes and our report dated
February 14, 2020 expressed an unqualified opinion thereon.
Basis for Opinion
The Company’s management is responsible for maintaining effective internal control over financial reporting and for
its assessment of the effectiveness of internal control over financial reporting included in the accompanying
Management’s Report on Internal Control over Financial Reporting. Our responsibility is to express an opinion on
the Company’s internal control over financial reporting based on our audit. We are a public accounting firm registered
with the PCAOB and are required to be independent with respect to the Company in accordance with the U.S. federal
securities laws and the applicable rules and regulations of the Securities and Exchange Commission and the PCAOB.
We conducted our audit in accordance with the standards of the PCAOB. Those standards require that we plan and
perform the audit to obtain reasonable assurance about whether effective internal control over financial reporting was
maintained in all material respects.
Our audit included obtaining an understanding of internal control over financial reporting, assessing the risk that a
material weakness exists, testing and evaluating the design and operating effectiveness of internal control based on
the assessed risk, and performing such other procedures as we considered necessary in the circumstances. We believe
that our audit provides a reasonable basis for our opinion.
Definition and Limitations of Internal Control Over Financial Reporting
A company’s internal control over financial reporting is a process designed to provide reasonable assurance regarding
the reliability of financial reporting and the preparation of financial statements for external purposes in accordance
with generally accepted accounting principles. A company’s internal control over financial reporting includes those
policies and procedures that (1) pertain to the maintenance of records that, in reasonable detail, accurately and fairly
reflect the transactions and dispositions of the assets of the company; (2) provide reasonable assurance that
transactions are recorded as necessary to permit preparation of financial statements in accordance with generally
accepted accounting principles, and that receipts and expenditures of the company are being made only in accordance
with authorizations of management and directors of the company; and (3) provide reasonable assurance regarding
prevention or timely detection of unauthorized acquisition, use, or disposition of the company’s assets that could have
a material effect on the financial statements.
Because of its inherent limitations, internal control over financial reporting may not prevent or detect misstatements.
Also, projections of any evaluation of effectiveness to future periods are subject to the risk that controls may become
inadequate because of changes in conditions, or that the degree of compliance with the policies or procedures may
deteriorate.
/s/ Ernst & Young LLP
San Jose, California
February 14, 2020
90

SunPower CorporationConsolidated Balance Sheets
(In thousands, except share par values)
December 29,2019
December 30,2018
AssetsCurrent assets:
Cash and cash equivalents . . . . . . . . . . . . . . . . . . . . . . . . . . . . . . . . . . . . . . . . . . . . . . . . . $ 422,955 $ 309,407
Restricted cash and cash equivalents, current portion . . . . . . . . . . . . . . . . . . . . . . . . . . . . . . . . 26,348 41,762
Restricted short-term marketable securities . . . . . . . . . . . . . . . . . . . . . . . . . . . . . . . . . . . . . . 6,187 —
Accounts receivable, net1 . . . . . . . . . . . . . . . . . . . . . . . . . . . . . . . . . . . . . . . . . . . . . . . . . . 226,476 175,605
Contract assets1 . . . . . . . . . . . . . . . . . . . . . . . . . . . . . . . . . . . . . . . . . . . . . . . . . . . . . . . . 99,426 58,994
Inventories . . . . . . . . . . . . . . . . . . . . . . . . . . . . . . . . . . . . . . . . . . . . . . . . . . . . . . . . . . . 358,257 308,146
Advances to suppliers, current portion . . . . . . . . . . . . . . . . . . . . . . . . . . . . . . . . . . . . . . . . . 107,388 37,878
Project assets - plants and land, current portion . . . . . . . . . . . . . . . . . . . . . . . . . . . . . . . . . . . 12,650 10,796
Prepaid expenses and other current assets . . . . . . . . . . . . . . . . . . . . . . . . . . . . . . . . . . . . . . . 121,244 131,183
Total current assets . . . . . . . . . . . . . . . . . . . . . . . . . . . . . . . . . . . . . . . . . . . . . . . . . . . . . . . . 1,380,931 1,073,771
Restricted cash and cash equivalents, net of current portion . . . . . . . . . . . . . . . . . . . . . . . . . . . . . 9,354 12,594
Restricted long-term marketable securities . . . . . . . . . . . . . . . . . . . . . . . . . . . . . . . . . . . . . . . . . — 5,955
Property, plant and equipment, net . . . . . . . . . . . . . . . . . . . . . . . . . . . . . . . . . . . . . . . . . . . . . . 323,726 839,871
Operating lease right-of-use assets . . . . . . . . . . . . . . . . . . . . . . . . . . . . . . . . . . . . . . . . . . . . . . 51,258 —
Solar power systems leased and to be leased, net . . . . . . . . . . . . . . . . . . . . . . . . . . . . . . . . . . . . 54,338 92,557
Advances to suppliers, net of current portion . . . . . . . . . . . . . . . . . . . . . . . . . . . . . . . . . . . . . . . 13,993 133,694
Long-term financing receivables, net - held for sale . . . . . . . . . . . . . . . . . . . . . . . . . . . . . . . . . . — 19,592
Other intangible assets, net. . . . . . . . . . . . . . . . . . . . . . . . . . . . . . . . . . . . . . . . . . . . . . . . . . . 7,466 12,582
Other long-term assets. . . . . . . . . . . . . . . . . . . . . . . . . . . . . . . . . . . . . . . . . . . . . . . . . . . . . . 330,855 162,033
Total assets . . . . . . . . . . . . . . . . . . . . . . . . . . . . . . . . . . . . . . . . . . . . . . . . . . . . . . . . . . . . . $ 2,171,921 $ 2,352,649
Liabilities and EquityCurrent liabilities:
Accounts payable1 . . . . . . . . . . . . . . . . . . . . . . . . . . . . . . . . . . . . . . . . . . . . . . . . . . . . . . $ 441,759 $ 325,550
Accrued liabilities1 . . . . . . . . . . . . . . . . . . . . . . . . . . . . . . . . . . . . . . . . . . . . . . . . . . . . . . 203,890 235,252
Operating lease liabilities, current portion . . . . . . . . . . . . . . . . . . . . . . . . . . . . . . . . . . . . . . . 9,463 —
Contract liabilities, current portion1 . . . . . . . . . . . . . . . . . . . . . . . . . . . . . . . . . . . . . . . . . . . 138,441 104,130
Short-term debt . . . . . . . . . . . . . . . . . . . . . . . . . . . . . . . . . . . . . . . . . . . . . . . . . . . . . . . . 104,856 40,074
Total current liabilities . . . . . . . . . . . . . . . . . . . . . . . . . . . . . . . . . . . . . . . . . . . . . . . . . . . . . 898,409 705,006
Long-term debt . . . . . . . . . . . . . . . . . . . . . . . . . . . . . . . . . . . . . . . . . . . . . . . . . . . . . . . . . . 113,827 40,528
Convertible debt1 . . . . . . . . . . . . . . . . . . . . . . . . . . . . . . . . . . . . . . . . . . . . . . . . . . . . . . . . . 820,259 818,356
Operating lease liabilities, net of current portion . . . . . . . . . . . . . . . . . . . . . . . . . . . . . . . . . . . . . 46,089 —
Contract liabilities, net of current portion1 . . . . . . . . . . . . . . . . . . . . . . . . . . . . . . . . . . . . . . . . . 67,538 99,509
Other long-term liabilities . . . . . . . . . . . . . . . . . . . . . . . . . . . . . . . . . . . . . . . . . . . . . . . . . . . 204,300 839,136
Total liabilities. . . . . . . . . . . . . . . . . . . . . . . . . . . . . . . . . . . . . . . . . . . . . . . . . . . . . . . . . . . 2,150,422 2,502,535
Commitments and contingencies (Note 9)
Equity:
Preferred stock, $0.001 par value; 10,000 shares authorized; none issued and outstanding as ofDecember 29, 2019 and December 30, 2018 . . . . . . . . . . . . . . . . . . . . . . . . . . . . . . . . . . . — —
Common stock, $0.001 par value, 367,500 shares authorized; 179,845 shares issued, and 168,121shares outstanding as of December 29, 2019; 152,085 shares issued, and 141,180 sharesoutstanding as of December 30, 2018 . . . . . . . . . . . . . . . . . . . . . . . . . . . . . . . . . . . . . . . . 168 141
Additional paid-in capital. . . . . . . . . . . . . . . . . . . . . . . . . . . . . . . . . . . . . . . . . . . . . . . . . . 2,661,819 2,463,370
Accumulated deficit . . . . . . . . . . . . . . . . . . . . . . . . . . . . . . . . . . . . . . . . . . . . . . . . . . . . . (2,449,679) (2,480,988)
Accumulated other comprehensive loss . . . . . . . . . . . . . . . . . . . . . . . . . . . . . . . . . . . . . . . . . (9,512) (4,150)
Treasury stock, at cost: 11,724 shares of common stock as of December 29, 2019; 10,905 shares ofcommon stock as of December 30, 2018 . . . . . . . . . . . . . . . . . . . . . . . . . . . . . . . . . . . . . . (192,633) (187,069)
Total stockholders’ equity (deficit) . . . . . . . . . . . . . . . . . . . . . . . . . . . . . . . . . . . . . . . . . . 10,163 (208,696)
Noncontrolling interests in subsidiaries . . . . . . . . . . . . . . . . . . . . . . . . . . . . . . . . . . . . . . . . . 11,336 58,810
Total equity (deficit) . . . . . . . . . . . . . . . . . . . . . . . . . . . . . . . . . . . . . . . . . . . . . . . . . . . 21,499 (149,886)
Total liabilities and equity . . . . . . . . . . . . . . . . . . . . . . . . . . . . . . . . . . . . . . . . . . . . . . . . . . . $ 2,171,921 $ 2,352,649
1 We have related-party balances for transactions made with Total S.A. and its affiliates as well as unconsolidated entities in which we havea direct equity investment. These related-party balances are recorded within the ‘‘accounts receivable, net,’’ ‘‘contract assets,’’ ‘‘prepaidexpenses and other current assets,’’ ‘‘accounts payable,’’ ‘‘accrued liabilities,’’ ‘‘contract liabilities, current portion,’’ ‘‘convertible debt,’’ and‘‘contract liabilities, net of current portion,’’ financial statement line items on our consolidated balance sheets (see Note 2, Note 9, Note 10,and Note 11).
91
The accompanying notes are an integral part of these consolidated financial statements.

SunPower CorporationConsolidated Statements of Operations(In thousands, except per share data)
Fiscal Year Ended
December 29,2019
December 30,2018
December 31,2017
Revenue:Solar power systems, components, and other1 . . . . . . . . . . . . . . . . . . . . . $1,835,149 $1,453,876 $ 1,594,941Residential leasing. . . . . . . . . . . . . . . . . . . . . . . . . . . . . . . . . . . . . . . . . . . 10,405 272,209 199,106Solar services. . . . . . . . . . . . . . . . . . . . . . . . . . . . . . . . . . . . . . . . . . . . . . . 18,671 — —
1,864,225 1,726,085 1,794,047Cost of revenue:
Solar power systems, components, and other1 . . . . . . . . . . . . . . . . . . . . . 1,722,871 1,843,150 1,678,400Residential leasing. . . . . . . . . . . . . . . . . . . . . . . . . . . . . . . . . . . . . . . . . . . 7,345 180,016 134,292Solar services. . . . . . . . . . . . . . . . . . . . . . . . . . . . . . . . . . . . . . . . . . . . . . . 8,104 — —
1,738,320 2,023,166 1,812,692
Gross profit (loss) . . . . . . . . . . . . . . . . . . . . . . . . . . . . . . . . . . . . . . . . . . . . . 125,905 (297,081) (18,645)Operating expenses:
Research and development1 . . . . . . . . . . . . . . . . . . . . . . . . . . . . . . . . . . . 67,515 81,705 82,247Sales, general and administrative . . . . . . . . . . . . . . . . . . . . . . . . . . . . . . . 260,443 260,111 278,645Restructuring charges . . . . . . . . . . . . . . . . . . . . . . . . . . . . . . . . . . . . . . . . 14,110 17,497 21,045Loss on sale and impairment of residential lease assets . . . . . . . . . . . . . 25,352 251,984 624,335Gain on business divestitures . . . . . . . . . . . . . . . . . . . . . . . . . . . . . . . . . . (143,400) (59,347) —
Total operating expenses . . . . . . . . . . . . . . . . . . . . . . . . . . . . . . . . . . . . 224,020 551,950 1,006,272
Operating loss . . . . . . . . . . . . . . . . . . . . . . . . . . . . . . . . . . . . . . . . . . . . . . . . (98,115) (849,031) (1,024,917)Other income (expense), net:
Interest income . . . . . . . . . . . . . . . . . . . . . . . . . . . . . . . . . . . . . . . . . . . . . 2,702 3,057 2,100Interest expense1 . . . . . . . . . . . . . . . . . . . . . . . . . . . . . . . . . . . . . . . . . . . . (53,353) (108,011) (90,288)Other, net . . . . . . . . . . . . . . . . . . . . . . . . . . . . . . . . . . . . . . . . . . . . . . . . . . 174,734 55,314 (87,645)
Other income (expense), net . . . . . . . . . . . . . . . . . . . . . . . . . . . . . . . . . 124,083 (49,640) (175,833)
Income (loss) before income taxes and equity in losses of
unconsolidated investees . . . . . . . . . . . . . . . . . . . . . . . . . . . . . . . . . . . . . . 25,968 (898,671) (1,200,750)(Provision) benefit for income taxes . . . . . . . . . . . . . . . . . . . . . . . . . . . . (26,631) (1,010) 3,944Equity in earnings (losses) of unconsolidated investees . . . . . . . . . . . . . (7,058) (17,815) 25,938
Net loss . . . . . . . . . . . . . . . . . . . . . . . . . . . . . . . . . . . . . . . . . . . . . . . . . . . . . (7,721) (917,496) (1,170,868)Net loss attributable to noncontrolling interests and redeemable
noncontrolling interests . . . . . . . . . . . . . . . . . . . . . . . . . . . . . . . . . . . . . 29,880 106,405 241,747
Net income (loss) attributable to stockholders. . . . . . . . . . . . . . . . . . . . . . . $ 22,159 $ (811,091) $ (929,121)
Net income (loss) per share attributable to stockholders:Basic. . . . . . . . . . . . . . . . . . . . . . . . . . . . . . . . . . . . . . . . . . . . . . . . . . . . . . . . $ 0.15 $ (5.76) $ (6.67)Diluted . . . . . . . . . . . . . . . . . . . . . . . . . . . . . . . . . . . . . . . . . . . . . . . . . . . . . . $ 0.15 $ (5.76) $ (6.67)Weighted-average shares:Basic. . . . . . . . . . . . . . . . . . . . . . . . . . . . . . . . . . . . . . . . . . . . . . . . . . . . . . . . 144,796 140,825 139,370Diluted . . . . . . . . . . . . . . . . . . . . . . . . . . . . . . . . . . . . . . . . . . . . . . . . . . . . . . 147,525 140,825 139,370
1 We have related-party transactions with Total S.A. and its affiliates as well as unconsolidated entities in which we have a direct equity
investment. These related-party transactions are recorded within the ‘‘revenue: solar power systems, components, and other,’’ ‘‘cost of
revenue: solar power systems, components, and other,’’ ‘‘operating expenses: research and development,’’ and ‘‘other income (expense), net:
interest expense’’ financial statement line items in our consolidated statements of operations (see Note 2 and Note 10).
92
The accompanying notes are an integral part of these consolidated financial statements.

SunPower CorporationConsolidated Statements of Comprehensive Income (Loss)
(In thousands)
Fiscal Year Ended
December 29,2019
December 30,2018
December 31,2017
Net loss . . . . . . . . . . . . . . . . . . . . . . . . . . . . . . . . . . . . . . . . . . . . . . . . . . . . . $ (7,721) $(917,496) $(1,170,868)
Components of other comprehensive income (loss):
Translation adjustment. . . . . . . . . . . . . . . . . . . . . . . . . . . . . . . . . . . . . . . . (1,128) (4,490) 5,638
Net change in derivatives (Note 12). . . . . . . . . . . . . . . . . . . . . . . . . . . . . (1,094) 397 (1,764)
Net income (loss) on long-term pension liability adjustment . . . . . . . . . (3,090) 2,901 (64)
Unrealized gain on investments . . . . . . . . . . . . . . . . . . . . . . . . . . . . . . . . — — (145)
Income taxes . . . . . . . . . . . . . . . . . . . . . . . . . . . . . . . . . . . . . . . . . . . . . . . (50) 50 565
Total other comprehensive income (loss) . . . . . . . . . . . . . . . . . . . . . . . (5,362) (1,142) 4,230
Total comprehensive loss . . . . . . . . . . . . . . . . . . . . . . . . . . . . . . . . . . . . . . . (13,083) (918,638) (1,166,638)
Comprehensive loss attributable to noncontrolling interests and
redeemable noncontrolling interests . . . . . . . . . . . . . . . . . . . . . . . . . . . 29,880 106,405 241,747
Comprehensive income (loss) attributable to stockholders . . . . . . . . . . . . . $ 16,797 $(812,233) $ (924,891)
93
The accompanying notes are an integral part of these consolidated financial statements.

SunPower CorporationConsolidated Statements of Equity (Deficit)
(In thousands)
Common Stock
RedeemableNoncontrolling
Interests Shares Value
AdditionalPaid-inCapital
TreasuryStock
AccumulatedOther
ComprehensiveLoss
AccumulatedDeficit
TotalStockholders’
Equity (Deficit)Noncontrolling
Interests
TotalEquity
(Deficit)
Balances at January 1, 2017 $ 103,621 138,508 $139 $2,410,395 $(176,783) $(7,238) $ (695,432) $1,531,081 $ 79,488 $ 1,610,569
Net loss . . . . . . . . . . . . . . . . . . . . (152,926) — — — — — (929,121) (929,121) (88,821) (1,017,942)
Cumulative-effect upon adoption ofASU 2016-09 and ASU 2016-16 . . . — — — — — — (45,344) (45,344) — (45,344)
Other comprehensive loss . . . . . . . . . — — — — — 4,230 — 4,230 — 4,230
Issuance of restricted stock toemployees, net of cancellations . . . . — 1,739 2 — — — — 2 — 2
Stock-based compensation expense . . . — — — 32,118 — — — 32,118 — 32,118
Contributions from noncontrollinginterests . . . . . . . . . . . . . . . . . . 71,928 — — — — — — — 125,500 125,500
Distributions to noncontrollinginterests . . . . . . . . . . . . . . . . . . (7,387) — — — — — — — (11,988) (11,988)
Purchases of treasury stock . . . . . . . . — (589) (1) — (4,756) — — (4,757) — (4,757)
Balances at December 31, 2017 $ 15,236 139,658 $140 $2,442,513 $(181,539) $(3,008) $(1,669,897) $ 588,209 $104,179 $ 692,388
Net loss . . . . . . . . . . . . . . . . . . . . (29,171) — — — — — (811,091) (811,091) (77,235) (888,326)
Other comprehensive loss . . . . . . . . . — — — — — (1,142) — (1,142) — (1,142)
Issuance of restricted stock toemployees, net of cancellations . . . . — 2,267 2 — — — — 2 — 2
Stock-based compensation expense . . . — — — 25,790 — — — 25,790 — 25,790
Contributions from noncontrollinginterests . . . . . . . . . . . . . . . . . . 36,734 — — — — — — — 114,470 114,470
Distributions to noncontrollinginterests . . . . . . . . . . . . . . . . . . (7,425) — — — — — — — (13,438) (13,438)
Purchases of treasury stock . . . . . . . . — (747) (1) — (5,530) — — (5,531) — (5,531)
Reduction of non-controlling interestdue to sale of interest in residentiallease portfolio1 . . . . . . . . . . . . . . (15,374) — — — — — — — (61,766) (61,766)
Noncontrolling interest buyout . . . . . . — — — (4,933) — — — (4,933) (7,400) (12,333)
Balances at December 30, 2018 $ — 141,178 $141 $2,463,370 $(187,069) $(4,150) $(2,480,988) $ (208,696) $ 58,810 $ (149,886)
Net loss . . . . . . . . . . . . . . . . . . . . — — — — — 22,159 22,159 (29,880) (7,721)
Cumulative-effect upon adoption ofASC 842. . . . . . . . . . . . . . . . . . — — — — — 9,150 9,150 — 9,150
Other comprehensive income . . . . . . . — — — — (5,362) — (5,362) — (5,362)
Issuance of restricted stock toemployees, net of cancellations . . . . 2,461 3 — — — 3 — 3
Stock-based compensation expense . . . — — 27,788 — — — 27,788 — 27,788
Contributions from noncontrollinginterests . . . . . . . . . . . . . . . . . . — — — — — — — 35,791 35,791
Distributions to noncontrollinginterests . . . . . . . . . . . . . . . . . . — — — — — — — (1,552) (1,552)
Purchases of treasury stock . . . . . . . . (818) (1) — (5,564) — — (5,565) — (5,565)
Reduction of non-controlling interests,due to sale of interest in residentiallease portfolio1 . . . . . . . . . . . . . . — — — — — — — (51,833) (51,833)
Issuance of common stock inconnection with equity offering, netof underwriter fees and discounts . . . 25,300 25 171,809 — — — 171,834 — 171,834
Common stock offering fees . . . . . . . (1,148) (1,148) (1,148)
Balances at December 29, 2019 168,121 $168 $2,661,819 $(192,633) $(9,512) $(2,449,679) $ 10,163 $ 11,336 $ 21,499
1 See Note 4 ‘‘Business Divestiture and Sale of Assets’’.
94
The accompanying notes are an integral part of these consolidated financial statements.

SunPower CorporationConsolidated Statements of Cash Flows
(In thousands)
Fiscal Year Ended
December 29,2019
December 30,2018
December 31,2017
Cash flows from operating activities:
Net loss . . . . . . . . . . . . . . . . . . . . . . . . . . . . . . . . . . . . . . . . . . . . . . . . . . . . . $ (7,721) $(917,496) $(1,170,868)
Adjustments to reconcile net loss to net cash used in operating activities:
Depreciation and amortization . . . . . . . . . . . . . . . . . . . . . . . . . . . . . . . . . 80,081 127,204 185,283
Non-cash restructuring charges . . . . . . . . . . . . . . . . . . . . . . . . . . . . . . . . . 5,874 — —
Stock-based compensation . . . . . . . . . . . . . . . . . . . . . . . . . . . . . . . . . . . . 26,935 26,353 34,674
Non-cash interest expense. . . . . . . . . . . . . . . . . . . . . . . . . . . . . . . . . . . . . 9,472 15,346 18,390
Dividend from equity method investee . . . . . . . . . . . . . . . . . . . . . . . . . . — 3,947 30,091
Equity in losses (earnings) of unconsolidated investees . . . . . . . . . . . . . 7,058 17,815 (25,938)
Mark-to-market (gain) loss on equity investment with readily
determinable fair value . . . . . . . . . . . . . . . . . . . . . . . . . . . . . . . . . . . . . (158,288) 6,375 —
Gain on sale of assets . . . . . . . . . . . . . . . . . . . . . . . . . . . . . . . . . . . . . . . . (25,212) — —
Gain on business divestiture . . . . . . . . . . . . . . . . . . . . . . . . . . . . . . . . . . . (143,400) (59,347) —
Gain on sale of investments without readily determinable fair value. . . (17,275) (54,196) (5,346)
Deferred income taxes. . . . . . . . . . . . . . . . . . . . . . . . . . . . . . . . . . . . . . . . 5,067 (6,862) (6,966)
Impairment of equity method investment. . . . . . . . . . . . . . . . . . . . . . . . . — — 89,564
Impairment of property, plant and equipment . . . . . . . . . . . . . . . . . . . . . 777 369,168 —
Loss on sale and impairment of residential lease assets . . . . . . . . . . . . . 33,778 251,984 624,335
Other, net . . . . . . . . . . . . . . . . . . . . . . . . . . . . . . . . . . . . . . . . . . . . . . . . . . — (6,796) 1,298
Changes in operating assets and liabilities:
Accounts receivable. . . . . . . . . . . . . . . . . . . . . . . . . . . . . . . . . . . . . . . . (66,194) (175) (1,191)
Contract assets . . . . . . . . . . . . . . . . . . . . . . . . . . . . . . . . . . . . . . . . . . . . (38,246) (43,509) 10,660
Inventories . . . . . . . . . . . . . . . . . . . . . . . . . . . . . . . . . . . . . . . . . . . . . . . (128,404) (39,174) (38,236)
Project assets . . . . . . . . . . . . . . . . . . . . . . . . . . . . . . . . . . . . . . . . . . . . . (2,188) 39,512 2,393
Prepaid expenses and other assets . . . . . . . . . . . . . . . . . . . . . . . . . . . . (8,746) 22,763 110,530
Operating lease right-of-use assets . . . . . . . . . . . . . . . . . . . . . . . . . . . . 8,530 — —
Long-term financing receivables, net - held for sale . . . . . . . . . . . . . . (473) (182,937) (123,674)
Advances to suppliers . . . . . . . . . . . . . . . . . . . . . . . . . . . . . . . . . . . . . . 50,191 44,417 68,767
Accounts payable and other accrued liabilities . . . . . . . . . . . . . . . . . . 79,394 (127,286) (216,349)
Contract liabilities . . . . . . . . . . . . . . . . . . . . . . . . . . . . . . . . . . . . . . . . . 27,531 (30,495) 145,171
Operating lease liabilities . . . . . . . . . . . . . . . . . . . . . . . . . . . . . . . . . . . (8,954) — —
Net cash used in operating activities . . . . . . . . . . . . . . . . . . . . . . . . (270,413) (543,389) (267,412)
Cash flows from investing activities:
Purchases of property, plant and equipment. . . . . . . . . . . . . . . . . . . . . . . (47,395) (44,906) (69,791)
Cash paid for solar power systems, leased, net . . . . . . . . . . . . . . . . . . . . — (68,612) (86,539)
Cash paid for solar power systems. . . . . . . . . . . . . . . . . . . . . . . . . . . . . . (53,284) (41,808) (126,548)
Purchases of marketable securities . . . . . . . . . . . . . . . . . . . . . . . . . . . . . . — — (1,306)
Proceeds from business divestiture, net of cash sold. . . . . . . . . . . . . . . . 40,491 23,257 —
Cash paid for acquisitions, net of cash acquired . . . . . . . . . . . . . . . . . . . — (17,000) —
Dividend from equity method investee . . . . . . . . . . . . . . . . . . . . . . . . . . — 12,952 3,773
Proceeds from sale of assets . . . . . . . . . . . . . . . . . . . . . . . . . . . . . . . . . . . 59,970 — —
Proceeds from sale of distribution rights of debt refinancing . . . . . . . . . 1,950 — —
Cash outflow from sale of residential lease portfolio, net of cash
received . . . . . . . . . . . . . . . . . . . . . . . . . . . . . . . . . . . . . . . . . . . . . . . . . (10,923) (28,004) —
Proceeds from sale of investments . . . . . . . . . . . . . . . . . . . . . . . . . . . . . . 42,957 453,708 5,954
Cash paid for investments in unconsolidated investees. . . . . . . . . . . . . . (12,400) (14,687) (18,627)
Net cash provided by (used in) investing activities. . . . . . . . . . . . . 21,366 274,900 (293,084)
95
The accompanying notes are an integral part of these consolidated financial statements.

Fiscal Year Ended
December 29,2019
December 30,2018
December 31,2017
Cash flows from financing activities:
Proceeds from bank loans and other debt . . . . . . . . . . . . . . . . . . . . . . . . 381,928 227,676 339,253
Repayment of 0.75% debentures due 2018, bank loans and other debt . (271,015) (535,252) (358,317)
Proceeds from issuance of non-recourse residential financing, net of
issuance costs. . . . . . . . . . . . . . . . . . . . . . . . . . . . . . . . . . . . . . . . . . . . . 72,259 192,287 89,612
Repayment of non-recourse residential financing . . . . . . . . . . . . . . . . . . (2,959) (17,358) (6,888)
Contributions from noncontrolling interests and redeemable
noncontrolling interests attributable to residential projects . . . . . . . . . 35,790 151,204 196,628
Distributions to noncontrolling interests and redeemable
noncontrolling interests attributable to residential projects . . . . . . . . . (316) (21,918) (18,228)
Proceeds from issuance of non-recourse power plant and commercial
financing, net of issuance costs . . . . . . . . . . . . . . . . . . . . . . . . . . . . . . 3,004 126,020 527,897
Repayment of non-recourse power plant and commercial financing . . . — (31,282) (176,069)
Proceeds of common stock equity offering, net of offering costs . . . . . 171,834 — —
Contributions from noncontrolling interests attributable to power plant
and commercial projects . . . . . . . . . . . . . . . . . . . . . . . . . . . . . . . . . . . . — — 800
Payment for prior business combination . . . . . . . . . . . . . . . . . . . . . . . . . (39,000) — —
Settlement of contingent consideration arrangement, net of cash
received . . . . . . . . . . . . . . . . . . . . . . . . . . . . . . . . . . . . . . . . . . . . . . . . . (1,646) — —
Purchases of stock for tax withholding obligations on vested restricted
stock . . . . . . . . . . . . . . . . . . . . . . . . . . . . . . . . . . . . . . . . . . . . . . . . . . . . (5,565) (5,530) (4,756)
Net cash provided by financing activities . . . . . . . . . . . . . . . . . . . . 344,314 85,847 589,932
Effect of exchange rate changes on cash, cash equivalents, restricted
cash and restricted cash equivalents . . . . . . . . . . . . . . . . . . . . . . . . . . . . . (373) 2,068 689
Net decrease in cash, cash equivalents, restricted cash and restricted
cash equivalents. . . . . . . . . . . . . . . . . . . . . . . . . . . . . . . . . . . . . . . . . . . . . 94,894 (180,574) 30,125
Cash, cash equivalents, restricted cash and restricted cash equivalents,
beginning of period1 . . . . . . . . . . . . . . . . . . . . . . . . . . . . . . . . . . . . . . . . . 363,763 544,337 514,212
Cash, cash equivalents, restricted cash and restricted cash equivalents,
end of period1 . . . . . . . . . . . . . . . . . . . . . . . . . . . . . . . . . . . . . . . . . . . . . . $ 458,657 $ 363,763 $ 544,337
Non-cash transactions:
Assignment of residential lease receivables to third parties . . . . . . . . . . $ — $ — $ 129
Stock consideration received from a business divestiture . . . . . . . . . . . . $ — $ 42,600 $ —
Acquisition of noncontrolling interests funded by Mezzanine Loan
proceeds . . . . . . . . . . . . . . . . . . . . . . . . . . . . . . . . . . . . . . . . . . . . . . . . . $ — $ 12,400 $ —
Costs of solar power systems, leased, sourced from existing inventory. $ — $ 36,384 $ 57,688
Costs of solar power systems, leased, funded by liabilities . . . . . . . . . . $ — $ 3,631 $ 5,527
Costs of solar power systems sourced from existing inventory . . . . . . . $ 29,206 $ — $ —
Costs of solar power systems funded by liabilities . . . . . . . . . . . . . . . . . $ 2,671 $ — $ —
Costs of solar power systems under sale-leaseback financing
arrangements, sourced from project assets . . . . . . . . . . . . . . . . . . . . . . $ — $ 86,540 $ 110,375
Property, plant and equipment acquisitions funded by liabilities . . . . . . $ 13,745 $ 8,214 $ 15,706
Acquisition funded by liabilities. . . . . . . . . . . . . . . . . . . . . . . . . . . . . . . . $ — $ 9,000 $ —
Contractual obligations satisfied with inventory . . . . . . . . . . . . . . . . . . . $ 1,701 $ 56,840 $ 34,675
Assumption of debt by buyer upon sale of equity interest . . . . . . . . . . . $ — $ 27,321 $ 196,104
Right-of-use assets obtained in exchange of lease obligations2 . . . . . . . $ 111,142 $ — $ —
Retained interest in SunStrong lease portfolio. . . . . . . . . . . . . . . . . . . . . $ — $ 9,750 $ —
Derecognition of financing obligations upon business divestiture3 . . . . $ 590,884 $ — $ —
Holdback related to sale of commercial sale-leaseback portfolio3 . . . . . $ 1,927 $ — $ —
96
The accompanying notes are an integral part of these consolidated financial statements.

Fiscal Year Ended
December 29,2019
December 30,2018
December 31,2017
Receivables in connection with sale of residential lease assets3. . . . . . . $ 2,570 $ 12,510 $ —
Assumption of debt by buyer in connection with sale of residential
lease assets3 . . . . . . . . . . . . . . . . . . . . . . . . . . . . . . . . . . . . . . . . . . . . . . $69,076 $561,588 $ —
Aged supplier financing balances reclassified from accounts payable
to short-term debt . . . . . . . . . . . . . . . . . . . . . . . . . . . . . . . . . . . . . . . . . $45,352 $ — $ —
Supplemental cash flow information:
Cash paid for interest, net of amount capitalized . . . . . . . . . . . . . . . . . . $32,777 $ 99,204 $59,885
Cash paid for income taxes. . . . . . . . . . . . . . . . . . . . . . . . . . . . . . . . . . . . $ 8,988 $ 7,800 $12,795
1 ‘‘Cash, cash equivalents, restricted cash and restricted cash equivalents’’ balance consisted of ‘‘cash and cash equivalents’’, ‘‘restricted cash
and cash equivalents, current portion’’ and ‘‘restricted cash and cash equivalents, net of current portion’’ financial statement line items on
the consolidated balance sheets for the respective periods.
2 Amounts for the year ended December 29, 2019 include the transition adjustment for the adoption of ASC 842 and new Right-of-Use
(‘‘ROU’’) asset additions.
3 See Note 4 Business Divestiture and Sale of Assets.
97
The accompanying notes are an integral part of these consolidated financial statements.

Notes to the Consolidated Financial Statements
Note 1. ORGANIZATION AND SUMMARY OF SIGNIFICANT ACCOUNTING POLICIES
Organization
SunPower Corporation (together with its subsidiaries, ‘‘SunPower,’’ ‘‘we,’’ ‘‘us,’’ and ‘‘our’’) is a leading global
energy company that delivers complete solar solutions to residential, commercial, and power plant customers
worldwide through an array of hardware, software, and financing options and through solar power solutions,
operations and maintenance (‘‘O&M’’) services, and ‘‘Smart Energy’’ solutions. SunPower’s Smart Energy initiative
is designed to add layers of intelligent controls to homes, buildings and grids - all personalized through easy-to-use
customer interfaces. Of all the solar cells commercially available to the mass market, we believe our solar cells have
the highest solar power conversion efficiency, a measurement of the amount of sunlight converted by the solar cell
into electricity. SunPower is a majority-owned subsidiary of Total Solar INTL SAS (‘‘Total’’), formerly Total Solar
International SAS, Total Gas & Power USA, SAS, and Total Energies Nouvelles Activités USA, a subsidiary of Total
S.A. (‘‘Total S.A.’’) (see ‘‘Note 2. Transactions with Total and Total S.A’’).
In the fourth quarter of fiscal 2019, we announced the separation of our Maxeon business. Please see Item 1.
Business for more details.
Liquidity
While challenging industry conditions and a competitive environment extended throughout fiscal 2019, we
believe that our total cash and cash equivalents, including cash expected to be generated from operations, will be
sufficient to meet our obligations over the next 12 months from the date of issuance of these consolidated financial
statements. Also, we have been successful in our ability to divest certain investments and non-core assets, such as
the sale of membership interests in our Commercial Sale-Leaseback Portfolio, and the sale and leaseback of Hillsboro
facility (Note 4. Business Divestiture and Sale of Assets). Additionally, we have secured other sources of financing
to satisfy our liquidity needs such as the issuance of common stock through the public offering completed in
November 2019 and realizing cash savings resulting from restructuring actions and cost reduction initiatives
(Note 14. Common Stock and Note 8. Restructuring). We continue to focus on improving our overall operating
performance and liquidity, including managing cash flows and working capital.
While we have not drawn on it, we also have the ability to enhance our available cash by borrowing up to
$55.0 million under the 2019 Revolver. See Note 11. Debt and Credit Sources.
Although we have historically been able to generate liquidity, we cannot predict, with certainty, the outcome of
our actions to generate liquidity as planned.
Basis of Presentation and Preparation
Principles of Consolidation
The consolidated financial statements are prepared in accordance with accounting principles generally accepted
in the United States of America (‘‘United States’’ or ‘‘U.S.,’’ and such accounting principles, ‘‘U.S. GAAP’’) and
include the accounts of SunPower, all of our subsidiaries and special purpose entities, as appropriate under
consolidation accounting guidelines. Intercompany transactions and balances have been eliminated in consolidation.
The assets of the special purpose entities that we establish in connection with certain project financing arrangements
for customers are not designed to be available to service our general liabilities and obligations.
Fiscal Periods
We have a 52-to-53-week fiscal year that ends on the Sunday closest to December 31. Accordingly, every fifth
or sixth year will be a 53-week fiscal year. Fiscal 2019, 2018 and 2017 are 52-week fiscal years. Our fiscal 2019
ended on December 29, 2019, fiscal 2018 ended on December 30, 2018 and fiscal 2017 ended on December 31, 2017.
Management Estimates
The preparation of the consolidated financial statements in conformity with U.S. GAAP requires our
management to make estimates and assumptions that affect the amounts reported in these consolidated financial
statements and accompanying notes. Significant estimates in these consolidated financial statements include revenue
98

recognition, specifically the nature and timing of satisfaction of performance obligations, standalone selling price of
performance obligations and variable consideration; allowances for doubtful accounts receivable; inventory and
project asset write-downs; stock-based compensation; long-lived asset impairment, specifically estimates for
valuation assumptions including discount rates and future cash flows; economic useful lives of property, plant and
equipment, and intangible assets; fair value of investments, including equity investments for which we apply the fair
value option and other financial instruments; residual value of solar power systems, including those subject to
residential operating leases; valuation of contingencies such as accrued warranty; the incremental borrowing rate used
in discounting of lease liabilities; the fair value of indemnities provided to customers and other parties; and income
taxes and tax valuation allowances. Actual results could materially differ from those estimates.
Summary of Significant Accounting Policies
Lease Accounting
Effective December 31, 2018, we adopted Accounting Standards Update (‘‘ASU’’) No. 2016-02, Leases
(Topic 842), as amended (‘‘ASC 842’’). For additional information on the changes resulting from the new standard
and the impact to our financial results on adoption, refer to the section Recently Adopted Accounting Pronouncements
below.
Arrangements with SunPower as a lessee
We determine if an arrangement is a lease at inception. Our operating lease agreements are primarily for real
estate and are included within operating lease right-of-use (‘‘ROU’’) assets and operating lease liabilities on the
consolidated balance sheets. We elected the practical expedient to combine our lease and related non-lease
components for all our leases.
ROU assets represent our right to use an underlying asset for the lease term and lease liabilities represent our
obligation to make lease payments arising from the lease. ROU assets and lease liabilities are recognized at the
commencement date based on the present value of lease payments over the lease term. Variable lease payments are
excluded from the ROU assets and lease liabilities and are recognized in the period in which the obligation for those
payments is incurred. As most of our leases do not provide an implicit rate, we use our incremental borrowing rate
based on the information available at commencement date in determining the present value of lease payments.
ROU assets also include any lease prepayments made and exclude lease incentives. Many of our lessee agreements
include options to extend the lease, which we do not include in our minimum lease terms unless they are reasonably
certain to be exercised. Rental expense for lease payments related to operating leases is recognized on a straight-line
basis over the lease term.
Sale-Leaseback Arrangements
We enter into sale-leaseback arrangements under which solar power systems are sold to third parties and
subsequently leased back by us over lease terms of up to 25 years.
We classify our initial sale-leaseback arrangements of solar power systems as operating leases or sales-type
leases, in accordance with the underlying accounting guidance on leases. We may sell our lessee interests in these
arrangements in entirety before the end of the underlying term of the leaseback.
For all sale-leaseback arrangements classified as operating leases, the profit related to the excess of the proceeds
compared to the fair value of the solar power systems is deferred and recognized over the term of the lease.
Sale-leaseback arrangements classified as finance leases or failed sale, are accounted for under the financing method,
the proceeds received from the sale of the solar power systems are recorded as financing liabilities. The financing
liabilities are subsequently reduced by our payments to lease back the solar power systems, less interest expense
calculated based on our incremental borrowing rate adjusted to the rate required to prevent negative amortization.
Refer to Note 4. Business Divestiture and Sale of Assets, for details of the sale of our commercial sale-leaseback
portfolio during fiscal 2019.
99

Arrangements with SunPower as a lessor
Solar Services
We offer solar services, in partnership with third-party financial institutions, which allows our residential
customers to obtain continuous access to SunPower solar power systems under contracts for terms of up to 20 years.
Solar services revenue is primarily comprised of revenue from such contracts wherein we provide continuous access
to an operating solar system to third parties.
We begin to recognize revenue on solar services when permission to operate (‘‘PTO’’) is given by the local
utility company, the system is interconnected and operation commences. We recognize revenue evenly over the time
that we satisfy our performance obligations over the initial term of the solar services contracts. Solar services
contracts typically have an initial term of 20 years. After the initial contract term, our customers may request an
extension of the term of the contract on prevailing market terms, or request to remove the system. Otherwise, the
contract will automatically renew and continue on a month-to-month basis.
We also apply for and receive Solar Renewable Energy Credits (‘‘SRECs’’) associated with the energy generated
by our solar energy systems and sell them to third parties in certain jurisdictions. SREC revenue is estimated net of
any variable consideration related to possible liquidated damages if we were to deliver fewer SRECs than
contractually committed, and is generally recognized upon delivery of the SRECs to the counterparty.
We typically provide a system output performance warranty, separate from our standard solar panel product
warranty, to our solar services customers. In connection with system output performance warranties, we agree to pay
liquidated damages in the event the system does not perform to the stated specifications, with certain exclusions.
The warranty excludes system output shortfalls attributable to force majeure events, customer curtailment, irregular
weather, and other similar factors. In the event that the system output falls below the warrantied performance level
during the applicable warranty period, and provided that the shortfall is not caused by a factor that is excluded from
the performance warranty, the warranty provides that we will pay the customer an amount based on the value of the
shortfall of energy produced relative to the applicable warrantied performance level. Such liquidated damages
represent a form of variable consideration and are estimated at contract inception and updated at each reporting period
and recognized over time as customers receive and consume the benefits of the solar services.
There are rebate programs offered by utilities in various jurisdictions and are issued directly to homeowners,
based on the lease agreements, the homeowners assign these rights to rebate to us. These rights to rebate are
considered non-cash consideration, measured based on the utilities’ rebates from the installed solar panels on the
homeowners’ roofs and recognized over the lease term.
Revenue from solar services contracts entered into prior to the adoption of ASC 842 were accounted for as leases
under the superseded lease accounting guidance and reported within ‘Residential Leasing’ on the consolidated
statement of operations.
Fair Value of Financial Instruments
The fair value of a financial instrument is the price that would be received to sell an asset or paid to transfer
a liability in an orderly transaction between market participants at the measurement date. The carrying values of cash
and cash equivalents, accounts receivable, and accounts payable approximate their respective fair values due to their
short-term maturities. Equity investments with readily determinable fair value are carried at fair value based on
quoted market prices or estimated based on market conditions and risks existing at each balance sheet date.
Equity investments without readily determinable fair value are measured at cost less impairment, and are adjusted for
observable price changes in orderly transactions for an identical or similar investment of the same issuer. Derivative
financial instruments are carried at fair value based on quoted market prices for financial instruments with similar
characteristics. The effective portion of derivative financial instruments is excluded from earnings and reported as a
component of ‘‘Accumulated other comprehensive loss’’ in the Consolidated Balance Sheets. The ineffective portion
of derivatives financial instruments are included in ‘‘Other, net’’ in the Consolidated Statements of Operations.
During fiscal 2019, we recorded a fair value adjustment of $2.0 million to our equity investments with Fair Value
Option (‘‘FVO’’). The fair value adjustment was included within ‘‘equity in losses of unconsolidated investees’’ in
our consolidated statements of operations for the year ended December 29, 2019 (see Note 7. Fair Value
Measurements).
100

Comprehensive Income (Loss)
Comprehensive income (loss) is defined as the change in equity during a period from non-owner sources.
Our comprehensive income (loss) for each period presented is comprised of (i) our net income (loss); (ii) foreign
currency translation adjustment of our foreign subsidiaries whose assets and liabilities are translated from their
respective functional currencies at exchange rates in effect at the balance sheet date, and revenues and expenses are
translated at average exchange rates prevailing during the applicable period; (iii) changes in unrealized gains or
losses, net of tax, for the effective portion of derivatives designated as cash flow hedges; and (iv) net income (loss)
on long-term pension liability adjustment (see Note 12. Derivative Financial Instruments).
Cash Equivalents
Highly liquid investments with original or remaining maturities of ninety days or less at the date of purchase
are considered cash equivalents.
Cash in Restricted Accounts
We maintain cash and cash equivalents in restricted accounts pursuant to various letters of credit, surety bonds,
loan agreements, and other agreements in the normal course of business. We also hold debt securities, consisting of
Philippine government bonds, which are classified as ‘‘Restricted short-term marketable securities’’ on our
consolidated balance sheets as they are maintained as collateral for present and future business transactions within
the country (see Note 5. Balance Sheet Components).
Short-Term and Long-Term Investments
We may invest in money market funds and debt securities. In general, investments with original maturities of
greater than ninety days and remaining maturities of one year or less are classified as short-term investments, and
investments with maturities of more than one year are classified as long-term investments. Investments with
maturities beyond one year may be classified as short-term based on their highly liquid nature and because such
investments represent the investment of cash that is available for current operations. Despite the long-term maturities,
we have the ability and intent, if necessary, to liquidate any of these investments in order to meet our working capital
needs within our normal operating cycles. We have classified these investments as held-to-maturity securities.
Short-Term and Long-Term Inventories
Inventories are accounted for on a first-in-first-out basis and are valued at the lower of cost or net realizable
value. We evaluate the realizability of our inventories, including purchase commitments under fixed-price long-term
supply agreements, based on assumptions about expected demand and market conditions. Our assumption of
expected demand is developed based on our analysis of bookings, sales backlog, sales pipeline, market forecast, and
competitive intelligence. Our assumption of expected demand is compared to available inventory, production
capacity, future polysilicon purchase commitments, available third-party inventory, and growth plans. Our factory
production plans, which drive materials requirement planning, are established based on our assumptions of expected
demand. We respond to reductions in expected demand by temporarily reducing manufacturing output and adjusting
expected valuation assumptions as necessary. In addition, expected demand by geography has changed historically
due to changes in the availability and size of government mandates and economic incentives.
We evaluate the terms of our long-term inventory purchase agreements with suppliers, including joint ventures,
for the procurement of polysilicon, ingots, wafers, and solar cells and establishes accruals for estimated losses on
adverse purchase commitments as necessary, such as lower of cost or net realizable value adjustments, forfeiture of
advanced deposits and liquidated damages. Obligations related to non-cancellable purchase orders for inventories
match current and forecasted sales orders that will consume these ordered materials and actual consumption of these
ordered materials are compared to expected demand regularly. We anticipate total obligations related to long-term
supply agreements for inventories will be realized because quantities are less than our expected demand for our solar
power products for the foreseeable future and because the raw materials subject to these long-term supply agreements
are not subject to spoilage or other factors that would deteriorate its usability; however, if raw materials inventory
balances temporarily exceed near-term demand, we may elect to sell such inventory to third parties to optimize
working capital needs. In addition, because the purchase prices required by our long-term polysilicon agreements are
significantly higher than current market prices for similar materials, if we are not able to profitably utilize this
material in our operations or elect to sell near-term excess, we may incur additional losses. Other market conditions
101

that could affect the realizable value of our inventories and are periodically evaluated by us include historical
inventory turnover ratio, anticipated sales price, new product development schedules, the effect new products might
have on the sale of existing products, product obsolescence, customer concentrations, the current market price of
polysilicon as compared to the price in our fixed-price arrangements, and product merchantability, among other
factors. If, based on assumptions about expected demand and market conditions, we determine that the cost of
inventories exceeds its net realizable value or inventory is excess or obsolete, or we enter into arrangements with third
parties for the sale of raw materials that do not allow us to recover our current contractually committed price for such
raw materials, we record a write-down or accrual equal to the difference between the cost of inventories and the
estimated net realizable value, which may be material. If actual market conditions are more favorable, we may have
higher gross margin when products that have been previously written down are sold in the normal course of business
Additionally, the Company’s classification of its inventory as either current or long-term inventory requires it to
estimate the portion of on-hand inventory that can be realized over the next 12 months. (see Note 5. Balance Sheet
Components).
Financing Receivables
Leases are classified as either operating or sales-type leases in accordance with the relevant accounting
guidelines. Financing receivables are generated by solar power systems leased to residential customers under
sales-type leases. Financing receivables represent gross minimum lease payments to be received from customers over
a period commensurate with the remaining lease term of up to 20 years and the system’s estimated residual value,
net of unearned income and allowance for estimated losses. Initial direct costs for sales-type leases are recognized
as cost of sales when the solar power systems are placed in service.
Our evaluation of the recoverability of these financing receivables is based on evaluation of the likelihood, based
on current information and events, and whether we will be able to collect all amounts due according to the contractual
terms of the underlying lease agreements. In accordance with this evaluation, we recognize an allowance for losses
on financing receivables based on our estimate of the amount equal to the probable losses net of recoveries.
The combination of the leased solar power systems discussed in the preceding paragraph together with the lease
financing receivables is referred to as the ‘‘Residential Lease Portfolio.’’
During fiscal 2018 and 2017, events and circumstances indicated that we might not be able to collect all amounts
due according to the contractual terms of the underlying lease agreements. We determined it was necessary to
evaluate the potential for allowances in our ability to collect these receivables. Estimates and judgments about future
cash flows were made using an income approach defined as Level 3 inputs under fair value measurement standards.
The income approach, specifically a discounted cash flow analysis, included assumptions for, among others,
forecasted lease income, expenses, default rates, residual value of these lease assets and long-term discount rates, all
of which require significant judgment by us. In accordance with such evaluation, we recognized an allowance for
losses on the consolidated statement of operations.
During fiscal 2019, we performed a recoverability test for assets in the residential assets by estimating future
undiscounted net cash flows expected to be generated by the assets, based on our own specific alternative courses
of action under consideration. The alternative courses were either to sell or refinance the assets, or hold the assets
until the end of their previously estimated useful lives. Upon consideration of the alternatives, we determined that
market value, in the form of indicative purchase price from a third-party investor was available for a portion of our
residential assets. As we intend to sell these remaining residential portfolio assets, we used the indicative purchase
price from a third-party investor as fair value of the underlying net assets in our impairment evaluation. See Note 6.
Solar Services for additional information on the related impairment charge.
102

Property, Plant and Equipment
Property, plant and equipment are stated at cost, less accumulated depreciation. Depreciation, excluding solar
power systems leased to residential customers and those associated with sale-leaseback transactions under the
financing method, is computed using the straight-line method over the estimated useful lives of the assets as
presented below. Solar power systems leased to residential customers are depreciated using the straight-line method
to their estimated residual values over the lease terms of up to 20 years. Leasehold improvements are amortized over
the shorter of the estimated useful lives of the assets or the remaining term of the lease. Repairs and maintenance costs
are expensed as incurred.
Useful Livesin Years
Buildings . . . . . . . . . . . . . . . . . . . . . . . . . . . . . . . . . . . . . . . . . . . . . . . . . . . . . . . . . . . . . . . . . . . . . . . . . . 20 to 30
Leasehold improvements . . . . . . . . . . . . . . . . . . . . . . . . . . . . . . . . . . . . . . . . . . . . . . . . . . . . . . . . . . . . . 1 to 20
Manufacturing equipment. . . . . . . . . . . . . . . . . . . . . . . . . . . . . . . . . . . . . . . . . . . . . . . . . . . . . . . . . . . . . 7 to 15
Computer equipment . . . . . . . . . . . . . . . . . . . . . . . . . . . . . . . . . . . . . . . . . . . . . . . . . . . . . . . . . . . . . . . . 2 to7
Solar power systems. . . . . . . . . . . . . . . . . . . . . . . . . . . . . . . . . . . . . . . . . . . . . . . . . . . . . . . . . . . . . . . . . 30
Furniture and fixtures . . . . . . . . . . . . . . . . . . . . . . . . . . . . . . . . . . . . . . . . . . . . . . . . . . . . . . . . . . . . . . . . 3 to 5
Interest Capitalization
The interest cost associated with major development and construction projects is capitalized and included in the
cost of the property, plant and equipment or project assets. Interest capitalization ceases once a project is substantially
complete or no longer undergoing construction activities to prepare it for its intended use. When no debt is
specifically identified as being incurred in connection with a construction project, we capitalize interest on amounts
expended on the project at our weighted average cost of borrowed money.
Long-Lived Assets Impairment
We evaluate our long-lived assets, including property, plant and equipment, solar power systems leased and to
be leased, and other intangible assets with finite lives, for impairment whenever events or changes in circumstances
arise. This evaluation includes consideration of technology obsolescence that may indicate that the carrying value of
such assets may not be recoverable. The assessments require significant judgment in determining whether such events
or changes have occurred. Factors considered important that could result in an impairment review include significant
changes in the manner of use of a long-lived asset or in its physical condition, a significant adverse change in the
business climate or economic trends that could affect the value of a long-lived asset, an accumulation of costs
significantly in excess of the amount originally expected for the acquisition or construction of a long-lived asset,
significant under-performance relative to expected historical or projected future operating results, or a current
expectation that, more likely than not, a long-lived asset will be sold or otherwise disposed of significantly before
the end of its previously estimated useful life.
For purposes of the impairment evaluation, long-lived assets are grouped with other assets and liabilities at the
lowest level for which identifiable cash flows are largely independent of the cash flows of other assets and liabilities.
We must exercise judgment in assessing such groupings and levels. We then compare the estimated future
undiscounted net cash flows expected to be generated by the asset group (including the eventual disposition of the
asset group at residual value) to the asset group’s carrying value to determine if the asset group is recoverable. If our
estimate of future undiscounted net cash flows is insufficient to recover the carrying value of the asset group, we
record an impairment loss in the amount by which the carrying value of the asset group exceeds the fair value.
Fair value is generally measured based on (i) internally developed discounted cash flows for the asset group,
(ii) third-party valuations, and (iii) quoted market prices, if available. If the fair value of an asset group is determined
to be less than its carrying value, an impairment in the amount of the difference is recorded in the period that the
impairment indicator occurs. For additional information on the impairment charge recorded in fiscal 2019 and 2018,
and the underlying fair value assumptions, see Note 6. Solar Services.
Product Warranties
We generally provide a 25-year standard warranty for the solar panels that we manufacture for defects in
materials and workmanship. The warranty provides that we will repair or replace any defective solar panels during
103

the warranty period. In addition, we pass through to customers long-term warranties from the original equipment
manufacturers of certain system components, such as inverters. Warranties of 25 years from solar panel suppliers are
standard in the solar industry, while certain system components carry warranty periods ranging from five to 20 years.
In addition, we generally warrant our workmanship on installed systems for periods ranging up to 25 years and
also provide a separate system output performance warranty to customers that have subscribed to our post-installation
monitoring and maintenance services which expires upon termination of the post-installation monitoring and
maintenance services related to the system. The warrantied system output performance level varies by system
depending on the characteristics of the system and the negotiated agreement with the customer, and the level declines
over time to account for the expected degradation of the system. Actual system output is typically measured annually
for purposes of determining whether warrantied performance levels have been met. The warranty excludes system
output shortfalls attributable to force majeure events, customer curtailment, irregular weather, and other similar
factors. In the event that the system output falls below the warrantied performance level during the applicable
warranty period, and provided that the shortfall is not caused by a factor that is excluded from the performance
warranty, the warranty provides that we will pay the customer a liquidated damage based on the value of the shortfall
of energy produced relative to the applicable warrantied performance level.
We maintain reserves to cover the expected costs that could result from these warranties. Our expected costs are
generally in the form of product replacement or repair. Warranty reserves are based on our best estimate of such costs
and are recognized as a cost of revenue. We continuously monitor product returns for warranty failures and maintains
a reserve for the related warranty expenses based on various factors including historical warranty claims, results of
accelerated lab testing, field monitoring, vendor reliability estimates, and data on industry averages for similar
products. Due to the potential for variability in these underlying factors, the difference between our estimated costs
and our actual costs could be material to our consolidated financial statements. If actual product failure rates or the
frequency or severity of reported claims differ from our estimates or if there are delays in our responsiveness to
outages, we may be required to revise our estimated warranty liability. Historically, warranty costs have been within
our expectations (see Note 9. Commitments and Contingencies).
Revenue Recognition
Module and Component Sales
We sell our solar panels and balance of system components primarily to dealers, system integrators and
distributors, and recognizes revenue at a point in time when control of such products transfers to the customer, which
generally occurs upon shipment or delivery depending on the terms of the contracts with the customer. There are no
rights of return. Other than standard warranty obligations, there are no significant post-shipment obligations
(including installation, training or customer acceptance clauses) with any of our customers that could have an impact
on revenue recognition. Our revenue recognition policy is consistent across all geographic areas.
Solar Power System Sales and Engineering, Procurement, and Construction Services
We design, manufacture and sell rooftop and ground-mounted solar power systems under construction and
development agreements, to our residential and commercial customers. In contracts where we sell completed systems
as a single performance obligation, primarily to our joint venture for residential projects, we recognize revenue at the
point-in-time when such systems are placed in service. Any advance payments received before control is transferred
is classified as ‘‘contract liabilities.’’
Engineering, procurement and construction (‘‘EPC’’) projects governed by customer contracts that require us to
deliver functioning solar power systems are generally completed within three to twelve months from commencement
of construction. Construction on large projects may be completed within eighteen to thirty-six months, depending on
the size and location. We recognize revenue from EPC services over time as our performance creates or enhances an
energy generation asset controlled by the customer. We use an input method based on cost incurred as we believe that
this method most accurately reflects our progress toward satisfaction of the performance obligation. Under this
method, revenue arising from fixed-price construction contracts is recognized as work is performed based on the ratio
of costs incurred to date to the total estimated costs at completion of the performance obligations.
Incurred costs include all direct material, labor and subcontract costs, and those indirect costs related to contract
performance, such as indirect labor, supplies, and tools. Project material costs are included in incurred costs when
the project materials have been installed by being permanently attached or fitted to the solar power system as required
104

by the project’s engineering design. Cost-based input methods of revenue recognition require us to make estimates
of net contract revenues and costs to complete the projects. In making such estimates, significant judgment is required
to evaluate assumptions related to the amount of net contract revenues, including the impact of any performance
incentives, liquidated damages, and other payments to customers. Significant judgment is also required to evaluate
assumptions related to the costs to complete the projects, including materials, labor, contingencies, and other system
costs. If the estimated total costs on any contract are greater than the net contract revenues, we recognize the entire
estimated loss in the period the loss becomes known and can be reasonably estimated.
Our arrangements may contain clauses such as contingent repurchase options, delay liquidated damages or early
performance bonus, most favorable pricing, or other provisions that can either increase or decrease the transaction
price. These variable amounts generally are awarded upon achievement of certain performance metrics or milestones.
Variable consideration is estimated at each measurement date at its most likely amount to the extent that it is probable
that a significant reversal of cumulative revenue recognized will not occur and true-ups are applied prospectively as
such estimates change.
Changes in estimates for sales of systems and EPC services occur for a variety of reasons, including but not
limited to (i) construction plan accelerations or delays, (ii) product cost forecast changes, (iii) change orders, or
(iv) changes in other information used to estimate costs. The cumulative effect of revisions to transaction prices or
input cost estimates are recorded in the period in which the revisions to estimates are identified and the amounts can
be reasonably estimated.
Operations and Maintenance
We offer our customers various levels of post-installation operations and maintenance (‘‘O&M’’) services with
the objective of optimizing our customers’ electrical energy production over the life of the system. We determine that
the post-installation systems monitoring and maintenance qualifies as a separate performance obligation. Post-
installation monitoring and maintenance is deferred at the time the contract is executed, based on the estimate of
selling price on a standalone basis, and is recognized to revenue over time as customers receive and consume benefits
of such services. The non-cancellable term of the O&M contracts are typically 90 days for commercial and residential
customers and 180 days for power plant customers.
We typically provide a system output performance warranty, separate from our standard solar panel product
warranty, to customers that have subscribed to our post-installation O&M services. In connection with system output
performance warranties, we agree to pay liquidated damages in the event the system does not perform to the stated
specifications, with certain exclusions. The warranty excludes system output shortfalls attributable to force majeure
events, customer curtailment, irregular weather, and other similar factors. In the event that the system output falls
below the warrantied performance level during the applicable warranty period, and provided that the shortfall is not
caused by a factor that is excluded from the performance warranty, the warranty provides that we will pay the
customer an amount based on the value of the shortfall of energy produced relative to the applicable warrantied
performance level. Such liquidated damages represent a form of variable consideration and are estimated at contract
inception and updated at each reporting period and recognized over time as customers receive and consume the
benefits of the O&M services.
In September 2019, we signed a definitive agreement to sell our O&M business. We expect to complete the sale
of our O&M business during the first half of fiscal 2020 subject to the satisfaction of customary conditions precedent,
including receipt of certain third-party consents and approvals.
Shipping and Handling Costs
We account for shipping and handling activities related to contracts with customers as costs to fulfill our promise
to transfer goods and, accordingly, records such costs in cost of revenue.
Taxes Collected from Customers and Remitted to Governmental Authorities
We exclude from our measurement of transaction prices all taxes assessed by governmental authorities that are
both (i) imposed on and concurrent with a specific revenue-producing transaction and (ii) collected from customers.
Accordingly, such tax amounts are not included as a component of revenue or cost of revenue.
Stock-Based Compensation
We measure and record compensation expense for all stock-based payment awards based on estimated fair
values. We provide stock-based awards to our employees, executive officers, and directors through various equity
105

compensation plans including our employee stock option and restricted stock plans. The fair value of restricted stock
units is based on the market price of our common stock on the date of grant. We have not granted stock options since
fiscal 2008.
We estimate stock option forfeitures at the date of grant. Our estimate of forfeitures is based on our historical
activity, which we believe is indicative of expected forfeitures. In subsequent periods if the actual rate of forfeitures
differs from our estimate, the forfeiture rates are required to be revised, as necessary. Changes in the estimated
forfeiture rates can have a significant effect on stock-based compensation expense since the effect of adjusting the
rate is recognized in the period the forfeiture estimate is changed.
We also grant performance share units to executive officers and certain employees that require us to estimate
expected achievement of performance targets over the performance period. This estimate involves judgment
regarding future expectations of various financial performance measures. If there are changes in our estimate of the
level of financial performance measures expected to be achieved, the related stock-based compensation expense may
be significantly increased or reduced in the period that our estimate changes.
Accounting for Business Divestitures
From time to time, we may dispose of significant assets or portions of our business by sale or exchange for other
assets. In accounting for such transactions, we apply the applicable accounting guidance under U.S. GAAP pertaining
to discontinued operations and disposals of components of an entity. Our assessment includes whether such disposal
represents a significant strategic shift in our operations and on the extent of our continuing involvement in relation
to that portion of our business. We evaluate the significance of our intended divestiture transactions in relation to our
consolidated financial measures to determine whether a disposal of assets or a business qualifies as discontinued
operations. For additional details see Note 4. Business Divestitures and Sale of Assets. We recognize disposal related
costs that are not part of divestiture consideration as general and administrative expense as they are incurred.
These costs typically include transaction and disposal costs, such as legal, accounting, and other professional fees.
Advertising Costs
Advertising costs are expensed as incurred. Advertising expense totaled approximately $8.2 million,
$6.9 million and $6.3 million, in fiscal 2019, 2018, and 2017, respectively.
Research and Development Expenses
Research and development expense consists primarily of salaries and related personnel costs, depreciation and
the cost of solar cell and solar panel materials and services used for the development of products, including
experiments and testing. All research and development costs are expensed as incurred. Research and development
expenses are reported net of contributions under the R&D Agreement with Total (See Note 2. Transactions with Total
and Total S.A. for further details) and contracts with governmental agencies because such contracts are considered
collaborative arrangements.
Translation of Foreign Currency
SunPower Corporation and certain of our subsidiaries use their respective local currency as their functional
currency. Accordingly, foreign currency assets and liabilities are translated using exchange rates in effect at the end
of the period. Aggregate exchange gains and losses arising from the translation of foreign assets and liabilities are
included in ‘‘Accumulated other comprehensive loss’’ in the Consolidated Balance Sheets. Foreign subsidiaries that
use the U.S. dollar as their functional currency remeasure monetary assets and liabilities using exchange rates in
effect at the end of the period. Exchange gains and losses arising from the remeasurement of monetary assets and
liabilities are included in ‘‘Other, net’’ in the consolidated statements of operations. Non-monetary assets and
liabilities are carried at their historical values.
We include gains or losses from foreign currency transactions in ‘‘Other, net’’ in the consolidated statements of
operations with the other hedging activities described in Note 12. Derivative Financial Instruments.
Concentration of Credit Risk
We are exposed to credit losses in the event of nonperformance by the counterparties to our financial and
derivative instruments. Financial and derivative instruments that potentially subject us to concentrations of credit risk
are primarily cash and cash equivalents, restricted cash and cash equivalents, investments, accounts receivable, notes
106

receivable, advances to suppliers, foreign currency option contracts, foreign currency forward contracts, bond hedge
and warrant transactions, and purchased options. Our investment policy requires cash and cash equivalents, restricted
cash and cash equivalents, and investments to be placed with high-quality financial institutions and to limit the
amount of credit risk from any one issuer. Similarly, we enter into foreign currency derivative contracts and
convertible debenture hedge transactions with high-quality financial institutions and limit the amount of credit
exposure to any one counterparty. The foreign currency derivative contracts are limited to a time period of less than
9 months. We regularly evaluate the credit standing of our counterparty financial institutions.
We perform ongoing credit evaluations of our customers’ financial condition whenever deemed necessary and
generally we do not require collateral from our leasing customers. We maintain an allowance for doubtful accounts
based on the expected collectability of all accounts receivable, which takes into consideration an analysis of historical
bad debts, specific customer creditworthiness and current economic trends. Qualified customers under our residential
lease program are generally required to have a minimum credit score. We believe that our concentration of credit risk
is limited because of our large number of customers, credit quality of the customer base, small account balances for
most of these customers, and customer geographic diversification. As of December 29, 2019, one customer accounted
for 13.9% of our accounts receivable balance. As of December 30, 2018, we had no customers that accounted for at
least 10% of accounts receivable. We had two different customers that accounted for 25.2% and 20.5% of our
‘‘Construction costs in excess of billing’’ balance as of December 29, 2019. We had one customer that accounted for
24.0% of our ‘‘Construction costs in excess of billing’’ balance as of December 30, 2018, respectively, on the
consolidated balance sheets. As of December 29, 2019 and December 30, 2018, our ‘‘Construction costs in excess
of billing’’ balance was $47.7 million and $34.3 million, respectively.
We have entered into agreements with vendors that specify future quantities and pricing of polysilicon to be
supplied for the next 2 years. The purchase prices required by these polysilicon supply agreements are significantly
higher than current market prices for similar materials. Under certain agreements, we were required to make
prepayments to the vendors over the terms of the arrangements.
Income Taxes
Deferred tax assets and liabilities are recognized for temporary differences between financial statement and
income tax bases of assets and liabilities. Valuation allowances are provided against deferred tax assets when we
cannot conclude that it is more likely than not that some portion or all deferred tax assets will be realized.
As applicable, interest and penalties on tax contingencies are included in ‘‘(Provision for) benefit from income
taxes’’ in the Consolidated Statements of Operations and such amounts were not material for any periods presented.
In addition, foreign exchange gains (losses) may result from estimated tax liabilities, which are expected to be settled
in currencies other than the U.S. dollar.
Investments in Equity Interests
Investments in entities in which we can exercise significant influence, but do not own a majority equity interest
or otherwise control, are accounted for under the equity method. We record our share of the results of these entities
as ‘‘Equity in earnings (losses) of unconsolidated investees’’ on the Consolidated Statements of Operations.
We monitor our investments for other-than-temporary impairment by considering factors such as current economic
and market conditions and the operating performance of the entities and records reductions in carrying values when
necessary. The fair value of privately-held investments is estimated using the best available information as of the
valuation date, including current earnings trends, undiscounted cash flows, and other company specific information,
including recent financing rounds.
We have elected the fair value option in accordance with the guidance in ASC 825, Financial Instruments, for
our investment in the SunStrong joint venture and SunStrong Partners, to mitigate volatility in reported earnings that
results from the use of different measurement attributes. We initially computed the fair value for our investments
consistent with the methodology and assumptions that market participants would use in their estimates of fair value
with the assistance of a third-party valuation specialist. The fair value computation is updated on a quarterly basis.
The investments are classified within Level 3 in the fair value hierarchy because we estimate the fair value of the
investments using the income approach based on the discounted cash flow method which considered estimated future
financial performance, including assumptions for, among others, forecasted contractual lease income, lease expenses,
residual value of these lease assets and long-term discount rates, and forecasted default rates over the lease term and
discount rates, some of which require significant judgment by management and are not based on observable inputs
(see Note 5. Balance Sheet Components, Note 7. Fair Value Measurements, and Note 10. Equity Investments).
107

Noncontrolling Interests
Noncontrolling interests represents the portion of net assets in consolidated subsidiaries that are not attributable,
directly or indirectly, to us. Beginning in fiscal 2013, we have entered into facilities with third-party investors under
which the investors are determined to hold noncontrolling interests in entities fully consolidated by us. The net assets
of the shared entities are attributed to the controlling and noncontrolling interests based on the terms of the governing
contractual arrangements. We further determined the hypothetical liquidation at book value method
(‘‘HLBV Method’’) to be the appropriate method for attributing net assets to the controlling and noncontrolling
interests as this method most closely mirrors the economics of the governing contractual arrangements. Under the
HLBV Method, we allocate recorded income (loss) to each investor based on the change, during the reporting period,
of the amount of net assets each investor is entitled to under the governing contractual arrangements in a liquidation
scenario.
Recently Adopted Accounting Pronouncements
In October 2018, the Financial Accounting Standard Board (‘‘FASB’’) issued ASU 2018-16, Derivatives and
Hedging (Topic 815): Inclusion of the Secured Overnight Financing Rate (SOFR) Overnight Index Swap (OIS) Rate
as a Benchmark Interest Rate for Hedge Accounting Purposes, which permits the use of the Overnight Index Swap
Rate based on the Secured Overnight Financing Rate as a fifth U.S. benchmark interest rate for purposes of hedge
accounting. The new guidance is effective for fiscal years beginning after December 15, 2018, and interim periods
within those fiscal years and should be applied prospectively for qualifying new or re-designated hedging
relationships entered into after December 31, 2018. We adopted the new guidance on December 31, 2018.
The adoption did not have an impact on our consolidated financial statements.
In August 2018, the FASB issued ASU 2018-13, Fair Value Measurement (Topic 820) which changes the fair
value measurement disclosure requirements of ASC 820. The guidance adds and clarifies certain disclosure
requirements for fair value measurements with the objective of improving the effectiveness of disclosures in the notes
to financial statements. The adoption did not have an impact on our consolidated financial statements.
In February 2016, the FASB issued ASC 842, which supersedes the existing guidance for lease accounting,
Leases (Topic 840). ASC 842 requires lessees to recognize a lease liability and a ROU asset for virtually all of their
leases (other than leases that meet the definition of a short-term lease). ASC 842 is effective for fiscal years beginning
after December 15, 2018, and interim periods within those fiscal years. In July 2018, the FASB issued several ASUs
to clarify and improve certain aspects of the new lease standard including, among many other things, the rate implicit
in the lease, lessee reassessment of lease classification, variable payments that depend on an index or rate, methods
of transition including an optional transition method to continue recognizing and disclosing leases entered into prior
to the adoption date under ASC 840. In December 2018, the FASB issued ASU 2018-20, Leases (Topic 842)
Narrow-Scope Improvements for Lessors, related to sales taxes and other similar taxes collected from lessees, certain
lessor costs paid by lessees to third parties, and related to recognition of variable payments for contracts.
On December 31, 2018, we adopted ASC 842 using the optional transitional method for all leases that existed
at or commenced before that date. We elected to apply the practical expedients in ASC 842-10-65-1 (f) and (g), and
therefore:
1) did not reassess expired contracts for presence of lease components therein and if it was already concluded
that such contracts had lease components, then the classification of the respective lease components therein
have not been re-assessed;
2) did not re-assess initial direct costs for any existing leases;
3) used hindsight for determining the lease term for all leases whereon ASC 842 has been applied;
4) elected to not separate the lease and non-lease components;
5) elected to not apply the recognition and measurement requirements of the new guidance to short-term
leases;
6) did not assess whether existing or expired land easements that were not previously assessed under legacy
guidance on leases are or contain a lease under the new guidance;
108

The adoption of ASC 842 had a material impact on our consolidated balance sheet as the standard requires us
to recognize an ROU asset and lease liability on our consolidated balance sheet as of December 31, 2018, for all
existing leases other than those to which we have applied the short-term lease practical expedient.
Upon adoption, we made the following changes to our accounting policies:
• Solar leases no longer meet the criteria for lease accounting as our contracts do not allow the customer to
direct the use of the underlying solar system. Instead, we will account for these arrangements entered into
on or after December 31, 2018 as contracts with customers pursuant to ASC Topic 606 and recognize
revenue ratably based on contractual lease cash flows over the lease term;
• All operating lease arrangements, other than short term leases, are now recorded on the balance sheet as
a ROU asset with a corresponding lease liability;
Further, arrangements that involve the lease-back of solar systems sold to a financier will continue to be
accounted for as a failed sale and result in the recording of a financing liability.
Impact to Consolidated Financial Statements
The below table shows the impact of adoption of ASC 842 on our consolidated financial statements as of
December 31, 2018:
(In thousands)December 31,
2018Adoption of
ASC 842December 31,
2018
Assets:
Prepaid expenses and other current assets . . . . . . . . . . . . . . . . . . . . . . . . $ 131,183 $ (4,433) $ 126,750
Operating lease right-of-use assets . . . . . . . . . . . . . . . . . . . . . . . . . . . . . . — 81,525 81,525
Other long-term assets. . . . . . . . . . . . . . . . . . . . . . . . . . . . . . . . . . . . . . . . 162,033 (14,028) 148,005
Current Liabilities:
Accrued liabilities . . . . . . . . . . . . . . . . . . . . . . . . . . . . . . . . . . . . . . . . . . . 235,252 (2,455) 232,797
Operating lease liabilities . . . . . . . . . . . . . . . . . . . . . . . . . . . . . . . . . . . . . — 11,499 11,499
Contract liabilities, current portion . . . . . . . . . . . . . . . . . . . . . . . . . . . . . . 104,130 (2,079) 102,051
Non-current liabilities:
Operating lease liabilities, net of current portion. . . . . . . . . . . . . . . . . . . — 70,132 70,132
Contract liabilities, net of current portion . . . . . . . . . . . . . . . . . . . . . . . . 99,509 (19,928) 79,581
Other long-term liabilities . . . . . . . . . . . . . . . . . . . . . . . . . . . . . . . . . . . . . 839,136 (3,256) 835,880
Equity:
Accumulated deficit. . . . . . . . . . . . . . . . . . . . . . . . . . . . . . . . . . . . . . . . . . $(2,480,988) $ 9,151 $(2,471,837)
Recent Accounting Pronouncements Not Yet Adopted
In June 2016, the FASB issued ASU 2016-13, Financial Instruments—Credit Losses (Topic 326): Measurement
of Credit Losses on Financial Instruments (ASU 2016-13) and subsequent amendment to the initial guidance:
ASU 2018-19 (collectively, Topic 326). Topic 326 requires measurement and recognition of expected credit losses for
financial assets held. The amendment applies to entities which hold financial assets and net investments in leases that
are not accounted for at fair value through net income as well as loans, debt securities, accounts receivables, and any
other financial assets not excluded from the scope that have the contractual right to receive cash. Topic 326 is
effective for us no later than the first quarter of fiscal 2020 with early adoption permitted. Based on the current
composition of our financial instruments, current market conditions, foreseeable and supportable forecasts, and
historical credit loss experience, the impact on our consolidated financial statements and related disclosures is not
expected to be material.
In August 2018, the FASB issued ASU 2018-14, Compensation - Retirement Benefits - Defined Benefit Plans
- General (Subtopic 715-20) to add, remove, and clarify disclosure requirements related to defined benefit pension
and other postretirement plans. This ASU is effective for us no later than the first quarter of fiscal 2020 with early
adoption permitted. No material impact is expected on our consolidated financial statements and disclosures, upon
adoption.
In August 2018, the FASB issued ASU 2018-15, Intangibles — Goodwill and Other — Internal-Use Software
(Subtopic 350-40) requiring a customer in a cloud computing arrangement that is a service contract to follow the
109

internal-use software guidance in ASC 350-40 to determine which implementation costs to capitalize as assets.
This ASU is effective for us no later than the first quarter of fiscal 2020 with early adoption permitted. This ASU
can be applied either retrospectively or prospectively to all implementation costs incurred after the date of adoption.
No material impact is expected on our consolidated financial statements and disclosures, upon adoption.
In October 2018, the FASB issued ASU 2018-17, Consolidation (Topic 810): Targeted Improvements to Related
Party Guidance for Variable Interest Entities, which broadens the scope of the private company alternative to include
all common control arrangements that meet specific criteria (not just leasing arrangements) and also eliminates the
requirement that entities consider indirect interests held through related parties under common control in their entirety
when assessing whether a decision-making fee is a variable interest. This ASU is effective for us no later than the
first quarter of fiscal 2020 on a retrospective basis with a cumulative-effect adjustment to retained earnings at the
beginning of the earliest period presented. No material impact is expected on our consolidated financial statements
and disclosures, upon adoption.
In November 2018, the FASB issued ASU 2018-18, Collaborative Arrangements (Topic 808): Clarifying the
Interaction between Topic 808 and Topic 606, which 1) clarifies that certain transactions between collaborative
arrangement participants should be accounted for as revenue under Topic 606; 2) adds unit-of-account guidance in
Topic 808 to align with the guidance in Topic 606; and 3) requires that in a transaction with a collaborative
arrangement participant that is not directly related to sales to third parties, presenting the transaction together with
revenue recognized under Topic 606 is precluded if the collaborative arrangement participant is not a customer.
This ASU is effective for us no later than the first quarter of fiscal 2020 on a retrospective basis to the date of initial
application of Topic 606 with early adoption permitted. Although we are evaluating the potential impact of this
ASU on our consolidated financial statements and disclosures, we are not expecting material impacts.
In December 2019, the FASB issued ASU No. 2019-12, Simplifying the Accounting for Income Taxes, which
simplifies the accounting for income taxes, eliminates certain exceptions within ASC 740, Income Taxes, and clarifies
certain aspects of the current guidance to promote consistency among reporting entities. ASU 2019-12 is effective
for us no later than the first quarter of fiscal 2021. Most amendments within the standard are required to be applied
on a prospective basis, while certain amendments must be applied on a retrospective or modified retrospective basis.
We are currently evaluating the impacts of the provisions of ASU 2019-12 on our financial statements and
disclosures.
Note 2. TRANSACTIONS WITH TOTAL AND TOTAL S.A.
In June 2011, Total completed a cash tender offer to acquire 60% of our then outstanding shares of common
stock at a price of $23.25 per share, for a total cost of approximately $1.4 billion. In December 2011, we entered into
a Private Placement Agreement with Total (the ‘‘Private Placement Agreement’’), under which Total purchased, and
we issued and sold, 18.6 million shares of our common stock for a purchase price of $8.80 per share, thereby
increasing Total’s ownership to approximately 66% of our outstanding common stock as of that date. As of
December 29, 2019, through the increase of our total outstanding common stock due to the secondary offering of
common stock completed on November 25, 2019, exercise of warrants and issuance of restricted and performance
stock units, Total’s ownership of our outstanding common stock was approximately 47%.
Supply Agreements
In November 2016, we and Total entered into a four-year, up to 200 megawatt (‘‘MW’’) supply agreement to
support the solarization of certain Total facilities. The agreement covers the supply of 150 MW of E-Series
(Maxeon 2) panels with an option to purchase up to another 50 MW of P-Series solar panels. In March 2017, we
received a prepayment totaling $88.5 million. The prepayment is secured by some of our assets located in the United
States and in Mexico.
We recognize revenue for the solar panels supplied under this arrangement consistent with our revenue
recognition policy for solar power components at a point in time when control of such products transfers to the
customer, which generally occurs upon shipment or delivery depending on the terms of the contracts. In the second
quarter of fiscal 2017, we started to supply Total with solar panels under the supply agreement and as of
December 29, 2019, we had $18.8 million of ‘‘contract liabilities, current portion’’ and $35.4 million of ‘‘contract
liabilities, net of current portion’’ on our consolidated balance sheets related to the aforementioned supply agreement
(see Note 9. Commitments and Contingencies’’).
110
In March 2018, we and Total, each through certain affiliates, entered into an agreement whereby we agreed to
sell 3.42 MW of photovoltaic (‘‘PV’’) modules to Total for a development project in Chile. This agreement provided
for payment from Total in the amount of approximately $1.3 million, 10% of which was paid upon execution of the
agreement.
On January 7, 2019, we and Total, each through certain affiliates, entered into an agreement whereby we agreed
to sell 3.7 MW of PV modules to Total for a ground-mounted PV installation in Dubai. This agreement provided for
payment from Total in the amount of approximately $1.4 million, 10% of which was received after execution of the
agreement.
On March 4, 2019, we and Total, each through certain affiliates, entered into an agreement whereby we agreed
to sell 10 MW of PV modules to Total for commercial rooftop PV installations in Dubai. This agreement provided
for payment from Total in the amount of approximately $3.2 million, 10% of which was received in April 2019.
In December 2019, we and Total, each through certain affiliates, entered into an agreement whereby we agreed
to sell 93 MW of PV modules to Total for commercial PV modules in France. This agreement provided for payment
from Total in the amount of approximately $38.4 million, 10% of which was received in December 2019.
In December 2019, we entered into and closed four Membership Interest Purchase and Project Development
Agreements which Total Strong, LLC., a joint venture between Total and Hannon Armstrong, to sell our membership
interests in four project companies. We recognized revenue of $6.2 million for sales to this joint venture, which is
included within ‘‘Solar power systems, components, and other’’ on our consolidated statements of operations for
fiscal 2019.
Affiliation Agreement
We and Total have entered into an Affiliation Agreement that governs the relationship between Total and us
(the ‘‘Affiliation Agreement’’). Until the expiration of a standstill period specified in the Affiliation Agreement
(the ‘‘Standstill Period’’), and subject to certain exceptions, Total, Total S.A., and any of their respective affiliates and
certain other related parties (collectively, the ‘‘Total Group’’) may not effect, seek, or enter into discussions with any
third party regarding any transaction that would result in the Total Group beneficially owning our shares in excess
of certain thresholds, or request us or our independent directors, officers or employees, to amend or waive any of the
standstill restrictions applicable to the Total Group. The Standstill Period ends when Total holds less than 15%
ownership of us.
The Affiliation Agreement imposes certain limitations on the Total Group’s ability to seek to effect a tender offer
or merger to acquire 100% of the outstanding voting power of us and imposes certain limitations on the Total Group’s
ability to transfer 40% or more of the outstanding shares or voting power of us to a single person or group that is
not a direct or indirect subsidiary of Total S.A. During the Standstill Period, no member of the Total Group may,
among other things, solicit proxies or become a participant in an election contest relating to the election of directors
to our Board of Directors.
The Affiliation Agreement provides Total with the right to maintain its percentage ownership in connection with
any new securities issued by us, and Total may also purchase shares on the open market or in private transactions
with disinterested stockholders, subject in each case to certain restrictions.
The Affiliation Agreement also imposes certain restrictions with respect to the ability of us and our Board of
Directors to take certain actions, including specifying certain actions that require approval by the directors other than
the directors appointed by Total and other actions that require stockholder approval by Total.
Upfront Warrant
In February 2012, we issued a warrant (the ‘‘Upfront Warrant’’) to Total S.A. to purchase 9,531,677 shares of
our common stock with an exercise price of $7.8685, subject to adjustment for customary anti-dilution and other
events. The Upfront Warrant, which was governed by a Private Placement Agreement and a Compensation and
Funding Agreement, dated February 28, 2012, as amended, was exercisable at any time for seven years after its
issuance, provided that, so long as at least $25.0 million in aggregate of our convertible debt remains outstanding,
such exercise would not cause any ‘‘person,’’ including Total S.A., to, directly or indirectly, including through one
or more wholly-owned subsidiaries, become the ‘‘beneficial owner’’ (as such terms are defined in Rule 13d-3 and
Rule 13d-5 under the Securities Exchange Act of 1934, as amended) (the ‘‘Exchange Act’’), of more than 74.99%
111

of the voting power of our common stock at such time, a circumstance which would trigger the repurchase or
conversion of our existing convertible debt. The Upfront Warrant expired by its terms on February 27, 2019.
0.875% Debentures Due 2021
In June 2014, we issued $400.0 million in principal amount of our 0.875% senior convertible debentures due
2021 (the ‘‘0.875% debentures due 2021’’). An aggregate principal amount of $250.0 million of the 0.875%
debentures due 2021 were acquired by Total. The 0.875% debentures due 2021 are convertible into shares of our
common stock at any time based on an initial conversion price equal to $48.76 per share, which provides Total the
right to acquire up to 5,126,775 shares of our common stock. The applicable conversion rate may adjust in certain
circumstances, including a fundamental change, as described in the indenture governing the 0.875% debentures due
2021.
4.00% Debentures Due 2023
In December 2015, we issued $425.0 million in principal amount of our 4.00% senior convertible debentures
due 2023 (the ‘‘4.00% debentures due 2023’’). An aggregate principal amount of $100.0 million of the 4.00%
debentures due 2023 were acquired by Total. The 4.00% debentures due 2023 are convertible into shares of our
common stock at any time based on an initial conversion price equal to $30.53 per share, which provides Total the
right to acquire up to 3,275,680 shares of our common stock. The applicable conversion rate may adjust in certain
circumstances, including a fundamental change, as described in the indenture governing the 4.00% debentures due
2023.
Joint Solar Projects with Total and its Affiliates
We enter into various EPC and O&M agreements relating to solar projects, including EPC and O&M agreements
relating to projects owned or partially owned by Total and its affiliates. As of December 29, 2019, we had an
insignificant amount of ‘‘Contract assets’’ and $6.7 million which consisted of ‘‘Accounts receivable, net’’ and
‘‘Prepaid expenses and other current assets’’ on our consolidated balance sheets related to projects in which Total and
its affiliates have a direct or indirect material interest.
During fiscal 2018, in connection with a co-development solar project in Japan among us, Total, and an
independent third party, we sold 25% of ownership interests in the co-development solar project to Total, for an
immaterial amount of proceeds. We sold the remaining 25% of ownership interest to Total in the three months ended
September 29, 2019, for proceeds of $4.6 million, and recognized a gain of $2.9 million, which is included within
‘‘other, net’’ in our consolidated statements of operations for fiscal 2019. Development service revenue of
$6.4 million was also recognized during fiscal 2019. We have also agreed to supply solar panels under this
arrangement with sales beginning in October 2019 and expected to occur through November 2020 and recognized
revenue consistent with our revenue recognition policy from solar power components.
In connection with a co-development solar project in Chile between us and Total, we sold all of our 50%
ownership interests in the co-development project to Total in fiscal 2019, for proceeds of $14.1 million, and
recognized a gain of $11.0 million, which is included within ‘‘other, net’’ in our consolidated statements of operations
for fiscal 2019. In connection with its assistance in obtaining a solar module supply related to this project, we incurred
charges of $4.9 million that will be paid directly to Total in fiscal 2020.
112

Related-Party Transactions with Total and its Affiliates:
The following related-party balances and amounts are associated with transactions entered into with Total and
its Affiliates. Refer to Note 10. Equity Investments for related-party transactions with unconsolidated entities in which
we have a direct equity investment.
As of
(In thousands)December 29,
2019December 30,
2018
Accounts receivable and other . . . . . . . . . . . . . . . . . . . . . . . . . . . . . . . . . . . . . . . . . . $ 6,707 $ 3,823Contract assets . . . . . . . . . . . . . . . . . . . . . . . . . . . . . . . . . . . . . . . . . . . . . . . . . . . . . . . 110 18Accounts payable . . . . . . . . . . . . . . . . . . . . . . . . . . . . . . . . . . . . . . . . . . . . . . . . . . . . . 4,921 —Contract liabilities, current portion1 . . . . . . . . . . . . . . . . . . . . . . . . . . . . . . . . . . . . . . 18,786 18,408Contract liabilities, net of current portion1 . . . . . . . . . . . . . . . . . . . . . . . . . . . . . . . . . 35,427 45,258
1 Refer to Note 9. Commitments and Contingencies - Advances from Customers.
Fiscal Year Ended
(In thousands)December 29,
2019December 30,
2018December 31,
2017
Revenue:Solar power systems, components, and other . . . . . . . . . . . . . . . . . . . . . $48,064 $28,094 $42,968
Cost of revenue:Solar power systems, components, and other . . . . . . . . . . . . . . . . . . . . . 33,320 16,382 30,400
Other income:Other, net . . . . . . . . . . . . . . . . . . . . . . . . . . . . . . . . . . . . . . . . . . . . . . . . . . 13,941 — —
Research and development expense:Offsetting contributions received under the R&D Agreement . . . . . . . . — (93) (138)
Interest expense:Guarantee fees incurred under the Credit Support Agreement . . . . . . . . 329 5,312 6,325Interest expense incurred on the 0.75% debentures due 2018 . . . . . . . . — 547 1,500Interest expense incurred on the 0.875% debentures due 2021 . . . . . . . 2,188 2,188 2,188Interest expense incurred on the 4.00% debentures due 2023 . . . . . . . . 4,000 4,000 4,000
Note 3. REVENUE FROM CONTRACTS WITH CUSTOMERS
Disaggregation of Revenue
The following tables represent disaggregated revenue from contracts with customers for fiscal 2019, 2018, and
2017 along with the reportable segment for each category:
Fiscal Year Ended
(In thousands) SunPower Technologies SunPower Energy Services Total Revenue
CategoryDecember29, 2019
December30, 2018
December31, 2017
December29, 2019
December30, 2018
December31, 2017
December29, 2019
December30, 2018
December31, 2017
Module and componentsales . . . . . . . . . . . . $415,081 $532,590 $408,303 $ 617,456 $ 477,652 $428,799 $1,032,537 $1,010,242 $ 837,102
Solar power systemssales and EPCservices . . . . . . . . . . 429,282 147,756 470,851 323,740 213,345 211,850 753,022 361,101 682,701
Operations andmaintenance . . . . . . . — — — 49,590 49,089 43,643 49,590 49,089 43,643
Residential leasing. . . . . — 125 4,687 10,405 305,528 225,914 10,405 305,653 230,601
Solar services1 . . . . . . . — — — 18,671 — — 18,671 — —
Revenue . . . . . . . . . $844,363 $680,471 $883,841 $1,019,862 $1,045,614 $910,206 $1,864,225 $1,726,085 $1,794,047
1 Upon adoption of ASC 842, revenues from residential leasing are being accounted for under ASC 606 and recorded under ’Solar services’(see Note 1)
We recognize revenue for sales of modules and components at the point that control transfers to the customer,
which typically occurs upon shipment or delivery to the customer, depending on the terms of the contract, and we
recognize revenue for operations and maintenance and solar services over the service period.
113

For EPC revenue and solar power systems sales, we commence recognizing revenue when control of the
underlying system transfers to the customer and continue recognizing revenue over time as work is performed based
on the ratio of costs incurred to date to the total estimated costs at completion of the performance obligations.
Judgment is required to evaluate assumptions including the amount of net contract revenues and the total
estimated costs to determine our progress towards contract completion and to calculate the corresponding amount of
revenue to recognize. If estimated total costs on any contract are greater than the net contract revenues, we recognize
the entire estimated loss in the period the loss becomes known. For contracts with post-installation systems
monitoring and maintenance, we recognize revenue related to systems monitoring and maintenance over the
non-cancellable contract term on a straight-line basis.
Changes in estimates for EPC services occur for a variety of reasons, including but not limited to (i) construction
plan accelerations or delays, (ii) product cost forecast changes, (iii) change orders, or (iv) changes in other
information used to estimate costs. Changes in estimates may have a material effect in our consolidated statements
of operations. The table below outlines the impact on revenue of net changes in estimated transaction prices and input
costs for systems related sales contracts (both increases and decreases) for the years ended December 29, 2019 and
December 30, 2018 as well as the number of projects that comprise such changes. For purposes of the following table,
only projects with changes in estimates that have an impact on revenue and or cost of at least $1.0 million during
the periods were presented. Also, included in the table is the net change in estimate as a percentage of the aggregate
revenue for such projects.
Fiscal Year Ended
(In thousands, except number of projects)December 29,
2019December 30,
2018December 31,
2017
Increase in revenue from net changes in transaction prices. . . . . . . . . . . . . . . $ 5,391 $ — $—
Increase (decrease) in revenue from net changes in input cost estimates . . . . 6,233 (1,045) —
Net increase (decrease) in revenue from net changes in estimates . . . . . . . $11,624 $(1,045) $—
Number of projects. . . . . . . . . . . . . . . . . . . . . . . . . . . . . . . . . . . . . . . . . . . . . . . 5 1 —
Net change in estimate as a percentage of aggregate revenue for associated
projects . . . . . . . . . . . . . . . . . . . . . . . . . . . . . . . . . . . . . . . . . . . . . . . . . . . . . . 11.6% —% —%
Contract Assets and Liabilities
Contract assets consist of (i) retainage which represents the earned, but unbilled, portion of a construction and
development project for which payment is deferred by the customer until certain contractual milestones are met; and
(ii) unbilled receivables which represent revenue that has been recognized in advance of billing the customer, which
is common for long-term construction contracts. Contract liabilities consist of deferred revenue and customer
advances, which represent consideration received from a customer prior to transferring control of goods or services
to the customer under the terms of a sales contract. Refer to Note 5. Balance Sheet Components for further details.
During the year ended December 29, 2019, the increase in contract assets of $38.2 million was primarily driven
by unbilled receivables for the sale of PPAs for $31.2 million in fiscal 2019 and commercial projects where certain
milestones had not yet been reached, but the criteria for revenue had been met. During the year ended December 30,
2018, the increase in contract assets of $43.5 million was primarily driven by unbilled receivables for commercial
projects where certain milestones had not yet been reached, but the criteria to recognize revenue had been met.
During the year ended December 29, 2019, the increase in contract liabilities of $2.3 million was primarily due to
addition of customer advances. During the year ended December 30, 2018, the decrease in contract liabilities of
$31.5 million was primarily due to the attainment of milestones billings for a variety of projects. During the year
ended December 29, 2019, we recognized revenue of $59.6 million that was included in contract liabilities as of
December 30, 2018. During the year ended December 30, 2018, we recognized revenue of $94.4 million that was
included in contract liabilities as of December 31, 2017.
The following table represents our remaining performance obligations as of December 29, 2019 for EPC
agreements for projects that we are constructing or expect to construct. We expect to recognize $176.4 million of
revenue upon transfer of control of the projects.
114

Project Revenue Category
EPCContract/Partner
DevelopedProject
Expected YearRevenue
Recognition WillBe Completed
Percentage ofRevenue
Recognized1
Various Distribution Generation
Projects . . . . . . . . . . . . . . . . . . . . . . .
Solar power systems sales
and EPC services Various 2020 72.3%
1 Denotes average percentage of revenue recognized.
As of December 29, 2019, we have entered into contracts with customers for sales of modules and components
for an aggregate transaction price of $450.1 million, the substantial majority of which we expect to recognize over
the next 12 months.
Note 4. BUSINESS DIVESTITURE AND SALE OF ASSETS
Sale of Residential Lease Assets
In fiscal 2018, we created SunStrong Capital Holdings, LLC (‘‘SunStrong’’) to own and operate a portion of our
residential lease assets and subsequently contributed to SunStrong our controlling equity interests in a number of
solar project entities that we controlled. As previously disclosed, on November 5, 2018, we entered into a Purchase
and Sale agreement (the ‘‘PSA’’) with HA SunStrong Capital LLC (‘‘HA SunStrong Parent’’), a subsidiary of Hannon
Armstrong Sustainable Infrastructure Capital, Inc (‘‘Hannon Armstrong’’), to sell 49.0% of the SunStrong
membership interests. Following the closing of the PSA, we do not have the power to unilaterally make decisions
that affect the performance of SunStrong, and accordingly, we deconsolidated SunStrong, thereby deconsolidating
majority of our residential lease assets portfolio. On September 27, 2019, we sold the majority of the remainder of
residential lease assets still owned by us, that were not previously sold. Refer to Note 6 for discussion of the
remainder of residential lease assets still owned by us. These residential lease assets were sold under a new
assignment of interest agreement entered into with SunStrong. SunStrong also assumed debts related to the residential
lease assets sold.
On April 12, 2019, SunStrong Capital Acquisition 3, LLC, our wholly-owned subsidiary (‘‘Mezzanine Loan 3
Borrower’’), and SunStrong Capital Lender 3 LLC, a wholly-owned subsidiary of Hannon Armstrong, entered into
a mezzanine loan agreement under which Mezzanine Loan 3 Borrower borrowed a subordinated, mezzanine loan of
$37.3 million (the ‘‘Mezzanine Loan 3’’). As of September 27, 2019, we have drawn $27.3 million under the
Mezzanine Loan 3. As part of the Transaction, SunStrong assumed all current and future debt service obligations
associated with Mezzanine Loan 3. The assumption of such debt, although a non-cash transaction for us, was
considered as future proceeds receivable, and reflected in the determination of the loss recognized upon
deconsolidation.
Borrowed Sunshine II, LLC, (‘‘CA Loan Borrower’’), our wholly-owned subsidiary, entered into a loan
agreement with Credit Agricole on January 31, 2019 under which the CA Loan Borrower may borrow a subordinated
loan of up to $55.0 million (the ‘‘CA warehouse loan’’). As of September 27, 2019, we had drawn $46.1 million under
the CA warehouse loan.
Tax-equity investors are required to make contributions to the solar project companies upon achievement of
certain condition precedents. Contributions of approximately $6.7 million distributed to us as the developer of the
Residential Lease Portfolio represent additional consideration related to residential lease assets for which we will
provide construction services after the close of the Transaction. In addition, we are eligible to receive $2.1 million
as a special distribution from SunStrong for transferring our rights to the future solar renewable energy credits
(‘‘SREC’’) associated with the residential lease assets. The tax-equity investor contribution and the special SREC
distribution was reflected in the determination of the loss recognized upon deconsolidation of residential lease
portfolio.
In December 2019, we entered into an arrangement with Hannon Armstrong to sell our rights over incremental
proceeds resulting from refinancing of certain debts that were transferred to SunStrong. We received a consideration
of $2.0 million from this transaction. Further, during the fourth quarter of fiscal 2019, we recorded an adjustment of
$1.3 million resulting from realization of estimated receivables recorded at the time of completion of the sale in
September 2019. These transactions collectively resulted in a gain on sale of $3.3 million in fourth quarter of fiscal
2019. Inclusive of these items, we recognized a $7.2 million net loss on the sale within ‘‘Loss on sale and impairment
of residential lease assets’’ in our consolidated statements of operations during fiscal year 2019.
115

Summarized financial information related to the transferred Residential Lease Portfolio on the disposal date is
as follows:
(In thousands)At Disposal
Date
Cash and cash equivalents . . . . . . . . . . . . . . . . . . . . . . . . . . . . . . . . . . . . . . . . . . . . . . . . . . . . . . . . . . . . $ 634
Restricted cash and cash equivalents, current portion . . . . . . . . . . . . . . . . . . . . . . . . . . . . . . . . . . . . . . 11,058
Accounts receivable, net. . . . . . . . . . . . . . . . . . . . . . . . . . . . . . . . . . . . . . . . . . . . . . . . . . . . . . . . . . . . . . 1,239
Restricted cash and cash equivalents, net of current portion . . . . . . . . . . . . . . . . . . . . . . . . . . . . . . . . . 4,706
Property, plant and equipment, net . . . . . . . . . . . . . . . . . . . . . . . . . . . . . . . . . . . . . . . . . . . . . . . . . . . . . 84,208
Solar power systems, leased, net . . . . . . . . . . . . . . . . . . . . . . . . . . . . . . . . . . . . . . . . . . . . . . . . . . . . . . . 12,261
Long-term financing receivables net . . . . . . . . . . . . . . . . . . . . . . . . . . . . . . . . . . . . . . . . . . . . . . . . . . . . 17,907
Other long-term assets . . . . . . . . . . . . . . . . . . . . . . . . . . . . . . . . . . . . . . . . . . . . . . . . . . . . . . . . . . . . . . . 5,960
Total assets . . . . . . . . . . . . . . . . . . . . . . . . . . . . . . . . . . . . . . . . . . . . . . . . . . . . . . . . . . . . . . . . . . . . . . 137,973
Accounts payable . . . . . . . . . . . . . . . . . . . . . . . . . . . . . . . . . . . . . . . . . . . . . . . . . . . . . . . . . . . . . . . . . . . 1,236
Accrued liabilities and other current liabilities . . . . . . . . . . . . . . . . . . . . . . . . . . . . . . . . . . . . . . . . . . . . 34
Contract liabilities, current portion . . . . . . . . . . . . . . . . . . . . . . . . . . . . . . . . . . . . . . . . . . . . . . . . . . . . . 163
Contract liabilities, net of current portion . . . . . . . . . . . . . . . . . . . . . . . . . . . . . . . . . . . . . . . . . . . . . . . . 3,024
Short-term debt . . . . . . . . . . . . . . . . . . . . . . . . . . . . . . . . . . . . . . . . . . . . . . . . . . . . . . . . . . . . . . . . . . . . . 1,085
Long-term debt . . . . . . . . . . . . . . . . . . . . . . . . . . . . . . . . . . . . . . . . . . . . . . . . . . . . . . . . . . . . . . . . . . . . . 44,246
Other long-term liabilities . . . . . . . . . . . . . . . . . . . . . . . . . . . . . . . . . . . . . . . . . . . . . . . . . . . . . . . . . . . . 1,809
Noncontrolling interests in subsidiaries . . . . . . . . . . . . . . . . . . . . . . . . . . . . . . . . . . . . . . . . . . . . . . . . . . 51,834
Total liabilities . . . . . . . . . . . . . . . . . . . . . . . . . . . . . . . . . . . . . . . . . . . . . . . . . . . . . . . . . . . . . . . . . . . 103,431
Net assets . . . . . . . . . . . . . . . . . . . . . . . . . . . . . . . . . . . . . . . . . . . . . . . . . . . . . . . . . . . . . . . . . . . . . . . . . $ 34,542
Net consideration recognized was as follows:
(In thousands)
Assumption of Mezzanine Loan 3. . . . . . . . . . . . . . . . . . . . . . . . . . . . . . . . . . . . . . . . . . . . . . . . . . . . . . $23,744
Special distribution from Mezzanine 3 and Credit Agricole Loans . . . . . . . . . . . . . . . . . . . . . . . . . . . . 5,897
Accounts receivable from SunStrong Capital Holdings (‘‘SSCH’’) for SREC distributions . . . . . . . . 2,146
Other costs and expenses . . . . . . . . . . . . . . . . . . . . . . . . . . . . . . . . . . . . . . . . . . . . . . . . . . . . . . . . . . . . . (254)
Net consideration recognized . . . . . . . . . . . . . . . . . . . . . . . . . . . . . . . . . . . . . . . . . . . . . . . . . . . . . . . . $31,533
Net loss on sale for the year ended December 29, 2019 was as follows:
(In thousands)
Net consideration recognized . . . . . . . . . . . . . . . . . . . . . . . . . . . . . . . . . . . . . . . . . . . . . . . . . . . . . . . . . . $ 31,533
Net assets disposed . . . . . . . . . . . . . . . . . . . . . . . . . . . . . . . . . . . . . . . . . . . . . . . . . . . . . . . . . . . . . . . . . . (34,542)
Warranty obligations incurred . . . . . . . . . . . . . . . . . . . . . . . . . . . . . . . . . . . . . . . . . . . . . . . . . . . . . . . . . (870)
Obligations to complete leases under construction . . . . . . . . . . . . . . . . . . . . . . . . . . . . . . . . . . . . . . . . . (6,650)
Other items . . . . . . . . . . . . . . . . . . . . . . . . . . . . . . . . . . . . . . . . . . . . . . . . . . . . . . . . . . . . . . . . . . . . . . . . 3,286
Net loss on sale . . . . . . . . . . . . . . . . . . . . . . . . . . . . . . . . . . . . . . . . . . . . . . . . . . . . . . . . . . . . . . . . . . $ (7,243)
Sale and Leaseback of Hillsboro Facility
In September 2019, we completed the sale of our manufacturing facility buildings and land in Hillsboro, Oregon,
to RagingWire Data Centers, Inc., through an affiliate, for a purchase price of $63.5 million (the ‘‘Sale-Leaseback
Transaction’’). As part of the Sale-Leaseback Transaction, we also leased back a portion of the facility, specifically,
the module assembly building, for three years. Further, we also agreed to complete the decommissioning services in
the building, which was completed in in the fourth quarter of fiscal 2019.
116

Net cash consideration of $39.7 million was received at the closing, net of fees and expenses of $3.8 million,
and a holdback amount of $20.0 million for timely completion of the decommissioning services. The holdback
amount of $20.0 million was received in full in the fourth quarter of fiscal 2019.
In accounting for this transaction, we applied the guidance in ASC 610-20, Derecognition of nonfinancial assets
and in-substance nonfinancial assets, which directs us to apply the guidance in ASC 606 Revenue from contracts with
customers, for recognition and measurement. In accordance with the guidance, sale of the building and provision of
decommissioning services were considered distinct performance obligations and total consideration was allocated to
these performance obligations based on their respective standalone selling prices.
During the fiscal year, we recognized net gain of $25.2 million, which is included within ‘‘cost of revenue:
solar power systems, components, and other’’ on our consolidated statements of operations for the year ended
December 29, 2019. As of December 29, 2019, we have a deferred gain of $3.8 million that represents the excess
of fair market value of the building leased back to be recognized over the leaseback term of three years.
Sale of Commercial Sale-Leaseback Portfolio
We entered into sale-leaseback arrangements under which solar power systems were sold to third parties and
subsequently leased back by us over lease terms of up to 25 years. Separately, we entered into sales of energy under
power purchase agreements (‘‘PPAs’’) with end customers, who host the leased solar power systems and buy the
electricity directly from us under PPAs with terms of up to 25 years. At the end of the lease term, we have the option
to purchase the systems at fair value or may be required to remove the systems and return them to the third parties.
On March 26, 2019, we and our wholly-owned subsidiary entered into a Membership Interest Purchase and Sale
Agreement (the ‘‘Purchase and Sale Agreement’’) with a wholly-owned subsidiary of Goldman Sachs Renewable
Power LLC. Pursuant to the Purchase and Sale Agreement, we agreed to sell, in exchange for cash consideration of
up to $86.9 million, membership interests owned by us in certain holding company subsidiaries (the ‘‘HoldCos’’)
that, in turn, own, directly or indirectly, the membership interests in one or more limited liability companies
(together with other related subsidiaries, the ‘‘Related Subsidiaries’’) that own leasehold interests in operating solar
photovoltaic electric generating projects (the ‘‘Projects’’) subject to sale-leaseback financing arrangements with one
or more financiers (each a ‘‘Lessor’’). The Projects are located at approximately 200 sites across the United States,
and represent in aggregate, approximately 233 MW of generating capacity. The portfolio of Projects financed by each
Lessor represents a separate asset (a ‘‘Portfolio’’) for which the price is separately agreed and stated in the Purchase
and Sale Agreement. Upon the sale of the applicable membership interests, the related assets were deconsolidated
from our balance sheet.
In connection with the sale transaction, we received total consideration of $81.3 million and recognized a total
gain of $143.4 million, which is included within ‘‘Gain on business divestitures’’ in our consolidated statements of
operations for the year ended December 29, 2019. We have also incurred approximately $1.2 million of transaction
costs related to the above transactions during fiscal 2019, which were expensed as incurred.
117

The assets and liabilities of the portfolios sold were as follows:
(In thousands)At Disposal
Date
Restricted cash and cash equivalents, current portion . . . . . . . . . . . . . . . . . . . . . . . . . . . . . . . . . . . . . . $ 43,641
Accounts receivable, net. . . . . . . . . . . . . . . . . . . . . . . . . . . . . . . . . . . . . . . . . . . . . . . . . . . . . . . . . . . . . . 7,959
Prepaid expenses and other current assets. . . . . . . . . . . . . . . . . . . . . . . . . . . . . . . . . . . . . . . . . . . . . . . . 957
Restricted cash and cash equivalents, net of current portion . . . . . . . . . . . . . . . . . . . . . . . . . . . . . . . . . 1,746
Operating lease right-of-use assets. . . . . . . . . . . . . . . . . . . . . . . . . . . . . . . . . . . . . . . . . . . . . . . . . . . . . . 46,109
Property, plant and equipment . . . . . . . . . . . . . . . . . . . . . . . . . . . . . . . . . . . . . . . . . . . . . . . . . . . . . . . . . 477,816
Total assets . . . . . . . . . . . . . . . . . . . . . . . . . . . . . . . . . . . . . . . . . . . . . . . . . . . . . . . . . . . . . . . . . . . . . . 578,228
Accounts payable . . . . . . . . . . . . . . . . . . . . . . . . . . . . . . . . . . . . . . . . . . . . . . . . . . . . . . . . . . . . . . . . . . . 1,071
Accrued Liabilities . . . . . . . . . . . . . . . . . . . . . . . . . . . . . . . . . . . . . . . . . . . . . . . . . . . . . . . . . . . . . . . . . . 1,641
Operating lease liabilities, current . . . . . . . . . . . . . . . . . . . . . . . . . . . . . . . . . . . . . . . . . . . . . . . . . . . . . . 2,443
Operating lease liabilities, non-current . . . . . . . . . . . . . . . . . . . . . . . . . . . . . . . . . . . . . . . . . . . . . . . . . . 38,803
Other long-term liabilities1. . . . . . . . . . . . . . . . . . . . . . . . . . . . . . . . . . . . . . . . . . . . . . . . . . . . . . . . . . . . 600,675
Total liabilities . . . . . . . . . . . . . . . . . . . . . . . . . . . . . . . . . . . . . . . . . . . . . . . . . . . . . . . . . . . . . . . . . . . 644,633
Net liabilities sold. . . . . . . . . . . . . . . . . . . . . . . . . . . . . . . . . . . . . . . . . . . . . . . . . . . . . . . . . . . . . . . . . . . $ (66,405)
1 Constitutes the financing liability on sale-lease arrangements on the property, plant and equipment sold.
Net gain on sale is presented in the following table:
Twelve MonthsEnded
(In thousands)December 29,
2019
Cash received from sale . . . . . . . . . . . . . . . . . . . . . . . . . . . . . . . . . . . . . . . . . . . . . . . . . . . . . . . . . . . . . . $ 81,262
Other intangible assets . . . . . . . . . . . . . . . . . . . . . . . . . . . . . . . . . . . . . . . . . . . . . . . . . . . . . . . . . . . . . . . 3,000
Net liabilities sold. . . . . . . . . . . . . . . . . . . . . . . . . . . . . . . . . . . . . . . . . . . . . . . . . . . . . . . . . . . . . . . . . . . 66,405
Holdback receivables . . . . . . . . . . . . . . . . . . . . . . . . . . . . . . . . . . . . . . . . . . . . . . . . . . . . . . . . . . . . . . . . 2,425
Net retained obligations . . . . . . . . . . . . . . . . . . . . . . . . . . . . . . . . . . . . . . . . . . . . . . . . . . . . . . . . . . . . . . (9,692)
Net gain on sale . . . . . . . . . . . . . . . . . . . . . . . . . . . . . . . . . . . . . . . . . . . . . . . . . . . . . . . . . . . . . . . . . . $143,400
Note 5. BALANCE SHEET COMPONENTS
Accounts Receivable, Net
As of
(In thousands)December 29,
2019December 30,
2018
Accounts receivable, gross1. . . . . . . . . . . . . . . . . . . . . . . . . . . . . . . . . . . . . . . . . . . . . $247,258 $193,980
Less: allowance for doubtful accounts . . . . . . . . . . . . . . . . . . . . . . . . . . . . . . . . . . . . (19,975) (16,906)
Less: allowance for sales returns . . . . . . . . . . . . . . . . . . . . . . . . . . . . . . . . . . . . . . . . (807) (1,469)
Accounts receivable, net . . . . . . . . . . . . . . . . . . . . . . . . . . . . . . . . . . . . . . . . . . . . . $226,476 $175,605
1 There is a lien on our accounts receivable of $75.4 million out of our consolidated accounts receivable, gross, as of December 29, 2019 in
connection with a Loan and Security Agreement entered into on March 29, 2019. See Note 11. Debt and Credit Sources.
118

(In thousands)
Balance atBeginning of
Period
Charges(Releases) toExpenses /Revenues
Additions(Deductions)
Balance atEnd
of Period
Allowance for doubtful accounts:Year ended December 29, 2019 . . . . . . . . . . . . . . . . . . . . . . . . . $16,906 1,024 $ 2,045 $19,975Year ended December 30, 2018 . . . . . . . . . . . . . . . . . . . . . . . . . 28,895 12,519 (24,508) 16,906Year ended December 31, 2017 . . . . . . . . . . . . . . . . . . . . . . . . . 20,380 15,609 (7,094) 28,895
Allowance for sales returns:Year ended December 29, 2019 . . . . . . . . . . . . . . . . . . . . . . . . . 1,469 (662) — 807Year ended December 30, 2018 . . . . . . . . . . . . . . . . . . . . . . . . . 1,974 (505) — 1,469Year ended December 31, 2017 . . . . . . . . . . . . . . . . . . . . . . . . . 2,433 (459) — 1,974
Accounts Receivable Factoring
In December 2018 and May 2019, we entered into factoring arrangements with two separate third-party factor
agencies related to our accounts receivable from customers in Europe. As a result of these factoring arrangements,
title of certain accounts receivable balances was transferred to third-party vendors, and both arrangements were
accounted for as a sale of financial assets, under ASU 2014-11 Transfer and Servicing (Topic 860), given effective
control over these financial assets has been surrendered. As a result, these financial assets have been excluded from
our consolidated balance sheets.
During the year ended December 29, 2019 and December 30, 2018, we sold accounts receivable invoices
amounting to $119.4 million and $26.3 million, respectively. As of December 29, 2019 and December 30, 2018, total
uncollected accounts receivable from end customers under both arrangements were $11.6 million and $21.0 million,
respectively. Transaction fees incurred for these arrangements were not material during the year ended December 29,
2019.
Inventories
As of
(In thousands)December 29,
2019December 30,
2018
Raw materials. . . . . . . . . . . . . . . . . . . . . . . . . . . . . . . . . . . . . . . . . . . . . . . . . . . . . . . . $ 54,936 $ 58,378Work-in-process . . . . . . . . . . . . . . . . . . . . . . . . . . . . . . . . . . . . . . . . . . . . . . . . . . . . . . 62,993 86,639Finished goods . . . . . . . . . . . . . . . . . . . . . . . . . . . . . . . . . . . . . . . . . . . . . . . . . . . . . . . 240,328 163,129
Inventories1 2 . . . . . . . . . . . . . . . . . . . . . . . . . . . . . . . . . . . . . . . . . . . . . . . . . . . . . . $358,257 $308,146
1 A lien of $37.1 million exists on our gross inventory as of December 29, 2019 in connection with a Loan and Security Agreement enteredinto on March 29, 2019. See Note 11. Debt and Credit Sources.
2 Also refer to long-term inventory for Safe Harbor program under the caption ‘‘Other long-term assets’’
Prepaid Expenses and Other Current Assets
As of
(In thousands)December 29,
2019December 30,
2018
Deferred project costs . . . . . . . . . . . . . . . . . . . . . . . . . . . . . . . . . . . . . . . . . . . . . . . . . $ 29,652 $ 30,394VAT receivables, current portion. . . . . . . . . . . . . . . . . . . . . . . . . . . . . . . . . . . . . . . . . 7,986 9,506Deferred costs for solar power systems . . . . . . . . . . . . . . . . . . . . . . . . . . . . . . . . . . . 29,631 17,805Derivative financial instruments . . . . . . . . . . . . . . . . . . . . . . . . . . . . . . . . . . . . . . . . . 1,002 729Other receivables . . . . . . . . . . . . . . . . . . . . . . . . . . . . . . . . . . . . . . . . . . . . . . . . . . . . . 37,140 48,062Prepaid taxes . . . . . . . . . . . . . . . . . . . . . . . . . . . . . . . . . . . . . . . . . . . . . . . . . . . . . . . . 718 853Other current assets . . . . . . . . . . . . . . . . . . . . . . . . . . . . . . . . . . . . . . . . . . . . . . . . . . . 411 —Other prepaid expenses . . . . . . . . . . . . . . . . . . . . . . . . . . . . . . . . . . . . . . . . . . . . . . . . 14,704 23,834
Prepaid expenses and other current assets . . . . . . . . . . . . . . . . . . . . . . . . . . . . . . . $121,244 $131,183
119

Property, Plant and Equipment, Net
As of
(In thousands)December 29,
2019December 30,
2018
Manufacturing equipment . . . . . . . . . . . . . . . . . . . . . . . . . . . . . . . . . . . . . . . . . . . . . . $ 144,614 $ 112,904
Land and buildings . . . . . . . . . . . . . . . . . . . . . . . . . . . . . . . . . . . . . . . . . . . . . . . . . . . 137,723 161,299
Leasehold improvements . . . . . . . . . . . . . . . . . . . . . . . . . . . . . . . . . . . . . . . . . . . . . . . 103,393 119,597
Solar power systems1. . . . . . . . . . . . . . . . . . . . . . . . . . . . . . . . . . . . . . . . . . . . . . . . . . 30,518 544,139
Computer equipment . . . . . . . . . . . . . . . . . . . . . . . . . . . . . . . . . . . . . . . . . . . . . . . . . . 93,312 98,274
Furniture and fixtures . . . . . . . . . . . . . . . . . . . . . . . . . . . . . . . . . . . . . . . . . . . . . . . . . 9,471 10,594
Construction-in-process . . . . . . . . . . . . . . . . . . . . . . . . . . . . . . . . . . . . . . . . . . . . . . . . 15,730 9,678
Property, plant and equipment, gross . . . . . . . . . . . . . . . . . . . . . . . . . . . . . . . . . . . 534,761 1,056,485
Less: accumulated depreciation. . . . . . . . . . . . . . . . . . . . . . . . . . . . . . . . . . . . . . . . . . (211,035) (216,614)
Property, plant and equipment, net . . . . . . . . . . . . . . . . . . . . . . . . . . . . . . . . . . . . . $ 323,726 $ 839,871
1 As a result of the adoption of ASC 842, all of our residential lease arrangements entered into on or after December 31, 2018 are excluded
from the scope of the lease accounting guidance and are accounted for as service contracts in accordance with ASC 606. The related assets
are recorded as ‘‘solar power systems’’ within ‘‘Property, plant and equipment, net’’ as of December 29, 2019.
Property, Plant and Equipment, Net, by Geography
As of
(In thousands)December 29,
2019December 30,
2018
United States . . . . . . . . . . . . . . . . . . . . . . . . . . . . . . . . . . . . . . . . . . . . . . . . . . . . . . . . $ 56,507 $575,451
Philippines . . . . . . . . . . . . . . . . . . . . . . . . . . . . . . . . . . . . . . . . . . . . . . . . . . . . . . . . . . 92,598 104,639
Malaysia . . . . . . . . . . . . . . . . . . . . . . . . . . . . . . . . . . . . . . . . . . . . . . . . . . . . . . . . . . . . 145,246 126,056
Mexico . . . . . . . . . . . . . . . . . . . . . . . . . . . . . . . . . . . . . . . . . . . . . . . . . . . . . . . . . . . . . 18,862 21,566
Europe . . . . . . . . . . . . . . . . . . . . . . . . . . . . . . . . . . . . . . . . . . . . . . . . . . . . . . . . . . . . . 10,469 12,043
Other. . . . . . . . . . . . . . . . . . . . . . . . . . . . . . . . . . . . . . . . . . . . . . . . . . . . . . . . . . . . . . . 44 116
Property, plant and equipment, net, by geography1 . . . . . . . . . . . . . . . . . . . . . . . . $323,726 $839,871
1 Based on the physical location of the assets.
Other Long-term Assets
As of
(In thousands)December 29,
2019December 30,
2018
Equity investments with readily determinable fair value. . . . . . . . . . . . . . . . . . . . . . $173,908 $ 36,225
Equity investments without readily determinable fair value . . . . . . . . . . . . . . . . . . . 8,536 8,810
Equity investments with fair value option . . . . . . . . . . . . . . . . . . . . . . . . . . . . . . . . . 17,500 8,831
Equity method investments . . . . . . . . . . . . . . . . . . . . . . . . . . . . . . . . . . . . . . . . . . . . . 26,658 34,828
Long-term inventory1. . . . . . . . . . . . . . . . . . . . . . . . . . . . . . . . . . . . . . . . . . . . . . . . . . 48,214 —
Other. . . . . . . . . . . . . . . . . . . . . . . . . . . . . . . . . . . . . . . . . . . . . . . . . . . . . . . . . . . . . . . 56,039 73,339
Other long-term assets . . . . . . . . . . . . . . . . . . . . . . . . . . . . . . . . . . . . . . . . . . . . . . . $330,855 $162,033
1 Entire balance consists of finished goods for Solar Sail. Refer to Note 10. Equity Investments for further discussion regarding Solar Sail.
120

Accrued Liabilities
As of
(In thousands)December 29,
2019December 30,
2018
Employee compensation and employee benefits . . . . . . . . . . . . . . . . . . . . . . . . . . . . $ 47,901 $ 44,337
Deferred revenue1 . . . . . . . . . . . . . . . . . . . . . . . . . . . . . . . . . . . . . . . . . . . . . . . . . . . . 767 4,251
Interest payable . . . . . . . . . . . . . . . . . . . . . . . . . . . . . . . . . . . . . . . . . . . . . . . . . . . . . . 10,161 11,786
Short-term warranty reserves. . . . . . . . . . . . . . . . . . . . . . . . . . . . . . . . . . . . . . . . . . . . 30,979 38,161
Restructuring reserve . . . . . . . . . . . . . . . . . . . . . . . . . . . . . . . . . . . . . . . . . . . . . . . . . . 6,601 6,310
VAT payables . . . . . . . . . . . . . . . . . . . . . . . . . . . . . . . . . . . . . . . . . . . . . . . . . . . . . . . . 6,393 8,325
Derivative financial instruments . . . . . . . . . . . . . . . . . . . . . . . . . . . . . . . . . . . . . . . . . 1,962 1,161
Legal expenses . . . . . . . . . . . . . . . . . . . . . . . . . . . . . . . . . . . . . . . . . . . . . . . . . . . . . . . 13,111 12,442
Taxes payable. . . . . . . . . . . . . . . . . . . . . . . . . . . . . . . . . . . . . . . . . . . . . . . . . . . . . . . . 32,191 19,146
Liability due to supply agreement. . . . . . . . . . . . . . . . . . . . . . . . . . . . . . . . . . . . . . . . 28,031 28,045
Other. . . . . . . . . . . . . . . . . . . . . . . . . . . . . . . . . . . . . . . . . . . . . . . . . . . . . . . . . . . . . . . 25,793 61,288
Accrued liabilities . . . . . . . . . . . . . . . . . . . . . . . . . . . . . . . . . . . . . . . . . . . . . . . . . . $203,890 $235,252
1 Consists of advance consideration received from customers under the residential lease program for leases entered into prior to December 31,
2018, which continue to be accounted for in accordance with the superseded lease accounting guidance.
Other Long-term Liabilities
As of
(In thousands)December 29,
2019December 30,
2018
Deferred revenue1 . . . . . . . . . . . . . . . . . . . . . . . . . . . . . . . . . . . . . . . . . . . . . . . . . . . . $ 40,246 $ 55,764
Long-term warranty reserves. . . . . . . . . . . . . . . . . . . . . . . . . . . . . . . . . . . . . . . . . . . . 107,466 134,105
Long-term sale-leaseback financing . . . . . . . . . . . . . . . . . . . . . . . . . . . . . . . . . . . . . . — 583,418
Unrecognized tax benefits . . . . . . . . . . . . . . . . . . . . . . . . . . . . . . . . . . . . . . . . . . . . . . 20,067 16,815
Long-term pension liability . . . . . . . . . . . . . . . . . . . . . . . . . . . . . . . . . . . . . . . . . . . . . 5,897 2,567
Derivative financial instruments . . . . . . . . . . . . . . . . . . . . . . . . . . . . . . . . . . . . . . . . . 373 152
Long-term liability due to supply agreement . . . . . . . . . . . . . . . . . . . . . . . . . . . . . . . — 28,198
Other. . . . . . . . . . . . . . . . . . . . . . . . . . . . . . . . . . . . . . . . . . . . . . . . . . . . . . . . . . . . . . . 30,251 18,117
Other long-term liabilities . . . . . . . . . . . . . . . . . . . . . . . . . . . . . . . . . . . . . . . . . . . . $204,300 $839,136
1 Consists of advance consideration received from customers under the residential lease program for leases entered into prior to December 31,
2018, which continue to be accounted for in accordance with the superseded lease accounting guidance.
Accumulated Other Comprehensive Loss
As of
(In thousands)December 29,
2019December 30,
2018
Cumulative translation adjustment . . . . . . . . . . . . . . . . . . . . . . . . . . . . . . . . . . . . . . . $(12,250) $(11,121)
Net unrealized gain (loss) on derivative financial instruments . . . . . . . . . . . . . . . . . (1,238) (145)
Net gain on long-term pension liability adjustment . . . . . . . . . . . . . . . . . . . . . . . . . . 3,976 7,066
Deferred taxes . . . . . . . . . . . . . . . . . . . . . . . . . . . . . . . . . . . . . . . . . . . . . . . . . . . . . . . — 50
Accumulated other comprehensive loss . . . . . . . . . . . . . . . . . . . . . . . . . . . . . . . . . $ (9,512) $ (4,150)
121

Note 6. SOLAR SERVICES
Upon adoption of ASC 842 on December 31, 2018, all arrangements under our residential lease program entered
into on or after December 31, 2018 are accounted for as contracts with customers in accordance with ASC 606.
The disclosure below relates to the residential lease arrangements entered into before December 31, 2018, which we
continue to retain and are accounted for in accordance with the superseded lease accounting guidance.
Operating Leases
The following table summarizes ‘‘Solar power systems leased and to be leased, net’’ under operating leases on
our consolidated balance sheets as of December 29, 2019 and December 30, 2018:
As of
(In thousands)December 29,
2019December 30,
2018
Solar power systems leased and to be leased, net1:
Solar power systems leased. . . . . . . . . . . . . . . . . . . . . . . . . . . . . . . . . . . . . . . . . . . . . $116,948 $139,343
Solar power systems to be leased . . . . . . . . . . . . . . . . . . . . . . . . . . . . . . . . . . . . . . . . — 12,158
116,948 151,501
Less: accumulated depreciation and impairment2 . . . . . . . . . . . . . . . . . . . . . . . . . . . (62,610) (58,944)
Solar power systems leased and to be leased, net . . . . . . . . . . . . . . . . . . . . . . . . . $ 54,338 $ 92,557
1 Solar power systems leased and to be leased, net, are physically located exclusively in the United States.
2 For the year ended December 29, 2019 and December 30, 2018, we recognized a non-cash impairment charge of $4.0 million and
$74.9 million, respectively, on solar power systems leased and to be leased.
The following table presents our minimum future rental receipts on operating leases placed in service as of
December 29, 2019:
(In thousands)Fiscal2020
Fiscal2021
Fiscal2022
Fiscal2023
Fiscal2024 Thereafter Total
Minimum future rentals on operating
leases placed in service1. . . . . . . . . . . . $735 $590 $593 $595 $598 $8,928 $12,039
1 Does not include contingent rentals that may be received from customers under agreements that include performance-based incentives.
Sales-Type Leases
As of December 29, 2019 and December 30, 2018, our net investment in sales-type leases presented within
‘‘accounts receivable, net’’ and ‘‘long-term financing receivables, net’’ on our consolidated balance sheets was as
follows:
As of
(In thousands)December 29,
2019December 30,
2018
Financing receivables, held for sale:
Minimum lease payments receivable . . . . . . . . . . . . . . . . . . . . . . . . . . . . . . . . . . . . . $ 3,569 $ 43,939
Unguaranteed residual value . . . . . . . . . . . . . . . . . . . . . . . . . . . . . . . . . . . . . . . . . . . . 680 4,450
Unearned income . . . . . . . . . . . . . . . . . . . . . . . . . . . . . . . . . . . . . . . . . . . . . . . . . . . . . (1,393) (8,859)
Allowance for estimated losses . . . . . . . . . . . . . . . . . . . . . . . . . . . . . . . . . . . . . . . . . . (2,856) (18,656)
Net financing receivables, held for sale . . . . . . . . . . . . . . . . . . . . . . . . . . . . . . . . . $ — $ 20,874
Net financing receivables - current, held for sale . . . . . . . . . . . . . . . . . . . . . . . . . $ — $ 1,282
Net financing receivables - non-current, held for sale . . . . . . . . . . . . . . . . . . . . . . $ — $ 19,592
122

As of December 29, 2019, future maturities of net financing receivables for sales-type leases were as follows:
(In thousands)Fiscal2020
Fiscal2021
Fiscal2022
Fiscal2023
Fiscal2024 Thereafter Total
Scheduled maturities of minimum lease
payments receivable1 . . . . . . . . . . . . . . $204 $180 $181 $182 $183 $2,639 $3,569
1 Does not include contingent rentals that may be received from customers under agreements that include performance-based incentives.
Impairment of Residential Lease Assets
On November 5, 2018, we sold 49% of our membership interest in SunStrong, formerly our wholly owned
subsidiary that historically held and controlled the assets and liabilities comprising our residential lease business.
Following the closing, we deconsolidated certain solar project entities that held our residential lease assets and
retained membership units representing a 51% membership interest in SunStrong. Further, on September 27, 2019,
we sold an additional solar project entity that held residential lease assets to SunStrong (Refer Note 4 Business
Divestitures and Sale of Manufacturing Facility).
We continued to retain certain residential lease assets subject to leasing arrangements on our consolidated
balance sheet as of December 29, 2019, primarily relating to leases that are fully self-funded and not financed by tax
equity investors. We expect to sell these to SunStrong in fiscal 2020 and continue to test them for impairment as
described below.
We performed a recoverability test for assets in the residential assets by estimating future undiscounted net cash
flows expected to be generated by the assets, based on our own specific alternative courses of action under
consideration. The alternative courses were either to sell or refinance the assets, or hold the assets until the end of
their previously estimated useful lives. Upon consideration of the alternatives, we determined that market value, in
the form of indicative purchase price from a third-party investor was available for a portion of our residential assets.
As we intend to sell these assets in fiscal 2020, we used the indicative purchase price from a third-party investor as
fair value of the underlying net assets in our impairment evaluation.
In accordance with the impairment evaluation, we recognized a non-cash impairment charge of $28.4 million
included in ‘‘loss on sale and impairment of residential lease assets’’ on the consolidated statement of operations for
the year ended December 29, 2019. We recognized a non-cash impairment charge of $189.7 million as ‘‘loss on sale
and impairment of residential lease assets’’ on the consolidated statement of operations for the year ended
December 30, 2018.
The impairment evaluation requires us to make assumptions and to apply judgment to estimate future cash flows
and assumptions. If actual results are not consistent with our estimates and assumptions used in estimating future cash
flows and asset fair values, and if and when a divestiture transaction occurs, the details and timing of which are
subject to change as the final terms are negotiated between us and the intended purchaser, we may be exposed to
additional impairment charges in the future, which could be material to the results of operations.
Sale of residential lease assets
On July 10, 2018, we created SunStrong to own and operate a portion of our residential lease assets and
subsequently contributed to SunStrong our controlling equity interests in the aforementioned solar project companies.
Further, on November 5, 2018, we entered into the PSA HA SunStrong Parent, a subsidiary of Hannon Armstrong,
to sell 49.0% membership interests in SunStrong for cash proceeds of $10 million. Refer to our annual consolidated
financial statements in Form 10-K for fiscal year ended December 31, 2018 for details of the transaction.
On November 5, 2018, SunStrong Capital Acquisition OF, LLC, a wholly-owned subsidiary of SunStrong
(‘‘Mezzanine Loan 2 Borrower’’), and SunStrong Capital Lender 2, LLC, a subsidiary of Hannon Armstrong, entered
into a loan agreement under which, Mezzanine Loan 2 Borrower may borrow a subordinated, mezzanine loan of up
to $32.0 million (the ‘‘Mezzanine Loan 2’’). The borrowing facilities provided by the Mezzanine Loan 2 were
determined in consideration of the residential lease assets for which we had either completed construction or had the
obligation to complete construction after November 5, 2018.
On May 31, 2019, the Mezzanine Loan 2 agreement was amended to increase the facility size to $49 million.
The change was made based on the revised cash flow projections from the Residential Lease Portfolio due to
123

improved operating performance of those assets subsequent to the sale to SunStrong. On May 31, 2019, the
Mezzanine Loan 2 Borrower drew an additional $10.5 million under the revised arrangement, which was distributed
to the Company as a special distribution in accordance with the agreement, resulting in an additional gain of
$8.4 million, arising out of revised operating performance of the underlying residential lease assets. Also, during the
quarter ended June 30, 2019, we closed one of the open funds that was sold as part of the original transaction, updated
our estimates on special distributions receivable from SunStrong with respect to the warehousing loan and proceeds
generated from the sale of future solar renewable energy credits, resulting in a gain of $1.9 million. The changes to
the estimates were driven by updated lease characteristics and other underlying assumptions on closure of the fund
and final draw of investment from the tax equity investors. Both gains were recorded within ‘‘Loss on sale and
impairment of residential lease assets’’ line item on the consolidated statements of operations.
On September 27, 2019, we sold the majority of the remainder of our remaining residential lease assets still
owned by us, that were not previously sold. These residential lease assets were sold under a new assignment of
interest agreement entered into with SunStrong. SunStrong also assumed debts related to the residential lease assets
sold. See Note 4. Business Divestiture and Sale of Assets for more details.
Note 7. FAIR VALUE MEASUREMENTS
Fair value is estimated by applying the following hierarchy, which prioritizes the inputs used to measure fair
value into three levels and bases the categorization within the hierarchy upon the lowest level of input that is available
and significant to the fair value measurement (observable inputs are the preferred basis of valuation):
• Level 1 — Quoted prices in active markets for identical assets or liabilities.
• Level 2 — Measurements are inputs that are observable for assets or liabilities, either directly or indirectly,
other than quoted prices included within Level 1.
• Level 3 — Prices or valuations that require management inputs that are both significant to the fair value
measurement and unobservable.
Assets and Liabilities Measured at Fair Value on a Recurring Basis
We measure certain assets and liabilities at fair value on a recurring basis. There were no transfers between fair
value measurement levels during any presented period.
The following table summarizes our assets and liabilities measured and recorded at fair value on a recurring
basis as of December 29, 2019 and December 30, 2018:
December 29, 2019 December 30, 2018
(In thousands)Total Fair
Value Level 3 Level 2 Level 1Total Fair
Value Level 3 Level 2 Level 1
Assets
Prepaid expenses and other
current assets:
Derivative financial instruments
(Note 12) . . . . . . . . . . . . . . . . . . . $ 1,002 $ — $1,002 $ — $ 729 $ — $729 $ —
Other long-term assets:
Equity investments with fair value
option (‘‘FVO’’) . . . . . . . . . . . . . . 17,500 17,500 — — 8,831 8,831 — —
Equity investments with readily
determinable fair value . . . . . . . . 173,908 — — 173,908 36,225 — — 36,225
Total assets . . . . . . . . . . . . . . . . . . . . . . $192,410 $17,500 $1,002 $173,908 $45,785 $8,831 $729 $36,225
124

December 29, 2019 December 30, 2018
(In thousands)Total Fair
Value Level 3 Level 2 Level 1Total Fair
Value Level 3 Level 2 Level 1
Liabilities
Accrued liabilities:
Derivative financial instruments
(Note 12) . . . . . . . . . . . . . . . . . . . $ — $— $1,962 $— $1,161 $— $1,161 $—
Other long-term liabilities:
Derivative financial instruments
(Note 12) . . . . . . . . . . . . . . . . . . . — — 373 — 152 — 152 —
Total liabilities . . . . . . . . . . . . . . . . . . . $2,335 $— $2,335 $— $1,313 $— $1,313 $—
Equity investments with fair value option (‘‘FVO’’)
We have elected the fair value option in accordance with the guidance in ASC 825, Financial Instruments, for
our investment in the SunStrong joint venture and SunStrong Partners, to mitigate volatility in reported earnings that
results from the use of different measurement attributes (see Note 10). We initially computed the fair value for our
investments consistent with the methodology and assumptions that market participants would use in their estimates
of fair value with the assistance of a third-party valuation specialist. The fair value computation is updated on a
quarterly basis. The investments are classified within Level 3 in the fair value hierarchy because we estimate the fair
value of the investments using the income approach based on the discounted cash flow method which considers
estimated future financial performance, including assumptions for, among others, forecasted contractual lease
income, lease expenses, residual value of these lease assets and long-term discount rates, and forecasted default rates
over the lease term and discount rates, some of which require significant judgment by management and are not based
on observable inputs.
The following table summarizes movements in equity investments for the year ended December 29, 2019. There
were no internal movements to or from Level 3 from Level 1 or Level 2 for the year ended December 29, 2019.
(In thousands)
Beginning balanceas of December 30,
2018FV
Adjustment1
Additionalinvestment[see Note]
Otheradjustments
Balance as ofDecember 29,
2019
Equity investments with FVO . . . . . . . . . . . . . . $8,831 $(1,954) $10,000 $623 $17,500
1 During the year ended December 29, 2019, we recorded a fair value adjustment of $2.0 million to our equity investments with FVO. Thefair value adjustment was included within ‘‘equity in losses of unconsolidated investees’’ in our consolidated statements of operations forthe year ended December 29, 2019.
Level 3 significant unobservable inputs sensitivity
The following table summarizes the significant unobservable inputs used in Level 3 valuation of our investments
carried at fair value as of December 29, 2019. Included in the table are the inputs or range of possible inputs that have
an effect on the overall valuation of the financial instruments.
2019
Assets: . . . . . . . . . . . . . . . . . . Fair value Valuation Technique Unobservable input Range (Weighted
Average)
Other long-term assets:
Equity investments . . . . . . $17,500 Discounted cash flows Discount rate
Residual value
10.5%-13% (1)
7.5% (1)
Total assets. . . . . . . . . . . . . . . $17,500
(1) The primary unobservable inputs used in the fair value measurement of our equity investments, when using a discounted cash flow model,are the discount rate and residual value. Significant increases (decreases) in the discount rate in isolation would result in a significantly lower(higher) fair value measurement. We estimate the discount rate based on our projected cost of equity. We estimate the residual value basedon the contracted systems in place in the years being projected. Significant increases (decreases) in the residual value in isolation wouldresult in a significantly higher (lower) fair value measurement.
125

Equity investments with readily determinable fair value
In connection with the divestment of our microinverter business to Enphase Energy, Inc. (‘‘Enphase’’) on
August 9, 2018, we received 7.5 million shares of Enphase common stock (NASDAQ: ENPH). The common stock
received was recorded as an equity investment with readily determinable fair value (Level 1), with changes in fair
value recognized in net income in accordance with ASU 2016-01 Recognition and Measurement of Financial Assets
and Liabilities. For fiscal 2019 and 2018, we recorded a gain of $158.3 million and a loss of $6.4 million,
respectively, within ‘‘other, net’’ in our consolidated statement of operations. During the year ended December 29,
2019, we sold 1 million of shares of Enphase common stock for cash proceeds of $20.6 million. (see Note. 11 for
pledge of these shares)
Assets and Liabilities Measured at Fair Value on a Non-Recurring Basis
We measure certain investments and non-financial assets (including property, plant and equipment, and other
intangible assets) at fair value on a non-recurring basis in periods after initial measurement in circumstances when
the fair value of such asset is impaired below its recorded cost. As of December 29, 2019 and December 30, 2018,
there were no such items recorded at fair value, with the exception of our residential lease assets (see ‘‘Note 6. Solar
Services’’).
Equity Method Investments
Our investments accounted for under the equity method are described in Note 10. Equity Investments.
We monitor these investments, which are included within ‘‘other long-term assets’’ on our consolidated balance
sheets, for impairment and record reductions in the carrying values when necessary. Circumstances that indicate an
other-than-temporary decline include Level 3 measurements such as the valuation ascribed to the issuing company
in subsequent financing rounds, decreases in quoted market prices, and declines in the results of operations of the
issuer.
As of December 29, 2019 and December 30, 2018, we had $26.7 million and $34.8 million, respectively, in
investments accounted for under the equity method (see Note 10. Equity Investments).
Equity investments without readily determinable fair value
These equity investments are securities in privately-held companies without readily determinable market values.
Prior to January 1, 2018, we accounted for these investments without readily determinable fair value at cost less
impairment. On January 1, 2018, we adopted ASU 2016-01 and elected to adjust the carrying value of such equity
securities to cost less impairment, adjusted for observable price changes in orderly transactions for an identical or
similar investment of the same issuer. Equity investments without readily determinable fair value are classified within
Level 3 in the fair value hierarchy because we estimate the value based on valuation methods using a combination
of observable and unobservable inputs including valuation ascribed to the issuing company in subsequent financing
rounds, volatility in the results of operations of the issuers and rights and obligations of the securities we hold.
Other than the $2.0 million fair value adjustment recorded in fiscal 2019, there was no impairment in any of the other
periods presented.
Restricted marketable securities
Our debt securities, classified as held-to-maturity, are Philippine government bonds that we maintain as
collateral for business transactions within the Philippines. These bonds have various maturity dates and are classified
as ‘‘Restricted short-term marketable securities’’ and ‘‘Restricted long-term marketable securities’’ on our
consolidated balance sheets as of December 29, 2019 and December 30, 2018, respectively. The Philippine Branch
is required by the Philippine SEC to maintain a certain amount of deposits to ensure that it will be able to secure its
liabilities as a foreign corporation’s branch. Security bond deposits to the Philippine SEC are determined based on
applicable regulations. The amounts are based on local audited statutory financial statement amounts, and the
minimum deposits are updated within six months after the end of the year. As of December 29, 2019 and
December 30, 2018, these bonds had a carrying value of $6.2 million and $6.0 million, respectively. We record such
held-to-maturity investments at amortized cost based on our ability and intent to hold the securities until maturity.
We monitor for changes in circumstances and events that would affect our ability and intent to hold such securities
until the recorded amortized costs are recovered. No other-than-temporary impairment loss was incurred during any
periods presented. The held-to-maturity debt securities were categorized in Level 2 of the fair value hierarchy.
126

Other financial assets and liabilities, including our accounts receivable, accounts payable and accrued liabilities,
are carried at cost, which generally approximates fair value due to the short-term nature of these financial assets and
liabilities.
Note 8. RESTRUCTURING
December 2019 Restructuring Plan
During the fourth quarter of fiscal 2019, we adopted a restructuring plan to realign and optimize workforce
requirements in light of recent changes to our business, including the Spin-Off. In connection with the restructuring
plan, which includes actions implemented in the fourth quarter of 2019 and is expected to be completed by mid-2023,
we expect between 145 and 160 non-manufacturing employees, representing approximately 3% of our global
workforce, to exit over a period of approximately 12 to 18 months. Between 65 and 70 of these employees in the
SunPower Technologies business unit and corporate have largely been informed and are expected to exit our company
following the Spin-Off and completion of transition services. As the SunPower Energy Services business unit refines
its focus on distributed generation, storage, and energy services, 80 to 90 employees exited or are expected to exit
during the fourth fiscal quarter of 2019 and the first half of 2020. We expect to incur restructuring charges totaling
approximately $16 million to $22 million, consisting primarily of severance benefits (between $8 million and
$11 million) and retention benefits (between $8 million and $11 million) primarily associated with the retention of
employees impacted by the Spin-Off transaction and certain key research and development employees. A substantial
portion of such charges have been and are expected to be incurred in the fourth quarter of fiscal 2019 and the first
quarter of fiscal 2020, and we expect between $14 million and $19 million of the charges to be cash. Cumulative costs
incurred were $7.4 million as of December 29, 2019, which relate to severance and benefits costs.
February 2018 Restructuring Plan
During the first quarter of fiscal 2018, we adopted a restructuring plan and began implementing initiatives to
reduce operating expenses and cost of revenue overhead in light of the known shorter-term impact of U.S. tariffs
imposed on PV solar cells and modules pursuant to Section 201 of the Trade Act of 1974 and our broader initiatives
to control costs and improve cash flow. In connection with the plan, we expected between 150 and 250
non-manufacturing employees to be affected, representing approximately 3% of our global workforce, with a portion
of those employees exiting from us as part of a voluntary departure program. The changes to our workforce varied
by country, based on local legal requirements and consultations with employee works councils and other employee
representatives, as appropriate. We expected to incur restructuring charges totaling between $20 million to
$30 million, consisting primarily of severance benefits (between $11 million and $16 million) and real estate lease
termination and other associated costs (between $9 million and $14 million). We expected between $12 million and
$20 million of the charges to be paid in cash. This restructuring plan is substantially complete. Cumulative costs
incurred were $19.0 million as of December 29, 2019. Of the cumulative costs, $5.9 million relate to non-cash
impairment charges, $11.8 million relate to severance and benefits costs, $0.6 million relate to lease and related
termination costs, and $0.7 million relate to other costs.
Legacy Restructuring Plans
Prior to fiscal 2018, we implemented approved restructuring plans, related to all segments, to reduce costs and
focus on improving cash flow, to realign our legacy power plant business unit, to align with changes in the global
solar market, as well as actions to accelerate operating cost reduction and improve overall operating efficiency.
These restructuring activities were substantially complete as of December 30, 2018, and any remaining costs to be
incurred are not expected to be material. Cumulative costs incurred were $376.8 million as of December 29, 2019.
Of the cumulative costs, $228.2 million relate to non-cash impairment charges, $100.8 million relate to severance and
benefits, $8.1 million relate to lease and related termination costs, and $39.7 million relate to other costs.
127

The following table summarizes the comparative periods-to-date restructuring charges by plan recognized in our
consolidated statements of operations:
Fiscal Year Ended
(In thousands)December 29,
2019December 30,
2018December 31,
2017
December 2019 Restructuring Plan:
Severance and benefits. . . . . . . . . . . . . . . . . . . . . . . . . . . . . . . . . . . . . . . . . . . . 7,355 — —
Other costs1 . . . . . . . . . . . . . . . . . . . . . . . . . . . . . . . . . . . . . . . . . . . . . . . . . . . . 41 — —
Total December 2019 Restructuring Plan . . . . . . . . . . . . . . . . . . . . . . . . . . . 7,396 — —
February 2018 Restructuring Plan:
Non-cash asset impairment charges. . . . . . . . . . . . . . . . . . . . . . . . . . . . . . . . . . 5,874 — —
Severance and benefits. . . . . . . . . . . . . . . . . . . . . . . . . . . . . . . . . . . . . . . . . . . . (333) 12,130 —
Lease and related termination costs. . . . . . . . . . . . . . . . . . . . . . . . . . . . . . . . . . 554 — —
Other costs1 . . . . . . . . . . . . . . . . . . . . . . . . . . . . . . . . . . . . . . . . . . . . . . . . . . . . 556 257 —
Total February 2018 Restructuring Plan . . . . . . . . . . . . . . . . . . . . . . . . . . . . 6,651 12,387 —
Legacy Restructuring Plan:
Non-cash impairment charges . . . . . . . . . . . . . . . . . . . . . . . . . . . . . . . . . . . . . . — — 147
Severance and benefits. . . . . . . . . . . . . . . . . . . . . . . . . . . . . . . . . . . . . . . . . . . . 83 1,866 5,415
Lease and related termination costs. . . . . . . . . . . . . . . . . . . . . . . . . . . . . . . . . . — 6 709
Other costs1 . . . . . . . . . . . . . . . . . . . . . . . . . . . . . . . . . . . . . . . . . . . . . . . . . . . . (20) 3,238 14,774
Total Legacy Restructuring Plan . . . . . . . . . . . . . . . . . . . . . . . . . . . . . . . . . . 63 5,110 21,045
Total restructuring charges. . . . . . . . . . . . . . . . . . . . . . . . . . . . . . . . . . . . . . . 14,110 $17,497 21,045
1 Other costs primarily represent associated legal and advisory services, and costs of relocating employees.
The following table summarizes the restructuring reserve activities during the year ended December 29, 2019:
Fiscal Year
(In thousands) 2018Charges
(Benefits)(Payments)Recoveries 2019
December 2019 Restructuring Plan:
Severance and benefits. . . . . . . . . . . . . . . . . . . . . . . . . . . . . . . . . . . . . . . . . . . . — 7,355 (1,533) 5,822
Other costs1 . . . . . . . . . . . . . . . . . . . . . . . . . . . . . . . . . . . . . . . . . . . . . . . . . . . . — 41 (41) —
Total 2019 Restructuring Plan . . . . . . . . . . . . . . . . . . . . . . . . . . . . . . . . . . . . — 7,396 (1,574) 5,822
February 2018 Restructuring Plan:
Non-cash asset impairment charges. . . . . . . . . . . . . . . . . . . . . . . . . . . . . . . . . . — 5,874 — —
Severance and benefits. . . . . . . . . . . . . . . . . . . . . . . . . . . . . . . . . . . . . . . . . . . . 5,449 (333) (4,820) 296
Lease and related termination costs. . . . . . . . . . . . . . . . . . . . . . . . . . . . . . . . . . — 554 (554) —
Other costs1 . . . . . . . . . . . . . . . . . . . . . . . . . . . . . . . . . . . . . . . . . . . . . . . . . . . . — 556 (557) —
Total February 2018 Restructuring Plan . . . . . . . . . . . . . . . . . . . . . . . . . . . . 5,449 6,651 (11,804) 296
Legacy Restructuring Plans . . . . . . . . . . . . . . . . . . . . . . . . . . . . . . . . . . . . . . 861 63 (441) 483
Total restructuring reserve activities . . . . . . . . . . . . . . . . . . . . . . . . . . . . . . . $6,310 $14,110 $(13,819) $6,601
1 Other costs primarily represent associated legal and advisory services, and costs of relocating employees.
128

Note 9. COMMITMENTS AND CONTINGENCIES
Facility and Equipment Leases
We lease certain facilities under non-cancellable operating leases from third parties. We also lease certain
buildings under non-cancellable capital leases. Operating leases are subject to renewal options for periods ranging
from 1 year to 10 years.
We have disclosed quantitative information related to the lease contracts we have entered into as a lessee by
aggregating the information based on the nature of asset such that the assets of similar characteristics and lease terms
are shown within one single financial statement line item.
The table below presents the summarized quantitative information with regard to lease contracts we have entered
into:
(In thousands)Fiscal Year EndedDecember 29, 2019
Operating leases:
Operating lease expense . . . . . . . . . . . . . . . . . . . . . . . . . . . . . . . . . . . . . . . . . . . . . . . . . . . . . . . . . $ 16,942
Sublease gain. . . . . . . . . . . . . . . . . . . . . . . . . . . . . . . . . . . . . . . . . . . . . . . . . . . . . . . . . . . . . . . . . . (276)
Rent expense . . . . . . . . . . . . . . . . . . . . . . . . . . . . . . . . . . . . . . . . . . . . . . . . . . . . . . . . . . . . . . . . . $ 16,666
Cash paid for amounts included in the measurement of lease liabilities
Cash paid for operating leases . . . . . . . . . . . . . . . . . . . . . . . . . . . . . . . . . . . . . . . . . . . . . . . . . . 20,515
Right-of-use assets obtained in exchange for lease obligations1 . . . . . . . . . . . . . . . . . . . . . . . . . 111,142
Weighted-average remaining lease term (in years) - operating leases . . . . . . . . . . . . . . . . . . . . . 7.4
Weighted-average discount rate - operating leases . . . . . . . . . . . . . . . . . . . . . . . . . . . . . . . . . . . . 9%
1 Amounts for the year ended December 29, 2019, include the transition adjustment for the adoption of ASC 842 and new ROU asset addition.
See Note 1. Organization and Summary of Significant Accounting Policies.
The future minimum lease payments to be paid under non-cancellable leases in effect at December 29, 2019, are
as follows (in thousands):
As of December 29, 2019 Operating leases
2020 . . . . . . . . . . . . . . . . . . . . . . . . . . . . . . . . . . . . . . . . . . . . . . . . . . . . . . . . . . . . . . . . . . . . . . . . . $ 14,085
2021 . . . . . . . . . . . . . . . . . . . . . . . . . . . . . . . . . . . . . . . . . . . . . . . . . . . . . . . . . . . . . . . . . . . . . . . . . 13,924
2022 . . . . . . . . . . . . . . . . . . . . . . . . . . . . . . . . . . . . . . . . . . . . . . . . . . . . . . . . . . . . . . . . . . . . . . . . . 12,521
2023 . . . . . . . . . . . . . . . . . . . . . . . . . . . . . . . . . . . . . . . . . . . . . . . . . . . . . . . . . . . . . . . . . . . . . . . . . 9,302
2024 . . . . . . . . . . . . . . . . . . . . . . . . . . . . . . . . . . . . . . . . . . . . . . . . . . . . . . . . . . . . . . . . . . . . . . . . . 5,668
Thereafter . . . . . . . . . . . . . . . . . . . . . . . . . . . . . . . . . . . . . . . . . . . . . . . . . . . . . . . . . . . . . . . . . . . . 24,979
Total lease payments . . . . . . . . . . . . . . . . . . . . . . . . . . . . . . . . . . . . . . . . . . . . . . . . . . . . . . . . . . . 80,479
Less: imputed interest . . . . . . . . . . . . . . . . . . . . . . . . . . . . . . . . . . . . . . . . . . . . . . . . . . . . . . . . . . . (24,927)
Total . . . . . . . . . . . . . . . . . . . . . . . . . . . . . . . . . . . . . . . . . . . . . . . . . . . . . . . . . . . . . . . . . . . . . . . . $ 55,552
As of December 29, 2019, we have additional operating leases that have not yet commenced with future
minimum lease payments amounting to $29.8 million. These operating leases will commence in the first quarter of
fiscal 2020 with lease terms of 18 years.
Purchase Commitments
We purchase raw materials for inventory and manufacturing equipment from a variety of vendors. During the
normal course of business, in order to manage manufacturing lead times and help assure adequate supply, we enter
into agreements with contract manufacturers and suppliers that either allow them to procure goods and services based
on specifications defined by us, or that establish parameters defining our requirements. In certain instances, these
agreements allow us the option to cancel, reschedule or adjust our requirements based on our business needs before
firm orders are placed. Consequently, purchase commitments arising from these agreements are excluded from our
disclosed future obligations under non-cancellable and unconditional commitments.
129
We also have agreements with several suppliers, including some of our unconsolidated investees, for the
procurement of polysilicon, ingots, and wafers, as well as certain module-level power electronics and related
equipment, which specify future quantities and pricing of products to be supplied by one vendor for periods of up
to 2 years and provide for certain consequences, such as forfeiture of advanced deposits and liquidated damages
relating to previous purchases, in the event that we terminate the arrangements or fail to satisfy our obligations under
the agreements.
Future purchase obligations under non-cancellable purchase orders and long-term supply agreements as of
December 29, 2019 are as follows:
(In thousands)Fiscal2020
Fiscal2021
Fiscal2022
Fiscal2023
Fiscal2024 Thereafter Total1
Future purchase obligations . . . . . . . . . . . $506,845 $79,225 $37,706 $33,148 $710 $6,082 $663,716
1 Total future purchase obligations were composed of $154.7 million related to non-cancellable purchase orders and $509.1 million relatedto long-term supply agreements.
We expect that all obligations related to non-cancellable purchase orders for manufacturing equipment will be
recovered through future cash flows of the solar cell manufacturing lines and solar panel assembly lines when such
long-lived assets are placed in service. Factors considered important that could result in an impairment review include
significant under-performance relative to expected historical or projected future operating results, significant changes
in the manner of use of acquired assets, and significant negative industry or economic trends. Obligations related to
non-cancellable purchase orders for inventories match current and forecasted sales orders that will consume these
ordered materials and actual consumption of these ordered materials is regularly compared to expected demand.
We anticipate total obligations related to long-term supply agreements for inventories, some of which (in the case of
polysilicon) are at purchase prices significantly above current market prices for similar materials, will be recovered
because the quantities required to be purchased are expected to be utilized in the manufacture and profitable sale of
solar power products in the future based on our long-term operating plans. Additionally, in order to reduce inventory
and improve working capital, we have periodically elected to sell polysilicon inventory in the marketplace at prices
below our purchase price, thereby incurring a loss. The terms of the long-term supply agreements are reviewed
annually by us and we assess the need for any accruals for estimated losses on adverse purchase commitments, such
as lower of cost or net realizable value adjustments that will not be recovered by future sales prices, forfeiture of
advanced deposits and liquidated damages, as necessary.
Advances to Suppliers
As noted above, we have entered into agreements with various vendors, some of which are structured as ‘‘take
or pay’’ contracts, that specify future quantities and pricing of products to be supplied. Certain agreements also
provide for penalties or forfeiture of advanced deposits in the event we terminate the arrangements. Under certain
agreements, we were required to make prepayments to the vendors over the terms of the arrangements. As of
December 29, 2019 and December 30, 2018, advances to suppliers totaled $121.4 million and $171.6 million,
respectively, of which $107.4 million and $37.9 million, respectively, is classified as ‘‘Advances to suppliers, current
portion’’ on our consolidated balance sheets. One supplier accounted for 100% and 99.6% of total advances to
suppliers as of December 29, 2019 and December 30, 2018, respectively.
Advances from Customers
We have entered into agreements with customers who have made advance payments for solar power systems.
These advances are applied as shipments of product occur or upon completion of certain project milestones.
The estimated utilization of advances from customers included within ‘‘Contract liabilities, current portion’’ and
‘‘Contract liabilities, net of current portion’’ on our consolidated balance sheets as of December 29, 2019 is as
follows:
(In thousands)Fiscal2020
Fiscal2021
Fiscal2022
Fiscal2023
Fiscal2024 Thereafter Total
Estimated utilization of advances
from customers . . . . . . . . . . . . . . . . . . . $53,553 $35,443 $173 $— $— $— $89,169
130

Product Warranties
The following table summarizes accrued warranty activities for fiscal 2019, 2018 and 2017:
Fiscal Year Ended
(In thousands)December 29,
2019December 30,
2018December 31,
2017
Balance at the beginning of the period . . . . . . . . . . . . . . . . . . . . . . . . . . . . $172,266 $181,303 $161,209
Accruals for warranties issued during the period . . . . . . . . . . . . . . . . . . 27,717 31,628 29,689
Settlements and adjustments during the period . . . . . . . . . . . . . . . . . . . . (61,538) (40,665) (9,595)
Balance at the end of the period. . . . . . . . . . . . . . . . . . . . . . . . . . . . . . . . . . $138,445 $172,266 $181,303
In some cases, we may offer customers the option to purchase extended warranties to ensure protection beyond
the standard warranty period. In those circumstances, the warranty is considered a distinct service and we account
for the extended warranty as a performance obligation and allocate a portion of the transaction price to that
performance obligation. More frequently, customers do not purchase a warranty separately. In those situations, we
account for the warranty as an assurance-type warranty, which provides customers with assurance that the product
complies with agreed-upon specifications, and this does not represent a separate performance obligation.
Such warranties are recorded separately as liabilities and presented within ‘‘accrued liabilities’’ and ‘‘other long-term
liabilities’’ on our consolidated balance sheets (see Note 5. Balance Sheet Components).
Project Agreements with Customers
Project agreements entered into with our commercial and power plant customers often require us to undertake
obligations including: (i) system output performance warranties, (ii) penalty payments or customer termination rights
if the system we are constructing is not commissioned within specified time frames or other milestones are not
achieved, and (iii) system put-rights whereby we could be required to buy back a customer’s system at fair value on
specified future dates if certain minimum performance thresholds are not met for specified periods. Historically, our
systems have performed significantly above their performance warranty thresholds, and there have been no cases in
which we have had to buy back a system. As of December 29, 2019 and December 30, 2018, we had $7.5 million
and $3.3 million, respectively, classified as ‘‘accrued liabilities,’’ and $2.8 million and $6.5 million, respectively,
classified as ‘‘other long-term liabilities’’ on our consolidated balance sheets for such obligations.
Future Financing Commitments
We are required to provide certain funding under agreements with unconsolidated investees, subject to certain
conditions. As of December 29, 2019, we have $2.9 million of future financing obligations related to these
agreements. These financing obligations are due in 2020.
Liabilities Associated with Uncertain Tax Positions
Total liabilities associated with uncertain tax positions were $20.1 million and $16.8 million as of December 29,
2019 and December 30, 2018, respectively. These amounts are included within ‘‘other long-term liabilities’’ on our
consolidated balance sheets in their respective periods as they are not expected to be paid within the next 12 months.
Due to the complexity and uncertainty associated with our tax positions, we cannot make a reasonably reliable
estimate of the period in which cash settlement, if any, would be made for our liabilities associated with uncertain
tax positions in Other long-term liabilities.
Indemnifications
We are a party to a variety of agreements under which we may be obligated to indemnify the counterparty with
respect to certain matters. Typically, these obligations arise in connection with contracts and license agreements or
the sale of assets, under which we customarily agree to hold the other party harmless against losses arising from a
breach of warranties, representations and covenants related to such matters as title to assets sold, negligent acts,
damage to property, validity of certain intellectual property rights, non-infringement of third-party rights, and certain
tax related matters including indemnification to customers under Section 48(c) of the Internal Revenue Code of 1986,
as amended, regarding solar commercial investment tax credits (‘‘ITCs’’) and U.S. Treasury Department
(‘‘U.S. Treasury’’) cash grant payments under Section 1603 of the American Recovery and Reinvestment Act (each
131
a ‘‘Cash Grant’’). Further, in connection with our sale of residential lease assets in fiscal 2018 to SunStrong, we have
provided Hannon Armstrong, indemnifications related to cash flow losses arising from a recapture of California
property taxes on account of a change in ownership, recapture of federal tax attributes and cash flow losses from
leases that do not generate the promised savings to homeowners. The maximum exposure to loss arising from the
indemnifications is limited to total amount of debt provided by from Hannon Armstrong to SunStrong. In each of
these circumstances, payment by us is typically subject to the other party making a claim to us that is contemplated
by and valid under the indemnification provisions of the particular contract, which provisions are typically
contract-specific, as well as bringing the claim under the procedures specified in the particular contract. These
procedures usually allow us to challenge the other party’s claims or, in case of breach of intellectual property
representations or covenants, to control the defense or settlement of any third-party claims brought against the other
party. Further, our obligations under these agreements may be limited in terms of activity (typically to replace or
correct the products or terminate the agreement with a refund to the other party), duration or amount. In some
instances, we may have recourse against third parties or insurance covering certain payments made by us.
In certain circumstances, we have provided indemnification to customers and investors under which we are
contractually obligated to compensate these parties for losses they may suffer as a result of reductions in benefits
received under ITCs and U.S. Treasury Cash Grant programs. We apply for ITCs and Cash Grant incentives based
on guidance provided by the Internal Revenue Service (‘‘IRS’’) and the U.S. Treasury, which include assumptions
regarding the fair value of the qualified solar power systems, among others. Certain of our development agreements,
sale-leaseback arrangements, and financing arrangements with tax equity investors, incorporate assumptions
regarding the future level of incentives to be received, which in some instances may be claimed directly by our
customers and investors. Generally, such obligations would arise as a result of reductions to the value of the
underlying solar power systems as assessed by the IRS. At each balance sheet date, we assess and recognize, when
applicable, the potential exposure from these obligations based on all the information available at that time, including
any audits undertaken by the IRS. The maximum potential future payments that we could have to make under this
obligation would depend on the difference between the eligible basis claimed on the tax filing for the solar energy
systems sold or transferred to indemnified parties and the values that the IRS may re-determine as the eligible basis
for the systems for purposes of claiming ITCs or Cash Grants. We use the eligible basis for tax filing purposes
determined with the assistance of independent third-party appraisals to determine the ITCs that are passed-through
to and claimed by the indemnified parties. We continue to retain certain indemnities, specifically, around ITCs and
Cash Grants and California property taxes, even after the underlying portfolio of assets is sold to a third party.
For contracts that have such indemnification provisions, we recognize a liability under ASC 460, ‘‘Guarantees,’’ for
the estimated premium that would be required by a guarantor to issue the same guarantee in a standalone arm’s-length
transaction with an unrelated party. We recognize such liabilities at the greater of the fair value of the indemnity or
the contingent liability required to be recognized under ASC 450, ‘‘Contingencies.’’ We initially estimate the fair
value of any such indemnities provided based on the cost of insurance policies that cover the underlying risks being
indemnified and may purchase such policies to mitigate our exposure to potential indemnification payments. After an
indemnification liability is recorded, we derecognize such amount typically upon expiration or settlement of the
arrangement.
As both December 29, 2019 and December 30, 2018, our provision was $8.3 million and $4.2 million
respectively, primarily for tax related indemnifications.
Defined Benefit Pension Plans
We maintain defined benefit pension plans for certain of our non-U.S. employees. Benefits under these plans are
generally based on an employee’s years of service and compensation. Funding requirements are determined on an
individual country and plan basis and are subject to local country practices and market circumstances. The funded
status of the pension plans, which represents the difference between the benefit obligation and fair value of plan
assets, is calculated on a plan-by-plan basis. The benefit obligation and related funded status are determined using
assumptions as of the end of each fiscal year. We recognize the overfunded or underfunded status of our pension plans
as an asset or liability on our consolidated balance sheets. As of December 29, 2019 and December 30, 2018, the
underfunded status of our pension plans presented within ‘‘other long-term liabilities’’ on our consolidated balance
sheets was $5.9 million and $2.6 million, respectively. The impact of transition assets and obligations and actuarial
gains and losses are recorded within ‘‘accumulated other comprehensive loss’’ and are generally amortized as a
component of net periodic cost over the average remaining service period of participating employees. Total other
comprehensive loss related to our benefit plans was $3.1 million for the year ended December 29, 2019.
132

Legal Matters
We are a party to various litigation matters and claims that arise from time to time in the ordinary course of our
business. While we believe that the ultimate outcome of such matters will not have a material adverse effect on us,
their outcomes are not determinable and negative outcomes may adversely affect our financial position, liquidity, or
results of operations.
Note 10. EQUITY INVESTMENTS
Our equity investments consist of equity investments with readily determinable fair value, investments without
readily determinable fair value, equity investments accounted for using the fair value option, and equity method
investments.
Our share of earnings (losses) from equity investments accounted for under the equity method is reflected as
‘‘Equity in earnings (losses) of unconsolidated investees’’ in our consolidated statements of operations. Mark-to-
market gains and losses on equity investments with readily determinable fair value are reflected as ‘‘other, net’’ under
other income (expense), net in our consolidated statements of operations. The carrying value of our equity
investments, classified as ‘‘other long-term assets’’ on our consolidated balance sheets, are as follows:
As of
(In thousands)December 29,
2019December 30,
2018
Equity investments with readily determinable fair value:
Enphase Energy, Inc. . . . . . . . . . . . . . . . . . . . . . . . . . . . . . . . . . . . . . . . . . . . . . . . . $173,908 $36,225
Total equity investments with readily determinable fair value . . . . . . . . . . . . . 173,908 36,225
Equity investments without readily determinable fair value:
Project entities . . . . . . . . . . . . . . . . . . . . . . . . . . . . . . . . . . . . . . . . . . . . . . . . . . . . . 2,677 2,951
Other equity investments without readily determinable fair value . . . . . . . . . . . . 5,859 5,859
Total equity investments without readily determinable fair value. . . . . . . . . . . 8,536 8,810
Equity investments with fair value option:
SunStrong Capital Holdings, LLC . . . . . . . . . . . . . . . . . . . . . . . . . . . . . . . . . . . . . 8,000 8,831
SunStrong Partners, LLC. . . . . . . . . . . . . . . . . . . . . . . . . . . . . . . . . . . . . . . . . . . . . 9,500 —
8point3 Solar Investco 3 Holdings, LLC . . . . . . . . . . . . . . . . . . . . . . . . . . . . . . . . — —
Total equity investment with fair value option. . . . . . . . . . . . . . . . . . . . . . . . . . 17,500 8,831
Equity method investments
Huansheng Corporation . . . . . . . . . . . . . . . . . . . . . . . . . . . . . . . . . . . . . . . . . . . . . . 26,533 32,784
Project entities . . . . . . . . . . . . . . . . . . . . . . . . . . . . . . . . . . . . . . . . . . . . . . . . . . . . . 125 2,044
Total equity method investments. . . . . . . . . . . . . . . . . . . . . . . . . . . . . . . . . . . . . 26,658 34,828
Total equity investments . . . . . . . . . . . . . . . . . . . . . . . . . . . . . . . . . . . . . . . . . . . . . . . $226,602 $88,694
Variable Interest Entities (‘‘VIEs’’)
A VIE is an entity that has either (i) insufficient equity to permit the entity to finance its activities without
additional subordinated financial support, or (ii) equity investors who lack the characteristics of a controlling
financial interest. Under ASC 810, Consolidation, an entity that holds a variable interest in a VIE and meets certain
requirements would be considered to be the primary beneficiary of the VIE and is required to consolidate the VIE
in its consolidated financial statements. In order to be considered the primary beneficiary of a VIE, an entity must
hold a variable interest in the VIE and have both:
• The power to direct the activities that most significantly impact the economic performance of the VIE; and
• The right to receive benefits from, or the obligation to absorb losses of the VIE that could be potentially
significant to the VIE.
We follow guidance on the consolidation of VIEs that requires companies to utilize a qualitative approach to
determine whether it is the primary beneficiary of a VIE. The process for identifying the primary beneficiary of a VIE
requires consideration of the factors that indicate a party has the power to direct activities that most significantly
133

impact the investees’ economic performance, including powers granted to the investees’ governing board and, to a
certain extent, a company’s economic interest in the investee. We analyze our investments in VIEs and classify them
as either:
• A VIE that must be consolidated because we are the primary beneficiary or the investee is not a VIE and
we hold the majority voting interest with no significant participative rights available to the other partners;
or
• A VIE that does not require consolidation because we are not the primary beneficiary or the investee is not
a VIE and we do not hold the majority voting interest.
As part of the above analysis, if it is determined that we have the power to direct the activities that most
significantly impact the investees’ economic performance, we consider whether or not we have the obligation to
absorb losses or rights to receive benefits of the VIE that could potentially be significant to the VIE.
Unconsolidated VIEs
On November 5, 2018, we sold a portion of our interest in certain entities that have historically held the assets
and liabilities comprising our residential lease business to an affiliate of Hannon Armstrong. The Residential Lease
Portfolio is held by SunStrong, which owns and operates those assets. The SunStrong partnership is planned to scale
as new residential lease assets are contributed to the partnership.
In furtherance of our long-term strategic goals, in June 2019, we entered into a joint venture with Hannon
Armstrong and SunStrong to form SunStrong Partners, LLC (‘‘SunStrong Partners’’), a jointly owned entity formed
to own, operate, and control residential lease assets. Bank of America Merrill Lynch (‘‘BAML’’) provided cash equity
and a multi-draw term loan, with additional equity provided by us, Hannon Armstrong, and SunStrong. In June 2019,
we made a $9.5 million equity investment in SunStrong Partners, in exchange for a 47.5% equity ownership.
Further, in June 2019, we entered into a joint venture with Hannon Armstrong and SunStrong to form 8point3
Solar Investco 3 Holdings, LLC (‘‘8point3 Holdings’’), a jointly owned entity to own, operate and control a separate
portfolio of existing residential lease assets, that was purchased from Capital Dynamics. Hannon Armstrong provided
all of the necessary initial capital contribution to 8point3 Holdings that was used to purchase this portfolio and Hanon
Armstrong owns 45.1% of the equity in 8point3 Holdings. In connection with the formation of this joint venture, we
received a 44.9% of the equity interest for a minimal value. SunStrong owns the remaining 10% of the equity in
8point3 Holdings.
With respect to our interest in the SunStrong and SunStrong Partners, we have offered certain substantive,
non-standard indemnifications to the investees or third party tax equity investors, related to cash flow losses arising
from a recapture of California property taxes on account of a change in ownership, recapture of federal tax attributes,
and any cash flow losses from leases that do not generate the promised savings to homeowners or tax equity investors.
The maximum exposure to loss arising from the indemnifications for SunStrong is limited to consideration received
for the solar power systems. The maximum exposure to loss arising from the indemnifications for SunStrong Partners
is limited to $250 million. Our retention of these indemnification obligations may require us to absorb losses that are
not proportionate with our equity interests. As such, we determined that the investees are variable interest entities.
Based on the assessment of the required criteria for consolidation, we determined that we do not have the power
to unilaterally make decisions that affect the performance of these investees. Under the respective operating and
governance agreements, we and Hannon Armstrong are given equal governing rights and all major decisions,
including among others, approving or modifying the budget, terminating service providers, incurring indebtedness,
refinancing any existing loans, declaring distributions, commencing or settling any claims. Therefore, we concluded
that these investees are under joint control and we are not the primary beneficiary of these investees.
We have elected the FVO in accordance with the guidance in ASC 825, Financial Instruments, for our
investments in SunStrong Capital Holdings, LLC, SunStrong Partners, and 8point3 Solar Investco 3 Holdings, LLC.
Refer to Note 7. Fair Value Measurements.
134

Summarized Financial Information of Unconsolidated VIEs
The following summary of unaudited financial information of the unconsolidated VIEs, is derived from the
unaudited financial statements of such VIEs. The following table presents summarized financial statements for
SunStrong, a significant investee, based on unaudited information provided to us by the investee:1
Fiscal Year Ended
(In thousands) December 29, 2019
Summarized statements of operations information:
Revenue . . . . . . . . . . . . . . . . . . . . . . . . . . . . . . . . . . . . . . . . . . . . . . . . . . . . . . . . . . . . . . . . . . . . 72,595
Gross loss . . . . . . . . . . . . . . . . . . . . . . . . . . . . . . . . . . . . . . . . . . . . . . . . . . . . . . . . . . . . . . . . . . (16,786)
Net income . . . . . . . . . . . . . . . . . . . . . . . . . . . . . . . . . . . . . . . . . . . . . . . . . . . . . . . . . . . . . . . . . 1,374
As of
(In thousands)December 29,
2019December 30,
2018
Summarized balance sheet information:
Current assets. . . . . . . . . . . . . . . . . . . . . . . . . . . . . . . . . . . . . . . . . . . . . . . . . . . . . . . . . . . 225,576 103,413
Long-term assets . . . . . . . . . . . . . . . . . . . . . . . . . . . . . . . . . . . . . . . . . . . . . . . . . . . . . . . . 1,049,451 868,185
Current liabilities . . . . . . . . . . . . . . . . . . . . . . . . . . . . . . . . . . . . . . . . . . . . . . . . . . . . . . . . 125,601 85,154
Long-term liabilities . . . . . . . . . . . . . . . . . . . . . . . . . . . . . . . . . . . . . . . . . . . . . . . . . . . . . 847,365 660,065
1 Note that amounts are reported one quarter in arrears as permitted by applicable guidance.
Consolidated VIEs
Our sale of solar power systems to residential and commercial customers in the United States are eligible for
ITC. Under the current law, the ITC was reduced from approximately 30% of the cost of the solar power systems
to approximately 26% for solar power systems placed into service after December 31, 2019, and then will be further
reduced to approximately 22% for solar power systems placed into service after December 31, 2020, before being
reduced permanently to 10% for commercial projects and 0% for residential projects. Internal Revenue Services
(‘‘IRS’’) guidance on the current law provides for the ability to safe harbor the ITC on qualifying solar power
systems, allowing preservation of the current ITC rates for projects that are completed after the scheduled reduction
in rates assuming other required criteria as prescribed by the IRS are met.
In September 2019, we entered the Solar Sail LLC (‘‘Solar Sail’’) and Solar Sail Commercial Holdings, LLC
(‘‘Solar Sail Commercial’’) joint ventures with Hannon Armstrong Sustainable Infrastructure Capital, Inc. (‘‘Hannon
Armstrong’’), to finance the purchase of 200 megawatts of panel inventory in accordance with IRS safe harbor
guidance, to preserve the 30% federal ITC for third-party owned commercial and residential systems. The companies
expect to increase the volume in later years, for which Hannon Armstrong has extended a secured financing of up
to $112.8 million as of December 29, 2019 (Refer Note 11, Debt and Credit Sources for other terms and conditions
of this facility). The portion of the value of the safe harbored panels was funded by equity contributions in the joint
venture of $6.0 million each by SunPower and Hannon Armstrong.
Based on the relevant accounting guidance summarized above, we determined that Solar Sail and Solar Sail
Commercial are VIEs and after performing the assessment of required criteria for consolidation, we determined that
we are the primary beneficiary of Solar Sail and Solar Sail Commercial as we have power to direct the activities that
significantly impact the entity’s economic performance and we have exposure to significant profits or losses, and as
such, we consolidate both of these entities.
Total revenue of the consolidated investee was zero for fiscal 2019. The assets of our consolidated investees are
restricted for use only by the particular investee and are not available for our general operations.
135

Related-Party Transactions with Investees
Related-party transactions with investees are as follows:
As of
(In thousands)December 29,
2019December 30,
2018
Accounts receivable. . . . . . . . . . . . . . . . . . . . . . . . . . . . . . . . . . . . . . . . . . . . . . . . . . . . . . . . $23,900 $19,062Accounts payable. . . . . . . . . . . . . . . . . . . . . . . . . . . . . . . . . . . . . . . . . . . . . . . . . . . . . . . . . . 62,811 7,982Accrued liabilities . . . . . . . . . . . . . . . . . . . . . . . . . . . . . . . . . . . . . . . . . . . . . . . . . . . . . . . . . 11,219 22,364Contract liabilities . . . . . . . . . . . . . . . . . . . . . . . . . . . . . . . . . . . . . . . . . . . . . . . . . . . . . . . . . 29,599 —
Fiscal Year Ended
(In thousands)December 29,
2019December 30,
2018December 31,
2017
Payments made to investees for products/services . . . . . . . . . . . . . . . . . $295,415 $80,150 $ —Revenues and fees received from investees for products/services1 . . . . 109,512 9,717 31,459
1 Includes a portion of proceeds received from tax equity investors in connection with 8point3 Energy Partners transactions.
Note 11. DEBT AND CREDIT SOURCES
The following table summarizes our outstanding debt on our consolidated balance sheets:
December 29, 2019 December 30, 2018
(In thousands) Face ValueShort-term
Long-term Total
FaceValue
Short-term
Long-term Total
Convertible debt:0.875% debentures
due 2021. . . . . . . . $ 400,000 $ — $399,058 $ 399,058 $400,000 $ — $398,398 $398,3984.00% debentures
due 2023. . . . . . . . 425,000 — 421,201 421,201 425,000 — 419,958 419,958CEDA loan . . . . . . . . . . 30,000 — 29,141 29,141 30,000 — 29,063 29,063Non-recourse financing
and other debt . . . . . 190,966 104,230 83,224 187,454 49,073 39,500 9,273 48,773
$1,045,966 $104,230 $932,624 $1,036,854 $904,073 $39,500 $856,692 $896,192
As of December 29, 2019, the aggregate future contractual maturities of our outstanding debt, at face value, were
as follows:
(In thousands)Fiscal2020
Fiscal2021
Fiscal2022
Fiscal2023
Fiscal2024 Thereafter Total
Aggregate future maturities of
outstanding debt . . . . . . . . . . . . . . . . . . $104,341 $466,902 $14,999 $425,732 $772 $33,220 $1,045,966
Convertible Debt
The following table summarizes our outstanding convertible debt:
December 29, 2019 December 30, 2018
(In thousands)Carrying
Value Face Value Fair Value1Carrying
Value Face Value Fair Value1
Convertible debt:0.875% debentures due 2021 . . . . . . . . . . $399,058 $400,000 $371,040 $398,398 $400,000 $306,9044.00% debentures due 2023 . . . . . . . . . . . 421,201 425,000 348,628 419,958 425,000 341,968
$820,259 $825,000 $719,668 $818,356 $825,000 $648,872
1 The fair value of the convertible debt was determined using Level 2 inputs based on quarterly market prices as reported by an independentpricing source.
136

Our outstanding convertible debentures are senior, unsecured obligations ranking equally with all of our existing
and future senior unsecured indebtedness.
0.875% Debentures Due 2021
In June 2014, we issued $400.0 million in principal amount of our 0.875% debentures due 2021. Interest is
payable semi-annually, beginning on December 1, 2014. Holders may exercise their right to convert the debentures
at any time into shares of our common stock at an initial conversion price approximately equal to $48.76 per share,
subject to adjustment in certain circumstances. If not earlier repurchased or converted, the 0.875% debentures due
2021 mature on June 1, 2021. In January 2020, we purchased, in open market transactions, a portion of this
convertible debt. See Note 18. Subsequent Events for further discussion.
4.00% Debentures Due 2023
In December 2015, we issued $425.0 million in principal amount of our 4.00% debentures due 2023. Interest
is payable semi-annually, beginning on July 15, 2016. Holders may exercise their right to convert the debentures at
any time into shares of our common stock at an initial conversion price approximately equal to $30.53 per share,
subject to adjustment in certain circumstances. If not earlier repurchased or converted, the 4.00% debentures due
2023 mature on January 15, 2023.
Other Debt and Credit Sources
Financing for Safe Harbor Panels Inventory
On September 27, 2019, we entered into joint ventures with Hannon Armstrong, to finance the purchase of up
to 200 megawatts of panels inventory, preserving the 30 percent federal Investment Tax Credit (‘‘ITC’’) for
third-party owned commercial and residential systems and meeting safe harbor guidelines. As of December 29, 2019,
we had $100.6 million borrowed and outstanding under this agreement. We have the ability to draw up to
$112.8 million under this agreement as of fiscal year ended December 29, 2019.
The loan carries an interest rate of 7.5% per annum payable quarterly. Principal amount on the loan is required
to be repaid quarterly from the financing proceeds of the underlying projects. The ultimate maturity date for the loan
is June 30, 2022.
Loan Agreement with California Enterprise Development Authority (‘‘CEDA’’)
In 2010, we borrowed the proceeds of the $30.0 million aggregate principal amount of CEDA’s tax-exempt
Recovery Zone Facility Revenue Bonds (SunPower Corporation - Headquarters Project) Series 2010 (the ‘‘Bonds’’)
maturing April 1, 2031 under a loan agreement with CEDA. The Bonds mature on April 1, 2031, bear interest at a
fixed rate of 8.50% through maturity, and include customary covenants and other restrictions on us. As of
December 29, 2019, the fair value of the Bonds was $32.1 million, determined by using Level 2 inputs based on
quarterly market prices as reported by an independent pricing source.
Revolving Credit Facility with Credit Agricole
On October 29, 2019, we entered into a new Green Revolving Credit Agreement (the ‘‘2019 Revolver’’) with
Crédit Agricole Corporate and Investment Bank (‘‘Credit Agricole’’), as lender, with a revolving credit commitment
of $55.0 million. The 2019 Revolver contains affirmative covenants, events of default and repayment provisions
customarily applicable to similar facilities and has a per annum commitment fee of 0.05% on the daily unutilized
amount, payable quarterly. Loans under the 2019 Revolver bear either an adjusted LIBOR interest rate for the period
elected for such loan or a floating interest rate of the higher of prime rate, federal funds effective rate, or LIBOR for
an interest period of one month, plus an applicable margin, ranging from 0.25% to 0.60%, depending on the base
interest rate applied, and each matures on the earlier of April 29, 2021, or the termination of commitments thereunder.
Our payment obligations under the 2019 Revolver are guaranteed by Total S.A. up to the maximum aggregate
principal amount of $55.0 million. In consideration of the commitments of Total S.A., we are required to pay them
a guaranty fee of 0.25% per annum on any amounts borrowed under the 2019 Revolver and to reimburse Total S.A.
for any amounts paid by them under the parent guaranty. We have pledged the equity of a wholly-owned subsidiary
of the Company that holds our shares of Enphase Energy, Inc. common stock to secure our reimbursement obligation
under the 2019 Revolver. We have also agreed to limit our ability to draw funds under the 2019 Revolver to no more
than 67% of the fair market value of the common stock held by our subsidiary at the time of the draw.
137

As of December 29, 2019, we had no outstanding borrowings under the 2019 Revolver.
September 2011 Letter of Credit Facility with Deutsche Bank and Deutsche Bank Trust Company
Americas (together, ‘‘Deutsche Bank Trust’’)
In September 2011, we entered into a letter of credit facility with Deutsche Bank Trust which provides for the
issuance, upon our request, of letters of credit to support our obligations in an aggregate amount not to exceed
$200.0 million. Each letter of credit issued under the facility is fully cash-collateralized and we have entered into a
security agreement with Deutsche Bank Trust, granting them a security interest in a cash collateral account
established for this purpose.
As of December 29, 2019 and December 30, 2018, letters of credit issued and outstanding under the Deutsche
Bank Trust facility totaled $3.6 million and $3.0 million, respectively, which were fully collateralized with restricted
cash on the consolidated balance sheets.
Other Facilities
Asset-Backed Loan with Bank of America
On March 29, 2019, we entered in a Loan and Security Agreement with Bank of America, N.A., which provides
a revolving credit facility secured by certain inventory and accounts receivable in the maximum aggregate principal
amount of $50.0 million. The Loan and Security Agreement contains negative and affirmative covenants, events of
default and repayment and prepayment provisions customarily applicable to asset-backed credit facilities. The facility
bears a floating interest rate of LIBOR plus an applicable margin, and matures on the earlier of March 29, 2022, a
date that is 91 days prior to the maturity of our 2021 convertible debentures, or the termination of the commitments
thereunder. During fiscal 2019, we drew loans totaling $31.3 million, under this facility and we repaid loans of
$12.2 million, leaving a balance outstanding of $19.2 million as of December 29, 2019.
SunTrust Facility
On June 28, 2018, we entered into a Financing Agreement with SunTrust Bank, which provides a revolving
credit facility in the maximum aggregate principal amount of $75.0 million. Each loan drawn from the facility bears
interest at either a base rate of federal funds rate plus an applicable margin or a floating interest rate of LIBOR plus
an applicable margin, and matures no later than three years from the date of the draw. As of December 29, 2019, we
had $75.0 million in borrowing capacity under this limited recourse construction financing facility. We have not
drawn any amounts under this facility as of December 29, 2019.
Non-recourse Financing and Other Debt
In order to facilitate the construction, sale or ongoing operation of certain solar projects, including our residential
leasing program, we regularly obtain project-level financing. These financings are secured either by the assets of the
specific project being financed or by our equity in the relevant project entity and the lenders do not have recourse
to our general assets for repayment of such debt obligations, and hence the financings are referred to as non-recourse.
Non-recourse financing is typically in the form of loans from third-party financial institutions, but also takes other
forms, including partnership flip structures, sale-leaseback arrangements, or other forms commonly used in the solar
or similar industries. We may seek non-recourse financing covering solely the construction period of the solar project
or may also seek financing covering part or all of the operating life of the solar project. We classify non-recourse
financings on our consolidated balance sheets in accordance with their terms; however, in certain circumstances, we
may repay or refinance these financings prior to stated maturity dates in connection with the sale of the related project
or similar such circumstances.
138

We also enter other debt arrangements to finance operations. The following presents a summary of these
financing arrangements, including non-recourse debt:
Aggregate Carrying Value1
(In thousands)December 29,
2019December 30,
2018 Balance Sheet Classification
Commercial Non-Recourse Projects:Arizona loan2 . . . . . . . . . . . . . . . . . . . . . . . . . $ 6,111 $ 6,650 Short-term debt and Long-term debtCounty of San Diego loan3 . . . . . . . . . . . . . . 3,004 — Short-term debt
Other Debt:AUO debt4 . . . . . . . . . . . . . . . . . . . . . . . . . . . 37,749 39,084 Short-term debtHSBC financing program5 . . . . . . . . . . . . . . . 21,993 — Short-term debtOther debt6 . . . . . . . . . . . . . . . . . . . . . . . . . . . 1,831 3,040 Short-term debt and Long-term debt
1 Based on the nature of the debt arrangements included in the table above, and our intention to fully repay or transfer the obligations at theirface values plus any applicable interest, we believe their carrying value materially approximates fair value, which is categorized withinLevel 3 of the fair value hierarchy.
2 In fiscal 2013, we entered into a financing agreement with PNC Energy Capital, LLC to finance our construction projects. Interest iscalculated at a per annum rate equal to LIBOR plus 4.13%. The amount borrowed is non-recourse in nature and has an outstanding balanceof $6.1 million as of December 29, 2019.
3 On December 24, 2019, we entered into a financing agreement with Fifth Third Bank, National Association, to finance our constructionprojects. The amount borrowed is non-recourse in nature and cannot exceed the total costs of the project. Each draw bears interest basedon the LIBOR Rate and the Base Rate of the unpaid amount. The loan matures at the earliest of 85 days after the project is placed in service;9 months after the initial borrowing date; or the first anniversary of the Financial Closing Date.
4 In fiscal 2016, we entered into a financing agreement with the Standard Chartered Bank of Malaysia. The agreement allows for an amountoutstanding up to $50 million for a 90 day period. Interest is calculated as 1.50% per annum over LIBOR. As of December 29, 2019, wehad $37.7 million outstanding from this facility.
5 Relates to trade payables that are financed through a facility with a financial institution.
6 Relates to short-term financing and capital lease obligations.
Note 12. DERIVATIVE FINANCIAL INSTRUMENTS
The following tables present information about our hedge instruments measured at fair value on a recurring basis
as of December 29, 2019 and December 30, 2018, all of which utilize Level 2 inputs under the fair value hierarchy:
(In thousands)Balance SheetClassification
December 29,2019
December 30,2018
Assets:Derivatives designated as hedging instruments:
Foreign currency option contracts . . . . . . . . . . . . . . . . . . . Prepaid expenses and
other current assets $ 514 $ —
$ 514 $ —
Derivatives not designated as hedging instruments:Foreign currency forward exchange contracts . . . . . . . . . Prepaid expenses and
other current assets $ 488 $ 729
$ 488 $ 729
Liabilities:Derivatives designated as hedging instruments:
Foreign currency forward exchange contracts . . . . . . . . . Accrued liabilities $ 461 $ —Foreign currency option contracts . . . . . . . . . . . . . . . . . . . Accrued liabilities 922 —Interest rate swap contracts . . . . . . . . . . . . . . . . . . . . . . . . Other long-term
liabilities 373 152
$1,756 $ 152
Derivatives not designated as hedging instruments:Foreign currency forward exchange contracts . . . . . . . . . Accrued liabilities $ 579 $1,161
$ 579 $1,161
139

December 29, 2019
Gross Amounts Not Offset in theConsolidated Balance Sheets, but
Have Rights to Offset
(In thousands)
GrossAmounts
Recognized
GrossAmounts
OffsetNet Amounts
PresentedFinancial
Instruments Cash Collateral Net Amounts
Derivative assets . . . . . . . . . . . . . . . . . $1,002 $— $1,002 $1,002 $— $ —
Derivative liabilities. . . . . . . . . . . . . . . 2,335 — 2,335 1,002 — 1,333
December 30, 2018
Gross Amounts Not Offset in theConsolidated Balance Sheets, but
Have Rights to Offset
(In thousands)
GrossAmounts
Recognized
GrossAmounts
OffsetNet Amounts
PresentedFinancial
Instruments Cash Collateral Net Amounts
Derivative assets . . . . . . . . . . . . . . . . . $ 729 $— $ 729 $729 $— $ —
Derivative liabilities. . . . . . . . . . . . . . . 1,313 — 1,313 729 — 584
The following table summarizes the pre-tax amount of unrealized gain or loss recognized in ‘‘accumulated other
comprehensive income’’ (‘‘OCI’’) in ‘‘stockholders’ equity’’ on our consolidated balance sheets:
Fiscal Year
(In thousands) 2019 2018 2017
Derivatives designated as cash flow hedges:
Loss in OCI at the beginning of the period . . . . . . . . . . . . . . . . . . . . . . . . . . . . . . . . . . . $ (164) $(561) $ 1,203
Unrealized gain (loss) recognized in OCI (effective portion) . . . . . . . . . . . . . . . . . . . 737 414 (905)
Less: Gain reclassified from OCI to revenue (effective portion of FX trades) . . . . . (1,836) (35) (1,137)
Less: Loss reclassified from OCI to interest expense (effective portion of interest
rate swaps) . . . . . . . . . . . . . . . . . . . . . . . . . . . . . . . . . . . . . . . . . . . . . . . . . . . . . . . . . 5 18 278
Net gain (loss) on derivatives . . . . . . . . . . . . . . . . . . . . . . . . . . . . . . . . . . . . . . . . . . . . . . (1,094) 397 (1,764)
Loss in OCI at the end of the period . . . . . . . . . . . . . . . . . . . . . . . . . . . . . . . . . . . . . . . . $(1,258) $(164) $ (561)
The following table summarizes the amount of gain or loss recognized in ‘‘other, net’’ in our consolidated
statements of operations in the year ended December 29, 2019, December 30, 2018 and December 31, 2017:
Fiscal Year
(In thousands) 2019 2018 2017
Derivatives designated as cash flow hedges:
Gain recognized in ‘‘Other, net’’ on derivatives (ineffective portion and amount
excluded from effectiveness testing) . . . . . . . . . . . . . . . . . . . . . . . . . . . . . . . . . . . . . . $392 $ — $ 254
Derivatives not designated as hedging instruments:
Gain (loss) recognized in ‘‘Other, net’’ . . . . . . . . . . . . . . . . . . . . . . . . . . . . . . . . . . . . . . $ 42 $(2,904) $1,635
Foreign Currency Exchange Risk
Designated Derivatives Hedging Cash Flow Exposure
Our cash flow exposure primarily relates to anticipated third-party foreign currency revenues and expenses and
interest rate fluctuations. We derive a portion of our revenues in foreign currencies, predominantly in Euros, as part
of our ongoing business operations. In addition, a portion of our assets are held in foreign currencies. We enter into
foreign currency forward contracts and at times, option contracts designated as cash flow hedges to hedge certain
forecasted revenue transactions denominated in currencies other than our functional currency. Our foreign currency
forward and option contracts are entered into for periods consistent with the related underlying exposures and do not
constitute positions that are independent of those exposures.
140

As of December 29, 2019 and December 30, 2018, we had designated outstanding cash flow hedge forward
contracts with a notional value of $48.9 million and zero, respectively. As of December 29, 2019 and December 30,
2018, we also had designated outstanding cash flow hedge option contracts with a notional value of $142.9 million
and zero, respectively. We designate either gross external or intercompany revenue up to our net economic exposure.
These derivatives have a maturity of six months or less and consist of foreign currency forward and option contracts.
The effective portion of these cash flow hedges is reclassified into revenue when third-party revenue is recognized
in our consolidated statements of operations.
Non-Designated Derivatives Hedging Transaction Exposure
Derivatives not designated as hedging instruments consist of forward and option contracts used to hedge
re-measurement of foreign currency denominated monetary assets and liabilities primarily for intercompany
transactions, receivables from customers, and payables to third parties. Changes in exchange rates between our
subsidiaries’ functional currencies and the currencies in which these assets and liabilities are denominated can create
fluctuations in our reported consolidated financial position, results of operations and cash flows. As of December 29,
2019, to hedge balance sheet exposure, we held forward contracts with an aggregate notional value of $17.5 million.
These foreign currency forward contracts have maturity of one month or less. As of December 30, 2018, to hedge
balance sheet exposure, we held forward contracts with an aggregate notional value of $11.4 million. These contracts
matured in January 2019.
Interest Rate Risk
We also enter into interest rate swap agreements to reduce the impact of changes in interest rates on our project
specific non-recourse floating rate debt. As of December 29, 2019 and December 30, 2018, we had interest rate swap
agreements designated as cash flow hedges with aggregate notional values of $6.1 million and $6.7 million,
respectively. These swap agreements allow us to effectively convert floating-rate payments into fixed rate payments
periodically over the life of the agreements. These derivatives have a maturity of more than 12 months. The effective
portion of these swap agreements designated as cash flow hedges is reclassified into interest expense when the
hedged transactions are recognized in our consolidated statements of operations. We analyze our designated interest
rate swaps quarterly to determine if the hedge transaction remains effective or ineffective. We may discontinue hedge
accounting for interest rate swaps prospectively if certain criteria are no longer met, the interest rate swap is
terminated or exercised, or if we elect to remove the cash flow hedge designation. If hedge accounting is
discontinued, and the forecasted hedged transaction is considered possible to occur, the previously recognized gain
or loss on the interest rate swaps will remain in accumulated other comprehensive loss and will be reclassified into
earnings during the same period the forecasted hedged transaction affects earnings or is otherwise deemed
improbable to occur. All changes in the fair value of non-designated interest rate swap agreements are recognized
immediately in current period earnings.
Credit Risk
Our option and forward contracts do not contain any credit-risk-related contingent features. We are exposed to
credit losses in the event of nonperformance by the counterparties to these option and forward contracts. We enter
into derivative contracts with high-quality financial institutions and limit the amount of credit exposure to any single
counterparty. In addition, we continuously evaluate the credit standing of our counterparties.
141

Note 13. INCOME TAXES
In the year ended December 29, 2019, our income tax provision of $26.6 million on a profit before income taxes
and equity in earnings (losses) of unconsolidated investees of $26.0 million was primarily due to tax expense in
foreign jurisdictions that were profitable. In the year ended December 30, 2018, our income tax provision of
$1.0 million on a loss before income taxes and equity in earnings of unconsolidated investees of $898.7 million was
primarily due to tax expense in foreign jurisdictions that were profitable, offset by tax benefit related to release of
valuation allowance in a foreign jurisdiction, and by a release of tax reserves due to lapse of statutes of limitation.
The geographic distribution of income (loss) from continuing operations before income taxes and equity
earnings (losses) of unconsolidated investees and the components of provision for income taxes are summarized
below:
Fiscal Year
(In thousands)December 29,
2019December 30,
2018December 31,
2017
Geographic distribution of income (loss) from continuing operations
before income taxes and equity in earnings of unconsolidated
investees:U.S. loss. . . . . . . . . . . . . . . . . . . . . . . . . . . . . . . . . . . . . . . . . . . . . . . . . $ (84,071) $(778,316) $(1,242,000)Non-U.S. income (loss). . . . . . . . . . . . . . . . . . . . . . . . . . . . . . . . . . . . . 110,040 (120,355) 41,250
Income (loss) before income taxes and equity in earnings (loss) of
unconsolidated investees . . . . . . . . . . . . . . . . . . . . . . . . . . . . . . . . . . . . . . $ 25,969 $(898,671) $(1,200,750)
Provision for income taxes:Current tax (expense) benefit
Federal . . . . . . . . . . . . . . . . . . . . . . . . . . . . . . . . . . . . . . . . . . . . . . . . . . $ (328) $ (1,155) $ 6,816State . . . . . . . . . . . . . . . . . . . . . . . . . . . . . . . . . . . . . . . . . . . . . . . . . . . . (370) (553) 6,575Foreign . . . . . . . . . . . . . . . . . . . . . . . . . . . . . . . . . . . . . . . . . . . . . . . . . . (24,588) (4,100) (12,074)
Total current tax (expense) benefit . . . . . . . . . . . . . . . . . . . . . . . . . . (25,286) (5,808) 1,317
Deferred tax (expense) benefitFederal . . . . . . . . . . . . . . . . . . . . . . . . . . . . . . . . . . . . . . . . . . . . . . . . . . (100) — —State . . . . . . . . . . . . . . . . . . . . . . . . . . . . . . . . . . . . . . . . . . . . . . . . . . . . — — 1,450Foreign . . . . . . . . . . . . . . . . . . . . . . . . . . . . . . . . . . . . . . . . . . . . . . . . . . (1,245) 4,798 1,177
Total deferred tax (expense) benefit . . . . . . . . . . . . . . . . . . . . . . . . . (1,345) 4,798 2,627
(Provision for) benefit from income taxes . . . . . . . . . . . . . . . . . . . . . . . . . . (26,631) $ (1,010) $ 3,944
The (provision for) benefit from for income taxes differs from the amounts obtained by applying the statutory
U.S. federal tax rate to income before taxes as shown below:
Fiscal Year
(In thousands)December 29,
2019December 30,
2018December 31,
2017
Statutory rate . . . . . . . . . . . . . . . . . . . . . . . . . . . . . . . . . . . . . . . . . . . . 21% 21% 35%Tax benefit (expense) at U.S. statutory rate . . . . . . . . . . . . . . . . . . . . $ (5,454) $ 188,721 $ 420,263Foreign rate differential . . . . . . . . . . . . . . . . . . . . . . . . . . . . . . . . . . . . (4,077) (28,502) (12,282)State income taxes, net of benefit . . . . . . . . . . . . . . . . . . . . . . . . . . . . (370) (395) (482)Section 956 and Subpart F . . . . . . . . . . . . . . . . . . . . . . . . . . . . . . . . . (4,774) (1,516) (1,264)Tax credits (investment tax credit and other) . . . . . . . . . . . . . . . . . . . 2,684 4,727 8,132Change in valuation allowance . . . . . . . . . . . . . . . . . . . . . . . . . . . . . . (4,027) (105,363) (143,804)Unrecognized tax benefits . . . . . . . . . . . . . . . . . . . . . . . . . . . . . . . . . . (3,245) 2,345 2,430Non-controlling interest income . . . . . . . . . . . . . . . . . . . . . . . . . . . . . (4,482) (22,763) 17,705Global intangible low-taxed income (‘‘GILTI’’) . . . . . . . . . . . . . . . . (1,278) (36,455) —Section 163L interest . . . . . . . . . . . . . . . . . . . . . . . . . . . . . . . . . . . . . . (1,299) (1,432) (2,691)Effects of tax reform . . . . . . . . . . . . . . . . . . . . . . . . . . . . . . . . . . . . . . — — (302,899)Other, net . . . . . . . . . . . . . . . . . . . . . . . . . . . . . . . . . . . . . . . . . . . . . . . (309) (377) 18,836
Total . . . . . . . . . . . . . . . . . . . . . . . . . . . . . . . . . . . . . . . . . . . . . . . . . $(26,631) $ (1,010) $ 3,944
142

As of
(In thousands)December 29,
2019December 30,
2018
Deferred tax assets:Net operating loss carryforwards . . . . . . . . . . . . . . . . . . . . . . . . . . . . . . . . . . . . . . $ 245,617 $ 225,489Tax credit carryforwards . . . . . . . . . . . . . . . . . . . . . . . . . . . . . . . . . . . . . . . . . . . . . 52,358 55,527Reserves and accruals . . . . . . . . . . . . . . . . . . . . . . . . . . . . . . . . . . . . . . . . . . . . . . . 62,108 241,194Stock-based compensation stock deductions . . . . . . . . . . . . . . . . . . . . . . . . . . . . . 3,923 9,316Basis difference on third-party project sales . . . . . . . . . . . . . . . . . . . . . . . . . . . . . 58,109 50,648Identified intangible assets . . . . . . . . . . . . . . . . . . . . . . . . . . . . . . . . . . . . . . . . . . . 6,749 —Other. . . . . . . . . . . . . . . . . . . . . . . . . . . . . . . . . . . . . . . . . . . . . . . . . . . . . . . . . . . . . 17,629 2,081
Total deferred tax assets . . . . . . . . . . . . . . . . . . . . . . . . . . . . . . . . . . . . . . . . . . . . . . . $ 446,493 $ 584,255Valuation allowance . . . . . . . . . . . . . . . . . . . . . . . . . . . . . . . . . . . . . . . . . . . . . . . . . . . (344,117) (404,923)
Total deferred tax assets, net of valuation allowance. . . . . . . . . . . . . . . . . . . . . . . . . $ 102,376 $ 179,332
Deferred tax liabilities:Other intangible assets and accruals . . . . . . . . . . . . . . . . . . . . . . . . . . . . . . . . . . . . (2,331) —Fixed asset basis difference. . . . . . . . . . . . . . . . . . . . . . . . . . . . . . . . . . . . . . . . . . . (20,302) (151,192)Investment in Enphase. . . . . . . . . . . . . . . . . . . . . . . . . . . . . . . . . . . . . . . . . . . . . . . (37,640) —Other. . . . . . . . . . . . . . . . . . . . . . . . . . . . . . . . . . . . . . . . . . . . . . . . . . . . . . . . . . . . . (30,731) (14,882)
Total deferred tax liabilities. . . . . . . . . . . . . . . . . . . . . . . . . . . . . . . . . . . . . . . . . . . . . $ (91,004) $(166,074)
Net deferred tax asset . . . . . . . . . . . . . . . . . . . . . . . . . . . . . . . . . . . . . . . . . . . . . . . . . $ 11,372 $ 13,258
As of December 29, 2019, we had federal net operating loss carryforwards of $839.8 million for tax purposes
of which $133.4 million was generated in fiscal 2018 and thereafter and can be carried forward indefinitely under
the Tax Cuts and Job Acts of 2017 (‘‘The Tax Act’’). The remaining federal net operating loss carry forward of
$706.4 million, which were generated prior to 2018, will expire at various dates from 2031 to 2037. As of
December 29, 2019, we had California state net operating loss carryforwards of approximately $876.1 million for tax
purposes, of which $5.2 million relate to debt issuance and will benefit equity when realized. These California net
operating loss carryforwards will expire at various dates from 2029 to 2039. We also had credit carryforwards of
approximately $68.2 million for federal tax purposes, of which $16.6 million relate to debt issuance and will benefit
equity when realized. We had California credit carryforwards of $9.0 million for state tax purposes, of which
$4.7 million relate to debt issuance and will benefit equity when realized. These federal credit carryforwards will
expire at various dates from 2019 to 2039, and the California credit carryforwards do not expire. Our ability to utilize
a portion of the net operating loss and credit carryforwards is dependent upon our being able to generate taxable
income in future periods or being able to carryback net operating losses to prior year tax returns. Our ability to utilize
net operating losses may be limited due to restrictions imposed on utilization of net operating loss and credit
carryforwards under federal and state laws upon a change in ownership.
We are subject to tax holidays in the Philippines where we manufacture our solar power products. Our current
income tax holidays were granted as manufacturing lines were placed in service. Tax holidays in the Philippines
reduce our tax rate to 0% from 30%. Tax savings associated with the Philippines tax holidays were approximately
$4.0 million, $3.4 million and $5.6 million in fiscal 2019, 2018 and 2017, respectively, which provided a diluted net
income (loss) per share benefit of $0.03, $0.02 and $0.04, respectively.
We qualify for the auxiliary company status in Switzerland where we sell our solar power products.
The auxiliary company status entitles us to a reduced tax rate of 11.5% in Switzerland from approximately 24.2%.
Tax savings associated with this ruling were approximately $2.3 million, $1.8 million and $2.4 million in fiscal 2019,
2018 and 2017, respectively, which provided a diluted net income (loss) per share benefit of $0.02, $0.01 and $0.02,
respectively.
We are subject to tax holidays in Malaysia where we manufacture our solar power products. Our current tax
holidays in Malaysia were granted to its former joint venture AUOSP (now a wholly-owned subsidiary). Tax holidays
in Malaysia reduce our tax rate to 0% from 24%. Tax savings associated with the Malaysia tax holiday were
approximately $3.9 million, $7.6 million, and $6.8 million in fiscal 2019, 2018, and 2017, respectively, which
provided a diluted net income (loss) per share benefit of $0.03, $0.05, and $0.05, respectively.
143

A material amount of our total revenue is generated from customers located outside of the United States, and
a substantial portion of our assets and employees are located outside of the United States. Because of the one-time
transition tax related to the Tax Cuts and Jobs Act enacted in 2017, a significant portion of the accumulated foreign
earnings were deemed to have been repatriated, and accordingly taxed, and were no longer subject to the U.S. federal
deferred tax liability. Although a portion of the accumulated foreign earnings may still be subject to foreign income
tax or withholding tax liability upon repatriations, the accumulated foreign earnings are intended to be indefinitely
reinvested in our foreign subsidiaries; therefore, no such foreign taxes have been provided. Determination of the
amount of unrecognized deferred tax liability related to these earnings is not practicable.
In June 2019, the U.S. Court of Appeals for the Ninth Circuit overturned the 2015 U.S. tax court decision in
Altera Co v. Commissioner, regarding the inclusion of stock-based compensation costs under cost sharing
agreements. In July 2019, Altera Corp., a subsidiary of Intel Inc., requested en banc review of the decision from the
Ninth Circuit panel and the request was denied in November 2019. In February 2020, Altera Corp. petitioned the U.S.
Supreme Court for review. While a final decision remains outstanding, we quantified and recorded the impact of the
case of $5.8 million as reduction to deferred tax asset, fully offset by a reduction to valuation allowance of the same
amount, without any income tax expense impact. If the Altera Ninth Circuit opinion is reversed by the U.S. Supreme
Court, we would anticipate unwinding the reduction to both deferred tax asset and valuation allowance impact as
aforementioned. We will continue to monitor the effects of the case’s outcome on our tax provision and related
disclosures once more information becomes available. We will continue to monitor the effects of the case’s outcome
on our tax provision and related disclosures once more information becomes available.
Valuation Allowance
Our valuation allowance is related to deferred tax assets in the United States, Malta, South Africa, Mexico, and
Spain and was determined by assessing both positive and negative evidence. When determining whether it is more
likely than not that deferred assets are recoverable, with such assessment being required on a jurisdiction by
jurisdiction basis, we believe that sufficient uncertainty exists with regard to the realizability of these assets such that
a valuation allowance is necessary. Factors considered in providing a valuation allowance include the lack of a
significant history of consistent profits, the lack of consistent profitability in the solar industry, the limited capacity
of carrybacks to realize these assets, and other factors. Based on the absence of sufficient positive objective evidence,
we are unable to assert that it is more likely than not that we will generate sufficient taxable income to realize net
deferred tax assets aside from the U.S. net operating losses that can be carried back to prior year tax returns. Should
we achieve a certain level of profitability in the future, we may be in a position to reverse the valuation allowance
which would result in a non-cash income statement benefit. The change in valuation allowance for fiscal 2019, 2018
and 2017 was $60.8 million, $43.8 million and $151.2 million, respectively.
Unrecognized Tax Benefits
Current accounting guidance contains a two-step approach to recognizing and measuring uncertain tax positions.
The first step is to evaluate the tax position for recognition by determining if the weight of available evidence
indicates that it is more likely than not that the position will be sustained on audit, including resolution of related
appeals or litigation processes, if any. The second step is to measure the tax benefit as the largest amount that is more
than 50% likely of being realized upon ultimate settlement.
A reconciliation of the beginning and ending amounts of unrecognized tax benefits during fiscal 2019, 2018, and
2017 is as follows:
Fiscal Year
(In thousands)December 29,
2019December 30,
2018December 31,
2017
Balance, beginning of year. . . . . . . . . . . . . . . . . . . . . . . . . . . . . . . . . . . . $103,884 $105,959 $ 82,253Additions for tax positions related to the current year . . . . . . . . . . . . 2,517 2,404 2,478Additions for tax positions from prior years . . . . . . . . . . . . . . . . . . . . 1,624 451 22,151Reductions for tax positions from prior years/statute of
limitations expirations . . . . . . . . . . . . . . . . . . . . . . . . . . . . . . . . . . . (416) (2,468) (1,460)Foreign exchange (gain) loss . . . . . . . . . . . . . . . . . . . . . . . . . . . . . . . . (668) (2,462) 537
Balance at the end of the period . . . . . . . . . . . . . . . . . . . . . . . . . . . . . . . $106,941 $103,884 $105,959
Included in the unrecognized tax benefits at fiscal 2019 and 2018 is $38.2 million and $36.7 million,
respectively, that if recognized, would result in a reduction of our effective tax rate. The amounts differ from the
144

long-term liability recorded of $20.1 million and $16.8 million as of fiscal 2019 and 2018, respectively, due to
accrued interest and penalties, as well as unrecognized tax benefits of French and Italian entities that are recorded
against deferred tax asset balances without valuation allowance.
We believe that events that could occur in the next 12 months and cause a change in unrecognized tax benefits
include, but are not limited to, the following:
• commencement, continuation or completion of examinations of our tax returns by the U.S. or foreign taxing
authorities; and
• expiration of statutes of limitation on our tax returns.
The calculation of unrecognized tax benefits involves dealing with uncertainties in the application of complex
global tax regulations. Uncertainties include, but are not limited to, the impact of legislative, regulatory and judicial
developments, transfer pricing and the application of withholding taxes. We regularly assess our tax positions in light
of legislative, bilateral tax treaty, regulatory and judicial developments in the countries in which we do business.
We determined that an estimate of the range of reasonably possible change in the amounts of unrecognized tax
benefits within the next 12 months cannot be made.
Classification of Interests and Penalties
We accrue interest and penalties on tax contingencies and classify them as ‘‘provision for income taxes’’ in our
consolidated statements of operations. Accrued interest as of December 29, 2019 and December 30, 2018 was
approximately $2.9 million and $2.1 million, respectively. Accrued penalties were not material for any of the periods
presented.
Tax Years and Examination
We file tax returns in each jurisdiction in which we are registered to do business. In the United States and many
of the state jurisdictions, and in many foreign countries in which we file tax returns, a statute of limitations period
exists. After a statute of limitations period expires, the respective tax authorities may no longer assess additional
income tax for the expired period. Similarly, we are no longer eligible to file claims for refund for any tax that we
may have overpaid. The following table summarizes our major tax jurisdictions and the tax years that remain subject
to examination by these jurisdictions as of December 29, 2019:
Tax Jurisdictions Tax Years
United States 2010 and onward
California 2002 and onward
Switzerland 2014 and onward
Philippines 2009 and onward
France 2016 and onward
Italy 2015 and onward
Additionally, certain pre-2010 U.S. corporate tax returns and pre-2002 California tax returns are not open for
assessment but the tax authorities can adjust net operating loss and credit carryovers that were generated.
We are under tax examinations in various jurisdictions. We do not expect the examinations to result in a material
assessment outside of existing reserves. If a material assessment in excess of current reserves results, the amount that
the assessment exceeds current reserves will be a current period charge to earnings.
Note 14. COMMON STOCK
Common Stock
Voting Rights - Common Stock
All common stock holders are entitled to one vote per share on all matters submitted to be voted on by our
stockholders, subject to the preferences applicable to any preferred stock outstanding.
145

Dividends - Common Stock
All common stock holders are entitled to receive equal per share dividends when and if declared by the Board
of Directors, subject to the preferences applicable to any preferred stock outstanding. Certain of our debt agreements
place restrictions on us and our subsidiaries’ ability to pay cash dividends.
Common Stock Offering
In November 2019, we completed an offering of 25,300,000 shares of our common stock at a price of $7.00 per
share, which included 3,300,000 shares issued and sold pursuant to the underwriter’s exercise in full of its option to
purchase additional shares, for gross proceeds of $177.1 million. We received net proceeds of $171.8 million from
the offering, after deducting underwriter fees and discounts. We incurred other expenses of $1.1 million for the
transaction which was recorded in APIC. In addition, we incurred incremental organizational costs in connection with
the offering of $1.3 million which was recorded in the consolidated statement of operations.
Shares Reserved for Future Issuance Under Equity Compensation Plans
We had shares of common stock reserved for future issuance as follows:
(In thousands)December 29,
2019December 30,
2018
Equity compensation plans. . . . . . . . . . . . . . . . . . . . . . . . . . . . . . . . . . . . . . . . . . . . . . . . 12,1171 11,183
1 On November 13, 2018, we filed post-effective amendments to registration statements in order to deregister shares of common stock thatare no longer required to be registered for issuance under our stock incentive plans. Other than with respect to the SunPower Corporation2015 Omnibus Incentive Plan, no further awards have been issued under the prior plans and no awards remain outstanding as ofDecember 29, 2019. See ‘‘Note 16. Stock-Based Compensation’’ for additional information.
Note 15. NET INCOME (LOSS) PER SHARE
We calculate basic net income (loss) per share by dividing earnings allocated to common stockholders by the
basic weighted-average number of common shares outstanding for the period.
Diluted weighted-average shares is computed using basic weighted-average number of common shares
outstanding plus any potentially dilutive securities outstanding during the period using the treasury-stock-type
method and the if-converted method, except when their effect is anti-dilutive. Potentially dilutive securities include
stock options, restricted stock units, and the outstanding senior convertible debentures.
The following table presents the calculation of basic and diluted net income (loss) per share attributable to
stockholders:
Fiscal Year Ended
(In thousands, except per share amounts)December 29,
2019December 30,
2018December 31,
2017
Basic net income (loss) per share:
Numerator:
Net income (loss) attributable to stockholders. . . . . . . . . . . . . . . . . . . $ 22,159 $(811,091) $(929,121)
Denominator:
Basic weighted-average common shares . . . . . . . . . . . . . . . . . . . . . . . 144,796 140,825 139,370
Basic net income (loss) per share. . . . . . . . . . . . . . . . . . . . . . . . . . . . . . . $ 0.15 $ (5.76) $ (6.67)
Diluted net income (loss) per share1
Numerator:
Net income (loss) attributable to stockholders. . . . . . . . . . . . . . . . . . . $ 22,159 $(811,091) $(929,121)
Net income (loss) available to common stockholders . . . . . . . . . . . . . . . $ 22,159 $(811,091) $(929,121)
146
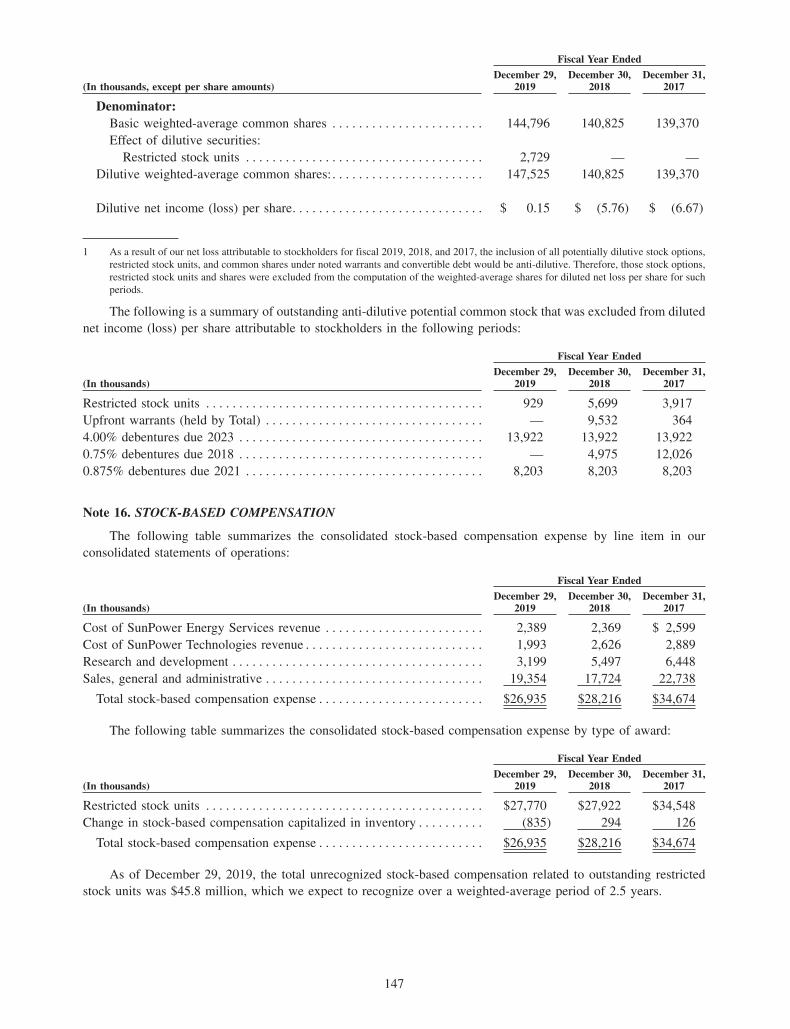
Fiscal Year Ended
(In thousands, except per share amounts)December 29,
2019December 30,
2018December 31,
2017
Denominator:
Basic weighted-average common shares . . . . . . . . . . . . . . . . . . . . . . . 144,796 140,825 139,370
Effect of dilutive securities:
Restricted stock units . . . . . . . . . . . . . . . . . . . . . . . . . . . . . . . . . . . . 2,729 — —
Dilutive weighted-average common shares: . . . . . . . . . . . . . . . . . . . . . . . 147,525 140,825 139,370
Dilutive net income (loss) per share. . . . . . . . . . . . . . . . . . . . . . . . . . . . . $ 0.15 $ (5.76) $ (6.67)
1 As a result of our net loss attributable to stockholders for fiscal 2019, 2018, and 2017, the inclusion of all potentially dilutive stock options,
restricted stock units, and common shares under noted warrants and convertible debt would be anti-dilutive. Therefore, those stock options,
restricted stock units and shares were excluded from the computation of the weighted-average shares for diluted net loss per share for such
periods.
The following is a summary of outstanding anti-dilutive potential common stock that was excluded from diluted
net income (loss) per share attributable to stockholders in the following periods:
Fiscal Year Ended
(In thousands)December 29,
2019December 30,
2018December 31,
2017
Restricted stock units . . . . . . . . . . . . . . . . . . . . . . . . . . . . . . . . . . . . . . . . . . 929 5,699 3,917
Upfront warrants (held by Total) . . . . . . . . . . . . . . . . . . . . . . . . . . . . . . . . . — 9,532 364
4.00% debentures due 2023 . . . . . . . . . . . . . . . . . . . . . . . . . . . . . . . . . . . . . 13,922 13,922 13,922
0.75% debentures due 2018 . . . . . . . . . . . . . . . . . . . . . . . . . . . . . . . . . . . . . — 4,975 12,026
0.875% debentures due 2021 . . . . . . . . . . . . . . . . . . . . . . . . . . . . . . . . . . . . 8,203 8,203 8,203
Note 16. STOCK-BASED COMPENSATION
The following table summarizes the consolidated stock-based compensation expense by line item in our
consolidated statements of operations:
Fiscal Year Ended
(In thousands)December 29,
2019December 30,
2018December 31,
2017
Cost of SunPower Energy Services revenue . . . . . . . . . . . . . . . . . . . . . . . . 2,389 2,369 $ 2,599
Cost of SunPower Technologies revenue . . . . . . . . . . . . . . . . . . . . . . . . . . . 1,993 2,626 2,889
Research and development . . . . . . . . . . . . . . . . . . . . . . . . . . . . . . . . . . . . . . 3,199 5,497 6,448
Sales, general and administrative . . . . . . . . . . . . . . . . . . . . . . . . . . . . . . . . . 19,354 17,724 22,738
Total stock-based compensation expense . . . . . . . . . . . . . . . . . . . . . . . . . $26,935 $28,216 $34,674
The following table summarizes the consolidated stock-based compensation expense by type of award:
Fiscal Year Ended
(In thousands)December 29,
2019December 30,
2018December 31,
2017
Restricted stock units . . . . . . . . . . . . . . . . . . . . . . . . . . . . . . . . . . . . . . . . . . $27,770 $27,922 $34,548
Change in stock-based compensation capitalized in inventory . . . . . . . . . . (835) 294 126
Total stock-based compensation expense . . . . . . . . . . . . . . . . . . . . . . . . . $26,935 $28,216 $34,674
As of December 29, 2019, the total unrecognized stock-based compensation related to outstanding restricted
stock units was $45.8 million, which we expect to recognize over a weighted-average period of 2.5 years.
147

Equity Incentive Programs
Stock-based Incentive Plans
During fiscal 2019, SunPower had one stock incentive plan: the SunPower Corporation 2015 Omnibus Incentive
Plan (‘‘2015 Plan’’). The 2015 Plan was adopted by our Board of Directors in February 2015 and was approved by
stockholders in June 2015. The 2015 Plan allows for the grant of options, as well as grant of stock appreciation rights,
restricted stock grants, restricted stock units and other equity rights. The 2015 Plan also allows for tax withholding
obligations related to stock option exercises or restricted stock awards to be satisfied through the retention of shares
otherwise released upon vesting.
The 2015 Plan includes an automatic annual increase mechanism equal to the lower of three percent of the
outstanding shares of all classes of our common stock measured on the last day of the immediately preceding fiscal
year, 6 million shares, or such other number of shares as determined by our Board of Directors. In fiscal 2015, our
Board of Directors voted to reduce the stock incentive plan’s automatic increase from 3% to 2% for 2016. As of
December 29, 2019, approximately 12.1 million shares were available for grant under the 2015 Plan.
Incentive stock options, nonstatutory stock options, and stock appreciation rights may be granted at no less than
the fair value of the common stock on the date of grant. The options and rights become exercisable when and as
determined by our Board of Directors, although these terms generally do not exceed ten years for stock options.
We have not granted stock options since fiscal 2008. All previously granted stock options have been exercised or
expired and accordingly no options remain outstanding. Under the 2015 Plan, the restricted stock grants and restricted
stock units typically vest in equal installments annually over three or four years.
The majority of shares issued are net of the minimum statutory withholding requirements that we pay on behalf
of our employees. During fiscal 2019, 2018, and 2017, we withheld 0.8 million, 0.7 million and 0.6 million shares,
respectively, to satisfy the employees’ tax obligations. We pay such withholding requirements in cash to the
appropriate taxing authorities. Shares withheld are treated as common stock repurchases for accounting and
disclosure purposes and reduce the number of shares outstanding upon vesting.
Restricted Stock Units and Stock Options
The following table summarizes our non-vested restricted stock units’ activities:
Restricted Stock Units
Shares(in thousands)
Weighted-AverageGrant Date FairValue Per Share1
Outstanding as of December 31, 2017 . . . . . . . . . . . . . . . . . . . . . . . . . . . . . . . . . . . . 7,293 $11.83
Granted . . . . . . . . . . . . . . . . . . . . . . . . . . . . . . . . . . . . . . . . . . . . . . . . . . . . . . . . . . . 4,449 7.77
Vested2 . . . . . . . . . . . . . . . . . . . . . . . . . . . . . . . . . . . . . . . . . . . . . . . . . . . . . . . . . . . (2,266) 14.45
Forfeited . . . . . . . . . . . . . . . . . . . . . . . . . . . . . . . . . . . . . . . . . . . . . . . . . . . . . . . . . . (1,816) 10.10
Outstanding as of December 30, 2018 . . . . . . . . . . . . . . . . . . . . . . . . . . . . . . . . . . . . 7,660 9.11
Granted . . . . . . . . . . . . . . . . . . . . . . . . . . . . . . . . . . . . . . . . . . . . . . . . . . . . . . . . . . . 5,430 6.82
Vested2 . . . . . . . . . . . . . . . . . . . . . . . . . . . . . . . . . . . . . . . . . . . . . . . . . . . . . . . . . . . (2,460) 9.65
Forfeited . . . . . . . . . . . . . . . . . . . . . . . . . . . . . . . . . . . . . . . . . . . . . . . . . . . . . . . . . . (1,304) 8.28
Outstanding as of December 29, 2019 . . . . . . . . . . . . . . . . . . . . . . . . . . . . . . . . . . . . 9,326 7.75
1 We estimate the fair value of our restricted stock awards and units at our stock price on the grant date.
2 Vested restricted stock awards include shares withheld on behalf of employees to satisfy the minimum statutory tax withholdingrequirements.
There were no options outstanding and exercisable as of December 29, 2019. The intrinsic value of the options
exercised in fiscal 2019, 2018, and 2017 were zero, zero, and $1.7 thousand, respectively. There were no stock
options granted in fiscal 2019, 2018, and 2017.
Note 17. SEGMENT AND GEOGRAPHICAL INFORMATION
Our SunPower Energy Services Segment (‘‘SunPower Energy Services’’ or ‘‘Downstream’’) refers to sales of
solar energy solutions in the North America region previously included in the legacy Residential Segment and
148
Commercial Segment including direct sales of turn-key engineering, procurement and construction (‘‘EPC’’)
services, sales to our third-party dealer network, sales of energy under power purchase agreements (‘‘PPAs’’), storage
solutions, cash sales and long-term leases directly to end customers, and sales to resellers. SunPower Energy Services
Segment also includes sales of our global O&M services. Our SunPower Technologies Segment (‘‘SunPower
Technologies’’ or ‘‘Upstream’’) refers to our technology development, worldwide solar panel manufacturing
operations, equipment supply to resellers and commercial and residential end-customers outside of North America
(‘‘International DG’’), and worldwide power plant project development and project sales. Upon reorganization, some
support functions and responsibilities, which previously resided within the corporate function, have been shifted to
each segment, including financial planning and analysis, legal, treasury, tax and accounting support and services,
among others.
Our Chief Executive Officer, as the chief operating decision maker (‘‘CODM’’), reviews our business, manages
resource allocations and measures performance of our activities between the SunPower Energy Services Segment and
the SunPower Technologies Segment.
Reclassifications of prior period segment information have been made to conform to the current period
presentation.
Adjustments Made for Segment Purposes
Adjustments Based on International Financial Reporting Standards (‘‘IFRS’’)
8point3 Energy Partners
We included adjustments related to the sales of projects contributed to 8point3 based on the difference between
the fair value of the consideration received and the net carrying value of the projects contributed, of which, a portion
was deferred in proportion to our retained equity stake in 8point3. The deferred profit was subsequently recognized
over time. Under GAAP, these sales were recognized under either real estate, lease, or consolidation accounting
guidance depending upon the nature of the individual asset contributed, with outcomes ranging from no, partial, or
full profit recognition. Under IFRS, profit was recognized on sales related to the residential lease portfolio, while for
other projects sold, profit was deferred until these projects reached commercial operations. Equity in earnings of
unconsolidated investees also included the impact of our share of 8point3’s earnings related to sales of projects
receiving sales recognition under IFRS but not GAAP. On June 19, 2018, we sold our equity interest in the 8point3
Group.
Legacy utility and power plant projects
We included adjustments related to the revenue recognition of certain utility and power plant projects based on
percentage-of-completion accounting and, when relevant, the allocation of revenue and margin to our project
development efforts at the time of initial project sale. Under IFRS, such projects are accounted for when the customer
obtains control of the promised goods or services which generally results in earlier recognition of revenue and profit
than U.S. GAAP. Over the life of each project, cumulative revenue and gross margin will eventually be equivalent
under both GAAP and IFRS; however, revenue and gross margin will generally be recognized earlier under IFRS.
Legacy sale-leaseback transactions
We include adjustments related to the revenue recognition on certain legacy sale-leaseback transactions entered
into before December 31, 2018, based on the net proceeds received from the buyer-lessor. Under U.S. GAAP, these
transactions were accounted for under the financing method in accordance with the applicable accounting guidance.
Under such guidance, no revenue or profit is recognized at the inception of the transaction, and the net proceeds from
the buyer-lessor are recorded as a financing liability. Imputed interest is recorded on the liability equal to our
incremental borrowing rate adjusted solely to prevent negative amortization. Under IFRS, such revenue and profit is
recognized at the time of sale to the buyer-lessor if certain criteria are met. Upon adoption of IFRS 16, Leases, on
December 31, 2018, IFRS is aligned with GAAP.
Mark-to-market gain (loss) on equity investments
We recognize adjustments related to the fair value of equity investments with readily determinable fair value
based on the changes in the stock price of these equity investments at every reporting period. Under GAAP, realized
and unrealized gains and losses due to changes in stock prices for these securities are recorded in earnings while
149

under IFRS, an election can be made to recognize such gains and losses in other comprehensive income. Such an
election was made by Total S.A. Further, we elected the Fair Value Option (‘‘FVO’’) for some of our equity method
investments, and we adjust the carrying value of those investments based on their fair market value calculated
periodically. Such option is not available under IFRS, and equity method accounting is required for those
investments. Management believes that excluding these adjustments on equity investments is consistent with our
internal reporting process as part of its status as a consolidated subsidiary of Total S.A. and better reflects our ongoing
results.
Other Adjustments
Intersegment gross margin
To increase efficiencies and the competitive advantage of our technologies, SunPower Technologies sells solar
modules to SunPower Energy Services based on transfer prices determined based on management’s assessment of
market-based pricing terms. Such intersegment sales and related costs are eliminated at the corporate level to derive
our consolidated financial results.
Loss on sale and impairment of residential lease assets
In the fourth quarter of fiscal 2017, we made the decision to sell or refinance our interest in the Residential Lease
Portfolio and as a result of this triggering event, determined it was necessary to evaluate the potential for impairment
in our ability to recover the carrying amount of the Residential Lease Portfolio. In accordance with such evaluation,
we recognized a non-cash impairment charge on our solar power systems leased and to be leased and an allowance
for losses related financing receivables. In connection with the impairment loss, the carrying values of our solar
power systems leased and to be leased were reduced which resulted in lower depreciation charges. In the
fourth quarter of fiscal 2018, we sold membership units representing a 49% membership interest in our residential
lease business and retained a 51% membership interest. The loss on divestment and the remaining unsold residential
lease assets impairment with its corresponding depreciation savings are excluded from our segment results as they
are non-cash in nature and not reflective of ongoing operating results. Additionally, in the third quarter of fiscal 2019,
in continuation with our intention to deconsolidate all the residential lease assets owned by us, we sold the remainder
of residential lease assets still owned by us, that were not previously sold. Gain/loss from such activity is excluded
from the company’s non-GAAP results as it is non-cash in nature and not reflective of ongoing operating results.
Impairment of property, plant, and equipment
We evaluate property, plant and equipment for impairment whenever certain triggering events or changes in
circumstances arise. This evaluation includes consideration of technology obsolescence that may indicate that the
carrying value of such assets may not be recoverable. In accordance with such evaluation, the company recognizes
a non-cash impairment charge when the asset group’s fair value is lower than its carrying value. Such impairment
charge is excluded from the company’s non-GAAP results as it is non-recurring in nature and not reflective of
ongoing operating results. Any such non-recurring impairment charge recorded by our equity method or other
unconsolidated investees is also excluded from our non-GAAP results as it is not reflective of their ongoing operating
results.
Construction revenue on solar services contracts
Upon adoption of ASC 842 in the first quarter of fiscal 2019, revenue and cost of revenue on solar services
contracts with residential customers are recognized ratably over the term of those contracts, beginning when the
projects are placed in service. For segment reporting purposes, we recognize revenue and cost of revenue upfront
based on the expected cash proceeds to align with the legacy lease accounting guidance. We believe it is appropriate
to recognize revenue and cost of revenue upfront based on total expected cash proceeds as it better reflects our
ongoing results as such method aligns revenue and costs incurred most accurately in the same period.
Cost of above-market polysilicon
As described in ‘‘Note 9. Commitments and Contingencies,’’ we have entered into multiple long-term,
fixed-price supply agreements to purchase polysilicon for periods of up to ten years. The prices in select legacy
supply agreements, which include a cash portion and a non-cash portion attributable to the amortization of
150
prepayments made under the agreements, significantly exceed current market prices. Additionally, in order to reduce
inventory and improve working capital, we have periodically elected to sell polysilicon inventory in the marketplace
at prices below our purchase price, thereby incurring a loss. We exclude the impact of our above-market cost of
polysilicon, including the effect of above-market polysilicon on product costs, losses incurred on sales of polysilicon
to third parties, and inventory reserves and project asset impairments recorded from our non-GAAP results as they
are not reflective of ongoing operating results.
Stock-based compensation
Stock-based compensation relates primarily to our equity incentive awards. Stock-based compensation is a
non-cash expense that is dependent on market forces that are difficult to predict. We believe that this adjustment for
stock-based compensation provides investors with a basis to measure our core performance, including the ability to
compare our performance with the performance of other companies, without the period-to-period variability created
by stock-based compensation.
Amortization of intangible assets
We incur amortization of intangible assets as a result of acquisitions, which includes patents, purchased
technology, project pipeline assets, and in-process research and development. We believe that it is appropriate to
exclude these amortization charges from our non-GAAP financial measures as they arise from prior acquisitions, are
not reflective of ongoing operating results, and do not contribute to a meaningful evaluation of our past operating
performance.
Depreciation of idle equipment
In the fourth quarter of 2017, we changed the deployment plan for our next generation of solar cell technology,
and revised our depreciation estimates to reflect the use of certain assets over their shortened useful lives. Such asset
depreciation is excluded from our non-GAAP financial measures as it is non-cash in nature and not reflective of
ongoing operating results. Excluding this data provides investors with a basis to compare our performance against
the performance of other companies without such charges.
Business process improvements
During the second quarter of fiscal 2019, we initiated a project to improve our manufacturing and related
processes to improve gross margin in coming years, and engaged third party experts to consult on business process
improvements. Management believes it is appropriate to exclude these consulting expenses from our non-GAAP
financial measures as they non-recurring in nature, and are not reflective of our ongoing operating results.
Gain on business divestiture
In fiscal 2019, we entered into a transaction pursuant to which we sold membership interest in certain of our
subsidiaries that own leasehold interests in projects subject to sale-leaseback financing arrangements. In connection
with this sale, we recognized a gain relating to this business divestiture. We believe that it is appropriate to exclude
this gain from our segment results as it is not reflective of ongoing operating results.
Transaction-related costs
In connection with material transactions such as the acquisition or divestiture of a business, we incur transaction
costs including legal and accounting fees. We believe that it is appropriate to exclude these costs from our segment
results as they would not have otherwise been incurred as part of our business operations and are therefore not
reflective of ongoing operating results.
Business reorganization costs
In connection with the reorganization of our business into an upstream and downstream, and subsequent
announcement of the separation transaction to separate the Company into two independent, and publicly-traded
companies, we incurred and expect to continue to incur in upcoming quarters, non-recurring charges on third-party
legal and consulting expenses to close the separation transaction. The company believes that it is appropriate to
exclude these from company’s non-GAAP results as it is not reflective of ongoing operating results.
151

Non-cash interest expense
We incur non-cash interest expense related to the amortization of items such as original issuance discounts on
our debt. We exclude non-cash interest expense because the expense does not reflect our financial results in the period
incurred. We believe that this adjustment for non-cash interest expense provides investors with a basis to evaluate our
performance, including compared with the performance of other companies, without non-cash interest expense.
Restructuring expenses
We incur restructuring expenses related to reorganization plans aimed towards realigning resources consistent
our global strategy and improving its overall operating efficiency and cost structure. Although we have engaged in
restructuring activities in the past, each has been a discrete event based on a unique set of business objectives.
We believe that it is appropriate to exclude these from company’s non-GAAP results as it is not reflective of ongoing
operating results.
Litigation
We may be involved in various litigations, claims and proceedings that result in payments or recoveries from
such proceedings. We exclude such gains or losses on litigation because the gains or losses do not reflect our
underlying financial results in the period incurred. The company believes that it is appropriate to exclude these from
our non-GAAP results as it is not reflective of ongoing operating results.
Segment and Geographical Information
The following tables present segment results for fiscal 2019, 2018 and 2017 for revenue, gross margin, and
adjusted EBITDA, each as reviewed by the CODM, and their reconciliation to our consolidated GAAP results, as
well as information about significant customers and revenue by geography based on the destination of the shipments,
and property, plant and equipment, net by segment.
Fiscal Year Ended
December 29, 2019 December 30, 2018 December 31, 2017
(In thousands):
SunPowerEnergyServices
SunPowerTechnologies
SunPowerEnergyServices
SunPowerTechnologies
SunPowerEnergyServices
SunPowerTechnologies
Revenue from external customers:
North America Residential . . . . . . . $ 792,031 $ — $ 788,766 $ — $ 660,305
North America Commercial. . . . . . . 304,348 — 307,754 — 467,715
Operations and maintenance . . . . . . 51,627 — 47,447 — 42,233
Module sales . . . . . . . . . . . . . . . . . . — 752,239 — 508,740 382,963
Development services and legacy
power plant. . . . . . . . . . . . . . . . . . — 91,822 — 162,227 575,342
Intersegment revenue . . . . . . . . . . . . . . — 470,015 — 388,539 466,949
Total segment revenue as reviewed
by CODM. . . . . . . . . . . . . . . . . . . . . $1,148,006 $1,314,076 $1,143,967 $1,059,506 $1,170,253 $1,425,254
Segment gross profit as reviewed by
CODM . . . . . . . . . . . . . . . . . . . . . . . $ 121,173 $ 171,405 $ 142,087 $ 19,050 $ 126,049 $ 135,574
Adjusted EBITDA . . . . . . . . . . . . . . . . $ 8,561 $ 137,454 $ 151,095 $ 27,980 $ 109,863 $ 145,696
152

Reconciliation of Segment Revenue to Consolidated GAAP Revenue Fiscal Year Ended
(In thousands):December 29,
2019December 30,
2018December 31,
2017
Total segment revenue as reviewed by CODM . . . . . . . . . . . . . . . . . . . . . . $2,462,082 $2,203,473 $2,595,507
Adjustments to segment revenue:
Intersegment elimination . . . . . . . . . . . . . . . . . . . . . . . . . . . . . . . . . . . . . . (470,015) (388,539) (466,949)
8point3 Energy Partners . . . . . . . . . . . . . . . . . . . . . . . . . . . . . . . . . . . . . . — 8,588 (7,198)
Legacy utility and power plant projects . . . . . . . . . . . . . . . . . . . . . . . . . . 303 4,145 (54,659)
Legacy sale-leaseback transactions. . . . . . . . . . . . . . . . . . . . . . . . . . . . . . — (101,582) (272,654)
Construction revenue on solar services contracts . . . . . . . . . . . . . . . . . . (128,145) — —
Consolidated GAAP revenue . . . . . . . . . . . . . . . . . . . . . . . . . . . . . . . . . . . . $1,864,225 $1,726,085 $1,794,047
Reconciliation of Segment Gross Profit to Consolidated GAAP Gross Profit Fiscal Year Ended
(In thousands):December 29,
2019December 30,
2018December 31,
2017
Segment gross profit . . . . . . . . . . . . . . . . . . . . . . . . . . . . . . . . . . . . . . . . . . . $ 292,578 $ 161,137 $ 261,623
Adjustments to segment gross profit:
Intersegment elimination . . . . . . . . . . . . . . . . . . . . . . . . . . . . . . . . . . . . . . . . (12,951) (25,386) (25,151)
8point3 Energy Partners . . . . . . . . . . . . . . . . . . . . . . . . . . . . . . . . . . . . . . . . — 8,337 2,656
Legacy utility and power plant projects . . . . . . . . . . . . . . . . . . . . . . . . . . . . (993) 1,244 (41,746)
Legacy sale-leaseback transactions. . . . . . . . . . . . . . . . . . . . . . . . . . . . . . . . 4,763 (242) (31,094)
Business process improvements . . . . . . . . . . . . . . . . . . . . . . . . . . . . . . . . . . (3,370) — —
Impairment of property, plant and equipment, and equity method
investment . . . . . . . . . . . . . . . . . . . . . . . . . . . . . . . . . . . . . . . . . . . . . . . . . 511 (355,107) —
Construction revenue on solar services contracts . . . . . . . . . . . . . . . . . . . . (20,018) — —
Loss on sale and impairment of residential lease assets . . . . . . . . . . . . . . . 1,192 14,847 —
Cost of above-market polysilicon . . . . . . . . . . . . . . . . . . . . . . . . . . . . . . . . . (126,805) (87,228) (166,906)
Litigation . . . . . . . . . . . . . . . . . . . . . . . . . . . . . . . . . . . . . . . . . . . . . . . . . . . . 2,515 — —
Stock-based compensation expense . . . . . . . . . . . . . . . . . . . . . . . . . . . . . . . (4,382) (4,996) (5,489)
Amortization of intangible assets . . . . . . . . . . . . . . . . . . . . . . . . . . . . . . . . . (7,135) (8,966) (10,206)
Depreciation of idle equipment. . . . . . . . . . . . . . . . . . . . . . . . . . . . . . . . . . . — (721) (2,300)
Non-cash interest expense. . . . . . . . . . . . . . . . . . . . . . . . . . . . . . . . . . . . . . . — — (32)
Consolidated GAAP gross profit (loss) . . . . . . . . . . . . . . . . . . . . . . . . . . . . $ 125,905 $(297,081) $ (18,645)
153

Reconciliation of Segments EBITDA to Loss before income taxes and equity inearnings (losses) of unconsolidated investees Fiscal Year Ended
(In thousands):December 29,
2019December 30,
2018December 31,
2017
Segment adjusted EBITDA. . . . . . . . . . . . . . . . . . . . . . . . . . . . . . . . . . . . . . $ 146,015 $ 179,075 $ 255,559Adjustments to segment adjusted EBITDA: . . . . . . . . . . . . . . . . . . . . . . . .
8point3 . . . . . . . . . . . . . . . . . . . . . . . . . . . . . . . . . . . . . . . . . . . . . . . . . . . . — 8,485 (78,990)Legacy utility and power plant projects . . . . . . . . . . . . . . . . . . . . . . . . . . (993) 1,244 (41,746)Business process improvements . . . . . . . . . . . . . . . . . . . . . . . . . . . . . . . . (3,370) — —Legacy sale-leaseback transactions. . . . . . . . . . . . . . . . . . . . . . . . . . . . . . (5,680) (18,802) (39,318)Mark-to-market gain (loss) on equity investment with readily
available fair value . . . . . . . . . . . . . . . . . . . . . . . . . . . . . . . . . . . . . . . . 156,345 (6,375) —Impairment of property, plant and equipment, and equity
method investment. . . . . . . . . . . . . . . . . . . . . . . . . . . . . . . . . . . . . . . . . (4,053) (369,168) —Construction revenue on solar services contracts . . . . . . . . . . . . . . . . . . 7,012 — —Loss on sale and impairment of residential lease assets . . . . . . . . . . . . . (25,636) (227,507) (473,709)Cost of above-market polysilicon . . . . . . . . . . . . . . . . . . . . . . . . . . . . . . . (126,805) (87,228) (166,906)Litigation . . . . . . . . . . . . . . . . . . . . . . . . . . . . . . . . . . . . . . . . . . . . . . . . . . 2,509 — —Stock-based compensation expense . . . . . . . . . . . . . . . . . . . . . . . . . . . . . (26,934) (28,215) (34,674)Amortization of intangible assets . . . . . . . . . . . . . . . . . . . . . . . . . . . . . . . (7,135) (8,966) (19,048)Depreciation of idle equipment. . . . . . . . . . . . . . . . . . . . . . . . . . . . . . . . . — (721) (2,300)Gain on business divestiture . . . . . . . . . . . . . . . . . . . . . . . . . . . . . . . . . . . 143,400 59,347 —Transaction-related costs . . . . . . . . . . . . . . . . . . . . . . . . . . . . . . . . . . . . . . (5,293) (17,727) 82Business reorganization costs . . . . . . . . . . . . . . . . . . . . . . . . . . . . . . . . . . (23,567) (1,330)Restructuring charges . . . . . . . . . . . . . . . . . . . . . . . . . . . . . . . . . . . . . . . . (14,110) (17,497) (21,045)Non-cash interest expense. . . . . . . . . . . . . . . . . . . . . . . . . . . . . . . . . . . . . (33) (68) (128)Equity in losses of unconsolidated investees . . . . . . . . . . . . . . . . . . . . . . 7,058 17,815 (25,938)Net loss attributable to noncontrolling interests. . . . . . . . . . . . . . . . . . . . (29,880) (106,406) (241,747)Cash interest expense, net of interest income . . . . . . . . . . . . . . . . . . . . . (40,207) (86,394) (79,965)Depreciation and amortization . . . . . . . . . . . . . . . . . . . . . . . . . . . . . . . . . (74,445) (120,367) (164,970)Corporate . . . . . . . . . . . . . . . . . . . . . . . . . . . . . . . . . . . . . . . . . . . . . . . . . . (48,230) (67,866) (65,907)
Income (loss) before income taxes and equity in loss of
unconsolidated investees . . . . . . . . . . . . . . . . . . . . . . . . . . . . . . . . . . . . . . $ 25,968 $(898,671) $(1,200,750)
Fiscal Year Ended
(As a percentage of total revenue): Business SegmentDecember 29,
2019December 30,
2018December 31,
2017
Significant Customers:Actis GP LLP . . . . . . . . . . . . . . . . . . . . . . . . . . . . . SunPower Technologies —% —% 13%
Fiscal Year Ended
(As a percentage of total revenue):December 29,
2019December 30,
2018December 31,
2017
Revenue by geography:United States . . . . . . . . . . . . . . . . . . . . . . . . . . . . . . . . . . . . . . . . . . . . . . . . . 57% 68% 79%Japan . . . . . . . . . . . . . . . . . . . . . . . . . . . . . . . . . . . . . . . . . . . . . . . . . . . . . . . 5% 5% 6%Rest of World. . . . . . . . . . . . . . . . . . . . . . . . . . . . . . . . . . . . . . . . . . . . . . . . . 38% 27% 15%
100% 100% 100%
Fiscal Year Ended
(In thousands):December 29,
2019December 30,
2018December 31,
2017
SunPower Energy Services . . . . . . . . . . . . . . . . . . . . . . . . . . . . . . . . . . . . . . $ 36,184 $512,953 $ 445,241SunPower Technologies. . . . . . . . . . . . . . . . . . . . . . . . . . . . . . . . . . . . . . . . . 285,424 323,941 698,553Corporate . . . . . . . . . . . . . . . . . . . . . . . . . . . . . . . . . . . . . . . . . . . . . . . . . . . . 2,118 2,977 4,051
Property, plant and equipment, net . . . . . . . . . . . . . . . . . . . . . . . . . . . . . . . . $323,726 $839,871 $1,147,845
154

NOTE 18. SUBSEQUENT EVENTS
In January 2020, we purchased $33.9 million of aggregated principal amount of our debentures due 2021 in open
market transactions for approximately $32.7 million, net. The purchases and early retirements resulted in a gain from
extinguishment of debt of approximately $1.1 million, which represented the difference between the book value of
the convertible notes, net of the remaining unamortized discount prior to repurchase and the reacquisition price of
the convertible notes upon repurchase.
On January 13, 2020, certain subsidiaries of SunStrong entered into a loan agreement with Wells Fargo National
Association, as administrative agent, Credit Suisse Securities (USA) LLC, as arranger, and the lenders party thereto,
to borrow a senior loan of $216.2 million, a portion of the proceeds of which were used to pay off the warehouse
loans previously borrowed from Credit Agricole. Concurrently, certain other subsidiaries of SunStrong entered into
a subordinated mezzanine loan agreement with Hannon Armstrong to borrow $72.8 million, the proceeds of which
refinanced two mezzanine loans previously borrowed from Hannon Armstrong. The Company received a special
distribution of $7.0 million from SunStrong, of which $4.0 million was applied against prior receivables from the
loans that were refinanced, and the remaining amount of $3.0 million was recorded as a gain on the above refinancing
transactions.
From the January 15, 2020 through February 3, 2020, Total Gaz Electricité Holdings France SAS (‘‘Total Gaz’’),
an affiliate of Total S.A, purchased 2,952,091 shares of our common stock, in a series of open market transactions.
155

SELECTED UNAUDITED QUARTERLY FINANCIAL DATA
Consolidated Statements of Operations:
Three Months Ended1
(In thousands, except per sharedata)
December 29,2019
September 29,2019
June 30,2019
March 31,2019
December 30,2018
September 30,2018
July 1,2018
April 1,2018
Revenue . . . . . . . . . . . . . . . . . $603,761 $475,958 $436,281 $ 348,225 $ 456,837 $ 428,263 $ 449,097 $ 391,888
Gross margin . . . . . . . . . . . . . $ 95,139 $ 48,251 $ 19,800 $ (37,285) $ (7,571) $ 9,877 $(309,961) $ 10,574
Net income (loss) . . . . . . . . . $ 5,977 $ (19,208) $110,074 $(104,565) $(172,146) $(113,911) $(483,843) $(147,597)
Net income (loss)
attributable to
stockholders . . . . . . . . . . . . $ 5,440 $ (15,017) $121,459 $ (89,724) $(158,174) $ (89,826) $(447,117) $(115,974)
Basic net loss per share
attributable to
stockholders . . . . . . . . . . . . $ 0.04 $ (0.11) $ 0.85 $ (0.63) $ (1.12) $ (0.64) $ (3.17) $ (0.83)
Diluted net loss per share
attributable to
stockholders . . . . . . . . . . . . $ 0.03 $ (0.11) $ 0.75 $ (0.63) $ (1.12) $ (0.64) $ (3.17) $ (0.83)
156

ITEM 9: CHANGES IN AND DISAGREEMENTS WITH ACCOUNTANTS ON ACCOUNTING ANDFINANCIAL DISCLOSURES
None.
ITEM 9A: CONTROLS AND PROCEDURES
Evaluation of Disclosure Controls and Procedures
We maintain ‘‘disclosure controls and procedures,’’ as defined in Rule 13a-15(e) and 15d-15(e) under the
Exchange Act, that are designed to provide reasonable assurance that information required to be disclosed in reports
that we file or submit under the Exchange Act is recorded, processed, summarized and reported within the time
periods specified in SEC rules and forms, and that such information is accumulated and communicated to our
management, including our Chief Executive Officer and Chief Financial Officer, as appropriate to allow timely
decisions regarding required disclosure. In designing and evaluating our disclosure controls and procedures,
management recognizes that disclosure controls and procedures, no matter how well conceived and operated, can
provide only reasonable, not absolute, assurance that the objectives of the disclosure controls and procedures are met.
Additionally, in designing disclosure controls and procedures, our management is required to apply its judgment in
evaluating the cost-benefit relationship of possible disclosure controls and procedures. The design of any disclosure
control and procedure also is based in part upon certain assumptions about the likelihood of future events, and there
can be no assurance that any design will succeed in achieving its stated goals under all potential future conditions.
Based on their evaluation as of the end of the period covered by this Annual Report on Form 10-K, our Chief
Executive Officer and Chief Financial Officer have concluded that our disclosure controls and procedures were
effective as of December 29, 2019 at a reasonable assurance level.
Management’s Report on Internal Control over Financial Reporting
Management is responsible for establishing and maintaining adequate internal control over financial reporting,
as defined in Exchange Act Rule 13a-15(f). Management conducted an evaluation of the effectiveness of our internal
control over financial reporting using the criteria described in Internal Control-Integrated Framework issued by the
Committee of Sponsoring Organizations of the Treadway Commission (2013 framework) (‘‘COSO’’). Based on this
evaluation, management concluded that our internal control over financial reporting was effective as of December 29,
2019 based on the criteria described in Internal Control-Integrated Framework issued by COSO. Management
reviewed the results of its assessment with our Audit Committee.
The effectiveness of the Company’s internal control over financial reporting as of December 29, 2019 has been
audited by Ernst & Young LLP, an independent registered public accounting firm, as stated in their report which is
included in Item 8 of this Annual Report on Form 10-K.
Changes in Internal Control over Financial Reporting
We regularly review our system of internal control over financial reporting and make changes to our processes
and systems to improve controls and increase efficiency, while ensuring that we maintain an effective internal control
environment. Changes may include such activities as implementing new, more efficient systems, consolidating
activities, and migrating processes.
There were no changes in our internal control over financial reporting that occurred during our most recent fiscal
quarter that materially affected, or are reasonably likely to materially affect, our internal control over financial
reporting.
ITEM 9B: OTHER INFORMATION
None.
ITEM 10. DIRECTORS, EXECUTIVE OFFICERS AND CORPORATE GOVERNANCE
Information appearing under this Item is incorporated herein by reference to our proxy statement for the 2020
annual meeting of stockholders.
We have adopted a code of ethics, entitled Code of Business Conduct and Ethics, that applies to all of our
directors, officers and employees, including our principal executive officer, principal financial officer, and principal
157

accounting officer. We have made it available, free of charge, on our website at www.sunpower.com, and if we amend
it or grant any waiver under it that applies to our principal executive officer, principal financial officer, or principal
accounting officer, we will promptly post that amendment or waiver on our website as well.
ITEM 11: EXECUTIVE COMPENSATION
Information appearing under this Item is incorporated herein by reference to our proxy statement for the 2020
annual meeting of stockholders.
ITEM 12: SECURITY OWNERSHIP OF CERTAIN BENEFICIAL OWNERS AND MANAGEMENT AND
RELATED STOCKHOLDER MATTERS
Information appearing under this Item is incorporated herein by reference to our proxy statement for the 2020
annual meeting of stockholders.
ITEM 13: CERTAIN RELATIONSHIPS AND RELATED TRANSACTIONS, AND DIRECTOR
INDEPENDENCE
Information appearing under this Item is incorporated herein by reference to our proxy statement for the 2020
annual meeting of stockholders.
ITEM 14: PRINCIPAL ACCOUNTANT FEES AND SERVICES
Information appearing under this Item is incorporated herein by reference to our proxy statement for the 2020
annual meeting of stockholders.
ITEM 15: EXHIBITS, FINANCIAL STATEMENT SCHEDULES
The following documents are filed as a part of this Annual Report on Form 10-K filed with the Securities and
Exchange Commission:
1. Financial Statements:
Page
Reports of Ernst & Young LLP, Independent Registered Public Accounting Firm . . . . . . . . . . . . . . . . . . . . 89
Consolidated Balance Sheets . . . . . . . . . . . . . . . . . . . . . . . . . . . . . . . . . . . . . . . . . . . . . . . . . . . . . . . . . . . . . . . 91
Consolidated Statements of Operations. . . . . . . . . . . . . . . . . . . . . . . . . . . . . . . . . . . . . . . . . . . . . . . . . . . . . . . 92
Consolidated Statements of Comprehensive Income (Loss) . . . . . . . . . . . . . . . . . . . . . . . . . . . . . . . . . . . . . . 93
Consolidated Statements of Equity (Deficit). . . . . . . . . . . . . . . . . . . . . . . . . . . . . . . . . . . . . . . . . . . . . . . . . . . 94
Consolidated Statements of Cash Flows . . . . . . . . . . . . . . . . . . . . . . . . . . . . . . . . . . . . . . . . . . . . . . . . . . . . . . 95
Notes to Consolidated Financial Statements . . . . . . . . . . . . . . . . . . . . . . . . . . . . . . . . . . . . . . . . . . . . . . . . . . . 98
2. Financial Statement Schedule:
All financial statement schedules are omitted as the required information is inapplicable or the information is
presented in the Consolidated Financial Statements or Notes to Consolidated Financial Statements under Item 8 of
this Annual Report on Form 10-K filed with the Securities and Exchange Commission.
158

3. Exhibits:
EXHIBIT INDEX
ExhibitNumber Description
2.1 Separation and Distribution Agreement, dated November 8, 2019, by and between SunPower
Corporation and Maxeon Solar Technologies, Pte. Ltd. (incorporated by reference to Exhibit 2.1 to
the Registrant’s Current Report on Form 8-K filed with the Securities and Exchange Commission on
November 12, 2019)
3.1 Restated Certificate of Incorporation of SunPower Corporation (incorporated by reference to
Exhibit 3.1 to the Registrant’s Current Report on Form 8-K filed with the Securities and Exchange
Commission on November 16, 2011).
3.2 Amended and Restated By-Laws of SunPower Corporation (incorporated by reference to Exhibit 3.1
to the Registrant’s Current Report on Form 8-K filed with the Securities and Exchange Commission
on November 7, 2017).
4.1 Specimen Common Stock Certificate (incorporated by reference to Exhibit 4.1 to the Registrant’s
Annual Report on Form 10-K filed with the Securities and Exchange Commission on February 29,
2012).
4.2 Certificate of Designation of Series A Junior Participating Preferred Stock of SunPower Corporation
(incorporated by reference to Exhibit 4.6 to the Registrant’s Current Report on Form 8-K filed with
the Securities and Exchange Commission on November 16, 2011).
4.3 Indenture, dated as of December 15, 2015 by and between SunPower Corporation and Wells Fargo
Bank, National Association, as Trustee (incorporated by reference to Exhibit 4.1 to the Registrant’s
Current Report on Form 8-K filed with the Securities and Exchange Commission on December 16,
2015).
4.4 Indenture, dated as of June 11, 2014 by and between SunPower Corporation and Wells Fargo Bank,
National Association, as Trustee (incorporated by reference to Exhibit 10.1 to the Registrant’s
Current Report on Form 8-K filed with the Securities and Exchange Commission on June 11, 2014).
4.5* Description of securities registered under Section 12 of the Securities Exchange Act
(Regulation S-K, Item 601(b)(4)(vi) and accompanying instructions)
10.1 Continuing Agreement for Standby Letters of Credit and Demand Guarantees, dated June 29, 2016
by and among the Company, Deutsche Bank AG New York Branch, and Deutsche Bank Trust
Company Americas (incorporated by reference to Exhibit 10.63 to the Registrant’s Quarterly Report
on Form 10-Q filed with the Securities and Exchange Commission on August 10, 2016).
10.2 Letter of Credit Facility Agreement, dated June 29, 2016, by and among SunPower Corporation,
SunPower Corporation, Systems, Total S.A., the Subsidiary Applicants party thereto, and The Bank
of Tokyo-Mitsubishi UFJ, Ltd. (incorporated by reference to Exhibit 10.64 to the Registrant’s
Quarterly Report on Form 10-Q filed with the Securities and Exchange Commission on August 10,
2016).
10.3 Letter of Credit Facility Agreement, dated June 29, 2016, by and among SunPower Corporation,
SunPower Corporation, Systems, Total S.A., the Subsidiary Applicants party thereto, and Credit
Agricole Corporate and Investment Bank (incorporated by reference to Exhibit 10.65 to the
Registrant’s Quarterly Report on Form 10-Q filed with the Securities and Exchange Commission on
August 10, 2016).
10.4 Letter of Credit Facility Agreement, dated June 29, 2016, by and among SunPower Corporation,
SunPower Corporation, Systems, Total S.A., the Subsidiary Applicants party thereto, and HSBC
Bank USA, National Association (incorporated by reference to Exhibit 10.66 to the Registrant’s
Quarterly Report on Form 10-Q filed with the Securities and Exchange Commission on August 10,
2016).
10.5 Transfer Agreement, dated June 29, 2016, by and among SunPower Corporation, SunPower
Corporation, Systems, Total S.A., Deutsche Bank AG New York Branch as administrative agent, and
the Banks party thereto (incorporated by reference to Exhibit 10.67 to the Registrant’s Quarterly
Report on Form 10-Q filed with the Securities and Exchange Commission on August 9, 2016).
159

ExhibitNumber Description
10.6 Affiliation Agreement, dated April 28, 2011, between SunPower Corporation and Total Gas &
Power USA, SAS (incorporated by reference to Exhibit 99.6 to the Registrant’s Quarterly Report on
Form 10-Q filed with the Securities and Exchange Commission on May 12, 2011).
10.7 Amendment to Affiliation Agreement, dated April 28, 2011, between SunPower Corporation and
Total Gas & Power USA, SAS (incorporated by reference to Exhibit 10.2 of Registrant’s Current
Report on Form 8-K filed with the Securities and Exchange Commission on June 7, 2011).
10.8 Second Amendment to Affiliation Agreement, dated December 23, 2011, by and between Total G&P
and SunPower Corporation (incorporated by reference to Exhibit 10.4 of Registrant’s Current
Report on Form 8-K filed with the Securities and Exchange Commission on December 23, 2011).
10.9 Amendment No. 3 to Affiliation Agreement, dated February 28, 2012, by and between SunPower
Corporation and Total Gas & Power USA, SAS (incorporated by reference to Exhibit 10.91 to the
Registrant’s Annual Report on Form 10-K filed with the Securities and Exchange Commission on
February 29, 2012).
10.10 Amendment No. 4 to Affiliation Agreement, dated August 10, 2012, by and between SunPower
Corporation and Total Gas & Power USA, SAS (incorporated by reference to Exhibit 10.2 to the
Registrant’s Quarterly Report on Form 10-Q filed with the Securities and Exchange Commission on
November 2, 2012).
10.11 Affiliation Agreement Guaranty, dated April 28, 2011, between SunPower Corporation and Total
S.A. (incorporated by reference to Exhibit 99.7 to the Registrant’s Quarterly Report on Form 10-Q
filed with the Securities and Exchange Commission on May 12, 2011).
10.12^ SunPower Corporation 2015 Omnibus Incentive Plan (incorporated by reference to Exhibit 10.1 to
the Registrant’s Registration Statement on Form S-8 (File No. 333-205207), filed with the Securities
and Exchange Commission on June 25, 2015).
10.13^ Forms of agreements under SunPower Corporation 2015 Omnibus Incentive Plan (incorporated by
reference to Exhibit 10.60 to the Registrant’s Quarterly Report on Form 10-Q filed with the
Securities and Exchange Commission on May 6, 2016).
10.14^ Outside Director Compensation Policy, as amended on July 22, 2015 (incorporated by reference to
Exhibit 10.1 to the Registrant’s Quarterly Report on Form 10-Q filed with the Securities and
Exchange Commission on October 29, 2015).
10.15^ Form of Employment Agreement for Executive Officers (incorporated by reference to Exhibit 10.47
to the Registrant’s Annual Report on Form 10-K filed with the Securities and Exchange
Commission on February 18, 2014).
10.16^ SunPower Corporation Annual Executive Bonus Plan (incorporated by reference to Exhibit 10.1 to
the Registrant’s Quarterly Report on Form 10-Q filed with the Securities and Exchange Commission
on April 30, 2014).
10.17^ SunPower Corporation Executive Semi-Annual Bonus Plan (incorporated by reference to
Exhibit 10.2 to the Registrant’s Quarterly Report on Form 10-Q filed with the Securities and
Exchange Commission on April 30, 2014).
10.18^ Form of Indemnification Agreement for Directors and Officers (incorporated by reference to
Exhibit 10.24 to the Registrant’s Annual Report on Form 10-K filed with the Securities and
Exchange Commission on February 19, 2016).
10.19^ 2016 Management Career Transition Plan, dated August 10, 2015 (incorporated by reference to
Exhibit 10.2 to the Registrant’s Quarterly Report on Form 10-Q filed with the Securities and
Exchange Commission on October 29, 2015).
10.20† Mortgage Loan Agreement, dated May 6, 2010, by and among SunPower Philippines Manufacturing
Ltd., SPML Land, Inc. and International Finance Corporation (incorporated by reference to
Exhibit 10.13 to the Registrant’s Quarterly Report on Form 10-Q filed with the Securities and
Exchange Commission on August 13, 2010).
10.21 Guarantee Agreement, dated May 6, 2010, by and between SunPower Corporation and International
Finance Corporation (incorporated by reference to Exhibit 10.14 to the Registrant’s Quarterly
Report on Form 10-Q filed with the Securities and Exchange Commission on August 13, 2010).
160

ExhibitNumber Description
10.22 Amendment No. 1 to Loan Agreement, dated November 2, 2010, by and between SunPower
Philippines Manufacturing Ltd. and International Finance Corporation (incorporated by reference to
Exhibit 10.42 to the Registrant’s Annual Report on Form 10-K filed with the Securities and
Exchange Commission on February 28, 2011).
10.23 Mortgage Supplement No. 1, dated November 3, 2010, by and between SunPower Philippines
Manufacturing Ltd., SPML Land, Inc. and International Finance Corporation (incorporated by
reference to Exhibit 10.63 to the Registrant’s Annual Report on Form 10-K filed with the Securities
and Exchange Commission on February 25, 2013).
10.24 Mortgage Supplement No. 2, dated October 9, 2012, by and between SunPower Philippines
Manufacturing Ltd., SPML Land, Inc. and International Finance Corporation (incorporated by
reference to Exhibit 10.64 to the Registrant’s Annual Report on Form 10-K filed with the Securities
and Exchange Commission on February 25, 2013).
10.25 Mortgage Supplement No. 3, dated February 7, 2013, by and between SunPower Philippines
Manufacturing Ltd., SPML Land, Inc. and International Finance Corporation (incorporated by
reference to Exhibit 10.1 to the Registrant’s Quarterly Report on Form 10-Q filed with the
Securities and Exchange Commission on May 7, 2013).
10.26 Loan Agreement, dated December 1, 2010, by and among California Enterprise Development
Authority and SunPower Corporation, relating to $30,000,000 California Enterprise Development
Authority Tax Exempt Recovery Zone Facility Revenue Bonds (SunPower Corporation -
Headquarters Project) Series 2010 (incorporated by reference to Exhibit 10.50 to the Registrant’s
Annual Report on Form 10-K filed with the Securities and Exchange Commission on February 28,
2011).
10.27 First Supplement to Loan Agreement, dated June 1, 2011, by and between California Enterprise
Development Authority and SunPower Corporation, relating to $30,000,000 California Enterprise
Development Authority Tax Exempt Recovery Zone Facility Revenue Bonds (SunPower
Corporation - Headquarters Project) Series 2010 (incorporated by reference to Exhibit 10.16 to the
Registrant’s Quarterly Report on Form 10-Q filed with the Securities and Exchange Commission on
August 9, 2011).
10.28† Letter of Credit Facility Agreement, dated August 9, 2011, by and among SunPower Corporation,
Total S.A., the Subsidiary Applicants party thereto, the Banks party thereto, and Deutsche Bank AG
New York Branch (incorporated by reference to Exhibit 10.3 to the Registrant’s Quarterly Report on
Form 10-Q filed with the Securities and Exchange Commission on November 10, 2011).
10.29† First Amendment to Letter of Credit Facility Agreement, dated December 20, 2011, by and among
SunPower Corporation, Total S.A., the Subsidiary Applicants party thereto, the Banks party thereto,
and Deutsche Bank AG New York Branch (incorporated by reference to Exhibit 10.65 to the
Registrant’s Annual Report on Form 10-K filed with the Securities and Exchange Commission on
February 29, 2012).
10.30 Second Amendment to Letter of Credit Facility Agreement, dated December 19, 2012, by and
among SunPower Corporation, Total S.A., the Subsidiary Applicants party thereto, the Banks party
thereto, and Deutsche Bank AG New York Branch (incorporated by reference to Exhibit 10.69 to
the Registrant’s Annual Report on Form 10-K filed with the Securities and Exchange Commission
on February 25, 2013).
10.31 Third Amendment to Letter of Credit Facility Agreement, dated December 20, 2013, by and among
SunPower Corporation, SunPower Corporation, Systems, Total S.A., Deutsche Bank AG New York
Branch (incorporated by reference to Exhibit 10.61 to the Registrant’s Annual Report on Form 10-K
filed with the Securities and Exchange Commission on February 18, 2014).
10.32 Fourth Amendment to Letter of Credit Facility Agreement, dated December 23, 2014, by and among
SunPower Corporation, SunPower Corporation, Systems, Total S.A., Deutsche Bank AG New York
Branch (incorporated by reference to Exhibit 10.66 to the Registrant’s Annual Report on Form 10-K
filed with the Securities and Exchange Commission on February 24, 2015).
161

ExhibitNumber Description
10.33 Fifth Amendment to Letter of Credit Facility Agreement, dated October 7, 2015, by and among
SunPower Corporation, SunPower Corporation, Systems, Total S.A., Deutsche Bank AG New York
Branch (incorporated by reference to Exhibit 10.3 to the Registrant’s Annual Report on Form 10-Q
filed with the Securities and Exchange Commission on October 29, 2015).
10.34 Continuing Agreement for Standby Letters of Credit and Demand Guarantees, dated September 27,
2011, by and among SunPower Corporation, Deutsche Bank Trust Company Americas, and
Deutsche Bank AG New York Branch (incorporated by reference to Exhibit 10.10 to the
Registrant’s Quarterly Report on Form 10-Q filed with the Securities and Exchange Commission on
November 10, 2011).
10.35 Security Agreement, dated September 27, 2011, by and among SunPower Corporation, Deutsche
Bank Trust Company Americas, and Deutsche Bank AG New York Branch (incorporated by
reference to Exhibit 10.11 to the Registrant’s Quarterly Report on Form 10-Q filed with the
Securities and Exchange Commission on November 10, 2011).
10.36 License and Technology Agreement, dated July 5, 2010, by and among SunPower Technology, Ltd.,
AU Optronics Singapore Pte. Ltd. and AUO SunPower Sdn. Bhd. (now known as SunPower
Malaysia Manufacturing Sdn. Bhd.) (incorporated by reference to Exhibit 10.4 to the Registrant’s
Quarterly Report on Form 10-Q filed with the Securities and Exchange Commission on
November 12, 2010).
10.37 Compensation and Funding Agreement, dated February 28, 2012, by and between SunPower
Corporation and Total S.A. (incorporated by reference to Exhibit 10.90 to the Registrant’s Annual
Report on Form 10-K filed with the Securities and Exchange Commission on February 29, 2012).
10.38 Amendment No. 1 to Compensation and Funding Agreement, dated August 10, 2012, by and
between SunPower Corporation and Total S.A. (incorporated by reference to Exhibit 10.1 to the
Registrant’s Quarterly Report on Form 10-Q filed with the Securities and Exchange Commission on
November 2, 2012).
10.39 Purchase and Sale Agreement, dated as of November 5, 2018, by and between SunPower
Corporation and HA SunStrong Capital LLC (incorporated by reference to Exhibit 10.1 to the
Registrants Current Report on Form 8-K filed with the Securities and Exchange Commission on
November 5, 2018).
10.40† Master Supply Agreement, dated as of August 9, 2018, by and between SunPower Corporation and
Enphase Energy, Inc. (incorporated by reference to Exhibit 99.1 to Amendment No. 1 of Enphase
Energy, Inc.’s Current Report on Form 8-K/A filed with the Securities and Exchange Commission
on October 23, 2018).
10.41† Amendment No. 1 to Master Supply Agreement, dated as of December 10, 2018, by and between
SunPower Corporation and Enphase Energy, Inc. (incorporated by reference to Exhibit 10.74 to the
Registrant’s Annual Report on Form 10-K filed with the Securities and Exchange Commission on
February 14, 2019).
10.42^ Equity Agreement and Release, dated as of June 25, 2018, by and between SunPower Corporation
and Charles D. Boynton (incorporated by reference to Exhibit 10.2 to the Registrant’s Quarterly
Report on Form 10-Q filed with the Securities and Exchange Commission on August 1, 2018).
10.43 Amendment to Continuing Agreement for Standby Letters of Credit and Demand Guarantees, dated
as of March 22, 2018, by and among Deutsche Bank AG New York Branch and Deutsche Bank
Trust Company Americas (collectively, as issuer), SunPower Corporation (as applicant), and
SunPower Corporation, Systems (as subsidiary applicant), dated as of March 22, 2018 (incorporated
by reference to Exhibit 10.1 to the Registrant’s Current Report on Form 8-K filed with the
Securities and Exchange Commission on March 28, 2018).
10.44^ 2019 Management Career Transition Plan (incorporated by reference to Exhibit 10.1 to the
Registrant’s Current Report on Form 8-K filed with the Securities and Exchange Commission on
May 1, 2019).
162

ExhibitNumber Description
10.45 Membership Interest Purchase Agreement, dated as of March 26, 2019, by and among SunPower
Corporation, SunPower AssetCo, LLC, and Elizabeth Cady Lessee Holdco LLC (incorporated by
reference to Exhibit 10.4 to the Registrant’s Quarterly Report on Form 10-Q filed with the
Securities Exchange Commission on May 10, 2019).
10.46^ Manavendra Sial - Final Letter Agreement (incorporated by reference to Exhibit 10.4 to the
Registrant’s Quarterly Report on Form 10-Q filed with the Securities Exchange Commission on
August 1, 2019).
10.47 Investment Agreement, dated November 8, 2019, among SunPower Corporation, Maxeon Solar
Technologies, Pte. Ltd., Tianjin Zhonghuan Semiconductor Co., Ltd. and, for the limited purposes
set forth therein, Total Solar INTL SAS (incorporated by reference to Exhibit 10.1 to the
Registrant’s Current Report on Form 8-K filed with the Securities and Exchange Commission on
November 12, 2019)
21.1* List of Subsidiaries.
23.1* Consent of Ernst & Young LLP, Independent Registered Public Accounting Firm.
24.1* Power of Attorney.
31.1* Certification by Chief Executive Officer Pursuant to Rule 13a-14(a)/15d-14(a).
31.2* Certification by Chief Financial Officer Pursuant to Rule 13a-14(a)/15d-14(a).
32.1** Certification Furnished Pursuant to 18 U.S.C. Section 1350 as Adopted Pursuant to Section 906 of
the Sarbanes-Oxley Act of 2002.
101.SCH*+ XBRL Taxonomy Schema Document.
101.CAL*+ XBRL Taxonomy Calculation Linkbase Document.
101.LAB*+ XBRL Taxonomy Label Linkbase Document.
101.PRE*+ XBRL Taxonomy Presentation Linkbase Document.
101.DEF*+ XBRL Taxonomy Definition Linkbase Document.
104 The cover page from the Company’s Annual Report on Form 10-K for the fiscal year ended
December 29, 2019 is formatted in Inline XBRL
Exhibits marked with a carrot (^) are director and officer compensatory arrangements.
Exhibits marked with an asterisk (*) are filed herewith.
Exhibits marked with two asterisks (**) are furnished and not filed herewith.
Exhibits marked with an extended cross (†) are subject to a request for confidential treatment filed with the Securities
and Exchange Commission.
Exhibits marked with a cross (+) are XBRL (Extensible Business Reporting Language) information furnished and not
filed herewith, are not a part of a registration statement or Prospectus for purposes of sections 11 or 12 of the
Securities Act of 1933, are deemed not filed for purposes of section 18 of the Securities Exchange Act of 1934, and
otherwise are not subject to liability under these sections.
163

SIGNATURES
Pursuant to the requirements of Section 13 or 15(d) of the Securities Exchange Act of 1934, the registrant has
duly caused this report to be signed on its behalf by the undersigned, thereto duly authorized.
SUNPOWER CORPORATION
Dated: February 14, 2020 By: /s/ MANAVENDRA S. SIAL
Manavendra S. SialExecutive Vice President and
Chief Financial Officer
Pursuant to the requirements of the Securities Exchange Act of 1934, this Report has been signed below by the
following persons on behalf of the registrant and in the capacities and on the dates indicated.
Signature Title Date
/S/ THOMAS H. WERNER Chief Executive Officer and Director
(Principal Executive Officer)
February 14, 2020
Thomas H. Werner
/S/ MANAVENDRA S. SIAL Executive Vice President and Chief Financial
Officer
(Principal Financial Officer)
February 14, 2020
Manavendra S. Sial
/S/ VICHHEKA HEANG Vice President, Corporate Controller and
Principal
Accounting Officer
February 14, 2020
Vichheka Heang
* Director February 14, 2020
Francis Badoual
* Director February 14, 2020
Catherine A. Lesjak
* Director February 14, 2020
Thomas R. McDaniel
* Director February 14, 2020
Julien Pouget
* Director February 14, 2020
Antoine Larenaudie
* Director February 14, 2020
Thomas Rebeyrol
* Director February 14, 2020
Franck Trochet
* Director February 14, 2020
Patrick Wood III
* By: /S/ MANAVENDRA S. SIALManavendra S. SialPower of Attorney
164

NOTICE OF THE 2020 ANNUAL MEETING OF STOCKHOLDERS
TO ALL SUNPOWER STOCKHOLDERS:
NOTICE IS HEREBY GIVEN that the 2020 Annual Meeting of Stockholders (the ‘‘Annual Meeting’’) ofSunPower Corporation, a Delaware corporation (‘‘SunPower’’), will be held on:
Date: Thursday, May 14, 2020
Time: 9:00 a.m. Pacific Time
Place: Online at www.virtualshareholdermeeting.com/SPWR2020
Virtual MeetingAdmission:
This year’s Annual Meeting will be a virtual meeting of stockholders, conducted via a livewebcast. You will be able to attend the Annual Meeting online, vote your shareselectronically, and submit questions during the meeting by visitingwww.virtualshareholdermeeting.com/SPWR2020. Have your Notice of Internet Availability ofProxy Materials or proxy card in hand when you access the website and then follow theinstructions. To participate in the meeting, you will need the 16-digit control numberincluded on the Notice of Internet Availability of Proxy Materials or proxy card. Onlinecheck-in will begin at 8:30 a.m. Pacific Time, and you should allow ample time for theonline check-in procedures.
Items ofBusiness:
1. The re-election of three directors to serve as Class III directors on the Board ofDirectors;
2. The approval, in an advisory vote, of our named executive officer compensation;3. The ratification of the appointment of Ernst & Young LLP as our independent
registered public accounting firm for fiscal year 2020; and4. The transaction of such other business as may properly come before the Annual
Meeting or any adjournment or postponement thereof.
The foregoing items of business are more fully described in the proxy statement accompanying this notice of theAnnual Meeting. On or about April 3, 2020, we began mailing to certain stockholders a Notice of Internet Availability ofProxy Materials containing instructions on how to access our proxy materials, including our 2019 Annual Report, via theInternet. Stockholders who did not receive the Notice of Internet Availability of Proxy Materials will receive a paper copyof this notice of the Annual Meeting, the proxy statement, our 2019 Annual Report, and the form of proxy.
All stockholders are cordially invited to attend the Annual Meeting. Only stockholders of record at the close ofbusiness on March 19, 2020 (the ‘‘Record Date’’) are entitled to receive notice of, and to vote at, the Annual Meeting orany adjournment or postponement of the Annual Meeting. Any registered stockholder in attendance at the Annual Meetingand entitled to vote may do so during the meeting even if such stockholder returned a proxy. SunPower’s list ofstockholders as of the Record Date will be available for inspection for 10 days prior to the Annual Meeting. If you wouldlike to inspect the stockholder list, call our Investor Relations department at (408) 240-5500 to schedule an appointment.In addition, the list of stockholders will also be available during the Annual Meeting through the meeting website for thosestockholders who choose to attend.
San Jose, California FOR THE BOARD OF DIRECTORSApril 3, 2020
Kenneth MahaffeyCorporate Secretary
IMPORTANT: WHETHER OR NOT YOU EXPECT TO ATTEND THE ANNUAL MEETING, PLEASECOMPLETE, DATE, AND SIGN THE PROXY CARD AND MAIL IT PROMPTLY, OR YOU MAY VOTEBY TELEPHONE OR VIA THE INTERNET BY FOLLOWING THE DIRECTIONS ON THE PROXYCARD. ANY ONE OF THESE METHODS WILL ENSURE REPRESENTATION OF YOUR SHARES ATTHE ANNUAL MEETING. NO POSTAGE NEED BE AFFIXED TO THE COMPANY-PROVIDED PROXYCARD ENVELOPE IF MAILED IN THE UNITED STATES.

PROXY STATEMENT FOR2020 ANNUAL MEETING OF STOCKHOLDERS
TABLE OF CONTENTS
Page
INFORMATION CONCERNING SOLICITATION AND VOTING . . . . . . . . . . . . . . . . . . . . . . . . . . . . 1
General . . . . . . . . . . . . . . . . . . . . . . . . . . . . . . . . . . . . . . . . . . . . . . . . . . . . . . . . . . . . . . . . . . . . . . . . . . . . . . 1
Important Notice Regarding the Availability of Proxy Materials . . . . . . . . . . . . . . . . . . . . . . . . . . . . . . . . 1
Delivery of Voting Materials . . . . . . . . . . . . . . . . . . . . . . . . . . . . . . . . . . . . . . . . . . . . . . . . . . . . . . . . . . . . . 1
Record Date and Shares Outstanding . . . . . . . . . . . . . . . . . . . . . . . . . . . . . . . . . . . . . . . . . . . . . . . . . . . . . . 2
Board Recommendations . . . . . . . . . . . . . . . . . . . . . . . . . . . . . . . . . . . . . . . . . . . . . . . . . . . . . . . . . . . . . . . . 2
Voting . . . . . . . . . . . . . . . . . . . . . . . . . . . . . . . . . . . . . . . . . . . . . . . . . . . . . . . . . . . . . . . . . . . . . . . . . . . . . . . 2
How Your Proxy Will Be Voted . . . . . . . . . . . . . . . . . . . . . . . . . . . . . . . . . . . . . . . . . . . . . . . . . . . . . . . . . . 4
Revoking Your Proxy. . . . . . . . . . . . . . . . . . . . . . . . . . . . . . . . . . . . . . . . . . . . . . . . . . . . . . . . . . . . . . . . . . . 4
Solicitation of Proxies . . . . . . . . . . . . . . . . . . . . . . . . . . . . . . . . . . . . . . . . . . . . . . . . . . . . . . . . . . . . . . . . . . 4
Voting Results. . . . . . . . . . . . . . . . . . . . . . . . . . . . . . . . . . . . . . . . . . . . . . . . . . . . . . . . . . . . . . . . . . . . . . . . . 4
Note Concerning Forward-Looking Statements . . . . . . . . . . . . . . . . . . . . . . . . . . . . . . . . . . . . . . . . . . . . . . 5
PROPOSAL ONE—RE-ELECTION OF CLASS III DIRECTORS. . . . . . . . . . . . . . . . . . . . . . . . . . . . . 6
BOARD STRUCTURE . . . . . . . . . . . . . . . . . . . . . . . . . . . . . . . . . . . . . . . . . . . . . . . . . . . . . . . . . . . . . . . . . . 10
Determination of Independence . . . . . . . . . . . . . . . . . . . . . . . . . . . . . . . . . . . . . . . . . . . . . . . . . . . . . . . . . . . 10
Leadership Structure and Risk Oversight . . . . . . . . . . . . . . . . . . . . . . . . . . . . . . . . . . . . . . . . . . . . . . . . . . . 10
Board Meetings . . . . . . . . . . . . . . . . . . . . . . . . . . . . . . . . . . . . . . . . . . . . . . . . . . . . . . . . . . . . . . . . . . . . . . . 10
Controlled Company, Nasdaq Listing Standards . . . . . . . . . . . . . . . . . . . . . . . . . . . . . . . . . . . . . . . . . . . . . 10
Board Committees . . . . . . . . . . . . . . . . . . . . . . . . . . . . . . . . . . . . . . . . . . . . . . . . . . . . . . . . . . . . . . . . . . . . . 10
Audit Committee . . . . . . . . . . . . . . . . . . . . . . . . . . . . . . . . . . . . . . . . . . . . . . . . . . . . . . . . . . . . . . . . . . . . . . 11
Compensation Committee . . . . . . . . . . . . . . . . . . . . . . . . . . . . . . . . . . . . . . . . . . . . . . . . . . . . . . . . . . . . . . . 12
Compensation Committee Interlocks and Insider Participation . . . . . . . . . . . . . . . . . . . . . . . . . . . . . . . . . . 12
Nominating and Corporate Governance Committee . . . . . . . . . . . . . . . . . . . . . . . . . . . . . . . . . . . . . . . . . . . 12
Finance Committee. . . . . . . . . . . . . . . . . . . . . . . . . . . . . . . . . . . . . . . . . . . . . . . . . . . . . . . . . . . . . . . . . . . . . 14
CORPORATE GOVERNANCE . . . . . . . . . . . . . . . . . . . . . . . . . . . . . . . . . . . . . . . . . . . . . . . . . . . . . . . . . . . 15
Stockholder Communications with Board. . . . . . . . . . . . . . . . . . . . . . . . . . . . . . . . . . . . . . . . . . . . . . . . . . . 15
Directors’ Attendance at Our Annual Meetings . . . . . . . . . . . . . . . . . . . . . . . . . . . . . . . . . . . . . . . . . . . . . . 15
Submission of Stockholder Proposals for the 2021 Annual Meeting . . . . . . . . . . . . . . . . . . . . . . . . . . . . . 15
Corporate Governance Principles . . . . . . . . . . . . . . . . . . . . . . . . . . . . . . . . . . . . . . . . . . . . . . . . . . . . . . . . . 17
Code of Business Conduct and Ethics; Related Persons Transactions Policy and Procedures. . . . . . . . . . 17
Certain Relationships and Related Persons Transactions . . . . . . . . . . . . . . . . . . . . . . . . . . . . . . . . . . . . . . . 18
AUDIT COMMITTEE REPORT. . . . . . . . . . . . . . . . . . . . . . . . . . . . . . . . . . . . . . . . . . . . . . . . . . . . . . . . . . 26
DIRECTOR COMPENSATION. . . . . . . . . . . . . . . . . . . . . . . . . . . . . . . . . . . . . . . . . . . . . . . . . . . . . . . . . . . 27
2019 Director Compensation Table . . . . . . . . . . . . . . . . . . . . . . . . . . . . . . . . . . . . . . . . . . . . . . . . . . . . . . . . 27
2019 Director Compensation Program . . . . . . . . . . . . . . . . . . . . . . . . . . . . . . . . . . . . . . . . . . . . . . . . . . . . . 27
Stock Ownership Guidelines . . . . . . . . . . . . . . . . . . . . . . . . . . . . . . . . . . . . . . . . . . . . . . . . . . . . . . . . . . . . . 28
PROPOSAL TWO—ADVISORY VOTE TO APPROVE NAMED EXECUTIVE OFFICER
COMPENSATION . . . . . . . . . . . . . . . . . . . . . . . . . . . . . . . . . . . . . . . . . . . . . . . . . . . . . . . . . . . . . . . . . . . . 29
EXECUTIVE OFFICERS . . . . . . . . . . . . . . . . . . . . . . . . . . . . . . . . . . . . . . . . . . . . . . . . . . . . . . . . . . . . . . . . 32
COMPENSATION DISCUSSION AND ANALYSIS . . . . . . . . . . . . . . . . . . . . . . . . . . . . . . . . . . . . . . . . . . 33
Executive Summary . . . . . . . . . . . . . . . . . . . . . . . . . . . . . . . . . . . . . . . . . . . . . . . . . . . . . . . . . . . . . . . . . . . . 33
General Philosophy and Objectives. . . . . . . . . . . . . . . . . . . . . . . . . . . . . . . . . . . . . . . . . . . . . . . . . . . . . . . . 34
Compensation Setting Process . . . . . . . . . . . . . . . . . . . . . . . . . . . . . . . . . . . . . . . . . . . . . . . . . . . . . . . . . . . . 34
Compensation Consultant. . . . . . . . . . . . . . . . . . . . . . . . . . . . . . . . . . . . . . . . . . . . . . . . . . . . . . . . . . . . . . . . 35
Peer Group . . . . . . . . . . . . . . . . . . . . . . . . . . . . . . . . . . . . . . . . . . . . . . . . . . . . . . . . . . . . . . . . . . . . . . . . . . . 35
Market and Peer Group Data. . . . . . . . . . . . . . . . . . . . . . . . . . . . . . . . . . . . . . . . . . . . . . . . . . . . . . . . . . . . . 36
2019 Compensation Components . . . . . . . . . . . . . . . . . . . . . . . . . . . . . . . . . . . . . . . . . . . . . . . . . . . . . . . . . 37

Page
Analysis of Fiscal 2019 Compensation Decisions . . . . . . . . . . . . . . . . . . . . . . . . . . . . . . . . . . . . . . . . . . . . 38
Employment and Severance Arrangements . . . . . . . . . . . . . . . . . . . . . . . . . . . . . . . . . . . . . . . . . . . . . . . . . . 44
Section 162(m) Considerations . . . . . . . . . . . . . . . . . . . . . . . . . . . . . . . . . . . . . . . . . . . . . . . . . . . . . . . . . . . 44
Stock Ownership Guidelines . . . . . . . . . . . . . . . . . . . . . . . . . . . . . . . . . . . . . . . . . . . . . . . . . . . . . . . . . . . . . 44
Other Disclosures . . . . . . . . . . . . . . . . . . . . . . . . . . . . . . . . . . . . . . . . . . . . . . . . . . . . . . . . . . . . . . . . . . . . . . 45
COMPENSATION COMMITTEE REPORT. . . . . . . . . . . . . . . . . . . . . . . . . . . . . . . . . . . . . . . . . . . . . . . . 46
EXECUTIVE COMPENSATION . . . . . . . . . . . . . . . . . . . . . . . . . . . . . . . . . . . . . . . . . . . . . . . . . . . . . . . . . 47
Compensation of Named Executive Officers . . . . . . . . . . . . . . . . . . . . . . . . . . . . . . . . . . . . . . . . . . . . . . . . 47
2019 Summary Compensation Table. . . . . . . . . . . . . . . . . . . . . . . . . . . . . . . . . . . . . . . . . . . . . . . . . . . . . . . 47
Grants of Plan-Based Awards . . . . . . . . . . . . . . . . . . . . . . . . . . . . . . . . . . . . . . . . . . . . . . . . . . . . . . . . . . . . 48
2019 Grants of Plan-Based Awards Table. . . . . . . . . . . . . . . . . . . . . . . . . . . . . . . . . . . . . . . . . . . . . . . . . . . 48
Non-Equity Incentive Plan Compensation . . . . . . . . . . . . . . . . . . . . . . . . . . . . . . . . . . . . . . . . . . . . . . . . . . 49
Equity Incentive Plan Compensation. . . . . . . . . . . . . . . . . . . . . . . . . . . . . . . . . . . . . . . . . . . . . . . . . . . . . . . 51
Outstanding Equity Awards at Fiscal Year-End . . . . . . . . . . . . . . . . . . . . . . . . . . . . . . . . . . . . . . . . . . . . . . 52
Outstanding Equity Awards at 2019 Fiscal Year-End Table. . . . . . . . . . . . . . . . . . . . . . . . . . . . . . . . . . . . . 53
2019 Option Exercises and Stock Vested Table . . . . . . . . . . . . . . . . . . . . . . . . . . . . . . . . . . . . . . . . . . . . . . 53
Potential Payments Upon Termination or Change of Control . . . . . . . . . . . . . . . . . . . . . . . . . . . . . . . . . . . 55
Termination Payments Table . . . . . . . . . . . . . . . . . . . . . . . . . . . . . . . . . . . . . . . . . . . . . . . . . . . . . . . . . . . . . 56
Employment and Severance Agreements . . . . . . . . . . . . . . . . . . . . . . . . . . . . . . . . . . . . . . . . . . . . . . . . . . . 57
CEO Pay Ratio . . . . . . . . . . . . . . . . . . . . . . . . . . . . . . . . . . . . . . . . . . . . . . . . . . . . . . . . . . . . . . . . . . . . . . . . 59
SECURITY OWNERSHIP OF MANAGEMENT AND CERTAIN BENEFICIAL OWNERS . . . . . . . 61
Delinquent Section 16(a) Reports . . . . . . . . . . . . . . . . . . . . . . . . . . . . . . . . . . . . . . . . . . . . . . . . . . . . . . . . . 62
COMPANY STOCK PRICE PERFORMANCE . . . . . . . . . . . . . . . . . . . . . . . . . . . . . . . . . . . . . . . . . . . . . 63
EQUITY COMPENSATION PLAN INFORMATION . . . . . . . . . . . . . . . . . . . . . . . . . . . . . . . . . . . . . . . . 64
PROPOSAL THREE—RATIFICATION OF THE APPOINTMENT OF INDEPENDENT
REGISTERED PUBLIC ACCOUNTING FIRM FOR FISCAL YEAR 2020 . . . . . . . . . . . . . . . . . . . 65
APPENDIX A – USE OF NON-GAAP FINANCIAL MEASURES. . . . . . . . . . . . . . . . . . . . . . . . . . . . . . A-1

SUNPOWER CORPORATION51 Rio Robles
San Jose, California 95134
PROXY STATEMENT FOR2020 ANNUAL MEETING OF STOCKHOLDERS
INFORMATION CONCERNING SOLICITATION AND VOTING
General
The Board of Directors (the ‘‘Board’’) of SunPower Corporation, a Delaware corporation, is furnishing this
proxy statement and proxy card to you in connection with its solicitation of proxies to be used at the Annual Meeting
of Stockholders of SunPower Corporation to be held on May 14, 2020 at 9:00 a.m. Pacific Time (the ‘‘Meeting
Date’’), or at any adjournment(s), continuation(s), or postponement(s) of the meeting (the ‘‘Annual Meeting’’).
This year’s Annual Meeting will be a virtual meeting of stockholders, conducted via a live webcast. You will
be able to attend the Annual Meeting online, vote your shares electronically, and submit your questions during the
meeting by visiting www.virtualshareholdermeeting.com/SPWR2020. Have your Notice of Internet Availability of
Proxy Materials or proxy card in hand when you access the website and then follow the instructions. To participate
in the meeting, you will need the 16-digit control number included on the Notice of Internet Availability of Proxy
Materials or proxy card.
Online check-in will begin at 8:30 a.m. Pacific Time on the Meeting Date, and you should allow ample time for
the online check-in procedures. We will have technicians ready to assist you should you have any technical
difficulties accessing the virtual meeting.
We use a number of abbreviations in this proxy statement. We refer to SunPower Corporation as ‘‘SunPower,’’
‘‘the Company,’’ or ‘‘we,’’ ‘‘us,’’ or ‘‘our.’’ The term ‘‘proxy solicitation materials’’ includes this proxy statement, the
notice of the Annual Meeting, and the proxy card. References to ‘‘fiscal 2019’’ mean our 2019 fiscal year, which
began on December 31, 2018 and ended on December 29, 2019, while references to ‘‘fiscal 2018’’ mean our 2018
fiscal year, which began on January 1, 2018 and ended on December 30, 2018.
Our principal executive offices are located at 51 Rio Robles, San Jose, California 95134, and our telephone
number is (408) 240-5500.
Important Notice Regarding The Availability of Proxy Materials
We have elected to comply with the Securities and Exchange Commission (the ‘‘SEC’’) ‘‘Notice and Access’’
rules, which allow us to make our proxy solicitation materials available to our stockholders over the Internet. Under
these rules, on or about April 3, 2020, we started mailing to certain of our stockholders a Notice of Internet
Availability of Proxy Materials (the ‘‘Notice of Internet Availability’’). The Notice of Internet Availability contains
instructions on how our stockholders can both access the proxy solicitation materials and our 2019 Annual Report
on Form 10-K for the fiscal year ended December 29, 2019 (the ‘‘2019 Annual Report’’) online and vote online.
By sending the Notice of Internet Availability instead of paper copies of the proxy materials, we expect to lower the
costs and reduce the environmental impact of our Annual Meeting.
Our proxy solicitation materials and our 2019 Annual Report are available at www.proxyvote.com.
Stockholders receiving the Notice of Internet Availability may request a paper or electronic copy of our proxy
solicitation materials by following the instructions set forth on the Notice of Internet Availability. Stockholders who
did not receive the Notice of Internet Availability will continue to receive a paper or electronic copy of our proxy
solicitation materials, which were first mailed to stockholders and made public on or about April 3, 2020.
Delivery of Voting Materials
If you would like to further reduce our environmental impact and costs in mailing proxy materials, you can
consent to receive all future proxy statements, proxy cards, and annual reports electronically via e-mail or the
Internet. To sign up for electronic delivery, please follow the instructions provided for voting via www.proxyvote.com
and, when prompted, indicate that you agree to receive or access proxy materials electronically in future years.
1

To reduce the environmental waste and expense of delivering duplicate materials to our stockholders, we are
taking advantage of householding rules that permit us to deliver only one set of proxy solicitation materials and our
2019 Annual Report, or one copy of the Notice of Internet Availability, to stockholders who share the same address,
unless otherwise requested. Each stockholder retains a separate right to vote on all matters presented at the Annual
Meeting.
If you share an address with another stockholder and have received only one set of materials, you may write or
call us to request a separate copy of these materials at no cost to you. For future annual meetings, you may request
separate materials or request that we only send one set of materials to you if you are receiving multiple copies by
writing to us at SunPower Corporation, 51 Rio Robles, San Jose, California 95134, Attention: Corporate Secretary,
or calling us at (408) 240-5500.
A copy of our 2019 Annual Report has been furnished with this proxy statement to each stockholder.
A stockholder may also request a copy of our 2019 Annual Report by writing to our Corporate Secretary at 51 Rio
Robles, San Jose, California 95134. Upon receipt of such request, we will provide a copy of our 2019 Annual Report
without charge, including the financial statements required to be filed with the SEC pursuant to Rule 13a-1 of the
Securities Exchange Act of 1934 (the ‘‘Exchange Act’’) for fiscal 2019. Our 2019 Annual Report is also available
on our website at http://investors.sunpower.com/sec.cfm.
Record Date and Shares Outstanding
Stockholders who owned shares of our common stock, par value $0.001 per share, at the close of business on
March 19, 2020, which we refer to as the Record Date, are entitled to notice of, and to vote at, the Annual Meeting.
On the Record Date, we had 169,754,988 shares of common stock outstanding. For more information about beneficial
ownership of our issued and outstanding common stock, please see ‘‘Security Ownership of Management and Certain
Beneficial Owners.’’
Board Recommendations
The Board recommends that you vote:
• ‘‘FOR’’ Proposal One: re-election of each of the nominated Class III directors;
• ‘‘FOR’’ Proposal Two: the approval, on an advisory basis, of the compensation of our named executive
officers; and
• ‘‘FOR’’ Proposal Three: the ratification of the appointment of Ernst & Young LLP as our independent
registered public accounting firm for fiscal year 2020.
Voting
Each holder of shares of common stock is entitled to one vote for each share of common stock held as of the
Record Date. Cumulating votes is not permitted under our Restated Certificate of Incorporation (the ‘‘Certificate of
Incorporation’’).
Many of our stockholders hold their shares through a stockbroker, bank, or other nominee, rather than directly
in his or her own name. As summarized below, there are distinctions between shares held of record and those
beneficially owned.
Stockholder of Record. If your shares are registered directly in your name with our transfer agent,
Computershare Trust Company N.A., you are considered, with respect to those shares, the stockholder of record and
these proxy solicitation materials are being furnished to you directly by us.
Beneficial Owner. If your shares are held in a stock brokerage account, or by a bank or other nominee
(also known as shares registered in ‘‘street name’’), you are considered the beneficial owner of such shares held in
street name, and these proxy solicitation materials are being furnished to you by your broker, bank, or other nominee,
who is considered, with respect to those shares, the stockholder of record. As the beneficial owner, you have the right
to direct your broker, bank, or other nominee how to vote your shares, or to vote your shares during the Annual
Meeting.
2
How to Vote. If you hold shares directly as a stockholder of record, you can vote in one of the following four ways:
(1) Vote via the Internet before the Meeting Date. Go to www.proxyvote.com to transmit your voting
instructions and for electronic delivery of information up until 11:59 p.m. Eastern Time on May 13, 2020.
Have your proxy card in hand when you access the website and then follow the instructions.
(2) Vote by Telephone at 1-800-690-6903 before the Meeting Date. Use a touch-tone telephone to transmit your
voting instructions up until 11:59 p.m. Eastern Time on May 13, 2020. Have your proxy card in hand when
you call and then follow the instructions. This number is toll free in the United States and Canada.
(3) Vote by Mail before the Meeting Date. Mark, sign, and date your proxy card and return it in the
postage-paid envelope we have provided, or return the proxy card to Vote Processing, c/o Broadridge,
51 Mercedes Way, Edgewood, New York 11717.
(4) Vote via the Internet during the Annual Meeting. You may attend the Annual Meeting on May 14, 2020 at
9:00 a.m. Pacific Time via the Internet at www.virtualshareholdermeeting.com/SPWR2020 and vote during
the Annual Meeting. Have your proxy card in hand when you access the website and then follow the
instructions.
If you hold shares beneficially in street name, you may submit your voting instructions in the manner prescribed
by your broker, bank, or other nominee by following the instructions provided by your broker, bank, or other
nominee, or you may vote your shares during the Annual Meeting.
Even if you plan to attend the Annual Meeting, we recommend that you vote your shares in advance as described in
options (1), (2), and (3) above so that your vote will be counted if you later decide not to attend the Annual Meeting.
Quorum. A quorum, which is the holders of at least a majority of shares of our stock issued and outstanding
and entitled to vote as of the Record Date, is required to be present in person or by proxy at the Annual Meeting in
order to hold the Annual Meeting and to conduct business. Your shares will be counted as being present at the Annual
Meeting if you attend the Annual Meeting (and are the stockholder of record for your shares), if you vote your shares
by telephone or over the Internet, or if you submit a properly executed proxy card. Abstentions and ‘‘broker
non-votes’’ are counted as present and entitled to vote for purposes of determining a quorum. Votes against a
particular proposal will also be counted both to determine the presence or absence of a quorum and to determine
whether the requisite number of voting shares has been obtained.
Explanation of Broker Non-Votes and Abstentions. A ‘‘broker non-vote’’ occurs when a broker or other
nominee holding shares for a beneficial owner does not vote on a particular proposal because the broker does not have
discretionary voting power with respect to that item and has not received instructions from the beneficial owner.
Brokers are prohibited from voting in their discretion on any non-routine proposals without instructions from the
beneficial owners. If you do not instruct your broker how to vote on a non-routine proposal, your broker will not vote
for you. Abstentions are deemed to be entitled to vote for purposes of determining whether stockholder approval of
that matter has been obtained, and they would be included in the tabulation of voting results as votes against the
proposal.
Votes Required/Treatment of Broker Non-Votes and Abstentions.
Proposal One – Re-election of Class III Directors. Election of a director requires the affirmative vote of the
holders of a plurality of votes represented by the shares in attendance or represented by proxy at the Annual Meeting
and entitled to vote on the election of directors. The three persons receiving the greatest number of votes at the Annual
Meeting shall be elected as Class III directors. Neither ‘‘broker non-votes’’ nor abstentions will affect the outcome
of the voting on Proposal One.
Proposal Two – Advisory Vote on Named Executive Officer Compensation. The non-binding advisory vote on named
executive officer compensation requires the affirmative vote of the holders of a majority of our stock having voting power
and in attendance or represented by proxy at the Annual Meeting. ‘‘Broker non-votes’’ have no effect and will not be
counted towards the vote total for this proposal. Abstentions will have the effect of votes against Proposal Two.
3

Proposal Three – Ratification of the Appointment of Independent Registered Public Accounting Firm for Fiscal
Year 2020. Ratification of the appointment of our independent registered public accounting firm requires the
affirmative vote of the holders of a majority of our stock having voting power and in attendance or represented by
proxy at the Annual Meeting. This proposal is considered to be a routine proposal and brokers have discretionary
authority to vote on this proposal. Abstentions will have the effect of votes against Proposal Three.
How Your Proxy Will Be Voted
If you complete and submit your proxy card or vote via the Internet or by telephone, the shares represented by
your proxy will be voted at the Annual Meeting in accordance with your instructions. If you submit your proxy card
by mail, but do not fill out the voting instructions on the proxy card, the shares represented by your proxy will be
voted in favor of each of the three proposals. In addition, if any other matters properly come before the Annual
Meeting, it is the intention of the persons named in the enclosed proxy card to vote the shares they represent as
directed by the Board. We have not received notice of any other matters that may properly be presented at the Annual
Meeting.
Revoking Your Proxy
You may revoke your proxy at any time before the Meeting Date by: (1) submitting a later-dated vote by
telephone, by mail, or via the Internet before 11:59 p.m. Eastern Time on May 13, 2020 or at the Annual Meeting;
or (2) delivering instructions to us at 51 Rio Robles, San Jose, California 95134 to the attention of our Corporate
Secretary. Any notice of revocation sent to us must include the stockholder’s name and must be actually received by
us before the Annual Meeting to be effective. Your attendance at the Annual Meeting after having executed and
delivered a valid proxy card or vote via the Internet or by telephone will not in and of itself constitute a revocation
of your proxy. If you are the stockholder of record or if your shares are held in ‘‘street name,’’ you may revoke your
proxy by voting electronically at the Annual Meeting.
Solicitation of Proxies
We will pay for the cost of this proxy solicitation. We may reimburse brokerage firms and other persons
representing beneficial owners of shares for their expenses in forwarding or furnishing proxy solicitation materials
to such beneficial owners. Proxies may also be solicited personally or by telephone, telegram, or facsimile by certain
of our directors, officers, and regular employees, without additional compensation.
Voting Results
We will announce preliminary voting results at the Annual Meeting and publish final results on a Current Report
on Form 8-K, which we intend to file with the SEC within four business days after the Meeting Date.
4

Note Concerning Forward-Looking Statements
Certain of the statements contained in this proxy statement are ‘‘forward-looking statements’’within the meaning
of the Private Securities Litigation Reform Act of 1995. Forward-looking statements are statements that do not
represent historical facts and the assumptions underlying such statements. We use words such as ‘‘anticipate,’’
‘‘believe,’’ ‘‘continue,’’ ‘‘could,’’ ‘‘estimate,’’ ‘‘expect,’’ ‘‘intend,’’ ‘‘may,’’ ‘‘plan,’’ ‘‘predict,’’ ‘‘project,’’ ‘‘potential,’’
‘‘will,’’ ‘‘would,’’ ‘‘should,’’ and similar expressions to identify forward-looking statements. Forward-looking
statements in this proxy statement include, but are not limited to, our plans and expectations regarding future
financial results, expected operating results, business strategies, the sufficiency of our cash and our liquidity,
projected costs and cost reduction measures, development of new products and improvements to our existing
products, the impact of recently adopted accounting pronouncements, our manufacturing capacity and manufacturing
costs, the adequacy of our agreements with our suppliers, our ability to monetize our solar projects, legislative
actions and regulatory compliance, competitive positions, management’s plans and objectives for future operations,
our ability to obtain financing, our ability to comply with debt covenants or cure any defaults, our ability to repay
our obligations as they come due, our ability to continue as a going concern, our ability to complete certain
divestiture, spin-off or other strategic transactions, trends in average selling prices, the success of our joint ventures
and acquisitions, expected capital expenditures, warranty matters, outcomes of litigation, our exposure to foreign
exchange, interest and credit risk, general business and economic conditions in our markets, industry trends, the
impact of changes in government incentives, expected restructuring charges, risks related to privacy and data
security, and the likelihood of any impairment of project assets, long-lived assets, and investments. These
forward-looking statements are based on information available to us as of the date of this proxy statement and our
current expectations, forecasts, and assumptions and involve a number of risks and uncertainties, including
uncertainties regarding the duration and severity of the COVID-19 pandemic, that could cause actual results to differ
materially from those anticipated by these forward-looking statements. Such risks and uncertainties include a variety
of factors, some of which are beyond our control. All of the forward-looking statements are qualified in their entirety
by reference to the factors discussed in Part I, Item 1A, ‘‘Risk Factors,’’ and elsewhere in our 2019 Annual Report,
which accompanies this proxy statement. Please see these and our other filings with the SEC for additional
information on risks and uncertainties that could cause actual results to differ. These forward-looking statements
should not be relied upon as representing our views as of any subsequent date, and we are under no obligation to,
and expressly disclaim any responsibility to, update or alter our forward-looking statements, whether as a result of
new information, future events or otherwise.
WHETHER OR NOT YOU EXPECT TO ATTEND THE ANNUAL MEETING, YOU ARE
REQUESTED TO COMPLETE, DATE, AND SIGN THE PROXY CARD AND RETURN IT PROMPTLY,
OR VOTE BY TELEPHONE OR VIA THE INTERNET BY FOLLOWING THE DIRECTIONS ON THE
PROXY CARD. STOCKHOLDERS WHO ATTEND THE ANNUAL MEETING MAY REVOKE A PRIOR
PROXY VOTE AND VOTE THEIR SHARES AS SET FORTH IN THIS PROXY STATEMENT.
5

PROPOSAL ONE
RE-ELECTION OF CLASS III DIRECTORS
The Board is currently composed of nine directors and divided into three classes, in accordance with Article IV,
Section B of our Certificate of Incorporation. Only the terms of the three directors serving as Class III directors are
scheduled to expire in 2020. The terms of other directors expire in subsequent years.
On April 28, 2011, we and Total Solar INTL SAS, formerly known as Total Solar International SAS, Total
Energies Nouvelles Activités USA, SAS and Total Gas & Power USA, SAS (‘‘Total’’), a subsidiary of Total S.A.,
entered into a Tender Offer Agreement (the ‘‘Tender Offer Agreement’’). Pursuant to the Tender Offer Agreement,
dated June 21, 2011, Total purchased in a cash tender offer approximately 60% of our then outstanding shares of
common stock (the ‘‘Tender Offer’’). In connection with the Tender Offer, we and Total entered into an Affiliation
Agreement that governs the relationship between Total and us following the close of the Tender Offer (the
‘‘Affiliation Agreement’’). In accordance with the terms of the Affiliation Agreement, the Board has nine members,
composed of our chief executive officer, three non-Total-designated members of the Board, and five directors
designated by Total. If the ownership of our voting securities by Total, together with the controlled subsidiaries of
Total S.A., declines below certain thresholds, the number of members of the Board that Total is entitled to designate
will be reduced as set forth in the Affiliation Agreement. See ‘‘Certain Relationships and Related Persons
Transactions—Agreements with Total Solar INTL SAS and Total S.A.—Affiliation Agreement.’’
The Board has considered and approved the nomination of Thomas McDaniel, Thomas Rebeyrol, and Thomas
Werner, our current Class III directors, for re-election as directors at the Annual Meeting. Mr. McDaniel is an
independent director. Mr. Rebeyrol is a Total-designated director. Mr. Werner is our president, chief executive officer,
and chairman of the Board. Each nominee has consented to being named in this proxy statement and to serve if
re-elected. Unless otherwise directed, the proxy holders will vote the proxies received by them for the three nominees
named herein. If any nominee is unable or declines to serve as a director at the time of the Annual Meeting, the
proxies will be voted for any nominee who is designated by the present Board to fill the vacancy. We do not expect
that any nominee will be unable or will decline to serve as a director. The Class III directors elected will hold office
until the annual meeting of stockholders in 2023 or until their successors are elected.
The Class I directors consist of François Badoual, Denis Toulouse, and Patrick Wood III, who will hold office
until the annual meeting of stockholders in 2021 or until their successors are elected. Messrs. Badoual and Toulouse
are Total-designated directors. Mr. Wood is an independent director. The Class II directors consist of Catherine
Lesjak, Julien Pouget, and Franck Trochet, who will hold office until the annual meeting of stockholders in 2022 or
until their successors are elected. Ms. Lesjak is an independent director. Messrs. Pouget and Trochet are
Total-designated directors.
Additional information about the Class III director nominees for re-election, and the Class I and Class II
directors, is set forth below.
Class III Directors Nominated for Re-Election at the Annual Meeting
Name AgePosition(s) with
SunPowerDirector
Since
Thomas McDaniel 70 Director 2009
Thomas Rebeyrol 54 Director 2019
Thomas Werner 59 President, Chief
Executive Officer, and
Chairman of the Board
2003
Thomas McDaniel was executive vice president, chief financial officer, and treasurer of Edison International, a
generator and distributor of electric power and investor in infrastructure and energy assets, before retiring in July
2008 after 37 years of service. Before January 2005, Mr. McDaniel was chairman, chief executive officer, and
president of Edison Mission Energy, a power generation business specializing in the development, acquisition,
construction, management, and operation of power production facilities. Mr. McDaniel was also chief executive
officer and a director of Edison Capital, a provider of capital and financial services supporting the growth of energy
and infrastructure projects, products, and services, both domestically and internationally. Mr. McDaniel has served
6

on the Board since February 2009. Mr. McDaniel formerly served as chairman of the boards of directors of
SemGroup, L.P., a midstream energy services company, and Tendril Networks, Inc., a software-as-a-service energy
efficiency company. He formerly served on the advisory boards of Cypress Envirosystems, which develops and
markets energy efficiency products, and On Ramp Wireless, a communications company serving electrical, gas, and
water utilities. Mr. McDaniel also served on the boards of directors of the Senior Care Action Network (SCAN) from
2000 to 2013 and Aquion Energy, a manufacturer of energy storage systems. Through the McDaniel Family
Foundation, he is actively involved in a variety of charitable activities, such as the Boys and Girls Club of Huntington
Beach, Heifer International, and the Free Wheelchair Mission.
Mr. McDaniel brings significant operational and development experience, including extensive experience
growing and operating global electric power businesses, to the Board. In addition, Mr. McDaniel’s prior experience
as a chief financial officer qualifies him as a financial expert, which is relevant to his duties as an Audit Committee
member. It is based on the Board’s identification of these qualifications, skills, and experience that the Board has
concluded that Mr. McDaniel should serve as a director on the Board and chairman of the Audit Committee.
Thomas Rebeyrol has served as senior vice president, strategy, growth and people of Total Gas Renewables &
Power, Inc. in Paris since September 2019. He previously served as vice president, strategy growth and new
businesses, of Total Marketing & Services, Inc. in Paris starting in 2015. From 2009 to 2015, Mr. Rebeyrol was
managing director of Total Egypt, a subsidiary of Total Marketing & Services, Inc. Mr. Rebeyrol joined the lubricant
division of Elf Aquitaine S.A.S. in 1999, prior to its acquisition by Total, and held various positions in the marketing
divisions of Total, including lubricant marketing director, lubricant sales director in Germany, and director of strategy
refining and marketing for Africa and the Middle East. He started his career at Procter & Gamble France in 1992.
Mr. Rebeyrol is a graduate of HEC Paris business school in France.
Mr. Rebeyrol brings significant international strategic and business development experience to the Board. His
extensive experience in the energy and technology industries gives him a valuable perspective on our role in the
global marketplace. It is based on the Board’s identification of these qualifications, skills, and experience that the
Board has concluded that Mr. Rebeyrol should serve as a director on the Board.
Thomas Werner has served as our chief executive officer and as a member of the Board since June 2003, and
chairman of the Board since May 2011. From 2001 to 2003, before joining SunPower, he held the position of chief
executive officer of Silicon Light Machines, Inc., an optical solutions subsidiary of Cypress Semiconductor
Corporation. From 1998 to 2001, Mr. Werner served as vice president and general manager of the Business
Connectivity Group of 3Com Corp., a network solutions company. He also held a number of executive management
positions at Oak Industries, Inc. and General Electric Co. Mr. Werner currently serves as a member of the board of
directors of Cree, Inc., an LED manufacturer, and the Silicon Valley Leadership Group. He is also on the board of
trustees of Marquette University. Mr. Werner served as a member of the board of directors of Silver Spring Networks,
a provider of smart grid applications, from March 2009 to January 2018. Mr. Werner holds a bachelor’s degree in
industrial engineering from the University of Wisconsin–Madison, a bachelor’s degree in electrical engineering from
Marquette University, and a master’s degree in business administration from George Washington University.
Mr. Werner brings significant leadership, technical, operational, and financial management experience to the
Board. Mr. Werner provides the Board with valuable insight into management’s perspective with respect to our
operations. Mr. Werner has demonstrated strong executive leadership skills through more than 20 years of executive
officer service with various companies and brings the most comprehensive view of our operational history over the
past several years. Mr. Werner also brings to the Board leadership experience through his service on the boards of
directors of two other organizations, which gives him the ability to compare the way in which management and
boards operate within the companies and organizations he serves. It is based on the Board’s identification of these
qualifications, skills, and experience that the Board has concluded that Mr. Werner should serve as a director on the
Board and chairman of the Board.
Class I Directors with Terms Expiring in 2021
Name AgePosition(s) with
SunPowerDirector
Since
François Badoual 55 Director 2017
Denis Toulouse 54 Director 2020
Patrick Wood III 57 Director 2005
7

François Badoual has served as president and chief executive officer of Total Washington D.C. Representative
Office, Ltd. since September 2019. From 2017 to 2020, he served as president and chief executive officer of Total
New Energies Ventures, Inc. From 2012 to 2017, he served as chief executive officer of Total Energy Ventures, the
corporate venture capital arm for the Total Group. Mr. Badoual also previously served as general manager and
country chairman for Total Exploration and Production - Algeria from 2009 to 2012, and as deputy general manager
for Total Exploration and Production - Angola from 2006 to 2009. Mr. Badoual has held various other positions in
the Total Group since 1990, and he has worked in France, Indonesia, United Arab Emirates, and Venezuela.
Mr. Badoual holds a degree in civil engineering from École Nationale des Travaux Publics de l’État and an Advanced
Master in Regional and Urban Planning from École Nationale des Ponts et Chaussées.
Mr. Badoual brings significant international managerial and operational experience to the Board. His extensive
experience in the energy industry gives him a valuable perspective on our efforts to manage our business and project
development activities. It is based on the Board’s identification of these qualifications, skills, and experience that the
Board has concluded that Mr. Badoual should serve as a director on the Board.
Denis Toulouse has served as senior vice president, corporate and project finance, of Total S.A. in Paris since
April 2019. He previously served as senior vice president, mergers and acquisitions, of Total S.A. in Paris starting
in 2016. From 2015 to 2016, Mr. Toulouse was chief financial officer of Total Gas & Power Ltd. in London.
Mr. Toulouse joined Elf Aquitaine S.A.S. in 1991, prior to its acquisition by Total, and held various positions in the
marketing division of Total, including chief financial officer of Total Deutschland in Germany and chief financial
officer of Total Belgium in Belgium. Mr. Toulouse is a graduate of HEC Paris business school in France.
Mr. Toulouse brings significant international managerial and business development experience to the Board. His
extensive experience in the energy industry gives him a valuable perspective on our efforts to manage our business
and project development activities. It is based on the Board’s identification of these qualifications, skills, and
experience that the Board has concluded that Mr. Toulouse should serve as a director on the Board.
Patrick Wood III has served as president of the Hunt Energy Network, an energy storage development company,
since February 2019, and as a principal of Wood3 Resources, an energy infrastructure developer, since July 2005. He
is active in the development of electric power and natural gas infrastructure assets in North America. From 2001 to
2005, Mr. Wood served as the chairman of the Federal Energy Regulatory Commission. From 1995 to 2001, he
chaired the Public Utility Commission of Texas. Mr. Wood has also been an attorney with Baker & Botts, a global
law firm, and an associate project engineer with Arco Indonesia, an oil and gas company, in Jakarta. He currently
serves as a director of Quanta Services, Inc. Mr. Wood is a past board chairman of Dynegy, a past director of
Memorial Resource Development, Inc. and TPI Composites, a former director of the American Council on
Renewable Energy, and a member of the National Petroleum Council.
Mr. Wood brings significant strategic and operational management experience to the Board. Mr. Wood has
demonstrated strong leadership skills through a decade of regulatory leadership in the energy sector. Mr. Wood brings
a unique perspective and extensive knowledge of energy project development, public policy development,
governance, and the regulatory process. His legal background also provides the Board with a perspective on the legal
implications of matters affecting our business. It is based on the Board’s identification of these qualifications, skills,
and experience that the Board has concluded that Mr. Wood should serve as a director on the Board, Chairman of
the Nominating and Corporate Governance Committee, and Chairman of the Compensation Committee.
Class II Directors with Terms Expiring in 2022
Name AgePosition(s) with
SunPowerDirector
Since
Catherine Lesjak 61 Director 2013
Julien Pouget 43 Director 2017
Franck Trochet 49 Director 2019
Catherine Lesjak retired from HP Inc. on February 28, 2019 and was the interim chief operating officer of HP
Inc. from July 1, 2018 until January 1, 2019. She served as executive vice president and chief financial officer of HP
Inc. (formerly Hewlett-Packard Company) (HP) from January 1, 2007 until November 1, 2015 and chief financial
officer of HP from November 1, 2015 until July 1, 2018. Ms. Lesjak served as interim chief executive officer of HP
from August 2010 through October 2010. As a 32-year veteran at HP, Ms. Lesjak held a broad range of financial
8

leadership roles across HP. Before being named as chief financial officer, Ms. Lesjak served as senior vice president
and treasurer, where she was responsible for managing HP’s worldwide cash, debt, foreign exchange, capital
structure, risk management, and benefits plan administration. Earlier in her career at HP, she managed financial
operations for Enterprise Marketing and Solutions and the Software Global Business Unit. Before that, she was group
controller for HP’s Software Solutions Organization and managed HP’s global channel credit risk as controller and
credit manager for the Commercial Customer Organization. Ms. Lesjak has a bachelor’s degree in biology from
Stanford University and a master of business administration degree in finance from the University of California,
Berkeley.
Ms. Lesjak’s extensive experience as the chief financial officer of a major corporation, with significant presence
in both the business-to-consumer and business-to-business markets, allows her to make significant contributions to
our strategic business planning and execution and qualifies her as a financial expert, which is relevant to her duties
as a member of the Audit Committee. Her background is also valuable in terms of financial oversight and review of
our strategic investments. It is based on the Board’s identification of these qualifications, skills, and experience that
the Board has concluded that Ms. Lesjak should serve as a director on the Board.
Julien Pouget has served as senior vice president of the Renewables division of Total S.A. since January 1, 2017.
From 2014 to 2016, he served as a senior advisor to the President of France, initially responsible for industry, then
industry and digital, and finally for the economy. His responsibilities during this time included the restructuring of
the French nuclear power industry. Prior to his service to the President of France, Mr. Pouget spent six years in
various positions at Alstom Power, including as vice president of the heat exchangers product line for France,
Switzerland, and China, as vice president and general manager of Asian activities, and as project leader and head of
engineering for the heat exchangers on the Flamanville 3 EPR nuclear power plant in France. From 2001 to 2008,
Mr. Pouget held various positions in the French Ministry of Industry, and at the state shareholding agency at the
French Ministry for Finance and Economy. Mr. Pouget is a chief engineer of the prestigious French Corps de Mines
and a graduate of the École Polytechnique.
Mr. Pouget brings significant international managerial and operational experience to the Board. His extensive
experience in the energy industry and in government gives him a valuable perspective on policy and the global energy
marketplace. It is based on the Board’s identification of these qualifications, skills, and experience that the Board has
concluded that Mr. Pouget should serve as a director on the Board.
Franck Trochet has served as vice president, finance, of Total Petrochemicals and Refining USA, Inc. in Houston
since 2017. He held a similar role for Total’s exploration and production and marketing and services divisions, as well
as its U.S. affiliates, since 2017. From 2013 to 2017, Mr. Trochet served as vice president, business control, for Total’s
refining and chemicals branch in Paris. He was part of the team that established Total’s refining and chemicals branch
in 2010 before being appointed as vice president, corporate affairs, of Total’s polymers business unit in Brussels.
Mr. Trochet joined the finance division of Elf Aquitaine S.A.S. in 1999, prior to its acquisition by Total, and held
various positions in the refining and marketing divisions of Total, including U.K. finance manager, until 2010. He
started his career at Ernst & Young LLP. He is a graduate of the Business School of Tours in France.
Mr. Trochet brings significant strategic and business development experience to the Board. His extensive
experience in the energy industry gives him a valuable perspective on the development of our strategy going forward.
It is based on the Board’s identification of these qualifications, skills, and experience that the Board has concluded
that Mr. Trochet should serve as a director on the Board.
Vote Required
Election of a director requires the affirmative vote of the holders of a plurality of votes represented by the shares
in attendance or represented by proxy at the Annual Meeting and entitled to vote on the election of directors. The
three persons receiving the greatest number of votes at the Annual Meeting shall be elected as Class III directors.
Neither ‘‘broker non-votes’’ nor abstentions will affect the outcome of the voting on this proposal.
THE BOARD OF DIRECTORS RECOMMENDS A VOTE ‘‘FOR’’ THE ELECTION TO THE BOARD
OF EACH OF THE CLASS III DIRECTOR NOMINEES.
9

BOARD STRUCTURE
Determination of Independence
The Board has determined that three of our nine directors, namely Ms. Lesjak, Mr. McDaniel, and Mr. Wood,
each meet the standards for independence as defined by applicable listing standards of The Nasdaq Stock Market and
rules and regulations of the SEC. The Board has also determined that Mr. Werner, our president, chief executive
officer, and chairman of the Board, and Mr. Badoual, Mr. Pouget, Mr. Rebeyrol, Mr. Toulouse, and Mr. Trochet, as
directors designated by our controlling stockholder, Total, pursuant to our Affiliation Agreement with Total, are not
‘‘independent’’ as defined by applicable listing standards of The Nasdaq Stock Market. There are no family
relationships among any of our directors or executive officers.
Leadership Structure and Risk Oversight
The Board has determined that having a lead independent director assist Mr. Werner, the president, chief
executive officer, and chairman of the Board, is in the best interest of our stockholders. Mr. Wood has served as the
lead independent director of the Board since June 2012. The Board believes this structure ensures a greater role for
the independent directors in the oversight of our company and encourages active participation of the independent
directors in setting agendas and establishing priorities and procedures for the work of the Board. We believe that this
leadership structure also is preferred by a significant number of our stockholders.
The Board is actively involved in oversight of risks that could affect our company. This oversight is conducted
primarily through committees of the Board, in particular our Audit Committee, as disclosed in the descriptions of
each of the committees below and in the respective charters of each committee. The full Board, however, has retained
responsibility for general oversight of risks. The Board satisfies this responsibility through full reports by each
committee chair regarding the committee’s considerations and actions, as well as through regular reports directly
from our officers responsible for oversight of particular risks within our company.
Board Meetings
The Board held four regular, quarterly meetings, one annual meeting, and six special meetings during fiscal
2019. During fiscal 2019, each incumbent director, as applicable, attended at least 75% of the aggregate number of
meetings of the Board and its committees on which such director served during his or her term. Our independent
directors held 17 meetings with management present, as well as four executive sessions during regular, quarterly
meetings and two executive sessions during special meetings without management present, during fiscal 2019.
Controlled Company, Nasdaq Listing Standards
As of April 3, 2020, Total has owned greater than 50% of our outstanding voting securities, and we are therefore
considered a ‘‘controlled company’’ within the meaning of The Nasdaq Stock Market rules. As long as we remain
a ‘‘controlled company,’’ we are exempt from the rules that would otherwise require that the Board be composed of
a majority of independent directors and that our Compensation Committee and Nominating and Corporate
Governance Committee be composed entirely of independent directors. This ‘‘controlled company’’ exception does
not modify the independence requirements for the Audit Committee, and we comply with the requirements of the
Sarbanes-Oxley Act and The Nasdaq Stock Market rules that require that our Audit Committee be composed
exclusively of independent directors.
Board Committees
We believe that good corporate governance is important to ensure that we are managed for the long-term benefit of
our stockholders. The Board has established committees to ensure that we maintain strong corporate governance standards.
The Board has standing Audit, Compensation, and Nominating and Corporate Governance Committees. The Board also
previously had a Finance Committee, which was dissolved by the Board on February 7, 2019. Additionally, the Board has
in the past established, and may in the future establish, ad hoc committees to assist the Board in fulfilling its oversight
responsibilities. The charters of our Audit, Compensation, and Nominating and Corporate Governance Committees are
10

available on our website at http://investors.sunpower.com. You may also request copies of our committee charters free of
charge by writing to SunPower Corporation, 51 Rio Robles, San Jose, California 95134, Attention: Corporate Secretary.
Below is a summary of our committee structure and membership information.
Director(1)Audit
CommitteeCompensation
CommitteeFinance
Committee(2)
Nominating andCorporate
GovernanceCommittee
François Badoual — — — Member
Catherine Lesjak(I) Member — Member —
Thomas McDaniel(I) Chair Member Chair Member
Julien Pouget — Member — —
Thomas Rebeyrol — Member — —
Denis Toulouse — — — —
Franck Trochet — — — Member
Patrick Wood III(I)(*) Member Chair — Chair
(1) (I) Indicates an independent director, and (*) indicates the lead independent director.
(2) The other two former members of the Finance Committee are no longer incumbent directors.
Audit Committee
Mr. McDaniel is the chairman of the Audit Committee, appointed in June 2012. Our Audit Committee is a
separately-designated standing committee established in accordance with Section 3(a)(58)(A) of the Exchange Act.
The Board has determined that each member of our Audit Committee is ‘‘independent’’ as that term is defined in
Section 10A of the Exchange Act and as defined by applicable listing standards of The Nasdaq Stock Market. Each
member of the Audit Committee is financially literate and has the financial sophistication required by the applicable
listing standards of The Nasdaq Stock Market. The Board has determined that each of Ms. Lesjak and Mr. McDaniel
meet the criteria of an ‘‘audit committee financial expert’’ within the meaning of applicable SEC regulations due to
their professional experience. Mr. McDaniel’s and Ms. Lesjak’s relevant professional experience is described above
under ‘‘Proposal One—Re-Election of Class III Directors.’’ The Audit Committee held 10 meetings during fiscal
2019.
The purpose of the Audit Committee, pursuant to its charter, is, among other things, to:
• provide oversight of our accounting and financial reporting processes and the audit of our financial
statements and internal controls by our independent registered public accounting firm;
• assist the Board in the oversight of: (1) the integrity of our financial statements; (2) our compliance with
legal and regulatory requirements; (3) the independent registered public accounting firm’s performance,
qualifications, and independence; and (4) the performance of our internal audit function;
• oversee management’s identification, evaluation, and mitigation of major risks to our company;
• prepare an audit committee report as required by the SEC to be included in our annual proxy statement;
• provide to the Board such information and materials as it may deem necessary to make the Board aware
of financial matters requiring the attention of the Board;
• consider questions of actual and potential conflicts of interest (including corporate opportunities) of Board
members and corporate officers and review and approve proposed related party transactions that would be
required to be disclosed under Item 404 of Regulation S-K, provided that any approval of related party
transactions may be made only by the disinterested members of the Audit Committee;
• oversee any waiver of the Code of Business Conduct and Ethics for directors and executive officers; and
• review at least annually our company’s banking and treasury authorizations and material terms of our credit
facilities as they bear on our risk exposures, financial disclosures, internal controls, and legal compliance.
The Audit Committee also serves as the representative of the Board with respect to its oversight of the matters
described below in the ‘‘Audit Committee Report.’’ The Audit Committee has established procedures for (1) the
11

receipt, retention, and treatment of complaints received by us regarding accounting, internal accounting controls, or
auditing matters, and (2) the confidential, anonymous submission by our employees of concerns regarding accounting
or auditing matters. The Audit Committee promptly reviews such complaints and concerns.1
Compensation Committee
Mr. Wood is the chairman of the Compensation Committee, appointed in November 2012. Two of the four
members of the Compensation Committee, Mr. McDaniel and Mr. Wood, are ‘‘independent’’ as defined by applicable
listing standards of The Nasdaq Stock Market. Mr. Pouget and Mr. Rebeyrol were designated by Total to be on the
Compensation Committee pursuant to our Affiliation Agreement and are not ‘‘independent’’ as defined by applicable
listing standards of The Nasdaq Stock Market. The Compensation Committee held six meetings during fiscal 2019.
The Compensation Committee, pursuant to its charter, assists the Board in discharging its duties with respect to:
• the formulation, implementation, review, and modification of the compensation of our directors and
executive officers;
• the review and preparation of an annual report of the Compensation Committee for inclusion in our annual
proxy statement or Annual Report on Form 10-K, in accordance with applicable rules of the SEC and
applicable listing standards of The Nasdaq Stock Market;
• the review and discussion with management of the Compensation Discussion and Analysis section of our
annual proxy statement or Annual Report on Form 10-K;
• oversight of our company compensation philosophy, which may be performance-based, to reward and
retain employees based on achievement of goals; and
• the administration of our equity incentive plans, including the SunPower Corporation 2015 Omnibus
Incentive Plan.
We also have a Section 16 Subcommittee of the Compensation Committee consisting solely of independent
directors available to approve certain compensation matters in accordance with Rule 16b-3 of the Exchange Act, as
recommended by the Compensation Committee. This subcommittee historically also reviewed and approved certain
compensation matters in accordance with Section 162(m) of the Internal Revenue Code of 1986, as amended
(the ‘‘Code’’).
In certain instances, the Compensation Committee has delegated limited authority to Mr. Werner, in his capacity
as a Board member, with respect to compensation and equity awards for employees other than our executive officers.
For more information on our processes and procedures for the consideration and determination of executive
compensation, see ‘‘Compensation Discussion and Analysis’’ below.
Compensation Committee Interlocks and Insider Participation
No member of our Compensation Committee was at any time during fiscal 2019 one of our officers or
employees or is one of our former officers or employees. No member of our Compensation Committee had any
relationship requiring disclosure under Item 404 and Item 407(e)(4) of Regulation S-K. Additionally, during fiscal
2019, none of our executive officers or directors was a member of the board of directors, or any committee of the
board of directors, or of any other entity such that the relationship would be construed to constitute a compensation
committee interlock within the meaning of the rules and regulations of the SEC.
Nominating and Corporate Governance Committee
Mr. Wood is the chairman of our Nominating and Corporate Governance Committee. Two of the four members
of the Nominating and Corporate Governance Committee, Mr. McDaniel and Mr. Wood, are ‘‘independent’’ as
defined by applicable listing standards of The Nasdaq Stock Market. Mr. Badoual and Mr. Trochet were designated
by Total to be on the Nominating and Corporate Governance Committee pursuant to our Affiliation Agreement with
Total and are not ‘‘independent’’ as defined by applicable listing standards of The Nasdaq Stock Market.
The Nominating and Corporate Governance Committee held four meetings during fiscal 2019.
1 Upon the dissolution of the Finance Committee on February 7, 2019, a portion of the Finance Committee’s oversight responsibilities(including oversight responsibility for certain treasury, financial risk review, insurance review, and other matters) was allocated to the AuditCommittee.
12

The Nominating and Corporate Governance Committee, pursuant to its charter, assists the Board in discharging
its responsibilities with respect to:
• the identification of individuals qualified to become directors and the selection or recommendation of
candidates for all directorships to be filled by the Board or by the stockholders;
• the evaluation of whether an incumbent director should be nominated for re-election to the Board upon
expiration of such director’s term, based upon factors established for new director candidates as well as the
incumbent director’s qualifications, performance as a Board member, and such other factors as the
Nominating and Corporate Governance Committee deems appropriate; and
• the development, maintenance, and recommendation of a set of corporate governance principles applicable
to us, and periodically reviewing such principles.
The Nominating and Corporate Governance Committee also considers diversity in identifying nominees for
directors. In particular, the Nominating and Corporate Governance Committee believes that the members of the Board
should reflect a diverse range of talent, skill, and expertise sufficient to provide sound and prudent guidance withrespect to our operations and interests. In addition, the Nominating and Corporate Governance Committee hasdetermined that the Board as a whole must have the right diversity, mix of characteristics, and skills for the optimalfunctioning of the Board in its oversight role.
The Nominating and Corporate Governance Committee believes the Board should be composed of persons withskills in areas such as:
• relevant industries, especially solar products and services;
• technology manufacturing;
• sales and marketing;
• leadership of large, complex organizations;
• finance and accounting;
• corporate governance and compliance;
• strategic planning;
• international business activities; and
• human capital and compensation.
Under our Corporate Governance Principles, during the director nominee evaluation process, the Nominatingand Corporate Governance Committee and the Board take the following into account:
• A significant number of directors on the Board should be independent directors, unless otherwise required
by applicable law or The Nasdaq Stock Market rules;
• Candidates should be capable of working in a collegial manner with persons of different educational,
business, and cultural backgrounds and should possess skills and expertise that complement the attributes
of the existing directors;
• Candidates should represent a diversity of viewpoints, backgrounds, experiences, and other demographics;
• Candidates should demonstrate notable or significant achievement and possess senior-level business,
management, or regulatory experience that would inure to our benefit;
• Candidates shall be individuals of the highest character and integrity;
• Candidates shall be free from any conflict of interest that would interfere with their ability to properly
discharge their duties as a director or would violate any applicable law or regulation;
• Candidates for the Audit Committee and Compensation Committee should have the enhanced
independence and financial literacy and expertise that may be required under law or The Nasdaq Stock
Market rules;
• Candidates shall be capable of devoting the necessary time to discharge their duties, taking into account
memberships on other boards and other responsibilities; and
• Candidates shall have the desire to represent the interests of all stockholders.
13

Finance Committee
Mr. McDaniel was the chairman of the Finance Committee. Two of the four former members of the Finance
Committee, Ms. Lesjak and Mr. McDaniel, are ‘‘independent’’ as defined by applicable listing standards of The
Nasdaq Stock Market. Helle Kristoffersen and Antoine Larenaudie, former members of the Board who resigned
during fiscal 2019 and fiscal 2020, respectively, were designated by Total to be on the Finance Committee pursuant
to our Affiliation Agreement with Total and were not ‘‘independent’’ as defined by applicable listing standards of The
Nasdaq Stock Market. The Finance Committee held one meeting during fiscal 2019. Pursuant to approval of the
Board, the Finance Committee was dissolved on February 7, 2019. A portion of the Finance Committee’s oversight
responsibilities were allocated to the Audit Committee, and the remainder to the Board.
Prior to its dissolution, the Finance Committee assisted the Board in discharging its duties with respect to:
• The review, evaluation, and approval of financing transactions, including credit facilities, structured
finance, issuance of debt and equity securities in private and public transactions, sales of project assets or
ownership therein to publicly traded entities in which we have an equity interest greater than 10% or their
subsidiaries, and the repurchase of debt and equity securities (other than financing activity exceeding
$50 million, which requires the review and approval of the Board);
• The review of our annual operating plan for recommendation to the Board, and the monitoring of capital
spend as compared with the annual operating plan;
• The review and recommendation to the Board of investments, acquisitions, divestitures, and other corporate
transactions; and
• General oversight of our treasury activities, and the review, at least annually, of our counterparty credit risk
and insurance programs.
14

CORPORATE GOVERNANCE
Stockholder Communications with Board
We provide a process by which stockholders may send communications to the Board, any committee of the
Board, our non-management directors, or any particular director. Stockholders can contact our non-management
directors by sending such communications to the chairman of the Nominating and Corporate Governance Committee,
c/o Corporate Secretary, SunPower Corporation, 51 Rio Robles, San Jose, California 95134. Stockholders wishing
to communicate with a particular Board member, a particular Board committee, or the Board as a whole may send
a written communication to our Corporate Secretary, SunPower Corporation, 51 Rio Robles, San Jose,
California 95134. The Corporate Secretary will forward such communication to the full Board, to the appropriate
committee, or to any individual director or directors to whom the communication is addressed, unless the
communication is unduly hostile, threatening, illegal, or harassing, in which case the Corporate Secretary has the
authority to discard the communication or take appropriate legal action regarding the communication.
Directors’ Attendance at Our Annual Meetings
Although we do not have a formal policy that mandates the attendance of our directors at our annual stockholder
meetings, our directors are encouraged to attend. All of our directors are expected to attend the 2020 Annual Meeting,
and eight of our directors attended our annual meeting of stockholders held on May 16, 2019 (the ‘‘2019 Annual
Meeting’’).
Submission of Stockholder Proposals for the 2021 Annual Meeting
As a SunPower stockholder, you may submit a proposal, including director nominations, for consideration at
future annual meetings of stockholders.
Stockholder Proposals. Only stockholders meeting certain criteria outlined in our Amended and Restated
By-Laws (the ‘‘By-Laws’’) are eligible to submit nominations for election to the Board or to propose other proper
business for consideration by stockholders at an annual meeting. Under the By-Laws, stockholders who wish to
nominate persons for election to the Board or propose other proper business for consideration by stockholders at an
annual meeting must give proper written notice to us not earlier than 120 days and not later than 90 days before the
first anniversary of the preceding year’s annual meeting, provided that in the event that an annual meeting is called
for a date that is not within 25 days before or after such anniversary date, notice by the stockholder in order to be
timely must be received not later than the close of business on the tenth day following the day on which we mail or
publicly announce our notice of the date of the annual meeting, whichever occurs first. Therefore, notices regarding
nominations of persons for election to the Board and proposals of other proper business for consideration at the 2021
annual meeting of stockholders must be submitted to us no earlier than January 14, 2021 and no later than
February 13, 2021. If the date of the 2021 annual meeting is moved more than 25 days before or after the anniversary
date of the 2020 Annual Meeting, the deadline will instead be the close of business on the tenth day following notice
of the date of the 2021 annual meeting of stockholders or public disclosure of such date, whichever occurs first. We
have discretionary power, but are not obligated, to consider stockholder proposals submitted after February 13, 2021
for the 2021 annual meeting.
Stockholder proposals will also need to comply with SEC regulations, such as Rule 14a-8 of the Exchange Act
regarding the inclusion of stockholder proposals in any Company-sponsored proxy material. In order to be included
in our proxy materials for the 2021 annual meeting of stockholders, pursuant to Rule 14a-8 of the Exchange Act the
submission deadline for stockholder proposals is December 4, 2020. All written proposals must be received by our
Corporate Secretary, at our corporate offices at 51 Rio Robles, San Jose, California 95134 by the close of business
on the required deadline in order to be considered for inclusion in our proxy materials for the 2021 annual meeting
of stockholders.
15

Nomination of Director Candidates. Our Nominating and Corporate Governance Committee will consider
director candidates recommended by our stockholders. Such nominations should be directed to the Nominating and
Corporate Governance Committee, c/o Corporate Secretary, SunPower Corporation, 51 Rio Robles, San Jose,
California 95134. In addition, the stockholder must give notice of a nomination to our Corporate Secretary, and such
notice must be received within the time period described above under ‘‘Stockholder Proposals.’’ Any such proposal
must include the following:
• the name, age, business address, residential address, and record address of such nominee;
• the principal occupation or employment of such nominee;
• the class or series and number of shares of our stock owned beneficially or of record by such nominee;
• any information relating to the nominee that would be required to be disclosed in our proxy statement;
• the nominee holder for, and number of, shares owned beneficially but not of record by such person;
• whether and the extent to which any hedging or other transaction or series of transactions has been entered
into by or on behalf of, or any other agreement, arrangement, or understanding (including any derivative
or short positions, profit interests, options, or borrowed or loaned shares) has been made, the effect or intent
of which is to mitigate loss to or manage risk or benefit of share price changes for, or to increase or decrease
the voting power of, such person with respect to any share of our stock;
• to the extent known by the stockholder giving the notice, the name and address of any other stockholder
supporting the nominee for election or re-election as a director on the date of such stockholder’s notice;
• a description of all arrangements or understandings between or among such persons pursuant to which the
nomination(s) are to be made by the stockholder and any relationship between or among the stockholder
giving notice and any person acting in concert, directly or indirectly, with such stockholder and any person
controlling, controlled by, or under common control with such stockholder, on the one hand, and each
proposed nominee, on the other hand; and
• a representation that the stockholder intends to appear in person or by proxy at the meeting to nominate the
persons named in its notice.
If a director nomination is made pursuant to the process set forth above, the Nominating and Corporate
Governance Committee will apply the same criteria in evaluating the nominee as it would any other board nominee
candidate, and will recommend to the Board whether or not the stockholder nominee should be included as a
candidate for election in our proxy statement. The nominee and nominating stockholder should be willing to provide
any information reasonably requested by the Nominating and Corporate Governance Committee in connection with
its evaluation. The Board will make the final determination whether or not a nominee will be included in the proxy
statement and on the proxy card for election.
Once either a search firm selected by the Nominating and Corporate Governance Committee or a stockholder
has provided our Nominating and Corporate Governance Committee with the identity of a prospective candidate, the
Nominating and Corporate Governance Committee communicates the identity and known background and
experience of the candidate to the Board. If warranted by a polling of the Board, members of our Nominating and
Corporate Governance Committee and/or other members of our senior management may interview the candidate.
If the Nominating and Corporate Governance Committee reacts favorably to a candidate, the candidate is next invited
to interview with the members of the Board who are not on the Nominating and Corporate Governance Committee.
The Nominating and Corporate Governance Committee then makes a final determination whether to recommend the
candidate to the Board for directorship. The Nominating and Corporate Governance Committee currently has not set
specific minimum qualifications or criteria for nominees that it proposes for Board membership, but evaluates the
entirety of each candidate’s credentials. The Nominating and Corporate Governance Committee believes, however,
that we will be best served if our directors bring to the Board a variety of diverse experience and backgrounds and,
among other things, demonstrated integrity, executive leadership, and financial, marketing, or business knowledge
and experience. See ‘‘Board Structure—Nominating and Corporate Governance Committee’’ for factors considered
by the Nominating and Corporate Governance Committee and the Board in considering director nominees.
16

Corporate Governance Principles
We believe that strong corporate governance practices are the foundation of a successful, well-run company. The
Board has adopted Corporate Governance Principles that set forth our core corporate governance principles,
including:
• oversight responsibilities of the Board;
• election and responsibilities of the lead independent director;
• role of Board committees and assignment and rotation of members;
• review of the Code of Business Conduct and Ethics and consideration of related party transactions;
• independent director meetings without management and with outside auditors;
• Board’s access to employees;
• annual review of director compensation;
• membership criteria and selection of the Board;
• annual review of Board performance;
• director orientation and continuing education;
• stock ownership guidelines for certain of our executive officers and directors;
• annual review of performance and compensation of executive officers; and
• succession planning for key executive officers.
Our Corporate Governance Principles are available on our website at http://investors.sunpower.com.
Code of Business Conduct and Ethics; Related Persons Transactions Policy and Procedures
It is our general policy to conduct our business activities and transactions with the highest level of integrity and
ethical standards and in accordance with all applicable laws. In addition, it is our policy to avoid situations that create
an actual or potential conflict between our interests and the personal interests of our officers and directors. Such
principles are described in our Code of Business Conduct and Ethics. Our Code of Business Conduct and Ethics is
applicable to our directors, officers, and employees (including our principal executive officer, principal financial
officer, and principal accounting officer), as well as to our suppliers, vendors, partners, and other parties that represent
us, and is designed to promote compliance with the laws applicable to our business, accounting standards, and proper
and ethical business methods and practices. Our Code of Business Conduct and Ethics is available on our website
at http://investors.sunpower.com/corporate-governance/governance-overview under the tab for ‘‘Code of Conduct.’’
You may also request a copy by writing to us at SunPower Corporation, 51 Rio Robles, San Jose, California 95134,
Attention: Corporate Secretary. If we amend our Code of Business Conduct and Ethics or grant a waiver applicable
to our principal executive officer, principal financial officer, or principal accounting officer, we will post a copy of
such amendment or waiver on our website. Under our Corporate Governance Principles, the Audit Committee is
responsible for reviewing and recommending changes to our Code of Business Conduct and Ethics.
Pursuant to our Corporate Governance Principles and the charter of our Audit Committee, our Audit Committee
will consider questions of actual and potential conflicts of interest (including corporate opportunities) of directors and
officers and approve or prohibit such transactions. The Audit Committee will review and approve in advance all
proposed related party transactions that would be required to be disclosed under Item 404 of Regulation S-K, in
compliance with the applicable Nasdaq Stock Market rules. A related party transaction will only be approved if the
Audit Committee determines that it is in our best interests. If a director is involved in the transaction, he or she will
be recused from all voting and approval processes in connection with the transaction.
17

Certain Relationships and Related Persons Transactions
Other than the compensation agreements and other arrangements described herein, and the transactions
described below, since the start of our last fiscal year on December 31, 2018, there has not been, nor is there currently
proposed, any transaction or series of similar transactions to which we have been or will be a party:
• in which the amount involved exceeded or will exceed $120,000; and
• in which any director, director nominee, executive officer, beneficial owner of more than 5% of any class
of our common stock, or any immediate family member of such persons had or will have a direct or indirect
material interest.
Agreements with Total and Total S.A.
Spin-Off Agreements
On November 11, 2019, we announced plans to separate into two independent, publicly traded companies –
SunPower and Maxeon Solar Technologies, Pte. Ltd. (‘‘Maxeon Solar’’). The separation is expected to occur through
a spin-off (the ‘‘Spin-Off’’) and distribution of all of the shares of Maxeon Solar held by SunPower to SunPower
stockholders, followed by an equity investment in Maxeon Solar by long-time partner Tianjin Zhonghuan
Semiconductor Co., Ltd. (‘‘TZS’’). In order to effect the Spin-Off, on November 8, 2019, we entered into a Separation
and Distribution Agreement with Maxeon Solar, which governs the principal corporate transactions required to effect
the separation and the Spin-Off distribution, and provides for the allocation between SunPower and Maxeon Solar
of the assets, liabilities, and obligations of the respective companies as of the separation.
On November 8, 2019, we entered into an Investment Agreement (the ‘‘Investment Agreement’’) with Maxeon
Solar, TZS, and, for the limited purposes set forth therein, Total, pursuant to which, immediately after the Spin-Off
distribution, TZS will purchase from Maxeon Solar ordinary shares that will, in the aggregate, represent
approximately 28.848% of the outstanding ordinary shares of Maxeon Solar on a fully diluted basis after giving effect
to the Spin-Off for $298 million. Pursuant to the Investment Agreement, consummation of the TZS investment is
subject to certain conditions being satisfied or waived by us or Maxeon Solar on the one hand, and TZS, on the other
hand, including, among other things: (1) the completion of the separation and the distribution in accordance with the
Separation and Distribution Agreement; (2) Maxeon Solar entering into definitive agreements for a term loan facility
in an amount not less than $325 million; (3) Maxeon Solar obtaining certain additional financing in the form of a
revolving credit facility of not less than $100 million or, alternatively, making certain working capital adjustment
arrangements; (4) Maxeon Solar having no more than $138 million in debt and no less than $50 million in Cash
(as defined in the Investment Agreement) immediately prior to the TZS investment; (5) execution of certain ancillary
agreements and a shareholders agreement (the ‘‘Shareholders Agreement’’); (6) receipt of required governmental
approvals; (7) completion of all necessary filings under the U.S. securities laws; (8) receipt by the Board of one or
more opinions from an independent valuation firm confirming the solvency and financial viability of each of us and
Maxeon Solar immediately after the consummation of the distribution in a form acceptable to us; (9) if applicable,
the receipt of a waiver from the Singapore Securities Industry Council from the applicability of the Singapore Code
on Take-overs and Mergers to the distribution and the investment; and (10) the absence of any legal impediments
prohibiting the investment. Moreover, the obligations of us and Maxeon Solar, on the one hand, and TZS, on the other
hand, to consummate the investment are subject to certain other conditions, including, among other things, (A) the
accuracy of the other party’s representations and warranties (subject to certain materiality qualifiers) and (B) the other
party’s performance of its agreements and covenants contained in the Investment Agreement in all material respects.
In addition, the obligation of TZS to consummate the investment is subject to the absence of any Material Adverse
Effect (as defined in the Investment Agreement) on Maxeon Solar occurring from the date of the Investment
Agreement through the closing of the investment, subject, in each case, to certain exclusions set forth in the
Investment Agreement.
Pursuant to the Investment Agreement, we, Maxeon Solar, TZS and, with respect to certain provisions, Total
have agreed to certain customary representations, warranties, and covenants, including certain representations and
warranties as to the financial statements, contracts, liabilities, and other attributes of Maxeon Solar, certain business
conduct restrictions and covenants requiring efforts to complete the transactions.
The Separation and Distribution Agreement and Investment Agreement contemplate certain additional
agreements be entered into between us, Maxeon Solar and other parties in connection with the Spin-Off and related
18

investment by TZS, including a tax matters agreement, employee matters agreement, transition services agreement,
brand framework agreement, cross license agreement, collaboration agreement and supply agreement, each as we
previously noted in our announcement of the contemplated transaction.
At the closing of the TZS investment, TZS, Total and Maxeon Solar will enter the Shareholders Agreement that
contains provisions bearing on the governance of Maxeon Solar and the ability of Total and TZS to buy, sell or vote
their shares in Maxeon Solar.
Revolving Credit Facility with Crédit Agricole and Related Guaranty
On October 29, 2019, we entered into a new Green Revolving Credit Agreement (the ‘‘2019 Revolver’’) with
Crédit Agricole Corporate and Investment Bank, as lender, with a revolving credit commitment of $55 million. The
2019 Revolver contains affirmative covenants, events of default and repayment provisions customarily applicable to
similar facilities and has a per annum commitment fee of 0.05% on the daily unutilized amount, payable quarterly.
Loans under the 2019 Revolver bear either an adjusted LIBOR interest rate for the period elected for such loan or
a floating interest rate of the higher of prime rate, federal funds effective rate, or LIBOR for an interest period of one
month, plus an applicable margin, ranging from 0.25% to 0.60%, depending on the base interest rate applied, and
each matures on the earlier of April 29, 2021, or the termination of commitments thereunder. Our payment obligations
under the 2019 Revolver are guaranteed by Total S.A. up to the maximum aggregate principal amount of $55 million.
In consideration of the commitments of Total S.A., we are required to pay them a guaranty fee of 0.25% per annum
on any amounts borrowed under the 2019 Revolver and to reimburse Total S.A. for any amounts paid by them under
the parent guaranty. We have pledged the equity of the wholly owned subsidiary of our company that holds our shares
of Enphase Energy, Inc. common stock to secure our reimbursement obligation under the 2019 Revolver. We have
also agreed to limit our ability to draw funds under the 2019 Revolver to no more than 67% of the fair market value
of the common stock held by our subsidiary at the time of the draw.
As of December 29, 2019, we had no outstanding borrowings under the 2019 Revolver.
Affiliation Agreement
In connection with the Tender Offer, we and Total entered into an affiliation agreement (the ‘‘Affiliation
Agreement’’). The Affiliation Agreement was amended on June 7, 2011, December 12, 2011, February 28, 2012, and
August 10, 2012. The Affiliation Agreement governs the relationship following the closing of the Tender Offer
between SunPower, on the one hand, and Total S.A., Total, any other affiliate of Total S.A. and any member of a
group of persons formed for the purpose of acquiring, holding, voting, disposing of, or beneficially owning our voting
stock of which Total S.A. or any of its affiliates is a member (the ‘‘Total Group’’), on the other hand.
Standstill. Following the closing of the Tender Offer and during the Standstill Period (as defined below), Total,
Total S.A., and the Total Group may not:
• effect or seek, or announce any intention to effect or seek, any transaction that would result in the Total
Group beneficially owning shares in excess of the Applicable Standstill Limit (as defined below), or take
any action that would require us to make a public announcement regarding the foregoing;
• request that (i) we, (ii) the Board members that are independent directors and not appointed to the Board
by Total (the ‘‘Disinterested Directors’’), or (iii) our officers or employees, amend or waive any of the
standstill restrictions applicable to the Total Group described above; or
• enter into any discussions with any third party regarding any of the foregoing.
In addition, no member of the Total Group may, among other things, solicit proxies relating to the election of directors
to the Board without the prior approval of the Disinterested Directors.
The Total Group is, however, permitted to either (i) make and consummate a Total Tender Offer or (ii) propose
and effect a Total Merger so long as, in each case, Total complies with certain advance notice and prior negotiation
obligations, including providing written notice to us at least 120 days before commencing or proposing such Total
Tender Offer or Total Merger and making its designees reasonably available for the purpose of negotiation with the
Disinterested Directors concerning such Total Tender Offer or Total Merger.
19

The ‘‘Standstill Period’’ is the period beginning on the date of the Affiliation Agreement and ending on the
earlier to occur of:
• a change of control of our company;
• the first time that the Total Group beneficially owns less than 15% of outstanding voting power of our
company;
• when we or the Board take or fail to take certain of the actions described below under ‘‘—Events Requiring
Stockholder Approval by Total’’ or fail to comply with certain of the covenants described below under
‘‘—Covenants of Total and SunPower’’ during the time when Total, together with the controlled subsidiaries
of Total S.A., owns 50% or less of the outstanding voting power of our company or 40% or less of the
outstanding voting power of our company when at least $100 million in Guarantees are outstanding under
the Credit Support Agreement;
• a tender offer for at least 50% of the outstanding voting power of our company is commenced by a third
party after the time when Total, together with the controlled subsidiaries of Total S.A., owns 50% or less
of the outstanding voting power of our company or 40% or less of the outstanding voting power of our
company when at least $100 million in Guarantees are outstanding under the Credit Support Agreement;
and
• the termination of the Affiliation Agreement.
The ‘‘Applicable Standstill Limit’’ is 70% of the lower of (i) the then outstanding shares of our common stock
or (ii) the then outstanding voting power of our company.
During the Standstill Period, the Total Group will not be in breach of its standstill obligations described above
if any member of the Total Group holds beneficial ownership of shares of our common stock in excess of the
Applicable Standstill Limit solely as a result of:
• recapitalizations, repurchases, or other actions taken by us or our controlled subsidiaries that have the effect
of reducing the number of shares of our common stock then outstanding;
• the issuance of shares of our common stock to Total in connection with the acquisition of Tenesol SA; or
• the rights specified in any ‘‘poison pill’’ share purchase rights plan having separated from the shares of our
common stock and a member of the Total Group having exercised such rights.
Transfer of Control. If any member or members of the Total Group seek to transfer, in one or a series of
transactions, either (i) 40% or more of the outstanding shares of our common stock or (ii) 40% or more of the
outstanding voting power of our company to a single person or group, then such transfer must be conditioned on, and
may not be effected, unless the transferee either:
• makes a tender offer to acquire 100% of the voting power of our company, at the same price per share of
voting stock and using the same form of consideration to be paid by the transferee to the Total Group; or
• proposes a merger providing for the acquisition of 100% of the voting power of our company, at the same
price per share of voting stock and using the same form of consideration to be paid by the transferee to the
Total Group.
Total’s Rights to Maintain. The Total Group has the following rights to maintain its ownership in us until (i) the
first time that the Total Group owns less than 40% of the outstanding voting power of our company, or (ii) until the
first time that Total transfers shares of our common stock to a person other than Total S.A. or a controlled subsidiary
of Total S.A. and, as a result of such transfer, Total S.A. and its subsidiaries own less than 50% of the outstanding
voting power of our company.
If we propose to issue new securities primarily for cash in a financing transaction, then Total has the right to
purchase a portion of such new securities equal to its percentage ownership in us. Total can also elect to purchase
our securities in open market transactions or through privately negotiated transactions in an amount equal to its
percentage ownership in connection with such issuance of new securities, as it did following our November 2019
offering of common stock. If we propose to issue new securities in consideration for our purchase of a business or
assets of a business, then Total has the right to purchase additional securities in the open market or through
privately-negotiated transactions equal to its percentage ownership in us. Total has similar rights in the event that we
20

issue or propose to issue (including pursuant to our equity plans or as the result of the conversion of our convertible
securities) securities that, together with all other issuances of securities by us since the end of the preceding fiscal
quarter, aggregate to more than 1% of our fully diluted equity. Total has a nine-month grace period, subject to certain
extensions to satisfy regulatory conditions, to acquire securities in the open market or through privately negotiated
transactions in connection with any of the securities issuances described above.
SunPower Board. The Affiliation Agreement provides that Total is entitled to designate nominees to the Board,
subject to the maintenance of certain ownership thresholds described below. See ‘‘Proposal One’’ above for more
details on our current Board membership.
So long as Total, together with the controlled subsidiaries of Total S.A., owns at least 10% of the outstanding
voting power of our company, then the Board must use its reasonable best efforts to elect the directors designated
by Total as follows:
• until the first time that Total, together with the controlled subsidiaries of Total S.A., owns less than 50%
of the voting power of our company, Total will be entitled to designate five nominees to serve on the Board;
• until the first time that Total, together with the controlled subsidiaries of Total S.A., owns less than 50%
but not less than 40% of the voting power of our company, Total will be entitled to designate four nominees
to serve on the Board;
• until the first time that Total, together with the controlled subsidiaries of Total S.A., owns less than 40%
but not less than 30% of the voting power of our company, Total will be entitled to designate three
nominees to serve on the Board;
• until the first time that Total, together with the controlled subsidiaries of Total S.A., owns less than 30%
but not less than 20% of the voting power of our company, Total will be entitled to designate two nominees
to serve on the Board; and
• until the first time that Total, together with the controlled subsidiaries of Total S.A., owns less than 20%
but not less than 10% of the voting power of our company, Total will be entitled to designate one nominee
to serve on the Board.
For as long as they are serving on the Board, the directors designated by Total will be allocated across the three
classes that comprise the Board in a manner as equal as practicable.
Subject to the listing standards of The Nasdaq Stock Market, until the first time that Total, together with the
controlled subsidiaries of Total S.A., owns less than 30% of the outstanding voting power of our company:
• the Audit Committee will be composed of three Disinterested Directors;
• the Compensation Committee and the Nominating and Corporate Governance Committee will each be
composed of two Disinterested Directors and two directors designated by Total; and
• any other standing committee will be composed of two Disinterested Directors and two directors designated
by Total.
Until the first time that Total, together with the controlled subsidiaries of Total S.A., own less than 10% of the
outstanding voting power of our company, a representative of Total will, subject to certain exceptions, be permitted
to attend all meetings of the Board or any committee thereof in a non-voting, observer capacity (other than any
committee whose sole purpose is to consider a transaction for which there exists an actual conflict of interest between
the Total Group, on the one hand, and us and any of our affiliates, on the other hand).
Events Requiring Specific Board Approval. At any time when Total, together with the controlled subsidiaries of
Total S.A., owns at least 30% of the outstanding voting power of our company, neither the Total Group nor we (or
any of our affiliates) may effect any of the following without first obtaining the approval of a majority of the
Disinterested Directors:
• any amendment to our Certificate of Incorporation or By-Laws;
• any transaction that, in the reasonable judgment of the Disinterested Directors, involves an actual conflict
of interest between the Total Group, on the one hand, and us and any of our affiliates, on the other hand;
• the adoption of any stockholder rights plan;
21

• except as provided above, the commencement of any tender offer or exchange offer by the Total Group for
shares of our common stock or securities convertible into shares of our common stock, or the approval of
a merger of us or any company that we control with a member of the Total Group;
• any voluntary dissolution or liquidation of our company or any company that we control;
• any voluntary bankruptcy filing by us or any company that we control or the failure to oppose any other
person’s bankruptcy filing or action to appoint a receiver of our company or any company that we control;
• any delegation of all or a portion of the authority of the Board to any committee thereof;
• any amendment, modification, or waiver of any provision of the Affiliation Agreement;
• any modification of, or action with respect to, director’s and officer’s insurance coverage; or
• any reduction in the compensation of the Disinterested Directors.
Events Requiring Supermajority Board Approval. At any time when Total, together with the controlled
subsidiaries of Total S.A., owns at least 30% of the outstanding voting power of our company, neither Total nor we
(nor any of Total’s or our affiliates, respectively) may, without first obtaining the approval of two-thirds of our
directors (including at least one Disinterested Director), effect any approval or adoption of our annual operating plan
or budget that has the effect of reducing the planned letter of credit utilization in any given year by more than 10%
below the applicable maximum letter of credit amount in the Credit Support Agreement.
Events Requiring Stockholder Approval by Total. Until the first time that Total, together with the controlled
subsidiaries of Total S.A., owns 50% or less of the outstanding voting power of our company or 40% or less of the
outstanding voting power of our company when at least $100 million in Guarantees are outstanding pursuant to the
Credit Support Agreement and, thereafter, for so long as (1) any loans by Total S.A. to us remain outstanding, (2)
any guarantees by Total S.A. of any of our indebtedness remain outstanding, or (3) any other continuing obligation
of Total S.A. to or for the benefit of us remain outstanding (‘‘Total Stockholder Approval Period’’), neither we
(including any of our controlled subsidiaries) nor the Board may effect any of the following without first obtaining
the approval of Total:
• any amendment to our Certificate of Incorporation or By-Laws;
• any transaction pursuant to which we or any company that we control acquires or otherwise obtains the
ownership or exclusive use of any business, property, or assets of a third party if as of the date of the
consummation of such transaction the aggregate net present value of the consideration paid or to be paid
exceeds the lower of (i) 15% of our then-consolidated total assets or (ii) 15% of our market capitalization;
• any transaction pursuant to which a third party obtains ownership or exclusive use of any of our business,
property, or assets or those of any company that we control if as of the date of the consummation of such
transaction the aggregate net present value of the consideration received or to be received exceeds the lower
of (i) 10% of our then-consolidated total assets or (ii) 10% of our market capitalization;
• the adoption of any stockholder rights plan;
• except for the incurrence of certain permitted indebtedness, the incurrence of additional indebtedness in
excess of the difference, if any, of 3.5 times our LTM EBITDA (as defined in the Affiliation Agreement)
less our Outstanding Gross Debt (as defined in the Affiliation Agreement);
• subject to certain exceptions, any voluntary dissolution or liquidation of our company or any company that
we control;
• any voluntary bankruptcy filing by us or any company that we control or the failure to oppose any other
person’s bankruptcy filing or action to appoint a receiver of our company or any company that we control;
or
• any repurchase of our common stock.
Certain Matters Related to SunPower’s Stockholder Rights Plan. Until the Total Group beneficially owns less
than 15% of the outstanding voting power of our company, neither we nor the Board is permitted to adopt any
stockholder rights plan without the approval of Total.
22

Covenants of Total and SunPower. In order to effect the transactions contemplated by the Affiliation Agreement,
each of Total and we have committed to taking certain actions. With respect to us, such actions include:
• amending our By-Laws to provide that the Total Group may call a special meeting of stockholders in
certain circumstances;
• taking certain actions to exculpate Total S.A., Total, any controlled subsidiary of Total S.A., and those of
our directors designated by Total from corporate opportunities, to the fullest extent permitted by applicable
law;
• taking certain actions to render Delaware’s business combination statute inapplicable to the Total Group
and certain future transferees of the Total Group; and
• providing Total with certain of our financial information from time to time.
Termination. The Affiliation Agreement generally terminates upon the earlier to occur of (i) Total, together with
the controlled subsidiaries of Total S.A., owning less than 10% of the outstanding voting power of our company or
(ii) Total, together with the controlled subsidiaries of Total S.A., owning 100% of the outstanding voting power of
our company.
By-Laws Amendment
On June 14, 2011, the Board approved amendments of our By-Laws as required under the Affiliation Agreement.
The amendments: (i) allow any member of the Total Group to call a meeting of stockholders for the sole purpose of
considering and voting on a proposal to effect a Total Merger or a Transferee Merger (as defined in the Affiliation
Agreement); (ii) provide that the number of directors of the Board shall be determined from time to time by resolution
adopted by the affirmative vote of a majority of our entire Board at any regular or special meeting; and (iii) require,
before the termination of the Affiliation Agreement, the approval of a majority of our independent directors to amend
our By-Laws so long as Total, together with the controlled subsidiaries of Total S.A., owns at least 30% of our voting
securities as well as require, before the termination of the Affiliation Agreement, Total’s written consent during the
Total Stockholder Approval Period to amend the By-Laws. In November 2011, our By-Laws were amended to
remove restrictions prohibiting stockholder consents in writing. On November 3, 2017, our By-Laws were amended
to provide that the designation of the office of president is not mandatory, in addition to effecting certain other minor
clarifying changes for purposes of administrative ease and alignment with our current organization.
The Affiliation Agreement and our By-Laws, and amendments thereto, as described above, are attached to, and
more fully described in, our Forms 8-K as filed with the SEC on May 2, 2011, June 7, 2011, June 15, 2011,
November 16, 2011, December 23, 2011, and November 7, 2017, our Form 10-Q as filed with the SEC on
November 2, 2012, and our Form 10-K as filed with the SEC on February 29, 2012.
Upfront Warrant
In February 2012, we issued a warrant (the ‘‘Upfront Warrant’’) to Total to purchase 9,531,677 shares of our
common stock at an exercise price of $7.8685 per share, subject to adjustment for customary anti-dilution and other
events. The Upfront Warrant, which was governed by a Private Placement Agreement, dated December 23, 2011, and
a Compensation and Funding Agreement, dated February 28, 2012, as amended, was exercisable at any time for seven
years after its issuance, provided that, so long as at least $25 million in aggregate of our convertible debt remained
outstanding, such exercise would not cause any ‘‘person,’’ including Total S.A., to, directly or indirectly, including
through one or more wholly owned subsidiaries, become the ‘‘beneficial owner’’ (as such terms are defined in
Rule 13d-3 and Rule 13d-5 under the Exchange Act) of more than 74.99% of the voting power of our common stock
at such time, a circumstance which would trigger the repurchase or conversion of our existing convertible debt. The
Upfront Warrant expired by its terms on February 27, 2019.
0.875% Debentures Due 2021
In June 2014, we issued $400 million in principal amount of our 0.875% senior convertible debentures due 2021
(the ‘‘0.875% debentures due 2021’’). An aggregate principal amount of $250 million of the 0.875% debentures due
2021 were acquired by Total. The 0.875% debentures due 2021 are convertible into shares of our common stock at
any time based on an initial conversion rate of 20.5071 shares of common stock per $1,000 principal amount of
0.875% senior convertible debentures due 2021 (which is equivalent to an initial conversion price equal to
23

approximately $48.76 per share, which provided Total the right to acquire up to 5,126,775 shares of our common
stock and now provides the right to acquire 3,969,375 shares of our common stock following the purchase noted
below). The applicable conversion rate may adjust in certain circumstances, including a fundamental change, as
described in the indenture governing the 0.875% debentures due 2021. In January and February 2020, we purchased
$33.9 million of this convertible debt in open market transactions and $56.4 million in transactions with Total.
4.00% Debentures Due 2023
In December 2015, we issued $425 million aggregate principal amount of our 4.00% senior convertible
debentures due 2023 (the ‘‘4.00% debentures due 2023’’). An aggregate principal amount of $100 million of the
4.00% debentures due 2023 were acquired by Total. The 4.00% debentures due 2023 are convertible into shares of
our common stock at any time based on an initial conversion rate of 32.7568 shares of common stock per $1,000
principal amount of the 4.00% debentures due 2023 (which is equivalent to an initial conversion price equal to
approximately $30.53 per share, which provides Total the right to acquire up to 3,275,680 shares of our common
stock). The applicable conversion rate may adjust in certain circumstances, including a fundamental change, as
described in the indenture governing the 4.00% debentures due 2023.
Joint Solar Projects with Total and Its Affiliates
We enter into various engineering, procurement and construction (‘‘EPC’’) and operations and maintenance
(‘‘O&M’’) agreements relating to solar projects, including EPC and O&M agreements relating to projects owned or
partially owned by Total and its affiliates. As of December 29, 2019, we had an insignificant amount of ‘‘Contract
assets’’ and $6.7 million of ‘‘Accounts receivable, net’’ and ‘‘Prepaid expenses and other current assets’’ on our
consolidated balance sheets related to projects in which Total and its affiliates had a direct or indirect material
interest.
During fiscal 2018, in connection with a co-development solar project in Japan among us, Total, and an
independent third party, we sold 25% of the ownership interests in the co-development solar project to Total for an
immaterial amount of proceeds. We sold the remaining 25% ownership interest to Total in the three months ended
September 29, 2019, for proceeds of $4.6 million. We have also agreed to supply solar panels under this arrangement,
with sales beginning in October 2019 and expected to continue through December 2020.
In connection with a co-development solar project in Chile between us and Total, we sold all of our
50% ownership interest in the co-development project to Total in fiscal 2019 for proceeds of $14.1 million.
We incurred charges of $10.2 million that will be paid directly to Total in fiscal 2020 in connection with its assistance
in obtaining a solar module supply related to this project.
Supply Agreements
In November 2016, we and Total entered into a four-year, up to 200-megawatt (‘‘MW’’) supply agreement to
support the solarization of certain Total facilities. This agreement covers the supply of 150 MW of E-Series
(Maxeon 2) panels with an option to purchase up to another 50 MW of P-Series solar panels. In March 2017,
we received a prepayment totaling $88.5 million. The prepayment is secured by some of our assets located in the
United States and in Mexico.
In March 2018, we and Total, each through certain affiliates, entered into an agreement whereby we agreed to
sell 3.42 MW of photovoltaic modules to Total for a development project in Chile. This agreement provided for
payment from Total in the amount of approximately $1.3 million, 10% of which was paid upon execution of the
agreement.
On January 7, 2019, we and Total, each through certain affiliates, entered into an agreement whereby we agreed
to sell 3.7 MW of photovoltaic (‘‘PV’’) modules to Total for a ground-mounted PV installation in Dubai. This
agreement provided for payment from Total in the amount of approximately $1.4 million, 10% of which was received
after execution of the agreement.
On March 4, 2019, we and Total, each through certain affiliates, entered into an agreement whereby we agreed
to sell 10 MW of photovoltaic modules to Total for commercial rooftop PV installations in Dubai. This agreement
provided for payment from Total in the amount of approximately $3.2 million, 10% of which was received in April
2019.
24

In December 2019, we and Total, each through certain affiliates, entered into an agreement whereby we agreed
to sell 93 MW of PV modules to Total for commercial PV modules in France. This agreement provided for payment
from Total in the amount of approximately $38.4 million, 10% of which was received in December 2019.
In December 2019, we entered into and closed a master membership interest purchase and project development
agreement with Total Strong, LLC, a joint venture between Total and Hannon Armstrong, to sell our membership
interests in certain project companies. Three project companies were sold to the joint venture on December 27, 2019.
We recognized revenue of $6.2 million for sales to this joint venture, which is included within ‘‘Solar power systems,
components, and other’’ on our consolidated statements of operations for fiscal 2019.
25

AUDIT COMMITTEE REPORT
The Audit Committee of the Board serves as the representative of the Board with respect to its oversight of:
• our accounting and financial reporting processes and the audit of our financial statements;
• the integrity of our financial statements;
• our internal controls;
• our compliance with legal and regulatory requirements and efficacy of and compliance with our corporatepolicies;
• the independent registered public accounting firm’s appointment, qualifications, and independence; and
• the performance of our internal audit function.
The Audit Committee also reviews the performance of our independent registered public accounting firm,Ernst & Young LLP, in the annual audit of financial statements and in assignments unrelated to the audit, reviews ourindependent registered public accounting firm’s fees, and pre-approves services to be provided by our independentregistered public accounting firm.
The Audit Committee provides the Board such information and materials as it may deem necessary to make theBoard aware of financial matters requiring the attention of the Board. The Audit Committee reviews our financialdisclosures and meets privately, outside the presence of our management, with our independent registered publicaccounting firm. In fulfilling its oversight responsibilities, the Audit Committee reviewed and discussed the auditedfinancial statements in our Annual Report on Form 10-K for our fiscal year ended December 29, 2019 withmanagement, including a discussion of the quality and substance of the accounting principles, the reasonableness ofsignificant judgments made in connection with the audited financial statements, and the clarity of disclosures in thefinancial statements. The Audit Committee reports on these meetings to the Board.
Our management has primary responsibility for preparing our financial statements and for our financialreporting process. In addition, our management is responsible for establishing and maintaining adequate internalcontrol over financial reporting. Our independent registered public accounting firm, Ernst & Young LLP, isresponsible for expressing an opinion on the conformity of our financial statements to generally accepted accountingprinciples and the effectiveness of our internal control over financial reporting.
The Audit Committee reports as follows:
(1) The Audit Committee has reviewed and discussed the audited financial statements for fiscal 2019 with ourmanagement.
(2) The Audit Committee has discussed with Ernst & Young LLP, our independent registered public accountingfirm, the matters required to be discussed by the Public Company Accounting Oversight Board and the SEC.
(3) The Audit Committee has received the written disclosures and the letter from Ernst & Young LLP requiredby the applicable requirements of the Public Company Accounting Oversight Board regarding theindependent accountant’s communications with the Audit Committee regarding independence, and hasdiscussed with Ernst & Young LLP its independence, including whether Ernst & Young LLP’s provisionof non-audit services to us is compatible with its independence.
The Audit Committee has adopted a policy that requires advance approval of all audit, audit-related, tax, andother services performed by the independent registered public accounting firm. The policy provides for pre-approvalby the Audit Committee (or its chair pursuant to delegated authority) of specifically defined audit and non-auditservices. Unless the specific service has been previously pre-approved with respect to that fiscal year, the AuditCommittee (or its chair pursuant to delegated authority) must approve the specific service before the independentregistered public accounting firm is engaged to perform such services for us.
Based on the review and discussion referred to in items (1) through (3) above, the Audit Committeerecommended to the Board, and the Board approved, the inclusion of our audited financial statements in our AnnualReport on Form 10-K for the fiscal year ended December 29, 2019, as filed with the SEC.
The foregoing report was submitted by the Audit Committee of the Board and shall not be deemed to be‘‘soliciting material’’ or to be ‘‘filed’’ with the SEC or subject to Regulation 14A promulgated by the SEC or Section18 of the Exchange Act, and shall not be deemed incorporated by reference into any prior or subsequent filing by usunder the Securities Act of 1933 or the Exchange Act.
AUDIT COMMITTEE OF THE BOARD OF DIRECTORS
Thomas McDaniel, ChairCatherine LesjakPatrick Wood III
26

DIRECTOR COMPENSATION
The following table sets forth a summary of the compensation we paid to our non-employee directors for fiscal
2019. The table does not include Mr. Werner, who did not receive separate compensation for his service on the Board.
2019 Director Compensation Table
Name
Fees Earned orPaid in Cash
($)(1)Stock Awards
($)(2)(3)Total
($)
Total-designated members of the Board — — —
Catherine Lesjak 100,000 300,015 400,015
Thomas McDaniel 100,000 300,015 400,015
Patrick Wood III 125,000 300,015 425,015
(1) The amounts reported in this column represent the aggregate cash retainers received by the non-employee directors for fiscal 2019, but donot include amounts reimbursed to the non-employee directors for expenses incurred in connection with attending Board and committeemeetings.
(2) The amounts reported in this column represent the aggregate grant date fair value computed in accordance with Financial AccountingStandards Board (‘‘FASB’’) Accounting Standards Codification (‘‘ASC’’) Topic 718 for restricted stock units granted to our non-employeedirectors in fiscal 2019, as further described below. Restricted stock units are fully vested on the date of grant. Each non-employee directorreceived the following grants of restricted stock units on the following dates with the following grant date fair values (please note that someamounts reported may not add up exactly due to rounding on an award-by-award basis):
Non-Employee Director Grant Date Restricted Stock Units (#)(a) Grant Date Fair Value ($)
Catherine Lesjak 02/11/2019 12,909 75,001
05/13/2019 9,411 75,006
08/12/2019 5,678 75,006
11/11/2019 8,855 75,002
Thomas McDaniel 02/11/2019 12,909 75,001
05/13/2019 9,411 75,006
08/12/2019 5,678 75,006
11/11/2019 8,855 75,002
Patrick Wood III 02/11/2019 12,909 75,001
05/13/2019 9,411 75,006
08/12/2019 5,678 75,006
11/11/2019 8,855 75,002
(a) Restricted stock units are fully vested on the date of grant.
(3) As of December 29, 2019, no other non-employee directors held stock awards and no non-employee directors held stock options.
2019 Director Compensation Program
Our outside director compensation policy provides for the compensation set forth below for our non-employee
directors, other than the Total-nominated directors:
• an annual fee of $400,000 ($100,000 quarterly) for our non-employee directors (other than the chairman
of the Board) for service on the Board and on Board committees;
• if our chairman is an independent director, an annual fee of $450,000 ($112,500 quarterly) to our chairman
of the Board for service on the Board and on Board committees; and
• an additional annual fee of $25,000 ($6,250 quarterly) to the lead independent director.
The Compensation Committee assessed the competitiveness of director compensation compared to the same
compensation peers used to assess named executive officer compensation.
As part of its assessment, the Compensation Committee also considered the relative workload and
responsibilities borne by the independent directors, which we believe are higher than many other public companies
for a number of reasons, including the fact that we have a controlling stockholder, that there are relatively fewer
27

independent directors on the Board, and that each of them serves on, or chairs, multiple committees. We review
director pay on an annual basis to monitor for changes in competitive pay levels and workload and responsibilities.
Our policy provides that these annual fees are prorated on a quarterly basis for any director that joins the Board
during the year. The $25,000 additional fee payable to the lead independent director is paid in cash. Any fees payable
to the chairman of the Board are paid in the form of restricted stock units. The other fees are paid on a quarterly basis,
25% in cash on or about the date of the quarterly Board meeting and 75% in the form of fully-vested restricted stock
units on the eleventh day in the second month of each quarter (or on the next trading day if such day is not a trading
day). Any fractional shares resulting from this calculation are rounded up to a full share. The restricted stock units
are settled in shares of our common stock within seven days of the date of grant. Because Mr. Werner is our chief
executive officer, he is not separately compensated for his service as chairman of the Board. Similarly, because each
of our Total-nominated directors do not qualify as independent directors under our director compensation policy, such
individuals receive no director compensation.
Stock Ownership Guidelines
We have stock ownership guidelines for our chief executive officer, certain executive officers, and non-
employee directors. Under the guidelines and subject to certain exceptions, non-employee directors are expected to
own shares of our common stock that have a value equal to five times the annual cash retainer they receive for serving
on the Board, with ownership measured at the end of each calendar year. Each non-employee director is expected to
maintain ownership at or above the threshold applicable to them beginning five years after first becoming subject to
the guidelines. Shares may be owned directly by the individual, owned by the individual’s spouse, or held in trust
for the benefit of the individual’s family. Although the non-employee directors were required to satisfy the stock
ownership guidelines beginning five years after their implementation in 2015, they each already own stock with a
value in excess of the guidelines as of the end of 2019.
28

PROPOSAL TWO
ADVISORY VOTE TO APPROVE NAMED EXECUTIVE OFFICER COMPENSATION
As required under the Dodd-Frank Wall Street Reform and Consumer Protection Act, or the Dodd-Frank Act,
and Section 14A of the Exchange Act, we are asking our stockholders to again vote to approve, on an advisory
(non-binding) basis, the compensation of our named executive officers as disclosed in this proxy statement in
accordance with the SEC’s rules.
As described in detail under the headings ‘‘Compensation Discussion and Analysis’’ and ‘‘Executive
Compensation,’’ we have adopted an executive compensation philosophy designed to deliver competitive total
compensation to our executive officers upon the achievement of financial and strategic performance objectives. In
order to implement that philosophy, the Compensation Committee has established a disciplined process for adopting
executive compensation programs and individual executive officer pay actions that includes the analysis of
competitive market data, a review of each executive officer’s role, performance assessments, and consultation with
the Compensation Committee’s independent compensation consultant. Please read the ‘‘Compensation Discussion
and Analysis’’ and ‘‘Executive Compensation’’ sections for additional details about our executive compensation
programs, including information about the fiscal 2019 compensation of our named executive officers.
At our 2019 annual meeting of stockholders, our stockholders voted to approve, on an advisory basis, the
compensation of our named executive officers, as disclosed in the proxy statement for that meeting. We refer to this
vote as our say-on-pay vote. Our Compensation Committee considered the results of the say-on-pay vote (which
received approximately 85% approval of the votes cast) at its meetings after the say-on-pay vote when it set annual
executive compensation. After our Compensation Committee reviewed the stockholders’ approval of the say-on-pay
vote in 2019, our Compensation Committee decided to maintain the general framework of our fiscal 2018
compensation policies and programs for our named executive officers in fiscal 2019, with certain modifications,
including simplification of the cash incentive structure to a semi-annual design to sharpen focus on strategic priorities
and maintain flexibility in order to adjust for significant changes that could occur during the year due to business
restructuring initiatives, the introduction of new performance metrics in cash incentives and equity awards focused
on achievement of strategic business restructuring and cash management objectives, as the Committee believed such
programs continued to be in the best interest of our stockholders.
2019 Compensation Features. Our compensation programs are intended to attract, retain and reward executive
officers who contribute to SunPower’s success and to align their pay outcomes with the Company’s short-term and
long-term performance. The Compensation Committee annually reviews the compensation programs for our named
executive officers to ensure they achieve the desired goals. In fiscal 2019, among the program features incorporated
by the Compensation Committee to implement the executive compensation philosophy stated above are the
following:
• Actual payouts under our performance-based cash bonus programs (specifically, the 2019 Executive
Semi-Annual Incentive Bonus Plan) for our named executive officers were determined based on
performance against a number of objectives: certain strategic business restructuring metrics, non-GAAP
revenue, and cash and cash equivalents metrics2 (or in the case of certain of our executive officers, business
unit revenue and adjusted cash flow metrics). In addition to the foregoing, corporate milestone performance
targets, a safety modifier based on company safety performance, and individual modifiers were assigned
based on performance in those areas.
• Long-term incentives in the form of time- and performance-based restricted stock units comprised a large
portion of each named executive officer’s compensation and are linked to the long-term performance of our
stock. Restricted stock units generally vest over four years, and performance-based restricted stock units
are earned only after the achievement of corporate performance targets and also generally vest over a
four-year period.
• Earning performance-based restricted stock units depends on the achievement of performance targets
corresponding to certain strategic business restructuring metrics, our non-GAAP revenue, and adjusted cash
and cash equivalents metrics.
• Individual performance was also measured for each half of the fiscal year based on each named executive
officer’s achievement of his or her personal key results, annual objectives, and adherence to company
2 Non-GAAP revenue is a non-GAAP financial measure. See Appendix A, “Use of Non-GAAP Financial Measures.”
29

values, which support our corporate, strategic, and operational milestones, as evaluated by our chief
executive officer (or, in the case of our chief executive officer, by the Board) in connection with the
assignment of an individual modifier to each named executive officer.
• Our change of control severance agreements do not entitle our named executive officers to payment without
termination of employment following a change of control (a ‘‘double trigger’’).
Our financial and operational performance was the key factor in the compensation decisions and outcomes for
fiscal 2019, as further described in the ‘‘Compensation Discussion and Analysis’’ and ‘‘Executive Compensation’’
sections. One of the core tenets of our executive compensation philosophy is our emphasis on performance-based pay.
As highlighted in the Compensation Components chart in the ‘‘Compensation Discussion and Analysis’’ section, in
fiscal 2019, a large portion of our named executive officers’ target compensation (82% for our chief executive officer
and averaging 78% for our other named executive officers) consisted of performance-based pay in the form of
semi-annual incentive bonus programs and long-term equity incentives.
The Compensation Committee believes that our executive compensation programs, executive officer pay levels,
and individual pay actions approved for our executive officers, including our named executive officers, are directly
aligned with our executive compensation philosophy and fully support its goals. The semi-annual performance targets
for the Corporate Executive Semi-Annual Bonus Program and SunPower Technologies Executive Semi-Annual
Bonus Program, set at the beginning of fiscal 2019 (and subsequently modified in the case of the business
restructuring targets), were assessed at the end of each half of the year. Based on our actual results in fiscal 2019,
results were calculated for each of the targets, as presented below in the aggregate (in millions of dollars).
2019 Corporate Executive Semi-Annual Bonus Program
First Half 2019 Performance Criterion Weight Minimum Target Maximum Achievement
Payment as %of TargetPayment
Sign binding term sheet with Track A or B withproceeds of at least: 50% $200 $ 300 $ 400
Term sheetsigned 35%
Revenue 25% $918 $1080 $1243 $893 0%
Adjusted Cash and Cash Equivalents 25% $100 $ 115 $ 175 $167 35.8%
Second Half 2019 Performance Criterion Weight Minimum Target Maximum Achievement
Payment as %of TargetPayment
Business Restructuring: Definitive agreementsigned by 25% 12/31/2019 10/31/2019 9/23/2019 11/8/2019 23.4%
Business Restructuring: Equity value in definitiveagreement of 25% >=$650 >=$725 >=$825 $735 26.3%
Revenue 20% $999 $1175 $1352 $1098 19.5%
Adjusted Cash & Cash Equivalents 30% $147 $162 $200 $250 37.5%
2019 SunPower Technologies Executive Semi-Annual Bonus Program
First Half 2019 Performance Criterion Weight Minimum Target Maximum Achievement
Payment as %of TargetPayment
Sign binding term sheet with Track A or B withproceeds of at least: 50% $200 $300 $400
Term sheetsigned 35%
SPT Revenue 20% $478 $563 $647 $531.9 16.3%
SPT Adjusted Cash Flow 30% ($141) ($126) ($ 96) ($114.6) 35.7%
Second Half 2019 Performance Criterion Weight Minimum Target Maximum Achievement
Payment as% of Target
Payment
Business Restructuring: Definitive agreementsigned by 25% 12/31/2019 10/31/2019 9/23/2019 11/8/2019 23.4%
Business Restructuring: Equity value in definitiveagreement of 25% >=$650 >=$725 >=$825 $735 26.3%
30

Second Half 2019 Performance Criterion Weight Minimum Target Maximum Achievement
Payment as% of Target
Payment
SPT Revenue 25% $493 $580 $667 $690 30%
SPT Adjusted Cash Flow 25% $41 $56 $86 $96.1 45%
The foregoing, combined, resulted in regular performance-based restricted stock awards granted to our named
executive officers being earned at 88.7% of the target level (excluding Jeffrey Waters, who did not receive a
performance-based restricted stock award grant in fiscal 2019, his year of hire), based on the average of first half and
second half attainment on the business restructuring revenue, and adjusted cash flow performance goals. Our
corporate performance in fiscal 2019 also resulted in aggregate cash bonus awards under our performance-based cash
bonus programs at approximately 71% of the target level.
We are asking our stockholders to indicate their support for our named executive officer compensation as
described in this proxy statement. This proposal, commonly known as a ‘‘say-on-pay’’ proposal, gives our
stockholders the opportunity to express their views on our named executive officers’ compensation. This vote is not
intended to address any specific compensation item, but rather the overall compensation of our named executive
officers and the philosophy, policies, and practices described in this proxy statement. Accordingly, the Board
recommends that our stockholders vote ‘‘FOR’’ the following resolution at the Annual Meeting:
‘‘RESOLVED, that, on an advisory basis, the compensation of SunPower’s named executive officers, as
disclosed pursuant to Item 402 of Regulation S-K, including the Compensation Discussion and Analysis,
compensation tables, and related narratives and descriptions in SunPower’s proxy statement for the Annual
Meeting, is hereby APPROVED.’’
Vote Required
The non-binding advisory vote on named executive officer compensation requires the affirmative vote of the
holders of a majority of our stock having voting power and in attendance or represented by proxy at the Annual
Meeting. ‘‘Broker non-votes’’ have no effect and will not be counted towards the vote total for this proposal.
Abstentions will have the effect of votes against this proposal.
Although the say-on-pay vote is advisory, and therefore not binding on us, the Compensation Committee, or the
Board, the Board and our Compensation Committee value the opinions of our stockholders. To the extent there is any
significant vote against our named executive officers’ compensation as disclosed in this proxy statement, we expect
to consider our stockholders’ concerns and the Compensation Committee expects to evaluate whether any actions are
necessary to address those concerns.
THE BOARD RECOMMENDS A VOTE ‘‘FOR’’ THE APPROVAL OF THE COMPENSATION OF
OUR NAMED EXECUTIVE OFFICERS, AS DISCLOSED IN THIS PROXY STATEMENT PURSUANT TO
THE COMPENSATION DISCLOSURE RULES OF THE SEC, ON A NON-BINDING, ADVISORY BASIS.
31

EXECUTIVE OFFICERS
Biographical information for our executive officers, other than Mr. Werner, is listed below. Biographical
information for Mr. Werner, who is both a director and an executive officer of the Company, can be found in the
section entitled ‘‘Proposal One—Re-Election of Class III Directors.’’
Name Age Position
Thomas Werner 59 President, Chief Executive Officer, and Chairman of the Board
Manavendra Sial 43 Executive Vice President and Chief Financial Officer
Kenneth Mahaffey
51
Executive Vice President, General Counsel, Chief Ethics and Compliance
Officer, and Corporate Secretary
Douglas Richards 61 Executive Vice President, Administration
Jeffrey Waters 55 Chief Executive Officer, SunPower Technologies
Manavendra Sial has served as our executive vice president and chief financial officer since May 2018, leading
the Company’s treasury, project finance, investor relations, financial planning, and accounting organizations.
Previously, he served as the chief financial officer for VECTRA, a $1 billion technology-driven diversified industry
business, which was a portfolio company of certain funds managed by affiliates of Apollo Global Management, LLC.
Prior to VECTRA, Mr. Sial was with SunEdison in various global finance and operations leadership roles from 2011
to 2015, including chief financial officer of MEMC’s solar energy and materials divisions. He also spent 11 years
with General Electric (GE) in a variety of roles, from FP&A leader for the Energy Services unit to chief financial
officer of power delivery for GE’s Transmission and Distribution group. He earned his master’s degree in business
administration from Duke University’s Fuqua School of Business and his Bachelor of Commerce from Delhi
University in India.
Kenneth Mahaffey is our executive vice president, general counsel, chief ethics and compliance officer, and
corporate secretary, with responsibility for our global legal organization. Mr. Mahaffey joined our company in 2006
as a founding member of our legal department. During his tenure, Mr. Mahaffey has managed attorneys and
professionals around the globe who handle all legal, contract, regulatory, and compliance matters in support of our
business segments. He has also provided lead support for our corporate functions, including finance, mergers and
acquisitions, marketing, policy, and communication. Mr. Mahaffey has deep expertise in renewable energy law,
finance, corporate governance, and compliance matters. Before joining SunPower, he worked as an attorney in private
practice managing a variety of commercial and litigation matters. Mr. Mahaffey has a Bachelor of Arts degree from
University of California, San Diego, and a Juris Doctor degree from McGeorge School of Law, University of the
Pacific.
Douglas Richards has served as our executive vice president, administration, since November 2011. From
April 2010 to October 2011, Mr. Richards served as our executive vice president, human resources and corporate
services. From September 2007 to March 2010, Mr. Richards served as our vice president, human resources and
corporate services. From 2006 to 2007, Mr. Richards was vice president of human resources and administration for
SelectBuild, a construction services company and a wholly owned subsidiary of BMHC, and from 2000 to 2006,
Mr. Richards was senior vice president of human resources and administration for BlueArc, a provider of
high-performance unified network storage systems to enterprise markets. Before BlueArc, Mr. Richards spent
10 years at Compaq Computer Corporation and five years at Apple Computer, Inc. in various management positions.
Mr. Richards graduated from California State University, Chico, with a Bachelor of Arts degree in public
administration.
Jeffrey Waters leads the SunPower Technologies business unit, which includes our global manufacturing,
research and development, and SunPower Solutions group. An experienced global business, operations and sales
leader, he joined our company in January 2019 from Isola, where he worked from Silicon Valley as the company’s
president and chief executive officer. Prior to Isola, Mr. Waters was senior vice president and general manager of
Altera Corporation and also held a variety of executive positions with Texas Instruments/National Semiconductor in
both the U.S. and Japan for 18 years, including in global sales. Mr. Waters holds a bachelor’s degree in engineering
from the University of Notre Dame, a master’s degree in engineering from Santa Clara University, and a master’s
degree in business administration from Northwestern University.
32

COMPENSATION DISCUSSION AND ANALYSIS
This Compensation Discussion and Analysis provides a detailed review and analysis of our compensation
policies and programs that applied to our named executive officers during the fiscal year ended December 29, 2019.
Our named executive officers, as set forth in the following table, were our president and chief executive officer, our
chief financial officer, and the next three most highly compensated executive officers serving as of December 29,
2019.
Name Title
Thomas Werner President and Chief Executive Officer
Manavendra Sial Executive Vice President and Chief Financial Officer
Kenneth Mahaffey Executive Vice President, General Counsel, Chief Ethics and
Compliance Officer, and Corporate Secretary
Douglas Richards Executive Vice President, Administration
Jeffrey Waters(1) Chief Executive Officer, SunPower Technologies
(1) Mr. Waters was hired as chief executive officer of the SunPower Technologies business unit of the Company on January 8, 2019.
Executive Summary
Our compensation programs are intended to align our named executive officers’ interests with those of our
stockholders by rewarding performance that meets or exceeds the goals that the Compensation Committee
establishes, with the ultimate objective of increasing stockholder value. We have adopted an executive compensation
philosophy designed to deliver competitive total compensation upon the achievement of financial and strategic
performance objectives. The total compensation received by our named executive officers varies based on corporate
and individual performance, as measured against performance goals. Therefore, a significant portion of each named
executive officer’s total pay is tied to Company performance (see the ‘‘2019 Compensation Components’’ chart
below).
In fiscal 2019, we achieved $1.992 billion in non-GAAP revenue and ended the year with $251 million in
adjusted cash and cash equivalents3, exceeding our minimum performance level for revenue and exceeding our
maximum performance level for adjusted cash and cash equivalents.
For fiscal 2019, our financial performance and performance against other strategic initiatives were the key
factors in the compensation decisions and outcomes for the year, consistent with our commitment to pay for
performance. Highlights of our named executive officer compensation program in 2019 were as follows:
• Commitment to pay for performance. A significant majority of our named executive officers’ target
compensation (82% for our chief executive officer and an average of 78% for our other named executive
officers) consisted of semi-annual and annual bonus programs and long-term equity incentives.
• Cash bonus payouts below target. Our annual bonus program incorporated financial metrics that we
believe align our compensation practices with our business goals and, correspondingly, align executives’
interests with stockholders’ interests. Achievement of performance targets related to our revenue and cash
and cash equivalents (and, in the case of certain of our executive officers, business unit revenue and
adjusted cash flow), together with achievement of our business restructuring objectives, corporate
milestone performance targets, safety performance, and individual modifiers assigned based on individual
performance, determined the actual payouts under our performance-based cash bonus programs
(specifically, the Amended and Restated Executive Semi-Annual Incentive Bonus Plan, which we refer to
as our Executive Semi-Annual Plan) for our named executive officers. Our corporate performance in fiscal
2019 resulted in aggregate cash bonus awards under these programs at approximately 68.7%. Performance
metrics, thresholds, and targets are further described below in ‘‘Executive Compensation—Non-Equity
Incentive Plan Compensation.’’
3 To supplement its consolidated financial results presented in accordance with U.S. generally accepted accounting principles (GAAP), theCompany uses non-GAAP measures that are adjusted for certain items from the most directly comparable GAAP measures, as described inAppendix A, “Use of Non-GAAP Financial Measures.”
33

• Performance-based restricted stock units achieved below target. Performance-based restricted stock
units granted in 2019 to each of our named executive officers other than Mr. Waters were only earned if
we achieved performance targets for our semi-annual revenue, cash and cash equivalent metrics, and for
certain strategic business restructuring performance goals. Performance with respect to the revenue target,
cash and cash equivalents target, and business restructuring target exceeded the minimum performance
levels but fell short of the target performance levels, which resulted in 88.7% of these equity awards being
earned. Performance metrics, thresholds, and targets are further described below in ‘‘Executive
Compensation—Equity Incentive Plan Compensation.’’
At our 2019 annual meeting of stockholders, our stockholders voted to approve, on an advisory basis, the
compensation of our named executive officers, as disclosed in the proxy statement for that meeting. We refer to this
vote as our say-on-pay vote. Our Compensation Committee considered the results of the say-on-pay vote (which
received approximately 85% approval of the votes cast) at its meetings after the say-on-pay vote when it set annual
executive compensation. After our Compensation Committee reviewed the stockholders’ approval of the say-on-pay
vote in 2019, our Compensation Committee decided to maintain the general framework of our fiscal 2018
compensation policies and programs for our named executive officers in fiscal 2019, with certain modifications,
including the introduction of new performance metrics in equity awards focused on achievement of strategic business
restructuring and cash management objectives, as the Committee believed such programs continued to be in the best
interest of our stockholders.
The following discussion should be read together with the information we present in the compensation tables,
the footnotes and narratives to those tables, and the related disclosure appearing in ‘‘Executive Compensation’’ below.
General Philosophy and Objectives
In fiscal 2019, we continued to operate a compensation program designed primarily to reward our named
executive officers based on our financial performance and the achievement of corporate objectives consistent with
increasing long-term stockholder value. Our 2019 executive compensation program was based on the following
primary objectives:
• to attract, retain, and reward executive officers who contribute to our success; and
• to align compensation programs with our short- and long-term performance.
In order to implement our philosophy, the Compensation Committee has a disciplined process for adopting
executive compensation programs and individual executive officer pay actions that includes the analysis of
competitive market data, a review of each executive officer’s role, performance assessments, and consultation with
the Compensation Committee’s independent compensation consultant, as described below.
We believe the mix of base salary, performance-based cash awards, and time-based and performance-based
equity awards provides proper incentives without encouraging excessive risk-taking and that the risks arising from
our compensation policies and practices for our employees are not reasonably likely to have a material adverse effect
on our company.
Compensation Setting Process
The Compensation Committee is responsible for managing the compensation of our executive officers, including
our named executive officers, in a manner consistent with our compensation philosophy. In accordance with the
‘‘controlled company’’ exception under the applicable listing standards of The Nasdaq Stock Market, our
Compensation Committee is composed of two independent directors and two directors designated by our controlling
stockholder, Total. We also have a Section 16 Subcommittee of the Compensation Committee consisting solely of
independent directors available to approve certain compensation matters in accordance with Rule 16b-3 of the
Exchange Act.
The Compensation Committee establishes our compensation philosophy and objectives and annually reviews
and, as necessary and appropriate, adjusts each named executive officer’s compensation. The Compensation
Committee offered our named executive officers total target compensation opportunities ranging from the
25th percentile to the 50th percentile of our peer group of companies (as further described below) during fiscal 2019.
34

In general, the Compensation Committee’s philosophy is to set total target compensation between the 50th percentile
and 75th percentile of our peer group. Individual named executive officer compensation may be above or below this
range based on experience, scope of position, individual performance, and total direct compensation (TDC) target
relative to the competitive market analysis.
When determining appropriate compensation for the named executive officers, the Compensation Committee
considered the advice of an independent compensation consultant, recommendations from management and internal
compensation specialists, practices of companies within our peer group, our performance, our business plan, and
individual performance. As part of this process, the compensation consultant prepared a competitive analysis of our
compensation program, and management presented its recommendations regarding base salary, time- and
performance-based equity awards, and performance targets under our Semi-Annual Bonus Plan to the Compensation
Committee for its review and consideration. The Compensation Committee accepts, rejects, or accepts as modified,
management’s various recommendations regarding compensation for the named executive officers other than our
chief executive officer. The Compensation Committee also approves, after modification, management’s
recommendations on various performance targets and milestones. The Compensation Committee met without our
chief executive officer when reviewing and establishing his compensation.
In addition, we hired Mr. Waters as the new chief executive officer of our SunPower Technologies business unit
in January 2019. In consultation with the Compensation Committee, management considered peer company
comparisons, internal pay equity, and Mr. Waters’s experience when determining his base salary, target bonus, new
hire equity grant, and other new hire bonuses, which are further described below in ‘‘Perquisites and Other
Compensation.’’
Compensation Consultant
In fiscal 2019, the Compensation Committee directly engaged and retained Semler Brossy, a compensation
consulting firm, as its compensation consultant. The Compensation Committee selected Semler Brossy based on its
experience and familiarity with the technology industry after initially soliciting and reviewing proposals from a
number of firms in 2018, when it first engaged Semler Brossy.
In fiscal 2019, Semler Brossy advised the Compensation Committee in connection with evaluating our compensation
practices, developing and implementing our executive compensation program and philosophy, establishing total
compensation targets, setting specific compensation components to reach the determined total compensation targets for
fiscal 2020, and reviewing and providing input on director pay. Semler Brossy did not provide any services to us other than
advising the Compensation Committee and management, at the direction of the Compensation Committee, on executive
compensation and director pay issues. The Compensation Committee has considered and assessed all relevant factors,
including, but not limited to, those set forth in Rule 10C-1(b)(4)(i) through (vi) under the Exchange Act, that could give
rise to a potential conflict of interest with respect to the compensation consultants described above. Based on this review,
the Compensation Committee determined that no material conflict of interest has been raised by the work performed by
Semler Brossy.
Peer Group
In fiscal 2018, the Compensation Committee directly engaged and retained Semler Brossy to review a list of our
peer group of companies. The Compensation Committee established the peer group that would be used in connection
with fiscal 2019 compensation decisions consistent with the Compensation Committee’s belief that the peer group
should be based on companies that design and manufacture products with similar complexity, companies more likely
to have robust sales channels including direct to consumers, companies offering end-to-end solutions to customers,
and technology-driven companies. The final peer group was selected using a mix of the following factors:
• Publicly traded semiconductor, clean technology, and broader high-technology industry companies; and
• Companies with between one-third and three times of each of our annual revenues, market value, and
employee headcount.
35

The Compensation Committee believes the characteristics of our fiscal 2019 peer group mirror those of our core
business as closely as possible. The companies included in our peer group for purposes of establishing fiscal 2019
compensation are listed below:
• Marvell Technology Group Ltd. • AVX Corporation
• Mueller Water Products • Belden Inc.
• Canadian Solar EnerSys • Plexus SunRun
• First Solar, Inc. • Tetra Tech
• FLIR Systems, Inc. • TransAlta
• Generac Holdings • Tutor Perini
• Itron, Inc. • Viavi Solutions
Market and Peer Group Data
In making its compensation decisions for our named executive officers for fiscal 2019, the Compensation
Committee considered an analysis performed by Semler Brossy that compared the total compensation of each named
executive officer to the compensation of individuals in comparative positions at companies in the peer group, based
on information from public filings, supplemented by industry and company size appropriate data from the Radford
Global Technology Survey. In general, the Compensation Committee evaluates base salaries relative to the 50th
percentile of the peer group and both performance-based cash bonus awards and long-term time- and performance-
based equity awards generally between the 50th percentile and 75th percentile of the peer group.
In establishing incentive opportunities, the Compensation Committee focused on corporate performance such
that if our corporate performance was achieved at target levels, the Compensation Committee expected that our
named executive officers’ total pay would be between the 50th and 75th percentile of the peer group. The
Compensation Committee viewed comparisons to peer group and market data as just one input into its discussion
regarding our named executive officers’ pay opportunities for fiscal 2019, and looked to individual performance, the
named executive officer’s experience in the executive role, and the executive’s scope of responsibility being narrower
or broader than that of comparable positions at our peer group companies to establish final pay opportunities either
above or below the initial market data comparisons.
In fiscal 2019, target cash compensation (base salary plus target bonus opportunity) was set between the
50th percentile and 75th percentile for each named executive officer except for Mr. Mahaffey. Mr. Mahaffey’s target
cash compensation was set at less than the 25th percentile to maintain his target total direct compensation (base salary
plus target bonus opportunity plus annual target equity awards) between the 50th and 75th percentile.
36

2019 Compensation Components
For fiscal 2019, the Compensation Committee allocated total compensation among various pay elements
consisting of base salary, performance-based cash bonus awards, time-based equity awards, performance-based
equity awards, and perquisites and other compensation. The table below provides an overview of each element of
compensation and is followed by a further discussion and analysis of the specific decisions that we made for each
element for fiscal 2019:
CompensationComponent Objective and Basis Form Practice
Base salary Fixed compensation that is setat a competitive level for eachposition to reward demonstratedexperience and skills.
Cash Base salaries are generally established around the50th percentile of competitive market data, withconsideration for experience and scope of rolerelative to comparable positions in one peergroup.
Performance-basedcash bonus awards
Semi-annual incentives thatdrive our performance and alignexecutives’ interests withstockholders’ interests.
Cash Target incentives are set as a percentage of basesalary and are set between the 50th percentile andthe 75th percentile. Actual payment is calculatedbased on achievement of corporate and individualgoals.
Time-based equityawards
Long-term incentive that alignsexecutives’ interests withstockholders’ interests and helpsretain executives through long-term vesting periods.
Restrictedstock units
Target equity awards (time-based plusperformance-based) are generally set between the50th percentile and the 75th percentile.
Performance-basedequity awards
Long-term incentive thatfocuses and rewards ourperformance and alignsexecutives’ interests withstockholders’ interests and helpsretain executives through long-term vesting periods.
Performance-basedrestrictedstock units
Target equity awards (time-based plusperformance-based) are generally set between the50th percentile and the 75th percentile. Actualpayment is calculated based on achievement ofcorporate goals.
Perquisites andother compensation
Offered to attract and retaintalent and to maintaincompetitive compensationpackages.
Various We generally do not provide any specialperquisites to our named executive officers.Newly hired executive officers may receiverelocation assistance, one-time signing bonuses,or other similar payments to attract them to joinour company. Named executive officers areeligible for certain severance benefits pursuant totheir employment agreements and our 2019Management Career Transition Plan. Namedexecutive officers are eligible to participate inhealth and welfare benefits and 401(k) matchingavailable to all employees.
The relative proportion of each element for fiscal 2019, as set forth below, was based generally on the
Compensation Committee’s comparison of compensation that we offered our named executive officers against
compensation offered by peer group companies to their named executive officers, the tax and accounting
consequences of certain types of equity compensation, and a desire to allocate a higher proportion of total
compensation to performance-based and equity incentive awards.
37

2019 Compensation Components
* Other Named Executive Officers excludes Jeffrey Waters, who was hired in January 2019.
Analysis of Fiscal 2019 Compensation Decisions
Base Salary. For fiscal 2019, the Compensation Committee chose to adjust the base salaries of Mr. Sial,
Mr. Mahaffey, and Mr. Richards, after taking into account market data, executive officer performance and experience
in their role, and the executive’s scope of responsibility in comparison to comparable positions at our peer group
companies.
The table below sets forth the salaries in effect in fiscal 2019 compared with the salaries in effect in fiscal 2018
for each of our named executive officers:
Name 2018 Base Salary ($)(1) 2019 Base Salary ($)(2)
Thomas Werner 600,000 600,000
Manavendra Sial 425,000 435,000
Kenneth Mahaffey 325,000 335,000
Douglas Richards 370,000 380,000
Jeffrey Waters(3) — 600,000
(1) These amounts represent 2018 base salaries after April 1, 2018.
(2) These amounts represent 2019 base salaries after April 1, 2019.
(3) Mr. Waters joined the Company as the chief executive officer of our SunPower Technologies business unit on January 8, 2019.
Performance-Based Cash Bonus Awards. In fiscal 2019, we redesigned our performance-based cash bonus
program. We maintained one umbrella performance-based cash bonus program, our Executive Semi-Annual
Incentive Bonus Plan (referred to as our Semi-Annual Bonus Plan), during fiscal 2019 in order to link bonus
payments to semi-annual corporate financial goals, operational objectives, and individual performance. Under the
Semi-Annual Bonus Plan, we adopted two programs: (i) the 2019 Corporate Executive Semi-Annual Bonus Program
and (ii) the 2019 SunPower Technologies Executive Semi-Annual Bonus Program. All of our named executive
officers, with the exception of Mr. Waters, participated in the 2019 Corporate Semi-Annual Bonus Program, and
Mr. Waters was our only named executive officer to participate in the 2019 SunPower Technologies Executive
Semi-Annual Bonus Program. Both programs are discussed in more detail below.
The supplemental table below entitled ‘‘Estimated Possible Payouts Under Semi-Annual Bonus Plan’’ sets forth
each named executive officer’s target and maximum payout opportunities under the Semi-Annual Bonus Plan. Under
the terms of each bonus program, failure to achieve certain corporate or individual metrics could have resulted in zero
payouts to an individual for a given period. The column entitled ‘‘2019 Total Non-Equity Incentive Plan
Compensation’’ in our 2019 Summary Compensation Table below and the footnotes thereto detail the actual payouts
awarded under this bonus plan to each named executive officer for fiscal 2019.
38

Estimated Possible Payouts Under Semi-Annual Bonus Plan
Name
2019 Semi-Annual Bonus PlanTarget (Aggregate)
($)(2)
2019 Semi-Annual Bonus PlanMaximum (Aggregate)
($)
Thomas Werner 1,200,000 2,475,000
Manavendra Sial 391,500 807,469
Kenneth Mahaffey 251,250 518,203
Douglas Richards 304,000 627,000
Jeffrey Waters(1) 750,000 1,546,875
(1) Mr. Waters joined the Company as the chief executive officer of our SunPower Technologies business unit on January 8, 2019. Target andMaximum possible payout are shown at an annualized rate. Actual payouts determined based on date of hire.
(2) Because we generally set base salaries for our executive officers at the 50th percentile of the market of salaries for executive officers insimilar positions and with similar responsibilities at comparable companies, we rely on performance-based cash bonus awards to elevatetarget total cash compensation to between the 50th percentile and the 75th percentile.
For fiscal 2019, the Compensation Committee maintained target payout levels under these programs at the same
percentage of annual salary for each of our named executive officers, after it evaluated the market data, individual
performance, and the scope of the named executive officer roles.
Name
2018 TotalTarget Payout
(including Annual andSemi-Annual Programs) as
Percentage ofAnnual Salary(2)
2019 TotalTarget Payout
(Semi-Annual Programs) asPercentage ofAnnual Salary
Thomas Werner 200% 200%
Manavendra Sial 90% 90%
Kenneth Mahaffey 75% 75%
Douglas Richards 80% 80%
Jeffrey Waters(1) — 125%
(1) Mr. Waters joined the Company as the chief executive officer of our SunPower Technologies business unit on January 8, 2019. Actualpayouts were determined based on date of hire.
(2) Actual bonus payments for each named executive officer under the Semi-Annual Bonus Plan are formula-driven, and the formulas are usedto calculate actual bonus payments. See ‘‘Executive Compensation—Non-Equity Incentive Plan Compensation’’ below for more informationabout these formulas.
In fiscal 2019, we used the semi-annual revenue and cash and cash equivalents metrics, and introduced business
restructuring metrics, which we believe to be reflective of the results of our operations. We continued the use of a
safety modifier for each half of the year, based on our annual Total Recordable Injury Rate (‘‘TRIR’’). TRIR is a
measurement of the total number of fatalities, permanent disability cases, occupational lost-time accidents, restricted
work cases, and medical treatments divided by the number of worked hours, and then multiplied by 1 million. Total
payout factor under the Semi-Annual Bonus Plan was subject to modification, capped at +10% or –10%, based on
achievement with respect to our TRIR target in each half of the year. In making the change to a semi-annual bonus
design, we considered Semler Brossy’s assessment of our 2018 incentive structure as being fairly complex and our
desire to sharpen focus on strategic priorities and maintain flexibility in the bonus program in order to adjust based
on significant changes that could occur during fiscal 2019 with business restructuring initiatives.
Each of our named executive officers other than Mr. Waters participated in our 2019 Corporate Semi-Annual
Bonus Program, which required the achievement of corporate targets established in respect of our: business
restructuring (50% of the payout), semi-annual revenue metric (25% of payout), and semi-annual cash and cash
equivalents metric (25% of payout), as adjusted by a safety modifier and a corporate key results modifier.
39
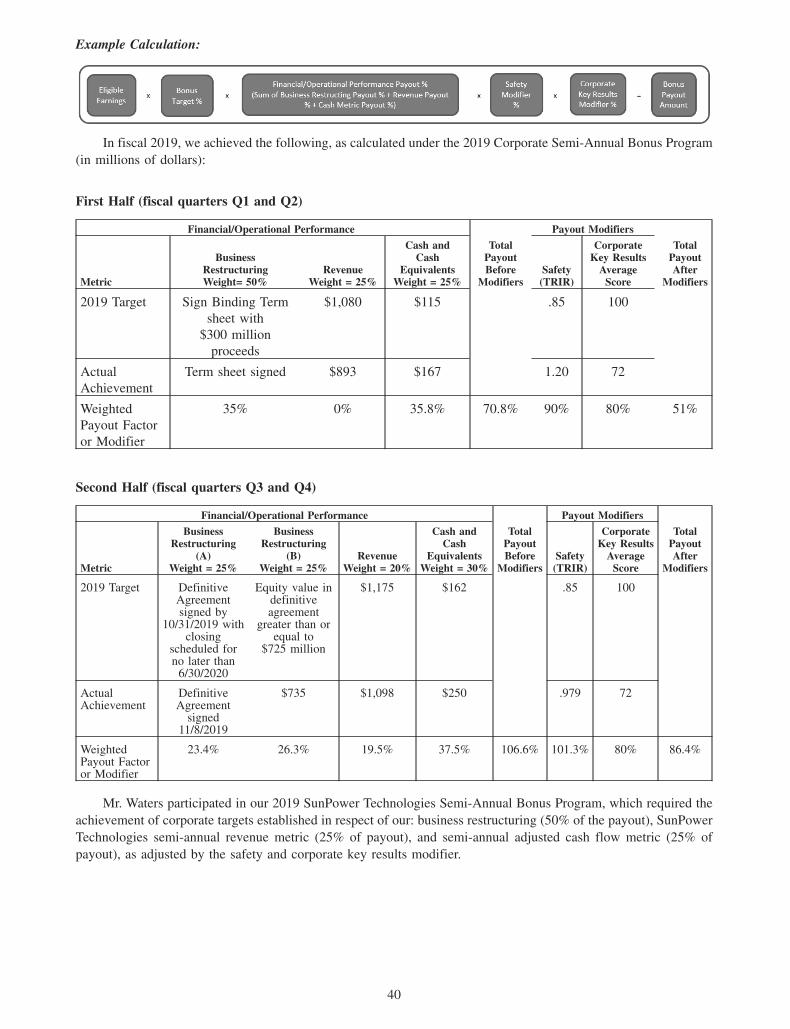
Example Calculation:
In fiscal 2019, we achieved the following, as calculated under the 2019 Corporate Semi-Annual Bonus Program(in millions of dollars):
First Half (fiscal quarters Q1 and Q2)
Financial/Operational Performance
TotalPayoutBefore
Modifiers
Payout Modifiers
TotalPayoutAfter
ModifiersMetric
BusinessRestructuringWeight= 50%
RevenueWeight = 25%
Cash andCash
EquivalentsWeight = 25%
Safety(TRIR)
CorporateKey Results
AverageScore
2019 Target Sign Binding Termsheet with
$300 millionproceeds
$1,080 $115 .85 100
ActualAchievement
Term sheet signed $893 $167 1.20 72
WeightedPayout Factoror Modifier
35% 0% 35.8% 70.8% 90% 80% 51%
Second Half (fiscal quarters Q3 and Q4)
Financial/Operational Performance
TotalPayoutBefore
Modifiers
Payout Modifiers
TotalPayoutAfter
ModifiersMetric
BusinessRestructuring
(A)Weight = 25%
BusinessRestructuring
(B)Weight = 25%
RevenueWeight = 20%
Cash andCash
EquivalentsWeight = 30%
Safety(TRIR)
CorporateKey Results
AverageScore
2019 Target DefinitiveAgreementsigned by
10/31/2019 withclosing
scheduled forno later than
6/30/2020
Equity value indefinitiveagreement
greater than orequal to
$725 million
$1,175 $162 .85 100
ActualAchievement
DefinitiveAgreement
signed11/8/2019
$735 $1,098 $250 .979 72
WeightedPayout Factoror Modifier
23.4% 26.3% 19.5% 37.5% 106.6% 101.3% 80% 86.4%
Mr. Waters participated in our 2019 SunPower Technologies Semi-Annual Bonus Program, which required theachievement of corporate targets established in respect of our: business restructuring (50% of the payout), SunPowerTechnologies semi-annual revenue metric (25% of payout), and semi-annual adjusted cash flow metric (25% ofpayout), as adjusted by the safety and corporate key results modifier.
40

In fiscal 2019, we achieved the following, as calculated under the 2019 SunPower Technologies Semi-Annual
Bonus Program (in millions of dollars):
First Half (fiscal quarters Q1 and Q2)
Financial/Operational Performance
TotalPayoutBefore
Modifiers
Payout Modifiers
TotalPayoutAfter
ModifiersMetric
BusinessRestructuringWeight = 50%
SPTRevenue
Weight = 20%
SPT AdjustedCash Flow
Weight = 30%Safety(TRIR)
CorporateKey Results
AverageScore
Target Sign Binding Term
sheet with
$300 million
proceeds
$563 ($126) .85 100
Actual
Achievement
Term sheet signed $532 ($114.6) 1.20 72
Weighted
Payout Factor
or Modifier
35% 16.3% 35.7% 87.0% 90% 80% 62.6%
Second Half (fiscal quarters Q3 and Q4)
Financial/Operational Performance
TotalPayoutBefore
Modifiers
Payout Modifiers
TotalPayoutAfter
ModifiersMetric
BusinessRestructuring-1Weight = 25%
BusinessRestructuring-2Weight = 25%
SPTRevenue
Weight = 20%
SPTAdjusted
CashFlow
Weight = 30%Safety(TRIR)
CorporateKey
ResultsAverage
Score
Target Definitive
Agreement
signed by
10/31/2019
with closing
scheduled for
no later than
6/30/2020
Equity value
in definitive
agreement
greater than or
equal to
$725 million
$580 $ 56 .85 100
Actual
Achievement
Definitive
Agreement
signed
11/8/2019
Equity value
of
$735 million
$690 $96.1 .979 72
Weighted
Payout Factor
or Modifier
23.4% 26.3% 30% 45% 124.6% 101.3% 80% 101%
Earned bonus amounts are reflected under ‘‘2019 Total Non-Equity Incentive Plan Compensation’’ in the 2019
Summary Compensation Table below.
Payments to our named executive officers under our Semi-Annual Bonus Plan required the achievement of
corporate targets set in respect of our quarterly corporate key results, as modified by an individual modifier assigned
by the chief executive officer (or, in the case of our chief executive officer, by the Board) based on his or her
individual performance. Such individual modifiers are expressed as a percentage, capped at 125%, and are combined
with a corporate milestones factor based on the level of achievement of our corporate targets, to calculate bonus
payments under the plan.
We incorporate a ‘‘management by objective’’ system throughout our organization to establish performance
goals that supplement our financial goals. Management establishes five-year corporate key results, and then derives
from them annual and quarterly corporate key results, which we refer to as corporate milestones. Each corporate
41

milestone is reviewed, revised, and approved by the Board, and subsequently the scores are reviewed and approved
by our Compensation Committee. In addition, each named executive officer, other than our chief executive officer,
establishes quarterly personal goals, which we refer to as key results, which are approved by the chief executive
officer and are intended to be aligned with each quarter’s corporate milestones. Quarterly corporate milestones in
fiscal 2019 included sensitive business objectives applicable to our entire company, focusing on strategic
transactions, revenue and margin targets, confidential cost and production targets, technology milestones, bookings
targets, major customer transactions, new product development, and manufacturing plans and enhancements. For
fiscal 2019, personal key results objectives included confidential revenue and margin targets, product development,
and achieving booking targets, among other operational goals. The Board determined the chief executive officer’s key
results, which consisted solely of the quarterly corporate milestones selected after discussion with the chief executive
officer. These corporate milestones and individual key results are typically challenging in nature and designed to be
stretch goals and encourage the individual to achieve success in his or her position during the performance period.
At the end of the year, the Compensation Committee determines the chief executive officer’s individual modifier, and
the chief executive officer determines the individual modifier for each other named executive officer, based on
achievement of their respective individual key results.
In fiscal 2019, we achieved an average score of 72 on corporate milestones, and the average individual modifier
assigned to our named executive officers was 95%. The maximum individual modifier was 105% and the minimum
individual modifier was 85%. Factors considered in determining individual modifiers include performance against
corporate, individual key results and annual objectives, and adherence to Company values.
Equity Awards. Our Compensation Committee believes that long-term Company performance is best achieved
by an ownership culture that encourages long-term performance by our executive officers through the use of
equity-based awards. Our SunPower Corporation 2015 Omnibus Incentive Plan, or 2015 Equity Plan, permits the
grant of stock options, stock appreciation rights, restricted shares, restricted stock units, performance shares, and
other stock-based awards. Consistent with our goal to attract, retain, and reward executive officers who contribute
to our long-term success in fiscal 2019, our long-term equity awards ranged from the 50th percentile to the
75th percentile of our peer group, other than for Mr. Werner and Mr. Sial whose grants were below the 25th percentile.
The Compensation Committee considered the long-term equity awards made to our chief executive officer and chief
financial officer in 2018, and in fiscal 2019 set Mr. Werner’s and Mr. Sial’s target long-term equity awards below the
25th percentile due to the shorter vesting term, which was less than two years in the case of Mr. Werner and two years
in the case of Mr. Sial. Our other named executive officers’ long-term equity awards were between the 50th percentile
and 75th percentile, considering individual performance, the named executive officer’s experience in the executive
role, the executive’s scope of responsibility being narrower or broader than that of comparable positions at our peer
group companies, and equity burn-rate and stockholder dilution.
The Compensation Committee then allocated long-term equity awards between time-based and performance-
based restricted stock units. To balance the advantages of both time-based and performance-based awards, the
Compensation Committee decided that annual long-term equity incentive awards granted to Mr. Sial, Mr. Mahaffey,
and Mr. Richards in fiscal 2019 would be made half in the form of performance-based restricted stock units (which
could be earned in amounts between 0% and 150% of the target amount) and half in the form of time-based restricted
stock units, all of which would vest over four years, except for Mr. Sial’s awards which would vest over two years.
The Compensation Committee decided that annual long-term equity incentive awards granted to Mr. Werner in fiscal
2019 would be made 75% in the form of performance-based restricted stock units (which could be earned in amounts
between 0% and 150% of the target amount) and 25% in the form of time-based restricted stock units, all of which
would vest on December 1, 2020, subject to continued service, and also subject to acceleration of vesting upon earlier
termination of service in certain circumstances, provided that he is not terminated for Cause (as such term is defined
in Mr. Werner’s employment agreement). We believe that time-based restricted stock units provide a more effective
retention tool while performance-based restricted stock units provide a stronger performance driver.
The Compensation Committee approved a new hire grant to Mr. Waters in fiscal 2019 in the form of
684,932 time-based restricted stock units, all of which would vest over four years.
42

Awards granted and earned in fiscal 2019 were as follows:
NameTime-Based Restricted
Stock Units
Performance-Based Restricted Stock
Units (Target)
Performance-Based Restricted Stock
Units Earned
Thomas Werner 50,000 150,000 133,050
Manavendra Sial 40,000 40,000 35,480
Jeffrey Waters(1) 684,932 -0- -0-
Kenneth Mahaffey 56,667 56,667 50,264
Douglas Richards 60,000 60,000 53,220
(1) Mr. Waters joined the Company as the chief executive officer of our SunPower Technologies business unit on January 8, 2019.
We used performance-based restricted stock units as incentive compensation during fiscal 2019 to align our
named executive officers’ compensation with corporate performance. In connection with our annual review of
executive officer compensation, the Compensation Committee approved performance targets for performance stock
unit awards to each of our executive officers other than Mr. Waters in respect of the following: business restructuring
metrics (50% of the award), annual revenue metric (25% of the award), cash and cash equivalents metric (25% of
the award), and a formula under which actual awards would be calculated after completion of fiscal 2019.
See ‘‘Executive Compensation—Equity Incentive Plan Compensation’’ below for more information about these
metrics, targets, and formulas.
These semi-annual performance metrics for each of these awards were selected on the basis of the operating plan
approved by the Board after considering expectations regarding our future growth and strategy, as well as potential
challenges in achieving such growth and strategic goals. Semi-annual performance periods provide us more
flexibility in an uncertain business environment. The performance targets were established at a level that the
Compensation Committee determined to be challenging for our named executive officers to achieve. In fiscal 2019,
our named executive officers achieved an average 42.3% payout factor in respect of the semi-annual business
restructuring target, an average 9.8% payout factor in respect of the semi-annual revenue target, and an average
36.7% payout factor in respect of the semi-annual cash and cash equivalents target, resulting in a combined 88.7%
payout for each of our executive officers. The performance goals and associated payouts for 2019 PSUs match the
financial and operational performance elements (excluding the safety and corporate key results bonus modifiers) used
for the cash bonus program as laid out in the tables in the Performance-Based Cash Bonus Awards.
The performance-based restricted stock units earned by our named executive officers other than our chief
executive officer and Mr. Sial began vesting in four equal annual installments, subject to continued service, starting
March 1, 2020. Certain performance-based restricted stock units granted to our chief executive officer will vest on
December 1, 2020, subject to continuing service, and also subject to acceleration of vesting upon earlier termination
of service in certain circumstances provided that he is not terminated for Cause (as such term is defined in
Mr. Werner’s employment agreement). Performance-based restricted stock units granted to Mr. Sial will vest in two
equal installments starting March 1, 2020.
For fiscal 2019, our Compensation Committee continued to grant time-based restricted stock units that vest in
four equal annual installments to our named executive officers other than Mr. Werner and Mr. Sial, subject to
continued service, starting March 1, 2020. Time-based restricted stock units granted to our chief executive officer will
vest on December 1, 2020, subject to continuing service, and also subject to acceleration of vesting upon earlier
termination of service in certain circumstances provided that he is not terminated for Cause (as such term is defined
in Mr. Werner’s employment agreement). Time-based restricted stock units granted to Mr. Sial will vest in two equal
installments starting March 1, 2020.
Perquisites and Other Compensation. As in prior years, we generally do not provide any special perquisites to
our named executive officers. We provided certain perquisites and other health and welfare and retirement benefits,
such as health, vision, and life insurance coverage and participation in and matching contributions under our 401(k)
defined contribution plan, which benefits are generally available to all employees. In 2019, we offered relocation
benefits to Mr. Sial from St. Louis, Missouri, to San Jose, California, following his receipt of housing assistance and
travel expense reimbursement during fiscal 2018 in connection with his new hire offer. The relocation benefits
include, but are not limited to, reimbursement of a portion of home closing costs, a relocation allowance, and
provision of temporary housing for up to 30 days.
43

For more information about these arrangements and benefits, see footnote 4 to the ‘‘2019 Summary
Compensation Table’’ below.
Pension Benefits. None of our named executive officers participate in or have account balances in qualified or
non-qualified defined benefit plans sponsored by us.
Nonqualified Deferred Compensation. None of our named executive officers participate in or have account
balances in non-qualified defined contribution plans or other deferred compensation plans maintained by us.
Employment and Severance Arrangements
Change in Control Arrangements. We are party to employment agreements with certain of our executive
officers, including our named executive officers, which provide severance benefits for employment terminations in
connection with a change of control. The change of control severance arrangements generally entitle each named
executive officer to certain calculated payments tied to base salary and bonus targets and accelerated vesting of his
outstanding equity awards, but only upon termination by us without cause or by the executive for good reason (as
those terms are defined in the agreements) in connection with a change of control of the Company (a ‘‘double
trigger’’ arrangement). The Compensation Committee believes that these reinforce and encourage the continued
attention and dedication of our named executive officers to their assigned duties without the distraction arising from
the possibility of a change of control, and to enable and encourage our named executive officers to focus their
attention on obtaining the best possible outcome for our stockholders without being influenced by personal concerns
regarding the possible impact of a change of control on their job security and benefits. Under his employment
agreement, our chief executive officer also receives limited accelerated vesting of outstanding equity awards if
terminated without cause or if he resigns for good reason. For more information, see ‘‘Executive
Compensation—Employment Agreements’’ and ‘‘Executive Compensation—Potential Payments Upon Termination or
Change of Control.’’
Severance Arrangements. We also maintain our 2019 Management Career Transition Plan, adopted in
April 2019, which generally entitles each named executive officer to certain calculated payments tied to salary and
bonus targets, reimbursement of healthcare continuation coverage, and outplacement assistance if the individual is
terminated without cause.
The Compensation Committee believes that the 2019 Management Career Transition Plan provides benefits that
are consistent with industry practice. We believe that entering into change of control and severance arrangements with
certain of our executives has helped us attract and retain excellent executive talent and that offering standard
packages avoids case-by-case negotiations. The severance arrangements also promote stability and continuity in our
senior management team. For more information, please see ‘‘Executive Compensation―Employment Agreements,’’
‘‘Executive Compensation—2019 Management Career Transition Plan’’ and ‘‘Executive Compensation―Potential
Payments Upon Termination or Change of Control’’ below.
Section 162(m) Considerations
Section 162(m) of the Code generally limits the deduction a company may take for compensation paid to certain
executive officers to the extent the compensation for any such individual exceeds $1 million for the taxable year,
unless the compensation qualifies as ‘‘qualified performance-based compensation’’ under Section 162(m) of the
Code. This exception has been repealed such that compensation paid to certain executives in excess of $1 million will
not be deductible unless it qualifies for transition relief applicable to certain arrangements in place as of November 2,
2017. Our Compensation Committee considers deductibility as one of a number of factors considered in determining
appropriate levels or methods of compensation. Accordingly, we may award compensation that is not deductible for
federal income tax purposes.
Stock Ownership Guidelines
In 2015, the Board adopted Stock Ownership Guidelines for Executives and Directors. Under these guidelines
and subject to certain exceptions, our chief executive officer is expected to own shares of our stock that have a value
equal to five times his annual salary. Other executive officers, as designated by the Board, are expected to own shares
that have a value equal to their annual salary. Each executive officer is expected to maintain ownership at or above
the threshold applicable to them beginning five years after such officer first becomes subject to the guidelines with
ownership measured at the end of each calendar year. Shares may be owned directly by the individual, owned by the
44

individual’s spouse, or held in trust for the benefit of the individual’s family. Although Mr. Werner was required to
satisfy the stock ownership guidelines beginning five years after their implementation in 2015, he already owns
shares with a value in excess of the guidelines as of the end of 2019. Currently, the Board has not designated any
additional officers to be subject to the guidelines.
Other Disclosures
Under our insider trading policy, our executive officers, directors, and employees are prohibited from engaging
in short sales of our securities, establishing margin accounts or otherwise pledging our securities, hedging our
securities, or buying or selling options, puts, or calls on our securities.
We do not have a policy regarding adjustment or recovery of awards or payments if the relevant performance
goals or measures upon which they are based are restated or otherwise adjusted so that awards or payments are
reduced.
45

COMPENSATION COMMITTEE REPORT
The following report has been submitted by the Compensation Committee of the Board:
The Compensation Committee of the Board has reviewed and discussed our Compensation Discussion and
Analysis with management. Based on this review and discussion, the Compensation Committee recommended to the
Board that the Compensation Discussion and Analysis be included in our Annual Report on Form 10-K for the fiscal
year ended December 29, 2019 and definitive proxy statement on Schedule 14A for our 2020 Annual Meeting, each
as filed with the SEC. The foregoing report was submitted by the Compensation Committee of the Board and shall
not be deemed to be ‘‘soliciting material’’ or to be ‘‘filed’’ with the SEC or subject to Regulation 14A promulgated
by the SEC or Section 18 of the Exchange Act, and shall not be deemed incorporated by reference into any prior or
subsequent filing by us under the Securities Act of 1933 or the Exchange Act.
COMPENSATION COMMITTEE OF
THE BOARD OF DIRECTORS
Thomas McDaniel
Julien Pouget
Thomas Rebeyrol
Patrick Wood III, Chair
April 3, 2020
46

EXECUTIVE COMPENSATION
Compensation of Named Executive Officers
The 2019 Summary Compensation Table below quantifies the compensation for each of our named executive officers
for services rendered during fiscal 2019 and, as applicable, fiscal 2018 and fiscal 2017. The primary elements of each
named executive officer’s total compensation during fiscal 2019 are reported in the table below and include, among others,
base salary, performance-based cash bonuses under our Semi-Annual Bonus Plan, awards of restricted stock units subject
to time-based vesting, and awards of performance-based restricted stock units subject to achievement of financial and other
strategic targets and subsequent time-based vesting.
2019 Summary Compensation Table
Name and Principal Position YearSalary($)(1)
Bonus($)
Stock Awards($)(2)
Non-EquityIncentive PlanCompensation
($)(3)
All OtherCompensation
($)(4)Total
($)
Thomas Werner President,Chief Executive Officer, andChairman of the Board
2019 600,000 -0- 1,486,000 860,833 25,650 2,972,483
2018 600,000 -0- 2,165,300 1,218,369 25,018 4,008,687
2017 428,154(7) -0- 2,973,600 819,471 24,991 4,246,216
Manavendra SialExecutive Vice Presidentand Chief Financial Officer (5)
2019 432,115 -0- 464,000 288,573 142,707 1,327,396
2018 266,442 100,000 1,907,600 245,480 79,400 2,598,922
Kenneth MahaffeyExecutive Vice President,General Counsel, Chief Ethicsand Compliance Officer,and Corporate Secretary
2019 332,115 -0- 657,337 152,264 31,459 1,173,175
2018 325,000 -0- 670,650 240,539 30,594 1,266,783
2017 325,000 -0- 283,200 227,819 31,007 867,026
Douglas RichardsExecutive Vice President,Administration
2019 377,115 -0- 696,000 206,056 21,887 1,301,058
2018 370,000 -0- 710,100 296,316 21,330 1,397,746
2017 370,000 -0- 672,600 277,810 21,474 1,341,884
Jeffrey WatersChief Executive Officer,SunPower Technologies(6) 2019 563,077 1,000,000 3,972,606 557,085 29,608 6,122,376
(1) The amounts reported in this column for fiscal 2019 reflect each named executive officer’s salary for fiscal 2019 plus payments for paid
time off and holidays.
(2) The amounts reported in the ‘‘Stock Awards’’ column for fiscal 2019 represent the aggregate grant date fair value computed in accordance
with FASB ASC Topic 718 of stock awards granted during the year (time-based and performance-based restricted stock units), excluding
the effect of certain forfeiture assumptions. For the performance-based restricted stock units reported in this column for fiscal 2019, such
amounts are based on the probable outcome of the relevant performance conditions as of the grant date. Assuming that the highest level of
performance is achieved for these awards, the grant date fair value of the performance-based restricted stock unit awards would be:
Mr. Werner, $1,671,750; Mr. Sial, $348,000; Mr. Mahaffey, $493,000; and Mr. Richards, $522,000. See Note 16 to our consolidated financial
statements in our 2019 Annual Report for details as to the assumptions used to determine the aggregate grant date fair value of these awards.
See also our discussion of stock-based compensation under ‘‘Management’s Discussion and Analysis of Financial Condition and Results of
Operations—Critical Accounting Estimates’’ in our 2019 Annual Report.
(3) The amounts reported in this column for fiscal 2019 reflect the amounts earned under our Semi-Annual Bonus Plan. Additional information
about non-equity incentive plan compensation earned during fiscal 2019 is set forth in ‘‘Executive Compensation—Non-Equity Incentive
Plan Compensation’’ below.
47

(4) The amounts reported in this column for fiscal 2019 as ‘‘All Other Compensation’’ consist of the elements summarized in the table below.
Name
HealthBenefits
($)
Group LifeInsurance
($)
401(k)Match
($)Relocation
BenefitsTotal
($)
Thomas Werner 16,314 936 8,400 25,650
Manavendra Sial 21,116 679 8,400 112,512 142,707
Kenneth Mahaffey 22,536 523 8,400 31,459
Douglas Richards 12,894 593 8,400 21,887
Jeffrey Waters 29,068 540 -0- 29,608
(5) Mr. Sial joined the Company as an executive vice president on May 2, 2018 and became chief financial officer of the Company on May 9, 2018.
(6) Mr. Waters joined the Company as chief executive officer of the SunPower Technologies business unit on January 8, 2019.
(7) Effective August 1, 2016, Mr. Werner’s annual salary was reduced at his request from $600,000 to $1, net of benefit costs, for the remainderof fiscal 2016, and the reduction was extended through the first fiscal quarter of 2017. Mr. Werner’s full salary was reinstated as of April 1,2017.
Grants of Plan-Based Awards
During fiscal 2019, our named executive officers were granted plan-based restricted stock units and
performance-based restricted stock units under our SunPower Corporation 2015 Omnibus Incentive Plan, which we
refer to as our 2015 Equity Plan. They were also granted cash bonus awards under our Semi-Annual Bonus Plan. The
following table sets forth information regarding the stock awards and cash bonus awards granted to each named
executive officer during fiscal 2019.
2019 Grants of Plan-Based Awards Table
Name Grant DateEstimated Future Payouts Under
Non-Equity Incentive Plan Awards(1)Estimated Future Payouts UnderEquity Incentive Plan Awards(2)
AllOtherStock
Awards:Numberof Sharesof Stockor Units
(#)
Grant DateFair Valueof Stock
andOptionAwards
($)Threshold
($)Target
($)Maximum
($)Threshold
(#)Target
(#)Maximum
(#)
Thomas Werner —(3) 540,000 1,200,000 2,475,000 — — — — —
4/18/2019(4) — — — 75,000 150,000 225,000 — 1,114,500
4/18/2019(5) — — — — — — 50,000 371,500
Manavendra Sial —(3) 176,175 391,500 807,469 — — — — —
2/12/2019(6) — — — 20,000 40,000 60,000 — 232,000
02/12/2019(7) — — — — — — 40,000 232,000
Kenneth Mahaffey —(3) 113,063 251,250 518,203 — — — — —
2/12/2019(8) — — — 28,334 56,667 85,000 — 328,669
2/12/2019(9) — — — — — — 56,667 328,669
Douglas Richards (3) 136,800 304,000 627,000 — — — — —
02/12/2019(8) — — — 30,000 60,000 90,000 — 348,000
02/12/2019(9) — — — — — — 60,000 348,000
Jeffrey Waters —(3) 337,500 750,000 1,546,875 — — — — —
02/12/2019(10) — — — — — — 684,932 3,972,606
(1) Additional information about estimated possible payouts under non-equity incentive plan awards is set forth above in the table entitled‘‘Estimated Possible Payouts Under Semi-Annual Bonus Plan.’’
(2) The amounts reported in these columns represent performance-based restricted stock unit opportunities. The Compensation Committeeapproved the awards to Mr. Werner on April 18, 2019 and on February 12, 2019 for the other named executive officers. The grant date fairvalue of these awards is reported based on the probable outcome of the applicable performance conditions and is consistent with the estimateof aggregate compensation cost, if any, expected to be recognized over the service period determined as of the grant date under FASB ASCTopic 718, excluding the effect of estimated forfeitures. See Note 16 to our consolidated financial statements in our 2019 Annual Reportfor details as to the assumptions used to determine the aggregate grant date fair value of these awards. See also our discussion of stock-basedcompensation under ‘‘Management’s Discussion and Analysis of Financial Condition and Results of Operations—Critical AccountingEstimates’’ in our 2019 Annual Report.
(3) Consists of an award under our Executive Semi-Annual Bonus Plan. Achievement levels for certain performance targets could reducepayouts to zero when the applicable formula is applied, as further described below.
48
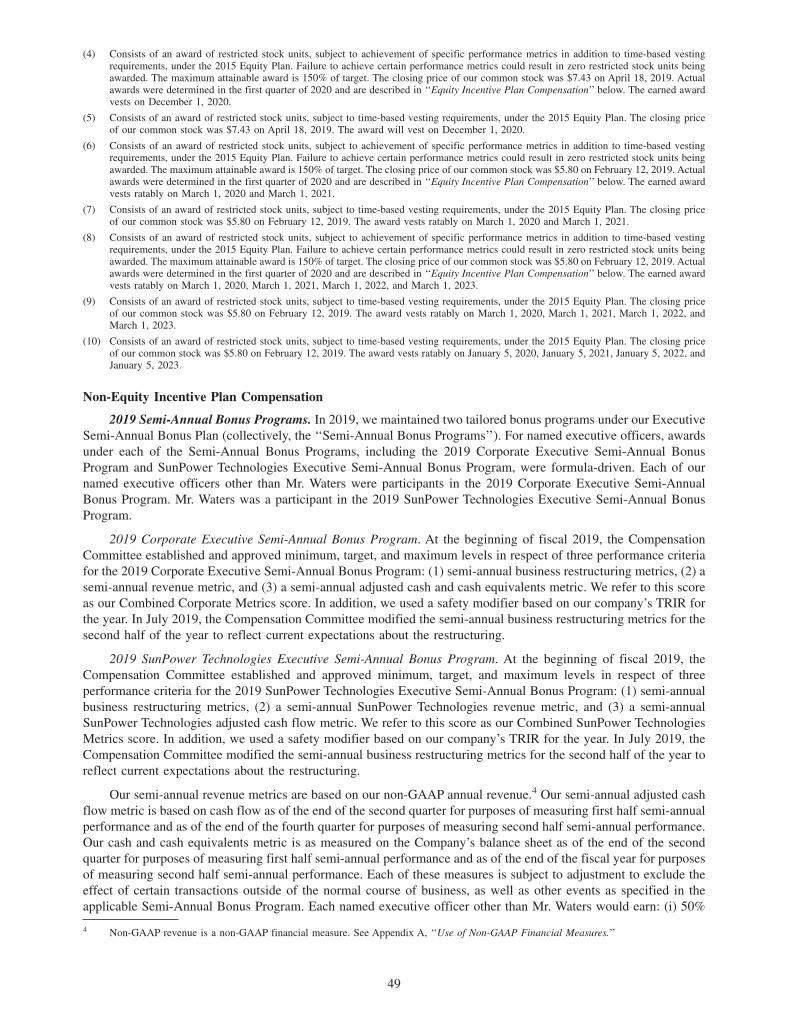
(4) Consists of an award of restricted stock units, subject to achievement of specific performance metrics in addition to time-based vestingrequirements, under the 2015 Equity Plan. Failure to achieve certain performance metrics could result in zero restricted stock units beingawarded. The maximum attainable award is 150% of target. The closing price of our common stock was $7.43 on April 18, 2019. Actualawards were determined in the first quarter of 2020 and are described in ‘‘Equity Incentive Plan Compensation’’ below. The earned awardvests on December 1, 2020.
(5) Consists of an award of restricted stock units, subject to time-based vesting requirements, under the 2015 Equity Plan. The closing priceof our common stock was $7.43 on April 18, 2019. The award will vest on December 1, 2020.
(6) Consists of an award of restricted stock units, subject to achievement of specific performance metrics in addition to time-based vestingrequirements, under the 2015 Equity Plan. Failure to achieve certain performance metrics could result in zero restricted stock units beingawarded. The maximum attainable award is 150% of target. The closing price of our common stock was $5.80 on February 12, 2019. Actualawards were determined in the first quarter of 2020 and are described in ‘‘Equity Incentive Plan Compensation’’ below. The earned awardvests ratably on March 1, 2020 and March 1, 2021.
(7) Consists of an award of restricted stock units, subject to time-based vesting requirements, under the 2015 Equity Plan. The closing priceof our common stock was $5.80 on February 12, 2019. The award vests ratably on March 1, 2020 and March 1, 2021.
(8) Consists of an award of restricted stock units, subject to achievement of specific performance metrics in addition to time-based vestingrequirements, under the 2015 Equity Plan. Failure to achieve certain performance metrics could result in zero restricted stock units beingawarded. The maximum attainable award is 150% of target. The closing price of our common stock was $5.80 on February 12, 2019. Actualawards were determined in the first quarter of 2020 and are described in ‘‘Equity Incentive Plan Compensation’’ below. The earned awardvests ratably on March 1, 2020, March 1, 2021, March 1, 2022, and March 1, 2023.
(9) Consists of an award of restricted stock units, subject to time-based vesting requirements, under the 2015 Equity Plan. The closing priceof our common stock was $5.80 on February 12, 2019. The award vests ratably on March 1, 2020, March 1, 2021, March 1, 2022, andMarch 1, 2023.
(10) Consists of an award of restricted stock units, subject to time-based vesting requirements, under the 2015 Equity Plan. The closing priceof our common stock was $5.80 on February 12, 2019. The award vests ratably on January 5, 2020, January 5, 2021, January 5, 2022, andJanuary 5, 2023.
Non-Equity Incentive Plan Compensation
2019 Semi-Annual Bonus Programs. In 2019, we maintained two tailored bonus programs under our Executive
Semi-Annual Bonus Plan (collectively, the ‘‘Semi-Annual Bonus Programs’’). For named executive officers, awards
under each of the Semi-Annual Bonus Programs, including the 2019 Corporate Executive Semi-Annual Bonus
Program and SunPower Technologies Executive Semi-Annual Bonus Program, were formula-driven. Each of our
named executive officers other than Mr. Waters were participants in the 2019 Corporate Executive Semi-Annual
Bonus Program. Mr. Waters was a participant in the 2019 SunPower Technologies Executive Semi-Annual Bonus
Program.
2019 Corporate Executive Semi-Annual Bonus Program. At the beginning of fiscal 2019, the Compensation
Committee established and approved minimum, target, and maximum levels in respect of three performance criteria
for the 2019 Corporate Executive Semi-Annual Bonus Program: (1) semi-annual business restructuring metrics, (2) a
semi-annual revenue metric, and (3) a semi-annual adjusted cash and cash equivalents metric. We refer to this score
as our Combined Corporate Metrics score. In addition, we used a safety modifier based on our company’s TRIR for
the year. In July 2019, the Compensation Committee modified the semi-annual business restructuring metrics for the
second half of the year to reflect current expectations about the restructuring.
2019 SunPower Technologies Executive Semi-Annual Bonus Program. At the beginning of fiscal 2019, the
Compensation Committee established and approved minimum, target, and maximum levels in respect of three
performance criteria for the 2019 SunPower Technologies Executive Semi-Annual Bonus Program: (1) semi-annual
business restructuring metrics, (2) a semi-annual SunPower Technologies revenue metric, and (3) a semi-annual
SunPower Technologies adjusted cash flow metric. We refer to this score as our Combined SunPower Technologies
Metrics score. In addition, we used a safety modifier based on our company’s TRIR for the year. In July 2019, the
Compensation Committee modified the semi-annual business restructuring metrics for the second half of the year to
reflect current expectations about the restructuring.
Our semi-annual revenue metrics are based on our non-GAAP annual revenue.4 Our semi-annual adjusted cash
flow metric is based on cash flow as of the end of the second quarter for purposes of measuring first half semi-annual
performance and as of the end of the fourth quarter for purposes of measuring second half semi-annual performance.
Our cash and cash equivalents metric is as measured on the Company’s balance sheet as of the end of the second
quarter for purposes of measuring first half semi-annual performance and as of the end of the fiscal year for purposes
of measuring second half semi-annual performance. Each of these measures is subject to adjustment to exclude the
effect of certain transactions outside of the normal course of business, as well as other events as specified in the
applicable Semi-Annual Bonus Program. Each named executive officer other than Mr. Waters would earn: (i) 50%
4 Non-GAAP revenue is a non-GAAP financial measure. See Appendix A, ‘‘Use of Non-GAAP Financial Measures.’’
49
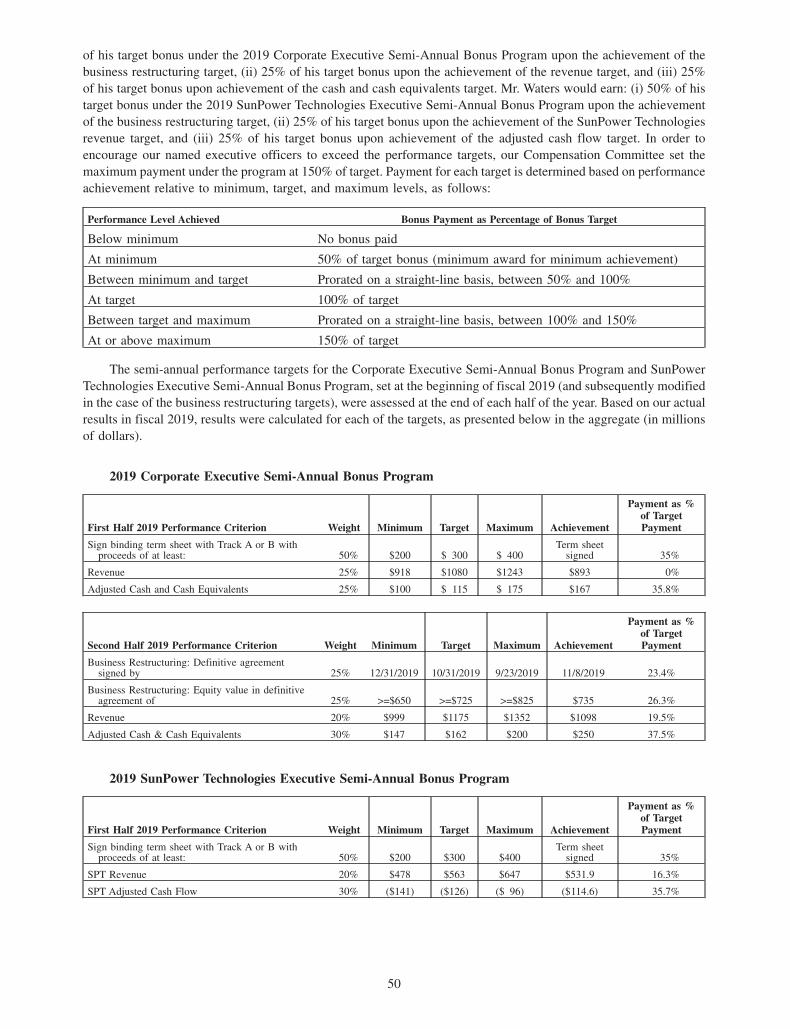
of his target bonus under the 2019 Corporate Executive Semi-Annual Bonus Program upon the achievement of the
business restructuring target, (ii) 25% of his target bonus upon the achievement of the revenue target, and (iii) 25%
of his target bonus upon achievement of the cash and cash equivalents target. Mr. Waters would earn: (i) 50% of his
target bonus under the 2019 SunPower Technologies Executive Semi-Annual Bonus Program upon the achievement
of the business restructuring target, (ii) 25% of his target bonus upon the achievement of the SunPower Technologies
revenue target, and (iii) 25% of his target bonus upon achievement of the adjusted cash flow target. In order to
encourage our named executive officers to exceed the performance targets, our Compensation Committee set the
maximum payment under the program at 150% of target. Payment for each target is determined based on performance
achievement relative to minimum, target, and maximum levels, as follows:
Performance Level Achieved Bonus Payment as Percentage of Bonus Target
Below minimum No bonus paid
At minimum 50% of target bonus (minimum award for minimum achievement)
Between minimum and target Prorated on a straight-line basis, between 50% and 100%
At target 100% of target
Between target and maximum Prorated on a straight-line basis, between 100% and 150%
At or above maximum 150% of target
The semi-annual performance targets for the Corporate Executive Semi-Annual Bonus Program and SunPower
Technologies Executive Semi-Annual Bonus Program, set at the beginning of fiscal 2019 (and subsequently modified
in the case of the business restructuring targets), were assessed at the end of each half of the year. Based on our actual
results in fiscal 2019, results were calculated for each of the targets, as presented below in the aggregate (in millions
of dollars).
2019 Corporate Executive Semi-Annual Bonus Program
First Half 2019 Performance Criterion Weight Minimum Target Maximum Achievement
Payment as %of TargetPayment
Sign binding term sheet with Track A or B withproceeds of at least: 50% $200 $ 300 $ 400
Term sheetsigned 35%
Revenue 25% $918 $1080 $1243 $893 0%
Adjusted Cash and Cash Equivalents 25% $100 $ 115 $ 175 $167 35.8%
Second Half 2019 Performance Criterion Weight Minimum Target Maximum Achievement
Payment as %of TargetPayment
Business Restructuring: Definitive agreementsigned by 25% 12/31/2019 10/31/2019 9/23/2019 11/8/2019 23.4%
Business Restructuring: Equity value in definitiveagreement of 25% >=$650 >=$725 >=$825 $735 26.3%
Revenue 20% $999 $1175 $1352 $1098 19.5%
Adjusted Cash & Cash Equivalents 30% $147 $162 $200 $250 37.5%
2019 SunPower Technologies Executive Semi-Annual Bonus Program
First Half 2019 Performance Criterion Weight Minimum Target Maximum Achievement
Payment as %of TargetPayment
Sign binding term sheet with Track A or B withproceeds of at least: 50% $200 $300 $400
Term sheetsigned 35%
SPT Revenue 20% $478 $563 $647 $531.9 16.3%
SPT Adjusted Cash Flow 30% ($141) ($126) ($ 96) ($114.6) 35.7%
50

Second Half 2019 Performance Criterion Weight Minimum Target Maximum Achievement
Payment as %of TargetPayment
Business Restructuring: Definitive agreementsigned by 25% 12/31/2019 10/31/2019 9/23/2019 11/8/2019 23.4%
Business Restructuring: Equity value in definitiveagreement of 25% >=$650 >=$725 >=$825 $735 26.3%
SPT Revenue 25% $493 $580 $667 $690 30%
SPT Adjusted Cash Flow 25% $41 $56 $86 $96.1 45%
The safety modifier based on our company’s TRIR for each half of the year, set at the beginning of fiscal 2019,
was also assessed at the end of each half of the year, and applied to the bonus payouts calculated under the Corporate
Executive Semi-Annual Bonus Program and the SunPower Technologies Executive Semi-Annual Bonus Program.
The maximum payout modifier for TRIR was set to 110% for achieving a .90 TRIR or below and the minimum
payout modifier for TRIR was set to 90% for achieving a TRIR of 1.10 or greater. Achieving a TRIR result of
1.00 would result in a TRIR modifier equal to 100%. Based on our actual results in fiscal 2019, results were
calculated in comparison to the target, as presented below.
First Half Performance Criterion Minimum Target Maximum AchievementPayment as % ofTarget Payment
SunPower Total Recordable Injury Rate 1.10 1.00 .90 1.20 90%
Second Half Performance Criterion Minimum Target Maximum AchievementPayment as % ofTarget Payment
SunPower Total Recordable Injury Rate 1.10 1.00 .90 .979 101.3%
Based on the actual results achieved, bonuses were earned and paid to our named executive officers at 53.3%
in the aggregate for the first half and 89.3% for the second half.
Awards under the Semi-Annual Bonus Programs were formula-driven, with targets including other corporate
performance metrics, consisting of a set of corporate milestones representing key results in support our corporate
business plan. Each named executive officer is further assigned an individual modifier by his or her manager, or, in
the case of our chief executive officer, by the Board, meant to take into account individual performance and
accomplishments. These metrics were then incorporated into the plan’s formula. Each named executive officer’s
individual modifier could result in no award being payable even if we achieved our semi-annual performance metrics
and corporate key results targets in the event that the individual modifier was determined to be zero. If threshold
corporate key results were achieved and we exceeded our semi-annual performance metric targets, bonus payments
could exceed 100% of target, up to a maximum payment of 150%, depending on the individual modifier.
Semi-Annual Bonus Program payment modifiers for each half of the year associated with corporate milestones
were determined as follows:
Average Corporate Key Results Score for the Half Payment
Under 60% 60% bonus payment modifier
60% or over but under 80% 80% bonus payment modifier
80% or over 100% bonus payment modifier
Quarterly corporate milestones in fiscal 2019 included sensitive business objectives applicable to our entire
company, focusing on strategic transactions, business restructuring, revenue and margin targets, confidential cost and
production targets, technology milestones, bookings targets, major customer transactions, new product development,
and manufacturing plans and enhancements. The quarterly corporate key results scores were 66.25%, 77.71%, 64%,
and 80.85% for each quarter in fiscal 2019, respectively, resulting in Semi-Annual Bonus Program bonus payment
modifiers of 80% in the first half and 80% in the second half. Individual modifiers for the named executive officers
ranged from 85% to 105%, and averaged 95%, for both the first half and the second half of fiscal 2019.
Equity Incentive Plan Compensation
In addition to time-based restricted stock unit awards, to further align executive compensation with maximizing
stockholder value, our Compensation Committee granted to our named executive officers certain performance-based
51

equity awards, consisting of restricted stock units (‘‘RSUs’’) that would be released and begin time-based vesting
only upon achievement of certain corporate or individual performance objectives.
Our Compensation Committee met at the beginning of 2019 and established and approved target levels in
respect of three performance criteria for our performance-based equity awards to named executive officers other than
Mr. Waters: (1) a semi-annual business restructuring metric, (2) a semi-annual revenue metric, and (3) a semi-annual
cash and cash equivalents metric. Each eligible named executive officer would earn 50% of his target
performance-based RSUs upon the achievement of the semi-annual business restructuring metric target, 25% of his
target performance-based RSUs upon the achievement of the revenue metric target, and 25% of his target
performance-based RSUs upon the achievement of the cash and cash equivalents target. The three metrics (business
restructuring, revenue, and adjusted cash and cash equivalents) and their corresponding targets are the same as those
for our 2019 Corporate Executive Semi-Annual Bonus Program described above in ‘‘Executive Compensation—Non-
Equity Incentive Plan Compensation.’’ The attainment for each half of the year was averaged, to determine the
attainment for the year for each performance criteria. The payment for each target was determined based on the
performance metric achieved relative to minimum, target, and maximum performance levels, as shown in the table
below.
Percentage of Performance Target Achieved Grant of RSUs as Percentage of Target RSUs
Below minimum No RSUs earned
At minimum 50% of target RSUs (minimum award for minimum achievement)
Between minimum and target Prorated on a straight-line basis, between 50% and 100%
At target 100% of target
Between target and maximum Prorated on a straight-line basis, between 100% and 150%
At or above maximum 150% of target
The performance-based restricted stock units earned by our named executive officers other than our chief
executive officer and our chief financial officer began vesting in four equal annual installments, subject to continued
service, starting March 1, 2020. Performance-based restricted stock units granted to our chief executive officer vest
on December 1, 2020, subject to continued service, and also subject to acceleration of vesting upon earlier
termination of service in certain circumstances, provided that he is not terminated for Cause (as such term is defined
in Mr. Werner’s employment agreement). Performance-based restricted stock units granted to our chief financial
officer will vest in two equal installments, subject to continued service, starting March 1, 2020.
For fiscal 2019, our Compensation Committee continued to grant time-based restricted stock units that vest in
four equal annual installments to our named executive officers other than our chief executive officer and chief
financial officer, subject to continued service, starting March 1, 2020. Time-based restricted stock units granted to
our chief executive officer vest on December 1, 2020, subject to continued service, and also subject to acceleration
of vesting upon earlier termination of service in certain circumstances, provided that he is not terminated for Cause
(as such term is defined in Mr. Werner’s employment agreement. Time-based restricted stock units granted to our
chief financial officer will vest in two equal installments, subject to continued service, starting March 1, 2020.
With respect to our 2019 performance-based equity awards to named executive officers other than Mr. Waters,
we achieved an average of 42.3% of our semi-annual business restructuring metric targets, 9.8% of our revenue
metric target, and 36.7% of our cash and cash equivalents metric target. Based on our actual results in fiscal 2019,
performance-based restricted stock units were earned by such named executive officers for achievement of each of
these metric targets.
The named executive officers’ targets and earned performance-based restricted stock units are described above
in ‘‘Compensation Discussion and Analysis—Analysis of Fiscal 2019 Compensation Decisions—Equity Awards.’’
Outstanding Equity Awards at Fiscal Year-End
The following table sets forth information regarding the outstanding equity awards held by our named executive
officers as of December 29, 2019.
52

Outstanding Equity Awards at 2019 Fiscal Year-End Table
Name Grant Date
Stock Awards
Number ofShares or Units ofStock That Have
Not Vested(#)
Market Value ofShares or Units ofStock That Have
Not Vested($)(1)
Thomas Werner 03/31/2016(2) 120,000 956,400
03/31/2016(3) 5,138 40,9450
03/31/2016(4) 8,610 68,622
03/31/2016(5) 17,900 142,663
03/10/2017(6) 17,700 141,069
03/10/2017(6) 90,000 717,300
03/10/2017(7) 75,000 597,750
03/10/2017(8) 75,000 597,750
02/16/2018(9) 32,500 259,025
04/12/2018(10) 30,000 239,100
04/12/2018(10) 32,305 257,471
04/12/2018(11) 59,640 475,331
04/12/2018(11) 34,170 272,335
04/18/2019(12) 50,000 398,500
04/18/2019(13) 133,050 1,060,409
Manavendra Sial 05/18/2018(19) 75,000 597,750
12/14/2018(20) 80,000 637,600
02/12/2019(21) 35,480 282,776
02/12/2019(22) 40,000 318,800
Kenneth Mahaffey 01/27/2016(14) 3,465 27,616
03/21/2016(5) 600 4,782
03/21/2016(5) 2,125 16,936
11/01/2016(16) 12,500 99,625
03/10/2017(7) 20,000 159,400
02/16/2018(17) 31,875 254,044
04/12/2018(18) 30,951 246,679
02/12/2019(23) 50,264 400,604
02/12/2019(24) 56,667 451,636
Douglas Richards 02/22/2016(15) 1,077 8,584
02/22/2016(5) 3,750 29,888
03/10/2017(7) 23,750 189,288
03/10/2017(8) 23,750 189,288
02/16/2018(17) 33,750 268,988
04/12/2018(18) 32,772 261,193
02/12/2019(23) 53,200 424,163
02/12/2019(24) 60,000 478,200
Jeffrey Waters 02/12/2019(25) 684,932 5,458,908
(1) The closing price of our common stock on December 27, 2019 (the last trading day of fiscal 2019) was $7.97.
(2) Each of these awards of restricted stock units provided for one-time vesting on March 31, 2020 subject to the recipient’s continuedemployment with us.
(3) Each of these awards of restricted stock units provided for one-time vesting on March 31, 2020 subject to the recipient’s continuedemployment with us.
(4) On March 31, 2016, the named executive officer was awarded a number of performance-based restricted stock units, with the actual number
53

contingent on the achievement of certain performance criteria. The actual award was determined in the first quarter of 2017. The earned
award vests in full on March 31, 2020, subject to the recipient’s continued employment with us.
(5) Each of these awards of restricted stock units provided for vesting in four equal annual installments on each of March 1, 2017, March 1,
2018, March 1, 2019, and March 1, 2020, subject to the recipient’s continued employment with us.
(6) On March 10, 2017, the named executive officer was awarded a number of performance-based restricted stock units, with the actual number
contingent on the achievement of certain performance criteria. The actual award was determined in the first quarter of 2018 and is described
in ‘‘Equity Incentive Plan Compensation’’ above. The earned award vests in full on March 31, 2020, subject to the recipient’s continued
employment with us.
(7) On March 10, 2017, the named executive officer was awarded a number of performance-based restricted stock units, with the actual number
contingent on the achievement of certain performance criteria. The actual award was determined in the first quarter of 2018 and is described
in ‘‘Equity Incentive Plan Compensation’’ above. The earned award vests in four equal annual installments on March 1, 2018, March 1,
2019, March 1, 2020, and March 1, 2021, subject to the recipient’s continued employment with us.
(8) Each of these awards of restricted stock units provided for vesting in four equal annual installments on each of March 1, 2018, March 1,
2019, March 1, 2020, and March 1, 2021, subject to the recipient’s continued employment with us.
(9) Each of these awards of restricted stock units provided for vesting in two equal annual installments on each of March 31, 2019 and March 31,
2020, subject to the recipient’s continued employment with us.
(10) On April 12, 2018, the named executive officer was awarded a number of performance-based restricted stock units, with the actual number
contingent on the achievement of certain performance criteria. The actual award was determined in the first quarter of 2019 and is described
in ‘‘Equity Incentive Plan Compensation’’ above. The earned award vests in two equal annual installments on March 1, 2019 and March 1,
2020, subject to the recipient’s continued employment with us.
(11) On April 12, 2018, the named executive officer was awarded a number of performance-based restricted stock units, with the actual number
contingent on the achievement of certain performance criteria. The actual award was determined in the first quarter of 2019 and is described
in ‘‘Equity Incentive Plan Compensation’’ above. The earned award will vest on March 31, 2020, subject to the recipient’s continued
employment with us.
(12) Each of these awards of restricted stock units provided for one-time vesting on December 1, 2020 subject to the recipient’s continued
employment with us.
(13) On April 18, 2019, the named executive officer was awarded a number of performance-based restricted stock units, with the actual number
contingent on the achievement of certain performance criteria. The actual award was determined in the first quarter of 2020 and is described
in ‘‘Equity Incentive Plan Compensation’’ above. The earned award will vest on December 1, 2020, subject to the recipient’s continued
employment with us.
(14) Each of these awards of restricted stock units provided for vesting in four equal annual installments on each of January 25, 2017, January 25,
2018, January 25, 2019, and January 25, 2020, subject to the recipient’s continued employment with us.
(15) On February 22, 2016, the named executive officer was awarded a number of performance-based restricted stock units, with the actual
number contingent on the achievement of certain performance criteria. The actual award was determined in the first quarter of 2017. The
earned award vests in four equal annual installments on each March 1, 2017, March 1, 2018, March 1, 2019, and March 1, 2020, subject
to the recipient’s continued employment with us.
(16) Each of these awards of restricted stock units provided for vesting in four equal annual installments on each of November 1, 2017,
November 1, 2018, November 1, 2019, and November 1, 2020, subject to the recipient’s continued employment with us.
(17) Each of these awards of restricted stock units provided for vesting in four equal annual installments on each of March 1, 2019, March 1,
2020, March 1, 2021, and March 1, 2022, subject to the recipient’s continued employment with us.
(18) On April 12, 2018, the named executive officer was awarded a number of performance-based restricted stock units, with the actual number
contingent on the achievement of certain performance criteria. The actual award was determined in the first quarter of 2019 and is described
in ‘‘Equity Incentive Plan Compensation’’ above. The earned award vests in four equal annual installments on March 1, 2019, March 1,
2020, March 1, 2021, and March 1, 2022, subject to the recipient’s continued employment with us.
(19) Each of these awards of restricted stock units provided for vesting in four equal annual installments on each of May 5, 2019, May 5, 2020,
May 5, 2021, and May 5, 2022, subject to the recipient’s continued employment with us.
(20) Each of these awards of restricted stock units provided for vesting in two equal annual installments on each of December 5, 2019 and
December 5, 2020, subject to the recipient’s continued employment with us.
(21) On February 12, 2019, the named executive officer was awarded a number of performance-based restricted stock units, with the actual
number contingent on the achievement of certain performance criteria. The actual award was determined in the first quarter of 2020 and
is described in ‘‘Equity Incentive Plan Compensation’’ above. The earned award vests in two equal annual installments on March 1, 2020
and March 1, 2021, subject to the recipient’s continued employment with us.
(22) Each of these awards of restricted stock units provided for vesting in two equal annual installments on each of March 1, 2020 and March 1,
2021, subject to the recipient’s continued employment with us.
(23) On February 12, 2019, the named executive officer was awarded a number of performance-based restricted stock units, with the actual
number contingent on the achievement of certain performance criteria. The actual award was determined in the first quarter of 2020 and
is described in ‘‘Equity Incentive Plan Compensation’’ above. The earned award vests in four equal annual installments on March 1, 2020,
March 1, 2021, March 1, 2022, and March 1, 2023, subject to the recipient’s continued employment with us.
(24) Each of these awards of restricted stock units provided for vesting in four equal annual installments on each of March 1, 2020, March 1,
2021, March 1, 2022, and March 1, 2023, subject to the recipient’s continued employment with us.
(25) Each of these awards of restricted stock units provided for vesting in four equal annual installments on each of January 5, 2020, January 5,
2021, January 5, 2022, and January 5, 2023, subject to the recipient’s continued employment with us.
54

The following table sets forth the number of shares acquired pursuant to the vesting of stock awards held by our
named executive officers during fiscal 2019 and the aggregate dollar amount realized by our named executive officers
upon such events. Because there were no shares acquired by our named executive officers pursuant to the exercise
of options during fiscal 2019, we have not included columns pertaining to option awards in the table below.
2019 Option Exercises and Stock Vested Table
Name
Stock Awards
Number of SharesAcquired on Vesting
(#)
Value Realizedon Vesting
($)(1)
Thomas Werner 192,842 1,248,988
Manavendra Sial 105,000 755,300
Kenneth Mahaffey 49,632 347,168
Douglas Richards 50,749 328,346
Jeffrey Waters -0- -0-
(1) The aggregate dollar value realized upon the vesting of a stock award represents the fair market value of the underlying shares on the vesting
date multiplied by the number of shares vested.
Potential Payments Upon Termination or Change of Control
Tabular Disclosure of Termination Payments. Our employment agreements with our named executive officers
contain provisions that provide for payments upon certain events of termination and change of control. See
‘‘Employment and Severance Agreements’’ below for a detailed description of these agreements. The following tables
summarize the estimated payments that would have been made on December 29, 2019 which our named executive
officers would be eligible to receive upon the following termination events, assuming each such event had occurred
on December 27, 2019, the last business day of fiscal 2019:
• termination with cause or voluntary resignation without good reason;
• involuntary termination without cause or voluntary resignation for good reason in connection with a change
of control;
• involuntary termination without cause or voluntarily resignation for good reason not in connection with a
change of control;
• retirement; or
• discontinued service due to death or disability.
The dollar value identified with respect to each type of equity award is based on each named executive officer’s
accelerated restricted stock units as of December 29, 2019 and is based on the $7.97 per share closing price for our
common stock on December 27, 2019, the last trading day of fiscal 2019. No named executive officers held unvested
stock options as of December 29, 2019. For more information on each officer’s outstanding equity awards as of
December 29, 2019, please see the ‘‘Outstanding Equity Awards At 2019 Fiscal-Year End Table’’ above. The tables
do not include unpaid regular salary, nor the impact of certain ‘‘best net’’ provisions of each named executive officer’s
employment agreement that provides that, in the event any payments under such employment agreement would
constitute parachute payments under Section 280G of the Code or be subject to the excise tax of Section 4999 of the
Code, then such payments should be either delivered in full or reduced to result in no portion being subject to such
tax provisions and still yield the greatest payment to the individual on an after tax basis.
55

Termination Payments Table
Name Termination Scenario
ContinuedSalary
($)
Bonus andAcceleratedNon-Equity
IncentivePlan Awards
($)
AcceleratedRestricted
Stock Units($)(1)(2)
ContinuedMedicalBenefits
andGross Up
($)
Outplace-ment
Services ($)
AccruedPaid Time
Off andSabbatical
($)Total
($)
Thomas Werner Termination with cause orvoluntary resignation withoutgood reason — — — — — 69,231 69,231
Involuntary terminationwithout cause or voluntaryresignation for good reasonin connection with change ofcontrol 1,200,000 2,400,000 6,953,175 77,850 15,000 69,231 10,354,986
Involuntary terminationwithout cause or voluntaryresignation for good reasonnot in connection withchange of control 1,200,000 1,200,000 5,532,766 77,850 15,000 69,231 8,094,577
Retirement — — — — — 69,231 69,231
Death or disability — — 6,728,266 — — 69,231 6,797,497
Manavendra Sial Termination with cause orvoluntary resignation withoutgood reason — — — — — — —
Involuntary terminationwithout cause or voluntaryresignation for good reasonin connection with change ofcontrol 850,000 765,000 1,836,926 73,882 15,000 — 3,540,808
Involuntary terminationwithout cause 425,000 382,500 — 36,941 15,000 — 859,441
Retirement — — — — — — —
Death or disability — — 1,872,950 — — — 1,872,950
Kenneth Mahaffey Termination with cause orvoluntary resignation withoutgood reason — — — — — — —
Involuntary terminationwithout cause or voluntaryresignation for good reasonin connection with change ofcontrol 650,000 487,500 1,661,322 112,021 15,000 — 2,925,843
Involuntary terminationwithout cause 325,000 243,750 — 56,011 15,000 — 639,761
Retirement — — — — — — —
Death or disability — — 1,712,354 — — — 1,712,354
Douglas Richards Termination with cause orvoluntary resignation withoutgood reason — — — — — — —
Involuntary terminationwithout cause or voluntaryresignation for good reasonin connection with change ofcontrol 740,000 592,000 1,849,592 59,665 15,000 — 3,256,257
Involuntary terminationwithout cause 370,000 296,000 — 29,832 15,000 — 710,832
Retirement — — — — — — —
Death or disability — — 1,903,629 — — — 1,903,629
56

Name Termination Scenario
ContinuedSalary
($)
Bonus andAcceleratedNon-Equity
IncentivePlan Awards
($)
AcceleratedRestricted
Stock Units($)(1)(2)
ContinuedMedicalBenefits
andGross Up
($)
Outplace-ment
Services ($)
AccruedPaid Time
Off andSabbatical
($)Total
($)
Jeffrey Waters Termination with cause orvoluntary resignation withoutgood reason — — — — — — —
Involuntary terminationwithout cause or voluntaryresignation for good reasonin connection with change ofcontrol 1,200,000 1,500,000 5,458,908 99,335 15,000 — 8,273,263
Voluntary resignation forlimited good reason not inconnection with change ofcontrol 1,200,000 1,500,000 5,458,908 99,335 15,000 — 8,273,263
Involuntary terminationwithout cause not inconnection with change ofcontrol 600,000 750,000 — 49,677 15,000 — 1,414,677
Retirement — — — — — — —
Death or disability — — 5,458,908 — — — 5,458,908
(1) In connection with a change of control, accelerated restricted stock units’ calculation assumes that the change of control does not involveTotal or one of its affiliates.
(2) Awards under the SunPower Corporation 2015 Omnibus Incentive Plan provide for accelerated vesting upon death or disability.
Employment and Severance Agreements
We have entered into employment agreements with certain of our executive officers, including our named
executive officers. In April 2019, we adopted a severance policy entitled the 2019 Management Career Transition
Plan, which replaced our 2016 Management Career Transition Plan. Additionally, our named executive officers are
entitled to receive certain payments from us or our affiliates in the event of certain termination events in connection
with a change of control.
Employment Agreements. We are party to employment agreements with several executive officers, including
the named executive officers. Each employment agreement provides that the executive’s employment is ‘‘at-will’’ and
may be terminated at any time by either party. Each employment agreement generally provides for a three-year term
that will automatically renew unless we provide notice of our intent not to renew at least 120 days before the renewal
date. The agreements do not specify salary, bonus, or other basic compensation terms, but instead provide that each
executive’s base salary, annual bonus, and equity compensation will be determined in accordance with our normal
practices. The primary purpose of the agreements is to provide certain severance benefits for employment
terminations in connection with a change of control (as defined in the agreement). In the event an executive’s
employment is terminated by us without cause (as defined in the agreement), or if the executive resigns for good
reason (as defined in the agreement), and if such termination or resignation occurs during the period three months
prior to, and ending 24 months following, a change of control, then the agreements also provide that the executive
is entitled to the following benefits:
• a lump-sum payment equivalent to 24 months of such executive’s base salary;
• a lump-sum payment equal to any earned but unpaid annual bonus for a completed fiscal year;
• a lump-sum payment equal to the product of (a) such executive’s target bonus for the then current fiscal
year, multiplied by (b) two;
• continuation of such executive’s and such executive’s eligible dependents’ coverage under our benefit plans
for up to 24 months, at our expense;
• a lump-sum payment equal to such executive’s accrued and unpaid base salary and paid time off;
• reimbursement of up to $15,000 for services of an outplacement firm mutually acceptable to us and the
executive;
• annual make-up payments for taxes incurred by the executive in connection with benefit plans’ coverage;
and
57

• all of such executive’s unvested options, shares of restricted stock and restricted stock units (including
performance-based restricted stock units) will become fully vested and (as applicable) exercisable as of the
termination date and remain exercisable for the time period otherwise applicable to such equity awards
following such termination date. In addition, (i) Mr. Werner’s agreement provides for full accelerated
vesting upon termination of employment without cause or resignation for good reason, regardless of
whether such termination is in connection with a change of control; provided, however, that absent a change
of control, no such accelerated vesting or lapsing shall apply to Mr. Werner’s performance-based equity
awards; and (ii) Mr. Waters’s agreement provided for full accelerated vesting upon termination of
employment without cause, or resignation for ‘‘limited good reason (as defined below), in each case prior
to January 1, 2020, regardless of whether such termination was in connection with a change of control, but
such provisions have now expired and are of no further effect.
Under the employment agreements, ‘‘cause’’ means the occurrence of any of the following, as determined by
us in good faith:
• acts or omissions constituting gross negligence or willful misconduct on the part of the executive with
respect to the executive’s obligations or otherwise relating to our business,
• the executive’s conviction of, or plea of guilty or nolo contendere to, crimes involving fraud,
misappropriation or embezzlement, or a felony crime of moral turpitude,
• the executive’s violation or breach of any fiduciary duty (whether or not involving personal profit) to us,
except to the extent that his violation or breach was reasonably based on the advice of our outside counsel,
or willful violation of any of our published policies governing the conduct of it executives or other
employees, or
• the executive’s violation or breach of any contractual duty to us which duty is material to the performance
of the executive’s duties or results in material damage to us or our business;
provided that if any of the foregoing events is capable of being cured, we will provide notice to the executive
describing the nature of such event and the executive will thereafter have 30 days to cure such event.
In addition, under the employment agreements, ‘‘good reason’’ means the occurrence of any of the following
without the executive’s express prior written consent:
• a material reduction in the executive’s position or duties,
• a material breach of the employment agreement,
• a material reduction in the executive’s aggregate target compensation, including the executive’s base salary
and target bonus on a combined basis, excluding a reduction that is applied to substantially all of our other
senior executives; provided, however, that for purposes of this clause, whether a reduction in target bonus
has occurred shall be determined without any regard to any actual bonus payments made to the executive,
or
• a relocation of the executive’s primary place of business for the performance of his duties to us to a location
that is more than 45 miles from our current business location.
The executive shall be considered to have ‘‘good reason’’ under the employment agreement only if, no later than
90 days following an event otherwise constituting ‘‘good reason’’ under the employment agreement, the executive
gives notice to us of the occurrence of such event and we fail to cure the event within 30 days following its receipt
of such notice from the executive, and the executive terminates service within 36 months following a change of
control.
If any of the severance payments, accelerated vesting and lapsing of restrictions would constitute a ‘‘parachute
payment’’ within the meaning of Section 280G of the Code and be subject to excise tax or any interest or penalties
payable with respect to such excise tax, then the executive’s benefits will be either delivered in full or delivered as
to such lesser extent which would result in no portion of such benefits being subject to such taxes, interest or
penalties, whichever results in the executive receiving, on an after-tax basis, the greatest amount of benefits.
58

Before receiving the benefits described in the employment agreements, the executive will be required to sign a
separation agreement and release of claims. In addition, the benefits will be conditioned upon the executive not
soliciting our or our affiliates’ (as defined in the employment agreement) employees, consultants, customers, or users
for one year following the termination date.
Mr. Werner’s agreement also provides that the above severance benefits will be paid even if his termination
without cause or resignation for good reason is not in connection with a change of control, conditioned upon a
non-competition arrangement lasting one year following employment termination.
Mr. Water’s agreement also provided that the above severance benefits would be paid in the event of his
termination without cause or resignation for limited good reason, in either event prior to January 1, 2020. For
purposes of Mr. Waters’ employment agreement only, ‘‘limited good reason’’ means an election by the Board not to
proceed with the Spin-Off or a similar transaction resulting in a stand-alone SunPower Technologies company prior
to January 1, 2020, and failure to offer Mr. Waters the position of CEO of SunPower Corporation in such event. Such
provisions have now expired and are of no further effect.
2019 Management Career Transition Plan. In April 2019, we adopted the 2019 Management Career Transition Plan,
(the ‘‘Severance Plan’’), which replaced our 2016 Management Career Transition Plan. The Severance Plan generally
terminates on the second anniversary of the effective date. The Severance Plan addresses severance for certain employment
terminations, and payments are only made if the executive or employee is not already entitled to severance benefits under
a separate employment agreement. Participants in the Severance Plan include our chief executive officer, Thomas Werner,
and those employees who have been employed by the Company for at least six months and report directly to him (including
our other named executive officers), as well as other key employees of the Company who are provided with written notice
from the chief executive officer that they are Severance Plan participants. Under the terms of the Severance Plan,
Mr. Werner and the other named executive officers will be eligible for benefits following a termination of employment by
us without cause (as defined in the Severance Plan). Such benefits include:
• a lump-sum payment equivalent to 12 months (or 24 months in Mr. Werner’s case) of such executive’s base
salary;
• a lump-sum payment equal to any earned but unpaid annual bonus for a completed fiscal year;
• a lump-sum payment equal to the pro rata portion of such executive’s actual bonus for the then current
fiscal year, based on the number of whole calendar months between the start of the fiscal year and the
termination date;
• reimbursement of such executive’s and such executive’s eligible dependents’ monthly premiums for
continuation coverage under the Consolidated Omnibus Reconciliation Act or applicable similar state law,
to the extent elected, for up to 12 months (or 24 months in Mr. Werner’s case);
• a lump-sum payment equal to such executive’s accrued and unpaid base salary and paid time off; and
• reimbursement of up to $15,000 for services of an outplacement firm mutually acceptable to the Company
and the executive.
CEO Pay Ratio
Pursuant to Section 953(b) of the Dodd-Frank Wall Street Reform and Consumer Protection Act, and
Item 402(u) of Regulation S-K, we are required to provide the following information about the relationship of the
annual total compensation of Thomas Werner, our chief executive officer (the ‘‘CEO’’), to the median of the annual
total compensation of all of our employees, excluding Mr. Werner:
For fiscal 2019, our last completed fiscal year:
• we have estimated the median of the annual total compensation of all our employees, excluding Mr. Werner,
to be $14,528; and
• Mr. Werner’s annual total compensation, for purposes of determining the CEO Pay Ratio, was $2,972,483.
Based on this information, for fiscal 2019, the ratio of the annual total compensation of Mr. Werner, our CEO,
to the median of the annual total compensation of all our employees, excluding Mr. Werner, was estimated to be
205:1. This pay ratio is a reasonable estimate calculated in a manner consistent with SEC rules based on our
59

payroll and employment records and the methodology and assumptions described below. Our pay ratio is not an
element that the Compensation Committee considers in setting the compensation of our CEO, nor is our CEO’s
compensation a material element that management considers in making compensation decisions for non-officer
employees.
Item 402(u) of Regulation S-K requires companies to identify the median employee only once every three years.
We identified the median employee in 2018, and we believe that changes in our employee population or employee
compensation arrangements since we identified the median employee do not result in a significant change to our pay
ratio disclosure. The employee population decreased 5% during such time period with no significant change to
employee compensation arrangements, and the percentage of U.S. employees of the total global workforce did not
materially change.
The ‘‘median employee’’ is a full-time, hourly employee located in Mexico. We totaled all of the elements of
the employee’s compensation for fiscal 2019 in accordance with the requirements of the applicable SEC rules and
converted the amounts from Mexican Pesos to U.S. dollars using the relevant monthly average currency exchange
rate of 18.8285 Mexican Pesos per U.S. dollar. This resulted in an annual total compensation of $14,528, of which
$8,905 is base salary and $5,623 is composed of bonus and other compensation such as overtime pay and other cash
allowances.
With respect to the annual total compensation of our chief executive officer, we took the amount reported in the
‘‘Total’’ column of our 2019 Summary Compensation Table.
Because the SEC rules for identifying the median of the annual total compensation of our employees and
calculating the pay ratio based on that employee’s annual total compensation allow companies to adopt a variety of
methodologies, to apply certain exclusions, and to make reasonable estimates and assumptions that reflect their
employee populations and compensation practices, the pay ratio reported by other companies may not be comparable
to the pay ratio for our company, as other companies have headquarters offices in different countries, have different
employee populations and compensation practices and may utilize different methodologies, exclusions, estimates,
and assumptions in calculating their pay ratios.
60

SECURITY OWNERSHIP OF MANAGEMENT AND CERTAIN BENEFICIAL OWNERS
The following table sets forth certain information regarding beneficial ownership of our common stock as of
March 19, 2020 (except as described below) by:
• each of our directors;
• our named executive officers;
• our directors, director nominees, and executive officers as a group; and
• each person (including any ‘‘group’’ as that term is used in Section 13(d)(3) of the Exchange Act) who is
known by us to beneficially own more than 5% of any class of our common stock.
Applicable beneficial ownership percentages listed below are based on 169,754,988 shares of common stock
outstanding as of March 19, 2020. The business address for each of our directors and executive officers is our
corporate headquarters at 51 Rio Robles, San Jose, California 95134.
Common Stock Beneficially Owned(1)
Directors and Named Executive Officers Number of Shares %
François Badoual — —
Catherine Lesjak 142,433 *
Kenneth Mahaffey 75,973 *
Thomas McDaniel(2) 252,191 *
Julien Pouget — —
Thomas Rebeyrol — —
Douglas Richards 69,262 *
Manavendra Sial(3) 82,741 *
Denis Toulouse — —
Franck Trochet — —
Jeffrey Waters 105,818 *
Thomas Werner(4) 981,349 *
Patrick Wood III 151,200 *
All Directors and Executive Officers as a Group (14 persons)(5) 1,889,641 1.11%
Other Persons
Total S.A.
Total Gaz Electricité Holdings France SAS
Total Solar INTL SAS(6)
2 place Jean Millier
La Défense 6
92400 Courbevoie
France 92,167,073 52.07%
The Vanguard Group(7)
100 Vanguard Blvd.
Malvern, PA 19355 10,759,225 6.34%
Wellington Management Group LLP(8)
280 Congress Street
Boston, MA 02210 12,413,023 7.31%
* Less than 1%.
(1) Beneficial ownership is determined in accordance with the rules of the SEC and generally includes voting or investment power with respect
to the securities. In computing the number of shares beneficially owned by a person and the percentage ownership of that person, shares
underlying restricted stock units and options held by that person that will vest or be exercisable within 60 days of March 19, 2020 are
deemed to be outstanding. Such shares, however, are not deemed to be outstanding for the purpose of computing the percentage ownership
of any other person.
61

(2) Includes 252,075 shares of common stock held indirectly in the McDaniel Trust dtd 7/26/2000, of which Mr. McDaniel and his spouse are
co-trustees.
(3) Includes 25,000 restricted stock units vesting within 60 days of March 19, 2020.
(4) Includes 152,500 restricted stock units and 210,120 performance-based restricted stock units vesting within 60 days of March 19, 2020, and
1,218 shares of common stock held by The Werner Family Trust (‘‘WF Trust’’), of which Mr. Werner and his wife are co-trustees. The
beneficiaries are the surviving spouse between Thomas Werner and Suzanne Werner, to be followed by Jessica Werner and Katheryn Werner.
Thomas and Suzanne Werner have been delegated joint control and voting power over the WF Trust.
(5) Includes 28,674 shares of common stock beneficially owned by an additional executive officer.
(6) Based on the information contained in an Amendment No. 14 to Schedule 13D filed with the SEC on March 20, 2020 by Total S.A. Total
Solar INTL SAS is an indirect wholly owned subsidiary of Total Gaz Electricité Holdings France SAS, which is an indirect wholly owned
subsidiary of Total S.A. Each of Total S.A., Total Gaz Electricité Holdings France SAS and Total Solar INTL SAS have shared voting and
dispositive power over 92,167,073 shares of our common stock.
(7) Based on the information contained in a Schedule 13G filed with the SEC on February 11, 2020 by The Vanguard Group. The Vanguard
Group has sole voting power over 65,916 shares of our common stock, shared voting power over 5,746 shares of our common stock, sole
dispositive power over 10,696,823 shares of our common stock and shared dispositive power over 62,402 shares of our common stock.
Vanguard Fiduciary Trust Company (‘‘VFTC’’), a wholly owned subsidiary of The Vanguard Group, Inc., is the beneficial owner of 56,656
shares of our common stock as a result of its serving as investment manager of collective trust accounts. Vanguard Investments Australia,
Ltd. (‘‘VIA’’), a wholly owned subsidiary of The Vanguard Group, Inc., is the beneficial owner of 15,006 shares of our common stock as
a result of its serving as investment manager of Australian investment offerings.
(8) Based on the information contained in a Schedule 13G filed with the SEC on January 28, 2020 by Wellington Management Group LLP,
Wellington Group Holdings LLP, Wellington Investment Advisors Holdings LLP, and Wellington Management Company LLP. Wellington
Management Group LLP, Wellington Group Holdings LLP, and Wellington Investment Advisors Holdings LLP have shared voting power
over 11,142,621 shares of our common stock and has shared dispositive power over 12,413,023 shares of our common stock. Wellington
Management Company LLP has shared voting power of 10,657,268 shares of our common stock and shared dispositive power of 11,390,517
shares of our common stock. Wellington Management Group LLP is the parent holding company of certain holding companies and the
Wellington Investment Advisers. The securities reported on the Schedule 13G are owned of record by clients of the Wellington Investment
Advisers. Wellington Investment Advisors Holdings LLP controls directly, or indirectly through Wellington Management Global Holdings,
Ltd., the Wellington Investment Advisers. Wellington Investment Advisors Holdings LLP is owned by Wellington Group Holdings LLP.
Wellington Group Holdings LLP is owned by Wellington Management Group LLP.
Delinquent Section 16(a) Reports
Section 16(a) of the Exchange Act requires certain of our executive officers and our directors, and persons who
own more than 10% of a registered class of our equity securities, to file an initial report of ownership on Form 3 and
reports of changes in ownership on Forms 4 or 5 with the SEC and The Nasdaq Global Select Market. Such executive
officers, directors, and greater than 10% stockholders are also required by SEC regulations to furnish us with copies
of all Section 16 forms that they file. We periodically remind our directors and executive officers of their reporting
obligations and assist in making the required disclosures once we have been notified that a reportable event has
occurred. We are required to report in this proxy statement any failure by any of the above-mentioned persons to
make timely Section 16 reports.
Based solely on our review of the copies of such forms received by us, and written representations from our
directors and executive officers, we are unaware of any instances of noncompliance, or late compliance, with
Section 16(a) filing requirements by our directors, executive officers, or greater than 10% stockholders during fiscal
2019, except as follows: (i) the Form 4 filing for Catherine Lesjak’s acquisition of 12,909 restricted stock units on
February 11, 2019 and immediate conversion of such restricted stock units to shares of common stock was made on
February 14, 2019, and (ii) the Form 4 filing for the conversion of 12,500 restricted stock units held by Kenneth
Mahaffey to shares of common stock on November 1, 2019 and subsequent disposition of a portion of such shares
as payment of tax liability was made on November 6, 2019.
62

COMPANY STOCK PRICE PERFORMANCE
The following graph compares the performance of an investment in our common stock from December 26,2014 through December 27, 2019, with the Nasdaq Composite index and with the Guggenheim Solar ETF. Thegraph assumes $100 was invested on December 26, 2014 in our common stock at the closing price of $26.32per share, at the closing price for the Nasdaq Composite and at the closing price for the Guggenheim Solar ETF.In addition, the graph assumes that any dividends were reinvested on the date of payment without payment ofany commissions. The performance shown in the graph represents past performance and should not beconsidered an indication of future performance. The following graph is not, and shall not be deemed to be, filedas part of our Annual Report on Form 10-K. Such graph should not be deemed filed or incorporated by referenceinto any of our filings under the Securities Act of 1933, or the Exchange Act, except to the extent specificallyincorporated by reference therein by us.
ASSUMES $100 INVESTED ON DECEMBER 26, 2014(ASSUMES DIVIDEND REINVESTED)
UNTIL FISCAL YEAR ENDED DECEMBER 29, 2019
December 31, 2015 December 30, 2016 December 29, 2017 December 28, 2018 December 27, 2019
SunPower Corporation 114.02 25.11 32.03 19.22 30.28
Nasdaq Composite 104.17 111.99 143.62 136.98 187.37
Guggenheim Solar ETF 90.17 51.18 77.63 57.36 95.36
63

EQUITY COMPENSATION PLAN INFORMATION
The following table provides certain information as of December 29, 2019 with respect to our equity compensation
plans under which our equity securities are authorized for issuance (in thousands, except dollar figures).
Plan Category
Number ofsecurities
to be issuedupon
exercise ofoutstanding
options,warrants
and rights
Weightedaverageexerciseprice of
outstandingoptions,
warrantsand rights
Number of securitiesremaining availablefor future issuance
under equitycompensation plans(excluding securitiesreflected in the first
column)
Equity compensation plans approved by security holders. . — — 12,117
Total(1) — — 12,117
(1) As of December 29, 2019, no options remained outstanding under our equity incentive plans. Under the terms of our equity incentive plans,
we may issue incentive or non-statutory stock options, restricted stock awards, restricted stock units, or stock purchase rights to directors,
employees, and consultants to purchase common stock. The SunPower Corporation 2015 Omnibus Incentive Plan includes an automatic
share reserve increase feature effective for fiscal 2016 through fiscal 2025. This share reserve increase feature will cause an annual and
automatic increase in the number of shares of our common stock reserved for issuance under the Stock Incentive Plan in an amount each
year equal to the least of: 3% of the outstanding shares of our common stock measured on the last day of the immediately preceding fiscal
year; 6,000,000 shares; and such other number of shares as determined by the Board. On December 30, 2019 the share reserve increase
feature caused an automatic increase of 5,043,640 (3% of outstanding common stock) shares for fiscal 2020.
64

PROPOSAL THREE
RATIFICATION OF THE APPOINTMENT OFINDEPENDENT REGISTERED PUBLIC ACCOUNTING FIRM FOR FISCAL YEAR 2020
The Board, upon recommendation of the Audit Committee, has reappointed the firm of Ernst & Young LLP as
our independent registered public accounting firm for the fiscal year ending January 3, 2021, subject to ratification
by our stockholders.
Ernst & Young LLP has served as our auditor since May 3, 2012. A representative of Ernst & Young LLP is
expected to be present at the Annual Meeting and will have an opportunity to make a statement if he or she desires
to do so, and is expected to be available to respond to appropriate questions.
Stockholder ratification of the selection of Ernst & Young LLP as our independent registered public accounting
firm is not required by our By-Laws or other applicable legal requirements. However, the Board is submitting the
selection of Ernst & Young LLP to the stockholders for ratification as a matter of good corporate governance.
If the stockholders fail to ratify the selection of our independent registered accounting firm, the Audit Committee
and the Board will reconsider whether or not to retain that firm. Even if the selection is ratified, the Board, at its
discretion, may direct the appointment of a different independent registered public accounting firm at any time during
the year if it determines that such a change would be in our and our stockholders’ best interests.
Ernst & Young LLP
Ernst & Young LLP fees incurred by us for fiscal 2018 and 2019 were as follows:
Services2018($)
2019($)
Audit Fees 5,859,755 5,024,093
Audit-Related Fees 137,420 3,178,737
Tax Fees 1,440,168 2,346,879
All Other Fees 11,200 10,955
Total 7,448,544 10,560,664
• Audit Fees: Audit fees for fiscal 2018 and 2019 were for professional services rendered in connection with
audits of our consolidated financial statements, statutory audits of our subsidiary companies, quarterly
reviews, and assistance with documents that we filed with the SEC (including our Forms 10-Q and 8-K)
for periods covering fiscal 2018 and 2019.
• Audit-Related Fees: Audit-related fees for 2018 and 2019 were for professional services rendered in
connection with consultations with management on various accounting matters, including audit of financial
statements of a carve-out entity and sell-side due diligence with respect to our previously announced
Spin-Off.
• Tax Fees: Tax fees for 2018 and 2019 were for tax compliance and consulting services.
• All Other Fees: Other fees in 2018 and 2019 were for access to technical accounting services.
Audit Committee Pre-Approval
As required by Section 10A(i)(1) of the Exchange Act, our Audit Committee has adopted a pre-approval policy
requiring that the Audit Committee pre-approve all audit and permissible non-audit services to be performed by our
independent registered public accounting firm. Any proposed service that has received pre-approval but which will
exceed pre-approved cost limits will require additional pre-approval by the Audit Committee. In addition, pursuant
to Section 10A(i)(3) of the Exchange Act, the Audit Committee has established procedures by which the Audit
Committee may from time to time delegate pre-approval authority to the Chairman of the Audit Committee. If the
Chairman exercises this authority, he must report any pre-approval decisions to the full Audit Committee at its next
meeting. The independent registered public accounting firm and our management are required to periodically report
to the Audit Committee regarding the extent of services provided by the independent registered public accounting
firm in accordance with the committee’s pre-approval, and the fees for the services performed to date.
65

During fiscal 2018 and 2019, all services provided to us by Ernst & Young LLP were pre-approved by the Audit
Committee in accordance with the pre-approval policy described above. The scope and services were reviewed and
approved by the Audit Committee before the services were rendered. Ernst & Young LLP and our Audit Committee
have each concluded that Ernst & Young LLP’s objectivity and ability to exercise impartial judgment on all issues
encompassed with the audit engagement has not been impaired because (i) the services did not include prohibited
non-audit related services and (ii) the fees we paid were insignificant both to Ernst & Young LLP and to SunPower.
Vote Required
The ratification of the appointment of Ernst & Young LLP as our independent registered public accounting firm
for fiscal year 2020 requires the affirmative vote of the holders of a majority of our stock having voting power and
in attendance or represented by proxy at the Annual Meeting. We do not expect ‘‘broker non-votes’’ on this proposal
since this proposal is considered to be a routine proposal and brokers have discretionary authority to vote on this
proposal. Abstentions will have the effect of votes against this proposal.
66

APPENDIX A
Use of Non-GAAP Financial Measures
Adjustments Based on International Financial Reporting Standards (‘‘IFRS’’)
The Company’s non-GAAP results include adjustments under IFRS that are consistent with the adjustments
made in connection with the Company’s internal reporting process as part of its status as a consolidated subsidiary
of Total S.A., our controlling shareholder and a foreign public registrant that reports under IFRS. Differences between
GAAP and IFRS reflected in the Company’s non-GAAP results are further described below. In these situations,
management believes that IFRS enables investors to better evaluate the Company’s performance, and assists in
aligning the perspectives of the management with those of Total S.A.
• 8point3: Historically, the Company included adjustments related to the sales of projects contributed to
8point3 Group, an equity method investee (‘‘8point3’’) based on the difference between the fair market
value of the consideration received and the net carrying value of the projects contributed, of which, a
portion is deferred in proportion to the Company’s retained equity stake in 8point3. The deferred profit was
subsequently recognized over time. Under GAAP, these sales were recognized under either real estate,
lease, or consolidation accounting guidance depending upon the nature of the individual asset contributed,
with outcomes ranging from no, partial, or full profit recognition. IFRS profit, less deferrals associated with
retained equity, is recognized for sales related to the residential lease portfolio. Revenue for other projects
sold was deferred until those projects reach commercial operation. On June 19, 2018, the Company sold
its equity interest in the 8point3 Group.
• Legacy utility and power plant projects: The Company included adjustments related to the revenue
recognition of certain utility and power plant projects based on percentage-of-completion accounting and,
when relevant, the allocation of revenue and margin to our project development efforts at the time of initial
project sale. Under IFRS, such projects were accounted for when the customer obtains control of the
promised goods or services which generally results in earlier recognition of revenue and profit than U.S.
GAAP. Over the life of each project, cumulative revenue and gross margin are eventually equivalent under
both GAAP and IFRS; however, revenue and gross margin is generally recognized earlier under IFRS.
• Legacy sale-leaseback transactions: The Company included adjustments related to the revenue recognition
on certain legacy sale-leaseback transactions entered into before December 31, 2018, based on the net
proceeds received from the buyer-lessor. Under U.S. GAAP, these transactions were accounted for under
the financing method in accordance with the applicable accounting guidance. Under such guidance, no
revenue or profit is recognized at the inception of the transaction, and the net proceeds from the
buyer-lessor are recorded as a financing liability. Imputed interest is recorded on the liability equal to our
incremental borrowing rate adjusted solely to prevent negative amortization. Under IFRS, such revenue and
profit is recognized at the time of sale to the buyer-lessor if certain criteria are met. Upon adoption of IFRS
16, Leases, on December 31, 2018, IFRS is aligned with GAAP.
• Mark-to-market (gain) loss in equity investments: The Company recognizes adjustments related to the fair
value of equity investments with readily determinable fair value based on the changes in the stock price of
these equity investments at every reporting period. Under GAAP, mark-to-market gains and losses due to
changes in stock prices for these securities are recorded in earnings while under IFRS, an election can be
made to recognize such gains and losses in other comprehensive income. Such an election was made by
Total S.A. Further, we elected the Fair Value Option (‘‘FVO’’) for some of our equity method investments,
and we adjust the carrying value of those investments based on their fair market value calculated
periodically. Such option is not available under IFRS, and equity method accounting is required for such
investments. Management believes that excluding these adjustments on equity investments is consistent
with our internal reporting process as part of its status as a consolidated subsidiary of Total S.A. and better
reflects our ongoing results.
A-1

Other Non-GAAP Adjustments
• Business process improvement costs: During fiscal 2019, the Company initiated a project to improve its
manufacturing and related processes to improve gross margin in coming years and engaged third party
experts to consult on business process improvements. Management believes it is appropriate to exclude
these consulting expenses from our non-GAAP results as they are non-recurring in nature, and are not
reflective of the Company’s ongoing operating results.
• Loss (gain) on sale and impairment of residential lease assets: In the fourth quarter of fiscal 2017, the
Company made the decision to sell or refinance its interest in the residential lease portfolio and as a result
of this triggering event, determined it was necessary to evaluate the potential for impairment in its ability
to recover the carrying amount of the residential lease portfolio. In accordance with such evaluation, the
Company recognized a non-cash impairment charge on its solar power systems leased and to be leased and
an allowance for losses related financing receivables. In connection with the impairment loss, the carrying
values of the Company’s solar power systems leased and to be leased were reduced which resulted in lower
depreciation charges. In the fourth quarter of fiscal 2018, the Company sold membership units representing
a 49% membership interest in its residential lease business and retained a 51% membership interest. The
loss on divestment and the remaining unsold residential lease assets impairment with its corresponding
depreciation savings are excluded from the Company’s non-GAAP results as they are non-cash in nature
and not reflective of ongoing operating results. Additionally, in the third quarter of fiscal 2019, in
continuation with our intention to deconsolidate all the residential lease assets owned by us, we sold the
remainder of residential lease assets still owned by us, that were not previously sold. Gain/loss from such
activity is excluded from the Company’s non-GAAP results as it is non-cash in nature and not reflective
of ongoing operating results.
• Impairment of property, plant, and equipment: The Company evaluates property, plant and equipment for
impairment whenever certain triggering events or changes in circumstances arise. This evaluation includes
consideration of technology obsolescence that may indicate that the carrying value of such assets may not
be recoverable. In accordance with such evaluation, the Company recognizes a non-cash impairment charge
when the asset group’s fair value is lower than its carrying value. Such impairment charge is excluded from
the Company’s non-GAAP results as it is non-recurring in nature and not reflective of ongoing operating
results. Any such non-recurring impairment charge recorded by our equity method or other unconsolidated
investees is also excluded from our non-GAAP results as it is not reflective of their ongoing operating
results.
• Construction revenue on solar services contracts: Upon adoption of the new lease accounting guidance
(‘‘ASC 842’’) in the first quarter of fiscal 2019, revenue and cost of revenue on solar services contracts with
residential customers are recognized ratably over the term of those contracts, once the projects are placed
in service. For non-GAAP results, the Company recognizes revenue and cost of revenue upfront based on
the expected cash proceeds to align with the legacy lease accounting guidance. Management believes it is
appropriate to recognize revenue and cost of revenue upfront based on total expected cash proceeds, as it
better reflects the Company’s ongoing results as such method aligns revenue and costs incurred most
accurately in the same period.
• Cost of above-market polysilicon: The Company has entered into multiple long-term, fixed-price supply
agreements to purchase polysilicon for periods of up to 10 years. The prices in select legacy supply
agreements, which incorporate a cash portion and a non-cash portion attributable to the amortization of
prepayments made under the agreements, significantly exceed current market prices. Additionally, in order
to reduce inventory and improve working capital, the Company has periodically elected to sell polysilicon
inventory in the marketplace at prices below the Company’s purchase price, thereby incurring a loss.
Management believes that it is appropriate to exclude the impact of its above-market cost of polysilicon,
including the effect of above-market polysilicon on product costs, losses incurred on sales of polysilicon
to third parties, and inventory reserves and project asset impairments from the Company’s non-GAAP
results as they are not reflective of ongoing operating results.
A-2

• Stock-based compensation: Stock-based compensation relates primarily to the Company’s equity incentive
awards. Stock-based compensation is a non-cash expense that is dependent on market forces that are
difficult to predict. Management believes that this adjustment for stock-based compensation provides
investors with a basis to measure the Company’s core performance, including compared with the
performance of other companies, without the period-to-period variability created by stock-based
compensation.
• Amortization of intangible assets: The Company incurs amortization of intangible assets as a result of
acquisitions, which includes patents, purchased technology, project pipeline assets, and in-process research
and development. Management believes that it is appropriate to exclude these amortization charges from
the Company’s non-GAAP financial measures as they arise from prior acquisitions, which are not reflective
of ongoing operating results.
• Depreciation of idle equipment: In the fourth quarter of 2017, the Company changed the deployment plan
for its next generation of solar cell technology, and revised its depreciation estimates to reflect the use of
certain assets over its shortened useful life. Such asset depreciation is excluded from the Company’s
non-GAAP results as it is non-cash in nature and not reflective of ongoing operating results.
• Gain on business divestiture: In the second quarter of fiscal 2019, the Company entered into a transaction
pursuant to which it sold membership interest in certain of its subsidiaries that own leasehold interests in
projects subject to sale-leaseback financing arrangements. In connection with this sale, the Company
recognized a gain relating to this business divestiture. In the third quarter of fiscal 2018, the Company
entered into a transaction pursuant to which the Company sold certain assets and intellectual property
related to the production of microinverters for purchase consideration comprised of both cash and stock.
In connection with this sale, the Company recognized a gain relating to this business divestiture.
Management believes that it is appropriate to exclude both of these gains from the Company’s non-GAAP
results as it is not reflective of ongoing operating results.
• Litigation: The Company may be involved in various litigations, claims and proceedings that result in
payments or recoveries from such proceedings. The Company excludes any gains or losses on such
litigation recoveries or payments from the non-GAAP results as it is not reflective of ongoing operating
results.
• Transaction-related costs: In connection with material non-recurring transactions such as acquisition or
divestiture of a business, the Company incurred transaction costs including legal and accounting fees.
Management believes that it is appropriate to exclude these costs from the Company’s non-GAAP results
as it is not reflective of ongoing operating results.
• Business reorganization costs: In connection with the reorganization of our business into an upstream and
downstream, and subsequent announcement of the separation transaction to separate the Company into two
independent, and publicly traded companies, we incurred and expect to continue to incur in upcoming
quarters, non-recurring charges on third-party legal and consulting expenses to close the separation
transaction. The Company believes that it is appropriate to exclude these from Company’s non-GAAP
results as it is not reflective of ongoing operating results.
• Non-cash interest expense: The Company incurs non-cash interest expense related to the amortization of
items such as original issuance discounts on its debt. The Company excludes non-cash interest expense
because the expense does not reflect its financial results in the period incurred. Management believes that
this adjustment for non-cash interest expense provides investors with a basis to evaluate the Company’s
performance, including compared with the performance of other companies, without non-cash interest
expense.
• Restructuring charges: The Company incurs restructuring expenses related to reorganization plans aimed
towards realigning resources consistent with the Company’s global strategy and improving its overall
operating efficiency and cost structure. Although the Company has engaged in restructuring activities in the
past, each has been a discrete event based on a unique set of business objectives. The Company believes
that it is appropriate to exclude these from Company’s non-GAAP results as it is not reflective of ongoing
operating results.
A-3

• Tax effect: This amount is used to present each of the adjustments described above on an after-tax basis in
connection with the presentation of non-GAAP net income (loss) and non-GAAP net income (loss) per
diluted share. The Company’s non-GAAP tax amount is based on estimated cash tax expense and reserves.
The Company forecasts its annual cash tax liability and allocates the tax to each quarter in a manner
generally consistent with its GAAP methodology. This approach is designed to enhance investors’ ability
to understand the impact of the Company’s tax expense on its current operations, provide improved
modeling accuracy, and substantially reduce fluctuations caused by GAAP to non-GAAP adjustments,
which may not reflect actual cash tax expense.
• Adjusted EBITDA adjustments: When calculating Adjusted EBITDA, in addition to adjustments described
above, the Company excludes the impact of the following items during the period:
• Cash interest expense, net of interest income
• Provision for income taxes
• Depreciation
We use this non-GAAP financial measure to enable us to evaluate the Company’s performance, including
compared with the performance of other companies. For more information about these non-GAAP financial
measures, see the tables captioned ‘‘Reconciliations of GAAP Measures to Non-GAAP Measures’’ set forth in our
Form 8-K filed on February 14, 2020.
A-4

Changing the Way Our World is Powered
Finding the right solar doesn’t have to be complicated. As we
celebrate our 35th anniversary, SunPower continues to help
homeowners and businesses across the globe reduce their
monthly electricity bills with the most efficient, powerful and
reliable panels available—all backed by our industry-leading
25-year warranty. It’s solar made simple.
Headquartered in Silicon Valley, SunPower has a team of
dedicated, customer-focused employees in Africa, Asia, Australia,
Europe, North and South America. For more information about
how SunPower is changing the way our world is powered, visit
www.sunpower.com.
Executive OfficersThomas WernerPresident, Chief Executive Officer and Chairman of the Board
Manavendra SialExecutive Vice President and Chief Financial Officer
Kenneth MahaffeyExecutive Vice President and General Counsel
Douglas RichardsExecutive Vice President, Administration
Jeffrey WatersChief Executive Officer, SunPower Technologies
Vichheka HeangCorporate Controller and Principal Accounting Officer
Board of DirectorsThomas WernerChairman of the Board
François BadoualDirector
Catherine LesjakDirector
Thomas McDanielDirector
Julien PougetDirector
Thomas RebeyrolDirector
Denis ToulouseDirector
Franck TrochetDirector
Patrick Wood IIIDirector

Corporate HeadquartersSunPower Corporation51 Rio Robles San Jose, California 95134408.240.5500
sunpower.com
©2020 SunPower Corporation. All Rights Reserved. SUNPOWER, the SUNPOWER logo, and all other trademarks cited herein are the property of SunPower Corporation in the U.S. and other countries as well.
Annual Report