annual report - whanganuiwanganui district council annual report for the year ended 30 june 2012...
TRANSCRIPT

Annual Report For the year ended 30 June 2012

Wanganui District Council Annual Report For the year ended 30 June 2012 101 Guyton Street Wanganui New Zealand

Wanganui District Council Annual Report for the year ended 30 June 2012
Page 3 of 170
Contents Page
Message from the Mayor 4-5
Organisational structure 6
Committee structure 7
Message from the Chief Executive 8-9
Statement of compliance and responsibility 10
Statement of comprehensive income 11
Statement of changes in equity 12
Statement of financial position 13
Statement of cash flows 14
Statement of accounting policies 15-26
Notes to the financial statements 27-59
Vision, mission and values 60-62
Our plans and our reporting 63-64
Groups of activities 65-67
Progress made towards the achievement of the community outcomes 68-108
Property and facilities group cost of service statement 109
Property and facilities group significant acquisitions or replacements of assets 110-111
Activity scorecards 112-119
Community and culture cost of service statement 120
Community and culture group significant acquisitions or replacements of assets 121
Community and culture group statements of service performance 122-129
Strategy and development cost of service statement 130
Strategy and development group significant acquisitions or replacements of assets 131
Strategy and development group statements of service performance 132-134
Transport cost of service statement 135
Transport group significant acquisitions or replacements of assets 136
Infrastructure group: transport statements of service performance 137-140
Water cost of service statement 141
Water group significant acquisitions or replacements of assets 142-143
Infrastructure group: water statements of service performance 144-147
Waste cost of service statement 148
Waste group significant acquisitions or replacements of assets 149
Infrastructure group: waste group statements of service performance 150-151
Corporate and governance cost of service statement 152
Corporate and governance group significant acquisitions or replacements of assets 153
Corporate and governance group statements of service performance 154-156
Customer services cost of service statement 157
Customer services group significant acquisitions or replacements of assets 158
Customer services group statements of service performance 159-162
Council Controlled Organisations 163-168
Equal employment opportunities report 169
Working with Maori 170
Audit Report

Wanganui District Council Annual Report for the year ended 30 June 2012
Page 4 of 170
101 Guyton Street P O Box 637, Wanganui 4500 Phone: (06) 349 0525 Fax: (06) 349 1653 Email: [email protected]
Annette Main Wanganui District Council A message from the Mayor: Annual Report 2011/12 The 2011/12 year was one of extremes for Wanganui as we faced some challenges, but also celebrated some wonderful events and projects. The development of our 10-Year Plan 2012-2022 was a testing time for this Council. Faced with the realities of mounting debt and tough economic times, we had to make some difficult decisions. The major focus is on paying off debt as well as looking after the facilities, assets and services we already have. The first priority will be to repay infrastructure debt, such as stormwater and roading. We have introduced a debt retirement rate and for 2012/13 the plan commits $641,000 to repay debt. Dealing with our earthquake-prone buildings will be a challenge in the coming years and we are allocating funding for this through an earthquake strengthening rate. This rate will provide $20M over the next 10 years to enable the necessary work on our public buildings. In acknowledgement of the financial constraints our community facing and our existing level of debt, our plan does not include additional spending on new projects. Earthquake-prone buildings will be an ongoing challenge for our community. During the year, we took steps to try to secure the future of the Sarjeant Gallery, which is one of those buildings. The Council agreed to continue to pursue external funding options for the Sarjeant Gallery development project which will protect the building and collection. An application has been made for government funding and further support will be sought from other organisations and individuals. This is a one-off opportunity to gain significant government funding and I look forward to a positive outcome. Two major events had Wanganui buzzing during the year. In September 2011, we hosted the USA Eagles for six days as the team prepared for Rugby World Cup 2011. The team was welcomed at a powhiri at Putiki Marae and then boarded waka for a journey on the Whanganui River to the central city. I was immensely proud to see thousands of people lining the banks of the Whanganui River to welcome the Eagles as they shared in our traditional welcome. It’s something the team will never forget and to see our community come together for this event was really moving. Paddling along in the waka and seeing the enjoyment and pride on people’s faces, as well as the response of the team, was something truly special. The visit by the USA Eagles gave us the opportunity to celebrate ourselves, our river and our way of life here in our district. The REAL Whanganui Festival, run in conjunction with the Rugby World Cup, was a celebration of Wanganui’s art and culture with more than 70 events over seven weeks. Even though Wanganui did not host a Rugby World Cup game, the event certainly gave us plenty to celebrate. The outstanding success of the VCC International Rally held in Wanganui in January 2012 was a credit both to the community and the rally organisers. Our community really got into the

Wanganui District Council Annual Report for the year ended 30 June 2012
Page 5 of 170
spirit of the rally, providing a warm welcome to our visitors, extending the hand of friendship, and making the most of the opportunity to take part in the public events. It was a joy to see the hundreds of vintage cars on our district’s roads and the smiles on everyone’s faces as they spotted the vehicles. The huge turnout for the rally open day at the racecourse was amazing – but equally amazing was the number of people who lined our streets when the cars did their farewell tour of the suburbs. We proved that Wanganui can host a major international event in style and I’m sure we will see the benefits of that in years to come. These are the events that put us on the map for all the right reasons and while we’re not likely to get another international rally of this size here again, I am sure we can continue our relationship with VCC and bring other events which build on our assets, here to Wanganui. In April 2012 I participated in a three-day hikoi, travelling by bicycle along the entire length of the Mountains to Sea (Nga Ara Tuhono) section of the National Cycle Trail (Nga Haerenga). The Mountains to Sea section was officially opened in July 2010 at Ohakune Old Coach Road and is a regional initiative involving Wanganui District Council, Ruapehu District Council, iwi, community groups and Department of Conservation (DoC). The ride traverses two iconic national parks with outstanding scenery and a rich cultural, historic and natural heritage, and also brings visitors to the urban area of Wanganui. As only parts of the Mountains to Sea had been officially opened, the hikoi allowed the cycle trail partners, iwi and the local communities to showcase their sections of track and the benefits to local businesses and the local and regional economy. I encourage everyone to experience at least part of this wonderful cycle trail if they are able. Wanganui continues to lead the way with the building of the ultrafast broadband network and I look forward to the opportunities this will bring when businesses and individuals start to connect to the network in late 2012. I remain confident that as a community we will work together to find solutions to the challenges ahead.
Annette Main Mayor of Wanganui

Wanganui District Council Annual Report for the year ended 30 June 2012
Page 6 of 170
Wanganui Rural Community Board Members Mayor & Councillors
Organisational structure as at 30 June 2012
Mayor Annette Main
Deputy Mayor Cr Rangi Wills
Chairman Mr Alan Taylor
Deputy Chair Mr Mark Lourie
Mr Bill Ashworth
Mr David Matthews
Cr Philippa Baker-Hogan
Cr Jack Bullock
Cr Randhir Dahya Cr Nicki Higgie
Cr Hamish McDouall Cr Clive Solomon Cr Ray Stevens
Cr Sue Westwood
Cr Michael Laws
Councillors Higgie and McDouall are appointed by the Council to the Wanganui Rural Community Board
Cr Allan Anderson
David Johnston
Cr Rob Vinsen
Mr Darrell Monk
Mr Andrew Collins

Wanganui District Council Annual Report for the year ended 30 June 2012
Page 7 of 170
Governance structure As at 30 June 2012 Council Presiding – Mayor Annette Main
Deputy Mayor – Cr Rangi Wills Committees Chair Deputy chair Strategy and Finance Cr Rob Vinsen Cr Sue Westwood Infrastructure and Property Cr Ray Stevens Cr Allan Anderson Community and Environment Cr Philippa Baker-Hogan Cr Rangi Wills Hearings and Regulatory Cr Sue Westwood Cr Nicki Higgie Youth Cr Jack Bullock (Co-deputy chairs)
Yth Crs Renee Harrison and Raphael Solomon
Joint Committee
Wanganui District Councils’ Forestry Joint Committee
Cr Nicki Higgie Cr Don Cameron (Ruapehu/South Taranaki Member)
Subcommittees, working parties etc
Chair
Tupoho working party Decided at each meeting Tamaupoko Link Mr Barney Haami 60th Anniversary of diplomatic relations between Japan and New Zealand
Cr Jack Bullock
Broadband working party Community Taskforce on Youth
Wellbeing (Co-chair) Cr Philippa Baker-Hogan
Discover Wanganui Cr Rob Vinsen District Plan Review working party Cr Sue Westwood Digital Leaders Impact Fund assessment committee Cr Rob Vinsen Waste Minimisation working party Cr Rob Vinsen Rural Community Board
Wanganui Rural Community Board Mr Alan Taylor Mr Mark Lourie

Wanganui District Council Annual Report for the year ended 30 June 2012
Page 8 of 170
Message from the Chief Executive During the year, we faced some significant challenges which have tested, and continue to test, our Council and community. However, we also achieved some ‘wins’ as we upgraded systems and capitalised on the improvements we have made to our infrastructure. One of the major issues facing our Council and community is the large number of earthquake-prone buildings in our district. The Council itself owns a number of these buildings and we have done a lot of work on obtaining detailed engineering reports and liaising with staff and occupants of the buildings to keep them informed of progress. We are continuing to work through a process of deciding how to deal with our earthquake-prone buildings and to this end the Council has introduced an earthquake strengthening rate in the 10-Year Plan 2012-2022. This rate will raise $20M over the 10 years of the plan for the purpose of strengthening work on our buildings. Private building owners are also required to deal with their earthquake-prone buildings and this will be a significant ongoing issue for our community. As a result of the earthquake-prone assessment of some of our own buildings, we have considered it prudent to recognise the potential impact of this in the financial statements. Accordingly, the financial accounts recognise a $13.3M provision for impairment of these buildings. On 3 March 2012, Wanganui was hit by a weather bomb which had a devastating impact on our district. Major damage to power lines meant we were unable to pump water from the Kai Iwi bores to our reservoirs at Westmere. Water restrictions were put in place and a huge effort over a number of days went into restoring the supply. The district’s forests and parks were hit hard by the weather bomb and the clean-up continued for some time. Private properties in the district also suffered significant damage but due to the amount of work required on our own assets, the Council was unable to help residents clear debris from their properties. During the year, Wanganui’s drinking water supply received an Aa grading from the Ministry of Health. This was a result of the work we have done to upgrade our water supply and introduce new water sources via the Westmere bores. The grading is a risk based assessment of the water supply and is a measure of confidence that the drinking water supply will not become contaminated. In October 2011, the Council was granted 15-year consents to discharge treated wastewater through the ocean outfall. The coastal permits allow the discharge of diluted wastewater and stormwater through the ocean outfall during high flow storm events and the discharge of treated wastewater through the outfall at other times. The issuing of the consents was a significant achievement which reflects the success of the entire wastewater scheme. A collaborative effort between Wanganui District Council, Horizons Regional Council and Opus International Consultants to develop a plan for Wanganui transport was recognised in May 2012 with an award from the New Zealand Planning Institute (NZPI). The NZPI Best Practice Award: Integrated Planning and Investigations recognises outstanding creativity, innovation and service in planning and was presented for work on the Wanganui Urban Transportation Strategy. The strategy is an outstanding example of integrated transport planning and will influence many of the Council’s future decisions on infrastructure development and land use planning, while efficiently using our existing infrastructure. It also reflects our focus on a family-friendly and healthy community. The strategy focuses on six key themes with a view to enhancing accessibility; creating a vibrant, people-focused central city and riverfront experience; enhancing the safety and efficiency of freight movement; and providing real transport choices which are safe and easy to use.

Wanganui District Council Annual Report for the year ended 30 June 2012
Page 9 of 170
Once again our libraries were at the forefront of technology, with Wanganui amongst the first wave of public libraries throughout New Zealand to upgrade to Kotui, an innovative new computer system co-ordinated by the National Library of New Zealand. Kotui makes it possible for users to search all of the library resources including books, DVDs and magazines from a single access point from their computer or smartphone wherever they are. Library customers can also view digital items online, put a hold on printed items they wish to borrow and view a record of past borrowing. The Kotui system provides an affordable and efficient way for councils to use leading edge technology as the costs are spread out amongst partner libraries. IT support is provided by Aotearoa People’s Network Kaharoa (APNK) who have a proven record in providing technology solutions and services to public libraries. The Shaping Wanganui project, our review of the Wanganui District Plan, is being done in phases. Phase 1 (City Centre and riverfront) is complete, with decisions made operative in May 2012. Consultation was undertaken during the year on Phase 2 (Residential) and Phase 3 (Built Heritage). The review process will be ongoing over the next few years, giving everyone the opportunity to have a say in the way our district develops into the future. As an organisation, we are awaiting the outcome of the Better Local Government reforms. At this time, we do not know what impact the reforms will have on us and there is considerable uncertainty about the future. In the meantime, we are committed to continuing to serve the Wanganui community and deliver the best possible services within the constraints of these testing economic times. I would like to thank all staff and elected members for their contributions during the past year.
Kevin Ross Chief Executive

Wanganui District Council Annual Report for the year ended 30 June 2012
Page 10 of 170
Statement of compliance and responsibility
For the year ended 30 June 2012
Compliance The Council and management of Wanganui District Council confirm that all the statutory requirements in relation to the Annual Report, as outlined in the Local Government Act 2002, have been complied with. Responsibility The Council and management accept responsibility for the preparation of the annual financial statements and the judgements used in them. They also accept responsibility for establishing and maintaining a system of internal controls designed to provide reasonable assurance as to the integrity and reliability of financial reporting. In the opinion of the Council and management, the annual financial statements for the year ended 30 June 2012 fairly reflect the financial position, results of operations and service performance achievements of Wanganui District Council. Signatures
Mayor Annette Main
Chief Executive Kevin Ross

Wanganui District Council Annual Report for the year ended 30 June 2012
Page 11 of 170
Statement of comprehensive income For the year ended 30 June 2012
Budget Council Group2012 2012 2011 2012 2011
Note $000 $000 $000 $000 $000IncomeRates revenue 1 40,946 41,346 39,048 41,346 39,048Finance income 2 620 425 346 498 371Other revenue 3 21,647 25,676 25,398 68,555 70,205Gains 4 175 (713) 542 (601) 542
Total income 63,388 66,734 65,334 109,798 110,166
ExpenditurePersonnel costs 5 13,596 13,757 13,113 16,764 15,790Depreciation and amortisation expense 14,445 14,948 14,347 16,296 15,648Finance costs 2 6,853 6,096 5,854 7,375 7,310Other expenses 6 29,166 37,417 31,537 72,471 69,100
Total operating expenditure 64,060 72,218 64,851 112,906 107,848
Total operating surplus/(deficit) before Earthquake impairments (672) (5,484) 483 (3,108) 2,318
Impairment of earthquake prone buildings 37 - (7,560) - (7,560) -
Operating surplus/(deficit) (672) (13,044) 483 (10,668) 2,318
Share of associate surplus/(deficit) - (15) (2) (15) (2)
Surplus/(deficit) before tax (672) (13,059) 481 (10,683) 2,316
Income tax expense 7 - (28) (4) 282 528
Surplus/(deficit) after tax from continuing operations (672) (13,031) 485 (10,965) 1,788
Discontinued operationsLoss after tax from discontinued operations 35 - - - - (122)
Surplus/ (deficit) after tax (672) (13,031) 485 (10,965) 1,666
Surplus/deficit attributable to:Wanganui District Council (672) (13,031) 485 (10,965) 1,666
Other comprehensive incomeGain on property plant & equipment revaluations 29,200 11,742 9,140 11,742 9,140Impairment of earthquake prone buildings - (5,776) - (5,776) -Gain on carbon credits revaluation - 159 - 159 -Financial assets at fair value through other comprehensive income - 20 (220) 18 (216)
Total other comprehensive income 29,200 6,145 8,920 6,143 8,924
Total comprehensive income 28,528 (6,886) 9,405 (4,822) 10,590
Total comprehensive income attributable to:Wanganui District Council 28,528 (6,886) 9,405 (4,822) 10,590
28,528 (6,886) 9,405 (4,822) 10,590
Explanations of major variances against budget are detailed in note 39.
The accompanying notes form part of these financial statements.

Wanganui District Council Annual Report for the year ended 30 June 2012
Page 12 of 170
Statement of changes in equity For the year ended 30 June 2012
Budget Council Group2012 2012 2011 2012 2011
Note $000 $000 $000 $000 $000
Balance at 1 July 833,255 788,644 785,014 790,352 785,542Adjustment to opening equity - - (5,655) - (5,655)Adjusted equity at 1 July 833,255 788,644 779,359 790,352 779,887
Amounts recognised directly in equityTotal comprehensive income for the year 28,528 (6,886) 9,405 (4,822) 10,590
Total recognised income and expense 28,528 (6,886) 9,405 (4,822) 10,590
Attributable to:Wanganui District Council 28,528 (6,886) 9,405 (4,822) 10,590
Adjustment to equity from CCO's - - (120) (14) (125)
Balance at 30 June 23 861,783 781,758 788,644 785,516 790,352
Explanations of major variances against budget are detailed in note 39.
The accompanying notes form part of these financial statements.

Wanganui District Council Annual Report for the year ended 30 June 2012
Page 13 of 170
Statement of financial position As at 30 June 2012
Budget Council Group2012 2012 2011 2012 2011
Note $000 $000 $000 $000 $000AssetsCurrent assetsCash and cash equivalents 8 6,612 7,148 5,757 16,253 12,996Debtors and other receivables 9 6,850 5,662 7,595 10,292 11,826Other financial assets 10 50 779 281 779 281Inventories 11 200 71 99 277 313Non-current assets held for sale 12 - 823 929 823 929Taxation - - - 136 137Total current assets 13,712 14,483 14,661 28,560 26,482
Non-current assetsDerivative financial instruments 13 784 - - - -Investments in associates 14 - 84 99 84 99Other financial assets 10 14,067 14,255 14,593 1,816 2,145Property, plant and equipment 15 921,233 836,362 836,664 862,183 862,393Intangible assets 16 112 611 413 11,159 11,271Forestry assets 17 5,656 3,205 4,241 3,205 4,241Investment property 18 6,728 24,406 24,579 23,737 23,799Total non-current assets 948,580 878,923 880,589 902,184 903,948
Total assets 962,292 893,406 895,250 930,744 930,430
LiabilitiesCurrent liabilitiesCreditors and other payables 20 5,563 6,682 9,545 18,264 20,521Derivative financial instruments 13 - - 39 - 67Borrowings 21 - 27,188 20,000 28,438 21,250Employee entitlements 22 1,505 1,950 1,801 2,094 2,019Total current liabilities 7,068 35,820 31,385 48,796 43,857
Non-current liabilitiesDerivative financial instruments 13 - 9,991 5,573 11,800 6,638Borrowings 21 93,291 64,815 68,550 81,565 86,818Employee entitlements 22 150 407 455 407 455Contracts for Differences (CFDs) - - - 68 -Deferred tax liability 7 - 615 643 2,592 2,310Total non-current liabilities 93,441 75,828 75,221 96,432 96,221
Total liabilities 100,509 111,648 106,606 145,228 140,078
Net assets 861,783 781,758 788,644 785,516 790,352
Equity 23Retained earnings 545,727 516,845 518,957 520,407 520,464Restricted reserves 64,942 53,812 64,096 53,812 64,096Revaluation reserves 251,114 210,817 205,487 211,039 205,711Other reserves - 284 104 258 81Total equity attributable to WDC 861,783 781,758 788,644 785,516 790,352
Total equity 861,783 781,758 788,644 785,516 790,352
Explanations of major variances against budget are detailed in note 39.
The accompanying notes form part of these financial statements.

Wanganui District Council Annual Report for the year ended 30 June 2012
Page 14 of 170
Statement of cash flows For the year ended 30 June 2012
Budget Council Group2012 2012 2011 2012 2011
Note $000 $000 $000 $000 $000Cash flows from operating activitiesReceipts from rates revenue 41,175 40,926 38,782 41,432 38,782Interest received 510 418 346 491 370Dividends received 110 - - - -Receipts from other revenue 21,557 26,151 22,956 69,008 69,106Payments to suppliers (29,166) (32,178) (29,583) (66,308) (67,504)Payments to employees (13,596) (13,657) (12,903) (16,737) (15,548)Goods and services tax (net) - (40) (141) 16 (267)Interest paid (6,853) (6,124) (5,707) (7,733) (2,265)Income tax paid - 137 7Net cash from operating activities 24 13,737 15,496 13,750 20,306 22,681
Cash flows from investing activitiesReceipts from sale of property, plant and equipment - 295 1,022 381 1,022Purchase of property, plant and equipment (18,940) (17,427) (22,726) (18,587) (24,302)Acquisition of investments - (191) (2,019) (490) (323)Purchase of intangible assets - (235) (355) (288) (2,639)Net cash from investing activities (18,940) (17,558) (24,078) (18,984) (26,242)
Cash flows from financing activitiesProceeds from borrowings 6,710 18,000 24,750 18,000 24,750Contributions from owners - - - - -Repayment of borrowings (1,122) (14,547) (15,012) (16,065) (15,512)Net cash from financing activities 5,588 3,453 9,738 1,935 9,238
Net (decrease)/increase in cash and cash equivalents 385 1,391 (590) 3,257 5,677Cash and cash eqivalents at the beginning of the year 6,227 5,757 6,347 12,996 7,319Cash and cash eqivalents at the end of the year 8 6,612 7,148 5,757 16,253 12,996
Explanations of major variances against budget are detailed in note 39.
The accompanying notes form part of these financial statements.

Wanganui District Council Annual Report for the year ended 30 June 2012
Page 15 of 170
Statement of accounting policies For the year ended 30 June 2012 REPORTING ENTITY Wanganui District Council is a territorial local authority governed by the Local Government Act 2002 and is domiciled in New Zealand. The Wanganui District Council group (WDC) consists of the ultimate parent Wanganui District Council and its subsidiaries, Wanganui District Council Holdings Limited (100% owned) which in turn owns 100% of Wanganui Gas Limited (WGL) and its subsidiaries, Wanganui District Councils’ Forestry Joint Committee (95.09%), Wanganui Airport Joint Venture (50%), Cooks Gardens Trust Board and Wanganui Incorporated. Its 49% equity share of New Zealand Masters Games Limited, its 33% interest in the Ruapehu, Wanganui, Rangitikei Economic Development Trust, its 15% interest in the Manawatu Wanganui LASS Limited and its 33% interest in the Whanganui River Enhancement Trust are equity accounted. All WDC subsidiaries and associates are domiciled in New Zealand. The primary objective of WDC is to provide goods or services for the community or social benefit rather than making a financial return. Accordingly, WDC has designated itself and the group as public benefit entities for the purposes of New Zealand equivalents to International Financial Reporting Standards (NZ IFRS). The financial statements of WDC are for the year ended 30 June 2012. The financial statements were authorised for issue by Council on 23 October 2012. BASIS OF PREPARATION Statement of compliance The financial statements of WDC have been prepared in accordance with the requirements of the Local Government Act 2002, which includes the requirement to comply with New Zealand generally accepted accounting practice (NZ GAAP). These financial statements have been prepared in accordance with NZ GAAP. They comply with NZ IFRS, and other applicable Financial Reporting Standards, as appropriate for public benefit entities. Measurement base The financial statements have been prepared on a historical cost basis, modified by the revaluation of land and buildings, certain infrastructural assets, investment property, forestry assets, certain intangible assets and certain financial instruments (including derivative instruments). Functional and presentation currency The financial statements are presented in New Zealand dollars and all values are rounded to the nearest thousand dollars ($000). The functional currency of WDC is New Zealand dollars. Changes in accounting policies There have been no changes in accounting policies. WDC has adopted the following revisions to accounting standards during the financial year which have only had a presentational or disclosure effect: • Amendments to NZ IAS 1 Presentation of Financial Statements. The amendments introduce a requirement to
present, either in the statement of changes in equity or the notes, for each component of equity, an analysis of other comprehensive income by item. WDC has decided to present this analysis in note 23.
• FRS-44 New Zealand Additional Disclosures and Amendments to NZ IFRS to harmonise with IFRS and Australian
Accounting Standards (Harmonisation Amendments) – The purpose of the new standard and amendments is to harmonise Australian and New Zealand accounting standards with source IFRS and to eliminate many of the differences between the accounting standards in each jurisdiction. The main effect of the amendments on the Council and group is that certain information about property valuations is no longer required to be disclosed. Note 15 has been updated for these changes.
• Amendments to NZ IFRS 7 Financial Instruments: Disclosures – The amendment reduces the disclosure
requirements relating to credit risk. Note 9 has been updated for the amendments. Standards, amendments and interpretations issued that are not yet effective and have not been early adopted Standards, amendments and interpretations issued but not yet effective that have not been early adopted, and which are relevant to the Council are:

Wanganui District Council Annual Report for the year ended 30 June 2012
Page 16 of 170
• NZ IFRS 9 Financial Instruments will eventually replace NZ IAS 39 Financial Instruments: Recognition and
Measurement. NZ IAS 39 is being replaced through the following 3 main phases: Phase 1 Classification and Measurement, Phase 2 Impairment Methodology, and Phase 3 Hedge Accounting. Phase 1 on the classification and measurement of financial assets has been completed and has been published in the new financial instrument standard NZ IFRS 9. NZ IFRS 9 uses a single approach to determine whether a financial asset is measured at amortised cost or fair value, replacing the many different rules in NZ IAS 39. The approach in NZ IFRS 9 is based on how an entity manages its financial instruments (its business model) and the contractual cash flow characteristics of the financial assets. The financial liability requirements are the same as those of NZ IAS 39, except for when an entity elects to designate a financial liability at fair value through the surplus/deficit. The new standard is required to be adopted for the year ended 30 June 2016. However, as a new Accounting Standards Framework will apply before this date, there is no certainty when an equivalent standard to NZ IFRS 9 will be applied by public benefit entities.
The Minister of Commerce has approved a new Accounting Standards Framework (incorporating a Tier Strategy) developed by the External Reporting Board (XRB). Under this Accounting Standards Framework, the Council is classified as a Tier 1 reporting entity and it will be required to apply full Public Benefit Entity Accounting Standards (PAS). These standards are being developed by the XRB based on current International Public Sector Accounting Standards. The effective date for the new standards for public sector entities is expected to be for reporting periods beginning on or after 1 July 2014. This means the Council expects to transition to the new standards in preparing its 30 June 2015 financial statements. As the PAS are still under development, the Council is unable to assess the implications of the new Accounting Standards Framework at this time. Due to the change in the Accounting Standards Framework for public benefit entities, it is expected that all new NZ IFRS and amendments to existing NZ IFRS will not be applicable to public benefit entities. Therefore, the XRB has effectively frozen the financial reporting requirements for public benefit entities up until the new Accounting Standard Framework is effective. Accordingly, no disclosure has been made about the new or amended NZ IFRS that exclude public benefit entities from their scope. SIGNIFICANT ACCOUNTING POLICIES Basis of consolidation The purchase method is used to prepare the consolidated financial statements, which involves adding together like items of assets, liabilities, equity, income and expenses on a line-by-line basis. All significant intragroup balances, transactions, income and expenses are eliminated on consolidation. Subsidiaries WDC consolidates as subsidiaries in the group financial statements all entities where WDC has the capacity to control their financing and operating policies so as to obtain benefits from the activities of the entity. This power exists where WDC controls the majority voting power on the governing body or where such policies have been irreversibly predetermined by WDC or where the determination of such policies is unable to materially impact the level of potential ownership benefits that arise from the activities of the subsidiary. Subsidiaries are fully consolidated from the date on which control is transferred to the group. They are deconsolidated from the date that control ceases. The consideration transferred in an acquisition of a subsidiary reflects the fair value of the assets transferred by the acquirer and liabilities incurred by the acquirer to the former owner. Any excess of the cost of the business combination over WDC’s interest in the net fair value of the identifiable assets, liabilities and contingent liabilities is recognised as goodwill. If WDC’s interest in the net fair value of the identifiable assets, liabilities and contingent liabilities recognised exceeds the cost of the business combination, the difference will be recognised immediately in the surplus or deficit. Investments in subsidiaries are carried at cost in WDC’s own “parent entity” financial statements. Associates WDC accounts for investments in associates in the group financial statements using the equity method. An associate is an entity over which the WDC has significant influence and that is neither a subsidiary nor an interest in a joint venture of WDC. The investment in an associate is initially recognised at cost and the carrying amount is increased or decreased to recognise WDC’s share of the surplus or deficit of the associate after the date of acquisition. WDC’s share of the surplus or deficit of the associate is recognised in WDC‘s statement of comprehensive income. Distributions received from an associate reduce the carrying amount of the investment. If WDC’s share of deficits of an associate equals or exceeds its interest in the associate, WDC discontinues recognising its share of further deficits. After WDC’s interest is reduced to zero, additional deficits are provided for, and a liability is recognised, only to the extent that WDC has incurred legal or constructive obligations or made payments on behalf of the associate. If the associate subsequently reports surpluses, WDC will resume recognising its share of those surpluses only after its share of the surpluses equals the share of deficits not recognised.

Wanganui District Council Annual Report for the year ended 30 June 2012
Page 17 of 170
Where WDC transacts with an associate, surplus or deficits are eliminated to the extent of WDC’s interest in the relevant associate. Dilution gains or losses arising from investments in associates are recognised in the surplus or deficit. Investments in associates are carried at cost in WDC’s own “parent entity” financial statements. Joint ventures A joint venture is a contractual arrangement whereby two or more parties undertake an economic activity that is subject to joint control. For jointly controlled assets, WDC recognises in its financial statements its share of jointly controlled assets, the liabilities and expenses it incurs, its share of liabilities and expenses incurred jointly, and income from the sale or use of its share of the output of the joint venture. Revenue Revenue is measured at the fair value of consideration received or receivable. Rates revenue Rates are set annually by a resolution from Council and relate to a financial year. All ratepayers are invoiced within the financial year to which the rates have been set. Rates revenue is recognised when payable. Revenue from water rates by meter is recognised on an accrual basis. Unbilled usage, as a result of unread meters at year-end, is accrued on an average usage basis. Gas Revenue is derived from gas network distribution services and the sale of energy. Such revenue is recognised when earned and is reported in the financial period to which it relates. Energy sales include an accrual for energy supplied but not billed at the end of the financial period. Government grants WDC receives government grants from Land Transport New Zealand, which subsidises part of WDC’s costs in maintaining the local roading infrastructure. The subsidies are recognised as revenue upon entitlement, as conditions pertaining to eligible expenditure have been fulfilled. Provision of services Revenue from the rendering of services is recognised by reference to the stage of completion of the transaction at balance date, based on the actual service provided as a percentage of the total services to be provided. Vested assets Where a physical asset is acquired for nil or nominal consideration, the fair value of the asset received is recognised as income. Assets vested in WDC are recognised as income when control over the asset is obtained. Sale of goods Revenue from sales of goods is recognised when a product is sold to the customer. Traffic and parking infringements Traffic and parking infringements are recognised when tickets are issued. Interest and dividends Interest income is recognised using the effective interest method. Interest income on an impaired financial asset is recognised using the original effective interest rate. Dividends are recognised when the right to receive payment has been established. Development contributions Development and financial contributions are recognised as revenue when the council provides, or is able to provide, the service for which the contribution was charged. Otherwise development and financial contributions are recognised as liabilities until such time the Council provides or is able to provide, the service. Development contributions are classified as part of “Other revenue”. Borrowing costs WDC has elected to defer the adoption of NZ IAS 23 Borrowing Costs (Revised 2007) in accordance with its transitional provisions that are applicable to public benefit entities. Consequently, all borrowing costs are recognised as an expense in the period in which they are incurred. Grant expenditure Non-discretionary grants are those grants that are awarded if the grant application meets the specified criteria and are recognised as expenditure when an application that meets the specified criteria for the grant has been received. Discretionary grants are those grants where WDC has no obligation to award on receipt of the grant application and are recognised as expenditure when a successful applicant has been notified of the WDC’s decision.

Wanganui District Council Annual Report for the year ended 30 June 2012
Page 18 of 170
Income Tax Income tax expense is the aggregate of current period movements in relation to both current and deferred tax. Current tax is the amount of income tax payable based on the taxable surplus for the current year, plus any adjustments to income tax payable in respect to prior years. Current tax is calculated using tax rates (and tax laws) that have been enacted or substantively enacted at balance date. Deferred tax is the amount of income tax payable or recoverable in future periods in respect of temporary differences and unused tax losses. Temporary differences are differences between the carrying amount of assets and liabilities in the financial statements and the corresponding tax bases used in the computation of taxable surplus. Deferred tax is measured at the tax rates that are expected to apply when the asset is realised or the liability is settled, based on tax rates (and tax laws) that have been enacted or substantively enacted at balance date. The measurement of deferred tax reflects the tax consequences that would follow from the manner in which the entity expects to recover or settle the carrying amount of its assets and liabilities. Deferred tax liabilities are generally recognised for all taxable temporary differences. Deferred tax assets are recognised to the extent that it is probable that taxable surpluses will be available against which the deductible temporary differences or tax losses can be utilised. Deferred tax is not recognised if the temporary difference arises from the initial recognition of goodwill or from the initial recognition of an asset and liability in a transaction that is not a business combination and, at the time of the transaction, affects neither accounting surplus nor taxable surplus. Deferred tax is recognised on taxable temporary differences arising on investments in subsidiaries and associates, and interests in joint ventures, except where the company can control the reversal of the temporary difference and it is probable that the temporary difference will not reverse in the foreseeable future. Current and deferred tax is recognised against the surplus or deficit for the period, except to the extent that it relates to a business combination, or to transactions recognised in other comprehensive income or directly in equity. Leases Finance leases A finance lease is a lease that transfers to the lessee substantially all the risks and rewards incidental to ownership of an asset, whether or not title is eventually transferred. At the commencement of the lease term, WDC recognises finance leases as assets and liabilities in the statement of financial position at the lower of the fair value of the leased item or the present value of the minimum lease payments. The finance charge is charged to the surplus or deficit over the lease period so as to produce a constant periodic rate of interest on the remaining balance of the liability. The amount recognised as an asset is depreciated over its useful life. If there is no certainty as to whether WDC will obtain ownership at the end of the lease term, the asset is fully depreciated over the shorter of the lease term and its useful life. Operating leases An operating lease is a lease that does not transfer substantially all the risks and rewards incidental to ownership of an asset. Lease payments under an operating lease are recognised as an expense on a straight-line basis over the lease term. Cash and cash equivalents Cash and cash equivalents includes cash on hand, deposits held at call with banks, other short-term highly liquid investments with original maturities of three months or less, and bank overdrafts. Bank overdrafts are shown within borrowings in current liabilities in the statement of financial position. Debtors and other receivables Short-term debtors and other receivables are recorded at their face value, less any provision for impairment. Impairment of a receivable is established when there is objective evidence that the Council will not be able to collect amounts due according to the original terms of the receivable. Significant financial difficulties of the debtor, probability that the debtor will enter into bankruptcy, receivership or liquidation, and default in payments are considered indicators that the debt is impaired. The amount of the impairment is the difference between the asset’s carrying amount and the present value of estimated future cash flows, discounted using the original effective interest rate. The carrying amount of the asset is reduced through the use of an allowance account, and the amount of the loss is recognised in the surplus or deficit. When the receivable is uncollectible, it is written off against the allowance account for receivables. Overdue receivables that have been renegotiated are reclassified as current (that is, not past due).

Wanganui District Council Annual Report for the year ended 30 June 2012
Page 19 of 170
Derivative financial instruments WDC uses derivative financial instruments to hedge exposure to interest rate risks arising from financing activities. In accordance with its treasury policy, WDC does not hold or issue derivative financial instruments for trading purposes. Derivatives are initially recognised at fair value on the date a derivative contract is entered into and are subsequently remeasured at their fair value at each balance date. The associated gains or losses of derivatives that are not hedge accounted are recognised in the surplus or deficit. Electricity Contracts for Differences (CFDs) CFDS are not traded on an active market so the fair values of CFDs are based on the discounted values of future cash flows with assumptions based on publically available forecasted prices and models maintained by an external consultant. Changes in the fair values of CFDs are recognised in the Statement of Comprehensive Income within the Operating Profit. Other financial assets Financial assets are initially recognised at fair value plus transaction costs unless they are carried at fair value through surplus or deficit in which case the transaction costs are recognised in the surplus or deficit. Purchases and sales of financial assets are recognised on trade-date, the date on which WDC commits to purchase or sell the asset. Financial assets are derecognised when the rights to receive cash flows from the financial assets have expired or have been transferred and the WDC has transferred substantially all the risks and rewards of ownership. WDC classifies its financial assets into the following categories: • fair value through surplus or deficit; • loans and receivables; • held-to-maturity investments; and • fair value through other comprehensive income. The classification of a financial asset depends on the purpose for which the instrument was acquired. Management determines the classification of its investments at initial recognition. Financial assets at fair value through surplus or deficit Financial assets at fair value through surplus or deficit include financial assets held for trading. A financial asset is classified in this category if acquired principally for the purpose of selling in the short-term. Derivatives are also categorised as held for trading unless they are designated as hedges. WDC’s financial assets at fair value through surplus or deficit include derivatives that are not designated as hedges. Financial assets acquired principally for the purpose of selling in the short-term are classified as a current asset. After initial recognition they are measured at their fair values with gains or losses on remeasurement are recognised in the surplus or deficit. Loans and receivables These are non-derivative financial assets with fixed or determinable payments that are not quoted in an active market. They are included in current assets, except for maturities greater than 12 months after the balance date, which are included in non-current assets. WDC’s loans and receivables comprise cash and cash equivalents, debtors and other receivables, term deposits, community and related party loans, long term receivables and hire purchase long term debtors. After initial recognition they are measured at amortised cost using the effective interest method less impairment. Gains and losses when the asset is impaired or derecognised are recognised in the surplus or deficit. Loans to community organisations made by WDC at nil, or below-market interest rates are initially recognised at the present value of their expected future cash flows, discounted at the current market rate of return for a similar financial instrument. The loans are subsequently measured at amortised cost using the effective interest method. The difference between the face value and present value of expected future cash flows of the loan is recognised in the surplus or deficit as a grant. Held to maturity investments Held to maturity investments are non-derivative financial assets with fixed or determinable payments and fixed maturities that WDC has the positive intention and ability to hold to maturity. They are included in current assets, except for maturities greater than 12 months after the balance date, which are included in non-current assets. WDC’s held to maturity investments include interest bearing bonds and deposits and sinking funds. After initial recognition they are measured at amortised cost using the effective interest method less impairment. Gains and losses when the asset is impaired or derecognised are recognised in the surplus or deficit.

Wanganui District Council Annual Report for the year ended 30 June 2012
Page 20 of 170
Fair value through other comprehensive income Financial assets at fair value through other comprehensive income are those that are designated into the category at initial recognition or are not in any of the other categories above. They are included in non-current assets unless management intends to dispose of the investment within 12 months of the balance date or it the debt instrument is not expected to be realised within 12 months of balance date. WDC’s financial assets at fair value through equity comprise investments in quoted and unquoted shares. WDC includes in this category:
• investments that it intends to hold long-term but which may be realised before maturity; and • shareholdings that it holds for strategic purposes.
WDC’s investments in its subsidiary and associate companies are not included in this category as they are held at cost (as allowed by NZ IAS 27 Consolidated and Separate Financial Statements and NZ IAS 28 Investments in Associates) whereas this category is to be measured at fair value. After initial recognition these investments are measured at their fair value, with gains and losses recognised in other comprehensive income, except for impairment losses, which are recognised in the surplus or deficit. On derecognition the cumulative gain or loss previously recognised in other comprehensive income is reclassified from equity to the surplus or deficit. Fair value The fair value of financial instruments traded in active markets is based on quoted market prices at the balance date. The quoted market price used is the current bid price. Impairment of financial assets At each balance date WDC assesses whether there is any objective evidence that a financial asset or group of financial assets is impaired. Any impairment losses are recognised in the surplus or deficit. Loans and receivables, and held-to-maturity investments Impairment of a loan or a receivable is established when there is objective evidence that WDC will not be able to collect amounts due according to the original terms. Significant financial difficulties of the debtor/issuer, probability that the debtor/issuer will enter into bankruptcy, and default in payments are considered indicators that the asset is impaired. The amount of the impairment is the difference between the asset’s carrying amount and the present value of estimated future cash flows, discounted using the original effective interest rate. For debtors and other receivables, the carrying amount of the asset is reduced through the use of an allowance account, and the amount of the loss is recognised in the surplus or deficit. When the receivable is uncollectible, it is written off against the allowance account. Overdue receivables that have been renegotiated are reclassified as current (i.e. not past due). For term deposits, local authority stock, government stock and community loans, impairment losses are recognised directly against the instruments carrying amount. Impairment of term deposits, local authority, government stock, and related party and community loans is established when there is objective evidence that the WDC will not be able to collect amounts due to the original terms of the instrument. Significant financial difficulties of the issuer, probability the issuer will enter into bankruptcy, and default in payments are considered indicators that the instrument is impaired. Quoted and unquoted equity investments For equity investments classified as fair value through other comprehensive income, a significant or prolonged decline in the fair value of the investment below its cost is considered objective evidence of impairment. If such evidence exists for investments at fair value through other comprehensive income, the cumulative loss (measured as the difference between the acquisition cost and the current fair value, less any impairment loss on that financial asset previously recognised in the surplus or deficit) recognised in other comprehensive income is reclassified from equity to the surplus or deficit. Impairment losses recognised in the surplus or deficit are not reversed through the surplus or deficit. If in a subsequent period the fair value of a debt instrument increases and the increase can be objectively related to an event occurring after the impairment loss was recognised, the impairment loss is reversed in the surplus or deficit. Inventories Inventories (such as spare parts and other items) held for distribution or consumption in the provision of services that are not supplied on a commercial basis are measured at the lower of cost, adjusted when applicable, for any loss of service potential. Where inventories are acquired at no cost or for nominal consideration, the cost is the current replacement cost at the date of acquisition. WGL inventories (comprising network and retail) are valued at the lower of cost or net realisable value after making provision for damaged or obsolete items. Cost is determined by the weighted average method of valuation. The amount of any write-down for the loss of service potential or from cost to net realisable value is recognised in the surplus or deficit in the period of the write-down. Non-current assets held for sale Non-current assets held for sale are classified as held for sale if their carrying amount will be recovered principally through a sale transaction rather than through continuing use. Non-current assets held for sale are recorded at lower of their carrying amount and fair value less costs to sell.

Wanganui District Council Annual Report for the year ended 30 June 2012
Page 21 of 170
Any impairment losses for write-downs of non-current assets held for sale are recognised in the surplus or deficit. Any increases in fair value (less costs to sell) are recognised up to the level of any impairment losses that have been previously recognised. Non-current assets (including those that are part of a disposal group) are not depreciated or amortised while they are classified as held for sale. Property, plant and equipment Property, plant and equipment consists of: Operational assets – these include land, buildings, motor vehicles, plant and equipment and library books. Restricted assets – these include artworks, cultural assets and parks and reserves. These assets provide a benefit or service to the community and cannot be disposed of because of legal or other restrictions. Infrastructure assets – these include the fixed utility systems comprising the roading, airport runway, water reticulation and drainage systems, and infrastructure land (including land under roads). Each asset type includes all items that are required for the network to function. The gas distribution network and gas measurement systems are valued at optimised depreciated replacement cost, adjusted by additions (at cost), disposals and depreciation. Revaluations are carried out every three years and are independently reviewed. Property, plant and equipment is shown at cost or valuation, less accumulated depreciation and impairment losses. Revaluation Land, buildings (operational and restricted) and infrastructural assets (except land under roads) are revalued with sufficient regularity to ensure that their carrying amount does not differ materially from fair value and at least every three years. All other asset classes are carried at depreciated historical cost. WDC assesses the carrying values of its revalued assets annually to ensure that they do not differ materially from the assets’ fair values. If there is a material difference, then the off-cycle asset classes are revalued. WDC accounts for revaluations of property, plant and equipment on a class of asset basis. The net revaluation results are credited or debited to other comprehensive income and are accumulated to an asset revaluation reserve in equity for that class of asset. Where this results in a debit balance in the asset revaluation reserve, this balance is not recognised in other comprehensive income but is recognised in the surplus or deficit. Any subsequent increase on revaluation that reverses a previous decrease in value recognised in the surplus or deficit will be recognised first in the surplus or deficit up to the amount previously expensed, and then recognised in other comprehensive income. Additions The cost of an item of property, plant and equipment is recognised as an asset if, and only if, it is probable that future economic benefits or service potential associated with the item will flow to WDC and the cost of the item can be measured reliably. Work in progress is recognised at cost less impairment and is not depreciated. In most instances, an item of property, plant and equipment is recognised at its cost. Where an asset is acquired at no cost, or for a nominal cost, it is recognised at fair value as at the date of acquisition. Disposals Gains and losses on disposals are determined by comparing the proceeds with the carrying amount of the asset. Gains and losses on disposals are reported net in the surplus or deficit. When revalued assets are sold, the amounts included in asset revaluation reserves in respect of those assets are transferred to accumulated funds. Depreciation Depreciation is provided on a straight-line basis on all property, plant and equipment other than land and art works, at rates that will write off the cost (or valuation) of the assets to their estimated residual values over their useful lives. The useful lives and associated depreciation rates of major classes of assets have been estimated as follows: Asset type Useful life Depreciation rate Land (including Restricted properties) Not a Depreciable
item Buildings and leasehold improvements (including Restricted properties) 5 to 50 years 2-20% Plant, vehicles and equipment 3 to 20 years 5-33% Furniture & Fittings 5 to 10 10-20% Library books 10 years 10%

Wanganui District Council Annual Report for the year ended 30 June 2012
Page 22 of 170
Art Works Not a Depreciable item
Infrastructural assets Roading network 50 to 100 years 1% - 2% Wastewater system 20 to120 years 1.2% - 5% Water system 9 to 100 years 1% - 11.1% Gas distribution network mains and services 7 to 100 years 1% - 15% Gas distribution network condition renewals 50 years 2% Gas measurement systems and distribution network customer stations 10 to 100 years 1% - 10% Airport runway 50 years 2% The residual value and useful life of an asset is reviewed, and adjusted if applicable, at each financial year-end. Intangible assets Goodwill Goodwill represents the excess of the cost of an acquisition over the fair value of WDC’s share of the identifiable assets, liabilities and contingent liabilities of the acquired subsidiary/associate at the date of acquisition. Goodwill on acquisition of subsidiaries is included in “intangible assets”. Goodwill on acquisition of associates is included in “investments in associates” and is tested for impairment as part of the overall balance. Separately recognised goodwill is tested annually for impairment and carried at cost less accumulated impairment losses. An impairment loss recognised for goodwill is not reversed. Goodwill is allocated to cash generating units for the purposes of impairment testing. The allocation is made to those cash-generating units or groups of cash-generating units that are expected to benefit from the business combination, in which the goodwill arose. Carbon credits Carbon credits are initially recognised at cost. After initial recognition, all carbon credits are measured, annually, at fair value. The net revaluation result is credited or debited to other comprehensive income and is accumulated to fair value through general reserve. Where this results in a debit balance in the reserve, this balance is not recognised in other comprehensive income but is recognised in the surplus or deficit. Any subsequent increase in revaluation that reverses a previous decrease in value recognised in the surplus or deficit will be recognised first in the surplus or deficit up to the amount previously expensed, and then recognised in other comprehensive income. Software acquisition and development Acquired computer software licenses are capitalised on the basis of the costs incurred to acquire and bring to use the specific software. Costs that are directly associated with the development of software for internal use by WDC, are recognised as an intangible asset. Direct costs include the software development employee costs and an appropriate portion of relevant overheads. Staff training costs are recognised in the surplus or deficit when incurred. Costs associated with maintaining computer software are recognised as an expense when incurred. Customer list WGL has capitalised the cost of the acquisition of the gas and electricity customers gained during the financial year. These are valued at cost. Amortisation The carrying value of an intangible asset with a finite life is amortised on a straight-line basis over its useful life. Amortisation begins when the asset is available for use and ceases at the date that the asset is derecognised. The amortisation charge for each period is recognised in the surplus or deficit. The useful lives and associated amortisation rates of major classes of intangible assets have been estimated as follows: Asset type Useful life Amortisation rate Computer software 3-10 years 10%-33% Customer list 5 years 20% Impairment of property, plant and equipment and intangible assets Intangible assets that have an indefinite useful life, or not yet available for use, are not subject to amortisation and are tested annually for impairment. Assets that have a finite useful life are reviewed for indicators of impairment at each balance date. When there is an indicator of impairment the asset’s recoverable amount is estimated. An

Wanganui District Council Annual Report for the year ended 30 June 2012
Page 23 of 170
impairment loss is recognised for the amount by which the asset’s carrying amount exceeds it recoverable amount. The recoverable amount is the higher of an asset’s fair value less costs to sell and value in use. Value in use is depreciated, replacement cost for an asset where the future economic benefits or service potential of the asset are not primarily dependent on the asset’s ability to generate net cash inflows and where the entity would, if deprived of the asset, replace its remaining future economic benefits or service potential. The value in use for cash-generating assets and cash generating units is the present value of expected future cash flows. If an asset’s carrying amount exceeds its recoverable amount, the asset is impaired and the carrying amount is written down to the recoverable amount. For revalued assets the impairment loss is recognised against the revaluation reserve for that class of asset. Where that results in a debit balance in the revaluation reserve, the balance is recognised in the surplus or deficit. For assets not carried at a revalued amount, the total impairment loss is recognised in the surplus or deficit. The reversal of an impairment loss on a revalued asset is credited to the revaluation reserve. However, to the extent that an impairment loss for that class of asset was previously recognised in surplus or deficit, a reversal of the impairment loss is also recognised in the surplus or deficit. For assets not carried at a revalued amount (other than goodwill) the reversal of an impairment loss is recognised in the surplus or deficit. Forestry assets Standing forestry assets are independently revalued annually at fair value less estimated costs to sell for one growth cycle. Fair value is determined based on the present value of expected net cash flows discounted at a current market determined pre-tax rate. This calculation is based on existing sustainable felling plans and assessments regarding growth, timber prices, felling costs, and silvicultural costs and takes into consideration environmental, operational and market restrictions. Gains or losses arising on initial recognition of biological assets at fair value less estimated costs to sell and from a change in fair value less estimated costs to sell are recognised in the surplus or deficit. The costs to maintain forestry assets are included in the surplus or deficit when incurred. Investment property Properties leased to third parties under operating leases are classified as investment property unless the property is held to meet service delivery objectives, rather than to earn rentals or for capital appreciation. Investment property is measured initially at its cost, including transaction costs. After initial recognition, WDC measures all investment property at fair value as determined annually by an independent valuer. Gains or losses arising from a change in the fair value of investment property are recognised in the surplus or deficit. Creditors and other payables Short-term creditors and other payables are recorded at their face value. Borrowings Borrowings are initially recognised at their fair value net of transaction costs incurred. After initial recognition, all borrowings are measured at amortised cost using the effective interest method. Borrowings are classified as current liabilities unless WDC has an unconditional right to defer settlement of the liability for at least 12 months after the balance date or if the borrowings are expected to be settled within 12 months of balance date. Employee entitlements Short-term employee entitlements Employee benefits that WDC expects to be settled within 12 months of balance date are measured at nominal values based on accrued entitlements at current rates of pay. These include salaries and wages accrued up to balance date, annual leave earned to, but not yet taken at, balance date, retiring and long service leave entitlements expected to be settled within 12 months, and sick leave. WDC recognises a liability for sick leave to the extent that compensated absences in the coming year are expected to be greater than the sick leave entitlements earned in the coming year. The amount is calculated based on the unused sick leave entitlement that can be carried forward at balance date, to the extent that WDC anticipates it will be used by staff to cover those future absences.

Wanganui District Council Annual Report for the year ended 30 June 2012
Page 24 of 170
WDC recognises a liability and an expense for bonuses where contractually obliged or where there is a past practice that has created a constructive obligation. Long-term employee entitlements Employee benefits that are due to be settled beyond 12 months after the end of the period in which the employee renders the related service, such as long service leave and retirement gratuities; have been calculated on an actuarial basis. The calculations are based on: • likely future entitlements accruing to staff, based on years of service, years to entitlement, the likelihood that
staff will reach the point of entitlement and contractual entitlements information; and • the present value of the estimated future cash flows. Presentation of employee entitlements Sick leave, annual leave, vested long service leave, and non-vested long service leave and retirement gratuities expected to be settled within 12 months of balance date, are classified as a current liability. All other employee entitlements are classified as a non-current liability. Superannuation schemes Defined contribution schemes Obligations for contributions to defined contribution superannuation schemes are recognised as an expense in the surplus or deficit as incurred. Equity Equity is the community’s interest in WDC and is measured as the difference between total assets and total liabilities. Equity is disaggregated and classified into a number of reserves. The components of equity are:
retained earnings restricted reserves asset revaluation reserves general reserves
Restricted reserves Restricted reserves are a component of equity generally representing a particular use to which various parts of equity have been assigned. Reserves may be legally restricted or created by WDC. Restricted reserves are those subject to specific conditions accepted as binding by WDC and which may not be revised by WDC without reference to the Courts or a third party. Transfers from these reserves may be made only for certain specified purposes or when certain specified conditions are met. Also included in restricted reserves are reserves restricted by Council decision. The Council may alter them without references to any third party or the Courts. Transfers to and from these reserves are at the discretion of the Council. WDC’s objectives, policies and processes for managing capital are described in note 38. Goods and Service Tax (GST) All items in the financial statements are stated exclusive of GST, except for receivables and payables, which are stated on a GST inclusive basis. Where GST is not recoverable as input tax then it is recognised as part of the related asset or expense. The net amount of GST recoverable from, or payable to, the Inland Revenue Department (IRD) is included as part of receivables or payables in the statement of financial position. The net GST paid to, or received from the IRD, including the GST relating to investing and financing activities, is classified as an operating cash flow in the statement of cash flows. Commitments and contingencies are disclosed exclusive of GST. Budget figures The budget figures are those approved by the Council in its 2009-2019 Ten Year Plan. The budget figures have been prepared in accordance with NZ GAAP, using accounting policies that are consistent with those adopted by WDC for the preparation of the financial statements. Landfill post-closure costs WDC, as past operator of the Balgownie landfill, has a legal obligation under the resource consent to provide on-going monitoring of the landfill after its closure. Post-closure monitoring costs are recognised as expenses when the obligation for post-closure arises. Cost allocation WDC has derived the cost of service for each significant activity of WDC using the cost allocation system outlined below.

Wanganui District Council Annual Report for the year ended 30 June 2012
Page 25 of 170
Direct costs are those costs directly attributable to a significant activity. Indirect costs are those costs which cannot be identified in an economically feasible manner with a specific significant activity. Direct costs are charged directly to significant activities. Indirect costs are charged to significant activities using appropriate cost drivers such operating expenditure net of NZTA subsidies. Critical accounting estimates and assumptions In preparing these financial statements WDC has made estimates and assumptions concerning the future. These estimates and assumptions may differ from the subsequent actual results. Estimates and assumptions are continually evaluated and are based on historical experience and other factors, including expectations or future events that are believed to be reasonable under the circumstances. The estimates and assumptions that have a significant risk of causing a material adjustment to the carrying amounts of assets and liabilities within the next financial year are discussed below: WDC infrastructural assets There are a number of assumptions and estimates used when performing DRC valuations over infrastructural assets. These include:
• the physical deterioration and condition of an asset, for example the Council could be carrying an asset at an amount that does not reflect its actual condition. This is particularly so for those assets which are not visible, for example stormwater, wastewater and water supply pipes that are underground. This risk is minimised by Council performing a combination of physical inspections and condition modelling assessments of underground assets;
• estimating any obsolescence or surplus capacity of an asset; • estimates are made when determining the remaining useful lives over which the asset will be depreciated.
These estimates can be impacted by the local conditions, for example weather patterns and traffic growth. If useful lives do not reflect the actual consumption of the benefits of the asset, then WDC could be over or under estimating the annual depreciation charge recognised as an expense in the surplus or deficit. To minimise this risk, WDC’s infrastructural asset useful lives have been determined with reference to the NZ Infrastructural Asset Valuation and Depreciation Guidelines published by the National Asset Management Steering Group, and have been adjusted for local conditions based on past experience. Asset inspections, deterioration and condition modelling are also carried out regularly as part of the WDC’s asset management planning activities, which gives WDC further assurance over its useful life estimates.
Experienced independent valuers perform or review the Council’s infrastructural asset revaluations. WGL infrastructural assets At each balance date WGL reviews the useful lives and residual values of its property, plant and equipment. Assessing the appropriateness of useful life and residual value estimates of property, plant and equipment requires WGL to consider a number of factors such as the physical condition of the asset, expected period of use of the asset by WGL, and expected disposal proceeds from the sale of the asset. An incorrect estimate of the useful life or residual value will impact on the depreciable amount of an asset, therefore impacting on the depreciation expense recognised in the surplus or deficit, and carrying amount of the asset in the statement of financial position. WGL minimises the risk of this estimation uncertainty to its infrastructure assets by:
• an annual review by an independent contractor of the value of the infrastructure assets to determine if any material changes exist.
• physical inspection of assets • asset replacement programs • review of second hand market prices for similar assets • analysis of prior assets sales; and • completing a revaluation of the infrastructure assets every third year
WGL has not made significant changes to past assumptions concerning useful lives and residual values. WGL’s customer acquisition programme has incurred unprecedented costs during the year relating to the marketing and switching activities. Accordingly WGL has chosen to value these customers as an intangible asset at the cost of acquisition less amortisation at the rate of 20% per annum. An incorrect estimate of the residual value will impact on the amortisable amount of an intangible asset impacting on the amortisation expense recognised in the surplus or deficit and the carrying amount of the intangible asset in the statement of financial position. WGL minimises the risk of this estimation uncertainty to its intangible assets by:
• an annual review of the value of the intangible assets to determine if any material changes exist. • a review of any prices for trades of similar intangible assets. • an annual review of the appropriateness of the amortisation rate. • analysis of prior intangible asset sales.
Impairment of earthquake prone buildings WDC has assessed a number of its buildings as being earthquake prone. These buildings fall within the categories of Property, Plant & Equipment and Investment Properties. WDC has assessed the likely cost of bringing these buildings to within 67% - 100% of the building code. These remedial costs have formed the basis of the impairment, which has been reflected through both other comprehensive income and surplus and deficit (note 37). WDC has minimised the risk of this estimation uncertainty through the use of independent consultants.

Wanganui District Council Annual Report for the year ended 30 June 2012
Page 26 of 170
Critical judgements in applying WDC’s accounting policies Management has exercised the following critical judgements in applying the WDC’s accounting policies for the period ended 30 June 2012: Classification of property WDC owns a number of properties, which are maintained primarily to provide housing to pensioners. The receipt of market-based rental from these properties is incidental to holding these properties. These properties are held for service delivery objectives as part of the Council’s social housing policy. These properties are accounted for as property, plant and equipment. Critical judgements in impairment of shares in subsidiary Management reviews its share investment in its subsidiary and has made estimates and assumptions concerning the future. These estimates and assumptions include revenue growth, future cash flows and future economic and market conditions. These estimates are based upon assumptions believed to be reasonable, but which are inherently uncertain and unpredictable. WDC minimises the risk of this estimation uncertainty by annually reviewing the value of its share investment.

Wanganui District Council Annual Report for the year ended 30 June 2012
Page 27 of 170
Notes to the financial statements For the year ended 30 June 2012 1. Rates revenue Council Group
2012 2011 2012 2011$000 $000 $000 $000
CBD rate 507 474 507 474General rate 9,822 9,138 9,822 9,138Roading and footpath rates 5,636 5,470 5,636 5,470Community facilities rate 13,036 11,957 13,036 11,957Stormwater rate 3,699 3,639 3,699 3,639Wastewater rate 3,305 3,173 3,305 3,173Water charge 4,300 4,186 4,300 4,186Fire capacity rate 1,041 1,011 1,041 1,011
Total rates revenue 41,346 39,048 41,346 39,048
Total rates revenue includes $1.1M (2011 $1.2M) for rates paid by WDC on properties owned by Council
Rates remissionsRates revenue is shown net of rates remissions and includes penalties. WDC's rates remission and postponement policies allows WDC toremit rates on conditions of a ratepayer's extreme financial hardship, and only for those ratepayers of residential properties. TheCouncil considers all applications on a case by case basis. There were no rates remissions in the 2012 financial year (2011 nil).
Non-rateable landUnder the Local Government (Rating) Act 2002 certain properties cannot be rated for general rates. These properties include schools,places of religious worship, public gardens and reserves. These non-rateable properties may be subject to targeted rates in respectof sewerage, water, refuse and sanitation. Non-rateable land does not constitute a remission under WDC's rates remission policy.
2. Finance income and finance costs Council Group2012 2011 2012 2011$000 $000 $000 $000
Finance incomeInterest income: - money market and term deposits 180 149 429 299 - related party loans 207 162 - - - community loans 2 3 2 3 - other 36 32 67 68Dividend income - - () 1Total finance income 425 346 498 371
Finance costsInterest expense: - interest on bank borrowings 6,109 5,786 7,389 7,242 - interest on finance leases 34 - 34 - - discount on long term receivable (47) 68 (47) 68Total finance costs 6,096 5,854 7,376 7,310
Net finance costs 5,671 5,508 6,878 6,940

Wanganui District Council Annual Report for the year ended 30 June 2012
Page 28 of 170
Notes to the financial statements For the year ended 30 June 2012 3. Other revenue Council Group
2012 2011 2012 2011$000 $000 $000 $000
User charges 7,005 7,011 7,005 7,011New Zealand Transport Agency subsidies 10,334 11,343 10,334 11,343Regulatory revenue 1,511 1,537 1,511 1,537Rental from investment properties 1,798 1,707 1,798 1,707Infringements and fines 471 473 471 473Rendering of services 550 459 550 459Petrol tax 286 294 286 294Vested assets - - - -Development contributions 76 3 76 3Lotteries Grant - Krupp Gun 17 - 17 -Lotteries Grant - Arts Conservation project - 37 - 37Property, plant and equipment gains on disposal - 39 - 39Other government grants 792 512 792 512Forestry revenue 1,229 1,164 1,229 1,164Other (includes trading income from Wanganui Gas Limited) 1,607 819 44,486 45,626
Total other revenue 25,676 25,398 68,555 70,205
There are no unfulfilled conditions and other contingencies attached to New Zealand Transport Agency subsidies or any government grant recognised.
4. Gains Council Group2012 2011 2012 2011$000 $000 $000 $000
Non-financial instrumentsInvestment property revaluation gains (note 18) (713) 322 (601) 322Gain/(loss) arising from physical change of forestry assets - 303 - 303Gain/(loss) arising from change in fair value of forest assets - 441 - 441Decreases due to harvest of forest assets - (615) - (615)Change in fair value of property, plant and equipment - 91 - 91Total non-financial instruments gains (713) 542 (601) 542
Total gains (713) 542 (601) 542
5. Personnel costs Council Group2012 2011 2012 2011$000 $000 $000 $000
Salaries and wages 13,732 12,980 16,813 15,720Employer contributions to superannuation - - 47 39Increase/(decrease) in employee entitlements/liabilities 25 133 (96) 31
Total personnel costs 13,757 13,113 16,764 15,790

Wanganui District Council Annual Report for the year ended 30 June 2012
Page 29 of 170
Notes to the financial statements For the year ended 30 June 2012 6. Other expenses Council Group
2012 2011 2012 2011$000 $000 $000 $000
Fees to auditors: - fees to Audit New Zealand for financial statement audit 153 142 260 225 - fees to Audit New Zealand for audit of LTCCP amendment - 10 - 10 - fees to Audit New Zeland for 10-Year Plan audit 90 - 107 - - other audit fees 24 24Donations 2 1 2 1General grants 785 757 785 757Contractors 11,928 11,215 12,003 11,215Maintenance 1,815 2,571 1,820 2,571Electricity 2,289 2,347 2,289 2,347Planned maintenance 845 841 845 841Insurance premiums 896 429 896 429Directors' fees - - 214 209Consultants and legal fees 2,783 3,042 2,877 3,080Rates Expense 1,195 1,212 1,195 1,212(Gain)/loss arising from physical change of forestry assets (561) - (561) -(Gain)/loss arising from change in fair value of forest assets 447 - 447 -Decreases due to harvest of forest assets 1,150 - 1,150 -Property, plant and equipment losses on disposal 502 - 498Losses from derivative financial instruments 4,380 1,361 5,095 1,450Impairment of Shares in Subsidiary - - - -Impairment of receivables (note 9) 477 43 667 278Minimum lease payments under operating leases 75 66 265 268Forestry expenditure 738 592 738 592Other operating expenses 7,404 6,908 40,855 43,615
Total other expenses 37,417 31,537 72,471 69,100
7. TaxCouncil Group
2012 2011 2012 2011$000 $000 $000 $000
Components of tax expenseCurrent tax expense - - - -Deferred tax expense (28) (4) 282 528Income tax expense (28) (4) 282 528
Relationship between tax expense and accounting profitSurplus/(deficit) from continuing operations (13,059) 481 (10,683) 2,316Surplus/(deficit) from discontinued operations - - - (122)Surplus/(deficit) before tax (13,059) 481 (10,683) 2,194Tax at 28% (2011: 30%) (3,656) 144 (2,991) 658Non-deductible expenditure 3,562 (285) 3,249 (287)Loss not recognised 67 136 67 136Deferred tax adjustment (1) 1 (43) 21
Tax expense (28) (4) 282 528
CouncilA deferred tax asset has not been recognised in relation to tax losses of $5,400,000 (2011 $5,162,000). Tax losses have been recognised at group level.
Deferred tax liability Property,
plant and Financial Employeeequipment instruments Tax losses entitlements Total
Council $000 $000 $000 $000 $000Balance 1 July 2010 1,226 - (572) (7) 647Charged to profit and loss (3) - (2) 1 (4)Charged to equity - - - - -Balance 30 June 2011 1,223 - (574) (6) 643Charged to profit and loss (8) - (19) (1) (28)Charged to equity - - - - -Balance 30 June 2012 1,215 - (593) (7) 615
GroupBalance 1 July 2010 6,280 (362) (4,004) (132) 1,782Charge/(credit) to income (83) (4) 614 1 528Charge/(credit) to equity - - - -Balance 30 June 2011 6,197 (366) (3,390) (131) 2,310Charged to profit and loss (110) (205) 598 (1) 282Charged to equity - - - -Balance 30 June 2012 6,087 (571) (2,792) (132) 2,592

Wanganui District Council Annual Report for the year ended 30 June 2012
Page 30 of 170
Notes to the financial statements For the year ended 30 June 2012 8. Cash and cash equivalents Council Group
2012 2011 2012 2011$000 $000 $000 $000
Cash at bank and on hand 7,148 5,757 16,253 12,996Term deposits with maturities less than 3 months - - - -
Total cash and cash equivalents 7,148 5,757 16,253 12,996
The carrying value of cash at bank and term deposits with maturities less than three months approximate their fair value.
The total value of cash and cash equivalents that can only be used for a specific purpose as outlined in the relevant trust deeds is $nil(2011 $nil).
9. Debtors and other receivables Council Group2012 2011 2012 2011$000 $000 $000 $000
Rates receivables 3,274 2,767 3,274 2,767Other receivables: - related party receivables (note 27) 2,893 401 - - - New Zealand Transport Agency subsidies 573 1,555 573 1,555 - interest receivable 6 - 6 - - other 515 4,211 8,159 8,958Gross debtors and other receivables 7,261 8,934 12,012 13,280
Less provision for impairment (1,599) (1,339) (1,720) (1,454)
Total debtors and other receivables 5,662 7,595 10,292 11,826
Fair valueDebtors and other receivables are non-interest bearing and receipt is normally on 30-day terms, therefore the carrying value ofdebtors and other receivables approximate their fair value.
ImpairmentWDC does not provide for any impairment on rates receivable (except Maori land) as it has various powers under the Local Government(Rating) Act 2002 to recover any outstanding debts. Ratepayers can apply for payment plan options in special circumstances. Wheresuch repayment plans are in place, debts are discounted to their present value of future payments if the impact of discounting ismaterial.
These powers allow WDC to commence legal proceedings to recover any rates that remain unpaid 4 months after the due datefor payment. If payment has not been made within 3 months of the Court's judgement, then WDC can apply to the Registrarof the High Court to have the judgement enforced by sale or lease of the rating unit.
The status of receivables as at 30 June 2012 and 2011 are detailed below:
2012Gross Impairment Net$000 $000 $000
CouncilNot past due 2,863 - 2,863Past due 1-60 days 441 - 441Past due 61-120 days 138 (1) 137Past due > 120 days 3,819 (1,598) 2,221Total 7,261 (1,599) 5,662
2011Gross Impairment Net$000 $000 $000
CouncilNot past due 5,428 (4) 5,424Past due 1-60 days 273 (28) 245Past due 61-120 days 80 (18) 62Past due > 120 days 3,153 (1,289) 1,864Total 8,934 (1,339) 7,595

Wanganui District Council Annual Report for the year ended 30 June 2012
Page 31 of 170
Notes to the financial statements For the year ended 30 June 2012
2012Gross Impairment Net$000 $000 $000
GroupNot past due 7,233 - 7,233Past due 1-60 days 557 - 557Past due 61-120 days 380 (117) 263Past due > 120 days 3,842 (1,603) 2,239Total 12,012 (1,720) 10,292
2011Gross Impairment Net$000 $000 $000
GroupNot past due 9,372 (4) 9,368Past due 1-60 days 430 (28) 402Past due 61-120 days 310 (131) 179Past due > 120 days 3,168 (1,291) 1,877Total 13,280 (1,454) 11,826
All receivables greater than 30 days in age are considered to be past due.
The impairment provision has been calculated based on expected losses for WDC's pool of debtors. Expected losses have been determinedbased on an analysis of WDC's losses in previous periods, and review of specific debtors as detailed below:
Council Group2012 2011 2012 2011$000 $000 $000 $000
Individual impairment 130 171 248 286Collective impairment 1,469 1,168 1,472 1,168Total provision for impairment 1,599 1,339 1,720 1,454
Individually impaired receivables have been determined to be impaired because of the significant financial difficulties being experienced bythe debtor. An analysis of these individually impaired debtors are as follows:
Council Group2012 2011 2012 2011$000 $000 $000 $000
Not past due - 4 - 6Past due 1-60 days - 28 - 28Past due 61-120 days 1 19 117 131Past due > 120 days 129 119 131 122Total individual impairment 130 170 248 287
Movements in the provision for impairment of receivables are as follows:Council Group
2012 2011 2012 2011$000 $000 $000 $000
At 1 July 1,339 1,372 1,454 1,496Additional provisions made during the year 381 42 487 166Provisions reversed during the year (35) - (34) 1Receivables written-off during period (86) (75) (187) (209)At 30 June 1,599 1,339 1,720 1,454
WDC holds no collateral as security or other credit enhancements over receivables that are either past due or impaired.

Wanganui District Council Annual Report for the year ended 30 June 2012
Page 32 of 170
Notes to the financial statements For the year ended 30 June 2012 10. Other financial assets Council Group
2012 2011 2012 2011$000 $000 $000 $000
Current portionSinking funds 65 64 65 64Loans to related parties (note 27) 10 217 10 217Long term receivables 704 - 704 -Total current portion 779 281 779 281
Non-current portionCommunity loans 35 59 35 59Long term receivables 2,970 3,440 220 690Hire purchase long term debtors - - 3 23Government Indexed Bonds 733 710 733 710Unlisted shares in NZ Local Government Insurance Corporation Limited 355 222 355 222Sarjeant Gallery NJ Young Fund with ABN Amro - - 448 420Listed shares in Vector Limited - - 14 14Listed shares in NZ Windfarm Limited - - 8 7Shares in subsidiary (at cost - WDCHL) 10,162 10,162 - -Total non-current portion 14,255 14,593 1,816 2,145
Total other financial assets 15,034 14,874 2,595 2,426
Fair value
Term DepositsThe carrying amounts of term deposits approximates their fair value $nil (2011 $nil).
Government stockThe fair value of government stock is its carrying value.
Community loansThe fair value of community loans is their carrying value of $35,000 (2011 $59,000). The terms of the loans may be discretionary as a resultof a Council decision.
Loans to related partiesThe fair value and carrying amount of loans to related parties is $10,000 (2011 $221,000).
Unlisted sharesThe unlisted shares in NZ Local Government Insurance Corporation Limited are valued using the net assets of the company. Councilconsiders this to be fair value at 30 June 2012.
Quoted sharesThe fair values of listed shares are determined by reference to published current bid price quotation in an active market.
Sinking fundsSinking funds are put aside for the repayment of loans and are held by the Wanganui District Council Sinking Fund Commissioners. Sinkingfund investments are restricted in use to the repayment of associated borrowings.
The Sarjeant Gallery NJ Young Fund with ABN Amro is valued at market value. Council considers this to be fair value at 30 June 2012.
ImpairmentThere were no impairment provisions for other financial assets. None of the financial assets are either past due or impaired.

Wanganui District Council Annual Report for the year ended 30 June 2012
Page 33 of 170
Notes to the financial statements For the year ended 30 June 2012 11. Inventories Council Group
2012 2011 2012 2011$000 $000 $000 $000
Held for distribution/Commercial inventoriesInventory 71 99 71 116Network - - 198 195Appliances - - 8 2
Total inventories 71 99 277 313
Inventories are pledged as security for liabilities - $198,580 (2011 $195,000). There has been no write-down of commercial inventories to netrealisable value (2011 $nil).
12. Non-current assets held for sale
Non-current assets held for sale at 30 June are: 8 Gilmour Street, 57 Heads Road, 25 Tawa Street,10, 14 and 18 Windsor Terrace.
Council Group2012 2011 2012 2011$000 $000 $000 $000
Land 792 898 792 898Buildings 31 31 31 31
Total non-current assets held for sale 823 929 823 929
13. Derivative financial instrumentsCouncil Group
2012 2011 2012 2011$000 $000 $000 $000
Current asset portionInterest rate swaps - fair value hedges - - - -
- - - -
Non-current asset portionInterest rate swaps - fair value hedges - - - -
- - - -Total derivative financial instrument assets - - - -
Current liability portionInterest rate swaps - fair value hedges - 39 - 67
- 39 - 67
Non-current liability portionInterest rate swaps - fair value hedges 9,991 5,573 11,800 6,638
9,991 5,573 11,800 6,638Total derivative financial instrument liabilities 9,991 5,612 11,800 6,705
Fair valueThe fair values of interest rate swaps have been determined using a discounted cash flows valuation technique based on quoted marketprices.
Interest rate swapsThe notional principal amounts of the outstanding interest rate swap contracts for WDC were $67,000,000 (2011 $63,000,000) and forthe WDC group were $82,500,000 (2011 $80,500,000).

Wanganui District Council Annual Report for the year ended 30 June 2012
Page 34 of 170
Notes to the financial statements For the year ended 30 June 2012 14. Investments in associates
2012 2011 2012 2011$000 $000 $000 $000
Ruapehu, Wanganui, Rangitikei Economic Development Trust (RED Trust) (3) 2 (3) 2Whanganui River Enhancement Charitable Trust (WRET) 70 83 70 83New Zealand Masters Games Limited (NZMGL) 16 13 16 13Manawatu Wanganui Local Advisory Shared Services (MW LASS) 1 1 1 1
Total investments in associates 84 99 84 99
Summarised financial information of associate entitiesRED Trust
2012 2011$000 $000
Assets 3 23Liabilities 12 17Revenues 65 32Surplus/(deficit) (1) 11Group's interest 33% 33%
WRET2012 2011$000 $000
Assets 383 367Liabilities 174 116Revenues 139 133Surplus/(deficit) (41) 22Group's interest 33% 33%
NZMGL2012 2011$000 $000
Assets 36 26Liabilities 2 -Revenues 19 18Surplus/(deficit) (18) (19)Group's interest 49% 49%
MWLASS2012 2011$000 $000
Assets 255 173Liabilities 246 165Revenues 384 548Surplus/(deficit) 1Group's interest 14% 14%
All associates are not listed companies and, accordingly, there are no published price quotations to determine the fair value of theinvestments.
Wanganui-Manawatu LASS Limited This company has been set up in 2008 by seven Local Councils to investigate the possibilities of economies of scale by joint procurement.
Council Group

Wanganui District Council Annual Report for the year ended 30 June 2012
Page 35 of 170
Notes to the financial statements For the year ended 30 June 2012 15. Property, plant and equipment
Movements for each class of property, plant and equipment are as follows:
Cost/ revaluation
Accumulated depreciation
and impairment
chargesCarrying amount
Current year additions
Current year disposals
Accumulated depreciation
eliminated on disposals /
revaluationsCurrent year depreciation
Current year Impairment
charges TransfersDepreciation
TransfersRevaluation
surplusCost/
revaluation
Accumulated depreciation
and impairment
chargesCarrying amount
Council 2012 1/7/2011 1/7/2011 1/7/2011 30/6/2012 30/6/2012 30/6/2012$000 $000 $000 $000 $000 $000 $000 $000 $000 $000 $000 $000 $000 $000
Operational assetsLand 54,350 - 54,350 201 (68) - - - - - - 54,483 - 54,483Buildings 63,428 (1,320) 62,108 1,014 (618) 24 (1,295) (11,534) - - 63,824 (14,125) 49,699Plant, equipment and motor vehicles 10,033 (7,644) 2,389 519 (146) 145 (899) - - - - 10,406 (8,398) 2,008Leased equipment 573 (573) () 587 (129) - 1,160 (702) 458Furniture and fittings 2,809 (1,882) 927 67 (1) 1 (117) - - - - 2,875 (1,998) 877Library books 3,584 (2,038) 1,546 320 - - (291) - - - - 3,904 (2,329) 1,575Artworks 28,806 - 28,806 123 - - - - 28 - - 28,957 - 28,957Capital work in progress 242 - 242 - - - - - (28) - - 214 - 214Total operational assets 163,825 (13,457) 150,368 2,831 (833) 170 (2,731) (11,534) - - 165,823 (27,552) 138,271
Infrastructural assetsWastewater system 246,479 - 246,479 2,522 - - (4,919) - - - - 249,001 (4,919) 244,082Water system 73,199 - 73,199 1,314 - - (1,862) (1,109) - - - 74,513 (2,971) 71,542Roading network 350,436 (14,103) 336,333 10,413 - 19,213 (5,110) - - - (6,331) 354,518 - 354,518Land under roads 8,056 - 8,056 - (6) - - - - - - 8,050 - 8,050Airport runway 2,063 - 2,063 - - - (28) - - - - 2,063 (28) 2,035Total infrastructural assets 680,233 (14,103) 666,130 14,249 (6) 19,213 (11,919) (1,109) - (6,331) 688,145 (7,918) 680,227
Restricted assetsLand 15,193 - 15,193 - - - - - (1,323) - - 13,870 - 13,870Buildings 5,077 (104) 4,973 10 - - (102) (887) - - - 5,087 (1,093) 3,994Total restricted assets 20,270 (104) 20,166 10 - - (102) (887) (1,323) - 18,957 (1,093) 17,864
Total property, plant and equipment 864,328 (27,664) 836,664 17,090 (839) 19,383 (14,752) (13,530) (1,323) - (6,331) 872,925 (36,563) 836,362

Wanganui District Council Annual Report for the year ended 30 June 2012
Page 36 of 170
Notes to the financial statements For the year ended 30 June 2012
Cost/ revaluation
Accumulated depreciation
and impairment
chargesCarrying amount
Current year additions
Current year disposals
Accumulated depreciation
eliminated on disposals /
revaluations
Current year depreciation
& Impairment charges
Current year Impairment
charges TransfersDepreciation
TransfersRevaluation
surplusCost/
revaluation
Accumulated depreciation
and impairment
chargesCarrying amount
Group 2012 1/7/2011 1/7/2011 1/7/2011 30/6/2012 30/6/2012 30/6/2012$000 $000 $000 $000 $000 $000 $000 $000 $000 $000 $000 $000 $000 $000
Operational assetsLand 54,389 - 54,389 201 (68) - - - - - - 54,522 - 54,522Buildings 64,086 (1,469) 62,617 1,015 (619) 24 (1,334) (11,534) - - 64,482 (14,313) 50,169Plant, equipment and motor vehicles 11,500 (8,536) 2,964 1,338 (185) 155 (1,149) - - - - 12,653 (9,530) 3,123Leased equipment 573 (573) () - - - - - - - - 573 (573) ()Furniture and fittings 2,864 (1,916) 948 67 (1) 1 (124) - - - - 2,930 (2,039) 891Library books 3,584 (2,038) 1,546 320 - - (291) - - - - 3,904 (2,329) 1,575Art work 28,806 - 28,806 123 - - - - 28 - - 28,957 - 28,957Capital work in progress 241 - 241 - - - - - (28) - - 213 - 213Total operational assets 166,043 (14,532) 151,511 3,064 (873) 180 (2,898) (11,534) - - 168,234 (28,784) 139,450
Infrastructural assetsWastewater system 246,479 (1) 246,478 2,522 - - (4,919) - - - - 249,001 (4,920) 244,081Water system 73,199 - 73,199 1,314 - - (1,862) (1,109) - - - 74,513 (2,971) 71,542Roading network 350,435 (14,103) 336,332 10,414 - 19,213 (5,110) - - - (6,331) 354,518 - 354,518Land under roads 8,056 - 8,056 - (6) - - - - - - 8,050 - 8,050Airport runway 2,063 - 2,063 - - - (28) - - - - 2,063 (28) 2,035Gas network infrastructure 26,191 (2,383) 23,808 881 (826) 27,072 (3,209) 23,863Total infrastructural assets 706,423 (16,487) 689,936 15,131 (6) 19,213 (12,745) (1,109) - - (6,331) 715,217 (11,128) 704,089
Restricted assetsLand 15,633 - 15,633 - - - - - (1,323) - - 14,310 - 14,310Buildings 5,417 (104) 5,313 10 - - (102) (887) - - 5,427 (1,093) 4,334Total restricted assets 21,050 (104) 20,946 10 - - (102) (887) (1,323) - 19,737 (1,093) 18,644
Total property, plant and equipment 893,516 (31,123) 862,393 18,205 (879) 19,393 (15,745) (13,530) (1,323) (6,331) 903,188 (41,005) 862,183

Wanganui District Council Annual Report for the year ended 30 June 2012
Page 37 of 170
Notes to the financial statements For the year ended 30 June 2012
Cost/ revaluation
Accumulated depreciation
and impairment
chargesCarrying amount
Current year additions
Current year disposals
Accumulated depreciation
eliminated on disposals
Current year depreciation Transfer
Depreciation Transfers
Revaluation surplus
Cost/ revaluation
Accumulated depreciation
and impairment
chargesCarrying amount
Council 2011 1/7/2010 1/7/2010 1/7/2010 30/6/2011 30/6/2011 30/6/2011$000 $000 $000 $000 $000 $000 $000 $000 $000 $000 $000 $000
Operational assetsLand 56,976 - 56,976 - (576) - - (2,050) - - 54,350 - 54,350Buildings 76,599 (93) 76,506 2,721 (15,785) 1 (1,247) (107) 19 - 63,428 (1,320) 62,108Plant, equipment and motor vehicles 9,510 (6,832) 2,678 614 (195) 174 (967) 104 (19) - 10,033 (7,644) 2,389Leased equipment 573 (573) () - - - - - - - 573 (573) ()Furniture and fittings 2,735 (1,803) 932 103 (29) 29 (108) - - - 2,809 (1,882) 927Library books 3,264 (1,696) 1,568 320 - - (342) - - - 3,584 (2,038) 1,546Artworks 32,149 - 32,149 112 - - - - - (3,455) 28,806 - 28,806Capital work in progress 1,360 - 1,360 82 - - - (1,200) - - 242 - 242Total operational assets 183,166 (10,997) 172,169 3,952 (16,585) 204 (2,664) (3,253) (3,455) 163,825 (13,457) 150,368
Infrastructural assetsWastewater system 231,244 (4,521) 226,723 4,565 - 9,129 (4,608) - - 10,670 246,479 - 246,479Water system 71,456 (1,731) 69,725 2,512 - 3,570 (1,839) - - (769) 73,199 - 73,199Roading network 339,208 (9,212) 329,996 11,228 - - (4,891) - - - 350,436 (14,103) 336,333Land under roads 8,056 - 8,056 - - - - - - - 8,056 - 8,056Airport runway 1,776 (34) 1,742 267 - 70 (36) - - 20 2,063 - 2,063Total infrastructural assets 651,740 (15,498) 636,242 18,572 - 12,769 (11,374) - 9,921 680,233 (14,103) 666,130
Restricted assetsLand 30,802 - 30,802 - (91) - - (15,518) - - 15,193 - 15,193Buildings 5,628 (10) 5,618 688 (1) (94) (1,238) - - 5,077 (104) 4,973Total restricted assets 36,430 (10) 36,420 688 (92) (94) (16,756) - 20,270 (104) 20,166
Total property, plant and equipment 871,336 (26,505) 844,831 23,212 (16,677) 12,973 (14,132) (20,009) 6,466 864,328 (27,664) 836,664

Wanganui District Council Annual Report for the year ended 30 June 2012
Page 38 of 170
Notes to the financial statements For the year ended 30 June 2012
Cost/ revaluation
Accumulated depreciation
and impairment
chargesCarrying amount
Current year additions
Current year disposals
Accumulated depreciation
eliminated on disposals
Current year depreciation Transfers
Depreciation Transfers
Revaluation surplus
Cost/ revaluation
Accumulated depreciation
and impairment
chargesCarrying amount
Group 2011 1/7/2010 1/7/2010 1/7/2010 30/6/2011 30/6/2011 30/6/2011$000 $000 $000 $000 $000 $000 $000 $000 $000 $000 $000 $000
Operational assetsLand 56,976 - 56,976 39 (576) - - (2,050) - 54,389 - 54,389Buildings 76,906 (211) 76,695 3,079 (15,792) 3 (1,280) (107) 19 64,086 (1,469) 62,617Plant, equipment and motor vehicles 10,691 (7,616) 3,075 924 (219) 182 (1,083) 104 (19) 11,500 (8,536) 2,964Leased equipment 573 (573) () - - - - - - - 573 (573) ()Furniture and fittings 2,786 (1,831) 955 109 (31) 30 (115) - - 2,864 (1,916) 948Library books 3,264 (1,696) 1,568 320 - - (342) - - - 3,584 (2,038) 1,546Art work 32,149 - 32,149 112 - - - - - (3,455) 28,806 - 28,806Capital work in progress 1,359 - 1,359 82 - - - (1,200) - - 241 - 241Total operational assets 184,704 (11,927) 172,777 4,665 (16,618) 215 (2,820) (3,253) (3,455) 166,043 (14,532) 151,511
Infrastructural assetsWastewater system 231,244 (4,522) 226,722 4,565 - 9,129 (4,608) - - 10,670 246,479 (1) 246,478Water system 71,456 (1,731) 69,725 2,512 - 3,570 (1,839) - - (769) 73,199 - 73,199Roading network 339,208 (9,212) 329,996 11,227 - - (4,891) - - - 350,435 (14,103) 336,332Land under roads 8,056 - 8,056 - - - - - - - 8,056 - 8,056Airport runway 1,776 (34) 1,742 267 - 70 (36) - - 20 2,063 - 2,063Gas network infrastructure 25,317 (1,581) 23,736 874 - - (802) - - 26,191 (2,383) 23,808Total infrastructural assets 677,057 (17,080) 659,977 19,445 - 12,769 (12,176) - 9,921 706,423 (16,487) 689,936
Restricted assetsLand 31,242 - 31,242 - (91) - - (15,518) - - 15,633 - 15,633Buildings 6,524 (10) 6,514 688 (1) (94) (1,794) - - 5,417 (104) 5,313Total restricted assets 37,766 (10) 37,756 688 (92) (94) (17,312) - 21,050 (104) 20,946
Total property, plant and equipment 899,527 (29,017) 870,510 24,798 (16,710) 12,984 (15,090) (20,565) 6,466 893,516 (31,123) 862,393

Wanganui District Council Annual Report for the year ended 30 June 2012
Page 39 of 170
Notes to the financial statements For the year ended 30 June 2012 15. Property, plant and equipment (continued)
Valuation
Operational and restricted land and buildingsAt fair value as determined from market-based evidence by an independent valuer. The most recent valuation was performed by Mr KD Pawson, Morgans Property Advisors, Valuers and the valuation is effective as at 30 June 2010. Forestry land has been valued by M RN Goudie, Goudie & Associates, Valuers and the valuation is effective as at 30 June 2010.
Infrastructural asset classes: roads, airport runway, water system, sewerage reticulation, stormwater system and gas distribution networkAt fair value determined on a depreciated replacement cost basis by an independent valuer. At balance date WDC assesses the carryingvalues of its infrastructural assets to ensure that they do not differ materially from the assets’ fair values. If there is a material difference,then the off-cycle asset classes are revalued. The most recent valuation of roading assets was performed by Robin Mackie (an employee of the WDC),NZCE, Member of NZWWA, as at 30 June 2012. John Vessey, of Opus International Consultants (Wellington), has confirmed the methodology.
The valuation of the water reticulation, wastewater reticulation and stormwater systems and airport assetswas undertaken by Robin Mackie (an employee of the WDC), NZCE, Member of NZWWA, at 30 June 2011. John Vessey, of OpusInternational Consultants Ltd (Wellington), has confirmed the methodology. It is WDC’s policy to revalue roading and airport infrastructureassets every three years and the water reticulation, wastewater reticulation and stormwater systems annually, but is only booked if the movement is greater than 10% of the carrying value of the assets at balance date.
The distribution network of WGL is valued at depreciated replacement cost, as at 30 June 2008 by Geoff Evans, BE (Mech) - NetworkManager and reviewed in accordance with NZ IAS 16 by Bruce Wattie, CA, BCA, Partner - Financial Advisory Services, of PricewaterhouseCoopers, and James Coe BSc, BE (Electrical), MBA, and member of IPENZ - Director, JT Consulting Limited and aNZ IFRS/ODV review by Guenter Wabnitz, Dip Ing, CPEng, MIPENZ, Principal Consultant Gas and Clean Fuels, Maunsell Limited. Thenetwork is revalued on a three yearly cycle. The revaluation for 2011 has been deferred until 2013 due to the work being carried out bythe Commerce Commission in the Gas Sector.
Land under roadsLand under roads was valued at 30 June 2003 and this valuation is considered deemed cost. Under NZ IFRS WDC has elected to use the fairvalue of land under roads as at 30 June 2003 as deemed cost. Land under roads is no longer revalued. Subsequent additions are shown at cost.
Art collectionThe art collection of the Sarjeant Gallery has been valued by Mr James Parkinson of Art + Object; Christies of London and Mr Greg Anderson, Curator,Sarjeant Gallery on 30 June 2011. This is considered deemed cost. Subsequent additions are shown at cost. The complete art collection is in theprocess of being catalogued. When this process has been completed the entire art collection will receive a full revaluaion.
ImpairmentIn addition to Impairment losses on earthquake prone buildings recognised in note 37, impairment losses of $1.109M have been bookedrelating to the Abelard water bore, for the year ended 30 June 2012 (2011 $nil).
Work in progressThe total amount of property, plant and equipment in the course of construction is $215,000 (2011 $241,210).
LeasingThe net carrying amount of plant and equipment held under finance leases is $457,000 (2011 $nil).

Wanganui District Council Annual Report for the year ended 30 June 2012
Page 40 of 170
Notes to the financial statements For the year ended 30 June 2012 16. Intangible assets Council
computer Council Council Group Group Groupsoftware other total other goodwill
$000 $000 $000 $000 $000 $000Movements for each class of intangible asset are as follows:
Balance at 1 July 2011Cost 2,412 - 2,412 1,801 10,226 14,439Accumulated amortisation and impairment (1,999) - (1,999) (1,169) - (3,168)Opening carrying amount 413 - 413 632 10,226 11,271
Year ended 30 June 2012Additions 235 235 53 - 288Amortisation charge (196) - (196) (356) - (552)Disposals/Transfers - - - (7) - (7)Amortisation charge eliminated on disposal - - - - - -Revaluation increament - 159 159 - - 159Closing carrying amount 39 159 198 (310) - (112)
Year ended 30 June 2012Cost 2,647 159 2,806 1,847 10,226 14,879Accumulated amortisation and impairment (2,195) - (2,195) (1,525) - (3,720)Closing carrying amount 452 159 611 322 10,226 11,159
Balance at 1 July 2010 -Cost 2,057 - 2,057 1,743 8,000 11,800Accumulated amortisation and impairment (1,785) - (1,785) (825) - (2,610)Opening carrying amount 272 - 272 918 8,000 9,190
Year ended 30 June 2011Additions 355 - 355 58 2,226 2,639Amortisation charge (214) - (214) (344) - (558)Disposals/Transfers - - - - - -Amortisation charge eliminated on disposal - - - - - -Closing carrying amount 141 - 141 (286) 2,226 2,081
Year ended 30 June 2011Cost 2,412 - 2,412 1,801 10,226 14,439Accumulated amortisation and impairment (1,999) - (1,999) (1,169) - (3,168)Closing carrying amount 413 - 413 632 10,226 11,271
Council other intangible assets relate to WDCFJC's holdings of Carbon Credits under the Emissions Trading Scheme.There are no restrictions over the title of WDC's intangible assets, nor are any intangible assets pledged as security for liabilities.
Impairment
GoodwillGoodwill arises on consolidation of Wanganui Gas Limited in the books of Wanganui District Council Holdings Limited.

Wanganui District Council Annual Report for the year ended 30 June 2012
Page 41 of 170
Notes to the financial statements For the year ended 30 June 2012 17. Forestry assets Council Group
2012 2011 2012 2011$000 $000 $000 $000
Balance at 1 July 4,241 4,112 4,241 4,112Increases due to purchases - - - -Gain/(loss) arising from physical change 561 303 561 303Gain/(losses) arising from changes in fair value (447) 441 (447) 441Decreases due to harvest (1,150) (615) (1,150) (615)Other changes - - - -
Balance at 30 June 3,205 4,241 3,205 4,241
Through its investment in the Wanganui District Councils' Forestry Joint Committee, WDC owns 1,080 hectares of pinus radiata forest, which are at varying stages of maturity ranging up to 28 years.
Valuation assumptionsIndependent registered valuers Alan Bell and Associates have valued forestry assets as at 30 June 2012. The following valuation assumptionshave been adopted in determining the fair value of forestry assets: - a pre-tax discount rate of 7% (2011 7%) has been used in discounting the present value of expected cash flows; - notional land rental costs have been included for freehold land; - the forest has been valued on a going concern basis and only includes the value of the existing crops on a single rotation basis; - no allowance for inflation has been provided; - costs are current average costs. No allowance has been made for cost improvements in future operations; and - log prices are based on a 3 year historical rolling average.
Financial risk management strategiesWDC is exposed to financial risks arising from changes in timber prices. WDC is a long-term forestry investor and does not expect timberprices to decline significantly in the foreseeable future, therefore, has not taken any measures to manage the risks of a decline in timber prices.WDC reviews its outlook for timber prices regularly in considering the need for active financial risk management.
Fire - All forest estate is insured for loss from fire based on the latest valuation from Alan Bell, Registered Forest Consultant. On site mitigationincludes updating the Rural Fire Authority and neighbours on access and risk issues, contacts and procedures. It also includes maintaining maps ofwater supplies and access to such. During the Fire Season (1 October to 30 April) the Fire Weather Index is monitored and on site operationscurtailed or cancelled depending on extent of risk. All contractors must have operative fire plans and be fully covered for insurance.
Tree Health - Regular surveillance with a defined procedure to have samples analysed at ENSIS (Forest Research) for any suspicious fungal orinsect damage.
Pestilence - Control of animal and plant pests is ongoing. Uncontrolled, they can cause damage or mortality to the crop. Animal control isfocused on goats and hares at establishment and possums in mid rotation. Plant pests are focused on new "invaders" with liaison and reportingto the Regional Council's Plant Pest division.
Security - All properties have secured access available only to registered key holders. Contractors and other forest users are given full briefingsfor health and safety reasons and to avoid any third party claims.
Harvesting - Local, national and international prices, transport costs and supply and demand are monitored to be aware of impending suddendecreases or potential increases in prices. If the latter occurs, production levels may be increased. All contracts have a 3 month exit clause orsooner by agreement. Access roads are established at least 6 months in advance of harvesting to allow them to stabilise in order to preventcollapse during operations. If this happens, timber may be isolated and lose quality. A bond is held with BNZ for the current harvesting agent,John Turkington Limited, to cover one month's harvesting if payment is in default. At present this is $50,000 (2010 $30,000).

Wanganui District Council Annual Report for the year ended 30 June 2012
Page 42 of 170
Notes to the financial statements For the year ended 30 June 2012 18. Investment property Council Group
2012 2011 2012 2011$000 $000 $000 $000
Balance at 1 July 24,579 4,282 23,799 2,946Additions from acquisitions 151 244 151 245Disposals/Transfers 1,305 19,731 1,303 20,286Fair value gains/(losses) on valuation (713) 322 (600) 322Fair value of Investment properties (before impairment) 25,322 24,579 24,653 23,798Less Impairment of earthquake prone buildings (916) - (916) -Balance at 30 June 24,406 24,579 23,737 23,799
WDC's investment properties are valued annually at fair value effective 30 June. All investment properties were valued based on open market evidence. The valuation was performed by Morgans Property Advisers (Morgans). Morgans is an experienced valuer with extensive market knowledge in the types of investment properties owned by WDC.
The fair value of investment property has been determined using the capitalisation of net income and discounted cash flow methods. Thesemethods are based upon assumptions including future rental income, anticipated maintenance costs, and appropriate discount rates.
Council Group2012 2011 2012 2011$000 $000 $000 $000
Rental income 1,798 1,707 1,798 1,707Expenses from investment property generating income (714) (536) (714) (536)Expenses from investment property not generating income - - - -Contractual obligations for capital expenditure - - - -Contractual obligations for operating expenditure - - - -
19. Joint ventures
WDC has a 50/50 joint venture with the Crown to operate the Wanganui Airport. WDC's interest in the jointly controlled operation is as follows:
Council and Group2012 2011$000 $000
Current assets 55 137Non-current assets 5,691 5,766Current liabilities 67 148Non-current liabilities 616 644Income 222 215Expenses 317 231
WDC has an interest in the Wanganui District Councils' Forestry Joint Committee. WDC's share is 95.09%. WDC's interest in the jointlycontrolled operation is as follows:
Council and Group2012 2011$000 $000
Current assets 968 829Non-current assets 5,677 6,632Current liabilities 74 70Non-current liabilities - -Income 1,279 1,181Expenses 1,773 458
Joint venture commitments and contingenciesDetails of any commitments and contingencies arising from the group's involvement in the joint ventures are disclosed separately in notes 25 and 26.

Wanganui District Council Annual Report for the year ended 30 June 2012
Page 43 of 170
Notes to the financial statements For the year ended 30 June 2012 20. Creditors and other payables Council Group
2012 2011 2012 2011$000 $000 $000 $000
Trade payables 3,990 5,757 15,286 16,548Deposits and bonds 730 1,024 730 1,024Accrued expenses 127 813 140 822Amounts due to related parties (note 27) 8 154 - -Rates in advance 356 336 356 336Other payables 154 148 154 148Accrued interest payable 810 838 1,091 1,168Revenue in advance 507 475 507 475
Total creditors and other payables 6,682 9,545 18,264 20,521
Creditors and other payables are non-interest bearing and are normally settled on 30-day terms, therefore the carrying value of creditorsand other payables approximates their fair value.
21. Borrowings Council Group2012 2011 2012 2011$000 $000 $000 $000
Current portionSecured loans 27,000 20,000 28,250 21,250Finance leases 188 - 188 -Total current portion 27,188 20,000 28,438 21,250
Non-current portionSecured loans 64,550 68,550 81,300 86,818Finance leases 265 - 265 -Total non-current borrowings 64,815 68,550 81,565 86,818
Total borrowings 92,003 88,550 110,003 108,068
Secured loansWDC's secured debt of $91,550,000 (2011 $88,550,000) is mostly issued at floating rates of interest. For floating rate debt, the interest rateis reset quarterly based on the 90-day bill rate plus a margin of 0.45-2.25% for credit risk.
There is a multi option credit facility of $20,000,000 (2011 $10,000,000) available with Westpac. At year end there had been drawdowns of $8,000,00(2011 $4,000,000) on this facility. In addition WDC has a $100,000 credit card facility with ANZ Bank. At June 2012 $7,244 was owing on this facility(2011 $3,427). WDC also has a $40,000 business mastercard facility with Westpac. At June 2012 nil was owing on this facility (2011 $nil).
SecurityCouncil loans are secured over rates revenue or property. There has been no variation to the Liability Management Policy during the2011/12 year.
Stock security certificates pursuant to a general security arrangement for $22,000,000 are held by Westpac.
Lease liabilities are effectively secured as the rights to the leased asset revert to the lessor in the event of default.
Fair values of non-current borrowingsThe carrying amounts and the fair values of non-current borrowings are as follows:
Carrying amounts Fair values2012 2011 2012 2011
Secured loans (Council) 91,550 88,550 84,328 50,062
The fair values are based on cash flows discounted using a rate based on the borrowing rates ranging from of 2.74% to 10.50% (2011 2.88%to 10.50%).
The carrying amounts of borrowings repayable within one year approximate their fair value, as the impact of discounting is not significant.

Wanganui District Council Annual Report for the year ended 30 June 2012
Page 44 of 170
Notes to the financial statements For the year ended 30 June 2012 Analysis of finance leases Council Group
2012 2011 2012 2011$000 $000 $000 $000
Total minimum lease payments are payableNot later than one year 225 - 225 -Later than one year and not later than five years 283 - 283 -Later than five years - - - -Total minimum lease payments 508 - 508 -Future finance charges (55) - (55) -Present value of minimum lease payments 453 - 453 -
Present value of minimum lease payments payableNot later than one year 188 - 188 -Later than one year and not later than five years 265 - 265 -Later than five years - -Total present value of minimum lease payments 453 - 453 -
Represented by:Current 188 - 188 -Non-current 265 - 265 -Total finance leases 453 - 453 -
Description of material leasing arrangementsWDC has entered into finance leases for various items of plant and equipment. The net carrying amount of the leased items within each classof property, plant and equipment is shown in note 15.
The finance leases can be renewed at WDC's option, with rents set by reference to current market rates for items of equivalent age andcondition. WDC does have the option to purchase the asset at the end of the lease term.
There are no restrictions placed on WDC by any of the finance leasing arrangements. 22. Employee entitlements Council Group
2012 2011 2012 2011$000 $000 $000 $000
Current portionAccrued pay 537 461 681 554Annual leave 1,213 1,157 1,213 1,270Retirement and long service leave 185 172 185 174Sick leave 15 11 15 21Total current portion 1,950 1,801 2,094 2,019
Non-current portionRetirement and long service leave 407 455 407 455Total non-current portion 407 455 407 455
Total employee entitlements 2,357 2,256 2,501 2,474
The present value of retirement and long service leave obligations depend on a number of factors that are determined on an actuarial basis. Two keyassumptions used in calculating this liability include the discount rate and the salary inflation factor. Any changes in these assumptions will affect the carrying amount of the liability.
Expected future payments are discounted using forward discount rates derived from the yield curve of New Zealand government bonds. The discount rates used are from 2 year, 5 year and 10 year bond yields. The salary inflation factor has been determined after considering historical salary inflationpatterns. An average discount rate of 2.91% (2011 4.08%) and an inflation factor of 3.2% (2011 3%) were used.

Wanganui District Council Annual Report for the year ended 30 June 2012
Page 45 of 170
Notes to the financial statements For the year ended 30 June 2012 23. Equity Council Group
2012 2011 2012 2011$000 $000 $000 $000
Retained earningsBalance at 1 July 518,957 523,855 520,464 524,188Asset adjustment to equity 1 July - (5,654) - (5,654)Transfers (to)/from restricted reserves 10,282 (77) 10,282 (77)Adjustment to equity from CCO's - (120) (11) (127)Transfers from property revaluation reserves on disposal 637 468 637 468Surplus/(deficit) for the year (13,031) 485 (10,965) 1,666
Balance at 30 June 516,845 518,957 520,408 520,4641
Restricted reservesBalance at 1 July 64,096 64,019 64,096 64,019Transfers (to)/from retained earnings (10,284) 77 (10,284) 77
Balance at 30 June 53,812 64,096 53,812 64,096
Restricted reserves consist of: - Trusts and bequests - Self funding insurance - City & Harbour Endowment
Asset revaluation reservesBalance at 1 July 205,487 196,815 205,711 197,040Write back to revaluation reserve 1 July - (10,005) - (10,005)Revaluation gains/(losses) 11,743 19,145 11,741 19,144Impairment of earthquake prone buildings (5,776) - (5,776) -Transfer to accumulated funds on disposal of property (637) (468) (637) (468)Tax on property revaluations - - - -
Balance at 30 June 210,817 205,487 211,039 205,711
Asset revaluation reserves consist of:Operational assets: - land 35,464 35,553 35,464 35,553 - buildings - 5,470 - 5,470 - library books - - - - - Artworks 4,763 4,763 4,763 4,763Infrastructural assets: - wastewater system 90,846 90,846 90,843 90,846 - water system 11,481 12,589 11,481 12,589 - roading network 49,185 36,301 49,185 36,301 - Airport runway - - - - - gas network infrastructure - - 225 224Restricted assets: - land 16,533 16,533 16,533 16,533 - buildings 2,545 3,432 2,545 3,432
210,817 205,487 211,039 205,711
Other reservesBalance at 1 July 104 325 81 297Valuation gains/(losses) taken to equity 21 (221) 18 (216)Carbon credits 159 - 159 -
Balance at 30 June 284 104 258 81
Other reserves consist of: - Fair value through equity - Carbon credit reserve

Wanganui District Council Annual Report for the year ended 30 June 2012
Page 46 of 170
Notes to the financial statements For the year ended 30 June 2012 24. Reconciliation of net surplus/(deficit) after tax to net cash flow from operating activities
Council Group2012 2011 2012 2011$000 $000 $000 $000
Surplus/(deficit) after tax (13,031) 485 (10,965) 1,666Add/(less) non-cash itemsShare of associate surplus/(deficit) 15 2 15 2Depreciation and amortisation expense 14,948 14,347 16,296 15,648Impairment of earthquake prone buildings 7,560 - 7,560 -Vested assets - - - -(Gains)/losses in fair value of biological assets 1,036 (129) 1,036 (129)Movement in fair value of investment property (713) (322) (601) (322)(Gains)/losses on derivative financial instruments 4,380 1,361 5,095 1,450(Gains)/losses from held-to-maturity investments - - - -(Gains)/losses in fair value of plant, property and equipment - (91) - (91)Increase/(decrease) in deferred tax (28) (3) 283 528(Gains)/losses on other investments - 68 - 68
27,198 15,233 29,684 17,154
Add/(less) items classified as investing or financing activities(Gains)/losses on disposal of property, plant and equipment 502 (39) 498 (39)
502 (39) 498 (39)
Add/(less) movements in working capital itemsAccounts receivable 1,933 (3,072) 1,523 (1,398)Inventories 28 3 35 103Accounts payable (1,085) 1,146 (420) 5,200Employee benefits (49) (6) (49) (5)
827 (1,929) 1,089 3,900
Net cash inflow/(outflow) from operating activities 15,496 13,750 20,306 22,681
25. Capital commitments and operating leases Council Group
2012 2011 2012 2011$000 $000 $000 $000
Capital commitmentsProperty, plant and equipment 5,164 3,959 5,164 3,959Intangible assets - - - -Investment property 91 - - -
Total capital commitments 5,255 3,959 5,164 3,959
There are no capital commitments in relation to the WDC's interest in the Forestry joint venture or Airport joint venture.
Operating leases as lesseeWDC leases property, plant and equipment in the normal course of its business. The majority of these leases have a non-cancellable term of48 months. The future aggregate minimum lease payments payable under non-cancellable operating leases are as follows:
Council Group2012 2011 2012 2011$000 $000 $000 $000
Not later than one year 72 72 72 259Later than one year and not later than five years 76 140 76 414Later than five years - - - 22
Total non-cancellable operating leases 148 212 148 695
The total minimum future sublease payments expected to be received under non-cancellable subleases at balance date is $nil (2010 $nil).
Lease can be renewed at WDC's option, with rents set by reference to current market rates for items of equivalent age and condition. WDCdoes have the option to purchase the asset at the end of the lease term.
There are no restrictions placed on WDC by any of the leasing arrangements.
WDC's financial statements include lease expenditure of $72,861 (2011 $66,194). The lease expenditure is for photocopiers, water coolers, and Eftpos

Wanganui District Council Annual Report for the year ended 30 June 2012
Page 47 of 170
Notes to the financial statements For the year ended 30 June 2012 Operating leases as lessorWDC leases its investment property under operating leases. These leases have a varying non-cancellable terms.The future aggregate minimum lease payments to be collected under non-cancellable operating leases are as follows:
Council Group2012 2011 2012 2011$000 $000 $000 $000
Not later than one year 1,714 1,296 1,714 1,296Later than one year and not later than five years 5,000 3,971 5,000 3,971Later than five years 6,044 5,432 6,044 5,432
Total non-cancellable operating leases 12,758 10,699 12,758 10,699
No contingent rents have been recognised in the statement of financial performance during the period.
26. Contingencies Council Group2012 2011 2012 2011$000 $000 $000 $000
Litigation - 160 160 160Building Act claims 110 70 70 70
Total contingent liabilities 110 230 230 230
RiskPool InsuranceWanganui District Council obtained public liability and professional indemnity insurance cover from New Zealand Mutual Liability RiskPool up to and including the 30th June 2009. From the 1st July 2009, Wanganui District Council has obtained public liability and professional indemnityinsurance from QBE. RiskPool operates as mutual fund where each member makes an annual contirbution to obtain cover however shouldclaims exceed contributions then calls can be made on the members of that fund year for the shortfall amount. RiskPool have advised that further calls may be made to the Council for past pool periods. Wanganui District Council has budgeted monies in its current LTP to cover these calls.
Wanganui District Council is a participating employer in the Defined Benefit Plan Contributors Scheme (the scheme), which is amulti-employer defined benefit scheme. If the other participating employers cease to participate in the scheme, Wanganui District Council could be responsible for any deficit of the scheme. Similarly, if a number of employers cease to participate in the scheme, the WanganuiDistrict Council could be responsible for an increased share of any deficit.
Wanganui District Council will be a participating territorial authority to the Financial Assistance Package (FAP) scheme recently passed into legislation by the Weathertight Homes Resoultions Services (Financial Assistance Package) Amendment Act 2011. The scheme is optional tothe homeowner. In signing up to the scheme, WDC is committing to funding 25 per cent of eligible claims. It is a five-year commitment, witha review period in 2014. There is currently one property which Wanganui District Council has provisionally agreed meets the requirements of the FAP.

Wanganui District Council Annual Report for the year ended 30 June 2012
Page 48 of 170
Notes to the financial statements For the year ended 30 June 2012 27. Related party transactions
Wanganui District Council is the ultimate parent of the group and controls six entities, being Wanganui District Council Holdings Limited, Wanganui Incorporated, Wanganui Airport Joint Venture, Cooks Gardens Trust Board, The Sarjeant Gallery Trust and Wanganui District Councils' Forestry Joint Committee. Wanganui District Council Holdings Limited in turnowns Wanganui Gas Limited. Wanganui Gas Limited in turn owns Energy Direct NZ Limited and GasNet Limited.Wanganui District Council has significant influence over the following as associates: the Ruaephu Wanganuui Rangitikei EconomicDevelopment Trust, the Wanganui River Enhancement Charitable Trust, the New Zealand Masters Games Limited, and the ManawatuWanganui LASS Limited.
Council2012 2011$000 $000
Wanganui Gas LimitedServices provided by WDC 166 193Interest paid to WDC - 8Loans payable to WDC - -Accounts payable to WDC - -Accounts receivable from WDC - -
Energy Direct NZ LimitedServices provided by WDC 101 110Services provided to WDC 65 63Loans payable to WDC - 1Accounts payable to WDC 10 7Accounts receivable from WDC 8 -
GasNet LimitedServices provided by WDC 174 129Services provided to WDC - -Accounts payable to WDC 11 11Accounts receivable from WDC - -
Wanganui District Council Holdings LimitedServices provided by WDC 606 346Services provided to WDC 92 43Interest paid to WDC 206 154Management fee paid to WDCHL 60 43Accounts payable to WDC 54 136Loans payable to WDC 2,750 2,750
Wanganui IncorporatedServices provided by WDC 4 4Services provided to WDC 95 145Loans payable to WDC (13) -Accounts payable to WDC - -Accounts receivable from WDC - 5
Wanganui Joint Venture Airport (50% JV)Services provided by WDC 61 60Services provided to WDC 7 10Loans payable to WDC 46 214Accounts payable to WDC - -Accounts receivable from WDC - -
Cooks Gardens Trust BoardServices provided by WDC -Services provided to WDC - -Loans payable to WDC - -Accounts payable to WDC - -
Sarjeant Gallery Trust BoardServices provided by WDC - -Services provided to WDC - 12Loans payable to WDC - -Accounts payable to WDC (includes WDC current account) 45 111
Wanganui District Council Forestry Joint Committee (95.09% JV)Interest paid to WDC -Services provided by WDC 25 25Services provided to WDC - -Loans receivable from WDC - -Loans payable to WDC 5 36Accounts payable to WDC - -Accounts receivable from WDC - -

Wanganui District Council Annual Report for the year ended 30 June 2012
Page 49 of 170
Notes to the financial statements For the year ended 30 June 2012
Council2012 2011
Ruapehu, Wanganui, Rangitikei Economic Development Trust (33% associate) $000 $000Contribution from WDC - -
Whanganui River Enhancement Charitable Trust (33% associate)Contribution from WDC -
New Zealand Masters Games Limited (49% associate)Services Provided by WDC - 2Contribution from WDC 13 9
Manawatu Wanganui LASS Limited (14.28% associate)Payment of share contribution to the LASS - -Contributions made to LASS projects 33 20
Transactions with key management personnel
During the year Councillors and key management, as part of a normal customer relationship, were involved in minor transactions with the WDC (such as payment of rates, purchase of rubbish bags etc).
WDC purchased gift vouchers from The Flying Fox, which Mayor Annette Main's spouse owns. The value of these services was $740 (2011 $Nil). These services were supplied on normal commercial terms. There is a balance of $Nil (2011 $Nil) outstanding for unpaid invoices at year end. WDC reimbursed Just Looking, which Councillor Rob Vinsen owns foradvertising in the paper relating to the Wanganui festival weekend $1,393 2012 ($Nil 2011). There is a balance of $Nil 2012 ($Nil 2011) outstanding for unpaid invoices at year end. Councillor Rob Vinsen also received $10,000 2012 as a board member of WDCHL ($6,667 2011).
A provision has been recognised for impairment of receivables for any loans or other receivables to related parties $nil (2011 $nil).
Key management personnel compensation Council Group2012 2011 2012 2011$000 $000 $000 $000
Salaries and other short term employee benefits 1,835 1,762 1,842 2,446Post-employment benefits - - - -Other long-term benefits 72 - 72 -Termination benefits - - -
Total key management personnel compensation 1,907 1,762 1,914 2,446
Key management personnel include the Mayor, Councillors, Chief Executive and other senior management personnel.

Wanganui District Council Annual Report for the year ended 30 June 2012
Page 50 of 170
Notes to the financial statements For the year ended 30 June 2012 28. Remuneration
GroupChief Executive 2012 2011The Chief Executive received the following remuneration: $000 $000
Salary 244 237Vehicle (market value plus FBT) 28 28Parking (market value plus FBT) - -Medical insurance (market value plus FBT) - -Superannuation subsidy 10 5
Total remuneration 282 270
In terms of his contract, the Chief Executive also received professional subscriptions of $nil (2010 $nil).
Elected representatives Council WGL/WDCHL2012 2011 2012 2011
Elected representatives received the following remuneration: $000 $000 $000 $000Council as elected on 9 October 2010Mayor Annette Main (includes car) 95 65Councillor Allan Anderson 28 27 - -Councillor Philippa Baker-Hogan 30 29 - -Councillor Jack Bullock 27 20 - -Councillor Randhir Dahya 27 27 - -Councillor Nicki Higgie 27 28 - -Councillor Michael Laws 26 19 - -Councillor Hamish McDouall 27 19 - -Councillor Clive Soloman 27 19 - -Councillor Ray Stevens 31 32 - -Councillor Rob Vinsen 31 29 10 7Councillor Sue Westwood 29 29 - -Councillor Rangi Wills 30 29 - -Councillors not re-elected on 9 October 2010Mayor Michael Laws (includes car) - 23 - -Councillor Barbara Bullock - 8 - -Councillor Danny Jonas - 8 - -Councillor Dot McKinnon - 13 - 4Councillor Rana Waitai - 8 - -
Rural Community Board as elected on 9 October 2010Bill Ashworth 5 3 - -Andrew Collins 5 6 - -Dave Johnston 5 3 - -Mark Lourie 6 5 - -David Matthews 6 5 - -Darrell Monk 6 4 - -Alan Taylor 8 8 - -Rural Community Board members not re-elected on 9 October 2010Shaun Forlong - 2 - -Brian Maude - 1 - -Peter Molan - 1 - -
476 470 10 11
29. Severance payments
Severance payments were made to two employees during the year. The payment amount totalled $14,000 (2011 two payments totalling $37,663).The value of each of the severance payments was $10,000 and $4,000.
30. Events after the balance date
There have been no material events since balance date.

Wanganui District Council Annual Report for the year ended 30 June 2012
Page 51 of 170
Notes to the financial statements For the year ended 30 June 2012 31. Financial instruments
Financial instrument categoriesThe accounting policies for financial instruments have been applied to the line items below:
Council Group2012 2011 2012 2011$000 $000 $000 $000
Financial assets
Fair value through surplus or deficitDerivative financial instrument assets - - - -
Loans and receivablesCash and cash equivalents 7,148 5,757 16,253 12,996Debtors and other receivables 5,662 7,595 10,292 11,826Loans to related parties 10 217 (890) (683)Community loans 35 59 35 59Long term receivables 3,675 3,440 3,675 3,440
Fair value through other comprehensive incomeOther financial assets: - unlisted shares 355 222 355 222 - listed shares - - 22 21Government Indexed Bonds* 733 710 733 710Sinking funds* 65 64 65 64
Financial liabilities
Fair value through surplus or deficitDerivative financial instrument liabilities 9,991 5,612 11,868 6,705
Financial liabilities at amortised costCreditors and other payables 6,682 9,545 18,264 20,521Borrowings: - secured loans 91,550 88,550 109,550 108,068
32. Fair value hierarchy disclosures
For those instruments recognised at fair value in the statement of financial position, fair values are determined according to the following hierarchy: - Quoted market price (level 1) - Financial instruments with quoted prices for identical instruments in active markets - Valuation technique using observable inputs (level 2) - Financial instruments with quoted prices for similar instruments in active markets or quoted prices for identical or similar instruments in inactive markets and financial instruments valued using models where all significant inputs are observable - Valuation techniques with significant non-observable inputs (level 3) - Financial instruments valued using models where one or more significant inputs are not observable

Wanganui District Council Annual Report for the year ended 30 June 2012
Page 52 of 170
Notes to the financial statements For the year ended 30 June 2012 The following table analyses the basis of the valuation of classes of financial instruments measured at fair value in the statement of financial position
TotalQuoted
market priceObservable
inputs
Significant non-
observable inputs
$000 $000 $000 $00030 June 2012 - CouncilFinancial assetsDerivatives - -Shares 355 355Government indexed bonds 733 733Sinking funds 65 65
Financial liabilitiesDerivatives 9,991 9,991
30 June 2012 - GroupFinancial assetsDerivatives - -Shares unlisted 355 355Government indexed bonds 733 733Sinking funds 65 65NJ Young bequest with ABN Amro 448 448
Financial liabilitiesDerivatives 11,868 11,868
30 June 2011 - CouncilFinancial assetsDerivatives - -Shares unlisted 222 222Government indexed bonds 710 710Sinking funds 64 64
Financial liabilitiesDerivatives 5,612 5,612
30 June 2011 - GroupFinancial assetsDerivatives - -Shares unlisted 222 222Government indexed bonds 710 710Sinking funds 64 64NJ Young bequest with ABN Amro 420 420
Financial liabilitiesDerivatives 6,705 6,705
There were no transfers between the different levels of the fair value hierarchy
33. Financial instrument risks
WDC has a series of policies to manage the risks associated with financial instruments. WDC is risk averse and seeks to minimise exposure from its treasury activities. WDC has established Council approved Liability Management and Investment policies. These policies do not allow any transactions that are speculative in nature to be entered into.
Market riskPrice riskPrice risk is the risk that the fair value or future cash flows of a financial instrument will fluctuate as a result of changes in market prices.WDC is exposed to equity securities price risk on its investments, which are classified as financial assets held at fair value through equity.This price risk arises due to market movements in listed securities. This price risk is managed by diversification of WDC’s investmentportfolio in accordance with the limits set out in WDC’s Investment Policy.
Currency riskCurrency risk is the risk that the fair value or future cash flows of a financial instrument will fluctuate due to changes in foreign exchangerates. WDC is not exposed to currency risk, as it does not enter into foreign currency transactions.
Valuation technique

Wanganui District Council Annual Report for the year ended 30 June 2012
Page 53 of 170
Notes to the financial statements For the year ended 30 June 2012 Fair value interest rate riskFair value interest rate risk is the risk that the value of a financial instrument will fluctuate due to changes in market interest rates. Borrowing issued at floating rates exposes the WDC to fair value interest rate risk. WDC’s Liability Management Policy outlines the level of borrowing that is to be secured using fixed rate instruments. Floating to fixed interest rate swaps are entered into to hedge the fair value interest raterisk arising where WDC has borrowed at floating rates. In addition, investments at fixed interest rates expose the WDC to fair value interestrate risk. If interest rates on investments at 30 June 2012 had fluctuated by plus or minus 0.5%, the effect would have been todecrease/increase the fair value through equity reserve by $3,666 (2011 $3,551). If interest rates on borrowings at 30 June 2012 hadfluctuated by plus or minus 0.5%, the effect would have been to decrease/increase the surplus after tax by $460,000 (2011 $442,750) as a result of higher/lower interest expense on floating-rate borrowings.
Cash flow interest rate riskCash flow interest rate risk is the risk that the cash flows from a financial instrument will fluctuate because of changes in market interestrates. Borrowings and investments issued at variable interest rates expose WDC to cash flow interest rate risk. WDC manages its cashflow interest rate risk on borrowings by using floating-to-fixed interest rate swaps. Such interest rate swaps have the economic effectof converting borrowings at floating rates and swaps them into fixed rates that are generally lower than those available if WDC borrowedat fixed rates directly. Under the interest rate swaps, WDC agrees with other parties to exchange, at specified intervals, the differencebetween fixed contract rates and floating-rate interest amounts calculated by reference to the agreed notional principal amounts.
Credit riskCredit risk is the risk that a third party will default on its obligation to Council, causing Council to incur a loss. Council has no significant concentrations of credit risk, as it has a large number of credit customers, mainly ratepayers, and Council has powers under the LocalGovernment (Rating) Act 2002 to recover outstanding debts from ratepayers. Council invests funds only in deposits with registered banksand local authority stock and its Investment Policy limits the amount of credit exposure to any one institution or organisation. Investmentsin other Local Authorities are secured by charges over rates. Other than other local authorities, the group only invests funds with thoseentities which have a Standard and Poor’s credit rating of at least A2 for short term and A – for long-term investments. Accordingly, thegroup does not require any collateral or security to support these financial instruments.
The Council and group holds no other collateral or credit enhancements for financial instruments that give rise to credit risk.
Maximum exposure to credit riskWDC's maximum credit exposure for each class of financial instrument is as follows:
Group2012 2011 2012 2011$000 $000 $000 $000
Cash at bank and term deposits 7,148 5,757 16,253 12,996Debtors and other receivables 5,662 7,595 10,292 11,826Derivative financial instrument assets - - - -Loan receivable 45 276 45 276Long term receivables 3,675 3,440 220 690Total credit risk 16,530 17,068 26,810 25,788
Credit quality of financial assetsThe credit quality of financial assets that are neither past due nor impaired can be assessed by reference to Standard and Poor'scredit ratings (if available) or to historical information about counterparty default rates:
Group2012 2011 2012 2011
Counterparties with credit ratings $000 $000 $000 $000
Cash at bank and term deposits:AA - 5,757 - 12,996AA- 7,148 - 16,253 -Total cash at bank and term deposits 7,148 5,757 16,253 12,996
Derivative financial instrument assets:AA - - - -AA- - - - -Total derivative financial instrument assets - - - -
Debtors and other receivables mainly arise from WDC's statutory functions, therefore there are no procedures in place tomonitor or report the credit quality of debtors and other receivables with reference to internal or external credit ratings.WDC has no significant concentrations of credit risk in relation to debtors and other receivables, as it has a large numberof credit customers.
Council
Council

Wanganui District Council Annual Report for the year ended 30 June 2012
Page 54 of 170
Notes to the financial statements For the year ended 30 June 2012 Liquidity riskManagement of liquidity riskLiquidity risk is the risk that Council will encounter difficulty raising liquid funds to meet commitments as they fall due. Prudent liquidity risk management implies maintaining sufficient cash, the availability of funding through an adequate amount of committed credit facilities and the ability to close out market positions. Council aims to maintain flexibility in funding by keeping committed credit lines available. In meeting its liquidity requirements, Council maintains a target level of investments that must mature within the next 12 months. Council manages its borrowings in accordance with its funding and financial policies, which includes a Liability Management Policy. These policies have been adopted as part of the Council’s 10-Year Plan. The maturity profiles of the Council’s interest bearing investments and borrowings are disclosed in notes 13 and 21 respectively.
Contractual maturity analysis of financial liabilitiesThe table below analyses WDC's financial liabilities into relevant maturity groupings based on the remaining period at thebalance date to the contractual maturity date. Future interest payments on floating rate debt is based on the floating rateon the instrument at the balance date. The amounts disclosed are the contractual undiscounted cash flows.
Carryingamount contractual Less than More than
cash flows cash flows 1 year 1-2 years 2-5 years 5 years$000 $000 $000 $000 $000
Parent 2012Creditors and other payables 6,682 6,682 6,682 - - -Secured loans 91,550 104,295 32,381 32,116 39,798 -Total 98,232 110,977 39,063 32,116 39,798 -
Group 2012Creditors and other payables 18,264 18,264 18,264 - - -Secured loans 109,550 104,295 32,381 32,116 39,798 -Total 127,814 122,559 50,645 32,116 39,798 -
Parent 2011Creditors and other payables 9,545 9,545 9,545 - - -Secured loans 88,550 102,318 35,386 16,607 50,326 -Total 98,095 111,863 44,931 16,607 50,326 -
Group 2011Creditors and other payables 20,521 20,521 20,521 - - -Secured loans 98,800 102,318 35,386 16,607 50,326 -Total 119,321 122,839 55,907 16,607 50,326 -

Wanganui District Council Annual Report for the year ended 30 June 2012
Page 55 of 170
Notes to the financial statements For the year ended 30 June 2012 The table below analyses WDC's derivative financial instruments that will be settled on a gross basis into relevant maturity groupingsbased on the remaining period at the balance sheet date to the contractual maturity date. The amounts disclosed are the contractualundiscounted cash flows.
Liability Betweencarrying Contractual Less than 1 and 2 More thanamount cash flows 6 months years 2 years
$000 $000 $000 $000 $000Parent and group 2012Contracts: - net 11,868 11,868 - - 11,868
Parent and group 2011Contracts: - net 6,705 6,705 28 87 6,590
Contractual maturity analysis of financial assetsThe table below analyses WDC's financial assets into relevant maturity groupings based on the remaining period at the balancedate to the contractual maturity date.
Carryingamount andcontractual Less than More thancash flows 1 year 1-2 years 2 years
$000 $000 $000 $000Parent 2012Cash and cash equivalents 7,148 7,148Debtors and other receivables 5,662 5,662Net settled derivative assets - -Other financial assets: - term deposits - - - related party loans 10 10 - community loans 35 35 - long term loans 3,675 704 2,971Total 16,530 13,559 - 2,971
Group 2012Cash and cash equivalents 16,253 16,253Debtors and other receivables 10,292 10,292Net settled derivative assets - -Other financial assets: - term deposits - - - related party loans 10 10 - community loans 35 35 - long term loans 924 704 220Total 27,514 27,294 - 220
Parent 2011Cash and cash equivalents 5,757 5,757Debtors and other receivables 7,595 7,595Net settled derivative assets - -Other financial assets: - term deposits - - - related party loans 217 217 - community loans 59 59 - long term loans 3,440 3,440Total 17,068 13,628 - 3,440
Group 2011Cash and cash equivalents 12,996 12,996Debtors and other receivables 11,826 11,826Net settled derivative assets - -Other financial assets: - term deposits - - - related party loans 217 217 - community loans 59 59 - long term loans 690 690Total 25,788 25,098 - 690

Wanganui District Council Annual Report for the year ended 30 June 2012
Page 56 of 170
Sensitivity analysisThe tables below illustrate the potential profit and loss and equity (excluding retained earnings) impact for reasonably possible marketmovements, with all other variables held constant, based on WDC's financial instrument exposures at the balance date.
Parent
2012 $000 - 100bps + 100bpsOther Other
Interest rate risk Profit Equity Profit Equity
Financial assetsCash and cash equivalents (71) 71Derivatives - -Other financial assets: ()
Financial liabilitiesBorrowings: - bank overdraft - - - term loans (916) 916 - Derivatives (100) 100
Total sensitivity to interest rate risk (1,087) - 1,087 -
Parent
2011 $000 - 100bps + 100bpsOther Other
Interest rate risk Profit Equity Profit Equity
Financial assetsCash and cash equivalents (58) 58Derivatives - -Other financial assets: (2) 2
Financial liabilitiesBorrowings: - bank overdraft - - - term loans (886) 886 - derivatives (56) 56
Total sensitivity to interest rate risk (1,002) - 1,002 -
Group
2012 $000 - 100bps + 100bpsOther Other
Interest rate risk Profit Equity Profit Equity
Financial assetsCash and cash equivalents (163) 163Derivatives - -Other financial assets:
Financial liabilitiesBorrowings: - bank overdraft - - - term loans (843) 843 - derivatives (118) 118
Total sensitivity to interest rate risk (1,124) - 1,124 -
Group
2011 $000 - 100bps + 100bpsOther Other
Interest rate risk Profit Equity Profit Equity
Financial assetsCash and cash equivalents (130) 130Derivatives - -Other financial assets:
Financial liabilitiesBorrowings: - bank overdraft - - - term loans (501) 501 - derivatives (67) 67
Total sensitivity to interest rate risk (698) - 698 -
Explanation of interest rate sensitivityThe interest rate sensitivity is based on a reasonable possible movement in interest rates, with all other variables held constant, measured as a basis p(bps) movement. For example, a decrease in 50 bps is equivalent to a decrease in interest rates of 0.5%.
The sensitivity for derivatives (interest rate swaps) has been calculated using a derivative valuation model based on a parallel shift in interest rates of-50bps/+100bps (2011 -50bps/+100bps).
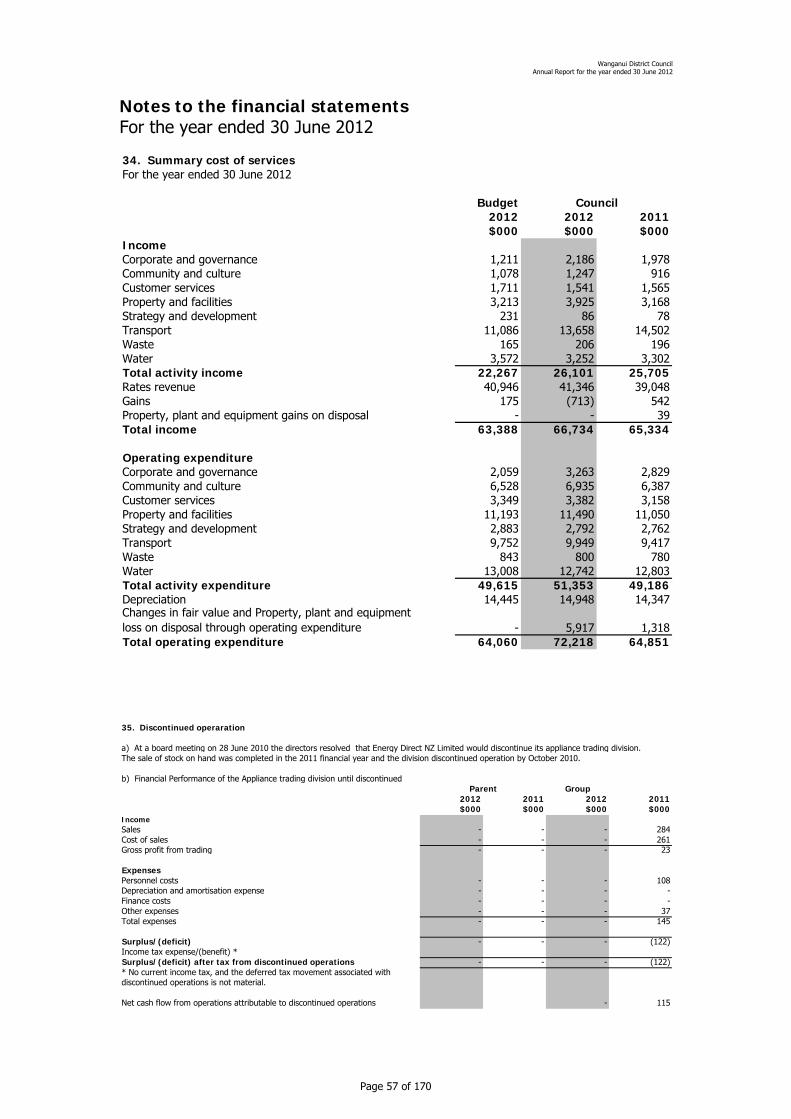
Wanganui District Council Annual Report for the year ended 30 June 2012
Page 57 of 170
Notes to the financial statements For the year ended 30 June 2012 34. Summary cost of servicesFor the year ended 30 June 2012
Budget Council2012 2012 2011$000 $000 $000
IncomeCorporate and governance 1,211 2,186 1,978Community and culture 1,078 1,247 916Customer services 1,711 1,541 1,565Property and facilities 3,213 3,925 3,168Strategy and development 231 86 78Transport 11,086 13,658 14,502Waste 165 206 196Water 3,572 3,252 3,302Total activity income 22,267 26,101 25,705Rates revenue 40,946 41,346 39,048Gains 175 (713) 542Property, plant and equipment gains on disposal - - 39Total income 63,388 66,734 65,334
Operating expenditureCorporate and governance 2,059 3,263 2,829Community and culture 6,528 6,935 6,387Customer services 3,349 3,382 3,158Property and facilities 11,193 11,490 11,050Strategy and development 2,883 2,792 2,762Transport 9,752 9,949 9,417Waste 843 800 780Water 13,008 12,742 12,803Total activity expenditure 49,615 51,353 49,186Depreciation 14,445 14,948 14,347Changes in fair value and Property, plant and equipment loss on disposal through operating expenditure - 5,917 1,318Total operating expenditure 64,060 72,218 64,851
35. Discontinued operaration
a) At a board meeting on 28 June 2010 the directors resolved that Energy Direct NZ Limited would discontinue its appliance trading division. The sale of stock on hand was completed in the 2011 financial year and the division discontinued operation by October 2010.
b) Financial Performance of the Appliance trading division until discontinuedParent Group
2012 2011 2012 2011$000 $000 $000 $000
IncomeSales - - - 284Cost of sales - - - 261Gross profit from trading - - - 23
ExpensesPersonnel costs - - - 108Depreciation and amortisation expense - - - -Finance costs - - - -Other expenses - - - 37Total expenses - - - 145
Surplus/(deficit) - - - (122)Income tax expense/(benefit) *Surplus/(deficit) after tax from discontinued operations - - - (122)* No current income tax, and the deferred tax movement associated withdiscontinued operations is not material.
Net cash flow from operations attributable to discontinued operations - 115

Wanganui District Council Annual Report for the year ended 30 June 2012
Page 58 of 170
Notes to the financial statements For the year ended 30 June 2012 36. Business Combination
On 1 October 2010 Wanganui District Council Holdings Limited acquired the assets and operations of the Wanganui port from Rivercity Port Limited.
In the nine months to June 2011, the Port operations has contributed revenue of $606,000 and profit/(loss) of ($9,000). If the acquisitionhad occurred on 1 July 2010, management estimates that the revenue of WDCHL would hve increased by $810,000 and profit/(loss)by ($12,000)
Parent Group2012 2011 2012 2011$000 $000 $000 $000
Consideration transferred - - - 2,750Total consideration transferred - - - 2,750
.
Fair value of identifiable assets acquired and liabilities assumedProperty, plant and equipment - - - 518Inventories - - - 15Trade and other payables - - - (9)Total net identificable assets - - - 524Total Goodwill - - - 2,226
37. Impairment of earthquake prone buildings
During the year Council assessed a number of its buidings as being earthquake prone. WDC has decided to recognise an impairmentfor these buildings. The impairment is based on estimated remedial costs of bringing the buidlings to a standard of between 67% - 100%of the building code.
WDC's assessment of these remedial costs of bringing the buidlings up to the above standard has been based on information provided by independent quantity surveyer Mr K Saunders ANZIQS, Saunders Stevenson Limited. Mr K Saunders has estimated these costs oninformation provided to him by structual engineers from BPL Group, MWH New Zealand Ltd and Opus International Consultants Limitedas commissioned by WDC.
Following are the categories of assets impaired:
Category of assetTotal
Impairment
Impairment through the revaluation
reserve
Impaired through
surplus or deficit
$000 $000 $000
Property Plant & Equipment - operational 11,534 4,890 6,644Property Plant & Equipment - restricted 887 887 -Investment Property 915 - 915Total 13,336 5,776 7,560 38. Capital management
The Council's capital is its equity (or ratepayers' funds), which comprises retained earnings and reserves. Equity is represented by net assets. TheLocal Government Act 2002 (the Act) requires the Council to manage its revenues, expenses, assets, liabilities, investments, and general financialdealings prudently and in a manner that promotes the current and future interests of the community. Ratepayers' funds are largely managed as aby-product of managing revenues, expenses, assets, liabilities, investments, and general financial dealings. The objective of managing these itemsis to achieve intergenerational equity, which is a principle promoted in the Act and applied by the Council. Intergenerational equity requires today's ratepayers to meet the costs of utilising the Council's assets and not expecting them to meet the full cost of long term assets that will benefit ratepayers in future generations. Additionally, the Council has in place asset management plans for major classes of assets detailing renewal and maintenance programmes, to ensure ratepayers in future generations are not required to meet the costs of deferred renewals and maintenance. The Act requires the Council to make adequate and effective provision in its Long Term Council Community Plan (LTCCP) and in its Annual Plan(where applicable) to meet the expenditure needs identified in those plans. And the Act sets out the factors that the Council is required to considerwhen determining the most appropriate sources of funding for each of its activities. The sources and levels of funding are set out in the funding and financial policies in the Council's LTCCP.
Council has the following Council created reserves:- reserves for different areas of benefit;- self-insurance reserves; and- trust and bequest reserves.
Reserves for different areas of benefit are used where there is a discrete set of rate or levy payers as distinct from the general rate. Any surplus or deficit relating to these separate areas of benefit is applied to the specific reserves. Self-insurance reserves are built up annually from general rates and are made available for specific unforeseen events. The release of these funds generally can only be approved by Council. Trust and bequest reserves are set up where Council has been donated funds that are restricted for particular purposes. Interest is added to trust and bequest reserveswhere applicable and deductions are made where funds have been used for the purpose they were donated.

Wanganui District Council Annual Report for the year ended 30 June 2012
Page 59 of 170
Notes to the financial statements For the year ended 30 June 2012 39. Explanation of major variances to budget
Statement of comprehensive income
IncomeRates revenue is 1.0% higher due to growth in the rating base. Finance income has decreased by 31.5% ($195,000) due to a change inthe treatment of internal borrowings.
Other revenue is 18.6% higher than expected due to an additional $2.5M funding from the New Zealand Transport Agency (NZTA) for flood damage work at a higher subsidy rate; unbudgeted Forestry revenue of $1.2M and unbudgeted bequest funds of $247,000for work undertaken at the Bason Botanic Gardens.
The cash surplus for the financial year was $1,391,000 per the Statement of cash flows.
ExpenditurePersonnel costs increased by 1.2% due to additional staff being employed on short-term contracts. Council received governmentsubsidies for these staff which has been recognised in 'other revenue'.
Depreciation and amortisation expense is 3.5% higher than budget. The variance is due to 2011 infrastructure valuations increasing thebook value of these assets.
Finance costs were 11.1% ($757,000) less than budget due to general market conditions providing lower interest rates and savings fromthe timing of borrowings. Council practices pro active interest rate risk management.
Other expenses are $8.3M higher than budget due to $1.8M unbudgeted Forestry costs ($1.0M of Forestry costs are non-cash items)Non-cash items not budgeted for that contributes to the variance include losses from the mark to market of derivative financialinstruments of $4.4M. The additional variance is due to unbudgeted costs in a number of areas such as Roading, Earthquake strengthening, Pools.
An unbudgeted impairment for earthquake prone buildings $7.6M has been recognised through surplus or deficit.
Statement of financial position
AssetsDebtors and other receivables are lower than last year mainly due to timing differences in invoicing.
The reclassification in the 2010/11 financial year of $19.7M of Land and buildings to Investment properties were not reflected in the2012 budget.
Total non-current assets were $69.M less than budgeted due to downwards revaluations and impairments not budgeted for. Totalnon-current assets are similar to 2011 levels with a variance of 0.2%.
LiabilitiesBorrowings were on track to budget with a variance of 1.3%. Movements in the value of Derivative financial instruments as well asDeferred tax liability were not budgeted for.
Creditors and other payables were higher than budget by $1.1M as a result of timing adjustments such as income in advance; finance costs payable; contract retentions and PAYE payable.
The higher than expected balance of Employee entitlements was due to additional annual leave provisions not budgeted for.
Statement of cash flows
Operating activitiesCash flows from operating activities is an indication whether an entity is able to finance its normal operations from short-term funds.Council generated a $15.5M cash surplus from operating activities. This is a positive variance to budget of 11.4%. The variance is duemainly to timing issues between invoicing and receiving/making payment.
Investing activitiesCash flows from investing activities show asset purchases to be $1.5M under budget (8% variance). Major projects exceeding budgetincluded flood damage repairs to roading. Capital projects delayed during 2011/12 include the Sarjeant Gallery environmental contol andstormwater separation work. These have been carried forward to the 2012/13 financial year.
Financing activitiesCash flows from financing activities is $2.1M under budget. This variance is due to reduced capital expenditure outlined above.

Wanganui District Council Annual Report for the year ended 30 June 2012
Page 60 of 170
Council’s vision, mission and values Council’s vision Family-friendly Wanganui – the preferred place for my family home where the community enjoys:
1. Economic opportunities 2. A good image and sense of identity 3. A safe community 4. Good health care services 5. Connectivity 6. Community networks 7. Quality educational opportunities 8. Quality and affordable housing in contemporary family neighbourhoods 9. Access to recreational and cultural activities
Council’s mission To make Wanganui an attractive place for families and to ensure a quality of life for all.
Council’s values • Leadership – to provide leadership for the community and to advocate on its behalf • Community stewardship – to effectively and efficiently manage community
facilities and resources • Participatory democracy – to consult with the community to identify needs and
determine priorities for allocating resources • Regional cooperation – to work with our regional partners • Accountability to ratepayers – to balance the provision of services with the
community’s ability to pay
Council’s strategic direction We aim to take a sustainable development approach in promoting the wellbeing of the community. This means we will promote development which meets the needs of present generations without compromising the ability of future generations to meet their own needs. For communities to flourish they need a secure livelihood, a safe and healthy environment, happiness and fulfillment. The four dimensions of community wellbeing include: Social, Economic, Environmental and Cultural. These are defined as: Social wellbeing: relates to education, health, financial and personal security; the strength of community networks and associations; rights and freedoms; and levels of equity. Economic wellbeing: relates to the ability of the economy to generate employment and wealth – which enables communities to afford the goods and services they desire. Environmental wellbeing: relates to the capacity of the natural environment to support, in a sustainable way, the activities that constitute community life. Cultural wellbeing: relates to the shared beliefs, values, customs, behaviours and identities reflected through language, stories, experiences, visual and performing arts, ceremonies, heritage and sports.

Wanganui District Council Annual Report for the year ended 30 June 2012
Page 61 of 170
Council’s Family-friendly Strategy Social wellbeing –
A safe community • Obtain World Health Organisation accreditation as a safe district
• Take a zero tolerance approach on gangs
• Take a zero tolerance approach on antisocial behaviour
• Provide a safe transportation network Good health care services • Advocate for retention of full hospital
services • Assist with the recruitment of
obstetricians, paediatricians and midwives
Community networks • Develop community partnerships • Support communities to establish
community networks and support structures
• Support children and youth programmes
• Value older people in our community • Continue to build strong relationships
with Iwi • Maximise the potential for ethnic
diversity Quality educational opportunities
• Encourage schools to adopt family-friendly policies
• Promote quality schools and preschools
• Facilitate and support tertiary educational opportunities to attract youth to Wanganui
Economic wellbeing - Economic opportunities
• Identify and develop economic development initiatives
• Improve business and industry growth, investments and performance
• Facilitate training and education opportunities
• Promote and support the tourism sector / Regional Tourism Organisation functions
• Promote and support events • Encourage and support the uptake of
technology that assists economic development
Connectivity • Facilitate good urban design • Facilitate the provision of digital
infrastructure to support families, schools and businesses
• Provide pathways to ensure safe cycling and walking routes, particularly to schools and the Central Business District

Wanganui District Council Annual Report for the year ended 30 June 2012
Page 62 of 170
• Provide an efficient transportation network to residents and promote economic development
Environmental wellbeing - Quality and affordable housing in contemporary family neighbourhoods
• Collaborate on healthy housing initiatives
• Ensure District Plan zoning and rules advance family-friendly interests
• Encourage environmental sustainability of neighbourhoods
Cultural wellbeing - A good image and sense of identity
• Undertake research aimed at attracting families
• Promote the quality of life in Wanganui – climate, travel benefits, family-friendly policies
• Improve the look of the city • Facilitate a strong sense of identity,
belonging and community Access to recreational and cultural activities
• Provide and maintain parks, recreational and sporting amenities and facilities that meet the needs of all age groups and abilities
• Recognise and value our points of difference around sports, arts, culture and heritage
• Encourage development of a vibrant Central Business District – shops and café scene, riverfront development

Wanganui District Council Annual Report for the year ended 30 June 2012
Page 63 of 170
Our plans and our reporting We are accountable to the people of the District for the achievement of our objectives and we are required to report to the public each year on our performance. We also work to achieve a satisfactory audit report from Audit New Zealand on our Annual Report. Under the Local Government Act 2002 (the Act), Council is required to adopt a 10-Year Plan every three years. In the year in which a 10-Year Plan is prepared, the first year of the Plan becomes the Annual Plan for that year. In the intervening years, years two and three after the 10-Year Plan is adopted, an Annual Plan must be produced.
The Annual Plan 2011 /12 and 10-Year Plan 2009-2019 This Annual Report is reporting on the Annual Plan 2011/12. The Annual Plan 2011/12 is Council’s annual budget document and aligns with year three of Council’s 10-Year Plan 2009-2019. Council received 214 submissions to the draft Annual Plan 2011/12 and on 19 May 2011 heard 50 of these. All submissions, both written and oral, were considered by Council at its deliberation meeting on 26 May 2011, with the Annual Plan 2011/12 adopted on 21 June 2011.
The 10-Year Plan 2009-2019 was published for public consultation from 14 April to 21 May 2009 in conjunction with Referendum ‘09. The Council received 61 submissions and heard these submissions at a meeting on 4 June 2009. Twenty-two submitters chose to present oral submissions. In addition, 19,000 people voted on specific proposals through Referendum ’09 – representing a 61% response rate. The Council deliberated on all submissions on 8 June 2009. On 30 June 2009 the 10-Year Plan was adopted.
Annual Report The Annual Report is required under section 98 of the Local Government Act 2002. The purpose of the Annual Report is to:
• Compare actual activities and actual performance with the intended level of activity and performance as set out in the 10-Year Plan and Annual Plan.
• Promote accountability of the local authority to the community for decisions made throughout the year.
The report must contain: In relation to each group of activities:
• The activities included within the group. • The Community Outcomes to which the group
primarily contributes. • The result of any measurement undertaken
during the year on progress towards the achievement of the Community Outcomes.
• A description of any identified effects that any activity within the group has had on the social, economic, environmental or cultural wellbeing of the community.
• An audited statement of service provision, comparing intended levels with actual levels and giving the reasons for any significant variance between actual and intended levels.
• An audited statement of any significant new or replacement assets in the year to which the report relates, with reasons for acquisition or replacement and explaining any significant

Wanganui District Council Annual Report for the year ended 30 June 2012
Page 64 of 170
variation between budgeted cost and actual cost. A report on each Council Controlled Organisation including:
• The extent to which each Council Controlled Organisation has attained the Council’s policies and objectives.
• A comparison between the actual and intended nature and scope of the organisation.
• A comparison between actual performance and key performance targets.
Audited financial statements for core and consolidated Council.
Remuneration paid to elected representatives and the chief executive.
Information relating to severance payments to the chief executive and any other staff.
A statement that the requirements of the Act in relation to the Annual Report have been complied with.
A report on the activities the Council has undertaken to establish and maintain processes to provide opportunities for Maori to contribute to the decision-making process of Council.

Wanganui District Council Annual Report for the year ended 30 June 2012
Page 65 of 170
Groups of activities Overview The Council’s activities fall into six groups: Property and facilities; Community and culture; Strategy and development; Infrastructure; Corporate and governance; and Customer services.
Property and facilities This group of activities includes services and facilities that underpin the maintenance of a family-friendly district. It ranges from the provision of essential services, such as cemeteries, which contribute to the health and social wellbeing of the community, to swimming pools which, although not essential services, are important facilities for the social wellbeing of the community. The activities included in this group are: Cemeteries Pensioner housing Central Business District maintenance Property Community buildings and rural halls Swimming pools Parks and reserves Community Outcomes to which the group primarily contributes The Property and facilities group contributes to:
A healthy community A safe community A prosperous community A well connected community A community with well developed amenities and recreational opportunities A community with identity An environmentally sustainable community
Community and culture This group of activities includes services and facilities that support the community and promote social and cultural wellbeing. It includes iconic venues that make up our cultural precinct and create the heart of Wanganui. The facilities attract visitors and provide residents with a deep sense of pride and identity. It also includes community development initiatives such as youth services and community support addressing issues around safety, health and youth wellbeing. The activities included with this group are: Community development Cultural precinct: Library Sarjeant Gallery Regional Museum War Memorial Hall Royal Wanganui Opera House Community Outcomes to which the group primarily contributes The Community and culture group contributes to:
A healthy community A safe community A prosperous community A well connected community A community where people work together A community with quality education A community with well developed amenities and recreational opportunities

Wanganui District Council Annual Report for the year ended 30 June 2012
Page 66 of 170
A community with identity An environmentally sustainable community
Strategy and development This group of activities provides support to the community and the Council. Support is provided to improve the economic wellbeing of the community and support and assistance is also provided to Council in achieving its strategic direction and in meeting its legislative requirements. The activities included in the group are: Economic development Strategy and policy Community Outcomes to which the group primarily contributes The Strategy and development group contributes to:
A healthy community A safe community A prosperous community A well connected community A community where people work together A community with quality education A community with identity An environmentally sustainable community
Infrastructure This group of activities is divided into three subcategories: Transport; Water; and Waste. Transport provides and maintains connections both within the district and beyond and is essential for economic prosperity and social connectedness. Water provides the ‘three water’ services, stormwater, wastewater and water supply. These essential services protect the health and safety of people, land and property. The Waste category concerns minimising the district’s waste and promotes the sustainable use of the district’s resources, for now and in the future. The activities included within this group are: Transport: Water: Roading Water supply Footpaths and berms Stormwater Airport Wastewater Sea port Waterways and natural drainage Central Business District Parking
Waste: Waste minimisation
Community Outcomes to which the group primarily contributes The Infrastructure group contributes to:
A healthy community A safe community A prosperous community A well connected community A community with well developed amenities and recreational opportunities A community with identity An environmentally sustainable community

Wanganui District Council Annual Report for the year ended 30 June 2012
Page 67 of 170
Corporate and governance This group of activities provides support for Council staff and elected members to work together for the benefit of the community. The portfolio of investments provides income to support the work of Council. The activities are: Corporate management Investments Governance Community Outcomes to which the group primarily contributes The Corporate and governance group contributes to:
A prosperous community A well connected community A community where people work together A community with identity
Customer services This group of activities includes services that promote a safe and healthy community. It includes Emergency management and Regulatory services. Emergency management aims to protect life and property and to prepare the community for emergency situations. Regulatory services is the delivery arm of Council and ensures the compliance and enforcement of relevant legislation and bylaws. The activities are: Regulatory services Emergency management Community Outcomes to which the group primarily contributes The Customer services group contributes to:
A healthy community A safe community An environmentally sustainable community

Wanganui District Council Annual Report for the year ended 30 June 2012
Page 68 of 170
Progress made towards the achievement of the Community Outcomes While amendment to the Local Government Act 2002 removed the requirement for Council to report on progress made towards achieving the Community Outcomes, Council has continued to track this performance. In September 2011 it released a Community Outcomes Monitoring Report. The report was tasked with detailing:
• The work that the Council and other participating key stakeholders had undertaken in an effort to best meet the outcomes specific to the Wanganui community;
• Measuring the state of Wanganui’s current social, cultural, environmental and economic wellbeing; and
• Forecasting planned projects and priorities that may impact on Community Outcomes into the future.
In order to accurately monitor this progress, each outcome was assigned a number of monitoring indicators. These indicators are a mixture of qualitative and quantitative measures and were developed in consultation with key stakeholders as part of the action planning process. Data collection has been an ongoing process and is recorded in Council’s Interplan database. The reporting for this Annual Report is based upon both the updated statistics gathered and the contribution Council has made through its work programmes. Data was obtained from the Council and key stakeholders and via a Community Outcomes Survey. This survey was conducted in February 2011 and canvassed 400 residents. Changes to the Local Government Act mean that Community Outcomes now constitute the outcomes that Council will aim to achieve in order to promote the wellbeing of our district. Although it is no longer mandated that Council produce a report and that community organisations and agencies collaborate in the definition and delivery of these outcomes, there is still a clear intention to work with our key stakeholders. This will see Council continue to align planning and service delivery with community aspirations so that we can achieve common goals together. As a result, Council reviewed its strategic direction in the lead up to the development of the 10-Year Plan 2012-2022 with the hosting of both Council and community visioning exercises. The ideas generated at these meetings were then incorporated into a revised Family-friendly Strategy.

Wanganui District Council Annual Report for the year ended 30 June 2012
Page 69 of 170
Community Outcomes indicators It is important to note that the Community Outcomes belong to the community, not the Council. As a result, the Council’s role is to take the lead by facilitating their achievement in partnership with other key stakeholders. The following Community Outcomes indicators have been developed in consultation with these stakeholders and an agreement to track performance reached. Where no specific performance target has been set by our partners then a comparison to the previous year’s performance has been made. This enables us to track progress between reporting periods but is different to assessing whether we are making sufficient progress towards an optimum position or end goal. Each Community Outcome is assigned primary and secondary indicators, which are then weighted accordingly in the Council’s planning and monitoring system (Interplan). An overall target of 90% is also set. This is considered to be a fair and reasonable level of attainment and recognises that success will not only be demonstrated at the 100% mark and that there is often more to the story. A variance of 10% is also applied so that the system is flexible enough to tell this story. This means that an indicator or Outcome might attain an amber traffic light where the result is close to being achieved and therefore a rigid ‘pass’ or ‘fail’ is not appropriate.
Indicators of a healthy community Primary indicators: Life expectancy
Life expectancy for the district decreased from 79.9 years in 2005 to 78 years in 2007. Women continued to have a longer life expectancy at 80.9 years compared to 75 years for men. (Source: Ministry of Health)
Secondary indicators:
Shorter stays in emergency departments
98% of patients were admitted, discharged or transferred from the Wanganui Hospital’s emergency department within six hours. This did not meet the Ministry of Health’s target of 100%, however it was an improvement on the previous year’s result (91%) and positioned Wanganui second equal out of 20 DHBs. The target is a measure of the efficiency of flow of acute (urgent) patients through public hospitals, and home again. (Source: Whanganui DHB)
Improved access to surgery
The DHB exceeded its elective surgery target by 11% - achieving 111%. This placed the Whanganui DHB second equal out of 20 DHBs. (Source: Whanganui DHB)
Waiting time for cancer treatment
All cancer patients requiring radiation treatment received this within four weeks as per the Ministry of Health’s target. This placed Wanganui first equal out of 20 DHBs. This service is delivered by MidCentral DHB. (Source: Whanganui DHB)
Immunisation rates for two-year olds
The target of increasing immunisation rates for two year olds to 95% in the 2011/12 year was not

Wanganui District Council Annual Report for the year ended 30 June 2012
Page 70 of 170
achieved. The actual result was 89% of two year olds immunised. This was the same result as the year before and meant that Whanganui was 16th amongst 20 DHBs. (Source: Whanganui DHB)
Percentage of hospitalised smokers provided with advice and help to quit
The target of 95% of hospitalised smokers provided with advice and help to quit was exceeded. The actual result was 97%. This placed the Whanganui DHB second equal out of 20 DHBs. (Source: Whanganui DHB)
Percentage of people with diabetes attending free annual checks
The target of 60% of diabetes patients attending free annual checks was not achieved. The actual result was 59%. In 2010/11 the Ministry of Health combined its cardiovascular and diabetes measures into a single measure: ‘Better diabetes and cardiovascular services’. Whanganui DHB’s result placed it second out of all DHBs. (Source: Whanganui DHB)
Percentage of the eligible adult population undergoing cardiovascular risk assessment
The target of 60% of diabetes patients undergoing cardiovascular risk assessment was not achieved. The actual result was 59%. In 2010/11 the Ministry of Health combined its cardiovascular and diabetes measures into a single measure: ‘Better diabetes and cardiovascular services’. Whanganui DHB’s result placed it second out of all DHBs. (Source: Whanganui DHB)
Diabetes management
The target of 60% of diabetes patients demonstrating satisfactory or better diabetes management was not met – the actual result was 59%. Although the target was not achieved, this result saw Wanganui ranked second out of 20 DHBs. (Source: Whanganui DHB)
Utilisation of adolescent dental services
Utilisation of adolescent dental services totaled 78%. This exceeded the target of 73%. (Source: Whanganui DHB)
Participation in sport and recreational activities
For the third year in a row there was no change in the percentage of people participating in at least one of the sport and recreational activities canvassed – this remained at 97%. This data is sourced from the Community Views Survey and covers activities such as playing sport for a club, using the riverbank walkways and visiting a park. The Community Views Survey can be found on the Council website: www.wanganui.govt.nz. (Source: Independent Community Views Survey)
Number of coaches in Wanganui
Sport Wanganui no longer records the number of coaches in Wanganui. However, between 2009/10 and
-

Wanganui District Council Annual Report for the year ended 30 June 2012
Page 71 of 170
2010/11 there was significant growth in the number of people undertaking some form of coaching activity, with this number growing from 452 to 640. Sport Wanganui now tracks the number of coaches who participate in development, training or networking opportunities. This is in line with its seven new outcome areas.
Use of public conservation land
Recorded visitors to conservation land and the number of users of Department of Conservation huts totaled 11,201. This was a significant increase on the previous year (6,702) but was due to inclusion of Whanganui River bookings. (Source: Department of Conservation)
Council actions that have contributed to ‘A healthy community’ Wastewater Treatment Plant The Wastewater Treatment Plant receives domestic sewage
and industrial wastewater, with separated stormwater discharging to the Whanganui River or smaller local watercourses.
Identification of high infiltration areas and medium term pump station upgrades
Wastewater catchments will be identified where unacceptable levels of stormwater enter the wastewater system during rain events. All catchments will be prioritised according to the volume of stormwater that enters – with the stormwater then removed from the wastewater system.
SCADA (Supervisory Control and Data Acquisition)
A new SCADA and telemetry system was progressed during 2011/12. This will enable Council to manage its wastewater and water networks remotely and will also provide data to assist with asset management.
Water renewals / upgrades The following renewals / upgrades were completed in 2011/12:
• Water main, Somerset Road – Devon Road • Wikitoria Road – SH4 – Landguard Road • Mt View Road – No. 163 Shakespeare Road • Dublin Street – Bell Street – Niblett Street • Mission Road – section through private property
(part only) • Variable speed drive at No. 3 bore
Soft water project and security of water supply
The Council continued its efforts to reduce household and business expenses, and ensure the long-term security of Wanganui’s water supply, by providing softer water and additional water sources. Construction of a soft water treatment plant was completed during 2011/12 close to the reservoirs at Westmere. This plant softens a portion of the water from Kai Iwi and mixes it with the remaining hard water. The mixed water is then fed into the city reservoirs. This process, combined with water from the soft water bores, softens the city supply. Although water from the Heloise bore is continuing to contribute to this aim, Abelard bore is not in operation because of sand infiltration. The future use of this bore is to be determined. The soft water treatment plant is operating at its design capacity and is treating 2.6 million litres of hard water a

Wanganui District Council Annual Report for the year ended 30 June 2012
Page 72 of 170
day. Water Strategy Development of the first stage of a Water Strategy has been
completed, however, because of uncertainty in relation to the Abelard bore, the second stage of the strategy was not undertaken during 2011/12 as scheduled. The 10-Year Plan 2012-2022 includes provision to increase the capacity of the softening plant to further reduce hardness as well as construction of another bore to improve security of supply. Additional options will be considered during 2012/13.
Improvements to Wanganui’s water grading
Wanganui’s drinking water supply received an Aa grading from the Ministry of Health in 2011/12 following improvement work to our water supply and introduction of new water sources via the Westmere bores.
The grading is a risk based assessment of the water supply and is a measure of confidence that the drinking water supply will not become contaminated. The ‘Aa’ grading means:
A – the source water and treatment plants are completely satisfactory, very low level of risk.a – the reticulation water quality and systems in place are completely satisfactory, extremely low level of risk.
Active sports engagement The Community Taskforce for Youth Wellbeing continued to support active engagement for young people in sports as a means of improving health, boosting confidence, imparting new skills, encouraging teamwork, increasing self esteem and supporting a strong sense of belonging. The Taskforce worked with organisations such as Sport Wanganui and For Our Kids to address access issues and identify the full range of opportunities available to our young people.
‘May Day’ Disability Expo Wanganui’s 10th Disability Expo (organised by the Whanganui Disability Resources Centre) was hosted on 4th May 2012 at the War Memorial Centre. Council staff manned a booth, highlighting services and support for people with disabilities.
Local alcohol policy Council has kept a watching brief on the government’s Alcohol Reform Bill to anticipate changes to local liquor licensing laws. As a result of these impending changes the Alcohol Working Group has begun to draft a local alcohol policy.
Home insulation project During its deliberations on the 10-Year Plan 2012-2022 in June 2012 Council resolved to participate in the insulation refits community project. As a result, third party funding of $10,000 was included in the plan to support the efforts of the Whanganui Regional Primary Health Organisation (who have contributed $50,000). This project aims to provide free insulation refits for 250 lower decile homes in the wider district. Community services cardholders are eligible for this programme.

Wanganui District Council Annual Report for the year ended 30 June 2012
Page 73 of 170
Indicators of a safe community Primary indicators: Crime levels Total reported crime incidents equaled 4,744 in
2011/12. Although last year’s report quoted a figure of 4,444, the revised total actually placed this number at 4,977. (Source: Wanganui Police)
Number of fatal/serious injury crashes per year
The target of less than 21 fatal/serious injury crashes on Council’s local roads was achieved. The actual result was 13 fatal/serious injury crashes during the 2011/12 year. There were 11 in the 2010/11 year. (Source: NZTA)
Perceptions of safety
Perceptions of safety at home in the evening remained consistent with the previous year – moving from 96% to 97%. Similarly, there was little change in the other safety measures tracked. However, perceptions of property safety did increase by 6% and feelings of safety in the CBD at night dropped by 6% (from 51% to 45%). This was canvassed via the annual Community Views Survey. (Source: Independent Community Views Survey)
Secondary indicators:
Public perception of gang issues
This is a new KPI and was measured for the first time in 2010/11. The Community Outcomes Survey revealed that 43% of people believe that Wanganui is a safe place and there are few issues with gangs. This survey will next be undertaken in 2012/13. (Source: Independent Community Outcomes Survey)
Police numbers in the district
The number of Police in the district remained at 121 between 2010/11 and 2011/12. (Source: Wanganui Police)
Reported injuries in relation to pavements and pedestrian crossings
There were 25 injuries reported to the Council during 2011/12 as a result of pavements or pedestrian crossings. This was a decrease on the number of urgent safety hazards identified in 2010/11. (Source: Wanganui District Council)
Pavement and pedestrian crossing safety
There were 24 complaints made to the Council about pavement and pedestrian crossing safety during 2011/12. This was a decrease on the number of defects identified in 2010/11. (Source: Wanganui District Council)
Number of property fires
The number of property fires in the district decreased from 131 to 85 between 2010/11 and 2011/12. (Source: New Zealand Fire Service)
Number of lives lost through property fires
There were no lives lost to fire during 2011/12. This matched the previous year’s result. (Source: New Zealand Fire Service)

Wanganui District Council Annual Report for the year ended 30 June 2012
Page 74 of 170
Council actions that have contributed to ‘A safe community’ Earthquake prone buildings assessment
Council completed initial evaluation engineering assessments of all its category B public earthquake prone buildings (EQPBs) and notified all associated governance bodies, occupants and staff of the results. Council is now considering priorities and options for retrofitting and future use of these buildings. Assessment of Council’s category C public buildings is in progress. Council has also kept an updated inventory of all privately owned EQPBs, with scores from their initial assessments and has actively consulted with owners of potential EQPBs to advise them of their responsibilities under our EQPB Policy. Council has established a EQPB Taskforce made up of external professional people that can assist Council and the community to work through EQPB issues and solutions.
Earthquake prone notices In March 2012 Council posted notices to advise the public that some of our buildings are earthquake-prone (as assessed under the Building Act 2004). These notices are placed in easily visible places in the buildings’ main entranceways and enable people to make a choice about whether or not they wish to enter that building. It is important to note that the buildings are structurally sound but have been assessed as ‘earthquake-prone’ – which means they are less than 33% of the new building standard.
Safer Wanganui The Safer Wanganui steering group worked hard to take action on Wanganui’s health and safety issues. This steering group is comprised of leaders from the seven priority focus areas (alcohol and other drugs, education, family violence, justice, safety and wellbeing, emergency planning and road safety) and provides direction and leadership – supporting the achievement of a safe Wanganui for everyone in our district. Issues discussed during the last year included emergency management preparedness, ways of addressing bullying (both within schools and the wider family environment) and road safety. Council also appointed a part-time Safer Wanganui coordinator.
New gang bylaw Council decided to create a new bylaw in light of an earlier High Court decision that the last bylaw was invalid. The proposed new bylaw was widely consulted on using the special consultative procedure under the Local Government Act and submitters were heard on 27 June 2012. At that meeting Council also considered these submissions with a view to deciding whether to adopt the proposed bylaw or not. Council adjourned the meeting in order to receive further information on the matter. This meeting is likely to reconvene some time in August 2012.

Wanganui District Council Annual Report for the year ended 30 June 2012
Page 75 of 170
Community Taskforce on Youth Wellbeing
The Community Taskforce on Youth Wellbeing continued to work together to strengthen options, opportunities and positive pathways for children and young people. In 2011/12 this work included a focus on Wanganui East and submissions on the Green Paper for Vulnerable Children and the Wanganui District Health Board's proposal on Women's Health Services. Representatives also met with Minister of Social Development Paula Bennett, as well as Associate Ministers of Social Development and Local MPs Chester Borrows and Tariana Turia. The Taskforce is one of the largest forums of its kind in Wanganui, with members from the Council, Iwi, and senior representatives of government agencies discussing youth issues with community youth sector representatives. The taskforce is jointly chaired by Whanganui Iwi and the Council.
Graffiti management
Council continued its partnership with the Wanganui Resene PaintWise Programme to clean up the city and support community groups. Residents were encouraged to return unwanted paint which was then mixed into varying shades of grey and donated to community organisations. Graffiti management was also supported by the Council’s ‘Graffiti Hotline’ and the Graffiti Team.
In addition, Council reconfirmed its commitment to the Graffiti Management Strategy in November 2011 following a comprehensive review.
White Ribbon Day
Wanganui District Council and Safer Wanganui supported and worked with agencies who offered advice and help to those affected by family violence. Participation in the White Ribbon Day march down Victoria Avenue was encouraged to convey that our community does not condone or tolerate violence against anyone – specifically against women and children. The march culminated in a free barbeque in Majestic Square cooked by volunteers, including Mayor Annette Main.
Supporting other safety initiatives Funding was provided through Community Development Initiatives Grant contracts to Community Patrols, Neighbourhood Support, Maori Wardens, Crime Stoppers and Surf Lifesaving. Council continued to work with these groups and Whanganui Violence Intervention Network, with this facilitative role integrated into the Safer Wanganui framework.
CCTV policy In December 2011 Council adopted a CCTV policy to set out its intended practice with regard to ‘electronic surveillance closed circuit television’. The policy also provides background to the existing state of Wanganui’s CCTV network, clarifies the roles and responsibilities of supporting agencies, offers policy direction around the use of CCTV and guides future development of the network. There are currently 21 CCTV cameras operating across Wanganui’s network.
Children encouraged to be ‘dog safe’ Wanganui schoolchildren received education on how to be 'dog safe’ through Council's Animal Control officers. Many of the dog safe sessions were delivered at school

Wanganui District Council Annual Report for the year ended 30 June 2012
Page 76 of 170
assemblies and Animal Control Officer Kelly was accompanied by Phoenix, her American Bulldog (a real show-stealer!). Teaching children how to behave around dogs is a positive way to ensure they learn to act calmly and safely – and is a good way to prevent incidents occurring. In addition to working in schools, Animal Control officers also regularly work with groups such as meter readers, who often enter gardens and homes where dogs are present. They are able to share their knowledge of how to approach an unknown dog safely and to avoid difficult situations.
For Our Kids
For Our Kids continued to foster the positive development of Wanganui’s young people through greater community involvement. In 2011/12 this included promotion of opportunities for individuals, families and businesses to assume the kaupapa as their own, provision of training to volunteers (there are currently 41 trained volunteers) and development of strong brand recognition throughout the community. Volunteers are committed to helping young people reach their full potential – whether through sports coaching, homework assistance or mentorship. For Our Kids was the first major initiative of the Community Taskforce on Youth Wellbeing.
Support for anti-bullying campaign The Youth Committee began investigations into whether an anti-bullying campaign could be introduced to local schools following interest in this issue through the School Leaders Network. The Committee is considering ‘ABC’ (the ‘Anti-Bullying Campaign’ implemented at Wanganui High School). A subcommittee comprising Youth Councillors and school leaders began work on a project plan in late 2011/12.
Hazards / site features project
The hazards / site features project continued to advance during the 2011/12 year. The project’s objective is to provide one Council-wide system that records site features information in a format that is current, comprehensive, centrally accessible, validated and maintained. This will provide more certainty and accuracy for customers when obtaining data from Council, for example in the form of Land Information Memoranda (LIMs). A mapping system has been developed to record and display these features and will include items such as heritage sites, trees and swimming pools as well as hazard identification. Most of the site features (21 at present) have now been transferred to the GIS layers system. Surface flooding information has been delayed but will be progressed during 2012/13.
Roading projects Council continued to work on road safety issues with the New Zealand Police, Horizons Regional Council, NZTA and ACC through a Road Safety Action Plan group. As a result, fatal and serious crashes have continued to decline in line with the Government’s Policy Statement on Transport targets. This is as a result of engineering, education and enforcement

Wanganui District Council Annual Report for the year ended 30 June 2012
Page 77 of 170
actions. It should be noted that Council had a $2.0M reduction in New Zealand Transport Agency (NZTA) subsidies for the 2011/12 year due to a Government decision to spend more money on ‘Roads of National Significance’ – and a $5.5M reduction over the 2009-2012 financial years. This meant that some of the roading projects identified in the 10-Year Plan had to be reprioritised. The Council recognised that its roading network was at a greater risk as a result of these exclusions and deferrals but could not deliver on its approved work programme without this subsidy. However, despite the reduction in NZTA subsidy Council still managed the network successfully – including dealing with $3.0M of district-wide emergency weather events (for example slips, etc). Projects of note during the year included the reconstruction of Dublin Street (between Bell Street and Niblett Street) and an extension to the riverfront shared pathway (opposite Moutoa Gardens).
Speed feedback sign Concerns about traffic speed on Totara Street saw the installation of a speed feedback sign near Tawhero School. These signs are intended to improve drivers’ awareness of the speed they are travelling and are used where vehicles are known to regularly travel over the speed limit, at crash locations where speed has been a factor or other appropriate locations (such as near schools).
Private stormwater separation project
Separation of the stormwater and wastewater network for private households continued during 2011/12. As at 30 June 2012 separation was 99.70% complete with only 19 properties outstanding. Of these, there will be about seven or eight that will prove too difficult or expensive to separate. The remainder should be complete by December 2012. Ongoing work will include onsite investigations throughout Wanganui to identify any cross-connections or missed links between sanitary and stormwater infrastructure. Once the separation project is complete Council will continue to review sources of infiltration to the sanitary system.
Development of Stormwater Strategy
Integrated Catchment Management Plans were progressed during 2011/12. The catchment management plans will be developed one catchment at a time. To date some work has been completed on the Churton catchment and the Awarua catchment. There are 10 major catchments and these will be progressed over the next 10 years.
Emergency management training activities
These activities included: Emergency Operations Centre
• 8 September 2011 – 24 Council staff volunteers attended a two hour session evaluating information and developing Action Plans.
• 10 November 2011 – 25 Emergency Operations Centre staff and three Emergency

Wanganui District Council Annual Report for the year ended 30 June 2012
Page 78 of 170
Services members assisted in testing the Tsunami Action Plan during the international exercise ‘Pacific Wave’ over a five hour period.
• 8 March 2012 – 21 Emergency Operations Centre members worked through the principles of communications and were briefed on the new Emergency Management Information System (EMIS).
• 18-29 March 2012 – A total of 28 Emergency Operations Centre staff attended seven one hour introductory sessions for EMIS.
Welfare Team
• 7 July 2011 – 17 community volunteers attended a session on a survivor’s experiences of the February 2010 Chile earthquake and a debrief of the welfare responses to the Christchurch earthquake.
• 6 October 2011 – 14 volunteers were briefed on the Health and Safety aspects of volunteering in an emergency event.
Responses to significant events Advanced warning of a significant weather bomb prompted activation of the Emergency Operations Centre and support from a total of 12 Emergency Operations Centre volunteers over the weekend of 2 – 4 March 2012. Volunteers collated damage reports and coordinated the emergency response in conjunction with members of the Emergency Management Committee.
Whanganui Navigation and Water Safety Group
The inaugural meeting of the Whanganui Navigation and Water Safety Group was held in December 2011 with representatives from Horizons Regional Council, Royal Life Saving Society and Iwi. Discussions held by the steering group have included navigation and water safety signage, channel markers, maritime rules in relation to the river and practical guidelines for river users.
Indicators of a prosperous community Primary indicators: Unemployment Unemployment benefit recipients totaled 968 in June
2011. In June 2012 this number had increased to 1186. (Source: Work and Income NZ)
Average total hourly earnings
Average total hourly earnings increased between 2010/11 and 2011/12 – moving from $21.43 to $22.72. (Source: Census NZ)
Deprivation profile At an average of 6.2, Wanganui's level of deprivation is just above the national average of 6. This decile number is based on household income, car and telephone access, household crowding, employment, home ownership status and people <60

Wanganui District Council Annual Report for the year ended 30 June 2012
Page 79 of 170
in a single parent family. This index categorises communities from one (least deprived) to decile ten (most deprived). Within our District Health Board area, 60% of suburbs recorded a decile rating greater than five. St John’s Hill is the only suburb to score one, while Castlecliff, Mosston and Central Wanganui are equally ranked the most deprived, all recording a score of ten. (Source: Whanganui DHB)
Median income Wanganui’s median income was $19,800 as measured by Census 2006. Although this marks an increase when compared to the previous Census period where median income was $14,800 it is still considerably lower than the national median of $24,400. The next Census will be delivered in March 2013. (Source: Census NZ)
Secondary indicators:
Perception of Wanganui as ‘business friendly’
Forty nine percent of respondents to the Chamber of Commerce's survey in 2008/09 believed Wanganui to be business friendly. This survey has not been delivered since. (Source: Whanganui Employers’ Chamber of Commerce)
Pastoral sector gross output
Gains were witnessed in Wanganui’s total pastoral sector gross output. This figure increased from $82M in 2010/11 to $85M in 2011/12. (Source: Meat & Wool NZ Economic Unit)
Tonnes of product through the port
7,875 tonnes of product was processed through Wanganui Port in 2011/12, representing a significant decrease of 10,228 tonnes on the previous period. This drop was attributed to the loss of urea shipments following the closure of the Kapuni plant (urea constituted 70% of our cargo in previous years). This plant is now back up and running and we have also picked up additional shipments. (Source: Wanganui Port)
Number of guest nights
Guest night figures in 2011/12 demonstrated growth, reversing a consistent pattern of decline. There were 173,274 guest nights in 2010/11 and 174,718 in 2011/12. In addition:
• International guest nights were up 3.7% to 37,410.
• Domestic guest nights increased by 0.1% to 137,308.
• The average length of stay grew from 1.67 nights to 1.73 nights.
• Overall occupancy rates were down from 26.4% to 25.9%.
• Accommodation capacity, excluding holiday parks, decreased by 0.3%.
(Source: Statistics NZ)

Wanganui District Council Annual Report for the year ended 30 June 2012
Page 80 of 170
Council actions that have contributed to ‘A prosperous community’ Sea port
Council continued to operate the sea port on a status quo (and austere) basis while a number of steps were taken to decide the port's future. The following processes have helped to make these decisions:
• People interested in operating the port have been sought and interviews held with a short list of four applicants. Further discussions with these people will take place over the next five months. Iwi representatives have also been invited to participate in these discussions.
• A submission has been made to the Horizons Regional Council 10-Year Plan about much needed repairs to river protection works from Cobham Bridge to (and including) the Moles. These repairs are needed whether there is a port or not. It needs to be decided which council is best placed to undertake river management in this area – although the district’s stance is that river management is a core function of the Regional Council. In the meantime, both councils have jointly appointed a specialist river engineer to report on the remedial work required.
• A specialist port engineer has been commissioned to provide cost estimates for undertaking functional replacement of parts of the port – and to decommission other parts.
These steps will result in the submission of a concept business plan to Council in late 2012 for a decision on the port’s future. In terms of investment performance the sea port activity was operated from Wanganui District Council Holdings Limited for the year. Work continues on considering future options for the port assets.
Economic Development Strategy The Council’s Economic Development Strategy was adopted in March 2012 after extensive consultation with the business community. The overarching goal of this strategy is sustainable economic prosperity for the people of Wanganui. This will be achieved through community-wide collaboration and cooperation.
Whanganui and Partners Whanganui and Partners emerged as an initiative from the Economic Development Strategy and was approved by the Council in June 2012. It will assist Council to work with stakeholders to support the Wanganui 2022 vision and mission – specifically through implementation of the Economic Development Strategy and Visitor Strategy.
‘Made in Wanganui’ In September 2011 a ‘Made in Wanganui’ initiative was launched as a joint project between Council and the Whanganui Employers’ Chamber of Commerce. Visitors to Wanganui who wish to start a business, invest in one or develop a business relationship can now easily connect with someone who can help them through a ‘single point of

Wanganui District Council Annual Report for the year ended 30 June 2012
Page 81 of 170
contact’ 0800 number. This initiative is being promoted through flyers in every motel and hotel room, cafes and restaurants, bars, service stations, gift shops, the i-Site and other locations on the visitor trail and was launched in time for the Rugby World Cup.
Mayors Taskforce for Jobs Mayor Annette Main continued her involvement in the Mayors Taskforce for Jobs – striving to achieve the taskforce’s goal of engaging all young people under 25 years of age in: “appropriate education, training, work or other activities that contribute to their long-term economic independence and wellbeing.” This work was integrated into the Community Taskforce on Youth Wellbeing.
Conference Bureau The Conference Bureau continued to promote Wanganui as a conference destination. In 2011/12 this included exhibiting at ‘Conventions and Incentives New Zealand’ (CINZ), ‘Wanganui Home and Lifestyle Show’ and ‘Let’s Hear it for the Girls Expo’ in New Plymouth. The bureau also sustained its advertisements in the Corporate Events Guide and CINZ Event Planners Guide 2011.
Skilled Workers Attraction Programme (SWAP)
The contract with WorkingIn Ltd was ceased in February 2012 following a review of its efficacy. A network of HR/recruitment specialists has now been convened as an advisory network and a ‘Moving To Whanganui’ publication is to be developed with their input. This publication will be used in a targeted way to attract immigrants for specific work opportunities.
Business assistance Fortnightly BIZ clinics were hosted with our Regional Business Partner Network agents, Vision Manawatu and Ministry of Science and Innovation funding consultants ‘thebcc Ltd’. New business start-up enquiries were similarly referred to these partner agencies, with seven received over the 2011/12 period. Advice and facilitation was also provided to eight businesses engaging with Council services as part of their business activity.
Recognition of Limited Service Volunteer graduates
In August 2011 Mayor Annette Main hosted a celebratory morning tea in the Council Chamber for Wanganui graduates of the Limited Service Volunteer (LSV) course. LSV is a hands-on six week course held at Burnham, Trentham or Hobsonville Military Camps for young people aged between 18-24 who are registered with Work and Income. Wanganui employers have now come on board to become sponsors of LSV, with a view to providing employment opportunities and mentorship for the LSV programme in the future. The course improves the employability of participants through its focus on discipline, motivation, respect and work ethic. It provides them with life skills and self-confidence to gain full time employment.
Work experience opportunities The Community Taskforce on Youth Wellbeing called for local employers and organisations to offer work experience opportunities for Wanganui’s young people. This was part of a programme to boost motivation, improve self-esteem and impart effective self-management. It also helped young people to see the array of career and training opportunities available to them.

Wanganui District Council Annual Report for the year ended 30 June 2012
Page 82 of 170
Economic development for the rural sector
Council’s economic development team continued to work with the Rural Community Board on business initiatives – particularly around agriculture and horticulture. In 2011/12 a land-use potential research report was commissioned and reported to the Board. These opportunities are now being pursued.
River Road tour
In October 2011 a tour of the Whanganui River Road provided an opportunity for Wanganui’s elected representatives to talk to residents, find out about tourism and economic development opportunities and discuss roading and other issues. Some highlights of the trip included visits to the Upokongaro jetty, Upokongaro Hall and Pipiriki Marae, discussion on the impact of forestry harvesting on the River Road area, a presentation by Powerco on the standalone BasePower project being trialled by Atihau Incorporated as an alternative to the power grid system and an update on rural broadband initiatives.
Sister Cities involvement and 60 year anniversary
Wanganui’s sister city relationships with Toowoomba, Australia and Nagaizumi-cho, Japan continued to be supported during 2011/12. This included a visit to Toowoomba by Mayor Annette Main and appointment of a new manager at the Nagaizumi-Wanganui Sister Cities Friendship Centre. In addition, 2012 marked the 60th anniversary of diplomatic relations between Japan and New Zealand. The Ambassador of Japan has contacted the mayor to seek Wanganui’s involvement in celebratory events and a Council working party is now developing a programme to recognise this special occasion. This will take place over Labour Weekend 2012.
Indicators of a well connected community Primary indicators: Community participation
In 2011/12 41% of people were active in a community organisation; this represented no change on results from 2010/11. This is canvassed via the annual Community Views Survey. (Source: Independent Community Views Survey)
Flights in and out of Wanganui
Flights in and out of Wanganui decreased from 3,258 in 2010/11 to 3,089 in 2011/12. This drop is attributed to a large number of cancellations over the Christmas / New Year period and in May – June as a result of aircraft unavailability. Improvements in data collection are also continuing to be made. In addition to the regular Wellington and Auckland services, there were 21 Air Nelson flights diverted to Wanganui following the closure of other airports There were 41,824 passengers carried during the 2011/12 year. (Source: Eagle Airways Ltd)

Wanganui District Council Annual Report for the year ended 30 June 2012
Page 83 of 170
Percentage of households with access to the internet
The target of 50% was exceeded. The actual projected result was 53% of households with access to the internet. Access to the internet is an important measure of social connectedness – providing the means to stay in touch as well as to obtain necessary information. This figure will be confirmed following the next Census in March 2013. (Source: Statistics NZ)
Secondary indicators:
Length of pathways and footpaths
Pathway and footpath provision slowed - shifting from 7,500m² to 4,203m² between 2010/11 and 2011/12. This drop was as a result of significant work undertaken in the previous year on the State Highway (at Carlton Avenue and Anzac Parade) and subdivision activity. (Source: Wanganui District Council)
Users of public transport
Users of the bus transport system in Wanganui decreased from 169,387 in 2010/11 to 162,079 in 2011/12. However, satisfaction with these services increased slightly. (Source: Horizons Regional Council)
Public transport user satisfaction
Horizons Regional Council conducts a public transport user satisfaction survey to canvass community perceptions of its services. In 2011/12 72% of public transport users were satisfied with the service received – an increase of 2% on the previous year. (Source: Horizons Regional Council)
Rail movements in and out of Wanganui
The Ministry of Transport records the number of rail movements in and out of Wanganui. In 2011/12 there were 2,496 rail movements. The Ministry of Transport has changed its method of data collection so these results are not directly comparable to those from the year before. (Source: Ministry of Transport)
-
Port assisted movements in and out of Wanganui Port
The ships register recorded 11 port assisted movements in and out of Wanganui Port during 2011/12. This represented a decline on the previous period where 23 movements were made. This drop was attributed to the loss of urea shipments following the closure of the Kapuni plant (urea constituted 70% of our cargo in previous years). This plant is now back up and running and we have also picked up additional shipments. (Source: Wanganui Port)

Wanganui District Council Annual Report for the year ended 30 June 2012
Page 84 of 170
Council actions that have contributed to ‘A well connected community’ Ultra-fast broadband roll-out
In July 2011 work officially began on constructing Wanganui’s $35M ultrafast broadband network. The roll-out of ultrafast broadband is part of the $1.3B government project to deliver ultrafast broadband to the door of 75% of the New Zealand population by the end of 2019. Wanganui is the third place in the country to receive this technology. Building the network will take up to five years, with the Central Business District area targeted first.
Ultrafast broadband in the rural areas
Council and the Rural Community Board worked with Telecom, Vodafone and other organisations to try to extend the deployment of rural broadband as far as possible. The Rural Broadband Initiative is focused on connecting rural schools – the first schools to be connected in Wanganui’s rural area are likely to be Brunswick School, Faith Academy, Kaitoke School, Mosston School and Westmere School.
Whanganui Digital Leaders Forum The Whanganui Digital Leaders Forum met monthly – undertaking work to ensure that Wanganui’s diverse communities are empowered and enabled to make the most of the advantages ultrafast broadband offers. The forum represents 10 key focus areas including education, business, health, the environment, sports, creative industries, Tangata Whenua, the rural sector, the community and Wanganui District Council itself. Work is now underway on producing a strategic plan for each of these focus areas.
Computers in Homes
The Wanganui Computers in Homes programme entered its sixth year of operation – having assisted around 580 families to become digitally literate to date. In 2011/12 Computers in Homes saw 223 graduations, with classes held at Aramoho, Tawhero and Wanganui East Schools, Born and Raised Pasifika Centre, Whanganui Learning Centre and the Putiki Marae Cyberwhare. Participation in Computers in Homes involves parents and caregivers undertaking 20 hours' training covering basic computer and internet use. They then receive a refurbished computer and software to use at home. The programme is for under-served families with children at school who can not afford to have a computer and internet connection at home. The companion programme ‘Stepping Up’ was also offered – supporting additional training for Computers in Homes families with an interest in building on their digital literacy skills.
Computer Clubhouse The Computer Clubhouse continued to provide a creative and safe after-school learning environment for young people aged 10 to 18 years. The Clubhouse has 15 computers with design software and a recording studio. During 2011/12 young people used the Clubhouse to write and record their own songs, produce music videos, develop animation and create video

Wanganui District Council Annual Report for the year ended 30 June 2012
Page 85 of 170
games. There are currently more than 400 members. Computer Clubhouse Teen Summit
Members of Wanganui’s Computer Clubhouse attended the first New Zealand Teen Summit for clubhouse members. Eight members, aged between 13 and 18, from each Clubhouse across the country were selected to attend and spent a week participating in workshops, attending a careers fair, performing in a talent show and showcasing the achievements of their Clubhouse.
Boston Computer Clubhouse summit
Three members of the Wanganui Computer Clubhouse were also selected to attend the Intel Computer Clubhouse Network 2012 Teen Summit in Boston in July. There are more than 100 clubhouses in 20 different countries and Wanganui is one of five centres in New Zealand to have a clubhouse. The Intel Computer Clubhouse Network supports community-based clubhouses around the world and organises a biennial Teen Summit – funding up to three members and a chaperone to attend the summit.
Aotearoa People’s Network Kaharoa
The Aotearoa People’s Network Kaharoa continued to provide a free internet service hosted by the district’s libraries. People used this service for a number of purposes including writing CVs, participating in online courses or staying in touch with family and friends through social networking sites. Computers linked to the network are available at both the Davis Library and Gonville Café Library. Free Wifi access is also available to people with their own wireless enabled computers and other wireless devices. The network caters to approximately 1,832 people a week (an increase on last year of around 65 people per week).
Ake Ake Centre
The Ake Ake Centre (a collaboration between Yes 2 Youth and the Council) was officially opened in October 2011, providing a safe and supportive place for young people to interact and engage in positive programmes and activities. In addition, a Community Technology Centre (CTC) pilot project was planned for the centre following submission of a successful application to the Council’s Digital Communities group (DIGICOM). Development of a CTC is based on DIGICOM’s interest in easing access to the internet for families and the wider community and provision of these digital resources at the Ake Ake Centre will mark a first for Castlecliff. The CTC will open in July 2012 and will function as a training space for Computers in Homes families, as a community facility and as a digital hub for young people from 3.00pm (where youth will be assisted to work on creative projects or activities).
Tram project
The tram project was progressed throughout 2011/12 – with approval sought to construct tramlines along Moutoa Quay (linking the Tram Shed to the PS Waimarie berth) as part of stage one of the project. This integrates with the Riverfront Development Plan – seeing the area eventually becoming a pedestrian-orientated open space. The restored No.12 Tram was relaunched from the Tram Shed on 23 January 2012 as part of the More FM Boardwalk Festival, with track construction beginning in May 2012. It is intended to

Wanganui District Council Annual Report for the year ended 30 June 2012
Page 86 of 170
have stage one of the project completed in time for the centenary of the tram’s first outing on the streets of Wanganui on 26 September.
Wanganui Airport turns 50
The 50th anniversary of the opening of Wanganui Airport was celebrated in December 2011. The airport provides a vital link for our community, with regular flights to Wellington and Auckland and provision of services for a number of aviation businesses – as well as recreational flying opportunities.
Upokongaro pathway proposed Investigations into a potential pathway between Wanganui and Upokongaro were undertaken during 2011/12 in conjunction with Horizons Regional Council. This would enhance existing urban pathways and form part of the ‘Mountains to Sea’ section of the national cycleway. These investigations are continuing through the Upokongaro Shared Pathway Project Team – comprising Iwi and other community representatives.
Shared Pathways Strategy Council adopted its Shared Pathways Strategy in March 2012. The strategy envisions a family-friendly district with pathways that are safe, convenient, interconnected, accessible, attractive and expressive to encourage multiple uses by multiple users – a district with active pathways for active people.
Cycle trail hikoi
A three day cycle journey travelling the entire length of the Mountains to Sea (Nga Ara Tuhono) section of the National Cycle Trail (Nga Haerenga) took place between 26-28 April 2012. The Mountains to Sea ride is a regional initiative involving Ruapehu District Council, Wanganui District Council, Iwi, community groups and Department of Conservation. As only parts of this ride have been officially opened, the hikoi allowed the cycle trail partners, iwi and the local communities to showcase their sections of track and the benefits already accrued. The hikoi finished at the North Mole, Castlecliff, where the Whanganui River meets the Tasman Sea.
Wanganui Urban Transportation Strategy
The Wanganui Urban Transportation Strategy was adopted by Council in November 2011. It sets out how (over the next thirty years) the community will achieve an affordable, integrated, safe, responsive and sustainable transport system to provide real transport choices for our city.
Award for Urban Transportation Strategy
The Urban Transportation Strategy (a collaborative effort between Wanganui District Council, Horizons Regional Council and Opus International Consultants) was recognised with an award from the New Zealand Planning Institute (NZPI) in May 2012. The strategy is an outstanding example of integrated planning and sets the direction for Wanganui transport over the next 30 years – in the understanding that building an effective transport network is not just about building roads.

Wanganui District Council Annual Report for the year ended 30 June 2012
Page 87 of 170
Roading subsidy Council received confirmation from New Zealand Transport Agency (NZTA) that the Council’s roading subsidy rate (62%) will remain the same until 2015. Wanganui is one of four councils in New Zealand that will receive the highest level subsidy over the next three years. This means that Council will be able to continue with its planned roading programmes at the existing subsidy level.
Mangamahu Road repair
Work on Mangamahu Road was undertaken during 2011/12 to repair damage caused by a storm event in late 2009. This saw a section of the road ‘fall out’ which restricted the road to little more than a single vehicle width. Repairs to the road involved reconstruction of the embankment and extension of the existing retaining wall in both directions. In order to protect the embankment from further erosion, a layer of "rock armouring" was designed to be installed within the river and on the reconstructed embankment below the river’s nominal flood level.
River Road seal extension This seal extension project entered its sixth year of a seven year period of construction. The earthworks contract for the entire 30 kilometres length is 64% complete. The project was suspended in January 2012 due to forest harvesting and a NZTA funding hold up.
Parking Strategy A Parking Strategy for the CBD and riverfront area was drafted during 2011/12. This will identify how Council will provide for and manage the development, distribution and ongoing management of parking facilities over the next 11 to 20 years. Submissions on the draft strategy closed on 15 June 2012.
Smart Eye parking trial
Smart Eye sensors were placed in parking bays between Guyton Street and Ingestre Street to monitor parking patterns and help inform the Wanganui Parking Management Plan.
Community profile information Council launched a new community profile tool in April 2012 to provide a comprehensive demographic insight into the Wanganui district. Our community profile presents data from the 1996, 2001 and 2006 NZ Census in simple, clear tables and charts with concise factual commentary. It provides easy to use information about the community and enables individuals, community groups and organisations to better understand the community and tackle activities such as research, planning, and advocacy. Wanganui’s profile links from the Council website: www.wanganui.govt.nz
Library home service The Wanganui Library Home Service was officially launched at a special event held at the Alexander Library on 16 November 2011. The service was made possible by a generous bequest from Josephine Duncan

Wanganui District Council Annual Report for the year ended 30 June 2012
Page 88 of 170
(a long-time supporter of the library) and has been established in partnership with Age Concern Wanganui. The Home Service offers a range of library services to people in the community who are unable to visit the library whether due to temporary incapacity through illness or injury, disability, or because of age. Volunteers have received training from Age Concern and are responsible for matching the interests of their Home Service participant to books and other items from the library.
Innovative new computer system for Wanganui libraries
Wanganui was amongst the first wave of public libraries throughout New Zealand to upgrade to Kotui, an innovative new computer system coordinated by the National Library of New Zealand. This was launched in March 2012. The new system benefits library staff by offering a future-proof way of sharing resources and freeing them up to spend more time with customers, as the day to day management of the library system is undertaken remotely. Kotui also makes it possible for users to search all of the library resources including books, DVDs and magazines from a single access point from their computer or smartphone wherever they are – at home, at work, at school or in the library!
e-books now available Wanganui’s libraries joined ePukaPuka (a consortium of 15 libraries around the lower North Island) and now offer the Overdrive digital library service for free. Audio books and e-books can now be downloaded onto your computer or smart device, with an issue period of one week. To access e-books visit the ePukaPuka website at www.epukapuka.org.
Disability Strategy In late 2011 a meeting was held with a representative group of mobility scooter users as a follow up to the 2010/11 Mobility Users Survey. This meeting focused on identifying and rectifying infrastructure issues and problem areas around the city.
Indicators of a community where people work together Primary indicators: Public perception of positive leadership
The 2012 Community Views Survey revealed that 55% of people rated the performance of the Mayor and councillors as ‘good’ or ‘very good’. This represented a slight decrease in confidence on the previous year where 57% of respondents were satisfied with this performance. In addition, provision of sufficient information, the quality of this information, responsiveness to community needs and issues and community involvement in decision making were also canvassed. All of these measures were largely consistent with the results for the previous year, with 63% of people considering that ‘enough’ or ‘more than enough’ information had been supplied (66% in 2011); 59% of people believing that the Council had responded ‘very well’ or ‘well’ to community needs and issues (61% in 2011); and 52%

Wanganui District Council Annual Report for the year ended 30 June 2012
Page 89 of 170
noting satisfaction with the community’s involvement in decision making (54% in 2011). This was the first year that the quality of information was canvassed. Overall, 65% of respondents stated that the information supplied by Council ‘told them what they needed to know’. (Source: Independent Community Views Survey)
Voter turnout at local elections
There was no local government election held during the 2011/12 year. The last election was held in October 2010 and attracted 60.52% of eligible voters. This was less than in 2007 where 63.44% participated. (Source: Wanganui District Council)
-
Secondary indicators:
Submissions to annual planning process
Submissions to Council’s annual planning process continued to grow – increasing from 58 submissions in 2009/10 to 216 in 2010/11 and 245 in 2011/12. Sixty-five submitters to the 10-Year Plan 2012-2022 elected to be heard at the Council’s submissions meetings on 11 and 12 June 2012. (Source: Wanganui District Council)
Referenda participation rate
There was no referendum held during the 2011/12 year. The last referendum was held in October 2010 and canvassed public opinion on gambling machines and the investigation of a unitary authority – it achieved a 46.45% response rate (a decrease of approximately 14% on the 2009 referendum). (Source: Wanganui District Council)
-
Council actions that have contributed to ‘A community where people work together’ Youth Committee
The Council’s Youth Committee entered into its seventh year of operation. Eighteen young people (between the ages of 12 and 24) are appointed for a term of at least one year and are selected to match Wanganui’s diverse makeup and act as effective youth advocates. Issues considered by the committee during 2011/12 included support for children and teens impacted by family violence, the 10-Year Plan 2012-2022 and bullying. The Committee also worked on its Dub.Dee.See. Connect 2022 Strategic Plan, reviewed the Kowhai Park skate bowl, attended the National Forum on Cultural Diversity and staged events such as Picnic in the Park.
Youth Committee officially the best!
Wanganui’s Youth Committee was officially named the country's best Youth Council at the biennial Youth in Local Government Conference held in Invercargill in April 2012. Wanganui's Youth Committee was named top in the 'Engaging young people in local/regional government affairs' category. Wanganui District Council has involved its Youth Committee in its activities and decision making and, over time, the Youth Committee has assumed a greater responsibility to engage with the wider youth community. It

Wanganui District Council Annual Report for the year ended 30 June 2012
Page 90 of 170
has established networks, such as the 'Youth Leaders Network', to reinforce its advocacy on behalf of young people in the Wanganui District and managed to engage young people in local government affairs, delivering tangible benefits for Wanganui’s young people. There are 34 Youth Councils in New Zealand.
Youth voter awareness The Youth Committee and the YMCA Youth Advisory Board worked together to organise a Youth Voting Awareness and Youth Policy Forum to help young people be better informed in the lead-up to the general election in November 2011.
Youth Connect 2012
Dub.Dee.See. Youth Connect 2012 was hosted by the Youth Committee over two days in June 2012. The successful event was attended by more than 100 young people from Wanganui schools, training providers and employers. They took part in a range of workshops and got to experience a mini-computer clubhouse set up especially for the event. All of the young people taking part were encouraged to share their views on what would make Wanganui an even better place for them. The ideas and information gathered will feed into the Youth Committee’s 10-Year Strategic Plan.
Dub.Dee.See.Connect 2022 Strategic Plan
The Youth Committee’s Strategic Plan was reviewed during 2011/12 (it is reviewed every three years). This process saw new projects and priorities identified and Youth Councillors appointed to specific portfolios. An updated plan will be adopted in early 2012/13.
Youth grants partnership The Whanganui Community Foundation invited the Youth Committee to partner in a youth grant initiative, with the Youth Committee responsible for determining how funding could best benefit Wanganui’s young people. A memorandum of understanding was endorsed in March 2012 – governing how the annual allocation of $10,000 will be distributed to assist youth initiatives.
School Leaders Network A School Leaders Network was progressed during 2011/12 with the intention of improving Council’s relationship with other young leaders. Meetings were held with the student Heads of local secondary schools and covered issues such as preventative and responsive methods to combat bullying and access to drugs and alcohol.
Youth Committee $300ships
The Youth Committee continued to provide funding for young people to help them reach their potential. ‘$300ships’ are available to Wanganui residents between 12 and 24 years of age to support personal development in any arena. Recipients during 2011/12 received funding for a diverse range of activities – including Waka Ama, trampolining, music, netball and film making.
Funding for the Youth Committee
The Youth Committee was awarded $13,000 from the Ministry of Youth Development ‘Partnership Fund’ for the “Dub.Dee.See.Connect,” project in July 2011. The aim of the project is to enhance the work of the Youth Committee by growing local connections and capacity and facilitating greater involvement of young people in the shaping of Wanganui’s future. This resulted in the hosting of the Dub.Dee.See. Youth Connect Forum in June 2012.

Wanganui District Council Annual Report for the year ended 30 June 2012
Page 91 of 170
Rose House project In December 2011 Council agreed to partner with four
community organisations (Birthright Wanganui, YMCA Wanganui, YMCA Central and Whakaaronui Ke Ti Ora Maori Women’s Welfare League) to seek funding from the Department of Building and Housing’s Social Housing Unit – Niche Fund for a supported housing facility for young mothers and their babies.
Christchurch earthquake memorial
A special Memorial Service was held at Majestic Square on 22 February 2012 to mark the anniversary of the February 2011 Christchurch earthquake. The event was organised and funded by the Council’s Youth Committee.
Christchurch visitors welcomed
Wanganui put on a warm welcome for 60 visitors from Christchurch who visited our city for one week in September 2011. The visit was an opportunity for rest and relaxation away from the effects of the Christchurch earthquakes and was organised by local woman Lyn Boyle and the Caversham Park Committee. Guests were presented with hand-knitted red and black scarves and bags of gifts and were taken on a tour of Wanganui’s sights – including a trip on the PS Waimarie and a visit to Jerusalem.
Welcome to Wanganui pack The Multicultural Action Group worked with Council to develop a ‘Welcome to Wanganui’ pack for newcomers to our city. This resource will facilitate community building and support new migrants to settle within our district.
Positive Ageing Strategy review The Positive Ageing Strategy was reviewed during 2011/12 in conjunction with key community stakeholders. It is due to be adopted in November 2012.
Facilitation of the Positive Ageing Forum
The Positive Ageing Forum continued to meet regularly during 2011/12 to progress issues of significance for older people in our community. This included presentations on neighbourhood support and safety, alzheimers, arthritis, the changeover to digital television and grandparents raising grandchildren. Discussions were also held on a number of topics – including the different transport options available to older people (e.g. health shuttles and the Age Concern volunteer driver army), the Council’s proposed 10-Year Plan 2012-2022 and information technology.
Suffrage celebrations Council celebrated Suffrage Day with a special morning tea at the Council Chambers on 19 September 2011. The Alexander Heritage and Research Library also marked the occasion with a display of suffrage memorabilia.
What do you think? Council launched an online citizens’ panel to canvass the views of our community. The ‘What do you think’ website provides a number of opportunities for Wanganui people to have their say and engage in online forums, polls and surveys: http://whatdoyouthink.org.nz
Wanganui 2022 Wanganui’s Family-friendly strategy was reviewed during 2011/12 following a community visioning day (‘Creating our Future’) facilitated by the Whanganui Community Foundation and a visioning exercise with councillors. Feedback was also sought from the wider community, for example through the ‘What do you think’ website. Council

Wanganui District Council Annual Report for the year ended 30 June 2012
Page 92 of 170
considered all this feedback and used it to develop a vision encapsulating where our district wants to be in 2022:
“Family-friendly Wanganui: the best place to live in New Zealand
• Enjoyed for its lifestyle and sense of community • Celebrated for its liveability, culture and heritage • Shaped by our river and environment • On the path of sustainability and prosperity • Loved by those who live here”
The revised Family-friendly strategy was fed into the 10-Year Plan 2012-2022.
10-Year Plan 2012-2022 The 10-Year Plan 2012-2022 was adopted on 28 June 2012. This sets out our planned services, activities and financial management policies for the coming decade.
Conversations with the community
Conversations with the community took place during 2011/12 – providing an opportunity for residents to engage with the Mayor, councillors and Council representatives. These meetings were also supported by Safer Wanganui.
Community Contracts Funding of $150,000 was available to support community groups and organisations in the delivery of community based projects or events. Thirty seven applications were received for the formal 2011/12 Community Contracts funding round and 29 contracts were approved with grants totalling $129,197. The residual amount ($20,803) was held for applications which might arise during the year.
Creative Communities grants
Funding for local community-based arts activities was again available through the Creative Communities Scheme. This scheme aims to increase participation in the arts at a local level, and increase the range and diversity of arts available to communities – with the fund administered by the Council in partnership with Creative New Zealand. There are two funding rounds per year. In round one 25 applications were received for the contestable pool of $16,174. Ten applications were approved and a small roll-over was permitted by Creative New Zealand for round two later in 2012. The successful applicants covered a broad programme of arts events and training and included Wanganui Opera Week, the Secondary School Portrait Competition, Wanganui National Art Exhibition and Awards, Whanganui Musicians Club songwriting and performance competition, an exhibition of contemporary mosaic art, the 31st Biennial National Glass Conference and an audio walking tour of Wanganui’s public art.
Providing the community with resources to foster financial independence, e.g. Fundview and BreakOut databases
These searchable databases were provided at the District Library and Community House and enabled the public to access current information on funding sources, criteria and availability. Fundview contains over 600 different funding schemes for voluntary organisations while Breakout offers over 2,200 funding schemes for students, researchers, sports people and artists.
Tamaupoko and Tupoho Working Parties
The Council continued to meet separately with two of the Atihaunui-A-Paparangi Runanga, Tupoho and TamaUpoko, on a six-weekly basis as per its relationship documents.

Wanganui District Council Annual Report for the year ended 30 June 2012
Page 93 of 170
Nine Tamaupoko Link meetings and eight Tupoho Working Party meetings took place during the 2011/12 year.
Rural Community Board
Representative community governance was provided in the rural area by the Rural Community Board. Public meetings continued to be held in alignment with Council’s six-weekly meeting cycle throughout 2011/12 and the Board pursued additional efforts to connect with its community through initiatives such as its rural newsletter ‘Hotwire’, articles in ‘On the Land’ and stakeholder meetings on specific topics. The Board also initiated a project examining the effect of forestry harvest on rural roads; took councillors, stakeholders and Council officers on two rural road trips to witness firsthand some of the specific issues faced by the rural sector; and worked with broadband network companies to ensure all of Wanganui’s rural area will have access to faster, more affordable broadband in the future. In addition, the board’s strategic plan (Rural Directions 2020) was used as a best practice example by the Local Government Commission.
Community Boards meeting In August 2011 the Wanganui Rural Community Board hosted a conference for community board representatives from throughout the lower North Island. The purpose of the meeting was to share developments in relation to the roles of community boards and highlight how they can best serve their communities.
Indicators of a community with quality education Primary indicators: NCEA attainment The percentage of school leavers with at least NCEA
Level 3, or sufficient attainment to attend university, increased between 2010 and 2011. In 2010 49.4% of students gained an entrance qualification while in 2011 this sat at 66.5%. (Source: Ministry of Education)
Level of educational attainment
The number of people aged 15 years or over with a tertiary qualification increased from 1,842 in 2001 to 2,688 in 2006 as measured by the Census. The number of people aged 15 years or over with no qualification decreased from 9,933 in 2001 to 9,768 in 2006. The next Census will be delivered in March 2013. (Source: Census NZ)
Early childhood education enrolment rates
Gains were made in the number of children enrolled in early childhood education between 2010/11 and 2011/12, with rolls increasing from 2,504 to 2,636. This continued an ongoing pattern of growth – with gains remaining most evident for ‘homebased’ childcare (jumping from 653 to 786). (Source: Ministry of Education)

Wanganui District Council Annual Report for the year ended 30 June 2012
Page 94 of 170
Secondary indicators:
UCOL enrolment rates
Full-time equivalent students for UCOL’s Whanganui Faculty declined between 2011 and 2012. They dropped from 724 to 682. (Source: Whanganui UCOL)
Gateway course enrolments
Gateway programmes offer practical courses of study supported by industry Unit Standard qualifications for school students in Years 11 through 13 – providing pathways into careers and a non-traditional approach to learning. In Wanganui these courses offer ‘on the job’ training in areas such as early childhood care and vet nursing. In 2011/12 there were 143 students enrolled in the Gateway programme. This was a decrease of 15 students on the previous year. (Source: Ministry of Education)
Council actions that have contributed to ‘A community with quality education’ INTRANZ (Industry Training New Zealand)
INTRANZ saw its second group of students graduate from the INTRANZ Foundation course during 2011/12. In addition to meeting the stringent performance criteria demanded throughout the 26 week course, all graduates also gained the National Certificate in Mechanical Engineering (Level 2). INTRANZ has purpose built training facilities located next to GDM in Gilberd Street, Castlecliff. The training school continues to receive strong support from the Wanganui District Council, Wanganui industry and Wanganui YMCA.
Wanganui Glass School
The Council sustained its involvement in the Wanganui Glass School throughout 2011/12 and during deliberations for the 10-Year Plan 2012-2022 in June agreed to continue this support into the 2012/13 year. Funding of $95,000 was included in the plan; however, a decision on future support will be made in late 2012. Mayoral Accommodation Scholarships (funded by UCOL) were also offered in 2012 for five first year Diploma in Glass Design and Production students – with the intent to encourage people to study glass art in Wanganui.
Adult Learners’ Week
Council supported the national launch of Adult Learners' Week/He Tangata Mātauranga at Putiki Marae on 1 November 2011 – co-hosting the event with the Whanganui Regional Adult Community Education Network and ACE Aotearoa. The launch was an opportunity for Wanganui to celebrate the diverse range of adult learning opportunities available within the district.
Education Wanganui Export Network visitors
Visitors from China and Thailand were welcomed in the Council chambers as guests of the Education Wanganui Export Network (EWEN). The visitors spent a week in Wanganui in June 2012 meeting the principals of all local

Wanganui District Council Annual Report for the year ended 30 June 2012
Page 95 of 170
high schools and learning more about the opportunities for international students studying in Wanganui.
Indicators of a community with well developed amenities and recreational opportunities Primary indicators: Participation in sport and recreational activities
The community’s level of participation in sport and recreational activities was canvassed by the Community Views Survey 2012. The vast majority of respondents to this survey (97%) had participated in at least one of the activity options over the last year – seeing Wanganui sustain the same level of participation as the year before. Respondents were asked which of the following they had undertaken over the previous year: visiting a beach; using / visiting a Premier Park; using / visiting a neighbourhood park; using the riverbank walkway; using other walkways around the city; using / visiting a sportsground; using / attending an event at Cooks Gardens; playing sport on an informal basis; playing organised sport (e.g. for a club); undertaking activities on the Whanganui River; and using a cycle-way or cycle-lane. (Source: Independent Community Views Survey)
Participation in arts and cultural activities
The 2012 Community Views Survey revealed that Wanganui residents participate in a number of arts and cultural activities, with 90% of respondents undertaking at least one of the identified options in the previous 12 month period. This result was consistent with the previous year’s results (88%). Respondents were asked whether they had: used the library; visited the Regional Museum; visited an historical site; been active in a community organisation; attended a performance at the Royal Wanganui Opera House; visited the Sarjeant Gallery; attended the theatre; attended a Maori cultural event / performance; and participated as a performer in any event or activity. (Source: Independent Community Views Survey)
Secondary indicators:
Community satisfaction with Council facilities
Community satisfaction with specific Council facilities was measured through the Community Views Survey. In 2010/11 64% of people were satisfied or very satisfied with Council facilities overall, however in 2011/12 this had increased to 67%. (Source: Independent Community Views Survey)

Wanganui District Council Annual Report for the year ended 30 June 2012
Page 96 of 170
Cultural facility patronage
Overall participation in our cultural facilities continued to increase – jumping from 483,759 to 504,405. Visitor counts are taken across Sarjeant Gallery, Whanganui Regional Museum, Royal Wanganui Opera House and the district libraries. (Source: Wanganui District Council)
Council actions that have contributed to ‘A community with well developed amenities and recreational opportunities’ Sarjeant Gallery development During 2011/12 the Council began applying for government
and philanthropic funding to enhance the existing gallery by providing better public and education facilities, appropriate storage, enhanced environmental controls and earthquake strengthening work. Wanganui’s Sarjeant Gallery, and its collection of art works, are nationally significant. This iconic Wanganui building has been assessed as earthquake prone at 5% of new building standard. There may be an opportunity to incorporate the solution for earthquake strengthening into the development project but the Council will make no decisions until the result of its funding application to the Ministry of Culture and Heritage is known and further uncertainties regarding central government requirements to earthquake strengthen buildings are understood. The cost of the development project is estimated at $32M and the project timeline will require a phased approach over a number of years. An application for up to $10M was lodged in May 2012 with the Ministry of Culture and Heritage’s Regional Museums Fund. A decision on the application is expected in September/October 2012.
Sarjeant Gallery education blog The Sarjeant Gallery added to its online presence during 2011/12 with the launch of a new education blog. The blog hosts creative ideas, images of students’ work and craft projects. It can be accessed here: http://sarjeant.org.nz/blog
Coffee at the Davis
Visitors to the Davis Central City Library can now enjoy great coffee as they select their latest read, browse the catalogue or take advantage of the free wi-fi and internet services provided. The new on-site coffee service was launched in March 2012.
National Parks Week Council celebrated the first ‘Hello Parks Week’ in March 2012 with a sausage sizzle at the Castlecliff Domain and a competition for a free family pass to the Splash Centre.
Top results for our parks Wanganui’s parks came out top in 2012 in an independent survey measuring public satisfaction with parks and reserves across participating councils in New Zealand. Of the 12 council areas surveyed Wanganui had the highest overall percentage satisfaction across all park categories with an average satisfaction level of 96.8%.

Wanganui District Council Annual Report for the year ended 30 June 2012
Page 97 of 170
Higginbottom Fountain back in action
The Higginbottom Fountain was returned to Virginia Lake in October 2011 following repairs and renovation. This work was undertaken by volunteers and assists the longevity of the fountain’s colourful light display.
Virginia Lake improvements Enhancements at Virginia Lake during 2011/12 included a repaint of the lathe house in the Winter Gardens, resurfacing of the steps and entrance to the Winter Gardens and work on the men’s and women’s toilets.
Parks and property general
General improvement work was undertaken in the parks and property area during 2011/12, for example:
• Replacement and repairs at the Bason Botanic Gardens conservatory.
• Development of the lake edge at Bason Botanic Gardens and installation of a new BBQ.
• Walkway repairs and slip clearing (including at Burnette Terrace, Alexa Place and Kowhai Park).
• Repainting of equipment and installation of new furniture and signage at Kowhai Park.
• Drainage improvements at Kowhai Park. • Planting of decorative street gardens in recognition
of the Rugby World Cup. • Repairs at the Wharf Street boat slipway. • Erection of a fence along the Taupo Quay walkway.
Picnic in the Park
The Youth Committee hosted its ever-popular annual Picnic in the Park for young people and their families at Kowhai Park on 3 December 2011. Attendees enjoyed entertainment such as face-painting, music, a bouncy castle, and sausage sizzle – with donations received for the Community Taskforce on Youth Wellbeing initiative, For Our Kids.
Kowhai Park skatebowl The Youth Committee worked with the parks team to investigate enhancements and redevelopment opportunities for the Kowhai Park skatebowl – with a view to hosting a New Zealand championship competition within the next three years.
Children’s Day Children’s Day was celebrated on 4 March 2012 with free, fun, family events in line with this year’s theme: ‘love and affection – treasure our children’. The Splash Centre joined the party with two free sessions for children and For Our Kids supported the city’s festivities with stalls and activities at both the Springvale and Castlecliff events. The Awa City Computer Clubhouse was on-site to film event-goers, participants and stallholders – creating a video project based on the day’s theme – and the Children’s Team from the Wanganui District Library (along with the Mobile Library Bus) spent the day reading stories and painting faces.
Mowhanau playground The playground at Mowhanau beach received a new lease on life during 2011/12. Although some of the playground favourites remained (the witch’s hat, pirate ship and flying fox) some new elements were also added and a marine theme introduced across the playground. The pirate ship also received a facelift – bringing with it new equipment including a slide and basket swing. In addition, swings and new safety matting was provided at

Wanganui District Council Annual Report for the year ended 30 June 2012
Page 98 of 170
Hutton Park and repositioning and replacement of play equipment was undertaken at Carlton Avenue Reserve.
Underground Youth Fashion Show
The sixth Underground Youth Fashion Show was staged in March 2012 – with a mini fashion show as a lead up to the main event as part of the Boardwalk Festival over Anniversary Weekend. The Youth Committee funded the capsule show and continued to act as a sponsor of the Underground event. The 2012 show saw 250 young people involved in event coordination, stage design, sound and lighting, modelling, fashion design and entertainment (including DJing, emceeing, singing and dance). The show attracted an audience of 1,200.
Mountain biking track The Council’s community projects team worked with the Wanganui Mountain Bike Club to help create tracks at a new mountain biking park at Harakeke Forest, Kaitoke. Although there was already a 12km mountain bike trail in the older part of the forest, no trails had been established in the newer areas and there was no convenient access to this part of the forest. Mayor Annette Main officially opened the Harakeke Forest Mountain Bike Park on 18 March 2012. The entrance to the park is off Pauri Road and the tracks are suitable for riders of all ages and experience.
Waitahinga Track In April 2012 Council supported the Wanganui Tramping Club’s proposal to establish a low grade tramping track within the Waitahinga Reserve. This track will provide walking opportunities for locals and visitors within a reasonable distance of the city and can be tramped in approximately three hours.
Pensioner housing review
A review of Council’s pensioner housing activity was progressed during 2011/12 – with the recommendation that Council look at relaxing its selection criteria to accommodate a greater pool of users and keep pace with changing times. A revised set of policies will be developed in line with this, and other recommendations, during 2012/13.
Indicators of a community with identity Primary indicators: Perceptions of Wanganui by residents
When asked about quality of life 90% of respondents to the Community Views Survey indicated that they believed this was ‘better’ or ‘about the same’ as last year. These results were consistent with the 2010/11 period. (Source: Independent Community Views Survey)
Perceptions of Wanganui by external people
The 2011 National Perceptions Survey revealed no improvement in Wanganui’s standing as a tourism destination. In 2009 33% of people considered Wanganui to be a tourism destination compared to 32% in 2011. This did not meet the longer term target of 50%. The survey will next be undertaken in the 2012/13 year. (Source: Independent National Perceptions Survey)

Wanganui District Council Annual Report for the year ended 30 June 2012
Page 99 of 170
Perception of Wanganui’s heritage value
Local perceptions of Wanganui’s heritage value were first measured in 2010/11 with 79% of respondents to the Community Outcomes Survey agreeing or strongly agreeing that Wanganui has a rich heritage and culture. This met the target of 75%. The survey will next be undertaken in 2012/13. (Source: Independent Community Outcomes Survey)
Secondary indicators:
Intention to remain in Wanganui
In 2012 70% of people had no intention to move out of Wanganui even if it was possible to do so – this compares to 67% in 2011. Of those who indicated that they would leave if the opportunity arose most (50%) claimed that better job opportunities would be the impetus to move. (Source: Independent Community Views Survey)
Council actions that have contributed to ‘A community with identity’ Marketing our district The district’s overarching brand ‘Whanganui’ was confirmed
in October 2011. Our marketing theme will be based around the Whanganui River in recognition of its centrality to our district. The key elements of the brand were further identified as our river, our culture, our heritage, our lifestyle and our people.
Architectural awards Two Wanganui District Council projects (the i-SITE Visitor Centre and the southern entranceway) were recognised in the 2011 Western Architecture Awards, with the Visitor Centre making its mark in the heritage category and the entranceway collecting for urban design and planning.
Rugby World Cup
Wanganui was selected to host the USA national rugby team for six days during their pre-tournament preparations for the Rugby World Cup. The team was welcomed with a powhiri at Putiki Marae on 4 September, followed by the official opening of the REAL Whanganui Festival. This festival was run in conjunction with the Rugby World Cup and showcased more than 70 events over seven weeks.
Lighting Strategy Council began work on a Lighting Strategy during 2011/12 in an effort to enhance our city’s features and the connections between them. This aligns with Council’s Public Art Strategy and builds on the lighting scheme in place at the Southern Entranceway. A lighting trial was undertaken during August 2011 to showcase the new lighting technology and techniques available, including activating multiple and moving colours and installing energy efficient LED streetlights. Provision for lighting in the central city was also included in the Shared Pathways Strategy.

Wanganui District Council Annual Report for the year ended 30 June 2012
Page 100 of 170
Public art
The ‘Mountains to the Sea’ sculpture (a finalist in the inaugural Sculpture Wanganui competition) was installed along the river following its purchase by a generous local benefactor (Mr. Jim Gordon). A special riverbank ceremony was held in November 2011 to formally recognise Mr. Gordon’s generosity and dedicate the sculpture to Mr. William Hikitangaarangi Smith and the work of the Maori wardens.
Jet Sprint World Series The wanganui.com UIM Jet Sprint World Series was held at Wanganui’s Shelter View track on February 18-19 2012 – the second of a two-round series. The series was also streamed live on the wanganui.com website.
Literary Festival The Wanganui Literary Festival was staged in September 2011 and showcased guest writers such as Elizabeth Knox, Joseph Romanos, Jenny Robin-Jones, Bill Manhire, Elizabeth Smither and Peter Wells. Events hosted during the 10-day festival included e-book self publishing, staged readings, a River Road trip to Jerusalem, a visual art exhibition and a children’s festival.
Glass Festival The most successful Wanganui Glass Festival to date was held in September 2011 – engaging at least 1,600 local, national and international participants. The festival included public events as well as workshop opportunities for glass artists.
Artists Open Studios
The 12th Annual Whanganui Artists Open Studios took place during March 2012 – providing a unique opportunity to visit artists in their own studios and watch their work in action. Twelve years of operation has seen the event grow into a major highlight of the Wanganui cultural calendar – seeing it attract visitors from across New Zealand. In 2012 70 artists and galleries participated (a significant increase on the previous year where 58 were involved).
Multicultural Forum
The Whanganui Multicultural Forum launched its new Facebook page in August 2011 with an event at the English Language Partners premises. The group has members from India, the Philippines, Holland, Korea, Sri Lanka, China, Japan, Samoa, Fiji, America, South Africa and England and is working closely with Council to support different cultural communities in our district. A ‘Taste of Cultures’ celebration was also hosted at Majestic Square on 12 November 2011. This showcased Wanganui’s international flavour through music, food and dance.
Puanga celebrations
Puanga was celebrated with a range of events including a dawn blessing and launch, an art exhibition, star gazing, whakapapa research sessions and Taonga Puoro workshop.

Wanganui District Council Annual Report for the year ended 30 June 2012
Page 101 of 170
Events The Council’s economic development team supported or
assisted a number of events during the 2011/12 year. These included Underground Fashion Show, Cemetery Circuit, Hoop Nation, World Jet Sprints, Vintage Car Club Rally, Mainstreet Caboodle, Wanganui Festival Weekend, Wanganui Festival of Glass, Artists’ Open Studios, Wanganui Glass School Summer Classes and Ohakea 75th Anniversary Air Show.
Pare installed
The pare designed for the entranceway to the Council Chambers was installed in August 2011. Its contemporary design reflects images of the Whanganui River, from the mountains to the sea, and features mountains and a waka across the lintel and river elements of rock and pumice. It was designed and commissioned from Whanganui artist Neil Ranginui as part of the refurbishment of the Council Chambers, which began in 2005.
Age Concern expo Council staff were on hand at the Age Concern Expo on 4 November 2011 promoting initiatives to support positive ageing in our district. This included provision of pensioner housing, the Gold Card Senior Parking scheme, Positive Ageing Forum, home bound library services and audio books.
Online cemetery records
Enhancements to cemetery data searches were made in 2011/12 with the linking of online results to a mapping system – allowing users to pinpoint the location of burial plots. This is the second phase of a project which began in 2009, when Council resolved to have all cemetery records digitised, in order to provide an easily-searchable resource for the public. This project is ongoing.
Archaeological study During 2011/12 local archaeologists continued to develop assessments on Wanganui’s archaeological features. This information will inform the District Plan, associated growth related strategies and development works.
‘Take a shot’ photography competition
The Youth Committee partnered with the Awa City Clubhouse, Mayors’ Taskforce for Jobs and Wanganui District Council to run a young photographers competition in celebration of Youth Week 2012. Entrants were encouraged to take a photo of something they were passionate about – in line with Youth Week’s theme ‘Love the Skin You’re In’. The winning image was taken by Emma Craig and earned her a digital camera and canvas print of her photograph.
Sports Hall of Fame The purpose of the Sports Hall of Fame is to recognise sporting achievements by athletes and coaches who have made a significant impact on Wanganui’s sporting heritage, with new inductees appointed each year. During 2011/12 the gallery of Sports Hall of Fame inductees found a permanent home in the atrium of the main grandstand at Cooks Gardens and Brian Silk was inducted for his contribution to golf. The next induction process is scheduled for November 2012 to coincide with the annual Wanganui Sports Awards.

Wanganui District Council Annual Report for the year ended 30 June 2012
Page 102 of 170
John Ballance statue The John Ballance statue was repaired following vandalism
and reinstated at its site in front of the municipal building at 101 Guyton Street in September 2011. John Ballance was Premier of New Zealand from 1891-93 and formed the country’s first Liberal government. He was previously the MP for Rangitikei and Wanganui.
Indicators of an environmentally sustainable community Primary indicators: Amount of waste recycled through the recycling centre
Although there was a slight decrease in the amount of waste recycled through the Peat Street recycling centre (with 21,301m³ of product received in 2011/12 compared to 21,396m³ in 2010/11) this is likely due to accuracy improvements in our calculation of glass weight. It appears that volume records for previous years may have been overstated. (Source: Wanganui District Council)
Drinking water quality
The target of 100% was achieved. The Council received confirmation of an Aa grading from the Ministry of Health following satisfaction of all testing and reporting requirements. This covers the Wanganui urban area. Ministry of Health grading is a measure of confidence that drinking water supplies will remain uncontaminated. (Source: Ministry of Health)
Secondary indicators:
Quality of water at Whanganui River swimming spots
During summer 2010/11 E. Coli levels in the Whanganui River (measured at the Town Bridge) met the national swimming spot guidelines 73% of the time. In summer 2011/12 this spot met the guidelines 54% of the time. It is likely that the apparent poorer water quality in 2011/12 was due to a wetter summer period. E. Coli bacteria are an indicator of public health-risk. Horizons Regional Council undertakes weekly testing at the Town Bridge site during the summer season (from 1 November until 30 April). Results that do not comply with the national standard mean that the river may be unsafe for swimming at the time the sample was taken. Horizons Regional Council provide the following advice on safe swimming:
• It is safest to wait three days after rain before swimming at river swimming spots.
• If the water looks clean and clear, and it is a sunny day, it should be OK to swim.
More information can be found on the Horizons Regional Council website: www.horizons.govt.nz (Source: Horizons Regional Council)

Wanganui District Council Annual Report for the year ended 30 June 2012
Page 103 of 170
Endangered wetlands
The number of high priority wetlands under active management by Horizons Regional Council remained at 11 between 2010/11 and 2011/12. These wetlands are considered to possess significant ecological benefit and active management is undertaken so that this benefit is retained and protected. ‘Active management’ means that the site is fenced and there is ongoing plant and animal pest control in place. (Source: Horizons Regional Council)
Quality of effluent from treatment plant
The quality of effluent discharge from the Wastewater Treatment Plant was measured across the 2011/12 year. The plant achieved 46% compliance with consent conditions which matched the previous year’s result. This measure tracks performance against consent condition number 10 which is about making sure discharges do not exceed set standards (for example in relation to grease, faecal coliforms and suspended solids). The consent is valid until 2026. There are 11 measurement parameters and Council complied with 8 of these at all times during 2011/12. Condition 10 is one of 22 consent conditions for the discharge of fully treated wastewater. As part of the consent conditions Council conducts tests on the quality of the water discharged throughout the year – these are independently assessed by environmental laboratory services. Horizons Regional Council then uses these results to determine whether resource consent conditions have been met. (Source: Wanganui District Council)
Water quality at South Beach and Castlecliff Beach
Water quality was tested throughout the 2011/12 year at both South Beach and Castlecliff Beach, with compliance achieved 100% of the time. This was an improvement on the previous year where 97% compliance was achieved. (Source: Wanganui District Council)
Council actions that have contributed to ‘An environmentally sustainable community’ Awarua Stream restoration The Council worked with the Awarua Stream Catchment
Committee on restoration efforts following receipt of funding from the Whanganui River Enhancement Trust. This funding will be used to study the stream and will support efforts to return it to its natural state.
Wastewater consents In October 2011 Council was granted 15-year consents to discharge treated wastewater and stormwater through the ocean outfall during high flow storm events and the discharge of treated wastewater through the outfall at other times.
Resource Recovery Centre Council's Waste Minimisation Working Party progressed the development of a resource recovery centre (a facility where the public can bring waste and recoverable materials for

Wanganui District Council Annual Report for the year ended 30 June 2012
Page 104 of 170
reuse and recycling) during 2011/12. This will provide the community with greater opportunities and services to minimise waste and will replace the existing Peat Street drop-off centre. The Resource Recovery Centre has the potential to offer used goods for resale as well as an environmental education centre. The centre is due to open in spring 2012.
Waste Minimisation Fund
The purpose of the Waste Minimisation Fund is to provide financial assistance (by way of grant, seeding finance or loan) for initiatives that further Wanganui’s waste minimisation goals. The fund is made available by the Council through the landfill levy money it receives from the New Zealand Waste Authority. During 2011/12 $10,500 was granted to the Zero Waste education programme, $5,000 to the Sustainable Schools programme, $2000 to ‘Paper for Trees’ and $3,300 towards a green waste composting trial.
Recycling Centre
The SaveMart recycling centre in Peat Street continued to enjoy popularity – processing 20,681m³ of product during 2011/12. The recycling centre is open 24/7 and 100% of recyclable material that passes through the centre is actually recycled.
River Week
Council participated in the third annual River Week with a tour of the wastewater treatment, the ‘Awesome Awa’ cleanup, bands on the river, a walk and cycle tour and a free BBQ at the river’s edge.
Natural burials Natural burial provision was progressed during the 2011/12 year in line with the Council’s Natural Burials Policy. The purpose of this policy is to provide an alternative way of laying people to rest, in an environmentally friendly way. As part of the implementation of this policy Council undertook surveying, prepared signage and set fees. It is anticipated that the Aramoho Cemetery will begin to offer natural burials during the 2012/13 year.
Shaping Wanganui
The District Plan review (known as “Shaping Wanganui”, and required every 10 years by the Resource Management Act) advanced according to schedule during 2011/12. The review process acknowledges that we must meet the challenges of a changing district and provides an opportunity for the whole community to re-assess environmental outcomes and expectations and to re-define its vision for the future. The following phases were progressed during the year:
• Phase 1 (Central City and the Riverfront) – this was completed and became an operative part of the District Plan on 25 May 2012.
• Phase 2 (covering the Restricted Services Residential Zone; Neighbourhood Commercial Zone; NZS4404 subdivision; natural hazards; reserves and open spaces; and the draft Springvale Structure Plan) – the draft plan change is complete with informal public consultation and community engagement underway. The proposed plan change

Wanganui District Council Annual Report for the year ended 30 June 2012
Page 105 of 170
is to be formally notified at the end of October 2012.
• Phase 3 (Heritage) – included oversight of the most comprehensive review of the district’s built heritage inventory (over 200 buildings) ever undertaken in Wanganui. The challenge of developing a strong policy framework to support and sustain the district’s built heritage, especially in the post Christchurch earthquake climate, is a key task for Council. Phase 3 is on target for notification at the same time as Phase 2.
• Phase 4 and Phase 5 (covering the Rural Zone; the Whanganui River Valley; Papakainga housing; archaeology; and trees) – this is now underway.
The entire District Plan review process will be completed in late 2014.
Community Outcomes and identified effects on community wellbeing A healthy community Groups that are primarily linked:
• Property and facilities group • Community and culture group • Strategy and development group • Infrastructure group • Customer services group
The Council continued to work collaboratively with its community partners to advance health outcomes for the district. These efforts remained driven by the Safer Wanganui Project – an extremely important example of positive community partnership in action. Active sport engagement was also successfully progressed through the Community Taskforce for Youth Wellbeing and Council worked hard to achieve ongoing improvements in relation to our water supply and wastewater network (seeing Wanganui achieve an ‘Aa’ grading from the Ministry of Health). In addition, health statistics revealed largely positive results when compared to DHB and Ministry of Health targets, Wanganui residents continued to sustain high participation rates in sport and recreation and outdoor pursuits on public conservation land remained a popular activity. Indicators and actions for ‘A healthy community’ demonstrate positive impact on the social wellbeing of the community. A safe community Groups that are primarily linked:
• Property and facilities group • Community and culture group • Strategy and development group • Infrastructure group • Customer services group
Community safety and the reduction of anti-social behaviour were significant priorities for the Council during 2011/12. This focus manifested itself in the drafting of a new gang bylaw, in graffiti management initiatives, in earthquake prone building assessments and notifications, in the roll-out of dog safety programmes and in the delivery of road safety improvements. Safety indicators generally reflected these efforts with perceptions of safety remaining high,

Wanganui District Council Annual Report for the year ended 30 June 2012
Page 106 of 170
serious road crashes well below target, a significant drop in the number of property fires and crime levels continuing to decrease. Indicators and actions for ‘A safe community’ denote that social wellbeing is continuing to be actively and successfully pursued. A prosperous community Groups that are primarily linked:
• Property and facilities group • Community and culture group • Strategy and development group • Infrastructure group • Corporate and governance group
Progress and prosperity were key drivers for the Council during 2011/12 in line with continued efforts to position Wanganui as a great place to live, visit and do business. As a result, the Council directed attention towards actions that would improve our economic standing – for example through adoption of an Economic Development Strategy, attraction of events and people to our district, development of economic initiatives in the rural area, pursuit of partnership initiatives and support for youth employment opportunities. Although economic indicators were a bit of a mixed bag, positive improvements were demonstrated in pastoral sector gross output and visitor numbers. Indicators and actions for ‘A prosperous community’ generally signify support for the community’s ongoing economic wellbeing. A well connected community Groups that are primarily linked:
• Property and facilities group • Community and culture group • Strategy and development group • Infrastructure group • Corporate and governance group
The Council continued to seek gains in connectivity both in terms of transport integration and communication networks throughout 2011/12. These gains were principally demonstrated in the pursuit of digital accessibility, the receipt of a prestigious planning award (for work on the Urban Transportation Strategy) and progression of the tram project in line with the Riverfront Development Plan. Indicators reflected slightly less success with limited gains; however, increased satisfaction with our public transport network was particularly noted. Indicators and actions for ‘A well connected community’ generally reflect positive impact on the social and economic wellbeing of the community. A community where people work together Groups that are primarily linked:
• Community and culture group • Strategy and development group • Corporate and governance group
The social fabric of the community continued to be supported and the significance of diverse voices recognised. This was achieved through the provision of a number of ‘community participation’ platforms, including the Youth Committee (which was officially named the best in the country!), Positive Ageing Forum and Iwi working parties and via the provision of social support functions. In 2011/12 this included the development of a ‘welcome pack’, the forging of stronger links with our district’s other young leaders, the hosting of conversations with the community and the hosting of a Youth Connect forum. Although the public’s rating of the

Wanganui District Council Annual Report for the year ended 30 June 2012
Page 107 of 170
performance of the Mayor and Councillors was slightly down, there was also a substantial increase in the number of people engaging with Council through the annual planning process. Indicators and actions for ‘A community where people work together’ reveal a sustained open and healthy political environment. This is marked by community development and governance efforts that champion inter-sector collaboration and widespread public engagement. This work continues to contribute to the enhancement of social wellbeing. A community with quality education Groups that are primarily linked:
• Community and culture group • Strategy and development group
The Council partnered with key stakeholders to ensure the retention of existing education opportunities and also supported new initiatives to plug the gaps, and meet the needs of our community. The delivery of quality education was principally secured and progressed through the Wanganui Glass School and Industry Training School, with promotion of life-long learning opportunities also highlighted through involvement in Adult Learners’ Week. Positive gains were similarly reflected in indicator activity with large (and sustained) increases in early childhood enrolments and improvements in NCEA attainment. However, UCOL and Gateway course enrolments were down. Indicators and actions for ‘A community with quality education’ reveal positive contributions to the social and economic wellbeing of the community. A community with well developed amenities and recreational opportunities Groups that are primarily linked:
• Property and facilities group • Community and culture group • Infrastructure group
A wide variety of amenities and recreational opportunities were developed and enhanced during 2011/12. These continued to position Wanganui as a great place to live and visit and included the staging of events and activities for (and by) young people, progression of a redevelopment proposal for the Sarjeant Gallery, introduction of coffee at the Davis Library and maintenance and improvement work at our premier parks. Indicators revealed similarly positive results across the board with more people satisfied with Council facilities, more people participating in sport and recreational activities and more people engaging in our district’s arts and cultural offerings. Indicators and actions for ‘A community with well developed amenities and recreational opportunities’ reveal that positive impact on the community’s social and cultural wellbeing continues to be made. A community with identity Groups that are primarily linked:
• Property and facilities group • Community and culture group • Strategy and development group • Infrastructure group • Corporate and governance group
Our unique image and identity continued to be fostered and promoted as part of efforts to relaunch Wanganui on the national stage – and position Wanganui as an exciting and vibrant place to live, visit and do business. As a result, our district’s marketing brand was confirmed, our identity was proclaimed (through events such as the Literary Festival, Glass Festival, Puanga/Matariki celebrations and Artists Open Studios) and our environment enhanced

Wanganui District Council Annual Report for the year ended 30 June 2012
Page 108 of 170
through more public sculpture and the investigation of a lighting programme. Indicators were generally positive, with people more optimistic about quality of life and a greater proportion of people committed to remaining in Wanganui. Indicators and actions for ‘A community with identity’ reveal that cultural and social wellbeing is continuing to be supported. An environmentally sustainable community Groups that are primarily linked:
• Property and facilities group • Community and culture group • Strategy and development group • Infrastructure group • Customer services group
Sustainable and efficient use of the district’s resources remained a priority during 2011/12. This was demonstrated in a variety of ways and at a various levels – including through the pursuit of restoration efforts at Awarua Stream, investigation of enhanced waste minimisation opportunities and progression of the district-wide Shaping Wanganui project. In terms of measured indicators, Horizons took active management of more high value wetlands, Council received confirmation of an Aa grading for its water supply and water quality at our beaches achieved 100% compliance. Indicators and actions for ‘An environmentally sustainable community’ denote positive effects on the environmental wellbeing of the community.

Wanganui District Council Annual Report for the year ended 30 June 2012
Page 109 of 170
Property and facilitiesFor the year ended 30 June 2012
Budget Council2012 2012 2011$000 $000 $000
IncomeUser fees and other revenue 3,040 3,783 3,025Subsidies 173 142 143Total income 3,213 3,925 3,168
Operating expenditureOperating expenditure 8,564 8,955 8,449Finance costs 937 766 836Council overhead 1,692 1,769 1,765Total operating expenditure 11,193 11,490 11,050
Operational rates requirement 7,980 7,565 7,882
Capital acquisitions 755 412 1,154Capital replacements 646 424 1,017Total capital expenditure 1,401 836 2,171
Total funding requirement 9,381 8,401 10,053
Transfers (to)/from special funds 207 189 676New loans/(loans repaid) 321 (207) 825Total capital funding 528 (18) 1,501
Rate requirement 8,853 8,419 8,552
Total operating expenditure within each Activity Group may vary due to timing of workprogrammes, however there were no changes to the level of service.

Wanganui District Council Annual Report for the year ended 30 June 2012
Page 110 of 170
Property and Facilities group significant acquisitions or replacements of assets The following table shows the significant expenditure on capital acquisitions and replacements for the Property and Facilities Group. Significant variations to the Annual Plan are discussed below if necessary. Activity Item Budget $ Actual $ Cemeteries Cemetery plans and rose beds 25,000 7,552 Pipe work 0 6,588 Road sealing 30,000 21,164 Fencing 15,000 17,092
Parks and reserves Virginia Lake restoration, toilets, Winter Gardens, sundry buildings etc 57,000 68,524
Gateways project land purchase 0 128,568 Playground equipment, furniture, fences etc 108,000 115,266 Bason Botanic Gardens 0 238,053 Bason barbeque and roading work 10,000 24,373 Kowhai Park 20,000 16,244 Disposal of Braves Building 0 (65,000) Sundry projects 45,000 8,338 Pensioner housing Building improvements 45,000 26,331 Property Information Centre 96,000 9,585 125 Guyton Street 39,000 0 Mowhanau Camp 44,000 0 Council Building 108,000 107,366 Swimming Pools HVAC modifications 552,000 0 Pool covers 86,000 54,418 Main switchboard 40,000 17,352 Sundry projects 30,250 39,854 Cooks Gardens Road sealing 20,000 0 Sundry projects 31,500 18,871 Total 1,401,750 860,539 Work was planned to maintain the service capacity of the Council facilities and to deal with the expected demands on the service. Cemeteries A lower amount than budgeted was spent on Cemetery plans and rose beds. A 2011 carry over of $11,000 was sufficient to cover Water pipe replacement work. Road sealing and fencing planned work was completed for the year. Parks and reserves Capital replacement and acquisition work in the Annual Plan totalled $240,000. This, together with 2011 carry overs of $160,000, gave a total programme budget for the year of $400,000. Actual expenditure for the year was $534,365. The main reason for the variance was developmental work carried out at the Bason Reserve totalling $238,053 (funded from the Alexander Bequest). This expenditure was partially offset by minor project savings of $36,662 in such areas as Hipango Park, Glen Logie rose garden and Kaitoke Road (not carried over), and also the disposal of the Braves building.

Wanganui District Council Annual Report for the year ended 30 June 2012
Page 111 of 170
Pensioner housing The positive variance to budget can be partly explained with some replacement expenditure being reclassified from capital expenditure to operational expenditure as planned maintenance. Property Budgeted costs of $96,000 for alterations at the Information Centre building, funded from the City Endowment special fund, have been delayed. Both 125 Guyton Street and Mowhanau Camp are to be carried over, at the reduced amounts of $12,000 and $25,000 respectively. Work on the Council building has been completed to budget. Swimming Pools The HVAC modifications project has been delayed and carried over to 2012/13. This project includes a heat pump upgrade that will facilitate energy cost savings. Pool covers and the main switchboard work have been completed well below budget. Other sundry projects, such as guttering replacement and pump work, were completed with a small variance over budget. Cooks Gardens Anticipated road sealing work has now been cancelled and will not go ahead. Sundry projects expenditure have been completed under budget, although this can be partly explained by carpet replacement, originally listed under this category, being transferred to operating expenditure as planned maintenance.

Wanganui District Council Annual Report for the year ended 30 June 2012
Page 112 of 170
Activity scorecards These scorecards track the Council’s performance against its measures and targets. In each instance (at both the activity level and group level) an overall target of 90% is set. This is considered to be a fair and reasonable level of attainment, recognising that success will not only be demonstrated at the 100% mark and that there is often more to the story. A variance of 10% is also applied so that the system is flexible enough to tell this story. This means that an indicator or Outcome might attain an amber traffic light where the result is close to being achieved and therefore a rigid ‘pass’ or ‘fail’ is not appropriate. STATEMENT OF SERVICE PERFORMANCE – PROPERTY AND FACILITIES GROUP Scorecard Name: Date From Date To CEMETERIES 01-Jul-2011 30-Jun-2012 Linked items Unit Target Actual Indicator Prior
year Percentage compliance with discharge to air conditions in resource consent (Cemeteries).
% 100 100 100
Comment: The target of 100% was achieved. Discharge to air resource consent conditions were complied with.
Percentage compliance with Office of Veterans Affairs inspections of the RSA burial area.
% 100 100 100
Comment: The target of 100% was achieved. Inspections complied with the Office of Veterans Affairs conditions.
The number of burial plots available within the district at any one time.
# >200 416 519.50
Comment: The target of greater than, or equal to, 200 was achieved. The actual result was an average of 416 burial plots available in the district during 2011/12. In addition, there were more plots potentially available at the rural cemeteries. These figures are based on all available land left in the cemetery for the purposes of burial plots according to the proposed layout.
The number of cremation plots available within the district at any one time.
# >500 1839 1907
Comment: The target of greater than, or equal to, 500 was achieved. The actual result was an average of 1,839 cremation plots available in the district during 2011/12. The figures are based on all available land left in the cemetery for the purposes of ash plots according to the proposed layout.
The percentage of permits issued before monuments are erected.
% 99 99 100
Comment: The target of greater than, or equal to, 99% was achieved. While there was one headstone erected that did not meet our specifications, Council officers are working with this customer to ensure compliance.
Percentage compliance with the requirements of the Burial and Cremation Act 1964.
% 100 100 100
Comment: The target of 100% was achieved with the Burial and Cremation Act complied with.
The percentage of the community who are fairly or very satisfied with the services and facilities provided (Cemeteries).
% 55 75 72

Wanganui District Council Annual Report for the year ended 30 June 2012
Page 113 of 170
Comment: The target of 55% was exceeded. The actual result was 75% of the community were satisfied or very satisfied with the cemetery services and facilities provided. This was a slight increase on the previous year where 72% was achieved.
Scorecard Name: Date From Date To CENTRAL BUSINESS DISTRICT MAINTENANCE 01-Jul-2011 30-Jun-2012 Linked items Unit Target Actual Indicator Prior
year The number of faults involving more than a single light fitting is less than the targeted number per annum (Central Business District maintenance).
# <12 0 0
Comment: The target of less than 12 was achieved. There were no faults involving more than a single light fitting during 2011/12.
The percentage of time that public toilets are available during opening hours (Central Business District maintenance).
% >95 100 100
Comment: The target of greater than, or equal to, 95% was achieved. The actual result was 100% availability.
The number of complaints to Council about cleanliness and hygiene will be less than the targeted number per annum (Central Business District maintenance).
# <12 0 0
Comment: The target of less than 12 was achieved. There were no complaints about cleanliness or hygiene made to Council during 2011/12.
The number of footpath related accidents in the CBD reported to Council is less than the targeted number per annum.
# <6 0 0
Comment: The target of less than six was achieved. There were no footpath related accidents in the CBD reported to Council.
The number of repairs to public or private assets caused by tree and vegetation related damage is less than the targeted number per annum.
# <5 3 0
Comment: The target of less than five was achieved. There were three repairs to public or private assets as a result of tree or vegetation damage following the March storm. This was an increase on the previous year where there were no repairs required.
The percentage of residents who are fairly or very satisfied with the contribution the CBD makes to their lifestyle and the image of Wanganui.
% 75 76 73
Comment: The target of 75% was exceeded. The actual result was 76% of residents were fairly or very satisfied with the contribution the CBD makes to their lifestyle and the image of Wanganui. This was an improvement on the previous year where 73% was achieved.

Wanganui District Council Annual Report for the year ended 30 June 2012
Page 114 of 170
Scorecard Name: Date From Date To COMMUNITY BUILDINGS & RURAL HALLS 01-Jul-2011 30-Jun-2012 Linked items Unit Target Actual Indicator Prior
year The percentage of time the Ward Observatory is open during its agreed opening hours.
% 100 100 100
Comment: The target of 100% was achieved. The Ward Observatory was open 100% of the time during its agreed opening hours. The Ward Observatory is open every Friday night when the sky is clear and by arrangement with the Wanganui Astronomical Society.
The percentage of time the Ladies Rest toilets are available for use during the agreed opening hours.
% >95 100 100
Comment: The target of greater than, or equal to, 95% was achieved. The Ladies Rest toilets were available 100% of the time during the agreed opening hours. The Ladies Rest toilets are open 24 hours a day, seven days a week – some cubicles are closed at night after cleaning.
The percentage of rural halls with a management committee.
% 100 100 100
Comment: The target of 100% was achieved and all relevant rural halls had a management committee. Upokongaro Hall is no longer considered a rural hall and, as such, has no management committee.
Scorecard Name: Date From Date To PARKS AND RESERVES 01-Jul-2011 30-Jun-2012 Linked items Unit Target Actual Indicator Prior
year The percentage of sporting code licence holders who have, and use, a Health and Safety Plan.
% 100 90 100
Comment: The target of 100% was not achieved. The actual result was 90% of sporting code licence holders held and used a Health and Safety Plan during 2011/12 – this reflects the difficulties some codes have in resourcing the administration of their sports. Council officers are working with and assisting the two licence holders who did not supply a plan for the winter season. The number of sporting code licence holders varies depending on who uses the fields for sports – last year there were 11 winter licence holders and 4 summer licence holders.
The percentage of time that the Coast Guard can launch when needed from the Wharf St. ramp (or the secondary Putiki Slipway), 24 hours a day, seven days a week.
% 100 100 100
Comment: The target of 100% was achieved. The Coast Guard was able to launch when needed.
Elevator maintenance, safety, emergency and management systems will pass the requirements of the annual Certificate of Inspection.
% 100 100 100
Comment: The target of 100% was achieved. Annual certification was awarded.

Wanganui District Council Annual Report for the year ended 30 June 2012
Page 115 of 170
The number of safety checks carried out on playground equipment per year.
# 12 12 12
Comment: The target of 12 was achieved. All scheduled safety checks were carried out on playground equipment. These were carried out on a monthly basis and covered 16 playgrounds. Kowhai Park and Virginia Lake are also checked weekly by the maintenance contractor. In addition, mowing contractors and the public alert Council to issues noticed in other areas between inspections.
The number of safety inspections of all walkways within the parks network per year.
# 4 4 4
Comment: The target of four was achieved. All scheduled walkway safety inspections were carried out. These were carried out on a quarterly basis and covered 14 walkways.
The percentage of maintenance inspections per year that are rated 'good' (Parks and reserves).
% 75 95.50 95.25
Comment: The target of 75% was exceeded. The actual result was 95.50% of maintenance inspections were rated ‘good’. This also represented a slight increase on the previous year where 95.25% was achieved. Contractors are rated monthly based on performance scores which are part of the contract specification. Contractors are aiming to get 600 points (‘good’) or more each month.
The percentage of sports-ground licence holders who are fairly or very satisfied with ground conditions.
% 80 100 100
Comment: The target of 80% was exceeded. The actual result was 100% of sports-ground licence holders were fairly or very satisfied with ground conditions. This matched last year’s result.
The percentage of the community fairly or very satisfied with the Durie Hill elevator.
% 60 52 46
Comment: The target of 60% was not achieved. The actual result was 52% of the community were fairly or very satisfied with the Durie Hill elevator. However, this did represent an improvement on the previous year where 46% was achieved.
The percentage of the community that is fairly or very satisfied with our parks and reserves.
% >80 87 87
Comment: The target of greater than, or equal to, 80% was exceeded. The actual result was 87% of the community were fairly or very satisfied with our parks and reserves. This matched the previous year’s result.
The percentage of the public who are fairly or very satisfied with the provision of public toilets (Parks and reserves).
% 28 48 37
Comment: The target of 28% was exceeded. The actual result was 48% of the community were fairly or very satisfied with the provision of public toilets. This was an 11% increase on the previous year.
The percentage of the time the elevator service is available to the public during operating hours.
% >99 100 100
Comment: The target of greater than, or equal to, 99% was achieved. The Durie Hill elevator remained available at all times during its operating hours. The Durie Hill elevator is open 52 weeks of the year from 7.30am to 6.00pm on weekdays, from

Wanganui District Council Annual Report for the year ended 30 June 2012
Page 116 of 170
9.00am to 6.00pm on Saturdays and from 10.00am to 5.00pm on Sundays.
The percentage of time that parks and open spaces are available for use (365 days per year).
% >98 94 98.75
Comment: The target of greater than, or equal to, 98% was not achieved. Parks and open spaces were available 94% of the time during 2011/12. This was as a result of damage caused by the March storm. Closures ensured public safety and allowed contractors to have unhindered access.
The percentage of time that sportsgrounds are available for use (365 days per year).
% 98 96 98.50
Comment: The target of 98% was not achieved. Sportsgrounds were available 96% of the time during 2011/12. This was a decrease on the previous year where 98.50% was achieved. Closures were mostly necessitated in the first quarter, for example following adverse weather. Cooks Gardens was also closed for a period to effect repairs to the lighting tower and then for the USA Eagles visit prior to the Rugby World Cup.
Scorecard Name: Date From Date To PENSIONER HOUSING 01-Jul-2011 30-Jun-2012 Linked items Unit Target Actual Indicator Prior
year Pensioner housing will be self funding, apart from asset replacements.
% 100 100 100
Comment: The target of 100% was achieved. Pensioner housing was self funding, apart from asset replacements. During 2011/12 a small surplus of $2K was achieved which was applied to debt repayment. In addition, $26K worth of capital replacement and $161K of planned maintenance was undertaken during the year.
The percentage of tenants who rate their level of satisfaction with pensioner housing as good or very good.
% 90 90.60 90.60
Comment: The target of 90% was achieved. The actual result was 90.60% of tenants rated their level of satisfaction with pensioner housing as ‘good’ or ‘very good’. This survey is delivered every three years. These results are from 2010/11.
Percentage occupancy rate for the pensioner housing portfolio.
% >95 88 90.75
Comment: The target of greater than 95% was not achieved. The actual result was 88% occupancy, a slight decrease on the previous year. A review of Council’s pensioner housing activity was progressed during 2011/12 – with the recommendation that Council look at relaxing its selection criteria to accommodate a greater pool of users and keep pace with changing times. A revised set of policies will be developed in line with this, and other recommendations, during 2012/13.
Scorecard Name: Date From Date To PROPERTY 01-Jul-2011 30-Jun-2012 Linked items Unit Target Actual Indicator Prior
year Percentage of Council owned buildings with a current Building Warrant of Fitness.
% 100 100 100
Comment: The target of 100% was achieved. All Council owned buildings had a current Building Warrant of Fitness.

Wanganui District Council Annual Report for the year ended 30 June 2012
Page 117 of 170
Percentage occupancy of investment properties.
% >90 97 97.20
Comment: The target of greater than 90% was achieved. The actual result was 97% occupancy of investment properties during 2011/12. This matched the previous year’s result.
Percentage of capital returns to Council from the sale of surplus properties that match forecast targets in timeframe terms.
% 95 100 0
Comment: The target of 95% was exceeded; the actual result was 100% of sales matched the forecast targets in timeframe terms. This was an improvement on the previous year where no sales matched the timeframe targets.
The percentage of Council activity managers who are fairly or very satisfied with the work carried out by Property Services.
% 95 95 79
Comment: The target of 95% was achieved – overall 95% of Council activity managers were fairly or very satisfied with the work carried out by Property services. This was an improvement on the previous year where 79% was achieved. This measure was canvassed via an internal survey.
Percentage of capital returns to Council from the sale of surplus properties that match forecast targets in dollar terms.
% 95 195 85
Comment: The target of 95% was exceeded; the actual result was 195% of sales matched or exceeded the forecast targets in dollar terms. This was because better than expected prices were received for two of the three properties sold this year, bringing the total return to $267,200. In 2010/11 eight properties were sold for a total of $1,035,553. Percentage of forecast net income for the City Endowment portfolio that is delivered.
% 98 90.50 94
Comment: The target of 98% was not achieved. The actual result was 90.50% of forecast net income delivered – a decrease of 3.5% on the previous year. Failure to attain the target reflects the continued vacancy of the office space at 31 Taupo Quay and liquidation of Zinc Café – however, this was offset by re-letting of the Visitor Centre Café and lower operating costs across the portfolio.
Percentage of forecast net income for the Community and Operational Property portfolio that is delivered.
% 98 94.40 93
Comment: The target of 98% was not achieved. The actual result was 94.40% of forecast net income delivered for the Community and Operational Property portfolio – an increase of 1.4% on the previous year.
Percentage of forecast net income for the Harbour Endowment portfolio that is delivered.
% 98 96.48 113
Comment: The target of 98% was not achieved. The actual result was 96.48% of forecast income delivered (113% in 2010/11).

Wanganui District Council Annual Report for the year ended 30 June 2012
Page 118 of 170
Scorecard Name: Date From Date To SWIMMING POOLS 01-Jul-2011 30-Jun-2012 Linked items Unit Target Actual Indicator Prior
year Percentage compliance with New Zealand Swimming Pool Water Quality Standards (NZS 5826:2000).
% 100 98 100
Comment: The target of 100% was not achieved. The actual result was an average of 98% compliance across the 2011/12 year. Pool water is independently tested every month and one sample from the fourth quarter returned a higher than threshold count for heterotrophic bacteria (HPC). This was not at a health threatening level and appropriate action was taken to correct the problem. Results like this can happen for a number of reasons. For example, sudden or increased bather loads coinciding with back-washing of filters and chlorine levels can have an impact on readings. Both the Splash Centre and the Wanganui East Pool are tested for compliance with Water Quality Standards, however, this KPI relates to the Splash Centre’s performance.
The number of pool users at Wanganui East Pool will be maintained at >22,000.
# >22000 10654 15447
Comment: The target of greater than, or equal to, 22,000 was not achieved. The actual result was 10,654 pool users at Wanganui East over the season. This was a decrease of 4,793 on the previous year and was attributed to very poor summer weather. The Wanganui East pool is generally open for a minimum of 16 weeks during the summer months (December through March), however, in 2011/12 the pool closed one week early.
The percentage of time that all pools meet the target temperatures agreed with the operators.
% 98 100 98.40
Comment: The target of 98% was exceeded. The actual result was 100% compliance with target temperatures. This measure only applies to the Splash Centre.
The percentage of time that the Splash Centre is open during opening hours.
% 98 99.85 100
Comment: The target of 98% was exceeded. In 2011/12 the Splash Centre was open 99.85% of the time during its opening hours. There was one unplanned closure in the third quarter as the result of a chlorine gas system false alarm.
The percentage of time that the Wanganui East Pool is open during its specified season.
% >95 94 99
Comment: The target of greater than, or equal to, 95% was not achieved. The actual result was 94% availability. Very poor summer weather greatly affected user numbers during the 2011/12 season which, in turn, affected the financial viability of the pool. As a result it closed one week early. The Wanganui East pool is generally open for a minimum of 16 weeks during the summer months (December through March).
Number of Splash Centre pool users. # 180000 214984 220010
Comment: The target of 180,000 was exceeded. The actual result was 214,984 users – indicating strong support for the facility and the programmes it offers. Although this was a decrease on the previous year, the facility continues to perform ahead of its user target set as part of the extension project.

Wanganui District Council Annual Report for the year ended 30 June 2012
Page 119 of 170
The percentage of the community who are fairly or very satisfied with the swimming pool facilities.
% 80 68 61
Comment: The target of 80% was not achieved. The actual result was 68% of the community were fairly or very satisfied with the swimming pool facilities. This represented a 7% increase on the previous year. Future surveys will be undertaken onsite to better target users of both the Wanganui East Pool and Splash Centre complex and to gain greater feedback on areas for improvement.

Wanganui District Council Annual Report for the year ended 30 June 2012
Page 120 of 170
Community and CultureFor the year ended 30 June 2012
Budget Council2012 2012 2011$000 $000 $000
IncomeUser fees and other revenue 1,063 1,237 906Subsidies 15 10 10Total income 1,078 1,247 916
Operating expenditureOperating expenditure 5,271 5,680 5,204Finance costs 216 166 139Council overhead 1,041 1,089 1,044Total operating expenditure 6,528 6,935 6,387
Operational rates requirement 5,450 5,688 5,471
Capital acquisitions 790 324 301Capital replacements 595 541 499Total capital expenditure 1,385 865 800
Total funding requirement 6,835 6,553 6,271
Transfers (to)/from special funds 20 112 363New loans/(loans repaid) 788 300 182Total capital funding 808 412 545
Rate requirement 6,027 6,141 5,726
Total operating expenditure within each Activity Group may vary due to timing of workprogrammes, however there were no changes to the level of service.

Wanganui District Council Annual Report for the year ended 30 June 2012
Page 121 of 170
Community and Culture group significant acquisitions or replacements of assets The following table shows the significant expenditure on capital acquisitions and replacements for the Community and Culture Group. Significant variations to the Annual Plan are discussed below if necessary. Activity Item Budget $ Actual $ Community development Sculpture project 0 85,694 Plant and equipment 12,000 2,998 Library Book Vote 320,000 320,000 Computer equipment 190,000 187,728 Office equipment and furniture 40,000 27,279 War Memorial Hall Windows refurbishment, cladding etc 95,000 202,192 Heating 42,000 0 Opera House Seating replacement programme 150,000 0 Sarjeant Gallery Environmental control 500,000 0 Art work additions 20,000 39,453 Intangible asset additions 16,000 0 Total 1,385,000 865,344 Work was planned to maintain the service capacity of the Council facilities and to deal with the expected demands on the service. Community development The Sculpture project cost of $85,694 was mainly funded from special funds $33,821 (2010/11 unspent funds set aside) and external donations of $39,120. The Plant and equipment budget of $12,000 was for CCTV. Only $2,998 was spent on this during 2012. The remaining balance will not be carried over to 2012/13. Library Council budgets a rolling programme for the replacement of library books. The 2012 budget for this book replacement was $320,000. Council uses these funds to keep the Library collection up to date and relevant. Expenditure for office and computer equipment, furniture and fittings, were under budget due mainly to an under spend on the Mobile Library refurbishment. War Memorial Hall The 2012 budget of $137,000 was increased by 2011 carry overs of $205,000, resulting in a total available budget of $342,000. Actual expenditure for the year was $202,192. However, due to issues such as availability of joiners, there will be a further carry over of $147,000 for 2012/13. Opera House The seating replacement programme has been deferred to 2013-2014. These budgeted funds will be carried over. Sarjeant Gallery The environmental control budget of $500,000 has been carried forward to 2012/13. This is pending earthquake assessments and the Gallery extension funding project. Art works purchased during the year of $39,453 was funded from special funds. The budget of $16,000 for intangible asset additions was not required this year, with the cost already being incurred in the 2011 financial year.

Wanganui District Council Annual Report for the year ended 30 June 2012
Page 122 of 170
Please see the activity scorecard information on page 112 of the Annual Report for further information. STATEMENT OF SERVICE PERFORMANCE – COMMUNITY AND CULTURE GROUP Scorecard Name: Date From Date To COMMUNITY DEVELOPMENT 01-Jul-2011 30-Jun-2012 Linked items Unit Target Actual Indicator Prior
year Annual satisfaction survey with the representatives of the Tupoho and TamaUpoko Runanga, measuring quality of working relationship with staff.
% 75 100 80
Comment: The target of 75% was exceeded. The actual result was 100% satisfaction – an improvement on the previous year where 80% was achieved. This measure was canvassed via an annual Council-delivered customer survey.
Number of Youth Councillors. # 18 18 18
Comment: The target of 18 was achieved. There were 18 Youth Councillors serving on the Youth Committee throughout 2011/12.
The number of youth events. # 12 11 20
Comment: The target of 12 was not met. The actual result was 11 youth events held during 2011/12. These events included the Christchurch earthquake memorial event, Picnic in the Park and Youth Forum.
The number of Youth Committee meetings
# 7 7 7
Comment: The target of seven was achieved. There were seven formal Youth Committee meetings held during 2011/12.
Percentage of uptake and reporting on Community Contract funding by community partners (to support delivery of capacity building programmes).
% 100 80 95
Comment: The target of 100% was not achieved. The actual result was 80% uptake and reporting. This was a decrease on the previous year where 95% was achieved. All Community Contract recipients received their funding but only 24 of the 30 successful candidates submitted funding reports on time. Two of the six that failed to meet the deadline were given an extension and the other four will provide reports during the 2012/13 year.
Number of family graduations from the Computers in Homes programme.
# 50 223 103
Comment: The target of 50 graduations was exceeded. The actual result was 223 family graduations from the Computers in Homes programme. This was an increase on the previous year where 103 graduations were made. The target of 50 graduations was set in 2009 before we knew the outcome of our application for funding from central government. The numbers we achieve are in line with the deliverables under the current contract (funded by the Department of Internal Affairs via the 2020 Communication Trust). However, as in previous years we continue to run ahead of schedule and will over-deliver against this contract.

Wanganui District Council Annual Report for the year ended 30 June 2012
Page 123 of 170
Number of formal forums held with Nga Rauru and Ngati Apa.
# 3 3 0
Comment: The target of three was achieved. Two meetings were held with Nga Rauru and one with Ngati Apa during 2011/12.
Number of Fundview and Breakout Database licences available for community use.
# 5 5 5
Comment: The target of five was achieved. Fundview and Breakout database licences were available for community use. These searchable databases were provided at the District Library and Community House and enabled the public to access current information on funding sources, criteria and availability. Fundview contains over 600 different funding schemes for voluntary organisations while Breakout offers over 2,200 funding schemes for students, researchers, sports people and artists.
Number of iconic events (Puanga/Matariki, Wanganui Artists Open Studios, Literary Festival - biennial) held per year (Community development).
# 3 5 4
Comment: The target of three was exceeded. The actual result was five iconic events staged during 2011/12. These included Wanganui Artists Open Studios and Puanga / Matariki.
Number of meetings held per annum (Community development - Safer Wanganui).
# 6 8 8
Comment: The target of six was exceeded. The actual result was eight meetings held during 2011/12.
Percentage of households with access to the internet.
% 52 53 53
Comment: The target of 52% was exceeded. The actual projected result from Statistics NZ was 53% of households with access to the internet. Access to the internet is an important measure of social connectedness – providing the means to stay in touch as well as to obtain necessary information. This figure will be confirmed following the next Census in March 2013.
The number of Aotearoa People's Network user sessions (Community development).
# 47000 95266 87828
Comment: The target of 47,000 was exceeded. The actual result was 95,266 user sessions. User numbers were consistent throughout the year and gains were attributable to a shortening of the session time per day (from one hour to 30 minutes) which allowed more customers to log on. In addition, there continued to be strong growth in the number of wifi sessions.
The number of Computer Clubhouse member sessions per annum (Community development).
# 4500 2996 2108
Comment: The target of 4,500 was not achieved. The actual result was 2,996 member sessions. The Computer Clubhouse has one of Wanganui’s largest youth memberships and the number of sessions is increasing. While the Clubhouse continues to implement different marketing strategies to increase membership overall, this target was based on a two by two-hour session model used by the International Computer Clubhouse Network and Wanganui’s Clubhouse is not operating in this way. This means that members sign in only once but may stay for up to four hours. This target has been reviewed for the future to better align with the programme offered in Wanganui and the Clubhouse has also developed a new system within its sign-in software to record sessions more accurately.

Wanganui District Council Annual Report for the year ended 30 June 2012
Page 124 of 170
Number of initiatives funded and implemented per annum (Community development - Safer Wanganui).
# 5 11 7
Comment: The target of five was exceeded. The actual result was eleven initiatives funded and implemented – surpassing last year’s result of seven. Initiatives included family violence training, safe driver workshops and the safe homes and streets programme.
Percentage of key milestones met for government-funded partnerships/projects (Community development).
% 98 100 100
Comment: The target of 98% was exceeded. The actual result was 100% achievement of all key milestones for government-funded partnerships and projects. Examples of government-funded partnerships and projects include:
• Department of Internal Affairs via 2020 Communication Trust – Computers in Homes • 2020 Communication Trust – Stepping Up • Department of Internal Affairs – Computer Clubhouse • Te Puni Kokiri – For Our Kids
Regularity of meetings with Ministries of Social Development, Youth Development, Education, Culture and Heritage, Justice; Department of Internal Affairs; Creative New Zealand; and Whanganui Police.
# 16 31 9
Comment: The target of 16 was exceeded. The actual result was 31 meetings. These regular meetings include collaborative forums such as Safer Whanganui, Strengthening Families and the Taskforce for Youth Wellbeing.
Scorecard Name: Date From Date To LIBRARY 01-Jul-2011 30-Jun-2012 Linked items Unit Target Actual Indicator Prior
year Percentage of opening hours staff are available to assist with access (Library).
% 100 100 100
Comment: The target of 100% was achieved. Staff were available to assist with access 100% of opening hours.
Percentage of the time Library sites (Davis, Alexander, Gonville) are open.
% 99 99.50 100
Comment: The target of 99% was exceeded. Library sites were open 99.50% of the time. The Davis Library was closed for half a day in the third quarter for implementation of the new Library Management System.
Percentage of time website is available (Library).
% 99 99 99
Comment: The target of 99% was achieved. The Library website was available 99% of the time.
The number of events, talks and tours that promote the Library's services to groups, individuals and organisations.
# 18 29 13
Comment: The target of 18 was exceeded. The actual result was 29 events, talks and tours were delivered to promote the Library’s services.

Wanganui District Council Annual Report for the year ended 30 June 2012
Page 125 of 170
The percentage of Te Taurawhiri and Heritage collections that are indexed and digitised (Library).
% 45 52.80 33.76
Comment: The target of 45% was exceeded. The actual result saw 52.80% of the collections now indexed and digitised. This was a good improvement on the previous year where 33.76% was achieved.
The percentage of time that staff are available to support and advise APN users during Library operating hours.
% 100 100 100
Comment: The target of 100% was achieved. Staff were available to assist APN users 100% of the time.
The percentage of time the People's Network (APN) is available during its operating hours (Library).
% 100 100 100
Comment: The target of 100% was achieved. The People’s Network was available 100% of the time during operating hours.
Number of items in collection (Library). # 122000 119982 125258 Comment: The target of 122,000 was not achieved. The actual result was 119,982 items in the collection. The library deployed a comprehensive policy of stock withdrawal during 2011/12. This, combined with the lack of available space to house any growth in collection quantities, led to a decline in total collection size.
Number of members with Iwi affiliation (Library).
# 2240 1751 2089
Comment: The target of 2,240 was not achieved. The actual result was 1,751 members with Iwi affiliation. This target is continuing to be worked towards but measurement is dependent on people volunteering this information when they sign up for a Library card. In addition, a new library management system was introduced in March 2012 which saw changes in reporting software and a database cleanse of inactive borrowers. This means the result is not directly comparable with the previous year.
Number of members with River Road addresses (Library).
# 384 284 360
Comment: The target of 384 was not achieved. The actual result was 284 members with River Road addresses. This result is not directly comparable with the previous year as a new library management system was introduced in March 2012 which brought about changes in reporting software and a database cleanse of inactive borrowers.
Number of older people (55+ yrs) who are library members.
# 3864 3905 3731
Comment: The target of 3,864 was exceeded. The actual result was 3,905 members over the age of 55. This was also an increase on the previous year where there were 3,731 members.
Percentage of all preschoolers (0-4 years) in Wanganui that are library members.
% 40 22 17.70
Comment: The target of 40% was not achieved. The actual result was 22% of pre-schoolers in Wanganui are library members, however, this was an increase on the previous year. Work is continuing to be undertaken by the Children’s Book Champion and Early Years Specialist to rebuild interest in the Library’s children’s services after a period of inactivity in 2010/11 while new staff members were sought. Initiatives include regular events targeted at preschoolers as well as kindergarten visits and weekly morning story times.
The number of local Private Training Establishments that the Library works
# >5 7 5

Wanganui District Council Annual Report for the year ended 30 June 2012
Page 126 of 170
with in the areas of literacy and skill development. Comment: The target of greater than, or equal to, five was achieved. The Library worked with seven Private Training Establishments (PTEs) during 2011/12 (two more than the previous year). These included Training For You, Te Wananga o Raukawa and Te Wananga o Aotearoa. Students were shown how to effectively use library systems to source information and to improve their literacy and research skills.
The number of user contributions of content items to the Library's online resources.
# 2000 228 84
Comment: The target of 2,000 was not achieved. The actual result was 228 user contributions (an increase of 144 on the previous year). The target was not achieved because the Flickr Commons Project that would have formed the basis of much of this measure was closed by Yahoo to new participants after we had signed the agreement but before we were set up. Library staff are currently investigating new means of achieving greater user contributions, for example by revamping the library website and using Tumblr.
The percentage of Library users who are fairly or very satisfied with the service provided.
% 92 89 87
Comment: The target of 92% was not achieved. The actual result was 89% of Library users were fairly or very satisfied with the service provided. This was an increase of 2% on the previous year.
Scorecard Name: Date From Date To ROYAL WANGANUI OPERA HOUSE 01-Jul-2011 30-Jun-2012 Linked items Unit Target Actual Indicator Prior
year The building has a current "Building Warrant of Fitness" (Royal Wanganui Opera House).
% 100 100 100
Comment: The target of 100% was achieved. The building received and maintained a current Building Warrant of Fitness.
The number of days each year that the Opera House hosts events.
Days 125 59 80
Comment: The target of 125 was not achieved. The actual result was 59 days of hosted events. This was due to shorter production runs as a result of the economic climate and was a decrease of 21 days on the previous year. When the Opera House is not hosting events it is staging rehearsals, hosting tours, performing maintenance and selling tickets for other venues.
The number of patrons who attend shows at the Opera House per year.
# 25000 20854 24426
Comment: The target of 25,000 was not achieved. The actual result was 20,854 patrons attending shows during 2011/12. This was a decrease on the previous year where 24,426 patrons were hosted.
The percentage of patrons that are fairly or very satisfied with the Opera House facilities.
% 70 84 87
Comment: The target of 70% was exceeded. The actual result was 84% of users were fairly or very satisfied with the Opera House facilities; however, this was a decrease on the previous year where 87% was achieved.

Wanganui District Council Annual Report for the year ended 30 June 2012
Page 127 of 170
Scorecard Name: Date From Date To SARJEANT GALLERY 01-Jul-2011 30-Jun-2012 Linked items Unit Target Actual Indicator Prior
year The number of days that the gallery is open each year.
Days 363 362.25 362.50
Comment: The target of 363 days was not achieved. The actual result was 362.25 opening days. The gallery was closed on Christmas Day, Good Friday and the morning of Anzac Day.
The number of events held at the gallery.
# 28 70 79
Comment: The target of 28 events was exceeded. The actual result was 70 events held at the gallery (a decrease of nine on the previous year). The gallery worked hard to engage with the community through events and was proactive in seeking out and initiating new opportunities (for example through artist talks and performances). Continued growth in the Artist’s Open Studios weekend also had positive impact on the number of events staged.
The number of local visitors (Sarjeant Gallery).
# 17986 19301 19293
Comment: The target of 17,986 was exceeded. The actual result was 19,301 local visitors. This was also a slight increase on the previous year where 19,293 visitors were received.
The percentage of the collection meeting minimum documentation standards (Sarjeant Gallery).
% 100 85.50 -
Comment: The target of 100% was not achieved. The actual result was 85.50% of the collection met minimum documentation standards. This was not able to be measured last year as there was no staff member employed to undertake this work. Now that an appointment has been made new guidelines have been put in place and more advanced forms of database monitoring established – providing more comprehensive analysis. In addition, more records have been added to the database which has meant that the overall percentage increase in achievement of documentation standards has slowed.
The percentage of the collection that is fully documented with references (Sarjeant Gallery).
% 37.50 0.20 -
Comment: The target of 37.50% was not achieved. The actual result was 0.20% of the collection fully documented with references. The figure reported only includes information held electronically in the Vernon database, whereas much of the collection documentation exists solely in a paper-based form. Most of the basic records are halfway towards being full records, but the information that is missing for a full record is inconsistent and varies from record to record. Through the restructure undertaken at the beginning of the 2012 year a dedicated member of staff was employed to undertake this and other essential collections work. As part of continuous improvement efforts the inputting procedures and reporting systems for this KPI have been reassessed and refined to reflect a more consistent measure of progress in the coming year. The percentage of visitors who are fairly or very satisfied with the gallery's exhibitions.
% 80 97.70 97.15
Comment: The target of 80% was exceeded. The actual result was 97.70% of visitors were fairly or very satisfied with the gallery’s exhibitions. This matched the previous year’s result and was canvassed via the Sarjeant Gallery’s daily customer satisfaction surveys.
The percentage of visitors who are fairly or very satisfied with their gallery experience.
% 80 97.35 96.98

Wanganui District Council Annual Report for the year ended 30 June 2012
Page 128 of 170
Comment: The target of 80% was exceeded. The actual result was 97.35% of visitors were fairly or very satisfied with their gallery experience. This was in line with the previous year’s result and was canvassed via the Sarjeant Gallery’s daily customer satisfaction surveys.
The revenue raised by the gallery from events.
$ 11576 14769 8669.90
Comment: The target of $11,576 in revenue raised by gallery events was exceeded. The actual result was $14,769. This was an increase of approximately $6,100 on the previous year.
The number of visitors to exhibitions and gallery events.
# 31689 29851 29493
Comment: The target of 31,689 was not achieved. The actual result was 29,851 visitors to exhibitions and gallery events. However, this was an increase on the previous year were 29,493 visitors were received.
Scorecard Name: Date From Date To WAR MEMORIAL CENTRE 01-Jul-2011 30-Jun-2012 Linked items Unit Target Actual Indicator Prior
year Reported graffiti is removed within two hours of notification (War Memorial Centre).
% 100 100 100
Comment: The target of 100% was achieved. Reported graffiti was removed within two hours of notification.
The book of remembrance is on permanent display for public viewing during hall opening hours, or by appointment (War Memorial Centre).
% 100 100 97.50
Comment: The target of 100% was achieved. The book of remembrance was on permanent display for public viewing throughout 2011/12.
Booking enquiries are confirmed the same day (War Memorial Centre).
% 100 100 97.50
Comment: The target of 100% was achieved. All booking enquiries were confirmed the same day. This was an improvement on the previous year where 97.50% was achieved.
The memorial status and architectural integrity of the War Memorial Centre is retained.
% 100 100 100
Comment: The target of 100% was achieved. Memorial status and architectural integrity were retained.
Number of bookings are increased (War Memorial Centre).
# 190 111 138
Comment: The target of 190 was not achieved. The actual result was 111 bookings. This represented a decrease on the previous year where 138 bookings were received and was most likely due to the economic climate. Although bookings were down, income from bookings exceeded the budget by 19.5%.

Wanganui District Council Annual Report for the year ended 30 June 2012
Page 129 of 170
The community is fairly or very satisfied with the service provided (War Memorial Centre).
% 66 63 63
Comment: The target of 66% was not achieved. The actual result was 63% of the community were fairly or very satisfied with the War Memorial Centre. This matched last year’s result and saw the Centre retain its 13% increase from the previous period.

Wanganui District Council Annual Report for the year ended 30 June 2012
Page 130 of 170
Strategy and developmentFor the year ended 30 June 2012
Budget Council2012 2012 2011$000 $000 $000
IncomeUser fees and other revenue 231 86 78Total income 231 86 78
Operating expenditureOperating expenditure 2,878 2,786 2,763Finance costs 33 38 11Council overhead (28) (32) (12)Total operating expenditure 2,883 2,792 2,762
Operational rates requirement 2,652 2,706 2,684
Capital acquisitions - 116 1,170Capital replacements - - 16Total capital expenditure - 116 1,186
Total funding requirement 2,652 2,822 3,870
Transfers (to)/from special funds (160) - (135)New loans/(loans repaid) (200) (200) 732Total capital funding (360) (200) 597
Rate requirement 3,012 3,022 3,273
Total operating expenditure within each Activity Group may vary due to timing of workprogrammes, however there were no changes to the level of service.

Wanganui District Council Annual Report for the year ended 30 June 2012
Page 131 of 170
Strategy and Development group significant acquisitions or replacements of assets The following table shows the significant expenditure on capital acquisitions and replacements for the Strategy and Development Group. Significant variations to the Annual Plan are discussed below if necessary. Activity Item Budget $ Actual $Economic Development Riverfront precinct development project 0 116,119 Work was planned to maintain the service capacity of the Council facilities and to deal with the expected demands on the service. The Riverfront precinct development project was completed this year, funded by carry over funds from 2010/11 of $90,000. Actual costs exceeded budget by $26,119.

Wanganui District Council Annual Report for the year ended 30 June 2012
Page 132 of 170
Please see the activity scorecard information on page 112 of the Annual Report for further information. STATEMENT OF SERVICE PERFORMANCE – STRATEGY AND DEVELOPMENT GROUP Scorecard Name: Date From Date To ECONOMIC DEVELOPMENT 01-Jul-2011 30-Jun-2012 Linked items Unit Target Actual Indicator Prior
year The Wanganui Educational Institute complies with NZQA performance standards and the annual NZQA Audit is completed without findings (Economic development).
% 100 - - 1
Comment: This indicator was no longer applicable and could not be measured. The Wanganui Educational Institute was deregistered in October 2010.
Whanganui UCOL is satisfied with its partnership in the Wanganui Glass School (Economic development).
% 100 100 100
Comment: The target of 100% was achieved. Whanganui UCOL was satisfied with its partnership in the Wanganui Glass School.
Whanganui UCOL is satisfied with service delivery at the Wanganui Glass School (Economic development).
% 100 100 100
Comment: The target of 100% was achieved. Whanganui UCOL was satisfied with service delivery at the Wanganui Glass School.
Customers rate their contact with Economic development as good or very good.
% 95 72 47
Comment: The target of 95% was not achieved. The actual result saw 72% of customers rate their contact with economic development as ‘good’ or ‘very good’. This was an increase on the previous year where 47% was achieved and is perhaps attributable to adoption of the Economic Development Strategy and greater engagement with the community. This measure was canvassed via an annual Council-delivered customer survey.
Number of kilometres of open access fibre optic cable laid (Economic development).
KM 0-25 79 0
Comment: The target of up to 25 kilometres of fibre optic cable laid was exceeded. The actual result was 79km of open access fibre optic cable laid during 2011/12 (47km underground and 32km overhead). Directional drilling techniques were employed to lay these services underground which meant that progress was faster than anticipated.
Number of new businesses starting up. # Increasing
trend 4109 4109
Comment: The target of delivering an increasing trend was not achieved. There was no change in the number of businesses in Wanganui between 2010/11 and 2011/12.
People who attend these courses (business education and training) rate them as good or very good.
% 90 - - -
Comment: This indicator was no longer applicable and could not be measured. These courses ended over 24 months ago due to centralisation of the programme.

Wanganui District Council Annual Report for the year ended 30 June 2012
Page 133 of 170
The Accreditation Audit will show that the i-Site premise met accessibility standards.
% 90 100 100
Comment: The target of 90% was exceeded. The Accreditation Audit confirmed that standards had been met.
The Visitor Information Network survey will show that customers are satisfied with i-Site services.
% 94 88.40 88.40
Comment: The target of 94% was not achieved. The actual result was 88.40%. This represented a pass and was an increase of over 8% on the previous assessment. Potential improvements such as display of i-Site maps and better directional signage were highlighted by the assessors.
Visitor guest nights will increase. # 222400 174718 173274 Comment: The target of 222,400 was not achieved. The actual result was 174,718 guest nights. However, this reversed a consistent pattern of decline and represented an increase on the previous year of 1,218. In addition:
• International guest nights were up 3.7% to 37,410. • Domestic guest nights increased by 0.1% to 137,308. • The average length of stay grew from 1.67 nights to 1.73 nights. • Overall occupancy rates were down from 26.4% to 25.9%. • Accommodation capacity, excluding holiday parks, decreased by 0.3%.
Scorecard Name: Date From Date To STRATEGY AND POLICY 01-Jul-2011 30-Jun-2012 Linked items Unit Target Actual Indicator Prior
year A Community Outcomes Monitoring Report will be produced at least once every three years.
% 0 0 100
Comment: This report was not required in 2011/12. It was last produced in 2010/11.
Council will facilitate the process of identifying Community Outcomes at least once every six years.
% 0 0 0
Comment: This review was not required in 2011/12. It was last undertaken in 2008. However, Council did review its Family-friendly Strategy during 2011/12 as part of the development of the 10-Year Plan 2012-2022.
Number of school or education centre events that staff attend each year (Strategy and policy).
# 1 2 0
Comment: The target of one was exceeded. The actual result was two school visits undertaken during 2011/12. This was an increase on the previous year where there were no visits made.
Summary documents will pass Audit NZ quality standards (Strategy and policy).
% 100 100 100
Comment: The target of 100% was achieved. Documents passed Audit NZ quality standards.
Percentage completed of the District Plan review.
% 60 34 15
Comment: The target of 60% was not achieved. The actual result was 34% completion of the District Plan review. This was as a result of resourcing issues, however, the project plan has now been revised (retaining the same project completion date) and the project is being brought back on

Wanganui District Council Annual Report for the year ended 30 June 2012
Page 134 of 170
track. Targets were set in 2008 and have now been updated in the 10-Year Plan 2012-2022. Measures to ensure the project adheres to its project plan include a project management service being provided by Opus and monthly monitoring by the District Plan Working Party. Any changes to the project plan will be recommended by the working party to the Council for approval. Phase one (central city and riverfront) is complete and phases two (residential) and three (built heritage) are both on schedule. Compliance with Local Government Act review provisions, i.e. 5 years after they are made and 10 years thereafter (Strategy and policy – bylaws are effective and up to date).
% 100 80 80
Comment: The target of 100% was not achieved. The actual result was 80% compliance with Local Government Act review provisions. Council is systematically working its way through a review of its bylaws. All comply apart from some bylaw reviews which are still incomplete.
Operational areas of Council rate the quality of the policies and plans developed for their area as good or very good.
% 100 100 83
Comment: The target of 100% was achieved – all areas canvassed rated the quality of policies and plans developed for them as ‘good’ or ‘very good’. This measure was tracked via an internal survey.

Wanganui District Council Annual Report for the year ended 30 June 2012
Page 135 of 170
TransportFor the year ended 30 June 2012
Budget Council2012 2012 2011$000 $000 $000
IncomeUser fees and other revenue 3,254 3,324 3,159Subsidies 7,832 10,334 11,343Total income 11,086 13,658 14,502
Operating expenditureOperating expenditure 7,962 8,314 7,833Finance costs 830 631 525Council overhead 960 1,004 1,059Total operating expenditure 9,752 9,949 9,417
Operational rates requirement (1,334) (3,709) (5,085)
Capital acquisitions 1,898 1,530 2,890Capital replacements 5,894 9,042 8,618Total capital expenditure 7,792 10,572 11,508
Total funding requirement 6,458 6,863 6,423
Transfers (to)/from special funds (28) 17 (10)New loans/(loans repaid) 815 1,250 1,244Total capital funding 787 1,267 1,234
Rate requirement 5,671 5,596 5,189
Total operating expenditure within each Activity Group may vary due to timing of workprogrammes, however there were no changes to the level of service.

Wanganui District Council Annual Report for the year ended 30 June 2012
Page 136 of 170
Transport group significant acquisitions or replacements of assets The following table shows the significant expenditure on capital acquisitions and replacements for the Transport Group. Significant variations to the Annual Plan are discussed below if necessary. Activity Item Budget $ Actual $ Roading Minor safety projects 880,000 809,232 Whanganui River Road seal extension 514,000 145,552 Pavement rehabilitation 346,680 792,749 Structures components replacements 356,500 536,381 Emergency management – first response 300,000 1,262,027 Flood damage repairs 0 2,091,834 Sealed road resurfacing 2,435,400 2,268,611 Traffic services renewals 193,760 247,736 Unsealed road metalling 445,000 496,436 Drainage renewals 1,294,920 1,386,818 Wylies Bridge 155,000 0 Pathways construction 377,000 0 Footpaths and Berms Replacements 303,000 375,758 Airport Wastewater separation 0 3,293 Sea Port (Harbour Endowment) Gas Building. Lift 108,000 102,296 309 Heads Road 75,000 48,257 CBD Parking Plant and equipment 8,000 4,900 Total 7,792,260 10,571,880 Work was planned to maintain the service capacity of the Council facilities and to deal with the expected demands on the service. Roading Total budget for roading for 2012 was $10.941M. This budget was made up from: 2011/12 budget of $7.383M; 2010/11 carry over of $1.358M; additional funds of $2.2M approved by NZTA at 85% subsidy after the October floods. Actual expenditure was $10.877M. With emphasis being placed on flood damage remedial work, there are estimated carry overs of $0.912M for the 2012/13 programme. Footpaths and Berms Capital replacement expenditure exceeded budget. This overspend was compensated for by reduced contract maintenance costs. Airport This was final wastewater separation costs resulting from 2010/11 work. Sea Port (Harbour Endowment) The budgeted programme included $108,000 for work on the Lift at the Gas Building, and $75,000 for work on 309 Heads Road. Both of these have been completed this year. This work was funded from the Harbour Endowment special fund. CBD Parking Plant and equipment under CBD parking related to the purchase of parking meters.

Wanganui District Council Annual Report for the year ended 30 June 2012
Page 137 of 170
Please see the activity scorecard information on page 112 of the Annual Report for further information. STATEMENT OF SERVICE PERFORMANCE – INFRASTRUCTURE GROUP: TRANSPORT Scorecard Name: Date From Date To ROADING 01-Jul-2011 30-Jun-2012 Linked items Unit Target Actual Indicator Prior
year Number of reported injury crashes per 100 million vehicle kilometres travelled.
# <51 30 36.89
Comment: The target of less than 51 was achieved. The actual result was 30 reported injury crashes per 100 million vehicle kilometres travelled. Council measures reported injury crashes on local authority roads in order to track whether it is keeping its community safe and to ultimately mitigate the social / economic costs of road crashes. This measurement also supports the objectives of the Government’s Policy Statement on Transport. Council has worked hard alongside its enforcement and education partners to reduce the severity of injury crashes in our district.
The district roads are to have an average road roughness below 110 NAASRA counts.
# <110 104 106
Comment: The target of below 110 NAASRA counts was achieved. The actual result was an average road roughness count of 104. This was an improvement on the previous year and was due to treatment of urban roads. NAASRA stands for the ‘National Association of Australian State Roading Authorities’ and this count is the standard measure for road roughness. Road roughness is an important contributor to Vehicle Operating Costs (VOC) and road roughness is measured as NAASRA counts/km (bumps/km). There is not a national benchmark standard for this indicator but having an ‘average’ ensures the network is not deteriorating overall.
Percentage km of roads in the district that are below a roughness level of 180 as measured by NAASRA.
% >90 94 93
Comment: The target of greater than 90% was achieved. Ninety four percent of roads in the district had a roughness level of 180 as measured by NAASRA. This was a slight improvement on the previous year where 93% was achieved. NAASRA stands for the ‘National Association of Australian State Roading Authorities’ and this count is the standard measure for road roughness. Road roughness is an important contributor to Vehicle Operating Costs (VOC) and road roughness is measured as NAASRA counts/km (bumps/km). The national benchmark is that 90% of roads should be below 180 NAASRA counts/km and roads in the Wanganui district have remained stable at around 94%.
Percentage of written complaints that are responded to within five working days (Roading).
% 90 96.50 97
Comment: The target of 90% was exceeded. The actual result was 96.50% of written complaints were responded to within five working days during 2011/12. This was in line with last year’s result.
Number of fatal/serious injury crashes per year.
# <21 13 11

Wanganui District Council Annual Report for the year ended 30 June 2012
Page 138 of 170
Comment: The target of less than 21 fatal/serious injury crashes on Council’s local roads was achieved. The actual result was 13 crashes during the 2011/12 year. Two of these were fatalities. There were 11 fatal/serious injury crashes in 2010/11. Although this represented a slight increase on the previous year, it is reflective of a downward trend overall. Council uses the information it collects regarding crash locations to prioritise and action roading improvements. Council measures reported injury crashes on local authority roads in order to track whether it is keeping its community safe and to ultimately mitigate the social / economic costs of road crashes. This measurement also supports the objectives of the Government’s Policy Statement on Transport. Council has worked hard alongside its enforcement and education partners to reduce the severity of injury crashes in our district.
Number of reported injury crashes per year.
# <63 69 76
Comment: The target of less than 63 was not achieved. The actual result was 69 reported injury crashes during the 2011/12 year. There were 76 in 2010/11. Council measures reported injury crashes on local authority roads in order to track whether it is keeping its community safe and to ultimately mitigate the social / economic costs of road crashes. Council uses the information it collects regarding crash locations to prioritise and action roading improvements. This measurement also supports the objectives of the Government’s Policy Statement on Transport. Council has worked hard alongside its enforcement and education partners to reduce the severity of injury crashes in our district.
Percentage km of roads in the district that are smooth as measured by Smooth Traffic Exposure.
% >90 88 83
Comment: The target of greater than 90% was not achieved. The actual result was 88% of roads in the district were categorised smooth as measured by Smooth Traffic Exposure. However, this was an increase on the previous year (83%) and was due to improvements on urban arterial and collector roads (e.g. Somme Parade, Dublin Street and Alma Road). Road roughness is an important contributor to Vehicle Operating Costs (VOC) and road roughness is measured as NAASRA counts/km (bumps/km). Smooth Traffic Exposure measures the roughness exposure on vehicles on the district’s roads per vehicle kilometre travelled (VKT). The national benchmark is that 90% of traffic should be exposed to smooth roads. Council is slowly trending upwards from 79% and is currently sitting at around the 88% mark. The reason for lower than benchmark standards is as a result of the urban stormwater / sewerage separation project where vehicle numbers are the greatest – hence exposure has been the greatest. The target of greater than 90% is set by NZTA and the national average in 2010/11 was 92%. Although there is a target, NZTA is interested in how districts are trending and Wanganui is trending well. Our result of 88% compares favourably with Wellington (73%) and is in line with Palmerston North (87%) and Napier (88%).
Percentage of residents who are fairly or very satisfied with the roading network.
% >65 54 59
Comment: The target of greater than 65% was not achieved. The actual result was 54% of the community were fairly or very satisfied with the roading network. This marked a decrease on the previous year where 59% satisfaction was attained. Although network condition has actually improved, it is possible that decreased satisfaction may be related to the roll out of UFB in the urban area and logging activity in the rural area.

Wanganui District Council Annual Report for the year ended 30 June 2012
Page 139 of 170
Scorecard Name: Date From Date To FOOTPATHS AND BERMS 01-Jul-2011 30-Jun-2012 Linked items Unit Target Actual Indicator Prior
year Number of footpath related defects per year as reported to Council's Customer Services.
# <253 107 95
Comment: The target of less than 253 defects was achieved. The actual result was 107 footpath related defects reported to Customer Services during 2011/12. However, this was a less positive result than the previous year where 95 defects were reported.
Percentage of street tree trimming requests responded to within five working days.
% 90 92.75 92
Comment: The target of 90% was exceeded. The actual result was 92.75% of street tree trimming requests were responded to within five working days. This was a slight improvement on the previous year where 92% was achieved.
Percentage of the community who are fairly or very satisfied with footpath surfaces.
% 50 42 47
Comment: The target of 50% was not achieved. The actual result was 42% of the community were fairly or very satisfied with footpath surfaces. This was a reduction on the previous year where 47% was achieved. Although the target was not met, a condition rating survey of actual defects revealed a 44% decline in faults from 2003 and 2010 – furthermore, Council’s ongoing strategy to renew footpaths at a constant rate until 2015 will see defects continue to decline by an additional 6% per annum. Although network condition has actually improved, it is possible that decreased satisfaction may be related to the roll out of UFB and tree damage to footpaths – particularly along high profile routes such as Victoria Avenue, St Hill Street, Wilson Street and Taupo Quay. Percentage of the time written or verbal complaints are responded to within five working days (Footpaths and berms).
% 90 95.75 96.50
Comment: The target of 90% was exceeded. The actual result was 95.75% of complaints were responded to within five working days.
Scorecard Name: Date From Date To AIRPORT 01-Jul-2011 30-Jun-2012 Linked items Unit Target Actual Indicator Prior
year Percentage compliance with annual Civil Aviation Authority Part 139 Certification concerning runway maintenance, security, safety, emergency and management systems.
% 100 100 100
Comment: The target of 100% was achieved. Civil Aviation Authority Part 139 certification was complied with.
The area (m2) of used commercial building space at the airport.
M² 19825 19872.81 19825
Comment: The target of 19,825m² was achieved. Used commercial building space totaled 19,872.81m² during the 2011/12 year. This was a slight increase on the previous year.

Wanganui District Council Annual Report for the year ended 30 June 2012
Page 140 of 170
The percentage of users who are fairly or very satisfied with the terminal facilities and other passenger services.
% 75 88 91
Comment: The target of 75% was exceeded. The actual result was 88% of users were fairly or very satisfied with the terminal facilities and other passenger services at the airport. Scorecard Name: Date From Date To SEA PORT 01-Jul-2011 30-Jun-2012 Linked items Unit Target Actual Indicator Prior
year The number of accidents or incidents per year (Port).
# 0 1 1
Comment: The target of no accidents or incidents was not achieved. There was one incident near-miss at the sea port during 2011/12.
The number of commercial vessel visits per annum (Port).
# 13 11 23
Comment: The target of 13 was not achieved. The actual result was 11 commercial vessel visits. This represented a reduction on the previous year where 23 visits were made. This drop was attributed to the loss of urea shipments following the closure of the Kapuni plant (urea constituted 70% of our cargo in previous years). This plant is now back up and running and we have also picked up additional shipments.
Scorecard Name: Date From Date To CENTRAL BUSINESS DISTRICT PARKING 01-Jul-2011 30-Jun-2012 Linked items Unit Target Actual Indicator Prior
year Percentage of time that meters are operating properly, including the timing mechanism (Central Business District parking).
% 98 98.25 98.63
Comment: The target of 98% was achieved. Meters operated properly 98.25% of the time during 2011/12. This matched last year’s result.

Wanganui District Council Annual Report for the year ended 30 June 2012
Page 141 of 170
WaterFor the year ended 30 June 2012
Budget Council2012 2012 2011$000 $000 $000
IncomeUser fees and other revenue 3,572 3,252 3,302Total income 3,572 3,252 3,302
Operating expenditureOperating expenditure 7,163 7,103 7,376Finance costs 4,430 4,159 4,057Council overhead 1,415 1,480 1,370Total operating expenditure 13,008 12,742 12,803
Operational rates requirement 9,436 9,490 9,501
Capital acquisitions 4,829 1,772 5,142Capital replacements 2,902 2,149 1,943Total capital expenditure 7,731 3,921 7,085
Total funding requirement 17,167 13,411 16,586
Transfers (to)/from special funds 66 19 36New loans/(loans repaid) 4,084 396 3,924Total capital funding 4,150 415 3,960
Rate requirement 13,017 12,996 12,626
Total operating expenditure within each Activity Group may vary due to timing of workprogrammes, however there were no changes to the level of service.

Wanganui District Council Annual Report for the year ended 30 June 2012
Page 142 of 170
Water group significant acquisitions or replacements of assets The following table shows the significant expenditure on capital acquisitions and replacements for the Water Group. Significant variations to the Annual Plan are discussed below if necessary. Activity Item Budget $ Actual $ Stormwater Separation project 3,300,000 679,680 Urban reticulation replacements 550,000 157,782 Wastewater Vehicle replacement 60,000 0 Pump Stations 550,000 716,275 Urban reticulation replacements 1,155,000 921,213 Rural Schemes 0 10,179 Waterways and Natural Drainage
Capital acquisition 50,000 49,937
Water Supply Land purchase 0 72,434 Water softening project 0 32,985 Vehicle replacement 30,000 0 Rural Schemes 26,000 24,317 Water urban supply 500,000 274,615 Urban reticulation replacements 1,510,000 982,276 Total 7,731,000 3,921,693 Work was planned to maintain the service capacity of the Council facilities and to deal with the expected demands on the service. Stormwater The separation of stormwater from sewage continued to be undertaken this year. This has been a long term project which is nearing completion. The 2012 Annual Plan budget for the Stormwater Separation Project was $3.3M. In addition to this budget there was also a carry over from 2010/11 of $0.78M, resulting in a total programme budget of $4.08M. Actual expenditure was considerably below budget at $0.68M. This variance was due to the Heads Road work not being competed. $3.4M will be carried over to 2012/13. Expenditure for urban reticulation replacements was also below budget by $392,218. Work to be carried over includes integrated catchment management; stormwater monitoring; swale land purchases; removal of culverts. Wastewater Programmed expenditure on wastewater was undertaken to improve the overall network. The urban reticulation and pump station budgets totalled $1.705M. These budgets were increased by 2010/11 carry overs of $346,000, giving a total programme budget of $2.051M. Actual expenditure was $1.637M, which was $413,512 below budget. Work to be carried over includes overflow connection; acqua screen; flow monitoring. Due to availability, the vehicle purchase has been carried over to 2012/13. Waterways and natural drainage Payment to Horizons for river and drainage contribution re Matarawa was $29,531, with the balance of the expenditure being for the installation of wastops. Water supply The Council’s aim is to reduce household and business expenses as well as ensuring the long-term security of Wanganui’s water supply. These aims are achieved by providing softer water and securing additional water sources. The project was completed this year utilising $40,000 of carry over funds from 2010/11.

Wanganui District Council Annual Report for the year ended 30 June 2012
Page 143 of 170
Water urban supply was underspent by $225,385. This underspend was mainly due to Mission Road work of $214,000 being carried over to 2012/13. This work was delayed while pipe stock savings were being pursued. The urban reticulation replacements programme budget for 2012 was $1.51M. At the six-month review this was reduced by $433,000 to enable greater repayment of water debt. Carry overs for 2012/13 total $152,000.

Wanganui District Council Annual Report for the year ended 30 June 2012
Page 144 of 170
Please see the activity scorecard information on page 112 of the Annual Report for further information. STATEMENT OF SERVICE PERFORMANCE – INFRASTRUCTURE GROUP: WATER Scorecard Name: Date From Date To WATER SUPPLY 01-Jul-2011 30-Jun-2012 Linked items Unit Target Actual Indicator Prior
year The Council will maintain a Bb grading and comply with the Drinking Water Standards for New Zealand (or mitigation undertaken if transgressions occur).
% 100 100 100
Comment: The target of 100% was achieved. The Council received confirmation of an Aa grading from the Ministry of Health following satisfaction of all testing and reporting requirements. This covers the Wanganui urban area. Ministry of Health grading is a measure of confidence that drinking water supplies will remain uncontaminated.
Water hardness levels across urban reticulation area.
# <100.00 for nine
months of the year
117.50 118.92
Comment: The target of less than 100ppm was not met. The actual result was an average of 117.50ppm. However, this demonstrated continued improvement on the previous two year’s results, with 118.92ppm achieved in 2010/11 and 150ppm in 2009/10. Hardness levels across the city vary from suburb to suburb, with a maximum hardness result of 157ppm and a minimum of 38ppm. Water is sampled on average once a month and is sent to an accredited laboratory for testing.
Horizons Regional Council consent conditions will be complied with or mitigation undertaken if transgressions occur (Water supply).
% 95 100 100
Comment: The target of 95% was exceeded. The actual result was 100% compliance with Horizons Regional Council consent conditions. These set limits on maximum daily quantities and abstraction rates and impose reporting requirements. This matched the previous year’s result.
Hydrants tested will comply with the New Zealand Fire Service's code of practice.
% 85 0 95.75
Comment: The target of 85% was not achieved. There was no testing undertaken by the New Zealand Fire Service throughout 2011/12 due to industrial action which caused subsequent disruption to its testing programme. However, hydrant testing finally resumed in July 2012.
Water will be available to serviced properties at all times.
% 99 99.90 99.90
Comment: The target of 99% was achieved. Water was available to serviced properties on average 99.90% of the time during 2011/12. ‘Shut-off’ notices delivered to customers detail the street, the number of properties affected, the date and the duration of maintenance. Mains with ongoing maintenance issues are given higher priority in the renewals programme. There were 29 planned water supply interruptions and 10 unplanned (compared to 63 planned and 37 unplanned in 2010/11). The unplanned interruptions were as a result of emergency repairs.

Wanganui District Council Annual Report for the year ended 30 June 2012
Page 145 of 170
High priority leak repairs will be commenced within six hours of notification (Water supply).
% 95 100 100
Comment: The target of 95% was exceeded. The actual average result was 100% of high priority leak repairs were commenced within six hours of notification. This information was received from Downer NZ via monthly reports and Council also undertakes its own internal monitoring. There were 86 high priority repairs conducted during 2011/12 (there were 126 in 2010/11). Call outs across the water supply activity were made in response to hydrant faults, valve faults, water leaks, water quality and ‘locates’ (requests from contractors and customers to locate the positions of water pipes, connections and tobies). High priority repairs are characterised as those that involve major water leakage or leakage that could cause flooding to private property or bank instability. Routine priority leak repairs will be completed within five working days of notification (Water supply).
% 90 91 90.70
Comment: The target of 90% was exceeded. The actual average result was 91% of routine priority leak repairs were commenced within five working days of notification. This information was received from Downer NZ via monthly reports and Council also undertakes its own internal monitoring. There were 1,346 routine priority repairs conducted during 2011/12 (there were 1,333 in 2010/11). Call outs across the water supply activity were made in response to hydrant faults, valve faults, water leaks, water quality and ‘locates’ (requests from contractors and customers to locate the positions of water pipes, connections and tobies). Routine priority repairs are characterised as those involving more minor instances of water leakage that are unlikely to impact on properties or bank stability.
Scorecard Name: Date From Date To STORMWATER 01-Jul-2011 30-Jun-2012 Linked items Unit Target Actual Indicator Prior
year Percentage of high priority repairs commenced within 6 hours of notification (Stormwater).
% >90 100 100
Comment: The target of greater than, or equal to, 90% was achieved. The actual result was 100% of high priority repairs were commenced within six hours of notification. This information was received from Downer NZ via monthly reports and Council also undertakes its own internal monitoring. There were 13 high priority repairs conducted during 2011/12 (there were 19 in 2010/11). Call outs across the stormwater activity were made in response to blocked rains, flooding, investigations, pipe repairs, ‘miscellaneous’ and ‘locates’ (requests from contractors and customers to locate the positions of pipes etc.). High priority repairs are characterised as those that involve problems with the stormwater network that have the potential to cause damage to private property or pose public health risk.
Percentage of routine priority repairs completed within 5 working days of notification (Stormwater).
% >90 82.93 91.04
Comment: The target of greater than, or equal to, 90% was not achieved. The actual result was 82.93% of routine priority repairs were completed within five working days of notification. This information was received from Downer NZ via monthly reports and Council also undertakes its own internal monitoring. There were 123 routine priority repairs conducted during 2011/12 (there were 134 in 2010/11). Call outs across the stormwater activity were made in response to blocked drains, flooding, investigations, pipe repairs, ‘miscellaneous’ and ‘locates’ (requests from contractors and

Wanganui District Council Annual Report for the year ended 30 June 2012
Page 146 of 170
customers to locate the positions of pipes etc.). Routine priority repairs are characterised as those that involve problems with the stormwater network that are unlikely to cause damage to private property or to pose public health risk.
Number of instances per year of water entering residential houses reported to Council (up to a 1:10 year storm event).
# <10 0 0
Comment: The target of less than 10 was achieved. There were no instances of water entering residential houses reported to Council during 2011/12. This matched the previous year’s result.
Scorecard Name: Date From Date To WASTEWATER 01-Jul-2011 30-Jun-2012 Linked items Unit Target Actual Indicator Prior
year Discharge of fully treated wastewater to sea outfall.
% >80 46 46
Comment: The target of greater than 80% was not achieved. The actual result was 46% compliance with consent condition number 10. This consent condition is about making sure discharges don’t exceed set standards (for example in relation to grease, faecal coliforms and suspended solids) and is valid until 2026. There are 11 measurement parameters and Council complied with 8 of these at all times during 2011/12. Condition 10 is one of 22 consent conditions for the discharge of fully treated wastewater. As part of the consent conditions Council conducts tests on the quality of the water discharged throughout the year – these are independently assessed by environmental laboratory services. Horizons Regional Council then uses these results to determine whether resource consent conditions have been met. Discharge of stormwater including diluted wastewater to sea outfall.
% <10 7.30 4
Comment: The target of less than 10% was achieved. The actual result saw wastewater pumped out to sea instead of to the plant for treatment an average of 7.30% of the time during the 2011/12 year. This happens when the pumps can’t work fast enough (for example, when it rains). In 2010/11 this happened 4% of the time.
Percentage of high priority repairs commenced within 6 hours of notification (Wastewater).
% >90 100 100
Comment: The target of greater than, or equal to, 90% was achieved. The actual result was 100% of high priority repairs were commenced within six hours of notification. This information was received from Downer NZ via monthly reports and Council also undertakes its own internal monitoring. There were 50 high priority repairs conducted during 2011/12 (there were 109 in 2010/11). Call outs across the wastewater activity were made in response to blocked drains, flooding, investigations, pipe repairs, ‘miscellaneous’ and ‘locates’ (requests from contractors and customers to locate the positions of pipes etc.). High priority repairs are those that involve any blockage or problem within the network with the potential to cause damage to private property or to pose public health risk.
Percentage of routine priority repairs completed within 5 working days of notification (Wastewater).
% 90 86.16 90.38
Comment: The target of greater than, or equal to, 90% was not achieved. The actual result was 86.16% of routine priority repairs were completed within five working days of notification. This information was received from Downer NZ via monthly reports and Council also undertakes its own internal monitoring. There were 318 routine priority repairs conducted during 2011/12 (there were

Wanganui District Council Annual Report for the year ended 30 June 2012
Page 147 of 170
291 in 2010/11). Call outs across the wastewater activity were made in response to blocked drains, flooding, investigations, pipe repairs, ‘miscellaneous’ and ‘locates’ (requests from contractors and customers to locate the positions of pipes etc.). Routine priority repairs are those that involve any blockage or problem within the network without the risk of causing damage to private property or the posing of public health risk.
Scorecard Name: Date From Date To WATERWAYS AND NATURAL DRAINAGE 01-Jul-2011 30-Jun-2012 Linked items Unit Target Actual Indicator Prior
year Whanganui River Flood Action Plan response compliance.
% 100 100 100
Comment: The target of 100% was achieved. The Whanganui River Flood Action Plan was complied with.

Wanganui District Council Annual Report for the year ended 30 June 2012
Page 148 of 170
WasteFor the year ended 30 June 2012
Budget Council2012 2012 2011$000 $000 $000
IncomeUser fees and other revenue 165 200 195Subsidies - 6 1Total income 165 206 196
Operating expenditureOperating expenditure 549 502 485Finance costs 186 185 193Council overhead 108 113 102Total operating expenditure 843 800 780
Operational rates requirement 678 594 584
Capital acquisitions - 30 -Total capital expenditure - 30 -
Total funding requirement 678 624 584
Transfers (to)/from special funds - (52) (63)New loans/(loans repaid) (68) (68) (18)Total capital funding (68) (120) (81)
Rate requirement 746 744 665
Total operating expenditure within each Activity Group may vary due to timing of workprogrammes, however there were no changes to the level of service.

Wanganui District Council Annual Report for the year ended 30 June 2012
Page 149 of 170
Waste group significant acquisitions or replacements of assets The following table shows the significant expenditure on capital acquisitions and replacements for the Waste Group. Significant variations to the Annual Plan are discussed below if necessary. Activity Item Budget $ Actual $Waste minimisation 0 30,000 Work was planned to maintain the service capacity of the Council facilities and to deal with the expected demands on the service. The $30,000 expenditure incurred related to the purchase of a shredder. This purchase was funded from the Waste Initiatives fund (external revenue).

Wanganui District Council Annual Report for the year ended 30 June 2012
Page 150 of 170
Please see the activity scorecard information on page 112 of the Annual Report for further information. STATEMENT OF SERVICE PERFORMANCE – INFRASTRUCTURE GROUP: WASTE Scorecard Name: Date From Date To WASTE MINIMISATION 01-Jul-2011 30-Jun-2012 Linked items Unit Target Actual Indicator Prior
year A free community recycling centre will be provided at Peat Street, 24 hours a day, 7 days a week.
% 100 100 100
Comment: The target of 100% was achieved. A free community recycling centre was provided at Peat Street 24 hours a day, seven days a week. A kerbside recycling pick-up service will be provided each month for all households unable to access the Recycling Centre due to disability or being car-less i.e. 12 per year.
# 12 12 12
Comment: The target of 12 was achieved. A kerbside recycling pick-up service was provided each month.
Facilities for domestic hazardous waste disposal will be provided at the transfer station.
% 100 100 100
Comment: The target of 100% was achieved. Facilities for domestic hazardous waste disposal were provided 100% of the time at the transfer station.
Resource consent conditions for Balgownie landfill (monitored for gas and leachates) are complied with.
% 100 100 100
Comment: The target of 100% was achieved. Resource consent conditions were complied with.
Rural refuse will be collected weekly. # 52 52 52
Comment: The target of 52 was achieved. Rural refuse was collected every week during 2011/12.
Number of school information and education visits made each year to talk about waste minimisation opportunities.
# 6 12 8
Comment: The target of six was exceeded. The actual result was twelve school information and education visits were made during 2011/12 to talk about waste minimisation opportunities. All primary schools are invited to participate in this initiative.
Number of school visits to the Recycling Centre hosted each year.
# 6 2 5
Comment: The target of six was not achieved. The actual result was two school visits hosted at the Recycling Centre during 2011/12. This service primarily relies on primary schools approaching Council to participate. Although offers are made within schools where we undertake education programmes, resourcing issues prohibit active promotion and hosting.
Number of complaints about the peri-urban refuse collection service.
# 6 0 3
Comment: The target of less than six was achieved – there were no complaints received about the peri-urban refuse collection during 2011/12. This was an improvement on last year where three

Wanganui District Council Annual Report for the year ended 30 June 2012
Page 151 of 170
complaints were received.
Number of complaints about the rural bin sites per year.
# 6 2 1
Comment: The target of less than six was achieved. The actual result was two complaints received about the rural bin sites during 2011/12.
Amount of product recycled through the Recycling Centre per year.
m³ >20500 21301 21396
Comment: The target of greater than 20,500m³ was exceeded. The actual result was 21,301m³ of product recycled. This was a slight decrease on the result for the previous year.
The number of users of the Recycling Centre per day, average.
# >380 381 335
Comment: The target of greater than 380 was achieved – there were, on average, 381 users of the Recycling Centre per day during 2011/12. This was an improvement on the previous year’s total of 335.

Wanganui District Council Annual Report for the year ended 30 June 2012
Page 152 of 170
Corporate and governanceFor the year ended 30 June 2012
Budget Council2012 2012 2011$000 $000 $000
IncomeUser fees and other revenue 1,211 2,165 1,949Subsidies - 21 29Total income 1,211 2,186 1,978
Operating expenditureOperating expenditure 7,606 9,146 8,670Finance costs 190 113 56Council overhead (5,737) (5,996) (5,897)Total operating expenditure 2,059 3,263 2,829
Operational rates requirement 848 1,077 851
Capital acquisitions 377 282 492Capital replacements 180 599 226Total capital expenditure 557 881 718
Total funding requirement 1,405 1,958 1,569
Transfers (to)/from special funds (350) (192) (373)New loans/(loans repaid) (140) (442) 564Total capital funding (490) (634) 191
Rate requirement 1,895 2,592 1,378
Total operating expenditure within each Activity Group may vary due to timing of workprogrammes, however there were no changes to the level of service.

Wanganui District Council Annual Report for the year ended 30 June 2012
Page 153 of 170
Corporate and Governance group significant acquisitions or replacements of assets The following table shows the significant expenditure on capital acquisitions and replacements for the Corporate and Governance Group. Significant variations to the Annual Plan are discussed below if necessary. Activity Item Budget $ Actual $ Governance Stained glass windows 20,000 10,438 Office equipment 0 8,738 Administration Furniture and fittings 30,000 22,779 Vehicle replacement 70,000 51,568 Information Management Computer equipment acquisition 225,000 173,720 Computer equipment replacement 80,000 592,031 Intangible asset additions 120,000 12,500 Infrastructure administration Furniture and fittings 12,000 42,656 Finance Intangible asset additions 0 34,118 Share of Forestry land disposal introduced 0 (67,803) Total 557,000 880,745 Work was planned to maintain the service capacity of the Council facilities and to deal with the expected demands on the service. Governance The stained glass work is an ongoing project spread over many years. One window was completed this year. Unbudgeted expenditure during the year included the installation of a new screen in the Boardroom. Administration Expenditure on furniture and fittings and replacement vehicles was below budget. Information Management The Annual Plan capital budget for the year was $425,000. Actual expenditure was $778,251. This included an overspend in the capital replacements budget of $512,031. The main reason for this overspend was due to the SAN server project. The total cost of this project was $454,795, this was budgeted to be leased over 3 years, however we are required to book to total value of the equipment offset by a 3 year loan. There was an underspend on IT Special Projects (Intangible asset additions) due to lack of resources. The remaining budget has not been carried forward to 2012/13. Infrastructure Administration Expenditure of $42,656 mainly relates to the Tram Tracks project. This project was funded from special funds. The furniture and fittings budget of $12,000 was unspent during the year. This budget will be carried over to 2012/13. Finance Expenditure of $34,118 relates to the purchase of Ibis rates modelling software. This purchase was funded from 2010/11 carry overs.

Wanganui District Council Annual Report for the year ended 30 June 2012
Page 154 of 170
Please see the activity scorecard information on page 112 of the Annual Report for further information. STATEMENT OF SERVICE PERFORMANCE – CORPORATE AND GOVERNANCE GROUP Scorecard Name: Date From Date To CORPORATE MANAGEMENT 01-Jul-2011 30-Jun-2012 Linked items Unit Target Actual Indicator Prior
year A clear audit opinion is achieved for audited documents (Corporate management).
% 100 100 100
Comment: The target of 100% was achieved. A clear audit opinion was achieved for audited documents. Workplace accidents for Council employees.
# <49 38 57
Comment: The target of less than 49 was achieved. The actual result was 38 accidents for Council employees. This was a decrease on the previous year where 57 reports were made.
Archives and records information will be available during core working hours (Corporate management).
% 90 100 100
Comment: The target of 90% was exceeded. The actual result was 100% availability of archives and records information.
Telephone calls to the Council's main telephone number (349 0001) will be answered within 20 seconds.
% 80 80.81 89.60
Comment: The target of 80% was achieved – 80.81% of calls to the Council’s main telephone number were answered within 20 seconds. This was a decrease on the previous year where 89.60% was achieved. This drop was primarily attributed to technical issues with the computer system.
The performance of Council staff is rated by the community as good or very good.
% >65 61 55
Comment: The target of greater than 65% was not achieved. The actual result was 61% of the community rate the performance of Council staff as ‘good’ or ‘very good’. However, this was an increase on the previous year where 55% was achieved. This is measured through the annual Community Views Survey and does not necessarily reflect those people who have had contact with Council. Customers who have had contact with Council report a 94% satisfaction rating. Council is also in the process of implementing an overarching Customer Care Strategy.
Customers surveyed report being satisfied or very satisfied with the contact and service received (Customer services).
% 90 94 97.60
Comment: The target of greater than 90% was exceeded. The actual result was 94% of customers reported being satisfied or very satisfied with the contact and service received. However, this did represent a decrease on the previous year where 97.60% was achieved. This measure was canvassed via a Council-delivered customer satisfaction survey.

Wanganui District Council Annual Report for the year ended 30 June 2012
Page 155 of 170
The community is satisfied that enough or more than enough information is supplied by the Council.
% >85 63 66
Comment: The target of greater than 85% was not achieved. The actual result was 63% of the community were satisfied that ‘enough’ or ‘more than enough’ information was supplied by the Council. This represented a decline on the previous year where 66% was achieved.
Scorecard Name: Date From Date To GOVERNANCE 01-Jul-2011 30-Jun-2012 Linked items Unit Target Actual Indicator Prior
year The community will be satisfied that Council has responded very well or well to community needs and issues.
% 75 59 61
Comment: The target of 75% was not achieved. The actual result was 59% of the community were satisfied that the Council had responded ‘very well’ or ‘well’ to community needs and issues. This represented a slight decrease on the previous year where 61% was achieved. The performance of the Rural Community Board will be rated by the community as good or very good.
% 50 47 40
Comment: The target of 50% was not achieved. The actual result was 47% of the rural community rated the performance of the Rural Community Board as ‘good’ or ‘very good’. However, this did represent an increase on the previous year where 40% was achieved.
The performance of the Mayor and councillors will be rated by the community as good or very good.
% 75 55 57
Comment: The target of 75% was not achieved. The actual result was 55% of the community rated the performance of the Mayor and councillors as ‘good’ or ‘very good’. This represented a slight decline on the previous year where 57% was achieved.
Scorecard Name: Date From Date To INVESTMENTS 01-Jul-2011 30-Jun-2012 Linked items Unit Target Actual Indicator Prior
year The forecast returns from the Joint Wanganui District Council Forestry Committee will be achieved.
% 100 100 100
Comment: The target returns were exceeded – while these were budgeted at $0, the actual return was $475K. Please refer to the ‘Notes to the Financial Statements’ (notes 17 and 19) for more information. The forecast returns from Wanganui District Council Holdings Limited will be achieved.
% 100 100 100

Wanganui District Council Annual Report for the year ended 30 June 2012
Page 156 of 170
Comment: The target of 100% was achieved. The actual result was 100% of forecast returns were achieved. The investment returns were budgeted at $0 and there was no variance to this result. These were considered to be satisfactory and exceeded predictions for the year. The Company’s subsidiary, Wanganui Gas Limited, performed to expectations and debt repayment of $1.5M across the group was achieved during the year. Please refer to the Council Controlled Organisations (CCO) section of the Annual Report for more information on the CCO’s performance.

Wanganui District Council Annual Report for the year ended 30 June 2012
Page 157 of 170
Customer servicesFor the year ended 30 June 2012
Budget Council2012 2012 2011$000 $000 $000
IncomeUser fees and other revenue 1,711 1,532 1,557Subsidies - 9 8Total income 1,711 1,541 1,565
Operating expenditureOperating expenditure 2,771 2,772 2,552Finance costs 31 38 36Council overhead 547 572 570Total operating expenditure 3,349 3,382 3,158
Operational rates requirement 1,638 1,841 1,593
Capital acquisitions 1 - 63Capital replacements 72 63 7Total capital expenditure 73 63 70
Total funding requirement 1,711 1,904 1,663
Transfers (to)/from special funds - (25) 35New loans/(loans repaid) (11) (11) 44Total capital funding (11) (36) 79
Rate requirement 1,722 1,940 1,584
Total operating expenditure within each Activity Group may vary due to timing of workprogrammes, however there were no changes to the level of service.

Wanganui District Council Annual Report for the year ended 30 June 2012
Page 158 of 170
Customer Services group significant acquisitions or replacements of assets The following table shows the significant expenditure on capital acquisitions and replacements for the Customer Services Group. Significant variations to the Annual Plan are discussed below if necessary. Activity Item Budget $ Actual $ Emergency Management Rural Fire plant and equipment 10,000 0 Regulatory Services Animal Control 48,000 43,298 Environmental Health 15,000 19,791 Total 73,000 63,089 Work was planned to maintain the service capacity of the Council facilities and to deal with the expected demands on the service. Emergency Management The Rural Fire budget for sundry plant and equipment was $10,000. No expenditure was incurred for the year. Regulatory Services The expenditure for Animal Control and Environmental Health was for vehicle replacements. Actual expenditure is on budget.

Wanganui District Council Annual Report for the year ended 30 June 2012
Page 159 of 170
Please see the activity scorecard information on page 112 of the Annual Report for further information. STATEMENT OF SERVICE PERFORMANCE – CUSTOMER SERVICES GROUP
Scorecard Name: Date From Date To EMERGENCY MANAGEMENT 01-Jul-2011 30-Jun-2012 Linked items Unit Target Actual Indicator Prior
year The Readiness and Response sections of the Rural Fire Plan will be reviewed every two years.
% 100 100 0
Comment: The target of 100% was achieved – the Readiness and Response sections of the Rural Fire Plan were reviewed and formally adopted by Council on 19 December 2011. The Reduction and Recovery sections of the Rural Fire Plan will be reviewed every five years.
% 0 0 85
Comment: The Reduction and Recovery sections of the Rural Fire Plan were received and formally adopted on 19 December 2011 in conjunction with the Readiness and Response sections. They will next be reviewed in 2015/16.
Percentage attendance at Manawatu-Wanganui Region Civil Defence Emergency Management Group meetings.
% 75 100 100
Comment: The target of 75% was exceeded. The actual result was 100% attendance at eight Manawatu-Wanganui Civil Defence Emergency Management Group meetings during 2011/12.
Receipt of calls will be acknowledged within 10 minutes (Emergency management – Rural Fire).
% 98 100 100
Comment: The target of 98% was exceeded. The actual result was 100% of calls were acknowledged within 10 minutes.
Receipt of calls will be acknowledged within 20 minutes (Emergency management – Civil Defence).
% 98 100 100
Comment: The target of 98% was exceeded. The actual result was 100% of calls were acknowledged within 20 minutes.
Number of public awareness presentations made per year (Emergency management).
# 15 51 63
Comment: The target of 15 was exceeded. The actual result was 51 public awareness presentations were made during 2011/12. The large number of presentations was due to increased interest and focus on emergency preparedness in the wake of the Christchurch earthquake but presentations were also made on other hazards, for example floods. Presentations are mainly delivered off-site and are made in response to community requests for information.
Percentage of public awareness (Emergency management).
% >75 85 82
Comment: The target of greater than, or equal to, 75% was exceeded. The actual result was 85% of the community could go without outside assistance for three days or more. This was an improvement on the previous year where 82% of people were adequately prepared. This improvement is due in part to increased interest and focus on emergency preparedness in the wake of the Christchurch earthquake.

Wanganui District Council Annual Report for the year ended 30 June 2012
Page 160 of 170
Scorecard Name: Date From Date To REGULATORY SERVICES 01-Jul-2011 30-Jun-2012 Linked items Unit Target Actual Indicator Prior
year Animal control Number of days the pound service is provided.
Days 365 365 365
Comment: The target of 365 days was achieved. The pound service was provided every day during 2011/12. This included cleaning of the kennels and feeding of the animals.
Percentage of known dogs that are registered or enforcement action taken.
% 100 98 95.50
Comment: The target of 100% was not achieved. The actual result was 98% of known dogs were registered or enforcement action was taken. Although the target was not achieved this is one of the highest rates in the country. Failure to attain the target is due to an element of flexibility provided, for example dogs loaded in June do not incur charges as it so close to the beginning of the registration year (which begins on 1 July) and there is a one month grace period for owners to register their dogs before they are infringed. In addition, this year’s result was an improvement on the previous period where 95.50% was achieved. Percentage of the community fairly or very satisfied with the animal control services provided.
% 65 60 58
Comment: The target of 65% was not achieved. The actual result was 60% of the community were fairly or very satisfied with the animal control services provided. This was an improvement on the previous year where 58% was achieved. The animal control team has worked on increasing its customer service during the 2011/12 year by contacting complainants with updates once their issues have been investigated.
Resource management Percentage of notified planning application reports available five working days before scheduled hearing dates.
% 100 100 100
Comment: The target of 100% was achieved. All notified planning application reports were available five working days before scheduled hearing dates.
Percentage of resource consents monitored within two years of being issued.
% 90 100 95
Comment: The target of 90% was exceeded. The actual result was 100% of resource consents were monitored within two years of being issued. This was an improvement of 5% on the previous year.
Percentage of resource consents processed within the statutory timeframes.
% >95 98 98.50
Comment: The target of greater than 95% was achieved. The actual result was 98% of resource consents were processed within the statutory timeframes. This was in line with the previous year.
Percentage of users fairly or very satisfied with the resource management services provided.
% >75 90 92

Wanganui District Council Annual Report for the year ended 30 June 2012
Page 161 of 170
Comment: The target of greater than, or equal to, 75% was exceeded. The actual result was 90% of customers were fairly or very satisfied with the resource management services provided, however, this was a slight decrease on the previous year where 92% was achieved. This measure was canvassed via an annual Council-delivered customer satisfaction survey.
Environmental health All complaints of excessive noise will be investigated within 30 minutes.
% 95 70 86
Comment: The target of 95% was not achieved. The actual result was 70% of excessive noise complaints were investigated within 30 minutes (86% in 2010/11). Each month the discrepancies are forwarded to the noise contract supervisor and the customer services supervisor for corrective action improvements. Although there have been some marked improvements in data entry, discrepancies are still occurring and further training is required. In addition, the contractor has been penalised where time delays have been considered unreasonable. This contract is currently up for tender.
Percentage of registered food premises inspected at least once a year.
% 100 100 92
Comment: The target of 100% was achieved. All registered food premises were inspected at least once during 2011/12. This was an improvement on the previous year where only 92% were inspected.
Users will be fairly or very satisfied with the environmental health services provided.
% 70 76 89
Comment: The target of 70% was exceeded. The actual result was 76% of customers were fairly or very satisfied with the environmental health services provided. However, this was a decrease on the previous year where 89% was achieved. This measure was canvassed via an annual Council-delivered customer satisfaction survey.
Parking control Percentage of parking areas patrolled Monday-Saturday (excluding public holidays).
% >98 96.75 98.25
Comment: The target of greater than, or equal to, 98% was not achieved. The actual result was 96.75% of parking areas were patrolled during operating hours. Failure to achieve the target can be attributed to resourcing issues.
Private stormwater compliance Percentage of properties above the Cobham Bridge that have their stormwater systems separated.
% 100 99.70 99.60
Comment: The target of 100% was not achieved. The actual result was 99.70% of properties above the Cobham Bridge had their stormwater systems separated. There are currently 19 properties above the Cobham Bridge that are not separated (there were 28 last year). Of these there will be seven or eight that will prove too difficult or expensive to separate. The remainder should be complete by December 2012.
Building control Percentage of building consents processed within the statutory timeframe.
% 90 99.43 99.84

Wanganui District Council Annual Report for the year ended 30 June 2012
Page 162 of 170
Comment: The target of 90% was exceeded. The actual result was 99.43% of building consents were processed within the statutory timeframe. This matched the previous year’s result.
Users will be fairly or very satisfied with the building control services provided.
% 70 97 88
Comment: The target of 70% was exceeded. The actual result was 97% of customers were fairly or very satisfied with the building control services provided. This was an improvement on the previous year where 88% was achieved. This measure was canvassed via an annual Council-delivered customer satisfaction survey.
Liquor licensing Percentage of liquor licences issued within 20 working days of receipt if approved.
% 95 99.67 99.75
Comment: The target of 95% was exceeded. The actual result was 99.67% of liquor licences were issued within 20 working days of receipt, if approved. This matched the previous year’s result.

Wanganui District Council Annual Report for the year ended 30 June 2012
Page 163 of 170
Council Controlled Organisations Wanganui District Council Holdings Limited (WDCHL) and Wanganui Gas Limited (WGL) WDCHL was formed in March 2002 to provide a commercial overview to the Council’s investment portfolio. It owns 100% of the shares in Wanganui Gas Limited and its subsidiaries and provides a monitoring service to Council for the following activities:
Council’s investment properties Wanganui District Councils’ Forestry Joint Committee Wanganui Airport Joint Venture Wanganui Gas Limited Inland Port/Sea Port Quarrying
WDCHL was formed to oversee individual investments and to advise Council on:
The mix of investments in the portfolio; The risk of investments in the portfolio; The management of individual investments in the portfolio; The overall strategy for investments in the portfolio; To identify opportunities to enhance investments and returns; To identify potential new investments that meet Council investment objectives; To identify appropriate structures that may better enhance focus and management of
particular investments. Monitoring of these investments has been carried out and questions regarding the future strategies, mix, prospects and risks of these investments have been addressed. The Board meets monthly except January. The Council objectives for the ownership of the Company are being met.
Objective
The Board intends to operate as a successful business in relation to its investments to the monitoring roles assigned to it under contract by WDC.
Performance targets
• To make a profit of $20,000
Actual
2010/11 Budget
Actual
2011/12
Surplus/(deficit) before tax $(118,000) $(207,500) $(403,000)
Dividend received $0 $0 $100,000
Dividend paid $0 $0 $0
Variance between actual and budget for 2012 was the result of the revaluations of derivative financial instruments and higher than budgeted income from Port activities. • To facilitate Wanganui Gas Limited to achieve the performance targets identified in its Statement of
Intent The directors have closely monitored the Wanganui District Council’s investment in Wanganui Gas Limited, with the Chairman of WDCHL sitting on the Wanganui Gas Limited’s Board. The Board has facilitated the continuance of the Council’s investment with variances to performance targets being monitored.

Wanganui District Council Annual Report for the year ended 30 June 2012
Page 164 of 170
Objectives
• The company aims to improve the long term value and financial return that WDC receives from its trading undertakings.
Wanganui Gas Limited has reported an improved financial performance over the financial year. WDCHL’s directors have continued to closely monitor the company’s progress and have aggressively advised on implementing new income streams and have taken advantage of risk mitigating courses of action.
• Optimise financial and physical resources through close scrutiny of potential areas of inefficiency, waste or under–utilisation of capital.
The Directors all have extensive and varied commercial experience which when combined provides a wide set of skills that can provide solutions to issues of inefficiency or under-utilisation of capital. This has been evidenced by our involvement in the shell rock venture at Waitaihanga, and working alongside Iwi to co-develop the shell rock reserve at Kaiwhiaki.
• Provide prudent management of investments and timely, constructive professional advice regarding its position as shareholder in Wanganui Gas Limited, and any other subsidiary companies or undertakings.
The Chairman of WDCHL sits on the Wanganui Gas Limited’s Board. This has provided for timely involvement in the company and in the management of Council’s investment. In addition, WDCHL’s directors sit on the Airport Management Board, worked along side external contractors with the Forestry portfolio, worked along side WDC staff with regard to property matters, including monitoring the newly acquired Port operations, and investigated new commercial projects such as property development opportunities, shell rock extraction agreements.
• Meet the expectations of WDC for quality, competitively priced strategic planning advice on investments and trading undertakings.
The Board has met monthly to discuss its portfolio performance and the Chairman has reported to Council every meeting to update the Council on matters.
• Review and advise on the strategies and plans of any subsidiary company, business unit or asset as requested by WDC.
Board meetings are held on a monthly basis and include the Chief Executive of the Council which enables open communication regarding matters concerning the Council. Monthly Board papers include reports on each area under WDCHL’s governance portfolio.
• Be a good corporate citizen and exercising the appropriate level of social responsibility toward the community and the environment, consistent with the conduct of a sustainable and profitable business.
WDCHL’s Directors are experienced directors who have had significant training and experience in the operations of a Board and the concept of governance. The directors are aware of the “wellbeings” as defined by the Local Government Act 2002 and carry out their decision making with the benefits to the ratepayers of the Wanganui District in the forefront.

Wanganui District Council Annual Report for the year ended 30 June 2012
Page 165 of 170
Wanganui Gas Limited Actual
2010/11
Budget
2011/12
Actual
2011/12
Net surplus/(deficit) after tax and subvention payment to average ordinary shareholders funds
13.5% 13.1% 17.1%
Earnings before interest and tax to average Assets. 9.4% 9.8% 10.3%
Statement of Intent
Wanganui Gas Limited (the company) is a Council Controlled Trading Organisation established under the Local Government Act 2002. The Statement of Intent for 2011/12 sets out the overall intentions and objectives of Wanganui Gas Limited for the two financial years beginning 1 July 2011.
Objectives
The Directors intend that the Company operate as a successful business and be at least as profitable and efficient as other energy companies. The Company aims to achieve a reasonable rate of return from its subsidiary companies (GasNet Limited and Energy Direct NZ Limited) and to provide a satisfactory dividend to its shareholder after retaining adequate earnings for future business requirements. Activities
The Company's core businesses are those of providing gas traders with safe, efficient and reliable gas distribution services through the Company's networks and the retailing of energy to our customers. Performance targets and assessment
The performance of the Company will be judged against the following measures: Strategic Plan
Develop and annually review an outline on the future direction of the Company and the strategies required to achieve it. Reporting
To provide timely monthly reports to management and the Shareholder covering the trading activities undertaken by the Company. To provide an unaudited interim financial statement for the six months to 31 December to the Shareholder by the end of February. To provide an audited Annual Report to the Shareholder by the end of September.

Wanganui District Council Annual Report for the year ended 30 June 2012
Page 166 of 170
Wanganui Airport Joint Venture (WAJV) The primary objectives of the airport operation are to: • Provide high quality facilities and service commensurate with existing levels of aviation activity and
in accordance with all the appropriate Acts, Regulations and Rules pertaining to airport and aviation operations in line with the size of Wanganui Airport.
• Operate the airport in a sound and business like manner. • Improve the long term value and financial performance of the airport while improving the economic
value of the airport to Wanganui. The objectives of the Wanganui Airport Joint Venture for this financial year and the following two financial years are clearly specified in the statement of intent which was approved by the joint partners. These objectives are listed below with the relevant targets and measure(s) of performance, and the performance achieved during the financial year. Objective Operate the airport in a sound and business like manner. Performance measure Reduction of the current loss position to ‘break even’ or to a level acceptable to Council in light of the CCO's economic value to Wanganui. Achievement
2009 2010 2011 2012Net Profit/(Loss) -208,000 -133,000 -25,000 -136,000 The airport was operated in a business like manner. Cost control was a major focus again this year. The deficit of $25,000 in 2011 was after revaluation surpluses of $181,000. Excluding these revaluations surpluses, the deficit has improved in 2012 compared to last year and is acceptable to the Joint Venture partners. Objective Provide high quality facilities and service commensurate with existing levels of aviation activity and in accordance with all the appropriate Acts, Regulations and Rules pertaining to airport and aviation operations of the size of Wanganui Airport. Performance measure Compliance with all aspects of Part 139 of Civil Aviation Rules with a minimum of one requirement per inspection. Achievement Full compliance with Civil Aviation Rules Part 139 was achieved. Objective Improve the long term value and financial performance of the airport along with improving the economic value of the airport to Wanganui. Performance measure Delivery of an activity plan and subsequent achievement of the individual targets outlined within that plan. Achievement Although the deficit exceeded that outlined in the business plan, the deficit before revaluation surpluses has improved compared to last year. The Joint Partners continue to investigate ways of improving revenue streams as well as controlling costs. Positive development continues with the direction being taken by the airport aimed at increasing user satisfaction.

Wanganui District Council Annual Report for the year ended 30 June 2012
Page 167 of 170
Wanganui Incorporated (WINC) The objective of Wanganui Incorporated is to improve the co-ordination of economic development and promotional agencies in Wanganui and to align relevant programmes and capabilities with Council in order to deliver on the Economic Development Strategy. Council brought many activities in house on 1 July 2007 however this charitable trust works in tandem with the Council’s economic development activity. Key performance targets are measured and reported as part of the Council’s Statements of Service Performance. Ruapehu, Wanganui, Rangitikei Regional Economic Development Trust (RED Trust) The objective of the Ruapehu, Wanganui, Rangitikei Regional Economic Development Trust is the promotion and implementation of regional development initiatives that may be identified by the trustees or the community in general, that benefit communities within New Zealand but primarily within the territorial authority districts of Ruapehu, Wanganui and Rangitikei. The Trust was established on 4 May 2006. The Ruapehu, Wanganui, Rangitikei Regional Economic Development Trust (RED Trust) has been exempted according to section 7 of the Local Government Act 2002 (the Act). It is therefore not a Council Controlled Organisation for the purposes of the Act. Cooks Gardens Trust Board The Cooks Gardens Trust Board was initially established to undertake the development of Cooks Gardens including construction of a new all-weather athletics track, a new velodrome and a new grandstand. With the community investment in this facility, Council believes the use of the facility should be as high as possible while not causing excessive wear or damage to the assets. Cooks Gardens is a premier sporting facility and the Trust has met the Council objectives of developing the facility and increasing its use. The Cooks Gardens Trust Board has been exempted according to section 7 of the Local Government Act 2002 (the Act). It is therefore not a Council Controlled Organisation for the purposes of the Act. Whanganui River Enhancement Charitable Trust The purposes of the Whanganui River Enhancement Charitable Trust are to promote the enhancement of the quality of the waters and catchment of the Whanganui River; to encourage other parties to promote the enhancement of the quality of the waters and catchment of the Whanganui River; to make funds available to allow river enhancement projects (social, economic and environmental) to be undertaken; to contribute to public education about the health and wellbeing of the Whanganui River; and to assist in the education of students engaged in full-time tertiary study, where that study is relevant to the Whanganui River. Although Council appoints two of the six Trustees (two also appointed by Ruapehu District Council) they do not exercise significant influence over the Trust. Genesis contributes all revenue, and provides management and accounting personnel. The life of the Trust is linked to the resource consents of Genesis’s Tongariro Power Development. The Whanganui River Enhancement Charitable Trust has been exempted according to section 7 of the Local Government Act 2002 (the Act). It is therefore not a Council Controlled Organisation for the purposes of the Act.

Wanganui District Council Annual Report for the year ended 30 June 2012
Page 168 of 170
Sarjeant Gallery Trust Board The purpose of the Sarjeant Gallery Trust Board is to promote and foster the interests of the Wanganui Sarjeant Gallery and the interests of Wanganui’s art and artists. The Wanganui Sarjeant Gallery provides a nationally recognised art experience for both residents of Wanganui and visitors. In addition to providing up-to-date exhibitions, it facilitates educational talks and forums, as well as providing artists a platform for displaying local art. The Sarjeant Gallery Trust Board has been exempted according to section 7 of the Local Government Act 2002 (the Act). It is therefore not a Council Controlled Organisation for the purposes of the Act. Manawatu-Wanganui Local Authority Shared Services Limited (MW LASS Ltd) MW LASS Ltd was formed in October 2008 to provide an ‘umbrella vehicle’ for the councils of the Manawatu-Wanganui region to investigate, procure, develop and deliver shared services. Such services will be initiated under the umbrella of MW LASS Ltd where a business case shows that they provide benefits to the council users by either improved levels of service, reduced costs, improved efficiency and/or increased value through innovation. Current feasibility studies being undertaken include GIS, Aerial photography and Joint procurement.

Wanganui District Council Annual Report for the year ended 30 June 2012
Page 169 of 170
Equal employment opportunities (EEO) report Over the past year the attainment of EEO goals has been sought through:
Making EEO information more readily available on the intranet, policies and through discussions of matters that impacted on our EEO policy and goals at senior management meetings, staff committee meetings and the union/employer working party meetings.
Giving staff the opportunity to express their views through the annual staff survey and
addressing issues that arose.
Having in place an Employees Assistance Programme which included: Staff support procedures which were adopted to assist employees to resolve concerns and
difficulties before they became costly in terms of personal distress or work efficiency. Access to an independent counselling service.
Adopting health and safety initiatives and supporting wellness programmes through:
Appointing a Health and Safety Officer. Reviewing, rewriting, endorsing and implementing the current health and safety policy and
procedure manual. The establishment of an independent staff health and safety committee. The continuance of the influenza inoculation programme which was extended to provide
alternative anti-flu medications. The subsidisation of fees programme for medical health and eye checks. The continuation of the conduct of Treaty of Waitangi training seminars for all newly
appointed staff.

Wanganui District Council Annual Report for the year ended 30 June 2012
Page 170 of 170
Working with Maori The Wanganui District Council continues to meet separately with two of the Atihaunui-A-Paparangi Runanga, Tupoho and TamaUpoko, on a six-weekly basis as per our relationship documents. Nine Tamaupoko Link meetings and eight Tupoho Working Party meetings took place during the 2011/12 year. Iwi, the Council and the Crown continued administration of Moutoa Gardens / Pakaitore through the Pakaitore Historic Reserve Board. Six meetings and the AGM were held during the year. Although relationship documents have not been developed with the two adjoining Iwi, Nga Rauru and Ngati Apa, contact has continued on an as-required basis. Council employs an Iwi Liaison officer on a halftime contract basis. Officers continue to carry out consultation with Iwi on specific issues.


