annual results for the fiscal year ended march 31, …annual results for fy 2016 180 207 208 183 184...
TRANSCRIPT

Annual Results for FY 2016
URL: http://www.exeo.co.jp/overseas/index.html
Annual Results for the Fiscal Year Ended March 31, 2017 (FY 2016)
May 10, 2017
Building a better, brighter future together Total ICT Solutions:
Contributing to the Realization of a Brighter Future by Bringing People Together and Forming Connections with Society
Annual Results for FY 2016 -1-
Contents
1. Overview of FY16 Results ・・・2
(1) Performance Figures ・・・3
(2) Orders Received ・・・4
(3) Net Sales ・・・5
(4) Operating Income ・・・6
(5) Cash Flow ・・・8
2. Plans for FY17 ・・・9
(1) Medium-Term Forecast for Projects ・・・10
(2) Performance Figures ・・・11
(3) Orders Received and Net Sales ・・・12
(4) Operating Income ・・・14
(5) Investment Trends of Major Telecom Carriers ・・・15
(6) NTT Group (Access/Network) ・・・16
(7) NTT Group (Mobile) ・・・17
(8) NCCs ・・・18
(9) Urban Infrastructure ・・・19
(10) SYSTEM-SOLUTIONS ・・・20
(11) Improved Productivity ・・・27
3. Raising Shareholders’ Value ・・・30
(1) Payment of Dividends ・・・31

Annual Results for FY 2016 -2-
1. Overview of FY16 Results
(1) Performance Figures
(2) Orders Received
(3) Net Sales
(4) Operating Income
(5) Cash Flow

Annual Results for FY 2016
FY15 FY16 FY16
Actual Plan Actual YOYCompared to
plan
A B C C/A C/BOrders received 300.4 305.0 324.1 108% 106%
Net sales 287.4 300.0 298.8 104% 100%(12.5%) (12.5%) (12.9%)
35.7 37.6 38.4 108% 102%(6.0%) (5.9%) (5.9%)
17.3 17.6 17.6 101% 100%(6.4%) (6.7%) (7.0%)
18.4 20.0 20.8 113% 104%(6.4%) (6.7%) (7.2%)
18.5 20.2 21.4 116% 106%(4.2%) (4.4%) (4.6%)
12.1 13.3 13.7 113% 104%Net income
Ordinary income
Gross profit
Operating income
SG&A expenses
-3-
(1) Performance Figures
■ Overview of FY16 results (consolidated)
Notes: All amounts less than ¥100m are disregarded. Figures in parentheses are ratio to net sales.
1. Overview of FY16 Results
(¥bn)
◆ Orders received, sales and profits all increased due to strong orders received from telecom carriers ◆ Net sales were in line with the plan, but operating income hit a new high

Annual Results for FY 2016
1. Overview of FY16 Results (2) Orders Received
■ YOY (consolidated) ■ Compared to plan (consolidated) (¥bn)
○Reason for increase ●Reason for decrease Note: All amounts less than ¥100m are disregarded.
-4-
FY16 Plan FY16 ActualFY15 Actual FY16 Actual
○ Access ○ Network ○ Mobile
+23.7
NCCs +8.5
300.4
324.1 Urban Infrastructure +0.4
〇 NI ● SI
SYSTEM-SOLUTIONS
+0.3
SYSTEM-SOLUTIONS
-5.8
+19.1
305.0
324.1
NTT Group +34.2
NCCs +4.7
Urban Infrastructure
-14.3
○ Access
○ Network
○ Mobile
○ Civil engineering ●Telecommunications facilities ● Electricity supply ● Waste-treatment plants
● SI ● NI
NTT Group +14.3
○Telecommunications facilities ○ Civil engineering ● Electricity supply ● Waste-treatment plants
◆ Up YOY due to rises in all segments, particularly orders received from NTT Group ◆ Grew at a sluggish pace in Urban Infrastructure and SYSTEM-SOLUTIONS, but increased compared to the plan, thanks to strong orders received from telecom carriers

Annual Results for FY 2016
1. Overview of FY16 Results (3) Net Sales
■ YOY (consolidated) ■ Compared to plan (consolidated) (¥bn)
○Reason for increase ●Reason for decrease Note: All amounts less than ¥100m are disregarded.
-5-
FY15 Actual FY16 Actual FY16 Plan FY16 Actual
+11.4
NTT Group +7.8
NCCs +0.1
287.4
Urban Infrastructure
+1.6
〇 SI 〇 NI
SYSTEM-SOLUTIONS
+1.9
○ Access ○ Mobile
○Telecommunications facilities ○ Electricity supply ● Waste-treatment plants
298.8
-1.2
300.0 298.8
SYSTEM-SOLUTIONS
-2.3
NTT Group +13.3
NCCs -0.7
Urban Infrastructure
-11.7
○ Access ○ Mobile
●Telecommunications facilities ● Electricity supply ● Civil engineering ● Waste-treatment plants
● SI ● NI
◆ Up YOY due to increases in all segments ◆ Almost in line with the plan as sales to telecom carriers saw a recovery in sluggish growth in Urban Infrastructure and SYSTEM-SOLUTIONS
Annual Results for FY 2016
FY16 Plan FY16 Actual
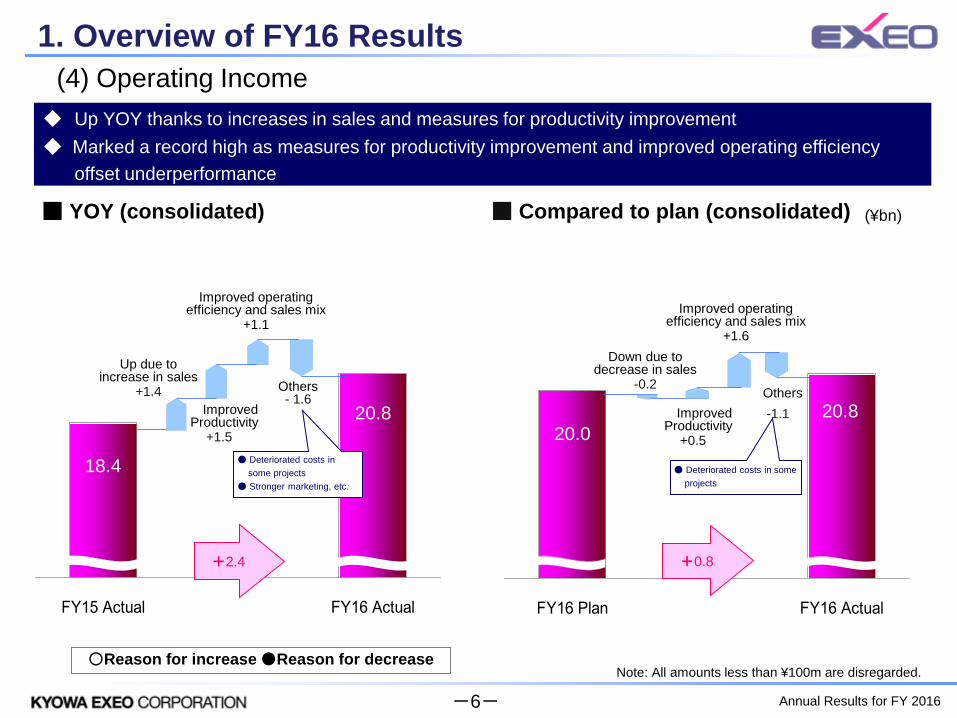
1. Overview of FY16 Results (4) Operating Income
■ YOY (consolidated) ■ Compared to plan (consolidated) (¥bn)
○Reason for increase ●Reason for decrease Note: All amounts less than ¥100m are disregarded.
-6-
FY15 Actual FY16 Actual
18.4
20.8
+2.4
Up due to increase in sales
+1.4 Improved
Productivity +1.5 20.0
+0.8
20.8
Down due to decrease in sales
-0.2 Others -1.1
● Deteriorated costs in some projects
Others - 1.6
● Deteriorated costs in some projects ● Stronger marketing, etc.
Improved operating efficiency and sales mix
+1.1 Improved operating
efficiency and sales mix +1.6
Improved Productivity
+0.5
◆ Up YOY thanks to increases in sales and measures for productivity improvement ◆ Marked a record high as measures for productivity improvement and improved operating efficiency offset underperformance
Annual Results for FY 2016
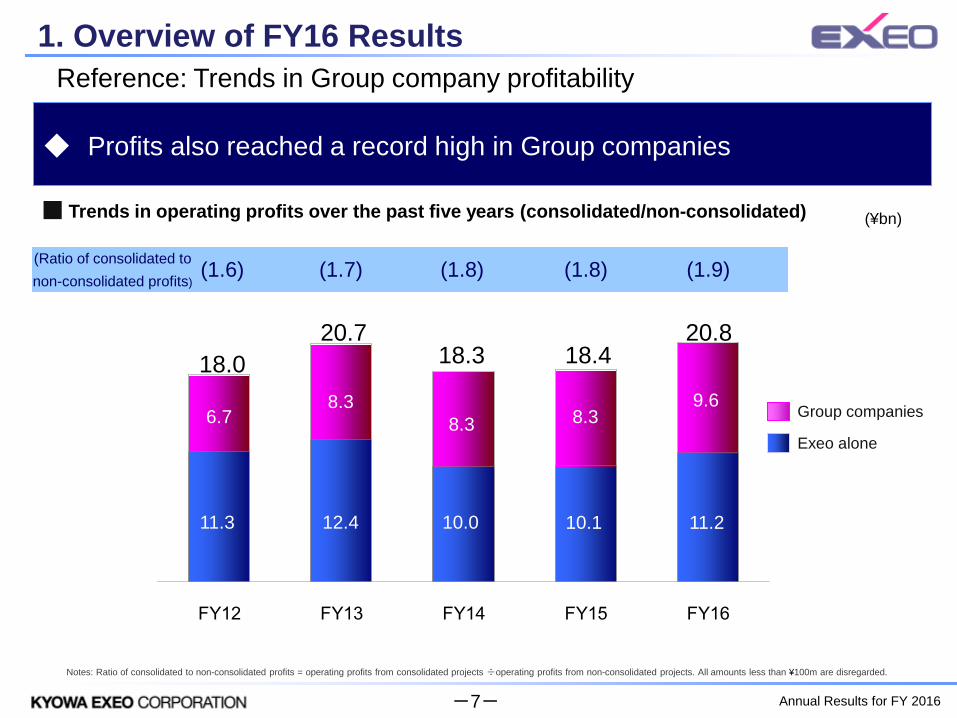
180
207 208
184183
FY12 FY13 FY14 FY15 FY16
6.7
12.4
8.3 8.3 9.6
1. Overview of FY16 Results Reference: Trends in Group company profitability
■ Trends in operating profits over the past five years (consolidated/non-consolidated)
(1.6) (1.7) (1.8) (1.8) (1.9)
(¥bn)
(Ratio of consolidated to non-consolidated profits)
Exeo alone
Group companies
Notes: Ratio of consolidated to non-consolidated profits = operating profits from consolidated projects ÷operating profits from non-consolidated projects. All amounts less than ¥100m are disregarded.
-7-
11.3
8.3
10.0 10.1 11.2
◆ Profits also reached a record high in Group companies
18.0 20.7
18.3 18.4 20.8
Annual Results for FY 2016
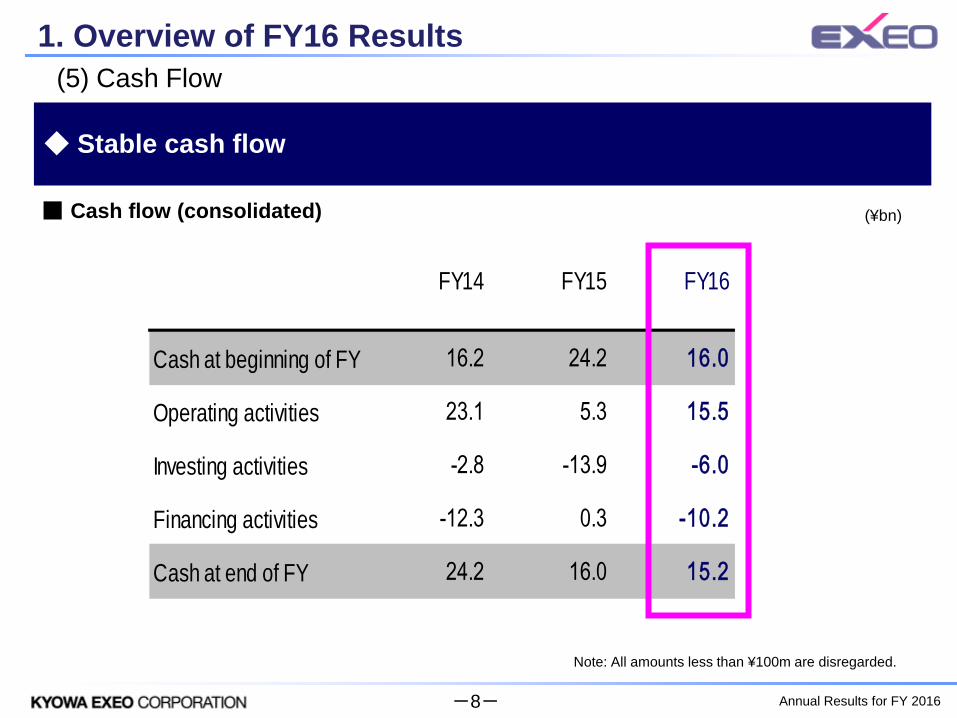
◆ Stable cash flow
1. Overview of FY16 Results
(5) Cash Flow
FY14 FY15 FY16
Cash at beginning of FY 16.2 24.2 16.0
Operating activities 23.1 5.3 15.5
Investing activities -2.8 -13.9 -6.0
Financing activities -12.3 0.3 -10.2
Cash at end of FY 24.2 16.0 15.2
■ Cash flow (consolidated)
Note: All amounts less than ¥100m are disregarded.
(¥bn)
-8-

Annual Results for FY 2016
(1) Medium-Term Forecast for Projects
(2) Performance Figures
(3) Orders Received and Net Sales
(4) Operating Income
(5) Investment Trends of Major Telecom Carriers
(6) NTT Group (Access/Network)
(7) NTT Group (Mobile)
(8) NCCs
(9) Urban Infrastructure
(10) SYSTEM-SOLUTIONS
(11) Improved Productivity
2. Plans for FY17
-9-

Annual Results for FY 2016
0
500
1,000
1,500
2,000
2,500
3,000
3,500
4,000
FY14 FY15 FY16 FY17 FY18 FY19 FY20
SYSTEM-SOLUTIONS
UrbanInfrastructure
NCCs
NTT Group(Mobile)
NTT Group(Access/Network)
(1) Medium-Term Management Plan (FY16–FY20) : Concept of Growth
■700 MHz ■5th generation
■SB FY16–17PJ ■KDDI synchro
■ Railway communication (New Haneda Line, etc.) 700 MHz Band TV reception measures
■Shift to CATV FTTH (8K-compatible)
■Response to inbound (cameras, signage, etc.)
Vietnam projects
ODA projects in Southeast Asia HEMS, Smart meters Data Center Project
■ NTT maintenance expansion
KDDI synchro (Hokkaido)
Public projects (NEXCO, disaster
prevention wireless etc.)
Response to aging public infrastructure (Waste-treatment plants, water and sewage, etc.)
■Reduction of above-street wiring ■Tokyo redevelopment work
Philippines Project
◇IoT solutions
◇Geo solutions (Mesh Beacon)
◇New energy (Energy Viewer) ◇ MS Cloud
New solutions
■ Maintenance of aging facilities accompanying measures for easing burden for ensuing years
■ Hikari collaboration
Expand engineering peripheral businesses by combining existing technologies and services Provide total solutions to ICT and IoT-related business Expand business through M&A and alliances
(¥bn)
400
350
300
250
200
150
100
50
Indoor Project
2. Plans for FY17
Start of Medium-Term Management Plan
■LTE-Advanced
Overseas projects
-10-

Annual Results for FY 2016
2. Plans for FY17 (2) Performance Figures
■ Plans for FY17 (consolidated)
FY17Plan YOY
A B B/AOrders received 324.1 330.0 102%
Net sales 298.8 320.0 107%(12.9%) (12.9%)
38.4 41.3 107%(5.9%) (5.7%)
17.6 18.3 104%(7.0%) (7.2%)
20.8 23.0 110%(7.2%) (7.4%)
21.4 23.6 110%(4.6%) (4.9%)
13.7 15.7 114%
FY16Actual
Gross profit
SG&A expenses
Operating income
Ordinary income
Net income attributableto ow ners of parent
Notes: All amounts less than ¥100m are disregarded. Figures in parentheses are ratio to net sales.
(¥bn)
◆ Targeting record high sales and profits backed by a wealth of ongoing
construction jobs
-11-
Annual Results for FY 2016
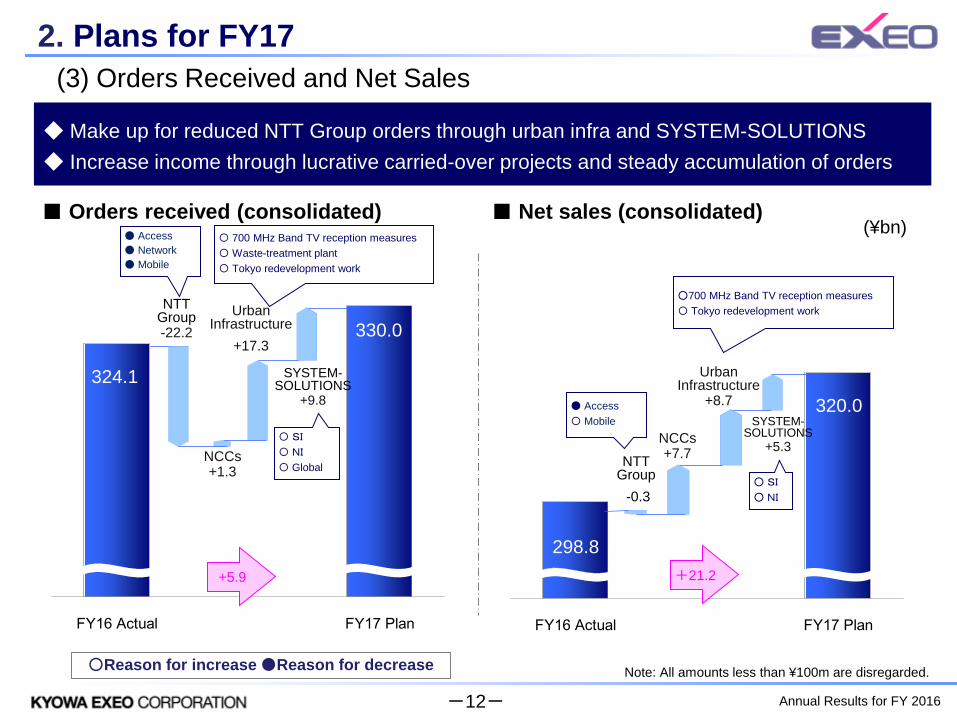
2. Plans for FY17 (3) Orders Received and Net Sales
■ Orders received (consolidated) ■ Net sales (consolidated) (¥bn)
○Reason for increase ●Reason for decrease Note: All amounts less than ¥100m are disregarded.
-12-
◆ Make up for reduced NTT Group orders through urban infra and SYSTEM-SOLUTIONS ◆ Increase income through lucrative carried-over projects and steady accumulation of orders
FY16 Actual FY17 PlanFY16 Actual FY17 Plan
+5.9
330.0
324.1
NTT Group -22.2
NCCs +1.3
Urban Infrastructure
+17.3
〇 SI 〇 NI 〇 Global
SYSTEM-SOLUTIONS
+9.8
● Access ● Network ● Mobile
〇 700 MHz Band TV reception measures 〇 Waste-treatment plant 〇 Tokyo redevelopment work
298.8
320.0
NTT Group -0.3
NCCs +7.7
Urban Infrastructure
+8.7 SYSTEM-
SOLUTIONS +5.3
● Access 〇 Mobile
○700 MHz Band TV reception measures 〇 Tokyo redevelopment work
○ SI ○ NI
+21.2

Annual Results for FY 2016
FY13 FY14 FY15 FY16 FY17
2. Plans for FY17 Reference: Status of projects carried over
■ Balance of projects carried over to next period by fiscal year (consolidated)
Note: All amounts less than ¥100m are disregarded.
-13-
(¥bn)
◆ Projects carried over increase significantly and reach an all-time high
117.9 118.3
103.7 105.4
143.5
Annual Results for FY 2016
FY16 Actual FY17 Plan
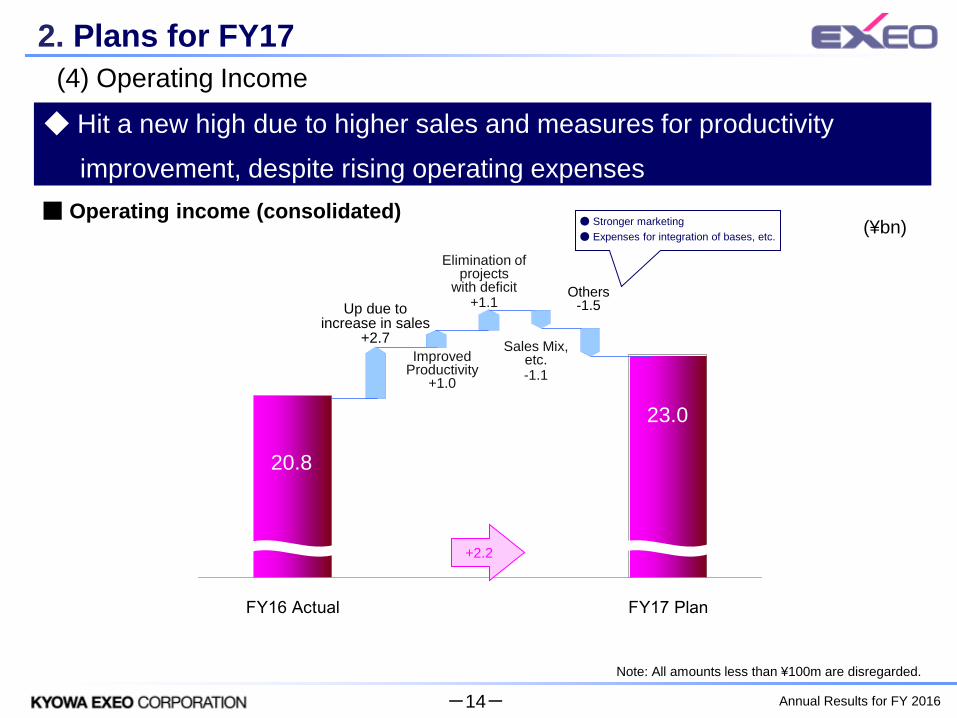
2. Plans for FY17 (4) Operating Income
■ Operating income (consolidated)
Note: All amounts less than ¥100m are disregarded.
-14-
(¥bn)
◆ Hit a new high due to higher sales and measures for productivity
improvement, despite rising operating expenses
Up due to increase in sales
+2.7
Others -1.5
20.8
+2.2
23.0
Improved Productivity
+1.0
● Stronger marketing ● Expenses for integration of bases, etc.
Elimination of projects
with deficit +1.1
Sales Mix, etc. -1.1

Annual Results for FY 2016
739.4
583.7
412.5320.5 TBA
FY13 FY14 FY15 FY16 FY17 Plan
263.0 224.0177.0 156.0 153.0
583.4 547.9
690.7626.6
510.0
FY13 FY14 FY15 FY16 FY17 Plan
Optical fiber
387.8 406.7 365.4
570.0661.8
703.1
597.1595.2
FY13 FY14 FY15 FY16 FY17 Plan
合計 LTE-related
571.8667.7
344.3
479.1
338.0 325.0 330.0
530.0519.4531.4
FY13 FY14 FY15 FY16 FY17 Plan
合計 Mobile
(5) Investment Trends of Major Telecom Carriers ■ NTT East/West
■ KDDI ■ SoftBank
■ NTT DoCoMo (¥bn)
(Source: Figures released by the telecommunications carriers)
Notes: FY13 figures is totals for mobile and fixed-line communications.
FY14 or later give figures for domestic communications business.
2. Plans for FY17
Note: Trends in FY14 or later include UQ mobile.
On Japanese standards in FY13, and on IFRS in the years after FY14.
-15-

Annual Results for FY 2016
0
5
10
(6) NTT Group (Access/Network)
■ Net sales of NTT Group (fixed-line network, consolidated)
■ NTT facilities management (fixed-line related) 【Net sales (consolidated)】
FY13 FY14 FY15 FY16 FY17 Plan
FY13 FY14 FY15 FY16 FY17 Plan
■ Trend in Number of FTTH Subscribers (Total of NTT East and West)
(Source: Created by Kyowa Exeo, based on NTT presentation material)
◆ The Hikari collaboration has resulted in continued demand for FTTH
◆ The Group as a whole is promoting measures for greater efficiency
(¥bn)
127.2
113.1 111.8 117.7 114.0
2. Plans for FY17
FY13 FY14 FY15 FY16 FY17 Plan
Flets Hikari 1,142
Collabo Hikari 854
469
1,457 1,845
27 1,805 1,872
1,926 1,996 2,076
10,000s of subscribers
-16-
(¥bn)
Annual Results for FY 2016
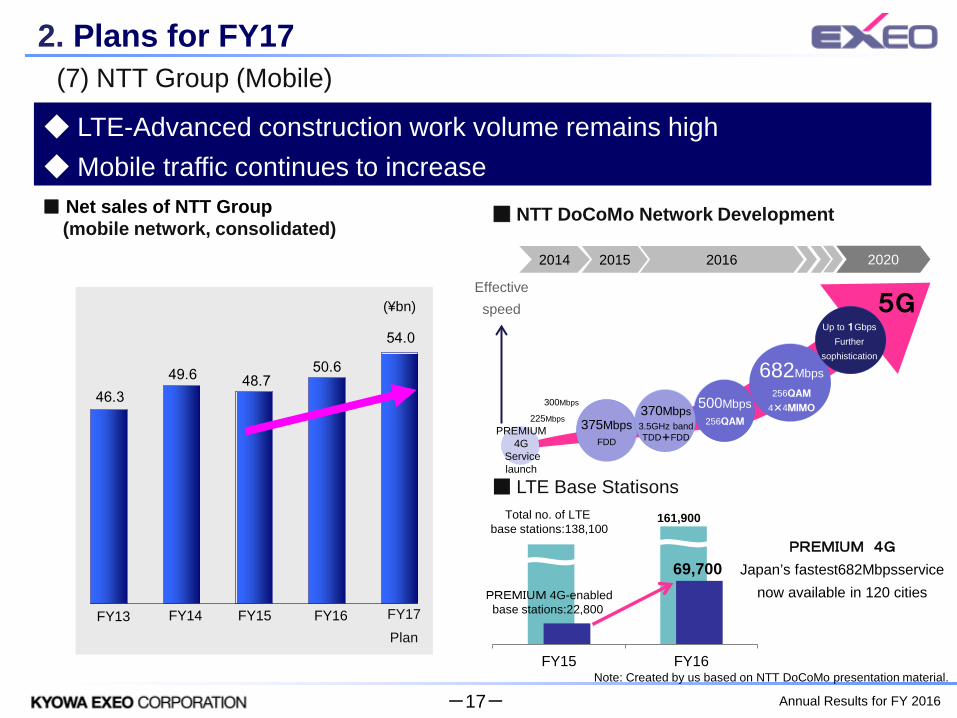
(7) NTT Group (Mobile)
■ Net sales of NTT Group (mobile network, consolidated)
◆ LTE-Advanced construction work volume remains high ◆ Mobile traffic continues to increase
■ NTT DoCoMo Network Development
■ LTE Base Statisons
2. Plans for FY17
2016 2020
Effective speed
2015 2014
225Mbps
500Mbps 256QAM
682Mbps 256QAM
4×4MIMO
Up to 1Gbps Further
sophistication
5G
300Mbps
PREMIUM 4G
Service launch
375Mbps FDD
370Mbps 3.5GHz band TDD+FDD
FY15 FY16
Total no. of LTE base stations:138,100
161,900
PREMIUM 4G-enabled base stations:22,800
69,700
Note: Created by us based on NTT DoCoMo presentation material.
54.0
50.648.749.6
46.3
FY13 FY14 FY15 FY16 FY17
Plan
PREMIUM 4G Japan’s fastest682Mbpsservice
now available in 120 cities
-17-
(¥bn)

Annual Results for FY 2016
31.0
23.323.2
36.6
44.1
FY13 FY14 FY15
◆ Orders received in Hokkaido area surge by winning orders for a combination of construction and maintenance of KDDI facilities ◆ Construction jobs for traffic are proceeding at full pace
(8) NCCs
(¥bn)
■ Net sales of NCCs (consolidated) ■ Trial consolidation of KDDI construction and maintenance orders
FY16 FY17
Plan
[Value of orders received in Hokkaido area] In FY 2016, it started with Hokkaido.
EXEO orders
2. Plans for FY17
FY15 FY16
■ Planned number of specified base stations with 3.5GHz
0
10000
20000
30000
40000
50000
16/3 17/3 18/3
SBM
KDDI 4,188
15,471
40,004
Note: Created by us based on documents from the Telecommunications Bureau of the Ministry of Internal Affairs and Communications
-18-
Annual Results for FY 2016
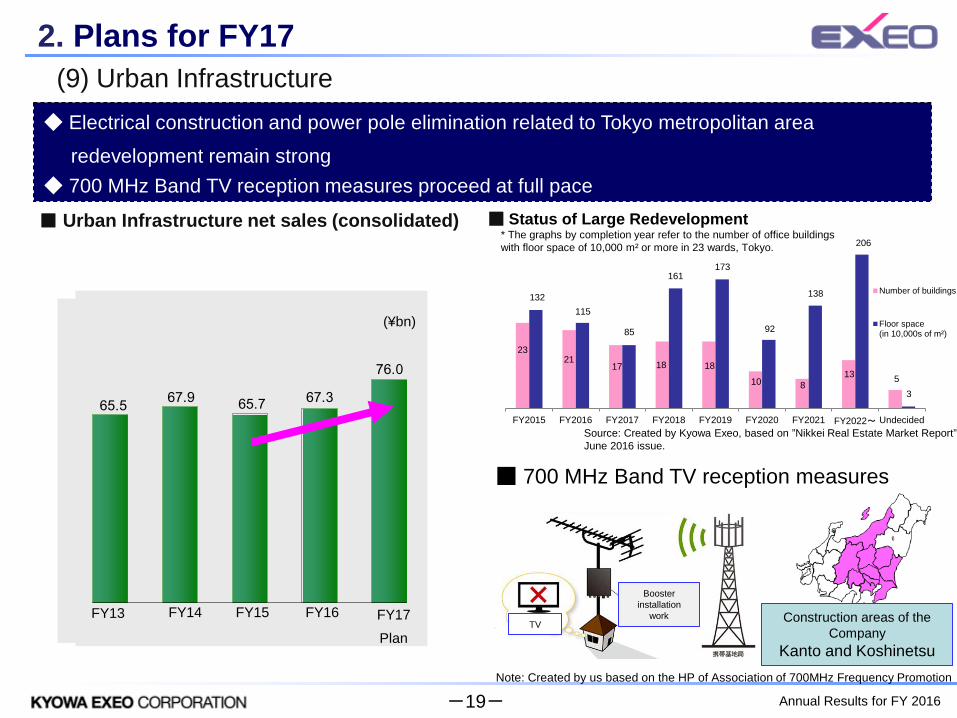
◆ Electrical construction and power pole elimination related to Tokyo metropolitan area
redevelopment remain strong ◆ 700 MHz Band TV reception measures proceed at full pace
(9) Urban Infrastructure
■ Urban Infrastructure net sales (consolidated)
(¥bn)
FY12 FY13 FY14 FY15 FY16 Plan
FY2015 FY2016 FY2017 FY2018 FY2019 FY2020 FY2021 FY2022~ Undecided
Number of buildings
Floor space(in 10,000s of m²)
23
132
21 17 18 18
10 8 13 5
115
85
161 173
92
138
206
3
■ Status of Large Redevelopment * The graphs by completion year refer to the number of office buildings with floor space of 10,000 m² or more in 23 wards, Tokyo.
Source: Created by Kyowa Exeo, based on ”Nikkei Real Estate Market Report” June 2016 issue.
2. Plans for FY17
76.0
67.365.767.965.5
FY13 FY14 FY15 FY16 FY17
Plan
■ 700 MHz Band TV reception measures
Construction areas of the Company
Kanto and Koshinetsu
Booster installation
work
Note: Created by us based on the HP of Association of 700MHz Frequency Promotion
TV
-19-
(¥bn)

Annual Results for FY 2016
(10) SYSTEM-SOLUTIONS
■ SYSTEM-SOLUTIONS net sales (consolidated)
FY13 FY14 FY15 FY16 FY17 Plan
(¥bn)
◆ Expand BPM Solutions Business ◆ Focus on new solutions such as IoT and cloud
2. Plans for FY17
45.0
39.737.8
33.635.2
Identification of issues
Process analysis Automation of tests
CA Technologies
Consulting business
■ Expansion of BPM Solutions Business
Visualization of redundant processes
Promotion of introduction of BPM
Develop
-20-

Annual Results for FY 2016
0123456
FY16 FY17 Plan0123456
FY16 FY17 Plan
0123456
FY16 FY17 Plan0123456
FY16 FY17 Plan
Reference: Performance and future initiatives of new solutions
・ Mesh-type beacon network solutions (indoor positioning infrastructure/sensor
network) ・ Guide application (tourism/disaster)
・ Energy management service ・ Transportable lithium battery ・ Smart meter
・ Okinawa ・ International, etc.
・ Thin client/virtual field ・ Security infrastructure ・ Educational apps
Cloud/security field
Solutions field Global, other
New energy field ¥1.3bn
¥5.6bn
¥0.2bn ¥1.2bn
¥2.6bn ¥3.2bn
¥5.1bn
¥13.0bn Orders Received
¥3.0bn ¥1.4bn
・Expand business in the Philippines ・Participate in business in Vietnam ・Overseas infrastructure projects
Launched survival power supply (March 2016) Started supplying cloud services to new power businesses (July 2016)
Development of EXBeacon: Begin commercializing mesh-type beacon network (Construction site/office) EXTravel: Released in 2016 Oyama Meguri Guide,
Yamanouchi Navi
・Cloud integration engineering in partnership with Microsoft -Enrichment of lineup of solutions in corporate communication and IoT fields, capital and business tie-up with Nextgen
2. Plans for FY17
0
2
4
6
8
10
12
14
16
FY16 FY17 Plan
Computerized parking space certification system
-21-

Annual Results for FY 2016
2. Plans for FY17
◆Energy management service for small and medium-sized corporations (high voltage small lot)
◆B2B2X business model. Middle B mainly targets electric power companies.
[Energy Viewer features] ■ Cost saving realized by one-stop services of EXEO covering equipment manufacturing to construction and operation ■ Energy saving without sacrificing amenities by monitoring room temperature ■ Always reduce electric consumption of air-conditioning through control 24 hours per day, 365 days per year. ■ Respond to all air-conditioning equipment manufacturers. The manufacturers’ warranty also continues.
<Benefits of introduction> ◇Customers (small and medium-sized corporations) Realization of energy saving with no impact on business, such as the maintenance of amenities and reduced burdens on employees due to automated control. ◇Electric power companies Added value such as acquiring customers in electric power selling and preventing withdrawal. Appeal of a power company with less expensive electricity, instead of a company with low unit price
Energy Viewer cloud
Cubicle High-voltage power receiving equipment
Distribution board
Temperature sensor
(Outdoor)
External air conditioning unit
External air conditioning unit
Visuali- zation
Implemen- tation Analysis
・ Electricity usage data ・ Temperature data ・ Control data
Option unit
Option unit
Contact connection
Temperature sensor (Indoor)
IPC device
GW device
CT sensor
Contact connection
Reference: Energy Viewer
-22-

Annual Results for FY 2016
Clo
ud In
tegr
atio
n En
gine
erin
g
Optical-fiber cable
・・
LTE
IoT-NW Unified communication/Thin clients
Clo
ud B
usin
ess
Exis
ting
Tele
com
mun
icat
ions
In
fras
truc
ture
Bus
ines
s
Optical-fiber cable
sensor
LTE
Internet
Carrier IP-NW PSTN Mobile
Cloud platform
Authentication Server
IoT processing
Azure
Groupware
Cloud PBX
Storage Big Data /Analysis
(1) State of activities Efforts for sound solutions for enterprises in collaboration with Microsoft
Japan (mainly consulting for small enterprises at the beginning) -Approx. 20 orders received, approx. 70 business deals in progress -Actual results: Assessment and partial introduction, etc. (leading transport companies, manufacturers and local core medical institutions, etc.) IoT
Visualize and analyze field engineering in real time by enhancing sensor networks including LPWA.
(2) Gained approval from Microsoft Japan (only 6 companies in Japan) Mar. 2017 Approved as Skype Operations Framework Offers Partner
(6 companies elected in Japan) (3) Capital and business tie-up with Nextgen Feb. 2017 Entered into a capital and business tie-up for the purpose
of improving the sound communications environment for enterprises.
(4) Train cloud engineers Train 2,000 Microsoft cloud engineers by 2019 (as of March 31, approx.
600 engineers had acquired qualifications). Train about 100 engineers to earn the high-level qualifications MCSE
Communication or MCSA Office365 (the largest number of engineers with such qualifications in Japan).
*Offer nationwide, unified, one-stop engineering, including cloud implementation alongside existing network engineering
Reference: Cloud Integration Engineering*
Development of the market for sound solutions for enterprises and the expansion of the IoT solutions lineup
2. Plans for FY17
-23-

Annual Results for FY 2016
Reference: Begin commercializing and providing mesh-type beacon network solutions
Example of introduction into construction site: Management of workers’ entrance, exit and locations
Number of persons currently staying inside 20 persons
6 persons 0 person 2 persons 2 persons
10 persons
0 person
10 persons
North
East
West
South
[Point 2] Enable the achievement of various objectives such as sensor network, indoor positioning infrastructure and remote monitoring and control with a single platform.
[Point 1] Provide the “Exbeacon platform” that combines the design and construction of a radio wave space in order to build an optimum network environment for each target facility.
Example of introduction into office: Management of employees’ sitting positions
Western warehouse East side warehouse
2. Plans for FY17
-24-
Annual Results for FY 2016
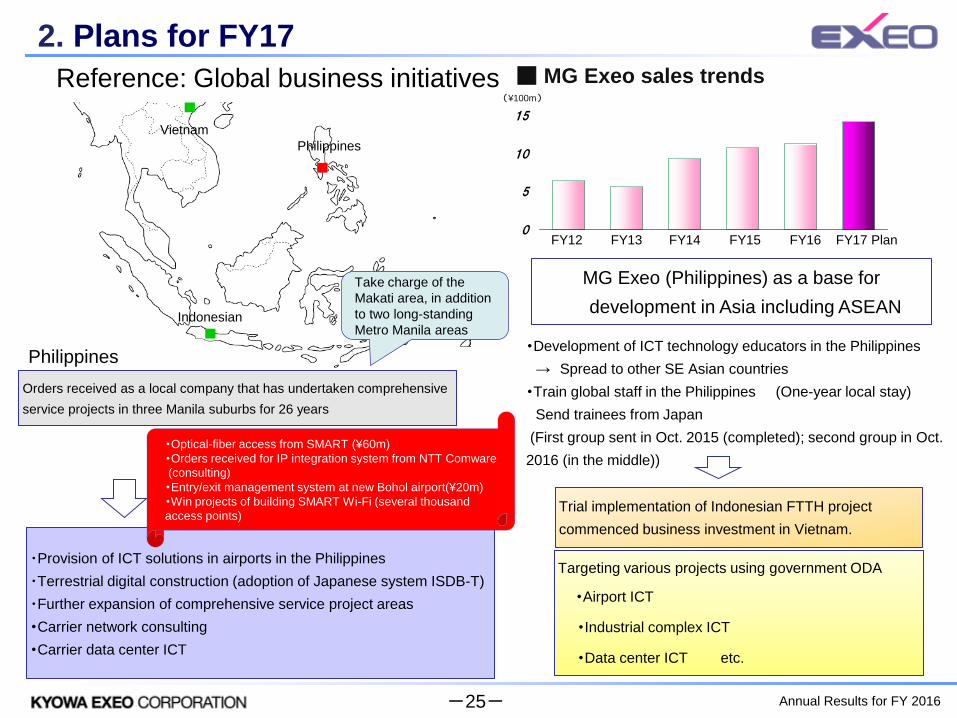
・Provision of ICT solutions in airports in the Philippines ・Terrestrial digital construction (adoption of Japanese system ISDB-T) ・Further expansion of comprehensive service project areas ・Carrier network consulting ・Carrier data center ICT
MG Exeo (Philippines) as a base for development in Asia including ASEAN
Philippines
Reference: Global business initiatives
・Development of ICT technology educators in the Philippines → Spread to other SE Asian countries ・Train global staff in the Philippines (One-year local stay) Send trainees from Japan (First group sent in Oct. 2015 (completed); second group in Oct. 2016 (in the middle))
FY12 FY14 FY15 FY16 FY17 Plan FY13
(¥100m)
■ MG Exeo sales trends
Philippines
・Optical-fiber access from SMART (¥60m) ・Orders received for IP integration system from NTT Comware (consulting) ・Entry/exit management system at new Bohol airport(¥20m) ・Win projects of building SMART Wi-Fi (several thousand access points)
2. Plans for FY17
0
5
10
15
Orders received as a local company that has undertaken comprehensive service projects in three Manila suburbs for 26 years
Take charge of the Makati area, in addition to two long-standing Metro Manila areas
Trial implementation of Indonesian FTTH project commenced business investment in Vietnam.
Targeting various projects using government ODA
・Airport ICT
・Industrial complex ICT
・Data center ICT etc.
Philippines Vietnam
Indonesian
-25-

Annual Results for FY 2016
Reference: Entry into the Vietnamese market 2. Plans for FY17
IBS Business: Abbreviation for In-Building System Business. It is a business model for receiving facility usage fees from telecom carriers by having multiple mobile operators use communications facilities such as shared antennas in a large building by constructing them on your own account.
As part of the measures for strengthening the overseas business, concluded an agreement to acquire shares of a new company of the IBS (In-Building System) Business in Vietnam.
Signing ceremony with a local partner C
ompan
y A
Com
pany B
Com
pany C
Mobile phone network
POI*
Shared antennas
* POI:Point of Interface
-26-

Annual Results for FY 2016
Impr
ovem
ent
Aims ¥1.5bn (cumulative ¥5.0bn)
¥1.0bn (cumulative ¥6.0bn)
¥1.0bn (cumulative ¥7.0bn)
¥1.0bn (cumulative ¥8.0bn)
Results ¥2.0bn (cumulative ¥7.0bn)
¥1.0bn (cumulative ¥8.0bn)
¥1.5bn (cumulative ¥9.5bn)
-
FY FY2014 FY2015 FY2016 FY2017 Plan
◆ FY16 targets achieved ◆ Continued measures to improve profits
(11) Improved Productivity
■ Enhanced profitability through cost reductions
Note: Amount of improvement represents cost reductions relative to FY10. ■ Recent principal measures
Area Measures
Functional
integration
◇Review of access, network, and engineering construction systems
◇Expansion of shared company work consignments
◇Group-wide unification of audits, MS tasks ◇Reorganization of Group access companies in Kanto area
◇Integrated cross-departmental systems ◇Improved business flow and systems through BPR
◇Construct common bases for system ◇Continue to improve business flow and systems through BPR
Reorganization
of Group
companies
◇Merger of subsidiary security companies ◇Merger of subsidiary access companies in Kansai/Chugoku regions
◇Merger of subsidiary mobile companies ◇Merger of subsidiary access companies in Tohoku region
◇Merger of major subsidiaries (WAKO and Ikeno) ◇Merger of subsidiary network companies
Consolidation of
bases
◇Sendai General Engineering Center (9 bases → 1) ◇Kagawa Technical Center (5 bases → 1) ◇Ishioka General Technical Center (4 bases → 1) ◇Koshin branches (5 bases → 1) ◇Hyogo General Technical Center (5 bases → 1)
◇Kansai branches (11 bases → 1)
*(planned for Oct. 2017)
◇Fujisawa Technical Center (2 bases → 1)
*(planned for Nov. 2017)
Resource
sharing
◇Resource shift to mobile/solutions area ◇Group-wide cross-sectional projects (mobile, 700 MHz TV reception measures, Data Centers, etc.)
2. Plans for FY17
-27-

Annual Results for FY 2016
2. Plans for FY17
Standardize cross-division operational processes as a common framework by BPR.
Develop systemization in series, including a new procurement system, for the purpose of increasing operating efficiency.
Reduce IT costs by eliminating redundant systems.
Paperless information sharing between desk and construction sites
Real-time in-house inspection through photo shooting by smartphone
Gain an understanding of the progress and utilization status at each site on the map.
Efficient safety patrol using GPS, etc.
■ Common base of systems
■ Increased operational efficiency by using IT
Reference: Measures for business improvement projects
-28-

Annual Results for FY 2016
2. Plans for FY17
■ Example of reducing overtime work through a work shift system at the technical center
Effect of reducing overtime work by up to four hours
per person per day
■ Certified as a Health and Productivity Management Organization
The Ministry of Economy, Trade and Industries certifies “corporations that work strategically on the health control of employees from a management perspective” as Health and Productivity Management Organizations for the purpose of visualizing them.
Reference: Measures for work style reform
-29-

Annual Results for FY 2016
3. Raising Shareholders’ Value
(1) Payment of Dividends
-30-
Annual Results for FY 2016
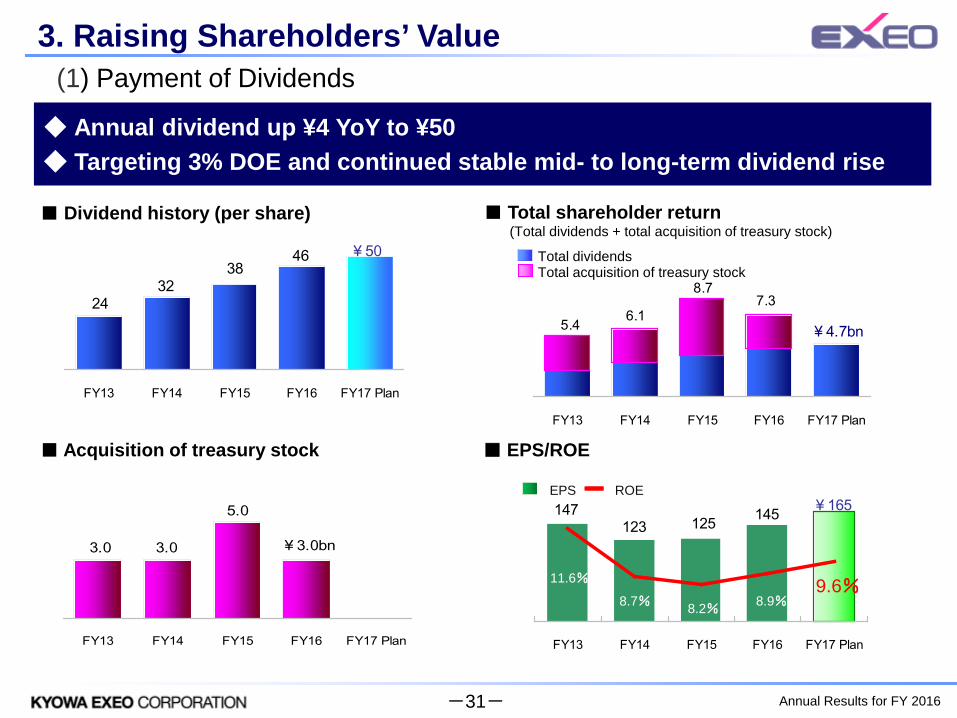
147125 145 ¥165
123
FY13 FY14 FY15 FY16 FY17 Plan
◆ Annual dividend up ¥4 YoY to ¥50 ◆ Targeting 3% DOE and continued stable mid- to long-term dividend rise
(1) Payment of Dividends
■ Dividend history (per share) ■ Total shareholder return (Total dividends + total acquisition of treasury stock)
Total dividends Total acquisition of treasury stock
EPS ROE
■ EPS/ROE ■ Acquisition of treasury stock
3. Raising Shareholders’ Value
¥504638
3224
FY13 FY14 FY15 FY16 FY17 Plan
¥4.7bn5.4 6.1
8.77.3
FY13 FY14 FY15 FY16 FY17 Plan
¥3.0bn
5.0
3.03.0
FY13 FY14 FY15 FY16 FY17 Plan
11.6%
8.2% 8.7% 8.9% 9.6%
-31-
Annual Results for FY 2016
Disclaimer Regarding Forward-Looking Statements
Management of the Company has made estimates and assumptions relating to financial forecasts based on information available as of the reporting date. Actual results could differ from those estimates.
3-29-20 Shibuya, Shibuya-ku, Tokyo 150-0002 JAPAN
http://www.exeo.co.jp/overseas/index.html
TEL: (81)3-5778-1073 FAX: (81)3-5778-1228
-32-