annual reviews click here to view this article's of cancer...
TRANSCRIPT

GE50CH16-Wu ARI 25 October 2016 10:24
Annu. Rev. Genet. 2016. 50:347–69
First published online as a Review in Advance onSeptember 28, 2016
The Annual Review of Genetics is online atgenet.annualreviews.org
This article’s doi:10.1146/annurev-genet-112414-054842
Copyright c© 2016 by Annual Reviews.All rights reserved
two stages of cancer evolution: Stage I is the evolution between tumors andnormal tissues, and Stage II is the evolution within tumors. The CancerGenome Atlas (TCGA) data show a low degree of convergent evolution inStage I, where genetic changes are not extensively shared among cases. Anequally important, albeit much less highlighted, discovery using TCGA datais that there is almost no net selection in cancer evolution. Both positive andnegative selection are evident but they neatly cancel each other out, render-ing total selection ineffective in the absence of recombination. The efficacyof selection is even lower in Stage II, where neutral (non-Darwinian) evo-lution is increasingly supported by high-density sampling studies (81, 123).Because natural selection is not a strong deterministic force, cancers usuallyevolve divergently even in similar tissue environments.
347
Click here to view this article'sonline features:
• Download figures as PPT slides• Navigate linked references• Download citations• Explore related articles• Search keywords
ANNUAL REVIEWS Further
∗Corresponding authors
The Ecology and Evolution of Cancer: The Ultra- Microevolutionary Process Chung-I Wu, 1,3,4, Hurng-Yi Wang, 2 Shaoping Ling,1,3
and Xuemei Lu3,
1 State Key Laboratory of Biocontrol, College of Ecology and Evolution, Sun Yat-Sen University, G uangzhou 510275, China; email: [email protected] Graduate Institute of Clinical Medicine and Hepatitis Research Center, National Taiwan University and Hospital, Taipei 106, Taiwan; email: [email protected] CAS Key Laboratory of Genomic and Precision Medicine, Beijing Institute of Genomics, Chinese Academy of Sciences, Beijing 100101, China; email: [email protected] Department of Ecology and Evolution, U niversity of Chicago, Chicago, Illinois 60637; email: [email protected]
Keywords
cancer evolution, natural selection, convergent evolution, cell population genetics, intratumor heterogeneity
Abstract
Although tumorigenesis has been accepted as an evolutionary process (20, 102), many forces may operate dif ferently in cancers than in organisms, as they evolve at vastly dif ferent time scales. Among such forces, natural selec- tion, here defined as dif ferential cellular proliferation among distinct somatic cell genotypes, is particularly interesting because its action might be thwarted in multicellular organisms (20, 29). In this review, selection is analyzed in
∗∗
Erratum
Ann
u. R
ev. G
enet
. 201
6.50
:347
-369
. Dow
nloa
ded
from
ww
w.a
nnua
lrev
iew
s.or
g A
cces
s pr
ovid
ed b
y O
klah
oma
Stat
e U
nive
rsity
- S
tillw
ater
on
09/2
8/17
. For
per
sona
l use
onl
y.

GE50CH16-Wu ARI 25 October 2016 10:24
INTRODUCTION
And so in the military –Knowing the other and knowing oneself,In one hundred battles no danger.Not knowing the other and not knowing oneself,In every battle certain defeat.The Art of War, Sun Tzu ∼ 300 B.C.
In the war on cancer, “oneself ” is our normal tissues, to which many fields of study are devoted.Normal tissues can be understood by their cell biology, physiology, development, biochemistry,etc., and there is substantial consensus on how the mechanisms should be dissected. The en-emy, of course, is cancer cells, which evolve continually driven by mutation and natural selection(20, 102). This process of evolutionary change drives increased proliferation of tumors. Therefore,tumorigenesis needs to be approached as an evolutionary phenomenon.
In this war, we not only do not understand the enemy well but do not even appear to agreeon how best to understand the evolution of the enemy. In the past two decades, cancer biologystudies have developed a system of interpreting cancer evolution (3, 18, 49, 92, 101, 110, 125,126, 136, 139, 149). However, this interpretation is often at odds with the principles of molecularevolutionary biology developed in the past 50 years by studying natural populations (23, 30, 38,59, 70, 79, 96, 99, 144). This review aims at bridging evolutionary biology and cancer biology.
To reconcile the divergent approaches to tumorigenesis, we reinterpret the data that have beenextensively analyzed in previous reports (12, 27, 51, 68, 77, 105, 128, 136). On the basis of thoseanalyses, well-established theories of molecular population genetics are introduced (30, 33, 38,59, 70, 140). Therefore, although the presentation in this review may at times be different fromthe published literature, it is a matter of divergent interpretations of the same set of observations.
A central issue for such a review is whether the theories developed to study natural populationsare suited to cell populations. In the section below, we discuss the differences between the twoprocesses in relation to the merits and limitations of these theories.
CANCER EVOLUTION VERSUS ORGANISMAL EVOLUTION
Tumorigenesis has increasingly been accepted as an evolutionary process and populations ofcancerous cells evolve, much like populations of organisms do. However, not all evolutionaryprinciples are universally applicable, and cancer indeed follows distinct evolutionary paths that areunusual in many respects.
First, tumorigenesis is a process with extremely small divergence in DNA sequences (Figure 1).The observations are based on many short branches, whereas the evolutionary data in natural pop-ulations consist of a single long branch (human to macaque, for example). This short evolutionarydistance is the defining feature of cancer evolution. Evolutionary studies are often categorized bythe level of divergence (d; the number of nucleotide substitutions per site) of the taxa of interest (seeFigure 1). Large-scale divergence, such as that between mammalian orders, is the realm ofmacroevolutionary biology, where d is generally much larger than 10−1. Microevolutionary biol-ogy focuses on the incipient phase of divergence between individuals of the same species or betweenclosely related species, with d roughly in the range of 10−3 to 10−1. For example, between humanand chimpanzee, d ∼ 0.012 and the difference between two humans is approximately 0.07% (28).Divergence of less than 10−4 usually provides little evolutionary information. Cancer evolution, in
348 Wu et al.
Ann
u. R
ev. G
enet
. 201
6.50
:347
-369
. Dow
nloa
ded
from
ww
w.a
nnua
lrev
iew
s.or
g A
cces
s pr
ovid
ed b
y O
klah
oma
Stat
e U
nive
rsity
- S
tillw
ater
on
09/2
8/17
. For
per
sona
l use
onl
y.

GE50CH16-Wu ARI 25 October 2016 10:24
Human Chimpanzee
C1 C2 C3 Cn
Microevolution
d ~ 10–3 – 10
–1
Cancer-normal tissue divergence (STAGE I)
Ci is the progenitorcancer cell in individual i
Evolution withintumors (STAGE II)
Cancer evolution(ultra-m
icroevolution)d ~ 10
–7 – 10–5
Tumor mass
Mouse
Macroevolutiond > 10
–1
Figure 1The scales of organismal evolution and cancer evolution. The evolutionary distance (d; number ofdifferences per nucleotide) between organisms is usually >0.1 in macroevolution and between 10−3 and 10−1
in microevolution. A distance of <10−5 is too small for organismal studies. In contrast, the evolutionarydistance between cancer cells and the normal tissue is between 10−7 and 10−5, or ultramicroevolutionary.Cancer evolution analysis is based on the sum of branch lengths (Ci, for the i-th case) and requires thesebranches to evolve in the same direction or converge.
contrast, has, on average, an evolutionary distance of ∼10−6 or ∼1 bp per Mb of single nucleotidechange (68, 77, 136). We refer to this fine-scale evolution as the ultramicroevolutionary process.
Second, although cancers have extremely short evolutionary distances, the evolution is mas-sively reiterated. Changes are hence summed over many branches in order to discern the evolu-tionary pattern. The continual reenactment of evolution provides a unique opportunity to addressa long-standing issue in evolutionary biology. Does selection drive the evolution along a relativelydeterministic pathway, or does evolution follow no particular pattern, with each pathway influ-enced by numerous contingent factors? Gould (52) invoked the metaphor of rewinding the tapeof life’s history and asked whether in repeated evolution life forms would end up in the same placeas we observe today. He speculated that evolution is contingent and the world would look verydifferent. Others disagreed, suggesting a defined set of patterns (97).
The debate, in essence, is about whether evolution is a process of adaptive convergence oradaptive divergence. The debate has only rarely been vigorously pursued for the obvious reasonthat there is generally no easy way to test the hypotheses. It is conceivable that an experimentalsystem with identical starting materials may provide some answers (154). Tumorigenesis of thesame tissue is possibly a natural system with nearly the same starting materials (normal tissue of ahuman) that are selected to proliferate in similar environments. Independent evolution of tumorsfrom normal tissues is indeed endlessly repeated in large and long-living species. In this regard,species that are far less susceptible to cancer are very interesting as well (1, 98, 131).
Third, in cancer evolution, the mutation rate itself may be evolving (2, 87, 118, 142), whereasthe mutation rate changes slowly, if at all, in organisms (59, 69, 79). Furthermore, the partitionof nucleotide substitutions into transitions and transversions captures the pattern across manytaxa (79), but they vary substantially in different types of cancers (2, 60, 68, 77, 87). Similarly,chromosomal ploidy change, copy number variation, and epigenetic modification are all commonin cancer cells (4, 11, 115, 145, 150) but rare in germ lines. Because genome instability in tumors
www.annualreviews.org • The Ecology and Evolution of Cancer 349
Ann
u. R
ev. G
enet
. 201
6.50
:347
-369
. Dow
nloa
ded
from
ww
w.a
nnua
lrev
iew
s.or
g A
cces
s pr
ovid
ed b
y O
klah
oma
Stat
e U
nive
rsity
- S
tillw
ater
on
09/2
8/17
. For
per
sona
l use
onl
y.

GE50CH16-Wu ARI 25 October 2016 10:24
is frequently observed (31, 57, 150), whether the instability is necessary for tumorigenesis hasbeen a contentious issue (14, 43, 146). A high mutation rate can lead to mutational meltdown andpopulation extinction (72, 83), a theoretical possibility that is difficult to test in nature but couldbe testable on cancer.
In summary, cancer evolution is sufficiently different from organismal evolution to requiremodifications of a number of rules but may also provide new perspectives on the general issues ofbiological evolution. At this moment, the molecular population genetics theories (23, 30, 38, 59,70, 79, 96, 99, 140, 144), with the appropriate modifications indicated above, are the best toolsto analyze cancer evolution. These theories are robust for various demographic scenarios such asthe Fisher-Wright or Moran model. They have also incorporated population size change, spatialstructure and overlapping generations, all of which operate differently in tumors than in naturalpopulations. Should future empirical data on tumors suggest unanticipated demographies thatdefy the existing population genetic models, new theory may be needed. At present, neither thenecessary data nor the alternative theory is available.
Finally, all theories generate null predictions based on the knowledge of mutation rate andpattern. For that reason, this review focuses on single nucleotide substitutions. Other types ofchanges such as copy number variation or epigenetic change, however important we suspect theymight be, cannot be modeled adequately before their mutation rates are determined.
DIVERGENT VIEWS ON THE EVOLUTION OF CANCER
What evolutionary principles deduced from the study of natural populations can, or cannot,be applied to cancer evolution? We focus on natural selection, which can be positive (for thebeneficial mutations) or negative (against the deleterious ones). Unless specified, selection heredenotes positive Darwinian selection. The power of negative selection in cancer evolution hasreceived scant attention but is likely to figure more prominently in the future (10, 90, 91) (seeStage I of Cancer Evolution: Tumors Versus Normal Tissues). We shall now review the differentapproaches to natural selection in cancer biology and evolutionary studies.
Neutralism as the Null Hypothesis
In studies of natural populations, neutral evolution is the null hypothesis (30, 38, 59, 70, 79,99). It is assumed that natural selection is not needed to explain the patterns of DNA changesunless the null hypothesis can be rejected. In the cancer evolution literature, natural selectionis assumed to be in operation unless proven otherwise (3, 18, 49, 59, 92, 101, 110, 125, 126,136, 139, 149). Among the evolutionary forces, including mutation, selection, genetic drift, andmigration, positive selection is the only force that may or may not operate in a given system.[However, negative selection against deleterious mutations is pervasive as most nonsynonymouschanges, for example, are deleterious in nature (70, 79, 99)]
Neutralism, being a simpler explanation, should be the null hypothesis. It is accepted when theobserved pattern of evolution is statistically compatible with a model that requires no (positive)selection. Selection may operate at times, but the overall pattern does not deviate from the neutralprediction. The neutral model therefore permits us to predict the behavior of the system, such asthe total amount of genetic diversity. When the neutral prediction is rejected, we may estimatethe degree of deviation as a gauge of the strength of selection. Testable hypotheses under a modelof selection, in contrast, can be generated only when the mechanism of selection can be preciselydefined.
350 Wu et al.
Ann
u. R
ev. G
enet
. 201
6.50
:347
-369
. Dow
nloa
ded
from
ww
w.a
nnua
lrev
iew
s.or
g A
cces
s pr
ovid
ed b
y O
klah
oma
Stat
e U
nive
rsity
- S
tillw
ater
on
09/2
8/17
. For
per
sona
l use
onl
y.

GE50CH16-Wu ARI 25 October 2016 10:24
The history of molecular evolution is instructive. Before the introduction of molecular toolsto measure evolutionary rate and genetic diversity, it was commonly assumed that most geneticvariants in nature have a fitness consequence. The reported high genetic diversity in nature (58, 78)made the conventional view untenable as selection tends to reduce, rather than enhance, geneticdiversity. In the past 50 years since the proposal of the neutral theory of molecular evolution (69,71), many measures have been introduced to test the observations against the neutral model ofevolution. These include tests authored by Ewens-Watterson (37, 143), Hudson, Kreitman, andAguade (63), McDonald & Kreitman (89), Tajima (127), Fu and Li (44, 45), Fay & Wu (40), andother tests such as the extended haplotype homozygosity and FST tests (116, 137, 143, 151).
Selection Driving Genetic Convergence
Genetic convergence may be the intellectual basis of the TCGA project that searches for thecommon mutations of cancers (12, 27, 51, 68, 76, 77, 105, 112, 128, 136). In contrast, the viewof genetic divergence is generally held by students of natural populations. When different taxamigrate to the same new habitats, adaptive genic convergence is so rare that each case of molecularconvergence has received substantial attention. The adoption of echolocation, the digestion ofcelluloses, and the colonization of high-altitude plateaus are such examples (42, 107, 153).
Selection in Relation to Complex Adaptation
As noted in Figure 1, tumorigenesis is ultramicroevolutionary, with extremely small divergencefrom the normal tissues. Whether and how complex adaptations such as cellular cooperation (16,46, 67, 126) could have evolved is intriguing, given the minimal evolutionary distances. It has beensuggested that mutations with a large phenotypic effect could be the basis of the large shift in cellbehaviors, in the spirit of Richard Goldschmidt’s “hopeful monster” (49). Such large shifts areusually deleterious and cannot be easily fixed in natural populations (75). They can be observed indomestication thanks to human interventions (19, 94) but are uncommon in natural species (132).Given that the hypothesis of large effect with few genes is testable [for example, by transgenicprocedures (55, 56)], the absence of such tests should be remedied.
Selection in Growing Populations
Cancer evolution is accompanied by population expansion. However, the means by which selec-tion operates in growing populations are understood very differently in the two fields. In cancerbiology, population expansion means excess resources; hence, selection for or against new vari-ants is reduced (18, 101, 110, 126, 139). Genetic drift is also interpreted as becoming strongerin expanding populations in cancer studies (49), whereas genetic drift is usually thought to be-come weaker as the population size gets larger. These interpretations are exactly the opposite ofthe core understanding of population genetics (38, 59, 70, 79). It is possible that organismal andcellular populations are fundamentally different but the differences, if indeed true, have not beendelineated.
General Comments
The fields of cancer biology and evolutionary biology embrace the subject of cancer evolutionwith very different perspectives. They even use the same terms for very different concepts. Forexample, macro- versus microevolution is a delineation of scale in evolutionary biology (seeFigure 1), whereas cancer biology uses them to denote large versus small genetic effects un-derlying phenotypes (6, 49). Thus, a simple genetic change causing a large phenotypic difference
www.annualreviews.org • The Ecology and Evolution of Cancer 351
Ann
u. R
ev. G
enet
. 201
6.50
:347
-369
. Dow
nloa
ded
from
ww
w.a
nnua
lrev
iew
s.or
g A
cces
s pr
ovid
ed b
y O
klah
oma
Stat
e U
nive
rsity
- S
tillw
ater
on
09/2
8/17
. For
per
sona
l use
onl
y.

GE50CH16-Wu ARI 25 October 2016 10:24
in domesticated plants and animals (19, 94) might be considered macroevolutionary. In this re-view, we adopt the terms used in evolutionary biology, or, more specifically, population genetics,when describing the evolutionary attributes of cancer.
CANCER EVOLUTION IN TWO STAGES
We now examine the empirical data on cancer evolution, which is divided into two stages (seeFigure 1). Stage I is the evolution of tumors from normal tissues. Here, a tumor is a new populationof cells that have become biologically different from the population of normal cells. The followingsection is about this stage, which is analogous to the molecular evolutionary analysis betweenspecies (79, 99). Stage II is the evolution within tumors. This is the process of population expansionfrom a single cancerous cell. The section Stage II of Cancer Evolution: Diversification WithinTumors deals with concepts analogous to molecular population genetics (38, 59) and focuseson the differentiation among cancerous cells within the same individual. Although the two stagesof evolution are separate parts of a continual process, they do have different properties. Indeed,the MacDonald-Kreitman test (89, 93) was developed to exploit the differences between the twostages for the purpose of inferring positive selection. The analytical tools for the two stages arealso different.
STAGE I OF CANCER EVOLUTION: TUMORS VERSUSNORMAL TISSUES
The analysis of cancer evolution is predicated on adaptive convergence, which can be in phenotypeonly or in both phenotype and genotype. We shall very briefly address phenotypic convergencefirst.
Evolutionary Convergence in Phenotype
Tumorigenesis is a process of phenotypic convergence. After all, this is how pathologists defineand stage tumors. Hanahan & Weinberg (57) defined a number of convergent phenotypes thatthey referred to as cancer hallmarks. These included autonomous growth signaling, evasion ofgrowth suppression, resistance of programmed cell death, avoidance of immune suppression, andacquisition of cell motility as well as other emerging hallmarks.
The quest for signatures of convergence has expanded into defining molecular phenotypes, andthe most common examples are biomarkers (8). Extending the theme, many studies introducedgene expression profiles and other molecular features into cancer typing (5, 62, 65, 85, 95, 112, 114).All these efforts reflect the underlying assumption that tumorigenesis is a process of evolutionaryconvergence. Molecular phenotypes are often empirically defined without a prior expectation.An interesting exception may be the convergence in the expression pattern that regresses back tothe embryonic stem cells (9, 24, 109). This view takes a further step beyond the dedifferentiationhypothesis (80, 141), under which cancer cells regress back to the tissue stem cells.
Evolutionary Convergence in Genotype
To discuss genotypic convergence, we need to have an overview of The Cancer GenomeAtlas (TCGA) that has been motivated by the view of adaptive genic convergence in tumorevolution. TCGA, in collaboration with the International Cancer Genome Consortium (ICGC;htttp://icgc.org), aimed to discover the shared genetic bases by sequencing a large number ofcancer genomes. Since then, the consortium has generated comprehensive sequencing data on
352 Wu et al.
Ann
u. R
ev. G
enet
. 201
6.50
:347
-369
. Dow
nloa
ded
from
ww
w.a
nnua
lrev
iew
s.or
g A
cces
s pr
ovid
ed b
y O
klah
oma
Stat
e U
nive
rsity
- S
tillw
ater
on
09/2
8/17
. For
per
sona
l use
onl
y.

GE50CH16-Wu ARI 25 October 2016 10:24
somatic mutations, gene expressions, and epigenetic modifications from ∼15,000 matched tumorand normal tissues for 49 different cancer types. At present, 1,374,866 single nucleotide variations(SNVs) in coding regions have been reported. These SNVs and other changes can be found inthe ICGC data portal (https://dcc.icgc.org/). Across all cases, the median number of codingregion mutations per cancer case is approximately 50, although a few cases may be more than 20times higher.
The TCGA-ICGC data have been comprehensively analyzed from the cancer biology perspec-tive (12, 27, 51, 68, 76, 77, 112, 128, 136). Overall, there are two salient results from the survey.First, there is only a modest overlap in genes that have mutated among cases of the same type.The overlap is even less across different cancer types. Hence, adaptive convergence is uncommoneven when driven by similar selective forces (see below for details). Second, a most surprisingresult is the apparent lack of selection signals in the TCGA data. The intensity of selection in eachcancer case can be expressed as the Ka/Ks ratio (59, 79), where Ka is the number of nonsynonymouschanges and Ks is the number of synonymous changes per nucleotide site, respectively. In almostall surveys of cancer evolution, Ka/Ks is approximately 1 across cancer types (104). Given that aKa/Ks = 1 is the signature of neutral evolution (59, 79), it would appear that most tumors havebeen evolving neutrally.
In the following two sections, we separately review the two sets of results (lack of convergenceand lack of overall selection). Although they both pertain to selection, they can be either stronglycorrelated or completely uncorrelated. For example, all cancer cases may experience strong se-lective pressures but do not converge genetically. Alternatively, different cancer cases may bedriven by weak selection, which may nevertheless converge. Convergence and selective intensityare distinct phenomena.
Low genotypic convergence. The original aim of finding common mutations that would identifya full set of cancer driver genes has turned out to be unattainable. For example, in the analysis byKandoth et al. (68), only two genes are mutated in more than 10% of all cancer cases (TP53 at42.0% and PIK3CA at 17.8%). Other reports present similar patterns (see 77, 128, 136). Althoughpassengers are not expected to be commonly shared among tumors, a substantial sharing of drivermutations among tumors was the expectation. The fact that one can often find two tumors ofthe same type that share no mutation in the same genes underscores the disappointingly lowconvergence among tumors.
Common occurrences of mutations are somewhat more likely for individual types of cancer.For example, the VHL gene is mutated in 52.3% of kidney cancers but is only mutated in 6.9%of cases across 12 cancer types. This is true for a few other genes, such as APC (82% in colorectalcancer versus 7% across multiple cancer types), ARID1A (28% and 30% in bladder and uterinecancers versus 5% in general), FLT3 (27% in glioblastoma and 3% in general), and CTNNB1(28% in uterine cancer and 3% in general). Higher genetic convergence is expected in the sametissue environment. Nevertheless, the number of common cancer drivers is rather modest evenfor the same cancer type (see figure 4 of Reference 68, for example).
In these analyses, common driver mutations are shown as the percentage of occurrences amongcancer cases. However, longer genes are proportionately more likely to be represented and caseswith more observed mutations have correspondingly more genes associated with the tumors. Allthese factors need to be corrected. For the same reason, genetic convergence at the pathway ornetwork level (5, 27, 62, 112) greatly exaggerates the commonality of mutations because a pathwayor network is equivalent to a supergene of enormous length.
In algebraic terms, the percentage of a mutated gene in cancer samples is P(U|D), which isthe probability of a gene having a mutation (U) in the sample, conditional on the sample being in
www.annualreviews.org • The Ecology and Evolution of Cancer 353
Ann
u. R
ev. G
enet
. 201
6.50
:347
-369
. Dow
nloa
ded
from
ww
w.a
nnua
lrev
iew
s.or
g A
cces
s pr
ovid
ed b
y O
klah
oma
Stat
e U
nive
rsity
- S
tillw
ater
on
09/2
8/17
. For
per
sona
l use
onl
y.

GE50CH16-Wu ARI 25 October 2016 10:24
the diseased state (D). The cancer-driving potential can be better represented by
λ = P(U|D)/P(U), (1)
where P(U) is the probability of having the mutation in the gene in the control population. Thus,λ is the enrichment index, or the relative likelihood of having the mutation, given the disease.Cancer driver genes are identified when P(U|D) is statistically larger than P(U), i.e., when λ > 1(77), although the actual λ has rarely been given. Under specific circumstances, λ can also berearranged as P(D|U)/P(D) with the interpretation of the risk of having the disease with themutation, relative to the probability of having the disease with or without the mutation.
In this review, we focus on the evolutionary rates of the cancer genomes by analyzing Ka/Ks foreach gene. Ka is equivalent to P(U|D) and Ks is equivalent to P(U), the latter being the expectedoccurrences of neutral mutations. Ka/Ks is hence a measure of λ.
Before we discuss the evolutionary rate, which is central to the identification of cancer drivergenes, we should also note that the quest for convergence signals has motivated many additionalmeasurements that change P(U|D) and P(U) in ways that might increase λ. The measurementsvary greatly, ranging from expression data and structural genomics to network analyses. Structuralgenomic information such as protein domain, post-translational modifications, protein pockets,and protein-ligand binding sites has been integrated into the algorithms (25, 111, 138, 152).Network-based analyses have also been extensively applied to decipher the tumorigenic conse-quence of somatic mutations. These include pathways, gene interaction networks, and mRNAexpression networks that may be sensitive to the effects of rare somatic mutations (7, 133, 134). Anintricate example is TieDIE (tied diffusion through interacting events) (108), which incorporatesgenomic and transcriptomic data into networks of protein-protein interactions and computation-ally predicts TF-to-target connections.
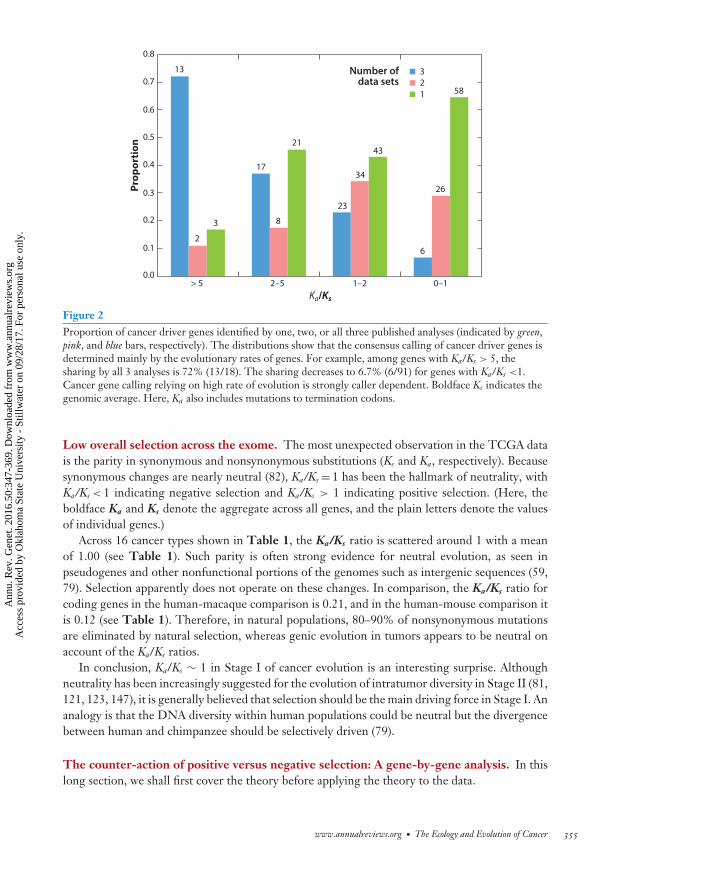
Our objective is not to evaluate the merits of each individual measurement (pathway, network,expression, etc.). Instead, we aim to identify the common features of driver genes that appear onmost lists of putative driver genes. A low consensus rate (31.0%) in somatic mutation calling hasbeen noted (39) and, in the more extreme cases, two lists of cancer driver genes do not overlapat all (57). With the TCGA data of somatic single nucleotide mutations, candidate driver listsoverlap much more extensively, and the overlap is mainly a function of the evolutionary rate,shown below. We compare the three comprehensive analyses that identify 127, 140, and 180cancer driver genes (68, 77, 136), respectively. In total, there are 257 genes, among which 59genes appear on all three lists.
We ask what features delineate the common subset. Figure 2 shows the proportion of genesthat are included in one, two, or three lists as a function of Ka/Ks. For genes that are included inall three lists, the Ka/Ks ratios tend to be high (Figure 2, blue bars; 72% and 6.8% for Ka/Ks >5and <1, respectively), whereas genes that appear in only one list tend to have lower Ka/Ks ratios(Figure 2, green bars). In short, the consensus candidate driver genes are those that evolve fast.The other measures such as gene expression level tend to introduce slower evolving genes thatare not agreed upon by different studies. There are genes with low Ka/Ks ratios that appear in alllists, such as VHL and APC; these genes in fact have high Ka/Ks ratios in specific cancer types. Hadwe considered specific cancer types, Figure 2 would have shown that almost all consensus drivergenes have high Ka/Ks ratios in some or all cancer types.
Because the number of cancer drivers that have been confidently predicted and shared by mostgene lists is modest, there may be a larger collection of cancer driver genes that have eludeddetection. How many are there and what are they? By analyzing the selective pressure on mutatedgenes in the next section, we hope to answer some of these questions.
354 Wu et al.
Ann
u. R
ev. G
enet
. 201
6.50
:347
-369
. Dow
nloa
ded
from
ww
w.a
nnua
lrev
iew
s.or
g A
cces
s pr
ovid
ed b
y O
klah
oma
Stat
e U
nive
rsity
- S
tillw
ater
on
09/2
8/17
. For
per
sona
l use
onl
y.
GE50CH16-Wu ARI 25 October 2016 10:24
0.8
0.7
0.6
0.5Pr
opor
tion
0.4
0.3
313
17
8
21
23
34
43
26
6
58
2
3
21
0.2
0.1
0.0> 5 2–5
Ka/Ks
0–11–2
Number ofdata sets
Figure 2Proportion of cancer driver genes identified by one, two, or all three published analyses (indicated by green,pink, and blue bars, respectively). The distributions show that the consensus calling of cancer driver genes isdetermined mainly by the evolutionary rates of genes. For example, among genes with Ka/Ks > 5, thesharing by all 3 analyses is 72% (13/18). The sharing decreases to 6.7% (6/91) for genes with Ka/Ks <1.Cancer gene calling relying on high rate of evolution is strongly caller dependent. Boldface Ks indicates thegenomic average. Here, Ka also includes mutations to termination codons.
Low overall selection across the exome. The most unexpected observation in the TCGA datais the parity in synonymous and nonsynonymous substitutions (Ks and Ka, respectively). Becausesynonymous changes are nearly neutral (82), Ka/Ks = 1 has been the hallmark of neutrality, withKa/Ks < 1 indicating negative selection and Ka/Ks > 1 indicating positive selection. (Here, theboldface Ka and Ks denote the aggregate across all genes, and the plain letters denote the valuesof individual genes.)
Across 16 cancer types shown in Table 1, the Ka/Ks ratio is scattered around 1 with a meanof 1.00 (see Table 1). Such parity is often strong evidence for neutral evolution, as seen inpseudogenes and other nonfunctional portions of the genomes such as intergenic sequences (59,79). Selection apparently does not operate on these changes. In comparison, the Ka/Ks ratio forcoding genes in the human-macaque comparison is 0.21, and in the human-mouse comparison itis 0.12 (see Table 1). Therefore, in natural populations, 80–90% of nonsynonymous mutationsare eliminated by natural selection, whereas genic evolution in tumors appears to be neutral onaccount of the Ka/Ks ratios.
In conclusion, Ka/Ks ∼ 1 in Stage I of cancer evolution is an interesting surprise. Althoughneutrality has been increasingly suggested for the evolution of intratumor diversity in Stage II (81,121, 123, 147), it is generally believed that selection should be the main driving force in Stage I. Ananalogy is that the DNA diversity within human populations could be neutral but the divergencebetween human and chimpanzee should be selectively driven (79).
The counter-action of positive versus negative selection: A gene-by-gene analysis. In thislong section, we shall first cover the theory before applying the theory to the data.
www.annualreviews.org • The Ecology and Evolution of Cancer 355
Ann
u. R
ev. G
enet
. 201
6.50
:347
-369
. Dow
nloa
ded
from
ww
w.a
nnua
lrev
iew
s.or
g A
cces
s pr
ovid
ed b
y O
klah
oma
Stat
e U
nive
rsity
- S
tillw
ater
on
09/2
8/17
. For
per
sona
l use
onl
y.

GE50CH16-Wu ARI 25 October 2016 10:24
Table 1 Ka/Ks of genes are given in the descending order. Only fast-evolving genes with Ka/Ksa > 8 in any of the three data
sets are shownb
Gene name(stronglybeneficial) Pan-cancerc HNSC BLCA
Gene name(weakly
beneficial) Pan-cancer HNSC BLCA
TP53 142.791 144.72 79.96 HIST1H2BD 3.644 11.09 1.74
KRAS 65.059 ND 14.56 RHOB 3.428 0.00 27.64
IDH1 24.444 1.39 2.03 RAC1 3.077 10.40 3.42
HRAS 20.133 55.70 14.89 HIST1H2AG 2.961 0.00 8.71
PIK3CA 18.612 14.94 13.60 C7orf49 2.543 8.71 ND
NRAS 16.096 ND 5.63 FGFR3 2.459 2.73 15.03
CDKN2A 15.985 31.65 10.79 CASP8 2.122 9.14 2.73
BRAF 12.043 1.28 1.13 ELF3 2.075 0.53 13.26
PTEN 11.571 4.63 2.59 PHLDA3 1.937 ND 8.80
PTH2 10.665 6.49 4.74 MIEN1 1.909 ND 11.45
GPX1 9.531 8.70 2.38 CDKN2B 1.761 ND 8.81
POTEC 7.197 8.08 6.16 DEFB123 1.603 2.93 9.62
POM121L12 7.056 9.49 4.46 CXCL12 1.413 6.60 9.82
AQP7 6.048 8.53 4.26 FAM96A 1.224 0.00 8.69
RHOA 5.883 6.06 15.00 PRX 1.111 0.83 24.51
HIST1H3B 5.715 2.98 9.80
HIST1H3I 5.262 10.51 6.58
OR2M5 4.543 8.80 3.44
HIST1H4E 4.372 9.98 2.19
SPANXN2 4.365 8.62 3.54
aThe average Ka/Ks ratio for the 16 cancer types is 1.00 (see legends for individual values). Ka/Ks = 0.21, averaged over functional genes between humanand macaque. Ka/Ks = 0.12, averaged over functional genes between human and mouse. Ka/Ks = 0.88, averaged over pseudogenes between human andmacaque. All numbers <5.0 are in light gray.bGiven that Ks for individual genes is not accurate because of the small number of mutations detected, Ks (the genome-wide Ks value) is used to calculatethe Ka/Ks ratio.cThe 16 cancer types used in this study: adenoid cystic carcinoma (Ka/Ks = 0.91), urothelial bladder carcinoma (1.02), esophageal carcinoma (1.03),head-neck squamous cell carcinoma (0.96), low-grade glioma (1.12), lung adenocarcinoma (0.96), lung squamous cell carcinoma (1.04),pheochromocytoma and paraganglioma (1.12), prostate adenocarcinoma (1.06), sarcoma (1.01), skin cutaneous melanoma (0.94), stomach adenocarcinoma(1.02), thyroid carcinoma (1.16), thymoma (1.38), uterine carcinosarcoma (1.06), and uveal melanoma (1.28). In this list, Ka and Ks are calculated fornondegenerate sites and fourfold degenerate sites, respectively.Abbreviations: BLCA, urothelial bladder carcinoma; HNSC, head-neck squamous cell carcinoma; ND: no single nucleotide variation detected.
A review of the population genetics theory. Strictly speaking, Ka/Ks = 1 does not mean theabsence of selection. It only means that the effect of positive selection in accelerating evolution isexactly canceled out by the effect of negative selection that slows it down. Because it seems toomuch a coincidence that the positive and negative effects could be so close in strength, neutralityis generally the more plausible explanation. However, in tumorigenesis, many genes are known tobear a strong signature of positive selection (12, 27, 51, 68, 76, 77, 112, 128, 136); hence, the largeimpact on the Ka/Ks ratio by even a tiny fraction of advantageous mutations needs be quantified.For that reason, neither should we ignore the possibility of negative selection operating on manyother genes.
356 Wu et al.
Ann
u. R
ev. G
enet
. 201
6.50
:347
-369
. Dow
nloa
ded
from
ww
w.a
nnua
lrev
iew
s.or
g A
cces
s pr
ovid
ed b
y O
klah
oma
Stat
e U
nive
rsity
- S
tillw
ater
on
09/2
8/17
. For
per
sona
l use
onl
y.

GE50CH16-Wu ARI 25 October 2016 10:24
As all living systems are driven by both positive and negative selection (22, 38, 59, 79), thereshould also be two types of selectively-driven genes in cancer evolution: positive drivers and neg-ative drivers. The former are genes whose mutations, on average, confer a proliferative advantageand speed up the evolution, whereas the latter are deleterious mutations that slow it down. Theterm “negative drivers” may help to raise the awareness of deleterious mutations. The relativeabundance and selective strength of positive and negative drivers are crucial for understandingtumorigenesis.
Let the proportion of nonsynonymous sites under positive and negative selection be p and q,respectively. The rest, 1 − p − q, is neutral. Synonymous sites are assumed to be neutral. Accordingto the classical theory (30, 38, 59, 70), the probability of fixation for a beneficial mutant with a fitnessadvantage of s is 2s. Deleterious mutations are assumed to have a very small probability (ε∼ 0)of becoming fixed. The neutral mutation is fixed with the probability of (1/Ne). We should notethat the probability of fixation given here is general and depends little on the specific models. Forexample, the fixation probability of 2s can be obtained by the branching process as well (see 30).Thus, the standard theory would show
Ka = Ne u[(1 − p − q )(1/Ne) + p2s + qε]
and
Ks = Ne u(1/Ne ) = u,
where Ne is the effective size of the cell population. Let the observed Ka/Ks be R, then
R = Ka/Ks = (1 − p − q ) + p2Ne s
or
q = (1 − R) + p(2Ne s − 1).
In most natural species, R < 0.3 and q > 0.7 (79). Negative selection thus overwhelms positiveselection, making the analysis of positive selection difficult. In contrast, R ∼ 1 in cancer evolution,suggesting nearly equal impacts by positive and negative selection. (Note that R ∼ 1 does notautomatically indicate neutrality. A system with p = 0.01, q = 0.99, 2Nes = 100 and no neutralmutations would also yield R ∼ 1.) The relationship between p and q when R = 1 can be thusdelineated
q ∼ p(2Ne s − 1). (2)
Using Equation 2, q � p unless Nes is close to 1. [When Nes = 1, the selective advantage vanishesbecause it would be the same as the drift effect (1/Ne.)] If 2Nes = 5, negative drivers are four timesas numerous as positive drivers (q = 4p). Note that 2Nes = 5 is very weak selection. For example,in human populations with Ne ∼ 104 (59), the selective advantage of 2Nes = 5 would be merelys = 0.00025. Clearly, to maintain an overall Ka/Ks ∼ 1, every positive driver needs to be balancedby many times more negative drivers. As 2Nes increases, the disparity also increases. From thedata, we can obtain the approximate Nes value for each gene (averaged over all sites of the genes).The fixation rate of nonsynonymous mutation for a gene is Ka = 2Nesu and Ks = Neu(1/Ne) = u.Hence,
Ka/Ks = 2Ne s . (3)
Application of the theory to the The Cancer Genome Atlas data. Using Equation 3, wecan tabulate the selective strength (2Nes) for each gene using the Ka/Ks values from TCGA.
www.annualreviews.org • The Ecology and Evolution of Cancer 357
Ann
u. R
ev. G
enet
. 201
6.50
:347
-369
. Dow
nloa
ded
from
ww
w.a
nnua
lrev
iew
s.or
g A
cces
s pr
ovid
ed b
y O
klah
oma
Stat
e U
nive
rsity
- S
tillw
ater
on
09/2
8/17
. For
per
sona
l use
onl
y.

GE50CH16-Wu ARI 25 October 2016 10:24
Ka/Ks
9086.08
71.99
51.78
27.8125.72
5.28
11.34
17.31
33.12
2.36
22.6325.73
29.0830.96
0.21
4.66
8.90 9.00
0.00 0.00 0.00 0.00 0.09 0.13 0.140.43 1.12 1.060.10
32.96
80
70
60
50
40
30
20
10
< 0.5 0.5–1.0 1.0–2.0 2.0–4.0 4.0–8.0 > 8.00
Human-macaque
Pan-cancer
BLCA
Perc
enta
ge o
f gen
es
HNSC
Simulation
Deleterious
Stronglybeneficial
Effectively neutral
Weakly beneficial
Figure 3Distributions of the evolutionary rate (Ka/Ks) of individual genes in cancer versus organismal evolution.Although the genome-wide average of Ka/Ks is very close to 1, the Ka/Ks ratio for individual genes oftendeviates from 1. Computer simulations assuming all genes with Ka/Ks = 1 show 5.3% and 0.2% of genes tohave Ka/Ks < 0.5 or >2, respectively. In contrast, the observations show much higher percentages of genes inthese two categories. The deviations are greater for individual cancer types [∼26% and ∼10% for HNSC(head-neck squamous cell carcinoma) and BLCA (urothelial bladder carcinoma)] than for the pan-cancerpattern (∼17% and ∼5%). The pan-cancer distribution is based on many more samples and is consideredmore accurate. For a comparison, the distribution of Ka/Ks between human and macaque is strongly skewed,with 86.1% of the Ka/Ks ratio being <0.5.
Table 1 presents all genes with 2Nes > 8 (strongly beneficial mutations as defined in Figure 3)either across all cancer types or in at least one of the two tissue types. It is striking that the secondhalf of Table 1 consists entirely of genes that are selected strongly in only one cancer type.
Figure 3 shows the distribution of Ka/Ks ( = 2Nes) for individual genes during tumorigenesis.For a comparison, we also present the Ka/Ks distribution between human and the macaque monkey,which shows very few genes with Ka/Ks > 1. The prospect of detecting positive selection in cancerevolution is much better (see Figure 3), which is informative in several ways.
First, although the Ka/Ks distributions in cancers yield a mean ratio of ∼1, we see excesses on thepositive and negative sides in comparison with the simulated distribution that assumes all genesto have the same Ka/Ks ratio. The existence of beneficial mutations has been amply confirmedby previous TCGA analyses (12, 27, 51, 68, 76, 112, 128, 136) and the existence of deleteriousmutations is a logical corollary, given that the mean Ka/Ks is ∼ 1. We will explore the genes undernegative selection in a follow-up study (in preparation).
358 Wu et al.
Ann
u. R
ev. G
enet
. 201
6.50
:347
-369
. Dow
nloa
ded
from
ww
w.a
nnua
lrev
iew
s.or
g A
cces
s pr
ovid
ed b
y O
klah
oma
Stat
e U
nive
rsity
- S
tillw
ater
on
09/2
8/17
. For
per
sona
l use
onl
y.

GE50CH16-Wu ARI 25 October 2016 10:24
Second, a large number of genes are under negative selection, as Equation 2 shows. In ref-erence to the simulated distribution, we classify genes with Ka/Ks < 0.5 as deleterious (meaningtheir mutations are, on average, deleterious), between 0.5 and 2 as effectively neutral, and >2 asadvantageous. Given the short evolutionary distance, a gene observed to have Ka/Ks = 2 may notbe statistically different from Ka/Ks = 1.
Genes with Ka/Ks > 8 are considered strongly advantageous and only approximately 0.1% ofgenes are in this category. Although 5–10% of the genes are weakly but positively driven, 17–28%of genes are at least equally strongly driven, but in the negative direction. In the cancer evolutionliterature, little attention has been paid to the effect of deleterious mutations (10, 90, 91), which,given their number, could be a drag on the evolution of tumors.
Third, the Ka/Ks distribution appears broader in specific cancer types than in the pan-canceranalysis. A simple interpretation is that there are more genes under selection, in both the positiveand negative directions, in individual tissues than in the pan-cancer data. As many mutations areadvantageous or deleterious only in some particular tissue environments, some previous studies(104), using different analyses, have hinted at such properties. We suspect that the tighter distri-bution in pan-cancer data with more cases falling in the middle of the distribution may be dueto their much larger sample sizes. A preliminary study correcting for the sample size differencesuggests that the average intensity of selection on each individual type may indeed be smaller thanportrayed (H.-Y. Wang & C.-I.Wu, in preparation).
In summary, there are a large number of weak driver genes (5% of all genes across cancertypes and ∼10% for specific types) that could account for the missing drivers, as noted before(136). There are in addition roughly three times as many negative drivers. In the absence ofrecombination, positive and negative selection would mutually interfere.
The causes and consequences of weak selection in cancer evolution. The causes of weakselection could be due to the very small Ne’s in tumors. A consequence of weak selection is thelow level of convergence, which requires strong selection.
Causes of weak selection. The role of selection in cancer evolution appears to be much weakerthan necessary to drive genotypic convergence. Several studies have also suggested weak selectionby attempting to estimate the selective intensity (s) directly (15, 121, 135). From the literature,we obtain estimates of 2Nes, which governs the pattern of evolution. When multiplied by 2Ne,the selective effect is weak in cancer for several reasons. First, the extremely short evolutionarydistance in each tumor means that even the strongest mutations may not have a chance to emerge.Second, 2Nes is small because Ne may be small, whereas s may not be. Cairns’ (20) suggestionof the compartmentalization of stem cell populations is nature’s way of reducing Ne. (Note thatNe here is in reference to the effect of selection.) Ling et al. (81) also suggested that the lowcell motility in solid tumors greatly reduces the efficacy of selection. Third, mutations emerge asheterozygotes in which mutations need to be semidominant to have a fitness effect. Fourth, thepreponderance of deleterious mutations would offset whatever growth advantages cells may havepreviously acquired.
Consequences of weak selection. The low efficacy of selection may be an important reason forthe observed low convergence in cancer genotypes. Strict convergence dictates that, in each stepof cancer evolution, a very small subset of mutations would have an overwhelming selective ad-vantage. Consequently, they are almost always the ones that are fixed. Indeed, the determinis-tic model of Jones et al. (66) defined the sequence of mutations leading to colorectal cancer as
www.annualreviews.org • The Ecology and Evolution of Cancer 359
Ann
u. R
ev. G
enet
. 201
6.50
:347
-369
. Dow
nloa
ded
from
ww
w.a
nnua
lrev
iew
s.or
g A
cces
s pr
ovid
ed b
y O
klah
oma
Stat
e U
nive
rsity
- S
tillw
ater
on
09/2
8/17
. For
per
sona
l use
onl
y.

GE50CH16-Wu ARI 25 October 2016 10:24
step-by-step changes on APC, CDC4, Kras, PIK3A, and p53 (41, 101). This sequential model hasbeen influential since its proposal (103).
How much selective advantage (2Nes) does a mutation need to confer a result in convergence?According to the TCGA data, the neutral (i.e., synonymous) substitution number is roughly3 × 10−6 per site on average. An average sized gene with 450 codons has approximately 1,000 non-synonymous sites. Therefore, its neutral mutations should be present in 0.3% (=3 × 10−6 × 1,000)of all cancer cases. A nonsynonymous mutation with a selective advantage must be more commonthan the neutral ones. Given an enrichment of λ [= P (U|D)/P (U) ∼ Ka/Ks], the mutation isexpected to be present in 0.3% of λ cases. Even with Ka/Ks = 10, such mutations should still bepresent in only 3% of cancer cases, and there are only 10 genes with Ka/Ks > 10 in the pan-canceranalysis (Table 1). The P53 gene, with a Ka/Ks value of 80–150, is a stark standout in the genome.
Figure 3 and Table 1 show 40 or so genes that contribute to the modest genotypic convergencein the TCGA data (12, 27, 51, 68, 76, 112, 128, 136). Beneath these genes is a broad class of geneswith weakly advantageous mutations (2 < Ka/Ks < 8). Such weak advantages could be easily offsetby the many deleterious mutations in the genome (genes with Ka/Ks < 0.5).
Additional notes. Little is known about the ecology underlying the selection. For example, whatecological factors of the kidney, but no other tissues, make VHL strongly selected? The sameapplies to Kras in the pancreas and APC in the colon (13, 117, 120)? We may also ask whether thesame organs in different mammals impose different selective pressures on the same set of genes.For example, are APC mutations as common in dog’s colorectal cancer as they are in humans?Although the prevalence of different cancer types between human and dog have provided somehints, the cross-species cancer genomics may offer new insights into cancer evolution. The lowincidences of cancers in mole rat (131), elephant (1, 124), and whale (98) have shown the promiseof broader investigations.
STAGE II OF CANCER EVOLUTION: DIVERSIFICATIONWITHIN TUMORS
We now ask how strongly natural selection operates in Stage II of cancer evolution (Figure 1)and how much genetic diversity accumulates in the process. In any population of organisms orcells, mutations occur during DNA replication. Through time, individual DNA copies accumulatedifferences, resulting in genetic diversity. This diversity, usually measured by DNA sequencing,provides information about the demography of the population, including growth mode, populationsubdivision, migration, etc. If, and only if, the observed diversity deviates from the expected valuethat is based on the given demography need natural selection be invoked.
The possible operation of natural selection in tumors is also important for clinical reasons.First, clones that are positively selected may be of particular clinical concern. Second, if selectionis not operative, the intratumor diversity would generally be expected to be larger. Note thatselection tends to reduce diversity, with new advantageous mutations driving out existing variantsand deleterious mutations being eliminated by the wild-type clones. When the neutral diversitybecomes sufficiently large, the probability that the standing genetic variation might confer drugresistant is correspondingly large.
Evidence for Natural Selection Driving Intratumor Diversity
The first empirical measure of within-tumor diversity is that of Shibata (119), who studiedmicrosatellite variations. Following that seminal study, other measures such as IgA diversity,DNA copy number variation, loss of heterozygosity (LOH), chromosome ploidy differences, and
360 Wu et al.
Ann
u. R
ev. G
enet
. 201
6.50
:347
-369
. Dow
nloa
ded
from
ww
w.a
nnua
lrev
iew
s.or
g A
cces
s pr
ovid
ed b
y O
klah
oma
Stat
e U
nive
rsity
- S
tillw
ater
on
09/2
8/17
. For
per
sona
l use
onl
y.

GE50CH16-Wu ARI 25 October 2016 10:24
methylation patterns (17, 21, 54) have all been used to confirm clonal diversification within tumors.In recent years, whole-genome or whole-exome sequencing has become the method of choice (31,48, 130). In this section, we evaluate the approaches that conclude the role of natural selectiondriving within-tumor diversity.
Sharing of intratumor variants. Gerlinger et al. (48, 50) presented the common occurrencesof SETD2 mutations in renal cell carcinomas as a signal of convergent selection within tumors.In light of the modest success in finding convergence signals in the TCGA data (68, 76, 136), astatistical assessment of the suggested enrichment is necessary (see Stage I of Cancer Evolution:Tumors Versus Normal Tissues), especially when common independent mutations within thesame tumor are quite rare in such studies. Furthermore, Ling et al. (81) estimated the numberof intratumor coding mutations to be in the hundreds of millions, mostly in low frequencies.Hence, sharing of intratumor variants that are not in high frequency could be noisy backgroundoccurrences.
Genetic diversity driving tumor progression. The level of intratumor genetic diversity hasbeen shown to be correlated with cancer progression and mortality (3, 86, 88, 106). It has hencebeen suggested that the higher intratumor diversity was driving aggressive tumor growth. Nev-ertheless, it seems no less likely that aggressive clones are dividing more frequently and, hence,accrue more diversity as a consequence. This is particularly true when the diversity measure isbased on nonfunctional variants such as microsatellites. In other words, the higher genetic diversitymay be the consequence, rather than the cause, of aggressive tumor growth.
Relapse after drug treatment. Higher genetic diversity may indeed predispose faster cancerevolution if the environment changes drastically. Many reports have shown that resistant clonesusually pre-exist in the original tumors but in very low frequencies (26, 32, 84, 100, 113). Thatneutral variants can become selectively different in changing environments has been demonstratedin Escherichia coli and yeast, a phenomenon referred to as the Dykhuizen-Hartl effect (35, 70).Because neutral diversity is characterized by a very large number of low-frequency variants (81),the emergence of low-frequency drug-resistant mutations is not unexpected.
Functional tests by xenografting. A functional approach to testing fitness differences amongsubclones of the same tumor is to compare their growth rate in vitro or as xenografts (24, 36, 73).Although the observations have been suggested to reveal fitness differences between subclonesof the same tumor, they in fact pertain to the continual evolution of these subclones in newenvironments, rather than in the original tumors.
In short, the inferences of selection driving intratumor diversity often pertain to the conse-quences of environmental changes on the diversity, rather than selection during tumor growth.Direct tests are reviewed next.
Evidence Supporting the Neutrality of Within-Tumor Diversity
A direct approach to assessing the effect of selection on intratumor diversity is to compare the sizesof the observed clones with the neutral expectation. The expected neutral pattern in stationarypopulations can be obtained from both the infinite-allele or infinite-site models of populationgenetics (30, 38, 59, 70, 79, 99). The models have been extended to exponentially growing pop-ulations in which the clone size distributions can be obtained mathematically (33, 34, 74, 148).In more complex (and realistic) modes of demography, direct computer simulations have been
www.annualreviews.org • The Ecology and Evolution of Cancer 361
Ann
u. R
ev. G
enet
. 201
6.50
:347
-369
. Dow
nloa
ded
from
ww
w.a
nnua
lrev
iew
s.or
g A
cces
s pr
ovid
ed b
y O
klah
oma
Stat
e U
nive
rsity
- S
tillw
ater
on
09/2
8/17
. For
per
sona
l use
onl
y.
GE50CH16-Wu ARI 25 October 2016 10:24
carried out (81, 123, 129, 147). These theories are often built on the coalescence framework ofpopulation genetics (140).
Only a handful of studies have been carried out to explicitly compare the observed intratumordiversity with the theoretical predictions. These studies look for unexpectedly large clones as anindication of positive selection, and all concluded that neutral evolution is an adequate explanationfor the observed intratumor diversity (81, 123, 129, 147).
It should nevertheless be noted that the failure to reject a null hypothesis might be due to thelow power of the test because of, for example, insufficient sampling. Indeed, few cancer evolutionstudies sequenced more than a small number of samples from the same cell population. Althoughseveral studies have genotyped a few more samples, the power and resolution of cancer evolutionstudies are quite low in comparison with studies of natural populations, which usually sequence tensor hundreds of samples. Furthermore, there is an important distinction between solid tumors andleukemia. A strong spatial structure in solid tumors permits local sampling of cells belonging to agenealogical clone. Bulk sequencing of local samples can thus substitute for single cell sequencing,which remains impractical at present. Leukemia samples do not contain spatial information forgenealogical analyses.
Ling et al. (81) sequenced 23 samples, and genotyped 286 in total, from a plane in the middle of a3.5-cm liver tumor. They showed that the 35 mutation clones follow the predicted size distribution.The power of the neutrality test is demonstrated because a small number of unexpectedly largeclones should have been able to reject the neutral model. The issue of power may be relevant to thestudy of Williams et al. (147), who used the mutations that are locally polymorphic but globallyrare for the test against neutrality. Wang et al. (141) suggested that mutations with globally lowfrequencies in the whole tumor offer little power to distinguish between selection and neutrality.
Tao et al. (129, 130) used a qualitative test by comparing descendant clones with their parents in12 cases of hepatocellular carcinoma with multiple tumors in the same liver. The younger clones,having additional mutations, should have started proliferating later and are expected to be smallerunder the neutral model. They found that clonal comparisons within a single tumor invariablyuphold the neutral model. Most interesting of all, when the same test is used on different tumorsof the same organ of the same patient, the neutral model is rejected in all seven informative cases.
Implications of Neutral Diversity within Tumors
The amount of within-population diversity should generally be larger under neutrality than underselection (38, 40, 45, 59, 63, 79, 89, 127, 151). If diversity-enhancing selection is suspected tobe operative (64), it needs to be defined with clearly formulated predictions. Under neutrality,Ling et al. (81) suggested that under a model with the average mutation rate, the number ofcoding mutations in a 3.5-cM liver tumor is expected to be greater than 100 million. The level ofintratumor diversity is mainly a function of the number of cells in the tumor.
Although the large diversity may seem discouraging, it is important to note that the bulkof mutations exist in fewer than 100 cells. Many therapeutic strategies (47, 113, 122) aiming atpreventing the spread of resistance work particularly well if the resistance mutations are rare in thecell populations. The data on relapses appear to support that position. Hence, the evolutionaryapproaches to cancer can be clinically relevant.
CONCLUSIONS: EVOLUTIONARY AND MEDICAL IMPLICATIONS
This review explores the means by which evolutionary forces operate across scales, from macroto micro to the ultramicro cancer evolution. Because the action of natural selection can only be
362 Wu et al.
Ann
u. R
ev. G
enet
. 201
6.50
:347
-369
. Dow
nloa
ded
from
ww
w.a
nnua
lrev
iew
s.or
g A
cces
s pr
ovid
ed b
y O
klah
oma
Stat
e U
nive
rsity
- S
tillw
ater
on
09/2
8/17
. For
per
sona
l use
onl
y.
GE50CH16-Wu ARI 25 October 2016 10:24
inferred, its central role in organismal evolution has been challenged twice in the past century,the first time by the mutationist school and the second time by neutralism (99). Cautions againstexcessive invocation of natural selection have also been raised many times (53).
In this review, using standard population genetics theory on published results, we find thatselection operates with lower efficacy in cancer evolution than in natural populations. This is truein both Stage I and II (see Figure 1). Selection efficacy is a function of Nes, and Ne may be rathersmall in tumorigenesis. This review also finds extensive negative selection against nonsynony-mous mutations, which greatly outnumber those under positive selection. Given the absence ofrecombination, the interference of positive and negative selection (the Hill-Robertson effect; 23,61) renders selection rather ineffective. This mutual interference is particularly strong when themutation rate is large.
A caveat is that this review only addresses selection on single nucleotide substitutions. Differenttypes of genetic variants may be under different selective pressures. Hence, copy number variation(CNV) or epigenetic changes could be driven by selection, as is often suggested (26, 32, 84, 100,113). The efficacy (or lack of ) of selection on such variants, however, remains unclear. For example,mutational hot spots for CNVs are not uncommon, and their occurrences in tumors could be dueto mutation, selection, or both.
The conclusions of this review have both medical and evolutionary implications. First, theoverall weak selection has not led to the strong genotypic convergence, as had been hoped for.Nevertheless, the convergence in phenotypes is manifested in the many cancer hallmarks (57).Whether cancer therapy should target such convergent phenotypes, instead of genotypes, is aninteresting question. Targeting the genotype implies a therapy that is exquisitely tuned to each in-dividual. Although we have seen limited successes using this approach, making it a widespread andcommon approach is an uncertain prospect. Phenotypic convergence, old fashioned as it may be,remains a viable therapeutic option. Second, although evolutionary principles help us understandtumorigenesis, the reverse is also true. There are many long-standing, seemingly unresolvablequestions in evolutionary biology that may find answers in tumorigenesis. The questions of evo-lutionary convergence (52), mutational meltdown (72, 83), and the origin of multicellularity areintriguing examples.
DISCLOSURE STATEMENT
The authors are not aware of any affiliations, memberships, funding, or financial holdings thatmight be perceived as affecting the objectivity of this review.
ACKNOWLEDGMENTS
We are grateful to Carlo Maley, Aurora Nedelcu, Darryl Shibata, Hu Zheng, and a memberof the Annual Review of Genetics editorial board for the most helpful comments. This studywas supported by the following grants: the National Basic Research Program (973 Program)of China (2014CB542006 to C.-I.W.), Research Programs of the Chinese Academy of Sciences(XDB13040300 to X.L. and C.-I.W.), a University of Chicago Comprehensive Cancer CenterPilot project (C.-I.W.), the National Science Foundation of China grant (91531305 to X.L.),grants from the College of Medicine, National Taiwan University and Ministry of Science andTechnology, Taiwan (105-2918-I-002-014 to H.-Y. W.), and the 985 Project (33000-18821105to C.-I.W.)
www.annualreviews.org • The Ecology and Evolution of Cancer 363
Ann
u. R
ev. G
enet
. 201
6.50
:347
-369
. Dow
nloa
ded
from
ww
w.a
nnua
lrev
iew
s.or
g A
cces
s pr
ovid
ed b
y O
klah
oma
Stat
e U
nive
rsity
- S
tillw
ater
on
09/2
8/17
. For
per
sona
l use
onl
y.

GE50CH16-Wu ARI 25 October 2016 10:24
LITERATURE CITED
1. Abegglen LM, Caulin AF, Chan A, Lee K, Robinson R, et al. 2015. Potential mechanisms for cancerresistance in elephants and comparative cellular response to DNA damage in humans. JAMA 314:1850–60
2. Alexandrov LB, Nik-Zainal S, Wedge DC, Aparicio SAJR, Behjati S, et al. 2013. Signatures of mutationalprocesses in human cancer. Nature 500:415–21
3. Almendro V, Marusyk A, Polyak K. 2013. Cellular heterogeneity and molecular evolution in cancer.Annu. Rev. Pathol. Mech. Dis. 8:277–302
4. Amabile G, Di Ruscio A, Muller F, Welner RS, Yang H, et al. 2015. Dissecting the role of aberrantDNA methylation in human leukaemia. Nat. Commun. 6:7091
5. Babur Z, Gonen M, Aksoy BA, Schultz N, Ciriello G, et al. 2015. Systematic identification of cancerdriving signaling pathways based on mutual exclusivity of genomic alterations. Genome Biol. 16:45
6. Barber LJ, Davies MN, Gerlinger M. 2015. Dissecting cancer evolution at the macro-heterogeneity andmicro-heterogeneity scale. Curr. Opin. Genet. Dev. 30:1–6
7. Bashashati A, Haffari G, Ding JR, Ha G, Lui K, et al. 2012. DriverNet: uncovering the impact of somaticdriver mutations on transcriptional networks in cancer. Genome Biol. 13:R124
8. Basil CF, Zhao YD, Zavaglia K, Jin P, Panelli MC, et al. 2006. Common cancer biomarkers. Cancer Res.66:2953–61
9. Basu-Roy U, Bayin NS, Rattanakorn K, Han E, Placantonakis DG, et al. 2015. Sox2 antagonizes theHippo pathway to maintain stemness in cancer cells. Nature Commun. 6:6411
10. Beckman RA, Loeb LA. 2005. Negative clonal selection in tumor evolution. Genetics 171:2123–3111. Beroukhim R, Mermel CH, Porter D, Wei G, Raychaudhuri S, et al. 2010. The landscape of somatic
copy-number alteration across human cancers. Nature 463:899–90512. Bignell GR, Greenman CD, Davies H, Butler AP, Edkins S, et al. 2010. Signatures of mutation and
selection in the cancer genome. Nature 463:893–9813. Blighe K. 2014. Cancer mutations and their tissue-specific nature. J. Cancer Sci. Ther. 6:9–1114. Bodmer W. 2008. Genetic instability is not a requirement for tumor development. Cancer Res. 68:3558–6115. Bozic I, Antal T, Ohtsuki H, Carter H, Kim D, et al. 2013. Accumulation of driver and passenger
mutations during tumor progression. PNAS 107:18545–5016. Brock A, Krause S, Ingber DE. 2015. Control of cancer formation by intrinsic genetic noise and mi-
croenvironmental cues. Nat. Rev. Cancer 15:499–50917. Brocks D, Assenov Y, Minner S, Bogatyrova O, Simon R, et al. 2014. Intratumor DNA methylation
heterogeneity reflects clonal evolution in aggressive prostate cancer. Cell Rep. 8:798–80618. Burrell RA, McGranahan N, Bartek J, Swanton C. 2013. The causes and consequences of genetic het-
erogeneity in cancer evolution. Nature 501:338–4519. Cadieu E, Neff MW, Quignon P, Walsh K, Chase K, et al. 2009. Coat variation in the domestic dog is
governed by variants in three genes. Science 326:150–5320. Cairns J. 1975. Mutation selection and the natural history of cancer. Nature 255:197–20021. Caldas C. 2012. Cancer sequencing unravels clonal evolution. Nat. Biotechnol. 30:408–1022. Charlesworth B, Charlesworth D. 2003. Evolution: A Very Short Introduction. Oxford: Oxford Univ. Press.
145 pp.23. Charlesworth B, Charlesworth D. 2010. Elements of Evolutionary Genetics. Englewood, CO: Roberts Co.
Publ.24. Chen H, Lin F, Xing K, He X. 2015. The reverse evolution from multicellularity to unicellularity during
carcinogenesis. Nat. Commun. 6:636725. Cheng X, Kao HY. 2012. Post-translational modifications of PML: consequences and implications.
Front. Oncol. 2:21026. Chong CR, Janne PA. 2013. The quest to overcome resistance to EGFR-targeted therapies in cancer.
Nat. Med. 19:1389–40027. Ciriello G, Miller ML, Aksoy BA, Senbabaoglu Y, Schultz N, Sander C. 2013. Emerging landscape of
oncogenic signatures across human cancers. Nat. Genet. 45:1127–33
364 Wu et al.
Ann
u. R
ev. G
enet
. 201
6.50
:347
-369
. Dow
nloa
ded
from
ww
w.a
nnua
lrev
iew
s.or
g A
cces
s pr
ovid
ed b
y O
klah
oma
Stat
e U
nive
rsity
- S
tillw
ater
on
09/2
8/17
. For
per
sona
l use
onl
y.

GE50CH16-Wu ARI 25 October 2016 10:24
28. Consort. CSAA. 2005. Initial sequence of the chimpanzee genome and comparison with the humangenome. Nature 437:69–87
29. Crespi BJ, Summers K. 2006. Positive selection in the evolution of cancer. Biol. Rev. Camb. Philos. Soc.81:407–24
30. Crow JF, Kimura M. 1970. An Introduction to Population Genetics Theory. New York: Harper Row Publ.31. de Bruin EC, McGranahan N, Mitter R, Salm M, Wedge DC, et al. 2014. Spatial and temporal diversity
in genomic instability processes defines lung cancer evolution. Science 346:251–5632. Ding L, Ley TJ, Larson DE, Miller CA, Koboldt DC, et al. 2012. Clonal evolution in relapsed acute
myeloid leukaemia revealed by whole-genome sequencing. Nature 481:506–1033. Durrett R. 2013. Population genetics of neutral mutations in exponentially growing cancer cell popula-
tions. Ann. Appl. Probab. Off. J. Inst. Math. Stat. 23:230–5034. Durrett R. 2015. Branching Process Models of Cancer. New York: Springer35. Dykhuizen D, Hartl DL. 1980. Selective neutrality of 6PGD allozymes in E. coli and the effects of genetic
background. Genetics 96:801–1736. Eirew P, Steif A, Khattra J, Ha G, Yap D, et al. 2015. Dynamics of genomic clones in breast cancer
patient xenografts at single-cell resolution. Nature 518:422–2637. Ewens WJ. 1972. The sampling theory of selectively neutral alleles. Theor. Popul. Biol. 3:87–11238. Ewens WJ. 2004. Mathematical Population Genetics. New York: Springer39. Ewing AD, Houlahan KE, Hu Y, Ellrott K, Caloian C, et al. 2015. Combining tumor genome simulation
with crowdsourcing to benchmark somatic single-nucleotide-variant detection. Nat. Methods 12:623–3040. Fay JC, Wu CI. 2000. Hitchhiking under positive Darwinian selection. Genetics 155:1405–1341. Fearon ER, Vogelstein B. 1990. A genetic model for colorectal tumorigenesis. Cell 61:759–6742. Foll M, Gaggiotti OE, Daub JT, Vatsiou A, Excoffier L. 2014. Widespread signals of convergent adap-
tation to high altitude in Asia and America. Am. J. Hum. Genet. 95:394–40743. Fox EJ, Prindle MJ, Loeb LA. 2013. Do mutator mutations fuel tumorigenesis? Cancer Metastasis Rev.
32:353–6144. Fu YX. 1996. New statistical tests of neutrality for DNA samples from a population. Genetics 143:557–7045. Fu YX, Li WH. 1993. Statistical tests of neutrality of mutations. Genetics 133:693–70946. Gajewski TF, Schreiber H, Fu Y-X. 2013. Innate and adaptive immune cells in the tumor microenvi-
ronment. Nat. Immunol. 14:1014–2247. Gatenby RA, Silva AS, Gillies RJ, Frieden BR. 2009. Adaptive therapy. Cancer Res. 69:4894–90348. Gerlinger M, Horswell S, Larkin J, Rowan AJ, Salm MP, et al. 2014. Genomic architecture and evolution
of clear cell renal cell carcinomas defined by multiregion sequencing. Nat. Genet. 46:225–3349. Gerlinger M, McGranahan N, Dewhurst SM, Burrell RA, Tomlinson I, Swanton C. 2014. Cancer:
evolution within a lifetime. Annu. Rev. Genet. 48:215–3650. Gerlinger M, Rowan AJ, Horswell S, Larkin J, Endesfelder D, et al. 2012. Intratumor heterogeneity and
branched evolution revealed by multiregion sequencing. New Engl. J. Med. 366:883–9251. Gonzalez-Perez A, Perez-Llamas C, Deu-Pons J, Tamborero D, Schroeder MP, et al. 2013. IntOGen-
mutations identifies cancer drivers across tumor types. Nat. Methods 10:1081–8252. Gould SJ. 1990. Wonderful Life: The Burgess Shale and the Nature of History. New York: WW Norton53. Gould SJ, Lewontin RC. 1979. Spandrels of San Marco and the Panglossian Paradigm: a critique of the
adaptationist program. Proc. R. Soc. Ser. B 205:581–9854. Greaves M, Maley CC. 2012. Clonal evolution in cancer. Nature 481:306–1355. Greenberg AJ, Moran JR, Coyne JA, Wu C-I. 2003. Ecological adaptation during incipient speciation
revealed by precise gene replacement. Science 302:1754–5756. Greenberg AJ, Wu C-I. 2006. Molecular genetics of natural populations. Mol. Biol. Evol. 23:883–8657. Hanahan D, Weinberg RA. 2011. Hallmarks of cancer: the next generation. Cell 144:646–7458. Harris H. 1971. Polymorphism and protein evolution. The neutral mutation–random drift hypothesis.
J. Med. Genet. 8:44459. Hartl DL, Clark AG. 2006. Principle of Population Genetics. Sunderland, MA: Sinauer Assoc.60. Helleday T, Eshtad S, Nik-Zainal S. 2014. Mechanisms underlying mutational signatures in human
cancers. Nat. Rev. Genet. 15:585–98
www.annualreviews.org • The Ecology and Evolution of Cancer 365
Ann
u. R
ev. G
enet
. 201
6.50
:347
-369
. Dow
nloa
ded
from
ww
w.a
nnua
lrev
iew
s.or
g A
cces
s pr
ovid
ed b
y O
klah
oma
Stat
e U
nive
rsity
- S
tillw
ater
on
09/2
8/17
. For
per
sona
l use
onl
y.

GE50CH16-Wu ARI 25 October 2016 10:24
61. Hill WG, Robertson A. 1966. The effect of linkage on limits to artificial selection. Genet. Res. 8:269–9462. Hofree M, Shen JP, Carter H, Gross A, Ideker T. 2013. Network-based stratification of tumor mutations.
Nat. Methods 10:1108–1563. Hudson RR, Kreitman M, Aguade M. 1987. A test of neutral molecular evolution based on nucleotide
data. Genetics 116:153–5964. Hughes AL. 1999. Adaptive Evolution of Genes and Genomes. New York: Oxford Univ. Press. 270 pp.65. Jacobsen A, Silber J, Harinath G, Huse JT, Schultz N, Sander C. 2013. Analysis of microRNA-target
interactions across diverse cancer types. Nat. Struct. Mol. Biol. 20:1325–3266. Jones S, Chen W-D, Parmigiani G, Diehl F, Beerenwinkel N, et al. 2008. Comparative lesion sequencing
provides insights into tumor evolution. PNAS 105:4283–8867. Junttila MR, de Sauvage FJ. 2013. Influence of tumour micro-environment heterogeneity on therapeutic
response. Nature 501:346–5468. Kandoth C, McLellan MD, Vandin F, Ye K, Niu B, et al. 2013. Mutational landscape and significance
across 12 major cancer types. Nature 502:333–3969. Kimura M. 1968. Evolutionary rate at the molecular level. Nature 217:624–2670. Kimura M. 1983. The Neutral Theory of Molecular Evolution. Cambridge: Cambridge Univ. Press71. King JL, Jukes TH. 1969. Non-Darwinian evolution. Science 164:788–9872. Kondrashov AS. 1988. Deleterious mutations and the evolution of sexual reproduction. Nature 336:435–
4073. Kreso A, O’Brien CA, van Galen P, Gan OI, Notta F, et al. 2013. Variable clonal repopulation dynamics
influence chemotherapy response in colorectal cancer. Science 339:543–4874. Lambert A. 2009. The allelic partition for coalescent point processes. Markov Process. Relat. Fields 15:359–
8675. Lande R. 1995. Mutation and conservation. Conserv. Biol. 9:782–9176. Lawrence MS, Stojanov P, Mermel CH, Robinson JT, Garraway LA, et al. 2014. Discovery and saturation
analysis of cancer genes across 21 tumour types. Nature 505:495–50177. Lawrence MS, Stojanov P, Polak P, Kryukov GV, Cibulskis K, et al. 2013. Mutational heterogeneity in
cancer and the search for new cancer-associated genes. Nature 499:214–1878. Lewontin RC, Hubby JL. 1966. A molecular approach to the study of genic heterozygosity in natural
populations. II. Amount of variation and degree of heterozygosity in natural populations of Drosophilapseudoobscura. Genetics 54:595
79. Li W-H. 1997. Molecular Evolution. Sunderland, MA: Sinauer Assoc. 487 pp.80. Li Y, Rogoff HA, Keates S, Gao Y, Murikipudi S, et al. 2015. Suppression of cancer relapse and metastasis
by inhibiting cancer stemness. PNAS 112:1839–4481. Ling S, Hu Z, Yang Z, Yang F, Li Y, et al. 2015. Extremely high genetic diversity in a single tumor
points to prevalence of non-Darwinian cell evolution. PNAS 112:E6496–50582. Lu J, Wu CI. 2005. Weak selection revealed by the whole-genome comparison of the X chromosome
and autosomes of human and chimpanzee. PNAS 102:4063–6783. Lynch M, Burger R, Butcher D, Gabriel W. 1993. The mutational meltdown in asexual populations. J.
Hered. 84:339–4484. Malcikova J, Stano-Kozubik K, Tichy B, Kantorova B, Pavlova S. 2015. Detailed analysis of therapy-
driven clonal evolution of TP53 mutations in chronic lymphocytic leukemia. Leukemia 29:877–8585. Malek JA, Martinez A, Mery E, Ferron G, Huang R, et al. 2012. Gene expression analysis of matched
ovarian primary tumors and peritoneal metastasis. J. Transl. Med. 10:12186. Maley CC, Galipeau PC, Finley JC, Wongsurawat VJ, Li X, et al. 2006. Genetic clonal diversity predicts
progression to esophageal adenocarcinoma. Nat. Genet. 38:468–7387. Martincorena I, Campbell PJ. 2015. Somatic mutation in cancer and normal cells. Science 349:1483–8988. Marusyk A, Almendro V, Polyak K. 2012. Intra-tumour heterogeneity: a looking glass for cancer? Nat.
Rev. Cancer 12:323–3489. McDonald JH, Kreitman MA. 1991. Adaptive protein evolution at the Adh locus in Drosophila. Nature
351:652–5490. McFarland CD, Korolev KS, Kryukov GV, Sunyaev SR, Mirny LA. 2013. Impact of deleterious passenger
mutations on cancer progression. PNAS 110:2910–15
366 Wu et al.
Ann
u. R
ev. G
enet
. 201
6.50
:347
-369
. Dow
nloa
ded
from
ww
w.a
nnua
lrev
iew
s.or
g A
cces
s pr
ovid
ed b
y O
klah
oma
Stat
e U
nive
rsity
- S
tillw
ater
on
09/2
8/17
. For
per
sona
l use
onl
y.

GE50CH16-Wu ARI 25 October 2016 10:24
91. McFarland CD, Yaglom JA, Wojtkowiak JW, Scott JG, Morse DL, et al. 2015. Passenger DNA alter-ations reduce cancer fitness in cell culture and mouse models. bioRxiv 2015:026302
92. McGranahan N, Swanton C. 2015. Biological and therapeutic impact of intratumor heterogeneity incancer evolution. Cancer Cell 27:15–26
93. Messer PW, Petrov DA. 2013. Frequent adaptation and the McDonald-Kreitman test. PNAS 110:8615–20
94. Meyer RS, Purugganan MD. 2013. Evolution of crop species: genetics of domestication and diversifica-tion. Nat. Rev. Genet. 14:840–52
95. Mitra K, Carvunis A-R, Ramesh SK, Ideker T. 2013. Integrative approaches for finding modular structurein biological networks. Nat. Rev. Genet. 14:719–32
96. Moran PAP. 1958. Random processes in genetics. Proc. Camb. Philos. Soc. 54:60–7197. Morris SC. 1998. The Crucible of Creation: The Burgess Shale and the Rise of Animals. Oxford: Oxford Univ.
Press98. Nagy JD, Victor EM, Cropper JH. 2007. Why don’t all whales have cancer? A novel hypothesis resolving
Peto’s paradox. Integr. Comp. Biol. 47:317–2899. Nei M. 1987. Molecular Evolutionary Genetics. New York: Columbia Univ. Press
100. Niederst MJ, Engelman JA. 2013. Bypass mechanisms of resistance to receptor tyrosine kinase inhibitionin lung cancer. Sci. Signal. 6:re6
101. Nowak MA, Michor F, Iwasa Y. 2003. The linear process of somatic evolution. PNAS 100:14966–69102. Nowell PC. 1976. The clonal evolution of tumor cell populations. Science 194:23–28103. Ortmann CA, Kent DG, Nangalia J, Silber Y, Wedge DC, et al. 2015. Effect of mutation order on
myeloproliferative neoplasms. N. Engl. J. Med. 372:601–12104. Ostrow SL, Barshir R, DeGregori J, Yeger-Lotem E, Hershberg R. 2014. Cancer evolution is associated
with pervasive positive selection on globally expressed genes. PLOS Genet. 10:e1004239105. Pardo EP, Godzik A. 2015. Analysis of individual protein regions provides novel insights on cancer
pharmacogenomics. PLOS Comput. Biol. 11:e1004024106. Park SY, Gonen M, Kim HJ, Michor F, Polyak K. 2010. Cellular and genetic diversity in the progression
of in situ human breast carcinomas to an invasive phenotype. J. Clin. Investig. 120:644107. Parker J, Tsagkogeorga G, Cotton JA, Liu Y, Provero P, et al. 2013. Genome-wide signatures of con-
vergent evolution in echolocating mammals. Nature 502:228–31108. Paull EO, Carlin DE, Niepel M, Sorger PK, Haussler D, Stuart JM. 2013. Discovering causal pathways
linking genomic events to transcriptional states using tied diffusion through interacting events (TieDIE).Bioinformatics 29:2757–64
109. Plaks V, Kong N, Werb Z. 2015. The cancer stem cell niche: How essential is the niche in regulatingstemness of tumor cells? Cell Stem Cell 16:225–38
110. Podlaha O, Riester M, De S, Michor F. 2012. Evolution of the cancer genome. Trends Genet. 28:155–63111. Porta-Pardo E, Godzik A. 2014. e-Driver: a novel method to identify protein regions driving cancer.
Bioinformatics 30:3109–14112. Porta-Pardo E, Hrabe T, Godzik A. 2015. A pan-cancer catalogue of driver protein interaction interfaces.
PLOS Comput. Biol. 11:e1004518113. Read AF, Day T, Huijben S. 2011. The evolution of drug resistance and the curious orthodoxy of
aggressive chemotherapy. PNAS 108:10871–77114. Reimand J, Wagih O, Bader GD. 2013. The mutational landscape of phosphorylation signaling in cancer.
Sci. Rep. 3:2651115. Rodrguez-Paredes M, Esteller M. 2011. Cancer epigenetics reaches mainstream oncology. Nat. Med.
17:330–39116. Sabeti PC, Reich DE, Higgins JM, Levine HZ, Richter DJ, et al. 2002. Detecting recent positive selection
in the human genome from haplotype structure. Nature 419:832–37117. Schaefer MH, Serrano L. 2016. Cell type–specific properties and environment shape tissue specificity
of cancer genes. Sci. Rep. 6:20707118. Shendure J, Akey JM. 2015. The origins, determinants, and consequences of human mutations. Science
349:1478–83
www.annualreviews.org • The Ecology and Evolution of Cancer 367
Ann
u. R
ev. G
enet
. 201
6.50
:347
-369
. Dow
nloa
ded
from
ww
w.a
nnua
lrev
iew
s.or
g A
cces
s pr
ovid
ed b
y O
klah
oma
Stat
e U
nive
rsity
- S
tillw
ater
on
09/2
8/17
. For
per
sona
l use
onl
y.

GE50CH16-Wu ARI 25 October 2016 10:24
119. Shibata D, Navidi W, Salovaara R, Li ZH, Aaltonen LA. 1996. Somatic microsatellite mutations asmolecular tumor clocks. Nat. Med. 2:676–81
120. Sieber OM, Tomlinson SR, Tomlinson IPM. 2005. Tissue, cell and stage specificity of (epi)mutationsin cancers. Nat. Rev. Cancer 5:649–55
121. Siegmund KD, Marjoram P, Tavare S, Shibata D. 2011. High DNA methylation pattern intratumoraldiversity implies weak selection in many human colorectal cancers. PLOS ONE 6:e21657
122. Silva AS, Kam Y, Khin ZP, Minton SE, Gillies RJ, Gatenby RA. 2012. Evolutionary approaches toprolong progression-free survival in breast cancer. Cancer Res. 72:6362–70
123. Sottoriva A, Kang H, Ma Z, Graham TA, Salomon MP, et al. 2015. A Big Bang model of human colorectaltumor growth. Nat. Genet. 47:209–16
124. Sulak M, Fong L, Mika K, Chigurupati S, Yon L, et al. 2015. TP53 copy number expansion correlateswith the evolution of increased body size and an enhanced DNA damage response in elephants. bioRxiv2015:028522
125. Swanton C. 2012. Intratumor heterogeneity: evolution through space and time. Cancer Res. 72:4875–82126. Tabassum DP, Polyak K. 2015. Tumorigenesis: It takes a village. Nat. Rev. Cancer 15:473–83127. Tajima F. 1989. Statistical method for testing the neutral mutation hypothesis by DNA polymorphism.
Genetics 123:585–95128. Tamborero D, Gonzalez-Perez A, Perez-Llamas C, Deu-Pons J, Kandoth C, et al. 2013. Comprehensive
identification of mutational cancer driver genes across 12 tumor types. Sci. Rep. 3:2650129. Tao Y, Hu Z, Ling S, Yeh S-H, Zhai W, et al. 2015. Further genetic diversification in multiple tumors
and an evolutionary perspective on therapeutics. bioRxiv 2015:025429130. Tao Y, Ruan J, Yeh S-H, Lu X, Wang Y, et al. 2011. Rapid growth of a hepatocellular carcinoma
and the driving mutations revealed by cell-population genetic analysis of whole-genome data. PNAS108:12042–47
131. Tian X, Azpurua J, Hine C, Vaidya A, Myakishev-Rempel M, et al. 2013. High-molecular-mass hyaluro-nan mediates the cancer resistance of the naked mole rat. Nature 499:346–49
132. Ting C-T, Takahashi A, Wu C-I. 2001. Incipient speciation by sexual isolation in Drosophila: concurrentevolution at multiple loci. PNAS 98:6709–13
133. Vandin F, Upfal E, Raphael BJ. 2011. Algorithms for detecting significantly mutated pathways in cancer.J. Comput. Biol. 18:507–22
134. Vaske CJ, Benz SC, Sanborn JZ, Earl D, Szeto C, et al. 2010. Inference of patient-specific pathwayactivities from multi-dimensional cancer genomics data using PARADIGM. Bioinformatics 26:237–45
135. Vermeulen L, Morrissey E, van der Heijden M, Nicholson AM, Sottoriva A, et al. 2013. Defining stemcell dynamics in models of intestinal tumor initiation. Science 342:995–98
136. Vogelstein B, Papadopoulos N, Velculescu VE, Zhou S, Diaz LA, Kinzler KW. 2013. Cancer genomelandscapes. Science 339:1546–58
137. Voight BF, Kudaravalli S, Wen X, Pritchard JK. 2006. A map of recent positive selection in the humangenome. PLOS Biol. 4:e72
138. Vuong H, Cheng FX, Lin CC, Zhao ZM. 2014. Functional consequences of somatic mutations in cancerusing protein pocket–based prioritization approach. Genome Med. 6:81
139. Waclaw B, Bozic I, Pittman ME, Hruban RH, Vogelstein B, Nowak MA. 2015. A spatial model predictsthat dispersal and cell turnover limit intratumour heterogeneity. Nature 525:261–64
140. Wakely J. 2009. Coalescent Theory: An Introduction. New York: WH Freeman141. Wang X, Jung Y-S, Jun S, Lee S, Wang W, et al. 2016. PAF-Wnt signaling–induced cell plasticity is
required for maintenance of breast cancer cell stemness. Nat. Commun. 7:10633142. Watson IR, Takahashi K, Futreal PA, Chin L. 2013. Emerging patterns of somatic mutations in cancer.
Nat. Rev. Genet. 14:703–18143. Watterson GA. 1978. The homozygosity test of neutrality. Genetics 88:405–17144. Watterson GA. 1984. Lines of descent and the coalescent. Theor. Popul. Biol. 26:77–92145. Weisenberger DJ. 2014. Characterizing DNA methylation alterations from The Cancer Genome Atlas.
J. Clin. Investig. 124:17–23146. Wilding J, Bodmer W. 2015. Genetic instability. In Oxford Textbook of Oncology, ed. DJ Kerr,
DG Haller, CJH van de Velde, M Baumann, pp. 72–81. Oxford: Oxford Univ. Press
368 Wu et al.
Ann
u. R
ev. G
enet
. 201
6.50
:347
-369
. Dow
nloa
ded
from
ww
w.a
nnua
lrev
iew
s.or
g A
cces
s pr
ovid
ed b
y O
klah
oma
Stat
e U
nive
rsity
- S
tillw
ater
on
09/2
8/17
. For
per
sona
l use
onl
y.

GE50CH16-Wu ARI 25 October 2016 10:24
147. Williams MJ, Werner B, Barnes CP, Graham TA, Sottoriva A. 2016. Identification of neutral tumorevolution across cancer types. Nat. Genet. 48:238–44
148. Wu X, Kimmel M. 2013. Modeling neutral evolution using an infinite-allele Markov branching process.Int. J. Stoch. Anal. 2013:963831
149. Yates LR, Campbell PJ. 2012. Evolution of the cancer genome. Nat. Rev. Genet. 13:795–806150. Zack TI, Schumacher SE, Carter SL, Cherniack AD, Saksena G, et al. 2013. Pan-cancer patterns of
somatic copy number alteration. Nat. Genet. 45:1134–40151. Zeng K, Shi S, Wu C-I. 2007. Compound tests for the detection of hitchhiking under positive selection.
Mol. Biol. Evol. 24:1898–908152. Zhao JF, Cheng FX, Wang YY, Arteaga CL, Zhao ZM. 2016. Systematic prioritization of druggable
mutations in similar to 5000 genomes across 16 cancer types using a structural genomics-based approach.Mol. Cell. Proteom. 15:642–56
153. Zhen Y, Aardema ML, Medina EM, Schumer M, Andolfatto P. 2012. Parallel molecular evolution in anherbivore community. Science 337:1634–37
154. Zhong S, Khodursky A, Dykhuixen DE, Dean AM. 2004 Evolutionary genomics of ecologicalspecialization. PNAS 101:11719–24
www.annualreviews.org • The Ecology and Evolution of Cancer 369
Ann
u. R
ev. G
enet
. 201
6.50
:347
-369
. Dow
nloa
ded
from
ww
w.a
nnua
lrev
iew
s.or
g A
cces
s pr
ovid
ed b
y O
klah
oma
Stat
e U
nive
rsity
- S
tillw
ater
on
09/2
8/17
. For
per
sona
l use
onl
y.

ANNUAL REVIEWSConnect With Our Experts
New From Annual Reviews:Annual Review of Cancer Biologycancerbio.annualreviews.org • Volume 1 • March 2017
Co-Editors: Tyler Jacks, Massachusetts Institute of Technology Charles L. Sawyers, Memorial Sloan Kettering Cancer Center
The Annual Review of Cancer Biology reviews a range of subjects representing important and emerging areas in the field of cancer research. The Annual Review of Cancer Biology includes three broad themes: Cancer Cell Biology, Tumorigenesis and Cancer Progression, and Translational Cancer Science.
TABLE OF CONTENTS FOR VOLUME 1:• How Tumor Virology Evolved into Cancer Biology and
Transformed Oncology, Harold Varmus• The Role of Autophagy in Cancer, Naiara Santana-Codina,
Joseph D. Mancias, Alec C. Kimmelman• Cell Cycle–Targeted Cancer Therapies, Charles J. Sherr,
Jiri Bartek• Ubiquitin in Cell-Cycle Regulation and Dysregulation
in Cancer, Natalie A. Borg, Vishva M. Dixit• The Two Faces of Reactive Oxygen Species in Cancer,
Colleen R. Reczek, Navdeep S. Chandel• Analyzing Tumor Metabolism In Vivo, Brandon Faubert,
Ralph J. DeBerardinis• Stress-Induced Mutagenesis: Implications in Cancer
and Drug Resistance, Devon M. Fitzgerald, P.J. Hastings, Susan M. Rosenberg
• Synthetic Lethality in Cancer Therapeutics, Roderick L. Beijersbergen, Lodewyk F.A. Wessels, René Bernards
• Noncoding RNAs in Cancer Development, Chao-Po Lin, Lin He
• p53: Multiple Facets of a Rubik’s Cube, Yun Zhang, Guillermina Lozano
• Resisting Resistance, Ivana Bozic, Martin A. Nowak• Deciphering Genetic Intratumor Heterogeneity
and Its Impact on Cancer Evolution, Rachel Rosenthal, Nicholas McGranahan, Javier Herrero, Charles Swanton
• Immune-Suppressing Cellular Elements of the Tumor Microenvironment, Douglas T. Fearon
• Overcoming On-Target Resistance to Tyrosine Kinase Inhibitors in Lung Cancer, Ibiayi Dagogo-Jack, Jeffrey A. Engelman, Alice T. Shaw
• Apoptosis and Cancer, Anthony Letai• Chemical Carcinogenesis Models of Cancer: Back
to the Future, Melissa Q. McCreery, Allan Balmain• Extracellular Matrix Remodeling and Stiffening Modulate
Tumor Phenotype and Treatment Response, Jennifer L. Leight, Allison P. Drain, Valerie M. Weaver
• Aneuploidy in Cancer: Seq-ing Answers to Old Questions, Kristin A. Knouse, Teresa Davoli, Stephen J. Elledge, Angelika Amon
• The Role of Chromatin-Associated Proteins in Cancer, Kristian Helin, Saverio Minucci
• Targeted Differentiation Therapy with Mutant IDH Inhibitors: Early Experiences and Parallels with Other Differentiation Agents, Eytan Stein, Katharine Yen
• Determinants of Organotropic Metastasis, Heath A. Smith, Yibin Kang
• Multiple Roles for the MLL/COMPASS Family in the Epigenetic Regulation of Gene Expression and in Cancer, Joshua J. Meeks, Ali Shilatifard
• Chimeric Antigen Receptors: A Paradigm Shift in Immunotherapy, Michel Sadelain
ANNUAL REVIEWS | CONNECT WITH OUR EXPERTS
650.493.4400/800.523.8635 (us/can)www.annualreviews.org | [email protected]
ONLINE NOW!
Ann
u. R
ev. G
enet
. 201
6.50
:347
-369
. Dow
nloa
ded
from
ww
w.a
nnua
lrev
iew
s.or
g A
cces
s pr
ovid
ed b
y O
klah
oma
Stat
e U
nive
rsity
- S
tillw
ater
on
09/2
8/17
. For
per
sona
l use
onl
y.

GE50-FrontMatter ARI 21 October 2016 7:49
Annual Review ofGenetics
Volume 50, 2016
Contents
A Life Investigating Pathways that Repair Broken ChromosomesJames E. Haber � � � � � � � � � � � � � � � � � � � � � � � � � � � � � � � � � � � � � � � � � � � � � � � � � � � � � � � � � � � � � � � � � � � � � � � � � � � � � � � � � 1
Sex-Biased Gene ExpressionSonja Grath and John Parsch � � � � � � � � � � � � � � � � � � � � � � � � � � � � � � � � � � � � � � � � � � � � � � � � � � � � � � � � � � � � � � � � �29
Aneuploidy in Cancer and AgingRyan M. Naylor and Jan M. van Deursen � � � � � � � � � � � � � � � � � � � � � � � � � � � � � � � � � � � � � � � � � � � � � � � � � �45
Transition Metals and Virulence in BacteriaLauren D. Palmer and Eric P. Skaar � � � � � � � � � � � � � � � � � � � � � � � � � � � � � � � � � � � � � � � � � � � � � � � � � � � � � � � �67
Sperm Meets Egg: The Genetics of Mammalian FertilizationEnrica Bianchi and Gavin J. Wright � � � � � � � � � � � � � � � � � � � � � � � � � � � � � � � � � � � � � � � � � � � � � � � � � � � � � � � �93
Robust Yet Fragile: Expression Noise, Protein Misfolding, and GeneDosage in the Evolution of GenomesJ. Chris Pires and Gavin C. Conant � � � � � � � � � � � � � � � � � � � � � � � � � � � � � � � � � � � � � � � � � � � � � � � � � � � � � � � 113
Evolution in the Cycles of LifeJohn L. Bowman, Keiko Sakakibara, Chihiro Furumizu, and Tom Dierschke � � � � � � � � � � 133
Functions, Regulation, and Therapeutic Implications of the ATRCheckpoint PathwayStephanie A. Yazinski and Lee Zou � � � � � � � � � � � � � � � � � � � � � � � � � � � � � � � � � � � � � � � � � � � � � � � � � � � � � � � � 155
Control of Meiotic Crossovers: From Double-Stand Break Formationto DesignationStephen Gray and Paula E. Cohen � � � � � � � � � � � � � � � � � � � � � � � � � � � � � � � � � � � � � � � � � � � � � � � � � � � � � � � � � 175
The Plant Microbiota: Systems-Level Insights and PerspectivesDaniel B. Muller, Christine Vogel, Yang Bai, and Julia A. Vorholt � � � � � � � � � � � � � � � � � � � � � 211
Genome-Wide Analysis of RNA Secondary StructurePhilip C. Bevilacqua, Laura E. Ritchey, Zhao Su, and Sarah M. Assmann � � � � � � � � � � � � � 235
Single-Cell and Single-Molecule Analysis of Gene Expression RegulationMaria Vera, Jeetayu Biswas, Adrien Senecal, Robert H. Singer, and Hye Yoon Park � � 267
Conservation and Variability of Meiosis Across the EukaryotesJosef Loidl � � � � � � � � � � � � � � � � � � � � � � � � � � � � � � � � � � � � � � � � � � � � � � � � � � � � � � � � � � � � � � � � � � � � � � � � � � � � � � � � � � � � 293
Monoallelic Gene Expression in MammalsAndrew Chess � � � � � � � � � � � � � � � � � � � � � � � � � � � � � � � � � � � � � � � � � � � � � � � � � � � � � � � � � � � � � � � � � � � � � � � � � � � � � � � � 317
v
Ann
u. R
ev. G
enet
. 201
6.50
:347
-369
. Dow
nloa
ded
from
ww
w.a
nnua
lrev
iew
s.or
g A
cces
s pr
ovid
ed b
y O
klah
oma
Stat
e U
nive
rsity
- S
tillw
ater
on
09/2
8/17
. For
per
sona
l use
onl
y.

GE50-FrontMatter ARI 21 October 2016 7:49
Proteopathic Strains and the Heterogeneity of Neurodegenerative DiseasesLary C. Walker � � � � � � � � � � � � � � � � � � � � � � � � � � � � � � � � � � � � � � � � � � � � � � � � � � � � � � � � � � � � � � � � � � � � � � � � � � � � � � 329
The Ecology and Evolution of Cancer: The Ultra-Microevolutionary ProcessChung-I Wu, Hurng-Yi Wang, Shaoping Ling, and Xuemei Lu � � � � � � � � � � � � � � � � � � � � � � � 347
Regulation and Role of Fungal Secondary MetabolitesJuliane Macheleidt, Derek J. Mattern, Juliane Fischer, Tina Netzker,
Jakob Weber, Volker Schroeckh, Vito Valiante, and Axel A. Brakhage � � � � � � � � � � � � � � � 371
Eukaryotic DNA Polymerases in Homologous RecombinationMitch McVey, Varandt Y. Khodaverdian, Damon Meyer,
Paula Goncalves Cerqueira, and Wolf-Dietrich Heyer � � � � � � � � � � � � � � � � � � � � � � � � � � � � � � � � � 393
Regulated Proteolysis in Bacteria: CaulobacterKamal Kishore Joshi and Peter Chien � � � � � � � � � � � � � � � � � � � � � � � � � � � � � � � � � � � � � � � � � � � � � � � � � � � � � � 423
Mosquito Vectors and the Globalization of Plasmodium falciparum MalariaAlvaro Molina-Cruz, Martine M. Zilversmit, Daniel E. Neafsey,
Daniel L. Hartl, and Carolina Barillas-Mury � � � � � � � � � � � � � � � � � � � � � � � � � � � � � � � � � � � � � � � � � 447
Plant Transgenerational EpigeneticsLeandro Quadrana and Vincent Colot � � � � � � � � � � � � � � � � � � � � � � � � � � � � � � � � � � � � � � � � � � � � � � � � � � � � � 467
The Genetics of Enteropathogenic Escherichia coli VirulenceJaclyn S. Pearson, Cristina Giogha, Tania Wong Fok Lung,
and Elizabeth L. Hartland � � � � � � � � � � � � � � � � � � � � � � � � � � � � � � � � � � � � � � � � � � � � � � � � � � � � � � � � � � � � � � � 493
Deciphering Combinatorial GeneticsAlan S.L. Wong, Gigi C.G. Choi, and Timothy K. Lu � � � � � � � � � � � � � � � � � � � � � � � � � � � � � � � � � � � 515
Interorgan Communication Pathways in Physiology: Focus onDrosophilaIlia A. Droujinine and Norbert Perrimon � � � � � � � � � � � � � � � � � � � � � � � � � � � � � � � � � � � � � � � � � � � � � � � � � 539
Cell-Specific Targeting of Genetically Encoded Tools forNeuroscienceLucas Sjulson, Daniela Cassataro, Shamik DasGupta, and Gero Miesenbock � � � � � � � � � � � 571
Vaccination via Chloroplast Genetics: Affordable Protein Drugs forthe Prevention and Treatment of Inherited or Infectious HumanDiseasesHenry Daniell, Hui-Ting Chan, and Elise K. Pasoreck � � � � � � � � � � � � � � � � � � � � � � � � � � � � � � � � � � � 595
Errata
An online log of corrections to Annual Review of Genetics articles may be found athttp://www.annualreviews.org/errata/genet
vi Contents
Ann
u. R
ev. G
enet
. 201
6.50
:347
-369
. Dow
nloa
ded
from
ww
w.a
nnua
lrev
iew
s.or
g A
cces
s pr
ovid
ed b
y O
klah
oma
Stat
e U
nive
rsity
- S
tillw
ater
on
09/2
8/17
. For
per
sona
l use
onl
y.

Ann
u. R
ev. G
enet
. 201
6.50
:347
-369
. Dow
nloa
ded
from
ww
w.a
nnua
lrev
iew
s.or
g A
cces
s pr
ovid
ed b
y O
klah
oma
Stat
e U
nive
rsity
- S
tillw
ater
on
09/2
8/17
. For
per
sona
l use
onl
y.