annual shareholder meeting -...
TRANSCRIPT

ANNUAL SHAREHOLDER MEETINGJANUARY 5, 2016

SAFE HARBOR STATEMENT
Statements in this presentation are "forward-looking statements" within the meaning of the Private Securities Litigation
Reform Act. The forward-looking statements can generally be identified by words such as "believes," "anticipates,"
"expects" or words of similar meaning. Forward-looking statements also include statements relating to the Company's
future performance, such as future prospects, revenues, profits and cash flows. The forward-looking statements are
subject to risks and uncertainties, which may cause actual results to be materially different from any future performance
suggested in the forward-looking statements. Such risks and uncertainties include those factors described in Part 1A of
the Company’s most recent Annual Report on Form 10-K, as such may be amended or supplemented by subsequent
Quarterly Reports on Form 10-Q or other reports filed with the Securities and Exchange Commission. Readers are
cautioned not to place undue reliance on these forward-looking statements. The forward-looking statements are made
only as of the date hereof, and the Company undertakes no obligation to publicly release the result of any revisions to
these forward-looking statements. For more information, please refer to the Company’s filings with the Securities and
Exchange Commission.
During this presentation, we will discuss GAAP measure such as net income, as well as certain non-GAAP measures
such as EBITDA. We have posted on www.investor.arinet.com, a reconciliation of these non-GAAP financial measures
to the most comparable financial measures under GAAP.
1
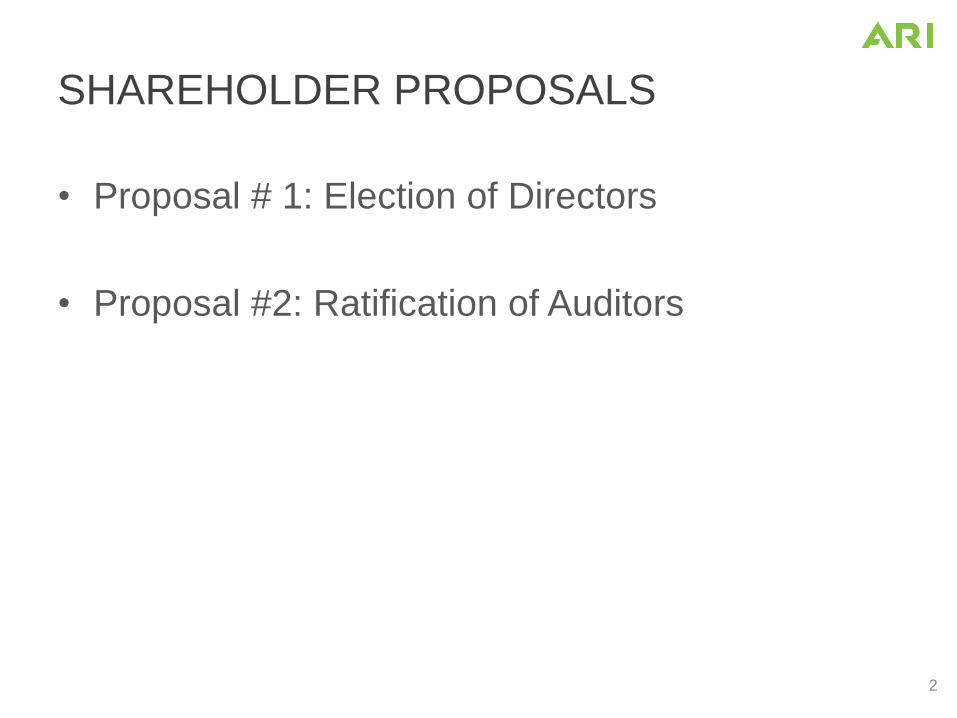
SHAREHOLDER PROPOSALS
• Proposal # 1: Election of Directors
• Proposal #2: Ratification of Auditors
2

QUESTIONS?
3
REVIEW ACTUAL VS. FY15 “OUTLOOK”
Roy W. Olivier – President & CEO
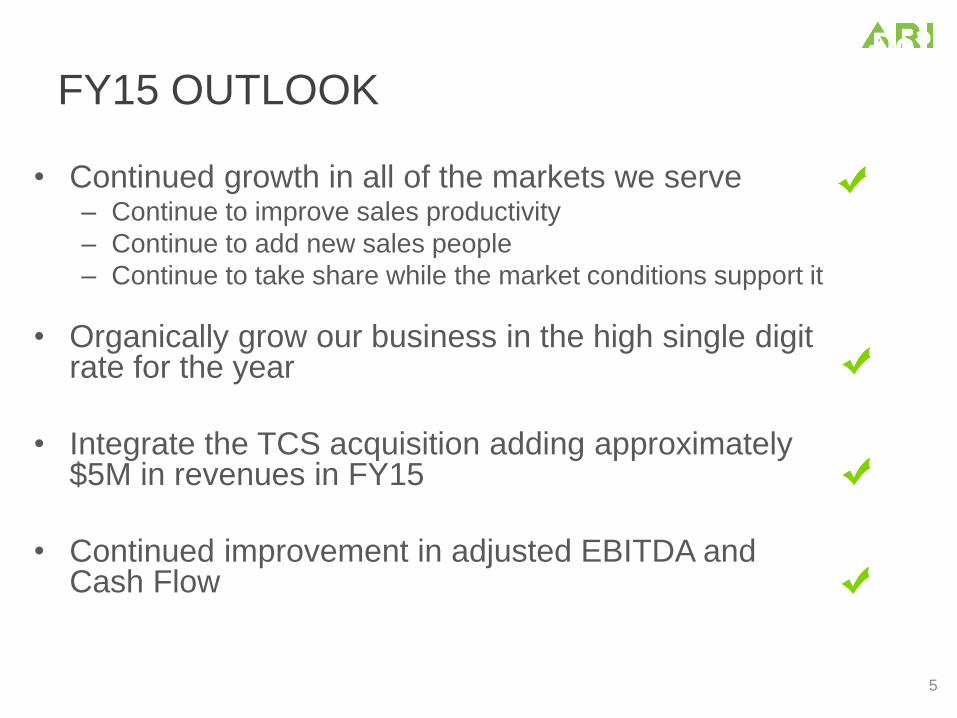
FY15 OUTLOOK
• Continued growth in all of the markets we serve– Continue to improve sales productivity
– Continue to add new sales people
– Continue to take share while the market conditions support it
• Organically grow our business in the high single digit rate for the year
• Integrate the TCS acquisition adding approximately $5M in revenues in FY15
• Continued improvement in adjusted EBITDA and Cash Flow
5
FY15 Outlook – How Did We Do?

INCREASING SHAREHOLDER VALUE
6
Stock Close Gain/Loss ADTV Gain/Loss
Jan 1, 2015 $3.65 22,246
Dec 31, 2015 $4.50 +23% 23,437 +5%
Coverage
Craig Hallum Buy Rating $5.25 Target
Ascendiant Capital Markets, LLC Buy Rating $5.50 Target
H.C. Wainwright & Co. Buy Rating $5.50 Target
Additional Info:
Attended 11 Conferences and conducted 3 Road Shows
Have 20 Institutional Investors vs. 15 in FY14
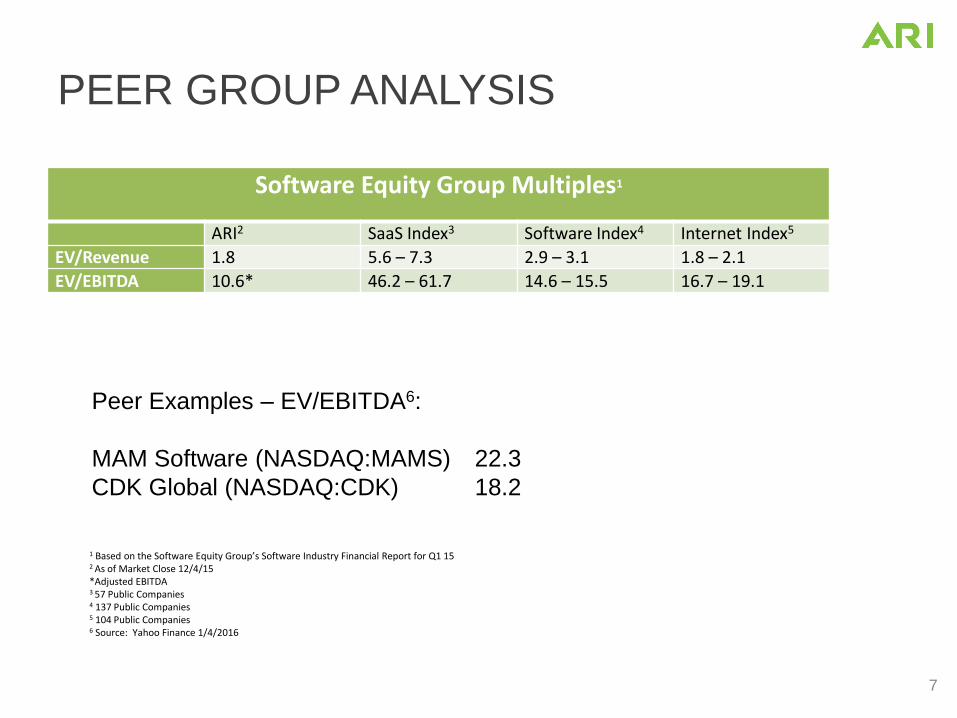
PEER GROUP ANALYSIS
Software Equity Group Multiples1
ARI2 SaaS Index3 Software Index4 Internet Index5
EV/Revenue 1.8 5.6 – 7.3 2.9 – 3.1 1.8 – 2.1
EV/EBITDA 10.6* 46.2 – 61.7 14.6 – 15.5 16.7 – 19.1
7
1 Based on the Software Equity Group’s Software Industry Financial Report for Q1 152 As of Market Close 12/4/15*Adjusted EBITDA3 57 Public Companies4 137 Public Companies5 104 Public Companies6 Source: Yahoo Finance 1/4/2016
Peer Examples – EV/EBITDA6:
MAM Software (NASDAQ:MAMS) 22.3
CDK Global (NASDAQ:CDK) 18.2

FY15 FINANCIAL RESULTS
Bill Nurthen - CFO
8

ANNUAL INCOME STATEMENT SUMMARY
9
(Dollars in Millions, Except Per Share Data)
FY15 FY14 YoY
Revenue $40.4M $33.0M 22.5%
Gross Profit $33.1M $26.6M 24.4%
Operating Income $2.3M $0.4M 550.0%
Net Income $1.1M ($0.1)M 1150.0%
Earnings Per Share $0.07 ($0.01) 800.0%
Adjusted EBITDA* $6.6M $4.4M 48.6%
Gross Margin 81.9% 80.7%
Operating Expenses (as a % of Revenue)
Sales & Marketing 25.8% 28.3%
Customer Operations and Support 19.3% 20.1%
Software Development and Technical Support 10.4% 8.2%
General and Administrative 16.4% 18.8%
Depreciation, Amortization, Other 4.3% 4.1%
Operating Margin 5.7% 1.1%
Adjusted EBITDA Margin 16.3% 13.4%
*Non-Gaap Reconci l iation of Adjusted EBITDA for FY15 and FY14 can be found at investor.arinet.com.
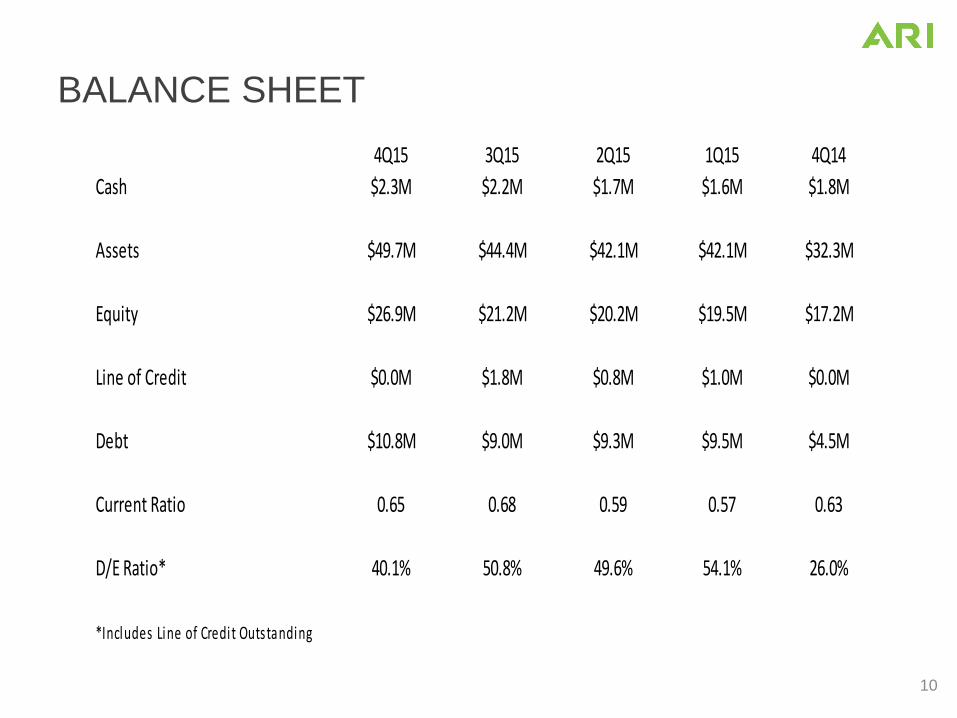
BALANCE SHEET
10
4Q15 3Q15 2Q15 1Q15 4Q14
Cash $2.3M $2.2M $1.7M $1.6M $1.8M
Assets $49.7M $44.4M $42.1M $42.1M $32.3M
Equity $26.9M $21.2M $20.2M $19.5M $17.2M
Line of Credit $0.0M $1.8M $0.8M $1.0M $0.0M
Debt $10.8M $9.0M $9.3M $9.5M $4.5M
Current Ratio 0.65 0.68 0.59 0.57 0.63
D/E Ratio* 40.1% 50.8% 49.6% 54.1% 26.0%
*Includes Line of Credit Outstanding

CASH FLOW SUMMARY
FY15 FY14
Cash Flow Operations $6.3M $2.4M
Capital Expenditures $0.7M $0.6M
Software Development $1.4M $1.8M
Free Cash Flow* $4.2M $0.0M
*Free Cash Flow defined as Cash Flow from Operations less Capital Expenditures and Software Development Capitalized
11

ANNUAL OPERATING METRICS
FY15 FY14
Churn -15.5% -12.6%
CAC Ratio 10.3 12.1
Recurring Revenue % 90.2% 93.6%
Total Dealer Sales Bookings (ACV) $7.0M $6.0M
12

QUARTERLY REVENUE ($ MIL)
13
5.4 5.5 5.7 5.95.9
7.5
8.2 8.5 8.2 8.1 8.28.5
9.1
10.1 10.310.9
0
2
4
6
8
10
12
1Q12 3Q12 1Q13 3Q13 1Q14 3Q14 1Q15 3Q15
ANNUAL TOTAL & RECURRING REVENUE
($ MIL)
14
17.418.7
27.0
30.9
36.5
21.322.5
30.1
33.0
40.4
0.0
5.0
10.0
15.0
20.0
25.0
30.0
35.0
40.0
45.0
FY11 FY12 FY13 FY14 FY15
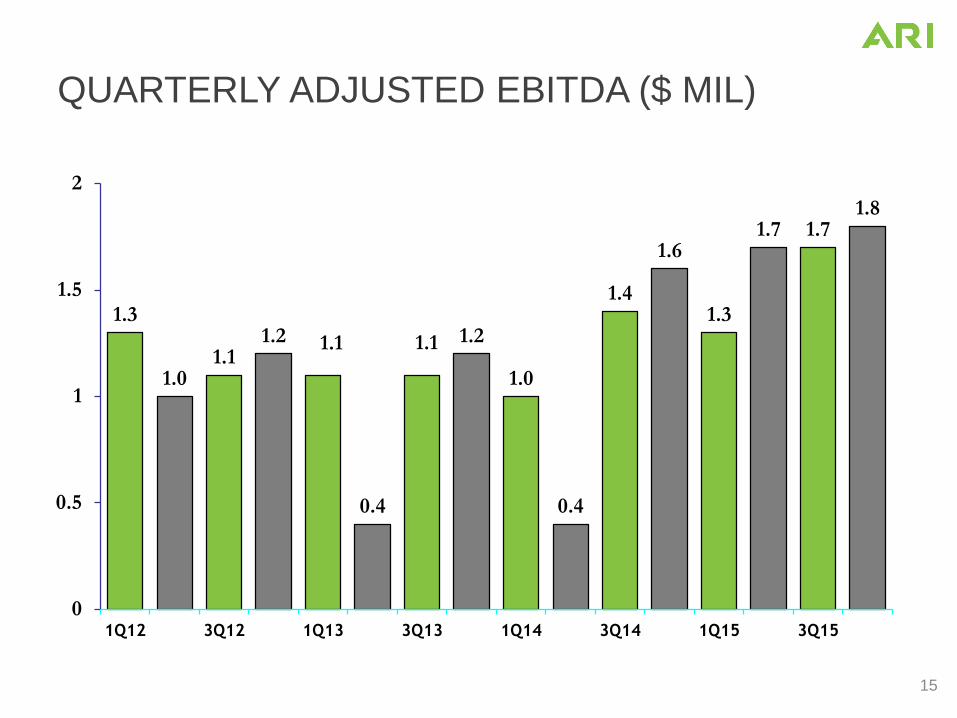
QUARTERLY ADJUSTED EBITDA ($ MIL)
15
1.3
1.01.1
1.2 1.1
0.4
1.1 1.2
1.0
0.4
1.4
1.6
1.3
1.7 1.71.8
0
0.5
1
1.5
2
1Q12 3Q12 1Q13 3Q13 1Q14 3Q14 1Q15 3Q15

ANNUAL ADJUSTED EBITDA ($ MIL)
16
5.2
4.6
3.8
4.4
6.6
0.0
1.0
2.0
3.0
4.0
5.0
6.0
7.0
FY11 FY12 FY13 FY14 FY15
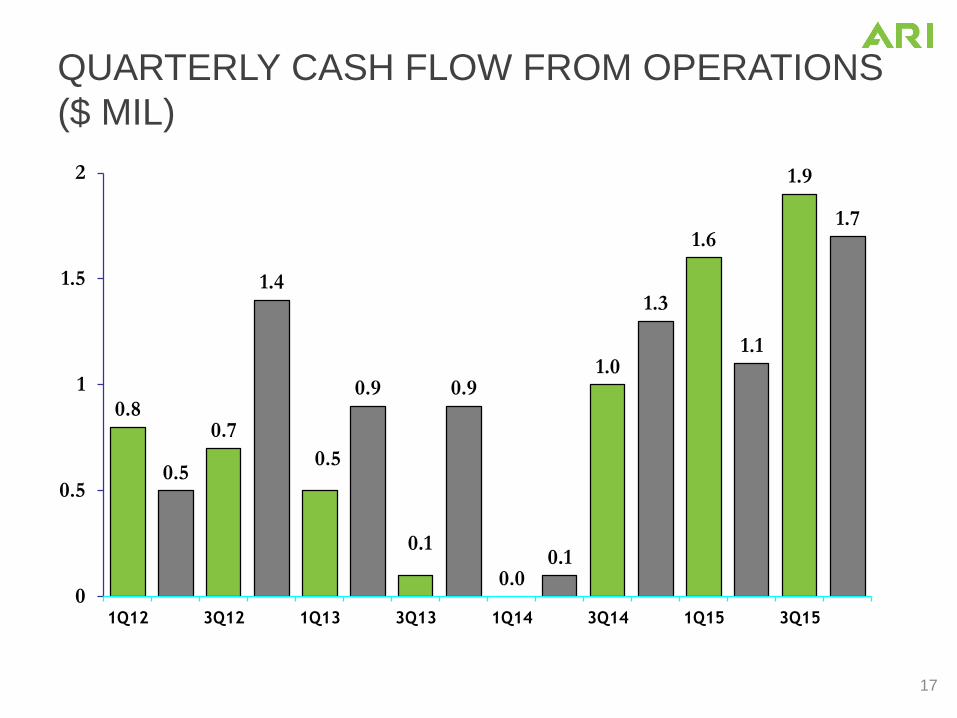
QUARTERLY CASH FLOW FROM OPERATIONS
($ MIL)
17
0.8
0.5
0.7
1.4
0.5
0.9
0.1
0.9
0.00.1
1.0
1.3
1.6
1.1
1.9
1.7
0
0.5
1
1.5
2
1Q12 3Q12 1Q13 3Q13 1Q14 3Q14 1Q15 3Q15
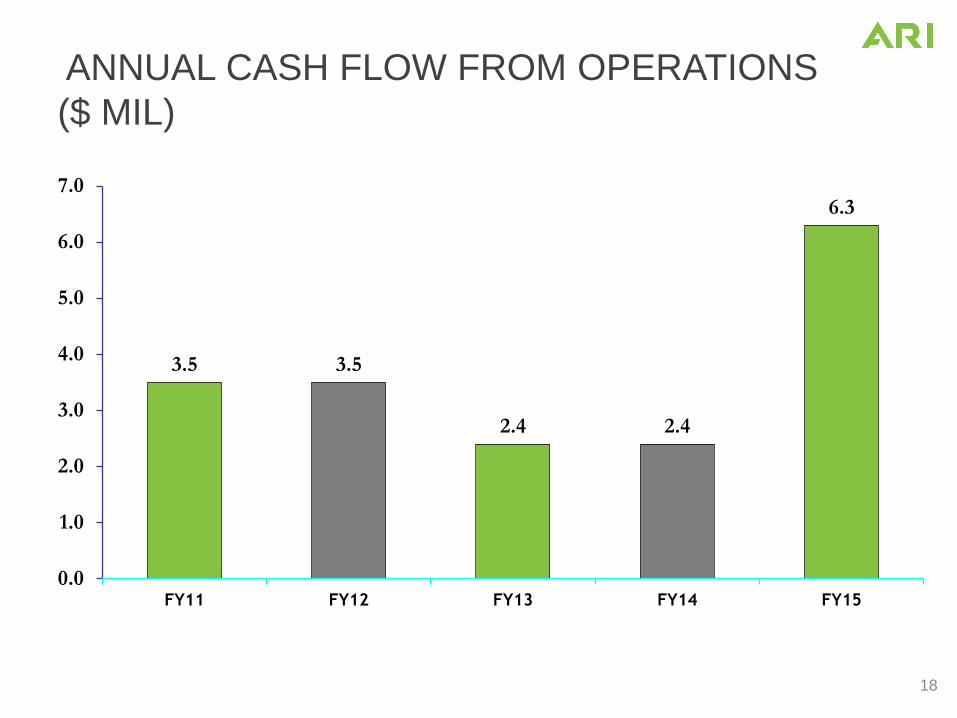
ANNUAL CASH FLOW FROM OPERATIONS
($ MIL)
18
3.5 3.5
2.4 2.4
6.3
0.0
1.0
2.0
3.0
4.0
5.0
6.0
7.0
FY11 FY12 FY13 FY14 FY15

QUARTERLY FREE CASH FLOW ($ MIL)
19
0.2
0.0 0.0
0.8
-0.3
0.4
-0.4
0.2
-0.8 -0.7
0.5
0.9
1.3
0.5
1.4
1.1
-1.0
-0.5
0.0
0.5
1.0
1.5
2.0
1Q12 3Q12 1Q13 3Q13 1Q14 3Q14 1Q15 3Q15
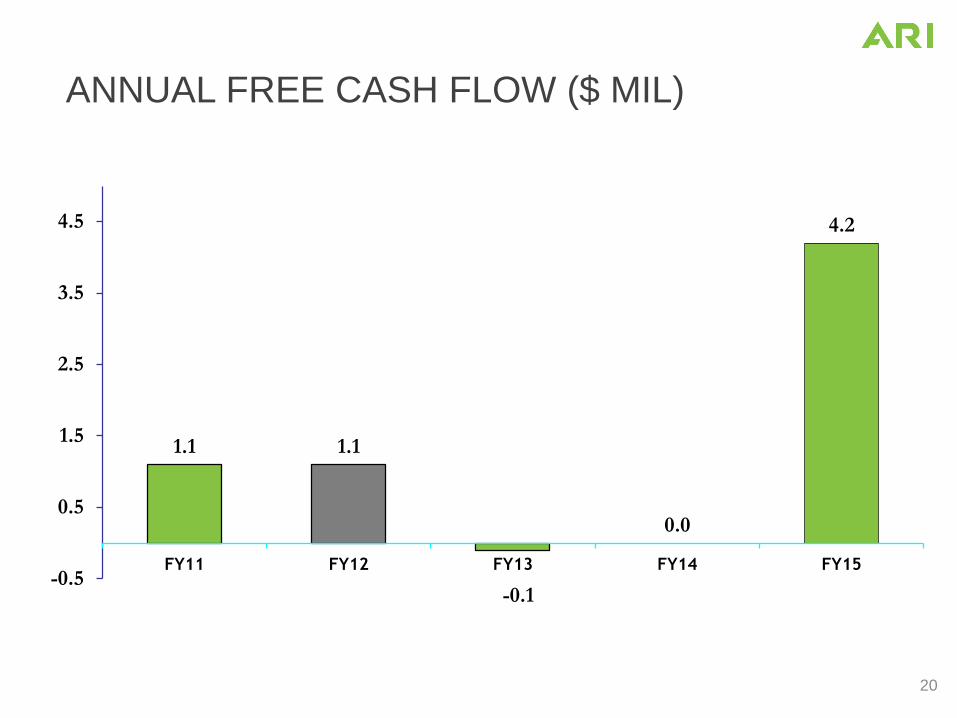
ANNUAL FREE CASH FLOW ($ MIL)
20
1.1 1.1
-0.1
0.0
4.2
-0.5
0.5
1.5
2.5
3.5
4.5
FY11 FY12 FY13 FY14 FY15
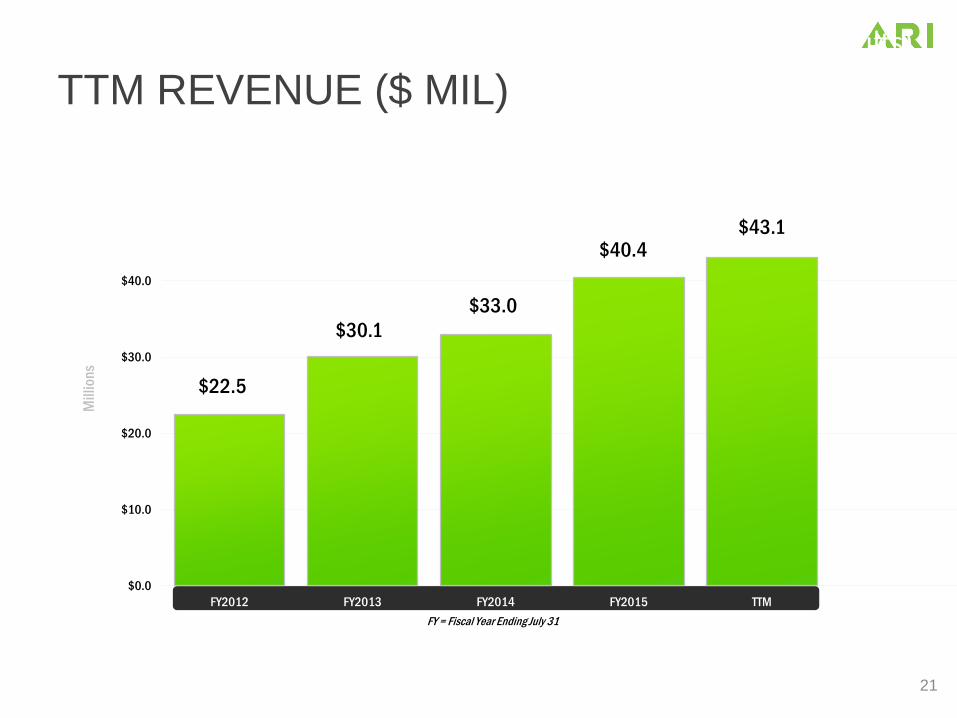
$0.0
$10.0
$20.0
$30.0
$40.0
FY2012 FY2013 FY2014 FY2015 TTM
Mill
ion
s
$43.1
$22.5
$33.0
TTM REVENUE ($ MIL)
21
FY = Fiscal Year Ending July 31
$30.1
$40.4
TTM Revenue (Includes 1Q16 Results)
$0.0
$1.0
$2.0
$3.0
$4.0
$5.0
$6.0
$7.0
$8.0
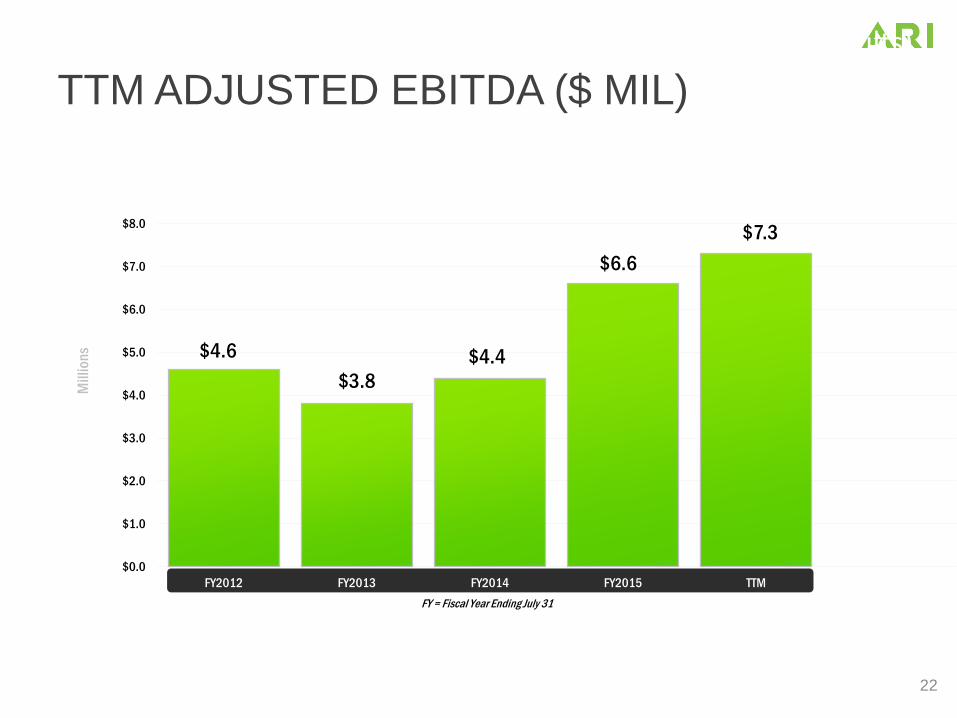
FY2012 FY2013 FY2014 FY2015 TTM
Mill
ion
s $4.6
$3.8
$6.6
TTM ADJUSTED EBITDA ($ MIL)
22
FY = Fiscal Year Ending July 31
$4.4
$7.3
TTM Adjusted EBITDA (Includes 1Q16 Results)
-$1.0
$0.0
$1.0
$2.0
$3.0
$4.0
$5.0
$6.0
$7.0
$8.0
FY12 FY13 FY14 FY15 TTM
ADJ EBITDA Operating Cash Flow Free Cash Flow
$3.8
$4.4
$6.6
$7.3
Mill
ion
s
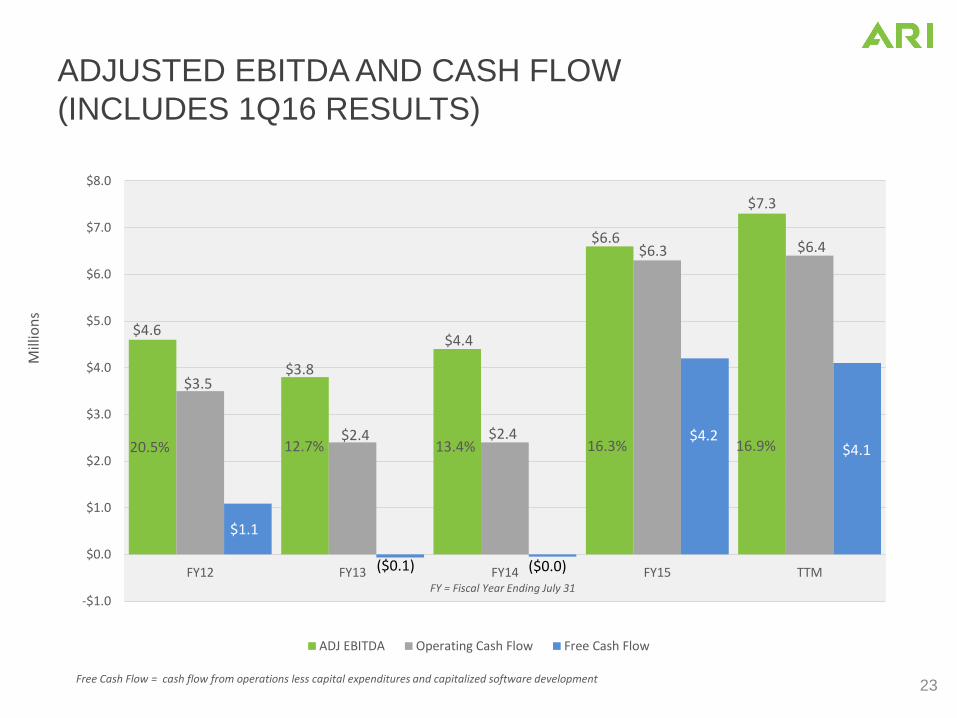
20.5% 12.7% 13.4%
FY = Fiscal Year Ending July 31
16.3% 16.9%
$3.5
ADJUSTED EBITDA AND CASH FLOW
(INCLUDES 1Q16 RESULTS)
23
$4.6
$2.4 $2.4
$6.3 $6.4
$1.1
$4.2
($0.1) ($0.0)
$4.1
Free Cash Flow = cash flow from operations less capital expenditures and capitalized software development
STRATEGY
Roy W. Olivier – President & CEO
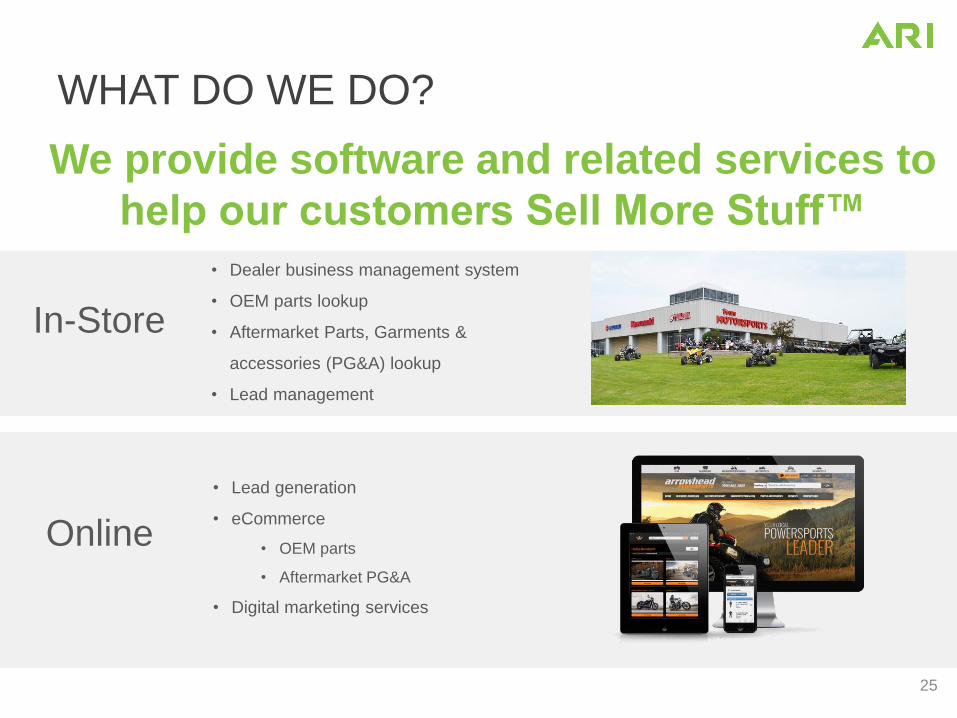
WHAT DO WE DO?
25
We provide software and related services to
help our customers Sell More Stuff™
In-Store
• Dealer business management system
• OEM parts lookup
• Aftermarket Parts, Garments &
accessories (PG&A) lookup
• Lead management
Online
• Lead generation
• eCommerce
• OEM parts
• Aftermarket PG&A
• Digital marketing services
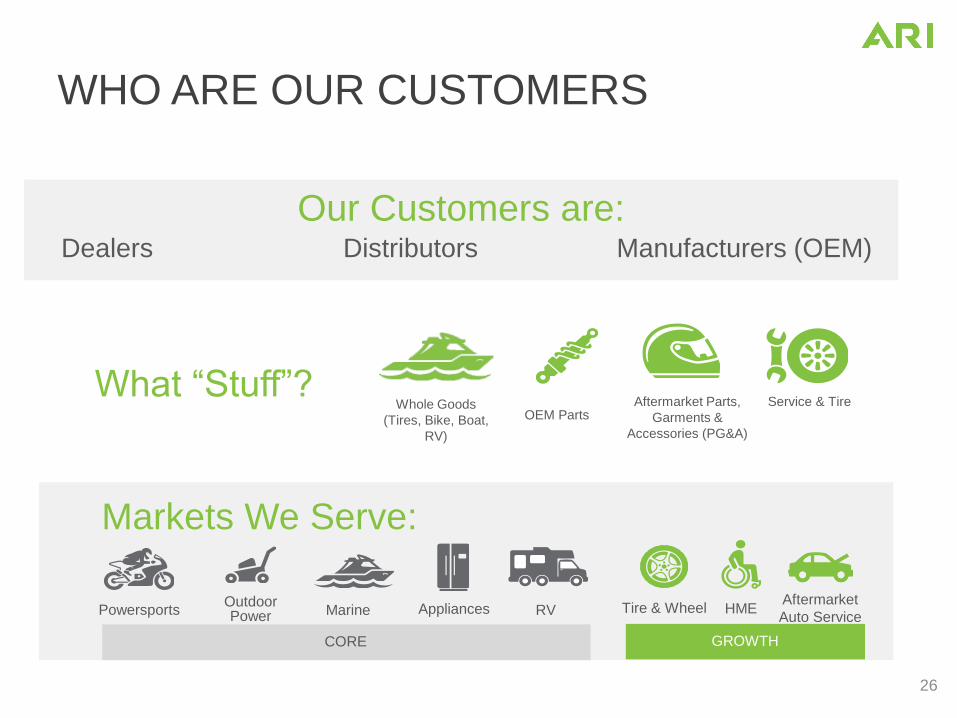
WHO ARE OUR CUSTOMERS
26
Dealers Distributors Manufacturers (OEM)
Our Customers are:
PowersportsOutdoor Power Marine RVAppliances
CORE
Tire & Wheel HME
Markets We Serve:
GROWTH
Aftermarket
Auto Service
What “Stuff”?Whole Goods
(Tires, Bike, Boat,
RV)
OEM PartsAftermarket Parts,
Garments &
Accessories (PG&A)
Service & Tire
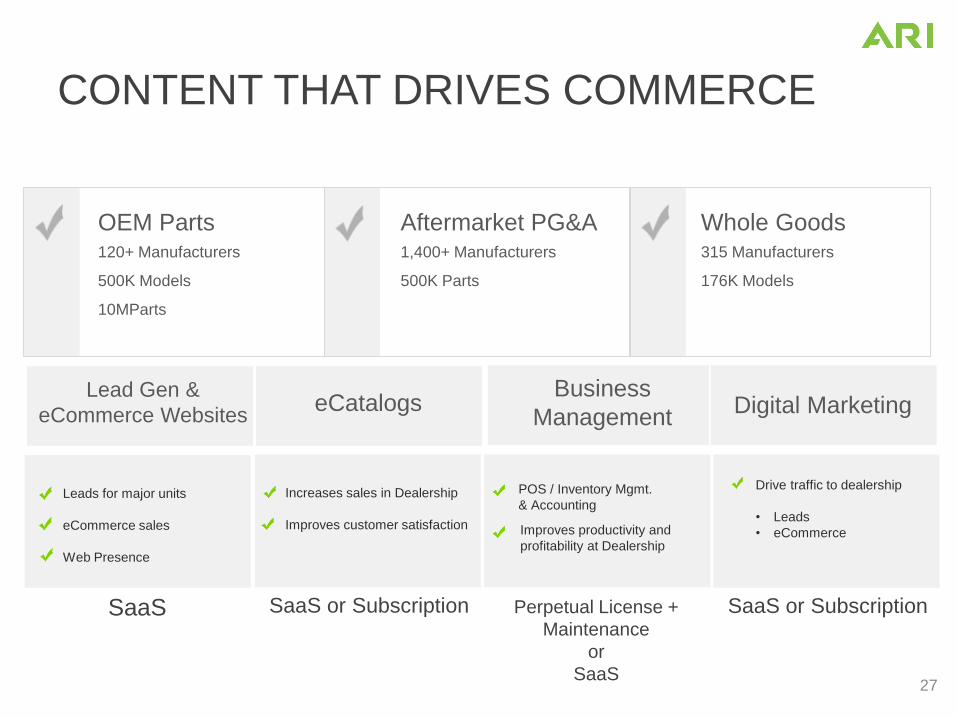
CONTENT THAT DRIVES COMMERCE
27
OEM Parts120+ Manufacturers
500K Models
10MParts
Aftermarket PG&A1,400+ Manufacturers
500K Parts
Whole Goods315 Manufacturers
176K Models
Improves productivity and
profitability at Dealership
Business
Management
POS / Inventory Mgmt.
& Accounting
Drive traffic to dealership
• Leads
• eCommerce
Digital Marketing
Leads for major units
eCommerce sales
Web Presence
Lead Gen &
eCommerce WebsiteseCatalogs
Increases sales in Dealership
Improves customer satisfaction
SaaS or SubscriptionPerpetual License +
Maintenance
or
SaaS
SaaS or SubscriptionSaaS

STRATEGIC GOALS - BACKGROUND
• To be the leader in providing software and services that help our customers Sell More Stuff™.
– Complex equipment will continue to be sold primarily through a dealer network.
– Approximately 7 out of 10 units sold originate as web leads.
– Online shopping is growing faster than in-store.
– Search is now over 50% mobile.
– ARI has a strong online footprint with supporting analytics (7,000+ Dealer Sites).
– We intend to integrate or own in-store systems (Business Management/Point of Sale).
28
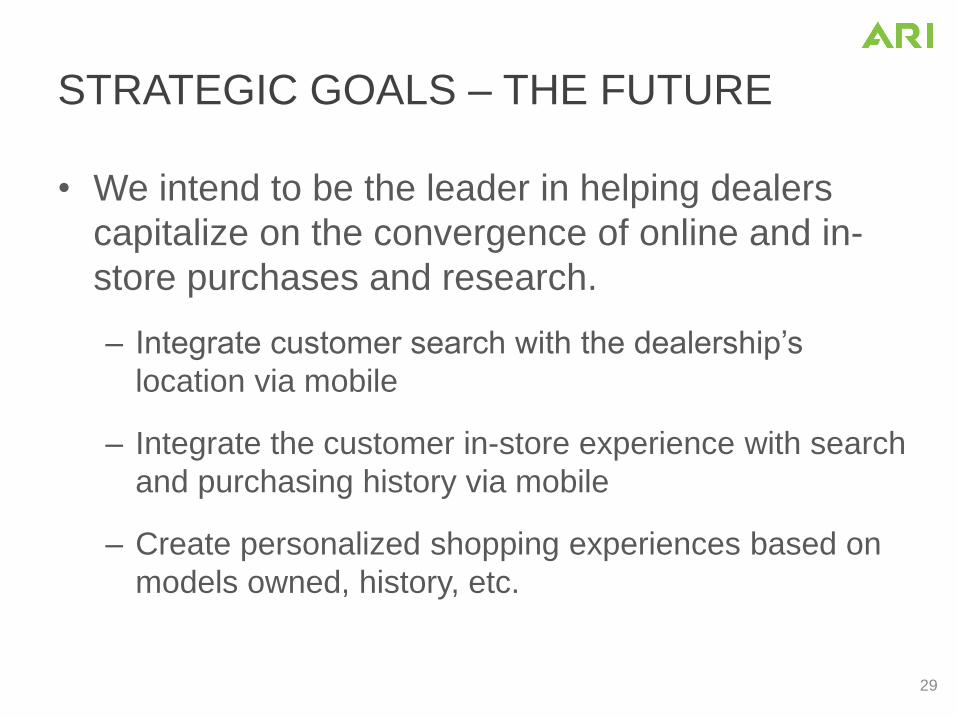
STRATEGIC GOALS – THE FUTURE
• We intend to be the leader in helping dealers
capitalize on the convergence of online and in-
store purchases and research.
– Integrate customer search with the dealership’s
location via mobile
– Integrate the customer in-store experience with search
and purchasing history via mobile
– Create personalized shopping experiences based on
models owned, history, etc.
29

STRATEGIC FOUNDATIONS
• Nurture and retain existing customers through world
class customer service and product feature upgrades.
• Drive organic growth through innovative new service
offerings, differentiated content and geographic
expansion.
• Lead the market with open integration to related
platforms.
• Successfully execute acquisitions that align with our core
strategy.
30

FOUR POINT GROWTH STRATEGY
31
• More Markets
¹Total addressable market represented by the green bars . Percentages represent ARI’s market share , or the percentage of U.S. dealers that currently use 1 or more of our products. For example, ARI currently has 40% market-share of the OPE vertical; with 40% of those dealers using 1 or more of ARI’s products.²Average revenue per dealer³Home Medical Equipment
66%
40%
90%10%
25K dealers
MAR
KET
SIZE
66%
40%
90% 10%
2%
17%
0%
25K dealers 125K dealers

GROWTH DRIVERS
32
• More Markets
• More Products• eCatalog
• Lead Gen & eCommerce
• Point of Sale / Dealer
Business Mgmt. Systems (POS/DBMS)
• Digital Marketing Services (DIGMS)
GROWTH DRIVERS
33
• More Markets
• More Products
• Higher ARPD
• eCatalog $1,839
• LeadGen/eCommerce $2,936
• POS/DBMS $4,766
• DIGMS $5,065

GROWTH DRIVERS
34
• More Markets
• More Products
• Higher ARPD
• Acquisitions that align
with our core strategy
• Completed 14
• Fragmented markets with many
small competitors
• We partner with over 90 today
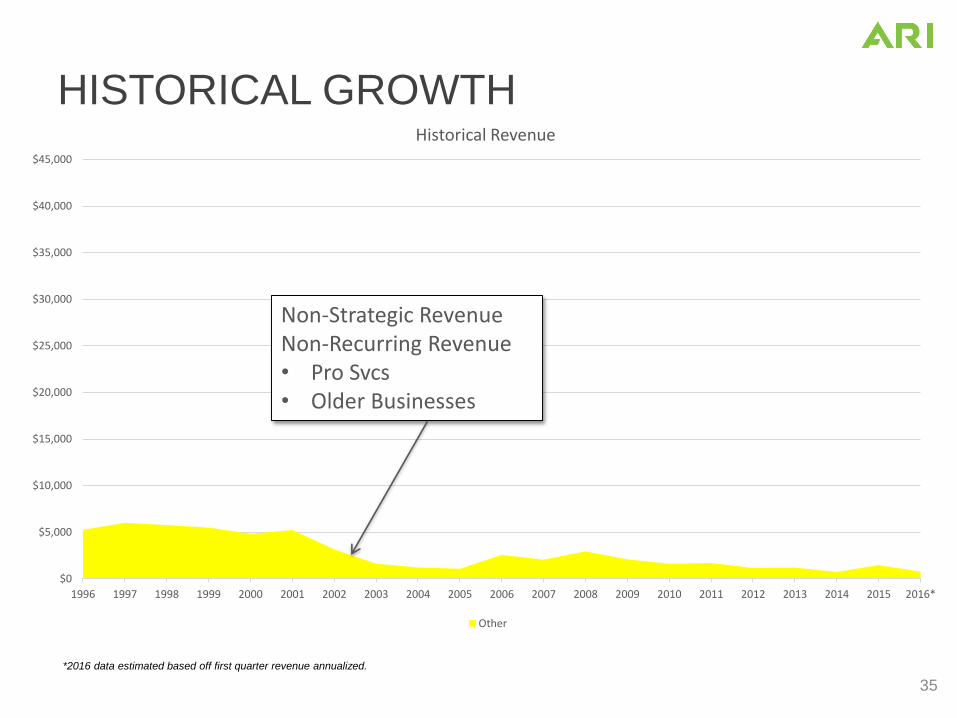
HISTORICAL GROWTH
$0
$5,000
$10,000
$15,000
$20,000
$25,000
$30,000
$35,000
$40,000
$45,000
1996 1997 1998 1999 2000 2001 2002 2003 2004 2005 2006 2007 2008 2009 2010 2011 2012 2013 2014 2015 2016*
Historical Revenue
Other
Non-Strategic RevenueNon-Recurring Revenue• Pro Svcs• Older Businesses
*2016 data estimated based off first quarter revenue annualized.
35

HISTORICAL GROWTH
$0
$5,000
$10,000
$15,000
$20,000
$25,000
$30,000
$35,000
$40,000
$45,000
1996 1997 1998 1999 2000 2001 2002 2003 2004 2005 2006 2007 2008 2009 2010 2011 2012 2013 2014 2015 2016*
Historical Revenue
Other eCatalog*2016 data estimated based off first quarter revenue annualized.
eCatalog• $18M Revenue• 18,000 +Dealers• 100 Countries
36

HISTORICAL GROWTH
In FY13 Q3 we made a change to our lead generation service business model, eliminating the pass-through cost of purchased ad words from the search engine providers on behalf
of our customers.
$0
$5,000
$10,000
$15,000
$20,000
$25,000
$30,000
$35,000
$40,000
$45,000
1996 1997 1998 1999 2000 2001 2002 2003 2004 2005 2006 2007 2008 2009 2010 2011 2012 2013 2014 2015 2016*
Historical Revenue
Other eCatalog Website
Lead Gen/eCom Websites• $23M Revenue• 7,500 Websites
*2016 data estimated based off first quarter revenue annualized. 37

HISTORICAL GROWTH
In FY13 Q3 we made a change to our lead generation service business model, eliminating the pass-through cost of purchased ad words from the search engine providers on behalf
of our customers.
$0
$5,000
$10,000
$15,000
$20,000
$25,000
$30,000
$35,000
$40,000
$45,000
1996 1997 1998 1999 2000 2001 2002 2003 2004 2005 2006 2007 2008 2009 2010 2011 2012 2013 2014 2015 2016*
Historical Revenue
Other eCatalog Website Digital Marketing
Digital Marketing Services• $1M Revenues• 225 Customers
*2016 data estimated based off first quarter revenue annualized. 38

HISTORICAL GROWTH
In FY13 Q3 we made a change to our lead generation service business model, eliminating the pass-through cost of purchased ad words from the search engine providers on behalf
of our customers.
$0
$5,000
$10,000
$15,000
$20,000
$25,000
$30,000
$35,000
$40,000
$45,000
$50,000
1996 1997 1998 1999 2000 2001 2002 2003 2004 2005 2006 2007 2008 2009 2010 2011 2012 2013 2014 2015 2016*
Historical Revenue
Other eCatalog Website Digital Marketing POS
Business Mgmt System/POS• $3M Revenues• 1,500 Locations
*2016 data estimated based off first quarter revenue annualized. 39

HISTORICAL GROWTH
In FY13 Q3 we made a change to our lead generation service business model, eliminating the pass-through cost of purchased ad words from the search engine providers on behalf
of our customers.
$0
$5,000
$10,000
$15,000
$20,000
$25,000
$30,000
$35,000
$40,000
$45,000
$50,000
1996 1997 1998 1999 2000 2001 2002 2003 2004 2005 2006 2007 2008 2009 2010 2011 2012 2013 2014 2015 2016*
Other eCatalog Website Digital Marketing POS
On track to do $47M - $49M in revenue for FY16
*2016 data estimated based off first quarter revenue annualized. 40

GROWTH OPPORTUNITY
Customer
Count
US TAM
# of
Customers
ARPD TAM Dollars
eCatalog 15,901 20,800 $1,839 $38M
Lead Gen &
eCommerce 7,557 143,800 $2,936 $422M
Point of
Sale/DBMS459 143,800 $4,762 $685M
Digital
Marketing228 143,800 $5,065 $728M
Total US $1.9B
41
After various adjustments we think TAM is $1.5B
eCat – Total includes “Bulk” license agreements without international dealers. ARPD is for dealers billed directly.
TAM – Total Addressable Market or the number of dealers, service locations or service providers.
ARPD– Average Recurring Revenue per dealer, service locations or service providers. Number for FY16Q1 annualized.

$0.0
$10.0
$20.0
$30.0
$40.0
$50.0
FY12 FY13 FY14 FY15 FY16 Low End Est.
Mill
ion
s
FY = Fiscal Year Ending July 31
Total Revenue
5 Year CAGR – 17%
3 Year CAGR – 16%
$22.5
$30.1
$47.0
$33.0
REVENUE GROWTH
42
$40.4

TARGET OPERATING MODEL
FY15 Act.FY16 Q1
Annualized
3 Years
FY19
5 Years
FY21
Sales $40M $47M ≅ $75M ≅ $100M
Growth CAGR 16.5% 16.5%
Adj. EBITDA % 16.9% 17.2% 18% - 22% 20% - 24%
Adj. EBITDA $ $7.3M $8M $14M - $17M $20M - $24M
43

NEAR TERM OUTLOOK
• In FY16 deliver $47M - $49M in Revenue– Deliver $50M revenue run rate in a quarter later in the
fiscal year
– Deliver $10M adjusted EBITDA run rate quarterly shortly thereafter
• Continue to integrate the three FY15 acquisitions
• Continued improvement in adjusted EBITDA and Cash Flow
44

QUESTIONS?
45